CONTENTS
17
/1, u Vol.8 No.2&3 October 2005 !Iq fr I :=
Transcript of CONTENTS

/1,
u
Vol.8 No.2&3 October 2005
!Iq
frI:=
VItrNo.2&3
CONTENTS
llessage - Minister of State (l/C) for Urban Employment & Poverty Alleviation
llessage - Secretary, Ministry of Urban Employment & Poverty Alleviation
Bftorial
Smrrity of the Habitat - A Key Factor in Disaster Reduction- Dy Prem Krishna
haints and Prospects of Master Plan Approach ln New Millennium- by D.S. Meshram
$Icnairehle Cities in lndia- by KT. Gurumukhi
Ilsfit Govemance for Sustainable Development- by $.K
-Sharma
Tln lfennium Development Goals - An Overview- bf h- Wek Gupta, Dr. Chandrakant S. Pandav
Enumental Sustainability ln Construction of Delhi Metro- A C-B.K Rao, Director (P&P), DMRC
krim Development Goals and Health- V LK *ngupta
Ih &rium Development Goals and the City- Qr lffis You
E Agrirct Poverty,-f KTGurumukhi
,1.
lh heily : A Social Perspective
I iiiirU&. S+a, Singh
Optober,2005
Pages
iii
iv
V
't4
19
21
37
43
B
53
61
I l,'Eftt F:ienre Poverty and Hunger@
The Millennium Development Goals - An Overview
Dr Vvek Gupta*, Dr. Chandrakant S. Pandav*x
Introduction
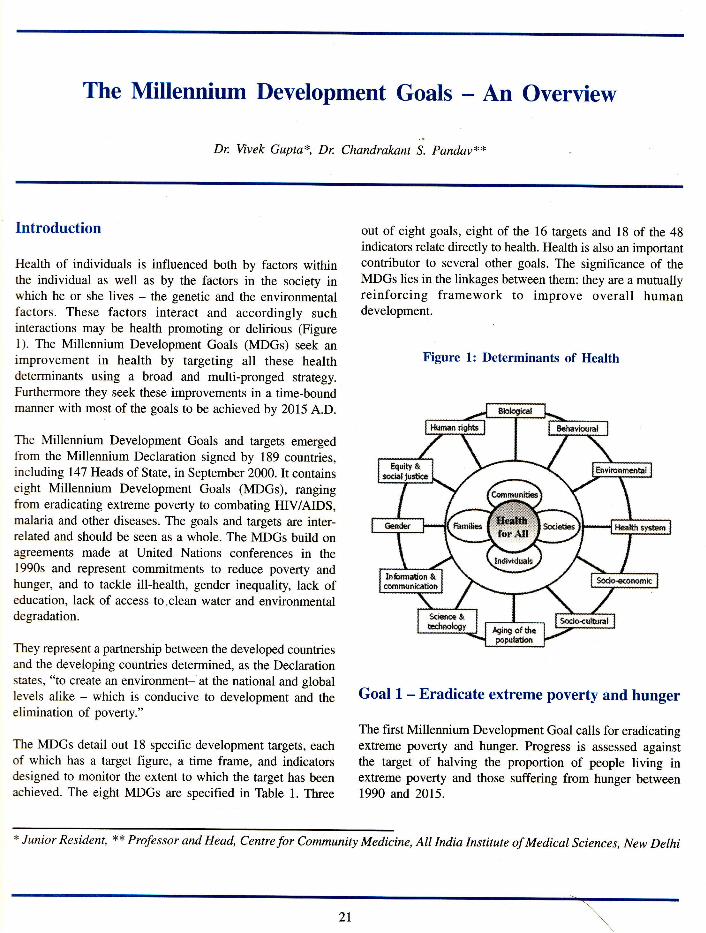
Health of individuals is influenced both by factors withinthe individual as well as by the factors in the society inwhich he or she lives - the genetic and the environmentalfactors. These factors interact and accordingly suchinteractions may be health promoting or delirious (Figurel). The Millennium Development Goals (MDGs) seek animprovement in health by targeting all these healthdeterminants using a broad and multi-pronged strategy.Furthermore they seek these improvements in a time-boundmanner with most of the goals to be achieved by 2015 A.D.
The Millennium Development Goals and targets emergedfrom the Millennium Declaration signed by 189 countries,including 147 Heads of State, in September 2000. Ir containseight Millennium Development Goals (MDGs), rangingfrom eradicating extreme poverty to combating HIV/AIDS,malaria and other diseases. The goals and targets are inter-related and should be seen as a whole. The MDGs build onagreements made at United Nations conferences in the1990s and represent commitments to reduce poverty andhunger, and to tackle ill-health, gender inequality, lack ofeducation, lack of access to.clean water and environmentaldegradation.
They represent a partnership between the developed countriesand the developing countries determined, as the Declarationstates, "to create an environment- at the national and globallevels alike - which is conducive to development and theelimination of poverty."
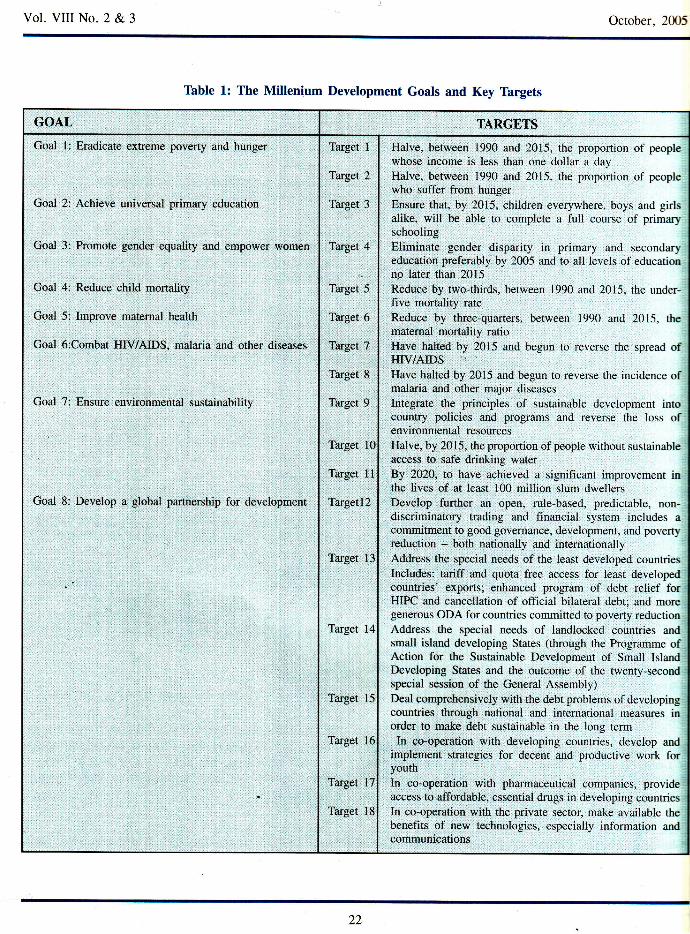
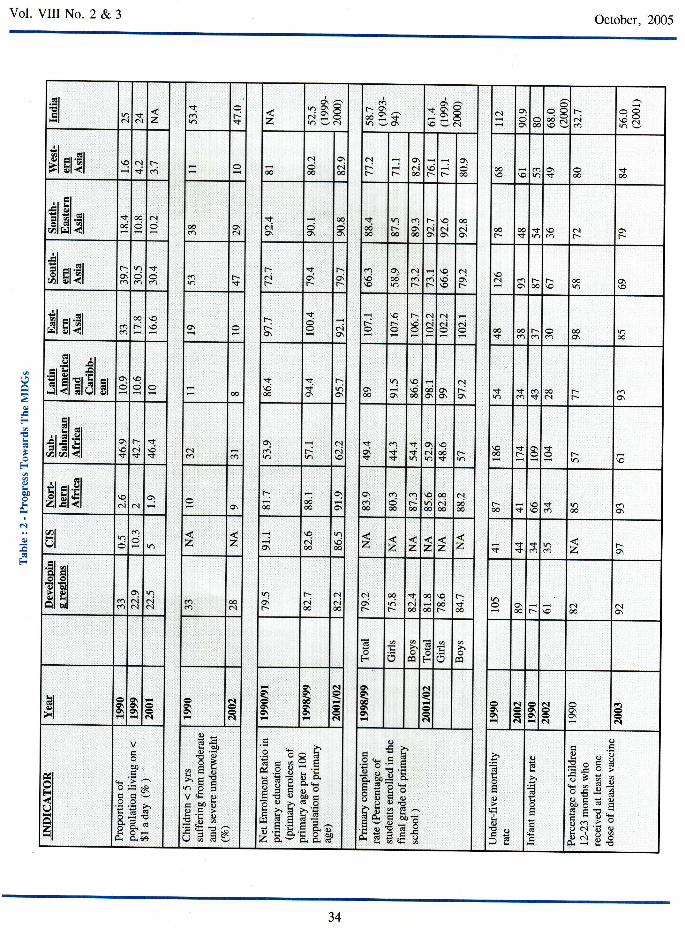
The MDGs detail out 18 specific development targets, eachof which has a target figure, a time frame, and indicatorsdesigned to monitor the extent to which the target has beenachieved. The eight MDGs are specified in Table 1. Three
out of eight goals, eight of the 16 targets and 18 of the 48indicators relate directly to health. Health is also an importantcontributor to several other goals. The significance of theMDGs lies in the linkages between them: they are a mutuallyreinforcing framework to improve overall humandevelopment.
Figure 1: Determinants of Health
Goal L - Eradicate extreme poverty and hunger
The first Millennium Development Goal calls for eradicatingextreme poverty and hunger. Progress is assessed againstthe target of halving the proportion of people living inextreme poverty and those suffering from hunger between1990 and 2015.
* Junior Resident, ** Professor and Head, Centre for Community Medicine, All India Institute of Medical Sciences, New Delhi
Vol. VIII No. 2 & 3 October. 2015
Thble 1: The Millenium Development Goals and Key Thrgets
GOAL TARGETS
Goal
Goal
1: Eradicate extreme poverty and hunger
2: Achieve universal primary education
Goal Promote gender equality and empower women
Goal 4: Reduce child morralitv
Goal 5: lmprove maternal health
Coal 6:Combat HIV/AIDS, malaria and other diseases
Goal 7: Ensure enyironmental sustainability
Goal 8: Develop a glotral partnership for development
Target 1
Target 2
Target 3
Target 4
Target 5
Target 6
Target 7
Target 8
Target 9
Target 10
Target 11
Tallgetl}
Target 13
Target 14
Target 15
Target l6
Target 17
Target 18
Halve, between 1990 and 2015, the proportion of peoplewhose income is less than one dollar a dav
Halve, between 1990 and 2015, the p.opo*io, of peoplewho sufler from hunger
Ensure that, by 2015, children everywhere. boys and girlsalike, will be able to complete a full course of primarlschoolingEliminate gender disparity in primary and secondaryeducation preferably by 2005 and to all levels of educarionno later than 2015
Reduce by two-thirds, between 1990 and 2015. the under-Iive mortality rate
Reduce by three-quarters. between 1990 and 2015, thematemal mortality ratioHave hahed by 2015 and begun to reverse the spread ofHIV/AIDSHave halted by 2015 and begun to reverse the incidence ofmalaria and other major diseases
Integrate the principles ol susLainable der elopmenr intocountry policies and programs and reverse the loss ofenvi ronmental resources
Halve, by 2015, the proportion of people without sustainableaccess to safe drinking waterBy 2020, to have achieved a significanr improvement inthe lives of at least 100 million slum dwellersDevelop fufther an open, rule-based. predictable, non-discriminatory trading and financial system includes acommitment to good governance, development, and povenvreduction - both nationatly and internationallyAddress the special needs of the least developed counrriesIRcludes: tariff and quota free access for least developedcountries' exports; enhanced program of debt relief forHIPC and cancellation of official bilateral debt; and moregenerous ODA for countries committed to poverty reductionAddress the speciai needs of landlocked countries andsmall island developing States (through the Programme ofAction for the Sustainable Development of Smatl IslandDeveloping States and the outcome of the twenty-secondspecial session of the General Assembly)Deal comprehensively with the debt problems of developin-ecountries through national and international measures inorder to make debt sustainable in the long termIn co-operation with developing countries, develop and
implement strategies for decent and productive work foryouth
In co-operation with pharmaceutical companies. provideaccess to affordable, essential drugs in developing countnesIn co-operation with the private sector, make available thebenefits of new technologies, especially information andcommunications
22
Vol. VIII No. 2 & 3 October, 2005
Extreme poverty in this goal is measured in monetary terms
against a threshold of about one dollar per day, standardized
across countries for comparable purchasing power. This has
been determined to be the monetary equivalent of the
minimum a person needs to survive. This definitionunderrates the extent of poverty in regions where the true
poverty line would be higher, e.g., in Europe and Central
Asia. Finally, in some middle-income countries, especially
large ones, while the national poverty rate may be relatively
low. poverty may be much higher in parts of the countrye.g.. Northeast of Brazil, Southem States in Mexico. However
it is recommended that for monitoring country poverty
trends, indicators based on national poverty lines should be
used, where available. India, led by continuing growth, is
likely to reach or exceed this MDG target leading the way
for the countries in South Asian region. The annual growth
rate of GDP in India has averaged 5.87o ftom 1994-2004,
up from 5.4Vo in the preceding ten years 1984-94. What has
been even more encouraging are the higher rates seen in the
later financial years beitg 8.6Vo in 2003 xd 6.9Vo in 2004.1
The MDGs call for a halving of hunger-povertyu between
1990 and 2015. For India, this would mean bringing down
the headcount ratio of calorie deficiency from 62.2Vo in
1990 to 3l.l7o in}Oll viz., the proportion o f the population
having monthly per capita consumption expenditure that is
lou'er than the poverty line. Hunger is rampant in India. In
1999-2000, for instance, more than one-half (537o) of India's
population consumed fewer calories than it required. This is
nearly double the estimated national incidence ofconsumptioi povertyb of 22-26%o.2
It may be pertinent to note here that the adage "averages
can be misleading" is very true in context of this goal, as itis for other MDGs. Talking about averages masks the large
inrer-regional differences in the levels of poverty. Its makes
sense to stratify data and examine it by subgroups to get a
more realistic account.
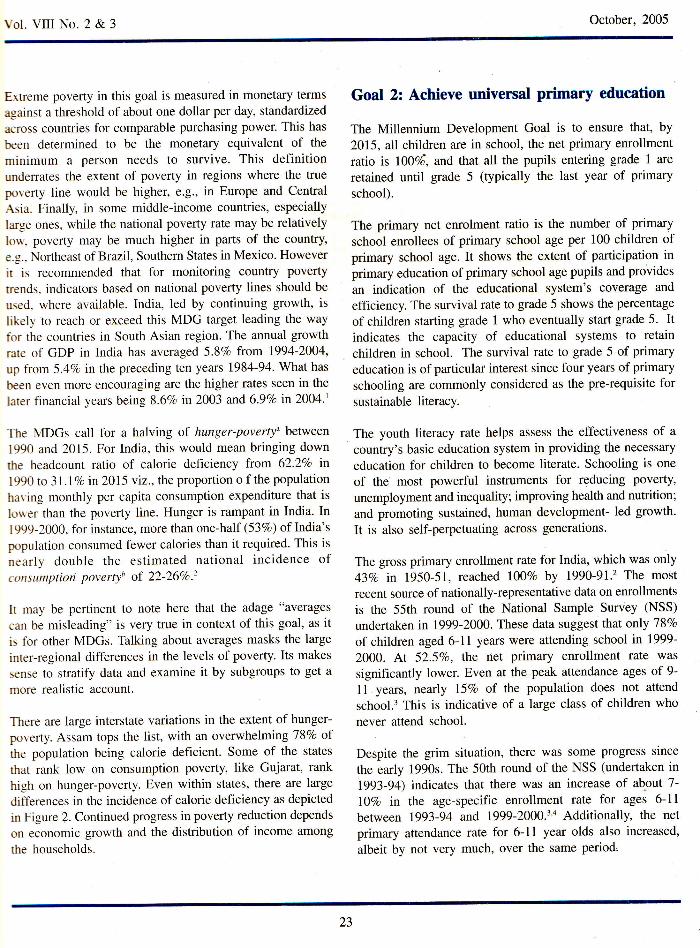
There are large interstate variations in the extent of hunger-
poverty. Assam tops the list, with an overwhelm\ng187o ofthe population being calorie deficient. Some of the states
that rank low on consumption poverty, like Gujarat, rank
high on hunger-poverty. Even within states, there are large
differences in the incidence of calorie deficiency as depicted
in Figure 2. Continued progress in poverty reduction depends
on economic growth and the distribution of income among
the households.
Goal 2: Achieve universal primary education
The Millennium Development Goal is to ensure that, by
2015, all children are in school, the net primary enrollment
ratio is l00%i, and that all the pupils entering grade 1 are
retained until grade 5 (typically the last year of primary
school).
The primary net enrolment ratio is the number of primary
school enrollees of primary school age per 100 children ofprimary school age. It shows the extent of participation in
primary education of primary school age pupils and provides
an indication of the educational system's coverage and
efficiency. The survival rate to grade 5 shows the percentage
of children starting grade 1 who eventually start grade 5. Itindicates the capacity of educational systems to retain
children in school. The survival rate to grade 5 of primary
education is ofparticular interest since four years ofprimaryschooling are commonly considered as the pre-requisite forsustainable literacy.
The youth literacy rate helps assess the effectiveness of acountry's basic education system in providing the necessary
education for children to become literate. Schooling is one
of the most powerful instruments for reducing poverty,
unemployment and inequality; improving health and nutrition;
and promoting sustained, human development- led growth.
It is also self-perpetuating across generations.
The gross primary enrollment rate for India, which was only
437o ir 1950-51, reached l00Vo by 1990-91.2 The most
recent source of nationally-representative data on enrollments
is the 55th round of the National Sample Survey (NSS)
undertaken in 1999-2000. These data suggest that only 78Vo
of children aged 6-11 years were attending school in 1999-
2000. At 52.5Vo, the net primary enrollment rate was
significantly lower. Even at the. peak attendance ages of 9-
1l.years, rcarly l57o of the population does not attend
school.3 This is indicative of a large class of children who
never attend school.
Despite the grim situation, there was some progress since
the early 1990s. The 50th round of the NSS (undertaken in
1993-94) indicates that there was an increase of about 7-
lOVo in the age-specific enrollment rate for ages 6-11
between 1993-94 and 1999-2000.3'a Additionally, the net
primary attendance rate for 6-11 year olds also increased,
albeit by not very much, over the same period,
23
Vol. VItr No. 2 & 3October. 205
Figure 2: Percent of Population that is calorie Deficient, by state, rggg-2000
,{s
Source: Attaining the Millennium Development Goals in India.2
*firH,*urp
#***t'&f#
f&ffi!*Gr*ffi
TrdlFil&kkkr***-!E*mfud
f;fE*rick
f,nlhiSL{li
e{,F-.itres*ldt
*fq*s.rfoi*
iGffirEf"4h&
t{*d5*I*grhr*
H&F&tn#,P.
*rfid*rJeltu#ato
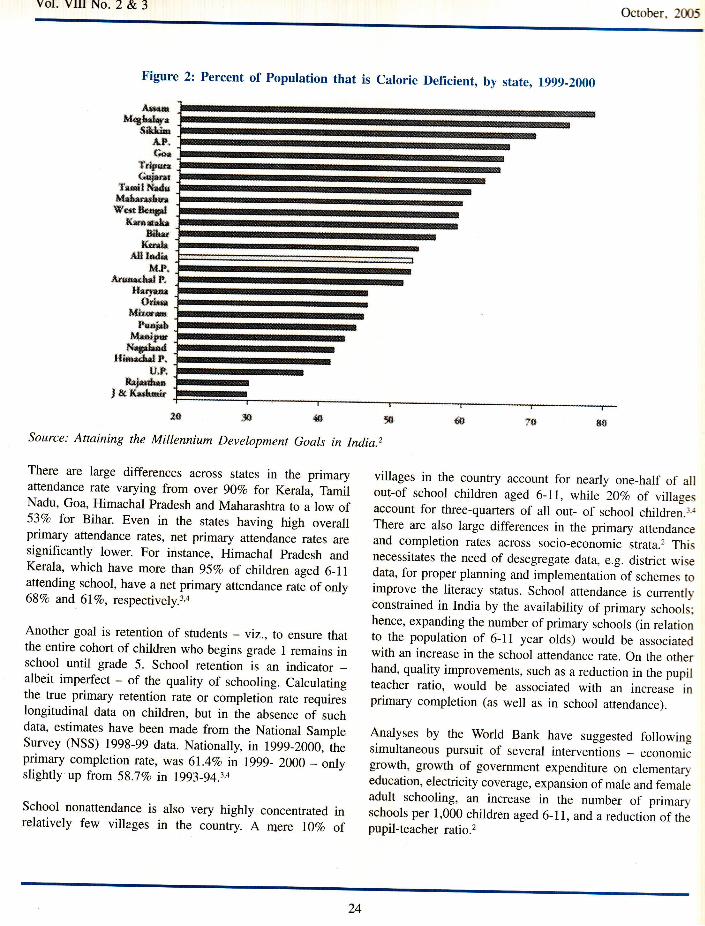
There are large differences across states in the primaryattendance rate varying from over 90Vo for Kerala, TamilNadu, Goa, Himachal Pradesh and Maharashtra to a low of53Vo for Bihar. Even in the states having high overallprimary attendance rates, net primary attendance rates aresignificantly lower. For instance, Himachal pradesh andKerala, which have more than 95Vo of children aged 6_11attending school, have a net primary attendance rate of only68Vo and 6lVo, respectively.3,a
Another goal is retention of students - yiz., to ensure thatthe entire cohort of children who begins grade 1 remains inschool until grade 5. School retention is an indicator _albeit imperfect - of the quality of schooling. Calculatingthe true primary retention rate or completion rate requireslongitudinal data on children, but in the absence of suchdata, estimates have been made from the National SampleSurvey (NSS) 1998-99 data. Nationally, in 1999-2000, theprimary completion rate, was 6l.4%o in lggg_ 2OOO _ onlyslightly up from 58.i%o in 1993-94.3.4
School nonattendance is also very highly concentrated inrelatively few villages in the country. A mere lTVo of
villages in the country account for nearly one_half of allout-of school children aged 6-11, whlle 20Vo of villagesaccount for three-quarters of all out- of school children.3.{There are also large differences in the primary attendanceand completion rates across socio-economic strata.2 Thisnecessitates the need of desegregate data, e.g. district wisedata, for proper planning and implementation of schemes toimprove the literacy status. School attendance is currentlyconstrained in India by the availability of primary schools;hence, expanding the number of primary schools (in relationto the population of 6-ll year olds) would be associatedwith an increase in the school attendance rate. On the otherhand, quality improvements, such as a reduction in the pupilteacher ratio, would be associated with an increase inprimary completion (as well as in school attendance).
Analyses by the World Bank have suggested followingsimultaneous pursuit of several interventions _ economicgrowth, growth of government expenditure on elementaryeducation, electricity coverage, expansion of male and femaleadult schooling, an increase in the number of primaryschools per I ,000 children aged 6- I 1, and a reduction of thepupil-teacher ratio.2
24
Vol. Vil No. 2 & 3 October,2005
It is important to note that attainment of the education-
related MDGs in India will require, in addition to the
interventions discussed earlier, broad-ranging institutional
reform in the education sector. Various surYeys indicate that
the rates of teacher absenteeism in government schools are
very high in India, with the situation often being worse in
the poor states. Teacher absenteeism is a reflection of the
larger problem of lack of accountability of schooladministrators and teachers to students and their parents.
Srtrile there are no simple solutions to this problem, evidence
from other countries suggests the need for institutional
reform that empowers citizens and communities to hold the
state accountable for school performance, devolvesadministrative and financial powers to communities, provides
greater autonomy to schools, involves parents in school
management, and motivates frontline workers to provide
better quality schooling.
Goal 3: Promote gender equality
The Millennium Declaration resolves to promote gender
equality and the empowerrnent of women as basic human
rights and as effective ways to combat poverty, hunger and
disease and to stimulate development that is truly sustainable.
The stated target is to ensure that the ratio of girls to boys
enrolled at all schooling levels, but particularly at the
primary and secondary levels, is 1007o.
School-based administrative data suggest that India has
made impressive gains in reducing the male-female gap intlrc gross primary enrollment rate in the last fifty years, withthe ratio of the female to male gross primary enrollment rate
nearly doubling from 4lVo it 1950-51 to SlEo in 1993-94,
*'here it has stayed since. Yet there are large interstate
variations in the extent of gender disparity in schooling,
with the gender gap being the largest in Bihar, Uttar Pradesh
and Rajasthan, where the gross primary enrollment rate forfemales is about two-thirds or less than that for males, and
the smallest in Punjab, Haryana, Sikkim and Kerala, where
is parity or near-parity in the gross primary enrollment rates
for boys and girl.2
Household survey data from the 55th NSS round of the NSS
also show large sub-state differences in the ratio of female
to male students in primary and secondary school. Even
more disconcerting is the finding that, between 1993-94 and
199-2000, as many as 30 regions - out of a total of 78 -
experienced a decline in the ratio of female to male students.
Surprisingly, these regions are located in such states as
Tamil Nadu, Andhra Pradesh, Karnataka, Maharashtra and
even Kerala.2
Factors found'to be associated with gender imbalances inschool attendance for boys and girls aged 6-18 years, using
the NSS 55th round unit record data include: 3
1. Household consumption expenditure per capita and
access to roads,
2. adult female schooling in the household
3. increase in the share of secondary education ingovernment educational spending is associated withreduced gender gap in enrollment
4. number of elementary and secondary schools per childaged 6-18,
5. better access to electricitY,
6. crime against women (as measured by the number ofcognizable kidnappings of women and girls per capita)
Since gender disparities in schooling outcomes are largely
caused by parental discrimination against the girl child,
public policies that increase the parental incentive to invest
in girls, such as tuition waivers for girls and female stipends
and scholarships, are likely to work well in narrowing the
gender gap.
A simple expansion of school capacity or introduction of afemale scholarship program will not work unless it is
accompanied by broad-ranging institutional reform to reduce
teacher absenteeism and to make schools and school
managers more accountable to students and the community.
Goal 4: Reduce child mortality
The Millennium Development Goal is to reduce infant and
child mortality by two-thirds between 1990 and 2015. For
India, this would imply a reduction of the infant mortalityrate (IMR) to 27 and of the under-five mortality rate
(U5MR) to 32by 2015.
Each year 26 million infants are born in India. Over the
decades there has been a declining trend in infant mortalityrate, neonatal mortality rate and still birth rate (Figure 3).
However, there has been just a l5%o declirie in Neonatal
25
Vol. VIII No. 2 & 3 October, 2005
rffi
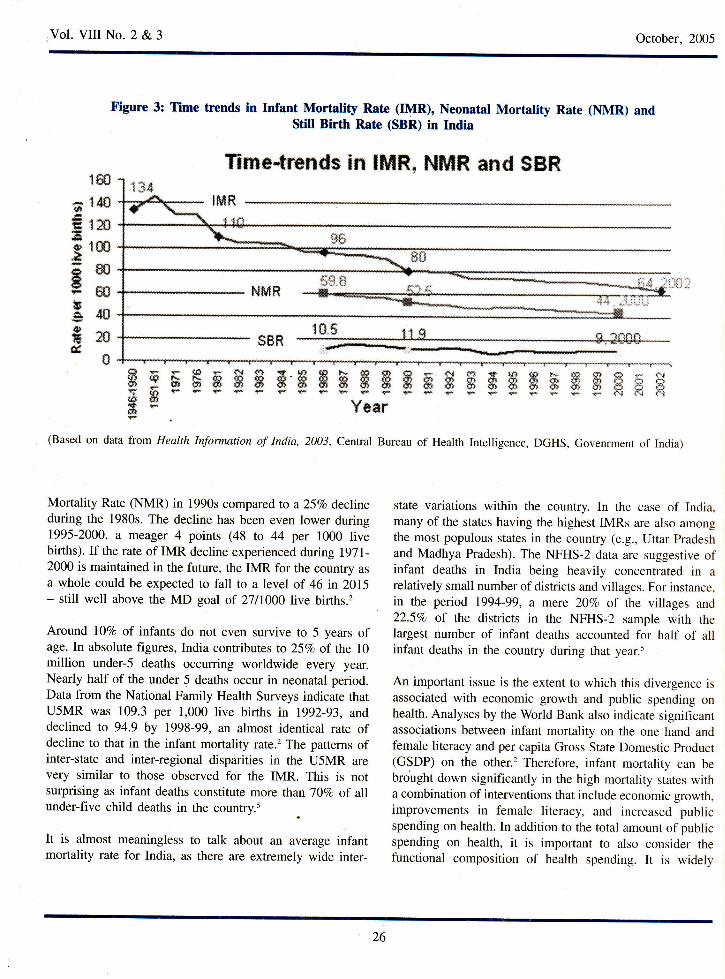
Figure 3: Tlme trends in Infant Mortality Rate (IMR), Neonatal Mortality Rate (NMR) andStitl Birth Rate (SBR) in India
IMR
Mortality Rate (NMR) in 1990s compared to a25Vo declineduring the 1980s. The decline has been even lower during1995-2000, a meager 4 points (48 ro 44 per 1000 livebirths). If the rate of IMR decline experienced during 1971-2000 is maintained in the future, the IMR for the country as
a whole could be expected to fall to a level of 46 in 2015
- still well above the MD goal of 2lllOOO live births.2
Around lOVo of infants do not even survive to 5 years ofage. In absolute figures, India contributes to 25Vo of the 10million under-S deaths occurring worldwide every yeilr.Nearly half of the under 5 deaths occur in neonatal period.Data from the National Family Health Surveys indicate thatU5MR was 109.3 per 1,000 live births in 1992-93, and,declined to 94.9 by 1998-99, an almosr identical rate ofdecline to that in the infant mortality rate.2 The patterns ofinter-state and inter-regional disparities in the U5MR arevery similar to those observed for the IMR. This is notsurprising as infant deaths constitute more than't\Vo of allunder-five child deaths in the country.5
It is almost meaningless to talk about an average infantmortality rate for India, as there are extremely wide inter-
}("$if
state variations within the country. In the case of India,many of the states having the highest IMRs are also amongthe most populous states in the country (e.g., Uttar Pradeshand Madhya Pradesh). The NFHS-2 data are suggestive ofinfant deaths in India being heavily concentrated in arelatively small number of districts and villages. For instance.in the period 1994-99, a mere 20%o of the villages and22.5Vo of the districrs in rhe NFHS-2 sample with thelargest number of infant deaths accounted for half of allinfant deaths in the country during that year.5
An important issue is the extent to whiih this divergence isassociated with economic growth and public spending onhealth. Analyses by the World Bank also indicate significantassociations between infant mortality on the one hand andfemale literacy and per capita Gross State Domestic product(GSDP) on the other.2 Therefore, infant mortality can bebrought down significantly in the high mortality states witha combination of interventions that include economic growth,improvements in female literacy, and increased publicspending on health. In addition to the total amount of publicspending on health, it is important to also consider thefunctional composition of health spending. It is widely
tr t4*8lffi.fi lffif,ffiftHffig{##ffia
il
105strn .':'- =* ,.. tl t . . u.*nnn".. "
(}ffie$ g)$"1 r"l
(Based on data from Health Information of India, 2003, Central Bureau of Health Intelligence, DGHS, Govenrment of India)
E sE E$ Hffi fiffi ffiH H Hfi sff ffi f; HHH # ffirf{#}F?F#FFfrFwFrswfn {!5
ffi s Yusr
ft{&t\
T*mp.tru*dr *n *fiClfi. Hil,|ft frrrd $Bfi
26
Vol. VIII No. 2 & 3 October, 2005
recognized that health outcomes, especially infant mortalityoutcomes, are more responsive to preventive healthinterventions, including communicable disease control andchild immunization, than to the provision of curative services,typically in hospitals. In addition, evidence from severalcountries, including India, indicates that public spending onimmunizations and preventive care is much more pro-poorthan that on hospital-based curative services. Thus there isa need to adopt a life cycle approach wherein preventiveand promotive strategies need to be implemented throughputthe life course. Due emphasis should be there on sustainededucation campaigns including communication for behaviourchange. Unfortunately, the lion's share of government healthexpenditure in most Indian states goes toward the provisionof health services, typically in hospitals. Relatively little isspent on preventive health activities.2
Another important factor is the quality of health services.Mahal et al find that all the southern states, but particularlyKerala and Tamil Nadu, show a 'progressive' distribution ofsubsidies (in that the ratio of subsidies to per capitahousehold consumption expenditure falls with per capitahousehold expenditure), whereas the poor states (such as
Uttar Pradesh, Madhya Pradesh, Bihar, Rajasthan and Orissa)have a 'regressive' distribution ofpublic subsidies on health.Second, governance and service delivery problems in thepoor states are often worse than in other states.6
In the poor states, there is widespread absenteeism ofdoctors and paramedics at govemment health centers andsub-centers; most government health facilities are indisrepair; and the availability of drugs and medical suppliesat public health facilities is typically nonexistent. Forexample, a recent survey across India indicates that 58Vo ofhealth workers in primary health facilities in Bihar wereabsent from their positions on any given day.? Anothernational survey conducted by the Public Affairs Centre,which ranked the performance of govemment health serviceson a number of indicators. such as access, usage, reliabilityand user satisfaction, found that the poor states typicallyrank in the bottom half of all the states in the country interms of the quality of their public health services.8
The NFHS-2 data provide some information on the proximatecorrelates of infant mortality. When a woman receivestetanus shots during her pregnancy, the subsequent survivalprospects for the child from thlt pregnancy are significantlyraised. Likewise, children with low birth weights are more
than two times as likely to die during infancy as childrenwho weighed more than 2.5 kilograms at birth. Medicalattendance (i.e., doctor, nurse or skilled birth attendantpresent) at birth is associated with a large reduction ininfant mortality, especially in the poor states. Interestingly,however, receipt of any antenatal care by a woman is evenmore strongly associated with infant survival thanprofessional attendance at birth. A child's birth weight is, inlarge part, influenced by the mother's nutritional status atdelivery. After the first month of life, child malnutritionbecomes an important contributing factor to infant and childmortality in India. In addition to nutrition, immunizationplays an important role in enhancing a child's survivalprospects, especially beyond infancy.5
Higher measles vaccination rates are associated with lowerchild mortality between ages 1 and 5 years. From 1992-93and 1998-99, most states experienced relatively slow progressin expanding measles immunization over the 6-year period,with the overall rate of measles vaccination in the countryincreasing from 42Vo to 5l%o.
Child mortality between the ages of one and five is alsosignificantly greater for females than for males. A girl inIndia is 40Vo more likely to die between her first and fifthbirthdays than is a boy. Thus, child mortality would drop by20Vo 1f girls had the same mortality rate as boys between theages of 1 month and 5 years.rr Other correlates of childmortality include birth order, social caste, female schooling,and rural infrastructure such as roads, safe drinking waterand sanitation, electricity, and the presence of Governmentprograms and health infrastrucfure in the form of sub-centres/PHCs/ anganwadi centre. 2
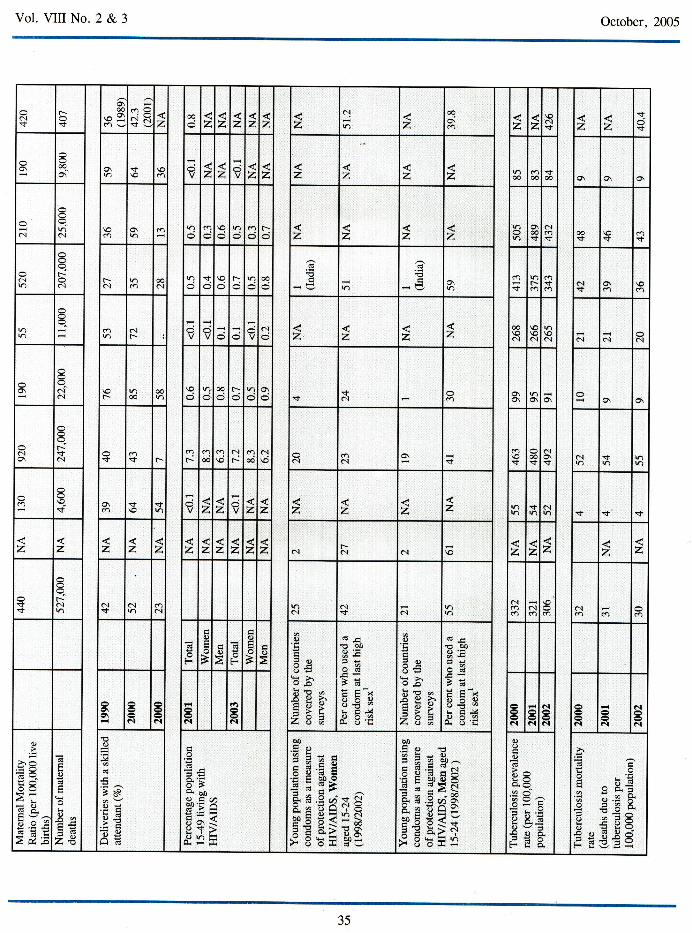
Goal 5: Improve maternal health
Each year in India, roughly 30 million women experiencepregnancy all,d 27 million have a live birth. Of these, over100,000 maternal deaths and one million newborn deathsoccur annually. Millions more suffer pregnancy related illhealth. In spite of a series of programmatic initiatives, thereis little evidence that maternity has become significantlysafer over the last 20 years.t2 One of the important constraintsin making strategies for reduction of maternal mortality isnon-availability of reliable national and sub-national data.The uncertainty of maternal mortality estimates does notallow any definitive assessment of progress towards achievingthis goal. Measuring maternal mortality accurately is difficult
27
Vol. VIII No. 2 & 3 October, 2005
except where comprehensive registration of deaths and ofcauses of death exists.
As an alternative, several indicators, dubbed "process"indicators, known to correlate very closely with actualmaternal mortality, have been proposed to track short-termprogress. Process indicators can be used to monitorinterventions needed to reduce maternal mortality. Theyfocus on professional care during pregnancy and chitdbirth,particularly for the management of complications.
The most widely available process indicator is the proportionof women who deliver with the assistance of a skilledattendant, defined as a medically-trained health careprovider-doctor, nurse, midwife. In India, as per NHHS-2data, skilled birth attendants (SBAs) conducted only 42.3Voof deliveries. Compared to 1992-93 this rate had increasedby 8Vo, largely due to a SOVo increase in the coverage bydoctors. Traditional birth attendants (TBAs) continue toconduct over one-third of all deliveries. The distribution ofskilled attendants and institutional deliveries by states revealsan inverse relationship with NMR and IMR. Though therehas been an increase in institutional deliveries, around 65Vodeliveries are conducted at home.s
Antenatal care is essential for diagnosing and treatingcomplications that could endanger the lives of mother andchild. Although most life-threatening obstetric complicationscannot be prevented through antenatal care, there is ampleevidence that care during the antenatal period represents animportant opportunity to deliver interventions that willimprove matemal health, as well as perinatal health andsurvival. Moreover, if the antenatal period is used to informwomen and families about danger signs and symptoms andabout the risks of labour and delivery it may provide theroute for ensuring that pregnant women deliver with theassistance of a skilled health care provider.
In India, as per NFHS-2, among women who underwent anon-institutional delivery in the three years prior toinvestigation, only 17 per cent obtained a postpartum check-up .within two months, and only 2 per cent obtained acheck-up within two days of birth. Of these, just one-thirdreported an abdominal examination (35 per cent), andaround two-fifths reported receiving breast-feeding adviceand baby care advice (43 per cent and 46 per centrespectively); even fewer (27 per cent) were counseledabout family planning.5
Preventing and reducing maternal .mortality is an issue ofsocial justice and human rights but women die becausematernal mortality is not viewed as a priority concern.Reducing maternal mortality has been an oft-repeated goal,yet there are few signs ofprogress. There a.re too few healthfacilities, professionals and drugs. The links betweenpregnancy-related care and maternal mortality are wellrecognized, and over the last decade national programmesand Plans have stressed the need for universal screening ofpregnant women and operationalizing essential andemergency obstetric care. Success stories are there whereproper planning and implementation has actually broughtdown the mortality rates (see box). Proper antenatal careensures at the end of pregnancy, a healthy mother and ahealthy baby, and to achieve it has been a challenge beingtaken up by the Reproductive and Child Health-Il program,a component of the National Rural Health Mission.
Goal 6: Combat HMAIDS, malaria and otherdiseases
The identified targets for his goal are to halt by 2015 andbegun to reverse the spread of HIV/AIDS and to halt by2015 and begun to reverse the incidence of malaria andother major diseases including tuberculosis.
Levels of the HIV/AIDS epidemic are tracked on the basisof the HIV prevalence among 15-24 year old pregnantwomen, condom use rate in the high risk population andnumber of children orphaned by HIV/AIDS. The prevalencerates of HIV/AIDS for India in the 15-24 year age group in2001 were estimated to be 0.2211000 in males atd 0.4611000 in females.r The recent trends, as reported by theNational AIDS Control Organization, ,.rori the countryshow that there is no galloping HIV epidemic in India as awhole, as no evidence of upsurge in HIV prevalence hasbeen observed in the country. Howeveq there are sub-national epidemics in various parts of the country with theevidence of high prevalence of HIV among both STD clinicattendees and antenatal clinic attendees.2 The prevalencerates of condom use in high risk populations vary from5l.2Vo in males to 39.8Vo in females.ll
The Second phase of the National AIDS Control Project, inIndia commenced in November 1999. The NACp-II hastwo key project objectives: to reduce the rate of growth ofHIV infection in India; and to strengthen India's capacity to
28
Vol. VIII No. 2 & 3 October, 2005
respond to HIViAIDS. It has two components withappropriate interventions defined. The first component is
delivering cost-effective interventions to contain the spread
of HIV/AIDS through targeted interventions for groups at
high risk, preventive interventions for the general community,and low cost AIDS care. Second important component is
strengthening capacity through institutional strengthening,
and inter-sectoral collaboration (public, private, and
voluntary).3
For malaria, the targets identified are prevalence and death
rates associated with malaria and the proportion of populationin malaria risk areas using effective malaria prevention andtreatment measures. The death rates for India have been
estimated to be 6/100,000 children in the 0-4 year age
groups in 2000. The malaria prevalence rate in the general
population in 2000 was 141100,000 population. Noinformation is available on the prevalence of use of
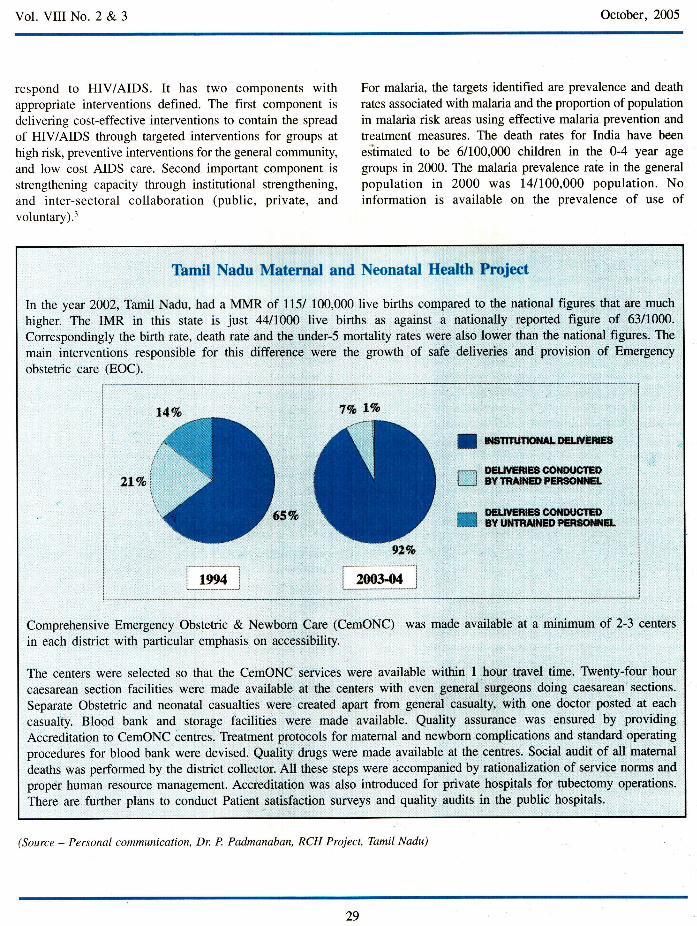
Tamil Nadu Maternal and Neonatal Health Project
In the year z}Oz,TarrilNadu, had a MMR of 115/ 100,000 live births compared to the national figures that are much
higher. The IMR in this state is just 4411000 live births as against a nationally reported figure of 63/1000.
Correspondingly the birth rate, death rate and the under-S mortality rates were also lower than the national figures. The
main interventions responsible for this difference were the growth of safe deliveries and provision of Emergency
obstetric care (EOC).
6ENTUTKtrTALI'EUYEreB
oEulamrg$coilDllgfcnBY tnA${EDFE*SOISET.
EETN'ffiEECOT{H'CTGilBY UiTfRAII{ED PENSOTS{EL
Comprehensive Emergency Obstetric & Newborn Care (CemONC) was made available at a minimum of 2-3 centers
in each district with particular emphasis on accessibility.
The centers were selected so that the CemONC services were available within t hour travel time. Twenty-four hour
caesarean section facilities were made available at the centers with even goneral surgeons doing caesarean sections.
Separate Obstetric and neonatal casualties were created apart from general casualty, with one doctor posted at each
casualty. Blood bank and storage facilities were made available. Quality assurance was ensured by providing
Accreditation to CemONC centres. Treatment protocols for maternal and newborn complications and standard operating
procedures for blood bank were devised. Quality drugs were made available at the centres. Social audit of all matemal
deaths was performed by the district collector. All these steps were accompanied by rationalization of service norms and
proper human resource management. Accreditation was also introduced for private hospitals for tubectomy operations.
There are further plans to conduct Patient satisfaction surveys and quality audits in the public hospitals.
IJ
tt1/oi\
t*Et
vL%
(Source - Personal communication, Dr. P. Padmanaban, RCH Project, Tamil Nadu)
29
Vol. VIII No. 2 & 3 October, 2005
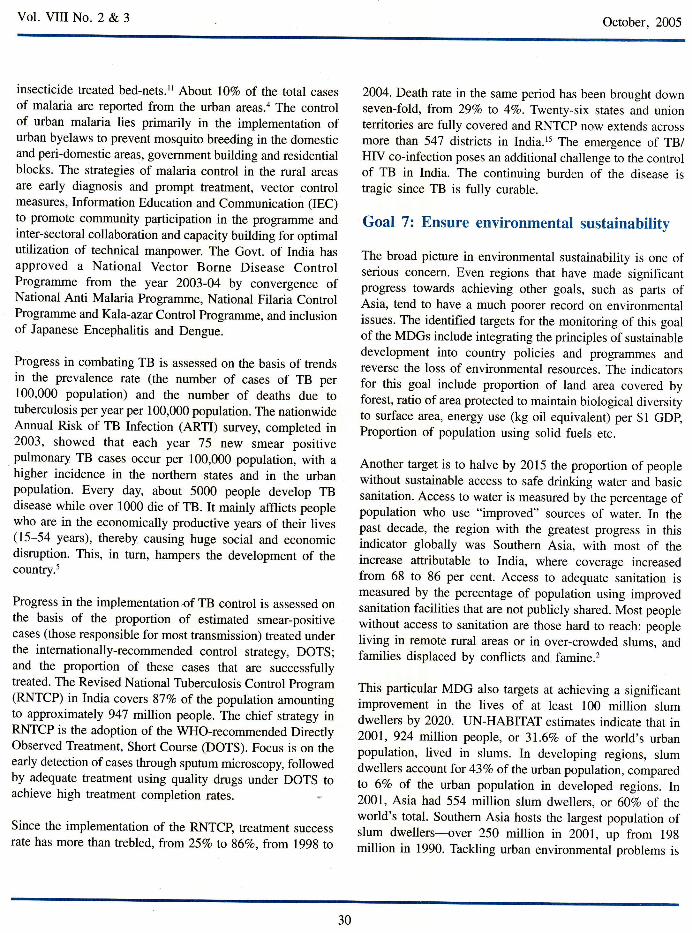
insecticide treated bed-nets.rr About 10Zo of the total casesof malaria are reported from the urban areas.a The controlof urban malaria lies primarily in the implementation ofurban byelaws to prevent mosquito breeding in the domesticand peri-domestic areas, government building and residentialblocks. The strategies of malaria control in the rural areasare early diagnosis and prompt treatrnent, vector controlmeasures, Information Education and Communication (IEC)to promote community participation in the programme andinter-sectoral collaboration and capacity building for optimalutilization of technical manpower. The Govt. of India hasapproved a National Vector Borne Disease ControlProgramme from the year 2003-04 by convergence ofNational Anti Malaria Programme, National Filaria ControlProgramme and Kala-azar Control Programme, and inclusionof Japanese Encephalitis and Dengue.
Progress in combating TB is assessed on the basis of trendsin the prevalence rate (the number of cases of TB per100,000 population) and the number of deaths due totuberculosis per year per 100,000 population. The nationwideAnnual Risk of TB Infection (ARTI) survey, completed in2003, showed that each year 75 new smear positivepulmonary TB cases occur per 100,000 population, with ahigher incidence in the northern states and in the urbanpopulation. Every day, about 5000 people develop TBdisease while over 1000 die of TB. It mainly afflicts peoplewho are in the economically productive years of their lives(15-54 years), thereby causing huge social and economicdisruption. This, in turn, hampers the development of thecountry.5
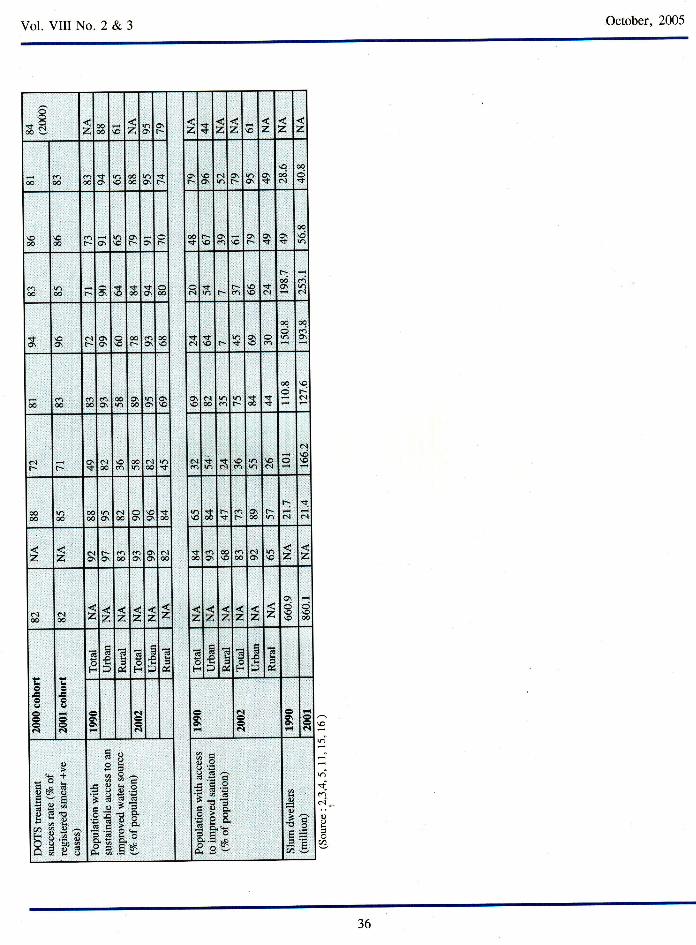
Progress in the implementationof TB control is assessed onthe basis of the proportion of estimated smear-positivecases (those responsible for most transmission) treated underthe internationally-recommended control strategy, DOTS;and the proportion of these cases that are successfullytreated. The Revised National Tuberculosis Control program(RNTCP) in India covers 87Vo of the population amountingto approximately 947 million people. The chief strategy inRNTCP is the adoption of the WHO-recommended DirectlyObserved Treatment, Short Course (DOTS). Focus is on theearly detection of cases through sputum microscopy, followedby adequate treatment using quality drugs under DOTS toachieve high treatment completion rates.
Since the implementation of the RNTCP, treatment successrate has more than trebled, from 257o to 86Vo, from 1998 to
2004. Death rate in the same period has been brought downseven-fold, from 29Va to 47o. Twenty-six states and unionterritories are fully covered and RNTCP now extends acrossmore than 547 districts in India.l5 The emergence of TB/HIV co-infection poses an additional challenge to the controlof TB in India. The continuing burden of the disease istragic since TB is fully curable.
Goal 7: Ensure environmental sustainability
The broad picture in environmental sustainability is one ofserious concern. Even regions that have made significantprogress towards achieving other goals, such as parts ofAsia, tend to have a much poorer record on environmentalissues. The identified targets for the monitoring of this goalof the MDGs include integrating the principles of sustainabledevelopment into country policies and programmes andreverse the loss of environmental resources. The indicatorsfor this goal include proportion of land area covered byforest, ratio of area protected to maintain biological diversityto surface area, energy use (kg oil equivalent) per gl GDp,Proportion of population using solid fuels etc.
Another target is to halve by 2015 the proportion of peoplewithout sustainable access to safe drinking water and basicsanitation. Access to water is measured by the percentage ofpopulation who use "improved" sources of water. In thepast decade, the region with the greatest progress in thisindicator globally was Southern Asia, with most of theincrease attributable to India, where coverage increasedfrom 68 to 86 per cent. Access to adequate sanitation ismeasured by the percentage of population using improvedsanitation facilities that are not publicly shared. Most peoplewithout access to sanitation are those hard to reach: peopleliving in remote rural areas or in over-crowded slums, andfamilies displaced by conflicts and famine.2
This particular MDG also targets at achieving a significantimprovement in the lives of at least 100 million slumdwellers by 2020. UN-HABITAI estimates indicate thar in200L, 924 million people, or 3l.6%o of the world's urbanpopulation, lived in slums. In developing regions, slumdwellers account for 43Vo ofthe urban population, comparedto 6Vo of the urban population in developed regions. In2001, Asia had 554 million slum dwellers, or 60% of theworld's total. Southern Asia hosts the largest population ofslum dwellers---over 250 million in 2001, up from 198million in 1990. Tackling urban environmental problems is
30
Vol. Vil No. 2 & 3 October,2005
Not surprisingly, given the large size and heterogeneity ofmost Indian states, the state averages of the MD indicatorsmask large intra-state variations. It may be useful toidentify the regions that rank poorly on all of the fiveindicators. Such regions could be considered the mostdeprived regions in the country. India cannot hope to attainthe MDGs without significant progress in the MD indicatorsin its poorest states - Bihar, Orissa, Uttar pradesh, MadhyaPradesh and Rajasthan. These States not only currentlyaccount for a large proportion of the country,s population,but, because of more rapid population growth, will account
. for an even larger share of the country's population in 2015.
Further, many of the Millennium Development indicatorshave high levels of geographical concentration in India. Forinstance, one-fifth of the villages and districts account foraround a half of all the infant deaths, and underweightchildren in the country. Amazingly, three quarters of all theout-of-school children aged 6-ll years are concentrated inonly 2O7o of the country's villages. The results ongeographical concentration of the MD indicators suggestthat targeting resources and interventions to villages anddistricts with the worst human development indicators is notonly desirable for improving equity, but will also be themost effective strategy for attainment of the MillenniumDevelopment Goals.
Third, there are other types of disparities in most of the MDindicators, the reduction of which would help in theattainment of the MDGs. Gender disparity is one example.
Since 2000, when the MDGs were ratified at the UnitedNations Millennium Summit, the goals have been widelyaccepted as a yardstick for measuring development progressacross countries. To be enduring, success in reaching thegoals must be based on system-wide reforms to supportprogress. Focusing on the outcomes does not imply focusingon education and health services alone. Health and educationoutcome'S depend on too many other factors for that towork---rverything from parents' knowledge an! behavior,to the ease and safety of reaching a health clinic or school,or the technology available for producing outcomes.
The Millennium Development Goals commit the internationalcommunity to a comprehensive vision of development - onethat places human development as the centerpiece of socialand economic progress and puts great value on globalpartnerships for development.
The Tenth Five Year Plan and the recently launched NationalRural Health Mission carry forward the vision of the MDGs.The Tenth Plan, for example, targets:
. All children to be in school by 2003 and complete 5years of schooling by 2007;
. Reduction ofpoverty ratio (proportion ofpeople belowpoverry line) to 2l7o by 2007 and furrher to ll%o by2012 (from 36Vo in 1993-94 and 26Vo in 1999-2000);
. Reducing gender gaps in literacy and wage rates by5OVo by 2006-07,
. Infant mortality rate (IMR) of 45 per thousand livebirths by 2007 and 28 by 20t2,
. Reduction in the maternal mortality ratio from 4 in1999-2000 to 2 per 1000 live birrhs in 2007 and, I by20t2,
. Reduction of HIV/AIDS through targetted intervention,
. 25Vo reduction in morbidity & mortality due to malariaby 2007 and 50Vo by 2010
. All villages to have sustained access to potable waterby 2007
. Increase in foiest cover to 25Vo by 2007 and 33Vo by2012. The forest cover was 2O.6Vo in 2001.
. Cleaning of major polluted rivers by 2007 and othernotified stretches by 2012.
The National Rural Health Mission was launched in April2005 as an all encompassing program for rural development.Among its numerous components, this program aims atstrengthening of primary health care infrastructure,amalgamation of vertical health programs including theReproductive and Child Health - Z and the Integrated ChildDevelopment Scheme, and integration of health concernswith determinants of health like sanitation & hygiene,nutrition, and safe drinking water.
Thus a number of initiatives have been taken and are beingundertaken which more or less have the same vision, ahealthy and developed nation, as is also reflected in ourPresidents dream of a healthy India.
"A developed India by 2020, or even earlie4 is not adream. It need not even be a mere vision in the minds of
32
October, 2005
Vol. VIII No. 2 & 3
many Indians, It is q mission that we can all take up - and
succeed."
Dr. APJ Abdul Kalam
? Chaudhury Nazmul, Hammer JS' Kremer M' et al
"Teacher ind Health Care Provider Absenteeism: A
iuttiCountry Study:'World Bank Washington' DC' 2003
8 Public Affairs Centre "Benchmarks for the New
. Millennium: State of India's Public Services'" Public Affairs
Centre, Bangalore, lndia', 2002
e Victora, C G, WagstaffA, Schellenberg JA' et al' "Applying
* Bqrity Lens to-Child Health and Mortality: More of the
i"*" i s not Enough." The Lancetz}O3' 362' July 19:233-
41.
loCountry Fact-file on Maternal, Newborn and Child Health
situation in India, 2005. Submitted to WHO Country Office'
lndia
11 Basic Indicators 2O02,in Healh Situation in the South-East
Asia., WHO,2003
t2 National Consultation on HIV estimates/surveillance India
2004: Policy and Programme Implications' NACO' 2005
13 Annual Repot 2002-2003, 2003-2004' National AIDS
Control Orgaiization, Ministry of Health and Family Welfare'
Govemment of India. Available from www'nacoonline'org
ta Annual Report 2003-04, Ministry of Health and Family
Welfare, Government of India,
lsTBIndia2005-RNTCPStatusReport'CentralTBDivision'
DirectorateGeneralofHealthServicesMinistryofHealthandFamily Welfare, Govemment of India' 2005
| 6 P ro gre s s t ow ards the M illennium D ev elopme nt G o al s' I 99 0 -
2004, Department of Economics and Social Affairs' World
Bank
"FryS,CousinsB,andOlivolaK,"Health-ofC6llftsnIjvingin UrUan Slums in Asia and the Near East: Review of Existing
Literature and Data,, Environmental Health Project, Activity
Report 109 (2002).
References
I India at a Glance, 8/1/05' from the Wor1d Bank Website'
at http://www.worldbank'org/cgi-bin/sendoff'cgi?page=7o2;dar cottrydataEo}FaagEozEird aag'pdf'accessed l0-
8-2005.
2 Report No. 30266-IN' India' Attaining the. Millennium
Devilopment Goqls in India: How Likely and What Will h
rake ti Reduce Infant Mortality, Child Malnutrition' Gender
Disparities and Hunger-Poverry qnd to Inc,rease School
Eniollment and Completion? Htman Development Unit
South Asia Region. 2004
3 National Sample Survey Organisation (NSSO)' Level qnd
Pattern of Consumer ixpenditure in India 1999-2000'
Re|; 4i7, National Sample Survey organisation' New
Delhi, 2001
a National Sample Survey Organisation (NSSO)' l'evel and
Pattern of Coniumer Expenditure in India 1993-94' Report
No +OZ, National Sample Survey Organisation' New
Delhi.l996
s National Family Health Survey-2 (1998-99)' International
Institute of Population Sciences and ORC Macro'
Mumbai.2000
6 Mahal, A., J. Singh, F Afridi, V' et al "Who 'Benefits'
from Public Sector Health Spending in India? Results of a
BenefitlncidenceAnalysisforlndia'"BackgroundPaperpt"p*"0 for David H' P"t"tt' Abdo Yazbeck' Rashmi
Sharma, G.N.V. Ramana, Lant Pritchett' and Adam Wagstaff'
)nOO. nruu Health Systems for India 's Poor: Findings'
Analysis, and Options. The World Bank Human Development
Network, Washington DC, 2002
33
Vol. Vil No. 2 & 3 October, 2005
('lEIEI
N!+al z
nc.) F..v z
hO\!i(\=oh v6l
rO\"dgG.h vOt
1Rts\o J c.l
o.l o\6\ €
?=€d
rat
CP35
gl El$l\o ot
+ \ca 6
..!
6
qol&
qrr(-- r e.l
oo\oa- F-
q€ 6€ \o o\.+ a
6ri--
Elilsrnao
€ c!@
a.l
+6i9\ o
oo
6
-t006
v?a-@
oi€\el
\oNa
€c.lo\
ooF.-
oot sn \o alf.- t-r
.it
;l;t$lr- n s
o t, a-$F*a.ta-
no\r
a-oi.-.
dl\o €n
c.l
r d;|,-
\o\o
qo\a-
al r€ t--\o 00\o
El a{loea-
9\o o\ \a-o\
vN5
F- t-r:\o
alcl
clcq eilO @
$6 r o €
6 6
.gl ir
!lil;rslrr 6n\o€
n$6
a-r) o\
@ o\\ooo
x3 o\
otFo\ s s
cas!j-
€6I
Fr- oo\
EI::l 6!r
lr el .91
EtEtflo\\Cttf,
\N+
n\ot+ alm c.)
qt-
N<..i\c
no\r+
('l\f,+
=q$qa.l
q6* t-.
\oco
:+t- 3 t-- \o
EIEliI d alo\ t--
66€ o\
o\co6
(n
€d)r-€
9co
o6i€
al6€ F-€ *t .rf,
o €(hl(Jl z z o\ .I
@n00 z z z z z 2 $
.+s $ h z ro\
.!l orII EI9tu>l olol lrlAl hd
ano\clot
6i(\ ocn
€d
no\a-
\cl€
Nsi)o
olo\t-
aq
t-.n6loo
*6
9€F
t-r$€ € F \o c.l€ c-t
F la F \J c0
6l9I>t
o\g\o\a6\ al
o\ at
6l
o\
€\g\
o\o\€ao\
N o\cr\ao\o\
tN
c.l
o\g\N
Na5
cl
t\01o\
ra
N
8HI
3lalal
bo
a.=Eq
EE TOJEo,= -A O'e
E 8.;
*;EU9'r"EE>,tr !no5v& oc ooboE>li'd o
dtr?tr.9 3E:Y9trE oEohE I.E
rJ.1 E ts
o'tr ir.adv
<:
b'EaqD9:ocEo
I b'P"aod'
o
3sE Ets (g-^a
I $ Ee^X
a d^
Eg63E.F o'o d !ln gtES
E
o
oYO'id
o6
6
o
dtr
o
-H e3ilr?o d: od)o re tr: tr 6qn6N'll o
8S E€
zFq
L
F
,00
li
NO
tr
34
Vol. VIII No. 2 & 3 October, 2005
cl$t+
o\oO
ro3Ov
6O
$E z ooz z z z z z
olz
€z z
\o(\<t z z
n
O Oo\
o\ s \c d z z. z z z z z z ooo€ i'
@ o\ o,
cl ol\om
cn o I o r- z z z zo\€.+
(\$
€\t \o<t t
Ni--6l f--
a.l o €al 9 F.- € o\ cn.+ t-.o v ol o\
clr N z z z z oo\od
c \oat at cl ol
a]c.l
\oa- € € @ € t-
s sN Oio\ o\ o\
oto\
t--*N s mF.. a-- € N
F-a€ q
c.l6c.l
o\ s :f, x ol$ N :+
aA \f o\ s + z z 2 2 2 z z z r) r+ o]$ <t $
z z z z z z z z z z z c..lF-.N al z z z z z
$$r-cl ai ol
Nc{+ at
r) alcn6
e.l\o cl
6
F
o
oB
go2 F
ooB
oo
?o9E!= >'9.obq g,
ET';AOa
"d oo
}E6AOq.o -,L eJ
qo!
o
:9OPlr >'9-ohc oxo>-=Hotr!a>
!b0
lrOig
}E65eloE v:H C)4-o o.9ro!
g\o\ N N
(.)
CI N d
N
N N 6l
al
al
o
>ro
a!-O
2.dr
o
!oc+ZN
0)
jt
BSo!
.zEo{Y
o2
6-BO. b0e tadil'-
^X'i!E;<eY>^ohH
H,
EEflEE;1Bal€ns$gE c# B5
.S, :do
=- o
I i a M^e cd.! '" a.9 H $EP=;:>{ire.EaE9-^i^A
$Eg=YE E A>NS oql=r)r- o oiJii
o
o=E)=x=ino-69tioviPo6-Fi:o.
fA
E ^ ESa i *)--a*
^4a=; '=osi 6 a?E E o=O P FU€s33e
H IJEi
35
Vol. Vil No. 2 & 3 October, 2005
\o
$oN0)o
a
<-R€U z co6 \6
4z rno\ 6
F* $ Gl* 2 z
60ca & !t \o @€ .+
t-\o 1o.l616
n lo\o\ l+qg6c'l
ao
d
\o6 oo r \o o\r o\ F\
r o\ lo'r'- l{ o\q(\c
o oo t, 6st\o +
@-+o\ 6
+lrl lF-\o I+\O lct
r.oo anrl
el
$5 \oo\
c.lr- o\qor f d nlO\tA+ l\o l6
mral
dr?
* (O6
(a* 06 6\0|o
r) o :l\lat lraiol6l6 ^ l< tst\ I€ lr+
00r.-c'I
Nt,r |.*
cl\rt 6l* \o dh
Noa
rat$ +rn
rrllS lF-al€l$
ollrl l\o:n lh I e.I
a,\c\e
@6
lrtb o(o( 6 c.l
ooca lO\ I l'-l'- loO ltat
r-or
r{,.jN
z z 6tCl\
r:d\
c40|o t\ f^
Eco lN l!nm lo\ l\o z z
6lco
N*42 z z z z, z <t<t<zlzlz A*W -i
\l, !o
L
o I
N
sF
r{
;l
d
t*.6
EIgIE
o\Cr
N
alo\6!
?il
.Io\a
o!=+
Es 3trvoifdXEF;H-O
'caR9^q o.9 iiE H UB
iqi
s
oc
6 6.}EEO'
9EHoEl o-
36O'EO d^d.3 tr€ E3'r@d,oagElia868.*Bto ^tl-
q)
oBeE6
iA,1
36