CONTENTS - EduGAINS
69
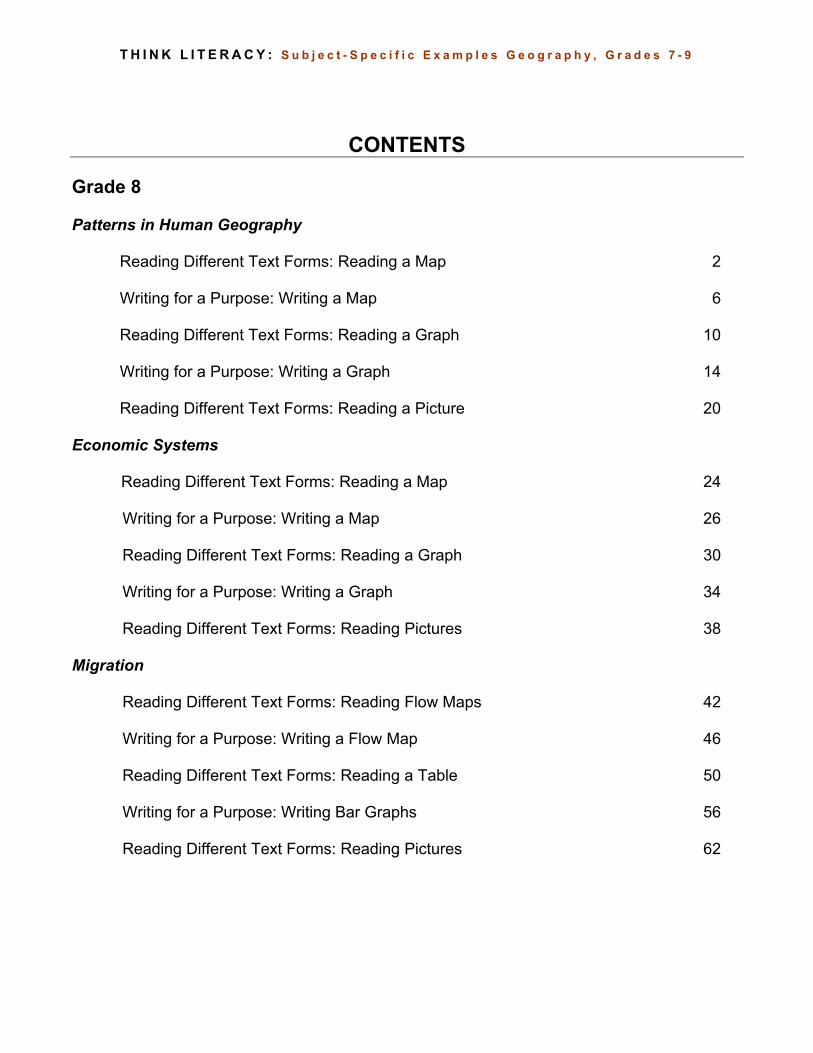
THINK LITERACY: Subject-Specific Examples Geography, Grades 7-9 CONTENTS Grade 8 Patterns in Human Geography Reading Different Text Forms: Reading a Map 2 Writing for a Purpose: Writing a Map 6 Reading Different Text Forms: Reading a Graph 10 Writing for a Purpose: Writing a Graph 14 Reading Different Text Forms: Reading a Picture 20 Economic Systems Reading Different Text Forms: Reading a Map 24 Writing for a Purpose: Writing a Map 26 Reading Different Text Forms: Reading a Graph 30 Writing for a Purpose: Writing a Graph 34 Reading Different Text Forms: Reading Pictures 38 Migration Reading Different Text Forms: Reading Flow Maps 42 Writing for a Purpose: Writing a Flow Map 46 Reading Different Text Forms: Reading a Table 50 Writing for a Purpose: Writing Bar Graphs 56 Reading Different Text Forms: Reading Pictures 62
-
Upload
khangminh22 -
Category
Documents
-
view
1 -
download
0
Transcript of CONTENTS - EduGAINS
T H I N K L I T E R A C Y : S u b j e c t - S p e c i f i c E x a m p l e s G e o g r a p h y , G r a d e s 7 - 9
CONTENTS Grade 8 Patterns in Human Geography Reading Different Text Forms: Reading a Map 2 Writing for a Purpose: Writing a Map 6 Reading Different Text Forms: Reading a Graph 10 Writing for a Purpose: Writing a Graph 14 Reading Different Text Forms: Reading a Picture 20 Economic Systems
Reading Different Text Forms: Reading a Map 24
Writing for a Purpose: Writing a Map 26
Reading Different Text Forms: Reading a Graph 30
Writing for a Purpose: Writing a Graph 34
Reading Different Text Forms: Reading Pictures 38
Migration
Reading Different Text Forms: Reading Flow Maps 42
Writing for a Purpose: Writing a Flow Map 46
Reading Different Text Forms: Reading a Table 50
Writing for a Purpose: Writing Bar Graphs 56
Reading Different Text Forms: Reading Pictures 62
T H I N K L I T E R A C Y :
S u b j e c t - S p e c i f i c E x a m p l e s G e o g r a p h y , G r a d e s 7 - 9
Reading Different Text Forms: Reading a Map
Grade 8 Geography – Patterns in Human Geography
R
2
Graphical text forms (such as diagrams, photographs, drawings, sketches, graphs, schedules, maps, charts, timelines and tables) are intended to communicate information in a concise format and illustrate how one piece of information is related to another. Providing students with an approach to reading graphical text also helps them to become effective readers. Purpose • Become familiar with the elements and features of graphical texts. • Explore a process for reading graphical texts, using a range of strategies for before, during
and after reading. Payoff Students will: • •
•
•
become more efficient at “mining” graphical texts for information and meaning. practise essential reading strategies and apply them to different course-related materials.
Tips and Resources
Sometimes a complicated idea or concept can be more easily communicated through a map. Often a map shows information in the context of a specific place and time. The map provides clues to the concept and focuses on certain map conventions (such as title, legend, direction, scale, and borders). See the following resources:
- Student/Teacher Resource, Population Density Map of Canada. - Student Resource, Tips for Reading Graphical Text, Think Literacy: Cross-Curricular
Approaches, Grades 7-12, p.86. - “Where People Live” in Human Geography (Gage), pp. 8-9. - website, www.atlas.gc.ca
• Many of the strategies for reading informational and literary texts can also be used effectively to read graphical texts.
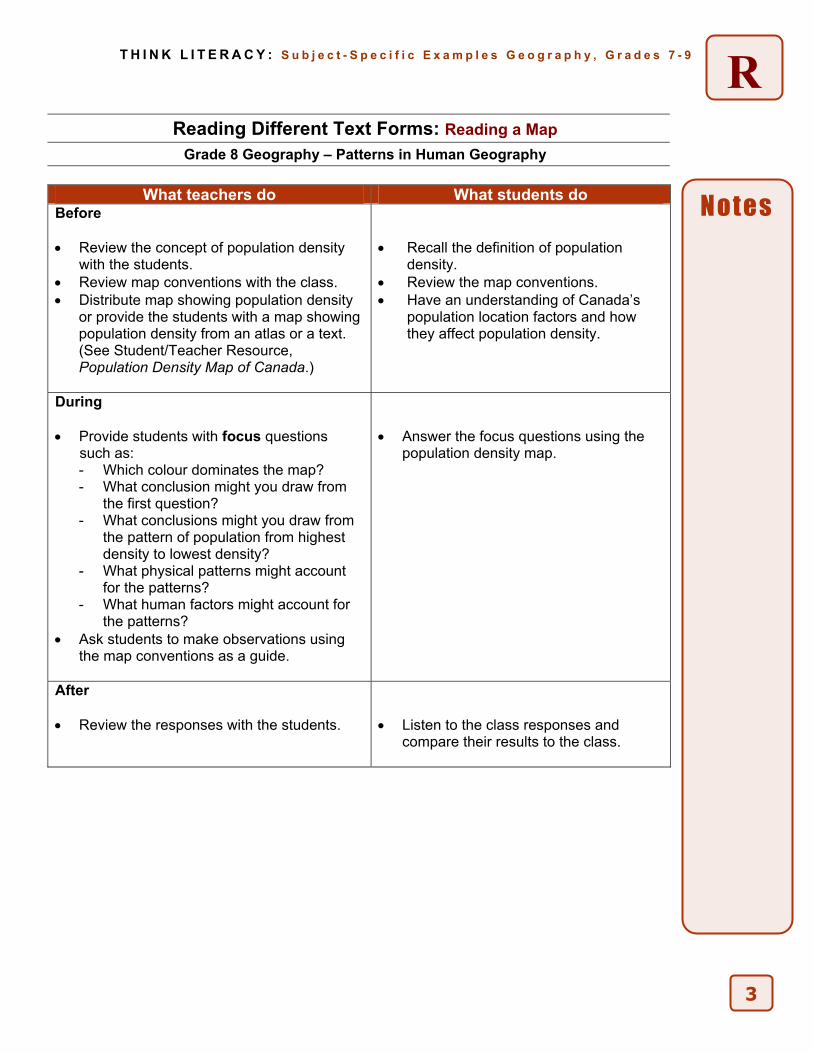
• The majority of Canada’s population is concentrated in a thin belt of land between Windsor and Quebec City. Even though Canada is the second largest country in the world in terms of area, it only ranks thirty-third in terms of population. The map illustrates the population density from the census information for the year 1996. Population density is calculated by taking the total population of the census division and dividing the number by the total area measured in square kilometers. The majority of Canada’s population occurs in the southernmost part of the country. The agricultural areas in the Prairies and eastern Canada have higher population densities than the sparsely populated North, but not as high as southern Ontario or southern Quebec. The agricultural and resource based economy support a medium to low-density population.
Further Support • Provide students with an advance organizer to guide them as they read a particular text.
This might be a series of prompts to guide them through the reading task.
RT H I N K L I T E R A C Y : S u b j e c t - S p e c i f i c E x a m p l e s G e o g r a p h y , G r a d e s 7 - 9
Reading Different Text Forms: Reading a Map
Grade 8 Geography – Patterns in Human Geography
Notes What teachers do What students do
Before • Review the concept of population density
with the students. • Review map conventions with the class. • Distribute map showing population density
or provide the students with a map showing population density from an atlas or a text. (See Student/Teacher Resource, Population Density Map of Canada.)
• Recall the definition of population
density. • Review the map conventions. • Have an understanding of Canada’s
population location factors and how they affect population density.
During • Provide students with focus questions such as:
- Which colour dominates the map? - What conclusion might you draw from
the first question? - What conclusions might you draw from
the pattern of population from highest density to lowest density?
- What physical patterns might account for the patterns?
- What human factors might account for the patterns?
• Ask students to make observations using the map conventions as a guide.
• Answer the focus questions using the
population density map.
After • Review the responses with the students.
• Listen to the class responses and
compare their results to the class.
3
R T H I N K L I T E R A C Y : S u b j e c t - S p e c i f i c E x a m p l e s G e o g r a p h y , G r a d e s 7 - 9
Student/Teacher Resource
Population Density Map of Canada
Population Density by Census Division, 1996 (person/square kilometre)
0 to 0.9
1 to 9.9
10 to 69.9
70 to 599.9
600 to 1 999.9
2 000 to 3 785.8
Boundaries
International
Provincial / Territorial
Canada / Kalaallit Nunaat dividing line
EEZ (200 mile)
Other Features
Water area
Regions outside Canada
Abstract: The majority of the Canadian population, about 60% is concentrated within a thin belt of land representing 2.2% of the land between Windsor, Ontario and Quebec City. Even though Canada is the second largest country in the world in terms of land area, it only ranks 33rd in terms of population. The agricultural areas in the Prairies and eastern Canada have higher population densities than the sparsely populated North, but not as high as southern Ontario or southern Quebec.
© Her Majesty the Queen in Right of Canada, 2004. www.atlas.gc.ca
4

W T H I N K L I T E R A C Y :
S u b j e c t - S p e c i f i c E x a m p l e s G e o g r a p h y , G r a d e s 7 - 9
Writing for a Purpose: Writing a Map
Grade 8 Geography – Patterns in Human Geography
When students can get the “picture” of a form of writing in their heads, they feel more confident about creating the final product. A template or framework is a skeletal structure for a writing form that allows students to organize their thoughts and researched information in order to write a first draft. Purpose • Provide students with a template to scaffold their understanding of a form of writing and help
them organize information before drafting the piece. Payoff Students will: • learn the common expectations for the form and components of a particular writing assignment. • organize their writing and ensure that it meets the requirements of the assignment. Tips and Resources • Sometimes a complicated idea or concept can be more easily communicated through a map.
Often a map shows information in the context of a specific place and time. The map provides clues to the concept and focuses on certain map conventions (such as title, legend, direction, scale, and borders).
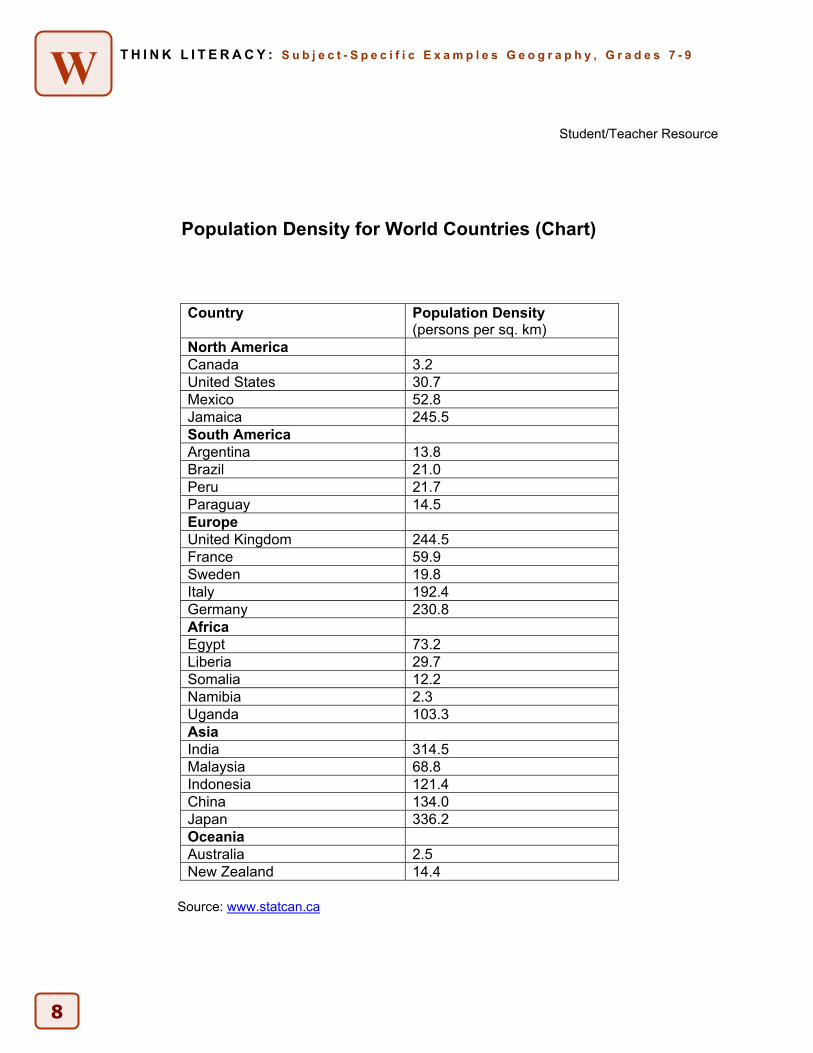
• See the following resources: - Student/Teacher Resource, Population Density for World Countries (Chart). - “Where People Live” in Human Geography (Gage), pp. 8-9. - web site, www.atlas.gc.ca or any atlas with population density data.
• Population density is the relationship between the area and the population of a country. This can be calculated by dividing the country’s population by the area. Population density is just a way of making a general comparison of the relationship between area and the population of a country.
Further Support • The template for any individual writing assignment can be revised to make accommodations
necessary for students with special needs. For example, reduce the number of paragraphs or supporting details, create differing expectations for research, or for the complexity of the main idea, etc.
6
S u b j e c t - S p e c i f i c E x a m p l e s G e o g r a p h y , G r a d e s 7 - 9 W T H I N K L I T E R A C Y :
Writing for a Purpose: Writing a Map
Grade 8 Geography – Patterns in Human Geography
What teachers do What students do Before • Introduce the activity to the students with
a review of the map conventions. • Instruct students to label the names of the
countries from the chart onto the map and use a coloured scale in the legend to show the population density of each country.
• Provide the students with the chart of the population density and a blank world political map. See Student/Teacher Resource, Population Density for World Countries (Chart).
• Discuss with the students the appropriate legend for the map.
• Review the concepts of map
conventions. • Preview the population density map
instructions.
During • Monitor the activity checking that the
students label the map correctly. • Provide students with focus questions
such as: - How does population density vary
around the world?
• Complete the map showing the population density of each country using the appropriate legend and colours.
• Answer the focus questions.
After • Have the students calculate the
population density of the class and the other classes in the school.
• Draw the results on a map of the school. • Students may compare population
density, birth rates, death rates, or other indicators in Canada to other countries.
• Assign each student a different country and have them construct a composite table or prepare a report on population patterns.
• Students may present their findings to the class.
• Working with a partner or
individually map the population density for the classroom and other classes in the school.
• Share your results with the class.
7
Notes
W S u b j e c t - S p e c i f i c E x a m p l e s G e o g r a p h y , G r a d e s 7 - 9 T H I N K L I T E R A C Y :
Student/Teacher Resource
Population Density for World Countries (Chart)
Country Population Density (persons per sq. km)
North America Canada 3.2 United States 30.7 Mexico 52.8 Jamaica 245.5 South America Argentina 13.8 Brazil 21.0 Peru 21.7 Paraguay 14.5 Europe United Kingdom 244.5 France 59.9 Sweden 19.8 Italy 192.4 Germany 230.8 Africa Egypt 73.2 Liberia 29.7 Somalia 12.2 Namibia 2.3 Uganda 103.3 Asia India 314.5 Malaysia 68.8 Indonesia 121.4 China 134.0 Japan 336.2 Oceania Australia 2.5 New Zealand 14.4
Source: www.statcan.ca
8

T H I N K L I T E R A C Y : S u b j e c t - S p e c i f i c E x a m p l e s G e o g r a p h y , G r a d e s 7 - 9
Reading Different Text Forms: Reading a Graph
Grade 8 Geography – Patterns in Human Geography
R
10
Graphical text forms (such as diagrams, photographs, drawings, sketches, graphs, schedules, maps, charts, timelines and tables) are intended to communicate information in a concise format and illustrate how one piece of information is related to another. Providing students with an approach to reading graphical text also helps them to become effective readers. Purpose • Become familiar with the elements and features of graphical texts. • Explore a process for reading graphical texts, using a range of strategies for before, during
and after reading. Payoff Students will: • become more efficient at “mining” graphical texts for information and meaning. • practise essential reading strategies and apply them to different course-related materials. Tips and Resources • Sometimes a complicated idea or concept can be more easily communicated through a graph.
The graph provides clues to the concept and focuses on certain graphing conventions (such as topic, type of graph, and use of colour).
• See the following resources: - Student/Teacher Resource, The Population Pyramid, showing the 1996 population. - Student Resource, Tips for Reading Graphical Text, Think Literacy: Cross-Curricular
Approaches, Grades 7-12, p. 86. • For more information, see:
- “How People Live” in Human Geography (Gage), pp. 30-32. - web site, www.census.gov/ipc/www/idbpyr.html.
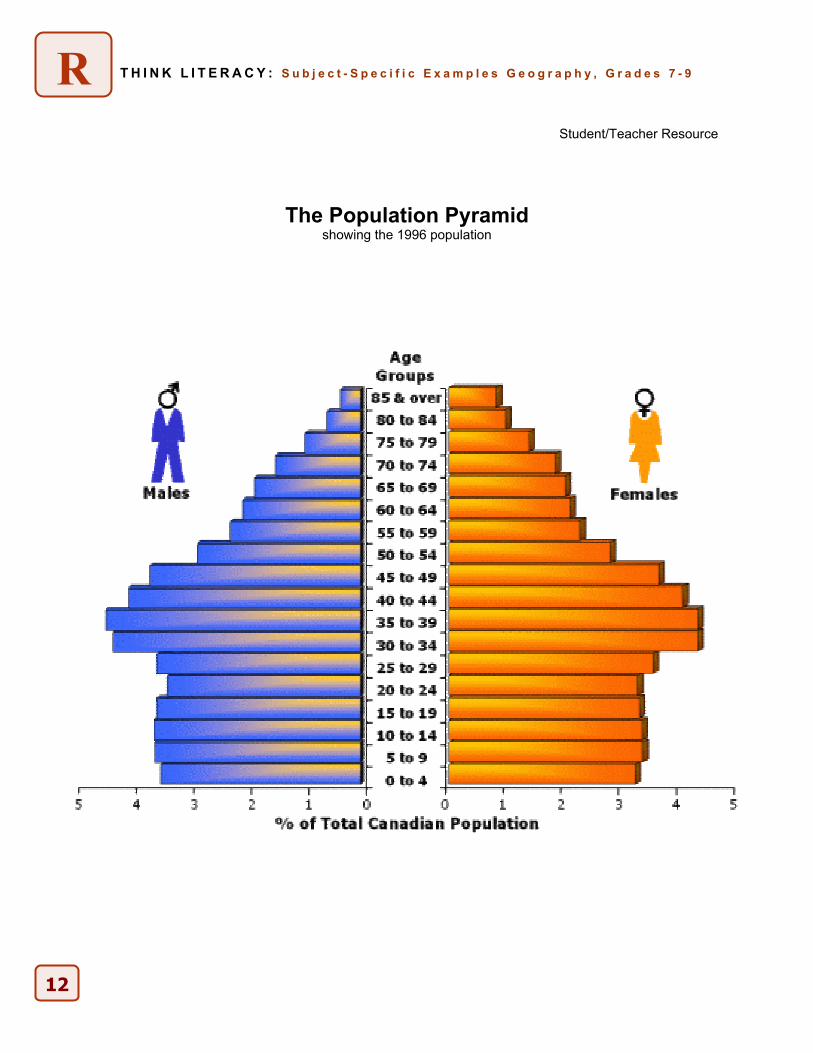
• Population pyramids are a type of graph that shows information about age groups of people within a country. The pyramid is divided into male and female members of the population and age groups. Each graph is a series of horizontal bar graphs stacked on top of each other. The youngest people in a society are shown in the bar graphs at the bottom and the oldest are at the top. The length of each bar shows the percentage or the population in millions of the total population in each group.
• Countries with a rapidly growing population have different age structures from those with slow growth. A rapidly growing population has a wide base at the bottom and a narrow top. Countries with different rates of population growth will have different shapes. A population pyramid that has a narrow base and equal numbers of people in most age groups represents a developed country while a population pyramid with a wide base and a narrow top represents a developing country.
Further Support • Provide students with an advance organizer to guide them as they read a particular text. This
might be a series of prompts to guide them through the reading task.
T H I N K L I T E R A C Y : S u b j e c t - S p e c i f i c E x a m p l e s G e o g r a p h y , G r a d e s 7 - 9
Reading Different Text Forms: Reading a Graph
Grade 8 Geography – Patterns in Human Geography
What teachers do What students do Before • Review the concept of a population
pyramid with the class. • Distribute a copy of the population
pyramid or a similar population pyramid to the students. (See Student/Teacher Resource, The Population Pyramid.)
• Review the concept of a
population pyramid.
During • Provide students with focus questions
such as: - Which age group has the largest
population bar graph? - Which age group has the smallest
population bar graph? - What observations can you make about
the population of Canada from the population pyramid?
- What is the shape of Canada’s population pyramid?
- Is Canada a developed or developing country?
• Ask students to make observations about the shape of pyramid and the different age groupings.
• Answer the focus questions
using the population pyramid.
After • Review the responses with the students. • Have the students find population
pyramids for one country on two other continents (see website listed) and compare those to Canada in terms of the pyramid’s shape and whether the countries are developing or developed countries.
• Collect student activities for evaluation.
• Listen to the class responses
and compare their results to those of other students.
• Use a web site or text material to compare population pyramids.
• Hand in the activities for
teacher evaluation.
Notes
R
11
R T H I N K L I T E R A C Y : S u b j e c t - S p e c i f i c E x a m p l e s G e o g r a p h y , G r a d e s 7 - 9
Student/Teacher Resource
The Population Pyramid showing the 1996 population
12

T H I N K L I T E R A C Y : S u b j e c t - S p e c i f i c E x a m p l e s G e o g r a p h y , G r a d e s 7 - 9
Writing for a Purpose: Writing a Graph Grade 8 Geography – Patterns in Human Geography
W
14
When students can get the “picture” of a form of writing in their heads, they feel more confident about creating the final product. A template or framework is a skeletal structure for a writing form that allows students to organize their thoughts and researched information in order to write a first draft. Purpose • Provide students with a template to scaffold their understanding of a form of writing and help
them organize information before drafting the piece. Payoff Students will: • learn the common expectations for the form and components of a particular writing assignment. • organize their writing and ensure that it meets the requirements of the assignment. Tips and Resources
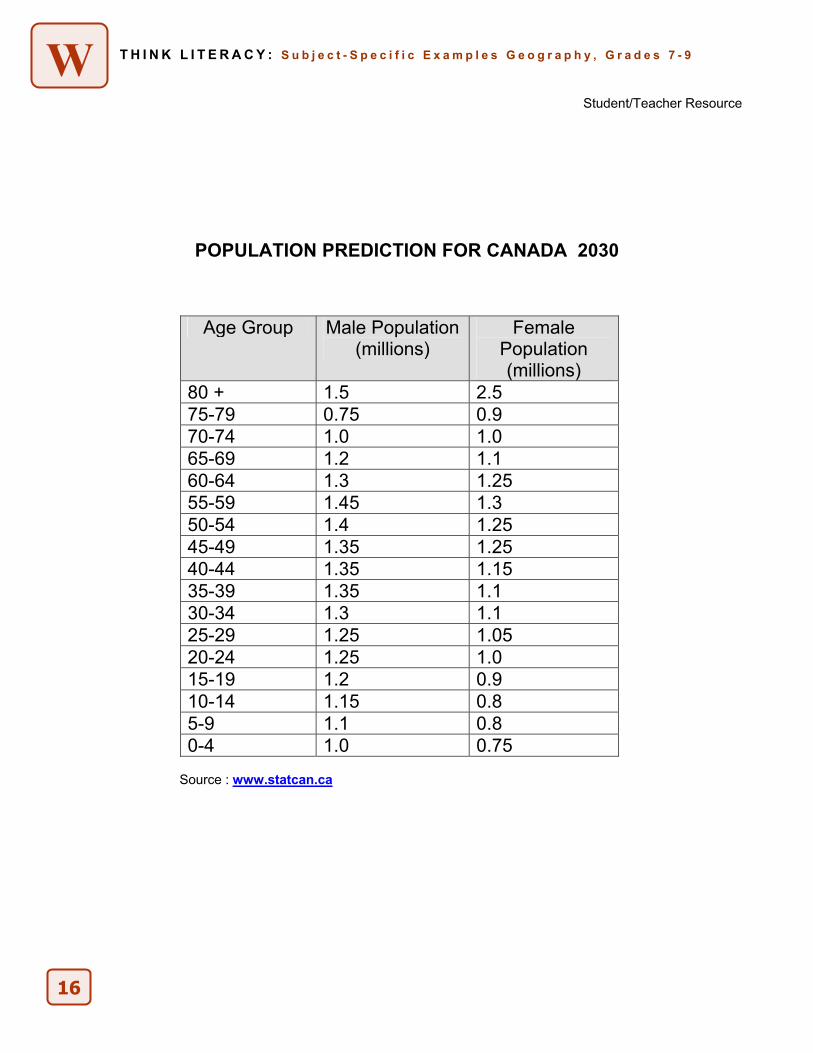
• The statistics shown on the predicted population pyramid reflect the current trend in population information and do not take into account future natural and human disasters such as war, plagues, or famine.
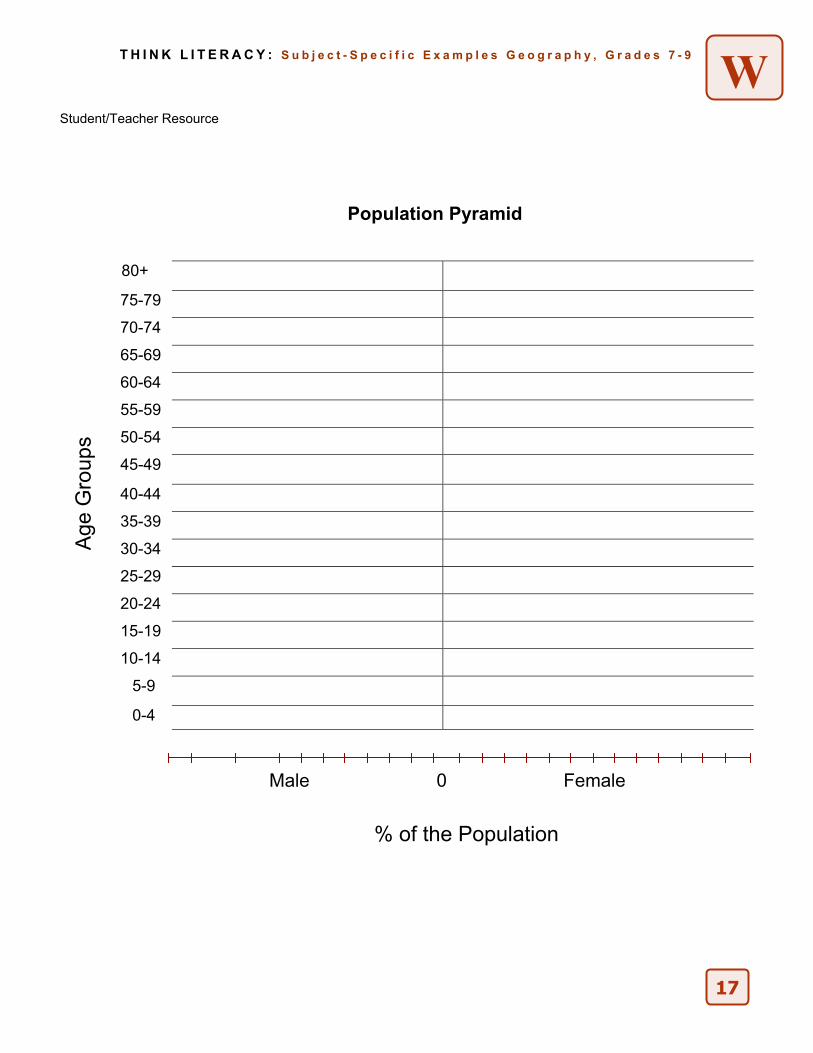
• See the following resources: - Student/Teacher Resource, Population Prediction for Canada 2030. - Student/Teacher Resource, Population Pyramid. - Student Resource, Information Report Template. - “How People Live” in Human Geography (Gage), pp. 30-32. - web site, www.statcan.ca
•
•
•
•
idea, etc.
Population pyramids are a type of graph that shows information about age groups of people within a country. The pyramid is divided into male and female members of the population and age groups. Each graph is a series of horizontal bar graphs stacked on top of each other. The youngest people in a society are shown in the bar graphs at the bottom and the oldest are at the top. The length of each bar shows the percentage or the population in millions of the total population in each group. The Canadian population is continuing an aging trend that started in the 1970’s. This aging is the result of two main factors: a decrease in fertility and an increase in life expectancy. The change in the age structure of the population has an effect on everything from the diaper industry to educational services, the job market and shopping patterns. Most importantly, the expected increase in the number of elderly will affect the need for health services and will put a great deal of pressure on government pension funds. The trends that exist today help us to better understand the challenges of the future. Changing populations have changing needs. An elderly population may require more health care. A baby boom population may require more schools and more child care.
Further Support
The template for any individual writing assignment can be revised to make the modifications or accommodations necessary for students with special needs. For example, reduce the number of paragraphs or supporting details, create differing expectations for research, or for the complexity of the main
T H I N K L I T E R A C Y :
S u b j e c t - S p e c i f i c E x a m p l e s G e o g r a p h y , G r a d e s 7 - 9
Writing for a Purpose: Writing a Graph Grade 8 Geography – Patterns in Human Geography
W
Notes
What teachers do What students do Before • Review the concept of population
pyramids with the students. • Discuss the concept of changing
populations have changing needs with the students.
• Distribute Student/Teacher Resource, Population Pyramid chart to the class and a sample population pyramid graph or a graph selected by the teacher.
• Know how to draw a population pyramid using the appropriate graphing conventions including title, legend, scale, and colour.
• Review the concept of population pyramids and the idea that changing populations have changing needs.
During • Ask the students to draw the
population pyramid using the information found on Student/Teacher Resource, Population Prediction For Canada 2030.
• Circulate through the class to make sure that the students are following the appropriate graphing conventions.
• Draw the population pyramid using the
information found on the chart.
After • Ask the students to compare the
shape and make up of the population changes between the 2030 and 1996 population pyramids.
• Ask the students to record the observations or prepare a report on how the needs of Canadians may change from today to 2030. See Student/Teacher Resource, Information Report Template.
• Compare the 2030 population pyramid
with a present day graph. Observe the differences in shape and age categories.
• Record the observations or prepare a report on the changing needs of Canadians. (See Student Resource, Population Pyramid: Template.) An example of one change might be: As the number of older people grows, how might that affect the need for health care facilities?
15
W T H I N K L I T E R A C Y :
S u b j e c t - S p e c i f i c E x a m p l e s G e o g r a p h y , G r a d e s 7 - 9
Student/Teacher Resource
POPULATION PREDICTION FOR CANADA 2030
Age Group Male Population (millions)
Female Population (millions)
80 + 1.5 2.5 75-79 0.75 0.9 70-74 1.0 1.0 65-69 1.2 1.1 60-64 1.3 1.25 55-59 1.45 1.3 50-54 1.4 1.25 45-49 1.35 1.25 40-44 1.35 1.15 35-39 1.35 1.1 30-34 1.3 1.1 25-29 1.25 1.05 20-24 1.25 1.0 15-19 1.2 0.9 10-14 1.15 0.8 5-9 1.1 0.8 0-4 1.0 0.75
Source : www.statcan.ca
16
WT H I N K L I T E R A C Y :
S u b j e c t - S p e c i f i c E x a m p l e s G e o g r a p h y , G r a d e s 7 - 9
Student/Teacher Resource
Population Pyramid
80+
75-79
70-74
65-69
60-64
55-59
50-54
45-49
40-44
35-39
30-34
25-29
20-24
15-19
10-14
5-9
0-4
Age
Gro
ups
Male 0 Female
% of the Population
17
W T H I N K L I T E R A C Y :
S u b j e c t - S p e c i f i c E x a m p l e s G e o g r a p h y , G r a d e s 7 - 9
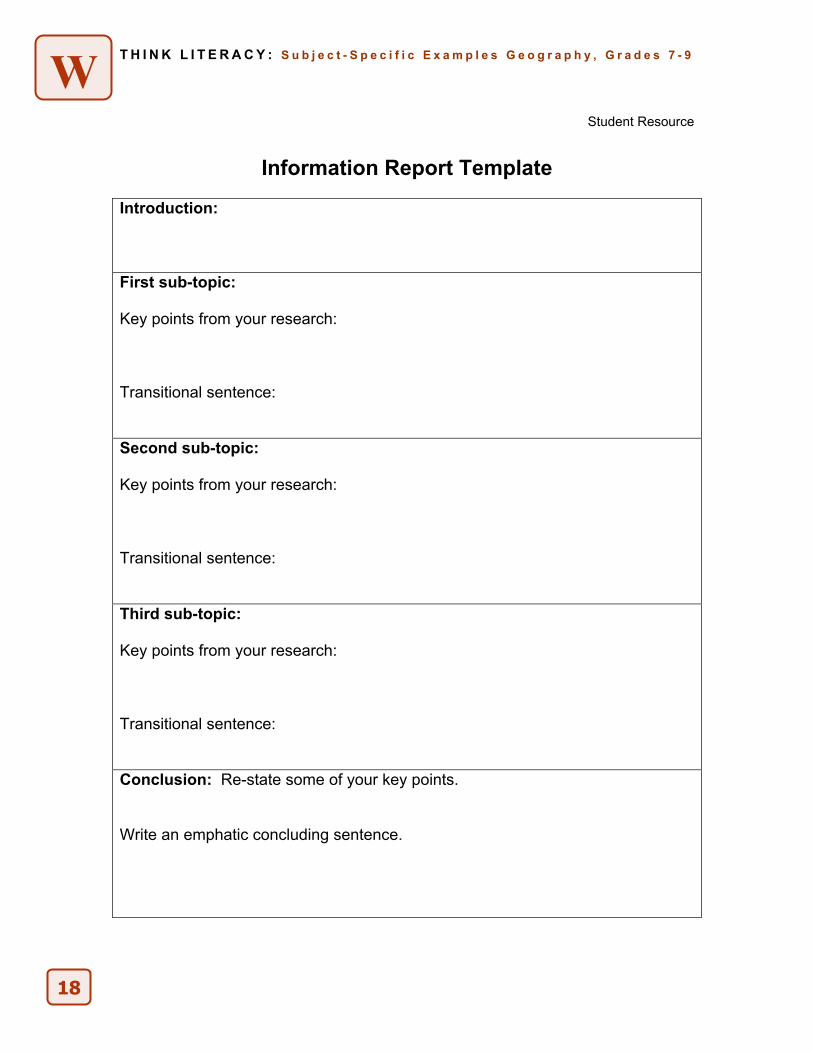
Student Resource
Information Report Template
Introduction: First sub-topic: Key points from your research: Transitional sentence: Second sub-topic: Key points from your research: Transitional sentence: Third sub-topic: Key points from your research: Transitional sentence: Conclusion: Re-state some of your key points. Write an emphatic concluding sentence.
18

T H I N K L I T E R A C Y : S u b j e c t - S p e c i f i c E x a m p l e s G e o g r a p h y , G r a d e s 7 - 9
Reading Different Text Forms: Reading a Picture
Grade 8 Geography – Patterns in Human Geography
R
Graphical text forms (such as diagrams, photographs, drawings, sketches, graphs, schedules, maps, charts, timelines and tables) are intended to communicate information in a concise format and illustrate how one piece of information is related to another. Providing students wan approach to reading graphical text also helps them to become effective reader
ith s.
• •
•
•
•
Purpose
Become familiar with the elements and features of graphical texts. Explore a process for reading graphical texts, using a range of strategies for before, during and after reading.
Payoff Students will: • become more efficient at “mining” graphical texts for information and meaning.
practise essential reading strategies and apply them to different course-related materials. Tips and Resources
Sometimes a complicated idea or concept can be more easily communicated through a picture. The picture provides clues to the concept and focuses on certain features (such as colour, shape and pattern). See the following resources:
- Student/Teacher Resource, Forms of Settlement of the Earth (picture). - Student Resource, Tips for Reading Graphical Text, Think Literacy: Cross-Curricular
Approaches, Grades 7-12, p. 86. - “Human Imprints” in Human Geography (Gage), p. 51.
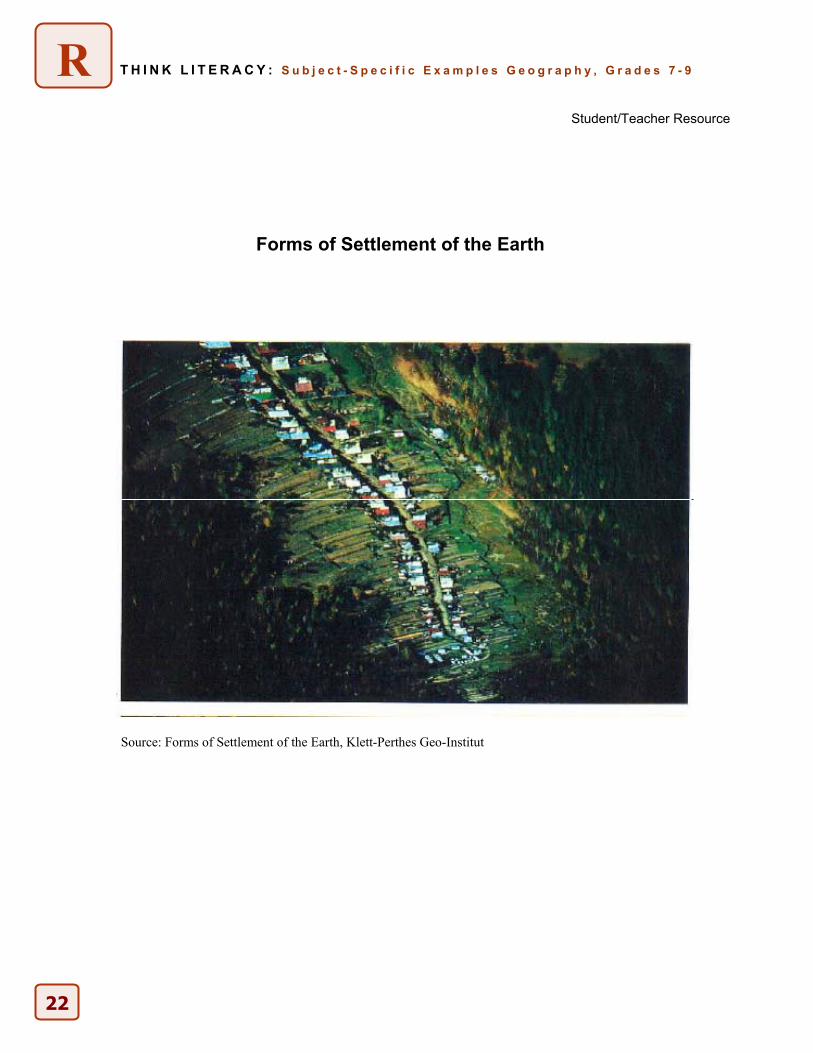
• There are three main types of settlement patterns in rural areas: linear, scattered, and clustered. The picture selected is an example of a linear pattern. This pattern consists of groups of houses or villages that form a long line, which can be straight or wavy. Straight lines may follow a road or railway line and curved lines may follow a river or narrow valley.
• When using the picture provided turn it upside down to reproduce for the students. Further Support • Provide students with an advance organizer to guide them as they read a particular text.
This might be a series of prompts to guide them through the reading task.
20
R T H I N K L I T E R A C Y : S u b j e c t - S p e c i f i c E x a m p l e s G e o g r a p h y , G r a d e s 7 - 9
Reading Different Text Forms: Reading a Picture
Grade 8 Geography – Patterns in Human Geography
What teachers do What students do Before • Review with students the three main
population settlement patterns. • Review with students both physical and
human geographical features. • Distribute copies of the picture to the
students, or produce an overhead, or black and white copies, or use a picture such as the one provided. (See Student/Teacher Resource, Forms of Settlement of the Earth.)
• Set a purpose for the activity.
• Review the three types of population
patterns. • Review the characteristics of both
physical and human geographical features.
• Review the use of a graphic organizer.
During • Provide students with focus questions
such as: - What physical features do you see in
the picture? - What human features do you see in
the picture? - What type of settlement pattern is
found in the picture? - What factures might contribute to
this type of pattern? • Do you think in the future this community
will continue to grow? Explain your reasons.
• Ask students in pairs or individually to observe the picture.
• With a partner or individually, answer
the focus questions using the picture as your point of reference.
After • Discuss the students’ responses in
class. • Review the picture and ask the students
to describe the community changes that they might envision over the next ten years in terms of both physical changes and human changes. A graphic organizer may be used for this follow-up activity.
• Listen to the class responses and
draw a conclusion based on the information.
• With a partner or individually draw conclusions about the future land patterns in this community and complete the graphic organizer.
Notes
21
R T H I N K L I T E R A C Y : S u b j e c t - S p e c i f i c E x a m p l e s G e o g r a p h y , G r a d e s 7 - 9
Student/Teacher Resource
Forms of Settlement of the Earth
Source: Forms of Settlement of the Earth, Klett-Perthes Geo-Institut
22

R T H I N K L I T E R A C Y : S u b j e c t - S p e c i f i c E x a m p l e s G e o g r a p h y , G r a d e s 7 - 9
Reading Different Text Forms: Reading a Map
Grade 8 Geography – Economic Systems
Graphical text forms (such as diagrams, photographs, drawings, sketches, graphs, schedules, maps, charts, timelines and tables) are intended to communicate information in a concise formaand illustrate how one piece of information is related to another. Providing students with an approach to reading graphical text also helps them to become effect
t
ive readers. Purpose • Become familiar with the elements and features of graphical texts. • Explore a process for reading graphical texts, using a range of strategies for before, during and
after reading. Payoff Students will: • become more efficient at “mining” graphical texts for information and meaning. • practise essential reading strategies and apply them to different course-related materials. Tips and Resources • Students will find the best (fastest and cheapest) route to take raw diamonds from the Northwest
Territories to Belgium and the UK. • For this activity use a world transportation thematic map from an atlas (e.g., Oxford atlas p. 141,
Pearson p. 46, 47, Nelson p. 45). The decision on how far to take this activity will depend on resources and time. One can calculate the transportation route from the source of the resource (in this case, diamonds) to the final global destination.
The basic premise is that it takes time, energy and money from harvesting to distribution of the final product. This links to the graphing exercise, see Reading a Graph (Economic Systems),
p. 30. • Scale is important in this exercise. Students need to know how to calculate the distance
traveled. Using string to outline a certain route (it goes around lakes etc.) or estimation are both techniques they can employ. The students will then apply the measure of string to the scale.
• This activity could be worked through in groups and in the end, have students compare their results.
Further Support • Provide students with an advance organizer to guide them as they read a particular text. This
might be a series of prompts to guide them through the reading task.
24
T H I N K L I T E R A C Y : S u b j e c t - S p e c i f i c E x a m p l e s G e o g r a p h y , G r a d e s 7 - 9
Reading Different Text Forms: Reading a Map
Grade 8 Geography – Economic Systems
What teachers do What students do Before • Using a world transportation thematic map from an atlas: - Review the parts of a map (title,
legend, scale, direction) (Could do a brainstorm using a web.)
- Emphasize the importance of understanding which parts of the map help you to get the big picture.
- Look at the way the map is set up with colour or shading or labels etc.
- Key into the scale! Explain how to calculate scale.
- Set the purpose of the reading: to find the best (fastest and cheapest) route to take the raw diamonds from the Northwest Territories to Belgium and the UK.
• Skim the map to find out what it is
about. Use this to review the parts of the map. Confirm the information with a partner.
During • Model reading the map. • Ask questions to prompt thinking:
- How will the diamonds be transported out of the mine? - Where are my main towns and cities? - How can the company get to these
places? (train, plane, truck, boat) - What would be the cheapest/easiest
method of transportation? - Teachers/students may decide whether a
rush order is needed.
• Read the map to decide the best route
for transporting the raw diamonds to one of Canada’s trading partners for diamond exports.
After • Discuss all the possibilities and reasons why
one mode of transportation might be better than another.
• Compare the students’ results in calculations and discuss the various strategies and thinking.
• Map each leg of the route indicating,
types of transportation, and distance onto a blank world map.
• Calculate the total distance traveled. • Give reasons for your route decisions. Compare your routes with others.
Notes
R
25
W T H I N K L I T E R A C Y : S u b j e c t - S p e c i f i c E x a m p l e s G e o g r a p h y , G r a d e s 7 - 9
Writing for a Purpose: Writing a Map
Grade 8 Geography – Economic Systems
When students can get the “picture” of a form of writing in their heads, they feel more confident about creating the final product. A template or framework is a skeletal structure for a writing form that allows students to organize their thoughts and researched information in order to write a first draft. Purpose • Provide students with a template to scaffold their understanding of a form of writing and help
them organize information before drafting the piece. Payoff Students will: •
idea, etc.
learn the common expectations for the form and components of a particular writing assignment. • organize their writing and ensure that it meets the requirements of the assignment. Tips and Resources • To create a map for economics there are several sources to use. Statistics Canada gives data on jobs, GNP, labour force, industries etc.
- The key will be to focus on the purpose of the map and what you can learn from it. The next area to focus on will be to review key features of a map including: appropriate title, scale, legend, direction labels. You may also consider, depending on the type of map, grid, colour code, labels and sidebar graphics.
- The type of map chosen to present specific information should be discussed (in this case students will make a chloropleth map)- depending on how extensive the lesson. For this activity, the students are asked to map the regions and use shading to delineate the amount of GNP by region. (Dark green –highest, mid green and light green- lowest) You can give them the regions or come up with them in class. It depends on the ability of the students. Since there is a five year span a suggestion would be to have different groups of students do a different year and then go into a comparison or look for trends or choose one year to complete.
- Compiling the data into the parts needed, doing the map and then analyze the map are the 3 major steps involved.
• Consider having students work in small groups or a pairs to share the interpretation of the information. Practice in the interpretation by sharing, will spawn confidence over time.
• See the following resources: - Student/Teacher Resource, Gross domestic product, expenditure-based, by provinces and territories. - Student/Teacher Resource, Organizer – G.D.P. by Regions in Canada.
Further Support • The template for any individual writing assignment can be revised to make the medications or
accommodations necessary for students with special needs. For example, reduce the number of paragraphs or supporting details, create differing expectations for research, or for the complexity of the main
26
T H I N K L I T E R A C Y : S u b j e c t - S p e c i f i c E x a m p l e s G e o g r a p h y , G r a d e s 7 - 9
Writing for a Purpose: Writing a Map
Grade 8 Geography – Economic Systems
What teachers do What students do
Before • A map gives the students a visual picture of data
that can be sometimes overwhelming. • The purpose of this map is to find what the GDP
is in relation to the regions of Canada. (Review concept of GDP- Gross Domestic Product.)
• Review the 5 regions- Atlantic Canada, (the maritime provinces) Central Canada, (Quebec and Ontario) The Prairies, (Manitoba, Saskatchewan and Alberta) Western Canada (B.C.) and the North (the 3 territories). Ask how they will calculate the GDP per region (add total).
• Discuss with the students the use of shading in this kind of map (low, medium, high GDP. They could use 3 shades of green for money.).
• Skim the data to decide the purpose of
the map and what type of map would be best suited. Share.
• Discuss the 5 regions of Canada. • Decide on the layout of where your title
and legend will be. During • Have students calculate the GDP on the table.
They need to add the provincial GDP for each region.
• Discuss the scale to be used in the legend. Ask:- Where are the darkest/ lightest shades? - What industries are prevalent in the
regions? - What type of industry do they rely on? - What are the populations? (refer to an atlas
for thematic map on population) - Does this reflect on where the incomes
come from in each region? (e.g. Southern Ontario)
- What factors influence the GDP? • Distribute a map of Canada. Instruct the
students to dot jot their observations on the completed map.
• Complete the table Student/Teacher
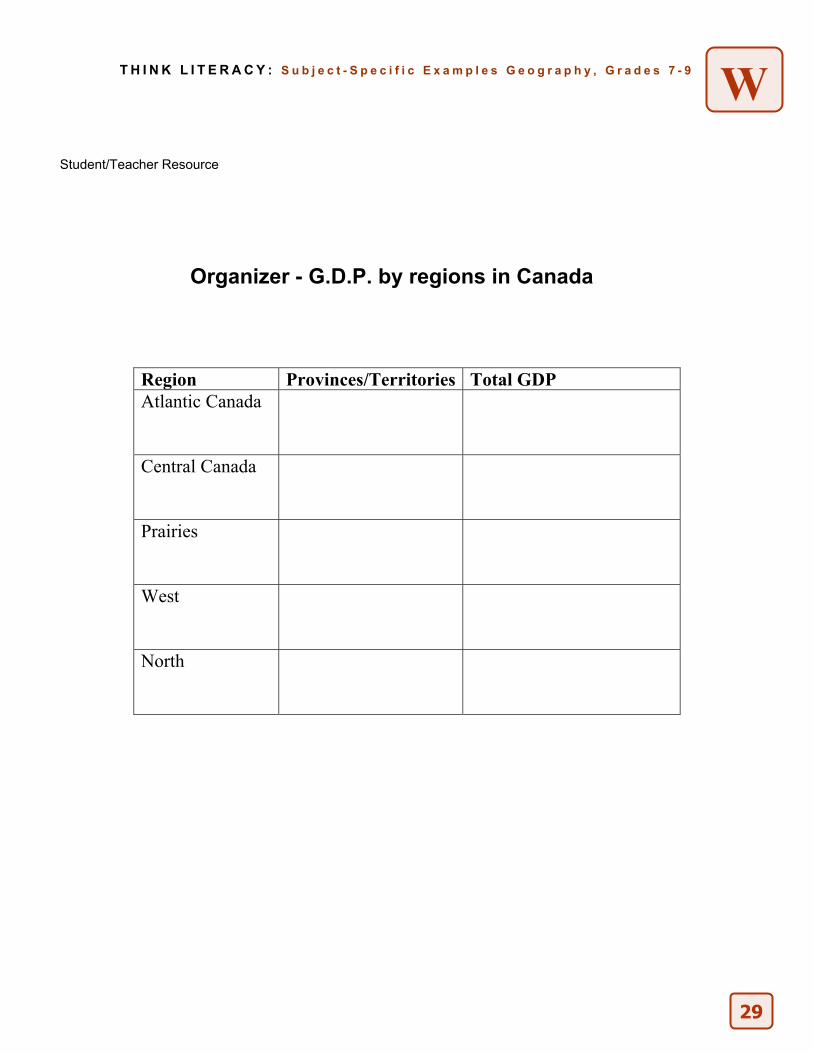
Resource, Organizer - G.D.P by regions in Canada to calculate the GDP of the 5 regions.
• Decide on scale for shading. • Complete map. • Use dot jots to make observations and
reflections of what they see. You may want them to reflect in a group or Think/Pair/Share.
After • Dig deeper into their understanding by asking
why the GDP is so different in each region. • Ask students to write any questions that come to
mind after the reflective work and include that at the end.
• Discuss as a whole group. • Editing process should be applied to written and
mapping work.
• Analyze the strengths and weakness in
terms of Canada’s ability to make money. (Use a T-chart.)
• Put in a summary. • Check their map to make sure all the key
information is in the work. • Create any extra questions they may
have on the data and discuss with class.
Notes
W
27
T H I N K L I T E R A C Y : W S u b j e c t - S p e c i f i c E x a m p l e s G e o g r a p h y , G r a d e s 7 - 9
Student/Teacher Resource
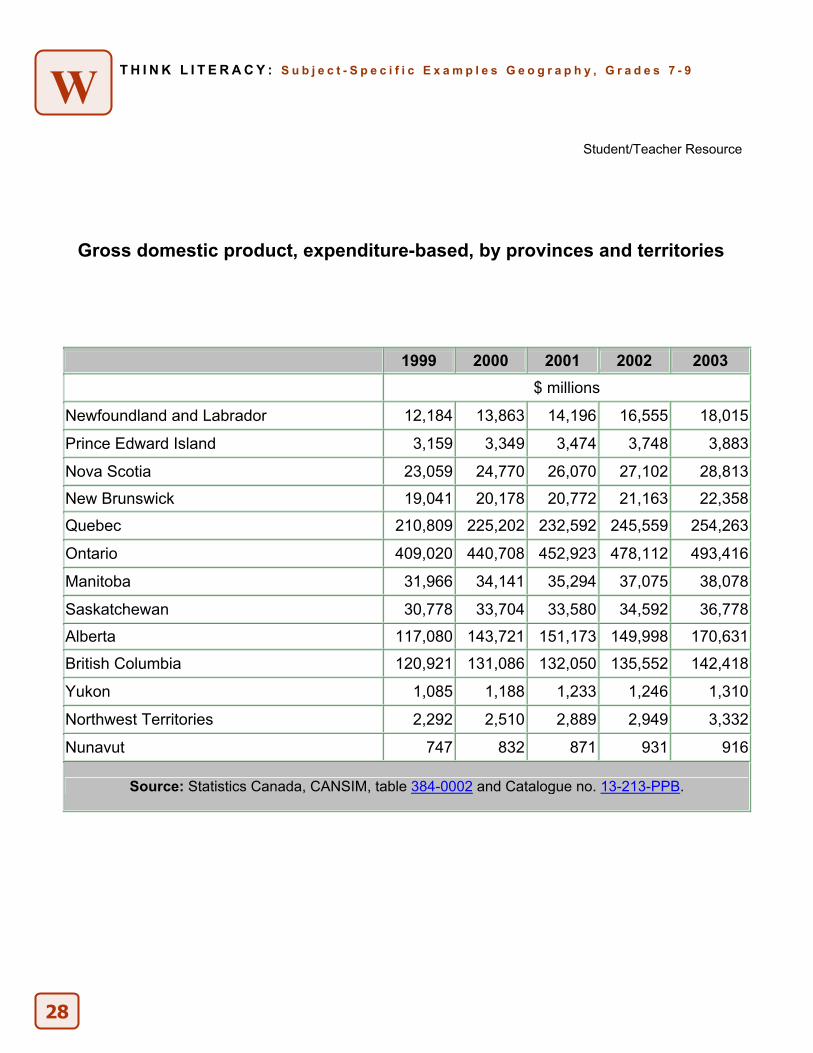
Gross domestic product, expenditure-based, by provinces and territories
1999 2000 2001 2002 2003
$ millions
Newfoundland and Labrador 12,184 13,863 14,196 16,555 18,015
Prince Edward Island 3,159 3,349 3,474 3,748 3,883
Nova Scotia 23,059 24,770 26,070 27,102 28,813
New Brunswick 19,041 20,178 20,772 21,163 22,358
Quebec 210,809 225,202 232,592 245,559 254,263
Ontario 409,020 440,708 452,923 478,112 493,416
Manitoba 31,966 34,141 35,294 37,075 38,078
Saskatchewan 30,778 33,704 33,580 34,592 36,778
Alberta 117,080 143,721 151,173 149,998 170,631
British Columbia 120,921 131,086 132,050 135,552 142,418
Yukon 1,085 1,188 1,233 1,246 1,310
Northwest Territories 2,292 2,510 2,889 2,949 3,332
Nunavut 747 832 871 931 916
Source: Statistics Canada, CANSIM, table 384-0002 and Catalogue no. 13-213-PPB.
28
T H I N K L I T E R A C Y : S u b j e c t - S p e c i f i c E x a m p l e s G e o g r a p h y , G r a d e s 7 - 9
Student/Teacher Resource
Organizer - G.D.P. by regions in Canada
Region Provinces/Territories Total GDP Atlantic Canada
Central Canada
Prairies
West
North
W
29

R T H I N K L I T E R A C Y : S u b j e c t - S p e c i f i c E x a m p l e s G e o g r a p h y , G r a d e s 7 - 9
Reading Different Text Forms: Reading a Graph
Grade 8 Geography – Economic Systems
30
Graphical text forms (such as diagrams, photographs, drawings, sketches, graphs, schedules, maps, charts, timelines and tables) are intended to communicate information in a concise formaand illustrate how one piece of information is related to another. Providing students with an approach to reading graphical text also helps them to become effect
t
ive readers.
s validity.
Purpose • Become familiar with the elements and features of graphical texts. • Explore a process for reading graphical texts, using a range of strategies for before, during and
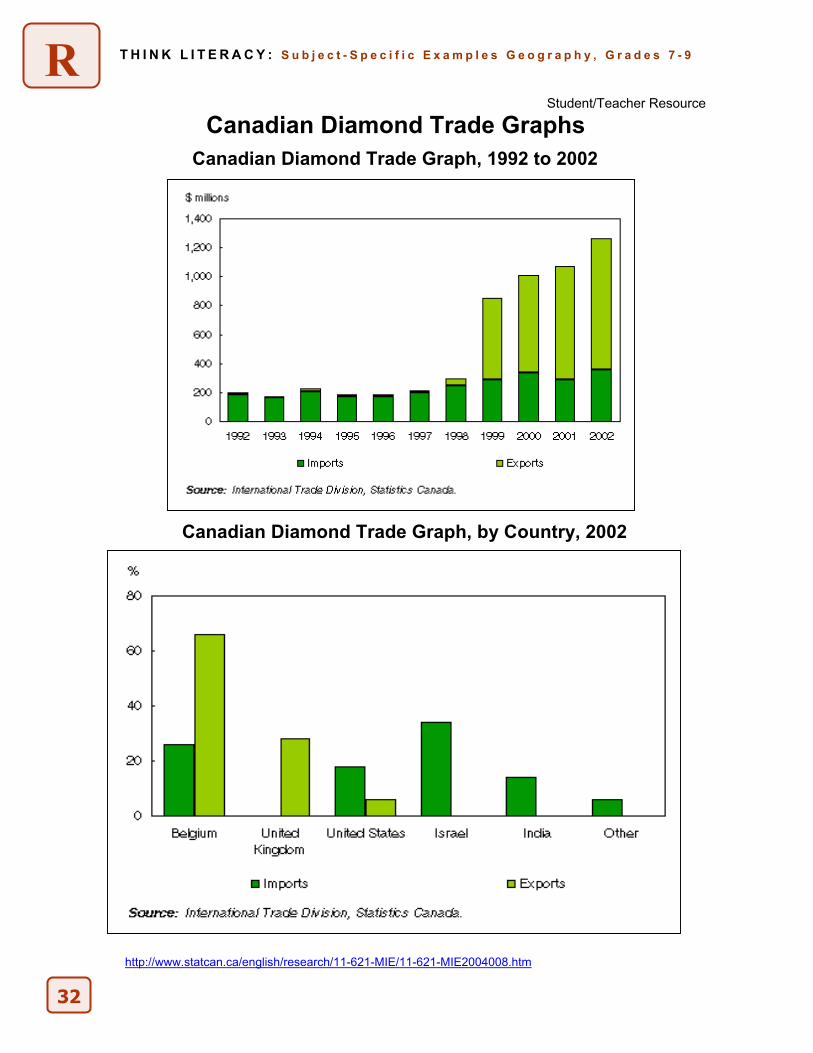
after reading. Payoff Students will: • become more efficient at “mining” graphical texts for information and meaning. • practise essential reading strategies and apply them to different course-related materials. Tips and Resources • Reading Graphs involves making observations on what students see and interpret what it
means. There can be trends to observe and then predict what will happen in the future. (e.g., What is the trend for the diamond industry in Canada?) The graph will also inspire questions for the students. (e.g. Why do we export so many diamonds to Belgium but import so few?) Also see Reading a Map, Gr. 8 Economic Systems. • It is important to spend time looking at features of the text such as the horizontal axis,
vertical axis, title, date when data was gathered and source. These features all help the student to critically think about the data and it
• The graph gives a snapshot of information which can be used to inform, compare, advise and persuade. Using the reading maps exercise and the Student/Teacher Resource, Canadian Diamond Trade Graphs, students extrapolate information about the diamond industry. In this lesson students will write a short article predicting the future of Canada’s diamond industry.
• Once the observations are made, it is important to take it the next step. What can we infer about the information? What don’t we know? What can we further investigate?
• Graphs can be used at the beginning of a concept to stimulate a discussion, in the middles to help consolidate ideas and concepts or at the end to see if students have grasped the concepts and to further investigations. Note: this example could also be modeled using other resources.
• For further information, see Student/Teacher Resource, Canadian Diamond Trade Graphs. (source: www.statcan.ca) Further Support • Provide students with an advance organizer to guide them as they read a particular text. This
might be a series of prompts to guide them through the reading task.
T H I N K L I T E R A C Y :
S u b j e c t - S p e c i f i c E x a m p l e s G e o g r a p h y , G r a d e s 7 - 9
What teachers do What students do Before • Review important vocabulary (import/export,
trading). • Ask the students to list different types of
graphs (e.g., bar graph, line graph, pie graph).
• Ask the students to explain a double bar graph. What would it look like? What is its purpose? (to compare)
• Elicit background knowledge on the diamond industry in Canada by brainstorming with the class.
• Distribute Student/Teacher Resource, Canadian Diamond Trade Graphs.
• Set a clear purpose for reading the graphs: to predict the future of the diamond industry in Canada.
• Participate in the brainstorm and
vocabulary review. • Skim the graphs to determine their
content.
During • Ask students what the key words are to their
understanding of the graphs. • Model questioning to cover the key areas:
- What countries do we export diamonds to?
- When did we start exporting? - Why do we import diamonds if we
already export them? Where do the exports mainly go?
- What might those countries have in common?
- Where do you think the future of the diamond industry will go and why?
- What is the trend in the diamond industry?
- What advantages might there be for Canada? What disadvantages would there be?
• Students will list their observations
on chart paper.
After • Give time for the students to “dot jot” their
observations. • Discuss reading “between the lines” and ask
what can the students infer about the diamond industry.
• Have students predict how the diamond industry will affect Canada in the future.
• Instruct students to use the data and their observations to back up their prediction.
• Use dot jots to complete a T-chart of
positives and negatives to pursuing the diamond industry in the north.
• Share as a small group or pair their observations.
• Write a short article for a newspaper completing the headline: Canada’s Diamond Future Looks__________.
Reading Different Text Forms: Reading a Graph
Grade 8 Geography – Economic Systems
R
Notes
31
T H I N K L I T E R A C Y :
S u b j e c t - S p e c i f i c E x a m p l e s G e o g r a p h y , G r a d e s 7 - 9
Student/Teacher Resource
Canadian Diamond Trade Graphs
Canadian Diamond Trade Graph, 1992 to 2002
Canadian Diamond Trade Graph, by Country, 2002
http://www.statcan.ca/english/research/11-621-MIE/11-621-MIE2004008.htm
32
R

W T H I N K L I T E R A C Y : S u b j e c t - S p e c i f i c E x a m p l e s G e o g r a p h y , G r a d e s 7 - 9
Writing for a Purpose: Writing a Graph
Grade 8 Geography – Economic Systems
When students can get the “picture” of a form of writing in their heads, they feel more confident about creating the final product. A template or framework is a skeletal structure for a writing form that allows students to organize their thoughts and researched information in order to write a first draft. Essay maps are another type of template. Purpose • Provide students with a template to scaffold their understanding of a form of writing and help
them organize information before drafting the piece. Payoff Students will: • learn the common expectations for the form and components of a particular writing
assignment. • organize their writing and ensure that it meets the requirements of the assignment. Tips and Resources • In this activity the students are asked to make a graph on the Gross Domestic Product of
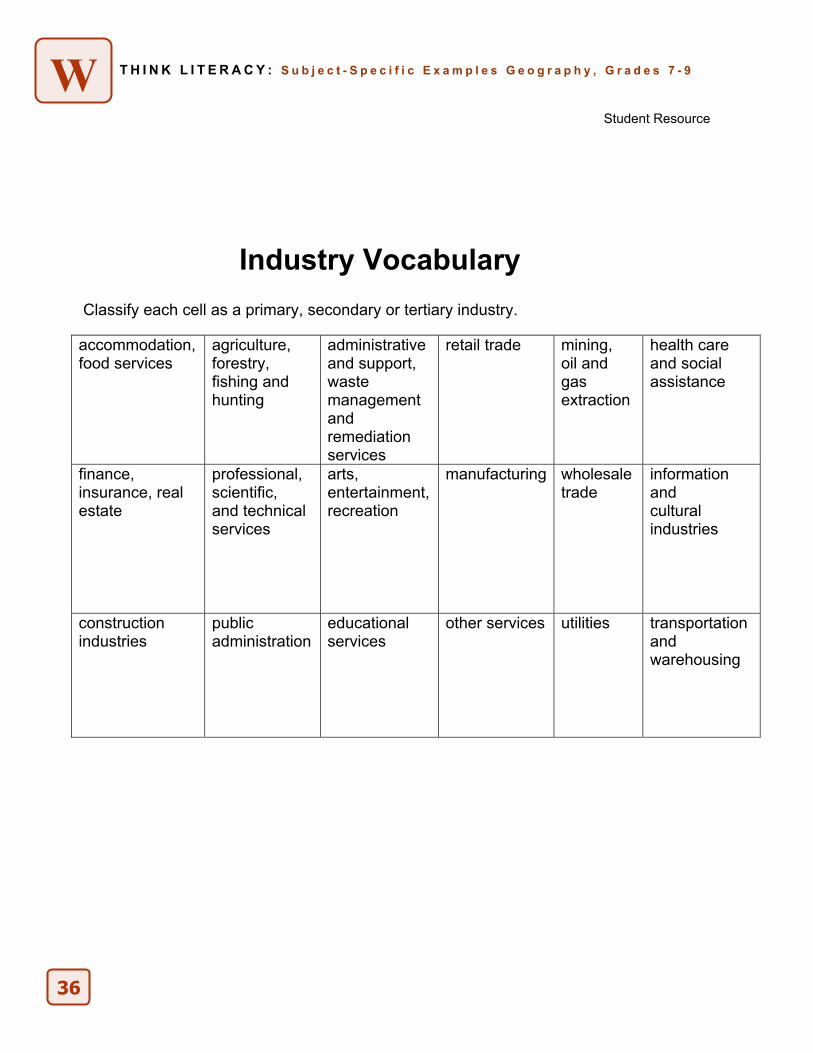
Canada by primary, secondary or tertiary industries. They therefore need to understand the types of industries and where they fit. A vocabulary sorting activity would help in this way. (See Student Resource, Industry Vocabulary). This exercise also connects well with the Grade 8 Economic Systems, Reading Pictures, page 38. Students will be able to expand their knowledge of what kinds of industries there are and how they are categorized.
• The purpose of the graphing activity needs to be made clear. This enables students to focus on what material is important. This Industry idea could be expanded into a discussion/ survey of careers in the class or school.
• In responding to the graphs, try Rapid Writing in Think Literacy: Cross-Curricular Approaches, Grades 7-12. In this approach students continuously write about what they see and connections they can make. Also, “ Dot Jots” are a quick way to make observations and connections before formal written work.
• Expand thinking by using “Stretching Ideas”, Think Literacy: Cross-Curricular Approaches, Grades 7-12, p.122. This will aid in questioning also.
• For more information see Teacher Resource, Gross Domestic Product at Basic Prices by Industry.
Further Support • The template for any individual writing assignment can be revised to make the modifications
or accommodations necessary for students with special needs. For example, reduce the number of paragraphs or supporting details, create differing expectations for research, or for the complexity of the main idea, etc.
34
T H I N K L I T E R A C Y : S u b j e c t - S p e c i f i c E x a m p l e s G e o g r a p h y , G r a d e s 7 - 9 W
Writing for a Purpose: Writing a Graph
Grade 8 Geography – Economic Systems
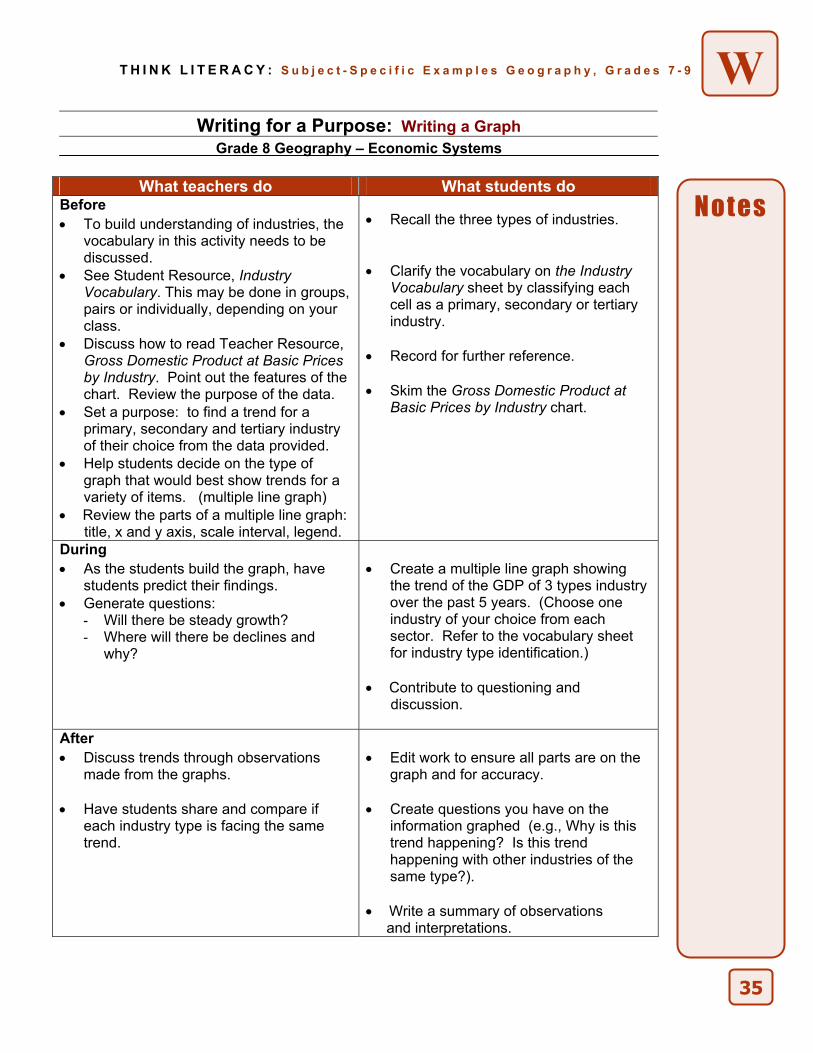
What teachers do What students do Before
• To build understanding of industries, the vocabulary in this activity needs to be discussed.
• See Student Resource, Industry Vocabulary. This may be done in groups, pairs or individually, depending on your class.
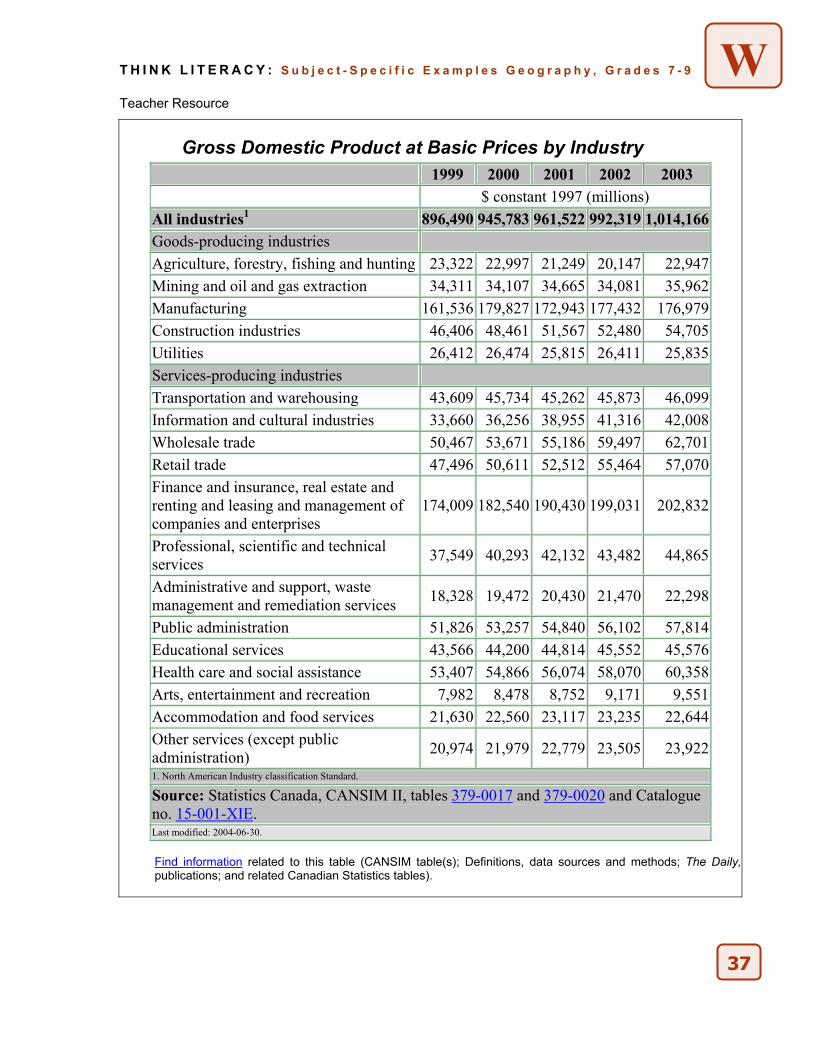
• Discuss how to read Teacher Resource, Gross Domestic Product at Basic Prices by Industry. Point out the features of the chart. Review the purpose of the data.
• Set a purpose: to find a trend for a primary, secondary and tertiary industry of their choice from the data provided.
• Help students decide on the type of graph that would best show trends for a variety of items. (multiple line graph)
• Review the parts of a multiple line graph: title, x and y axis, scale interval, legend.
• Recall the three types of industries. • Clarify the vocabulary on the Industry
Vocabulary sheet by classifying each cell as a primary, secondary or tertiary industry.
• Record for further reference. • Skim the Gross Domestic Product at
Basic Prices by Industry chart.
During
• As the students build the graph, have students predict their findings.
• Generate questions: - Will there be steady growth? - Where will there be declines and why?
• Create a multiple line graph showing the trend of the GDP of 3 types industry over the past 5 years. (Choose one industry of your choice from each sector. Refer to the vocabulary sheet for industry type identification.)
• Contribute to questioning and discussion.
After
• Discuss trends through observations made from the graphs.
• Have students share and compare if each industry type is facing the same trend.
• Edit work to ensure all parts are on the graph and for accuracy.
• Create questions you have on the
information graphed (e.g., Why is this trend happening? Is this trend happening with other industries of the same type?).
• Write a summary of observations and interpretations.
Notes
35
T H I N K L I T E R A C Y : S u b j e c t - S p e c i f i c E x a m p l e s G e o g r a p h y , G r a d e s 7 - 9
Student Resource
Industry Vocabulary
Classify each cell as a primary, secondary or tertiary industry.
accommodation, food services
agriculture, forestry, fishing and hunting
administrative and support, waste management and remediation services
retail trade mining, oil and gas extraction
health care and social assistance
finance, insurance, real estate
professional, scientific, and technical services
arts, entertainment, recreation
manufacturing wholesale trade
information and cultural industries
construction industries
public administration
educational services
other services utilities transportation and warehousing
W
36
T H I N K L I T E R A C Y : S u b j e c t - S p e c i f i c E x a m p l e s G e o g r a p h y , G r a d e s 7 - 9
Teacher Resource
Gross Domestic Product at Basic Prices by Industry 1999 2000 2001 2002 2003 $ constant 1997 (millions)
All industries1 896,490 945,783 961,522 992,319 1,014,166Goods-producing industries Agriculture, forestry, fishing and hunting 23,322 22,997 21,249 20,147 22,947Mining and oil and gas extraction 34,311 34,107 34,665 34,081 35,962Manufacturing 161,536 179,827 172,943 177,432 176,979Construction industries 46,406 48,461 51,567 52,480 54,705Utilities 26,412 26,474 25,815 26,411 25,835Services-producing industries Transportation and warehousing 43,609 45,734 45,262 45,873 46,099Information and cultural industries 33,660 36,256 38,955 41,316 42,008Wholesale trade 50,467 53,671 55,186 59,497 62,701Retail trade 47,496 50,611 52,512 55,464 57,070Finance and insurance, real estate and renting and leasing and management of companies and enterprises
174,009 182,540 190,430 199,031 202,832
Professional, scientific and technical services 37,549 40,293 42,132 43,482 44,865
Administrative and support, waste management and remediation services 18,328 19,472 20,430 21,470 22,298
Public administration 51,826 53,257 54,840 56,102 57,814Educational services 43,566 44,200 44,814 45,552 45,576Health care and social assistance 53,407 54,866 56,074 58,070 60,358Arts, entertainment and recreation 7,982 8,478 8,752 9,171 9,551Accommodation and food services 21,630 22,560 23,117 23,235 22,644Other services (except public administration) 20,974 21,979 22,779 23,505 23,9221. North American Industry classification Standard. Source: Statistics Canada, CANSIM II, tables 379-0017 and 379-0020 and Catalogue no. 15-001-XIE. Last modified: 2004-06-30. Find information related to this table (CANSIM table(s); Definitions, data sources and methods; The Daily,publications; and related Canadian Statistics tables).
W
37
R T H I N K L I T E R A C Y : S u b j e c t - S p e c i f i c E x a m p l e s G e o g r a p h y , G r a d e s 7 - 9
Reading Different Text Forms: Reading Pictures
Grade 8 Geography – Economic Systems
Graphical text forms (such as diagrams, photographs, drawings, sketches, graphs, schedules, maps, charts, timelines and tables) are intended to communicate information in a concise formaand illustrate how one piece of information is related to another. Providing students with an approach to reading graphical text also helps them to become effect
t
ive readers.
• •
Purpose • Become familiar with the elements and features of graphical texts. • Explore a process for reading graphical texts, using a range of strategies for before, during and
after reading. Payoff Students will:
become more efficient at “mining” graphical texts for information and meaning. practise essential reading strategies and apply them to different course-related materials.
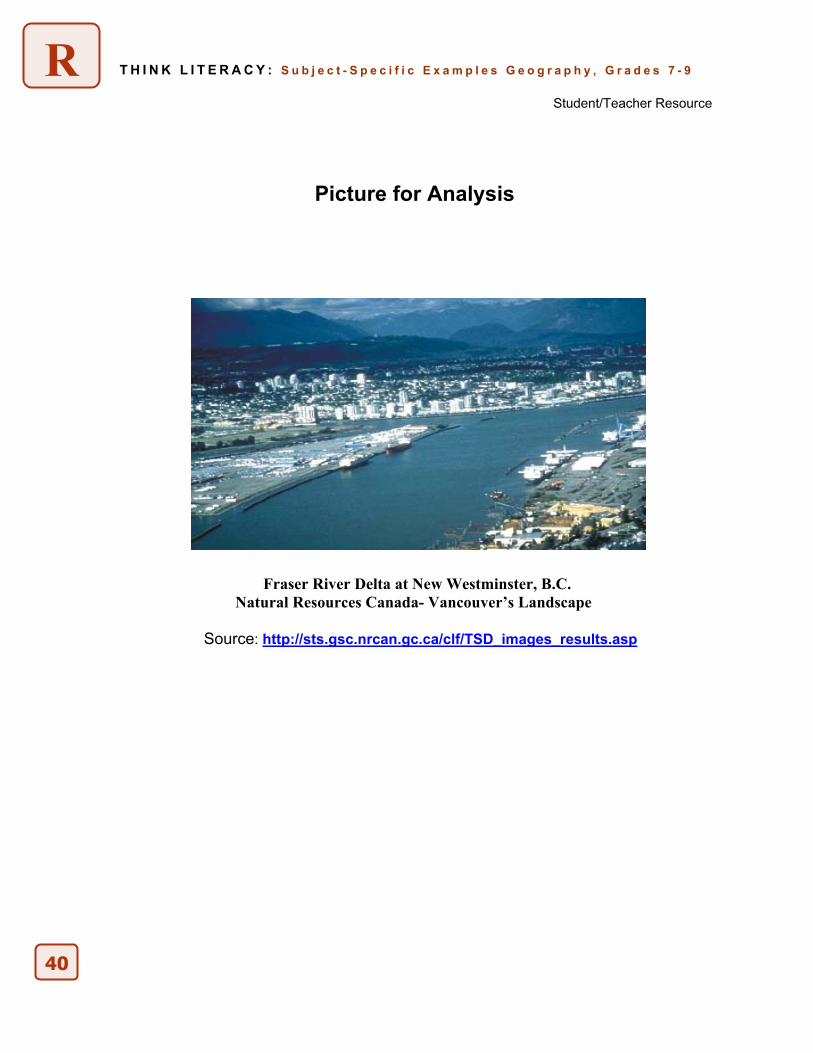
Tips and Resources • For this activity use a picture that includes all three industry types: primary, secondary and
tertiary (e.g., a picture at http://sts.gsc.nrcan.gc.ca/clf/TSD_images_results.asp Natural Resources Canada- under the Terrain Science Images Collection, Fraser Delta at New Westminster. Note: colour is critical to being able to read the picture).
• Reading a picture starts with skimming to find the general content. Focus the reader to the foreground, mid ground and background of the picture. Reading the caption provides the reader with context.
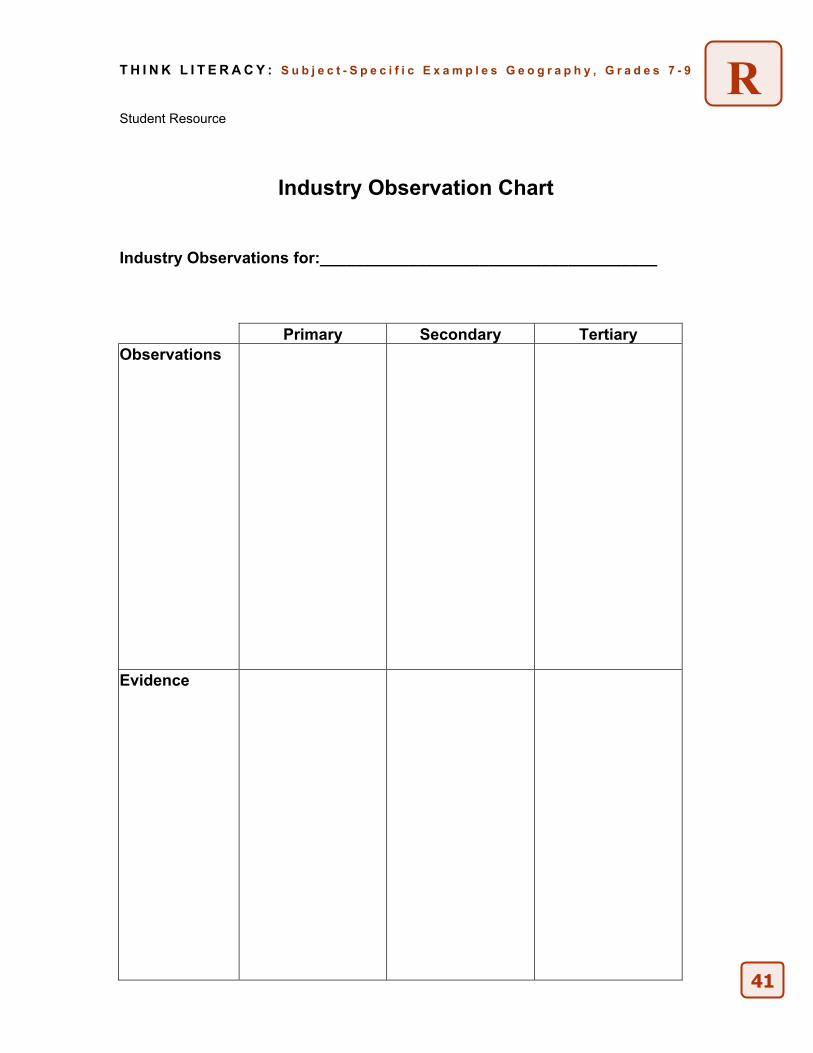
• Use Rapid Writing in Think Literacy: Cross-Curricular Approaches on p. 98 to make observations of the picture. (Other strategies might be Think/Pair/Share, I Spy, Questioning ) Use the Student Resource, Observation Chart, to help them organize their observations and evidence to prove them. As in language, you want the students to back up their observations and thinking.
• Further questioning will lead to inferring. Even though students don’t see something they can make some solid inferences based on their prior knowledge. Ask students: How did the logs get to the delta? What industries are there? What might be the tertiary industries in the area? How might the industries be connected to each other? How might they support each other? Thus if one business fails it will have a ripple effect on the economy. Likewise if a new industry/ business comes to town it will also have an effect on local economy.
• See: - Student/Teacher Resource, Picture for Analysis - Student Resource, Industry Observation Chart Further Support • Provide students with an advance organizer to guide them as they read a particular text. This
might be a series of prompts to guide them through the reading task.
38
R T H I N K L I T E R A C Y : S u b j e c t - S p e c i f i c E x a m p l e s G e o g r a p h y , G r a d e s 7 - 9
Reading Different Text Forms: Reading Pictures
Grade 8 Geography – Economic Systems
What teachers do What students do Before • Tell students that pictures tell stories. • Recall or introduce the 3 main types of
industry- primary, secondary and tertiary. • Ask students if they know how to read
pictures. (See Student/Teacher Resource, Picture For Analysis.)
• Invite students to decide why the photographer took this photo. Ask students what the purpose of the photograph might be.
• Why did the photographer choose the perspective? Are they trying to inform? Persuade?
• Discuss their background knowledge of
the 3 types of industry.
During • Direct the students to look at the 3 main
parts of the photograph- fore, mid and background.
• What does this picture tell us about the industries in this area? - How can you tell manufacturing
industry from service area from primary?
- Which sector appears larger? • Infer about the primary industry given the
river, and the forest in the background; this is a ideal time to emphasize the word, “infer”.
• Each time a student makes a statement you want them to prove or back-up their point with evidence from the picture.
• Lead the questioning to what the impact would be if the secondary industry went out of business.
• Complete the Student Resource
Industry Observation Chart to identify the 3 types of industry found in the picture and give evidence. Use dot jots. Use one cell for each observation and evidence found.
After • Recap what they observed. • Discuss the ramifications to the picture of
a new industry or one that is going under as they pertain to the local economy.
• Have students apply their knowledge by having them find their own pictures.
• Find a picture (from a magazine,
website, photographs etc.) illustrating the three types of industry. If need be, choose three separate pictures.
Notes
39
R T H I N K L I T E R A C Y : S u b j e c t - S p e c i f i c E x a m p l e s G e o g r a p h y , G r a d e s 7 - 9
Student/Teacher Resource
Picture for Analysis
Fraser River Delta at New Westminster, B.C. Natural Resources Canada- Vancouver’s Landscape
Source: http://sts.gsc.nrcan.gc.ca/clf/TSD_images_results.asp
40
T H I N K L I T E R A C Y : S u b j e c t - S p e c i f i c E x a m p l e s G e o g r a p h y , G r a d e s 7 - 9
Student Resource
Industry Observation Chart Industry Observations for:______________________________________
Primary Secondary Tertiary Observations
Evidence
41
R
R T H I N K L I T E R A C Y : S u b j e c t - S p e c i f i c E x a m p l e s G e o g r a p h y , G r a d e s 7 - 9
Reading Different Text Forms: Reading Flow Maps
Grade 8 Geography – Migration
Graphical text forms (such as diagrams, photographs, drawings, sketches, graphs, schedules, maps, charts, timelines and tables) are intended to communicate information in a concise format and illustrate how one piece of information is related to another. Providing students with an approach toreading graphical text also helps them to become effective re
aders.
• •
ly or
- Flow map resource:
Purpose • Become familiar with the elements and features of graphical texts. • Explore a process for reading graphical texts, using a range of strategies for before, during and
after reading. Payoff Students will:
become more efficient at “mining” graphical texts for information and meaning. practise essential reading strategies and apply them to different course-related materials.
Tips and Resources • By using a flow map, the concept of movement of people or things can be easily demonstrated.
Key features of a flow map as a graphic include: - print features (such as titles, labels, captions). - organizational features (such as legends, table of contents, keys). - design features (such as colour, shape, line, placement, focal point). - patterns (such as repetition of graphics, colour, symbols).
• Flow maps use these elements and features to effectively show movement of people or things from a source to a destination. Quantity or amount can be explicitly identified numericaldemonstrated visually by size and/or shape of the line/arrow graphic.
• Lines and arrows are used on the map. • The line begins at the source of the movement and ends at the destination, indicated by the arrow.• The thickness of the line can also be used to indicate the amount of things or people being moved,
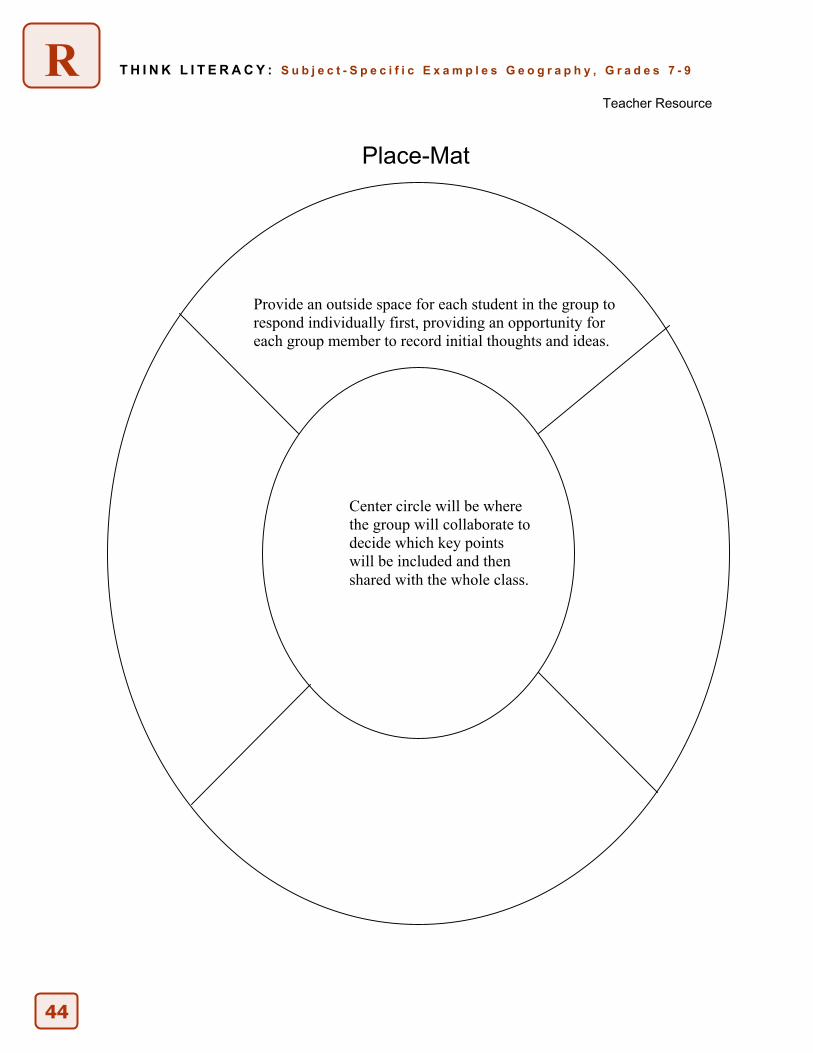
and can also permit a visual tool for comparison. • Colour can also be used as an indicator of quantity. • Think/Pair/Share: a student response strategy in which a question is posed, students are given
time to think individually about their response and then pair with a partner to share their responses. Finally, the students share their responses with the whole class.
• See: - Teacher Resource, Place-Mat
Most Important Flows Further Support • Provide students with an advance organizer to guide them as they read a particular text. This
might be a series of prompts to guide them through the reading
www.statcan.ca > Census> Thematic Maps> Canadians on the Move> 12
task.
42
T H I N K L I T E R A C Y : S u b j e c t - S p e c i f i c E x a m p l e s G e o g r a p h y , G r a d e s 7 - 9 R
Reading Different Text Forms: Reading Flow Maps
Grade 8 Geography – Migration
What teachers do What students do Before • Activate prior knowledge of students by
brainstorming the reasons why people move. • Provide each group with a place-mat design on a
piece of chart paper and markers. (See Teacher Resource, Place-Mat.)
• Provide the students with a flow map, Canada, 12 Most Important Flows Between Provinces, and also put on an overhead.
• Invite questions about this map, and make predictions based on this first read.
• Invite students to skim and scan map features they recognize and know.
• Brainstorm ideas, concepts or personal experiences in their groups using the place-mat strategy.
• Record responses individually, then discuss as a group, and then place key ideas in the center of the placemat to report to the class.
• Ask questions about the map. • Engage prior learning from which to
make connections.
During • Model using a Think Aloud to demonstrate how the
information from the map can be read, interpreted and understood.
• Focus Questions: - What is the title of the map? Can you turn the
title into a question? - Are all important features of a map evident? - What is in the legend? - Locate the flow lines. Are they all the same
thickness? Why or why not? - What is at the source and the destination?
• Listen and observe teacher modeling,
reading and interpreting the flow map.
• Anticipate and predict information about the movement of people in Canada.
• Begin to understand the purpose of the map and information being presented.
• Recall and relate previous understandings about maps and applying that knowledge to this kind of map.
• Identify key features of a flow map, and begin reading the map.
After • Focus statements to model interpretation:
- Based on the data…I predict that… - I can draw these conclusions… - Based on this evidence, I think…
• After reading and interpreting the information from the map, help students consolidate their understanding of this kind of map by using a Think/Pair/Share strategy.
• Focus Questions: - What are the key features? - What do the lines mean? - Why are the lines of different thickness? - What information is in the legend?
• Review the process of reading a flow map. Discuss what kind of information would be best displayed using this kind of map.
• Can the students locate examples? • Invite students to suggest other ways to present the
information on the map in a different way (such as a chart, table, paragraph or report, another kind of map).
• Use a Think/Pair/Share to review the
specific features of a flow map, further extending and clarifying understanding.
• Locate other examples of flow maps
by researching in a variety of atlases. • Present the data in another form (text
or graphical).
Notes
43
R T H I N K L I T E R A C Y : S u b j e c t - S p e c i f i c E x a m p l e s G e o g r a p h y , G r a d e s 7 - 9
Teacher Resource
Place-Mat
Provide an outside space for each student in the group to respond individually first, providing an opportunity for each group member to record initial thoughts and ideas.
Center circle will be where the group will collaborate to decide which key points will be included and then shared with the whole class.
44

T H I N K L I T E R A C Y : S u b j e c t - S p e c i f i c E x a m p l e s G e o g r a p h y , G r a d e s 7 - 9
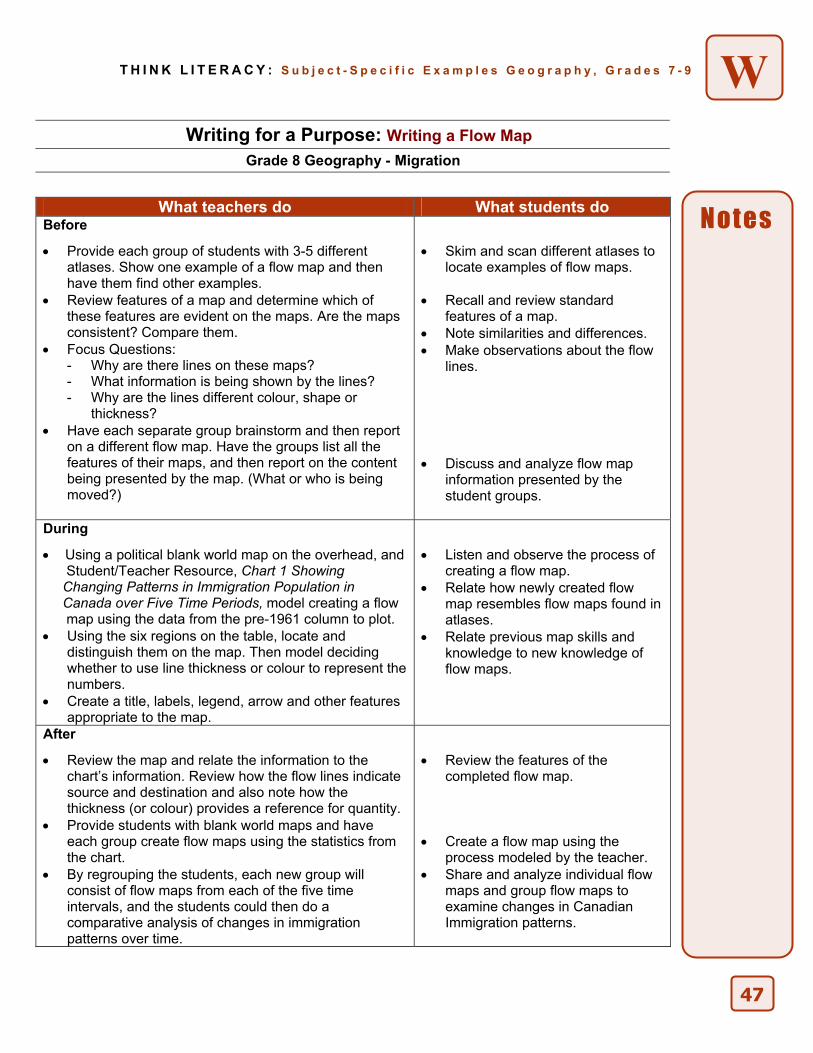
Writing for a Purpose: Writing a Flow Map
Grade 8 Geography - Migration
W
When students can get the “picture” of a form of writing in their heads, they feel more confident about creating the final product. A template or framework is a skeletal structure for a writing form that allows students to organize their thoughts and researched information in order to write a first draft. Essay maps are another type of template. Purpose • Provide students with a template to scaffold their understanding of a form of writing and help them
organize information before drafting the piece. Payoff Students will: • learn the common expectations for the form and components of a particular writing assignment. • organize their writing and ensure that it meets the requirements of the assignment. Tips and Resources • Maps are visual representations of places, from very small scale, such as a room to a larger scale such as
a neighbourhood through to the entire surface of the earth or beyond. Maps place information in a spatial or time context (such as; a town being located beside a river, or changes in a place over time). Maps help us locate places in relation to other places or ourselves.
• Features of all maps may include: - title - key or legend - place names (in various sizes and fonts) - colour code - cardinal points or north arrow - symbols, labels - directional arrows (for flow maps) - grid - index - charts or tables at side to provide further explanation
• Flow maps include the same features as most maps, but are specific to indicating movement of things or people from a source to a destination. The direction of movement is shown by an arrow placed directly on top of the map, with the destination being pointed out by the end of the arrow. Quantity can be determined either by the thickness of the arrow plotted, or by colour coding numerical increments that would be referred to in the legend.
• Complexity of flow lines depends upon the information of the data being plotted, as a single line may break out into two or more destination lines. Some maps use curved lines, which may also be representing the actual path of the movement, whereas straight lines more simply indicate source and destination locations only.
• A flow map is really a completed base map, indicating relevant geographical or political base information and all other standard conventions of mapping as noted above. The flow lines are then added to the ‘top’ of the map to present the movement information.
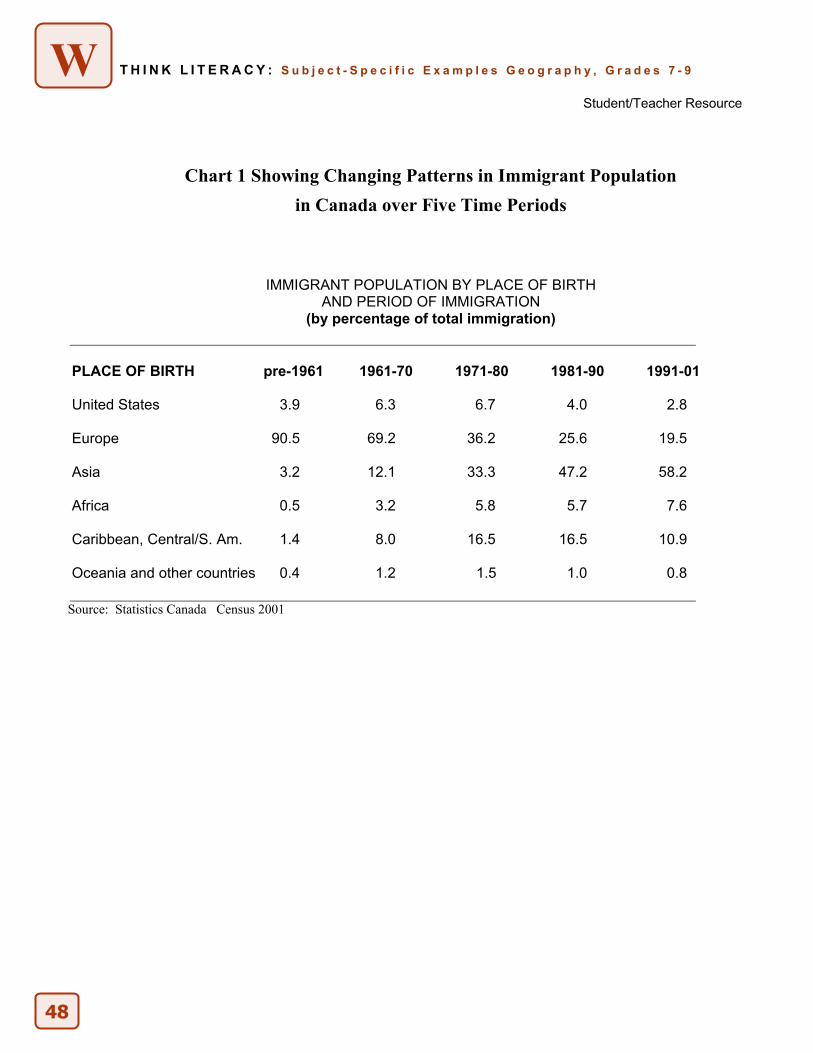
• See Student/Teacher Resource, Chart 1 Showing Changing Patterns in Immigration Population in Canada over Five Time Periods.
• Resources required: a variety of atlases containing examples of flow maps and a blank political World Map (for overhead and students). e.g., Flow Map: www.statscan.ca>Census>Thematic Maps Further Support • The template for any individual writing assignment can be revised to make the modifications or
accommodations necessary for students with special needs. For example, reduce the number of paragraphs or supporting details, create differing expectations for research, or for the complexity of the main idea, etc.
46
W T H I N K L I T E R A C Y :
S u b j e c t - S p e c i f i c E x a m p l e s G e o g r a p h y , G r a d e s 7 - 9
Writing for a Purpose: Writing a Flow Map
Grade 8 Geography - Migration
What teachers do What students do
Before
• Provide each group of students with 3-5 different atlases. Show one example of a flow map and then have them find other examples.
• Review features of a map and determine which of these features are evident on the maps. Are the maps consistent? Compare them.
• Focus Questions: - Why are there lines on these maps? - What information is being shown by the lines? - Why are the lines different colour, shape or
thickness? • Have each separate group brainstorm and then report
on a different flow map. Have the groups list all the features of their maps, and then report on the content being presented by the map. (What or who is being moved?)
• Skim and scan different atlases to locate examples of flow maps.
• Recall and review standard
features of a map. • Note similarities and differences. • Make observations about the flow
lines. • Discuss and analyze flow map
information presented by the student groups.
During
• Using a political blank world map on the overhead, and Student/Teacher Resource, Chart 1 Showing Changing Patterns in Immigration Population in Canada over Five Time Periods, model creating a flow map using the data from the pre-1961 column to plot. • Using the six regions on the table, locate and
distinguish them on the map. Then model deciding whether to use line thickness or colour to represent the numbers.
• Create a title, labels, legend, arrow and other features appropriate to the map.
• Listen and observe the process of creating a flow map.
• Relate how newly created flow map resembles flow maps found in atlases.
• Relate previous map skills and knowledge to new knowledge of flow maps.
After
• Review the map and relate the information to the chart’s information. Review how the flow lines indicate source and destination and also note how the thickness (or colour) provides a reference for quantity.
• Provide students with blank world maps and have each group create flow maps using the statistics from the chart.
• By regrouping the students, each new group will consist of flow maps from each of the five time intervals, and the students could then do a comparative analysis of changes in immigration patterns over time.
• Review the features of the completed flow map.
• Create a flow map using the
process modeled by the teacher. • Share and analyze individual flow
maps and group flow maps to examine changes in Canadian Immigration patterns.
Notes
47
W T H I N K L I T E R A C Y :
S u b j e c t - S p e c i f i c E x a m p l e s G e o g r a p h y , G r a d e s 7 - 9
Student/Teacher Resource
Chart 1 Showing Changing Patterns in Immigrant Population in Canada over Five Time Periods
IMMIGRANT POPULATION BY PLACE OF BIRTH AND PERIOD OF IMMIGRATION
(by percentage of total immigration)
PLACE OF BIRTH pre-1961 1961-70 1971-80 1981-90 1991-01
United States 3.9 6.3 6.7 4.0 2.8 Europe 90.5 69.2 36.2 25.6 19.5 Asia 3.2 12.1 33.3 47.2 58.2 Africa 0.5 3.2 5.8 5.7 7.6 Caribbean, Central/S. Am. 1.4 8.0 16.5 16.5 10.9 Oceania and other countries 0.4 1.2 1.5 1.0 0.8
Source: Statistics Canada Census 2001
48

T H I N K L I T E R A C Y : S u b j e c t - S p e c i f i c E x a m p l e s G e o g r a p h y , G r a d e s 7 - 9
Reading Different Text Forms: Reading a Table
Grade 8 Geography - Migration
R
Graphical text forms (such as diagrams, photographs, drawings, sketches, graphs, schedules, maps, charts, timelines and tables) are intended to communicate information in a concise format and illustrate how one piece of information is related to another. Providing students with an approach to reading graphical text also helps them to become effective readers. Purpose • Become familiar with the elements and features of graphical texts. • Explore a process for reading graphical texts, using a range of strategies for before, during and
after reading. Payoff Students will: • •
become more efficient at “mining” graphical texts for information and meaning. practise essential reading strategies and apply them to different course-related materials.
Tips and Resources • Sometimes a complicated idea or concept can be communicated more easily using a table.
Tables are a specific form of chart that organizes data or information into specific parts or categories. This allows for easy reference. Information is presented in rows and columns. Some features of tables include: - print features (such as size of type, titles, heading, sub-headings, labels). - design features (such as column and row format, borders, boxes).
• A table provides information, such as a list of statistics on a specific subject to: - represent information visually. - organize and summarize information for comparison or classification. - list or organize information for quick reference. - shows relationships within a group of statistics or between groups.
• Tables are frequently used in Geography, along with other forms of graphical texts to support written material to help the reader quickly grasp key information (such as number patterns, populations, immigrant patterns, movement of people over time).
• See the following resources: - Student/Teacher Resource, Urban vs. Rural Population (1931 to 2001). - Student Resource, Tips for Reading Graphical Texts (Tables). - Student Resource, Immigrant Population of Canada (1911-2001). - Teacher Resource, Four Corners.
Statistics Canada, 2001. When Kids Can’t Read: What Teachers Can Do, Kylene Beers, 2003. Think Literacy: Cross-Curricular Approaches, Grades 7-12, p.84. Further Support • Provide students with an advance organizer to guide them as they read a particular text. This
might be a series of prompts to guide them through the reading task.
50
R T H I N K L I T E R A C Y : S u b j e c t - S p e c i f i c E x a m p l e s G e o g r a p h y , G r a d e s 7 - 9
Reading Different Text Forms: Reading a Table
Grade 8 Geography – Migration
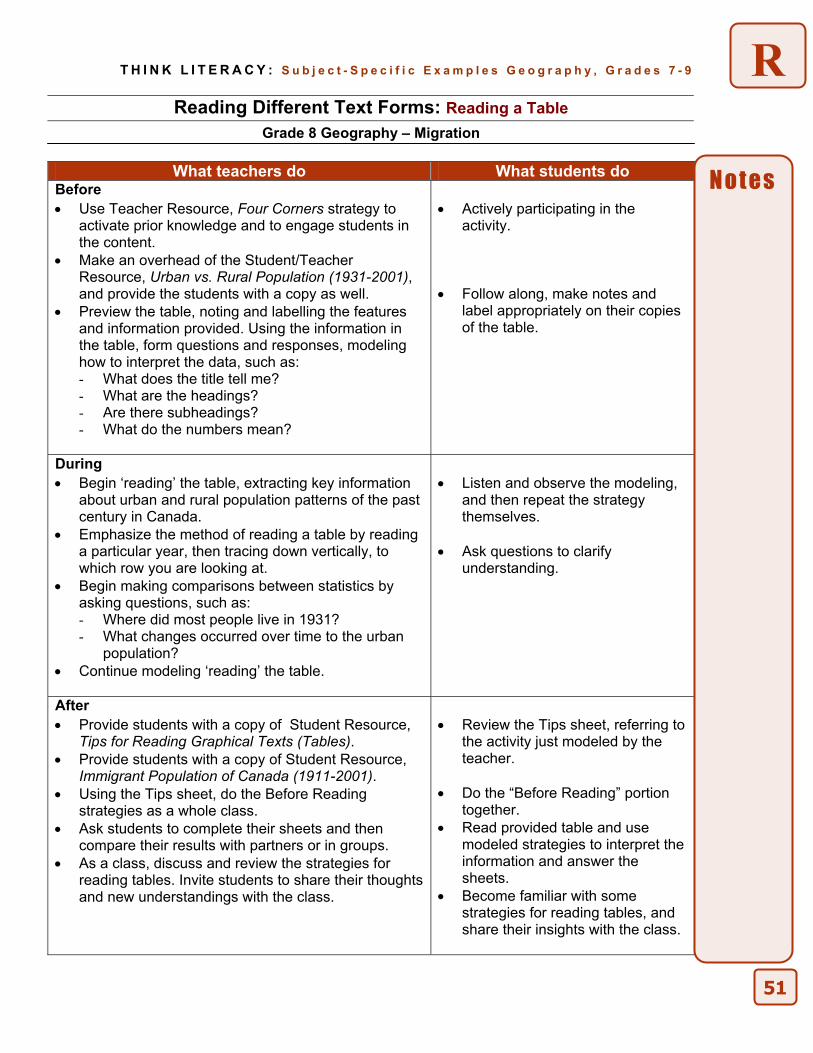
What teachers do What students do Before
• Use Teacher Resource, Four Corners strategy to activate prior knowledge and to engage students in the content.
• Make an overhead of the Student/Teacher Resource, Urban vs. Rural Population (1931-2001), and provide the students with a copy as well.
• Preview the table, noting and labelling the features and information provided. Using the information in the table, form questions and responses, modeling how to interpret the data, such as: - What does the title tell me? - What are the headings? - Are there subheadings? - What do the numbers mean?
• Actively participating in the activity.
• Follow along, make notes and
label appropriately on their copies of the table.
During
• Begin ‘reading’ the table, extracting key information about urban and rural population patterns of the past century in Canada.
• Emphasize the method of reading a table by reading a particular year, then tracing down vertically, to which row you are looking at.
• Begin making comparisons between statistics by asking questions, such as: - Where did most people live in 1931? - What changes occurred over time to the urban
population? • Continue modeling ‘reading’ the table.
• Listen and observe the modeling, and then repeat the strategy themselves.
• Ask questions to clarify
understanding.
After
• Provide students with a copy of Student Resource, Tips for Reading Graphical Texts (Tables).
• Provide students with a copy of Student Resource, Immigrant Population of Canada (1911-2001).
• Using the Tips sheet, do the Before Reading strategies as a whole class.
• Ask students to complete their sheets and then compare their results with partners or in groups.
• As a class, discuss and review the strategies for reading tables. Invite students to share their thoughts and new understandings with the class.
• Review the Tips sheet, referring to the activity just modeled by the teacher.
• Do the “Before Reading” portion
together. • Read provided table and use
modeled strategies to interpret the information and answer the sheets.
• Become familiar with some strategies for reading tables, and share their insights with the class.
N o t e s
51
R T H I N K L I T E R A C Y : S u b j e c t - S p e c i f i c E x a m p l e s G e o g r a p h y , G r a d e s 7 - 9
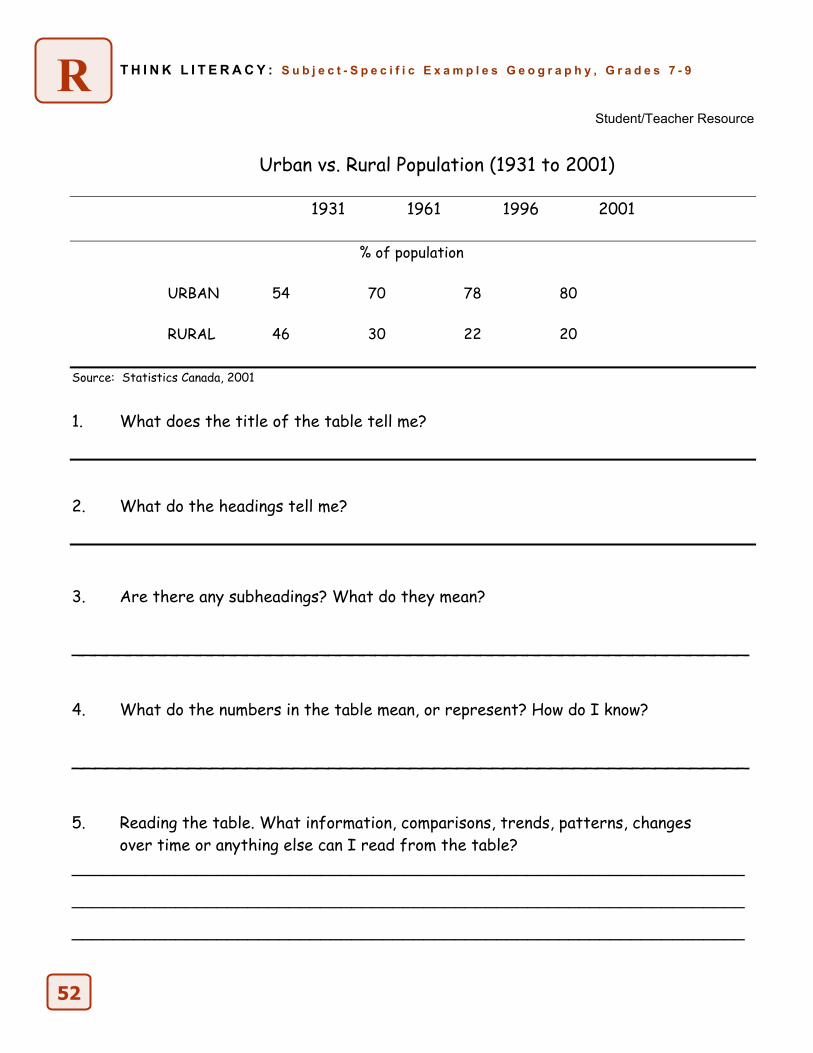
Student/Teacher Resource
Urban vs. Rural Population (1931 to 2001)
1931 1961 1996 2001
% of population URBAN 54 70 78 80 RURAL 46 30 22 20
Source: Statistics Canada, 2001
1. What does the title of the table tell me?
2. What do the headings tell me?
3. Are there any subheadings? What do they mean?
__________________________________________________________
4. What do the numbers in the table mean, or represent? How do I know?
__________________________________________________________
5. Reading the table. What information, comparisons, trends, patterns, changes over time or anything else can I read from the table?
_________________________________________________________________
_________________________________________________________________
_________________________________________________________________
52
R T H I N K L I T E R A C Y : S u b j e c t - S p e c i f i c E x a m p l e s G e o g r a p h y , G r a d e s 7 - 9
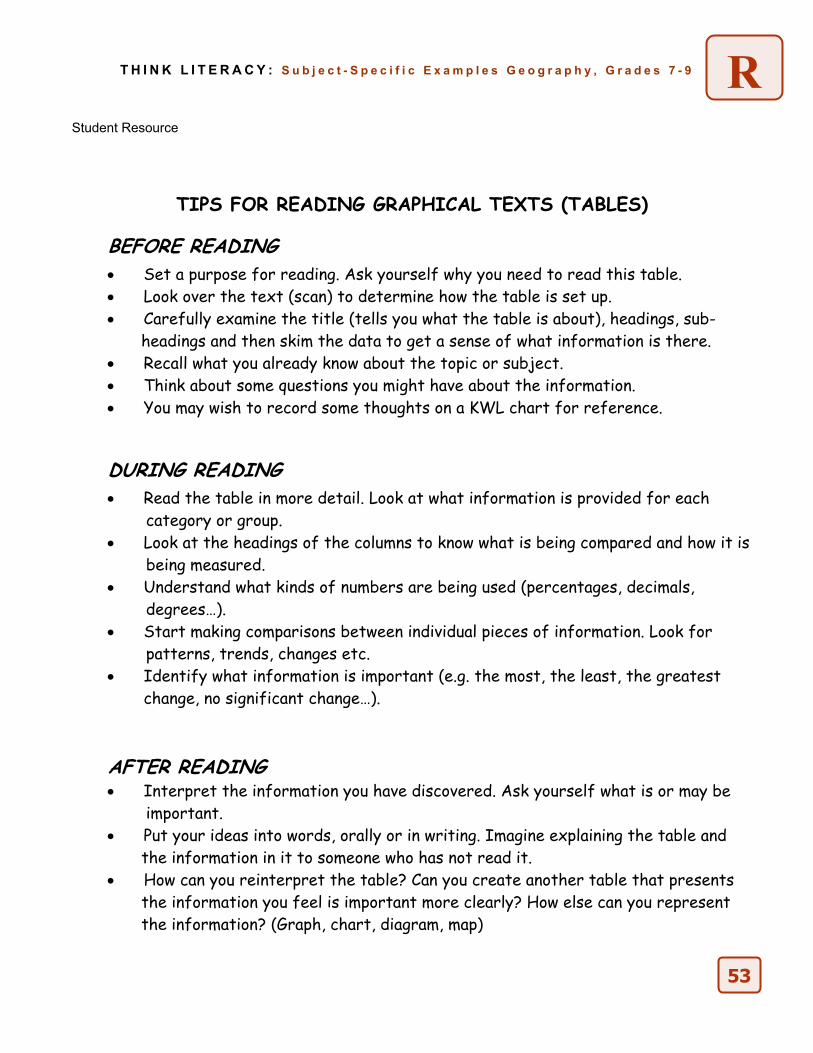
Student Resource
TIPS FOR READING GRAPHICAL TEXTS (TABLES)
BEFORE READING • Set a purpose for reading. Ask yourself why you need to read this table. • Look over the text (scan) to determine how the table is set up. • Carefully examine the title (tells you what the table is about), headings, sub- headings and then skim the data to get a sense of what information is there. • Recall what you already know about the topic or subject. • Think about some questions you might have about the information. • You may wish to record some thoughts on a KWL chart for reference.
DURING READING • Read the table in more detail. Look at what information is provided for each category or group. • Look at the headings of the columns to know what is being compared and how it is being measured. • Understand what kinds of numbers are being used (percentages, decimals, degrees…). • Start making comparisons between individual pieces of information. Look for patterns, trends, changes etc. • Identify what information is important (e.g. the most, the least, the greatest
change, no significant change…). AFTER READING • Interpret the information you have discovered. Ask yourself what is or may be important. • Put your ideas into words, orally or in writing. Imagine explaining the table and the information in it to someone who has not read it. • How can you reinterpret the table? Can you create another table that presents the information you feel is important more clearly? How else can you represent the information? (Graph, chart, diagram, map)
53
R T H I N K L I T E R A C Y : S u b j e c t - S p e c i f i c E x a m p l e s G e o g r a p h y , G r a d e s 7 - 9
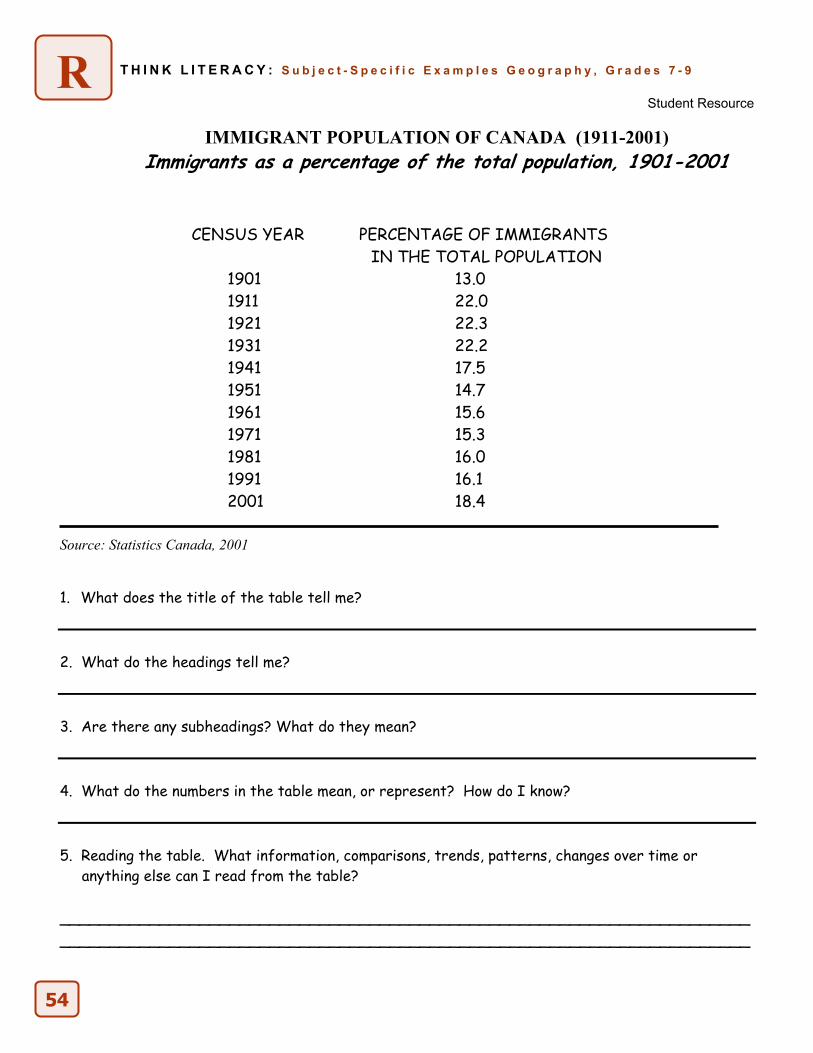
Student Resource
IMMIGRANT POPULATION OF CANADA (1911-2001) Immigrants as a percentage of the total population, 1901-2001
CENSUS YEAR PERCENTAGE OF IMMIGRANTS IN THE TOTAL POPULATION
1901 13.0 1911 22.0 1921 22.3 1931 22.2 1941 17.5 1951 14.7 1961 15.6 1971 15.3 1981 16.0 1991 16.1 2001 18.4
Source: Statistics Canada, 2001 1. What does the title of the table tell me? 2. What do the headings tell me? 3. Are there any subheadings? What do they mean? 4. What do the numbers in the table mean, or represent? How do I know? 5. Reading the table. What information, comparisons, trends, patterns, changes over time or anything else can I read from the table? __________________________________________________________________________________________________________________________________________
54
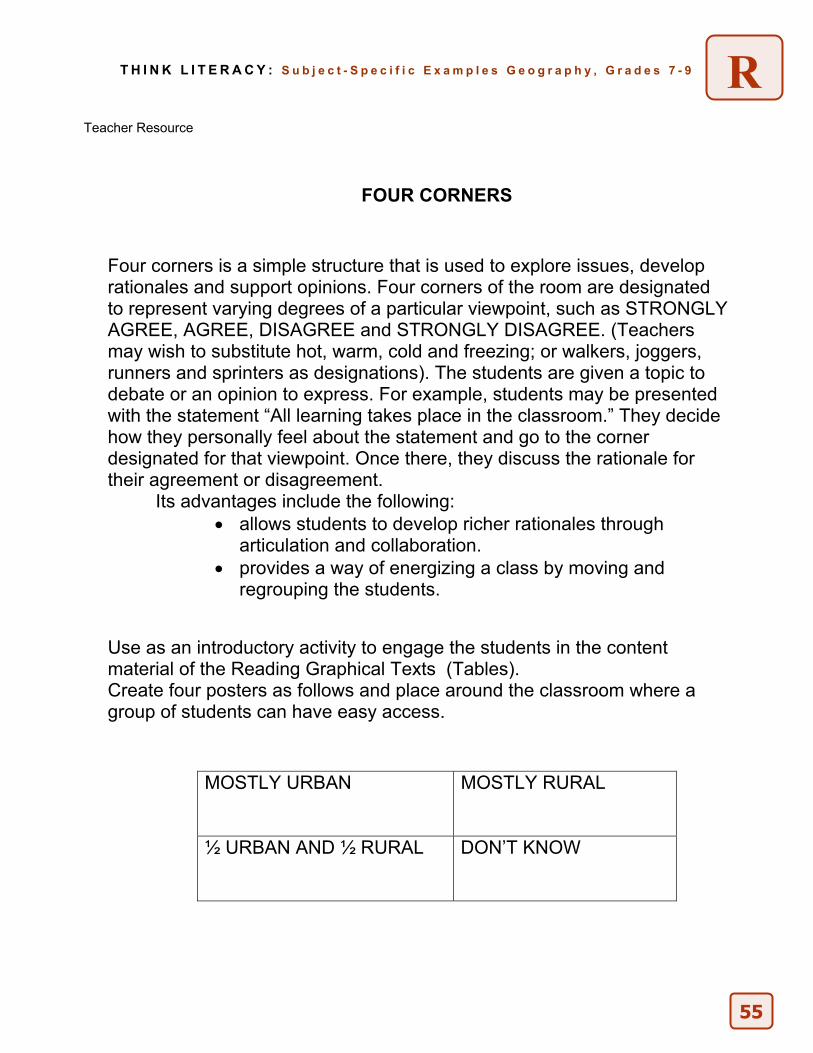
R T H I N K L I T E R A C Y : S u b j e c t - S p e c i f i c E x a m p l e s G e o g r a p h y , G r a d e s 7 - 9
Teacher Resource
FOUR CORNERS
Four corners is a simple structure that is used to explore issues, develop rationales and support opinions. Four corners of the room are designated to represent varying degrees of a particular viewpoint, such as STRONGLY AGREE, AGREE, DISAGREE and STRONGLY DISAGREE. (Teachers may wish to substitute hot, warm, cold and freezing; or walkers, joggers, runners and sprinters as designations). The students are given a topic to debate or an opinion to express. For example, students may be presented with the statement “All learning takes place in the classroom.” They decide how they personally feel about the statement and go to the corner designated for that viewpoint. Once there, they discuss the rationale for their agreement or disagreement.
Its advantages include the following: • allows students to develop richer rationales through
articulation and collaboration. • provides a way of energizing a class by moving and
regrouping the students.
Use as an introductory activity to engage the students in the content material of the Reading Graphical Texts (Tables). Create four posters as follows and place around the classroom where a group of students can have easy access.
MOSTLY URBAN MOSTLY RURAL
½ URBAN AND ½ RURAL DON’T KNOW
55
W T H I N K L I T E R A C Y : S u b j e c t - S p e c i f i c E x a m p l e s G e o g r a p h y , G r a d e s 7 - 9
Writing for a Purpose: Writing Bar Graphs
Grade 8 Geography – Migration
56
When students can get the “picture” of a form of writing in their heads, they feel more confident about creating the final product. A template or framework is a skeletal structure for a writing form that allows students to organize their thoughts and researched information in order to write a first draft. Essay maps are another type of template. Purpose • Provide students with a template to scaffold their understanding of a form of writing and help them
organize information before drafting the piece. Payoff Students will: • learn the common expectations for the form and components of a particular writing assignment. • organize their writing and ensure that it meets the requirements of the assignment. Tips and Resources • Graphs are visual representations of facts or data. They are valuable visual tools that make
comparisons readily apparent and memorable. They convey a lot of information quickly and concisely. Graphs work best when presented with other forms of visual and written text, enabling the reader to cross reference and gain deeper meaning and insight of the content being shown.
• A bar graph specifically uses rectangular bars to represent quantities of items. One axis, usually the vertical (y-axis) indicates the kind of measurement and the units, while the other horizontal (x-axis) indicates what is being measured. The bars usually extend from the x-axis indicating what is being measured, to a height determined by a quantity indicated by the y-axis.
• Bar graphs show comparisons and/or changes over time. Bar graphs are best used to show how a number of objects or events compare in relationship to a single property or compare measurements taken from a number of objects or categories.
• Features of bar graphs include: - Title. - Labels (to indicate what the axes mean or are measuring). - Uniform size of type or lettering, usually very small. - Numeric form for numbers, not words. - Uniform units of measurement, and equal spacing of increments along the axes. - Carefully and neatly drawn graphics using a ruler or they can be computer-generated. - Single, double, triple or multiple groups of bars that can be grouped or the bars can be stacked.
• See the following resources: - Teacher Resource, Table to Model Making a Graph. - Teacher Resource, Creating and Discussing Bar Graphs. - Student Resource, Bar Graph Checklist. - Student Resource, Immigrant Population By Place of Birth and Period of Immigration.
Just the Facts? Teaching Non-Fiction, Grades 4-8, TDSB 2003 Further Support The template for any individual writing assignment can be revised to make the modifications or accommodations necessary for students with special needs. For example, reduce the number of paragraphs or supporting details, create differing expectations for research, or for the complexity of the main idea, etc.
T H I N K L I T E R A C Y : S u b j e c t - S p e c i f i c E x a m p l e s G e o g r a p h y , G r a d e s 7 - 9 W
Writing for a Purpose: Writing Bar Graphs
Grade 8 Geography – Migration
What teachers do What students do Before
• Place six columns on the board, titled United States, Europe, Asia, Africa, Caribbean & S.A., Oceania and other countries. Have students fill in two strips of paper naming the country of origin of their parents (or perhaps grandparents). They place their strips under the appropriate region. (Place the Canadian responses in a seventh column).
• Discuss the results of the class survey. Explain that a basic form of graph has been created using data from the class.
• Focus Questions: - How is a bar graph created using
statistics? - What are the key features of a bar graph?
• Place Teacher Resource, Table to Model Making a Graph on the overhead – show only the top ½ of the page. Say that this table will be used to create a bar graph.
• Place name of country of origin of each parent on strips of paper, then tape the strips on the board beneath the appropriate region.
• Analyze the information and note the
basic features of a graph. • Respond and participate in discussion. • Identify key features of bar graphs. • Recognize features of a table. • Predict and anticipate how the table will
be used to create a bar graph.
During
• Use Teacher Resource, Creating and Discussing Bar Graphs to guide thinking in a Think Aloud.
• Also use a copy of the Student Resource, Bar Graph Checklist on the overhead as a guide to develop the bar graph.
• Complete the checklist and create a bar graph on the overhead, modeling your thinking, editing and revising, focusing on the process of determining scale, proportion and appropriate units of each axis.
• Listen and observe the creation of a bar graph on the overhead. Make connections to prior knowledge and experience with graphing.
After
• Have students review the features of a bar graph.
• Demonstrate using the checklist as a final review.
• Provide the students with Student Resource, Bar Graph Checklist and for follow up, to practise using the checklist.
• Facilitate and guide the students through the activity. Scaffold some students with a graph template and assist with math calculations where appropriate.
• Complete the lesson by making comparisons and analyzing similarities and differences with the new results and the class survey results on the board.
• Review the features of a bar graph. • Create a bar graph using the resource
sheets individually, in pairs or groups. • Practice using the checklist and the
guided instructions to create a bar graph. • Compare completed graphs with other
students. • Relate results of finished activity to initial
student survey. Compare and analyze the two sets of data.
Notes
57
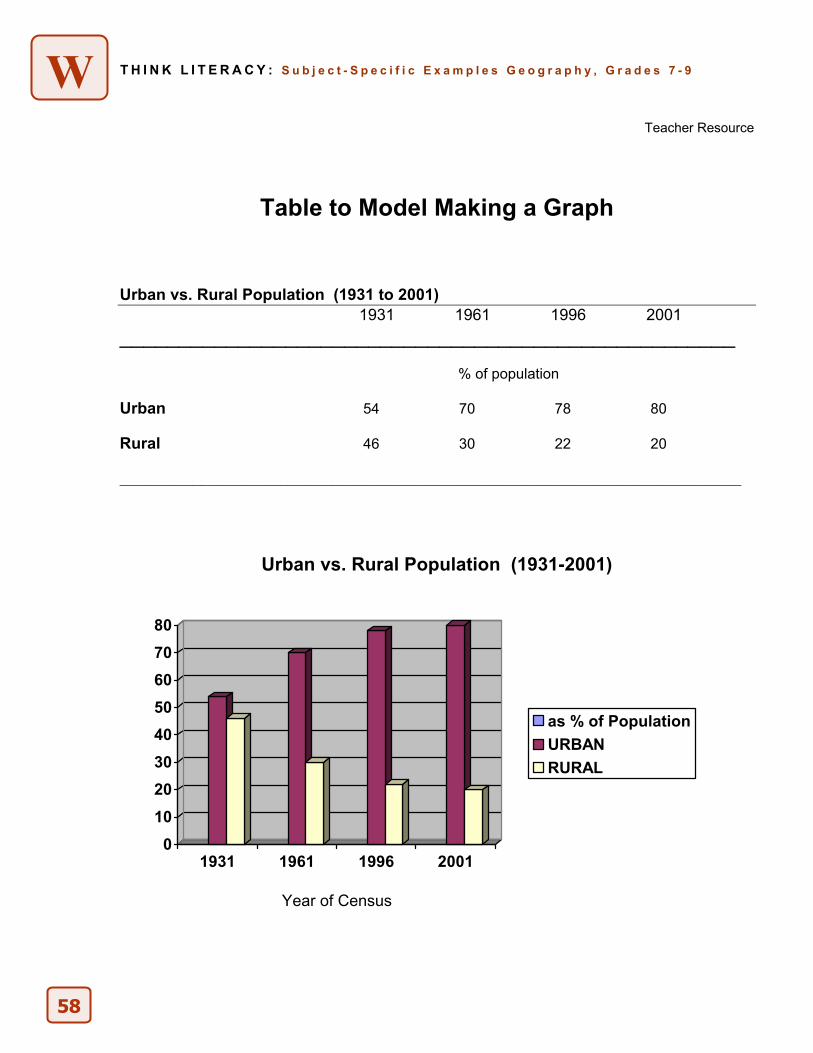
W T H I N K L I T E R A C Y : S u b j e c t - S p e c i f i c E x a m p l e s G e o g r a p h y , G r a d e s 7 - 9
Teacher Resource
Table to Model Making a Graph
Urban vs. Rural Population (1931 to 2001) 1931 1961 1996 2001
____________________________________________________
% of population
Urban 54 70 78 80 Rural 46 30 22 20 _____________________________________________________________________________________
Urban vs. Rural Population (1931-2001)
01020304050607080
1931 1961 1996 2001
as % of PopulationURBANRURAL
Year of Census
58
W T H I N K L I T E R A C Y : S u b j e c t - S p e c i f i c E x a m p l e s G e o g r a p h y , G r a d e s 7 - 9
Teacher Resource
Creating and Discussing Bar Graphs
Depending on student’s needs and abilities, use guided writing, modelling and ‘think-aloud’ to create graphs together. Using data collected by the students through surveys or research will provide a relevant, meaningful data set to work with. Explicitly demonstrate using sample chart provided, modeling using think-aloud: • the data to be used will be showing comparisons and/or changes over
time, therefore a double bar graph will be the appropriate graph to create.
• considering your audience and level of skill, what style would be appropriate.
• looking at the data, and deciding on the scale of measurement units, making sure they are uniform and that the end result will be balanced and proportional.
• creating a few rough drafts to experiment with scale, proportion and colour.
• editing and proofreading for accuracy and spelling before creating final version.
• choosing a title and labelling the axes clearly and appropriately. • using the template as a guide in creating and completing the graph.
Depending on your students, have them create some bar graphs either as a group, in pairs or individually or assign them the chart provided.
59
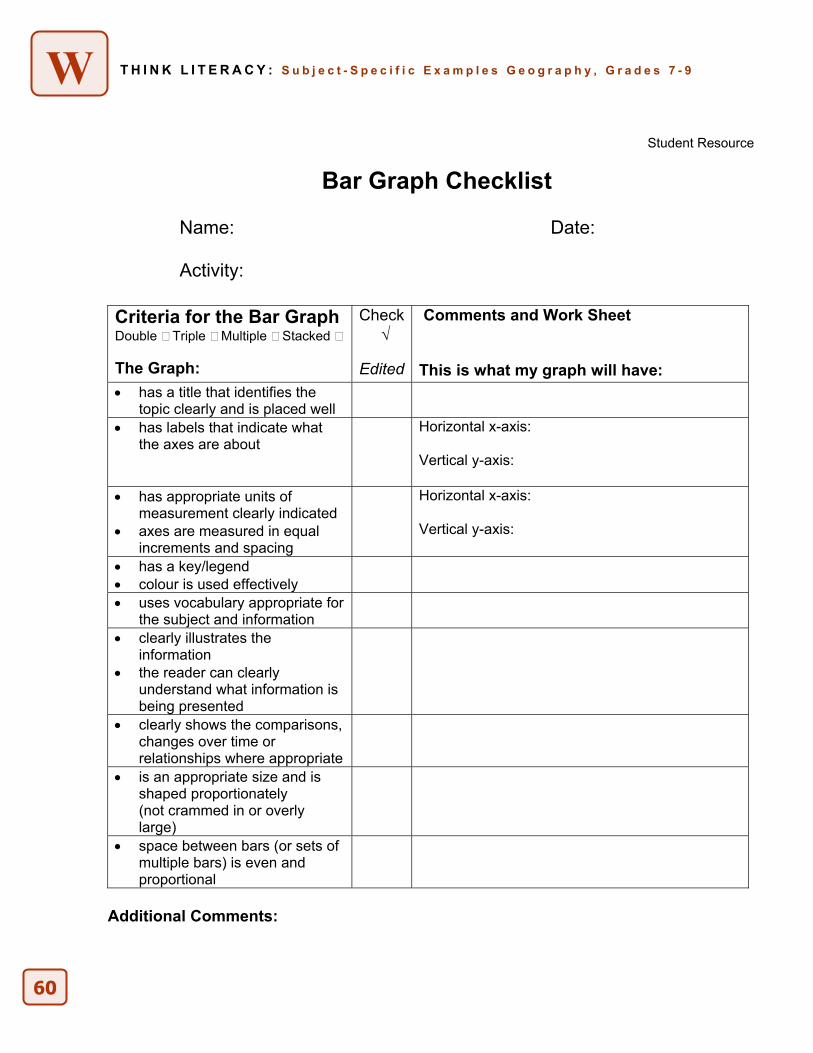
W T H I N K L I T E R A C Y : S u b j e c t - S p e c i f i c E x a m p l e s G e o g r a p h y , G r a d e s 7 - 9
Student Resource
Bar Graph Checklist
Name: Date:
Activity: Criteria for the Bar Graph Double Triple Multiple Stacked The Graph:
Check √
Edited
Comments and Work Sheet This is what my graph will have:
• has a title that identifies the topic clearly and is placed well
• has labels that indicate what the axes are about
Horizontal x-axis: Vertical y-axis:
• has appropriate units of measurement clearly indicated
• axes are measured in equal increments and spacing
Horizontal x-axis: Vertical y-axis:
• has a key/legend • colour is used effectively
• uses vocabulary appropriate for the subject and information
• clearly illustrates the information
• the reader can clearly understand what information is being presented
• clearly shows the comparisons, changes over time or relationships where appropriate
• is an appropriate size and is shaped proportionately (not crammed in or overly large)
• space between bars (or sets of multiple bars) is even and proportional
Additional Comments:
60
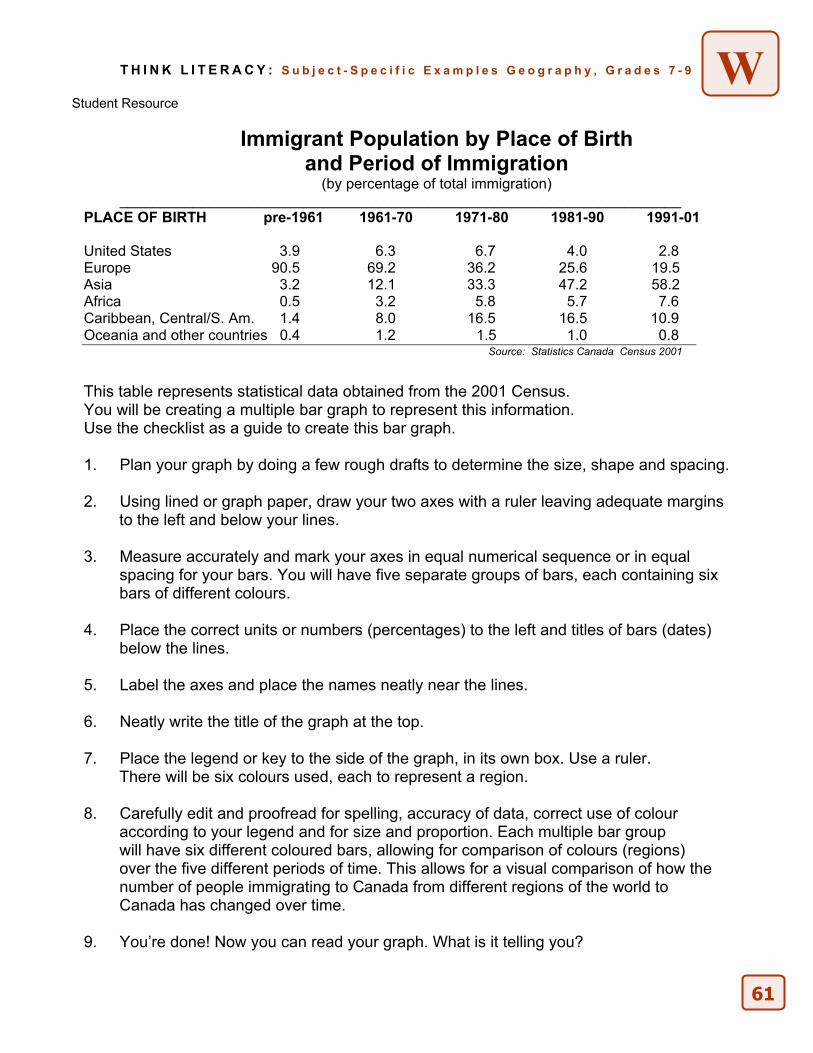
T H I N K L I T E R A C Y : S u b j e c t - S p e c i f i c E x a m p l e s G e o g r a p h y , G r a d e s 7 - 9 W
Student Resource
Immigrant Population by Place of Birth and Period of Immigration
(by percentage of total immigration) _____________________________________________________________________
PLACE OF BIRTH pre-1961 1961-70 1971-80 1981-90 1991-01
United States 3.9 6.3 6.7 4.0 2.8 Europe 90.5 69.2 36.2 25.6 19.5 Asia 3.2 12.1 33.3 47.2 58.2 Africa 0.5 3.2 5.8 5.7 7.6 Caribbean, Central/S. Am. 1.4 8.0 16.5 16.5 10.9 Oceania and other countries 0.4 1.2 1.5 1.0 0.8
Source: Statistics Canada Census 2001
This table represents statistical data obtained from the 2001 Census. You will be creating a multiple bar graph to represent this information. Use the checklist as a guide to create this bar graph. 1. Plan your graph by doing a few rough drafts to determine the size, shape and spacing. 2. Using lined or graph paper, draw your two axes with a ruler leaving adequate margins to the left and below your lines. 3. Measure accurately and mark your axes in equal numerical sequence or in equal spacing for your bars. You will have five separate groups of bars, each containing six bars of different colours. 4. Place the correct units or numbers (percentages) to the left and titles of bars (dates) below the lines. 5. Label the axes and place the names neatly near the lines. 6. Neatly write the title of the graph at the top. 7. Place the legend or key to the side of the graph, in its own box. Use a ruler. There will be six colours used, each to represent a region. 8. Carefully edit and proofread for spelling, accuracy of data, correct use of colour according to your legend and for size and proportion. Each multiple bar group will have six different coloured bars, allowing for comparison of colours (regions) over the five different periods of time. This allows for a visual comparison of how the number of people immigrating to Canada from different regions of the world to Canada has changed over time. 9. You’re done! Now you can read your graph. What is it telling you?
61
R T H I N K L I T E R A C Y : S u b j e c t - S p e c i f i c E x a m p l e s G e o g r a p h y , G r a d e s 7 - 9
Reading Different Text Forms: Reading Pictures
Grade 8 Geography - Migration
62
Graphical text forms (such as diagrams, photographs, drawings, sketches, graphs, schedules, maps, charts, timelines and tables) are intended to communicate information in a concise format and illustrate how one piece of information is related to another. Providing students with an approach to reading graphical text also helps them to become effective readers. Purpose • •
Become familiar with the elements and features of graphical texts. Explore a process for reading graphical texts, using a range of strategies for before, during and after reading.
Payoff Students will: • become more efficient at “mining” graphical texts for information and meaning. • practise essential reading strategies and apply them to different course-related materials. Tips and Resources • Sometimes pictures and photos can communicate an idea or a concept more easily than words.
Pictures can elicit responses that are unexpected or perhaps unclear. Pictures capture a moment in time. They tell stories with images as a writer does with words. The combination of a photo with written text can provide the reader with a more meaningful context than what can be achieved only through text.
• Often, a picture will allow the reader to readily make connections to personal experience or knowledge, and will produce a relevant personal response. However, when presented with an unfamiliar image, the viewer will try to engage with the photo by relating prior knowledge and experience to the photo. By making these connections and generalizations, new understandings can be achieved.
• Locate in magazines, texts and other available resources a variety of pictures representing two specific environments, urban and rural. Find 10-15 pictures depicting a busy street intersection in a downtown of a large city including office towers in the background. Another set of 10-15 will show a pastoral, agricultural (farming) environment, ideally including a farm setting, with buildings, animals and perhaps some evidence of crops. These pictures represent ideal examples of what typifies urban and rural environments.
• Use classroom and library resources to locate a variety of pictures depicting a wider variety of urban and rural settings of Canada over the past 100 years. The images will help the students gain more understanding of urban and rural environments, and the images representing many changes over time will help the students develop an understanding of the underlying reasons for increasing urbanization over the past century (advances in technology, industrialization, more jobs in growing cities…).
• See the following resources: - Student Resource, Tips for Reading Pictures. - Student Resource, T-Chart Organizer - Analyzing Pictures. - Student Resource, Venn diagram (Urban). - Student Resource, Venn diagram (Rural). - Student Resource, T-Chart Organizer - During the 20th Century.
Further Support • Provide students with an advance organizer to guide them as they read a particular text. This might
be a series of prompts to guide them through the reading task.
T H I N K L I T E R A C Y : S u b j e c t - S p e c i f i c E x a m p l e s G e o g r a p h y , G r a d e s 7 - 9 R
Reading Different Text Forms: Reading Pictures
Grade 8 Geography – Migration
What teachers do What students do Before
• As students come in to class, have each group of students (2-4) select one photo from each of two piles of photos (one urban pictures, the other rural) and Student Resource, T-Chart Organizer, Analyzing Pictures.
• Have students in groups discuss all the features of the photos and record their thoughts on the T-Chart.
• Introduce the terms ‘urban’ and ‘rural’ to reinforce the concepts if not already determined by the students.
• Debrief and consolidate the concepts, explicitly referring to visual features, patterns noted, what was obvious, what was inferred.
• Discuss and collaborate by creating a list of features of both photos on a T-Chart.
• Label their T-Chart with the two headings,
Urban and Rural Environments. • Participate in the class discussion, making the
connection between their pictures and the lists on the T-Chart.
During
• Provide students with a copy of the Student Resource, Tips for Reading Pictures. Review the sheet and discuss referring to the first set of pictures.
• Provide pairs or groups with at least 4-5 pictures each of Canadian rural and urban scenes over the past 100 years. (Located in various classroom and library resources).
• Provide the Student Resource, Venn Diagram Templates (Urban and Rural) for each group to record their observations about how the two environments have changed over time.
• Support and facilitate group activity by guiding and modeling the reading of the picture if necessary.
• Classify photos according to urban and rural attributes and how the two environments have changed over time.
• Complete the Venn Diagrams collaboratively in
groups or pairs. • Identify key features of both environments and
changes made over time. • Begin to analyze reasons for changes over
time, which would affect both environments.
After • Have groups select the three most important
changes noted on each chart. Then, have each group in turn report one to the class. The teacher will record the responses on the board (or overhead, or chart paper). After each group has reported, invite any more responses, which have not yet been noted.
• Discuss and review method of ‘reading pictures’, and reinforce how much discussion and writing was generated from a few visuals, further emphasizing the depth and variety of the content of the activity.
• In groups, review the Venn Diagrams and select the three most important changes that were noted to have occurred over time for each.
• Report one of the three choices at a time. • Notice that other groups have observed similar
changes, or they will add new information to their own diagrams. Continue until all key observations have been reported.
• Begin to realize the vast amount of information and content that can be obtained by a few pictures. Using a graphic organizer can also help organize thoughts and responses.
Notes
63
R T H I N K L I T E R A C Y : S u b j e c t - S p e c i f i c E x a m p l e s G e o g r a p h y , G r a d e s 7 - 9
Student Resource
Tips for Reading Pictures
When you ‘read’ a picture or photograph, often there may not be any title or caption that would provide you with a means to identify what the subject is. You may need to scan over the image in order to determine what the picture is about. Photographers make choices when they create their images. Not only is the image important, but also what has been left out of the image. What is the perspective of the image? Would a different perspective create a different response?
When reading a picture or photograph, remember to think about the photographer as you would a writer of a story. What are they trying to say? Who is their audience? Could the image have been manipulated in any way? Think of new computer technologies, and the ease with which anyone can now alter visual information as never before. Pictures and photos now more than ever need to be read with a critical eye. Not only observations and facts can be read, but many questions should be generated to more fully understand the image.
When reading any image, keep these questions in mind:
1. Why are you looking at this photo?
2. Recall what you already know about the subject or do you have questions about the content of the picture? Study the image carefully. Look for relationships within the picture or between pictures.
3. Who took this picture and why?
4. What was the photographer trying to do (for example, narrate, explain, describe, persuade or some combination of these purposes)?
5. Why did the photographer choose this angle or perspective?
6. Where in the photograph do you look first?
7. What do you need to know to read the image successfully?
8. Is this image in its original state, or have alterations or adjustments (possibly) been made?
Adapted from: Jim Burke, Ron Klemp, Wendell Schwartz:
Reader’s Handbook, Great Source Education Group
64
T H I N K L I T E R A C Y : S u b j e c t - S p e c i f i c E x a m p l e s G e o g r a p h y , G r a d e s 7 - 9
Student Resource
T-Chart Organizer – Analyzing Pictures
Picture # 1 Picture # 2
R
65
R T H I N K L I T E R A C Y : S u b j e c t - S p e c i f i c E x a m p l e s G e o g r a p h y , G r a d e s 7 - 9
Student Resource
Venn Diagram (Urban) Differences and Similarities between Canadian Urban Environments from 1900 to present
Urban Environment Early 1900s
Changes Between Urban Environments throughout the 1900s
Urban Environment Late 1900s
66
R T H I N K L I T E R A C Y : S u b j e c t - S p e c i f i c E x a m p l e s G e o g r a p h y , G r a d e s 7 - 9
Student Resource
Venn Diagram (Rural) Differences and Similarities between Canadian Rural Environments from 1900 to present
Rural Environment Early 1900s
Changes Between Rural Environments throughout 1900s
Rural Environment Late 1900s
67
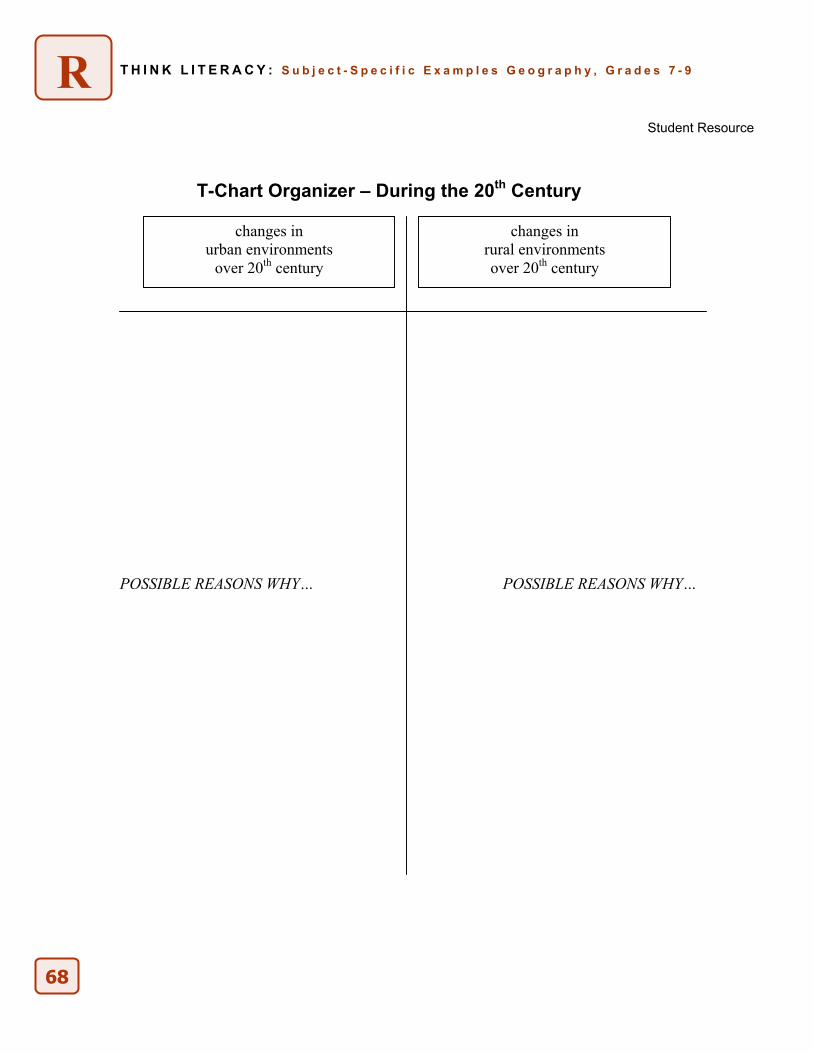
R T H I N K L I T E R A C Y : S u b j e c t - S p e c i f i c E x a m p l e s G e o g r a p h y , G r a d e s 7 - 9
Student Resource
T-Chart Organizer – During the 20th Century
POSSIBLE REASONS WHY… POSSIBLE REASONS WHY…
changes in urban environments
over 20th century
changes in rural environments over 20th century
68