
CONTENT 2012 Proceedings - ThinkMind
98
CONTENT 2012 The Fourth International Conference on Creative Content Technologies ISBN: 978-1-61208-220-2 July 22-27, 2012 Nice, France CONTENT 2012 Editors Hans-Werner Sehring, T-Systems Multimedia Solutions GmbH, Germany Petre Dini, Concordia University - Montreal, Canada / China Space Agency Center - Beijing, China 1 / 98
-
Upload
khangminh22 -
Category
Documents
-
view
1 -
download
0
Transcript of CONTENT 2012 Proceedings - ThinkMind

CONTENT 2012
The Fourth International Conference on Creative Content Technologies
ISBN: 978-1-61208-220-2
July 22-27, 2012
Nice, France
CONTENT 2012 Editors
Hans-Werner Sehring, T-Systems Multimedia Solutions GmbH, Germany
Petre Dini, Concordia University - Montreal, Canada / China Space Agency Center -
Beijing, China
1 / 98

CONTENT 2012
Foreword
The Fourth International Conference on Creative Content Technologies (CONTENT2012), held between July 22 and 27, 2012 in Nice, France, targeted advanced concepts,solutions and applications in producing, transmitting and managing various forms of contentand their combination. Multi-cast and uni-cast content distribution, content localization, on-demand or following customer profiles are common challenges for content producers anddistributors. Special processing challenges occur when dealing with social, graphic content,animation, speech, voice, image, audio, data, or image contents. Advanced producing andmanaging mechanisms and methodologies are now embedded in current and soon-to-besolutions.
We welcome technical papers presenting research and practical results, position papersaddressing the pros and cons of specific proposals, such as those being discussed in thestandard fora or in industry consortia, survey papers addressing the key problems and solutionson any of the above topics short papers on work in progress, and panel proposals.
We take here the opportunity to warmly thank all the members of the CONTENT 2012Technical Program Committee, as well as the numerous reviewers. The creation of such a broadand high quality conference program would not have been possible without their involvement.We also kindly thank all the authors who dedicated much of their time and efforts to contributeto CONTENT 2012. We truly believe that, thanks to all these efforts, the final conferenceprogram consisted of top quality contributions.
Also, this event could not have been a reality without the support of many individuals,organizations, and sponsors. We are grateful to the members of the CONTENT 2012 organizingcommittee for their help in handling the logistics and for their work to make this professionalmeeting a success.
We hope that CONTENT 2012 was a successful international forum for the exchange ofideas and results between academia and industry and for the promotion of progress in the areaof creative content technologies.
We are convinced that the participants found the event useful and communications veryopen. We hope Côte d’Azur provided a pleasant environment during the conference andeveryone saved some time for exploring the Mediterranean Coast.
2 / 98

CONTENT 2012 Chairs:
CONTENT Advisory ChairsRaouf Hamzaoui, De Montfort University - Leicester, UKJalel Ben-Othman, Université de Versailles, FranceJaime Lloret Mauri, Polytechnic University of Valencia, SpainWolfgang Fohl, Hamburg University of Applied Sciences, GermanyZhou Su, Waseda University, Japan
CONTENT 2012 Industry/Research ChairsAjith Abraham, Machine Intelligence Research Labs (MIR Labs), USAHans-Werner Sehring, T-Systems Multimedia Solutions GmbH, Germany
3 / 98

CONTENT 2012
Committee
CONTENT Advisory Chairs
Raouf Hamzaoui, De Montfort University - Leicester, UKJalel Ben-Othman, Université de Versailles, FranceJaime Lloret Mauri, Polytechnic University of Valencia, SpainWolfgang Fohl, Hamburg University of Applied Sciences, GermanyZhou Su, Waseda University, Japan
CONTENT 2012 Industry/Research Chairs
Ajith Abraham, Machine Intelligence Research Labs (MIR Labs), USAHans-Werner Sehring, T-Systems Multimedia Solutions GmbH, Germany
CONTENT 2012 Technical Program Committee
Dana Al Kukhun, IRIT/University of Toulouse III - Toulouse, FranceMarios C. Angelides, Brunel University - Uxbridge, UKKambiz Badie, Research Institute for ICT, IranChristos Bouras, University of Patras, GreeceYiwei Cao, RWTH Aachen University, GermanySavvas A. Chatzichristofis, Democritus University of Thrace, GreeceChi-Hua Chen, National Chiao Tung University, Taiwan, R.O.C.Octavian Ciobanu, "Gr.T. Popa" University of Medicine and Pharmacy – Iasi, RomaniaRaffaele De Amicis, Fondazione Graphitech - Trento, ItalyRafael del Vado Vírseda, Universidad Complutense de Madrid, SpainAndrea Esuli, CNR, ItalyWolfgang Fohl, Hamburg University of Applied Sciences, GermanyAntonio Javier García Sánchez, Technical University of Cartagena, SpainAfzal Godil, National Institute of Standards and Technology, USAPatrick Gros, INRIA Rennes - Campus de Beaulieu, FranceRaouf Hamzaoui, De Montfort University - Leicester, UKChih-Cheng Hung, Southern Polytechnic State University - Marietta, USAJinyuan Jia, Tongji University. Shanghai, ChinaAngelos Lazaris, University of Southern California, USAMaryam Tayefeh Mahmoudi, Research Institute for ICT, IranVittorio Manetti, SESM/Finmeccanica Company & University of Naples "Federico II", ItalyJoan Navarro, Universidad Ramón Llull, SpainSebastian Pena Serna, Fraunhofer IGD - Darmstadt, GermanySören Pirk, Universität Konstanz, GermanyMarius Ioan Podean, Babes-Bolyai University of Cluj-Napoca, RomaniaAlex Popa, Aalto University, Finland
4 / 98

Aitor Rodriguez, University Autonoma of Barcelona, SpainAndreau Sancho-Asensio, La Salle Universitat Ramon Llull Barcelona, SpainJames Sawle, De Montfort University - Leicester, UKDaniel Scherzer, Max-Planck-Institut Informatik - Saarbrücken, GermanyHans-Werner Sehring, T-Systems Multimedia Solutions GmbH, GermanyAtsuhiro Takasu, National Institute of Informatics, JapanDaniel Thalmann, Nanyang Technological University, SingaporeBožo Tomas, University of Mostar, Bosnia and HerzegovinaKrzysztof Walczak, Poznan University of Economics, PolandStefan Wesarg, Fraunhofer IGD - Darmstadt, GermanyWojciech R. Wiza, Poznan University of Economics, PolandShigang Yue, University of Lincoln, UKJuan Zamora, Universidad Técnica Federico Santa María, Chile
5 / 98

Copyright Information
For your reference, this is the text governing the copyright release for material published by IARIA.
The copyright release is a transfer of publication rights, which allows IARIA and its partners to drive the
dissemination of the published material. This allows IARIA to give articles increased visibility via
distribution, inclusion in libraries, and arrangements for submission to indexes.
I, the undersigned, declare that the article is original, and that I represent the authors of this article in
the copyright release matters. If this work has been done as work-for-hire, I have obtained all necessary
clearances to execute a copyright release. I hereby irrevocably transfer exclusive copyright for this
material to IARIA. I give IARIA permission or reproduce the work in any media format such as, but not
limited to, print, digital, or electronic. I give IARIA permission to distribute the materials without
restriction to any institutions or individuals. I give IARIA permission to submit the work for inclusion in
article repositories as IARIA sees fit.
I, the undersigned, declare that to the best of my knowledge, the article is does not contain libelous or
otherwise unlawful contents or invading the right of privacy or infringing on a proprietary right.
Following the copyright release, any circulated version of the article must bear the copyright notice and
any header and footer information that IARIA applies to the published article.
IARIA grants royalty-free permission to the authors to disseminate the work, under the above
provisions, for any academic, commercial, or industrial use. IARIA grants royalty-free permission to any
individuals or institutions to make the article available electronically, online, or in print.
IARIA acknowledges that rights to any algorithm, process, procedure, apparatus, or articles of
manufacture remain with the authors and their employers.
I, the undersigned, understand that IARIA will not be liable, in contract, tort (including, without
limitation, negligence), pre-contract or other representations (other than fraudulent
misrepresentations) or otherwise in connection with the publication of my work.
Exception to the above is made for work-for-hire performed while employed by the government. In that
case, copyright to the material remains with the said government. The rightful owners (authors and
government entity) grant unlimited and unrestricted permission to IARIA, IARIA's contractors, and
IARIA's partners to further distribute the work.
6 / 98

Table of Contents
Methodology for Improving Performance of Traffic Control System Through Processing Traffic Control PoliciesSequentiallySang Wan Kim, Joon Kyung Lee, Dong Won Kang, and Sang Ha Kim
1
Resonance-Relationship Network Construction by Information Analysis Based on Microblog InteractionsMeng-Hsuan Fu, Fang-Yu Lin, Yau-Hwang Kuo, and Kuan-Rong Lee
8
A Document Analysis System for Linking Cross-document EntitiesManabu Ohta and Atsuhiro Takasu
14
Open Linked Data in Policy-Based RepositoriesChien-Yi Hou and Richard Marciano
21
Multicast Group Management for Users of Heterogeneous Wireless NetworksSvetlana Boudko, Wolfgang Leister, and Stein Gjessing
24
Designing Template-based Page Generator: A Case of Mobile PadTse-Ming Tsai, Shih-Chun Chou, Bo-Fu Liu, Yuting Lin, and Seng-Cho T. Chou
28
Fast Parallel k-NN Search in High-Dimensional SpacesHyun-Hwa Choi, Seung-Jo Bae, and Kyu-Chul Lee
32
Mirage: A Real-time Affection Meter via Collaborative Memory Creation and NavigationLyn Chao-ling Chen and Yi-ping Hung
38
Enduring Cultures - A Socio Cultural ToolkitShweta Verma, Schubert Foo, and Natalie Pang
45
Collective Intelligence Utilization in the Scope of Personal Learning EnvironmentDanguole Rutkauskiene and Andrej Afonin
49
Developing Virtual Social Communities: Lessons Drawn from Two Indian Social CommunitiesSchubert Foo, Samantha Vu, Natalie Pang, and Shweta Verma
56
Real-Time Character Inverse Kinematics using the Gauss-Seidel Iterative Approximation MethodBen Kenwright
63
Development of an Interactive Puppet Show System for the Hearing-Impaired PeopleRyohei Egusa, Kumiko Wada, Miki Namatame, Fusako Kusunoki, Hiroshi Mizoguchi, and Shigenori Inagaki
69
1 / 2 7 / 98

Ring’s Anatomy - Parametric Design of Wedding RingsRene Berndt, Christoph Schinko, Ulrich Krispel, Volker Settgast, Sven Havemann, Eva Eggeling, and Dieter W.Fellner
72
Comparison of Methods for Horizon Line Detection in Sea ImagesTzvika Libe, Evgeny Gershikov, and Samuel Kosolapov
79
Self-Calibrated Structured Light 3D Scanner Using Color Edge PatternSamuel Kosolapov
86
Powered by TCPDF (www.tcpdf.org)
2 / 2 8 / 98

Methodology for Improving Performance of Traffic Control System Through Processing Traffic Control Policies Sequentially
Sang Wan Kim , Joon Kyung Lee, Dong Won Kang
Next Generation Communication Research Dep. ETRI
Gajongdong Yusonggu Deajon, Republic of KOREA [email protected], [email protected], [email protected]
Sang Ha Kim
Department of Computer Engineering Chungnam National University
Gungdong Yusonggu Deajon, Republic of KOREA [email protected]
Abstract— This paper relates to a traffic control system, and more particularly, to a technique for reducing the load of a traffic control system that has to process a large capacity of traffic on a high-speed line, through policy establishment sequentially by a policy server. Among high-speed data transmission technologies, a traffic control system for internet traffic control on a high-speed line basically requires high performance capable of processing a large capacity of traffic. However, in order to process a large capacity of traffic on a high-speed line, a high performance processor for traffic control is also needed. However, such a high performance processor increases the cost of the traffic control system. For this reason, this paper suggest a method for reducing the load of a traffic control system by allowing the traffic control system to define policies for processing traffic and perform the policies sequentially. The paper's suggesting method include controlling input volume of traffic to the traffic control system based on a filter policy , a system policy, a common service policy, and a subscriber policy in this order, which are established by the traffic control system, according to characteristics of the packet. Therefore, by processing policies sequentially, it is possible to in advance prevent a traffic control system from processing unnecessary traffic. Also, by differentiating policies to be performed for each subscriber and establishing policy layers requiring a relatively long time to process traffic at later stages, it is possible to reduce the load of the traffic control system upon processing traffic and accordingly improve the performance of the traffic control system
Keywords-Internet; Traffic Control; Traffic Control Policy; Network Control
I. INTRODUCTION Many researchers have studied the network policy issues.
Cataldo Basile proposed the model for policy representation to adopt policy in the enforcement elements independently [1]. Ehab et al. described Firewall policy management and a model to simplify the management of firewall policy [2]. Kanada proposed two rule-based building block architecture s for policy-based network control [5][6]. And there are some papers focused on the issues about management of policy rule [7][8][9][10]. Jan van Lunteren proposed the scheme to reduce the complexity of a classification rule set
and storage requirement [3]. But, in this paper, we will focus on a scheme using sequential policy set to reduce traffic volume which is processed for a long time in traffic control system. So, we propose a new methodology to increase the performance of traffic control system with policy unit which process input traffic sequentially.
Recently, the demand for the network appliance on network is increased to solve the problems due to the excessive Internet traffic loads. In the network environments, high-speed data transmission technologies have been developed to transmit a large amount of information quickly and accurately. With help of development of circuit and component technologies, free frequency bands without requiring specific permissions, popularization of portable computers, etc., technologies for transmitting data at high speed under a mobile environment have been developed and used. Among such high-speed data transmission technologies, a traffic control system for the high-speed Internet line requires basically high performance which is capable of processing a large capacity of traffic.
We developed an Internet traffic control system in order to provide common platform which can control the traffic in real-time. Our system, which is named High-speed Internet Traffic Control and Analysis Platform (HITCAP), can collect and analysis not only with the header information of a packet but also payload of a packet which is including site address, email, Voice over IP(VoIP) and even metadata which includes optional keyword: information of the receiver or the sender and attached files. Our system distinguishes and classifies the traffic of the applied service with the advanced technology, DPI (Deep Packet Inspection). It also lets system manager to control and analyze the chosen service with DPP (Deep Packet Processing). However, in order to process a large amount of traffic packets on a high-speed line, a high-performance H/W processor for traffic control is also needed. Such a high performance H/W processor increases the cost of the traffic control system. For this reason, this paper suggest a new method for reducing the load of a traffic control system by allowing the traffic control system to define policies for processing traffic and perform the policies sequentially.
The proposed methodology include controlling a packet of the traffic control system based on a filter policy, a system
1Copyright (c) IARIA, 2012. ISBN: 978-1-61208-220-2
CONTENT 2012 : The Fourth International Conference on Creative Content Technologies
9 / 98

policy, a common service policy, and a subscriber policy in this order, which are established by the traffic control system according to characteristics of the packet. Therefore, by processing policies sequentially, it is possible to in advance prevent a traffic control system from processing unnecessary traffic. Also, by differentiating policies to be performed for each subscriber and establishing policy layers requiring a relatively long time to process traffic at later stages, it is possible to reduce the load of the traffic control system upon processing traffic and accordingly improve the performance of the traffic control system. Section II describes developed traffic control H/W system, Section III proposes main idea, and then, we perform the evaluation test in Session IV. Finally, Session V concludes this paper.
II. HITCAP SYSTEM
A. HITCAP H/W PLATFORM HITCAP system, which we are developing, can process
the Internet traffic. HITCAP can classify the high-speed traffic with the Intelligent DPI Device. If input packet is classified by application classification engine as an interested traffic then classification device sends specific service traffic to the DPP (Deep Packet Processing) [12] module.
Figure 1. Concept of developed Hardware Platform
Figure 1 presents the concept of HITCAP to process Internet traffic. We implement 2-type of PCI-NIC type HITCAP cards for flexibility, functionality and economic reasons. If we implement on PCI-NIC, it can be installed COTS server without additional cost. If a manager wants to compose the traffic control system using two NICs, the first NIC (HITCAP-X) mainly classifies packets and second NIC (HITCAP-T) processes packets up to Layer 7.
Figure 2. X11 Network Processor based High-speed traffic classification
Card
Figure 2 shows a prototype of X11 [10][11]. based high-speed traffic classification card. It uses the systolic type NPU, X11 of Xelerated as network processor [9]. Figure 3 shows OCTEON plus CN5860 based deep packet processing card (HITCAP-T). A user can program c-like syntax and API, but the user must use OCTEON API [12].
Figure 3. OCTEN CN5860 Network Processor based Deep Packet
Processing Card
B. Platform Management System (PMS) Traffic Control Platform H/W (HITCAP H/W) is
managed by the Platform Management System (PMS). All received policy and configuration data are collected by PMS. PMS receives policy from policy server and PMS enforces policy to the adequate HITCAP Hardware [12].
There are some cases of policy enforcement. · L2~L4 : enforce policy to HITCAP-X only · L2~L4 with signature :
- enforce L2~L4 with forward action to HITCAP-X - enforce L2~L4 with signature to HITCAP-T
Figure 4 shows Platform Management System (PMS) Configuration and internal modules [12].
Figure 4. Concept of Policy Management System
C. Policy Server (PS) The policy server manages policy rules between
applications and policy enforcement points like HITCAP-hardware [11]. A manager can easily add and re-configure policies to manage and control traffic, optimization and admission control, etc. A wide variety of interfaces make it easy for manager to integrate the policy server into any type of network service [12]. Figure 5 shows Policy Server (PS) GUI.
2Copyright (c) IARIA, 2012. ISBN: 978-1-61208-220-2
CONTENT 2012 : The Fourth International Conference on Creative Content Technologies
10 / 98

Figure 5. Policy Server Graphic User Interface
III. PROCESSING TRAFFIC CONTROL POLICY SEQUENTIALLY FOR IMPROVING PERFORMANCE OF THE
CONTROL PLATFORM In the traffic control system, we focused the scheme
using sequential policy set to reduce traffic volume which is processed for a long time in traffic control system. So, we proposed methodology to increase the performance of the traffic control system with a policy unit, which processes the input traffic sequentially. We define the policy with the 6 types policy layers. Figure 6 is a diagram illustrating a logical hierarchical structure for establishing policies in a traffic control system. In Figure 1, a policy logical structure, which can be established by the traffic control system, logically has 6 policy layers: a filter policy, a system policy, a common service policy, a subscriber policy, a policy group, and a policy. The filter policy is a filtering policy based on a Virtual LAN (VLAN), an IP version, a protocol type, etc., to determine whether to process the received packet. Traffic filtered according to the filter policy is filtered in/allowed to the next stage or filtered out/dropped from the next stage.
The system policy is a policy to protect the traffic control system. The system policy is composed of a trusted user policy and a system status policy. The received packet is allowed or dropped according to whether a user who has requested or transmitted the packet is ‘trusted’ or ‘untrusted’, which is determined from the policy content established in the trusted user policy.
The system policy is a policy to protect the traffic control system. The system policy is composed of a trusted user policy and a system status policy. The received packet is allowed or dropped according to whether a user who has requested or transmitted the packet is ‘trusted’ or ‘untrusted’, which is determined from the policy content established in the trusted user policy.
Figure 6. Policy Structure
3Copyright (c) IARIA, 2012. ISBN: 978-1-61208-220-2
CONTENT 2012 : The Fourth International Conference on Creative Content Technologies
11 / 98
The system status policy is a system policy for allowing packets if a current amount of traffic is less than the threshold allowable by the system or for controlling the flow of packets based on statistical information about input packets. The system status policy may control the amount of traffic that is input to the traffic control system when a large amount of traffic such as abnormal traffic is generated in a short time.
The policy provides a basic unit policy for controlling packets based on IP addresses, ports and signatures, etc. The policy group, which is a logical group of policies, functions to easily manage the policies, for example, in such a manner as to group predefined policies to create a single policy.
The common service policy, which is a logical group of policy groups, functions to easily manage predefined policy groups. The common service policy may establish a policy that can be applied in common to all input traffic regardless of individual subscribers or systems. For example, in the case of a traffic control system at a college campus, a policy manager can establish a policy for blocking all peer to peer (P2P) traffic, and in this case, the common service policy may define a policy that must be applied to all P2P traffic.
The subscriber policy, which is another logical group of policy groups, is managed by the predefined policy groups. The subscriber policy is applied only to specific subscribers.
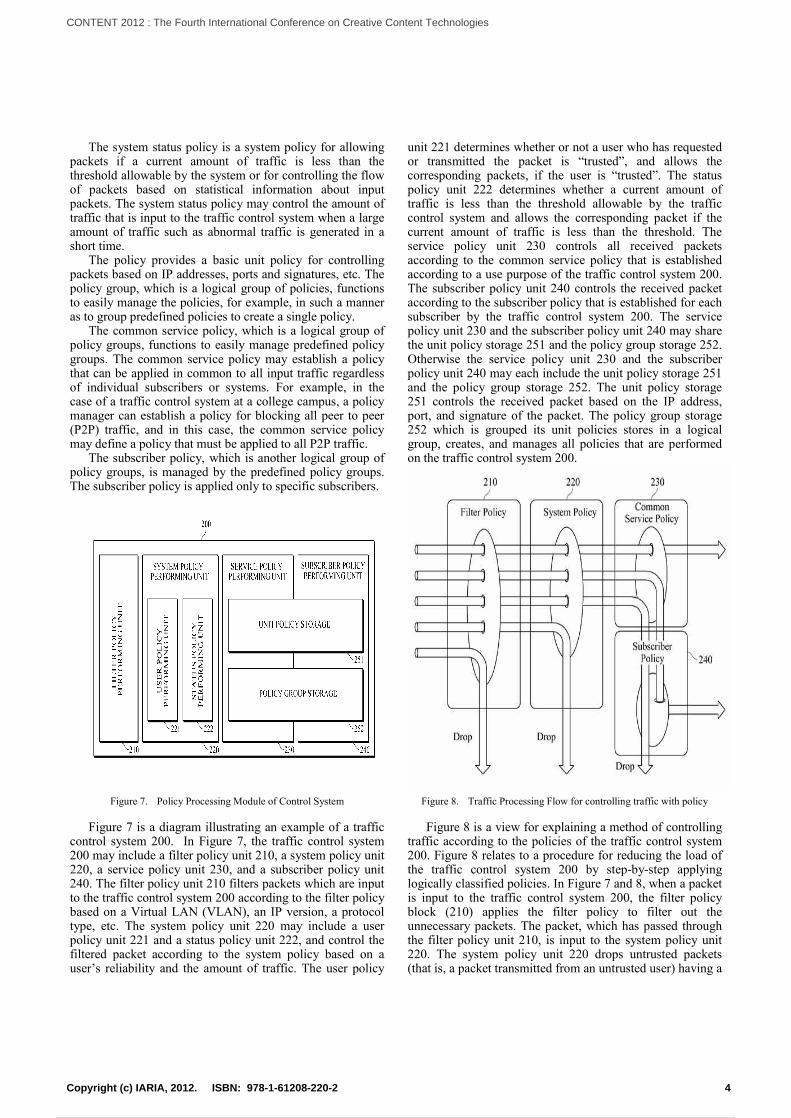
Figure 7. Policy Processing Module of Control System
Figure 7 is a diagram illustrating an example of a traffic control system 200. In Figure 7, the traffic control system 200 may include a filter policy unit 210, a system policy unit 220, a service policy unit 230, and a subscriber policy unit 240. The filter policy unit 210 filters packets which are input to the traffic control system 200 according to the filter policy based on a Virtual LAN (VLAN), an IP version, a protocol type, etc. The system policy unit 220 may include a user policy unit 221 and a status policy unit 222, and control the filtered packet according to the system policy based on a user’s reliability and the amount of traffic. The user policy
unit 221 determines whether or not a user who has requested or transmitted the packet is “trusted”, and allows the corresponding packets, if the user is “trusted”. The status policy unit 222 determines whether a current amount of traffic is less than the threshold allowable by the traffic control system and allows the corresponding packet if the current amount of traffic is less than the threshold. The service policy unit 230 controls all received packets according to the common service policy that is established according to a use purpose of the traffic control system 200. The subscriber policy unit 240 controls the received packet according to the subscriber policy that is established for each subscriber by the traffic control system 200. The service policy unit 230 and the subscriber policy unit 240 may share the unit policy storage 251 and the policy group storage 252. Otherwise the service policy unit 230 and the subscriber policy unit 240 may each include the unit policy storage 251 and the policy group storage 252. The unit policy storage 251 controls the received packet based on the IP address, port, and signature of the packet. The policy group storage 252 which is grouped its unit policies stores in a logical group, creates, and manages all policies that are performed on the traffic control system 200.
Figure 8. Traffic Processing Flow for controlling traffic with policy
Figure 8 is a view for explaining a method of controlling traffic according to the policies of the traffic control system 200. Figure 8 relates to a procedure for reducing the load of the traffic control system 200 by step-by-step applying logically classified policies. In Figure 7 and 8, when a packet is input to the traffic control system 200, the filter policy block (210) applies the filter policy to filter out the unnecessary packets. The packet, which has passed through the filter policy unit 210, is input to the system policy unit 220. The system policy unit 220 drops untrusted packets (that is, a packet transmitted from an untrusted user) having a
4Copyright (c) IARIA, 2012. ISBN: 978-1-61208-220-2
CONTENT 2012 : The Fourth International Conference on Creative Content Technologies
12 / 98

disallowable IP address or determines whether a current amount of traffic is more than the threshold and drops the corresponding packet if the current amount of traffic is more than the threshold. That is, the system policy unit 220 drops packets exceeding an allowable amount of traffic, expressed in unit of traffic volume (bps, pps and fps, etc.), thereby could adjust the bandwidth of input traffic.
The packet, that has passed through the system policy per unit 220, is input to the common service policy unit 230. The common service policy unit 230 processes, if the packet satisfies the common service policy. The packet according to the policy established by a policy establisher. The common service policy unit 230 processes packets in advance according to the policy, therefore it reduces traffic load that has to be processed by the subscriber policy unit 240 for performing a policy for each specific subscriber. Finally, the packet, dropped by the common service policy unit 230 is input to the subscriber policy unit 240, and the subscriber policy unit 240 determines whether there is a subscriber policy which the packet satisfies. If there is a subscriber policy which the packet satisfies, the subscriber policy unit 240 controls the packet according to the subscriber policy, and if there is no subscriber policy which the packet satisfies, the subscriber policy unit 240 drops the packet.
Figure 9. Flowchart of Processing Policy sequentially
Since packets allowed at the earlier stages through policy rules are not subject to policy processing at the later stages, the traffic control load of the traffic control system 200 may be reduced, which leads to improvement of system performance. Figure 9 is a flowchart illustrating another method I of controlling traffic according to a policy of the traffic control system 200 illustrated in Figure 7. In Figure 9, a method of controlling packets sequentially according to the policy processing units (filter policy, the system policy, the
common service policy, and the subscriber policy), which are basically set by the traffic control system 200, was described. First, when a packet is input to the traffic control system (400), the packet is filtered according to the filter policy based on a VLAN, an IP version, and a protocol type of the packet (410). If the packet does not satisfy the filter policy, the packet is dropped (460). The packet, which is allowed according to the filter policy, is controlled followed by the system policy based on a user’s reliability and the amount of traffic (420). If the packet does not satisfy the system policy, the packet is also dropped (460). All packets, allowed in operation 420 are controlled by the common service policy. Packets which satisfy the common service policy are finally allowed as packets which satisfy all policies of the traffic control system 200 (450). If a packet satisfies the subscriber policy that is established for each subscriber by the traffic control system 200 although the packet does not satisfy the common service policy (440), the corresponding packet is allowed (450), and if the packet does not satisfy the subscriber policy, the packet is finally dropped (460).
IV. PERFORMANCE EVALUATION In Survey of Packet Classification Techniques, we can
find lots of solutions to classify packets [4]. HITCAP H/W system adopts TCAM module for classification and adopts NETL7 coprocessor for Layer 7 depth packet inspection. In the processing time cost aspect, TCAM based classification spends low time. But, Layer 7 depth packet inspection needs lot of time to analysis packets. In H/W performance aspect, how much traffic volume is performed with the Layer 7 depth packet inspection module is a critical issue.
The proposed method composes policy processing units (filter policy, system policy, service policy and subscriber policy). Filter policy and system policy units use TCAM chip to classify traffics but, service policy and subscriber policy use NETL7 coprocessor module to inspection packets. If all input packets processed by using Layer 7 depth packet inspection module (NETL7), traffic control system performance is decreased in direct proportion to the input traffic volume. For the performance evaluation, we set the performance test environment in Figure 9.
Figure 10 is a test environment for the performance evaluation using the packet generator and HITCAP system.
Table I shows the generated packets from the packet generator. The generated packets in the Table I are processed in the filter policy unit and service policy unit. Table II shows the generated packets which are processed in the only service policy unit.
TABLE I. GENERATED PACKETS WHITCH IS PROCESEED IN THE FILTER POLICY UNIT AND SERVICE POLICY UNIT
Policy Rule
Generated Packet Packet
size Generated Port Total Volume Protocol
Filter Policy Using TCAM 1024Byte Port 1 : 10Gbps
Port 3 : 10Gbps 20Gbps TCP Stream
Service Policy Using NETL7
1024Byte Port 2 : 10Gbps Port 4 : 10Gbps 20Gbps UDP
Stream
5Copyright (c) IARIA, 2012. ISBN: 978-1-61208-220-2
CONTENT 2012 : The Fourth International Conference on Creative Content Technologies
13 / 98

Table III shows experimental results. When we processed input traffic sequentially using filtered policy unit and service policy unit, HITCAP H/W system handled all input traffic, totally 40Gbps traffic (20Gbps TCP stream and 20Gbps UDP Stream). But, when we processed input traffic using only NETL7 deep packet inspection module, HITCAP H/W system handled half of input traffic, only 20Gbps traffic because that all input traffic could not be handled in the NETL7 deep packet inspection module.
TABLE II. GENERATED PACKETS WHITCH IS PROCESEED IN THE ONLY SERVICE POLICY UNIT
Policy Rule
Generated Packet Packet
size Generated Port Total Volume Protocol
All Policy using NETL7
1024Byte Port 1 : 10Gbps Port 3 : 10Gbps 20Gbps TCP
Stream
1024Byte Port 2 : 10Gbps Port 4 : 10Gbps 20Gbps UDP
Stream
TABLE III. EXERIMENTAL RESULTS
In this experimental results, we show that this
methodology could reduce the load of the traffic control system upon processing traffic and accordingly improve the performance of the traffic control system by differentiating policies which are requiring a relatively long time to process traffic.
V. CONCLUSION AND FUTURE WORK We focused on a scheme using sequential policy set to
reduce traffic volume which is processed for a long time in traffic control system. So we proposed another methodology to increase traffic control system performance with policy unit. We suggest a method for reducing the load of a traffic control system by allowing the traffic control system to process policies sequentially. The paper's suggesting methodology includes controlling input volume of traffic based on the policy processing units, which are established by the traffic control system according to characteristics of the packet. Therefore, by processing policies sequentially, it is possible to prevent a traffic control system from processing unnecessary traffic. Also, by differentiating policies to be performed for each subscriber and policies requiring a relatively long time process, it is possible to
reduce the load of the traffic control system. Accordingly, it improves the performance of the traffic control system. This proposed method was adopted at our developed traffic control system, HITCAP.
In the future, there is a need to study about the policy enforcement performance issue. Policy server need to enforce lots of policies to the policy execution point timely.
ACKNOWLEDGMENT This research result has been funded by KCC (Korea
Communication Committee).
REFERENCES [1] C. Basile, A. Cappadonia, and A. Lioy, “Network-Level
Access Control Policy Analysis and Transformation”, IEEE/ACM Transactions on Networking, vol. 19, Issue: 6, pp. 1597-1609, December, 2011
[2] E. Al-Shaer and H. Hamed, “Modeling and management of firewall policies,” IEEE Transactions on NETWROK AND SERVICE MANAGEMENT, vol. 9, Issue: 2, no. 1, pp. 2–10, Apr. 2004
[3] J. van Lunteren and T. Engbersen, “Fast and scalable packet classification,” IEEE J. Sel. Areas Commun., vol. 21, no. 4, pp. 560–571, May 2003
[4] D. Taylor, “Survey and taxonomy of packet classification techniques, ”Comput. Surveys, vol. 37, no. 3, pp. 238–275, 2005.
[5] Y. Kanada, “Two Rule-based Building-block Architectures for Policy-based Network Control”, 2nd International Working Conference on Active Networks (IWAN 2000), Lecture Notes in Computer Science, No. 1942, pp. 195–210, Springer, October 2000.
[6] Y. Kanada, “A Representation of Network Node QoS Control Policies Using Rule-based Building Blocks”, International Workshop on Quality of Service 2000 (IWQoS 2000), pp. 161–163, June 2000.
[7] D. Haixin, W. Jianping and L. Xing, “Policy-based Access Control Framework for Large Networks”, The Proceedings of the IEEE International Conference on Networks ICON 2000 IEEE
[8] J.D. Guttman, Filtering Postures: Local Enforcement for global policies , Proceedings of the IEEE Computer Society Symposium on Research in Security and Privacy , May 4-7 1997, pp. 120-129
[9] Cássio Ditzel Kropiwiec, Edgard Jamhour, Mauro Sérgio Pereira Fonseca and Guy Pujolle, “Policy Framework for Capability-Based Firewall Configuration”, Policy 2007
[10] J. P. Albuquerque, H. Krumm and P.L. Geus, “Policy Modeling and Refinement for Network Security Systems”. IEEE 6th International Workshop on Policies for Distributed Systems and Networks, 2005, pp. 24-33.
[11] A. Westerinen, “Terminology for policy-based management,” RFC-3198, Nov. 2001 [Retrieved: March, 2012]
[12] P. Sang-Kil, Y. Sang-Sik and L. Joon-Kyung, “Multi-stage Traffic Control Platform,” ICCS2011, Nov. 2011
Policy Rule
Generated Packet Processing Results Packet
size Input
Volume Processing Traffic
Volume With Proposed Method
1024Byte 40Gbps 40Gbps Without Proposed Method 1024Byte 40Gbps 20Gbps
6Copyright (c) IARIA, 2012. ISBN: 978-1-61208-220-2
CONTENT 2012 : The Fourth International Conference on Creative Content Technologies
14 / 98

Port 1Port 2
Port 3Port 4
TrafficClassificationUsing TCAM
TrafficProcessing
Using NETL7
• TCP 1024byte packet• UDP 1024byte packet
Figure 10. Test Environment for performance evaluation
7Copyright (c) IARIA, 2012. ISBN: 978-1-61208-220-2
CONTENT 2012 : The Fourth International Conference on Creative Content Technologies
15 / 98

Resonance-Relationship Network Construction by Information Analysis Based on
Microblog Interactions
Meng-Hsuan Fu, Fang-Yu Lin, Yau-Hwang Kuo
Department of Computer Science and Information
Engineering
National Cheng Kung University
Tainan, Taiwan, ROC
{mhfu,coffeetrue,kuoyh}@ismp.csie.ncku.edu.tw
Kuan-Rong Lee
Department of Information Engineering,
Kun Shan University Tainan,
Taiwan, ROC
leekr@ ismp.csie.ncku.edu.tw
Abstract— In fields of community and relationship analysis for
online social medium, there are lots of researches focusing on
interest detection and similarity. From those we know people
are similar in some interests, but do not know why. Among
conventional studies, personal profile information (explicit
data) is often the main foundation to analyze. However it may
occur inconsistency between a real fact and subjective
information written by users. Thus, we think objective
information and potential factor are essential to help us to
understand the real conditions and progress in the future. So
that we proposed a novel model and proposed methods to
construct resonance-relationship network with behavioral
pattern analysis and coordinate opinion analysis. We leverage
interactive and time-varying data to extract resonance-
relationship, and model the distribution of interactions. Finally,
we showed our observation and result, and explained an actual
situation with photography in case study. In summary, we
proposed a novel model to analyze and solve potential
problems for online social relationships.
Keywords-resonance-relationship; social relationship;
behavior modeling; coordinate opinion.
I. INTRODUCTION
Nowadays, the explicit and implicit data analyses of social community and social relationship are used to mine hidden information, such as the mutual interests between users. The explicit data includes raw text or tag presented in personal profile that is always wrote by users themselves. However, the implicit data was implied in users‟ behaviors . In the previous modeling studies, behaviors of browse and click on webpage are discussed [3, 4] mostly, and then behaviors are used to analyze user interests. Then, similarity of interests between two nodes are computed. The goal of this kind studies is to improve quality of personal service in networks, there are lots of applications such as recommendation system and matching system.
Online social networks have become more popular because of the blog prevailing. Some traditional methods may have been in deficiency gradually. Firstly, we perceive some important information in each personal profile, which is the main foundation to determine user‟s affinity. We expect an objective fact instead of personal subjective opinion; however, if the information includes too much subjective opinion, the inconsistency between fact and the information users wrote might occur. In some scenarios, we
prefer objective facts, but the results happened via personal profile would not suit our requirements. Therefore, we proposed a method of analyzing interactive information based on online social platform, and expected to provide objective information.
Secondly, past studies in detecting users‟ interests realized people come together due to similarity of interests [9, 10], but they did not know why people got high similarity score in these fields (interests). In fact, people come together not only the similar interests but also other reasons. For example, people are curious about different characteristics, reliable comments, meeting frequently, and so on. In short, we think there are some key causes to make people come together, so that we made attempt on this study.
In the following section, we will give the detail explanation, definition and comparison. Section 2 reviews the literature on user behavior modeling in OSNs (online social networks), semantic orientation analysis, social relationship discovery and matching systems. Section 3 details the model and the procedure that we proposed method/algorithm. Section 4 discuss the results of our experiment and explain by case study, and finally conclude this paper and give a future work.
II. RELATED WORK
A. User Behavior Modeling
A number of studies observing properties of online social networks recently, and now most people are inseparable from the social networks. So, how do we understand the implicit information in the social medium is an important task. Based on this concept, there are two key issues [1] addressed for the measurements: characterization of user activities and usage patterns. This paper proposed a question: the information of user interaction is really an indicator of analysis on OSNs? Due to the motivation they try to quantify their observing factor and verify their assumption [2]. In order to characterize user behavior in online social network, the methodologies proposed to identify different classes of user behavior by evaluating the feature vector, which they defined [3] and analyze the user workloads in different online social networks to get the usage patterns [4]. Moreover, feature selection is also significant, because concept drift [5] is often caused by poor feature selection. Therefore, major studies chose the key impacting factors
8Copyright (c) IARIA, 2012. ISBN: 978-1-61208-220-2
CONTENT 2012 : The Fourth International Conference on Creative Content Technologies
16 / 98

cautiously by modeling extracted features and coefficient of variation.
B. Social Relationship and Matching
In the field of community analysis, a part of researches aimed at discovering hidden information and relation. In a study, two algorithms were designed by the original concept of feature extraction to accomplish relation extraction [6]. Regression-based algorithm is suitable when a user provides multiple community examples, but MinCut-based algorithm is suitable when a user provides single community example [6].
The applications of social matching system are often online social website and applications in some well-known social networks, such as iPartment [7] of Taiwan, Australia online dating website, RSVP [8] and so on. However, the conventional matching processes are almost according to users‟ profile and some questionnaires, which are all fixed fields for choose; the matching process of applications in some well-known social networks is providing the mutual friends between two users. [9] That study did matching process based on the personal information and their preferable conditions written in RSVP. The method classified users into several groups and matched male groups and female groups according to which male personal conditions are corresponding to female preferences. In addition, a social matching model was proposed [10] based in Twitter, they first detected personal information and interests, and then identify the user and his/her knowledge. Finally, they calculate similarity of interests between users then recommend. Another kind matching is recommending items, and then evolutionary computing method [11] is also used to improve the traditional methods in recommendation system.
Modularity [12] is common in evaluation of community analysis. It is an index to evaluate strength of a community (group), so that it is often used to partition a whole network into several groups. And it is used to understand intensity of one community or group according to the adjacent matrix and expectation value of degrees in a network (graph). Recently, Lu et al. [13] proposed a novel framework to evaluate user’s condition in online social networks. It
contains three parts, people rank, social rank, relationship weight individually.
III. OUR MODEL
The core issue we researched for online social medium is to understand the hidden relationship, called resonance-relationship, and then construct a resonance network. We give this phrase a definition: people have a) coordinate opinions and b) enthusiasms for some themes.
Here, we mined referable user‟s opinion and potential tendentiousness by their posts and comments, and then regarded enthusiasms as the degree of participation. However, in order to target the potential users, we carry out “Active Cluster Detection” first. The overall framework is shown as Figure 1. We believe this study will be in favor of future applications development.
A. Environment
This study is based on online social platform: Facebook
[14]. We collected data from fanspages in Facebook, where
could obtain enough large amount of raw data. Each
fanspage has specific theme, it is a platform for online users
to exchange ideas.
We try to solve a problem that the raw data in Facebook
is miscellaneous. We assume condition of our environment:
“we know there are some hot topics in one theme”, because
the goal of our research is resonance-relationship based on
themes and topics. In addition, we need a terminology
database in the coordinate opinion model beforehand, here
we set “photography” as our query text, the terminology
database is obtained from PHOTOGRAPHYTIPS.COM™
[15]. We retrieved data includes theme title, posts,
comments and the corresponding behaviors by each user.
See the example as Figure 2.
Active Cluster
Detection
Coordinate Opinion
Analysis
Behavioral Patten
and
Feedback Analysis
Data Collection
P & UGC
Terminology
Resonating
Network
Figure 1. Overall famework of our model.
Figure 2. Example of fanspage in Facebook.
9Copyright (c) IARIA, 2012. ISBN: 978-1-61208-220-2
CONTENT 2012 : The Fourth International Conference on Creative Content Technologies
17 / 98

B. Active Cluster Detection
After data collection, we proceed to detect active cluster (AC) in a theme. Since there is one kind of people called “flash mob”, which means they just come and appear one time and exit rapidly, they do not attend interactions in at all. Here, we leveraged interactive information to achieve our goal that is finding the potential users.
The challenge is that some users are aggressive to express their views but some users are relative passive to interact, so that we probe the problem for two parts. We assume the users are positivity if they post actively, users just comment or do other actions occasionally passively, so that we think they are relative inactive and they always need someone to lead their opinion. We sought out active users preferentially, and next discovered passive users by setting a threshold. The model is presented as (1), where PT is the function to gather statistics in theme k, surf is the function to calculate attending ratio in topics of theme k, and AC(ui) is the function to determine whether ui active is. We will compute post-times (PT) and visiting ratio (surf) by raw
data. Here, is a Boolean value, then and are
control parameters. We set value 0.5. is equal to m
multiplied by acting times.
))(1()()( surfPTuAC i
C. Coordinate opinion Analysis
In level of opinion orientation analysis, our goal is to
analysis and determine the potential users‟ level of comment
orientation in specific topics. The algorithm is shown as
Figure 3. Firstly, word and phrase are mentioned by a user
in the specific topic then we look them up in the
terminology database. In Figure 3, Line5 to Line8 are
claclulated the factoring value of a specific theme. Line10 is
the process to decide users‟ temporary orientation by words.
SO function is a method of semantic orientation [16]. Then,
we calculate the value of importance weighting for a user by
line13 (Z is set as a normalized factor). Recursively, we
could conclude users‟ personal orientation and levels in
line15. Consequenctly, the user who has strong personal
orientation is regarding as strong concious level to some
topics. We do that algorithm for every posts under a topic
until their orientation in convergence. So that we could
know users‟ conscious orientation in each attending topic.
In the following, we obtained OPL value via the
algorithm in Figure 3, and then compute the coordinate
value between pairwise users by (2). Define ),( ji oo to be 1
if user i and user j belong to the same orientation and zero
otherwise.
),(_ , jijiba oooploplopCo
Figure 3. Algorithm of Level of opinion.
D. Degree of Participation Analysis
In behavioral feedback analysis, we would analyze
different types of behaviors and attending level in some
topics to discover the degree of preferences. (Assume each
user‟s personal behavior patten is changed in different
topics.) Here, we regarded user behaviors as three states. s1
is like button reply or simple text reply; s2 is pure text reply;
s3 is additional remark such as outer link reply. S=[s1,s2,s3].
And each state has a feedback set value.
We analyze each user‟s behavioral patterns in different
topics and themes they attended by (3), which calculates the
maxmum likelihood of behavioral patterns via markov
model (The algorithm is shown in Figure 4.). The
behavioral patterns are regared as behavioral sequences
under one of the topics that user attended, and then we
leverage (4) to calculate the participation score. ziY ,
is represented the probability of user i who has actions
on topic z; mi
TY , is represented the probability of user i who
has actions on post m, T is the length of behavioral sequence.
And it is subject to
end1,2,3,=now123,pre :1>len
(initial) 1,2,3=now0,=pre :1=len
For example, a user do actions (maximum likelihood):
comment it and then click like button, then we know his/her
behavioral sequence is <s2, s1>.
Input: P: post, C: comment, u : user.
w: the words
Th : theme
1. repeat
2. repeat
3. do segmentation;
4. if iw find in terminology Database
5. if (everTalk( u , Th , iw ))
6. iw .value ++;
7. else
8. insert node iw , set value = 1;
9. end if
10. tempOp := SO(iw );
11. until there is no C in P
12. until there is no P
13.
n
i
izvaluewThuIM
0
1 .),( .
14. get user orientation: OP;
15. OPThuIMOPL ),(
10Copyright (c) IARIA, 2012. ISBN: 978-1-61208-220-2
CONTENT 2012 : The Fourth International Conference on Creative Content Technologies
18 / 98

len
mi
TprelenTnowlenT
mi
lenT YsXsXY ,
11
, )]|Pr([
)(AttendS statewBehSeq
AttendS is the score that user i got in topic z. It is represented the score users prefered the topic. According to the personal behavior sequence in a topic, we sum the value of weight of elements, and w is the average value calculating by all actions that people did in the topic.
Figure 4. Algorithm of obtaining behavioral pattern.
E. Resonance-Relationship Netwok
Eventually, we would like to construct a resonating network using the hidden features we analyzed in part C and D. This network is represented as a graph ),( EVG . Each
node indicates an user that has a feature vector to stand for himself/herself. And each edge is the resonance-relationship between users, if the score of resonance-relationship is larger than the threshold, then the edge will be set up. We leverage (5) to compute resonance score between user s and
user t. jw is weight of each feature. We found some
conditions changed according to the whole circumstance, thus we adjust weight value appropriately.
),(
)(
1
1
,tsdist
tsdistw
RS
m
j jj
j
ts
In (5), dist function is to compute the distance between
users and users‟ feature vector.
IV. EXPERIMENT AND CASE STUDY
In this paragraph, we set the experiments based on
Facebook raw data (explained in Environment and Figure
2.). Our preliminary experiments focus on observing active
cluster and acquiring behavioral pattern. Moreover, we find
some worth discussing phenomenon and then explain in
discussion.
A. Experiment Results
The number of attending user and interaction are 83 and 100 in dataset 1. Likewise, the number of attending user and interaction are 175 and 205 in dataset 2.
We query “Photography” to get related themes (fanspages) then obtain hot topics via posts. The difference between dataset1 and dataset2 is the type. This is due to human factors and inherent properties in target platform. When we query target text, lots of related fanspages appear, and how shall we choose? If the type of dataset is cross-theme, it means we may filter some people we don‟t know whether they are important.
We know there is 9.8% active rate in dataset 1 and there is 5.1% active rate in dataset 2 by (1). Here, we set the threshold value 0.2. See TABLE I., we understand the real active cluster is minority. While a dataset is huge, the active cluster is also colossal but manageable. Re-visit indicates how many re-interactions are in whole datasets.
TABLE I. DATASET 1 AND 2.
Active Rate Re-visit(act) Type
Dataset 1 9.8% 13.3% Cross-theme
Dataset 2 5.1% 15.3% Cross-topic
After active cluster detection, we do the algorithm of
behavioral pattern by user generated contents (UGCs). We picked up part of attending users with topics and bsq (behavior sequence) shown in TABLE II. If an user has several bsq in one topic and then we get the maximum likelihood bsq to be his/her behavior pattern. Then we could
use (4) to calculate participation score. We adjust statew
according to the conditions in topic. (An example is in Figure 5.)
TABLE II. PART RESULT OF BEHAVIOR PATTERN IN DATASET 2.
User Topic (multiple posts)
Behavior pattern
Amit Mohod 4 (s1,s2,s1)
Dhruvell Dave 4 (s1,s2,s2)
Kristy Lopp Smith 3 (s1,s1,s2)
Nore Sanada Tozh 3 (s2,s2)
Photography Tips 1,2,4 (s1),(s3),(s2,s3)
Sribha Jain 4 (s2,s2)
Suhasini Gotmare 2,4 (s1),(s2)
Vasu Devan 3 (s2,s2)
Vikram Singh Grewal 4 (s1,s1)
… … …
Behavior Pattern Recognition
Input: ui: user i;
Topic k;
doc(ui , topick) the behavioral record in DB;
pm : post m;
s0,s1,s2,s3,send: define user state;
index, j, g : counter;
1. tr = getRawdata(doc(ui , topick ));
2. While(tr){
3. mes = getContent(pm);
4. while(mes){
5. determineType(pm .mes[index]);
6. }
7. saveTempSeq(ui ,bsq[j++]);
8. len = bsq.length;
9. if(length==1) );Pr( 1
,
1 initialT
mi
T sXY
10. else
11. len
mi
TprelenTnowlenT
mi
lenT YsXsXY ,
11
, )]|Pr([ ;
12. }
13. for(g=1 ; g<=t ; g++){
14. ziY , = Max( mi
TY , );
15. }
16. getPattern();
11Copyright (c) IARIA, 2012. ISBN: 978-1-61208-220-2
CONTENT 2012 : The Fourth International Conference on Creative Content Technologies
19 / 98
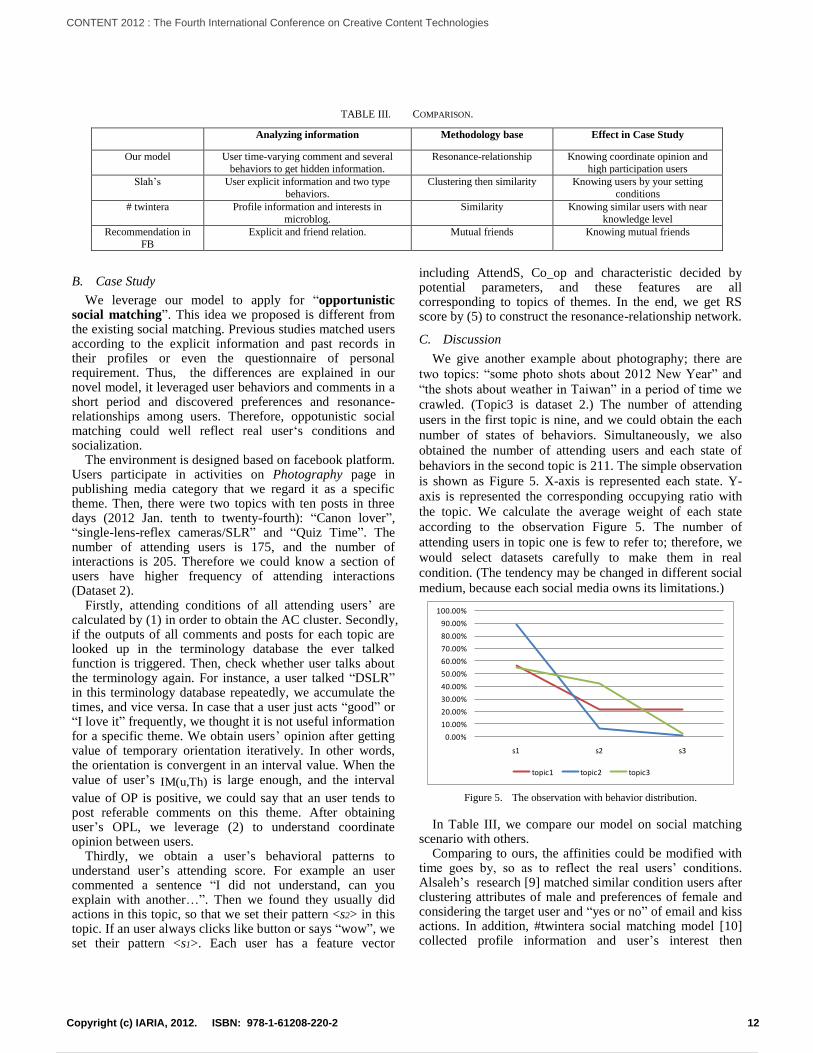
TABLE III. COMPARISON.
Analyzing information Methodology base Effect in Case Study
Our model User time-varying comment and several
behaviors to get hidden information.
Resonance-relationship Knowing coordinate opinion and
high participation users
Slah‟s User explicit information and two type
behaviors.
Clustering then similarity Knowing users by your setting
conditions
# twintera Profile information and interests in
microblog.
Similarity Knowing similar users with near
knowledge level
Recommendation in
FB
Explicit and friend relation. Mutual friends Knowing mutual friends
B. Case Study
We leverage our model to apply for “opportunistic social matching”. This idea we proposed is different from the existing social matching. Previous studies matched users according to the explicit information and past records in their profiles or even the questionnaire of personal requirement. Thus, the differences are explained in our novel model, it leveraged user behaviors and comments in a short period and discovered preferences and resonance-relationships among users. Therefore, oppotunistic social matching could well reflect real user„s conditions and socialization.
The environment is designed based on facebook platform. Users participate in activities on Photography page in publishing media category that we regard it as a specific theme. Then, there were two topics with ten posts in three days (2012 Jan. tenth to twenty-fourth): “Canon lover”, “single-lens-reflex cameras/SLR” and “Quiz Time”. The number of attending users is 175, and the number of interactions is 205. Therefore we could know a section of users have higher frequency of attending interactions (Dataset 2).
Firstly, attending conditions of all attending users‟ are calculated by (1) in order to obtain the AC cluster. Secondly, if the outputs of all comments and posts for each topic are looked up in the terminology database the ever talked function is triggered. Then, check whether user talks about the terminology again. For instance, a user talked “DSLR” in this terminology database repeatedly, we accumulate the times, and vice versa. In case that a user just acts “good” or “I love it” frequently, we thought it is not useful information for a specific theme. We obtain users‟ opinion after getting value of temporary orientation iteratively. In other words, the orientation is convergent in an interval value. When the value of user‟s Th)IM(u, is large enough, and the interval
value of OP is positive, we could say that an user tends to post referable comments on this theme. After obtaining user‟s OPL, we leverage (2) to understand coordinate opinion between users.
Thirdly, we obtain a user‟s behavioral patterns to understand user‟s attending score. For example an user commented a sentence “I did not understand, can you explain with another…”. Then we found they usually did actions in this topic, so that we set their pattern <s2> in this topic. If an user always clicks like button or says “wow”, we set their pattern <s1>. Each user has a feature vector
including AttendS, Co_op and characteristic decided by potential parameters, and these features are all corresponding to topics of themes. In the end, we get RS score by (5) to construct the resonance-relationship network.
C. Discussion
We give another example about photography; there are
two topics: “some photo shots about 2012 New Year” and
“the shots about weather in Taiwan” in a period of time we
crawled. (Topic3 is dataset 2.) The number of attending
users in the first topic is nine, and we could obtain the each
number of states of behaviors. Simultaneously, we also
obtained the number of attending users and each state of
behaviors in the second topic is 211. The simple observation
is shown as Figure 5. X-axis is represented each state. Y-
axis is represented the corresponding occupying ratio with
the topic. We calculate the average weight of each state
according to the observation Figure 5. The number of
attending users in topic one is few to refer to; therefore, we
would select datasets carefully to make them in real
condition. (The tendency may be changed in different social
medium, because each social media owns its limitations.)
0.00%
10.00%
20.00%
30.00%
40.00%
50.00%
60.00%
70.00%
80.00%
90.00%
100.00%
s1 s2 s3
topic1 topic2 topic3
Figure 5. The observation with behavior distribution.
In Table III, we compare our model on social matching scenario with others.
Comparing to ours, the affinities could be modified with time goes by, so as to reflect the real users‟ conditions. Alsaleh‟s research [9] matched similar condition users after clustering attributes of male and preferences of female and considering the target user and “yes or no” of email and kiss actions. In addition, #twintera social matching model [10] collected profile information and user‟s interest then
12Copyright (c) IARIA, 2012. ISBN: 978-1-61208-220-2
CONTENT 2012 : The Fourth International Conference on Creative Content Technologies
20 / 98

proposed knowledge indicators from several aspects by Twitter API. On the contrary, ours analyzed the time-varying hybrid data so the result will be changed according to user‟s interaction in social medium.
In addition, we realized behavioral distribution varies obviously. The distribution is not regular, we know the more trivial and intuitive action the more popular. Of course, it depends on the contents of posts. If the issue of post is suitable for discussion, the state-2 type will become more.
V. CONCLUSION AND PROSPECT
This research mainly proposed and dicussed a novel model and methods. Instead of the conventional methods, which almost analyzed by personal profile information, and then calculate similar interests relationship. In order to solve the problem of inconsistency between subjective opinion and objective fact, and understanding hidden causes, we perceive that people know each others in several factors and not at all by similarity. So that we leverage users‟ interactive data: posts, comments and behaviors to develop our method, instead of static personal profile information (even explicit links). This model is useful to construct resonance-relationship network, we could understand the relationship factoring by some hidden causes. Thus it could be applied to several scenarios such as social matching, marketing. And we expect it will be in favor of future applications development.
ACKNOWLEDGMENT
This work was supported in part by the National Science
Council of Taiwan under grant NSC-97-2221-E-006-144-
MY3 and NSC-100-2221-E-006-251-MY3.
REFERENCES
[1] Gyarmati, L. and T. Trinh, “Measuring user behavior in
online social networks,” Network, IEEE, vol. 24(5), pp. 26-31, 2010.
[2] Wilson, C., Boe, B., Sala, A., Puttaswamy, K.P.N., and Zhao, B.Y., “User interactions in social networks and their implications,” Proceedings of the 4th ACM European
conference on Computer systems, Nuremberg, Germany, 2009, pp. 205-218.
[3] Maia, M., J. Almeida and V. Almeida, “Identifying user behavior in online social networks,” Proceedings of the 1st Workshop on Social Network Systems, Glasgow, Scotland, 2008, pp. 1-6.
[4] Benevenuto, F., Rodrigues, T., Cha, M., and Almeida V., “Characterizing user behavior in online social networks,” Proceedings of the 9th ACM SIGCOMM conference on Internet measurement conference, Chicago, USA, 2009, pp. 49-62.
[5] Concept drift, http://en.wikipedia.org/wiki/Concept_drift, Wikipedia. [retrieved: April, 2012]
[6] Cai, D., Shao, Z. He, X. Yan, X., and Han, J., “Mining hidden community in heterogeneous social networks,” Proccedings on the 3rd international workshop on Link discovery, Chicago 2005, pp. 58-65.
[7] iPartment: http://www.i-part.com.tw/ [retrieved: April, 2012].
[8] RSVP: http://www.rsvp.com.au/ [retrieved: April, 2012].
[9] Alsaleh, S., Nayak, R., Xu, Y., and Chen, L., “Improving matching process in social network using implicit and explicit user information,” Web Technologies and Applications, 2011, pp. 313-320.
[10] Vrabl, S., J. Oliveira, and C.L.R. Motta, “#twintera!: A social matching environment based on microblogging,” Computer Supported Cooperative Work in Design (CSCWD), 15th International Conference on, 2011, pp.556-561.
[11] Hyun-Tae Kim, Jong-Hyun Lee, and Chang Wook Ahn, “A Recommender System based on interactive evolutionary computation with data grouping,” Procedia Computer Science, vol. 3, pp.611-616, 2011.
[12] Modularity, http://en.wikipedia.org/wiki/Modularity_(networks), Wikipedia. [retrieved: May, 2012]
[13] Lu, Z., Yanlong, Wen, Haiwei, Zhang, Ying Zhang, and Xiaojie, Yuan, “User relationship index based on social network community analysis,” Business Management and Electronic Information (BMEI), International Conference on. 2011, vol. 4, pp.66-69.
[14] Facebook: http://www.facebook.com/ [retrieved: May, 2012].
[15] PHOTOGRAPHYTIPS.COM™: http://www.photographytips.com/page.cfm/1587 [retrieved: May, 2012].
[16] Turney, P. and M.L. Littman, “Measuring praise and criticism: Inference of semantic orientation from association,” ACM Transactions on Information System, vol. 21, pp. 315-346, 2003.
13Copyright (c) IARIA, 2012. ISBN: 978-1-61208-220-2
CONTENT 2012 : The Fourth International Conference on Creative Content Technologies
21 / 98

A Document Analysis System for Linking Cross-document Entities
Manabu OhtaOkayama University
3-1-1 Tsushima-naka, Kita-ku, Okayama, [email protected]
Atsuhiro TakasuNational Institute of Informatics
2-1-2 Hitotsubashi, Chiyoda-ku, Tokyo, [email protected]
Abstract—This paper proposes an entity extraction andmatching system for digital documents. Digital documentsusually contain many links to their relevant information, butthey do not cover all the links. Entity extraction and matchingsystems are used to detect such implicit links. They usuallyconsist of several steps such as parsing, dictionary matching,and classification. Some of these steps, however, inevitablycause errors, which must be managed properly so that theprocess of subsequent steps is not degraded. We have thereforebeen developing an entity extraction and matching systemfocusing on managing the errors incurred at each step. Thispaper overviews the system and explains some techniques wehave developed to improve the quality of entity extractionand matching because the system can be a key solution tocontent management for institutional repositories and academicsocieties as well as digital libraries.
Keywords-digital library; information extraction; CRF.
I. INTRODUCTION
Progress in information and communication technologyis changing the style of users when they read documents.Digital documents are augmented with multimedia contentsuch as video and sounds. Texts themselves tend to bedecomposed into small portions and linked to one another asin dictionaries and encyclopedias. Users read such networkeddocuments by following links according to their preferredorder. In other words, documents are organized by readersaccording to their purposes and interests. Hence, their orga-nization differs depending on readers’ contexts.
Traditional documents such as books and articles arealso provided in the same cyberspace with the networkeddocuments. These documents are usually written by a singleauthor or a small group of authors, and readers are expectedto read them according to the authors’ context. The read-ability of traditional documents in cyberspace is improvedby linking them to ones that are related to them like net-worked documents. For example, by linking technical termsappearing in a document to the corresponding dictionarypages on the Internet, readers can check the meaning of theterms efficiently and effectively. Linkages are also especiallyuseful for named entities such as people and places.
Papers on computer science and related research areasoften contain descriptions of software tools such as supportvector machines (SVMs) and conditional random fields(CRFs). If the papers are linked to the download pages of
such software tools, readers can easily repeat similar experi-ments described in the papers. Furthermore, if a system cangive a list of tools providing the same functions along withtheir evaluations such as their processing efficiency, whichhas been reported in various papers, it would help readersto choose proper software tools.
Because documents often contain references, it would beconvenient if we could obtain cited papers without having tosearch for them. Some researchers and publishers are indeedtrying to build systems that provide direct access to citedarticles.
In this paper, we use the term entity for objects to belinked, such as technical terms, software tools, figures, andtables. The two main functions of linking entities are:
• To extract entities and• To match entities with related portions in networked
documents.
Machine learning techniques are often used for bothinformation extraction and matching. Some researchers haveapplied sequence labeling techniques to extract entities. Forexample, Xin et al. proposed that CRFs be applied toextract information from conference home pages [1]. Entityextraction has also been studied as a problem in documentlayout analysis in the pattern recognition community. Nagyet al. proposed a layout analysis system that extractedbibliographic components such as authors and titles fromacademic articles [2] in early studies. Story et al. devel-oped a digital library system for academic articles wherethey extracted various entities from scanned documents [3].Advanced layout analysis techniques have recently beenexamined for extracting information from books [4]. Welink entities after they have been extracted. Various kinds ofmachine learning techniques have also been applied to entitymatching problems [5]. For example, Bilenko et al. appliedapproximate string matching and classification methods tothis problem [6]. Shu et al. proposed the use of latent topicsto improve the accuracy of entity resolution [7].
Because processing errors are unavoidable in these tech-niques, the main concern of our study is how to control thequality of the entity linkages that resulted. The accuracy ofentity linkages is improved by
• Improving the accuracy of all processing modules and
14Copyright (c) IARIA, 2012. ISBN: 978-1-61208-220-2
CONTENT 2012 : The Fourth International Conference on Creative Content Technologies
22 / 98

Figure 1. Outline of entity linkage system.
• Preventing errors from being propagated to succeedingprocesses.
Many researchers have focused on the former, but ourconcerns are on the latter as well as improvements to allmodules.
We occasionally need complex rules and large amountsof training data to acquire accurate extraction and matchingof entities. However, it is very labor-intensive to preparetraining data. Furthermore, if rules become more complex,we need more training data. Therefore, it is importantto reduce the human cost while retaining the quality oflinkages, which is another focal point of our study. Thispaper, therefore, describes our ongoing efforts to develop adocument analysis system with these features.
The rest of this paper is organized as follows. Section IIoverviews the system we are developing. Sections III andIV explain our bibliographic entity extractors for researchpapers and our entity matchers for generating links betweentechnical terms and their corresponding Web content. Sec-tion V summarizes the paper and mentions future work.
II. SYSTEM OVERVIEW
This section overviews our system. As seen in Figure1, it consists of four modules: a layout analyzer, entityextractors, entity matchers, and a database system. The inputof our system is an XML file of OCRed text with boundingrectangles for its characters, words, and lines, as shown inFigure 2. The output of the system is also an XML file whereentities are marked up.
A. Input Data and Layout Analyzer
We handle both scanned document images and PDF files.Given a scanned document, we applied commercial OCRto obtain recognized text and the positions of characters.However, we plan to obtain characters and their positionsalso from PDF with transparent text. The position wasrepresented by a bounding rectangle for each characterlocated on a page. Figure 2 shows part of the fictitiousinput data for the title page given in Figure 3. The bounding
rectangles for lines, words, and characters are tagged by“line”, “word”, and “char”. Attributes “x” and “y” denotethe coordinates of the upper left corner of the boundingrectangle whereas “w” and “h” denote the width and heightof the rectangle.
Words and lines obtained from scanned documents some-times contain errors in layout analysis. For example, twolines in different columns may be incorrectly merged intoone line. Therefore, we applied layout analysis to correcterrors using rules designed for individual journal formats[8].
B. Entity Extractor
Documents contain various kinds of entities such astechnical terms, the names of software tools, figures, andtables. We are developing multiple extractors each of whichis designed for an accurate extraction of each specific entity.We currently have extractors developed for technical termsand bibliographic components that appear in title pages andreference sections. In addition, we plan to develop extractorsfor figures and tables.
Information extraction has been studied in natural lan-guage processing and machine learning communities [9],where only textual information is utilized. Document imageanalysis researchers, on the other hand, have developedvarious methods of layout analysis [10]. We believe that thecombination of these techniques will be effective to improvethe accuracy of extraction for some entities. For example,the font size and spaces around a bounding rectangle areimportant features to extract the article title from the titlepage shown in Figure 3. We discuss the effectiveness ofsuch layout information for entity extraction in Section III.
Another way of improving the accuracy of extraction isto use dictionaries such as authority files. Let us considerthe task of extracting bibliographic components from theacademic papers shown in Figure 3. If we have an authorityfile for authors, this helps us find authors on a title pageby comparing the words that appear on the page with theauthors’ names in the authority file.
We obtain entries for dictionaries by entity extraction. Wecan enrich entries in the dictionary and then increase theaccuracy of extraction by adding them to a correspondingdictionary. The key to enabling this positive feedback is thequality of entity extraction. We are presently trying to solvethis problem with two approaches:
• Manual correction of extraction errors and• Robust extraction against noise in dictionaries.
C. Entity Matcher
The same entity appears in different documents. Forexample, an author’s name appears in multiple papers aswell as on his/her own home page. An entity matcher detectsidentical entities that appear in different documents and linksthem. We need to develop multiple entity matchers each of
15Copyright (c) IARIA, 2012. ISBN: 978-1-61208-220-2
CONTENT 2012 : The Fourth International Conference on Creative Content Technologies
23 / 98

<line x="626" y="752" w="2580" h="83"><word x="626" y="753" w="68" h="77"><char x="626" y="753" w="68" h="77"> A </char></word><word x="720" y="753" w="502" h="82"><char x="720" y="753" w="60" h="81"> D </char><char x="783" y="770" w="55" h="53"> o </char><char x="839" y="770" w="56" h="53"> c </char><char x="898" y="770" w="58" h="56"> u </char><char x="958" y="770" w="67" h="55"> m </char>
....</word>
....</line>
Figure 2. Example of input data.
which is designed for a specific type of entity, as in theentity extractor.
The entity matcher solves the problem with linkingrecords, detecting duplicate records [5], and mining links[11]. The main feature of the entity matcher is its robustnessagainst errors caused by preceding steps. An entity is usuallyrepresented by multiple attributes. For example, a personis represented by his/her names, affiliations, and titles.When entities are matched, we first calculate a similaritymeasure between corresponding attributes, and then integratethe attribute similarity measures into an entity similaritymeasure (e.g., [6]). Finally, we determine the identity ofentities according to their overall similarity. If a documentis obtained through OCR, we need to overcome errors inOCR recognition in addition to notational discrepancies. Weare trying to handle this problem by approximate stringmatching that is learnable [12], [13]. We describe a wayof handling OCR errors in entity matching in Section IV.
D. Database System
The database system provides functions for managingXML files. We are currently designing a system that focuseson two features. First, the database system cooperates withmultiple entity extractors and they are dynamically added,deleted, and modified. As a result, the database systemneeds to manage dynamically updated tags. Some tagsare correlated with one another. For example, one entityextractor detects a person’s name as a single entity, whereasanother detects its name as a combination of its first andlast names. As a result, the database contains tags for fullnames, first names, and last names. The system needs toappropriately correlate these tags with one another.
Not only OCR but also entity extractors and matchersinevitably make errors. To handle the errors in a succeedingprocess, we plan to design a markup system that containsinformation on the quality of data. We are currently consid-ering encoding two kinds of information into the resultingtags: candidates and confidence values. For example, someOCR software tools output candidate characters with confi-dence values and some CRF tools also generate candidate
Figure 3. Title page of this paper.
labels for tokens in a sequence with their confidence values.We plan to encode these kinds of information into the tagsof the resulting XML files.
III. BIBLIOGRAPHIC ENTITY EXTRACTION
We are developing an automatic method of extractingbibliographies from a title page of academic articles scannedwith OCR markup. The method uses CRFs [14] to label seri-ally OCRed text lines in an article’s title page as appropriatebibliographic entity names. Although we achieved excellentextraction accuracies for some Japanese academic journals[15], we needed a substantial amount of training data thathad to be obtained by manually extracting bibliographiesfrom printed documents, which was costly. Therefore, weapplied some active sampling techniques to the CRF-basedextraction of bibliographies to reduce the amount of trainingdata [16]. We achieved favorable experimental results wherea sampling strategy using the proposed criteria to selectsamples could reduce the amount of training data to lessthan half or even a third that for the two journals used inthe experiment. However, later manual correction was stillrequired since extraction errors were unavoidable. Therefore,we also plan to address the problem of detecting suchextraction errors as precisely as possible to minimize costlymanual corrections.
A. Problem Definition
The automatic extraction of bibliographic entities from atitle page of research papers is defined to label each textline on the title page as an appropriate bibliographic entity.Bibliographic entities include titles, authors, abstracts, andwhatever other components we find on the title pages ofresearch papers. Note that a bibliographic entity includes atleast one text line and is often comprised of several lines.
Figure 3 shows a title page of this paper as an exampleof a title page of research papers, which starts with a titlefollowed by authors’ names and affiliations and continues
16Copyright (c) IARIA, 2012. ISBN: 978-1-61208-220-2
CONTENT 2012 : The Fourth International Conference on Creative Content Technologies
24 / 98

with an abstract and keywords. Since the title page inFigure 3 includes a title, authors’ names and affiliations,an abstract, and keywords, we can generate an XML filewhere bibliographic markups for these are inserted into theoriginal XML file.
Our OCR was developed in collaboration with an OCRvendor to analyze page layouts and achieve character recog-nition. Since Japanese articles contain both Japanese andEnglish words, the OCR was equipped with both Japaneseand English OCR engines and it automatically selected oneof them according to the dominant language of the article.The OCR not only produced recognized text for scannedpages, but also XML markups indicating the boundingrectangles for characters, words, lines, and blocks. The targetof bibliography labeling was text lines composed of oneor more words. Moreover, these XML elements had thelayout attributes of x, y, w, and h shown in Figure 2, andwe therefore knew where the text blocks, lines, words, orcharacters were located on the page and how large they were.
B. CRF-based Bibliography Extraction
We adopt a linear-chain CRF to label text lines. Thatis, we define the conditional probability of a label se-quence, y = y1, ..., yn, given an input-token sequence,x = x1, ..., xn as:
p(y | x) = 1
Z(x)exp
{n∑
i=1
K∑k=1
λkfk(yi−1, yi,x)
}, (1)
where Z(x) is the normalization constant, fk(yi−1, yi,x)is an arbitrary feature function, and λk is a learned weightassociated with the feature function, fk.
The CRF assigns the label sequence, y∗, to the given-token sequence, x, that maximizes Eq. (1), i.e
y∗ := argmaxy
p(y | x). (2)
Note that the input-token sequence, x, is the sequence oftext lines, while the label sequence, y, is the sequence ofnames of bibliographic entities such as the title, authors, andabstract.
We prepared ten kinds of labels for the bibliographicentities listed in Table I to extract these from three targetJapanese academic journals. The “type” is that of the articlespecifically defined for one of the journals. We did notextract them all but a subset of the ten bibliographic entitiesfrom articles in a given journal since different journals haveslightly different bibliographic entities on their title pages.
We took into account the line’s location and size, thegap between lines, and the size and number of charactersconstituting each line for visual features used for CRF-based labeling. The visual features reflected the layoutinformation of the title pages. The linguistic features forCRF-based labeling were also important, which reflectedthe textual information of text lines identified through OCR.
Table IBIBLIOGRAPHIC ENTITIES
Bibliographic entity label Descriptionj/e-title Title in Japanese/Englishj/e-authors Authors’ names in Japanese/Englishj/e-abstract Abstract in Japanese/Englishj/e-keywords Keywords in Japanese/Englishtype Article typeother Other text lines
We adopted the proportions of several kinds of characters inthe text lines: alphanumerics, kanji, hiragana, and symbols.We also used the appearance of keywords that seemedto be correlated with specific bibliographic entities, e.g.,“university” was often found in the author’s affiliations. Theexperiments indicated that more than 98% of the biblio-graphic entities were correctly extracted from a Japaneseacademic journal [15]. The experiments also revealed thatboth visual and textual features were indispensable to theCRF-based labeling of bibliographies.
Our CRF-based labeling was applied to another settingto extract bibliographic entities by adaptively changing thegranularity of its target. That is, we applied it to automati-cally extracting author’s names from identified “authors” textlines in scanned academic articles [17]. The experimentalresults indicated that more than 99% of author-name stringswere correctly extracted by using the CRF-based labelingfor characters that constituted the “authors” lines.
C. Active Sampling
We achieved more than 98% accuracy in extracting biblio-graphic entities from a Japanese academic journal; however,we needed 280 articles to train CRF [15]. Therefore, we trieda few active sampling techniques to reduce the amount oftraining data because such data can only be obtained throughmanual labeling of bibliographies, which is costly.
We first proposed two confidence measures for selectingsamples, both of which reflected the confidence of labelingfor thus far manually unlabeled training data [16]. Oneof these was the normalized likelihood obtained throughdividing log (p(y∗ | x)) shown in Eq. (1) by the length ofthe input-token sequence, |x|. We first calculated these con-fidence measures for automatically labeled token sequencesand then ordered them in ascending order on the basis ofthese confidence measures. We manually assigned labelsto the top-ranked token sequences and added them to thetraining data. We then obtained CRF using the enrichedtraining data.
The experiments revealed that both confidence measurescould reduce the amount of training data to less than halfthat in random sampling for two Japanese academic journals.However, we observed no significant improvements for oneJapanese journal where the accuracy of assigning labels wasmuch lower than those for the other two journals. Apartfrom active sampling, we also investigated the effect of
17Copyright (c) IARIA, 2012. ISBN: 978-1-61208-220-2
CONTENT 2012 : The Fourth International Conference on Creative Content Technologies
25 / 98

using pseudo-training data labeled with the current CRFwith high confidence in addition to manually labeled trainingdata. Although we observed improvements for one journalwith the pseudo-training data, there were no significantdifferences in the other two journals, which suggests theneed for further investigations.
D. Future Perspectives
Although the CRF-based labeling of bibliographiesachieved excellent extraction accuracies for some Japanesejournals, extraction errors were inevitable. Therefore, weplan to detect such labeling errors automatically to passthem onto manual labeling. This involves the problem ofbalancing human costs against the quality of extracted bib-liographic entities. We expect that the confidence measuresproposed for active sampling can also be used for detectinglabeling errors since less-confident samples are more likelyto be erroneous than more-confident ones. We also expectthat eliminating some bibliographic label transitions in CRFwill improve labeling accuracy because bibliographic entitieshave syntactic constraints such that the space for authorstypically follows that of the title and is followed by thatof the abstract, although different journals have slightlydifferent syntax.
IV. LINKAGE BETWEEN TERMS AND DOCUMENTS
With more appropriate linkage of digital libraries to Webresources, online-browsing of research papers would bemuch more comfortable since many digital libraries forresearch papers are online and accessible from the Web.Such linkages are accomplished in practice by linking termsthat appear in papers stored in digital libraries with corre-sponding Web content. We implemented a prototype systemto support the online-browsing of research papers by usingthe OCRed text of scanned Japanese academic articles [18].The prototype system extracted technical terms from theOCRed text, and searched Wikipedia and the Web for thebest explanatory descriptions of the terms and for relatedsoftware download pages to generate links to them. We alsoenhanced the prototype system to further use the extractedtechnical terms for recommending papers related to browsedpapers [19]. We achieved excellent accuracies for extractingtechnical terms from research papers and reasonable preci-sion in retrieved Web content such as Wikipedia articles,explanatory Web pages, and related software downloadpages. Moreover, we also attained favorable experimentalresults where the prototype system could recommend morerelevant papers than other methods of recommendation thatwere implemented for comparison.
A. Online-Browsing Support for Research Papers
The proposed browsing support system i) extracted tech-nical terms from XML files with OCR markups, ii) searchedWikipedia and the Web for the extracted terms to generate
links to the retrieved Wikipedia articles and Web pages, andiii) searched the Web for the download pages of softwaretools related to the technical terms to generate links to them.
The technical terms were those whose explanations wouldbe helpful to novice researchers and were extracted fromresearch papers by using a Japanese morphological analyzerand some heuristics [18]. Since we handled OCRed text con-taining recognition errors, we utilized the query correctionfunction of the Yahoo!JAPAN search engine [20], i.e., “Didyou mean: guessed-corrected-term”. This correction was notalways effective especially for short acronyms with variousmeanings. Therefore, it was only applied if there were asmall number of search results for the original term.
1) Matching Technical Terms against Explanatory Con-tent: Once technical terms had been extracted, we searchedWikipedia [21] for explanatory articles on all terms in thefirst place. Since we only retrieved one article whose headexactly matched the extracted technical term, each technicalterm had at most one link to a Wikipedia article. We alsoobtained a summary of the article as a brief explanation ofthe term, and displayed it near the links on our prototypebrowser, as shown in Figure 4.
Although retrieved Wikipedia articles usually providegood explanations of technical terms, such articles are notalways found in Wikipedia and sometimes may be inad-equate. Therefore, we also searched the Web for expla-nations of terms by using the Web search API providedby Yahoo!JAPAN. We first searched the Web for phrasessuch as “technical-term is defined as” in Japanese and thensearched the retrieved Web pages for explanatory sentencesthat matched 23 different explanatory expression templateswe predefined. We extracted the explanatory sentences andtheir two succeeding sentences as explanations of the tech-nical terms. The prototype browser used these sentences asdescriptions of the generated links. The prototype browserindicated at most three links to the explanatory Web pagesfor each technical term (Figure 4).
2) Matching Technical Terms against Software DownloadPages: The download pages of software tools related totechnical terms, say, SVM and CRF, were also consideredto be helpful to readers of research papers. Therefore,we also searched the Web for such download pages. Weused a specifically designed query and some characteristickeywords that often appear on download pages such as“tools”, “software”, and “downloads” to retrieve them. Linksto the software download pages were also displayed on theprototype browser, as shown in Figure 4.
3) Recommendation of Related Papers: We also proposedanother mode to support the online-browsing of researchpapers by further utilizing extracted technical terms. Thatis, we added a function to our prototype browser thatrecommended papers that were related to a paper that wasbrowsed. Concretely, we first generated a bipartite graphthat consisted of papers retrieved by the extracted technical
18Copyright (c) IARIA, 2012. ISBN: 978-1-61208-220-2
CONTENT 2012 : The Fourth International Conference on Creative Content Technologies
26 / 98

Figure 4. Prototype browser showing links to explanatory and softwaredownload pages.
terms, which we called related papers, and technical termsthat appeared in the set of related papers. We then ranked therelated papers using the HITS algorithm [22] to analyze thebipartite graph. The prototype browser recommended top-ranked papers to users, as can be seen in Figure 5.
4) Prototype Browser: Figure 4 has the GUI of theprototype browser we implemented for reading researchpapers. The left window shows major bibliographies suchas the title, authors, an abstract, and keywords. The title andauthors are both in Japanese and English, but the abstractand keywords are only in Japanese because the prototypebrowser is only targeting Japanese papers at present. A paperon a “personalized Web search” has been displayed in theleft window in Figure 4. The right window indicates a link tothe Wikipedia article, three links to explanatory pages, andseveral links to software download pages. Figure 4 illustrateshow these three kinds of links were displayed in the rightwindow when the Japanese term meaning “collaborativefiltering” was selected in the left window.
Figure 5 also shows the GUI of the prototype browser weimplemented revealing a list of recommended papers. Theleft window has the same major bibliographies as those inFigure 4 while the right window has a list of recommendedpapers ranked with our proposed method of recommenda-tion. The same paper as that in Figure 4 is displayed in theleft window of Figure 5, and four recommended papers arevisible in the right window.
B. Future Perspectives
We need to make the extraction of technical terms moresophisticated in the first place for entity extraction. More-over, we plan to extract other useful entities such as figuresand tables from whole papers instead of from only theirtitle pages. We achieved reasonable accuracies for both
Figure 5. Prototype browser showing list of recommended papers [19].
explanatory page searches and software download pagesearches from the perspective of entity matching betweenextracted terms and their corresponding Web content. Wealso consider that matching extracted bibliographic entitiesagainst existing citation databases is worthwhile since suchinformation on links is useful not only as it is but also forrecommending papers [19]. Another focus for future workis to embed the proposed functions into existing documentbrowsers on the basis of our findings with the prototypebrowser.
V. CONCLUSION
This paper overviewed our developing entity extractionand matching system that consists of a layout analyzer,entity extractors, entity matchers, and a database system.This paper also explained the prototypes of our entityextractors and matchers for research papers with somefindings obtained through experiments. Our prototype entityextractor used both layout and textual information in theextraction of bibliographic entities to improve the quality ofextraction. Moreover, it obtained extraction rules with lesshuman cost in labeling by using active sampling techniques.Our prototype entity matcher also obtained reasonable linksbetween technical terms in papers and their correspondingWeb content. We plan to make all parts of the proposedsystem more sophisticated in the future to especially controlerrors propagated from module to module.
ACKNOWLEDGMENT
This work was supported by two JSPS Grants-in-Aidfor Scientific Research (B) (23300040 and 24300097), aJSPS Grant-in-Aid for Young Scientists (B) (23700119), andthe Collaborative Research Program of National Institute ofInformatics.
19Copyright (c) IARIA, 2012. ISBN: 978-1-61208-220-2
CONTENT 2012 : The Fourth International Conference on Creative Content Technologies
27 / 98

REFERENCES
[1] X. Xin, J. Li, J. Tang, and Q. Luo, “Academic confer-ence homepage understanding using constrained hierarchicalconditional random fields,” in Proc. of ACM 17th Conf.on Information and Knowledge Management (CIKM 2008),2008, pp. 1301–1310.
[2] G. Nagy, S. Seth, and M. Viswanathan, “A prototype docu-ment image analysis for technical journals,” IEEE Computer,vol. 25, no. 7, pp. 10–22, 1992.
[3] G. A. Story, L. O’Gorman, D. Fox, L. L. Schaper, and H. V.Jagadish, “The rightpages image-based electronic library foralerting and browsing,” IEEE Computer., vol. 25, no. 9, pp.17–26, 1992.
[4] A. Doucet, G. Kazai, and J.-L. Meunier, “ICDAR 2011 BookStructure Extraction Competition,” in Proc. of 11th Intl. Conf.on Document Analysis and Recognition (ICDAR 2011), 2011,pp. 1501–1505.
[5] A. K. Elmagarmid, P. G. Ipeirotis, and V. S. Verykios, “Dupli-cate record detection: A survey,” IEEE Trans. on Knowledgeand Data Engineering, vol. 19, no. 1, pp. 1–16, 2007.
[6] M. Bilenko and R. J. Mooney, “Adaptive duplicate detectionusing learnable string similarity measures,” in Proc. of ninthACM SIGKDD Intl. Conf. on Knowledge discovery and datamining (KDD 2003), 2003, pp. 39–48.
[7] L. Shu, B. Long, and W. Meng, “A latent topic model forcomplete entity resolution,” in Proc. of 25th Intl. Conf. onData Engineering (ICDE 2009), 2009, pp. 880–891.
[8] A. Takasu, “Information extraction by two dimensionalparser,” in Proc. of 20th IEEE Intl. Conf. on Tools withArtificial Intelligence (ICTAI 2008), 2008, pp. 333–340.
[9] S. Sarawagi, “Information extraction,” Foundations andTrends in Databases, vol. 1, no. 3, pp. 261–377, 2008.
[10] H. Bunke and P. Wang, Eds., Handbook of Character Recog-nition and Document Image Analysis. World Scientific, 1997.
[11] L. Getoor and C. P. Diehl, “Link mining: A survey,” ACMSIGKDD Explorations Newsletter, vol. 7, no. 2, pp. 3–12,2005.
[12] A. Takasu and K. Aihara, “Dvhmm: Variable length textrecognition error model,” in Proc. of 16th Intl. Conf. onPattern Recognition (ICPR 2002), 2002, pp. 110–114.
[13] A. McCallum, K. Bellare, and F. Pereira, “A conditionalrandom field for discriminatively-trained finite-state stringedit distance,” in Proc. of 21st Conf. on Uncertainty in AI(UAI), 2005, pp. 388–395.
[14] J. Lafferty, A. McCallum, and F. Pereira, “Conditional ran-dom fields: Probabilistic models for segmenting and labelingsequence data,” in Proc. of 18th Intl. Conf. on MachineLearning (ICML 2001), 2001, pp. 282–289.
[15] M. Ohta, T. Yakushi, and A. Takasu, “Bibliographic elementextraction from scanned documents using conditional randomfields,” in Proc. of third Intl. Conf. on Digital InformationManagement (ICDIM 2008), 2008, pp. 99–104.
[16] M. Ohta, R. Inoue, and A. Takasu, “Empirical evaluation ofactive sampling for CRF-based analysis of pages,” in Proc. of11th IEEE Intl. Conf. on Information Reuse and Integration(IRI 2010), 2010, pp. 13–18.
[17] M. Ohta and A. Takasu, “CRF-based authors’ name taggingfor scanned documents,” in Proc. of Joint Conf. on DigitalLibraries (JCDL 2008), 2008, pp. 272–275.
[18] M. Ohta, T. Hachiki, and A. Takasu, “Using Web resourcesfor support of online-browsing of research papers,” in Proc. of10th IEEE Intl. Conf. on Information Reuse and Integration(IRI 2009), 2009, pp. 348–353.
[19] ——, “Related paper recommendation to support online-browsing of research papers,” in Proc. of fourth Intl. Conf. onthe Applications of Digital Information and Web Technologies(ICADIWT 2011), 2011, pp. 130–136.
[20] Yahoo!Japan, “Yahoo!Search.” http://search.yahoo.co.jp/[Accessed: 08.05.2012]
[21] Wikipedia, “The Free Encyclopedia.” http://ja.wikipedia.org/[Accessed: 08.05.2012]
[22] J. M. Kleinberg, “Authoritative sources in a hyperlinkedenvironment,” Journal of the ACM, vol. 46, no. 5, pp. 604–632, 1999.
20Copyright (c) IARIA, 2012. ISBN: 978-1-61208-220-2
CONTENT 2012 : The Fourth International Conference on Creative Content Technologies
28 / 98

Open Linked Data in Policy-based Repositories
Chien-Yi Hou School of Information and Library Science University of North Carolina at Chapel Hill
Chapel Hill, United States [email protected]
Richard Marciano School of Information and Library Science University of North Carolina at Chapel Hill
Chapel Hill, United States [email protected]
Abstract—Since the creation of the World Wide Web and the emergence of search engines, the web has become the major media for researchers to explore and share data. In 2009, Berners-Lee started a movement to encourage researchers to put their data on the web. He wanted researchers to open and link their data to the public to increase the use and reuse of content. However, the lack of proper mechanisms to assist researchers publishing data on the web has prevented them from effective sharing. We create mechanisms to help researchers open and link their data using the integrated Rule-Oriented Data System, iRODS. iRODS is a data grid software that has been widely used to manage research data in large-scale European, American, and Asian national research projects, such as at the "Bibliothèque Nationale de France". iRODS comes with a business rule engine which allows researchers to create rules to manage and process data. In this paper, we show how to configure iRODS rules to transmit and open linked data in a distributed data cloud setting.
Keywords-linked data; policy-based data management.
I. INTRODUCTION Publishing research results on the web has become the
most common approach for researchers to share their research findings because with robust search engines, everything you put on the web gets revealed to the world automatically. That is not necessarily the case though for the data that researchers use to analyze and eventually link to their publications. These data are usually not available after experiments are conducted and might not get retained. The main reason is that these data are stored in digital repositories that are not exposed to the web. In Berners-Lee’s TED talk [1] in 2009, he advocated the idea of sharing “raw data now”. He encouraged researchers to share not only the study results but also the data to produce the study results. The technology created to support this idea is Linked Data [2]. Linked Data provides the mechanism for researchers to create associations between data or information and other related data or information. It creates the relationships between data and information. It helps aggregate data and information together. Researchers could do a “one-stop shop” to find all the relevant data if they were linked together.
Sharing raw data with the public is an important idea to bring data to life. The same dataset might be used across multiple disciplines and reveal interesting or even unexpected findings. However, the last thing researchers
want to do is further burden their daily research. Opening and linking one’s data should be so easy and seamless that one almost forgets its existence! In this paper, we would like to show how to automate this process by using policy-based data management software to manage and publish data. The goal is to fit data sharing processes into one’s data management cycle seamlessly. In the 2nd section, we will introduce the data grid software used in this paper and discuss how researchers are using it. In the 3rd section, we will show you how to open Linked Data by using rules. In the conclusion, we will discuss our findings and next steps.
II. POLICY-BASED DATA MANAGEMENT The last four years or so have seen the emergence of
policy-aware infrastructure. New collaboratives have emerged with a focus on distributed preservation frameworks that are driven by community-based management policies, comprising auditing, replication of content, automatic extraction and association of metadata, validation of checksums, format migration, and trustworthiness. Policies are typically rules describing actions that take place in repositories. This trend was highlighted in the 2008 Communications of the ACM Magazine [3], where the need for repositories to incorporate mechanisms that implement and automate policies and regulations was identified. Emerging data cyber-infrastructure management environments and systems include well-known and widely-used systems such as LOCKSS, DSpace, Fedora, and iRODS.
The iRODS approach we focus on and discuss in greater detail in this section, supports the notion of extensibility with a scalable rule-based engine, allowing the registration of new server-side distributed user-defined workflows.
A. iRODS Overview iRODS [4], the Integrated Rule-Oriented Data System, is
a community-driven, open source, data grid software that aims to help researchers manage large sets of data. iRODS has been used widely by scientists to manage data in large-scale European, American, and Asian national research projects. It is also used as a distributed file system to manage and share data across different locations. Researchers will
21Copyright (c) IARIA, 2012. ISBN: 978-1-61208-220-2
CONTENT 2012 : The Fourth International Conference on Creative Content Technologies
29 / 98

need to have accounts in order to access data stored in iRODS.
B. iRODS Rules The rule engine inside iRODS gives researchers the
capability to specify their data management policies within iRODS. The basic components of an iRODS rule are hooks, conditions, actions, and recovery actions. iRODS hooks are operations that happen during the data manipulation process. There are over 70 hooks now in existence. For example, a hook named acPostProcForPut will be triggered after you upload a file. When the rule is triggered, the rule engine will check the conditions of that rule. If the conditions are satisfied, the actions in the rule will be executed. The action could be a single procedure or a chain of procedures. If the actions somehow fail, recovery actions can be executed if specified.
iRODS rules could be executed at three different modes: (1) immediate execution, (2) delayed execution, and (3) periodic execution. For example, you can specify a rule that sends you an email immediately or three minutes after a file is deleted. You also can run a rule every month to verify the integrity of your data. iRODS provides flexible rule design principles and many hooks that span the data management lifecycle. These features provide the opportunity to plug data sharing processes into researchers’ data management processes.
C. iRODS Metadata In order to make Linked Data more useful, it is essential
to provide rich information to describe the data, e.g., who the creator of these data is and what these data are about. iRODS provides the capability to create metadata to describe an individual object, a collection, a user account, or even a resource that is used to store the data. You can define your own metadata as AVU (Attribute, Value, Unit) triplets to describe your “subjects”. The capability to ingest metadata into iRODS is very useful when we need to extract information to create relationships for Linked Data.
D. iRODS Use Cases Because of the flexibility to design policies for your own
digital repository, iRODS has been used in many research projects. Hedges [5] implements preservation policies on iRODS to manage research data. The SHAMAN project [6] also uses iRODS to design polices for preservation. Walling and Esteva [7] integrate their procedures into iRODS to automate the metadata extraction process while ingesting data. The PoDRI project [8] uses iRODS policies to manage the interoperability between Fedora, Flexible Extensible Digital Object Repository Architecture, and iRODS. Integrating open Linked Data processes with iRODS data management is a new idea.
III. OPEN AND LINKED DATA BY POLICIES Data grids have been used in international research
projects [9][10] to manage large-scale data, but sharing data is mainly restricted within projects or groups. Researchers usually only share their research results with the public as
publications but not as raw data. These raw data are invisible to web crawlers and search engines. In order to make these raw data accessible and usable by the general public, we need a mechanism to publish data to the web and automate the open Linked Data process in researchers’ daily data management.
iRODS provides researchers the flexibility to incorporate policies and procedures as iRODS rules into their data management routine. This feature gives them the opportunity to integrate data publishing processes with data management processes. The process to publish Linked Data will be triggered automatically without further actions after initially setting it up and thus it becomes part of the data management process. The content to be published as Linked Data is data already stored in iRODS or data that will be ingested into iRODS. First of all, we need to define the actions to trigger the “publish Linked Data” procedure. Let us assume we only publish the data when the data is opened to the “public”, then data will be opened when the file’s access permission is set to “public”. “Public” access permission here means that anonymous users have read permission to the data. This kind of situation could take place in a couple of different scenarios. The first one is when the file’s access permission is being changed to “public”. The second scenario is when data are ingested to a directory with public access permission. Below are the two open linked data usage scenarios:
• Scenario 1 (Figure 1.): After researchers change the
access permission, a rule named acPostProcForModifyAccessControl will be triggered. We add a condition to check the access permission. If the permission is set to “public”, the rule will initiate the “publish Linked Data” procedure. There should also be corresponding rules to check the permission while researchers remove the public access permission, a “close” Linked Data procedure would need to be called to remove the link from the web.
• Scenario 2 (Figure 2.): A rule named acPostProcForPut will be triggered every time researchers upload a file to iRODS. If the access permission of the target directory is set to “public”, then the access permission of the uploaded file will be “public” as well. In this case the “publish Linked Data” procedure will be called to publish data to the web.
Figure 1. Open linked data scenario 1
22Copyright (c) IARIA, 2012. ISBN: 978-1-61208-220-2
CONTENT 2012 : The Fourth International Conference on Creative Content Technologies
30 / 98

Figure 2. Open linked data scenario 2
According to Bizer [11], there are three basic steps to
publish a dataset as Linked Data on the Web. They are: (1) assigning URIs to the entities, (2) setting RDF links to other data sources on the Web, and (3) providing metadata about published data. In order to fulfill these three steps, researchers will need to provide enough information to describe their data. The information will be stored as iRODS user-defined metadata and will be used by the “Publish Linked Data” process in Figure 1 and Figure 2. The advantage of storing this information as user-defined metadata is the flexibility to link data based on user-defined metadata. Different datasets might link to different data sources on the web. iRODS also provides a unique iRODS URI to each individual object that could be used to access to the object. Researchers will use the published Linked Data information to reveal the data’s existence and use the iRODS URI to get the data. Data will be stored in iRODS where we will apply other management policies like integrity checking. The details of how the “Publish Linked Data” process works will be included in future work.
IV. CONCLUSION AND NEXT STEPS We have demonstrated some simple usage scenarios on
how to publish Linked Data using policy-based data management software, but there are still many factors that we need to consider when dealing with more complex data. For example, data that require IRB (institutional review board) approvals might need some pre-processing to remove the personal identities or ask other researchers to obtain similar IRB approvals. Policies to avoid accidently violating the privacy of data will need to be defined.
Our next step is to identify required information to describe data in order for it to be published. Different types of data will have different requirements to create relationships, but we would like to find a general set of information that could be used to describe most of the data and create linkages. Additional information could be considered as add-on but is not necessary.
Opening research data to the public is becoming popular and it is an important approach to get the best out of the investments that are used to generate or acquire these data. The technology of Open Linked Data provides researchers a mechanism to share data. By using Policy-based Data Management systems, we will be able to build policies within the system to help researchers publish Linked Data to
the web. This approach could encourage researchers to share more raw data because the sharing procedure has been built into data management process and could be modified by researchers when needed. It has the potential to save a lot of effort, encourage the reuse of research data, and open up the field of study.
ACKNOWLEDGEMENTS This work is supported by a Research and Demonstration grant from the Institute of Museum and Library Services, (IMLS LG-06-09-0184-09) “Policy-Driven Repository Interoperability.
REFERENCES [1] Berners-Lee, T. (2009) on the next Web, TED talks,
2009(Feb). http://www.ted.com/talks/tim_berners_lee_on_the_next_web.html
[2] Bizer, C., Heath, T., Idehen, K., and Berners-Lee, T. (2008). Linked data on the web (LDOW2008). Proceeding of the 17th International Conference on World Wide Web WWW 08, 2008 (September), 1265. ACM Press.
[3] Berman, F., Got Data? A Guide to Data Preservation in the Information Age, Francine Berman, Communications of the ACM, December 2008, Vol. 51, No. 12, pp. 50-56, http://mags.acm.org/communications/200812/
[4] Rajasekar, A., Moore, R., Hou, C.-Y., Lee, C. A., Marciano, R., De Torcy, A., Wan, M., et al. (2010). iRODS Primer: Integrated Rule-Oriented Data System. Synthesis Lectures on Information Concepts Retrieval and Services (Vol. 2, pp. 1-143).
[5] Hedges, M., Hasan, A., and Blanke, T. (2007). Management and preservation of research data with iRODS. Proceedings of the ACM first workshop on CyberInfrastructure information management in eScience CIMS 07 (pp. 17-22). ACM.
[6] Innocenti, P., Ross, S., Elena, M., Wilson, T., Ludwig, J., and Pempe, W. (2009). Assessing digital preservation frameworks: the approach of the SHAMAN project. MEDES 09 Proceedings of the International Conference on Management of Emergent Digital EcoSystems.
[7] Walling, D., and Esteva, M. (2011). Automating the Extraction of Metadata from Archaeological Data Using iRods Rules. International Journal of Digital Curation, 6(2), 253-264.
[8] Pcolar, D., Davis, D. W., Zhu, B., Chassanoff, A., Hou, C. Y., and Marciano, R. (2010). Conceptualizing Policy-Driven Repository Interoperability (PoDRI) Using iRODS and Fedora. Information Sciences, 25. Morgan and Claypool Publishers.
[9] Hoschek, W., Jaen-martinez, J., Samar, A., Stockinger, H., and Stockinger, K. (2000). Data Management in an International Data Grid Project. (R. Buyya and M. Baker, Eds.) Manager, 1971, 77-90. Springer-Verlag.
[10] Johnston, W. E. (2002). Computational and data Grids in large-scale science and engineering. Future Generation Computer Systems, 18(8), 1085-1100.
[11] Bizer, C., Heath, T., and Berners-Lee, T. (2009). Linked Data - The Story So Far. (T Heath, M. Hepp, and C Bizer, Eds.) International Journal on Semantic Web and Information Systems, 5(3), 1-22. Elsevier.
23Copyright (c) IARIA, 2012. ISBN: 978-1-61208-220-2
CONTENT 2012 : The Fourth International Conference on Creative Content Technologies
31 / 98

Multicast Group Management for Users ofHeterogeneous Wireless Networks
Svetlana Boudko and Wolfgang LeisterNorsk Regnesentral, Oslo, Norway
Email: {svetlana.boudko, wolfgang.leister}@nr.no
Stein GjessingUniversity of Oslo, Norway
Email: [email protected]
Abstract—Today mobile devices are typically equipped withmultiple access network interfaces. Another important issueis a coexistence of heterogeneous wireless access networks.The selection of optimal serving mobile networks for multicaststreams is a challenging problem. We consider a network selectionproblem for multicast groups of mobile clients that operate in aheterogeneous wireless access network environment. We identifyseveral decision makers solving this problem and present ourview on what kind of information is needed to be exchangedbetween these decision markers.
Index Terms—Wireless networking, mobile network selection,decentralized algorithms.
I. INTRODUCTION
The increasing market of mobile devices and mobile ser-vices, as well as availability of various wireless networktechnologies challenge resource limitations of wireless accessnetworks. According to Cisco [1], global mobile data trafficgrew 2.3-fold in 2011, more than doubling for the fourthyear in a row. It confirms the previous Cisco forecasts from2010 and 2011 and it is expected that mobile data trafficwill double again in 2012. Mobile video traffic, the qualityof which is particularly sensitive to network conditions, was52% of the total traffic by the end of 2011. The number ofmobile-connected tablets tripled to 34 million in 2011, andeach tablet generated 3.4 times more traffic than the averagesmartphone. It is expected that mobile-connected tablets willgenerate almost as much traffic in 2016 as the entire globalmobile network in 2012. In 2016, 4G will be 6 percentof connections covering 36 percent of total traffic. Monthlyglobal mobile data traffic will surpass 10 exabytes in 2016.This growth poses extra challenges both on mobile networkresources and on resources of the backhaul infrastructure thatconnects a mobile network to the backbone Internet. Thisrequires rethinking of how the data is delivered to the users.
Multicast is an efficient method for point-to-multipointcommunications and reduces drastically the usage of networkresources when the same content is sent to a large group ofusers. Different types of applications like video conferencing,file distribution, live multimedia streaming can benefit fromdeploying multicast networking. However, the well-knowncomplexity of managing multicast makes the deployment ofmulticast even more challenging in wireless environmentswhen mobility issues have to be considered. In this paper,we consider a solution for network selection problem for
heterogeneous mobile networking as a part of multicast groupmanagement.
The remainder of the paper is organized as follows. Afterpresenting an overview of related work in Section II, wediscuss a representative scenario in Section III. We presentthe problem formulation and outline a suitable algorithm inSection IV, before concluding and discussing future work inSection V.
II. RELATED WORK
To the best of our knowledge, the research field concerningselection of a network in heterogeneous wireless networksfrom a perspective of multicast delivery is not well exploited.Most of the previous works for mobile multicast focus on op-timal multicast tree construction in multihop ad hoc networks[2–5].
Ormond and Murphy [6] propose a network selection ap-proach that uses a number of possible utility functions. Thesolution is user-centric and an interplay between different usersand networks is not considered; neither is a multicast scenario.Ormond and Murphy conclude that the impact of multipleusers operating in the same region need to be further examined.
Gluhak et al. [7] consider the problem of selecting theoptimal bearer paths for multicast services with groups ofheterogeneous receivers. The proposed algorithm selects thebearer path based on different optimization goals. However,Gluhak et al. address the problem only for the ideal staticmulticast case without taking into account users crossingdifferent cells. In their work, multicast membership does notchange during the duration of a service, and multicast groupsare not built with consideration of users’ movements. In ouropinion, this is not a realistic case for wireless networks.
Yang and Chen [8] propose a bandwidth-efficient multicastalgorithm for heterogeneous wireless networks that is formu-lated as an Integer Linear Programming problem that is solvedusing Lagrangian relaxation. The algorithm deals only withconstructing optimal shortest path trees for multicast groups.In this approach, important parameters such as cost of service,user’s velocity, etc. are not considered.
Jang et al. [9] present a mechanism for efficient networkresource usage in a mobile multicast scenario. This mechanismis developed for heterogeneous networks and implements net-work selection based on network and terminal characteristicsand QoS. However, in the proposed mechanism, the network
24Copyright (c) IARIA, 2012. ISBN: 978-1-61208-220-2
CONTENT 2012 : The Fourth International Conference on Creative Content Technologies
32 / 98

Figure 1. Multicast streaming scenario for a group of mobile clients servedby several mobile networks before regrouping.
Figure 2. Multicast streaming scenario for a group of mobile clients servedby several mobile networks after regrouping.
selection is performed purely based on terminal’s preferences,the network perspective is not considered, and the solutiondoes not optimize the utilization of network resources.
In our analysis, we recognize that the authors have notaddressed several important aspects related to the networkselection for mobile multicast groups. We need to study howthe users’ movements influence the optimality of buildingmulticast groups and how the information needed for networkselection is exchanged between the decision makers. Wethink that it is also important to consider how the signalinginfrastructure is built.
III. SCENARIO
To illustrate the yet unsolved challenges for optimal networkselection in multicast networks, we consider a multimediastreaming scenario for a group of mobile users that concur-rently receive the same content from the Internet. We assume
that a backbone proxy server (BPS) is placed at the networkedge. The BPS is a member of a content distribution system(CDN). This scenario is an extension of a scenario that wepreviously have considered to illustrate an adaptive multimediastreaming architecture to mobile nodes [10].
The BPS streams the content that either is hosted on theserver, or resends the streaming content as a part of applicationlayer multicast. The users of this network are located inan area with a substantial overlap in coverage of severalmobile networks, and are connected to different networks.The base stations of the system have multicast capabilities,implementing, for example, Multimedia Broadcast MulticastService [11]. A representative scenario of such networking isillustrated in Figure 1.
In our scenario, the mobile terminals are capable to connectto several access networks, and vertical handoffs between thesenetworks are technically possible. Further, we assume thatthese terminals are equipped with GPS receivers, so that theirlocation information can be transmitted to the BPS. The BPScan use this information to determine how the users can beregrouped in multicast groups. Such regrouping is beneficialas it saves network resources. Hence, the users that get thesame content can exploit the same wireless link because thecontent can be broadcasted to them. The resources in thebackhaul network are also better utilized because the contentis now delivered only to one mobile network instead of beingspread to several networks. An example of such regrouping isdepicted in Figure 2.
Technically, to facilitate such a mechanism, the user ter-minals will have the possibility to switch to other mobilenetworks after receiving certain messages from the BPS. Sinceusers may have different preferences depending on diversecriteria, for example, power consumption, security, networkcost of service, etc., the interplay between the users’ utilitiesand the networks’ utilities is important to consider.
IV. PROBLEM FORMULATION
In this section, we formalize the scenario discussed inSection III.
A. System Model
We consider a set of networks N = 1, 2, . . . , n, a setof mobile nodes M = 1, 2, . . . ,m and a set of streamingsessions S = 1, 2, . . . , s. Each session sk is served to morethan one mobile node mj . Therefore, using multicast for datadissemination is beneficial. For each node mj and networkni, the following is defined: streaming bitrate requirementsof mobile nodes are denoted by rj ; rssi,j is the receivedsignal strength in network ni for terminal mj , while powerconsumption and the cost of service in network ni for node mj
are denoted by pi,j and ci,j , respectively. Location informationfor node mj is denoted by lj For each node mj , we define auser preference profile that is described by a tuple containingThp
i,j , Thci,j , and Thrss
i,j . These denote thresholds or userpreferences, for, respectively, power consumption, cost ofservice and received signal strength. We define a time period
25Copyright (c) IARIA, 2012. ISBN: 978-1-61208-220-2
CONTENT 2012 : The Fourth International Conference on Creative Content Technologies
33 / 98
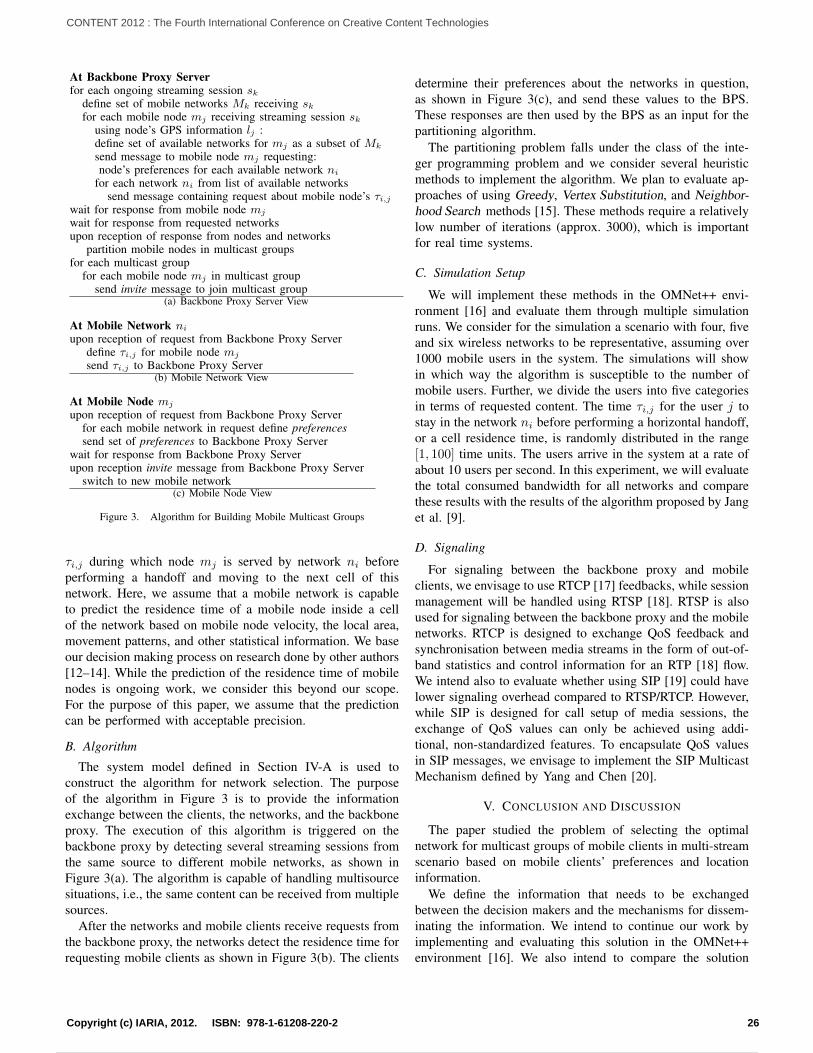
At Backbone Proxy Serverfor each ongoing streaming session sk
define set of mobile networks Mk receiving sk
for each mobile node mj receiving streaming session sk
using node’s GPS information lj :define set of available networks for mj as a subset of Mk
send message to mobile node mj requesting:node’s preferences for each available network ni
for each network ni from list of available networkssend message containing request about mobile node’s τi,j
wait for response from mobile node mj
wait for response from requested networksupon reception of response from nodes and networks
partition mobile nodes in multicast groupsfor each multicast group
for each mobile node mj in multicast groupsend invite message to join multicast group
(a) Backbone Proxy Server View
At Mobile Network ni
upon reception of request from Backbone Proxy Serverdefine τi,j for mobile node mj
send τi,j to Backbone Proxy Server(b) Mobile Network View
At Mobile Node mj
upon reception of request from Backbone Proxy Serverfor each mobile network in request define preferencessend set of preferences to Backbone Proxy Server
wait for response from Backbone Proxy Serverupon reception invite message from Backbone Proxy Server
switch to new mobile network(c) Mobile Node View
Figure 3. Algorithm for Building Mobile Multicast Groups
τi,j during which node mj is served by network ni beforeperforming a handoff and moving to the next cell of thisnetwork. Here, we assume that a mobile network is capableto predict the residence time of a mobile node inside a cellof the network based on mobile node velocity, the local area,movement patterns, and other statistical information. We baseour decision making process on research done by other authors[12–14]. While the prediction of the residence time of mobilenodes is ongoing work, we consider this beyond our scope.For the purpose of this paper, we assume that the predictioncan be performed with acceptable precision.
B. Algorithm
The system model defined in Section IV-A is used toconstruct the algorithm for network selection. The purposeof the algorithm in Figure 3 is to provide the informationexchange between the clients, the networks, and the backboneproxy. The execution of this algorithm is triggered on thebackbone proxy by detecting several streaming sessions fromthe same source to different mobile networks, as shown inFigure 3(a). The algorithm is capable of handling multisourcesituations, i.e., the same content can be received from multiplesources.
After the networks and mobile clients receive requests fromthe backbone proxy, the networks detect the residence time forrequesting mobile clients as shown in Figure 3(b). The clients
determine their preferences about the networks in question,as shown in Figure 3(c), and send these values to the BPS.These responses are then used by the BPS as an input for thepartitioning algorithm.
The partitioning problem falls under the class of the inte-ger programming problem and we consider several heuristicmethods to implement the algorithm. We plan to evaluate ap-proaches of using Greedy, Vertex Substitution, and Neighbor-hood Search methods [15]. These methods require a relativelylow number of iterations (approx. 3000), which is importantfor real time systems.
C. Simulation Setup
We will implement these methods in the OMNet++ envi-ronment [16] and evaluate them through multiple simulationruns. We consider for the simulation a scenario with four, fiveand six wireless networks to be representative, assuming over1000 mobile users in the system. The simulations will showin which way the algorithm is susceptible to the number ofmobile users. Further, we divide the users into five categoriesin terms of requested content. The time τi,j for the user j tostay in the network ni before performing a horizontal handoff,or a cell residence time, is randomly distributed in the range[1, 100] time units. The users arrive in the system at a rate ofabout 10 users per second. In this experiment, we will evaluatethe total consumed bandwidth for all networks and comparethese results with the results of the algorithm proposed by Janget al. [9].
D. Signaling
For signaling between the backbone proxy and mobileclients, we envisage to use RTCP [17] feedbacks, while sessionmanagement will be handled using RTSP [18]. RTSP is alsoused for signaling between the backbone proxy and the mobilenetworks. RTCP is designed to exchange QoS feedback andsynchronisation between media streams in the form of out-of-band statistics and control information for an RTP [18] flow.We intend also to evaluate whether using SIP [19] could havelower signaling overhead compared to RTSP/RTCP. However,while SIP is designed for call setup of media sessions, theexchange of QoS values can only be achieved using addi-tional, non-standardized features. To encapsulate QoS valuesin SIP messages, we envisage to implement the SIP MulticastMechanism defined by Yang and Chen [20].
V. CONCLUSION AND DISCUSSION
The paper studied the problem of selecting the optimalnetwork for multicast groups of mobile clients in multi-streamscenario based on mobile clients’ preferences and locationinformation.
We define the information that needs to be exchangedbetween the decision makers and the mechanisms for dissem-inating the information. We intend to continue our work byimplementing and evaluating this solution in the OMNet++environment [16]. We also intend to compare the solution
26Copyright (c) IARIA, 2012. ISBN: 978-1-61208-220-2
CONTENT 2012 : The Fourth International Conference on Creative Content Technologies
34 / 98

with the work proposed by Jang et al. [9] that was previouslydiscussed in Section II.
In this paper, we considered one backbone proxy serverthat also operates as a central decision maker for initiat-ing the network selection operation. However, it is highlyprobable that different edge servers can be used as proxiesfor different mobile access networks even if these networksoverlap geographically. It is, therefore, important to definemechanisms that are capable of functioning in a decentralizedway. Also, we need careful security considerations related tousers’ location information that becomes available to severalentities of the system.
VI. ACKNOWLEDGMENT
The work described in this paper has been conducted as apart of the ADIMUS (Adaptive Internet Multimedia Stream-ing) project which is funded by the NORDUnet-3 programme.
REFERENCES
[1] Cisco, “Cisco visual networking index: Global mobiledata traffic forecast update, 2011-2016,” 2012.
[2] M. Gerla, C.-C. Chiang, and L. Zhang, “Tree multicaststrategies in mobile, multishop wireless networks,” Mob.Netw. Appl., vol. 4, no. 3, pp. 193–207, Oct. 1999.
[3] C.-C. Chiang, M. Gerla, and L. Zhang, “Forwardinggroup multicast protocol (FGMP) for multihop, mobilewireless networks,” Cluster Computing, vol. 1, no. 2, pp.187–196, Apr. 1998.
[4] J. G. Jetcheva, “Adaptive demand-driven multicast rout-ing in multi-hop wireless ad hoc networks,” Ph.D. disser-tation, Carnegie Mellon University, Pittsburgh, PA, USA,2004.
[5] J. Yuan, Z. Li, W. Yu, and B. Li, “A cross-layer optimiza-tion framework for multihop multicast in wireless meshnetworks,” Selected Areas in Communications, IEEEJournal on, vol. 24, no. 11, pp. 2092 –2103, nov. 2006.
[6] O. Ormond and J. Murphy, “Utility-based intelligentnetwork selection,” in In Proceedings of the IEEE In-ternational Conference on Communications, 2006.
[7] A. Gluhak, K. Chew, K. Moessner, and R. Tafazolli,“Multicast bearer selection in heterogeneous wirelessnetworks,” in IEEE Int’l Conf. on Communications, ICC2005, vol. 2, may 2005, pp. 1372–1377.
[8] D.-N. Yang and M.-S. Chen, “Efficient resource allo-cation for wireless multicast,” IEEE Transactions onMobile Computing, vol. 7, no. 4, pp. 387–400, Apr. 2008.
[9] I.-S. Jang, W.-T. Kim, J.-M. Park, and Y.-J. Park, “Mobilemulticast mechanism based mih for efficient networkresource usage in heterogeneous networks,” in Proc.
of the 12th Int’l Conf. on Advanced CommunicationTechnology, ser. ICACT’10, 2010, pp. 850–854.
[10] W. Leister, T. Sutinen, S. Boudko, I. Marsh, C. Griwodz,and P. Halvorsen, “An architecture for adaptive multime-dia streaming to mobile nodes,” in MoMM ’08: Proceed-ings of the 6th International Conference on Advances inMobile Computing and Multimedia. ACM, 2008, pp.313–316.
[11] G. Xylomenos, V. Vogkas, and G. Thanos, “The multi-media broadcast/multicast service,” Wireless Communi-cations and Mobile Computing, vol. 8, no. 2, pp. 255–265, 2008.
[12] B. Liang and Z. J. Haas, “Predictive distance-based mo-bility management for multidimensional PCS networks,”IEEE/ACM Trans. Netw., vol. 11, no. 5, pp. 718–732,Oct. 2003.
[13] I. Akyildiz, J. S. Ho, and Y.-B. Lin, “Movement-basedlocation update and selective paging for PCS networks,”IEEE/ACM Trans. Netw, vol. 4, no. 4, 1996.
[14] G. Yavas, D. Katsaros, O. Ulusoy, and Y. Manolopou-los, “A data mining approach for location prediction inmobile environments,” Data Knowl. Eng., vol. 54, pp.121–146, August 2005.
[15] M. S. Daskin, Network and Discrete Location: Models,Algorithms, and Applications. New Jork, USA: Wiley-Interscience, 1995.
[16] G. Pongor, “Omnet: Objective modular network testbed,”in MASCOTS ’93: Proc. Int’l Workshop on Modeling,Analysis, and Simulation on Computer and Telecommuni-cation Systems. Society for Computer Simulation, 1993,pp. 323–326.
[17] H. Schulzrinne, A. Rao, and R. Lanphier, “Real TimeStreaming Protocol (RTSP),” RFC 2326 (ProposedStandard), Apr. 1998. [Online]. Available: http://www.ietf.org/rfc/rfc2326.txt
[18] H. Schulzrinne, S. Casner, R. Frederick, and V. Jacobson,“RTP: A Transport Protocol for Real-Time Applications,”RFC 3550 (Standard), Jul. 2003. [Online]. Available:http://www.ietf.org/rfc/rfc3550.txt
[19] J. Rosenberg, H. Schulzrinne, G. Camarillo, A. Johnston,J. Peterson, R. Sparks, M. Handley, and E. Schooler,“SIP: Session Initiation Protocol,” RFC 3261 (ProposedStandard), Jun. 2002, updated by RFCs 3265, 3853,4320, 4916. [Online]. Available: http://www.ietf.org/rfc/rfc3261.txt
[20] S.-R. Yang and W.-T. Chen, “Sip multicast-based mo-bile quality-of-service support over heterogeneous ipmultimedia subsystems,” IEEE Transactions on MobileComputing, vol. 7, no. 11, pp. 1297–1310, Nov. 2008.
27Copyright (c) IARIA, 2012. ISBN: 978-1-61208-220-2
CONTENT 2012 : The Fourth International Conference on Creative Content Technologies
35 / 98

Designing Template-based Page Generator: A Case of Mobile Pad
Tse-Ming Tsai1,2, Shih-Chun Chou1, Bo-Fu Liu1, Yuting Lin1, Seng-Cho T. Chou2 1The Innovative DigiTech-Enabled Applications & Services Institute, Institute of Information Industry
Taipei, Taiwan 2Department of Information Management, National Taiwan University
Taipei, Taiwan
{eric; benchou; bofuliu; ytlin}@iii.org.tw; [email protected]
Abstract—The importance of web application and advanced
technology has attracted increasing attention as among the
concerns of individuals such as designers, traditional media
publishers, ad agencies, and companies of all sizes in order to
create, distribute, monetize, and optimize engaging content and
publications for mobile pad. Pages that are often used for
collecting and disseminating information are natural bases in
publications. The current study presents a methodology that
uses factoring and synthesis to process aesthetic knowledge
involved in pages for designing template-based page generator.
Grounded on this research, content producers/distributors
possess flexible creation and modification of computer-
generated pages for streamlining creative content formation
processes.
Keywords-content management; mobile applicatopn; page
component; publication; template
I. INTRODUCTION
Awareness and ownership of mobile pad (also well known as tablet PC) are growing, spurred by marketing campaigns from Apple, Amazon, Barnes & Noble or Research In Motion recently as well as press coverage and word-of-mouth buzz. According to Forrester's newest report in March 2012, US consumer tablet sales in 2016 expect to reach 60.3 million unit sales. And 112.5 million US adults will own a tablet in 2016, which will equal 34.3% of US adults [1].
In order to seize these widespread business opportunities, individuals such as designers, traditional media publishers, ad agencies, and companies of all sizes want to create, distribute, monetize, and optimize engaging content and publications for tablet devices [2]. However, the specification of mobile pad is totally different from personal computer or even paper. How to assist traditional designers utilize the characteristic of mobile pad to concept creative layout? How to help digital publishers create innovative digital content for mobile pad? How to bridge the communication gap of digital publishing between programmer and editor in a fastest and economic way? Therefore, in this research, our objective is to present a methodology for designing a template-based page generator to overcome innovative editing problems. Grounded on our research, a product-innovation and creative content platform can be prototyped by the corresponding modules and processes.
In this research, page refers to a leaf or a sheet in publications (e.g. books, magazines, newspapers, journals,
catalogs, etc.), which are typically published for mobile pad devices. Pages that are often used for collecting and disseminating information are natural bases in publications [3]. These publications provide immersive reading experiences through engaging content in mobile applications (hereinafter referred to as “publication Apps”).
The remainder of the paper is organized as follows.
Sections II and III define various concepts associated with
page management, including a page, template and meta-
template. Section IV describes the factoring and synthesis of
pages. Section V presents the methodology for designing
template-based mobile page generator. The last section
concludes the paper and illustrates the future work.
II. CHARACTERISTICS OF PAGES
A page in publication Apps can be decomposed into six parts including heading, description, background, menu, intension and extension. The heading part refers to the highlight title which summarizes the articles within a page. Most of the highlight titles are usually outlined in a sentence, such as topic, headline or subtitle. The description part is composed of numerous paragraphs which describes the details of the highlight titles. We can regard caption or footnote or article as a description part. The background part contains figures to help explain the article or beautify the margin. The menu part indicates the functions which prompt readers to do specific tasks such as jumping to a particular page, setting the font size or searching keywords within a whole publication App. The intension part is defined as the input data from device sensor. Take multi-touch sensor as an instance, reader needs two fingers to stretch the image to zoom in, and vice versa. Besides, when reader rotates his/her mobile device, the accelerator and gyroscope can detect the speed and direction to make the illustration upside-down. The content which is changed by device sensor data is called intension parts. The extension part refers to web content that must be connected to the Internet to fetch the updated data. A noted example is the updated tweets from social network websites. The last three parts including menu, intension and extension are specific characteristics in publication Apps in order to provide vivid reading experiences in this post-PC world.
Each part in a page is aggregated by pieces of components which may be divided from static to dynamic [4][5]. For static components, their display effects are stable. We regard text as a static component that every single word is fixed and firmed. In other words, the display effects of
28Copyright (c) IARIA, 2012. ISBN: 978-1-61208-220-2
CONTENT 2012 : The Fourth International Conference on Creative Content Technologies
36 / 98

dynamic components are changed by input values such as time, location data, device holding direction, etc. We regard web content as a dynamic component that the web content area could be connected to the server to get the newest response, i.e. the display essence from the web content component is changeable. Therefore, we summarize seven components which are commonly used in publication Apps, shown as below component spectrum.
Figure 1. Page component spectrum from static to dynamic.
Based on the components, the structure of a page may be analyzed by its purpose. Different purposes of pages may construct different characteristics and components. In Fig. 2, for instance, the pages within magazine App can be concluded to cover page, interior page, and advertisement page. Firstly, in regard to cover page we often see the heading and the background parts with text and image components. Secondly, the interior page usually contains the focal subject that is elaborately designed with multiple components. A publication App usually consists of numerous interior pages. Lastly, the advertisement page is often arranged for the advertisers. Common components of the advertisement page are image and web content (website link).
Figure 2. Different purpose of a page.
(adapted from WIRED magazine App: WIRED App Guide, 19.13 free)
III. LEVELS OF ABSTRACTION
In addition to grouping related attributes into generator, pages can also be generalized at three different levels: page instance, page template and meta-template.
Page instance: a page instance in publication Apps could be defined as a screen shot of the mobile device. In every digital publication App, multiple pages comprise a complete book or magazine. In this research, we use “page” and “page instance” interchangeably.
Page template: the skeleton of a page, in which attribute values are removed and may be substituted by other proper ones. The example in Fig. 3 shows
the relationship between a page and its template. A template may contain text, image and other components.
Meta-template: a further abstraction of templates by replacing their components with associated types. For instance, the image and text component of the page templates shown in Fig. 3 can be generalized into a meta-template of Components because image component can be substituted for jpg, png, and gif format attributes. Also text component can be substituted for different wording or different font attributes. A meta-template can generate multiple templates. A template can generate multiple pages.
Figure 3. Meta-template, template, page and their relationship.
(partially adapted from Bella magazine App: free edition)
IV. FACTORING AND SYNTHESIS OF PAGES
Based on different levels of abstraction, pages can be manipulated and managed through a factoring and synthesis process [6], as shown in Fig. 4. Factoring is a process of aggregation and generalization. It builds templates and meta-templates from existing pages. Synthesis is a process of specialization and instantiation. It constructs pages from meta-template and templates.
The first step in factoring is page analysis that extracts components to build a template. Attribute value in pages are removed from components to separate template and their affiliated data (F1). The templates are then generalized into meta-template (F2).
The synthesis process constructs pages from meta-templates and templates. When a page is needed, the user chooses a proper meta-template to build a template by defining attribute values of components (S1). Once the template is built, the system retrieves data from source material database and maps data into the template based on specification of the template. A page is constructed (S2).
Cover Page Advertisement PageInterior Page
29Copyright (c) IARIA, 2012. ISBN: 978-1-61208-220-2
CONTENT 2012 : The Fourth International Conference on Creative Content Technologies
37 / 98

Figure 4. Factoring and synthesis of pages.
V. METHODOLOGY FOR DESIGNING TEMPLATE-BASED
DIGITAL PUBLISHING SYSTEM
The processes of factoring and synthesis suggest a method for designing template-based mobile page generator. The method includes two major stages: design and application (see Fig. 5). The design stage is the process of factoring that includes page analysis, component design, meta-template design and database design. Once the meta-template and database are available, the page generator can be applied to construct pages by the synthesis process. This section presents major modules of the method.
Figure 5. Methodology for development.
A. Page Analysis
The objective of page analysis is to find the attribute values of major characteristics for designing the page generator. Pages are analyzed to identify their parts (including heading, description, background, menu, intension and extension) and corresponding attribute values. The process of identifying characteristic parts in the page is recursive.
The second step focuses on recognizing associated attribute values of a part. For instance, the description part is
composed with associated attribute values such as string, number, jpg and mp4.
B. Component Design
After defining all attributes, it is necessary to find their relationships. The most important processes of this module are factoring all the attribute values and grouping some similar attributes. In other words, this module collects attributes into clusters with a homogenous structure. If the values are jpg, png, and gif format attributes, these attributes are aggregated to image component. If the values are tap, flip, pinch, stretch and gesture attributes, these attributes are aggregated to sensor component. The components may be divided from static to dynamic for seven components.
C. Meta-template Design
The purpose of meta-template design is to simplify and automate the process of page generation. The components in Fig. 1 can be combined together within a page for 127 possibilities, as in (1).
12777
76
75
74
73
72
71 CCCCCCC
Note that the possibilities means the sum of the meta-templates which refers to that the different combination within a page is 127 categories. To go into detail, one of the seven components is a kind of meta-template deriving 7 possibilities of the meta-template. Moreover, randomly choosing two of the seven components will composite 21 possibilities of the meta-template. For this similar inference, once the page generator chooses all of the seven components within a page, the number of meta-template is 1.
D. Database Design
To maximize the flexibility in page construction, data must be decomposed and stored at the elementary level. To accomplish this goal, source material data are indexed and tagged. Besides the seven components can be combined to meta-template, the components can be mapped to the source material database. Take the image component for example, there are several other formats or extra picture files to fill in the image component. All the page generator needs to do is assuring the index or tag in database is correctly link to the components in order to replace the relative attribute values of the components.
E. Page Construction
The major function of the application phase is to construct pages from meta-templates. To allow end users to create their own pages easily, it is necessary to automate the application process. Through this module, editor can choose one of the meta-templates. This meta-template is similar to what he/her wants to convey. Then editor has flexible creation and modification of computer-generated pages for streamlining creative content formation processes.
------------------
-----------------------------------
------------------
-----------------------------------
Meta-template
Page Template
Pages
F1 F1
------------------
-----------------------------------
------------------
-----------------------------------
S2 S2
F2 F2 S1 S1
Factoring Process Synthesis Process
Image+
Text------------
30Copyright (c) IARIA, 2012. ISBN: 978-1-61208-220-2
CONTENT 2012 : The Fourth International Conference on Creative Content Technologies
38 / 98

VI. CONCLUSION AND FUTURE WORK
The current study presents a methodology for designing template-based page generator. The method is based on the concept of factoring and synthesis to simplify content management. It includes two major phases: one is to derive meta-templates and design material databases from existing pages; the other is to apply meta-template to create new page for publication Apps.
The contribution of the current study is two-fold. First, the methodology can alleviate the difficulty in flexible arrangement of page components, especially when creative presentation is necessary. It integrates several concepts and methods (such as factoring, synthesis, aggregation and generalization) into the design process to provide flexible necessary for individuals such as designers, traditional media publishers, ad agencies, and companies of all sizes that want to create their innovative pages easily. Second, the method allows a page skeleton and its associated attribute data to be managed separately. This helps the construction of template-based page generator to better use existing data in material database. The editor may specify different templates and fill them with data in the current material database. It also provides a greater possibility for reusing page layout and other presentation modules.
In addition to managerial implication, this research provides profound impact in this AppEconomy era. The app economy began to percolate in 2007 — the year that Apple introduced the iPhone and Facebook turned its website into a platform for other programs designed for its rapidly growing audience. Individuals such as designers, traditional media publishers, ad agencies, and companies of all sizes that want to create, distribute, monetize, and optimize engaging content and publications for tablet devices desire an easiest tool to flexibly manage the source material (of literature and art) for publication Apps. Not only the traditional designers can utilize the characteristic of mobile pad to layout pages, but also the digital publishers can quickly create another new issue of innovative pages based on previous edition. Furthermore, publishers who are aiming at distinguished digital publishing need to develop native publication Apps that results in the communication gap with programmer. The current study provides a method for editors to sketch a
blueprint or a solid configuration with definite expression toward aesthetic knowledge. The sketch speeds up the communication between editors and programmers.
This work is the beginning of a line of research focused on flexible page management in creative content platforms. In the future work, this method can be implemented into an automated system integrating with other systems to expand system capabilities and evaluation of system productivity and user satisfaction. Moreover, leaving a space for innovation should also be taken into consideration since it has been proved that the most successful webpage designs are not template-based but the ones that rely on presenting the content in a way that meets the business owner objectives and attracts the attention of the end-user.
ACKNOWLEDGMENT
This study is conducted under the “III Innovative and Prospective Technologies Project” of the Institute for Information Industry which is subsidized by the Ministry of Economy Affairs of the Republic of China.
REFERENCES
[1] Sarah Rotman Epps, “Forecast Update: Amazon Expands Tablets’ Addressable Market”, Forrester Blogs, http://blogs.forrester.com/sarah_rotman_epps/12-03-06-forecast_update_amazon_expands_tablets_addressable_market. Retrieved Mar 13, 2012.
[2] Bob Bringhurst, “Design Decisions for Digital Publishing Apps”, InDesign Docs, http://blogs.adobe.com/indesigndocs/. Retrieved Mar 13, 2012.
[3] C.W. Holsapple, A.B. Whinston, Decision Support Systems: A Knowledge-Based Approach, West Publishing, St. Paul, MN, 1996.
[4] Chia-Hui Chang, Mohammed Kayed, Moheb Ramzy Girgis, Khaled F. Shaalan, “A Survey of Web Information Extraction Systems”, IEEE Transactions on Knowledge and Data Engineering, vol. 18(10), 2006, pp. 1411-1428.
[5] P. Fraternali, and P. Paolini, A conceptual model and a tool environment for developing more scalable, dynamic, and customizable Web applications, in: Proc. Int. Conf. EDBT98, Valencia Spain, March 1998.
[6] Jen-Her Wu, Her-Sen Doonga, Ching-Chang Leeb, Tse-Chih Hsiac, and Ting-Peng Liang, “A methodology for designing form-based decision support systems”, Decision Support Systems, vol. 36(3), 2004, pp. 313–335.
31Copyright (c) IARIA, 2012. ISBN: 978-1-61208-220-2
CONTENT 2012 : The Fourth International Conference on Creative Content Technologies
39 / 98
Fast Parallel k-NN Search in High-Dimensional Spaces
Hyun-Hwa Choi, Seung-Jo Bae High Performance Computing Software Team
Electronics and Telecommunications Research Institute Daejeon, Rep. of Korea
{hyunwha, sbae} @etri.re.kr
Kyu-Chul Lee Dept. of Computer Science
Chungnam National University Daejeon, Rep. of Korea
Abstract—We are currently witnessing a rapid growth of image data, triggered by the popularity of the Internet and the huge amount of user-generated content from Web 2.0 applications. To address the demanding search needs caused by large-scale image collections, two major approaches for high-dimensional data in cluster systems have been proposed: Speeding up the search by using distributed index structures, and speeding up the search by scanning a Vector Approximation-file (VA-file) in parallel. We propose to combine both techniques to search for large k-nearest neighbors (k-NN) in a high-dimensional space. We develop a distributed index structure, called a Distributed Vector Approximation-tree (DVA-tree), with a two-level structure: the first level is a hybrid spill-tree consisting of minimum bounding spheres, the second level is VA-files. We also introduce a new approximate k-NN search algorithm on this structure and derive cost formulae for predicting the response time of the k-NN search. We then provide a detailed evaluation on large, high dimensional datasets. In an experimental evaluation, we show that our indexing scheme can handle approximate k-NN queries more efficiently for high-dimensional datasets.
Keywords-knn search; distributed indexing structure; high dimensionality
I. INTRODUCTION We are currently witnessing a rapid growth of image data,
triggered by the popularity of the Internet and the huge amount of user-generated content from Web 2.0 applications. Given such image collections, performing similarity search to find objects most similar to a given object is a classical problem with many practical applications. A common approach to similarity search is to extract so-called features from the objects, e.g., color, shape and texture information, and to utilize special index structures for these features.
To address the demanding search needs caused by large-scale image collections, several distributed index structures for high-dimensional data spaces have been proposed. Most of the approaches recently published focus mainly on supporting range queries or operating in peer-to-peer systems [1 - 4]. However, in order to provide similarity on massive high-dimensional data in cloud computing services or web search services, we need efficient ways of providing a k-nearest neighbors (k-NN) search for high-dimensional data in cluster environments. The k-NN search is a central
requirement in database applications such content-based multimedia retrieval, because it has no input parameters that require prior knowledge of data. The “best” indexes have the following properties:
· The index should be deployable over multiple nodes in cluster environments.
· The index should require no special tuning of parameters required for each specific dataset.
· The set of candidates retrieved by the index should contain the most similar objects to the query.
· The number of candidates retrieved must be as small as possible, to reduce I/O and computation costs.
Over the years, little work for providing an efficient and scalable access to high-dimensional data in centralized systems have been done on the parallelization of trees or Vector Approximation-files (VA-files). In [5 - 6], the authors used R-trees [7] as underlying data structure, because they guarantee good space utilization and treat geometric objects as a whole. Koudas et al. [5] proposed a “Master R-tree” architecture. A master server contains all the internal nodes of the parallel R-tree, and the leaf level nodes are declustered across several data servers. The major focus of the work is on finding the optimal declustering “chunk size”. Schnitzer et al. [6] designed a “Master Client R-tree” as parallel multi-dimensional indexing structure. The Master Client R-tree is a two-level distributed R-tree that has a single global index on a master server and local indexes on the other data servers. The Master Client R-tree is similar to the Master R-tree in the sense that it declusters leaf level nodes across data servers. However each data server creates a complete R-tree as its own local index using the leaf level nodes that are assigned to it. Liu et al. [8] introduced a parallel version of a hybrid spill tree. A top-tree is built on the sample feature vectors. Each leaf node in this top-tree then defines the partition, for which a hybrid spill-tree is built on a separate machine.
On the other hand, most multi-dimensional indexing structures have an exponential dependence upon the number of dimensions. In recognition of this, a VA-file [9] was developed to accelerate the scan through the feature vectors. The VA-file consists of two separated files: the vector file containing the feature vectors, and the approximation file containing a compressed representation of each feature vector. Nearest neighbor queries are processed using two
32Copyright (c) IARIA, 2012. ISBN: 978-1-61208-220-2
CONTENT 2012 : The Fourth International Conference on Creative Content Technologies
40 / 98

phases. In the filtering phase, the entire approximation file is scanned sequentially to prune the majority of feature vectors. The candidates that cannot be pruned are refined by a random search of the vector file in the refinement phase. Weber et al. [10] and Chang et al. [11] proposed a parallel NN-search based on the VA-file to achieve a linear increase on search speed as the number of servers grows. However, the query response times of these solutions have not been satisfactory for a search engine which enables similarity search on the World-Wilde Web.
In this paper, we present a new distributed indexing structure for fast nearest neighbor search in high-dimensional feature space, called a Distributed Vector Approximation-tree (DVA-tree). The core problem of designing a fast parallel nearest neighbor search algorithm is to find an adequate clustering algorithm which distributes the data onto the nodes such that the data, which have to be read in executing a query, are distributed as equally as possible among the nodes. We create a sample small enough to fit on a single machine from large-scale feature vectors and build a hybrid spill tree on the sample. The feature vectors partitioned to each cluster by the built hybrid spill tree are stored into a separate machine. A local index server, which operates on the separate machine, manages a VA-file as local index to process k-NN queries. We also describe how parallel k-NN search based on the DVA-tree works and derive cost formulae for predicting the response time of the parallel k-NN search. We present an experimental evaluation of our indexing scheme using both real and synthetic data sets, and compare it against previous techniques. The experimental results show that our indexing scheme can handle approximate k-NN queries more efficiently for high-dimensional datasets.
The remainder of this paper is organized as follows. In the next section, we first define the similarity queries and briefly present existing methods for similarity query processing. In Section III, we introduce our newly proposed DVA-tree structure. We also present the approximate k-NN search operation on the DVA-tree and derive cost formulae for predicting the response time of the k-NN search. Section IV reports the findings of an experimental study conducted to evaluate the proposed scheme. Finally, in Section V, we draw some conclusions.
II. PRELIMINARY A promising and widely used approach for similarity
searching in multimedia databases is to map the multimedia objects into points in a metric space. The metric spaces include high-dimensional vector spaces, where objects are compared using Euclidean (L2) distance.
A metric space M=(D, d), where D is a domain of objects and d is a total distance function with the following properties:
Symmetry: d(Ox, Oy) = d(Oy, Ox) Non negativity: d(Ox, Oy) > 0 (Ox≠Oy) and d(Ox, Ox)=0
Triangle inequality: d(Ox, Oy) ≤ d(Ox, Oz) + d(Oz, Oy)
The distance between two points P and Q in the metric space is defined by Euclidean distance function:
2
1
0
22 )(),(),( å
-
=
-==d
iii PQQPdQPL (1)
The similarity queries in a D-dimensional space may be defined as follows:
Definition II.1 Range Query Given a query object Q∈D and a maximum search distance r, the range query range(Q, r) selects all indexed objects Oj such that d(Oj, Q) ≤ r.
Definition II.2 k- Nearest Neighbors (k-NN) Given a query object Q∈D and an integer k ≥1, the k-NN query NN(Q, k) selects the k indexed objects which have the shortest distance from Q.
In order to achieve a better performance of k-NN search, two classes of techniques (index structures and scan methods) have been proposed for high-dimensional data. The basic idea of most high-dimensional indexing structures is to construct a tree structure by partitioning the data space or clustering data. These methods can prune the search space for queries using the partitioning. In a M-tree [12], for each routing object Or, there is an associated sub-tree T(Or), called the covering tree of Or. All objects in the covering tree T(Or) are within the distance r from Or, r > 0. Given a query Q, a lower bound dmin(T(Or)) on the distance of any object in T(Or) from Q is
}0,),(max{))((min rQOdOTd rr -= (2)
Upper bound is
rQOdOTd rr += ),())((max (3)
Consider the largest distance dk in current nearest neighbors. At the execution of k-NN search, the order in which nodes are visited can be determined by selecting the node for which the dmin lower bound is minimum, and any sub-tree for which dmin(T(Or)) > dk can be pruned from the search. According to experimental observations, these lead to better performance.
The scan based VA-File [9] divides the data space into 2b rectangular cells where b denotes a user specified number of bits. For each dimension j, a small number of bits (bj) is assigned. There are 2bj partitions along dimension j, requiring 2bj + 1 marks, i.e., mj[0], …, mj[2bj]. An approximation a for a data point p is generated as follows. Let aj be the number of the partition into which pj falls. A point falls into a partition only if it lies between the lower and upper bounds of that partition:
33Copyright (c) IARIA, 2012. ISBN: 978-1-61208-220-2
CONTENT 2012 : The Fourth International Conference on Creative Content Technologies
41 / 98

]1[][ +<£ jjjjj amPam (4)
The approximation a is simply the concatenation of the binary bj-bit patterns for each partition.
Figure 1. lower and upper bounds for L2(Q, P)
In Fig.1, the lower and upper bounds on the distance between a query point Q and a data point P are determined by the equations:
uBoundPQLlBound ££ ),(2 (5)
ïî
ïí
ì
>-
=
<+-
=
= å=
jjjjj
jj
jjjjj
j
D
jj
QaQam
Qa
QaamQ
lBoundwhere
lBoundlBound
][
0
]1[
)(2
1
2
(6)
ïî
ïí
ì
>-+
=-+-
<-
=
= å=
jjjjj
jjjjjjjj
jjjjj
j
D
jj
QaQam
QaQamamQ
QaamQ
uBoundwhere
uBounduBound
]1[
)]1[],[max(
][
)(2
1
2
(7)
In the VA-file, the approximations are scanned linearly.
A feature vector is a candidate whenever less than k feature vectors have been encountered, or whenever the lower bound is less than the k-th largest upper bound currently in the candidate set. The actual distance based on L2 is evaluated only for these candidate feature vectors. In practical experiments, between 95% and 99% of the feature vectors were eliminated during scan step of approximations. The main advantage of the VA-file is that it retains good performance as dimensionality increases.
III. THE DVA-TREE In order to improve the data access performance through
the benefit of parallel process, it is important to distribute large data across multiple machines. For skewed distributions, the data density in some parts of a data space is higher than in other parts. Therefore, the core idea for a distributed indexing structure is to find an adequate
clustering algorithm which distributes the data onto the nodes such that the data, which have to be read in executing a query, are distributed as equally as possible among the nodes. On the other hand, a sequential scan is superior to tree-based structures on a single machine, if the dimensionality of feature vectors exceeds a certain threshold [9]. We employ a tree structure as a clustering strategy. The tree is utilized for query processing, as usual, to restrict the search to relevant parts of the data space. The data points in each leaf node of the tree are stored into a separate machine with the VA-file.
A. The Strucuture The structure of a DVA-tree is illustrated in Fig. 2. The
DVA-tree is a distributed version of a two-level index scheme. The first level is a hybrid spill-tree consisting of minimum bounding spheres, the second level contains data points in a compressed representation.
Figure 2. Structure of the DVA-tree
We first create a sample small enough to fit on a single machine from large-scale feature vectors. To accurately predict clusters of the entire feature vectors, we use the subset obtained from the feature vectors using random sampling method, and then build a hybrid spill tree on the sample. The hybrid spill-tree is the latest data partition method that is efficient in both accuracy and time of retrieval. The feature vectors partitioned to each cluster by the built hybrid spill tree are stored into a separate machine. Each of the separate machines manages a VA-file as local index to process a k-NN queries. The overall DVA-tree can be viewed conceptually as a single hybrid spill-tree, spanning a large number of machines.
B. K-NN Queries The k-NN queries are processed by the three phases as
shown in Fig. 3. In the first phase, the k-NN queries are submitted to the global index server owning the hybrid spill-tree. The global index server traverses the hybrid spill-tree in order to determine which VA-file(s) must be accessed. At this time, the global index server transforms the k-NN queries into range queries with arbitrary thresholds. The thresholds for the range queries are the average k-th distance between the sample data. They are computed while building the hybrid spill-tree. In the DVA-tree, whole clusters can be pruned by traversing the hybrid spill-tree. The k-NN queries
34Copyright (c) IARIA, 2012. ISBN: 978-1-61208-220-2
CONTENT 2012 : The Fourth International Conference on Creative Content Technologies
42 / 98

are forwarded to the local index servers determined by the global index server. In the second phase, the local index servers process the k-NN queries on the VA-files in parallel. In the third phase, final results of the k-NN queries are obtained from candidate neighbors returned by the multiple local index servers.
Figure 3. K-NN Search
The cost of k-NN query processing TQP on a DVA-tree consists of the following components:
· Cost for traversing a hybrid spill-tree · Cost for searching a k-NN query on a VA-file · Cost for merging candidates
Relevant symbols and their descriptions are given in Table 1.
TABLE I. SUMMARY OF SYMBOLS AND RESPECTIVE DEFINITIONS
Symbol Descriptions D number of dimensions Q query point k number of nearest neighbors
k average kth distance between points in a sample
F(x) distance distribution Or routing point stored in an internal node on a hybrid spill- tree r(Nr) covering radius of node Nr l number of nodes in a hybrid spill-tree
m number of leaf nodes accessed for processing a range query on a hybrid spill-tree
v number of points stored in a local index server b number of bits used for bit encoding (compressing)
tapprox time to compute lower and upper bounds per dimension in a filtering step for a VA-file search
tvector time to compute the distance between two points per dimension
w number of points remained after the filtering step of a VA-file search
tread time to load a block from a disk
tcompare time to compare two distances between two points and a query point
For simplicity, we assume that data points are uniformly
and independently distributed in the data space. First, consider a range query rang(Q,k ). A node Nr of the hybrid spill-tree has to be accessed iff the ball of radius k centered in the query object Q and the region associated with Nr
interset. This is the case iff d(Q, Or) ≤ r(Nr) +k . For instance,
the distribution of distance is F(x) = Pr{d(O1, O2) ≤x}. The probability that Nr has to be accessed can be expressed [13] as
))(())((
})(),(Pr{}Pr{
kNrFkNrF
kNrOQdaccessedisNnode
rrQ
rrr
+»+=
+£= (8)
The expected number of nodes accessed for a range query is
))(()),((
1
kNrFkQrangenodesl
iri
+= å= (9)
If the hybrid spill-tree fits entirely into main memory, no IO operation are necessary. Therefore, the average cost for a range query is the sum of the costs of distance computation among the query point and the accessed nodes.
)()),((1 vectorst tDkQrangenodesT ××= (10)
The local index servers corresponding to m leaf nodes determined by tree search process the k-NN query using a VA-file in parallel. The points v in each local index sever may be represented by a unique bit-string of length b. We consider the case that the approximation file fits into main memory. The cost of the filtering phase is
)(btDvT approxf ××= (11)
After the filtering phase, a small set of candidiates remain. In the refinement phase, the number w of points visited is represented in [14]. The disk IO occurs by random access to the vector file. The cost of the refinement step can be derived as
)( vectorreadr tDtwT ×+×= (12)
Finally, the total cost of theVA-File based k-NN search is the sum of the costs of the two phases.
rfnd TTT +=2 (13)
Each local index server returns k sorted candidate points. The final k nearest neighbors are determined by comparing m×k candidate points obtained from m local index servers. The merge cost of the candidate points is estimated as
comparerd tmkT ×-×= )1(3
(14)
Finally, the estimated total cost for k-NN query processing is
rdndstQP TTTT 321 ++= (15)
35Copyright (c) IARIA, 2012. ISBN: 978-1-61208-220-2
CONTENT 2012 : The Fourth International Conference on Creative Content Technologies
43 / 98

IV. EXPERIMENTAL RESULTS In this section, we present an experimental study to
evaluate the performance of the DVA-tree. The performance is evaluated using the average execution time and accuracy of a k-NN search over 100 different queries. We compare the performance of the DVA-tree with that of the distributed hybrid spill-tree [8] because the distributed hybrid spill-tree is a recent indexing structure based on a cluster environment.
The distributed hybrid spill-tree and DVA-tree algorithms were developed using the M-tree C++ package [15]. We report our experimental results based on real and synthetic datasets. We use a real data set, Aerial40 [16]. Aerial40 contains 270,000 feature vectors with 61 dimensions.
All the experiments were conducted on eight server machines in a Linux cluster based on a global file system. Each of the eight servers has a 3.40 GHz Pentium® D CPU processor with 2.4 GB of memory capacity. For the distributed hybrid spill-tree or DVA-tree, we dedicated a master server and six other servers as local index servers that execute k-NN queries either on the local hybrid spill-tree or VA-file. Meanwhile, we used the last server as a merger to integrate the k-NN search results from the local index servers. This is to construct a similar query execution environment as the MapReduce operations for the nearest neighbor search proposed in [8]. In order to emulate a larger configuration including more than six local index servers, we also ran multiple local index servers on a single machine. The intercommunication between the master server and local index servers is done via TCP/IP.
For a fair performance comparison, the top trees of the DVA-tree and distributed hybrid spill-tree are built on same sample data, and all the indexing structures have the same number of index servers. The number of bits per dimension of approximation cell used in the VA-file is 8.
In many applications, data points are often correlated in different ways. We test the performance of the DVA-tree and the distributed hybrid spill-tree on the skewed dataset of Aerial40. For a fair performance comparison, the top trees of the DVA-tree and distributed hybrid spill-tree are built on same sample data.
Figure 4. The search time on the skewed dataset.
Fig. 4 depicts the performance of the approximate k-NN
searches as the number of the required nearest neighbors
increases. The results show that the average execution time of the approximate k-NN searches on the DVA-tree runs up to 1.78 times faster than on the distributed hybrid spill-tree. Moreover, we can notice that the performance gap between the DVA-tree and the distributed hybrid spill-tree steadily widens as the number of the nearest neighbors increases. This is based on the fact that the DVA-tree executes the nearest neighbor search based on the VA-file, which scans the entire approximation data regardless of the number of required neighbors and performs disk operations for few vector data. However, the distributed hybrid spill-tree has an amount of overhead for processing directories of the tree, and this overhead increases when increasing the number of desired nearest neighbors. Therefore, the processing delay for a nearest neighbor search increases more slowly for the DVA-tree than for the distributed hybrid spill-tree.
On the other hand, both the DVA-tree and distributed hybrid spill-tree yield better performances, when we use the smaller page capacity of leaf nodes in the top tree. This can be explained by the fact that the top tree with smaller page capacity of leaf nodes enables the parallel k-NN queries to be performed over more local index servers. We observe that the DVA-tree yields better performance than the distributed hybrid spill-tree regardless of the size of the leaf pages in the top-tree. The results are shown in Fig. 4.
Figure 5. The search accuracy of the skewed dataset.
Fig. 5 shows the search accuracy by varying the page
capacity of the tree from 128 KBytes to 256 KBytes. The DVA-tree obtains a better search accuracy compared to the distributed hybrid spill-tree when using the same sized leaf pages, because it performs k-NN queries based on the VA-file, which provides an exact k-NN search.
36Copyright (c) IARIA, 2012. ISBN: 978-1-61208-220-2
CONTENT 2012 : The Fourth International Conference on Creative Content Technologies
44 / 98

Figure 6. The k-NN search time for different data size.
Fig. 6 shows the performance of the approximate 100-
NN search by varying the number of data from 200,000 to 1,000,000. This result is similar to those of experiments using the real dataset and clearly shows the effectiveness of the DVA-tree. The DVA-tree outperforms the distributed hybrid spill-tree in terms of execution time as the number of data increases. This is due to the fact that local index servers in the DVA-tree utilize the VA-file technique without any processing overhead of the directory of the tree. In recognition of this fact, if we consider a larger dataset or a higher number of dimensions, such as 100, the difference between search performances will widen even more.
V. CONCLUSIONS In this paper, we presented the design of a new high-
dimensional indexing scheme, called a DVA-tree, to solve the distributed k-nearest neighbor search problem over large- scale high-dimensional data in cluster environments. The DVA-tree employs a hierarchical clustering method and distributed VA-file management in order to allow a parallel k-NN search on each of the VA-files. We use a hybrid spill-tree as a clustering method and build the hybrid spill-tree on the sample data of large-scale high-dimensional data, because the sampling is independent of the dimensionality and the sampled data maintain the cluster information of the data set stored in the database. The data sets clustered by the hybrid spill-tree are managed on distributed VA-files. We proposed an algorithm for approximate k-NN searches over multiple machines. Our experimental evaluation indicates that the DVA-tree can efficiently provide a k-NN search with high accuracy. Moreover, since our algorithms are very simple, they are appropriate for data sets of tremendous size or dimensions.
ACKNOWLEDGMENT This work was supported by the IT R&D program of
MKE/KEIT. [10038768, The Development of Supercomputing System for the Genome Analysis]
REFERENCES
[1] S. Blanas and V. Samoladas, “Contention-base performance evaluation of multidimensional range search in peer-to-peer networks”, Journal of Future Generation Computer System, Vol. 25, Iss.1, pp.100-108, 2009
[2] H. V. Jagadish, B. C. Ooi, Q. H. Vu, R. Zhang, and A. Zhou, “VBI-tree: a peer-to-peer framework for supporting multi-dimensional indexing schemes,” Proc. IEEE International Conference on Data Engineering (ICDE 06), p 34, 2006.
[3] M. Bawa, T. Condie, and P. Ganesan, “LSH forest: self-tunning indexes for similarity search,” Proc. International World Wide Web (WWW 05), pp. 353-366, 2005.
[4] C. Schmidt and M. Parashar, “Flexible information discovery in decentralized distributed systems,” Proc. IEEE International Symposium on High Performance Distributed Computing (HPDC 03), 2003.
[5] N. Koudas, C. Faloutsos, and I. Kamel, “Declustering spatial on multi-computer architecture,” Proc. International Conference on Extending Database Technology (EDBT 96), pp. 592-614, 1996.
[6] B. Schnitzer and S. T. Leutenegger, “Master-Client R-trees: a new parallel R-tree architecture,” Proc. International Conference on Scientific ad Statistical Database Management (SSDBM 99), pp. 68-77, 1999.
[7] A. Guttman, “R-trees: a dynamic index structure for spatial searching,” Proc. ACM SIGMOD International conference on Management of Data, pp. 47-57, 1984.
[8] T. Liu, C. Rosenberg, and H. A. Rowley, “Clustering billions of images with large scale nearest neighbor search,” Proc. IEEE Workshop on Application of Computer Vision (WACV 07), pp. 28-33, 2007.
[9] R. Weber, H.-J. Schek, and S. Blott, “A quantitative analysis and performance study for similarity-search methods in high-dimensional spaces,” Proc. International Confernce on Very Large Databases (VLDB 98), pp. 194-205, 1998.
[10] R. Weber, K. Böhm, and H.-J. Schek, “Interative-time similarity search for large image collections using parallel VA-files,” Proc. IEEE International Conference on Data Engineering (ICDE 00), pp. 83-92, 2000.
[11] J. Chang, and A. Lee, “Parallel high-dimensional index structure for content-based information retrieval,” Proc. International Conference on Convergence Information Technology (ICCIT 08), pp. 101-106, 2008.
[12] P. Ciaccia, M. Patella, and P. Zezula, “M-tree: an efficient access method for similarity search in metric spaces,” Proc. International Conference on Very Large Database (VLDB 97), pp. 426-435, 1997.
[13] P. Ciaccia, M. Patella, and P. Zezula, “A cost model for similarity queries in metric spaces”, Proc. ACM SIGPODS conference, pp. 65-76, 1998.
[14] R. Weger, and K. Böhm, “Trading quality for time with nearest-neighbor search,” Technical report, Dept . of Computer Science, 1999.
[15] M-tree homepage, http://www-db.deis.unibo.it/research/Mtree , retrieved: March, 2012.
[16] Real data source website, retrieved: March, 2012 http://www.autolab.org/autoweb/15960.html
37Copyright (c) IARIA, 2012. ISBN: 978-1-61208-220-2
CONTENT 2012 : The Fourth International Conference on Creative Content Technologies
45 / 98

Mirage: A Real-time Affection Meter via Collaborative Memory Creation and Navigation
Lyn Chao-ling Chen and Yi-ping Hung Image and Vision Lab
Graduate Institute of Networking and Multimedia National Taiwan University
Taipei, Taiwan [email protected] [email protected]
Abstract—This paper presents an interdisciplinary study on social science and computing technology to build a novel interactive device Mirage toward presenting the collaborative memories of a place. With the support of social science theory, the locative media builds a strong connection between the participants for sharing similar memories at the same place. Using the metaphor of magic crystal ball, we construct the Mirage coordinate by system calibration to obtain precise 3D directions and distances of hand motions. With the aid of computing technologies, participants use their hands to manipulate and to reverse the memory axis intuitively, and to control the speed of memory stream with the accurate hands positions. Through memory navigation, they contact with each other by affection communication and create the virtual social relationship between them. During the touching process, they gradually turn the world into their world with self -memories through memory creation, and their self-conscious be enhanced. Besides, the experience of attending the digital art exhibition helps us to attract the aesthetic people to be involved in the experiment that raises the diversity and quality of collected data. We also design the affection computation method for analysis the affection amplification effect between the participants, and the experiment proves the interesting social factor influence which we proposed in this paper.
Keywords-Affective Computing; Collaborative Narrative; Human Facial Expression Recognition; Interactive Device; Locative Media; Memory; Psycogeography
I. INTRODUCTION
Human world has concreted and preserved by many kinds of memories that form diverse cultures and histories of human beings. Ong’s extensive work [1] on orality and communication shows many of the characteristics of listening prior to print literacy and the recording and stockpiling of speech/sound. These memories with affections of people are evidences that they ever lived. In the new era of rapidly changing technologies, the types of memory creation have become various and rich, such as email, MSN messages, Twitter, or the social website Facebook. People like to share their life experiences with their families and friends. That is easier for them to contact with others to form a rich virtual social layer upon the real world. But, even from now, the major way of displaying the personal histories is limited by timeline, and the expression form of their feelings is still poor, for example just using the face symbols. That
brings the issue how to reveal human affection within the abundant recorded memories intuitively and automatically.
This research focuses on to develop a novel interactive device for collaborative memory creation and navigation. Using the metaphor of crystal ball, participants intuitively enter the magical memory space and control the time axis to reverse the world with bare hands. Through the memory navigation, they sense the strong connections with others who ever had similar experiences at the same place. With the magical power gift, during the touching process they gradually turn the world into their world with self-memories, as in the Genesis the God gives Adam life, and enhance their self-conscious. We also design the affection computation method for analysis the interesting affection amplification effect between the participants.
Figure 1. The Mirage in Being digital artwork exhibition
The Mirage attended Being digital artwork exhibition held by MOCA museum [2] from December 3, 2011 to January 8, 2012 showing on Fig. 1. The experience helped us to collect plenty diverse data for experiment.
This paper starts by revealing a new concept of virtual memory creation to open up a new way of memory navigation. We then propose Mirage as a novel interactive device to realize the collaborative creation and navigation. Section 2 provides pointers to related works, including the social science theory that supports the design principles for Mirage to meet our several expectations. Section 3 describes the system implementation including two models for
38Copyright (c) IARIA, 2012. ISBN: 978-1-61208-220-2
CONTENT 2012 : The Fourth International Conference on Creative Content Technologies
46 / 98

affection computing. Section 4 presents a preliminary study of the system and the analysis on users’ feedbacks, followed by the conclusion and future work in Section 5.
II. PRIOR ART
A. The Virtual Social Relationship
For the improvement of new technology, a rich virtual layer has generated upon the physical world which has unique meaning to an individual. As Shotter [3] said, “World as activities and events rather than substances and things,” and therefore, the virtual world formed from an individual’s cognition is more meaningful than the real world. That brings the topic to discuss the interesting virtual social relationships among the world. SecondLab [4] creates a remote lab that allows students to control a microbot working with real experience in the social 3D-based immersive environment, and creates the novel virtual social relationship. Moreover, the virtual interactive activity has realized in gameplay field. Uncle Roy All Around You [5] [6] held a city game by following online-player’s directions to find the mysterious Uncle Roy hidden in the city.
From virtual social relationship creations, we find out that there is a connection within people, content, and location. As Salamensky’s theory [7], “a new kind of conversational space opens up… The particular mix of spatial metaphor and the dynamics of instantaneous communication… build a sense of belonging.” Under the premise, the digital content is meaningful to people with embedded location information, otherwise it is meaningless for the sense of belonging lost. Milgram [8] defines a Reality-Virtuality (RV) continuum as a way to define how new technologies could form new types of realities in the new age. The virtual layer provides us abundant resources for digging the new type of social relationship and we will further discuss these locative media.
B. The Locative Media
Locative media has been realized in the new era for the technology improvement. Many smartphones can show the locations of users’ near friends, moreover, they also like to share where they currently stay via the Facebook’s check-in function. It brings the trend that people start to pay a lot of attention to location information and it has meaning to them with the social aid. Harrison [9] declares the difference between the term “space” and “place.” Space is the structure of the world, it is a three-dimensional environment, in which objects and events occur and have relative positions and directions. A place, at the base of previous definition, is a space invested with understanding of behavioral appropriateness, cultural expectations, and so forth. Jacob [10] and Alexander [11] further illustrate that a place is considered including the people’s life experience there with deeply-echo social and historical meanings. That starts the investment to find out the connection between people and place they lived. Sonic City [12] is a real-time music creation system that generates different sounds according to the buildings or passenger users met on the street, through the discovery they are aware of their daily routes and the connection of the city is enhanced. However, it doesn’t reach
to the virtual social layer with the life experiences of residents. Urban Tapestries [13] enables people to leave their path in the city generating a complex network. They provide the geography information on the map, but they can’t interact with each other to create virtual social relationship.
Bakhtin [14] gives explanation of human’s view through dialogism. He claims that each person organizes the world through his unique experiences. That echoes Shotter’s point where the individuals construct their own world by their unique cognition. In prior work, Storylog [15] concretes the Michael Ende’s [16] Fantasica, in which people create virtual social relationship via collaborative narrative storytelling. That implies the interaction property of Salamensky’s theory. Each avatar they created from their unique cognitions is embedded with their true personalities, and their different cultural background supports Bakhtin’s view. Besides, they name the locations of story world creating the relations between people and location echoes Shotter’s theory.
The world concreted from the people’s thoughts leads the locative media to the mental level and enables them to turn the real world into their own world. The power of turning space into “a sense of place” [17] depends on how deep of the inner mind people inject to the world. For the reason, we focus on how to reveal the inner layer of people intuitively, the memories with their thoughts, minds, and affections.
C. The Human Affections within Memories
Memories contain people’s affections and record of their life traces. The early researches still narrow on the memory retrieval how to help people preserve and recall the valuable memories. iRemember [18] retrieves keywords from a huge vocal data recorded from everyday conversations with campus for two years. The transcript text brightness is proportional to recognition confidence that tries to recall people’s social experiences. Matthew [19] aims his work physically in the health filed to help people with the EMI (Elderly Mentally Ill) problems. Using the portable device combining with Microsoft SenseCam [20], an off-the-shelf voice recorder, and a GPS logger, he records everyday behaviors of patients then provides the helpful memory cues. But, it still needs the expert knowledge of caregiver to decide which good memory cues are.
The rapid improvement of portable device makes the memory recording easy and brings the researches into lifelogging field. I Like to Log [21] also records data by SenseCam and automatically generates keyfarme images of people’s daily lives. It’s like diaries with specific names, events and time. The new problem is how to deal with the huge amount raw data recorded day after day, and most researches are disoriented by the huge log information. People keep their memories for sharing their feelings with others to form the meaningful lives. That is why we focus on the inner layer of people, their affections within memories. We try to find out their treasure memory fragments by human affection analysis. It was shown that image is a stronger material than text, or voice to reveal one’s affection state. This research identifies the affection state of people by human facial expression recognition and human behavior
39Copyright (c) IARIA, 2012. ISBN: 978-1-61208-220-2
CONTENT 2012 : The Fourth International Conference on Creative Content Technologies
47 / 98

The Memory Flow
User Viewing
The Overture
Self-
Memory
…
Predesigned Images Past
Memory
Past
Memory
Past
Memory
Past
Memory
60
Frames
A user’s
Memory Creation
…
60
Frames
60
Frames
60
Frames
60
Frames
60
Frames
60
Frames
60
Frames
The Genesis
… Past
Memory
Past
Memory
Self-
Memory
Self-
Memory
Past
Memory
Self-
Memory
Self-
Memory
Self-
Memory
Self-
Memory
… 60
Frames
60
Frames
60
Frames
60
Frames
60
Frames
60
Frames
60
Frames
60
Frames
60
Frames
The Genesis
detection, and further analyzes the affection amplification effect between them in the common memory world.
III. PROJECT DESCRIPTION
A. User Scenario
The memory flow consists of three parts and shows on the Fig. 2.
• The Chaos: In idle mode, the crystal ball continuously displays a haze through particle generation to turn on people’s curiosity. It reveals the Chaos world as the initial state of memory world without any infections.
• The Overture: The participant touches the crystal ball and the haze fades away then the door of memory world opens. It starts with a stream of predesigned images retouched by artist, and brings to participant the experience of passing through the time tunnel. In the meantime, it triggers the camera to capture his face images continuously.
• The Genesis: After the overture, a tinkle sound alerts the participant that he arrives to the territory of memory world. It plays the memory fragments collected form the past visitors. With the magical power gift, he controls the time axis with acceleration speed, navigates in the depiction or flashback way, and continues or temporally stops to view the detail of a memory frame. During the touching process, the memory fragments pass through his fingers and he will be surprised to see own faces showing in the memory flow. The more he involves in, the more he infects the world. The memory creation gives the world new element as God gives Adam life in Genesis, and finally, the world turns into his own world only with his memories. During the interaction process, once participant’s finger lefts, the world goes back to the initial Chaos state showing mysterious haze. However, what ever done is irreversible.
Initialization
Index Record
Hand Motion Detection
Information Fusion
Score Computing Weighting
Adjustment
Emotion Model
Facial Expression
Recognition
Activity Model
Head Motion
Detection
Camera Input
Affection Score
Database
The Genesis
The Collaborative
Memory Frames
The Overture
The Predesigned
Images
The Chaos
Idle Mode
Most
4 Blocks
The Self-memory
Frames
Index Update
Figure 2. Mirage system architecure
B. Mirage System
Mirage is an interactive device for collaborative memory creation and navigation. After alpha blending processing, the 3D virtual memories fragments are reflected through a Fresnel lens and then are projected in a transparent acrylic ball. Using two cameras, we construct Mirage coordinate by system calibration to obtain precise 3D directions and distances of hand motions. With the specific information, users control memory axis and modulate memory stream with acceleration speed according to their hands positions. Besides, another camera is embedded for ambient capturing of their faces during the interaction.
The system architecture of Mirage shows on Fig. 2. Once it detects the user’s hand motion, it triggers the camera to continuously capture one block of 60 memories frames. By recording the block index, we know the start and end points of the user’s memory creation. After one period capturing, the block index is updated. In the meantime that adds new elements to the current memory world by shifting and replacing a block of 60 memories frames. The continuous updating maintains the transition in the memory world and user can see the evidence of his influence.
We display one block of past 240 to 180 frames to form the past memory stream, and the four blocks of past 240 to 1 frames to form the current memory world. The interval was tested in the design phase and it creates best connection between the current and previous users that allows him almost to see the previous one’s memories. Therefore, there is the best chance within couple friends seeing each other’s memories and occurring to the interesting interaction with social meaning. Besides, the transition is a skill displaying the delayed memories instead of showing them simultaneously. That achieves the spirit of slow technology [22], which inspires the audiences to discover the meaning of artwork by themselves, not teaches them in advance.
Figure 3. The components of a user’s memory creation
The correlation of user’s memory creation and the memory flow is shown on Fig. 3. A user’s memory blocks will be added one by one to the memory flow by the updating mechanism. The first three blocks of memory creation capturing in the Overture period are the baseline of a user’s affection. The record blocks correspond to the predesigned images by the artist for the art aesthetic. We only consider the next four blocks to analyze the previous one’s affection influence on a user, and ignore the rest blocks
40Copyright (c) IARIA, 2012. ISBN: 978-1-61208-220-2
CONTENT 2012 : The Fourth International Conference on Creative Content Technologies
48 / 98

corresponding to repeated memories. For the first time, the user sees the content and it causes him strongest feelings. For the same reason, we choose the next eight blocks which contain both previous one’s memories and self-memories, and analyze the social factor influence among them. The number of rest blocks is without limitation until the end of a user’s interaction. We propose a real-time affection analysis method to measure the user’s affection level and to verify the affection amplification effect.
C. The Affection Analysis Method
We consider the facial expression and gesture classes from Argyle’s [23] six clues of people’s positive communication behaviors and define the human affection by emotion model and activity model. In emotion model, we define the positive degree of affection by facial expression recognition method, and in activity model we identify the strong degree of affection by head motion detection. Fig. 4 shows the four possible affection states of a user. In low emotion condition, user is bored within low activity state, and is suddenly out of patience with high activity state. In high emotion condition, a user is immersed within low activity state, and is excited with high activity state.
Figure 4. Four possible affection states of a user
From the observation, no matter which activity state is, it reveals a user with positive affection in high emotion condition, and with negative affection in low emotion condition. The difference is that the strong degree of affection that people’s motions generates stronger affection than the expressions. Therefore, the flow of affection computation is shown on Fig. 2. We combine the detection results into emotion and activity scores through information fusion, and dynamically adjust the emotion score by the activity score as weighting adjustment to enhance the previous result. Finally, we come out with the affection score A (1).
ae SSA ×= , where Se ≥ threshold (1)
)( ae SSA −×= , where Se < threshold
The parameters Se and Sa are emotion and activity score, respectively. The positive value represents the positive affection of a user and the negative value means the negative affection. The threshold of emotion score 0.65 has been tested with best identification to distinguish the expressiveness and blank faces in the design phase. We further describe the adopted methods in each model.
In the emotion model, based on our previous work [24], we consider local and holistic face components. Besides, both local facial components and global face are adopted. We divide face into seven components including left eye (LE), right eye (RE), middle of eyebrows (ME), nose (NS), mouth and chin (MC), left cheek (LC), and right cheek (RC), and add upper face (UF) and holistic face (HF) components to the classification. Then we adopt manifold learning and fusion classifier to integrate the multi-component information. Given a face image I, a mapping M: Rd × c→ Rt is constructed (2), where c is the number of components, mi(.) is an embedding function learned from the manifold of component i, and Ii is a d-dimensional sub-image of the i-th component.
( ) ( ) ( ) ( )[ ]cc ImImImIM ,,, 2211 ‥‥= (2)
The multi-component information is encoded to a t-dimensional feature vector M(I), where t ≥ c. To characterize the significance of components from the embedded features, a fusion classifier F: Rt → {Positive, Negative} is used based on a binary classifier SVM. After the LDE and SVM models construction, we do face registration and feature extraction of each component. Then we project each component’s feature to the corresponding manifold models and calculate the belonging probability of each class. Finally, we combine all probabilities as a new feature vector, and use it as the input of SVM classifier to come out the final result. Through the method, the positive affection degree of each memory frame can be recognized.
In the activity model, for the continuous capturing, we adopt face tracking and head motion detection methods in each memory block. We run each memory frame through a face detection algorithm [25], and come out with the locations and sizes of all faces in the image. Then we detect face and calculate its movement to find the adapted mapping of face movement and head motion score by adjusting the variance of a Gaussian. For computing the activity score, firstly, we consider the persistent property of a calm state. We calculate the calm value of current frame inheriting from the previous adjacent frame (3).
UPcc VtStS +−= )1()( ,if static head (3)
)1(α)( −×= tStS cc , else (where α<1)
The initial value of Sc(t) is zero. The calm value increases stably without any head motion detection within
41Copyright (c) IARIA, 2012. ISBN: 978-1-61208-220-2
CONTENT 2012 : The Fourth International Conference on Creative Content Technologies
49 / 98

= #of frames that user is detected positive affections in memory blocks
# of frames in memory blocks
Positive Affection Rate
(4)
one second sliding window, otherwise it rapidly decreases α time (α=1/3 in experiment). Then we use its reciprocal as the activity score and define the strong degree of affection. When Sc is 0, we set Sa to 100 to avoid the zero divide error and define the range of affection score from -100 to 100. The higher affection score means more positive affection feedback to the corresponding memory blocks in the current memory flow; otherwise, the lower affection score represents the lesser responses. The method we proposed quantifies the affection level of a user and enhances the affection by weighting adjustment.
D. The Mirage Elements
From the social science support, the elements of Mirage are listed as following.
• Time: The memory navigation is a narrative way that echoes Ong’s viewpoints and memories which are collected from the visitors is with time sequence embedded. Besides, the updating mechanism keeps the transition with attractive and magical powers, always with unknown things to be discovered.
• Location: Nowadays the huge amounts of data are contributed without location information embedded. They drift on the internet without any meaning to others and cause the phenomenon of sense of place lost. On the contrary, the locative element binds all of the residents and forms the universe of Mirage.
• Interaction: In Mirage, the participant gives the world meaning through memory creation and changes the architecture of universe via turning it into his own world. The architecture will continue changes for another participant involving, and will turn into a new world to flatter its new master.
• Affection amplification: Through memory creation, the residents of Mirage are contacting each other even they are not really presented here in the reality. Their affections are amplified by the virtual social relationship, and it’s more obvious with the “familiar elements factor,” the self-memories and their friends’ memories.
IV. EVALUATION RESULTS
During the 37 days exhibition, we collected 347,400 useful images from 1014 participants which consisted of 5,790 memory blocks. The camera set were close to the user to capture the images with clear faces and expressions of participants, and the detail information also helped us to compute the affection elements. The special location in the culture region of Taipei city easily brings in many artists or those who are interested in art and being involved in the work. Besides, the nearby Metro station also brings a lot of travelers that also expands the diverse and dense properties of our data collection. The statistics result of the length of participants’ memory blocks is as follows: 38.06% users with less than 3 memory blocks reveal the slow technology property of the interactive device that they discovered the device by themselves and caused many small memory flows; 39.05% users with 3 to 7 blocks reveal that many of them
were interested in the past memory navigation and were aware of they are part of the memories in the memory flow; 18.34% users with 7 to 15 blocks and 4.14% users with over 15 blocks mean many users’ behaviors with high interaction properties and often with social factor influences. We observed the users interaction behaviors and found out interesting circumstances where people changed postures to find out the correlation of the delayed memory frames and played with their friends to see each other’s faces showing in the memory flow. These memory blocks often contain more than one face or interchange with the same several faces showing on Fig. 5. The virtual social relationship between the avatars in virtual memory world and them in the reality causes the interesting affection amplification. Therefore, we make two assumptions. One is that others’ affections amplify an individual’s affection. The other is that the familiar element generates strong affection amplification.
Figure 5. The memory fragments with social factor influence
We are interested in the positive influence within the virtual social relationship. Therefore, we only consider the positive affection state to define our positive affection detection rate (4), where the unit is frame.
Using the affection method to analyze the collected data from three stages we mentioned before, the statistics results shows as follows. We calculate the original affection state of all users from the average of the first three memory blocks as the baseline for comparison, and the 63.5892% average rate shows that participants are curious about the device with high participation. Then from the average of the next four blocks we get the affection state after others’ affections influences, and the 70.5610% average rate proves the first assumption that most of the users’ affections are amplified by others’ positive affections through the memory navigation. Finally, from the average of the next eight blocks define the affection state after the social factor influence, and the 74.4864% average rate reveals the evidence of the “familiar elements” influences from the self-memories or the last visitor’s memories. That reveals the evidence of social factor intervention and proves the second assumption. That is why even with the showing memory flow with low positive affection, it also amplifies the users’ affections with obvious influence. We also interviewed the participants how they felt about the memory navigation, all them thought it is interesting and they liked the novel
42Copyright (c) IARIA, 2012. ISBN: 978-1-61208-220-2
CONTENT 2012 : The Fourth International Conference on Creative Content Technologies
50 / 98

experience of seeing themselves, and especially people whom they know being shown in the memory flow.
V. CONCLUSION AND FUTURE WORKS
We designed and built the interactive device Mirage to create an open, infinite and agnostic memory world. Using the metaphor of crystal ball, the users navigate the memory world intuitively to sense the connection of the past visitors. Moreover, with the magical power gift, they influence the world and become part of it through memory creation. The collaborative behavior concretes the universe of Mirage, which consists of the memories belonged to all of the residents in the memory world. The locative media property also creates the connection of the preserved memory fragments, and forms virtual social relationship between all of the participants by sharing common memories.
We proposed a real-time affection computation system for analysis the affection amplification effect among the participants. The basic virtual social relationship constructed by the locative media plays an important role in the experiment. Their affections are amplified each other by sharing the similar experiences at the same place. Besides, the familiar elements provide obvious evidence of affection amplification. From the real-time affection meter mechanism, it enables us to add the memory fragments with high positive affection simultaneously to the showing memory flow in the next version. However, in the current version we keep the sequence of memory creation in the memory flow for observing the social factor influence.
This work can be viewed as a pilot study in the field that first focuses on the place memory, the collaborative memory creation, and the affection amplification effect. During the exhibition, we observed the interaction behaviors of the participants. Most of them really liked the novel memory navigation experiences and felt that the memory creations are indeed interesting. Besides, they were not aware of the ambient recording that ensures the accurate and authentic properties of collected data in the experiment.
The virtual social relationship can be expanded in our future work. For example, a crowd generate stronger atmosphere of a place than just single one, therefore, we can track every faces in the image to count the numbers as an affection adjustment factor. Besides, with the recent growth of number of smartphones, it’s common that people take a shot and share it to the internet immediately. For the reason, the affection analysis method can be applied to the internet photo album or the social website with locative information tagging, and provides a new display rule by human affection. With this pilot study, we believe that the development of collaborative memory brings new possibilities in the social computing field, and the human affection as the calendar of memory world helps to solve the problem of huge amount of raw data in the lifelogging field.
REFERENCES [1] W. J. Ong, “Orality and literacy: the technologizing of the
word,” Lodon. New York: Methuem, 1982. [2] MOCA Taipei. Retrived from
http://www.mocataipei.org.tw/blog/post/27649791
[3] J. Shotter, “Conversational realities: constructing life through languages,” Sage, London, 1993.
[4] J. Garcia-Zubia, J. Irurzun, I. Angulo, U. Hernandez, M. Castro, E. Sancristobal, P. Orduna, and J. Ruiz-de-Garibay, “SecondLab: a remote laboratory under second life,” Proc. Education Engineering (EDUCON 2010), IEEE Press, 2010, pp. 351-356.
[5] City-wide Performance. Retrieved from http://www.equator.ac.uk/index.php/articles/summary/c62/.
[6] Blast Theory. Retrieved from http://www.blasttheory.co.uk. [7] S. I. Salamensky, “Talk, talk, talk: the culture life of
everyday conversation,” Routledge, London and New York, 2001, article by S. Turkle and S. L. Salamensky, “Techno talk: e-mail, the internet, and other conversations,” pp. 225-246.
[8] P. Milgarm, H. Takemura, A. Utsumi, and F. Kishino,“Augmented Reality: a class of displays on the Reality-Virtually continnum,” Proc. Telemanipulator and Telepresence Technologies (SPIE), 1994, vol. 2351, pp. 282-292.
[9] S. Harrison and P. Dourish, “Re-place-ing space: the roles of place and space in collaborative systems,” Proc. ACM Conference on Computer-Supported Cooperative Work, Boston, MA, 1996, submitted for publication.
[10] J. Jacobs, “The death and life of great American cities,” Random house, New York, 1961.
[11] C. Alexander, “The timeless way of building,” Oxford University Press, New York, 1979, submitted for publication.
[12] L. Gaye, R. Maze, and L. E. Holmquist, “Sonic city: the urban environment as a musical interface,” Proc. the 2003 Conference on New Interfaces for Musical Expression, Montreal, Canada, 2003, NIME03-109.
[13] G. Lane, “Urban tapestries: wireless networking, public authuring and social knowledge,” Proc. the Forth Wireless World Conference, July 17-18, 2003.
[14] M. Crang, and N. Thrift, “Thinking space,” Critical Geographical Series, Routledge, London and New York, article by Holloway, Julian, and Kneale, J. M. Bakhtim, “Dialogics of space,” 2002.
[15] J. L. Chen, “The never ending story: a collaborative narrative Storylog,” Proc. the International Computer Symposium, 2006, pp. 745-752.
[16] M. Ende and R. Manheim, “The neverending story,” (Reprint edition), ISBN 0-14-007431-7, 12, 60, Puffin, January 1, 1993.
[17] T. Cresswell, “Place: a short introduction,” Blackwell publishing, Australia, 2004.
[18] S. Vemuri, C. Schmandt, and W. Bender, “iRemember: a personal, long-term memory prosthesis,” Proc. the 3rd ACM workshop on Continuous archival and retrival of personal experences, 2006.
[19] M. L. Lee and A.K. Dey, “Lifelogging memory appliance for people with Episodic Memory Impairment,” Proc. the 10th International Conference on Ubiquitous Computing, 2008, pp. 44-53.
[20] S. Hodges, L. Williams, E. Berry, S. Izadi, J. Srinivasan, A. Butler, G. Smyth, N. Kapur, and K. Wood, “SenseCam: a retrospective memory aid,” Proc. the 8th International Conference on Ubiquitous Computing, 2006, pp. 81-90.
[21] N. Caprani, C. Gurrin, and N. E. O'Connor, “I like to log: a questionnaire study towards accessible lifelogging for older users,” Proc. the 12th International ACM SIGACCESS Conference on Computers and Accessibility, Orlando, Fl, October 25-27, 2010.
[22] I. hallnas and J. Redstrom, “ Slow technology: designing for reflection,” Journal of Personal and Ubiquitous Computing, Springer-Verlag, 2000.
43Copyright (c) IARIA, 2012. ISBN: 978-1-61208-220-2
CONTENT 2012 : The Fourth International Conference on Creative Content Technologies
51 / 98

[23] M. Argyle, “Bodily communication,” New York: Methuen & Co. Ltd, 1988.
[24] W. Y. Chang, C. S. Chen, and Y. P. Hung, “Analyzing facial expression by fusion mani-folds,” Proc. Asian Conference on Computer Vision Conference, 2007.
[25] P. Viola and M. J. Jones, “Robust real-time face detection,” Proc. International Journal of Computer Vision, 57(2), 2004, pp. 137-154.
44Copyright (c) IARIA, 2012. ISBN: 978-1-61208-220-2
CONTENT 2012 : The Fourth International Conference on Creative Content Technologies
52 / 98

Enduring Cultures – A Socio Cultural Toolkit
Shweta Verma Industrial Design Centre
Indian Institute of Technology Bombay Mumbai, India
Schubert Foo, Natalie Pang Centre of Social Media Innovations for Communities
Nanyang Technological University Singapore
[email protected], [email protected]
Abstract – In the mad rush of modernization and the blind aping of Western manners, the East Indians (Roman Catholic ethnic group from the west coast of India) are slowly but steadily losing count of some of their most cherished customs and conventions, and are at the risk of being lost forever. ‘Enduring Cultures’ is an approach to cultural heritage preservation and protection of indigenous knowledge with an emphasis on local community participation and collaboration via social media. This paper presents a design recommendation of a work-in-progress system that aims at engaging the community together while creating a platform for generating and broadcasting content that is central to the community’s cultural identity.
Keywords – social tools; community; cultural computing; preservation; collaborative; culture; web; mobile; user generated content; East Indians; Mumbai.
I. INTRODUCTION - THE EAST INDIANS AND THEIR CULTURE
The East Indians are indigenous to the west Konkan coast of India and owe their nomenclature not to natural growth but to a change of religion. Under the Portuguese rule in the 16th century, several villages were evangelised and many accepted the Catholic faith [1].
Much later, by the adoption of the name `East Indian’ they wanted to impress upon the British Government of Bombay that they were the earliest Roman Catholic subjects under the British Crown in this part of India [2].
This conversion was the main foundation of this Marathi Christian community making it a culturally rich amalgamation of pre-christian traditions and adaptations from Christianity. Their manners, customs and social mores rendered them a community absolutely apart from all the other Indian communities and have unique daily practices ingrained in their religion, villages, language, dressing, cuisine, music, matchmaking and their occupation.
Figure 1 shows a series of photographs from the community depicting worship, costume, family and living.
Figure 1. The East Indians of Mumbai, India.
II. OPPORTUNITIES AND NEED GAPS Although cultures themselves are dynamic and
evolving, they are fragile when faced with political, social and economic changes [3]. For example, large-scale migration patterns of communities moving out from rural into urban areas have resulted in many social practices being eroded and lost.
For generations, oral tradition kept the elaborate social mores and traditional practices of the East Indians alive. With modernisation, communities are now faced with difficulties in maintaining their own culture and encouraging the newer generations to recognise their own cultural heritage as being worthy of preserving and passing on to future generations.
Today, as their coastal villages get increasingly urbanised, the small community is struggling to preserve their oral traditions in religion, matchmaking, dressing, cuisine, music and other unique cultural identities that rendered them a community in the first place.
Need gaps are critical in the face of information sourcing, dilution of cultural roots due to migration and
45Copyright (c) IARIA, 2012. ISBN: 978-1-61208-220-2
CONTENT 2012 : The Fourth International Conference on Creative Content Technologies
53 / 98

fragmentation of the community leading to loss in collective identity.
III. ISSUES WITH CURRENT INITIATIVES Currently there are very few social media initiatives
available for culture preservation or to shape and impart cultural practices. At best, only traditional portals like Facebook and Youtube to upload and share information amongst community members are in use. Some initiatives have been taken by the East Indian Association to create an online system for social interaction and general community awareness [4]. Figure 2 is a screenshot of the home page of the East Indian Community system.
Most East Indians belong to the middle of the pyramid economic group. They generally lack the resources or the knowledge to access and participate in such portals. The most familiar mode of communication is the mobile phone (that are usually feature phones or entry level smart phones), which is primarily used for voice calls or SMS. Being in close vicinity to more urban localities, the community is also equipped with Internet facilities.
Despite the availability of infrastructure, there is still a lack of participation from the majority of the community due to the preference of in-person communication and lack of digital media devices that can address the needs of the community.
There is also another section of the younger generation of the community, which, under the influence of education and modernisation, is now adapting popular media. The varied technological adoptions within the community and the generation gaps are the critical reasons for the obliteration of cultural identity.
IV. DESIGN FOR DIALOGUE Culture preservation is presently dominated by the
documentation of tangible forms of culture. ‘Enduring Cultures’ addresses more than material preservation and incorporates the vital elements of everyday experiences in living culture.
Using traditional means of communication and technology readily available to the villages belonging to the middle of the pyramid, the concept aims at creating a multi-local society bridging the gap between the local villages and the migrants to the much modern localities. The concept also aims at creating tangibility on the web so as to reach to a wider global audience.
It allows indigenous people take the lead in data collection as well as utilization by choosing what they perceive as important, wish to preserve and pass on.
Figure 3 provides an overview of the concept model. In this model, the main goal is to first encourage the contribution of community information by users in various forms and formats. Information contributed are tagged, organized and stored in a culture repository that support the key functions for the community to learn, pass on and sustain themselves. The model’s second thrust is to engender community interaction through co-creation and collaboration.
V. DETAILS OF THE SYSTEM The idea proposed is that of a web application that
extends onto mobiles, desktops and public displays
Figure 3. Concept Model
Figure 2. Home page of the East Indian Community website
(www.east-indians.com)
46Copyright (c) IARIA, 2012. ISBN: 978-1-61208-220-2
CONTENT 2012 : The Fourth International Conference on Creative Content Technologies
54 / 98

creating a self-authored and sustaining culture repository that allows users to capture, collaborate and co-create.
The system consists of four distinct segments that work together to give a holistic experience to the users.
A. Contribution of Content Users may upload any content they consider unique to
their cultural identity. For this purpose, users may use any medium most preferred by them like voice, text, video, photo, online link, and others.
B. Tagging of Uploaded Content Any content contributed by a user undergoes a process
of smart tagging so as to identify and distinguish the key characteristics of the content. Moreover, users may manually input additional tags to their content to facilitate data aggregation. These user-generated tags make the system more robust and flexible.
C. Self Organisation of Data The next step is that of self-organisation of tagged
content into media rich (audio, video, stills and text) sets called ‘Frames’ of common topics. Dynamic organisation of data helps users navigate through the culture repository more effectively thus allowing exploration and discovery of new information.
D. Sharing Consolidated ‘Frames’ Users may interact with this self-authored culture
repository by browsing, sharing, printing or posting individual sets of related topics while gaining and sharing culture rich information. Figure 4 shows the use of the bulletin board concept for organizing information for viewing, browsing and interacting. The display changes as new information is contributed and as more hits to popular information artifacts are accumulated.
The above-mentioned functions take place over an ecosystem comprising of three components described as follows (see Figure 5):
A. Mobile and Desktop - A mobile application (which works as a layer on the in-built applications) and a desktop widget (with offline support) for tagging and uploading content on the go. They are essentially used for reporting anything happening in the community that will be of interest to or considered worth noticing by the other members of the community.
B. Web Interface - A web repository for viewing and using the consolidated content. With this interface the users may: - Receive SMS notifications about happening in
and around their locality.
- View a live map of tags and uploads and identify cultural hotspots based on the nature of the content being uploaded by the members of the community of a particular neighbourhood.
- Promote and collaborate on upcoming events, broadcast announcements and raise concerns.
- Create ‘tag shortcuts’ for the particular sets or ‘Frames’. This way when the user chooses to upload new content, they can quickly use the shortcut to automatically add the tags to the content.
C. Public Display - This is envisaged to be a touch screen interface with interactive support through SMS facility to be put up at community centres. The public display targets users without the necessary resources to access content on the web and acts as a trigger for in-person interaction and an evidence of their varied cultural identities. In addition to display of information the interactive screen can also be wirelessly connected for printing the content that the system generates using individual contributions of the members of the community. Users may alternatively choose to receive a link to the content of interest via SMS or email for future use.
Figure 4. An Illustration of Data Contribution and Consolidation
Figure 5. Three components – Mobile, Web and Public Display
47Copyright (c) IARIA, 2012. ISBN: 978-1-61208-220-2
CONTENT 2012 : The Fourth International Conference on Creative Content Technologies
55 / 98

Moreover, the screen may also be transformed into one large monitor for viewing movies, live events and videos of community interest during community meetings, social gatherings or cultural events.
VI. TAGGING PROTOCOL FOR DATA ORGANISATION To allow seamless data aggregation and retrieval, the
tagging system has been defined using the following tag types:
A. Category - Pre-defined tag sets of cultural identities. Allow broad categorisation of content while placing in a Frame.
B. Keyphrase - A phrase describing the contribution. Smart words within the phrase act as the primary tag during retrieval.
C. Variable - Secondary tags that boost content aggregation. Multiple variables foster meaningful predictions while displaying content.
By allowing certain pre-defined categories and certain user-generated variables, the system attempts to create a balance, giving the users adequate amount of freedom to share their thoughts and support for assuring their content falls in the right set or Frame. The system uses these tags to dynamically organize data by combining, rearranging and replicating uploaded content into various Frames and exhibit the same as per the demand of the user.
VII. CONCLUSION AND FUTURE WORK The proposed idea defines a standard protocol for
contribution of content that can be most easily adopted by majority of the users, taking into consideration the varied levels of technological know-how amongst the users. The system also allows for seamless user-content interaction and viewing of the user generated content in different contexts (eg. view according to time, media, locality, tags or other variables).
While the platform provides assistance in observing, collecting, recording, and using data, it gives the members of the community freedom to choose and select the information, expressions and rituals that they perceive as important. This in-turn promotes a true sense of belonging while encouraging the people to recognise the significance of their own cultural heritage.
This social application is accessible to the masses, yet functional enough to address the social needs of communities that are at risk of quickly disappearing.
In order to further refine the concept, high fidelity user interfaces were designed and detailed for the various components of the system keeping in mind the varied levels of technical know-how amongst the users of the system (see Figure 6).
A focus group session with six participants from the community aged 35-50 years conducted in the contextual environment on this aspect of the work suggests that the system encourages the users to notice their surroundings from a culture preservation point of view. People were more conscious of aspects of their daily life pertaining to
their culture, which otherwise go unnoticed. Few users requested to see a list of tags and keywords used by others so as to trigger imagination while uploading new content. Variable tags were used as means of providing additional information about the content as opposed to describing the content. Users were also interested in viewing their contribution placed in different Frames with different interpretations.
We are currently developing a prototype of the system. As part of user studies and follow on work, we will carry out a series of iterations and refinements to gauge the usability and user interactions of the system in order to evolve the system into a highly intuitive system to serve the multi-local yet traditional community.
ACKNOWLEDGEMENT
The data discussed in this paper is part of a research project funded by the National Research Foundation (NRF) and managed through the multi-agency Interactive & Digital Media Programme Office (IDMPO) hosted by the Media Development Authority of Singapore (MDA) under Centre of Social Media Innovations for Communities (COSMIC).
REFERENCE
[1] Gazetteer or India, Maharashtra State, Volume I, II & III -http://www.maharashtra.gov.in/pdf/gazeetter_reprint.html [Retrived: January, 2012]
[2] Baptisa, E. (1967). The East Indians: Catholic
Community of Bombay, Salsette and Bassein. Mumbai: Bombay East Indian Association
[3] Czermak, K., Delanghe, P., & Weng, W. (n.d.).
Preserving intangible cultural heritage in Indonesia. [4] Bombay East Indian Association –
http://www.eastindians.com/beia.htm [Retrieved: February, 2012]
Figure 6. Interface design of the system - Frame
48Copyright (c) IARIA, 2012. ISBN: 978-1-61208-220-2
CONTENT 2012 : The Fourth International Conference on Creative Content Technologies
56 / 98
Collective Intelligence Utilization in the Scope of Personal Learning Environment
Danguolė Rutkauskienė
Research Laboratory of E-Learning Technologies
Kaunas University of Technology
Kaunas, Lithuania
Andrej Afonin
Research Laboratory of E-Learning Technologies
Kaunas University of Technology
Kaunas, Lithuania
Abstract-Personal Learning Environment (PLE) is an emerging
concept in the field of learning technology. PLE allows users to
aggregate information from distributed Web 2.0 services and
organize it in the way that it is convenient for learners. Despite
the fact, that PLE uses distributed social services as information
source and by the nature of its design, it is a type of virtual social
community; the social component is used very poorly in the scope
of PLE. A new model of “wisdom of the crowd” utilization is
presented in this paper. The exclusive feature of this method is
both aggregated and generated information sources analysis,
allowing developing more precise digital identity and its’
further use for appropriate learning sources discovery.
Keywords-virtual social communities; personal learning
environment; social software; Web 2.0.
I. A CONCEPT OF PERSONAL LEARNING ENVIRONMENT
The notion of Personal Learning Environment (PLE) appeared as a result of discussion among experts in different fields regarding the future of Virtual Learning Environments [1]. Virtual Learning Environments were seen as a fenced garden without any connection with other virtual environments, which are used by students for information collection and results dissemination [2]. On the opposite, Personal Learning Environments were rather seen as platforms for content aggregation from different contexts were learning takes place, such as home, workplace or educational institution [2]. However, there is still no commonly accepted definition of what is a PLE.
Some researchers see a PLE as a predefined set of software tools, which are used by learners to organize their learning process. Thus, Mark van Harmelen from Manchester University defines PLE as a single learner’s e-learning system, which provides access to different e-learning resources and/or personal or virtual learning environments used by students and teachers [3]. Other researchers use PLE as a metaphor to describe modern student’s online activity and environment. Graham Attwell’s definition of PLE refers not only to software tools, but also to peripheral devices, that could ensure learning continuity outside the institution boundaries, such as mobile phones, laptops or portable music players [4]. Despite the fact that explicit definition of PLE is still under consideration, still a common feature could be highlighted – personal learning environment passes the control of learning process to the learner himself.
PLE design and implementation is a topic of hot discussions as well. Nial Sclatter [5] distinguishes researchers to three groups with their own perspectives and functionality vision. According to the first group, PLE has to be implemented as a desktop application and serve as intermediate node between learner and online services [6]. In their perspective, PLE is a learner’s owned software application, which communicates with distributed educational web services and databases on service oriented bases. The second initiative group’s vision is that the PLE construction is based only on Internet browser, using either separate online services, or integrated online environments, that aggregates different kind of information from distributed, mostly Web 2.0, services, such as blogs, wiki, social bookmarking, multimedia sharing and others services, that enable students’ collaboration and organizational activities. This group has most successors. Third group of researchers state that personal learning environment is not only a piece of software, but the complex infrastructure, which combines both software applications and distributed web services and technical equipment, and the main goal is to propose suitable teaching and learning methods for successful infrastructure exploitation and focus more on use cases and learning scenarios [4], [7].
A PLE is a self-directed and self-controlled learning environment with social media background, which aggregates information from distributed, mostly Web 2.0, services, and allows organizing received information in the way that matches the learner’s needs in the most sensible way.
This paper presents a new approach on how to use Web 2.0-based collective intelligence in the scope of PLE. The definition of PLE has been introduced earlier on; next, a brief introduction to social media and hidden social structures in the background, types of relationships and their building principles. Section three introduces proposed method and explains its working principles in detail. Section four describes how the method was implemented in practice and shows the results that have been achieved. A case study finalizes the whole article.
II. SOCIAL MEDIA AND THE ROLE OF CONNECTIONS
THERE
The previous analysis of PLE concept unveiled that due to its nature, PLE is a type of social media. In order to understand the nature of ongoing processes, an analysis on
49Copyright (c) IARIA, 2012. ISBN: 978-1-61208-220-2
CONTENT 2012 : The Fourth International Conference on Creative Content Technologies
57 / 98

social media is required. There are two major types of social media [8]:
1. Social networks 2. Online communities Everyone has their social networks (whether online or
offline) (Fig. 1). Social networks consist of friends, family, co-workers and people they are acquainted with. Social networking sites are simply making these networks visible. The most important difference between social networks and online communities is how people are held together on these sites. People are held together by pre-established interpersonal relationships, such as classmates, friends, co-workers, etc., on social network sites. Connections as these are made to last. People join social networking sites to maintain old relationships and establish new connections as well [8].
Figure 1. Structure of Social Network [8].
Unlike social networks, communities are held together by common interests (Fig. 2). It can be a mutual hobby, a common project or a goal, the way of life or a profession. People participate in online communities, because some members feel they can contribute to the community with their experience, while others feel they can benefit from being there. It is common for an individual to be a part of more than one community. Moreover, communities can overlap and are often nested [8].
Examples of the structure of social network and online community are presented in Fig. 1 and Fig. 2. Individuals are shown as red nodes in these pictures, and lines between those nodes represent relationships, that people establish between each other. However, the nature of these relationships is slightly different. A relationship in social network represents, that two people are members of the same social structure and have established connection there: it could be family, friends, co-workers, etc. However, it’s hard to say without additional metrics, on how useful this relationship is to both sides, how strong it is, it is constant or happened only once. Relationships in online communities, on the other hand, are
built in the same field and are related by the same interest. Relationships, of such type suite better, if there is an intension of using these connections for educational purposes.
Figure 2. Structure of social community [8].
The lifecycle of every relationship consists of three stages (Fig. 3): 1) creating the weak tie: the first step of any relationship; 2) building up the tie strength: transformation of weak ties into strong relationships; 3) maintaining the relationship: preventing strong relationships from eroding and reverting back to weak ties [9].
Figure 3. Lifecycle of Relationship [9].
A weak tie could be created both in social networks and in online community. The formation of weak ties between two people depends on their desire to connect, the amount of communities they share in common and the network distance between them. But tie strength predominantly is built in communities. What builds strong relationship within
50Copyright (c) IARIA, 2012. ISBN: 978-1-61208-220-2
CONTENT 2012 : The Fourth International Conference on Creative Content Technologies
58 / 98

communities is the combination of frequent engagements, deep interactions, and the time spent together. If relationships are well developed, they become a part of person’s social network. So, communities are needed for transforming weak ties into strong ones, and social networks are for maintaining and sustaining these relationships [10][11].
An approach of utilizing personal social network is proposed by Facebook social evangelist Eric Fisher and is called Social Design Strategy [12]. Social design consists of three core components: identity, conversation and community, in other words, the person himself, the other people and the conversations between the person and the other people. In the diagram (Fig. 4), identity is put to the center, conversation is in the middle and community is on the outside. Conversation is a media that serves as glue between the identity and the community. The conversation is the way people express their identities to the community and receives feedback from it.
Figure 4. Social Design Diagram [12].
Fisher [12] proposes to start from the center and work the way out, during the process of designing a social product. That is, to allow people to create their identity, talk about it and build community over the time.
However, over the time, he proposes to take the reverse approach and work from the outside in. That is to utilize the community, define new types of conversations and to perform further identity updates.
III. “IDENTITY-NETWORK-PROPOSAL” MODEL
The analysis of relationship development in social networks and online communities, as well as analysis in social design strategy allows defining general a model of collective intelligence utilization. A general method is to
construct digital identity, create weak ties with other members, turn weak ties to strong relationships and maintain these relationships. This section presents the potential of proposed method of PLE’s collective intelligence for hidden network composition and its’ further utilization for learning purposes.
The problem, in the scope of PLE, is weak ties establishment and their conversion into strong relationships, as PLE is a single persons’ environment. Nevertheless, PLE by its design nature aggregates data mainly from distributed Web 2.0 services, meaning that social network or community could be established on distributed services side. Proposed model allows overcoming this shortage and using collective intelligence potential, accumulated in social software services, in a scope of single person’s environment.
General model (Fig. 5) working principle is as following: the first step is to develop the digital identity of the person. In order to do that, the method proposes to separate and analyze 2 sources of information: users’ aggregated content (source of knowledge) and users’ generated content (reflection on learning process). Similar digital identities are created to all PLE platform users. The map of digital users’ identities is created after the first step. The second step is finding users with similar digital identities and mapping them to each other. This step composes artificial communities that are based on users’ interests, thus creating weak ties between users. The third step is turning weak ties into strong relationships. In order to do this, users are prompted with other users’ operated content. A constant monitoring of user’s activity is performed and logged. If users get interested in proposed content (clicks proposed data for further information, adds to favorites, etc.) the weak tie between these two users is labeled as strong relationship. At the same time, users’ digital identities and connections between them are updated with new information.
Figure 5. Identity-network-proposal model.
A more detailed model analysis is presented below.
A. Step 1. Digital identity development.
Main source of users’ information is distributed Web 2.0 services, aggregated in the scope of PLE platform [13]. Every aggregated Web 2.0 service item usually comes with metadata that is called tags. Tagging is an inexpensive and easy way of using the wisdom of the crowd and making resources visible and sortable [16].
51Copyright (c) IARIA, 2012. ISBN: 978-1-61208-220-2
CONTENT 2012 : The Fourth International Conference on Creative Content Technologies
59 / 98

Figure 6. Tag list.
Tag is a metadata about the element that allows working with data in a more convenient way. A set of separate tags is called a tag cloud. Usually, tags in a tag cloud are visualized in different sizes, meaning that the tag with bigger size was used more often. The structured list view (Fig. 6) with tags and their usage density shows a clear picture of users’ interests. At this stage, all platform users are merged to common matrix (Table I).
TABLE I. COMMON USERS’ INTERESTS MATRIX
User1 User2 User3 User4 User5 User6
web 2.0 6 5 1 2 6 3
education 3 4 9 5 3 2
technology 5 6 8 5 3
software 6 2
.net 5
learning 4 2
python 4
management 6
hr 4
programming 5 2
In order to develop a more explicit users’ profile, the
presented method proposes the usage of two types of metadata. The first type of the metadata comes in a form of tags pinned to Web 2.0 services elements. Generally, it is users’ aggregated content: links from social bookmarking services, podcasts, vodcasts and “youtube” type videos, and other structured information. Second part of the metadata comes from users’ generated content. At this stage, the method proposes to analyze and extract metadata from users’ reflections on learning activities that they post in their blogs and wikis. The aggregated type of metadata corresponds to knowledge gained during the learning process. Another important part of learning process is reflection, which corresponds to users’ generated data. As reflection
information comes as a text (blogs, wiki, etc.) this information is analyzed and another set of metadata is generated.
Both types of metadata (aggregated and generated) are combined in a common user’s interest matrix with the same weight (Table I). Such approach allowed defining more explicit user’s profile, which not only combines consumed, but also created contents, that correspond the gained knowledge and reflection during the learning process.
B. Step 2. Implicit network composition.
This stage is responsible for the composition of weak ties. At the beginning there is no activity between users, thus there is no possibility to define these ties upon their actions. Therefore, weak ties between the users are defined using collective intelligence algorithms. In this case, an algorithm is used, that calculates Pearson correlation (1) [18] between all users.
))(
)()(
(
2
2
2
2
N
YY
N
XX
N
YXXY
r
(1)
The result of calculations is shown in Table II.
TABLE II. PEARSON CORERLATION MATRIX
User1 User2 User3 User4 User5 User6
User1 1 0.6546 -0.826 -1.0 1.0 0.9449
User2 0.6546 1 0.1705 -1.0 0.6546 0.866
User3 -0.826 0.1705 1 1.0 -0.8260 -0.596
User4 -1.0 -1.0 1.0 1 -1.0 -1.0
User5 1.0 0.6546 -0.8260 -1.0 1 0.6882
User6 0.9449 0.866 -0.596 -1.0 0.6882 1
The results of Pearson correlation algorithm illustrate that
the biggest coefficient and, accordingly, biggest similarity have user pairs (User4, User3), (User1, User6), (User2, User6), (User5, User6) and (User1, User2), and the smallest similarity is between users (User1, User4), (User2, User4), (User4, User5), (User4, User6), (User1, User3) and (User3, User6).
Based on Pearson coefficient calculations, a set of users with similar preferences is made for every user. A set of similar users to User1 is presented in Table III.
TABLE III. USERS SIMILAR TO USER1
User Similarity coefficient
User5 1.0
User6 0.9449111825230654
User2 0.6546536707079769
Data on Table III show users with similar interests as
User1 are User5 (1.0), User6 (0.94) and User2 (0.65). It means that there are weak ties between User1 and User5, User6 and User2.
Such matrixes are calculated for every platform user. After this step weak ties are established between all users with similar interests.
52Copyright (c) IARIA, 2012. ISBN: 978-1-61208-220-2
CONTENT 2012 : The Fourth International Conference on Creative Content Technologies
60 / 98

C. Step 3. Information tracking and proposal.
The last step is responsible for converting weak ties into strong relationships. To do this, an appropriate user is prompted with information, operated by another user from similarity set. If the user responds to proposed information (clicks a link, saves to favorites, etc.), the weak tie get additional weight (gets +1 point) and is turned into strong relationship.
TABLE IV. USER1 STRONG RELATIONSHIPS TABLE
User5 User6 User2
User1 11 8 5
Relationships with bigger weight are considered more
valuable. This weight affects information flow that is prompted for user later. Also, at this stage user’s digital identity information is appended with new metadata according to his shown interests. This updated information is used to discover new weak ties.
IV. METHOD EVALUATION
Big players like Google, Facebook or eBay use collective intelligence utilization approach in their products. Nonetheless, their methods are not published and are held as commercial secrets. Such companies publish only general guidelines, like social design strategy, which was overviewed in the second chapter on this paper.
On the other hand, collective intelligence utilization methods are not applied in online education systems so far. That is why there are no legitimate numbers to compare with.
The proposed method could be implemented in any PLE platform. For the proof of the concept, method was implemented and tested in open source PLE platform “Dropthings” [17]. Principal schema of method implementation is illustrated in Fig. 7.
PLE
Widget A1
Aggregated
data
analyzer
Add \ editAdd \ edit
Add \ editGet
Recommendation widget
Widget An
Add \ edit
Aggregated content
Get
Get
Widget G1
Generated
data
analyzer
Add \ edit
Widget Gn
Add \ edit
Generated content
Get
Get
Web 2.0 service SA1
Get
Web 2.0 service SAn
Web 2.0 service SA1
Web 2.0 service SAn
Add \ editGet
Digital
Profile
Agent
Profile database
Users
relationships
manager
recommendations
management
Reaction
Content
Distributed Web 2.0 services
Add \ editGet
Figure 7. Method implementation in a scope of PLE.
As Fig. 7 illustrates, selected for the proof of the concept “Dropthings” PLE platform is a widget based aggregation platform. As the method suggests, widgets are divided to two groups: ones used to aggregate content (social bookmarking, YouTube videos, etc.), and those, which are used to reflection (blogs, wiki). Each group has separate analysers. Aggregated data analyser extracts tags from Web 2.0 items and passes them to the digital profile agent. Generated content analyser scans user’s generated text information and extracts keywords from there, and passes them to the profile agent. The profile agent is responsible for digital identity storage. The relationships manager analyses profile information at the beginning and afterwards finds similar users according to theirs interests. That is how weak ties are established. The recommendation manager uses these ties to find potentially useful data and propose it to the user in recommendation widget. If proposed information is useful for the user, and he clicked proposed link, appropriate information is send to the relationships manager. The relationship manager adds addition weight to that relationship and turns it into strong connection, meaning, that from now on they will see more information from each other. Weak ties expire after predefined time, if they do not get additional weight.
In order to evaluate proposed approach, the survey was made among users, to find out, if this method allows students to discover useful information. Survey results revealed that 31% of users found such prompted help ‘extremely useful’, 57% stated that it was ‘reasonably useful’ and only 12% stated that it was ‘useful occasionally or not useful at all’.
V. CASE STUDY IN CONNECT PROJECT
CONNECT [15] social learning and virtual community platform implements WEB-based social networking tools and it has been built by free Software applications (liferay). CONNECT is an international online community where everyone can find opportunities and stimulus to test oneself, to find chances of self-training either on one's own or with others, to increase own competencies in an informal way by exploiting the peer's experiences.
Project partners from Italy, Czech Republic, Spain, France, Germany, United Kingdom and Norway has their national communities but more than that they can connect to the transnational community which can be joined by anyone. The Connect project aim at creating a virtual environment is useful for all people who are at risk of exclusion from the labour market. Are they women in maternity leave, people over fifty, immigrants or whatever, the net may provide various chances to re-launch themselves. The Web 2.0 simplifies ways of creating own website at a low cost. It provides easy tools to promote oneself and own competencies in a very attractive and multimedia way. It offers applications to broadcast oneself easily on the net, contributing with opinions, discussions and products.
As Fig. 8 illustrates, there is a possibility of finding new ideas, as well as possibility of taking part in discussions and expressing oneself. There is also an opportunity to look up for relevant information which was placed in the website by other users.
53Copyright (c) IARIA, 2012. ISBN: 978-1-61208-220-2
CONTENT 2012 : The Fourth International Conference on Creative Content Technologies
61 / 98
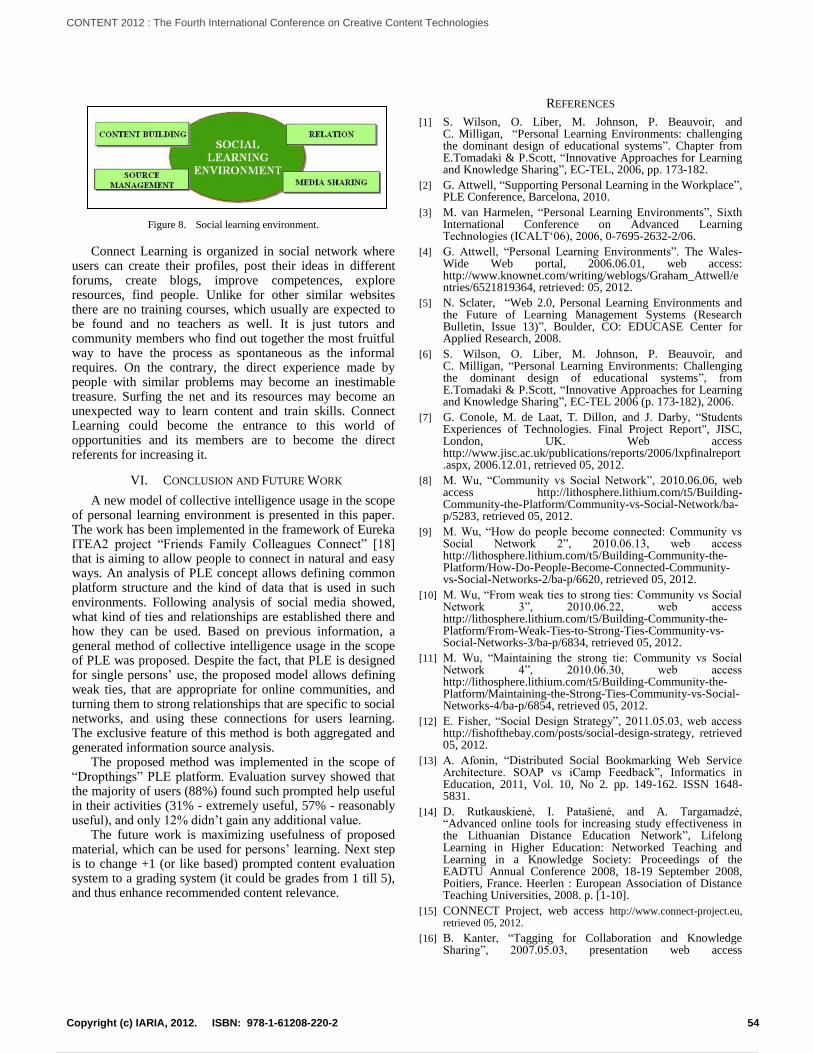
Figure 8. Social learning environment.
Connect Learning is organized in social network where users can create their profiles, post their ideas in different forums, create blogs, improve competences, explore resources, find people. Unlike for other similar websites there are no training courses, which usually are expected to be found and no teachers as well. It is just tutors and community members who find out together the most fruitful way to have the process as spontaneous as the informal requires. On the contrary, the direct experience made by people with similar problems may become an inestimable treasure. Surfing the net and its resources may become an unexpected way to learn content and train skills. Connect Learning could become the entrance to this world of opportunities and its members are to become the direct referents for increasing it.
VI. CONCLUSION AND FUTURE WORK
A new model of collective intelligence usage in the scope of personal learning environment is presented in this paper. The work has been implemented in the framework of Eureka ITEA2 project “Friends Family Colleagues Connect” [18] that is aiming to allow people to connect in natural and easy ways. An analysis of PLE concept allows defining common platform structure and the kind of data that is used in such environments. Following analysis of social media showed, what kind of ties and relationships are established there and how they can be used. Based on previous information, a general method of collective intelligence usage in the scope of PLE was proposed. Despite the fact, that PLE is designed for single persons’ use, the proposed model allows defining weak ties, that are appropriate for online communities, and turning them to strong relationships that are specific to social networks, and using these connections for users learning. The exclusive feature of this method is both aggregated and generated information source analysis.
The proposed method was implemented in the scope of “Dropthings” PLE platform. Evaluation survey showed that the majority of users (88%) found such prompted help useful in their activities (31% - extremely useful, 57% - reasonably useful), and only 12% didn’t gain any additional value.
The future work is maximizing usefulness of proposed material, which can be used for persons’ learning. Next step is to change +1 (or like based) prompted content evaluation system to a grading system (it could be grades from 1 till 5), and thus enhance recommended content relevance.
REFERENCES
[1] S. Wilson, O. Liber, M. Johnson, P. Beauvoir, and C. Milligan, “Personal Learning Environments: challenging the dominant design of educational systems”. Chapter from E.Tomadaki & P.Scott, “Innovative Approaches for Learning and Knowledge Sharing”, EC-TEL, 2006, pp. 173-182.
[2] G. Attwell, “Supporting Personal Learning in the Workplace”, PLE Conference, Barcelona, 2010.
[3] M. van Harmelen, “Personal Learning Environments”, Sixth International Conference on Advanced Learning Technologies (ICALT‘06), 2006, 0-7695-2632-2/06.
[4] G. Attwell, “Personal Learning Environments”. The Wales-Wide Web portal, 2006.06.01, web access: http://www.knownet.com/writing/weblogs/Graham_Attwell/entries/6521819364, retrieved: 05, 2012.
[5] N. Sclater, “Web 2.0, Personal Learning Environments and the Future of Learning Management Systems (Research Bulletin, Issue 13)”, Boulder, CO: EDUCASE Center for Applied Research, 2008.
[6] S. Wilson, O. Liber, M. Johnson, P. Beauvoir, and C. Milligan, “Personal Learning Environments: Challenging the dominant design of educational systems”, from E.Tomadaki & P.Scott, “Innovative Approaches for Learning and Knowledge Sharing”, EC-TEL 2006 (p. 173-182), 2006.
[7] G. Conole, M. de Laat, T. Dillon, and J. Darby, “Students Experiences of Technologies. Final Project Report", JISC, London, UK. Web access http://www.jisc.ac.uk/publications/reports/2006/lxpfinalreport.aspx, 2006.12.01, retrieved 05, 2012.
[8] M. Wu, “Community vs Social Network”, 2010.06.06, web access http://lithosphere.lithium.com/t5/Building-Community-the-Platform/Community-vs-Social-Network/ba-p/5283, retrieved 05, 2012.
[9] M. Wu, “How do people become connected: Community vs Social Network 2”, 2010.06.13, web access http://lithosphere.lithium.com/t5/Building-Community-the-Platform/How-Do-People-Become-Connected-Community-vs-Social-Networks-2/ba-p/6620, retrieved 05, 2012.
[10] M. Wu, “From weak ties to strong ties: Community vs Social Network 3”, 2010.06.22, web access http://lithosphere.lithium.com/t5/Building-Community-the-Platform/From-Weak-Ties-to-Strong-Ties-Community-vs-Social-Networks-3/ba-p/6834, retrieved 05, 2012.
[11] M. Wu, “Maintaining the strong tie: Community vs Social Network 4”, 2010.06.30, web access http://lithosphere.lithium.com/t5/Building-Community-the-Platform/Maintaining-the-Strong-Ties-Community-vs-Social-Networks-4/ba-p/6854, retrieved 05, 2012.
[12] E. Fisher, “Social Design Strategy”, 2011.05.03, web access http://fishofthebay.com/posts/social-design-strategy, retrieved 05, 2012.
[13] A. Afonin, “Distributed Social Bookmarking Web Service Architecture. SOAP vs iCamp Feedback”, Informatics in Education, 2011, Vol. 10, No 2. pp. 149-162. ISSN 1648-5831.
[14] D. Rutkauskienė, I. Patašienė, and A. Targamadzė, “Advanced online tools for increasing study effectiveness in the Lithuanian Distance Education Network”, Lifelong Learning in Higher Education: Networked Teaching and Learning in a Knowledge Society: Proceedings of the EADTU Annual Conference 2008, 18-19 September 2008, Poitiers, France. Heerlen : European Association of Distance Teaching Universities, 2008. p. [1-10].
[15] CONNECT Project, web access http://www.connect-project.eu, retrieved 05, 2012.
[16] B. Kanter, “Tagging for Collaboration and Knowledge Sharing”, 2007.05.03, presentation web access
54Copyright (c) IARIA, 2012. ISBN: 978-1-61208-220-2
CONTENT 2012 : The Fourth International Conference on Creative Content Technologies
62 / 98

http://www.slideshare.net/kanter/tagging-for-collaboration-and-knowledge-sharing, retrieved 05, 2012.
[17] DROPTHINGS, Open source platwork, http://dropthings.codeplex.com, retrieved 05, 2012.
[18] Eureka ITEA2 project “Friends Family Colleagues Connect” proposal, web access
http://www.itea2.org/project/index/view/?project=10022, retrieved 05, 2012.
[19] T. Segaran, “Programmming Collective Intelligence”, O’Reilly Media, Inc., 2007. ISBN-10: 0-596-52932-5, ISBN-13: 978-0-596-52932-1.
55Copyright (c) IARIA, 2012. ISBN: 978-1-61208-220-2
CONTENT 2012 : The Fourth International Conference on Creative Content Technologies
63 / 98

Developing Virtual Social Communities Lessons Drawn from Two Indian Social Communities
Schubert Foo Wee Kim Wee School of Communication and
Information Nanyang Technological University
Singapore [email protected]
Samantha Vu Centre of Social Media Innovations for Communities
Nanyang Technological University Singapore
Natalie Pang Wee Kim Wee School of Communication and
Information Nanyang Technological University
Singapore [email protected]
Shweta Verma Industrial Design Centre
Indian Institute of Technology Bombay Mumbai, India
Abstract — This paper presents two case studies of how the Bohra community and the East Indian community in Mumbai, India make use of social tools that include their own customized community online portals, Facebook and YouTube to create and manage social content for their respective communities. The aim is to contrast and identify learning points with regard to the usefulness and effectiveness of social tools for community engagement, and to infer design and development factors for building social innovations for communities in the future. The findings suggest that five areas are of particular importance: (1) Content and knowledge creation, (2) Preservation of cultural identity, (3) Design for social structures, (4) Engendering community trust, and (5) Adapting appropriate integrated-hybrid models.
Keywords – social tools; community; Bohra; East Indian; Mumbai; online portal; social innovation; community engagement; knowledge; cultural identity; trust
I. INTRODUCTION This paper presents a baseline study of a research project
by the COSMIC (Center of Social Media Innovations for Communities) at NTU (Nanyang Technological University, Singapore) which focuses on developing social media tools and innovations for developing communities, specifically for India’s middle of the pyramid population. As part of this endeavour, this preparatory study employed a series of field interviews on a sample of community respondents to explore how two contrasting communities in Mumbai, namely, the India-Dawoodi Bohra and the East Indians, adopts certain social tools in preserving their community identity and maintaining their everyday social practices as exemplary cases whereby learning points can be drawn for building social tools for communities in the future. Semi-structured interviews with key informants and community gatekeepers are used, with each interview lasting between one to two
hours. Each interview is also transcribed and content analysed using a line-by-line coding approach, to understand how community portals are used.
Before proceeding, it is necessary to clarify our concept of analysis. We use the term ‘social media’ as a rather loose construct in the paper. This is intentional as the term has been widely defined and used in more western and developed societies. Kaplan and Haenlein [6] created a classification schema for social media, and in the process, distinguished the different social functions resulting in various outcomes such as Wikipedia, social networking sites like Facebook and LinkedIn, and gaming worlds. We acknowledge that these applications are characteristic of the contemporary Web (2.0), yet we would like to maintain the distinction between the definition and application of social media. In fact, Kaplan and Haenlein’s article [6], titled ‘Users of the world, unite!’ was extremely provocative to us. The many examples of social media today are applications that are intricately associated with the technological presence and environment of the Web. But such applications and technological environments are not omnipresent in the ‘world’ as described in their article’s title. In societies where such technological environments are absent, does it mean that it is impossible for social media applications to emerge? We would like to suggest that this is not the case. And in order for us to predict the technological forms of social media in such societies (like India), it is necessary for us to consider not just the technologies in use, but also the cultural practices that are closely entwined in such technologies. This is the objective of our paper.
The paper will first go through the findings of our study with regards to the community members' use of social tools in each of the 2 case studies, the Dawoodi Bohra and the East Indians from Mumbai, India. The 2 cases will then be compared to discuss valuable learning points. As a
56Copyright (c) IARIA, 2012. ISBN: 978-1-61208-220-2
CONTENT 2012 : The Fourth International Conference on Creative Content Technologies
64 / 98

concluding note, we will reflect on relevant implications for design and future research.
II. CASE OF THE DAWOODI BOHRA IN MUMBAI The Dawoodi Bohra is a Muslim community that
originated from India. Their community leader is Syedna Mohammed Burhanuddin (TUS). Although there are around one million Bohras worldwide (Hong Kong, Singapore, Thailand, Malaysia, Canada, USA, and Middle East), most of them reside in Mumbai, Gujarat and Central India [7]. Overseas Dawoodi Bohras are settled in large ports and cities and are chiefly engaged in commercial and business occupations [3]. The Bohras typically perform and adhere to their religious rituals, social and cultural traditions with much zeal, regardless of their locations. With the advent of ICT, the Bohras have made use of community portals [2] with the main purpose of staying connected with their community and to carry out unique functions and purposes served by the community. The portals have standard functions such as log in, news, photo upload, archive, and directory services (see Appendix A for the screenshot of the portal). However, in order to access the site, each user has to use his or her own e-jamaat number on e-jamaat card which is essentially an identification card for the Bohra only. Once a child is born in the community, the child’s parents would have to apply for the e-jamaat card for the child. The card number is an unique identifier for each individual from cradle to grave. This smart identification system does not only make these community sites serve as closed systems that are accessible only to its members but also forms the pillar in the organised management hierarchy in the community. As a result of such exclusivity, all of the information and content created among the members are discussed within the system’s boundaries and not publicly available elsewhere. The following sections report on the findings on a series of 13 semi-structured Bohras interviewees conducted in Mumbai, India in January 2012. These interviews were conducted to understand how the Bohras use their community portal and e-jamaat card system. The interviewees consist of Bohras who have either used or not used the portals before (and if not used, we sought to understand the reasons why they were not using them).
Community prayer sessions make up one of the many pulses of the Bohra community. Because of its importance - both as a ritual and symbol of the community's identity, leaders of the community have initiated the use of Ejamaat.com to facilitate individual registrations for such prayer sessions. When a community member wants to register for a prayer session, he has to log on to the Ejamaat.com site and register. The system returns a pass and barcode for printing. At the prayer session, the local head priest checks the barcode to know if a person is registered or not. Furthermore, every e-jamaat number is associated with a mobile phone number. As long as a community member registers his phone number with his e-jamaat number, he will automatically receive event alerts via SMS. As such, community members who do not register their mobile phone numbers, including children (who are not old enough to use mobile phones), are excluded from such a service from the
Bohra local head. These SMSes are managed by an appointed person who assists the local priest in the community management system. He is the one who has access to the database of his local community households' e-jamaat numbers, addresses, family members, business, and other information. He is also in charge of uploading photos of functions or news about Syedna (the community leader) on the portal. Community members who wish to upload photos cannot do it directly on the portal. Instead, they will need to send them to him who acts as a gatekeeper and moderator to determine if these photos should be uploaded. Successful uploads are acknowledged by him through SMS. As such, the content in the portal and the determination of what information is being pushed to the members’ mobile phones are strictly and solely controlled by the local leader who closely follows Syedna's instructions. This form of centralized authority implies that the local head is a very trusted follower who acts as formal advisor (on careers, business, etc.) for everything, especially when community members are unable to obtain the desired information from their friends or families.
In addition to the local head, there are committees that manage other aspects in Bohra community. Faisel Hussani is the community travelling department which acts as a travel agent for the Bohras. Health camp and cooking camp are organised on a frequent basis to educate the Bohras of health issues, and traditional Bohra recipes with accompanied demonstrations. Kardan Hasana - Committee of the Trust Fund is in charge of processing loan requests from community families who want to borrow money for business or education or any other purposes. The Thehsun Nikah Committee (TNC) handles the database of boys and girls at marriageable age to match them if requests from parents are received.
Such a structural set up helps to explain why certain portal functions are used while others are not used at all and how social content on the Bohra sites are created. Although usual portal functions such as forum, news, photo/video/archive, and so on, are all available on all Bohra sites, the interview respondents reported using only the registration function (be it registering for praying or functions/events). Users do not see a need in using the forum to ask questions or advices, even for cooking tips. Neither do they use the portals for business advertising despite the fact that Bohra is a business community. They are used to the traditional model of family business through generations so that the need to engage customers outside their existing networks is not present. However, 10 respondents who are in some business or another, expressed the need to find other Bohra businessmen or businesswomen around worldwide, which are currently not met by the available business channels in the community such as community magazines (Badre Munir and Nasim Sehar) and Bohrani expo (held yearly in World Trade Center in Mumbai). As a result of the lack of practical needs, there is no social interaction on these portals. Putting it simply, the sites are used for pragmatic, rather than social reasons. "We
57Copyright (c) IARIA, 2012. ISBN: 978-1-61208-220-2
CONTENT 2012 : The Fourth International Conference on Creative Content Technologies
65 / 98

are not socially interconnected to others because the platform allows connection to the community governances but not with other Bohras", said one of the respondents. The so-called new media (Web 2.0) is used in a traditional, one-way communication manner.
However, in terms of sharing photos, the shortcoming does not lie in the lack of usefulness of the portals but on the affordances of these tools. As mentioned, users cannot upload photos for sharing directly but need to have these screened and approved through the local head. As a result, public social media platforms such as Facebook and Flickr are used by the community members to share photos instead. Facebook is also used to search for long lost friends who are not on the existing Bohra networks/sites. Some respondents also use their mobile phones’ Bluetooth capability to share photos. Apparently, Facebook is heuristic and simple enough for the community to use it at the personal level.
Such a conscious usage by the community reflects, to a certain extent, however bonded, well-organised a community is and however well-controlled the communal technological platforms are, interactions at the sub community level is technologically determined. Having said that, a certain level of trust must be present for the members to adopt Facebook as a photo sharing platform over their existing community portal. Some respondents pointed out that even if they are allowed to upload photos on the communal portals, they would still prefer to share their photos (of community functions) on their Facebook accounts.
Although social interactions are not happening via the portals, the Bohras have other platforms of gathering and meetings. There are religious gatherings that last up to ten days. One example is Moharram when everyone is dressed in Bohra style so you can tell and meet new members of Bohra community. In fact, there are up to 8 such long duration events in the year.
As a result of the Bohras' adopting the portals as a bank of information passive viewing rather than collaborative/interactive platforms, respondents unanimously reported that they just visited their community sites for topics like education in community, news about the leader's lectures and travels, and photos of events. Sites like Malumaat.com are created to become the only trusted source of official community information to keep everyone updated worldwide. Almost all respondents feel this is sufficient and there is no need to have other platforms or supplemental information on this website either.
Along with the portals, other traditional print media such as flyers and pamphlets, books and magazines are dominant in the Bohra community. Flyers are given by local head or casually passed by their Bohra neighbours. Magazines are published once every month which are available for subscription. Content in these are mainly messages by the leader. Larger and more important events will appear on TV and printed newspapers. There is a book-
Saifa covering all Bohra festivals and traditions, available in the most updated edition. Another book-Busahebaa Saheefa includes all typical rituals such as what to do when a child is born, sex education, gift in proposing, etc. A problem with these traditional media is the same information is being circulated over the years. Some respondents from our study expressed the need to know if new tradition or knowledge of the community exists since they have been uniformly taught the same thing over time. This poses a challenge to the evolution of community knowledge – how will new information be generated and how new is "new"?
The Bohra online sites were launched around 12-13 years ago (around the same time of the explosion of Web 2.0). However, interestingly enough, 3 respondents have never actually used these sites mainly due to the lack of computer literacy. Many of them pointed out that it is inconvenient to visit these sites since frequent power cuts in Mumbai does not allow them to have computers on all the time and few people own phones that have Internet access. These observations are reinforced through the interviewees' reflections on SMS and the mobile phones: "Every day morning we have to check our SMS to see if anything is there."; "SMS is the fastest and best rather than going and sitting on a laptop or a computer and then opening the site and see what is going on."
The trend of favouring SMS as the means for community engagement negates the effectiveness and potential of Web 2.0, resulting in an early detection of the digital divide. The older respondents above 50 fifty years old expressed doubts and hesitance in using Facebook: "Facebook is all youngster" was noted by one respondent. These elder folks rely on their children for information updated on the portal or the most recent news that are not circulated via SMS. A quick and simple analysis of 63 Twitter feeds about Bohra on Twitter on a random 24 hour period also supports this observation of the digital divide. Most of the tweets belong to the younger generation, with the oldest being middle age.
III. CASE OF THE EAST INDIANS - MUMBAI The East Indians are Christians baptised by missionaries
from Portugal in the 16th century [1] and have unique daily practices ingrained in music, prayers, and food. In stark contrast to the Bohra community, the East Indians have adopted and embraced open platforms like YouTube and Facebook much more widely in addition to their official websites.
At a first glance, East Indian websites [5] are not as advanced as the Bohra sites with professional design looks. The sites include a simple blog, a short history of the community origins, categories like Language, Folklore, Religion, Prayer request, Job opportunities, and others (see Appendix B for the screenshot of the website). The main difference in the East Indian sites as compared to the Bohras' is that information is publicly available and the sites allow participation without any constraints. In other words,
58Copyright (c) IARIA, 2012. ISBN: 978-1-61208-220-2
CONTENT 2012 : The Fourth International Conference on Creative Content Technologies
66 / 98

the community does not adhere to any strict rules in sharing information within and among other communities. Even though one has to register with the site administrator using their personal email, they can log in easily once the administrator approves. Such an openness is due to the fact that the East Indians are becoming more and more dispersed and their identity are fading away even among their own community members.
A total of 12 semi-structured interviews of East Indian respondents were conducted in Mumbai, India in February and March, 2012 with the same objectives to understand what are the technological platforms adopted by the East Indians for communal purposes and preserving community cultural heritage. Interviews lasted on average 1 hour and 30 minutes. Each interview was translated and transcribed in English for content analysis as before.
In this community, the impetus to create social content is mainly to create awareness amongst those outside the community and highlight East Indian issues and concerns to various government agencies due to their lack of visibility in popular media. Concurrently, the East Indians of Mumbai have adopted Facebook and YouTube much more widely on a communal level, as compared to the Bohras. The volume of user-generated content is greater and new community practices were observed.
A content analysis of the East Indian Facebook page [4] (where the author is a member) provides an insight in new activities in these platforms, such as organising singing competitions, gathering requests, recipes sharing, and others. The Facebook community pages are updated as many as 20 times daily in terms of current news, daily prayers, religious videos, ringtones of East Indian songs, singing competition announcements, and so on. Participants are mainly administrators followed by the newer generation of migrants living in modern localities with the know-how and access to the platform. All of these updates are simultaneously reflected in real time on Twitter under the ID #eastindians. YouTube is used to upload singing competition videos only. Videos are tagged with proper singer names and song titles. The number of views (145 views on average for a video) and comments (2 comments on average) reflects a considerable amount of user participation.
The concept of boundary objects holds much relevance here, to understand the community’s use of multiple applications in Facebook, Twitter and YouTube. The content posting feature in Facebook, for example, presents itself as a boundary object for different members of the community. The concept of boundary objects was first introduced by Starr [8] to describe symbolic objects functioning as an interface between communities. Such objects may be shared and used in common as they are understandable to the users, but participants need not understand how the others use it, nor are they required to comprehend how others interpret these boundary objects. Boundary objects are thus useful in presenting points of
negotiation and mediation between community members, but are yet flexible enough to be adequately understood by people living and working in different contexts, to allow for collective work and content to be shared. In the case of the East Indians, they provide a common interface for members of the community to gather with the collective purpose of producing and sharing content. In other words, boundary objects can also be seen as a set of knowledge on its own, with the techniques of community interaction embedded within these objects.
Singing is a unique identity and much loved culture of this community. Frequent competitions of up to 3 times per month are not unusual. Beyond the Internet, they are regularly conducted at different timings in different villages in Mumbai. However, the participation from youngsters and teenagers in this activity is noticeably low. Most participants are middle aged or older. This alludes to a generation gap in the community. Through our field studies, we found out that, in fact, the young are not interested in the community culture. What we observed on the East Indian sites proves that not only a generation gap exists but also a decreasing rate of participation among members. Blogs on the sites seem to encourage passive readers and not contributors. Even short responses, if they exist, will definitely help to strengthen the community identity to a certain extent. However, the low participation could also be due to the fact that the ‘active’ elders in the community rely on their children who are more tech savvy.
The East Indian community engagement activities are still very physical and locality based. The activities are locally based on individual villages whilst in the Bohra case, festivals and functions can be held in different localities but they are unanimously happening at the same time in Mumbai. The Bohras worldwide are updated with photos and news on the portals. The absence of capturing such festivals and online sharing of such memories in the East Indian community shows that they still prefer face-to-face gatherings, keeping subsets of the community engaged rather than the community as a whole. Such community fragmentation and spatial divide can be detrimental to sustaining the community identity and heritage in the long run.
Similarly to the Bohra, the East Indians still rely heavily on traditional print media. Every village has a community magazine. These magazines are mainly used for matrimonial advertisements, job opportunities and other such marketing needs. Magazine seems to reach more people due to its tangible nature. Discussions about the articles in the magazine also take place during church events or social gatherings as suggested by respondents in the study.
IV. LEARNING POINTS AND DISCUSSION The case studies showcased two distinct communities
with different structures, having different information needs,
59Copyright (c) IARIA, 2012. ISBN: 978-1-61208-220-2
CONTENT 2012 : The Fourth International Conference on Creative Content Technologies
67 / 98

and adopting and using different combination of social tools for their engagement (Table 1).
TABLE 1 - COMPARISON OF THE MAIN CHARACTERISTICS OF THE TWO
COMMUNITIES
Bohra East Indians Customised main portals: Ejamaat.com, Malumaat.com, Zeninfosys.com Others: Ajnoudin.com (1-2 lines daily prayers mainly used by Bohras in US); Moumennin.com (Business information, including advertisements); Vatansidhpur.com (General information for Sidhpur (Amatulla Saifee) community)
Open global social media systems: Facebook and YouTube. Others: Community association website
Community activities are not locally based (Registration for gatherings from almost everywhere)
Community activities are very locally based (E.g. Singing competitions, Local church meetings, individual village themed festivals (Food fests, cultural fests))
Digital divide: Mobile phone (elderly) vs Facebook (young/teens)
- Generation divide - Different levels of technology adoptions between the old and young generation - Spatial divide and community fragmentation
Trust in technologies: -Through practical use of customised portal, and -Adoption of Facebook (photo sharing, people/friend search) and Bluetooth (photo sharing)
Trust in technologies: Through adoption of Facebook and YouTube (photo and video sharing)
Arising from these findings, the discussion and learning points are centred on the following 5 areas:
A. Content and Knowledge Creation The closed system adopted by the Bohra community
ensures the old and existing knowledge is carefully maintained, preserved and passed down, thereby helping to protect their heritage and values. However, at the same time, the closed system inhibits the collaborative participation of individuals and subsequently, impedes the process of knowledge creation. The portals do not allow users (except the local leaders) to upload photos themselves, which can potentially become new knowledge. Even though such information might be considered peripheral secondary knowledge, such photos or any other inputs from the community members in future are valuable and critical for the process of creating content and knowledge for community sustainability.
One of the major challenges moving forward is to find and devise mechanisms to encourage the community to participate more actively in the information and knowledge
creation. For example, if blogs on the Bohras can be created by capturing speech and subsequently transcribed into text automatically, there could be more motivation, through alternative inputs channels, for the users to contribute content. In other words, multi modal tools to capture information should be considered as opposed to the persistent and use of text-only mechanism s that most social tools are now equipped with.
The East Indians, on the other hand, adopt an open system that can reach larger masses but they are at the stage of being susceptible of losing their identity. Besides, they tend to have community engagement activities in physical spaces. The challenge with such an open system model is to explore in what ways social media tools can be further enhanced or endowed with features to translate and transform the physical to the virtual yet maintaining good user experiences. Nevertheless, due to their natural endorsement of public social tools like Facebook and YouTube, the East Indian community has a good chance to embrace the evolving and new generations of the virtual environment.
B. Preservation of Cultural Identity The Bohra apparently has a strong identity as a business
community but in terms of interactions, may not exchange as much cultural content as the East Indian community. The East Indians' singing and traditional songs undoubtedly forms part of their unique cultural identity. The social media tools like Facebook and YouTube are facilitating to capture the intangibles of this identity to ultimately preserve the East Indian identity for time to come. Their use of media tools such as Twitter, Facebook and YouTube, also provides a new collection of knowledge about the cultural interactions and identity of the community. Towards this end, the concept of boundary objects may be used to understand the dynamics of the social infrastructure operating within the East Indian community.
C. Design for Community Social Structures The Bohra community is so well-organised with
explicit manpower allocation and structure that the community members do not feel a need to use the portals for functions other than registration. New practices of how a community can use a default set of social tools (portals in this case) are lacking due to their satisfaction of the status quo. For such a centralised and orderly community, its social structures have to be taken into account in the development of social innovations; otherwise, the solution proposed will be rendered useless and redundant by such a community.
D. Engendering Community Trust Any social innovations to be developed in the future
must be aligned with the existing community's preferred medium. For an exclusive community like the Bohra, the members trust their own customized web portals because they trust the community authority. Many of the Bohras
60Copyright (c) IARIA, 2012. ISBN: 978-1-61208-220-2
CONTENT 2012 : The Fourth International Conference on Creative Content Technologies
68 / 98

expressed hesitance and doubt in other platforms not recommended by the Bohra leader. In order for an innovative tool to be used by the Bohras, it has to win the trust of the community leader and gatekeepers to ensure mass adoption of the community later on.
In contrast, the East Indians adopted Facebook and YouTube due to the conveniences offered by such platforms, which means trust in technology is built inherently from affordances of the technology. Recognizing the element of trust before embarking on any particular platform/social tools increases the chances of success in adoption.
Almost all of the interviewees, regardless of which community they are from, highlighted the convenience of SMSes and mobile phones, which is the preferred medium for communication. This knowledge of the trust model and preferred channels of communication provides potential opportunities for new social tools.
E. Adapting Appropriate Integrated-Hybrid Models Social media portals are designed to support many-to-
many communication interactions but in the case of the Bohra portals, they were transformed back to a one-way centralised platform mainly to mass message the community with little or few opportunities to draw participation back from the members. In other words, the Bohras managed to adopt the multi participatory and socially enabled Web 2.0 tool to conform to their social structures. As a consequence, they failed to harness and exploit the potential of web tool. Moving forward, an adapting hybrid model that can integrate or mash together both these open and closed requirements may be feasible. Hence, a combinatory closed system of trusted web portals interfacing with open social tools like Facebook to encourage multi way communication could be beneficial to the community. The challenge is how the Bohras can still allow such technologies to have a space within their technological framework without threatening or disturbing their social structures. This might be more difficult to achieve as compared to the East Indians whose has the advantage of a strong cultural identity where current social tools can support.
V. CONCLUSION The insights drawn from the study of these two
contrasting communities convey a strong need to create a new generation of collaborative platforms for community members who collectively adopts a range of preferred technologies depending on their age groups and literacy levels. It is crucial to address the behavior of those that have
an active social life but have not yet extended that to become mobile.
Addressing such user needs will lead us to the design of a holistic solution that will both be contextual as well as global in nature in order to meet specific goals. A research driven iterative design process should be followed in this situation, incorporating user feedback at regular stages so as to evaluate initial concepts. In order to further refine the concepts, other forms of data collection, such as a quantitative survey, may be conducted with the targeted audience to collaborate and reinforce the qualitative findings. Finally, the proposed solution should be tested in contextual environment and detailed in order to be completely intuitive to the users of such a traditional yet pervasively online community.
ACKNOWLEDGMENT The data discussed in this paper is part of a research
project funded by the National Research Foundation (NRF) and managed through the multi-agency Interactive & Digital Media Programme Office (IDMPO) hosted by the Media Development Authority of Singapore (MDA) under Centre of Social Media Innovations for Communities (COSMIC).
REFERENCES [1] E. W. Baptista, The East Indians: Catholic Community of
Bombay, Salsette and Bassein. Bombay: Bombay East Indian Association, 1967.
[2] Bohra Community Portals. Retrieved May 4, 2012 from http://ejamaat.com/, http://www.zeninfosys.net/zi6/ and http://malumaat.com/main/load_advanced.html.
[3] A. Chandavarkar, “Barbara Harris-White, India Working: Essays on Society and Economy,” Economic Development and Cultural Change, vol. 53 (3), 2005, pp. 762-765.
[4] East Indians in Facebook [Group page]. Retrieved November 1, 2011, from http://www.facebook.com/#!/eastindians
[5] East Indians websites. Retrieved May 4, 2012 from http://www.east-indians.com/, http://www.east-indians.net/.
[6] M. Kaplan, and M. Haenlein, “Users of the world, unite! The challenges and opportunities of social media,” Business Horizons, vol. 53 (1), 2010, pp. 59-68, doi:10.1016/j.bushor.2009.09.003.
[7] S. Roy, The Dawoodi Bohras: an anthropological perspective. London: B.R. Publishing, 1984.
[8] S. Star, and J. Griesemer, “Institutional ecology, ‘Translations’ and Boundary Objects: Amateurs and Professionals in Berkeley’s Museum of Vertebrate Zoology, 1907-39,” Social Studies of Science, vol. 19 (3), 1989, pp. 387-420.
61Copyright (c) IARIA, 2012. ISBN: 978-1-61208-220-2
CONTENT 2012 : The Fourth International Conference on Creative Content Technologies
69 / 98

Appendix A
Dawoodi Bohra Community Portal Home Page (http://malumaat.com)
Appendix B
East Indian Community Portal Home Page (http://www.east-indians.com/)
62Copyright (c) IARIA, 2012. ISBN: 978-1-61208-220-2
CONTENT 2012 : The Fourth International Conference on Creative Content Technologies
70 / 98

Real-Time Character Inverse Kinematics using the Gauss-Seidel Iterative Approximation Method
Ben Kenwright
School of Computing Science Newcastle University
Newcastle, United Kingdom [email protected]
Abstract—We present a realistic, robust, and computationally
fast method of solving highly non-linear inverse kinematic
problems with angular limits using the Gauss-Seidel iterative
method. Our method is ideally suited towards character based
interactive applications such as games. To achieve interactive
simulation speeds, numerous acceleration techniques are
employed, including spatial coherent starting approximations
and projected angular clamping. The method has been tested
on a continuous range of poses for animated articulated
characters and successfully performed in all cases and
produced good visual outcomes.
Keywords-character animation; gauss-seidel; inverse
kinematics; real-time
I. INTRODUCTION
Character Inverse Kinematics (IK) is an important and challenging topic in the graphics and robotics community, and in employment by numerous applications in the film, animation, virtual reality, and game industry [1–6].
However, character-based models can be highly complex; even the most simplified models of 20-30 joints can generate a vast number of poses [5][6]. Whereby producing a simple pose to achieve a solitary task can produce ambiguous solutions that make the problem highly nonlinear and computationally expensive to solve. For example, even a straightforward task of reaching to pickup an object can be accomplished by means of any number of motions.
This paper focuses on how the Gauss-Seidel algorithm [7] can be employed to solve character IK problems; such as the biped shown in Figure 1. The Gauss-Seidel algorithm is an iterative, efficient, low memory method of solving linear systems of equations of the form Ax=b. Hence, we integrate the Gauss-Seidel iterative algorithm with a character IK problem to produce a flexible whole system IK solution for time critical systems such as games. This method is used as it offers a flexible, robust solution with the ability to trade accuracy for speed and give good visual outcomes.
Furthermore, to make the Gauss-Seidel method a practical IK solution for characters, it needs to enforce joint limits. We incorporate joint limits by modifying the update scheme to include an iterative projection technique. Additionally, to ensure real-time speeds we take advantage of spatial coherency between frames as a warm starting approximation for the solver. Another important advantage
of the proposed method is the simplicity of the algorithm and how it can be easily configured for custom IK problems.
The main contribution of the paper is the practical demonstration and discussion of using the Gauss-Seidel method for real-time character IK problem. Including constraint conditions, speed up approaches and robustness factors.
The rest of the paper is organized as follows. First, Section II gives a brief survey of related work. In Section III, we present the biped character model used for our simulations. Then, Section IV explains how the Jacobian matrix is calculated. Sections V to VIII primarily discusses the Gauss-Seidel algorithm and implementation details. Section IX presents the results. Finally, Section X draws conclusions and future work.
II. RELATED WORK
IK is a vital component that can be implemented using a wide range of solutions. We give a brief overview of existing, current, and cutting-edge approaches to help emphasis the different ways of approaching the problem; enabling the reader to see where our method sits.
In general, however, for very simple problems with just a few links, analytical methods are employed to solve the IK problem. Alternatively, for larger configurations, iterative numerical methods must be employed due to the complexity of the problem.
The character IK problem of finding solutions to poses that satisfies positional and orientation constraints has been well studied, e.g., [1], [6], [8], [9]. The problem is highly nonlinear, meaning there can be numerous solutions; hence, multiple poses fulfilling the constraint conditions. In practical situations, there can even be cases where no solution exists due to the poor placement of end-effectors. IK systems typically use cut down models, e.g., merely performing IK on individual limbs (as in body, arms, legs) [5], [10], [11]. This makes the problem computationally simpler and less ambiguous.
Numerous solutions from various fields of research have been implemented to solving the IK problem. The most popular method and the method upon which we base our iterative solution is the Jacobian matrix [6][12][13]. The Jacobian matrix method aims to find a linear approximation to the problem by modelling the end-effectors movements relative to the instantaneous systems changes of the links translations and orientations. Numerous different methods
63Copyright (c) IARIA, 2012. ISBN: 978-1-61208-220-2
CONTENT 2012 : The Fourth International Conference on Creative Content Technologies
71 / 98

have been presented for calculating the Jacobian inverse, such as, Jacobian Transpose, Damped Least Squares (DLS), Damped Least Squares with Singular Value Decomposition (SVD-DLS), Selectively Damped Least Square (SDLS) [3], [4], [14–17].
An alternative method uses the Newton method; whereby the problem is formulated as a minimization problem from which configuration poses are sought. The method has the disadvantage of being complex, difficult to implement and computationally expensive to computer-per-iteration [13].
The Cyclic Coordinate Descent (CCD) is a popular real-time IK method used in the computer games industry [18]. Originally introduced by Wang et al. [19] and then later extended to include constraints by Welman et al. [1]. The CCD method was designed to handle serial chains and is thus difficult to extend to complex hierarchies. It has the advantage of not needing to formulate any matrices and has a lower computational cost for each joint per iteration. Its downside is that the character poses even with constraints can produce sporadic and unrealistic poses. However, further work has been done to extend CCD to work better with human based character hierarchies [2][5][20].
A novel method recently proposed was to use a Sequential Monte Carlo approach but was found to be computationally expensive and only applicable for offline processing [21][22].
Data driven IK systems have been presented; Grochow et al. [23] method searched a library of poses to determine an initial best guess solution to achieve real-time results. An offline mesh-based for human and non-human animations was achieved by learning the deformation space; generating new shapes while respecting the models constrains [24], [25].
A method known as ‘Follow-The-Leader’ (FTL) was presented by Brown et al. [26] and offered real-time results using a non-iterative technique. However, this approach was later built upon by Aristidou et al. [27] and presented an iterative version of the solver known as FABRIK.
The Triangular IK method [28][29], uses trigonometric properties of the cosine rule to calculate joint angles, beginning at the root and moving outwards towards the end-effectors. While the algorithm can be computationally fast, due to it being able to propagate the full hierarchy in a single iteration, it cannot handle multiple end-effectors well and is primarily based around singly linked systems.
The advantages of an iterative character IK system were also presented by a well written paper by Tang et al. [30] who explored IK techniques for animation using a method based on the SHAKE algorithm. The SHAKE algorithm is an iterative numerical integration scheme considered similar to the Verlet method [31], which can exploit substantial step-sizes to improve speed yet remain stable when solving large constrained systems. The algorithm is also proven to have the same local convergence criterion as the Gauss-Seidel method we present here as long as the displacement size is kept sufficiently small.
III. ARTICULATED CHARACTER MODEL
We model the mechanical functioning of the biped as a series of multiple rigid segments (or links) connected by joints. This interconnected series is also called a kinematic chain.
As shown in Figure 1, we represent the biped character as a collection of 14 rigid body segments connected using 8 primary joints. The character gives us 30 degrees of freedom (DOF).
Joints such as the shoulder have three DOF corresponding to abduction/adduction, flexion/extension and internal/external rotation (i.e., rotation around the x, y and z axis).
Furthermore, it is convenient to note that a joint with n DOF is equivalent to n joints of 1 DOF connected by n-1 links of length zero. Thus, the shoulder joint can be described as a sequence of 3 separate joints of 1 DOF, where 2 of the joints connecting links have zero lengths.
Figure 1. The joint configuration with the right foot set as the IK base.
As shown in Figure 1, the single DOF connected joints were colored in accordance with their axis type; the x, y and z representing the colors red, green and blue. The foot was set as the base for the IK with five end-effectors (i.e., head, pelvis, right-hand, left-hand and left-foot). We developed an application for an artist to interrogate and experiment with the biped IK system; setting end-effectors locations and viewing the generated poses.
Each end-effector has a 6 DOF constraint applied to it; representing the target position and orientation. The ideal end-effectors are drawn in red, and the current end-effectors are drawn in green. This can be seen clearly in Figure 5, where the target end-effectors are located at unreachable goals.
IV. JACOBIAN MATRIX
The Jacobian J is a matrix that represents the change in joint angles to the displacement of end-effectors e .
Each frame we calculate the Jacobian matrix from the current angles and end-effectors. We assume a right-handed coordinate system.
To illustrate how we calculate the Jacobian for an articulated system, we consider the simple example shown in Figure 2. For a more detailed description see [3], [4], [14–17]. The example demonstrates how we decompose the
Joint DOF
Total
HeadShoulderElbowHandPelvisHipKneeFoot
33123312
30
64Copyright (c) IARIA, 2012. ISBN: 978-1-61208-220-2
CONTENT 2012 : The Fourth International Conference on Creative Content Technologies
72 / 98

problem and represent it as a matrix for a sole linked chain with a single three DOF end-effector. We then extend this method to multiple linked-chains with multiple end-effectors (each with six DOF) to represent the character hierarchy.
Figure 2. Relationship between multiple joint angles and end-effectors.
The angles for each joint and the error for each end-effector are represented by matrices.
0
1
2
...
n
θ (1)
x
y
z
e
e
e
e (2)
where i
is the rotation of joint i relative to joint i-1, and
e for the end-effectors global position. From these matrices, we can determine that the end-
effectors, and the joint angles are related. This leads to the forward kinematics definition, defined as:
( )fe θ (3)
We can differentiate the kinematic equation for the relationship between end-effectors and angles. This relationship between change in angles and change in end-effectors location is represented by the Jacobian matrix.
e Jθ (4)
The Jacobian J is the partial derivatives for the change in end-effectors locations by change in joint angles.
eJ
θ (5)
If we can re-arrange the kinematic problem:
1( )f θ e (6)
We can conclude a similar relationship for the Jacobian:
1θ J e (7)
For small changes, we can approximate the differentials by their equivalent deltas:
argt et current e e e (8)
For these small changes, we can then use the Jacobian to represent an approximate relationship between the changes of the end-effectors with the changes of the joint angles.
1 θ J e (9)
We can substitute the result back in:
current previous θ θ θ (10)
The practical method of calculating J in code is used:
( )j target j
j
er e p
θ (11)
where jr is the axis of rotation for link j, targete is the
end-effectors target position, jp is end position of link j.
Figure 3. Iteratively calculating the Jacobian on a frame by frame basis.
For example, calculating the Jacobian for Figure 3 gives:
0
0 0
1 1
1
2 2
2
( )
( )
( )
current
current
current
e
r e pe
J r e p
r e pe
(12)
and
current target e e e (13)
1
2
ecurrent
etarget
e current + e
1
2
ecurrent
p1
p2
r0
r1
r2
p2
p1
p0 r0
r1
r2
etarget
p1
65Copyright (c) IARIA, 2012. ISBN: 978-1-61208-220-2
CONTENT 2012 : The Fourth International Conference on Creative Content Technologies
73 / 98

The Jacobian matrix is calculated for the system so that
we can calculate the inverse and hence the solution. Alternatively, a good explanation of the Jacobian and its
applications is also presented by Buss [12], who gives an introduction to IK methods using the Transpose, Pseudoinverse, and Damped Least Square (DLS) method.
V. FORMULATING THE GAUSS-SEIDEL
PROBLEM
We set up the IK problem into a particular arrangement, so that we can solve for the unknowns using the Gauss-Seidel method. Whereby, we construct the IK formulation using the Jacobian matrix with the linear equation format of the form:
Ax b (14)
The IK problem is then composed as: T T J J J e (15)
Equating equivalent variables: T
T
unknown
A J J
b J e
x
(16)
With the Gauss-Seidel iterative method, we solve for the
unknown x value. To prevent singularities and make the final method more stable and robust we incorporated a damping value:
( )T A J J I (17)
where , is a small damping constant, typically 0.001,
and I is an identify matrix.
VI. ITERATIVE GAUSS-SEIDEL IK SOLUTION
The Gauss-Seidel iterative algorithm is a technique developed for solving a set of linear equations of the form Ax=b. The method has gained a great deal of acclaim in the physics-based community for providing a computationally fast robust method for solving multiple constraint rigid body problems [32–34].
The iterative algorithm is based on matrix splitting [35], and its computational cost per iteration is O(n), where n is the number of constraints. Furthermore, the number of constraints and the number of iterations is what dominates the performance of the algorithm.
Algorithm 1 is the basic Gauss-Seidel method for a generic linear system of equations of the form Ax=b; for the
unknowns, an initial guess0x is needed. Naively this value
could be zero and result in the system having a cold start. Then the algorithm would proceed, while at each iteration, the corresponding elements from A, b and x (current) act as a feedback term to move x (next) closer to the solution.
The conditions for the algorithm terminating are:
If a maximum number of iterations has been reached.
If the error ||Ax-b|| drops below a minimum threshold.
If || ||ix falls below a tolerance.
If || ||ix remains the same as the previous frame
(within some tolerance).
0
1
=1to iterationlimit
1 to
n
i ij j
j
i
ii
i i i
x x
iter
i n
b A x
xA
x x x
for do
for do
endfor
endfor
Algorithm 1. Gauss-Seidel iterative algorithm to solve Ax=b given x0.
It is essential that the coefficients along the diagonal part of the matrix be dominant for the Gauss-Seidel method to converge on a solution.
VII. APPLYING JOINT LIMITS
Any IK solution needs to enforce angular joint limits before it can be a viable solution for a character system. We can modify the basic iterative algorithm to enforce joint limits by clamping the angles for each iteration update.
1
1
1
:
:
:
lower if J e lower
upper if J e upper
J e otherwise
(18)
This extension of the basic Gauss-Seidel algorithm to handle constraint limits for the unknowns is called the Projected Gauss-Seidel (PGS) algorithm. The angular limits form bounds that are in form of upper and lower joint angles that are easily enforced through clamping.
Furthermore, the PGS algorithm has O(n) running time and convergence is guaranteed as long as the matrix is positive definite [7]. In practice, we have found the algorithm to provide excellent visual and numerical results.
VIII. SPATIAL AND TEMPORAL COHERENCY
To give the iterative solver an initial kick-start we take advantage of spatial and temporal coherency of the problem. Since the PGS solver is iterative by design the convergence rate can be slow; depending on the eigenvalues of the matrix. However, by caching the result from the previous solution, we can considerably reduce the number of iterations, especially if there are only minute changes.
66Copyright (c) IARIA, 2012. ISBN: 978-1-61208-220-2
CONTENT 2012 : The Fourth International Conference on Creative Content Technologies
74 / 98

IX. RESULTS
A. Walking
Setting the foot as the base of the IK solution and alternating it to the other foot between steps. At each foot changeover, a target trajectory was calculated for the swinging foot. The swinging foot end-effectors were interpolated to animate the walking motion. This produced the lower-body walking-motion. In addition, the upper-body end-effectors had similar trajectories calculated to induce upper-body motion to co-inside with the feet. As the trajectory interpolation between the start and end-effectors was performed, the IK solution was iteratively updated to generate a natural smooth blending animation with natural looking poses.
Figure 4. The step cycle for the IK; swapping the IK root between the left and right foot - with the standing foot holding the weight chosen as the root.
B. Random Poses
We experimented with a diverse range of poses of generally unpredictable and chaotic stature to explore the stability and flexibility of our approach. For example, we did random on the spot poses of the character kneeling, standing on one single leg, waving, and so on (as shown in Figure 6).
Figure 5. The Gauss-Seidel method remains stable even when we impose impossible constraint conditions on the end-effectors – the solver converges on achieving a best attempt stretching solution.
C. Robustness
One important criteria was that the IK solver remained stable – this included placing end-effectors out of reach so that no solution could be found.
In practice, when no result was obtainable, a best reach condition was always presented, stretching to obtain the
end-effectors but remaining stable (i.e., not oscillating or jittering).
Furthermore, when end-effectors were started at radically different locations, the resulting solution would radically jerk – however, the result always converged on acceptable poses.
D. Performance
On average, the small spatial coherent transitions between frame updates resulted in the Gauss-Seidel method requiring only two or three iterations for the end-effectors to reach acceptable answers. This resulted in the IK solver being able to easily maintain a low-computational overhead and run at real-time frame-rates. Our Gauss-Seidel implementation was straightforward and single threaded; however, numerous methods have been demonstrated by Courtecuisse et al. [36] to exploit even greater performance improvements by taking advantage of multi-core architectures.
Table 1. Performance of our Gauss-Seidel character implementation. Where little or no movement results in 1-2 iterations while sporadic changes in posture resulted in ~10 or more iterations.
Furthermore, our Gauss-Seidel method would only require a few mill-seconds to compute the solution. The cost of calculating the full IK biped solution for different iteration is shown in Table 1. Our implementation performed at real-time rates and maintained a consistent frame-rate well above a 100Hz.
Simulations were performed on a machine with the following specifications: Windows7 64-bit, 16Gb Memory, Intel i7-2600 3.4Ghz CPU. Compiled and tested with Visual Studio.
Figure 6. Examples of general disorderedly and chaotic investigation poses.
X. CONCLUSION AND FURTHER WORK
We presented the Gauss-Seidel technique as a method for solving real-time character IK problems. We used temporal caching to reduce the computational cost and gain real-time performance speeds. The results of the IK system performed well enough to be used in time critical systems (such as games.) With the angular limits, the method can
Desired End-Effector Positions and Orientations
Current End-Effector Positions and Orientations
Iterations 1 5 20
Avg.
Time 0.01ms 0.042ms 0.11ms
67Copyright (c) IARIA, 2012. ISBN: 978-1-61208-220-2
CONTENT 2012 : The Fourth International Conference on Creative Content Technologies
75 / 98

suffer from singularity problems if the end-effectors jump; however, due to the end-effectors following small spatial transitions singularities are mostly avoided.
The algorithm is simple to implement, computationally fast, little memory overhead, and is fairly robust. The IK solution can work with multiple end-effectors to produce poses with smooth movement with and without constraints.
While we demonstrated the practical aspect of using the Gauss-Seidel method as a valid real-time method for a character IK system, further work still needs to be done for a more detailed statistical comparison between the aforementioned IK solutions; comparing memory, complexity and computational costs.
In additional, a further area of study would be the general practical applicability of generating primary and secondary IK goals using weighted biasing of conflicting constraints (e.g., secondary goal of keeping body within balancing stance while always achieving the primary target of arms and feet reaching their goals.)
XI. REFERENCES
[1] C. Welman, “Inverse kinematics and geometric constraints for articulated figure manipulation,” Simon Fraser University, 1993.
[2] L. Unzueta, M. Peinado, R. Boulic, and Á. Suescun, “Full-body performance animation with Sequential Inverse Kinematics,” Graphical Models, vol. 70, no. 5, pp. 87-104, Sep. 2008.
[3] C. W. Wampler, “Manipulator inverse kinematic solutions based on vector formulations and damped least-squares methods,” Systems, Man and Cybernetics, IEEE Transactions on, vol. 16, no. 1, pp. 93–101, Jan. 1986.
[4] W. A. Wolovich and H. Elliott, “A computational technique for inverse kinematics,” in Decision and Control, 1984. The 23rd IEEE Conference on, 1984, vol. 23, no. December, pp. 1359–1363.
[5] R. Kulpa and F. Multon, “Fast inverse kinematics and kinetics solver for human-like figures,” Humanoid Robots (December 2005), IEEE, pp. 38-43, 2005.
[6] J. Zhao and N. I. Badler, “Inverse kinematics positioning using nonlinear programming for highly articulated figures,” ACM Transactions on Graphics (TOG), vol. 13, no. 4, pp. 313–336, 1994.
[7] W. R. Cottle, J.-S. Pang, and E. R. Stone, The Linear Complementarity Problem. Academic Press, 1992.
[8] M. Girard and A. A. Maciejewski, “Computational modeling for the computer animation of legged figures,” in ACM SIGGRAPH Computer Graphics, 1985, vol. 19, no. 3, pp. 263–270.
[9] B. B. C. Rose, S. Rosenthal, and J. Pella, “The process of motion capture: Dealing with the data,” in Computer Animation and Simulation, 1997, vol. 97, pp. 1-14.
[10] K. Yamane and Y. Nakamura, “Natural motion animation through constraining and deconstraining at will,” IEEE Transactions on Visualization and Computer Graphics, vol. 9, no. 3, pp. 352-360, Jul. 2003.
[11] L. Zhao, “Gesticulation behaviors for virtual humans,” , 1998. Pacific Graphics' 98. Sixth Pacific, 1998.
[12] S. Buss, “Introduction to inverse kinematics with jacobian transpose, pseudoinverse and damped least squares methods,” University of California, San Diego, Typeset manuscript, pp. 1-19, 2004.
[13] R. Fletcher, Practical methods of optimization, Volume 1. Wiley, 1987, p. 436.
[14] A. Balestrino, G. D. Maria, and L. Sciavicco, “Robust control of robotic manipulators,” Proc. Of the 9th IFAC World Congress, vol. 5, pp. 2435-2440, 1984.
[15] J. Baillieul, “Kinematic programming alternatives for redundant manipulators,” in Robotics and Automation. Proceedings. 1985 IEEE International Conference on, 1985, vol. 2, pp. 722–728.
[16] Y. Nakamura and H. Hanafusa, “Inverse kinematic solutions with singularity robustness for robot manipulator control,” Journal of Dynamic Systems, Measurement, and Control, vol. 108, no. 3, pp. 163-171, 1986.
[17] S. R. Buss and J.-su Kim, “Selectively Damped Least Squares for Inverse Kinematics,” Methods, pp. 1-13, 2004.
[18] J. Lander, “Making kine more flexible,” Game Developer Magazine, no. November, 1998.
[19] L. Wang, “A combined optimization method for solving the inverse kinematics problems of mechanical manipulators,” Robotics and Automation, IEEE, vol. I, no. 4, 1991.
[20] R. Boulic, J. Varona, L. Unzueta, M. Peinado, A. Suescun, and F. Perales, “Evaluation of on-line analytic and numeric inverse kinematics approaches driven by partial vision input,” Virtual Reality, vol. 10, no. 1, pp. 48-61, Apr. 2006.
[21] N. Courty and E. Arnaud, “Inverse kinematics using sequential monte carlo methods,” Articulated Motion and Deformable Objects, pp. 1–10, 2008.
[22] C. Hecker, B. Raabe, R. W. Enslow, J. DeWeese, J. Maynard, and K. van Prooijen, “Real-time motion retargeting to highly varied user-created morphologies,” ACM Transactions on Graphics, vol. 27, no. 3, p. 1, Aug. 2008.
[23] K. Grochow, S. Martin, A. Hertzmann, and Z. Popović, “Style-based inverse kinematics,” in ACM Transactions on Graphics (TOG), 2004, vol. 23, no. 3, pp. 522–531.
[24] R. W. Sumner, M. Zwicker, C. Gotsman, and J. Popović, “Mesh-based inverse kinematics,” in ACM Transactions on Graphics (TOG), 2005, vol. 24, no. 3, pp. 488–495.
[25] K. G. Der, R. W. Sumner, and J. Popović, “Inverse kinematics for reduced deformable models,” in ACM Transactions on Graphics (TOG), 2006, vol. 25, no. 3, pp. 1174–1179.
[26] J. Brown, J. C. Latombe, and K. Montgomery, “Real-time knot-tying simulation,” The Visual Computer, vol. 20, no. 2, pp. 165–179, 2004.
[27] A. Aristidou and J. Lasenby, “FABRIK: A fast, iterative solver for the Inverse Kinematics problem,” Graphical Models, vol. 73, no. 5, pp. 243-260, Sep. 2011.
[28] R. Mukundan, “A robust inverse kinematics algorithm for animating a joint chain,” International Journal of Computer Applications in Technology, vol. 34, no. 4, p. 303, 2009.
[29] R. Muller-Cajar and R. Mukundan, “Triangualation-a new algorithm for inverse kinematics,” Proc. of the Image and Vision Computing New Zealand, pp. 181-186, 2007.
[30] W. Tang, M. Cavazza, and D. Mountain, “A constrained inverse kinematics technique for real-time motion capture animation,” The Visual Computer, vol. 15, no. 7–8, pp. 413-425, Nov. 1999.
[31] L. Verlet, “Computer" experiments" on classical fluids. I. Thermodynamical properties of Lennard-Jones molecules,” Physical Review, vol. 159, no. 1, pp. 98-103, 1967.
[32] F. Jourdan, P. Alart, and M. Jean, “A Gauss-Seidel like algorithm to solve frictional contact problems,” Computer Methods in Applied Mechanics and Engineering, vol. 155, no. 1–2, pp. 31-47, Mar. 1998.
[33] T. Liu and M. Y. Wang, “Computation of three-dimensional rigid-body dynamics with multiple unilateral contacts using time-stepping and gauss-seidel methods,” Automation Science and Engineering, IEEE Transactions on, vol. 2, no. 1, pp. 19–31, 2005.
[34] E. Catto, “Iterative dynamics with temporal coherence,” in Game Developer Conference, 2005, pp. 1-24.
[35] H. G. Gene and F. V. L. Charles, Matrix Computations, 3rd Editio. The Johns Hopkins University Press, 1996.
[36] H. Courtecuisse and J. Allard, “Parallel Dense Gauss-Seidel Algorithm on Many-Core Processors,” 2009 11th IEEE International Conference on High Performance Computing and Communications, no. 1, pp. 139-147, 2009.
68Copyright (c) IARIA, 2012. ISBN: 978-1-61208-220-2
CONTENT 2012 : The Fourth International Conference on Creative Content Technologies
76 / 98
Development of an Interactive Puppet Show System
for the Hearing-Impaired People
Ryohei Egusa Graduate School of Human Development and
Environment Kobe University
Kobe, Hyogo, Japan [email protected]
Kumiko Wada Master’s Degree Course
Tama Art University Hachioji, Tokyo, Japan
Miki Namatame Faculty of Industrial Technology
Tsukuba University of Technology Tsukuba, Ibaraki, Japan
Fusako Kusunoki Department of Information Design
Tama Art University Hachioji, Tokyo, Japan [email protected]
Hiroshi Mizoguchi
Faculty of Science and Technology Tokyo University of Science
Noda, Chiba, Japan [email protected]
Shigenori Inagaki Graduate School of Human Development and
Environment Kobe University
Kobe, Hyogo, Japan inagakis@ kobe-u.ac.jp
Abstract—In this study, we developed Interactive Puppet Theater. Interactive Puppet Theater is a puppet show system that is designed for appreciation by hearing-impaired people. This system has two features to allow the hearing-impaired people to enjoy a puppet show. First, to ensure that aural information is conveyed, we project the dialogues (textual data) onto the background of the puppet show. Then, using Kinect, we allow the audience to participate in the story through physical movements. Thus, the audience is allowed to influence the story’s progression. Similar to gestures and sign language, physical movement is a relatively easy way for the hearing-impaired people to express themselves. Therefore, we aimed to create a system that would make it relatively easy for them to facilitate the progression of a story using means that they are most familiar with. We believe that these features will assist the hearing-impaired people in enjoying a puppet show.
Keywords-Inclusive Design; Puppet Theater; Digital Storytelling; Interactive; Hearing-impaired People
I. PURPOSE OF THIS STUDY The research field targeted at providing support for
the hearing-impaired people has received growing attention in recent years [1-3]. In this study, we developed Interactive Puppet Theater (hereafter simply Puppet Theater). Puppet Theater is a puppet-show system meant for the hearing-impaired people. A normal puppet
show is difficult for the hearing-impaired people to appreciate. This is because everything in a puppet show, from the dialogue to the narration and effects, relies on sound.
To this end, we implemented two features in Puppet Theater so that the hearing-impaired people could easily watch and enjoy a puppet show. First, we projected the dialogue (textual data) on the background of the puppet show to supplement the aural information. Next, we added the feature for the audience to participate in the story by using physical movement. Egusa et al. [4] conducted a preliminary evaluation experiment using university students with normal hearing as subjects to evaluate the effectiveness of the audience with respect to participation in the story without any physical movement. In this paper, we describe in detail the feature to participation in Puppet Theater using physical movement.
Physical movement is a relatively easy way for hearing-impaired people to express themselves. This is because, for many hearing-impaired people, the most common method of communication is that involving the use of language based on physical movements such as gestures. In addition, since communication using physical movement is a common practice, it would be easy for the hearing-impaired people to understand the situation by seeing other people’s physical movements. It can be expected that stress for the hearing-impaired
69Copyright (c) IARIA, 2012. ISBN: 978-1-61208-220-2
CONTENT 2012 : The Fourth International Conference on Creative Content Technologies
77 / 98

people would be lowered more easily through physical movement rather than through writing or speech. By using a range image sensor (Xbox360 Kinect sensor developed by Microsoft Corporation, i.e., Kinect sensor), the viewer can watch Puppet Theater presentation without having to worry about the operation of the terminal.By becoming a facilitator in the story, the viewer can actively participate in and thus enjoy the puppet show. Hence, we added the feature for the audience to participate in the story through physical movement.
We can measure the physical movement of a person by using the Kinect sensor. Several studies have been conducted using a Kinect sensor, owing to its attractive advantage [5-6]. Its depth sensor is beneficial for Puppet Theater. The depth sensor can function accurately and capture a human body in a dimly lit room. This function is effectiveness for measuring the physical movement of a person during a performance of Puppet Theater. This can be attribute to the fact that it is necessary to keep the room dimly lit to be able to project the animation clearly. Moreover, the Kinect sensor can be reasonable to be installed with ease Puppet Theater. Therefore, we use the Kinect sensor to measure the physical movement of a person in Puppet Theater.
II. PUPPET THEATER DESIGN
A. System Configuration
Puppet Theater takes the form of a paper puppet show. Figure 1 shows the framework of a basic Puppet Theater system. Flash animation is projected onto the background screen with a projector. Puppets are then manipulated in front of the screen. The stage is composed of a 180-inch screen, paper puppets, a short-focus projector, and a Kinect sensor. The Flash animation is operated through use of a notebook PC. Interference between the puppets and the background is avoided with the help of the short-focus projector.
Figure 2 shows the characters as puppets. Puppets are used for lending a sense of reality to the show a sense of reality, as it is believed that viewers are more likely to be interested in a story if the character “exists” in the real world. Furthermore, as puppets are relatively simple constructions, they can be easily handled by anyone.
Figure 3 shows the system composition of the Kinect sensor. The notebook PC connected to the Kinect sensor is connected via a network to another notebook PC connected to a projector in order to reproduce Flash. The Kinect sensor and a physical operation are used for choosing a subsequent story. The Kinect sensor functions as a reader of the position and the gesture of a person’s hand. In order to select a story, one viewer is chosen from among the audience. This viewer then stands in a predetermined spot. The spot is located approximately
Figure 1. Framework of the system.
Figure 2. Puppets.
Figure 3. System composition of the Kinect sensor.
2 meters in front of the Kinect sensor. Then the viewer points a palm toward the screen. In response to the hand position detected by the Kinect sensor, the cursor moves in the background. To choose a story, the viewer performs a gesture to push the palm forward when the cursor is placed on an icon.
B. Presentation of Dialogue
All of the show’s dialogues are visually expressed through Flash animation. Since the area where the dialogue is displayed is transparent, the background
70Copyright (c) IARIA, 2012. ISBN: 978-1-61208-220-2
CONTENT 2012 : The Fourth International Conference on Creative Content Technologies
78 / 98

Figure 4. Selection point of branches of the story.
illustration is not masked. Performers can determine the timing of all the texts through a simple operation.
C. Participation in the Story through Physical Movement
In Puppet Theater, the performers and the audience carry the story. During the puppet show, a scene from which the story branches is shown to the audience. Figure 4 shows an example of the scene presented to show the branches of the story. The relevant icons and the cursor are displayed on the screen. These icons are then used for choosing from multiple possible subsequent stories. If the viewer chooses a favorite icon, the story corresponding to that icon begins to develop. Through this approach, the viewers can not only appreciate the show in a unilateral way but also manipulate the story.
The chosen individual then operates the cursor to choose a favorite icon from among the many options. When the cursor is placed on an icon, the icon’s animation begins to play. Figure 5 shows how the viewer chooses an icon.
D. Contents
The Puppet Theater system is composed of Flash animation and puppets. Therefore, in some cases we can change the animation’s content. The content adopted here was composed of five scenes corresponding to five tasks. First, as an introduction, the audience watches the scene in which water is drawn. Then, the various branching paths are displayed, presenting the remaining four choices. The viewer chooses his/her favorite from among the remaining scenes. Whenever the scene is over, the story returns to the branching point. The viewer then chooses the scene he or she wants to see next. After the viewer has seen all the available scenes, the ending of the story is initiated through the operation of a notebook PC.
III. CONCLUSION & FUTURE WORK This paper demonstrates that the Puppet Theater is an
effective aid for hearing-impaired people in enjoying
Figure 5. Attempting Kinect operation.
experience of watching puppet shows. In the future, we intend to evaluate Puppet Theater in cooperation with the hearing-impaired people to determine the system’s effectiveness and to discuss any problems encountered.
ACKNOWLEDGEMENTS This research was supported by JSPS the Grants-in-
Aid for Scientific Research (B) (No. 23300309).
REFERENCES [1] Lee, S., Henderson, V., Hamilton, H., Starner, T., Brasher,
H., and Hamilton, S., “A Gesture-Based American Sign Language Game for Deaf Children”, In Proceedings of CHI2005 Extended Abstract, Portland, Oregon, pp. 1589-1592, April 2-7 2005.
[2] Gentry, M. M., Chinn, K. M., and Moulton, R. D., “ Effectiveness of Multimedia Reading Materials When Used with Children Who Are Deaf”, American Annals of the Deaf , 149 2005, pp. 394-403.
[3] Namatame, M., and K, Muneo., “Suitable Representations of Hyperlinks for Deaf Persons: An Eye-tracking Study”, In Proceedings of the 10th International ACM SIGACCESS Conference on Computers and accessibility , Canada, Nova Scotia, Halifax, pp. 247-248, October 13-15 2008.
[4] Egusa, R., Wada, K., Namatame, M., Kusunoki, F., Mizoguchi, H., and Inagaki, S., “Learning Support System Based on Inclusive Design Method for Story Comprehension”, In Proceedings of the 35th Annual Meeting of JSSE, Japan, Tokyo, pp. 456-457, August 23-25 2011.
[5] Shotton, J., Fitzgibbon, A., Cook, M., Sharp, T., Finocchio, Mark., Moore, R., Kipman, A., and Blake, A., “Real-Time Human Pose Recognition in Parts from Single Depth Images”, In Proceedings of the 24th IEEE Conference on Computer Vision and Pattern Recognition, USA, Colorado Springs, pp. 1297-1304, June 20-25 2011.
[6] Xu, D., Chen, Y., Wu, X., Ou, Y., and Xu, Y., “Integrated Approach of Skin-color Detection and Depth Informationfor Hand and Face Localization”, In Proceedings of the 2011 IEEE International Conference on Robotics and Biomimetics, Thailand, Phuket, pp.952-956, December 7-11 2011.
71Copyright (c) IARIA, 2012. ISBN: 978-1-61208-220-2
CONTENT 2012 : The Fourth International Conference on Creative Content Technologies
79 / 98
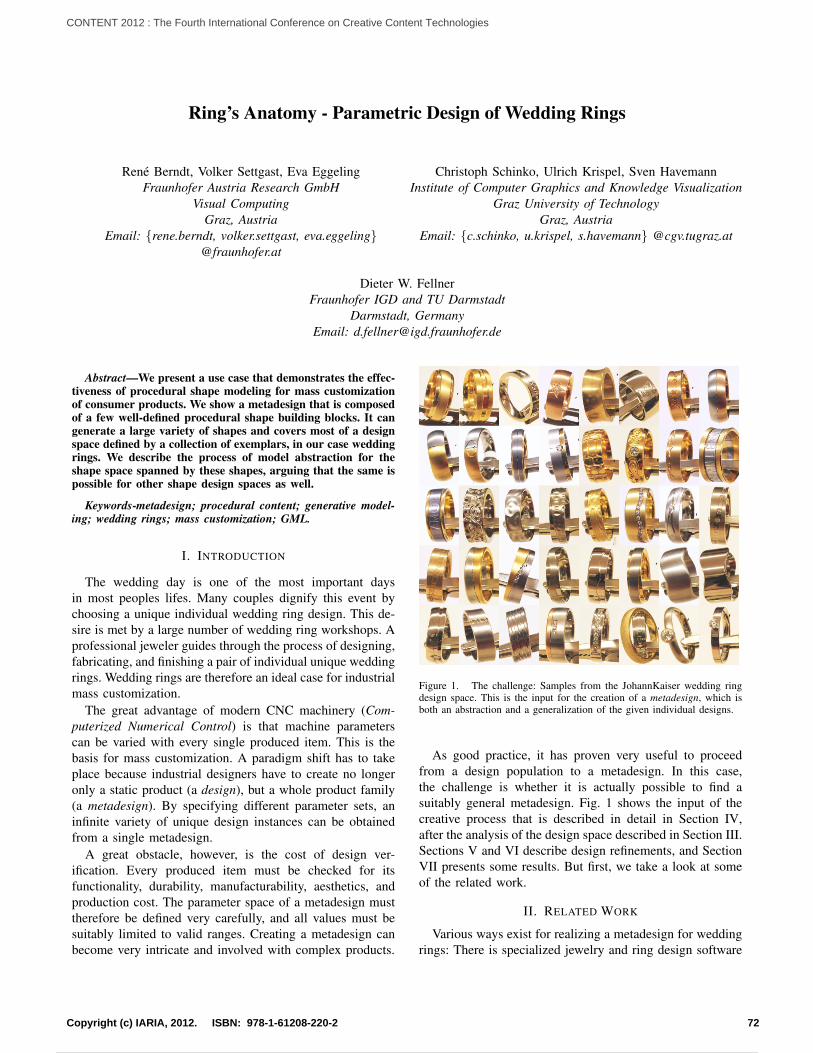
Ring’s Anatomy - Parametric Design of Wedding Rings
Rene Berndt, Volker Settgast, Eva EggelingFraunhofer Austria Research GmbH
Visual ComputingGraz, Austria
Email: {rene.berndt, volker.settgast, eva.eggeling}@fraunhofer.at
Christoph Schinko, Ulrich Krispel, Sven HavemannInstitute of Computer Graphics and Knowledge Visualization
Graz University of TechnologyGraz, Austria
Email: {c.schinko, u.krispel, s.havemann} @cgv.tugraz.at
Dieter W. FellnerFraunhofer IGD and TU Darmstadt
Darmstadt, GermanyEmail: [email protected]
Abstract—We present a use case that demonstrates the effec-tiveness of procedural shape modeling for mass customizationof consumer products. We show a metadesign that is composedof a few well-defined procedural shape building blocks. It cangenerate a large variety of shapes and covers most of a designspace defined by a collection of exemplars, in our case weddingrings. We describe the process of model abstraction for theshape space spanned by these shapes, arguing that the same ispossible for other shape design spaces as well.
Keywords-metadesign; procedural content; generative model-ing; wedding rings; mass customization; GML.
I. INTRODUCTION
The wedding day is one of the most important daysin most peoples lifes. Many couples dignify this event bychoosing a unique individual wedding ring design. This de-sire is met by a large number of wedding ring workshops. Aprofessional jeweler guides through the process of designing,fabricating, and finishing a pair of individual unique weddingrings. Wedding rings are therefore an ideal case for industrialmass customization.
The great advantage of modern CNC machinery (Com-puterized Numerical Control) is that machine parameterscan be varied with every single produced item. This is thebasis for mass customization. A paradigm shift has to takeplace because industrial designers have to create no longeronly a static product (a design), but a whole product family(a metadesign). By specifying different parameter sets, aninfinite variety of unique design instances can be obtainedfrom a single metadesign.
A great obstacle, however, is the cost of design ver-ification. Every produced item must be checked for itsfunctionality, durability, manufacturability, aesthetics, andproduction cost. The parameter space of a metadesign musttherefore be defined very carefully, and all values must besuitably limited to valid ranges. Creating a metadesign canbecome very intricate and involved with complex products.
Figure 1. The challenge: Samples from the JohannKaiser wedding ringdesign space. This is the input for the creation of a metadesign, which isboth an abstraction and a generalization of the given individual designs.
As good practice, it has proven very useful to proceedfrom a design population to a metadesign. In this case,the challenge is whether it is actually possible to find asuitably general metadesign. Fig. 1 shows the input of thecreative process that is described in detail in Section IV,after the analysis of the design space described in Section III.Sections V and VI describe design refinements, and SectionVII presents some results. But first, we take a look at someof the related work.
II. RELATED WORK
Various ways exist for realizing a metadesign for weddingrings: There is specialized jewelry and ring design software
72Copyright (c) IARIA, 2012. ISBN: 978-1-61208-220-2
CONTENT 2012 : The Fourth International Conference on Creative Content Technologies
80 / 98

1 (0,0, -2) (1,1,0) 2 quad2 /cyan setcurrentmaterial 5 poly2doubleface3 (0,1,1) extrude4 (0,0,1) (1,0,1) normalize 0 project ringplane5 (2,0,0) (0,1, -1) 2 quad6 /yellow setcurrentmaterial 5 poly2doubleface7 0 bridgerings
Figure 2. Procedural mesh modeling with GML. The quad operator (1) expects two points and a mode integer on the stack and produces an array of 3Dpoints. It is converted to a double-sided mesh face (2) one side of which is extruded (3). Two faces, represented by half-edges, can be connected usingbridgerings (7). Faces with smooth (green) edges are rendered as subdivision surfaces.
[1] [2], but also more flexible solutions like scriptable CADtools or shape programming languages.
A. Jewelry Design
Traditional jewelry design is an art with a history ofthousands of years. Only recently, the tools have changed.One way to realize a metadesign today is as an executablecomputer program. This may run very efficiently, but it lacksflexibility as the ring design is hard-coded.
The jewelry modeler from Singh et al. [3] is based onparametric voxels to allow designing carved bangles. Carvedjewelry consists of copies of small parametric cavities withuser-defined parameters. Various repetitive designs can beobtained this way. The sophisticated system from Wannaru-mon [4] uses iterated function systems (IFS) fractals. Itincorporates case-based reasoning methods and fuzzy logicto increase the efficiency of mimicking existing art forms.The system provides the option to control the cost of jewelryproduced using CNC or rapid prototyping machines.
JewelCAD [1] is a specialized 3D freeform modeler withmodeling tools that allow much freedom in creating artisticand stylish designs. It facilitates the import of profile pathsfrom 2D sketches for path extrusions defining patterns andlattices. However, it is not for procedural path generation.
iRing3D [2] is an iPhone app for end users with a simplebut powerful interactive touch-interface for ring design.However, the basic structure, and thus, the metadesign, ispre-defined, as rings are edited on a per-segment basis.
B. Procedural Modeling
iRing3D is based on an underlying engine for parametricshape design, ParaCloud GEM [5]. A parametric enginegreatly facilitates the realization of metadesigns, as it pro-vides the functionality for geometry generation, typicallyaccessible through a scripting language. In fact there aremany options for creating shape procedurally. Examplesinclude Lindenmayer or L-systems for describing plants[6], shape grammars for buildings [7], or by visual editingof geometry-generating dataflow graphs [8]. An exhaustivetreatment is beyond the scope of this paper. Instead, wedescribe two representative approaches with a large userbase, namely Processing and Rhino Grasshopper.
Processing started as a simplistic Java-based softwaresketchbook to teach students the fundamentals of computerprogramming [9]. With its comprehensive library of visualelements it quickly turned into a tool for visual artists. Agreat number of interactive art installations is realized todaywith Processing. But, the approach reaches its limits withmesh modeling, since scripting mesh operations can quicklybecome difficult to handle.
A complementary approach is taken by Grasshopper [10].It is a plugin that adds parametric modeling capabilities toa well established interactive NURBS modeler, Rhinoceros.Rhino’s mesh modeling operations can be wired together byinterconnecting components on a 2D Grasshopper canvas,which requires no programming skills. This facilitates para-metric mesh modeling up to a certain level of complexity.But even though defining a desired ring metadesign usingGrasshopper is feasible, it is not possible to deploy it as astand-alone software package because it requires Rhino. Asimpler solution is needed.
C. GML, the Generative Modeling Language
Our choice for encoding the metadesign of weddingrings is GML, a simple stack-based shape programminglanguage [11]. GML is syntactically similar to PostScript,but it provides mesh modeling rather than 2D typesettingoperators. A GML program is basically a stream of tokensthat are either data (which are put on a stack) or processinginstructions (which are executed). The example in Fig. 2shows how easily profiles (point arrays) can be turned intomesh faces that are then connected using ’bridges’. Meshmodeling operations in GML are based on halfedges; ahalfedge unambiguously denotes one vertex, one face, andone edge of a mesh. The example from Fig. 2 can easilybe extended to obtain a closed ring, provided all profilescontain the same number of points.
GML programs are typically developed in a very interac-tive fashion using the GMLStudio IDE available from theGML website [12]. The GML engine is available as ActiveXcontrol, which makes it particularly easy to embed it intoother applications.
73Copyright (c) IARIA, 2012. ISBN: 978-1-61208-220-2
CONTENT 2012 : The Fourth International Conference on Creative Content Technologies
81 / 98

Figure 3. Rings with different materials, surface characteristics, ornamental patterns and artistic engravings.
III. RING FEATURES
This section presents background knowledge about thedomain, i.e., the characteristic elements of a wedding ring.
A. Profile
The profile is the most characteristic feature defining theshape of the ring. The classic profiles are:
• Flat section profile is the traditional wedding ringprofile, which is flat on the inside and on the outside.
• D shaped profile rings have a flat profile on the insideand a heavily bent (half-circle) profile on the outside.
• Halo profile rings have a perfectly round cross section.• Oxfort court is an oval profile with flat rounded
internal and external facets.
B. Material
Another characteristic property of a wedding ring is itsmaterial. Various noble metals, e.g., rose gold, white gold,silver, platinum, but also stainless steel, are typically usedused for a wedding ring. Depending on the design, a ringmay also combine different materials; but even for a singlematerial the appearance can be varied. The surface can rangefrom a polished, highly specular surface, over glossy, toabraded (”brushed”) with a matt finished appearance. Figure3 shows samples of rings with different material and surfacecharacteristics. Combining metals with different colors canyield a quite unique ring with subtle visual contrasts, whichhas a striking look without the need for additional engravingsor jewelry.
C. Patterns and Engravings
Modern wedding rings may contain both engravings andpatterns. Engravings include artistic strokes, but also simpletext, typically the names of the couple on the inside. Withpatterns the ring surface gets a somewhat rough appearance,as in Fig. 3 (ring pairs 1,5,6).
D. Gems
Typical gemstones used in wedding rings are diamonds,sapphires, rubies, emeralds, amethysts and aquamarines.Gems not only add value, but the gem distribution patternoften also has a symbolic meaning (“starry sky”, etc.).
IV. PARAMETERIZATION
Fig. 1 shows the collection of shape instances spanningthe design space of JohannKaiser wedding rings that is tobe covered by a metadesign. Careful analysis reveals thatthe base shape of most rings can be defined using thefollowing parameters: (1) a profile polygon, (2) the angularstep size defined by the number of supporting profiles tobe placed around the ring’s center, (3) the radius, and (4) avertex transformation function. The idea is to decompose thedesign variations into a set of transformation functions. Eachfunction selectively transforms certain vertices in a certainway. By calling a sequence of different transformations, theeffects can be combined. This way, e.g., horizontal and ver-tical deformations can be separated; countless combinationsare possible by simple function concatenation.
Figure 5a shows an example of a profile polygon, copiesof which are placed radially around the origin (Fig. 5b).These polygons are first converted to double-sided faces.Then, corresponding back- and front-sides are connectedusing the bridgerings operator; it expects two halfedgesof corresponding vertices of two faces that have the samenumber of vertices (Fig. 5d). The profile polygon, therotation angle, and a set of custom parameters are the inputto this transformation function.
Figure 4. Semi-sharp creases can be obtained by close parallel edge pairs.Note that the transform function faithfully maintains this parallelity, whichwould not be possible, e.g., by simple scaling.
The custom parameters depend on the particular transfor-mation used; the sine transformation in Fig. 6 for instancerequires three parameters: frequency, amplitude, and theindices of the points of the profile polygon to which thetransformation is to be applied. Depending on the placementangle it can modify the input polygon before it is placed inthe scene. The result of the code in Fig. 6 is shown in Fig. 5f.In this case, the transformation is applied selectively only tothe points 0-7 of the profile (see Fig. 4a). The transformation
74Copyright (c) IARIA, 2012. ISBN: 978-1-61208-220-2
CONTENT 2012 : The Fourth International Conference on Creative Content Technologies
82 / 98
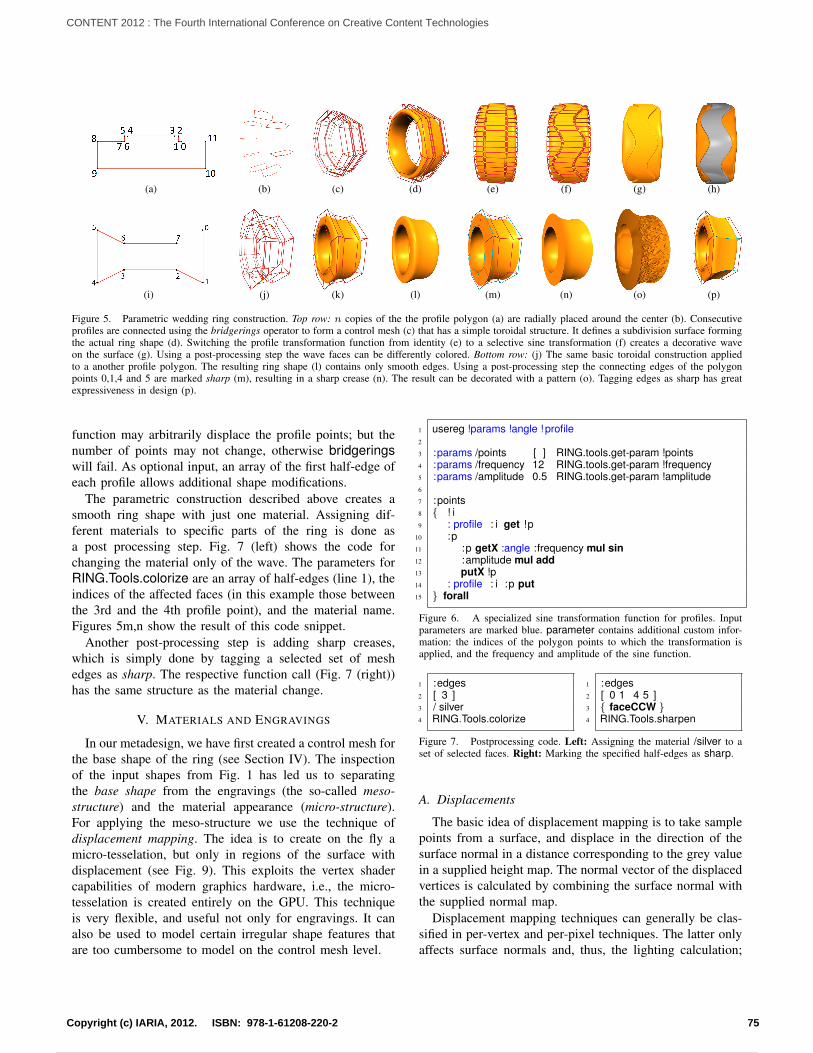
(a) (b) (c) (d) (e) (f) (g) (h)
(i) (j) (k) (l) (m) (n) (o) (p)
Figure 5. Parametric wedding ring construction. Top row: n copies of the the profile polygon (a) are radially placed around the center (b). Consecutiveprofiles are connected using the bridgerings operator to form a control mesh (c) that has a simple toroidal structure. It defines a subdivision surface formingthe actual ring shape (d). Switching the profile transformation function from identity (e) to a selective sine transformation (f) creates a decorative waveon the surface (g). Using a post-processing step the wave faces can be differently colored. Bottom row: (j) The same basic toroidal construction appliedto a another profile polygon. The resulting ring shape (l) contains only smooth edges. Using a post-processing step the connecting edges of the polygonpoints 0,1,4 and 5 are marked sharp (m), resulting in a sharp crease (n). The result can be decorated with a pattern (o). Tagging edges as sharp has greatexpressiveness in design (p).
function may arbitrarily displace the profile points; but thenumber of points may not change, otherwise bridgeringswill fail. As optional input, an array of the first half-edge ofeach profile allows additional shape modifications.
The parametric construction described above creates asmooth ring shape with just one material. Assigning dif-ferent materials to specific parts of the ring is done asa post processing step. Fig. 7 (left) shows the code forchanging the material only of the wave. The parameters forRING.Tools.colorize are an array of half-edges (line 1), theindices of the affected faces (in this example those betweenthe 3rd and the 4th profile point), and the material name.Figures 5m,n show the result of this code snippet.
Another post-processing step is adding sharp creases,which is simply done by tagging a selected set of meshedges as sharp. The respective function call (Fig. 7 (right))has the same structure as the material change.
V. MATERIALS AND ENGRAVINGS
In our metadesign, we have first created a control mesh forthe base shape of the ring (see Section IV). The inspectionof the input shapes from Fig. 1 has led us to separatingthe base shape from the engravings (the so-called meso-structure) and the material appearance (micro-structure).For applying the meso-structure we use the technique ofdisplacement mapping. The idea is to create on the fly amicro-tesselation, but only in regions of the surface withdisplacement (see Fig. 9). This exploits the vertex shadercapabilities of modern graphics hardware, i.e., the micro-tesselation is created entirely on the GPU. This techniqueis very flexible, and useful not only for engravings. It canalso be used to model certain irregular shape features thatare too cumbersome to model on the control mesh level.
1 usereg !params !angle ! profile2
3 :params /points [ ] RING.tools.get-param !points4 :params /frequency 12 RING.tools.get-param !frequency5 :params /amplitude 0.5 RING.tools.get-param !amplitude6
7 :points8 { ! i9 : profile : i get !p
10 :p11 :p getX :angle :frequency mul sin12 :amplitude mul add13 putX !p14 : profile : i :p put15 } forall
Figure 6. A specialized sine transformation function for profiles. Inputparameters are marked blue. parameter contains additional custom infor-mation: the indices of the polygon points to which the transformation isapplied, and the frequency and amplitude of the sine function.
1 :edges2 [ 3 ]3 / silver4 RING.Tools.colorize
1 :edges2 [ 0 1 4 5 ]3 { faceCCW }4 RING.Tools.sharpen
Figure 7. Postprocessing code. Left: Assigning the material /silver to aset of selected faces. Right: Marking the specified half-edges as sharp.
A. Displacements
The basic idea of displacement mapping is to take samplepoints from a surface, and displace in the direction of thesurface normal in a distance corresponding to the grey valuein a supplied height map. The normal vector of the displacedvertices is calculated by combining the surface normal withthe supplied normal map.
Displacement mapping techniques can generally be clas-sified in per-vertex and per-pixel techniques. The latter onlyaffects surface normals and, thus, the lighting calculation;
75Copyright (c) IARIA, 2012. ISBN: 978-1-61208-220-2
CONTENT 2012 : The Fourth International Conference on Creative Content Technologies
83 / 98

(a) (b) (c) (d) (e) (f) (g) (h) (i)
Figure 8. Placing diamonds: (a) A single diamond is placed on the ring. (b) The ”real” specimen. (c) Diamond placement can also exploit the structureof the parametric construction, e.g., by following the control mesh wave. (d,e) One diamond is placed at the midpoint of each half-edge of the wave. (g,h)Placement of diamonds at the points of maximum curvature of the sine wave. (i) The corresponding ”real” specimen.
Figure 9. Left: The CGV logo from Fig. 10 (middle) is applied asdisplacement map. The grey value determines the distance in normaldirection of the original surface. For light calculations, the normal mapfrom Fig. 10 (right) is used. Right: The micro-tesselation is generated onthe GPU, with one vertex for each pixel of the displacement map.
it virtually displaces points corresponding to texel centers.Consequently, per-pixel displacement is carried out by thetexture unit of the fragment shader. Per-vertex displacementchanges the positions of the of the original mesh vertices,and is therefore implemented in the vertex or geometryshader. So per-vertex displacement mapping creates actualgeometry, whereas per-pixel displacement only creates thevisual effect of a displacement. An overview of currentdisplacement mapping techniques can be found in [13].
We want to use our metadesign not only for visualization,but also for rapid-prototyping purposes. Using the per-vertexapproach is therefore mandatory, as it allows exporting thedisplaced geometry to a 3D Printer. The disadvantage ofper-vertex displacement is that it requires a rather densetesselation for highly detailed displacement maps. In our 3D-engine we overcome this issue by using a view-dependenttesselation scheme. Depending on the distance of the camerafrom the geometry, as well as on rendering speed, severallevels of subdivision are available on the CPU as well as onthe GPU to always display the appropriate level of geometricdetail. Also efficient encoding schemes for displacement aswell as normal maps, like presented in [14], can be usedto reduce CPU to GPU data transfer and thus improvethe performance. The ring in Fig. 9 illustrates the adaptivetesselation technique with the high resolution-tesselation insurface regions where a displacement is applied, and thesignificantly coarser tesselation used elsewhere.
A per-vertex displacement is encoded in two bitmaps,• a displacement map holding the height values of the
engraving as greyscale values, and• a normal map providing one surface normal vector for
each displaced vertex.Figure 10 shows a displacement map (middle) as well as anormal map (right) created from the logo of CGV (left, In-stitute of ComputerGraphics and Knowledge Visualization).
Figure 10. Left: The CGV logo. Middle: A displacement map with aslight blur effect. (Right:) The figure to the right shows the correspondingnormal map. Displacement and normal information is encoded as pixels inthe bitmaps.
These two bitmaps together with a starting half-edge, andwith parameters to specify the scale and spatial extent, aresufficient to define the displacement. This is illustrated bythe concise code fragment in Fig. 11.
B. Materials
The appearance of the microstructure of the material is ap-plied in the final rendering stage. It uses the standard Blinn-Phong shading model in combination with an approximationof the Fresnel reflection term that can model anisotropichighlights. To make the surface look metallic, the specularhighlight is modified by the color of the material, instead of
1 usereg2 ”dsp.png” !dsp3 ”nrml.png” !nrml4 0.1 !scale5 :dsp :nrml :scale :edge 3 3 dsp-displacetexture
Figure 11. Only a few lines of GML code are needed for applyingdisplacements. The file names of displacement and normal map togetherwith a scale factor, an edge, and two parameters defining the spatial extentare enough.
76Copyright (c) IARIA, 2012. ISBN: 978-1-61208-220-2
CONTENT 2012 : The Fourth International Conference on Creative Content Technologies
84 / 98

Figure 12. Side (left) and top (right) view of a brilliant. The five parametersthat are used to define the shape of a brilliant in our system are totaldiameter (A), table diameter (B), crown height (C), pavillion height (D)and girdle height (E).
the color of the light source. We use a static cube map toreflect the environment.
The ring’s surface can be shiny or matte, but accuratesimulation of a matte surface would be very time consuming.To simulate matte surfaces, we use a blurry cube map.The reflected color is mixed with the result of the Blinn-Phong [15] shader using a Fresnel term Fλ [16]. The Fresnelreflection term is calculated as Fλ = Rv ·N using the viewray Rv and the surface normal N . It exhibits more intensivereflections for flat viewing angles, and shows more of thematerial color for othogonal viewing angles.
VI. ADORNERS - GEMS
In this section, we describe the parametrization of adorn-ing elements like gems.
Our gem model is of the round brilliant cut type, dueto its dominant position in the market [17]. Similar toHemphill et. al, our mathematical model consists of a convexpolyhedron (CP) representing the surface of the brilliant.A CP is a convex set bounded by planar regions, in otherwords a volume with planar facets that is approximatelycorresponding to a sphere (in the sense that it contains nodents). In our system a CP is defined by the planes ofits facet. Each plane is defined using three 3D points; theorientation of these points specifies the orientation of theplane, thus permitting to distinguish between points belowand above the plane. The interior of a CP is defined as theset of points that are simultaneously below all of the facetplanes.
In comparison to Hemphill et al. [17], our parametrizationis slightly simplified (without culet facet); we use only fiveparameters to define the shape, as shown in Figure 12. Asit is common that the gems used on one ring are all thesame or very similar, the system differentiates between theinstantiation of a diamond, given a parameter set, and theplacements of instances of this diamond. GML provides thefunctionality to evaluate the surface of a CP given its facetplanes, which is used to create the instance geometry of aprocedural gem.
Procedural gem instances can then be placed by specifyingthe apex point, an upvector, and a scale factor. The gemsare placed on the ring surface by performing a ray-meshintersection to determine a ring surface point. Fig. 8 shows
Figure 13. Output of the parameterization process: A metadesign thatcan generate a continuous variety of ring designs, from which only a fewinstances are shown
the placement of a single diamond as well as the parametricplacement following a geometric feature.
VII. CONCLUSION AND FUTURE WORK
We have presented a case example for the efficiency ofprocedural shape modeling in for the mass customization ofwedding rings. Fig. 13 shows a few results of our parametrictoolkit. The current implementation is integrated into theREx system (see Fig. 14), which is based on the GMLbrowser plugin [18].
We consider the presented exercise to be a blueprintthat can be efficiently carried out also for other tasks ofcreating metadesigns for mass-customizable shape domains.The production of a metadedesign that is able to reproducealmost all of the input shapes took only about six weeks.The resulting GML code is only less than 20 KB large, andthe whole GML engine is contained in an ActiveX controlof less than 6 MB size. So we think it is fair to say that wehave produced a simple solution for a complex problem. Thehost application, the REx wedding ring designer, is alreadycommercially available. The system supports immediate costcalculation within each design step (e.g., depending on thechosen material or the number of gems). The added value ofour metadesign is that a variety of new wedding ring designsis available, which are part of the shape space spanned by theexemplars, but were so far not part of the (already extensive)product catalogue of the company.
Adorning elements like gems are a nice addition whendesigning rings. Sometimes, gems are not directly placedon the ring’s surface but in a socket. Modeling socketsvia the control mesh would be too cumbersome and mayhave unwanted side effects when using displacements, for
77Copyright (c) IARIA, 2012. ISBN: 978-1-61208-220-2
CONTENT 2012 : The Fourth International Conference on Creative Content Technologies
85 / 98

Figure 14. The resulting REx application from JohannKaiser, a weddingring configurator to be used by jewelers, is already commercially available.
example. Help in the form of Constructive Solid Geome-try (CSG) would allow to create complex surfaces usingBoolean operations. The next important aspect for futurework is to further enhance the visual quality. Currently, ourrenderer can handle shiny, polished or matte surfaces. Avery common surface finish of rings is brushing. For caselike this, the render should be able to handle various differentsurface characteristics. This requires a coherent, more global(u, v)-parametrization of the surface (procedural texturecoordinates).
The presented approach is considered to be used forvisualization, information purposes only. Ensuring manufac-turability, functionality or durability of the created designs ispart of future work. However, we think that a lot of potentialproblems can be avoided by carefully defining parametricconstraints.
For dissemination purposes amongst end-users, a web-based user interface offering clear, but certainly limitedmeans of configuration would be sensible. There is no needto create a browser plugin. Ideally, modern web-technologycan be used to create a meaningful user interface and aserver-side rendering approach can deliver photo-realisticrenderings.
ACKNOWLEDGMENT
We would like to thank JohannKaiser for supplying sam-ple wedding rings as well as for the permission to use theirring photographs in this paper. In addition, the authors grate-fully acknowledge the generous support from the AustrianResearch Promotion Agency (FFG) for the research projectMETADESIGNER, grant number 820925/18236.
REFERENCES
[1] E. Li, “Jewellery CAD/CAM Limited,” online:http://www.jcadcam.com, retrieved: 06, 2012.
[2] E. Nir, “iRing3d,” online: http://www.iring3d.com, retrieved:06, 2012.
[3] H. Singh, P. Tandon, and V. Gulati, “Article: A jewelry mod-eler for carved bangles,” International Journal of ComputerApplications, vol. 5, no. 2, pp. 25–27, August 2010, publishedBy Foundation of Computer Science.
[4] S. W., “An aesthetics driven approach to jewelry design,”Computer-Aided Design and Applications, vol. 7, no. 4, pp.489–503, 2010.
[5] E. Nir, “Paracloud gem,” online: http://www.paracloud.com,retrieved: 06, 2012.
[6] P. Prusinkiewicz and A. Lindenmayer, The AlgorithmicBeauty of Plants, P. Prusinkiewicz and A. Lindenmayer, Eds.Springer-Verlag, 1990.
[7] P. Muller, P. Wonka, S. Haegler, A. Ulmer, and L. V. Gool,“Procedural modeling of buildings,” in ACM SIGGRAPH,vol. 25, 2006, pp. 614 – 623.
[8] B. Ganster and R. Klein, “An Integrated Framework forProcedural Modeling,” Proceedings of Spring Conference onComputer Graphics 2007 (SCCG 2007), vol. 23, pp. 150–157,2007.
[9] C. Reas and B. Fry, Processing: A Programming Handbookfor Visual Designers and Artists. MIT Press, 2007.
[10] S. Davidson, “Grasshopper - generative modeling for Rhino,”online: http://www.grasshopper3d.com, retrieved: 06, 2012.
[11] S. Havemann, “Generative Mesh Modeling,” Ph.D. disserta-tion, Braunschweig Technical University, Germany, Novem-ber 2005.
[12] S. Havemann, R. Berndt, and D. W. Fellner, “Web-site of the generative modeling language gml,” online:http://www.generative-modeling.org, retrieved: 06, 2012.
[13] L. Szirmay-Kalos and T. Umenhoffer, “Displacement map-ping on the GPU - State of the Art,” Computer GraphicsForum, vol. 27, no. 1, 2008.
[14] C. Schinko, T. Ullrich, and D. W. Fellner, “Simple andEfficient Normal Encoding with Error Bounds,” Proceedingsof Theory and Practice of Computer Graphics, vol. 29, pp.63–66, 2011.
[15] J. F. Blinn, “Models of light reflection for computer synthe-sized pictures,” SIGGRAPH Comput. Graph., vol. 11, no. 2,pp. 192–198, Jul. 1977.
[16] M. Pharr and R. Fernando, GPU Gems 2: Programming Tech-niques for High-Performance Graphics and General-PurposeComputation (Gpu Gems). Addison-Wesley Professional,2005.
[17] S. T. Hemphill, I. M. Reinitz, M. L. Johnson, and J. E.Shigley, “Modeling the appearance of the round brilliantcut diamond: An analysis of brilliance,” Gems & Gemology,vol. 34, pp. 158–183, 1998.
[18] R. Berndt, D. W. Fellner, and S. Havemann, “Generative 3dmodels: A key to more information within less bandwidthat higher quality,” in Proc. Web3D 2005 Intl. Symp. ACMSiggraph, 2005, pp. 111–122.
78Copyright (c) IARIA, 2012. ISBN: 978-1-61208-220-2
CONTENT 2012 : The Fourth International Conference on Creative Content Technologies
86 / 98

Comparison of Methods for Horizon Line Detection in Sea Images
Tzvika Libe, Evgeny Gershikov and Samuel Kosolapov
Department of Electrical Engineering
Braude Academic College of Engineering
Karmiel 21982, Israel
e-mail: [email protected] , [email protected] (corresponding author) and [email protected]
Abstract— Four algorithms designed to find a horizontal line
separating sea from sky in real-life conditions were
implemented and compared by their accuracy and relative
speed. The algorithms selected were H-COV-LUM, based on
regional covariances in luminance images, H-HC, based on
edge detection and the Hough transform, H-LSC, based on
maximal edge detection and the least squares method and H-
MED, based on median filtering and linear regression. Real-
life images were used for comparison. The most accurate line
with respect to angular error was obtained by using the H-HC
algorithm and with respect to the error in the position of the
line by H-COV-LUM, whereas the highest speed was achieved
by using the H-LSC method.
Keywords-horizon detection; marine images; edge detection;
median filtering; image analysis
I. INTRODUCTION
The horizon line is used for different purposes, such as
navigation in airborne and marine vehicles and military
surveillance. A number of horizon line detection methods are
known [1,2,5,6,7,10,11]. Some of these methods are based
on edge detection [9], while others employ different
techniques. Due to the variety of techniques, a comparison of
the detection performance that they can achieve can be very
helpful. The goal of this research is to implement and
compare the accuracy of a number of well-known and modified horizon-line detection approaches. Considering
that in the later stages of this research the selected algorithm
is to be implemented on a stand-alone hardware unit,
algorithms complexity and their relative speed is also
evaluated.
The structure of this paper is as follows. In the next
section we present the algorithms discussed in this work for
horizon line detection in marine images. Then in Section III
we describe the methods and criteria used in the comparison
of these algorithms. Section IV is dedicated to horizon
detection results: quantitative and visual and, finally, Section V presents a summary of this work and our
conclusions.
II. ALGORITHMS COMPARED
Four algorithms are compared in this work. The
motivation for their choice is comparison of local feature
based algorithms, such as those based on edges, with global
feature based methods, such as H-COV-LUM, that uses
regional covariances. The H-MED algorithm extends the
meaning of a local feature (edge) at a pixel to its small
neighborhood and then looks for the maximal edge in the
vertical direction. Thus it introduces a compromise between
local and global features. No algorithms that require a
training stage, such as neural networks and support vector
machines were chosen for the comparison, but only simple
low complexity methods were taken.
The compared methods are:
“H-COV-LUM” – an algorithm that uses regional
covariances, as introduced in [5], but calculated on
luminance images. Although there are cases where the color
information is important [8], in this case, using achromatic image data only improves the algorithm speed significantly
with minimal loss in accuracy.
“H-HC” – using pre-processing, Canny edge detector [3]
and Hough transform [4].
“H-LSC” – using pre-processing, edge detection and
calibration by the least-squares method approach.
“H-MED” – seeking for the maximal edge in the vertical
direction, followed by median filtration in order to reject
outlying points and linear regression.
The algorithms are described in more detail in the next
subsections.
A. Regional covariance based algorithm (H-COV-LUM)
An algorithm for horizon detection for remotely piloted
Micro Air Vehicles was introduced in [5]. The algorithm
receives an image taken from the air as input and searches
for an optimal partition of the image into two regions: sky
and ground (or sky and sea) using a line, which is the detected horizon. The optimization criterion is based on the
determinants and the traces of the covariance matrices of the
two regions. More specifically, if we denote a sky pixel by
, , , ,[ G B ]s s s s T
i j i j i j i jRx , where , , ,,G ,Bs s s
i j i j i jR are the
primary red, green and blue values at the pixel (i,j), and we
denote a ground pixel by , , , ,[ ]g g g g T
i j i j i j i jR G Bx , then the
covariance matrices of the regions are given by
, , ,T
s s s s s
i j i jE x x ,
s s
i jE x and
, , ,T
g g g g g
i j i jE x x ,
g g
i jE x . E()
denotes here statistical mean. The optimization criterion, considered for all the possible horizon line orientations and
positions and maximized is given by [5]:
79Copyright (c) IARIA, 2012. ISBN: 978-1-61208-220-2
CONTENT 2012 : The Fourth International Conference on Creative Content Technologies
87 / 98

(1)
2 2
1,
det( ) det( ) ( ) ( )s g s gJ
trace trace
where det() denotes the determinant and trace() denotes the
trace of the covariance matrices s and
g .
We consider a similar criterion to the one in (1) for the
luminance image, thus the optimization term J becomes
2 2
1,
var( ) var( ) var ( ) var ( )s g s gJ
Y Y Y Y
(2)
where var() stands for variance and sY ,
gY are the luminance values of the sky and ground regions,
respectively. A simplified optimization criteria
1
var( ) var( )s gJ
Y Y
(3)
can be used instead of the one in (2) with similar results.
Also, defining a region of interest (ROI) in the image and
searching the horizon line only in this area speeds up the
algorithm significantly. Alternatively, the input image can
be down-sampled prior to the application of the algorithm to reduce its runtime, but this will decrease the accuracy as
well.
B. Edge detection and Hough transform based algorithm
(H-HC)
The stages of this method can be summarized as follows:
1. Pre-process the image using morphological erosion to reduce the probability of the detection of weak edges
in the later stages. A small circular structuring
element can be used here. Alternatively, the image
can be smoothed using a low pass filter, but we
found erosion to provide better performance.
2. Apply Canny [3] edge detector to the pre-processed
image.
3. Apply the Hough transform [4] to the edges map.
4. Choose the horizon line to be the longest line
found in the previous step.
C. Edge detection and least squares calibration based algorithm (H-LSC)
This algorithm is based on edge detection as well, but
uses a simple algorithm to detect the maximal vertical edge
in each column of the image. Its stages are described below.
1. Pre-process the image using morphological erosion.
2. Find the maximal vertical edge in each column of the image. The simplest way to measure the edge
strength is using an approximation of the vertical
derivative, e.g., , 1,i j i jY Y
. Store the (i,j)
coordinates of the maximal edges.
3. Use the least squares method to find the optimal line
passingthroughthemaximaledges’coordinates.
Edges with very small values as well as very big ones can be discarded here for better algorithm
resilience to noise.
D. Median filtering and linear regression based algorithm
(H-MED)
This algorithm employs median filters in several stages
providing high performance in the presence of noise. The
stages of the algorithm are:
1. Pre-process the image using morphological erosion.
2. Find the maximal vertical edge in each column of the
image. Here the edge at pixel (i,j) is measured as the
absolute difference between two median values of
the 5 pixels above and including pixel (i,j) and the 5
pixels below it, i.e., , 1 2i jedge med med , where
1 , 4
5
2 , 1
,
.
i
k j k i
i
k j k i
med median Y
med median Y
(4)
and.
The (i,j) coordinates of the maximal edges are stored.
3. Use linear regression to find the optimal line
passing through themaximaledges’coordinates.
4. An optional step of median filtering can be added to
remove outliers. This step can be applied to the
vertical coordinates of the maximal edges (prior to
Step 3) or to the regression errors (following Step 3).
We define the regression error as the error at
coordinates (i,j) of a maximal edge, i.e.,
, 1 0 ,i jerr i a j a
(5)
where 0 1,a a are the optimal line coefficients found in
Step 3. We define the median filtered error ,
med
i jerr as
,i jerr after applying a median filter. Now the outliers
are (i,j), where , , .med
i j i jerr err Th Th here is the
threshold (e.g., a value of 1).
III. COMPARISON METHODS AND CRITERIA
Next, we describe the images and criteria used for the
comparison of the algorithms in this work.
A. Images used to compare the algorithms
The results of horizon detection for a group of 9 marine
images are presented in this work. Image input format is
true color (24 bit per pixel) non-compressed BMP.
Resolutions used vary from 249x169 to 900x675 pixels.
Most images contain a horizon line separating the sea and
the sky clearly distinguished by the human eye. However,
sometimes the horizon line is slightly distorted by camera optics and sea waves or concealed by marine vessels. To
further challenge the selected algorithms, several images
contained clouds or sun light effects near the surface of the
sea water.
80Copyright (c) IARIA, 2012. ISBN: 978-1-61208-220-2
CONTENT 2012 : The Fourth International Conference on Creative Content Technologies
88 / 98

B. Comparison criteria
The algorithms were compared with respect to accuracy
and speed. The accuracy was measured for the detected
horizon angle relative to a horizontal line (in degrees) as
well as the height of the line above the bottom left corner of
the image (in pixels). The errors provided in the next section
for these two horizon line parameters are measured relative
to the line height and angle as determined visually. The
algorithms’ speed was measured in terms of run time (in
seconds).
IV. RESULTS
The accuracy comparison for the algorithms described above (height and angle deviations) is given in Table 1 in
terms of the mean errors for 9 test images. In some of these
images the horizon is not horizontally aligned (e.g., see Fig.
1). As it can be seen, the angular deviation is very small on
average for the H-LSC and H-HC algorithms. The height
deviation is smallest for the H-COV-LUM method, based
on regional covariances in luminance images. However, the
fastest algorithm is H-LSC, based on maximal edges and
least squares optimization, as seen from the run time
comparison in Table 2. The H-COV-LUM and H-MED
algorithms are significantly slower than H-LSC due to the required computations of regional covariances or local
medians in the process of the horizon detection.
Algorithm Mean height
deviation
Mean angle
deviation
H-LSC 1.92 0.23 °
H-COV-LUM 1.11 0.47 °
H-HC 1.67 0.13 °
H-MED 1.83 0.44 °
TABLE 1. MEAN HEIGHT DEVIATION (PIXELS) AND ANGLE
DEVIATION (DEGREES) FOR THE FOUR ALGORITHMS
TABLE 2. MEAN RUN TIMES (SECONDS) FOR THE FOUR
HORIZON DETECTION ALGORITHMS
A. Visual results
Visual results are provided in Figs. 1, 2 and 3. As it can
be seen, all the algorithms provide similar good results for
the Horizon_1 image (Fig. 1), although the H-COV-LUM
method slightly misses the horizon line. This is due to the
effect of the clouds and the sunlight reflection in the sea
water. A similar effect can be seen for the Horizon_5 image
(Fig. 2), where the H-COV-LUM method provides a slightly
less accurate estimate of the horizon line than the other
algorithms that achieve visually similar performance with
good detection of the horizon. H-COV-LUM is thus an efficient algorithm for locating the position of the center of
the horizon line, but sometimes the line is slightly rotated
compared to the optimal one introducing an angular error.
The algorithm copes well with images where the sky and the
sea are uniform in appearance even when marine vessels are
present, but it may be confused by clouds, sun reflection
effects (Fig. 1) and strong waves (Fig. 2). The solution to
this may be a pre-processing stage which removes some of
the clouds, light reflection effects and waves from the image
resulting in more uniform sky and sea areas. This is
currently under research.
In Fig. 3, both H-COV-LUM and H-HC methods provide good estimates of the horizon line, while H-LSC is
less accurate. As for H-MED, its performance is inferior to
the others due to a bigger angular error. This method is
more affected by the closer ship concealing the horizon line.
The reason for the performance decrease for H-LSC and H-
MED is that both detect maximal edges at pixels of the
larger marine vessel instead of the horizon that is partly
hidden. Than the least squares technique or the linear
regression employed to find the optimal line passing
through the maximal edge locations produce a line that is
shifted downwards relative to the optimal horizon line. The solution to this problem can be calculating the optimal line
many times using partial data and then choosing the one
passing through or close to the maximal number of edge
pixels. This is currently under research.
The H-HC algorithm, on the other hand, is robust to the
hindrances introduced by the sea vessels in the image of Fig.
3 due to the use of the Hough transform that detects the line
passing through the maximal number of pixels in the edge
map. Thus, even though some of the ship pixels are detected
as edges, this does not confuse the method as long as more
pixels are marked as edges on the real horizon line.
V. CONCLUSIONS
Four different algorithms for horizon detection in marine
images were examined in this work. The techniques
employed by these algorithms vary from using regional
covariances of sky and sea regions (H-COV) to using edge
detection and Hough transform (H-HC), using maximal
edge detection and the least squares method (H-LSC) and
using median filtering and linear regression (H-MED). The
algorithms were implemented and compared for a group of
test images with respect to accuracy as well as speed. The
most accurate method with respect to the angular error was
found to be H-HC, while the other algorithms do not lag far behind. The H-COV algorithm provided the highest
accuracy when estimating the height of the horizon line
above the bottom left corner of the image. Also when
Algorithm Mean Time (sec.)
H-LSC 0.3
H-COV-LUM 2.8
H-HC 0.4
H-MED 2.5
81Copyright (c) IARIA, 2012. ISBN: 978-1-61208-220-2
CONTENT 2012 : The Fourth International Conference on Creative Content Technologies
89 / 98

comparingthealgorithms’speed,thefastestmethod was H-
LSC. We conclude that all the algorithms examined in this
work can be used for horizon detection in still marine
images. Moreover, the algorithms can be used also in
images taken by infrared cameras, which is the subject of
future research.
ACKNOWLEDGMENT
We would like to thank the administration of Ort Braude college and the Department of Electrical Engineering for providing the opportunity to conduct this research and the financial means to present it at the conference.
REFERENCES
[1] G. Bao, Z. Zhou, S. Xiong, X. Lin, and X. Ye, “Towards micro air vehicle flight autonomy research on the method of horizon extraction”, Proc. IEEE Conf. on Instrumentation and Measurement Technology, 2003, vol. 2, pp. 1387-1390.
[2] G.-Q. Bao, S.-S. Xiong, and Z.-Y. Zhou, “Vision-based horizon extraction for micro air vehicle flight control”, IEEE Trans. on Instrumentation and Measurement, 54(3), 2005, pp. 1067-1072.
[3] J. Canny, “A computational approach to edge detection”, IEEE Transactions on PAMI, 8(6), 1986, pp. 679-697.
[4] R. O. Duda and P. E. Hart, “Use of the Hough Transformation to Detect Lines and Curves in Pictures”, Comm. ACM, 15(1), 1972, pp. 11–15.
[5] S. M. Ettinger, M. C. Nechyba, P. G. Ifju, and M. Waszak, “Vision-guided flight stability and control for micro air vehicles”, Proc. IEEE Conf. on Intelligent Robots and Systems, Lausanne, Switzerland, 2002, pp. 2134 – 2140.
[6] S. Fefilatyev, V. Smarodzinava, L.O. Hall, and D.B. Goldgof, “Horizon detection using machine learning techniques”. Proc. Intern. Conf. on Machine Learning and App., 2006, pp. 17-21.
[7] S. Fefilatyev, D.B. Goldgof, and L. Langebrake. “Towards detection of marine vehicles on horizon from buoy camera”. Proc. SPIE, 2007, pp. 6736:67360O.
[8] E. Gershikov and M. Porat, “On color transforms and bit allocation for optimal subband image compression”, Signal Processing: Image Communication, 22(1), Jan. 2007, pp. 1-18.
[9] S. Kosolapov, “Robust Algorithms Sequence for Structured Light 3D Scanner Adapted for Human Foot 3D Imaging”, Journal of Comm. and Computer, 8(7), 2011, pp. 595-598.
[10] K. Nonami, F. Kendoul, S. Suzuki, W. Wang, and D. Nakazawa, Autonomous flying robots (Springer, Tokyo, Dordrecht, Heidelberg, London, New York, 2010).
[11] Y. Wang, Z. Liao, H. Guo, T. Liu, and Y. Yang, "An Approach for Horizon Extraction in Ocean Observation", Proc. IEEE Congress on Image and Signal Processing, 2009, Tianjin, China, pp. 1-5.
82Copyright (c) IARIA, 2012. ISBN: 978-1-61208-220-2
CONTENT 2012 : The Fourth International Conference on Creative Content Technologies
90 / 98

H-COV result for Horizon_1 H-LSC result for Horizon_1
H-MED result for Horizon_1 H-HC result for Horizon_1
Figure 1. Horizon detection results for image Horizon_1. The (yellow) line marks the
detected horizon. Note the clouds and reflected light effects in this image.
83Copyright (c) IARIA, 2012. ISBN: 978-1-61208-220-2
CONTENT 2012 : The Fourth International Conference on Creative Content Technologies
91 / 98

H-COV result for Horizon_5 H-LSC result for Horizon_5
H-MED result for Horizon_5 H-HC result for Horizon_5
Figure 2. Horizon detection results for image Horizon_5. The (yellow) line marks the detected
horizon. Despite the waves and the ship present, all the algorithms detect the horizon correctly.
84Copyright (c) IARIA, 2012. ISBN: 978-1-61208-220-2
CONTENT 2012 : The Fourth International Conference on Creative Content Technologies
92 / 98

.
H-COV result for Horizon_6 H-LSC result for Horizon_6
H-MED result for Horizon_6 H-HC result for Horizon_6
Figure 3. Horizon detection results for image Horizon_6. The (yellow) line marks the
detected horizon. Note the waves and the sea vessels present in this image, especially the closer one blocking the horizon.
85Copyright (c) IARIA, 2012. ISBN: 978-1-61208-220-2
CONTENT 2012 : The Fourth International Conference on Creative Content Technologies
93 / 98

Self-Calibrated Structured Light 3D Scanner Using Color Edge Pattern
Samuel Kosolapov
Department of Electrical Engineering
Braude Academic College of Engineering
Karmiel 21982, Israel
e-mail: [email protected] (Samuel Kosolapov)
Abstract—A prototype of general-purpose fast and
inexpensive non-laser structured light self-calibrated 3D
scanner using a unique color edge pattern was designed, built
and tested. The main elements of the 3D scanner are non-laser
slide projector and inexpensive WEB camera. The pattern
projected to the colored 3D object in test consists of a plurality
of a pairs of color strips, white strips and black strips. In the
simplest implementation, three basic complimentary colors
{M, Y, C} were used, effectively creating at least 6 unique color
edges. The addition of black and white delimiter strips enables
the creation of a pattern containing 32 easily recognized edges
in the simplest implementation and 153 color edges in case six
colors {R, G, B, M, Y, C} are used. Color edges can be easily
(and unambiguously) detected on the true-color 2D images of
the 3D object in-test (grabbed by WEB camera) which enable
the reconstruction of the 3D shape from a single 2D frame.
Optional mechanical translation of the pattern enables the
increase in the number of edges and, after applying a sequence
of image processing algorithms, the building of a true color 3D
model of the scanned 3D object. In order to lessen pure
acquisition time (when 3D object in test must not move),
special auto-calibration elements were integrated into scanner
mechanical construction so that auto-calibration and 3D
reconstruction steps are executed after acquisition is finished.
Scanner prototype was tailored to scan 3D shape of human foot
with a 3D accuracy of about 0.5 mm in less than 2 sec, which is
adequate for the selected exemplary application: individual
insoles design and production.
Keywords-image processing; 3D scanner; structured light;
color edge detector
I. INTRODUCTION
“Structure light technique” - the illumination of 3D
objects by specially designed pattern in order to create 3D
models of real 3D objects from set of relevant 2D images is
well known [1][2]. A number of techniques to solve the
“ambiguity problem” resulting from the usage of
monochrome and color structure light patterns are known
[1][2][3]. In the frames of previous research [4][5], a number
of 3D scanner prototypes were build. Generally, the operation of a 3D scanner requires a time-consuming
calibration step. The goal of this research was to evaluate
the “post-acquisition calibration” concept. The re-designed
prototype contains calibration elements (calibration bars and
calibration markers), which are an integral part of the
scanner mechanical construction. By using these auto-
calibration elements, required calibration information can be
extracted after image acquisition is finished. Post-calibration
may be especially useful in the field condition or in medical
devices, when usage of “standard” time-consuming
calibration procedure may be problematic. Following parts
of this article describes main elements of the exemplary
design of the 3D scanner, color edge pattern used, main
blocks of the reconstruction software and results of 3D
Scanner operation.
II. SCANNER DESIGN AND OPERATION
The exemplary design and operation of 3D Scanner
using a unique color edge pattern (see Figure 1 and Figure
2) was described in [3]. The main elements of the software used to reconstruct 3D image were described in [3][4][5]. In
this research, additional auto-calibration elements (see
Figure 3) were included in the scanner design. Additionally,
electromechanical means were modified to enable micro-
movements of the slide.
Figure 3 presents a number of original, intermediate, and
processed 2D images obtained during reconstruction steps.
Callout 1 points to the exemplary “MY” color edge on the
surface of foam mold of the human foot. (Foam molds are
used in podiatry clinics to create a “mechanical copy” of the
human foot. The mold is used to produce individual insole for specific patient). Callouts 2 and 3 point to 4 (of 8) corner
color markers. Callouts 4, 5, 6, 7 point to white calibration
bars. Color corner markers and calibration bars are integral
parts of the scanner design; they are always seen by the
camera and used in the post-calibration and 3D
reconstruction process.
A. Unique Color Edge Pattern
The described 3D Scanner uses a specially designed
color pattern [3] consisting of color strips pairs, white strips
and black strips. In the simplest implementation (presented
on Figure 1), three basic colors {R, G, B} are used. In this
pattern, six unique color edges are created: “RG”, “BG”,
“RB”, “GB”, “BR” and “GR”. It must be mentioned that the
exemplary “RG” and “GR” color edges can be easily
distinguished by directional color edge detector (as a “color
jump” of opposite sign) and, thus, are considered as different.
Usage of color strips enables us to obtain more
“structure light lines” from a single 2D image without an
“ambiguity problem” [1] and thus lessen a number of
images needed to be grabbed for 3D reconstruction. In order
86Copyright (c) IARIA, 2012. ISBN: 978-1-61208-220-2
CONTENT 2012 : The Fourth International Conference on Creative Content Technologies
94 / 98

to additionally increase speed of 3D scan, non-unique white
and black “delimiter” strips (“wbw”) were added to the
pattern (See Figure 1 and Figure 2).
Theoretically, any number of colors can be used to build
color strips. However, camera noise restricts the number of
colors that can be reliably recognized by software, especially when colored 3D objects are to be scanned.
Practically, the pattern presented on Figure 2 (having 153
color edges) appears to be reliable enough, even when
inexpensive low quality WEB cameras are used.
In the following examples, the simplest pattern (32
edges) was used, but, instead of the basic set {R, G, B}, a
complimentary set {M, Y, C} was used in order to enable
pattern printing by using inexpensive ink-jet printer.
B. Acquisition and Pattern Translation
Theoretically, the selected approach enables the
reconstruction of the 3D shape of the real 3D object by using
a single 2D image. Practically, this can be reliably executed
only for 3D objects having a white surface. Real-life 3D
objects are colored, which distorts pattern colors (surface
color is combined with pattern colors). Theoretically, by
searching for the “color-edge” jump (instead of the specific colors of the adjacent strips), the 3D reconstruction from one
2D frame can be carried out (in case the surface color
changes in a smooth fashion). However, practically, an
abrupt color change of the 3D object surface makes this
reconstruction non-reliable.
In order to increase the reliability of the 3D scanner,
electromechanical means enabling the translation of the slide
in the direction normal to the direction of the pattern color
edges were added to scanner design.
Callouts 1 and 8 on the Figure 3 point to exemplary
“MY” color edge on the surface of foam. It can be seen that
the position of “MY” (and other pattern elements) is shifted in the horizontal direction. Additionally, it can be seen that
the colors of the pattern are severely distorted by color of the
foam (by comparing the strip color on the white calibration
bars with colors on the foam surface).
Typically, the slide was translated three times during
acquisition (acquisition results in four raw frames). The use
of auto-calibration enables the use of an extremely simple
low-quality electro-mechanical translator using a stepper
motor controlled by PC.
In some tests, each of four raw frames was a robust mean
of a number of frames.
C. True color Image Assembly, Alignment and Decolorizing
It is clear that on every raw frame only a part of 3D
object’s surface is illuminated by a white light. Considering
that the camera is not moved during acquisition, it is clear
that by selecting the “brightest” pixels from all four raw frames, the “true color” 2D image of the object in test can be
created (See Callout 9 on Figure 3).
By using the original colors of the surface of the 3D
object, it is possible to “de-colorize” all raw frames: referring
to callout 10 of Figure 3, it can be seen that the color edges
are easily distinguished now and that colors of the strips on
the surface of white calibration bars are practically the same
as the colors of the strips on the surface of the foam. The decolorizing algorithm may lead to unreliable results at the
dark regions (especially on the periphery). To prevent the
appearance of “non-existed colors”, pixels in doubt are
marked as “bad pixels” and seen as “black pixels” (Callout
11).
During the “decolorizing” step, four raw frames are
“aligned” by using eight corner calibration markers (as if the
camera axis is normal to the calibration bars).
III. RECONSTRUCTION SOFTWARE
A. Color edge detector and synthetic calibration lines
The reconstruction software detects all possible color
edges on every aligned and decolorized raw frame. Callout
12 of Figure 3 points to the exemplary “MY” color edge
detected by the color edge detector (the edge points are
drawn as “black”). Callouts 13 and 14 points to the “MY”
color edge points detected on the surface of the left and right
base calibration bars. The Z coordinate of these bars is set as
the zero of Z-axis. Callouts 15 and 16 points to the “MY”
color edge points detected on the surface of the left and right
upper calibration bars. The Z coordinate of these bars is known as 40 mm.
By drawing a line between sub-lines of callouts 13 and
14, one can obtain the base synthetic calibration line (See
Callout 17) and upper calibration line (Callouts 15-16 and
18). Lines 17 and 18 are equivalent to the “standard pre-
acquisition” calibration lines. However, they are extracted
after the acquisition is finished. If needed, an improved or
more sophisticated algorithm can be re-used to create more
exact calibration lines.
B. True color 3D image reconstruction
After synthetic calibration lines creation, {X,Y,Z}
triangulation is trivial. By processing all “black” pixels of
all color edges of all raw frames, a cloud of 3D points is
created. Referring to reconstructed 2D true-color image, {R,
G, B} the color of every 3D point of the cloud can be set.
The special sequence of robust algorithms eliminates
obvious outliners [4]. Resulted cloud of 3D Points can be presented by any appropriate way.
IV. RESULTS
Typical results of 3D scanner operation are presented on
Fig. 4. Callout 1 points to the “Heights map” of the resulted
3D model of the foam mold: the Z-coordinate is encoded as
“pixel brightness”. Callouts 2 and 3 points to X and Y
Height profiles (zoomed for clarity). By using cursors, the Z
87Copyright (c) IARIA, 2012. ISBN: 978-1-61208-220-2
CONTENT 2012 : The Fourth International Conference on Creative Content Technologies
95 / 98

coordinate and {R,G,B} color can be evaluated for any
{X,Y}.
Callout 4 of Figure 4 points to the 3D Model presented
by using an “Oblique Projection”. By using this
presentation, the 3D model can be seen from any angle.
Callout 5 presents the 3D model as a standard STL file (which can be sent directly to the 3D Printer on CNC).
Typical {X, Y, Z} accuracy of the 3D Scanner was
about 0.5 mm.
Typical scan time is about 2 sec (comparing with more
than 1 min for the design described in [3]). The processing
time depends on the PC speed and is about 30 sec.
V. CONCLUSIONS
For the selected application inexpensive (less than
$100) non-laser 3D Scanner described above has a typical
accuracy of 0.5 mm, which is less than the accuracy of
laser-scanning devices. However, structured light scanners
can be used when laser usage is not recommended (for example in medical devices) or when the high price of laser
scanners makes them impractical. Additional advantages of
the developed design are its relatively short scan time and
the elimination of calibration step.
It can be assumed that the usage of a new generation of
high resolution, inexpensive, and low-noise digital cameras
will enable a significant increase in the accuracy and
reliability of structured light 3D scanners.
ACKNOWLEDGMENT
This study was supported by TNUFA Grant from the Chief Scientist of the Ministry of Trade and Industry, Israel, and by a grant from research committee of ORT Braude Academic College of Engineering, Karmiel, Israel.
REFERENCES
[1] R. Jain, R. Kasturi, B.G. Schunck, “Machine Vision”,
McGraw-Hill Inc., 1995, pp. 301-304.
[2] P. Gockel, T. Dillman, “Computer Vision. Principles and Practics”, Elector International Media BV ,2008, pp. 225-250.
[3] S. Kosolapov, “Method and Apparatus for determinimg the three dimensional shape and dimensions of the object, US Patent US 7,456,842 B2, 2008.
[4] S. Kosolapov, Evaluation of Robust Algorithms Sequence Designed to Eliminate Outliners from Cloud of 3D Points Representing 3D Human Foot Image, SMTDA 2010, pp. 383-389.
[5] S. Kosolapov, “Robust Algorithms Sequence for Structured Light 3D Scanner Adapted for Human Foot 3D Imaging”, Journal of Communication and Computer, 8(7), 2011, pp. 595-598.
Figure 1. Structure Light Pattern containing 6 unique color edges.
Total number of edges to be extracted from one 2D image is 32
Figure 2. Structure Light Pattern containing 30 unique color edges.
Total number of edges to be extracted from one 2D image is 153.
88Copyright (c) IARIA, 2012. ISBN: 978-1-61208-220-2
CONTENT 2012 : The Fourth International Conference on Creative Content Technologies
96 / 98

Figure 3. Usage of the pattern shift for reconstruction of true-color 2D image of 3D test object (foam mold)
and extraction of {X,Y,Z} coordinates from synthetic calibration lines. (See text for detailed explanations)
89Copyright (c) IARIA, 2012. ISBN: 978-1-61208-220-2
CONTENT 2012 : The Fourth International Conference on Creative Content Technologies
97 / 98
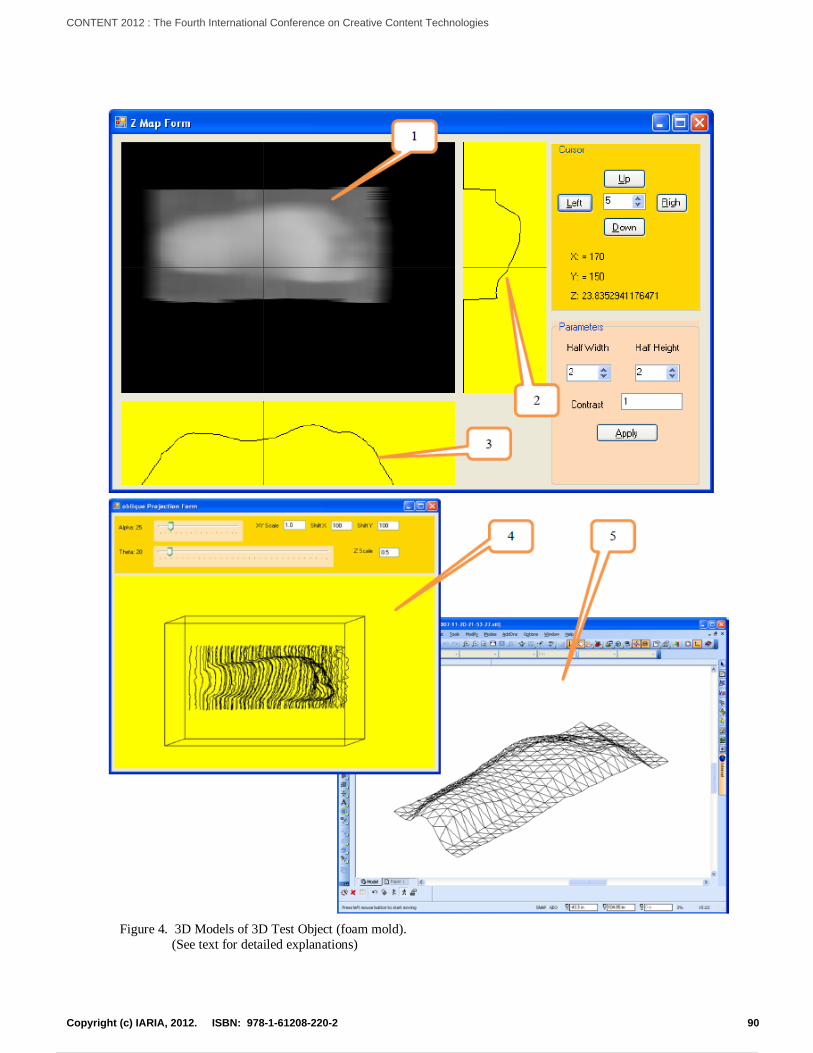
Figure 4. 3D Models of 3D Test Object (foam mold).
(See text for detailed explanations)
90Copyright (c) IARIA, 2012. ISBN: 978-1-61208-220-2
CONTENT 2012 : The Fourth International Conference on Creative Content Technologies
Powered by TCPDF (www.tcpdf.org)
98 / 98