Contamination Assessment of Lead, Zinc, Copper, Cadmium, Arsenic and Antimony in Ahangaran Mine...
14
Soil and Sediment Contamination, 19:573–586, 2010 Copyright © Taylor & Francis Group, LLC ISSN: 1532-0383 print / 1549-7887 online DOI: 10.1080/15320383.2010.499921 Contamination Assessment of Lead, Zinc, Copper, Cadmium, Arsenic and Antimony in Ahangaran Mine Soils, Malayer, West of Iran BEHROUZ RAFIEI, AZAM SADAT KHODAEI, SAEID KHODABAKHSH, MAHDI HASHEMI, AND MASOUMEH BAKHTIARI NEJAD Bu Ali Sina University, Hamedan, Iran Heavy metal contamination has become an important environmental hazard in recent years. In this study a soil-based geochemical survey in the mining district of Ahangaran Malayer (Hamedan province, west of Iran) was carried out. The concentrations of Pb, Zn, Cu, Cd, As, and Sb were determined in 40 topsoil samples. A number of calculation methods have been put forward for quantifying the contamination level of heavy metals on the basis of geoaccumulation index (I geo ), enrichment factor (EF), pollution index (PI). The calculated results of I geo and EF of heavy metals reveal the order of I geo is Pb > Sb > Cd > As > Cu > Zn and the order of EF is Pb > Sb > Cd > Zn > Cu > As. The high I geo and EF for Pb, Sb, and Cd in the soils indicate that there is considerable Pb, Sb, and Cd pollution, which mainly originates from mining activities. The I geo and EF of Zn, As and Cu are low and the assessment results indicate this pollution is not significant. Assessment results of PI indicate soils are seriously polluted. Keywords Ahangaran mining district, contaminated soils, heavy metal, Iran, lead Introduction Since early in the history of mankind, metallic ore deposits have played an important role in the technological and economic development of human society. The highly industrialized society requires an increase in metallic mineral supplies. Thus, it is a priority to increase exploration and exploitation of these ore deposits (Kesler, 1994). Regrettably, in most historical and some modern cases the exploitation of ore deposits has been accompanied by a negative impact to the environment (Gray et al., 1994; King, 1995). Heavy metals occur as natural constituents of the earth crust, and are persistent envi- ronmental contaminates since they cannot be degraded or destroyed. The term geochemical background has been defined as “The normal abundance of an element in barren earth material” (Hawkes and Webb, 1962). In regions where hydrothermal processes have given rise to mineralization, the common compositions of local background are modified, raising metal concentrations (geogenic sources). In addition, ore extraction and mineral processing facilitate metal mobilization in surrounding areas and increase the average levels of metal in Address correspondence to Behrouz Rafiei, Dept. of Geology, Faculty of Sciences, Bu Ali Sina University, Mahdieh St., Hamedan, Iran 65178-38695. E-mail: b rafi[email protected]; behrouz rafi[email protected] 573
Transcript of Contamination Assessment of Lead, Zinc, Copper, Cadmium, Arsenic and Antimony in Ahangaran Mine...

Soil and Sediment Contamination, 19:573–586, 2010Copyright © Taylor & Francis Group, LLCISSN: 1532-0383 print / 1549-7887 onlineDOI: 10.1080/15320383.2010.499921
Contamination Assessment of Lead, Zinc, Copper,Cadmium, Arsenic and Antimony in Ahangaran
Mine Soils, Malayer, West of Iran
BEHROUZ RAFIEI, AZAM SADAT KHODAEI,SAEID KHODABAKHSH, MAHDI HASHEMI,AND MASOUMEH BAKHTIARI NEJAD
Bu Ali Sina University, Hamedan, Iran
Heavy metal contamination has become an important environmental hazard in recentyears. In this study a soil-based geochemical survey in the mining district of AhangaranMalayer (Hamedan province, west of Iran) was carried out. The concentrations of Pb,Zn, Cu, Cd, As, and Sb were determined in 40 topsoil samples. A number of calculationmethods have been put forward for quantifying the contamination level of heavy metalson the basis of geoaccumulation index (Igeo), enrichment factor (EF), pollution index(PI). The calculated results of Igeo and EF of heavy metals reveal the order of Igeo isPb > Sb > Cd > As > Cu > Zn and the order of EF is Pb > Sb > Cd > Zn > Cu > As.The high Igeo and EF for Pb, Sb, and Cd in the soils indicate that there is considerablePb, Sb, and Cd pollution, which mainly originates from mining activities. The Igeo andEF of Zn, As and Cu are low and the assessment results indicate this pollution is notsignificant. Assessment results of PI indicate soils are seriously polluted.
Keywords Ahangaran mining district, contaminated soils, heavy metal, Iran, lead
Introduction
Since early in the history of mankind, metallic ore deposits have played an important role inthe technological and economic development of human society. The highly industrializedsociety requires an increase in metallic mineral supplies. Thus, it is a priority to increaseexploration and exploitation of these ore deposits (Kesler, 1994). Regrettably, in mosthistorical and some modern cases the exploitation of ore deposits has been accompaniedby a negative impact to the environment (Gray et al., 1994; King, 1995).
Heavy metals occur as natural constituents of the earth crust, and are persistent envi-ronmental contaminates since they cannot be degraded or destroyed. The term geochemicalbackground has been defined as “The normal abundance of an element in barren earthmaterial” (Hawkes and Webb, 1962). In regions where hydrothermal processes have givenrise to mineralization, the common compositions of local background are modified, raisingmetal concentrations (geogenic sources). In addition, ore extraction and mineral processingfacilitate metal mobilization in surrounding areas and increase the average levels of metal in
Address correspondence to Behrouz Rafiei, Dept. of Geology, Faculty of Sciences, Bu AliSina University, Mahdieh St., Hamedan, Iran 65178-38695. E-mail: b [email protected]; [email protected]
573

574 B. Rafiei et al.
the soil (anthropogenic sources). Heavy metals, naturally and anthropogenically distributedinto the environment, have harmful effects on the human body. Exposure to Pb may leadto loss of appetite and weight, depression, muscular weakness, joint stiffness, growth re-tardation, and cardiovascular abnormalities (Rosen, 1993; Gupta and Gupta, 1998). Zinchas been reported to cause the some signs of illness as does lead, and can easily be mis-takenly diagnosed as lead poisoning (McCluggage, 1991). Excessive copper may lead toneurodegenerative diseases such as Alzheimer’s disease, Parkinson’s disease, amyotrophiclateral sclerosis, and Prion disease (Butterfield and Boyd-Kimball, 2004; Poon et al., 2004).Cadmium is toxic at extremely low levels. In humans, long-term exposure results in renaland myocardic dysfunction. High exposure can lead to abstractive lung disease, osteomala-cia, osteoporosis, and high blood pressure (McCluggage, 1991; INECAR, 2000; EuropeanUnion, 2002; Young, 2005). In humans, chronic exposure to arsenic can cause skin, lung,liver, bladder, and kidney cancers. High-level exposure can cause death (Chen et al., 1988;Chen and Wang, 1990; Ogwuegbu and Ijima, 2003). Antimony exerts a strong irritatingeffect on the gastrointestinal mucosa and triggers sustained vomiting. Other effects includeabdominal cramps, diarrhea, and cardiac toxicity (Elinder and Friberg, 1986). Chronic res-piratory uptake of antimony-containing dusts leads to irritation of the respiratory treat andmyocardial and liver damage (Elinder and Friberg, 1986; Winship, 1987).
The impact of heavy metal pollution on ecosystems due to anthropogenic activitieslike smelting or mining activities has been investigated (Adriano, 1986; Chuan et al., 1996;Cambier, 1997; Dijkstra, 1998). Opencast mining activities may have a serious environ-mental impact on soils and water streams by generating sulfide-rich tailings (Bhattacharyaet al., 2006).
As a result, elevated levels of heavy metals may be found in and around disused met-alliferous mine ore due to discharge and dispersion of mine wastes into nearby agriculturalsoils and stream systems. Eventually, they may pose a potential health risk to residents inthe vicinity of mining areas and consumers of locally grown foods.
The Ahangaran mining district (west of Iran) was selected to analyze the importance ofthe different geogenic and anthropogenic factors in pollution of the soil. This area is one ofthe earliest active mines in Iran, discovered in 1959. Before 1974, the mine materials wereextracted by mineral separation methods; since then 3,600 tons of Pb and Zn are extractedannually after construction of the floatation unit in the mine. The absolute ore reserve isestimated at 254,800 tons and the extraction capacity is 1,000 tons; extraction is carried outusing the open pit and stairway method.
Despite all the human activity described, to date no detailed studies have been carriedout in the region to determine the concentrations of heavy metals in the surrounding soils.Therefore, the main objective of this study was to determine the concentration of heavymetals in soil samples collected and to identify the concentration of the anomalous elementsto discriminate natural and anthropogenic contributions.
Materials and Methods
General Description of Study Area
The study area is situated at 20km SE of Malayer City in Hamedan province (longitude48o 59′ 25′′ E, latitude 34o 11′ 8′′ N), west central Iran (Figure 1) (Gitashenasi, 2008).The climate is relatively hot and dry in summer and rainy in winter (semi-arid area); themaximum annual rainfall is 289 mm (Malayeri et al., 2005). The texture of the soil is mainly

Contamination Assessment of Ahangaran Mine Soils 575
Figure 1. Location map of the study area (redrawn after Gitashenasi, 2008) and sampling points.
sandy mud. The dominate clay minerals found in the soils are chlorite, illite, kaolinite, andsmall amounts of smectite.
The area is covered by slightly metamorphized rocks of lower Jurassic slates, phyllitesand quartzite sandstones) and lower cretaceous carbonates (Momenzadeh et al., 1979).The area is located on the Sanandaj-Sirjan structural zone (Stocklin, 1968), which ischaracterized by NW striking regional metamorphism and volcanism in Mesozoic to earlytertiary time, plutonism in late mesozoic to early tertiary, and by Alpine tectonism in tertiaryto present time.
The ore is syngenetic and stratiform, found in a relatively symmetrical anticline. Theore matter occurs as scattered patches in flat and thin lenses of sandy-dolomite interbeddedin the lower cretaceous carbonates, and as fracture and karst filling in the same lenses,which the grade of the ore from the center of the lens towards circumference of the lensdecreases to non-economic values. The paragenesis includes sulfide (i.e. galena, pyrite,chalcopyrite, malachite, and azurite) and oxide (siderite, hematite, and goethite) minerals.The thickness of the ore increases eastward from the present mine open cast.
Mining and milling operations, together with grinding, concentrating ores and disposalof tailing, provide obvious sources of contamination in the surface environment, along withmine and mill waste water (Adriano, 1986), and they may pose a potential risk of healthfor wild life and human.
Sampling and Chemical Analysis
In total, 38 topsoil samples (0–30 cm depth) were collected from the mine-around soils,dump and arable land in the summer of 2007 to determine the contamination level. Each soil

576 B. Rafiei et al.
sample was obtained in a 50 × 50 cm grid using a stainless steel trowel. Two control sampleswere selected far from the mine. The sample locations were selected based on the mineoutcrops and parts, potentially more subject to pollution. However, in the north mountainousregion of the mine, no outcrops of the beds can be found due to the dip directions. Therefore,sample locations had to be moved to the south of the mine. A southward gentle dip existsin the mine.
Sampling sites of the field survey have been identified on the basis of mineralizationarea, tailing location, and geomorphological features of the mining area. Soil samples werecollected along seven radial transects from mine and tailing. The control samples werecollected from north of Konjdar and east of Siyah Chegha villages, located far from themine and mining area and were assumed not affected by the mineralization that led tonatural and anthropogenic enrichment. The location of the sampling points is shown inFigure 1.
All samples were stored in sealed polyethylene bags, labeled, and transported to thelaboratory. The samples were air-dried in an oven at 50◦C for two days and then weremixed, forming a cone and dividing the cone into four parts. Each opposite fraction wasmixed and then the two halves were mixed. The > 2 mm size fraction, including stones,coarse plant roots or residues, was removed. A portion of the < 2 mm fraction was split outand designated as whole sample. One half was stored; the other half was then ground witha mortar and homogenized and sieved through 120 mesh sieve. Then, the ground samplewas digested using a strong acid mixture (2 ml of HF, 8 ml of HClO4, 3 ml of HCl and9 ml of HNO3), and then solutions were prepared for ICP-AES measurement (Inductivelycoupled Plasma Atomic Emission spectrometry, a technique of simultaneous multi-elementanalyses, in the acme Analytical Chemistry Laboratories Ltd., in north Vancouver (ALSCanada).
Methods for Estimating Pollutant Impact
A number of calculation methods have been put forward for quantifying the degree ofmetal enrichment or pollution in soils (Loska et al., 1997; Yasar et al., 2001; Audry et al.,2004; Gemici et al., 2007; Abrahim and Parker, 2008; Shikazono et al., 2008). In thisstudy, geoaccumulation Index (Igeo), enrichment factor (EF), and pollution index (PI) werecalculated to assess the heavy metal contamination level around the mine.
A quantitative measure of extend of metal pollution in the studied soil was calculatedusing the geoaccumulation protocol proposed by Muller (1969). This index (Igeo) of heavymetal accumulation is calculated by computing the base 2 logarithm of the measured totalconcentration of the metal relative to its background concentration using the followingmathematical relationship (Muller, 1969):
Igeo = log2[Cn/1.5Bn] (1)
where Cn is the measure total concentration of the element in the < 63 µm fraction of soil, Bn
is the geochemical background concentration of the element in fossil argillaceous sediment(average shale). In the study, Bn is the background of element in mine soils. The constant1.5 is introduced to minimize the effect of possible variations in the background values,which may be attributed to lithologic variations in the soils. The following classificationis given for geoaccumulation index (Muller, 1969): < 0 = practically unpolluted, 0–1= unpolluted to moderately polluted, 1–2 = moderately polluted, 2–3 = moderately to

Contamination Assessment of Ahangaran Mine Soils 577
strongly polluted, 3–4 = strongly polluted, 4–5 = strongly to extremely polluted, and> 5 = extremely polluted.
Enrichment factor (EF) of an element in the studied samples was based on the stan-dardization of a measured element against a reference element. A reference element isoften an element having low concentration variability, such as Al, Fe, Ti, Si, Sr, K, etc.(Tasdemir and Kural, 2005; Kartal et al., 2006; Turner and Simmonds, 2006; Yongming etal., 2006; Hao et al., 2007). The pH of the selected soil samples ranges from 7.09 to 7.86with an average of 7.52. Aluminum was selected as the reference element, due to crustaldominance and its high immobility (Shikazono et al., 2008). The EF is calculated as:
EF = [Cx/Cref]sample/[Cx/Cref]Background (2)
where Cx is the measure total concentration of element in the soil and Cref is the concen-tration of reference element. EF values less than 5.0 are not considered significant becausesuch small enrichments may arise from differences in the composition of local soil materialand reference soil used in EF calculations. Five contamination categories are recognizedon the basis of the enrichment factors: (Kartal et al., 2006; Yongming et al., 2006): EF <
2 states deficiency to minimal enrichment, EF = 2–5 moderate enrichment, EF = 5–20significant enrichment, EF = 20–40 very high enrichment, and EF > 40 extremely highenrichment.
Pollution index (PI) is also commonly used to assess the environment quality) Chenet al., 2005). The PI was defined as the ratio of element concentration in the study to thebackground content of the corresponding element. The PI of each element was calculatedand classified as either low (PI ≤ 1), middle (1 < PI ≤ 3), or high (PI > 3).
Statistical Analysis
Statistical analyses were performed by SPSS 16.0 for Windows. Most variables did notexhibit normal distribution and/or variances homogeneity, so all variables were comparedusing Anderson-Darling Normality Test (MINITAB Realise 13.0 for Windows).
Results and Discussion
Heavy Metal Concentration in Topsoils
Table 1 reports the main statistical indices for the concentration of 6 trace elements (Pb,Cu, Zn, Cd, Sb and As), as well as background values measured in topsoils from the studiedarea.
This was particularly evident for Pb, whose concentrations varied from 12.0 to 7830.0mg/kg, with a mean of 1901.2 mg/kg and a relatively high median (886.0 mg/kg). However,the Pb in topsoil was primarily between 50.0 and 1000.0 mg/kg, only 5% of the sampleshaving Pb concentration below 50.0 mg/kg, while 10% had very high concentration above6330.0 mg/kg. In general, the Pb concentrations in the mine topsoils significantly exceededthe worldwide average for soils (17.0 mg/kg; Koljonen, 1992) and the upper limit forunpolluted soils, namely 50.0 mg/kg (Shacklette et al., 1971; Fergusson, 1990).
Similar variability was found for Zn, with soil contents ranging from 15.0 to 10000.0mg/kg, with a mean of 476.4 mg/kg and a relatively low median (median = 174.0 mg/kg;Table 1). Most concentrations were between 50.0 and 200.0 mg/kg, but a fairly low

Tabl
e1
Aha
ngar
anm
inin
gdi
stri
ctda
ta(m
g/kg
)(f
rom
40so
ilsa
mpl
es):
elem
ents
anal
yzed
,min
imum
,max
imum
,mea
n,m
edia
n,lo
calb
ackg
roun
dva
lue,
anom
alou
sco
nten
t,ne
tano
mal
ous
valu
es,a
ndco
ntro
lsam
ples
Loc
alba
ckgr
ound
Ano
mal
ous
Net
anom
alou
sC
ontr
olC
ontr
olE
lem
ent
Min
imum
Max
imum
Mea
nM
edia
nva
lue
cont
ent
valu
essa
mpl
e1
sam
ple
2
Pb12
.078
30.0
1901
.288
6.0
102.
512
92.5
1190
.057
.064
.0Z
n15
.010
000.
047
6.4
174.
014
1.0
395.
025
4.0
100.
010
5.0
Cu
22.0
258.
088
.461
.050
.012
7.0
77.0
36.0
36.0
Cd
0.40
65.3
02.
70.
60.
41.
91.
50.
50.
5A
s11
.017
2.0
34.5
28.0
20.0
36.5
16.5
17.0
13.0
Sb4.
027
8.0
47.2
11.0
6.0
92.0
86.0
5.0
5.0
578

Contamination Assessment of Ahangaran Mine Soils 579
Table 2The Pearson correlation matrix of heavy metals
Pb Zn Cu Cd As Sb
Pb 1Zn 0.39∗ 1Cu 0.93∗∗ 0.16 1Cd 0.38∗ 0.99∗∗ 0.16 1As 0.62∗∗ 0.89∗∗ 0.47∗∗ 0.88∗∗ 1Sb 0.96∗∗ 0.24 0.95∗∗ 0.24 0.50∗∗ 1
∗ Correlation is significant at the 0.05 level.∗∗ Correlation is significant at the 0.01 level.
percentage (about 10%) were above 1000.0 mg/kg. The topsoils frequently had Zn lev-els above the global baseline in soils (70.0 mg/kg; Koljonen, 1992).
Copper concentrations in the topsoils varied between 22.0 and 258.0 mg/kg, with amedian value of 61.0 mg/kg (Table 1). The latter value exceeded the worldwide averagefor soils (25.0 mg/kg; Koljonen, 1992).
Cadmium concentrations ranged from 0.4 to 65.3 mg/kg with a median value of0.6 mg/kg Table 1). About 35% of the samples had Cd contents below 0.4 mg/kg, whileabout 5% exceeded 5.0 mg/kg.
Arsenic and Sb levels in the topsoils ranged from 11.0–172.0 mg/kg and 4.0–278.0mg/kg, respectively (Table 1). A high proportion of the samples (approximately 12.5%) hadAs contents greater than 50.0 mg/kg. and about 10% of the samples had Sb concentrationsgreater 161.0 mg/kg.
Figure 2 represents the distribution of heavy metals (Pb, Zn, Cu, Cd, As and Sb) in thestudy area. The concentration of each heavy metal decreases from mine and tailing in distaldirection toward the control sample sites. Correlation analysis revealed significant positivecorrelations among Pb, Zn, Cu, Cd, As and Sb in the topsoils (Table 2). Lead concentrationsshow strong positive correlations with Sb (r = 0.96) and Cu (r = 0.93). A high Sb contentis commonly found in practically all metal sulfide ores (especially those of Pb and Cu)(Shotyk et al., 2005).
The soil concentrations of Zn, As, and Cd exhibited a very strong positive correlation(Table 2), in agreement with the geochemical affinity of these elements (it is well knownthat the sulfide minerals can contain As and Cd) (Sarkar, 2002). Cadmium is a commonassociate of zinc and antimony of lead. It seems that there is a common source for thepollution in the studied area.
Background and Anomalous Values
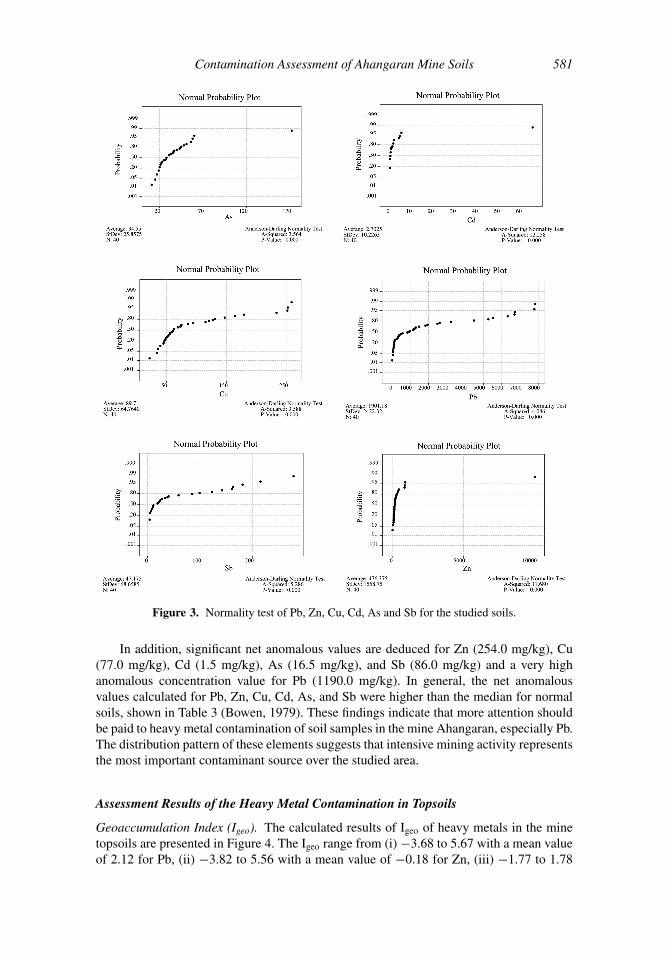
The normality curves were created for all the variables (Figure 3). The normality test forall elements shows that the distribution of points undergoes an inflection. Therefore, twopopulations can be observed. This feature of the graph is used to separate geogenic valuesfrom anthropogenically influenced samples. This latter subset is interpreted as representingthe result of mining activity. The median values obtained for the first and the secondpopulations are the local background and the anomalous concentrations, respectively. Theterm background has been defined as “the normal abundance of an element in barren earthmaterial” and anomaly is a departure from the geochemical patterns that are normal for a

580 B. Rafiei et al.
Figure 2. Heavy metal distribution map in the study area. Concentration of heavy metals decreasesfrom mine/tailing to distal direction (northern part to the southern).
given area (Hawkes and Webb, 1962). A net anomalous value can be deduced by subtractingthe local background from the anomalous content (Martinez et al., 2007).
Table 1 presents the local background, the anomalous content, and the net anomalousvalue deduced for the Ahangaran mine area soils. The median values for the local back-ground for Pb (102.5 mg/kg), Zn (141.0 mg/kg), Cu (50.0 mg/kg), Cd (0.4 mg/kg), As(20.0 mg/kg), and Sb (6.0 mg/kg) are higher than those obtained for the reference values(control samples).
Contamination Assessment of Ahangaran Mine Soils 581
Figure 3. Normality test of Pb, Zn, Cu, Cd, As and Sb for the studied soils.
In addition, significant net anomalous values are deduced for Zn (254.0 mg/kg), Cu(77.0 mg/kg), Cd (1.5 mg/kg), As (16.5 mg/kg), and Sb (86.0 mg/kg) and a very highanomalous concentration value for Pb (1190.0 mg/kg). In general, the net anomalousvalues calculated for Pb, Zn, Cu, Cd, As, and Sb were higher than the median for normalsoils, shown in Table 3 (Bowen, 1979). These findings indicate that more attention shouldbe paid to heavy metal contamination of soil samples in the mine Ahangaran, especially Pb.The distribution pattern of these elements suggests that intensive mining activity representsthe most important contaminant source over the studied area.
Assessment Results of the Heavy Metal Contamination in Topsoils
Geoaccumulation Index (Igeo). The calculated results of Igeo of heavy metals in the minetopsoils are presented in Figure 4. The Igeo range from (i) −3.68 to 5.67 with a mean valueof 2.12 for Pb, (ii) −3.82 to 5.56 with a mean value of −0.18 for Zn, (iii) −1.77 to 1.78

582 B. Rafiei et al.
Table 3The net anomalous values (mg/kg) of heavy metals in Ahangaran mine soils (0–30 cm)
compared with median values (mg/kg) in normal soils, proposed by Bowen (1979)
Net anomalous Normal soilsa Normal soils a
Element values Median Range
Pb 1190 35 2–300Zn 254 90 1–900Cu 77 30 2–250Cd 1.5 0.35 0.01–2As 16.5 6 0.1–40Sb 86 1 0.2–10
aBowen (1979).
with a mean value of 0.03 for Cu, (iv) −0.58 to 6.77 with a mean value of 0.50 for Cd,(v) −1.45 to 2.52 with a mean value of −0.01 for As, (vi) −1.17 to 4.95 with a meanvalue of 1.00 for Sb. The mean values of Igeo decrease in the order of Pb > Sb > Cd >
As > Cu > Zn. Percentage Igeo of Pb mainly falls into class > 3 (40%), indicating that
Figure 4. Box-plot of EF, Igeo and PI for heavy metals in Ahangaran mine soils. (Outlier (◦): valuesof more than 1.5–3 boxes length; Extreme values (∗): values of more than 3-box length upper or lowerof the boxes).

Contamination Assessment of Ahangaran Mine Soils 583
lead is strongly polluted to extremely polluted. The mean Igeo (2.12) obtained for Pb showsmoderately to strongly polluted. The mean and percentage Igeo obtained for Zn, Cu, andAs falling into class < 0 (Zn = −0.18, 70%; Cu = −0.03, 65% and As = −0.01, 55%),indicating practically unpolluted. The mean and percentage Igeo of Cd reveal unpolluted tomoderately polluted in mine soil. The mean Igeo obtained for Sb shows moderately polluted,while percentage Igeo of Sb mainly (45%) falls into class > 1 show that the most sampleswere moderately to strongly polluted.
Enrichment Factors (EF). Enrichment factors of heavy metals were calculated for eachsample relative to the background value of the element in the area. The EF of Pb, Cu, Zn, Cd,As, and Sb is in the range of 0.16–231.74, 0.10–75.92, 0.60–15.29, 0.83–174.75, 0.47–9.21,and 0.58–140.56, with an average of 24.27, 3.72, 2.14, 7.53, 1.89, and 11.03, respectively(Figure 4). Percentage EF of Pb falling to class > 5 (54.4%) states that most samples weresignificant enrichment to extremely high enrichment. Percentage EF of other element (Zn,Cu, and As) indicates that most samples were deficiency to minimal enrichment, whilemean value falls into class < 2 and reveals deficiency to minimal enrichment to significantenrichment. Percentage EF of Cd falling to class < 5 (85%) shows that most samples weredeficiency to minimal enrichment to moderate enrichment, while mean value falls into class> 5 and states significant enrichment to extremely high enrichment. Percentage EF of Sbfalling to class > 5 (about 34%) indicates one-third of samples were significant enrichmentto extremely high enrichment.
Pollution Index (PI). The mean pollution index (PI) of Pb, Sb, Cd, and Zn are higher than 3,and ranging from 0.12 to 76.39, 0.67 to 46.33, 1.0 to 163.25 and 0.11 to 70.92, respectively.The data show that these elements presented serious pollution in the study area. The orderof mean PI values are Pb > Sb > Cd > Zn > Cu > As, similar to EF.
The studied indices are based on a simple equation (the ratio of heavy metal concentra-tion to the background concentration). Geoaccumulation Index was defined as a logarithmicbase where the value of 1.5 was used in the formula. Pollution Index is based on a simpleratio. Therefore, EF, which is compared with a reference element (i.e. aluminum), is morereliable for this study. In addition, the value of enrichment is more practical than the pol-lution degree. The indices Igeo and PI represent total rather than bioavailable pollution ofheavy metals.
Conclusion
The concentrations of heavy metals Pb, Zn, Cu, Cd, As, and Sb and their contamination levelin soils collected from the Ahangaran mining area, Malayer, in the west of Iran have beenstudied in this work. The concentration of Pb, Zn, Cu, Cd, As, and Sb in mine soils rangesfrom 12.0 to 7830.0, 15.0 to 10000.0, 22.0 to 258.0, 0.4 to 65.3, 11 to 172.0 and 4.0 to 278.0mg/kg, with a mean 1901.0, 476.4, 88.4, 2.70, 34.6 and 47.2 mg/kg, respectively, and theconcentrations of heavy metals investigated in the work are compared with the backgroundvalues of elements in study area. The results indicate that soils in the Ahangaran mine haveelevated metal concentrations as a whole.
The calculated results of Igeo, EF, and PI of heavy metals reveal the order of Igeo andEF are Pb > Sb > Cd > As > Cu > Zn, and Pb > Sb > Cd > Zn > Cu > As; the order ofPI is similar to that of EF.
The high Igeo, EF and PI for Pb, Sb, and Cd in soil samples indicate that there isconsiderable pollution, which mainly originates from mining activities. The Igeo, EF and PI

584 B. Rafiei et al.
of Zn, Cu and As are low and the assessment results indicate the pollution is not significant.These findings indicate that more attention should be paid to heavy metal contamination ofsoils around the Ahangaran mine, especially Pb.
Acknowledgments
The authors are thankful to Bu Ali Sina University for financial support. We thank Dr.Michael Aide and two anonymous reviewers for their valuable comments. We also heartilythank Miss Fatemeh Ahmadi Ghomi for her assistance in text formatting and all personswho assisted in field work and made comments at various stages on the work.
References
Abrahim, G., Parker, R. J. 2008. Assessment of heavy metal enrichment factors and the degree ofcontamination in marine sediments from Tamak Estuary, Auckland, New Zealand. Environ.Monit. Assess. 136, 227–238.
Adriano, D. C. 1986. Trace Elements in the Terrestrial Environment. Springer-Verlag, New York.Audry, S., Schafer, J., Blanc, G., and Jouanneau, J. M. 2004. Fifty-year sedimentary record of heavy
metal pollution (Cd, Zn, Cu, Pb) in the lot River reservoirs (France). Environ. Pollut. 132,413–426.
Bhattacharya, A., Routh, J., Jacks G., Bhattacharya P., and Morth, M. 2006. Environmental assessmentof abandoned mine tailings in Adak, Vaster botten district (northern Sweden). Appl. Geochem.21, 1760–1780.
Bowen, H. J. M. 1979. Environmental Chemistry of the Elements. Academic Press, London.Butterfield, D.A., and Boyd-Kimball, D. 2004. Amyloid β-peptide (1–42) contributes to the oxidative
stress and neurodegeneration found in Alzheimer disease brain. Brain Pathol 14, 426–432Cambier, P. 1997. Evalution of the mobility of toxic elements in contaminated soils. Anal. Mag. 25,
35–38.Chen, C.J., and Wang C,J. 1990. Ecological correlation between arsenic level in well water and
age-adjusted mortality from malignant neoplasm. Cancer Res. 50, 5470–5474.Chen, C.J., Kuo, T.L., and Wu, M.M. 1988. Arsenic and cancers. Lancet 1, 414–415.Chen, T. B., Zheng, Y. M., Lei, M., Huang, Z. C., Wu, H. T., Chen, H., Fan, K. K., Yu, K., Wu, X.,
and Tian, Q. Z. 2005. Assessment of heavy metal pollution in surface soils of urban parks inBeijing, Chain. Chemosphere 60, 542–551.
Chuan, M. C., Shu, G. Y., and Liu, J. C. 1996. Solubility of heavy metals in a contaminated soil:effects of redox potential and pH. Water. Air. Soil. Pollut. 90, 543–556.
Dijkstra, E. A. 1998. Micromorphological study on the development of humus profiles in heavy metalpolluted and non-polluted forest soils under Scots pine. Geoderma 82, 341–358.
Elinder, C.G., and Friberg, L. 1986. Antimony. In: Friberg. L., Norodberg, G.F., Vouk, V.B. (eds.),Handbook on the Toxicology of Metals, pp 26–42, Elsevier, Amsterdam.
European Union. 2002. Heavy Metal in Wastes. European Commission on Environment, Denmark.Fergusson, J. E. 1990. The Heavy Elements: Chemistry, Environmental Impact and Health Effects,
Pergamon Press, Oxford.Gemici, U., and Tarcan, G. 2007. Assessment of the pollutants in farming soils and waters around
untreated abandoned Turkonu mercury mine (Turkey). Bull. Environ. Contamin. Toxicol. 79,20–24.
Gitashenasi Geographical and Cartographic Institute 2008. Road Atlas of Iran, Tehran, Iran.Gray, J. E., Coolbaugh, M. F., Plumlee, G. S., and Atkinson, W. W. 1994. Environmental geology of
the Summitville mine, Colorado. Econ. Geol. 89, 2006–2014.Gupta, U.C., and Gupta, S.C. 1998. Trace element toxicity relationships to crop production and
livestock and human health: implications for management. Commun Soil Sci Plant Anal 29,1491–1522.

Contamination Assessment of Ahangaran Mine Soils 585
Hao, Y., Guo, Z., Yang, Z., Fang, M., and Feng, J. 2007. Seasonal variations and sources of variouselements in the atmospheric aerosols in Qingdao, China. Atmos. Res. 85, 27–37.
Hawkes, H.E., and Webb, J.S. 1962. Geochemistry in Mineral Exploration. Harper, New York.INECAR (Institute of Environmental Conservation and Research). 2000. Position paper against
mining in Rapu-Rapu. INECAR, Ateneo de Naga University, Philippines.Kartal, S., Ayd, Z., and Tokalioglu, S. 2006. Fractionation of metals in street sediment samples by
using the BCR sequential extraction procedure and multivariate statistical elucidation of thedata. J. Hazard. Mater. 132, 80–89.
Kesler, S. E. 1994. Mineral Resources, Economics and the Environment. Macmillan College Pub.,New York.
King, T. V. 1995. Environmental considerations of active and abandoned mine land: lessons fromSummitville, Colorado. USGS Bull., 2220.
Koljonen, T. 1992. Geochemical Atlas of Finland, Part 2: Till. Geological Survey of Finland, Espoo,Finland.
Loska, K., Cebula, J., Pelczar, J., Wiechula, D., and Kwapulinski, J. 1997. Use of enrichment, andcontamination factors together with geoaccumulation indexes to evaluate the content of Cd, Cu,and Ni in the Rybnik water reservoir in Poland. Water. Air. Soil. Pollut. 93, 347–365.
Malayeri, B., Mir Ghafari, N., and Shariatmadari, H. 2005. Heavy metal contamination assessment inwater, soil & plants due to extraction processes in Ahangaran Pb & Zn Mine, Hamedan Province.President Deputy Strategic Planning and Control Organization, unpublished technical report.
Martinez, J., Llamas, J., de Miguel, E., Rey, J., and Hidalgo, M. C. 2007. Determination of thegeochemical background in a metal mining site: example of the mining district of Linares (southspain). J. Geochem. Explor. 94, 19–29.
McCluggage D. 1991. Heavy metal poisoning. NCS Magazine, The Bird Hospital, CO, USA (www.Cockatiels.org/articles/Diseases/metals.html).
Momenzadeh, M., Shafighi, S., Rastad, E., and Amstutz, G. C. 1979. The Ahangaran lead-silverdeposit, SE-Malayer, west central- Iran. Mineral. Deposita 14, 323–341.
Muller, G. 1969. Index of geoaccumulation in sediments of the Rhine River. Geojurnal 2, 108–118.
Ogwuegbu, M.O., and Ijioma, M.A. 2003. Effects of certain heavy metals on the population dueto mineral exploitation. In: International Conference on Scientific and Environmental Issues inthe Population, pp 8–10. Environmental and Sustainable Development in Nigeria, University ofAdo Ekiti, Ekiti State, Nigerian
Poon, H.F., Calabrese, V., Scapagnini, G., and Butterfield, D.A. 2004. Free radicals and brain aging.Clin Geriatr Med 20, 329–359.
Rosen, J.F. 1993. Health effects of lead in children at low exposure levels: expert consensus basedupon the federal and non-federal literature. In: Allen, R.J., Niagu, J.O., ed. Heavy Metals in theEnvironment, vol. II. CEP Consultants, Edinburgh, London.
Sarkar, B. 2002. Heavy Metals in the Environment. Marcel Dekker Inc., New York.Shacklette, H. T., Hamilton, J. C., Boerngen, J. G., and Bowles, J.M. 1971. Elemental Composition
of Superficial Materials in the Conterminous United States. US Geological Survy ProfessionalPapers, 574 D.
Shikazono, N., Zakir, H. M., and Sudo, Y. 2008. Zinc contamination in river water and sediments atTaisyu Zn-Pb mine area, Tsushima Island, Japan. J. Geochem. Explor. 98, 80–88.
Shotyk, W., Chen, B., and Krachler, M. 2005. Lithogenic, oceanic and anthropogenic sources ofatmospheric Sb to a maritime blanket bog, Myramar, Faroe Islands. J. Environ. Monit. 7,1148–54.
Stocklin, J. 1968. Structural history and tectonics of Iran. Amer. Assoc. Petrol. Geol. Bull. 52,1229–1258.
Tasdemir, Y., and Kural, C. 2005. Atmospheric dry deposition fluxes of trace elements measured inBursa, Turkey. Environ. Pollut. 138, 462–472.
Turner, A., and Simmonds, L. 2006. Elemental concentrations and metal bioaccessibility in UKhousehold dust. Sci. Total. Environ. Geol. 371, 74–81.

586 B. Rafiei et al.
Winship, K.A. 1987. Toxicity of antimony and its compounds. Adverse Drug Reactions and AcutePoisoning Reviews 2, 67–90.
Yasar, D., Aksu, A. E., and Uslu, O. 2001. Anthropogenic pollution in Izmit Bay: Heavy metalconcentrations in surface sediments. Turk. J. Eng. Environ. Sci. 25, 299–313.
Yongming, H., Peixuan, D., Junji, C., and Posmentier, E. S. 2006. Multivariate analysis of heavymetal contamination in urban dusts of Xian, central China. Sci. Total. Environ. 355, 176–186.
Young, R.A. 2005. Toxicity Profiles: Toxicity Summery for Cadmium, Risk Assessment InformationSystem, RAIS, University of Tennessee.