On the Interplay of Organizational Archi - Alexandria (UniSG)
Upload
khangminh22Category
view
0download
0
Nutritional influences on arsenic toxicity in Bangladeshi men and women:
interplay between one-carbon metabolism, arsenic, and epigenetics
Caitlin G. Howe
Submitted in partial fulfillment of the
requirements for the degree of
Doctor of Philosophy
under the Executive Committee
of the Graduate School of Arts and Sciences
COLUMBIA UNIVERSITY
2016

© 2016
Caitlin G. Howe
All Rights Reserved
ABSTRACT
Nutritional influences on arsenic toxicity in Bangladeshi men and women:
interplay between one-carbon metabolism, arsenic, and epigenetics
Caitlin G. Howe
Background: In Bangladesh, more than 57 million individuals are exposed to arsenic-
contaminated drinking water at concentrations that exceed the World Health Organization
guideline for safe drinking water, which is 10 µg/L. Arsenic is a human carcinogen, which has
also been associated with numerous non-cancer outcomes, including cardiovascular disease. For
many arsenic-related health outcomes, susceptibility differs by sex, with some outcomes
preferentially afflicting males and others females. Although reducing exposure to arsenic-
contaminated drinking water is the primary strategy for preventing arsenic toxicity, cancer risks
remain elevated decades after arsenic exposure has been reduced. Therefore, public health
approaches which complement arsenic remediation efforts are needed. One potential set of
strategies includes nutritional interventions. Deficiencies in one-carbon metabolism (OCM)
nutrients can cause hyperhomocysteinemia (HHcys), which has been associated with adverse
health outcomes, including cancers and cardiovascular disease. In Bangladesh, the prevalence of
HHcys is quite high and differs by sex (63% among men, 26% among women). Nutrients
involved in the OCM pathway may also protect against arsenic toxicity. Two potential
mechanisms include: 1) by enhancing arsenic metabolism and 2) by preventing/reversing
arsenic-induced epigenetic dysregulation.
Arsenic metabolism facilitates urinary arsenic elimination and depends on two sequential
S-adenosylmethionine (SAM)-dependent methylation steps, which yield the mono- and dimethyl
arsenical species (MMA and DMA, respectively) and S-adenosylhomocysteine (SAH), a potent
inhibitor of most methyltransferases. SAM is synthesized via OCM, a pathway with many
nutritional influences, including folate and cobalamin. There is substantial evidence from
experimental studies that the OCM pathway is important for facilitating arsenic metabolism and
elimination. However, the relationships between SAM, SAH, and arsenic methylation may be
particularly complex in populations exposed continuously to arsenic, because 1) the arsenic
metabolites compete for methylation, since each methylation step is catalyzed by the arsenic (+3)
methyltransferase and requires a methyl group from SAM, and 2) folate and cobalamin
nutritional status may vary between individuals.
Although the mechanisms mediating arsenic toxicity remain largely unclear and are
likely multifactorial, there is increasing evidence that arsenic induces epigenetic dysregulation,
including alterations in both DNA methylation and posttranslational histone modifications
(PTHMs), and these effects may differ by sex. Arsenic has also been shown to alter gene
expression in a sex-dependent manner. However, the sex-specific effects of arsenic on PTHMs
and gene expression have not been confirmed in a large epidemiological study. Since many of
the enzymes involved in epigenetic regulation, including DNA methyltransferases and lysine
histone methyltransferases, depend on SAM, epigenetic modifications are also influenced by
OCM. Previous studies have demonstrated that nutritional methyl donors involved in the OCM
pathway buffer against/modify toxicant-induced alterations in DNA methylation. This may also
be true for arsenic-induced alterations in PTHMs. However, the relationships between OCM
indices and PTHMs have not been characterized in arsenic-exposed populations.
Objectives: We had five main objectives: 1) to examine the relationships between SAM, SAH,
and arsenic methylation capacity, and potential effect modification by folate and cobalamin
nutritional status; 2) to characterize a specific cleavage product of histone H3, which we
identified in human peripheral blood mononuclear cells (PBMCs) in our early analyses of
PTHMs; 3) to evaluate the effects of arsenic exposure and arsenic removal on three candidate
PTHMs (di- and tri-methylation at lysine 36 of histone H3 (H3K36me2 and H3K36me3,
respectively) and di-methylation at lysine 79 of histone H3 (H3K79me2)), which were selected
because they are dysregulated in cancers and are altered by arsenic and/or nutritional methyl
donors in vitro; 4) to examine associations between arsenic exposure and gene-specific DNA
methylation and mRNA expression, particularly for genes involved in pathways implicated in
arsenic toxicity; and 5) to characterize the relationships between OCM indices and our three
candidate PTHMs, and the effect of folic acid (FA) supplementation on these same PTHMs. For
objectives 3-5, we also examined potential differences by sex.
Methods: To address these objectives, we used data from three epidemiological studies of
arsenic-exposed Bangladeshi adults: 1) the Folate and Oxidative Stress (FOX) study, a cross-
sectional study of healthy individuals; 2) the Folic Acid and Creatine Trial (FACT), a
randomized placebo-controlled trial (duration 24 weeks) in which healthy participants received
an arsenic-removal water filter at baseline and were also randomized to one of five nutrition
intervention arms: placebo, 400 µg FA/day (FA400), 800 µg FA/day (FA800), 3 g creatine/day
(Creatine), and Creatine + FA400; and 3) the Bangladesh Vitamin E and Selenium Trial (BEST),
a randomized placebo-controlled trial (duration 6 years) in which individuals with arsenicosis
were randomized to one of four nutrition intervention arms: placebo, vitamin E (alpha-
tocopheral, 100 mg/day), selenium (L-selenomethionine, 200 µg/day), or a combination of
vitamin E and selenium.
In Chapter 3, we examined associations between blood SAM and SAH and the proportion
(%) of each arsenic metabolite, measured in blood and urine, among FOX participants. We
further examined if these associations differed within strata of folate and/or cobalamin nutritional
status. In Chapter 4, we characterized a specific cleavage product of histone H3, which we
identified in human PBMCs from a subset of FACT participants (n = 32). We also determined
the prevalence of H3 cleavage in these samples and the impact of H3 cleavage on the
measurement of downstream PTHMs. In Chapter 5, we presented sex-specific associations
between pre-intervention measures of blood arsenic and creatinine-adjusted urinary arsenic
(uAsCr) and PTHMs, measured in PBMCs collected from FACT participants (n = 317). We also
evaluated whether PTHMs were stable for the 12 week duration after FACT participants
received arsenic-removal water filters (n = 60 from placebo group). In Chapter 6, we presented
associations between pre-intervention uAsCr and gene-specific DNA methylation (whole blood, n
= 400) and mRNA expression (PBMCs, n = 1799) for 47 candidate genes involved in arsenic
metabolism, OCM, epigenetic regulation, DNA repair, or tumor suppression/oncogenesis, using
baseline-collected samples from BEST participants. We also evaluated these associations
separately by sex. In Chapter 6, we examined sex-specific associations between baseline
circulating concentrations of OCM indices, including folate, cobalamin, choline, betaine, and
homocysteine, and PTHMs measured in PBMCs collected from FACT participants (n = 324).
We also evaluated whether FA400 (n = 106), compared with placebo (n = 60), for a duration of
12 weeks increased global levels of PTHMs.

Results: We observed that folate and cobalamin nutritional status significantly modified
associations between SAM and the % arsenic metabolites, as hypothesized (Chapter 3). Among
folate and cobalamin deficient individuals, SAM was positively associated with the %MMA, and
negatively associated with the %DMA, in blood. In Chapter 4, we determined that H3 cleavage
was evident in one third of the FACT PBMC samples examined. We further demonstrated that
H3 cleavage impacts the measurement of certain PTHMs. In Chapter 5, we reported that
biomarkers of arsenic exposure were associated with H3K36me2 in a sex-dependent manner. In
particular, uAsCr was positively associated with H3K36me2 among men, but not women.
Furthermore, the use of arsenic-removal water filters was associated with significant reductions
in H3K36me2 over a 12 week period, but this did not differ by sex. We also observed that uAsCr
was associated with the methylation and expression of several genes involved in OCM,
epigenetic regulation, DNA repair, and tumor suppression, and many of these associations
differed by sex (Chapter 6). The associations between several OCM indices and PTHMs were
also sex-dependent (Chapter 7). Specifically, choline was positively associated with H3K36me2
among men only, while cobalamin was positively associated with H3K79me2 among women
only. However, FA400 for 12 weeks did not alter global levels of the PTHMs examined.
Conclusions: Given that cancer risks remain elevated decades after arsenic exposure has ceased,
public health interventions which complement arsenic remediation efforts are needed. Nutritional
interventions may be one promising approach. Previous studies have observed that a higher
%MMA, and a lower %DMA, in urine is associated with an increased risk of developing adverse
health outcomes. Our finding that SAM was positively associated with %MMA, and negatively
associated with %DMA, among individuals deficient for folate and cobalamin contributes
additional evidence that nutritional status may explain some of the inter-individual differences in
arsenic methylation capacity and, consequently, in susceptibility to arsenic toxicity.
Our observation that arsenic exposure was positively associated with global levels of
H3K36me2 among men, but not women, and that arsenic was associated with gene-specific
DNA methylation and mRNA expression in a sex-dependent manner, adds to a growing
literature that arsenic induces epigenetic dysregulation differentially by sex. Furthermore, these
findings suggest that this may have functional consequences, such as alterations in mRNA
expression, including for genes involved in pathways implicated in arsenic toxicity. While it is
tempting to speculate that this may explain some of the sex differences in susceptibility to
arsenic toxicity, the clinical implications of our findings will require additional study.
We also provided the first evidence from an arsenic-exposed population that choline and
cobalamin are associated with PTHMs (H3K36me2 and H3K79me2, respectively) in a sex-
dependent manner, and that 12 weeks’ supplementation with FA, at a dose based on the
recommended dietary allowance for folate, does not significantly alter global levels of
H3K36me2, H3K36me3, or H3K79me2 in human PBMCs. Previous studies have shown that
nutrients in the OCM pathway protect against toxicant-induced alterations in DNA methylation.
Our findings suggest that some OCM nutrients, particularly choline and cobalamin, may also
influence PTHMs in human PBMCs. These findings lay the groundwork for future studies which
further examine whether these nutrients can protect against or modify arsenic-induced alterations
in PTHMs.
i
TABLE OF CONTENTS
List of tables and figures ............................................................................................................... vii
List of abbreviations ..................................................................................................................... xii
Acknowledgements ...................................................................................................................... xvi
Dedication .................................................................................................................................. xviii
Chapter One: Statement of hypotheses........................................................................................1
Chapter One References ..............................................................................................................8
Chapter Two: Background .........................................................................................................10
Overview of one-carbon metabolism and the transsulfuration pathway ..................................10
One-carbon metabolism .....................................................................................................10
Nucleic acid synthesis ............................................................................................10
Methylation reactions.............................................................................................11
Folate......................................................................................................................14
Cobalamin ..............................................................................................................16
Betaine ...................................................................................................................17
Choline ...................................................................................................................18
Homocysteine and hyperhomocysteinemia ...........................................................19
Transsulfuration pathway...................................................................................................20
Overview of arsenic metabolism and toxicity ..........................................................................20
Arsenic and associated health outcomes ............................................................................20
Uptake and metabolism of inorganic arsenic .....................................................................21
Proposed mechanisms of arsenic toxicity ..........................................................................24
General mechanisms of arsenic toxicity ...............................................................24
ii
Proposed mechanisms of arsenic carcinogenicity ..................................................25
Arsenic metabolism and toxicity .......................................................................................25
Influences of one-carbon metabolism on arsenic metabolism and toxicity .......................29
Experimental studies ..............................................................................................29
Observational studies .............................................................................................30
Randomized clinical trials......................................................................................31
Interplay between arsenic, one-carbon metabolism, and epigenetics .......................................32
Epigenetics .......................................................................................................................32
Histone proteins ....................................................................................................32
Histone structure ...................................................................................................33
PTHM nomenclature .............................................................................................35
DNA modifications ...............................................................................................35
Euchromatin and heterochromatin ........................................................................37
Relationship between PTHMs and DNA methylation ..........................................39
Regulation of histone lysine methylation .............................................................39
Dysregulation of epigenetic modifications in human disease.........................................40
DNA methylation and human diseases ................................................................40
PTHMs and human diseases ................................................................................40
Epigenetic therapeutics ........................................................................................41
Arsenic and epigenetics ..................................................................................................42
Arsenic and DNA methylation.............................................................................42
Interactions with nutritional status and sex ..........................................................42
Arsenic and PTHMs .............................................................................................44

iii
One-carbon metabolism and epigenetics ..........................................................................44
One-carbon metabolism and DNA methylation ...................................................44
One-carbon metabolism and PTHMs....................................................................49
Summary and rationale .............................................................................................................52
Chapter Two References ...........................................................................................................53
Chapter Two Appendix .............................................................................................................79
Chapter Two Appendix References ..........................................................................................82
Chapter Three: Folate and cobalamin modify associations between S-adenosylmethionine
and methylated arsenic metabolites in arsenic-exposed Bangladeshi adults .........................84
Abstract ....................................................................................................................................85
Introduction ..............................................................................................................................86
Study Participants and Methods...............................................................................................88
Results ......................................................................................................................................94
Discussion ..............................................................................................................................100
Acknowledgements ................................................................................................................107
Chapter Three References ......................................................................................................108
Chapter Three Supplemental Material ...................................................................................113
Chapter Four: Enzymatic cleavage of histone H3: a new consideration when measuring
histone modifications in human samples .................................................................................120
Abstract ..................................................................................................................................121
Enzymatic cleavage of histones .............................................................................................121
Implications for molecular epidemiology studies ..................................................................125
Acknowledgements ................................................................................................................126
iv
Chapter Four References........................................................................................................127
Chapter Four Appendix..........................................................................................................130
Chapter Five: Associations between blood and urine arsenic concentrations and global
levels of posttranslational histone modifications in Bangladeshi men and women .............132
Abstract ..................................................................................................................................133
Introduction ............................................................................................................................134
Study Participants and Methods.............................................................................................135
Results ....................................................................................................................................142
Discussion ..............................................................................................................................146
Conclusions ............................................................................................................................153
Acknowledgements ................................................................................................................153
Chapter Five References ........................................................................................................154
Chapter Five Supplemental Material .....................................................................................160
Chapter Six: Sex-specific associations between arsenic exposure and DNA methylation and
mRNA expression of candidate genes in Bangladeshi adults with arsenicosis ....................166
Abstract ..................................................................................................................................167
Introduction ............................................................................................................................168
Study Participants and Methods.............................................................................................169
Results ....................................................................................................................................171
Discussion ..............................................................................................................................183
Conclusions ............................................................................................................................189
Acknowledgements ................................................................................................................190
Chapter Six References ..........................................................................................................191
v
Chapter Six Supplemental Material .......................................................................................198
Chapter Seven: Folic acid supplementation and sex-specific associations between one-
carbon metabolism indices and histone modifications in arsenic-exposed Bangladeshi
adults ...........................................................................................................................................207
Abstract ..................................................................................................................................208
Introduction ............................................................................................................................209
Study Participants and Methods.............................................................................................210
Results ....................................................................................................................................215
Discussion ..............................................................................................................................221
Acknowledgements ................................................................................................................223
Chapter Seven References .....................................................................................................225
Chapter Seven Supplemental Material ...................................................................................230
Chapter Seven Supplemental Material References ................................................................245
Chapter Eight: Conclusions and Future Directions ...............................................................246
Summary of main findings.....................................................................................................246
Chapter Three (Specific Aims 1a and 1b) ......................................................................246
Main findings of Chapter Three (Specific Aims 1a and 1b) ..........................................247
Chapter Four ..................................................................................................................248
Main findings of Chapter Four ......................................................................................248
Chapter Five (Specific Aims 2a and 2b) ........................................................................249
Main findings of Chapter Five (Specific Aims 2a and 2b) ............................................250
Chapter Six (Specific Aim 2c) .......................................................................................251
Main findings of Chapter Six (Specific Aim 2c) ...........................................................252
vi
Chapter Seven (Specific Aims 3a and 3b) ....................................................................253
Main findings of Chapter Seven (Specific Aims 3a and 3b) ........................................253
Future directions ....................................................................................................................254
New and complementary approaches ..........................................................................255
Combining multiplex laboratory techniques with cluster analysis .......................255
Gene-specific approaches .....................................................................................255
Mathematical models ............................................................................................256
Discerning the role of exposure timing ........................................................................256
Mechanistic studies of sex differences ........................................................................257
Conclusions ............................................................................................................................259
Chapter Eight References ......................................................................................................261

vii
LIST OF TABLES AND FIGURES
Chapter One
Figures
Figure 1. One-carbon metabolism and the transsulfuration pathway .........................................2
Chapter Two
Tables
Table 1. Summary of studies examining the effects of arsenic on global levels of PTHMs ....46
Table A1. Associations between %MMA in urine and adverse health outcomes ....................79
Table A2. Associations between %DMA in urine and adverse health outcomes .....................81
Figures
Figure 1. S-adenosylmethionine and S-adenosylhomocysteine ................................................11
Figure 2. Simplified overview of one-carbon metabolism .......................................................13
Figure 3. Structure of folic acid ................................................................................................14
Figure 4. Arsenic metabolism (Challenger Pathway) ...............................................................22
Figure 5. Relative toxicities of predominant arsenic species ....................................................25
Figure 6. Associations between %MMA in urine and adverse health outcomes ......................27
Figure 7. Associations between %DMA in urine and adverse health outcomes ......................28
Figure 8. Nucleosome structure ................................................................................................33
Figure 9. Human histone H3 structure and lysine methylation marks ......................................34
Figure 10. 5-methylcytosine and 5-hydroxymethylcytosine ....................................................36
Figure 11. Heterochromatin and euchromatin ..........................................................................38
Figure 12. SAM-dependent methylation of histone H3 ............................................................50
viii
Chapter Three
Tables
Table 1. General characteristics of arsenic-exposed, Bangladeshi adults (ages 30-63 y)
enrolled in the FOX study .........................................................................................................95
Table 2. Correlations between nutrition variables and arsenic metabolites in arsenic-exposed,
Bangladeshi adults (ages 30-63 y) enrolled in the FOX study .................................................97
Table 3. Associations between SAM, SAH, SAM:SAH, and arsenic metabolites in arsenic-
exposed Bangladeshi adults (ages 30-63 y) enrolled in the FOX study .................................101
Table 4. Associations between SAM and methylated blood arsenic metabolites in arsenic-
exposed Bangladeshi adults (ages 30-63 y) enrolled in the FOX study, stratified by folate or
cobalamin nutritional status ....................................................................................................102
Table 5. Associations between SAM and methylated blood arsenic metabolites in arsenic-
exposed Bangladeshi adults (ages 30-63 y) enrolled in the FOX study, stratified by joint folate
and cobalamin nutritional status .............................................................................................103
Table S1. Bivariate analyses for SAM and SAH in arsenic-exposed, Bangladeshi adults
(ages 30-63 y) enrolled in the FOX study ...............................................................................113
Table S2. Correlations between continuous nutrition variables in arsenic-exposed
Bangladeshi adults (ages 30-63 y) enrolled in the FOX study (n = 353) ...............................114
Table S3. Associations between SAM, SAH, SAM:SAH, and arsenic metabolites in arsenic-
exposed Bangladeshi adults (ages 30-63 y) enrolled in the FOX study, stratified by folate
nutritional status ......................................................................................................................115
Table S4. Associations between SAM, SAH, SAM:SAH, and arsenic metabolites in arsenic-
exposed Bangladeshi adults (ages 30-63 y) enrolled in the FOX study, stratified by cobalamin
nutritional status ......................................................................................................................117
Figures
Figure 1. SAM-dependent arsenic metabolism .........................................................................87
Figure 2. Scatterplots and LOESS curves showing relations between bDMA:bMMA and
bInAs or bMMA in arsenic-exposed, Bangladeshi adults (ages 30-63 y) enrolled in
the FOX study (n = 353) ...........................................................................................................98
ix
Figure S1. One-carbon metabolism ........................................................................................119
Chapter Four
Tables
Table A1. Descriptive characteristics for continuous variables in FACT participants with vs.
without extensive H3 cleavage ...............................................................................................130
Table A2. Descriptive characteristics for categorical variables in FACT participants with vs.
without H3 cleavage ...............................................................................................................131
Figures
Figure 1. Enzymatic cleavage of H3 interferes with the measurement of certain PTHMs ....122
Figure 2. Extensive H3 cleavage is evident in approximately one-third of PBMC histone
samples, but it does not affect measures of H3K36me2 and H3K79me2 ..............................125
Chapter Five
Tables
Table 1. Baseline characteristics of FACT participants with at least one PTHM measured and
complete information for other variables included in regression models ...............................143
Table 2. Estimated regression coefficients and 95% confidence intervals for associations
between baseline measures of arsenic exposure and PTHMs in FACT participants ..............145
Table 3. Within-person changes in PTHMs from baseline to week 12 for FACT
participants in the placebo group ............................................................................................147
Table S1. Baseline characteristics of FACT participants in the placebo group with PTHM
measures ..................................................................................................................................160
Table S2. Baseline characteristics of FACT participants with vs. without PTHM measures
and with complete information for variables included in regression models .........................161
Table S3. Spearman correlation coefficients for baseline measures of arsenic exposure and
PTHMs in FACT participants .................................................................................................162
Table S4. Estimated regression coefficients and 95% confidence intervals for associations
between baseline measures of arsenic exposure and PTHMs, after adjusting for additional
covariates, in FACT participants ............................................................................................163
x
Figures
Figure S1. Folic Acid and Creatine Trial (FACT) Study Design and Sampling for Current
Study .......................................................................................................................................164
Chapter Six
Tables
Table 1. Candidate genes ........................................................................................................172
Tables 2. Genes that were differentially methylated by arsenic exposure after adjusting for
multiple comparisons, either in the whole sample, in men, or in women...............................177
Table 3. Genes that were differentially expressed by arsenic exposure after adjusting for
multiple comparisons, either in the whole sample, in men, or in women...............................178
Table 4. Comparison of DNA methylation findings with previous studies ............................180
Tables 5. Comparison of mRNA expression findings with previous studies .........................181
Table S1. Genes that were differentially methylated by arsenic exposure before adjusting for
multiple comparisons (P < 0.05) either in the whole sample, in men, or in women ..............198
Table S2. Genes that were differentially expressed by arsenic exposure before adjusting for
multiple comparisons (P < 0.05) either in the whole sample, in men, or in women ..............205
Figures
Figure 1. Venn diagrams representing genes that are differentially methylated and expressed
in men compared with women ................................................................................................179
Figure 2. One-carbon metabolism genes that were differentially expressed after adjusting for
multiple comparisons ..............................................................................................................186
Chapter Seven
Tables
Table 1. Within-person change in PTHM from baseline to week 12 in FACT participants by
treatment arm ..........................................................................................................................220
Table S1. General baseline characteristics by sex for FACT participants with PTHM
measures ..................................................................................................................................230
xi
Table S2. Baseline characteristics of FACT participants with vs. without PTHM
measures ...................................................................................................................................232
Table S3. Baseline characteristics of FACT participants with vs. without RBC folate
measures ..................................................................................................................................233
Table S4. Associations (β (95%CI)) between OCM indices and PTHMs by sex in FACT
participants, comparing models additionally adjusting for BMI ............................................235
Table S5. Associations (β (95%CI)) between OCM indices and PTHMs by sex in FACT
participants, comparing nutrients in models alone vs. included simultaneously ....................237
Table S6. Baseline characteristics of FACT participants with PTHM measures at baseline in
400 µg FA and placebo groups ...............................................................................................239
Figures
Figure 1. Sex-specific associations between OCM indices and PTHMs in FACT
participants ..............................................................................................................................218
Figure S1. FACT design and sampling for current study .......................................................241
Figure S2. Sex-specific associations between OCM indices and PTHMs in FACT participants
with RBC folate measures ......................................................................................................243
Chapter Eight
Figures
Figure 1. Four core genotype mouse model............................................................................258
xii
LIST OF ABBREVIATIONS
400FA 400 µg folic acid per day
5,10-mTHF 5,10-methylene-tetrahydrofolate
5-hmC 5-hydroxymethylcytosine
5-mC 5-methylcytosine
5-mTHF 5-methyl-tetrahydrofolate
5’-UTR 5’ untranslated region
800FA 800 µg folic acid per day
ac Acetylated
AHCY S-adenosylhomocysteine hydrolase
AI Adequate intake
APL Acute promyelocytic leukemia
Arg. Argentina
As Arsenic
As2O3 Arsenic trioxide
AsIII Arsenite
AsV Arsenate
AS3MT Arsenic (+3 oxidation state) methytransferase
bAs Blood arsenic
bDMA Blood dimethyl arsenical species
BEST Bangladesh Vitamin E and Selenium Trial
BHMT Betaine homocysteine methyltransferase
bInAs Blood inorganic arsenical species
bMMA Blood monomethyl arsenical species
bSe Blood selenium
C2H7AsI Dimethylarsine iodide
CAE Cumulative arsenic exposure
CBS Cystathionine-β-synthase
CGI Cytosine-guanine dinucleotide island
CH3AsI2 Diiodomethylarsine
CHDH Choline dehydrogenase
CIN Cervical intraepithelial neoplasia
CoA Coenzyme A
CpG Cytosine-guanine dinucleotide
CTD Comparative Toxicogenomics Database
CVD Cardiovascular disease
d Days
Develop. Delay Developmental delay

xiii
DHF Dihydrofolate
DHFR Dihydrofolate reductase
DMA Dimethyl arsenical species
DMAIII Trivalent dimethyl arsenic
DMAV Pentavalent dimethyl arsenic
DMA:MMA Ratio of dimethyl to monomethyl arsenical species
%DMA Proportion of dimethyl arsenic species
DMG Dimethyl glycine
DNMT DNA methyltransferase
E2 Estradiol
ESC Embryonic stem cell
F Female
FA Folic acid
FACT Folic Acid and Creatine Trial
FOX Folate and Oxidative Stress Study
GAA Guanidinoacetate
GAMT Guanidinoacetate N-methyltransferase
GNMT Glycine N-methyltransferase
GSH Glutathione
GSS Glutathione synthetase
GSSG Glutathione disulfide
H3K4 Histone H3 lysine 4
H3K9me2 Histone H3 lysine 9 di-methylation
H3K36 Histone H3 lysine 36
H3K36me1 Histone H3 lysine 36 mono-methylation
H3K36me2 Histone H3 lysine 36 di-methylation
H3K36me3 Histone H3 lysine 36 tri-methylation
H3K79me1 Histone H3 lysine 79 mono-methylation
H3K79me2 Histone H3 lysine 79 di-methylation
Hcys Homocysteine
HEALS Health Effects of Arsenic Longitudinal Study
HHcys Hyperhomocysteinemia
HR Hazards ratio
InAs Inorganic arsenical species
%InAs Proportion of inorganic arsenical species
IF Intrinsic factor
IQR Inter-quartile range
KDM Lysine histone demethylase
KHMT Lysine histone methyltransferase
Log Natural log transformation
xiv
M Male
MAT1A Methionine adenosyltransferase 1 (hepatic)
MAT2A Methionine adenosyltransferase 2 subunit alpha (non-hepatic)
MAT2B Methionine adenosyltransferase 2 subunit beta (non-hepatic)
MDD Methyl deficient diet
MMA Monomethyl arsenical species
MMAIII Trivalent monomethyl arsenic
MMAV Pentavalent monomethyl arsenic
MMA:InAs Ratio of monomethyl to inorganic arsenical species
%MMA Proportion of monomethyl arsenical species
me1 Mono-methylated
me2 Di-methylated
me3 Tri-methylated
Met Methionine
MTHFR Methylenetetrahydrofolate reductase
MTR Methionine synthase
MTRR Methionine synthase reductase
N_Shore North shore
NaAsO2 Sodium arsenite
Na3AsO4 Sodium arsenate
NHEJ Non-homologous end joining
NTD Neural tube defect
OCM One-carbon metabolism
OR Odds ratio
PABA 4-aminobenzoic acid
PBL Peripheral blood leukocyte
PBMC Peripheral blood mononuclear cell
PC Phosphatidylcholine
PE Phosphatidylethanolamine
PEMT Phosphatidylethanolamine N-methyltransferase
ph Phosphate
PTHM Posttranslational histone modification
PVD Peripheral vascular disease
RBC Red blood cell
RDA Recommended dietary allowance
SAH S-adenosylhomocysteine
SAM S-adenosylmethionine
SAM:SAH Ratio of S-adenosylmethionine to S-adenosylhomocysteine
SNP Single nucleotide polymorphism
TET Ten-eleven translocation methylcytosine dioxygenase
xv
THF Tetrahydrofolate
TRX Thioredoxin
TSS200 Within 200 basepairs of a transcription start site
uAs Urinary arsenic
uAsCr Urinary arsenic adjusted for urinary creatinine
uCr Urinary creatinine
uDMA Urinary dimethyl arsenical species
uInAs Urinary inorganic arsenical species
uMMA Urinary monomethyl arsenical species
UL Upper limit
U.S. United States
w Weeks
wAs Water arsenic
WBC White blood cell
y Years
xvi
ACKNOWLEDGEMENTS
This dissertation was the result of a collaborative effort. I therefore wish to thank everyone who
contributed to the studies presented in this dissertation and the many individuals who have
supported my academic training at Columbia.
First and foremost, I want to thank my adviser Dr. Mary Gamble. I feel fortunate to have worked
with someone so dedicated to the training, professional development, and success of her
students. I am a better scientist and writer for having worked with Dr. Gamble, and I am so
grateful for the countless opportunities she has given me over the past five years. I would also
like to thank my other thesis committee members, Drs. Frances Champagne, Joseph Graziano,
Regina Santella, and Robert Wright. I sincerely enjoyed meeting with them each semester, and
have appreciated their guidance and suggestions.
I want to especially thank Drs. Megan Hall and Xinhua Liu. Both are outstanding teachers and
role models, and my skills and knowledge in epidemiology and biostatistics are much stronger
for having trained with them.
I looked forward to going to work every day because of the fun and supportive atmosphere in the
Gamble Lab. Thanks in particular to Drs. Megan Niedzwiecki, Brandilyn Peters, Jessica
Napolitano, and Kristin Harper, and also to Vesna Ilievski, Anne Bozack, and Shelley Qu.
I appreciate the Graziano lab for all of their technical support, and especially want to thank
Vesna Slavkovich and Angela Lomax-Luu. Members of the Perzanowski, Freyer, Santella, and
Guilarte labs have also assisted me in the lab at various points throughout my time at Columbia,
particularly Adnan Divjan, JD Knotts, Gloria Maya, Meredith Loth, and Irina Gurvich.
The support of my fellow doctoral students has been tremendous. In particular, I feel very lucky
to have spent the past five years with the other members of my cohort, Ashlinn Quinn and
Tiffany Sanchez. Their friendship and encouragement have been integral to my successful and
happy experience at Columbia.
The data management expertise of Diane Levy and Nancy Loiacono made many aspects of my
day-to-day experience at Columbia more efficient. Their help was greatly appreciated, and I
would not have been as productive without it.
Many other members of the Environmental Health Sciences community have helped me “behind
the scenes”. I would especially like to acknowledge Dr. Norman Kleiman for additional training
in laboratory techniques; Dr. Greg Freyer for his support and guidance over the past five years;
Dr. Julie Herbstman for mentoring me during my second laboratory rotation; Lee Marsi, Bernice
Ramos-Perez, Raquel Sotelo, and Melissa Rivera for their administrative support; and Dr. Alysa

xvii
Turkowitz, Nina Kulacki, and our interim and former chairs, Drs. Joseph Graziano and Tomas
Guilarte, for their academic support.
I would also like to acknowledge two professors in the Department of Epidemiology: Dr. Mary
Beth Terry, for her mentorship on the Cancer Epidemiology Training Grant, and Dr. Sharon
Schwartz, whose “Concepts in Causal Inference” course was a fundamental component of my
training in epidemiology and also one of my favorite experiences at Columbia.
The histone methods described in this dissertation were adapted from assays developed in Dr.
Max Costa’s lab at New York University. I am particularly grateful to Dr. Yana Chervona, who
trained me in these methods.
I am also grateful to our collaborators Dr. Habibul Ahsan (University of Chicago) and Dr. Maria
Argos (University of Illinois, Chicago) for allowing us to mine gene expression and DNA
methylation data from the BEST study and for collaborating with us on the candidate gene
project described in Chapter 6.
The work presented in this dissertation would not have been possible without the dedicated field
staff in Bangladesh. Nor would it have been possible without the participation of the men and
women in the FOX, FACT, and BEST studies. I hope that their contributions, and the research
generated from Columbia’s Superfund Program, continue to improve our understanding of
arsenic toxicity, such that public health interventions can be designed to reduce disease burden in
Bangladesh and in other arsenic-exposed populations.
Over the past five years, I have been fortunate to receive full funding to support my academic
training. I am grateful to Dr. Al Neugut for providing me with 3 years of support on the Cancer
Epidemiology Training Grant, to the department of Environmental Health Sciences for additional
funding, and to the NIEHS for my F31 fellowship support.
Finally, on a more personal note, I am extremely lucky to have such a loving and supportive
family. I am particularly grateful to my parents and brother for their love and emotional support.
This dissertation is dedicated to them.

xviii
DEDICATION
For my family
1
CHAPTER ONE
Statement of hypotheses
In Bangladesh, approximately 57 million individuals are exposed to arsenic at
concentrations that exceed the World Health Organization guideline for safe drinking water,
which is 10 μg/L [1]. This is a critical public health issue, because exposure to arsenic has been
associated with numerous diseases, including both cancer and non-cancer outcomes, with
susceptibility often differing by sex (reviewed in [2]). Although eliminating exposure to arsenic-
contaminated drinking water is the primary strategy for reducing arsenic toxicity, cancer risks
remain elevated decades after arsenic exposure has ceased [3]. Therefore, complementary
approaches will be needed to reduce disease burden in populations that have already been
exposed to arsenic-contaminated drinking water.
Nutritional interventions may offer one set of complementary approaches. One-carbon
metabolism (OCM), a biochemical pathway with many nutritional influences, including folate,
cobalamin, choline, and betaine, may affect arsenic toxicity through multiple mechanisms. Two
potential mechanisms include: 1) by enhancing arsenic metabolism and 2) by preventing or
reversing arsenic-induced epigenetic dysregulation, including alterations in posttranslational
histone modifications (PTHMs) (Figure 1). Since arsenic metabolism facilitates urinary arsenic
excretion [4], and since epigenetic dysregulation is one proposed mechanism by which arsenic
causes cancer [5], a better understanding of these mechanisms may inform the development of
future interventions which reduce arsenic toxicity. This dissertation is an epidemiological
investigation of the interplay between OCM, arsenic, and epigenetics.
2
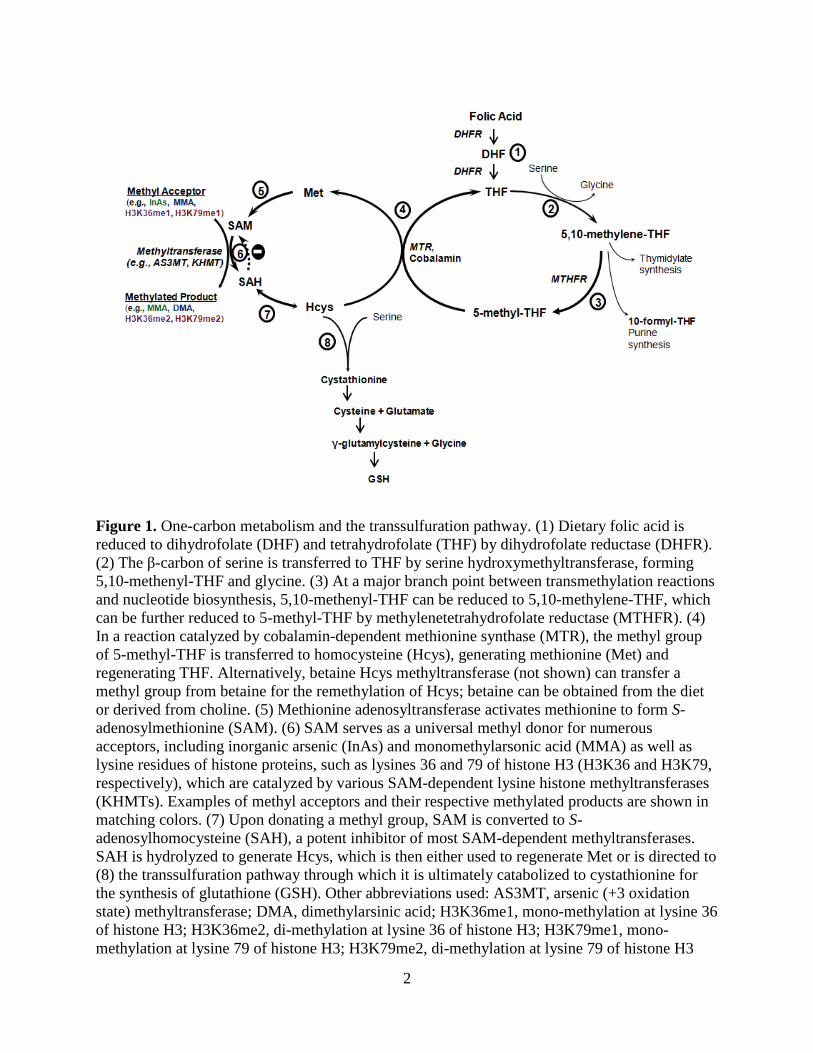
Figure 1. One-carbon metabolism and the transsulfuration pathway. (1) Dietary folic acid is
reduced to dihydrofolate (DHF) and tetrahydrofolate (THF) by dihydrofolate reductase (DHFR).
(2) The β-carbon of serine is transferred to THF by serine hydroxymethyltransferase, forming
5,10-methenyl-THF and glycine. (3) At a major branch point between transmethylation reactions
and nucleotide biosynthesis, 5,10-methenyl-THF can be reduced to 5,10-methylene-THF, which
can be further reduced to 5-methyl-THF by methylenetetrahydrofolate reductase (MTHFR). (4)
In a reaction catalyzed by cobalamin-dependent methionine synthase (MTR), the methyl group
of 5-methyl-THF is transferred to homocysteine (Hcys), generating methionine (Met) and
regenerating THF. Alternatively, betaine Hcys methyltransferase (not shown) can transfer a
methyl group from betaine for the remethylation of Hcys; betaine can be obtained from the diet
or derived from choline. (5) Methionine adenosyltransferase activates methionine to form S-
adenosylmethionine (SAM). (6) SAM serves as a universal methyl donor for numerous
acceptors, including inorganic arsenic (InAs) and monomethylarsonic acid (MMA) as well as
lysine residues of histone proteins, such as lysines 36 and 79 of histone H3 (H3K36 and H3K79,
respectively), which are catalyzed by various SAM-dependent lysine histone methyltransferases
(KHMTs). Examples of methyl acceptors and their respective methylated products are shown in
matching colors. (7) Upon donating a methyl group, SAM is converted to S-
adenosylhomocysteine (SAH), a potent inhibitor of most SAM-dependent methyltransferases.
SAH is hydrolyzed to generate Hcys, which is then either used to regenerate Met or is directed to
(8) the transsulfuration pathway through which it is ultimately catabolized to cystathionine for
the synthesis of glutathione (GSH). Other abbreviations used: AS3MT, arsenic (+3 oxidation
state) methyltransferase; DMA, dimethylarsinic acid; H3K36me1, mono-methylation at lysine 36
of histone H3; H3K36me2, di-methylation at lysine 36 of histone H3; H3K79me1, mono-
methylation at lysine 79 of histone H3; H3K79me2, di-methylation at lysine 79 of histone H3
3
Hypothesis 1
We hypothesize that blood S-adenosylmethionine (SAM) will be negatively associated
with the proportion (%) of inorganic arsenical species (InAs) in blood and urine, while blood S-
adenosylhomocysteine (SAH) will be associated with an arsenic metabolite profile indicative of
reduced arsenic methylation capacity (i.e., ↑%InAs, ↑% monomethyl arsenical species (MMA),
and ↓% dimethyl arsenical species (DMA) in blood and urine). We further hypothesize that
folate and cobalamin nutritional status will modify the associations between SAM and the
methylated arsenic metabolites (%MMA and %DMA).
Specific Aim 1a. SAM, SAH, and arsenic methylation
We will examine associations between whole blood SAM and SAH concentrations and
arsenic metabolites, measured as the % of each metabolite (InAs, MMA, and DMA) in total
blood or urine arsenic (bAs and uAs, respectively), using samples from the Folate and Oxidative
Stress (FOX) Study, a cross-sectional study of Bangladeshi adults (n = 378) exposed to a wide
range of water arsenic concentrations (0 to 700 µg/L).
Specific Aim 1b. Folate and cobalamin nutritional status, SAM, and arsenic methylation
Using samples from the FOX study, we will evaluate whether folate and/or cobalamin
nutritional status modify associations between SAM and the methylated arsenic metabolites
(%MMA and %DMA), measured in blood and urine. Folate and cobalamin nutritional status will
be determined using plasma folate and cobalamin cutoffs (9 nmol/L and 151 pmol/L,
respectively [6]).
The findings of Aims 1a and 1b are reported in Chapter 3.
4
Characterizing enzymatic cleavage of histone H3
In our early analyses of PTHMs, we identified a specific cleavage product of histone H3
in human peripheral blood mononuclear cells (PBMCs), which were collected from participants
enrolled in the Folic Acid and Creatine Trial (FACT). We describe this cleavage product, the
prevalence of H3 cleavage in human PBMC samples, and the impact of H3 cleavage on the
measurement of downstream PTHMs.
These findings are reported in Chapter 4.
Hypothesis 2
We hypothesize that arsenic induces sex-specific alterations in global levels of three
candidate PTHMs: histone H3 lysine 36 di- and tri-methylation (H3K36me2 and H3K36me3,
respectively) and histone H3 lysine 79 di-methylation (H3K79me2), which were selected
because they are influenced by arsenic and/or nutritional methyl donors in experimental models
[7-10] and are dysregulated in cancers [11-16]. H3K36me2 was also selected based on a
previous finding from our group that among men only, arsenic is positively associated with DNA
methylation in the promoter region of lysine demethylase 2B, a histone demethylase that
specifically targets H3K36me2. Furthermore, H3K79me2 was also selected, because it regulates
the expression of Tet1, which converts 5-methylcytosine (5-mC) to 5-hydroxymethylcytosine (5-
hmC) [17, 18]. We have previously observed that both 5-mC and 5-hmC are altered by arsenic in
a sex-dependent manner [19]. We further hypothesize that arsenic exposure is associated with
gene-specific DNA methylation and mRNA expression in a sex-dependent manner.
5
Specific Aim 2a. Sex-specific effects of arsenic on PTHMs
We will examine associations between pre-intervention measures of bAs and creatinine-
adjusted uAs (uAsCr) and H3K36me2, H3K36me3, and H3K79me2, measured in histones
isolated from PBMCs collected from a subset of FACT participants at baseline (n = 317). FACT
is a randomized placebo-controlled trial of folic acid (FA) and/or creatine supplementation in
arsenic-exposed Bangladeshi adults. We will further determine if the associations between
arsenic exposure and PTHMs differ by sex.
Specific Aim 2b. Stability of PTHMs after reductions in arsenic exposure
We will evaluate whether H3K36me2, H3K36me3, and H3K79me2 are altered after the
provision of arsenic-removal water filters. This will be examined using PBMCs collected at
baseline and week 12 from a subset of FACT participants randomized to the placebo group (n =
60), who were provided with arsenic-removal water filters but did not receive a nutritional
intervention. We will further examine whether alterations in PTHMs due to arsenic-removal
water filter use differ by sex.
The findings of Aims 2a and 2b are reported in Chapter 5.
Specific Aim 2c. Sex-specific associations between arsenic exposure and gene-specific DNA
methylation and mRNA expression levels
Using pre-intervention samples from the Bangladesh Vitamin E and Selenium Trial
(BEST), a randomized trial of vitamin E and/or selenium supplementation in Bangladeshi adults
with arsenicosis, we will examine whether uAsCr is associated with gene-specific DNA
methylation (whole blood, n = 400) and mRNA expression (PBMCs, n = 1799). We will use a

6
candidate gene approach, selecting genes involved in OCM, arsenic metabolism, epigenetic
regulation, DNA repair, and tumor suppression/oncogenesis, as these pathways are involved in
arsenic metabolism or have been implicated in arsenic toxicity. The Comparative
Toxicogenomics Database will be used to identify potential targets of arsenic. We will also select
a subset of genes involved in these pathways which have not previously been examined in
relation to arsenic exposure. We will further examine potential differences by sex.
The findings of Aim 2c are reported in Chapter 6.
Hypothesis 3
We hypothesize that nutritional methyl donors and related cofactors involved in the OCM
pathway, including folate, cobalamin, choline, and betaine, will be positively associated with
PTHMs (H3K36me2, H3K36me3, and H3K79me2), and that homocysteine, an indicator of
reduced methylation capacity, will be inversely associated with these PTHMs. Furthermore, we
hypothesize that FA supplementation will increase global levels of these PTHMs. Additionally,
we hypothesize that these relationships may differ by sex.
Specific Aim 3a. Associations between OCM indices and PTHMs
Using pre-intervention samples from the FACT study (n = 324), we will examine
associations between circulating concentrations of OCM indices and global levels of H3K36me2,
H3K36me3, and H3K79me2, measured in PBMCs. Furthermore, we will assess whether any of
these associations differ by sex.

7
Specific Aim 3b. Influence of FA supplementation on PTHMs
Using samples from the FACT study, we will investigate whether FA supplementation
(400 μg/day for 12 weeks) (n = 107), compared with placebo (n = 60), increases global levels of
H3K36me2, H3K36me3, and H3K79me2, measured in PBMCs. We will also examine potential
differences by sex.
The findings of Aims 3a and 3b are reported in Chapter 7.
8
CHAPTER ONE REFERENCES
1. Kinniburgh DG, Smedley PL, Davies J, Milne CJ, Gaus I, Trafford JM, et al (2003). The
scale and causes of the groundwater arsenic problem in Bangladesh in Arsenic in Ground
Water (p.211-257). Welch AH, Stollenwerk KG (Eds). Boston, MA: Kluwer Academic
Publishers.
2. National Research Council. 2013. Critical aspects of EPA's IRIS assessment of inorganic
arsenic. National Research Council Interim Report.
3. Steinmaus CM, Ferreccio C, Romo JA, Yuan Y, Cortes S, Marshall G, et al. Drinking
water arsenic in northern Chile: high cancer risks 40 years after exposure cessation. Cancer
Epidemiol Biomarkers Prev. 2013;22: 623-630.
4. Drobna Z, Naranmandura H, Kubachka KM, Edwards BC, Herbin-Davis K, Styblo M, et
al. Disruption of the arsenic (+ 3 oxidation state) methyltransferase gene in the mouse
alters the phenotype for methylation of arsenic and affects distribution and retention of
orally administered arsenate. Chem Res Toxicol. 2009;22:1713-1720.
5. Ren X, McHale CM, Skibola CF, Smith AH, Smith MT, Zhang L. An emerging role for
epigenetic dysregulation in arsenic toxicity and carcinogenesis. Environ Health Perspect.
2011;119:11.
6. Christenson RH, Dent GA, Tuszynski A. Two radioassays for serum vitamin B12 and
folate determination compared in a reference interval study. Clin Chem. 1985;31:1358–60
7. Zhou X, Sun H, Ellen TP, Chen H, Costa M. Arsenite alters global histone H3
methylation. Carcinogenesis. 2008;29:1831-1836.
8. Bistulfi G, Vandette E, Matsui S, Smiraglia DJ. Mild folate deficiency induces genetic and
epigenetic instability and phenotype changes in prostate cancer cells. BMC Biol
2010;8(6):1741-7007.
9. Sadhu MJ, Guan Q, Li F, Sales-Lee J, Iavarone AT, Hammond MC, et al. Nutritional
control of epigenetic processes in yeast and human cells. Genetics 2013;195(3):831-44.
10. Zhang Q, Xue P, Li H, Bao Y, Wu L, Chang S, et al. Histone modification mapping in
human brain reveals aberrant expression of histone H3 lysine 79 dimethylation in neural
tube defects. Neurobiol Dis 2013;54:404-13.
11. Duns G, van den Berg E, van Duivenbode I, Osinga J, Hollema H, Hofstra RM, et al.
Histone methyltransferase gene SETD2 is a novel tumor suppressor gene in clear cell renal
cell carcinoma. Cancer Res 2010;70(11):4287-4291.
9
12. Fontebasso AM, Schwartzentruber J, Khuong-Quang DA, Liu XY, Sturm D, Korshunov
A, et al. Mutations in SETD2 and genes affecting histone H3K36 methylation target
hemispheric high-grade gliomas. Acta Neuropathol 2013;125(5):659-669.
13. He J, Nguyen AT, Zhang Y. KDM2b/JHDM1b, an H3K36me2-specific demethylase, is
required for initiation and maintenance of acute myeloid leukemia. Blood 2011;117(14):
3869-3880.
14. Tamagawa H, Oshima T, Numata M, Yamamoto N, Shiozawa M, Morinaga S, et al.
Global histone modification of H3K27 correlates with the outcomes in patients with
metachronous liver metastasis of colorectal cancer. Eur J Surg Oncol 2013;39(6):655-661.
15. Bernt KM, Zhu N, Sinha AU, Vempati S, Faber J, Krivstov AV, et al. MLL-rearranged
leukemia is dependent on aberrant H3K79 methylation by DOT1L. Cancer Cell
2011;20(1):66-78.
16. Zhang L, Deng L, Chen F, Yao Y, Wu B, Wei L, et al. Inhibition of histone H3K79
methylation selectively inhibits proliferation, self-renewal and metastatic potential of
breast cancer. Oncotarget 2014;5(21):10665.
17. Huang H, Jiang X, Li Z, Li Y, Song C-X, He C, et al. TET1 plays an essential
oncogenic role in MLL-rearranged leukemia. Proc Natl Acad Sci U S A. 2013;110:11994-
11999.
18. Williams K, Christensen J, Pedersen MT, Johansen JV, Cloos PA, Rappsilber J, et al.
TET1 and hydroxymethylcytosine in transcription and DNA methylation fidelity. Nature.
2011;473:343-348.
19. Niedzwiecki MM, Liu X, Hall MN, Thomas T, Slavkovich V, Ilievski V, et al. Sex-
specific associations of arsenic exposure with global DNA methylation and
hydroxymethylation in leukocytes: results from two cross-sectional studies in Bangladesh.
Cancer Epidemiol Biomarkers & Prev. 2015;24:1748-1757.
10
CHAPTER TWO
Background
A. Overview of one-carbon metabolism and the transsulfuration pathway
1. One-carbon metabolism
One-carbon metabolism (OCM) consists of a series of oxidation and reduction reactions
that involve the transfer of one-carbon units via folate [1]. These one-carbon units are primarily
derived from formate and the hydroxymethyl group of serine [2]. The reactions of OCM are
highly compartmentalized between the cytoplasm, mitochondria, and nucleus and are involved in
many essential reactions, including the biosynthesis of thymidylate and purines and numerous
transmethylation reactions [1, 3].
Nucleic acid synthesis
The de novo synthesis of deoxythymidine monophosphate requires the transfer of a one-
carbon group from folate, in the form of 5,10-methylene-tetrahydrofolate (5,10-mTHF), to the 5’
position of deoxyuridine monophosphate [1, 3]. This primarily occurs in the cytoplasm and is
catalyzed by thymidylate synthase [1, 3]. In folate limiting conditions, thymidylate synthesis is
impaired [4]. As a result, uracil misincorporation into DNA occurs, which can lead to
chromosomal breaks and genomic instability [4].
Purine ring synthesis is largely dependent on purine recycling via the purine nucleotide
salvage pathway [5]. However, de novo purine synthesis is critical during periods of rapid cell
division, such as embryogenesis [6], and when purine nucleotides are limiting [5, 7]. De novo
purine synthesis depends on the donation of two formate groups, provided by two molecules of
11
folate, in the form of 10-formyl-tetrahydrofolate, which become carbons 2 and 8 of the newly
synthesized purine ring [3, 5].
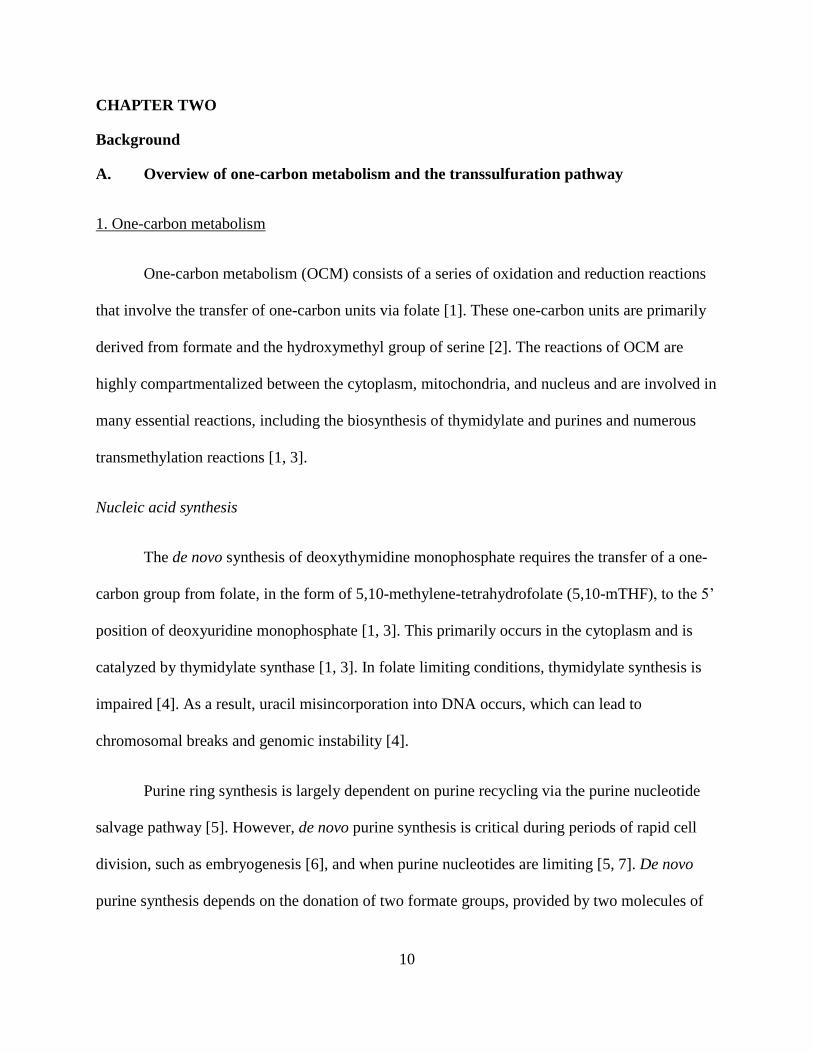
Methylation reactions
S-adenosymethionine (SAM) is involved in more than 100 different methylation reactions
[8], which are important for diverse biological processes, including stabilization of DNA, RNA,
and proteins; small molecule biosynthesis; cell signaling; and inactivation or elimination of small
molecules, including xenobiotics [9]. SAM is therefore considered the universal methyl donor
[10]. Each SAM-dependent methyltransferase transfers a methyl group from SAM to its
respective substrate, which results in the methylated product and S-adenosyhomocysteine (SAH)
(Figure 1). SAH is a potent inhibitor of most SAM-dependent methyltransferases [9]. Thus,
SAM and SAH are considered indices of methylation capacity [11-14].
Figure 1. S-adenosylmethionine and S-adenosylhomocysteine. S-adenosylmethionine (SAM) can
donate a methyl group (shown in red) to a large number of different substrates. Upon donating
this methyl group, SAM is converted to S-adenosylhomocysteine (SAH), a potent inhibitor of
most SAM-dependent methyltransferases.

12
SAM synthesis is catalyzed by methionine adenosyltransferase and depends on the
activation of methionine (Met) by ATP [15, 16]. Met can be obtained from the diet or
synthesized via the methylation of homocysteine (Hcys) in a reaction catalyzed by one of two
enzymes: 1) Met synthase (MTR), which utilizes cobalamin as a cofactor and requires a methyl
donation from folate in the form of 5-methyl-tetrahydrofolate (5-mTHF) or 2) betaine Hcys
methyltransferase (BHMT), which requires a methyl donation from betaine (Figure 2) [17].
Although both pathways contribute to Met synthesis, MTR is expressed ubiquitously [18], while
BHMT expression is mainly confined to the kidney and liver [19]. Given their importance in
numerous methylation reactions, intracellular SAM and SAH concentrations are very tightly
controlled [20]. In part, this occurs through negative feedback via long-range allosteric
regulation. For example, SAM inhibits methylenetetrahydrofolate reductase (MTHFR), which
irreversibly converts 5,10-mTHF to 5-mTHF [21]. SAM also inhibits BHMT [22]. Thus, SAM
downregulates its own synthesis by simultaneously reducing the production of 5-mTHF and the
amount of betaine utilized for the remethylation of Hcys (Figure 2).
Since SAH is a potent inhibitor of most SAM-dependent methyltransferases [9], the
elimination of SAH is also important for maintaining efficient methylation capacity. SAH can be
hydrolyzed to Hcys by SAH hydrolase [23]. However, this reaction is reversible and strongly
favors SAH synthesis [23]. Therefore, SAH will readily accumulate, leading to the inhibition of
multiple methylation reactions, unless Hcys is rapidly eliminated by 1) remethylation to Met by
either the folate- and cobalamin-dependent or the betaine-dependent pathway or 2) catabolism
via the transsulfuration pathway [23].
13
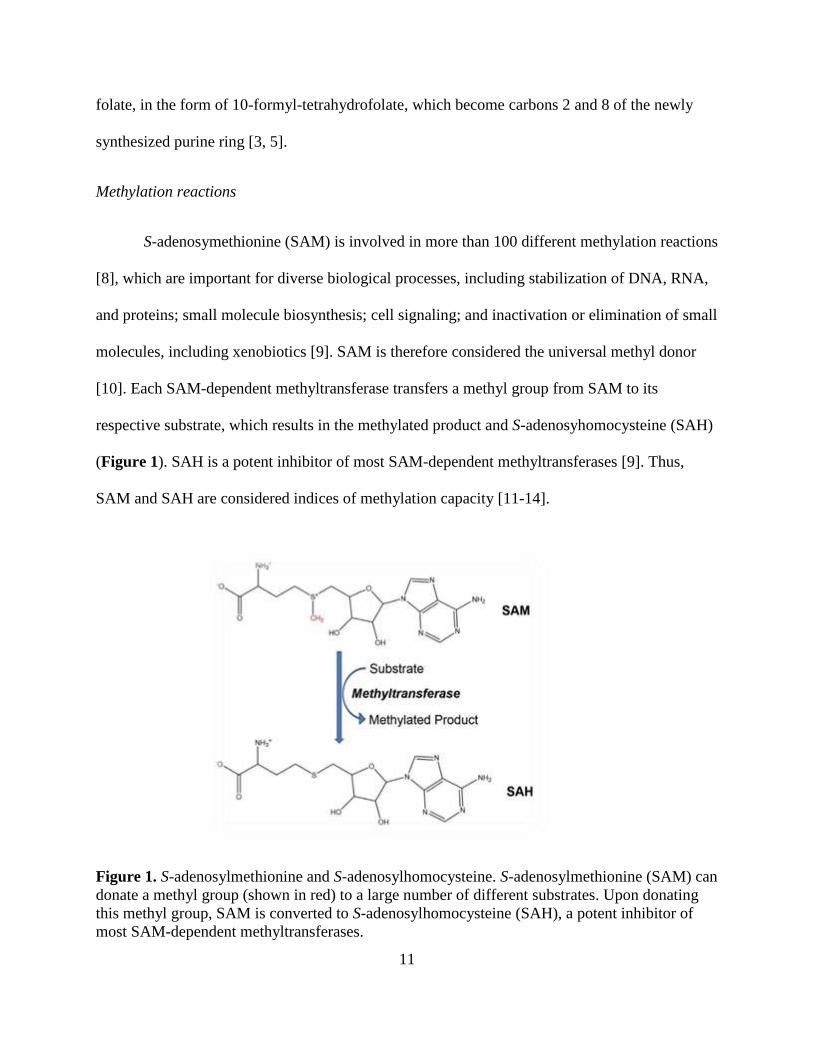
Figure 2. Simplified overview of one-carbon metabolism. S-adenosylmethionine (SAM) donates
a methyl group to one of its numerous substrates to form the methylated product and S-
adenosylhomocysteine (SAH), which can be hydrolyzed to homocysteine (Hcys). However, this
reaction is reversible and favors SAH synthesis. The regeneration of SAM depends on
methionine (Met), which can be obtained from the diet or synthesized endogenously via the
remethylation of Hcys. This is either catalyzed by 1) methionine synthase (MTR), a cobalamin-
dependent enzyme that requires a methyl donation from 5-methyl-tetrahydrofolate (5-mTHF), or
2) betaine homocysteine methyltransferase (BHMT), which requires a methyl donation from
betaine. Once betaine donates a methyl group, it forms dimethylglycine (DMG). 5-mTHF can be
obtained directly from the diet, or it can be derived from folic acid (FA). FA must be reduced to
dihydrofolate (DHF), then tetrahydrofolate (THF), before receiving a methyl group from serine
to form 5,10-methylene-tetrahydrofolate (5,10-mTHF). 5,10-mTHF is then converted to 5-mTHF
by methylene tetrahydrofolate reductase (MTHFR). Betaine can either be obtained from the diet
or derived from the irreversible oxidation of choline, which can also be acquired from the diet or
synthesized endogenously. De novo choline synthesis involves three sequential methylation
reactions, catalyzed by phosphatidylethanolamine N-methyltransferase (PEMT), which converts
phosphatidylethanolamine (PE) to phosphatidylcholine (PC). The synthesis of one molecule of
PC requires three molecules of SAM and generates three molecules of SAH. To ensure tight
control of intracellular SAM and SAH concentrations, many enzymes involved in one-carbon
metabolism are regulated through long-range allosteric interactions. For example, SAM inhibits
both BHMT and MTHFR and thereby downregulates its own synthesis.
14
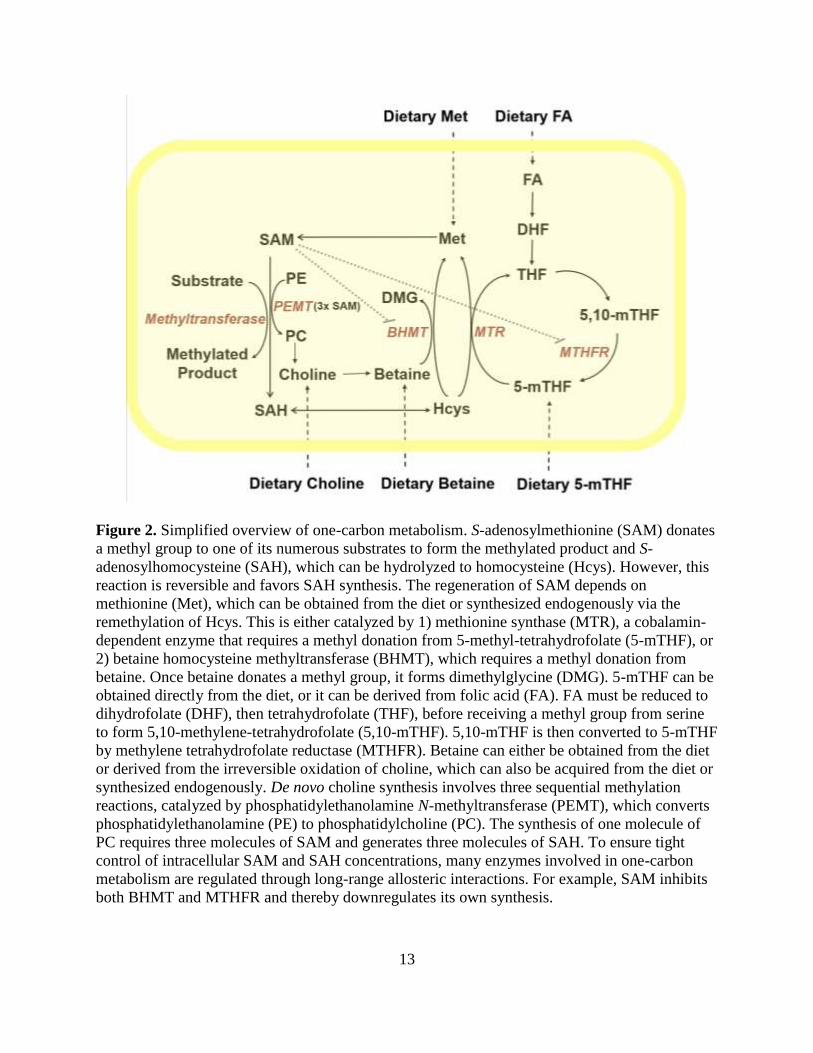
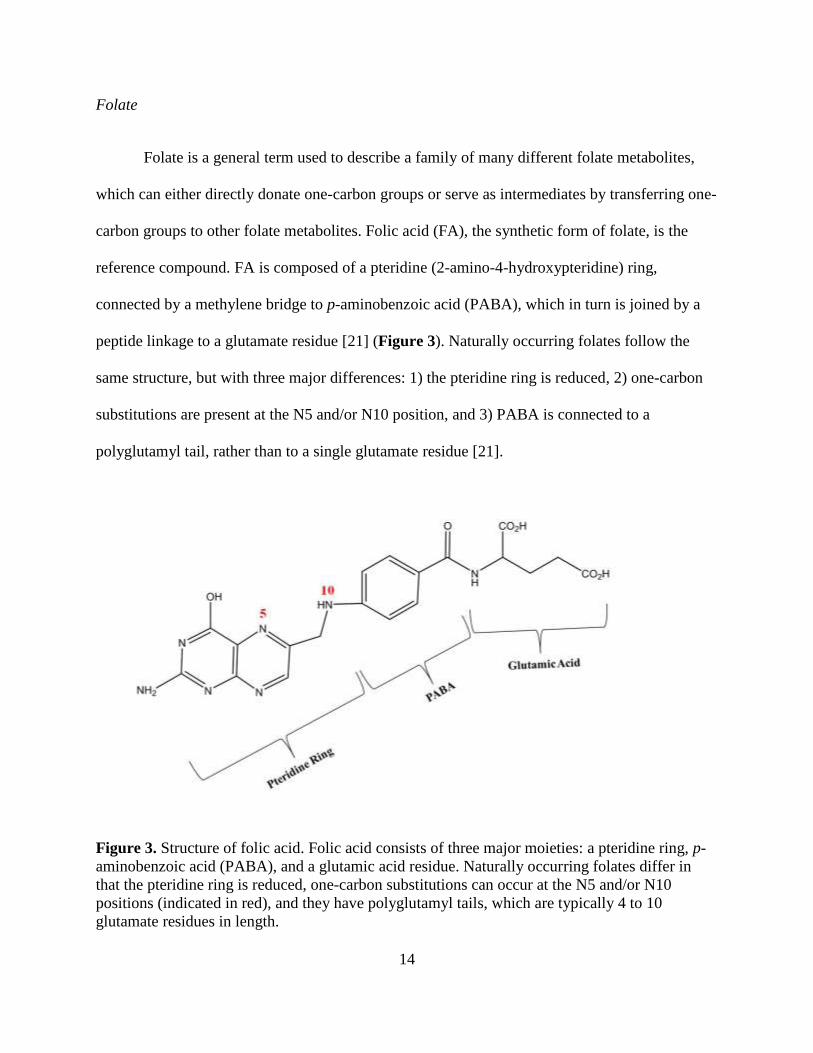
Folate
Folate is a general term used to describe a family of many different folate metabolites,
which can either directly donate one-carbon groups or serve as intermediates by transferring one-
carbon groups to other folate metabolites. Folic acid (FA), the synthetic form of folate, is the
reference compound. FA is composed of a pteridine (2-amino-4-hydroxypteridine) ring,
connected by a methylene bridge to p-aminobenzoic acid (PABA), which in turn is joined by a
peptide linkage to a glutamate residue [21] (Figure 3). Naturally occurring folates follow the
same structure, but with three major differences: 1) the pteridine ring is reduced, 2) one-carbon
substitutions are present at the N5 and/or N10 position, and 3) PABA is connected to a
polyglutamyl tail, rather than to a single glutamate residue [21].
Figure 3. Structure of folic acid. Folic acid consists of three major moieties: a pteridine ring, p-
aminobenzoic acid (PABA), and a glutamic acid residue. Naturally occurring folates differ in
that the pteridine ring is reduced, one-carbon substitutions can occur at the N5 and/or N10
positions (indicated in red), and they have polyglutamyl tails, which are typically 4 to 10
glutamate residues in length.
15
Folate is mainly absorbed in the proximal jejunum, where naturally occurring folates
must be cleaved to monoglutamate species prior to being transported into the enterocyte,
primarily by the reduced folate carrier or the proton-coupled folate transporter [24]. FA is more
readily absorbed than naturally occurring folates, in part because FA does not need to be cleaved
and thus can be directly transported into the enterocyte [21]. After being reduced in the
enterocyte, FA is converted with naturally occurring folates to 5-mTHF [21], the predominant
form of circulating folate [21].
In the United States, the recommended dietary allowance (RDA) for folate is 400 µg
dietary folate equivalents/day for adults [25]. This is comparable to 400 µg natural folate from
food sources, 240 µg FA taken with food, or 200 µg FA taken on an empty stomach [25]. Food
sources particularly rich in natural folates include leafy greens and other vegetables, such as
Brussels sprouts and asparagus, as well as beef liver, beans, and nuts [25]. In countries with
mandatory FA fortification programs, fortified staple foods are rich sources of FA. In 1998, the
United States mandated fortification of cereals, breads, pastas, and other grain products with FA
[25]. Thus, with the exception of certain subgroups, the prevalence of folate deficiency in the
United States has remained very low (<5%) since 1998 [26]. However, many countries do not
have mandatory FA fortification, and have a high prevalence of folate deficiency. For example,
in Bangladesh the prevalence of folate deficiency (plasma folate <9 nmol/L [27]) is estimated to
be as high as 57% for men and 39% for women [28].
The upper tolerable limit (UL) for FA is 1 mg/day. This was originally established based
on concerns that FA could mask cobalamin deficiency, since FA supplementation can correct
megaloblastic anemia, the main clinical symptom of cobalamin deficiency, without correcting
other potential consequences, such as neurological damage [25]. These concerns largely arose in

16
response to early case studies which reported neurological symptoms in cobalamin deficient
individuals treated with FA [29].
Cobalamin
In mammals, cobalamin, also known as vitamin B12, exists in two main active forms:
methylcobalamin and 5’-deoxyadenosylcobalamin [21]. These are the predominant forms of
cobalamin in the serum and cytosol, respectively [30]. Methylcobalamin is a cofactor for MTR,
while 5’-deoxyadenosylcobalamin is a cofactor for methylmalonyl coenzyme A (CoA) mutase,
which converts methylmalonyl CoA to succinyl CoA, an intermediate in the citric acid cycle
[21]. In addition to its role in SAM synthesis, MTR is critical for regenerating tetrahydrofolate
(THF) from 5-mTHF [21]. Therefore, cobalamin deficiency can lead to a functional folate
deficiency due to a phenomenon called the “methyl trap”, where in the absence of cobalamin,
folate becomes trapped as 5-mTHF, since MTR is thus unable to convert 5-mTHF to THF
(Figure 2). Consequently, an intracellular deficiency in THF develops, leading to the impairment
of downstream processes, such as purine and thymidylate synthesis [21].
In the United States, the RDA for cobalamin is 2.4 µg/day for adults [31]. Major dietary
sources include meat, eggs, and dairy [31]. In high-income countries, many cereals also contain
cobalamin as a result of voluntary fortification [32, 33]. The main type of cobalamin used in
fortified foods and supplements is cyanocobalamin, which is easily absorbed and can be
converted endogenously to the biologically active forms methylcobalamin and
5’deoxyadenosylcobalamin [31]. There is currently no UL for cobalamin [31], since randomized
trials that administered doses as high as 0.4 and 1 mg/day did not observe toxic side effects [34,
35].
17
Dietary cobalamin is tightly bound to proteins and must therefore be released by
hydrochloric acid in the stomach to be effectively absorbed [36]. However, free cobalamin is
very susceptible to denaturation and must bind instantly to haptocorrin, a glycoprotein which
protects it until it reaches the duodenum [37]. Once in the duodenum, cobalamin is released and
bound by intrinsic factor (IF), [36, 38] another glycoprotein, which is essential for cobalamin’s
subsequent absorption in the ileum [39]. Upon absorption, cobalamin is released from IF and is
thus able to form a complex with transcobalamin II [40], which circulates in the blood and is
transported into cells by transcobalamin receptors, which are expressed ubiquitously [41, 42].
Gastric atrophy occurs with aging, leading to decreased production of hydrochloric acid
and IF. As a result, the elderly are particularly susceptible to developing cobalamin deficiency
[33]. In the United States, the prevalence of cobalamin deficiency is highest among those greater
than 60 years old, with 6% classified as deficient (plasma cobalamin <148 pmol/L) and more
than 20% classified as marginally depleted (148 pmol/L< plasma cobalamin <221 pmol/L) [33].
Since cobalamin is only found naturally in animal products, vegans and vegetarians are also
susceptible to developing cobalamin deficiency [33]. Due to expense, meat is not a major
component of the diet in Bangladesh. Consequently, there is a high prevalence of cobalamin
deficiency in Bangladesh, even among individuals less than 60 years old, with 8% of men and
13% of women between the ages of 28 and 49 classified as deficient (plasma cobalamin <151
pmol/L [27]) [28].
Betaine
Betaine, also known as trimethylglycine, has two major physiological functions: 1) to act
as an osmolyte and 2) to serve as a methyl donor for the regeneration of SAM [43]. Due to its
18
role as a methyl donor, betaine supplementation reduces Hcys concentrations [44-47]. Although
the Hcys-reducing effects of betaine are smaller than those observed for FA [48], they are more
pronounced in individuals with low plasma folate [49]. Food sources rich in betaine include
wheat, shellfish, spinach, and sugar beets [43]. There is currently no RDA or adequate intake
(AI) level for betaine.
Studies in animal models [43, 50, 51] and human participants [52, 53] have shown that
dietary betaine is rapidly absorbed, then transported into tissues by amino acid transport systems
[43], such as amino acid transport system A [54] and the betaine/γ–aminobutyric acid transporter
[55, 56]. However, the majority of betaine is synthesized endogenously [43] in a two-step
process that occurs in the liver and kidney [57-59], whereby choline is first irreversibly oxidized
by choline dehydrogenase to betaine aldehyde, which is subsequently oxidized to betaine in a
reaction catalyzed by betaine aldehyde dehydrogenase [60].
Choline
Choline is an essential component of membrane phospholipids and is also required for
lipid transport and acetylcholine synthesis [61]. Since choline is a precursor to betaine, it also
serves as an important methyl donor, particularly when Met and folate are limiting [61]. Choline
can be obtained from the diet or synthesized endogenously. Approximately 70% of endogenous
choline is provided by the Kennedy Pathway [62, 63]. The remaining 30% is synthesized de
novo through a pathway which converts phosphatidylethanolamine (PE) to phosphatidylcholine
(PC) through three methylation reactions, which are catalyzed by the SAM-dependent
phosphatidylethanolamine N-methyltransferase (PEMT) [60] (Figure 2). Consequently, PC

19
synthesis is one of the largest consumers of SAM [60]. However, choline also contributes to
SAM synthesis, since the majority of choline is irreversibly oxidized to betaine in the liver [60].
Although choline is synthesized endogenously in the liver [60, 64] and, to a lesser extent,
in the brain [60, 65, 66], it must also be obtained from the diet [60]. Major dietary sources
include liver, egg yolks, fish, and dairy products [60, 61]. The main forms of choline obtained
through these food sources include free choline and choline esters, such as phosphocholine,
glycerophosphocholine, PC, and sphingomyelin [67]. Although there is currently insufficient
information to set an RDA for choline [61], the recommended AI is 550 mg/day for adult men
and 425 mg/day for adult women who are not pregnant or lactating [61]. These AIs were largely
determined based on the amount of choline required to prevent liver damage [60]. Given the
hypotensive properties of choline, proposed ULs have also been set for certain subgroups,
including an UL of 3.5 g choline/day for women who are pregnant or lactating [60].
Homocysteine and hyperhomocysteinemia
Hcys is a thiol-containing amino acid which is involved in both the transmethylation and
the transsulfuration pathways [17]. Plasma Hcys concentrations rise when Hcys accumulates
intracellularly [17]. Individuals with plasma Hcys concentrations exceeding 13 µmol/L are
classified as having hyperhomocysteinemia (HHcys) [68], which is a risk factor for several
adverse health outcomes, including cardiovascular disease [69] and neurological disorders [70].
In human populations, several factors have been associated with elevated plasma Hcys
concentrations, including increased age, decreased renal function, and certain genetic variants
(reviewed in [17]). Plasma Hcys concentrations are also consistently higher among men
20
compared with women [17]. Additionally, deficiencies in B vitamins, particularly folate, are
important determinants of elevated plasma Hcys concentrations [17].
2. Transsulfuration pathway
The transsulfuration pathway involves the unidirectional catabolism of Hcys for the
synthesis of glutathione (GSH) [71, 72], the primary intracellular antioxidant in mammals [71,
72]. This occurs in two major steps: 1) Hcys and serine condense to form cystathionine in a
reaction that is catalyzed by cystathionine-β-synthase (CBS) and 2) cystathionine is cleaved by
γ-cystathionase to liberate cysteine for GSH synthesis [73]. Vitamin B6, in the form of pyridoxal
phosphate, is a required cofactor for each step [73].
B. Overview of arsenic metabolism and toxicity
1. Arsenic and associated health outcomes
Exposure to arsenic-contaminated drinking water is a global problem. Worldwide, it has
been estimated that 140 million individuals are exposed to inorganic arsenic (InAs) at
concentrations exceeding the World Health Organization guideline for safe drinking water [74],
which is 10 μg/L [75]. More than 57 million of these individuals reside in Bangladesh [76]. This
is a critical public health issue, because there is substantial evidence that arsenic causes skin,
lung, and bladder cancers, ischemic heart disease, and skin lesions (reviewed in [77]). Arsenic
has also been associated with kidney, prostate, liver, and pancreatic cancers (reviewed in [77]),
peripheral neuropathy [78], decreased intellectual function in children [79], nonmalignant lung
disease (reviewed in [80]), diabetes [81-83], and hypertension (reviewed in [84]). In both animal
21
and human studies, susceptibility to arsenic toxicity has been shown to differ by sex1, with some
outcomes preferentially afflicting males and others females (reviewed in [77]).
Although InAs can exist in four oxidation states (-III, 0, III, and V) [85], in well water it
predominately exists in the trivalent (III) and pentavalent (V) states (arsenite and arsenate,
respectively) [77].
2. Uptake and metabolism of inorganic arsenic
Almost all ingested InAs is absorbed by the gastrointestinal tract [77, 86]. Although the
mechanisms of absorption are still being elucidated, arsenate (AsV) competes for uptake by
phosphate transporters [87], while arsenite (AsIII) is likely taken up by several different
transporters, including organic anion transporting polypeptides, glucose transporters, and
aquaporins 7 and 9 [87]. Once absorbed, InAs is metabolized through a two-step methylation
process, which is catalyzed by the SAM-dependent, AsIII methyltransferase (AS3MT) [88, 89].
Three detailed mechanisms have been proposed for the sequential methylation of InAs to
mono- and dimethyl arsenical species (MMA and DMA, respectively). The most commonly
accepted pathway is that proposed by Challenger et al., whereby InAs is methylated via an
oxidative methylation pathway, in which the valence state of As changes from III to V each time
a methyl group is transferred from SAM [90, 91] (Figure 4). Two alternative pathways have also
been hypothesized. In 2005, Hayakawa et al. described a mechanism in which arsenic is
successively methylated, but the valence state does not change with the transfer of a methyl
group from SAM [92]; instead, arsenic-GSH complexes form prior to each methylation step [92].
1For simplicity, the word “sex” is used. However, in epidemiological studies, observed differences between males and females
may be driven by both biological sex, which is determined by sex chromosomes and gonads, and socially-determined factors
(i.e., gender-related factors). Therefore, with respect to human populations, “sex” refers to both sex and gender unless otherwise
specified.
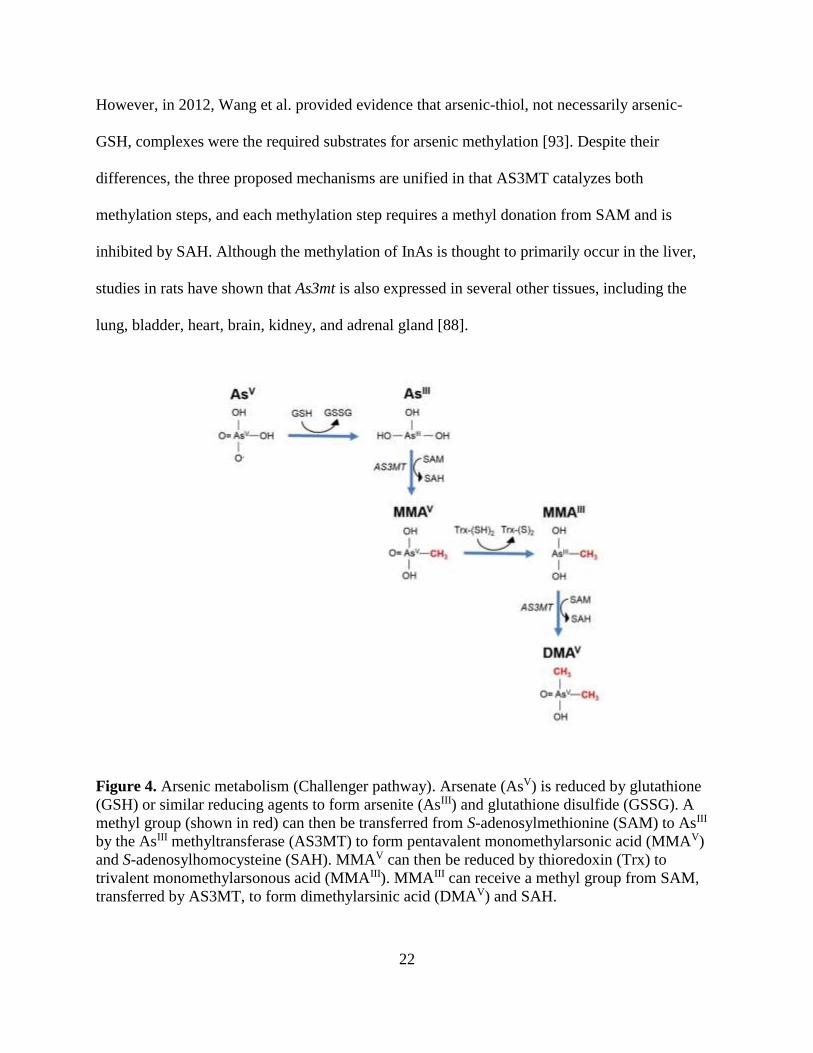
22
However, in 2012, Wang et al. provided evidence that arsenic-thiol, not necessarily arsenic-
GSH, complexes were the required substrates for arsenic methylation [93]. Despite their
differences, the three proposed mechanisms are unified in that AS3MT catalyzes both
methylation steps, and each methylation step requires a methyl donation from SAM and is
inhibited by SAH. Although the methylation of InAs is thought to primarily occur in the liver,
studies in rats have shown that As3mt is also expressed in several other tissues, including the
lung, bladder, heart, brain, kidney, and adrenal gland [88].
Figure 4. Arsenic metabolism (Challenger pathway). Arsenate (AsV) is reduced by glutathione
(GSH) or similar reducing agents to form arsenite (AsIII) and glutathione disulfide (GSSG). A
methyl group (shown in red) can then be transferred from S-adenosylmethionine (SAM) to AsIII
by the AsIII methyltransferase (AS3MT) to form pentavalent monomethylarsonic acid (MMAV)
and S-adenosylhomocysteine (SAH). MMAV can then be reduced by thioredoxin (Trx) to
trivalent monomethylarsonous acid (MMAIII). MMAIII can receive a methyl group from SAM,
transferred by AS3MT, to form dimethylarsinic acid (DMAV) and SAH.
23
Cell lines differ in their capacity to methylate arsenic, with human hepatocytes having a
relatively high capacity; keratinocytes and bronchial cell lines having a lower capacity; and
bladder epithelial cells, lymphoblasts, and fibroblasts having a very limited arsenic methylation
capacity (reviewed in [94]). The efficiency of arsenic metabolism also varies considerably
between species (reviewed in [95]). Dogs and mice methylate a substantial portion of InAs, with
>70% eliminated as DMA (DMAIII + DMAV) within days [96-98]. Rats are also very efficient at
methylating InAs to DMA [95]. However, DMA accumulates in the red blood cells (RBCs) of
rats due to the affinity of DMAIII for cysteine 13 in the rat hemoglobin alpha chain [99]. Thus,
rats excrete very little DMA [100]. Since this particular cysteine residue is not present in human
or mouse hemoglobin, DMAIII does not accumulate in the RBCs of these species [100].
Compared with other mammals, rats also excrete a substantial amount of arsenic into bile [95].
In contrast with most animal models, humans are relatively inefficient at fully methylating InAs
to DMA and thus excrete a large portion (~10-20%) of total urinary As (uAs) as MMA (MMAIII
+ MMAV) [95]. Given the large differences in arsenic metabolism between species, and the fact
that arsenic by itself is not tumorigenic in most rodent models [101], population-based studies
have been essential for studying the potential mechanisms of arsenic toxicity.
Within human populations there is substantial inter-individual variation in arsenic
metabolism. Thus far, this has been attributed to differences in nutritional status [102, 103] and
genetics [104]. There are also substantial differences by sex, with women typically having a
greater capacity to methylate arsenic than men, such that they excrete a lower proportion of uAs
as MMA and a higher proportion as DMA [105-107]. This difference is most apparent in adults
between the ages of 22 and 55 [108] and may be due to sex differences in the OCM pathway
[77]. For example, endogenous choline synthesis may be higher among premenopausal women
24
due to estrogen-induced upregulation of PEMT expression ([109] and reviewed in [110]). Studies
in mice suggests that inter-individual differences in the microbiome may also contribute to
variation in arsenic metabolism [111-113]. However, this has not been studied in human
populations.
The efficiency of arsenic metabolism may also vary with the dose of arsenic, as InAs has
been shown to inhibit its own methylation in vitro [114, 115]. The second methylation step (i.e.,
the methylation of MMA to DMA) is particularly sensitive to this [114, 115]. Consistent with
this, mice exposed to increasing doses of InAs excrete a larger proportion of arsenic as MMA
and a lower proportion as DMA [116]. Therefore, individuals exposed to particularly high
concentrations of InAs may have a reduced capacity to completely methylate InAs to DMA.
However, while there is some supporting evidence of this in human populations [117-119], the
findings have not always been consistent [120].
3. Proposed mechanisms of arsenic toxicity
General mechanisms of arsenic toxicity
There are likely multiple mechanisms of arsenic toxicity. Since AsV and phosphate are
structurally very similar, one mechanism of action is through the disruption of phosphate-
dependent biochemical reactions and anion transporters [121]. Trivalent arsenical species are
also highly toxic, because they react with sulfhydryl groups in proteins and thereby inhibit the
activity of many enzymes [122]. In this manner, it has been estimated that arsenic inhibits at least
200 different enzymes [122].
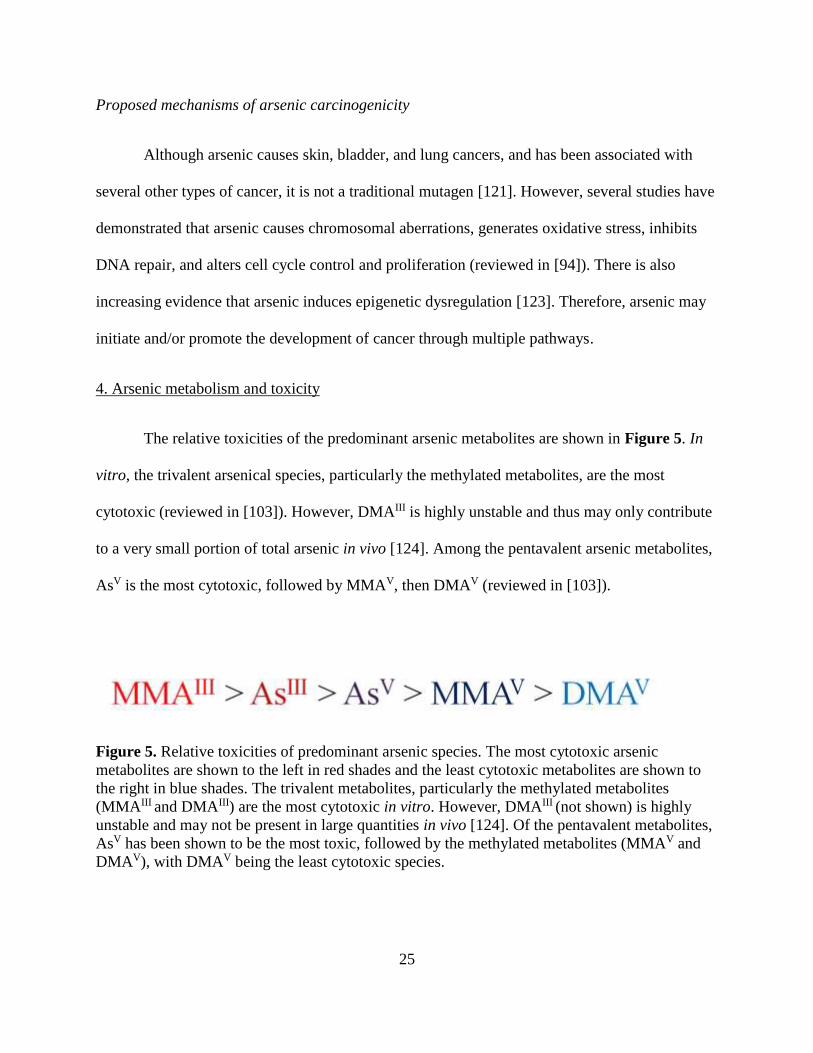
25
Proposed mechanisms of arsenic carcinogenicity
Although arsenic causes skin, bladder, and lung cancers, and has been associated with
several other types of cancer, it is not a traditional mutagen [121]. However, several studies have
demonstrated that arsenic causes chromosomal aberrations, generates oxidative stress, inhibits
DNA repair, and alters cell cycle control and proliferation (reviewed in [94]). There is also
increasing evidence that arsenic induces epigenetic dysregulation [123]. Therefore, arsenic may
initiate and/or promote the development of cancer through multiple pathways.
4. Arsenic metabolism and toxicity
The relative toxicities of the predominant arsenic metabolites are shown in Figure 5. In
vitro, the trivalent arsenical species, particularly the methylated metabolites, are the most
cytotoxic (reviewed in [103]). However, DMAIII is highly unstable and thus may only contribute
to a very small portion of total arsenic in vivo [124]. Among the pentavalent arsenic metabolites,
AsV is the most cytotoxic, followed by MMAV, then DMAV (reviewed in [103]).
Figure 5. Relative toxicities of predominant arsenic species. The most cytotoxic arsenic
metabolites are shown to the left in red shades and the least cytotoxic metabolites are shown to
the right in blue shades. The trivalent metabolites, particularly the methylated metabolites
(MMAIII and DMAIII) are the most cytotoxic in vitro. However, DMAIII (not shown) is highly
unstable and may not be present in large quantities in vivo [124]. Of the pentavalent metabolites,
AsV has been shown to be the most toxic, followed by the methylated metabolites (MMAV and
DMAV), with DMAV being the least cytotoxic species.
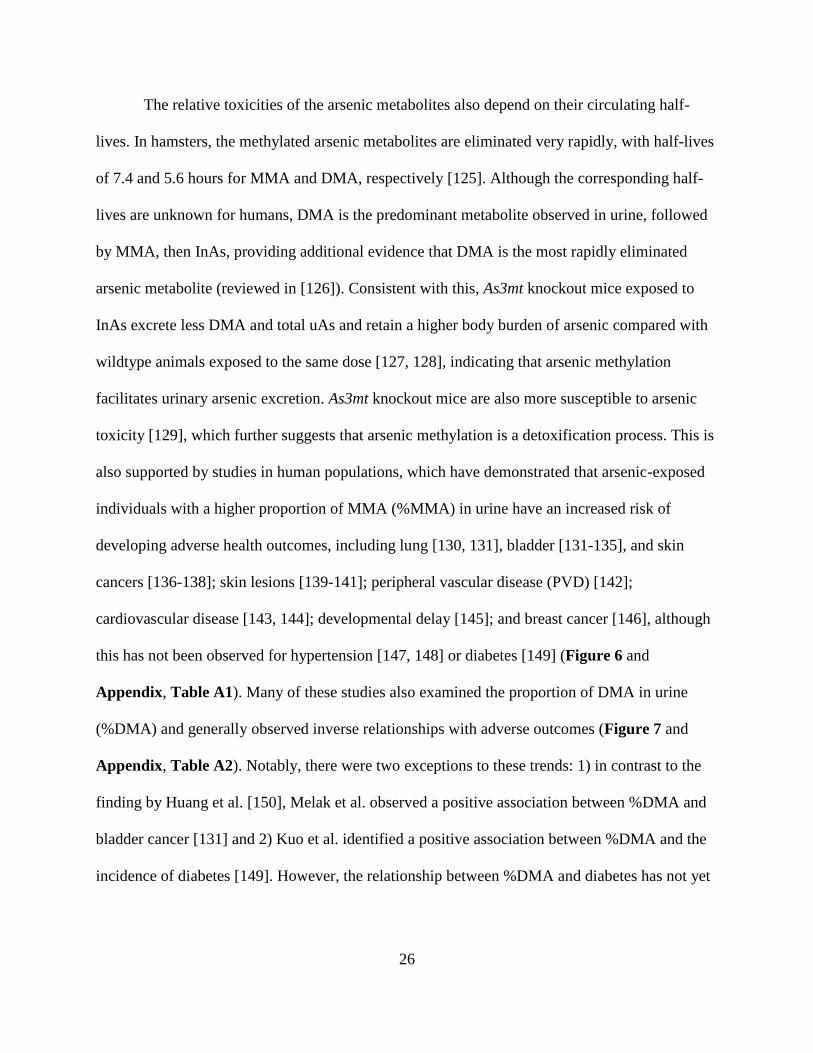
26
The relative toxicities of the arsenic metabolites also depend on their circulating half-
lives. In hamsters, the methylated arsenic metabolites are eliminated very rapidly, with half-lives
of 7.4 and 5.6 hours for MMA and DMA, respectively [125]. Although the corresponding half-
lives are unknown for humans, DMA is the predominant metabolite observed in urine, followed
by MMA, then InAs, providing additional evidence that DMA is the most rapidly eliminated
arsenic metabolite (reviewed in [126]). Consistent with this, As3mt knockout mice exposed to
InAs excrete less DMA and total uAs and retain a higher body burden of arsenic compared with
wildtype animals exposed to the same dose [127, 128], indicating that arsenic methylation
facilitates urinary arsenic excretion. As3mt knockout mice are also more susceptible to arsenic
toxicity [129], which further suggests that arsenic methylation is a detoxification process. This is
also supported by studies in human populations, which have demonstrated that arsenic-exposed
individuals with a higher proportion of MMA (%MMA) in urine have an increased risk of
developing adverse health outcomes, including lung [130, 131], bladder [131-135], and skin
cancers [136-138]; skin lesions [139-141]; peripheral vascular disease (PVD) [142];
cardiovascular disease [143, 144]; developmental delay [145]; and breast cancer [146], although
this has not been observed for hypertension [147, 148] or diabetes [149] (Figure 6 and
Appendix, Table A1). Many of these studies also examined the proportion of DMA in urine
(%DMA) and generally observed inverse relationships with adverse outcomes (Figure 7 and
Appendix, Table A2). Notably, there were two exceptions to these trends: 1) in contrast to the
finding by Huang et al. [150], Melak et al. observed a positive association between %DMA and
bladder cancer [131] and 2) Kuo et al. identified a positive association between %DMA and the
incidence of diabetes [149]. However, the relationship between %DMA and diabetes has not yet

27
Figure 6. Associations between %MMA in urine and adverse health outcomes. Black boxes
represent point estimates for odds or hazards ratios for associations between %MMA and
adverse health outcomes. The size of the box is proportional to the precision of the estimate
based on the standard error. 95% confidence intervals are represented by gray lines. Arrows
indicate that the confidence interval extends beyond the range of the plot. The association is not
statistically significant at P < 0.05 if the confidence interval crosses the dashed line. Outcomes
that have consistently been associated with arsenic exposure are listed first. *MMA:InAs or
DMA:MMA (low versus high) was used instead of %MMA. Abbreviations used: Arg.,
Argentina; Develop. Delay, developmental delay; %MMA, proportion of monomethyl arsenical
species (MMAIII + MMAV) in urine; DMA:MMA, ratio of dimethyl arsenical species (DMAIII +
DMAV) to monomethyl arsenical species in urine; MMA:InAs, ratio of MMA to inorganic
arsenical species (AsIII + AsV); PVD, peripheral vascular disease; U.S., United States
28
Figure 7. Associations between %DMA in urine and adverse health outcomes. Black boxes
represent point estimates for odds or hazards ratios for associations between %DMA and adverse
health outcomes. The size of the box is proportional to the precision of the estimate based on the
standard error. 95% confidence intervals are represented by gray lines. Arrows indicate that the
confidence interval extends beyond the range of the plot. The association is not statistically
significant at P < 0.05 if the confidence interval crosses the dashed line. Outcomes that have
consistently been associated with exposure to arsenic are listed first. Abbreviations used:
Develop. Delay, developmental delay; %DMA, proportion of dimethyl arsenical species (DMAIII
+ DMAV) in urine; PVD, peripheral vascular disease
29
been confirmed in other populations, and whether or not arsenic exposure is causally related to
diabetes has been debated [83, 151-153].
5. Influences of one-carbon metabolism on arsenic metabolism and toxicity
The OCM pathway and arsenic metabolism are highly interrelated, particularly since the
latter involves two sequential SAM-dependent methylation reactions. There are therefore many
possible nutritional influences on the metabolism and toxicity of arsenic.
Experimental studies
Early experimental studies demonstrated that arsenic-exposed rabbits fed a choline- and
Met-deficient diet eliminate less arsenic in urine than arsenic-exposed rabbits fed a control diet,
primarily due to reductions in DMA excretion [154]. Similarly, mice exposed simultaneously to
arsenic and a diet deficient in choline [155] or folate [156] have been shown to excrete less uAs
and to incur greater amounts of DNA damage at lower doses of arsenic than mice fed a control
diet [155]. Furthermore, mice nullizygous for Folbp2, which is involved in folate transport [157],
and mice born to mothers nullizygous for Mthfr [158] are more susceptible to arsenic-induced
embryotoxicity. Choline supplementation also protects against arsenic-induced neural tube
defects (NTDs) in chicks [159], and several in vitro studies have demonstrated that nutritional
methyl donors prevent arsenic-induced DNA damage [160-162], mitochondrial dysfunction
[160], alterations in gene expression patterns [163], apoptosis [164], and oxidative stress [165].
Collectively, these studies suggest that nutritional methyl donors protect against arsenic toxicity,
and there are likely multiple protective mechanisms.
30
Observational studies
Epidemiological studies have also provided evidence that the OCM pathway and arsenic
metabolism are highly interrelated. Several cross-sectional studies in Bangladesh have observed
that nutritional methyl donors, including folate, Met, and choline, are associated with an arsenic
metabolite profile indicative of enhanced arsenic methylation capacity (i.e., a lower %MMA and
a higher %DMA in urine) and lower concentrations of blood arsenic (bAs), while plasma Hcys
has been associated with an arsenic metabolite profile indicative of reduced arsenic methylation
capacity (i.e., a higher %MMA and a lower %DMA in urine) and higher concentrations of bAs
[166-168]. Studies in Argentinian populations have also observed associations between single
nucleotide polymorphisms (SNPs) in OCM genes and arsenic metabolites [169-171]. For
example, SNPs which reduce the activity of MTHFR have been associated with a higher %InAs
and a lower %DMA in urine [169]. Similarly, SNPs in CBS which increase Hcys concentrations
are associated with a higher %MMA in urine [170]. Folate deficiency and HHcys are also
independent predictors of arsenic-induced skin lesion risk [172], and plasma folate has been
inversely associated with bladder cancer risk in an arsenic-exposed population [150], providing
additional human evidence that nutritional methyl donors, such as folate, may protect against
arsenic toxicity.
Importantly, some of these effects may be population-dependent. For example, studies in
the United States have not observed significant associations between dietary folate and uAs
metabolites [173] or toenail arsenic concentrations [174]. Since these studies occurred after the
United States mandated FA fortification of staple foods, this could be due to the fact that most of
these participants were folate sufficient [173, 174]. Another important consideration is that both
studies examined dietary folate rather than folate biomarkers. Natural folates are very susceptible
31
to oxidative degradation, thus dietary folate may not accurately reflect folate status [175].
Similar to the findings in the United States, a study in pregnant Bangladeshi women only
observed marginal associations between plasma folate and uAs metabolites [176]. However,
these women were taking prenatal supplements, including 400 µg FA/day [176], and were
therefore likely to be folate sufficient. Furthermore, the OCM pathway is known to be
dramatically altered during pregnancy [177].
Although folate has not been associated with arsenic measures in populations receiving
adequate folate, a study in the northeastern United States observed an inverse relationship
between dietary cobalamin intake and toenail arsenic concentrations [174]. However, the
relationship between cobalamin and arsenic metabolism may be quite complex, as studies in
Bangladesh have observed positive associations between plasma cobalamin [178], or dietary
cobalamin intake [168], and the %MMA or the ratio of MMA to DMA, respectively, in urine.
Randomized clinical trials
Thus far, two randomized, placebo-controlled trials in Bangladesh have provided the
strongest human evidence that folate facilitates the metabolism and excretion of arsenic. The first
such trial, which was conducted in folate-deficient adults, demonstrated that 400 µg FA/day
significantly reduces the total proportion of uAs excreted as InAs or MMA, increases the total
proportion of uAs excreted as DMA [179], and reduces total bAs concentrations [180]. A second
trial demonstrated that a higher dose of FA (800 µg FA/day) reduces bAs concentrations in a
mixed population of folate-deficient and folate-replete adults, and to a similar extent (12%
reduction) as 400 µg FA/day in folate deficient adults (14% reduction) [181].
32
C. Interplay between arsenic, one-carbon metabolism, and epigenetics
1. Epigenetics
Epigenetics has traditionally been defined as the study of stable and heritable changes in
gene expression or cellular phenotypes that occur without changes in Watson-Crick base-pairing
of DNA [182]. However, others have proposed a less conservative definition, which includes all
chromatin modifications that alter gene activity, irrespective of heritability [183].
Histone proteins
The major unit of chromatin is the nucleosome, which is composed of approximately 147
base pairs of DNA, wrapped 1.65 times around a histone protein octamer [184, 185]. The histone
octamer consists of two copies of each of the four core histones: H2A, H2B, H3, and H4;
histones H2A and H2B form two heterodimers, while histones H3 and H4 form a tetramer [184,
186] (Figure 8). A fifth histone (H1), known as the linker histone, helps to stabilize the
nucleosome and facilitates the folding of nucleosomes into higher-order structures [183, 187]. In
addition to helping to compact and organize DNA such that it fits inside the nucleus, histone
proteins regulate the accessibility of DNA for different cellular processes, such as gene
transcription, DNA replication, and DNA repair [188]. Several mechanisms regulate these
processes, including the addition of posttranslational modifications to the histone proteins [188],
replacement of the canonical histones with histone variants [189], and potentially, proteolytic
cleavage of the histone proteins [190] (see Chapter 4 for additional discussion of histone
cleavage).
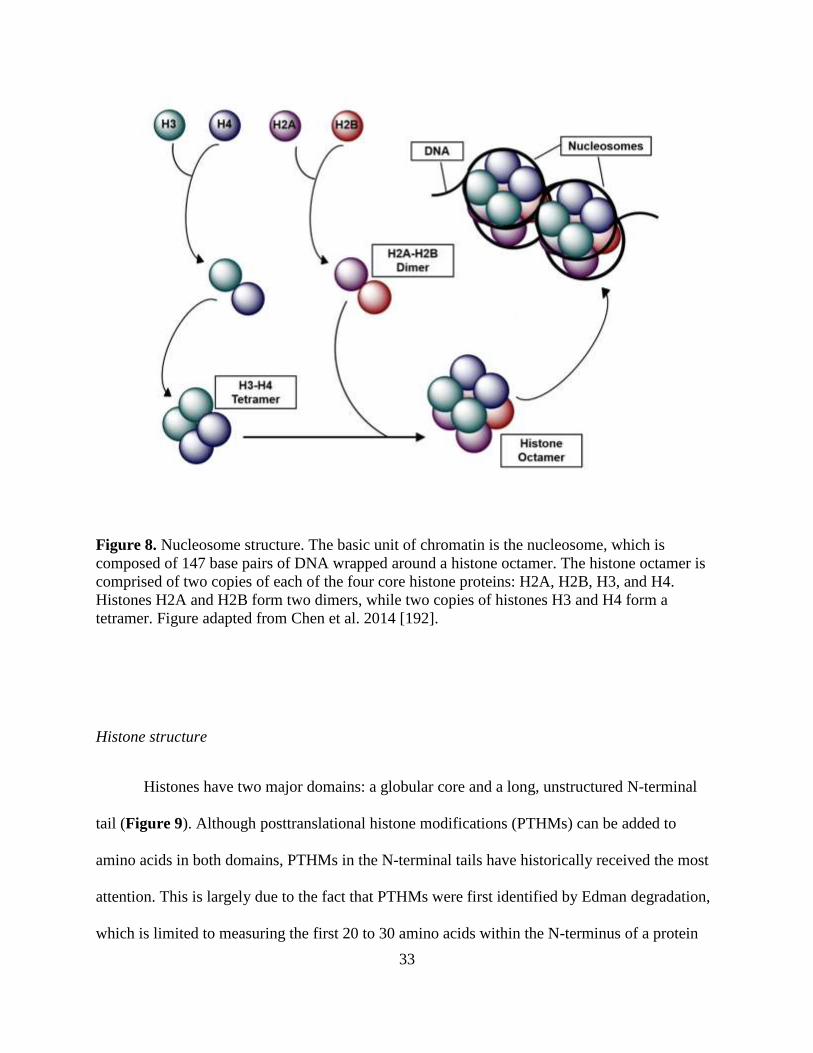
33
Figure 8. Nucleosome structure. The basic unit of chromatin is the nucleosome, which is
composed of 147 base pairs of DNA wrapped around a histone octamer. The histone octamer is
comprised of two copies of each of the four core histone proteins: H2A, H2B, H3, and H4.
Histones H2A and H2B form two dimers, while two copies of histones H3 and H4 form a
tetramer. Figure adapted from Chen et al. 2014 [192].
Histone structure
Histones have two major domains: a globular core and a long, unstructured N-terminal
tail (Figure 9). Although posttranslational histone modifications (PTHMs) can be added to
amino acids in both domains, PTHMs in the N-terminal tails have historically received the most
attention. This is largely due to the fact that PTHMs were first identified by Edman degradation,
which is limited to measuring the first 20 to 30 amino acids within the N-terminus of a protein
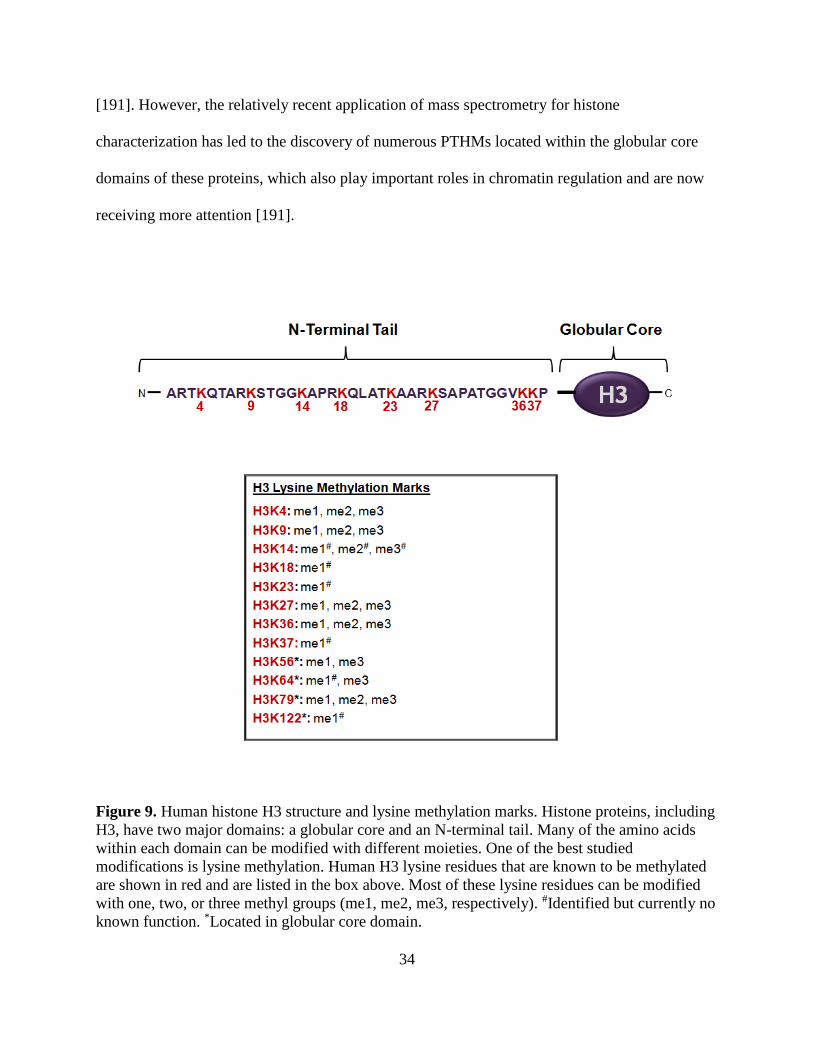
34
[191]. However, the relatively recent application of mass spectrometry for histone
characterization has led to the discovery of numerous PTHMs located within the globular core
domains of these proteins, which also play important roles in chromatin regulation and are now
receiving more attention [191].
Figure 9. Human histone H3 structure and lysine methylation marks. Histone proteins, including
H3, have two major domains: a globular core and an N-terminal tail. Many of the amino acids
within each domain can be modified with different moieties. One of the best studied
modifications is lysine methylation. Human H3 lysine residues that are known to be methylated
are shown in red and are listed in the box above. Most of these lysine residues can be modified
with one, two, or three methyl groups (me1, me2, me3, respectively). #Identified but currently no
known function. *Located in globular core domain.
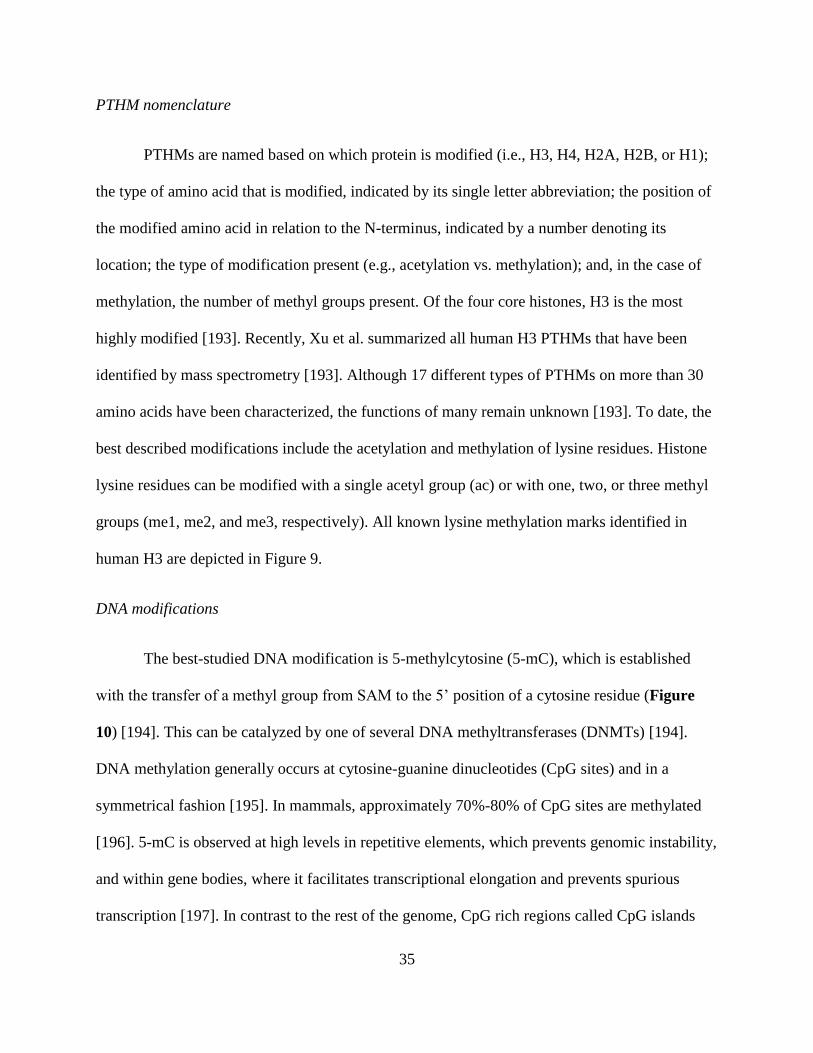
35
PTHM nomenclature
PTHMs are named based on which protein is modified (i.e., H3, H4, H2A, H2B, or H1);
the type of amino acid that is modified, indicated by its single letter abbreviation; the position of
the modified amino acid in relation to the N-terminus, indicated by a number denoting its
location; the type of modification present (e.g., acetylation vs. methylation); and, in the case of
methylation, the number of methyl groups present. Of the four core histones, H3 is the most
highly modified [193]. Recently, Xu et al. summarized all human H3 PTHMs that have been
identified by mass spectrometry [193]. Although 17 different types of PTHMs on more than 30
amino acids have been characterized, the functions of many remain unknown [193]. To date, the
best described modifications include the acetylation and methylation of lysine residues. Histone
lysine residues can be modified with a single acetyl group (ac) or with one, two, or three methyl
groups (me1, me2, and me3, respectively). All known lysine methylation marks identified in
human H3 are depicted in Figure 9.
DNA modifications
The best-studied DNA modification is 5-methylcytosine (5-mC), which is established
with the transfer of a methyl group from SAM to the 5’ position of a cytosine residue (Figure
10) [194]. This can be catalyzed by one of several DNA methyltransferases (DNMTs) [194].
DNA methylation generally occurs at cytosine-guanine dinucleotides (CpG sites) and in a
symmetrical fashion [195]. In mammals, approximately 70%-80% of CpG sites are methylated
[196]. 5-mC is observed at high levels in repetitive elements, which prevents genomic instability,
and within gene bodies, where it facilitates transcriptional elongation and prevents spurious
transcription [197]. In contrast to the rest of the genome, CpG rich regions called CpG islands
36
(CGI) tend to be unmethylated, allowing for active transcription of the associated genes [198].
Although definitions for CGIs vary, they are typically classified as regions of at least 200 base
pairs in length, with a G+C content >50% and an observed-to-expected CpG ratio >60% [198].
CGIs are present in more than 50% of genes [198]. Methylation in these regions may inhibit
transcription directly by obstructing transcription factor binding or indirectly by recruiting
chromatin modifying enzymes, which restructure the chromatin such that it is less accessible to
the transcriptional machinery [199]. Although gene-specific levels of DNA methylation are cell
type specific, genome-wide DNA methylation levels have been shown to be highly correlated
between purified cell types within blood and skin lineages (Pearson’s correlations typically
between 0.96 and 0.99) [200].
Figure 10. 5-methylcytosine and 5-hydroxymethylcytosine. Cytosine residues within DNA can
be modified with different moieties, such as methyl or hydroxymethyl groups (shown in red). 5-
methylcytosine (5-mC) is formed when a methyl group is transferred from SAM to the 5’
position of a cytosine residue in a reaction that can be catalyzed by one of three DNA
methyltransferases (DNMTs). 5-mC can then be oxidized to 5-hydroxymethylcytosine (5-hmC)
by one of several enzymes within the ten-eleven translocation methylcytosine dioxygenase
(TET) family. 5-hmC can be further oxidized to other cytosine derivatives, which can
subsequently be removed by the base excision repair pathway.
37
Although 5-mC is considered a stable mark, a global loss of 5-mC occurs with aging and
during cancer development [201-203]. Originally it was thought that DNA demethylation only
occurred through passive mechanisms. However, there is now evidence that 5-mC is also
actively demethylated through a pathway that depends on the oxidation of 5-mC to 5-
hydroxmethylcytosine (5-hmC) [204]. This is catalyzed by the ten-eleven translocation (Tet)
methylcytosine dioxygenase family of enzymes [204] (Figure 9). 5-hmC can be further oxidized
to other cytosine derivatives [204], which can be removed by the base excision repair pathway
(reviewed in [205]).
In most mammalian tissues, 5-hmC is much less abundant than 5-mC [195]. 5-hmC
levels range from 0.03% to 0.17% in most mouse tissues [206]. One exception to this is the
central nervous system, where normal 5-hmC levels may be as high as 0.70% [206]. In contrast,
global 5-mC levels are close to 4.30% in almost all tissues [206]. Although the biological roles
of 5-hmC are not fully understood, this mark has generally been associated with active genes and
may be important for epigenetic reprogramming [207].
Euchromatin and heterochromatin
PTHMs and DNA methylation work together to regulate chromatin, which can be
classified into two major regions: heterochromatin and euchromatin [208]. Heterochromatin is
condensed and is generally transcriptionally inactive, whereas euchromatin is open and mainly
contains transcriptionally active genes [208] (Figure 11). Each region is dominated by specific
epigenetic patterns (Figure 11). Heterochromatin is typically characterized by high levels of 5-
mC, low levels of 5-hmC, and repressive PTHMs, such as H4K20me3, H3K9me2/3, and
H3K27me3 [184, 188, 209, 210]. In contrast, euchromatin is typically characterized by low
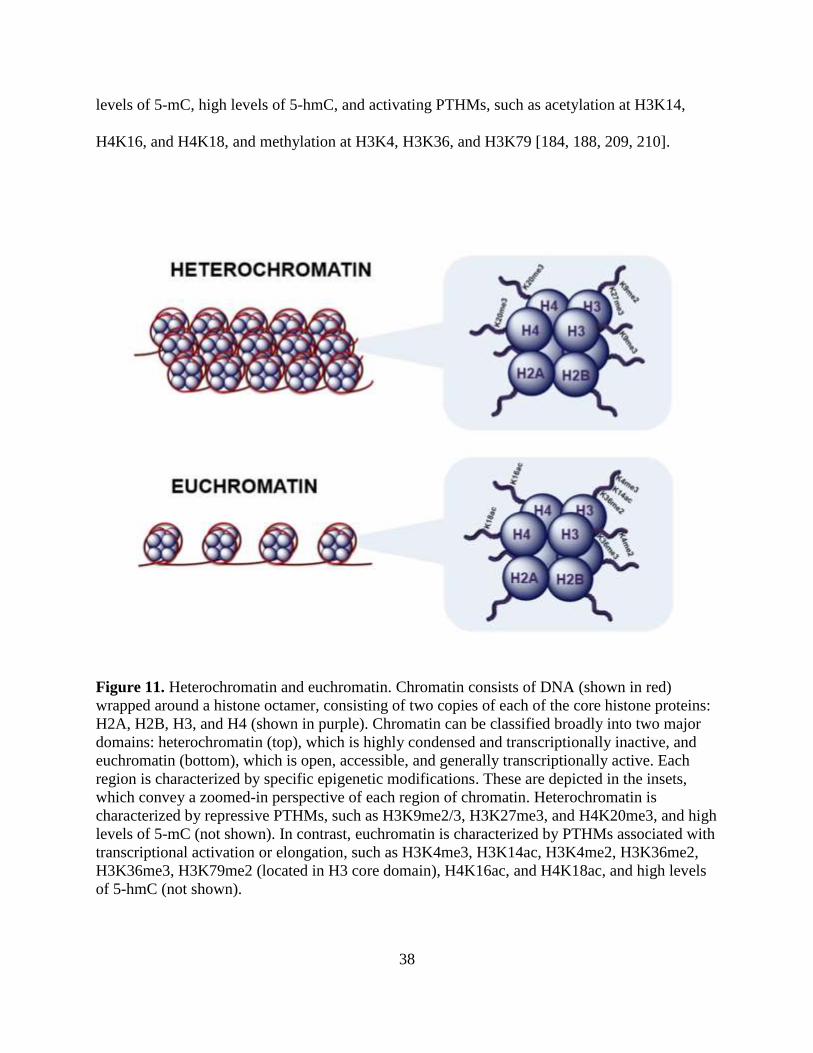
38
levels of 5-mC, high levels of 5-hmC, and activating PTHMs, such as acetylation at H3K14,
H4K16, and H4K18, and methylation at H3K4, H3K36, and H3K79 [184, 188, 209, 210].
Figure 11. Heterochromatin and euchromatin. Chromatin consists of DNA (shown in red)
wrapped around a histone octamer, consisting of two copies of each of the core histone proteins:
H2A, H2B, H3, and H4 (shown in purple). Chromatin can be classified broadly into two major
domains: heterochromatin (top), which is highly condensed and transcriptionally inactive, and
euchromatin (bottom), which is open, accessible, and generally transcriptionally active. Each
region is characterized by specific epigenetic modifications. These are depicted in the insets,
which convey a zoomed-in perspective of each region of chromatin. Heterochromatin is
characterized by repressive PTHMs, such as H3K9me2/3, H3K27me3, and H4K20me3, and high
levels of 5-mC (not shown). In contrast, euchromatin is characterized by PTHMs associated with
transcriptional activation or elongation, such as H3K4me3, H3K14ac, H3K4me2, H3K36me2,
H3K36me3, H3K79me2 (located in H3 core domain), H4K16ac, and H4K18ac, and high levels
of 5-hmC (not shown).
39
PTHMs can alter chromatin structure through both direct and indirect mechanisms. Since
acetyl and phosphate groups are negatively charged, the addition of these moieties to histones
directly impacts chromatin structure by reducing the affinity of the otherwise positively charged
histone proteins for the negatively charged DNA [188]. This leads to a more open chromatin
conformation [188]. However, PTHMs can also indirectly alter chromatin structure by recruiting
chromatin modifiers, which actively remodel the chromatin to a more open or closed
conformation [188].
Relationship between PTHMs and DNA methylation
The relationship between PTHMs and DNA methylation is dynamic, with each type of
modification influencing the other. PTHMs have been shown to direct de novo DNA methylation
patterns during development [211]. For example, methylation at H3K4 blocks the binding of
DNMT3L, a recruiter of de novo DNMTs [212]. In turn, DNA methylation can act as a template
for the re-establishment of PTHMs after DNA has been replicated [211]. However, PTHMs are
generally thought to be more labile than DNA methylation [211]. Therefore, PTHMs may be
more easily influenced by environmental exposures and may thus mediate environmentally-
induced alterations in DNA methylation.
Regulation of histone lysine methylation
Histone lysine methylation marks are regulated by histone lysine demethylases (KDMs)
and SAM-dependent lysine histone methyltransferases (KHMTs). KDMs can be classified into
two major groups. The majority fall under the Jumonji C family, which can remove methyl
groups from mono-, di-, and tri-methylated substrates (reviewed in [213]). In contrast, the LSD
family of demethylases can only demethylate mono- and di-methylated substrates [213]. KHMTs
40
are also classified into two major groups based on their catalytic domains. The majority of
KHMTs have a highly conserved Su(var)3-9, Enhancer of Zeste [E(Z)], and Trithorax (trx)
domain [214]. The only exception is DOT1L, which catalyzes the mono- di- and tri-methylation
of H3K79, but is structurally more similar to arginine methyltransferases [214].
2. Dysregulation of epigenetic modifications in human diseases
DNA methylation and human diseases
Distinct alterations in DNA methylation patterns have been observed in numerous
cancers and in several non-cancer health outcomes. Typically, a simultaneous loss of global, but
gain of gene-specific, DNA methylation is observed during cancer development (reviewed in
[215]). This can lead to genomic instability and the silencing of tumor suppressor genes,
respectively [215]. Pre-diagnostic measures of global and genome-wide leukocyte DNA
methylation patterns have been associated with increased risks for developing several adverse
outcomes, including breast [216, 217] and gastric [218] cancers in women, renal cell carcinoma
[219] and ischemic heart disease [220] in men, and arsenic-induced skin lesions [172].
PTHMs and human diseases
Experimental studies have demonstrated that PTHMs are critical for normal cellular
processes. For example, DNA repair mechanisms are regulated by several PTHMs, including
H3K36me3 [221-223], H3K36me2 [224], and H3K79me2 [214]. H3K79me2 is also required for
normal cell cycle control, cardiac development, and hematopoiesis (reviewed in [214]). The
dysregulation of these, and other, PTHMs has therefore been implicated in the development of
human diseases, particularly cancers. For example, an aberrant global increase in H3K36me2
41
leads to the overexpression of genes involved in oncogenic programming [225]. Similarly, a
global aberrant increase in H3K79me2 plays a key role in the development of MLL-fusion
leukemia [214]. In contrast, global reductions in H4K16ac and H4K20me3 are characteristic of
most cancer types [226]. Global PTHM patterns have also been used successfully to predict the
prognosis of many types of cancer, including lung, prostate, breast, gastric, esophageal, kidney,
liver, colorectal, and pancreatic cancers, as well as gliomas and hematological malignancies
([227-230] and reviewed in [231]).
There is also evidence that PTHMs are dysregulated in non-cancer outcomes. For
example, human NTDs are characterized by a global loss of H3K79me2 [232], and alterations in
H3 phosphorylation and acetylation have been observed in postmortem brain tissue samples from
individuals with Alzheimer’s disease [233] and neuropsychiatric disorders [233, 234].
Epigenetic therapeutics
Since epigenetic modifications are reversible, they are targets of many potential
therapeutics. Currently, two DNMT inhibitors and three histone deacetylase inhibitors are
approved by the Food and Drug Administration for the treatment of hematological malignancies
[183]. Several other epigenetic therapeutics are in preclinical or early clinical trials for the
treatment of both hematological malignancies and solid tumors, and many of these newer drugs
target KDMs and KHMTs [183]. However, it is important to note that in many cases the effects
of epigenetic therapies may be non-specific, as many histone-modifying enzymes also have non-
histone targets. One notable exception to this is DOT1L, which exclusively methylates H3K79
and is a promising therapeutic target for MLL-fusion leukemia [235, 236].
42
3. Arsenic and epigenetics
Arsenic and DNA methylation
Consistently, across in vitro and animal studies, arsenic has been shown to reduce global
levels of DNA methylation (reviewed in [123]). In contrast, positive associations between
arsenic exposure and global DNA methylation have been observed in human populations [237-
240]. There may be several reasons for these discrepancies: 1) experimental studies often use
very high doses of arsenic, which are not relevant to human exposures, 2) the durations of
exposure used in experimental studies are much shorter than the chronic exposures experienced
by most human populations, 3) in vitro studies typically employ cancer/transformed cell lines,
and 4) arsenic metabolism and susceptibility to arsenic toxicity differ substantially between
humans and animal models. Human populations are also heterogeneous with respect to
nutritional status, which can have profound influences on epigenetic marks (described in more
detail below). Additionally, there has been a historical bias in the use of male animals and male-
derived cell lines for biomedical research, despite important sex differences [241]. Therefore,
differences in nutritional status and sex are additional factors which may contribute to
inconsistencies across studies. Several population-based studies have begun to tease apart the
important interactions between arsenic, nutrition, and sex in relation to DNA methylation.
Interactions with nutritional status and sex
Folate nutritional status has been shown to modify the relationship between arsenic
exposure and global DNA methylation. One study in Bangladeshi adults observed a positive
association between arsenic exposure and global levels of leukocyte DNA methylation, but only
among those who were folate sufficient (plasma folate >9 nmol/L) [237]. Similarly, in a study of
43
elderly men, arsenic exposure was found to be positively associated with Alu methylation (an
indicator of global DNA methylation), but only in individuals with plasma folate concentrations
below the median [240]; importantly, since this study took place in the United States after FA
fortification occurred, individuals in the low folate stratum were comparable to the folate
sufficient stratum in Bangladesh. Thus, the findings from these two studies are consistent.
Sex may also modify the effect of arsenic on DNA methylation. In Bangladesh, prenatal
arsenic exposure has been positively associated with global levels of cord blood DNA
methylation among males, but negatively among females [242]. Another study in Bangladesh
observed that prenatal arsenic exposure was associated with altered cord blood DNA methylation
levels in both boys and girls, but the effects were more pronounced among boys [243]. The
majority of studies which have examined the relationship between arsenic exposure and global
DNA methylation have relied on bisulfite-conversion techniques, which cannot distinguish
between 5-mC and 5-hmC (reviewed in [244]). However, in a recent study, which was able to
discriminate between these two marks using an LC-MS/MS assay, arsenic exposure was found to
be positively associated with both 5-hmC and 5-mC among men, but was inversely associated
with 5-hmC and was not associated with 5-mC among women [245]. These findings were
observed in two separate study samples [245]. Thus, sex appears to modify the effects of arsenic
exposure on both 5-mC and 5-hmC.
Statistical power considerations often preclude the examination of three-way interactions
between sex, nutritional status, and arsenic exposure in human populations. However, one study
in mice observed that simultaneous exposure to arsenic and a methyl deficient diet (MDD)
reduced global levels of DNA methylation in the livers of male animals, but increased global

44
DNA methylation in the livers of female animals [246]. Therefore, arsenic may interact with
both nutrition and sex to influence DNA methylation patterns.
Arsenic and PTHMs
There is increasing evidence that arsenic also alters global levels of PTHMs. While the
majority of these studies have been conducted in vitro [247-265], there are a few supporting
studies in rodents [266, 267] and human populations [268, 269] (Table 1). Collectively, these
studies provide evidence that arsenic induces global dysregulation of many different PTHMs.
However, there are some discrepancies across studies, which may be attributed to differences in
the particular tissues/cell lines examined; the durations, doses, and forms of arsenic used; the sex
of the animals or cell lines utilized; and, potentially, cleavage of histone proteins, which can
affect the measurement of downstream PTHMs (See Chapter 4). Details of each study are
summarized in Table 1. Similar to studies on arsenic and DNA methylation, there is increasing
evidence that arsenic affects certain PTHMs differentially by sex [267, 269].
4. One-carbon metabolism and epigenetics
One-carbon metabolism and DNA methylation
DNMTs are SAM-dependent enzymes. Therefore, the majority of experimental studies
have demonstrated that global levels of DNA methylation are reduced when methyl donors or
related cofactors are limiting [270-282] and are increased as a result of methyl donor
supplementation [280, 283], although there have been a few exceptions [284-290]. Methyl
donors may also counteract epigenetic dysregulation caused by environmental toxicants. For
example, Dolinoy et al. observed that in utero exposure to bisphenol A reduces DNA

45
methylation, but this could be prevented by maternal supplementation with a combination of FA,
cobalamin, choline, and betaine [291].
Since the methyl deficient conditions used in most animal studies are generally not
relevant to human populations, epidemiological studies have been essential for understanding
how nutritional methyl donors may influence DNA methylation. Several observational studies
have observed inverse relationships between plasma Hcys or SAH concentrations and global
DNA methylation levels [293, 294]. Additionally, RBC folate has been positively correlated with
DNA methylation, although only in individuals with the T/T MTHFR SNP, which reduces
MTHFR activity [295, 296]; this SNP has also been independently associated with lower global
leukocyte DNA methylation levels [297]. Studies in adult women have also observed that global
DNA methylation levels are reduced in response to folate depletion [298, 299], and these effects
may be reversible [298]. Additionally, two randomized trials in adults have demonstrated that
FA supplementation, at doses ranging from 100 to 4000 µg/day, either alone or in combination
with cobalamin (500 µg/day), for durations ranging from 1 month to up to 2 years, alters DNA
methylation levels in white blood cells [300, 301].
In contrast with most of the findings for folate, one study observed that maternal choline
intake during early pregnancy was inversely associated with cord blood DNA methylation,
although this was only observed among boys [302]. Thus, other factors, such as sex and the
timing of methyl donor supplementation, may be important modifiers of these relationships.
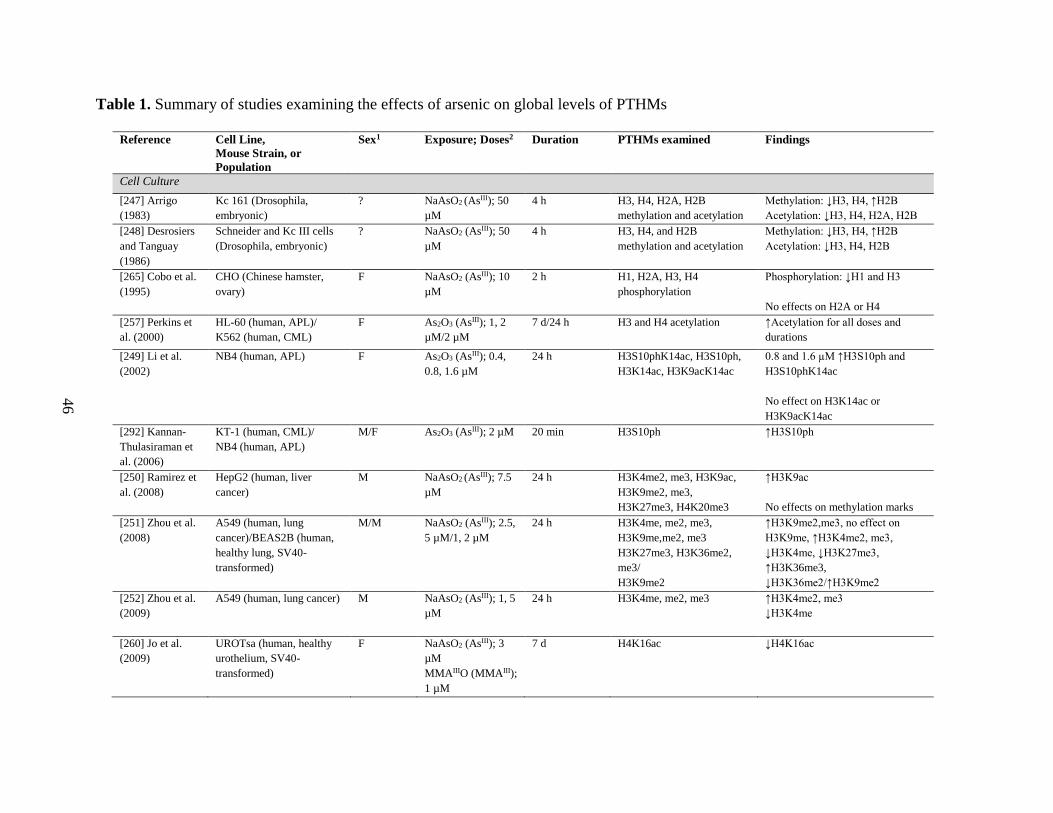
46
Table 1. Summary of studies examining the effects of arsenic on global levels of PTHMs
Reference Cell Line,
Mouse Strain, or
Population
Sex1 Exposure; Doses2 Duration PTHMs examined Findings
Cell Culture
[247] Arrigo
(1983)
Kc 161 (Drosophila,
embryonic)
? NaAsO2 (AsIII); 50
µM
4 h H3, H4, H2A, H2B
methylation and acetylation
Methylation: ↓H3, H4, ↑H2B
Acetylation: ↓H3, H4, H2A, H2B
[248] Desrosiers
and Tanguay
(1986)
Schneider and Kc III cells
(Drosophila, embryonic)
? NaAsO2 (AsIII); 50
µM
4 h H3, H4, and H2B
methylation and acetylation
Methylation: ↓H3, H4, ↑H2B
Acetylation: ↓H3, H4, H2B
[265] Cobo et al.
(1995)
CHO (Chinese hamster,
ovary)
F NaAsO2 (AsIII); 10
µM
2 h H1, H2A, H3, H4
phosphorylation
Phosphorylation: ↓H1 and H3
No effects on H2A or H4
[257] Perkins et
al. (2000)
HL-60 (human, APL)/
K562 (human, CML)
F As2O3 (AsIII); 1, 2
µM/2 µM
7 d/24 h H3 and H4 acetylation ↑Acetylation for all doses and
durations
[249] Li et al.
(2002)
NB4 (human, APL) F As2O3 (AsIII); 0.4,
0.8, 1.6 µM
24 h H3S10phK14ac, H3S10ph,
H3K14ac, H3K9acK14ac
0.8 and 1.6 µM ↑H3S10ph and
H3S10phK14ac
No effect on H3K14ac or
H3K9acK14ac
[292] Kannan-
Thulasiraman et
al. (2006)
KT-1 (human, CML)/
NB4 (human, APL)
M/F As2O3 (AsIII); 2 µM 20 min H3S10ph ↑H3S10ph
[250] Ramirez et
al. (2008)
HepG2 (human, liver
cancer)
M NaAsO2 (AsIII); 7.5
µM
24 h H3K4me2, me3, H3K9ac,
H3K9me2, me3,
H3K27me3, H4K20me3
↑H3K9ac
No effects on methylation marks
[251] Zhou et al.
(2008)
A549 (human, lung
cancer)/BEAS2B (human,
healthy lung, SV40-
transformed)
M/M NaAsO2 (AsIII); 2.5,
5 µM/1, 2 µM
24 h H3K4me, me2, me3,
H3K9me,me2, me3
H3K27me3, H3K36me2,
me3/
H3K9me2
↑H3K9me2,me3, no effect on
H3K9me, ↑H3K4me2, me3,
↓H3K4me, ↓H3K27me3,
↑H3K36me3,
↓H3K36me2/↑H3K9me2
[252] Zhou et al.
(2009)
A549 (human, lung cancer) M NaAsO2 (AsIII); 1, 5
µM
24 h H3K4me, me2, me3 ↑H3K4me2, me3
↓H3K4me
[260] Jo et al.
(2009)
UROTsa (human, healthy
urothelium, SV40-
transformed)
F NaAsO2 (AsIII); 3
µM
MMAIIIO (MMAIII);
1 µM
7 d H4K16ac ↓H4K16ac
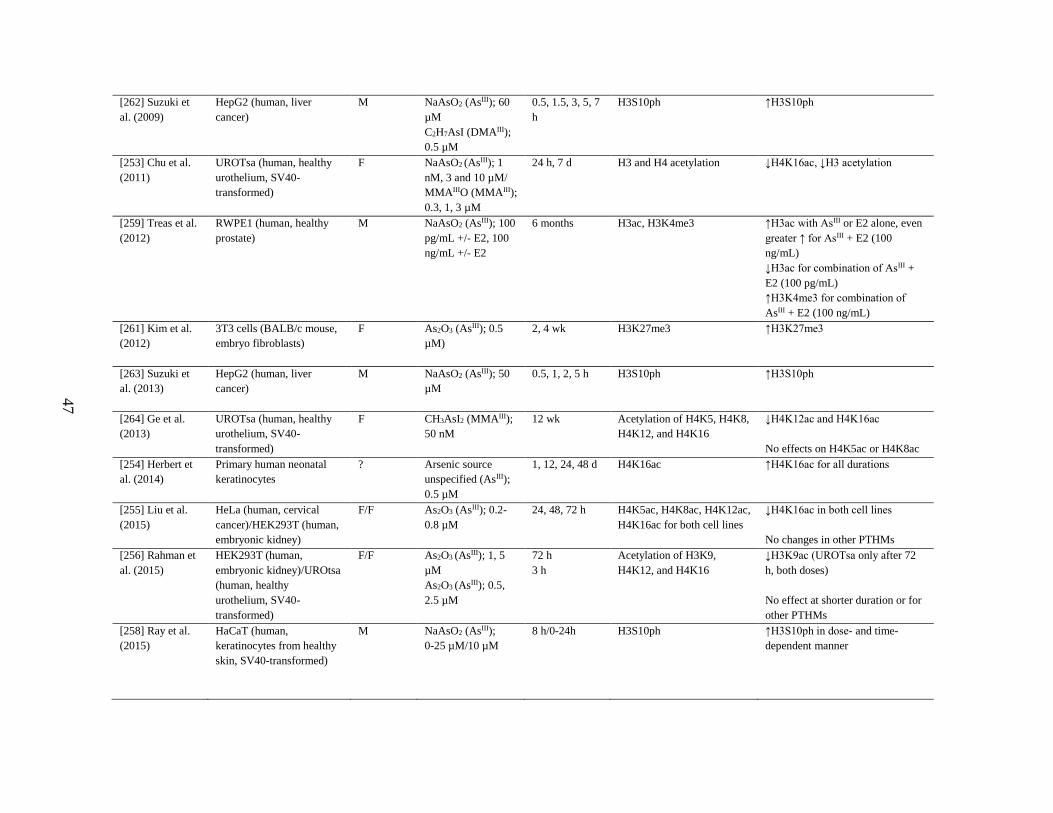
47
[262] Suzuki et
al. (2009)
HepG2 (human, liver
cancer)
M NaAsO2 (AsIII); 60
µM
C2H7AsI (DMAIII);
0.5 µM
0.5, 1.5, 3, 5, 7
h
H3S10ph ↑H3S10ph
[253] Chu et al.
(2011)
UROTsa (human, healthy
urothelium, SV40-
transformed)
F NaAsO2 (AsIII); 1
nM, 3 and 10 µM/
MMAIIIO (MMAIII);
0.3, 1, 3 µM
24 h, 7 d H3 and H4 acetylation ↓H4K16ac, ↓H3 acetylation
[259] Treas et al.
(2012)
RWPE1 (human, healthy
prostate)
M NaAsO2 (AsIII); 100
pg/mL +/- E2, 100
ng/mL +/- E2
6 months H3ac, H3K4me3 ↑H3ac with AsIII or E2 alone, even
greater ↑ for AsIII + E2 (100
ng/mL)
↓H3ac for combination of AsIII +
E2 (100 pg/mL)
↑H3K4me3 for combination of
AsIII + E2 (100 ng/mL)
[261] Kim et al.
(2012)
3T3 cells (BALB/c mouse,
embryo fibroblasts)
F As2O3 (AsIII); 0.5
µM)
2, 4 wk H3K27me3 ↑H3K27me3
[263] Suzuki et
al. (2013)
HepG2 (human, liver
cancer)
M NaAsO2 (AsIII); 50
µM
0.5, 1, 2, 5 h H3S10ph ↑H3S10ph
[264] Ge et al.
(2013)
UROTsa (human, healthy
urothelium, SV40-
transformed)
F CH3AsI2 (MMAIII);
50 nM
12 wk Acetylation of H4K5, H4K8,
H4K12, and H4K16
↓H4K12ac and H4K16ac
No effects on H4K5ac or H4K8ac
[254] Herbert et
al. (2014)
Primary human neonatal
keratinocytes
? Arsenic source
unspecified (AsIII);
0.5 µM
1, 12, 24, 48 d H4K16ac ↑H4K16ac for all durations
[255] Liu et al.
(2015)
HeLa (human, cervical
cancer)/HEK293T (human,
embryonic kidney)
F/F As2O3 (AsIII); 0.2-
0.8 µM
24, 48, 72 h H4K5ac, H4K8ac, H4K12ac,
H4K16ac for both cell lines
↓H4K16ac in both cell lines
No changes in other PTHMs
[256] Rahman et
al. (2015)
HEK293T (human,
embryonic kidney)/UROtsa
(human, healthy
urothelium, SV40-
transformed)
F/F As2O3 (AsIII); 1, 5
µM
As2O3 (AsIII); 0.5,
2.5 µM
72 h
3 h
Acetylation of H3K9,
H4K12, and H4K16
↓H3K9ac (UROTsa only after 72
h, both doses)
No effect at shorter duration or for
other PTHMs
[258] Ray et al.
(2015)
HaCaT (human,
keratinocytes from healthy
skin, SV40-transformed)
M NaAsO2 (AsIII);
0-25 µM/10 µM
8 h/0-24h H3S10ph ↑H3S10ph in dose- and time-
dependent manner

48
Rodent
[266] Cronican et
al. 2013
C57BL6/J (brain, cortex
and hippocampus)
Both,
combined
NaAsO2 (AsIII); 100
µg/L
(1 wk before
conception
until birth)
H3K9ac ↓H3K9ac
[267] Tyler et al.
2015
C57BL/6 (brain, dentate
gyrus and frontal cortex)
Both,
separate
Na3AsO4 (AsV);
50 µg/L
(10 d prior to
pregnancy –
weaning)
H3K4me3, H3K9ac,
H3K9me3
M dentate gyrus: ↑H3K4me3 and
↑H3K9ac
F dentate gyrus: ↓H3K4me3 and
↓H3K9ac
M frontal cortex: ↑H3K4me3 and
↓H3K9ac
F frontal cortex: No change in
H3K4me3 or H3K9ac
No effects on H3K9me3 in either
brain region in either sex
Human
[268] Cantone et
al. 2011
Adults, occupationally
exposed via inhalation, Italy
(PBLs) (n = 63)
M Arsenic in
particulate matter
(0.01 – 0.31 µg/m3)
Chronic (y) H3K4me2, H3K9ac ↑H3K4me2
[269] Chervona
et al. 2012
Adults, exposed via
contaminated drinking
water, Bangladesh
(PBMCs) (n = 40, 50%
male)
Both,
separate
Water As (primarily
AsIII) (50 – 500
µg/L)
Chronic (y) H3K4me3, H3K9ac,
H3K9me2, H3K18ac,
H3K27ac, H3K27me3
Whole sample: ↑H3K9me2,
↓H3K9ac.
M: ↓H3K4me3 and H3K27me3.
↑H3K27ac.
F: ↑H3K4me3 and H3K27me3.
↓H3K27ac
Abbreviations used: AsIII, arsenite; AsV, arsenate; As2O3, arsenic trioxide; APL, acute promyelocytic leukemia; C2H7AsI, dimethylarsine iodide; CH3AsI2, diiodomethylarsine; CML, chronic
myelogenous leukemia; d, days; E2, estradiol; F, female; h, hours; M, male; NaAsO2, sodium arsenite; Na3AsO4; sodium arsenate; PBLs, peripheral blood leukocytes; PBMCs, peripheral blood
mononuclear cells; PTHM, posttranslational histone modification; wk, week; y, years
1With respect to cell culture studies, sex refers to the biological sex of the animal or patient from which the cell line was derived 2Units are listed as they were reported in the original reference.
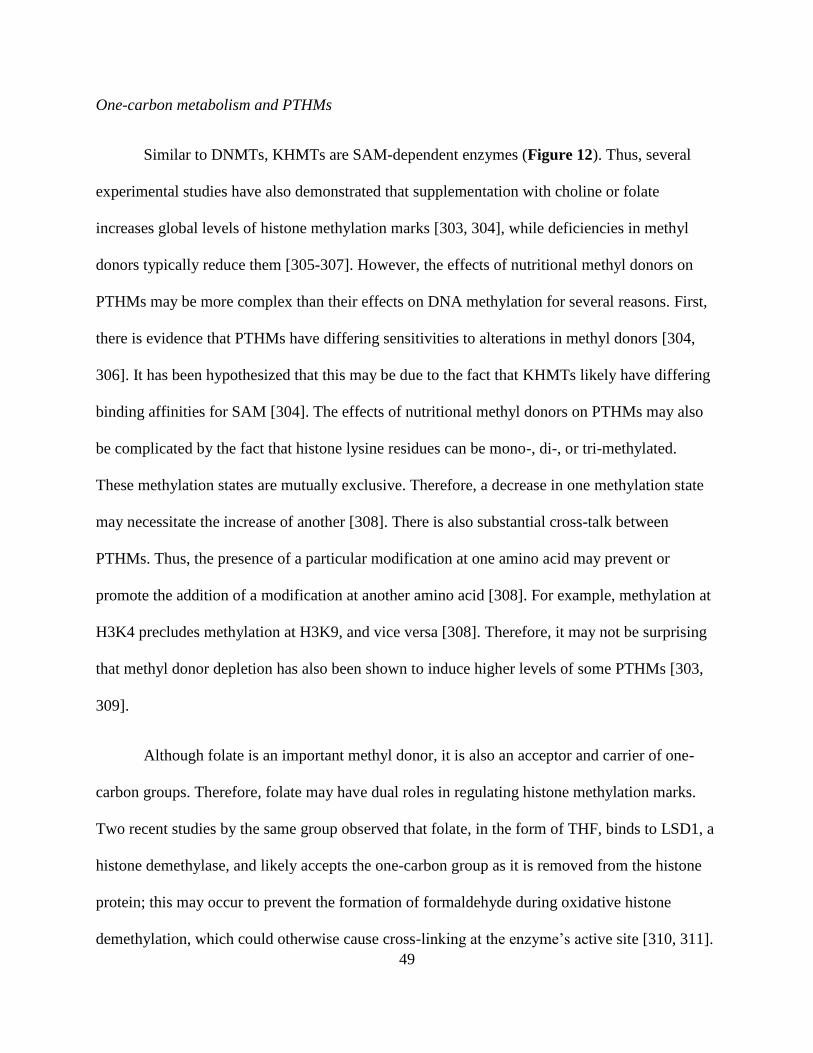
49
One-carbon metabolism and PTHMs
Similar to DNMTs, KHMTs are SAM-dependent enzymes (Figure 12). Thus, several
experimental studies have also demonstrated that supplementation with choline or folate
increases global levels of histone methylation marks [303, 304], while deficiencies in methyl
donors typically reduce them [305-307]. However, the effects of nutritional methyl donors on
PTHMs may be more complex than their effects on DNA methylation for several reasons. First,
there is evidence that PTHMs have differing sensitivities to alterations in methyl donors [304,
306]. It has been hypothesized that this may be due to the fact that KHMTs likely have differing
binding affinities for SAM [304]. The effects of nutritional methyl donors on PTHMs may also
be complicated by the fact that histone lysine residues can be mono-, di-, or tri-methylated.
These methylation states are mutually exclusive. Therefore, a decrease in one methylation state
may necessitate the increase of another [308]. There is also substantial cross-talk between
PTHMs. Thus, the presence of a particular modification at one amino acid may prevent or
promote the addition of a modification at another amino acid [308]. For example, methylation at
H3K4 precludes methylation at H3K9, and vice versa [308]. Therefore, it may not be surprising
that methyl donor depletion has also been shown to induce higher levels of some PTHMs [303,
309].
Although folate is an important methyl donor, it is also an acceptor and carrier of one-
carbon groups. Therefore, folate may have dual roles in regulating histone methylation marks.
Two recent studies by the same group observed that folate, in the form of THF, binds to LSD1, a
histone demethylase, and likely accepts the one-carbon group as it is removed from the histone
protein; this may occur to prevent the formation of formaldehyde during oxidative histone
demethylation, which could otherwise cause cross-linking at the enzyme’s active site [310, 311].
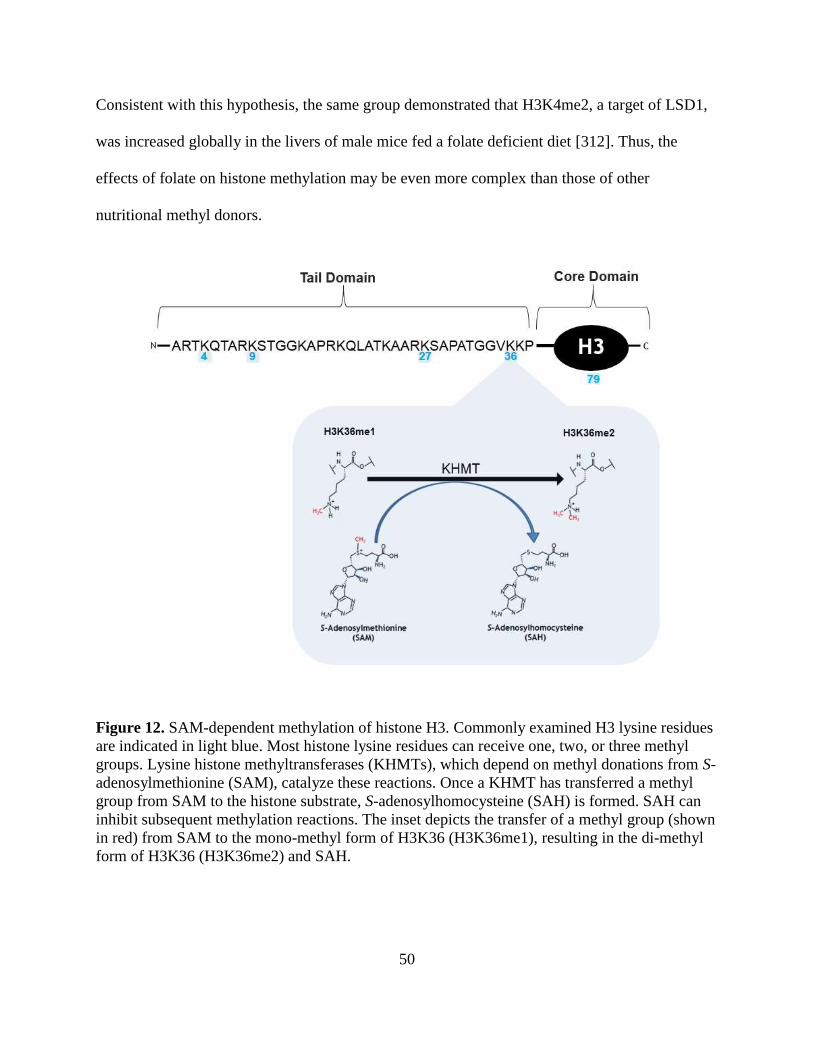
50
Consistent with this hypothesis, the same group demonstrated that H3K4me2, a target of LSD1,
was increased globally in the livers of male mice fed a folate deficient diet [312]. Thus, the
effects of folate on histone methylation may be even more complex than those of other
nutritional methyl donors.
Figure 12. SAM-dependent methylation of histone H3. Commonly examined H3 lysine residues
are indicated in light blue. Most histone lysine residues can receive one, two, or three methyl
groups. Lysine histone methyltransferases (KHMTs), which depend on methyl donations from S-
adenosylmethionine (SAM), catalyze these reactions. Once a KHMT has transferred a methyl
group from SAM to the histone substrate, S-adenosylhomocysteine (SAH) is formed. SAH can
inhibit subsequent methylation reactions. The inset depicts the transfer of a methyl group (shown
in red) from SAM to the mono-methyl form of H3K36 (H3K36me1), resulting in the di-methyl
form of H3K36 (H3K36me2) and SAH.
51
The effects of OCM indices on PTHMs have been largely understudied in human
populations. One very small case-control study in China (n = 8) characterized global PTHM
patterns in human NTDs using mass spectrometry, and observed that H3K79me2 levels were
much lower in fetal brain tissue from NTD cases compared with healthy controls matched on
gestational age and sex [232]. Since folate deficiency is an established risk factor for NTDs,
these findings provide indirect evidence that folate deficiency reduces global H3K79me2 levels
[232]. This group also confirmed that folate deficient conditions reduce H3K79me2 levels in
vitro [232]. A second study in the United States by Piyathilake et al. examined the influence of
FA fortification on global H3K9me2 levels in women with cervical intraepithelial neoplasia
(CIN) [313]. They compared H3K9me2 levels in CIN tissue collected from participants recruited
pre- vs. post-FA fortification, and found that H3K9me2 levels were higher in the tissue collected
post-fortification, after adjusting for age and race. Piyathilake et al. therefore concluded that FA
increased global H3K9me2 levels [313]. However, this study had several important limitations:
1) there were likely other factors which changed during the FA fortification period, or which
differed between the two groups of participants, which may have confounded the relationship
between FA fortification and H3K9me2, 2) CIN tissue collected pre-FA fortification had been
stored for a longer duration than CIN tissue collected post-fortification, which could potentially
affect H3K9me2 measures differentially by group, and 3) individual-level folate measures were
not available for the participants, thus it is unclear if folate status actually differed between the
two groups. Therefore, while there is some preliminary evidence from human populations that
folate influences PTHMs, additional epidemiological studies are needed.

52
D. Summary and rationale
As outlined in sections B and C, there is growing evidence that nutrients involved in the
OCM pathway may influence arsenic toxicity through effects on both arsenic metabolism and
epigenetics. Since the metabolism of arsenic involves two sequential SAM-dependent
methylation reactions, nutrients involved in the OCM pathway, particularly folate, facilitate the
methylation and urinary excretion of arsenic. However, the relationships between SAM and
arsenic methylation, and the potential modifying effects of nutrients in the OCM pathway, have
not been evaluated in human populations. In experimental models, SAM has also been shown to
influence epigenetic modifications that are dependent on methylation reactions, such as DNA
and histone methylation. These modifications are dysregulated in adverse health outcomes, such
as cancers, and are altered by arsenic and nutritional methyl donors in experimental settings.
However, given important differences between experimental models and human populations,
there is a need for supporting epidemiological studies. In particular, there is a dearth of
information on the influences of arsenic and OCM indices on PTHMs. Since susceptibility to
arsenic toxicity differs between men and women, and since previous studies have observed that
arsenic influences epigenetic modifications in a sex-dependent manner, a better understanding of
potential differences by sex is also critical. The goal of this dissertation is to address these gaps
in the literature, using data from three epidemiological studies of arsenic-exposed Bangladeshi
men and women.
53
CHAPTER TWO REFERENCES:
1. Tibbetts AS and Appling DR. Compartmentalization of mammalian folate-mediated one-
carbon metabolism. Annu Rev Nutr. 2010;30:57-81.
2. Field MS, Kamynina E, Agunloye OC, Liebenthal RP, Lamarre SG, Brosnan ME, et al.
Nuclear enrichment of folate cofactors and methylenetetrahydrofolate dehydrogenase 1
(MTHFD1) protect de novo thymidylate biosynthesis during folate deficiency. J Biol
Chem. 2014;289(43):29642-50.
3. Fox JT and Stover PJ. Folate‐Mediated One‐Carbon Metabolism. Vitam Horm.
2008;79:1-44.
4. Blount BC, Mack MM, Wehr CM, MacGregor JT, Hiatt JA, Wang G, et al. Folate
deficiency causes uracil misincorporation into human DNA and chromosome breakage:
implications for cancer and neuronal damage. Proc Natl Acad Sci U S A.
1997;94(7):3290-3295.
5. Stover PJ. One-carbon metabolism–genome interactions in folate-associated pathologies.
J Nutr. 2009;139(12):2402-2405.
6. Alexiou M and Leese HJ. Purine utilisation, de novo synthesis and degradation in mouse
preimplantation embryos. Development. 1992;114(1):185-92.
7. An S, Kumar R, Sheets ED, Benkovic SJ. Reversible compartmentalization of de novo
purine biosynthetic complexes in living cells. Science. 2008;320(5872):103-106.
8. Carmel R. and Jacobson D. Homocysteine in Health and Disease. Cambridge, UK:
Cambridge University Press, 2001.
9. Clarke SG and Banfield K (2001). S-adenosylmethionine-dependent methyltransferases,
in Homocysteine in Health and Disease (p. 63-78). Carmel R and Jacobson D (Eds.).
Cambridge, UK: Cambridge University Press.
10. Frey PA, Hegeman AD, and Ruzicka FJ. The radical SAM superfamily. Crit Rev
Biochem Mol Biol. 2008;43(1):63-88.
11. Chiang PK and Cantoni GL. Perturbation of biochemical transmethylations by 3-
deazaadenosine in vivo. Biochem Pharmacol. 1979;28(12):1897-1902.
12. Caudill MA, Wang JC, Melnyk S, Pogribny IP, Jernigan S, Collins MD, et al.
Intracellular S-adenosylhomocysteine concentrations predict global DNA
hypomethylation in tissues of methyl-deficient cystathionine beta-synthase heterozygous
mice. J Nutr. 2001;131(11):2811-8.
54
13. Cantoni GL. The role of S-adenosylhomocysteine in the biological utilization of S-
adenosylmethionine. Prog Clin Biol Res. 1985;198:47.
14. Hoffman DR, Marion DW, Cornatzer WE, Duerre JA. S-Adenosylmethionine and S-
adenosylhomocystein metabolism in isolated rat liver. Effects of L-methionine, L-
homocystein, and adenosine. J Biol Chem. 1980;255(22):10822-10827.
15. Kotb M and Geller AM. Methionine adenosyltransferase: structure and function.
Pharmacol Ther. 1993;59(2):125-143.
16. Mato JM, Alvarez L, Ortiz P, Pajares MA. S-adenosylmethionine synthesis: molecular
mechanisms and clinical implications. Pharmacol Ther. 1997;73(3):265-280.
17. Selhub J. Homocysteine metabolism. Annu Rev Nutr. 1999;19(1):217-246.
18. Chen LH, Liu ML, Hwang HY, Chen LS, Korenberg J, Shane B. Human methionine
synthase. cDNA cloning, gene localization, and expression. J Biol
Chem.1997;272(6):3628-34.
19. Delgado-Reyes CV, Wallig MA, Garrow TA. Immunohistochemical detection of
betaine–homocysteine S-methyltransferase in human, pig, and rat liver and kidney. Arch
Biochem Biophys. 2001;393(1):184-186.
20. Schwahn BC, Chen Z, Laryea MD, Wendel U, Lussier-Cacan S, Genest J Jr, et al.
Homocysteine-betaine interactions in a murine model of 5,10-methylenetetrahydrofolate
reductase deficiency. FASEB J. 2003;17(3):512-514.
21. Shane B. Folate and vitamin B12 metabolism: overview and interaction with riboflavin,
vitamin B6, and polymorphisms. Food Nutr Bull. 2008;29(2 Suppl):5-16.
22. Finkelstein JD and Martin JJ. Methionine metabolism in mammals. Distribution of
homocysteine between competing pathways. J Biol Chem. 1984;259(15):9508-9513.
23. De La Haba G and Cantoni GL. The enzymatic synthesis of S-adenosyl-L-homocysteine
from adenosine and homocysteine. J Biol Chem. 1959;234(3):603-608.
24. Visentin M, Diop-Bove N, Zhao R, Goldman ID. The intestinal absorption of folates.
Annu Rev Physiol. 2014;76:251.
25. Office of Dietary Supplements. Folate Dietary Supplement Fact Sheet. 2012. National
Institutes of Health: http://ods.od.nih.gov/factsheets/Folate-HealthProfessional/#h2.
26. McDowell MA, Lacher DA, Pfeiffer CM, Mulinare J, Picciano MF, Rader JI, et al. Blood
folate levels: the latest NHANES results. NCHS Data Brief. 2008;6:1-8.
55
27. Christenson RH, Dent GA, Tuszynski A. Two radioassays for serum vitamin B12 and
folate determination compared in a reference interval study. Clin Chem.
1985;31(8):1358-1360.
28. Gamble MV, Ahsan H, Liu X, Factor-Litvak P, Ilievski V, Slavkovich V, et al. Folate
and cobalamin deficiencies and hyperhomocysteinemia in Bangladesh. Am J Clin Nutr.
2005;81(6):1372-7.
29. Israels MC and Wilkinson JF. Neurological Complications in Pernicious Anaemia
Treated with Folic Acid. Br Med J.1949;2(4636):1072.
30. Klee GG. Cobalamin and folate evaluation: measurement of methylmalonic acid and
homocysteine vs vitamin B(12) and folate. Clin Chem. 2000;46(8 Pt 2):1277-83.
31. Office of Dietary Supplements. Vitamin B12 Dietary Supplement Fact Sheet. 2011.
National Institutes of Health: http://ods.od.nih.gov/factsheets/VitaminB12-
HealthProfessional/.
32. Refsum H and Smith AD. Are we ready for mandatory fortification with vitamin B-12?
Am J Clin Nutr. 2008;88(2):253-254.
33. Allen LH. How common is vitamin B-12 deficiency? Am J Clin Nutr. 2009;89(2):693S-
696S.
34. Bønaa KH, Njølstad I, Ueland PM, Schirmer H, Tverdal A, Steigen T, et al.
Homocysteine lowering and cardiovascular events after acute myocardial infarction. N
Engl J Med. 2006;354(15):1578-1588.
35. Lonn E, Yusuf S, Arnold MJ, Sheridan P, Pogue J, Micks M, et al. Homocysteine
lowering with folic acid and B vitamins in vascular disease. N Engl J Med.
2006;354(15):1567-1577.
36. Cooper BA and Castle WB. Sequential mechanisms in the enhanced absorption of
vitamin B12 by intrinsic factor in the rat. J Clin Invest. 1960;39(1):199.
37. Kittang E and Schjønsby H. Effect of gastric anacidity on the release of cobalamins from
food and their subsequent binding to R-protein. Scand J Gastroenterol. 1987;22(9):1031-
1037.
38. Allen RH, Seetharam B, Podell E, Alpers DH. Effect of Proteolytic Enzymes on the
Binding of Cobalamin to R Protein and Intrinsic Factor: In vitro evidence that a failure to
partially degraded protein is responsible for cobalamin malabsorption in pancreatic
insufficiency. J Clin Invest. 1978;61(1):47.
56
39. Moestrup SK and Verroust PJ. Megalin- and cubilin-mediated endocytosis of protein-
bound vitamins, lipids, and hormones in polarized epithelia. Annu Rev Nutr. 2001;21:
407-28.
40. Rothenberg SP, Weiss JP, Cotter R. Formation of transcobalamin II--vitamin B12
complex by guinea-pig ileal mucosa in organ culture after in vivo incubation with
intrinsic factor--vitamin B12. Br J Haematol. 1978;40(3):401-14.
41. Quadros EV, Regec AL, Khan KM, Quadros E, Rothenberg SP. Transcobalamin II
synthesized in the intestinal villi facilitates transfer of cobalamin to the portal blood. Am
J Physiol. 1999;277(1 Pt 1):G161-6.
42. Koury MJ and Ponka P. New insights into erythropoiesis: the roles of folate, vitamin
B12, and iron. Annu Rev Nutr. 2004;24:105-31.
43. Craig SA. Betaine in human nutrition. Am J Clin Nutr. 2004;80(3):539-549.
44. Alfthan G, Tapani K, Nissinen K, Saarela J, Aro A. The effect of low doses of betaine on
plasma homocysteine in healthy volunteers. Br J Nutr, 2004;92(4):665-9.
45. Olthof MR, van Vliet T, Boelsma E, Verhoef P. Low dose betaine supplementation leads
to immediate and long term lowering of plasma homocysteine in healthy men and
women. J Nutr. 2003;133(12):4135-8.
46. Steenge GR, Verhoef P, Katan MB. Betaine supplementation lowers plasma
homocysteine in healthy men and women. J Nutr, 2003;133(5):1291-5.
47. Schwab U, Törrönen A, Toppinen L, Alfthan G, Saarinen M, Aro A, et al. Betaine
supplementation decreases plasma homocysteine concentrations but does not affect body
weight, body composition, or resting energy expenditure in human subjects. Am J Clin
Nutr. 2002;76(5):961-7.
48. Brouwer IA, Verhoef P, Urgert R. Betaine supplementation and plasma homocysteine in
healthy volunteers. Arch Intern Med. 2000;160(16):2546-2546.
49. Holm PI, Ueland PM, Vollset SE, Midttun Ø, Blom HJ, Keijzer MB, et al. Betaine and
folate status as cooperative determinants of plasma homocysteine in humans. Arterioscler
Thromb Vasc Biol. 2005;25(2):379-385.
50. Kettunen H, Tiihonen K, Peuranen S, Saarinen MT, Remus JC. Dietary betaine
accumulates in the liver and intestinal tissue and stabilizes the intestinal epithelial
structure in healthy and coccidia-infected broiler chicks. Comp Biochem Physiol A Mol
Integr Physiol. 2001;130(4):59-69.
57
51. Kettunen H, Peuranen S, Tiihonen K, Saarinen M. Intestinal uptake of betaine in vitro
and the distribution of methyl groups from betaine, choline, and methionine in the body
of broiler chicks. Comp Biochem Physiol A Mol Integr Physiol. 2001;128(2):269-78.
52. Frontiera MS, Stabler SP, Kolhouse JF, Allen RH. Regulation of methionine metabolism:
effects of nitrous oxide and excess dietary methionine. J Nutr Biochem. 1994;5(1):28-38.
53. Schwahn BC, Hafner D, Hohlfield T, Balkenhol N, Laryea MD, Wendel U.
Pharmacokinetics of oral betaine in healthy subjects and patients with homocystinuria. Br
J Clin Pharmacol. 2003;55(1):6-13.
54. Peters‐Regehr T, Bode JG, Kubitz R, Häussinger D. Organic osmolyte transport in
quiescent and activated rat hepatic stellate cells (Ito cells). Hepatology. 1999;29(1):173-
180.
55. Yamauchi A, Uchida S, Kwon HM, Preston AS, Robey RB, Garcia-Perez A, et al.
Cloning of a Na(+)- and Cl(-)-dependent betaine transporter that is regulated by
hypertonicity. J Biol Chem. 1992;267(1):649-52.
56. Takenaka M, Bagnasco SM, Preston AS, Uchida S, Yamauchi A, Kwon HM, et al. The
canine betaine gamma-amino-n-butyric acid transporter gene: diverse mRNA isoforms
are regulated by hypertonicity and are expressed in a tissue-specific manner. Proc Natl
Acad Sci U S A. 1995;92(4):1072-6.
57. Bianchi G and Azzone GF. Oxidation of choline in rat liver mitrochondria. J Biol Chem.
1964;239:3947-55.
58. Mann PJ, Woodward HE, Quastel JH. Hepatic oxidation of choline and arsenocholine.
Biochem J. 1938;32(6):1024-32.
59. O'Donoghue N, Sweeney T, Donagh R, Clarke KJ, Porter RK. Control of choline
oxidation in rat kidney mitochondria. Biochim Biophys Acta. 2009;1787(9):1135-9.
60. Wurtman R, Cansev M, Ulus I (2010). Choline and its products acetylcholine and
phosphatidylcholine, in Handbook of Neurochemistry and Molecular Neurobiology (p.
443-501). Lajtha A, Tettamanti G, Goracci G (Eds.). New York, New York: Springer.
61. Zeisel SH and da Costa KA. Choline: an essential nutrient for public health. Nutr Rev.
2009;67(11):615-23.
62. Sundler R and Akesson B. Regulation of phospholipid biosynthesis in isolated rat
hepatocytes. Effect of different substrates. J Biol Chem. 1975;250(9):3359-67.
63. Vance JE and Vance DE. Phospholipid biosynthesis in mammalian cells. Biochem Cell
Biol. 2004;82(1):113-28.
58
64. Bremer J and Greenberg DM. Biosynthesis of choline in vitro. Biochim Biophys Acta.
1960;37(1):173-175.
65. Blusztajn JK, Zeisel SH, Wurtman RJ. Synthesis of lecithin (phosphatidylcholine) from
phosphatidylethanolamine in bovine brain. Brain Res. 1979;179(2):319-327.
66. Crews FT, Hirata F, Axelrod J. Identification and properties of methyltransferases that
synthesize phosphatidylcholine in rat brain synaptosomes. J Neurochem.
1980;34(6):1491-1498.
67. Teng Y-W and Ziesel SH (2011). Chapter 14: Choline in Health and Disease, in Vitamins
in the Prevention of Human Diseases. Herrmann W and Obeid R. (Eds.). New York, New
York: De Gruyter Verlag.
68. Centers for Disease Control. National Report on Biochemical Indicators of Diet and
Nutrition in the U.S. Population 1999-2002. June 12, 2012 [Accessed 07/17/2015].
69. Brattström L and Wilcken DE. Homocysteine and cardiovascular disease: cause or
effect? Am J Clin Nutr. 2000;72(2):315-323.
70. Diaz-Arrastia R. Homocysteine and neurologic disease. Arch Neurol. 2000;57(10):1422-
7.
71. Finkelstein JD. The metabolism of homocysteine: pathways and regulation. Eur J Pediatr.
1998;157 (Suppl 2):S40-4.
72. Lu SC. Glutathione synthesis. Biochim Biophys Acta. 2013;1830(5):3143-3153.
73. Lu SC. Regulation of glutathione synthesis. Mol Aspects Med. 2009;30(1):42-59.
74. Bagchi S. Arsenic threat reaching global dimensions. CMAJ. 2007;177(11):1344-5.
75. World Health Organization. World Health Organization Guidelines for drinking-water
quality: Incorporating first and second addenda to third edition. 2008.
http://www.who.int/water_sanitation_health/dwq/gdwq3/en/index.html [Accessed
02/09/15].
76. Kinniburgh DG, Smedley PL, Davies J, Milne CJ, Gaus I, Trafford JM, et al (2001). The
Scale and Causes of Groundwater Arsenic Problem in Bangladesh, in: Arsenic in
Groundwater (p. 211-257). Welch AH and Stollenwerk KG (Eds.). Boston, MA: Kluwer
Academic.
77. National Research Council. Critical Aspects of EPA's IRIS Assessment of Inorganic
Arsenic. National Research Council Interim Report. 2013.
59
78. Hafeman DM, Ahsan H, Louis ED, Siddique AB, Slavkovich V, Cheng Z, et al.
Association between arsenic exposure and a measure of subclinical sensory neuropathy in
Bangladesh. J Occup Environ Med. 2005;47(8):778-784.
79. Wasserman GA, Liu X, Parvez F, Ahsan H, Factor-Litvak P, Kline J, et al. Water arsenic
exposure and intellectual function in 6-year-old children in Araihazar, Bangladesh.
Environ Health Perspect. 2007;115(2):285-289.
80. Sanchez TR, Perzanowski M, Graziano JH. Inorganic arsenic and respiratory health, from
early life exposure to sex-specific effects: A systematic review. Environ Res.
2016;147:537-55.
81. Rahman M, Tondel M, Ahmad SA, Axelson O. Diabetes mellitus associated with arsenic
exposure in Bangladesh. Am J Epidemiol. 1998;148(2):198-203.
82. Tseng CH, Tai TY, Chong CK, Tseng CP, Lai MS, Lin BJ, et al. Long-term arsenic
exposure and incidence of non-insulin-dependent diabetes mellitus: a cohort study in
arseniasis-hyperendemic villages in Taiwan. Environ Health Perspect. 2000;108(9):847.
83. Navas-Acien A, Silbergeld EK, Pastor-Barriuso R, Guallar E. Arsenic exposure and
prevalence of type 2 diabetes in US adults. JAMA. 2008;300(7):814-822.
84. Abhyankar LN, Jones MR, Guallar E, Navas-Acien A. Arsenic exposure and
hypertension: a systematic review. Environ Health Perspect. 2011;120(4):494-500.
85. Oremland RS and Stolz JF. The ecology of arsenic. Science. 2003;300(5621):939-944.
86. Zheng Y, Wu J, Ng JC, Wang G, Lian W. The absorption and excretion of fluoride and
arsenic in humans. Toxicol Lett. 2002;133(1):77-82.
87. Calatayud M, Gimeno J, Vélez D, Devesa V, Montoro R. Characterization of the
intestinal absorption of arsenate, monomethylarsonic acid, and dimethylarsinic acid using
the Caco-2 cell line. Chem Res Toxicol. 2010;23(3):547-556.
88. Lin S, Shi Q, Nix FB, Styblo M, Beck MA, Herbin-Davis KM, et al. A novel S-adenosyl-
L-methionine:arsenic(III) methyltransferase from rat liver cytosol. J Biol Chem.
2002;277(13):10795-803.
89. Thomas DJ, Li J, Waters SB, Xing W, Adair BM, Drobna Z, et al. Arsenic (+3 oxidation
state) methyltransferase and the methylation of arsenicals. Exp Biol Med. 2007;232(1):3-
13.
90. Challenger F. Biological methylation. Chem Rev. 1945;36(3):315-361.
91. Challenger F. Biological methylation. Adv Enzymol Relat Subj Biochem. 1951;12:429-
91.

60
92. Hayakawa T, Kobayashi Y, Cui X, Hirano S. A new metabolic pathway of arsenite:
arsenic–glutathione complexes are substrates for human arsenic methyltransferase Cyt19.
Arch Toxicol. 2005;79(4):183-191.
93. Wang S, Li X, Song X, Geng Z, Hu X, Wang Z. Rapid equilibrium kinetic analysis of
arsenite methylation catalyzed by recombinant human arsenic (+ 3 oxidation state)
methyltransferase (hAS3MT). J Biol Chem. 2012. 287;(46):38790-38799.
94. Rossman TG. Mechanism of arsenic carcinogenesis: an integrated approach. Mutat Res,
2003. 533;(1-2):37-65.
95. Vahter M. Species differences in the metabolism of arsenic compounds. Appl Organomet
Chem. 1994;8(3):175-182.
96. Vahter M. Biotransformation of trivalent and pentavalent inorganic arsenic in mice and
rats. Environ Res. 1981;25(2):286-93.
97. Charbonneau SM, Tam GKH, Bryce F, Zawidzka Z, Sandi E. Metabolism of orally
administered inorganic arsenic in the dog. Toxicol Lett. 1979;3(2):107-113.
98. Hollins JG, Charbonneau SM, Bryce P, Ridgeway JM, Tam GKH, Willes RF. Whole
body retention and excretion of [74 As] arsenic acid in the adult beagle dog. Toxicol Lett.
1979;4(1):7-13.
99. Naranmandura H, Suzuki N, Iwata K, Hirano S, Suzuki KT. Arsenic metabolism and
thioarsenicals in hamsters and rats. Chemical Res Toxicol. 2007;20(4):616-624.
100. Lu M, Wang H, Li XF, Arnold LL, Cohen SM, Le XC. Binding of dimethylarsinous acid
to cys-13alpha of rat hemoglobin is responsible for the retention of arsenic in rat blood.
Chem Res Toxicol. 2007;20(1):27-37.
101. Wang JP, Qi L, Moore MR, Ng JC. A review of animal models for the study of arsenic
carcinogenesis. Toxicol Lett. 2002;133(1):17-31.
102. Niedzwiecki MM, Hall MN, Liu X, Slavkovich V, Ilievski V, Levy D, et al. Interaction
of plasma glutathione redox and folate deficiency on arsenic methylation capacity in
Bangladeshi adults. Free Radic Biol Med. 2014;73: 67-74.
103. Hall MN and Gamble MV. Nutritional manipulation of one-carbon metabolism: effects
on arsenic methylation and toxicity. J Toxicol. 2012;2012:595307.
104. Antonelli R, Shao K, Thomas DJ, Sams R 2nd, Cowden J. AS3MT, GSTO, and PNP
polymorphisms: impact on arsenic methylation and implications for disease
susceptibility. Environ Res. 2014;132:156-67.
61
105. Hopenhayn-Rich C, Biggs ML, Smith AH, Kalman DA, Moore LE. Methylation study of
a population environmentally exposed to arsenic in drinking water. Environ Health
Perspect. 1996;104(6):620-8.
106. Hsueh YM, Huang YL, Huang CC, Wu WL, Chen HM, Yang MH, et al. Urinary levels
of inorganic and organic arsenic metabolites among residents in an arseniasis-
hyperendemic area in Taiwan. J Toxicol Environ Health A. 1998;54(6):431-44.
107. Lindberg AL, Esktröm EC, Nermell B, Rahman M, Lönerdall B, Persson LA, et al.
Gender and age differences in the metabolism of inorganic arsenic in a highly exposed
population in Bangladesh. Environ Res. 2008. 106(1):110-20.
108. Lindberg AL, Kumar R, Goessler W, Thirumaran R, Gurzau E, Koppova K, et al.
Metabolism of low-dose inorganic arsenic in a central European population: influence of
sex and genetic polymorphisms. Environ Health Perspect. 2007;115(7):1081-6.
109. Resseguie ME, Niculescu M, da Costa KA, Randall T, Zeisel S. Estrogen induces the
PEMT (phosphatidylethanolamine N-methyltransferase) gene in human and murine
hepatocytes. FASEB J. 2007;21(5):A61.
110. Zeisel SH. Choline: critical role during fetal development and dietary requirements in
adults. Annu Rev Nutr. 2006;26:229-50.
111. Lu K, Cable PH, Abo RP, Ru H, Graffam ME, Schlieper KA, et al. Gut microbiome
perturbations induced by bacterial infection affect arsenic biotransformation. Chem Res
Toxicol, 2013;26(12):1893-903.
112. Pinyayev TS, Kohan MJ, Herbin-Davis K, Creed JT, Thomas DJ. Preabsorptive
metabolism of sodium arsenate by anaerobic microbiota of mouse cecum forms a variety
of methylated and thiolated arsenicals. Chem Res Toxicol. 2011;24(4):475-477.
113. Lu K, Mahbub R, Cable PH, Ru H, Parry NM, Bodnar WM, et al. Gut microbiome
phenotypes driven by host genetics affect arsenic metabolism. Chem Res Toxicol.
2012;27(2):172-174.
114. Song X, Geng Z, Li X, Hu X, Bian N, Zhang X, et al. New insights into the mechanism
of arsenite methylation with the recombinant human arsenic (+3) methyltransferase
(hAS3MT). Biochimie. 2010;92(10):1397-406.
115. Styblo M, Del Razo LM, LeCluyse EL, Hamilton GA, Wang C, Cullen WR, et al.
Metabolism of arsenic in primary cultures of human and rat hepatocytes. Chem Res
Toxicol. 1999. 12(7): p. 560-5.
116. Garcia-Montalvo EA, Valenzuela OL, Sánchez-Peña LC, Albores A, Del Razo LM.
Dose-dependent urinary phenotype of inorganic arsenic methylation in mice with a focus
on trivalent methylated metabolites. Toxicol Mech Methods, 2011. 21(9): p. 649-55.
62
117. Xu YY, Wang Y, Li X, He M, Xue P, Fu JQ, et al. Variations in arsenic methylation
capacity and oxidative DNA lesions over a 2-year period in a high arsenic-exposed
population. Int Arch Occup Environ Health. 2009;82(2):251-8.
118. Del Razo LM, García-Vargas GG, Altered profile of urinary arsenic metabolites in adults
with chronic arsenicism A pilot study. Archives of toxicology, 1997. 71(4): p. 211-217.
119. Olmos V, Navoni JA, Calcagno ML, Sassone AH, Villamil Lepori EC. Influence of the
level of arsenic (As) exposure and the presence of T860C polymorphism in human As
urinary metabolic profile. Hum Exp Toxicol. 2015;34(2):170-178.
120. Hopenhaynrich C, Smith AH, Goeden HM. Human studies do not support the
methylation threshold hypothesis for the toxicity of inorganic arsenic. Environ Res. 1993;
60(2):161-177.
121. Hughes MF. Arsenic toxicity and potential mechanisms of action. Toxicol Lett. 2002;
133(1):1-16.
122. Shen S, Li XF, Cullen WR, Weinfeld M, Le XC. Arsenic binding to proteins. Chem Rev.
2013;113(10):7769-92.
123. Ren X, McHale CM, Skibola CF, Smith AH, Smith MT, Zhang L. An emerging role for
epigenetic dysregulation in arsenic toxicity and carcinogenesis. Environ Health Perspect,
2011;119(1):11-9.
124. Raml R, Rumpler A, Goessler W, Vahter M, Li L, Ochi T, et al. Thio-dimethylarsinate is
a common metabolite in urine samples from arsenic-exposed women in Bangladesh.
Toxicol Appl Pharmacol 2007. 222(3):374-80.
125. Yamauchi H and Fowler BA (1994). Toxicity and metabolism of inorganic and
methylated arsenicals, in Arsenic in the Environment (p. 35-53). Nriagu JO (Eds.). New
York, New York: John Wiley & Sons.
126. Vahter M. Mechanisms of arsenic biotransformation. Toxicology. 2002;181:211-217.
127. Hughes MF, Edwards BC, Herbin-Davis KM, Saunders Jesse, Styblo M, Thomas DJ.
Arsenic (+ 3 oxidation state) methyltransferase genotype affects steady-state distribution
and clearance of arsenic in arsenate-treated mice. Toxicol Appl Pharmacol.
2010;249(3):217-223.
128. Drobna Z, Naranmandura H, Kubachka KM, Edwards BC, Herbin-Davis K, Styblo M, et
al. Disruption of the arsenic (+ 3 oxidation state) methyltransferase gene in the mouse
alters the phenotype for methylation of arsenic and affects distribution and retention of
orally administered arsenate. Chem Res Toxicol. 2009;22(10):1713-1720.
63
129. Yokohira M, Arnold LL, Pennington KL, Suzuki S, Kakiuchi-Kiyota S, Herbin-Davis K,
et al. Severe systemic toxicity and urinary bladder cytotoxicity and regenerative
hyperplasia induced by arsenite in arsenic (+ 3 oxidation state) methyltransferase
knockout mice. A preliminary report. Toxicol Appl Pharmacol. 2010; 246(1):1-7.
130. Steinmaus C, Yuan Y, Kalman D, Rey OA, Skibola CF, Dauphine DF, et al. Individual
differences in arsenic metabolism and lung cancer in a case-control study in Cordoba,
Argentina. Toxicol Appl Pharmacol. 2010;247(2):138-145.
131. Melak D, Ferreccio C, Kalman D, Parra R, Acevedo J, Pérez L, et al. Arsenic methylation
and lung and bladder cancer in a case-control study in northern Chile. Toxicol Appl
Pharmacol. 2014;274(2):225-31.
132. Chen YC, Su HJJ, Guo YLL, Hsueh YM, Smith TJ, Ryan LM, et al. Arsenic methylation
and bladder cancer risk in Taiwan. Cancer Causes Control. 2003;14(4):303-10.
133. Steinmaus C, Bates MN, Yuan Y, Kalman D, Atallah R, Rey OA, et al. Arsenic
methylation and bladder cancer risk in case-control studies in Argentina and the United
States. J Occup Environ Med. 2006;48(5):478-88.
134. Pu YS, Yang SM, Huang YK, Chung CJ, Huang SK, Chiu AW, et al. Urinary arsenic
profile affects the risk of urothelial carcinoma even at low arsenic exposure. Toxicol
Appl Pharmacol. 2007;218(2):99-106.
135. Huang YK, Huang YL, Hseuh YM, Yang MH, Wu MM, Chen SY, et al. Arsenic
exposure, urinary arsenic speciation, and the incidence of urothelial carcinoma: a twelve-
year follow-up study. Cancer Causes Control, 2008;19(8):829-839.
136. Hsueh YM, Chiou HY, Huang YL, Wu WL, Huang CC, Yang MH, et al. Serum beta-
carotene level, arsenic methylation capability, and incidence of skin cancer. Cancer
Epidemiol Biomarkers Prev. 1997;6(8):589-96.
137. Yu RC, Hsu KH, Chen CJ, Froines JR. Arsenic methylation capacity and skin cancer.
Cancer Epidemiol Biomarkers Prev. 2000;9(11):1259-62.
138. Chen YC, Guo YL, Su HJ, Hseuh YM, Smith TJ, Ryan LM, et al. Arsenic methylation
and skin cancer risk in southwestern Taiwan. J Occup Environ Med. 2003;45(3):241-8.
139. Ahsan H, Chen Y, Kibriya MG, Slavkovich V, Parvez F, Jasmine F, et al. Arsenic
metabolism, genetic susceptibility, and risk of premalignant skin lesions in Bangladesh.
Cancer Epidemiol Biomarkers Prev. 2007;16(6):1270-8.
140. McCarty KM, Chen YC, Quamruzzaman Q, Rahman M, Mahiuddin G, Hsueh YM, et al.
Arsenic methylation, GSTT1, GSTM1, GSTP1 polymorphisms, and skin lesions. Environ
Health Perspect. 2007;115(3):341-5.

64
141. Lindberg AL, Rahman M, Persson LA, Vahter M. The risk of arsenic induced skin
lesions in Bangladeshi men and women is affected by arsenic metabolism and the age at
first exposure. Toxicol Appl Pharmacol. 2008;230(1):9-16.
142. Tseng CH, Huang YK, Huang YL, Chung CJ, Yang MH, Chen CJ, et al. Arsenic
exposure, urinary arsenic speciation, and peripheral vascular disease in blackfoot disease-
hyperendemic villages in Taiwan. Toxicol Appl Pharmacol. 2005;206(3):299-308.
143. Wu MM, Chiou HY, Hseuh YM, Hong CT, Su CL, Chang SF, et al. Effect of plasma
homocysteine level and urinary monomethylarsonic acid on the risk of arsenic-associated
carotid atherosclerosis. Toxicol Appl Pharmacol. 2006;216(1):168-75.
144. Chen Y, Wu F, Liu M, Parvez F, Slavkovich V, Eunus M, et al. A prospective study of
arsenic exposure, arsenic methylation capacity, and risk of cardiovascular disease in
Bangladesh. Environ Health Perspect. 2013;121(7):832-8.
145. Hsieh RL, Huang YL, Shiue HS, Huang SR, Lin MI, Mu SC, et al. Arsenic methylation
capacity and developmental delay in preschool children in Taiwan. Int J Hyg Environ
Health. 2014;217(6):678-86.
146. Lopez-Carrillo L, Hernandez-Ramirez RU, Gandolfi AJ, Ornelas-Aguirre JM, Torres-
Sanchez, Cebrian ME, et al. Arsenic methylation capacity is associated with breast cancer
in northern Mexico. Toxicol Appl Pharmacol. 2014;280(1):53-9.
147. Huang YK, Tseng CH, Huang YL, Yang MH, Chen CJ, Hseuh YM. Arsenic methylation
capability and hypertension risk in subjects living in arseniasis-hyperendemic areas in
southwestern Taiwan. Toxicol Appl Pharmacol, 2007;218(2):135-42.
148. Li X, Li B, Xi S, Zheng Q, Wang D, Sun G. Association of urinary monomethylated
arsenic concentration and risk of hypertension: a cross-sectional study from arsenic
contaminated areas in northwestern China. Environ Health.2013;12(37):12-37.
149. Kuo CC, Howard BV, Umans JG, Gribble MO, Best LG, Francesconi KA, et al. Arsenic
exposure, arsenic metabolism, and incident diabetes in the strong heart study. Diabetes
Care. 2015;38(4):620-7.
150. Huang YK, Pu YS, Chung CJ, Shiue HS, Yang MH, Chen CJ, et al. Plasma folate level,
urinary arsenic methylation profiles, and urothelial carcinoma susceptibility. Food Chem
Toxicol. 2008;46(3):929-38.
151. Smith AH. Arsenic and diabetes. Environ Health Perspect. 2013;121(3):a70.
152. Navas-Acien A, Maull EA, Thayer KA. Arsenic and Diabetes: Navas-Acien et al.
Respond. Environ Health Perspect. 2013;121(3):a71.
65
153. Steinmaus C, Yuan Y, Liaw J, Smith AH. Low-level population exposure to inorganic
arsenic in the United States and diabetes mellitus: a reanalysis. Epidemiology.
2009;20(6):807-815.
154. Vahter M and Marafante E. Effects of low dietary intake of methionine, choline or
proteins on the biotransformation of arsenite in the rabbit. Toxicol Lett. 1987;37(1):41-
46.
155. Tice RR, Yager JW, Andrews P, Crecelius E. Effect of hepatic methyl donor status on
urinary excretion and DNA damage in B6C3F1 mice treated with sodium arsenite. Mutat
Res.1997;386(3):315-334.
156. Spiegelstein O, Lu X, Le XC, Troen A, Selhub J, Melnyk S, et al. Effects of dietary folate
intake and folate binding protein-1 (Folbp1) on urinary speciation of sodium arsenate in
mice. Toxicol Lett. 2003;145(2):167-174.
157. Wlodarczyk B, Spiegelstein O, Gelineau-van Waes J, Vorce RL, Lu X, Le CX, et al.
Arsenic-induced congenital malformations in genetically susceptible folate binding
protein-2 knockout mice. Toxicol Appl Pharmacol. 2001;177(3):238-246.
158. Wlodarczyk BJ, Zhu H, Finnell RH. Mthfr gene ablation enhances susceptibility to
arsenic prenatal toxicity. Toxicol Appl Pharmacol. 2014. 275(1):22-7.
159. Song G, Cui Y, Han ZJ, Xia HF, Ma X. Effects of choline on sodium arsenite-induced
neural tube defects in chick embryos. Food Chem Toxicol. 2012;50(12):4364-74.
160. Majumdar S, Mukherjee S, Maiti A, Karmakar S, Das AS, Mukherjee M, et al. Folic acid
or combination of folic acid and vitamin B(12) prevents short-term arsenic trioxide-
induced systemic and mitochondrial dysfunction and DNA damage. Environ Toxicol.
2009;24(4): 377-87.
161. Ramirez T, Garcia-Montalvo V, Wise C, Cea-Olivares R, Poirier LA, Herrera LA. S-
adenosyl-L-methionine is able to reverse micronucleus formation induced by sodium
arsenite and other cytoskeleton disrupting agents in cultured human cells. Mutat Res.
2003;528(1-2):61-74.
162. McDorman EW, Collins BW, Allen JW. Dietary folate deficiency enhances induction of
micronuclei by arsenic in mice. Environ Mol Mutagen. 2002;40(1):71-7.
163. Nelson GM, Ahlborn GJ, Delker DA, Kitchin KT, O’Brien TG, Chen Y, et al. Folate
deficiency enhances arsenic effects on expression of genes involved in epidermal
differentiation in transgenic K6/ODC mouse skin. Toxicology. 2007;241(3):134-45.
164. Xu Y, Wang H, Wang Y, Zheng Y, Sun G. Effects of folate on arsenic toxicity in Chang
human hepatocytes: involvement of folate antioxidant properties. Toxicol Lett. 2010;
195(1):44-50.
66
165. Mukherjee S, Das D, Mukherjee M, Das AS, Mitra C. Synergistic effect of folic acid and
vitamin B12 in ameliorating arsenic-induced oxidative damage in pancreatic tissue of rat.
J Nutr Biochem. 2006;17(5):319-27.
166. Gamble MV, Liu X, Ahsan H, Pilser R, Ilievski V, Slavkovich V, et al. Folate,
homocysteine, and arsenic metabolism in arsenic-exposed individuals in Bangladesh.
Environ Health Perspect. 2005;113(12):1683-8.
167. Hall M, Gamble M, Slavkovich V, Liu X, Levy D, Cheng Z, et al. Determinants of
arsenic metabolism: blood arsenic metabolites, plasma folate, cobalamin, and
homocysteine concentrations in maternal-newborn pairs. Environ Health Perspect.
2007;115(10):1503-9.
168. Heck JE, Gamble MV, Chen Y, Graziano JH, Slavkovich V, Parvez F, et al.
Consumption of folate-related nutrients and metabolism of arsenic in Bangladesh. Am J
Clin Nutr. 2007; 85(5):1367-74.
169. Steinmaus C, Moore LE, Shipp M, Kalman D, Rey OA, Biggs ML, et al. Genetic
polymorphisms in MTHFR 677 and 1298, GSTM1 and T1, and metabolism of arsenic. J
Toxicol Environ Health. 2007;70(2):159-170.
170. Porter KE, Basu A, Hubbard AE, Bates MN, Kalman D, Rey O, et al. Association of
genetic variation in cystathionine-β-synthase and arsenic metabolism. Environ Res.
2010;110(6):580-587.
171. Schlawicke Engstrom K, Nermell B, Concha G, Sromberg U, Vahter M, Broberg K.
Arsenic metabolism is influenced by polymorphisms in genes involved in one-carbon
metabolism and reduction reactions. Mutat Res. 2009;667(1-2):4-14.
172. Pilsner JR, Liu X, Ahsan H, Ilievski V, Slavkovich V, Levy D, et al. Folate deficiency,
hyperhomocysteinemia, low urinary creatinine, and hypomethylation of leukocyte DNA
are risk factors for arsenic-induced skin lesions. Environ Health Perspect. 2009;117(2):
254-60.
173. Steinmaus C, Carrigan K, Kalman D, Atallah R, Yuan Y, et al. Dietary intake and arsenic
methylation in a US population. Environ Health Perspect. 2005:1153-1159.
174. Gruber JF, Karagas MR, Gilbert-Diamond D, Bagley PJ, Zens MS, Sayarath V, et al.
Associations between toenail arsenic concentration and dietary factors in a New
Hampshire population. Nutr J. 2012;11(45):10.1186.
175. Bailey LB, Stover PJ, McNulty H, Fenech MF, Gregory JF 3rd, Mils JL, et al.
Biomarkers of nutrition for development—folate review. J Nutr. 2015;145(7): 1636S-
1680S
67
176. Li L, Ekstrom EC, Goessler W, Lonnerdal B, Nermell B, Yunus M, et al. Nutritional
status has marginal influence on the metabolism of inorganic arsenic in pregnant
Bangladeshi women. Environ Health Perspect. 2008;116(3): 315-21.
177. Dasarathy J, Gruca LL, Bennett C, Parimi PS, Duenas C, Marczewski S, et al.
Methionine metabolism in human pregnancy. Am J Clin Nutr. 2010;91(2):357-365.
178. Hall MN, Liu X, Slavkovich V, Ilievski V, Mi Z, Alam S, et al. Influence of cobalamin
on arsenic metabolism in Bangladesh. Environ Health Perspect. 2009;117(11):1724-9.
179. Gamble MV, Liu X, Ahsan H, Pilsner JR, Ilievski V, Slavkovich V, et al. Folate and
arsenic metabolism: a double-blind, placebo-controlled folic acid-supplementation trial in
Bangladesh. Am J Clin Nutr. 2006;84(5):1093-101.
180. Gamble MV, Liu X, Slavkovich V, Pilsner JR, Ilievski V, Factor-Litvak P, et al. Folic
acid supplementation lowers blood arsenic. Am J Clin Nutr. 2007;86(4):1202-1209.
181. Peters BA, Hall MN, Liu X, Parvez F, Sanchez TR, van Geen A, et al. Folic Acid and
Creatine as Therapeutic Approaches to Lower Blood Arsenic: A Randomized Controlled
Trial. Environ Health Perspect. 2015;123(12):1294-301.
182. Goldberg AD, Allis CD, Bernstein E. Epigenetics: a landscape takes shape. Cell,
2007;128(4):635-638.
183. Zheng YG (2015). Epigenetic Technological Applications. Zheng YG (Ed.). New York,
New York: Elsevier.
184. Zhou VW, Goren A, Bernstein BE. Charting histone modifications and the functional
organization of mammalian genomes. Nat Rev Genet. 2011;12(1):7-18.
185. Luger K, Mader AW, Richmond RK, Sargent DF, Richmond TJ. Crystal structure of the
nucleosome core particle at 2.8 Å resolution. Nature. 1997;389(6648):251-260.
186. Kornberg RD. Chromatin structure: a repeating unit of histones and DNA. Science.
1974;184(4139):868-871.
187. McBryant SJ, Lu X, Hansen JC. Multifunctionality of the linker histones: an emerging
role for protein-protein interactions. Cell Res. 2010;20(5):519-28.
188. Bannister AJ and Kouzarides T. Regulation of chromatin by histone modifications. Cell
Res. 2011;21(3):381-395.
189. Weber CM and Henikoff S. Histone variants: dynamic punctuation in transcription.
Genes Dev. 2014;28(7):672-82.
68
190. Azad GK and Tomar RS. Proteolytic clipping of histone tails: the emerging role of
histone proteases in regulation of various biological processes. Mol Biol Rep. 2014.
41(5):2717-30.
191. Mersfelder EL and Parthun MR. The tale beyond the tail: histone core domain
modifications and the regulation of chromatin structure. Nucleic Acids Res.
2006;34(9):2653-62.
192. Chen R, Kang R, Fan XG, Tang D. Release and activity of histone in diseases. Cell Death
Dis. 2014;5(8):e1370.
193. Xu YM, Du JY, Lau AT. Posttranslational modifications of human histone H3: an
update. Proteomics. 2014;14(17-18):2047-60.
194. Bestor TH. The DNA methyltransferases of mammals. Hum Mol Genet. 2000;
9(16):2395-2402.
195. Breiling A and Lyko F. Epigenetic regulatory functions of DNA modifications: 5-
methylcytosine and beyond. Epigenetics Chromatin. 2015;8:24.
196. Law JA and Jacobsen SE. Establishing, maintaining and modifying DNA methylation
patterns in plants and animals. Nat Rev Genet. 2010;11(3):204-20.
197. Jones PA. Functions of DNA methylation: islands, start sites, gene bodies and beyond.
Nat Rev Genet. 2012;13(7):484-92.
198. Larsen F, Gundersen G, Lopez R, Prydz H. CpG islands as gene markers in the human
genome. Genomics. 1992;13(4):1095-107.
199. Deaton AM and Bird A. CpG islands and the regulation of transcription. Genes Dev.
2011;25(10):1010-1022.
200. Bock C, Beerman I, Lien WH, Smith ZD, Gu H, Boyle P, et al. DNA methylation
dynamics during in vivo differentiation of blood and skin stem cells. Mol Cell. 2012;
47(4):633-647.
201. Portela A and Esteller M. Epigenetic modifications and human disease. Nat Biotechnol.
2010. 28(10):1057-68.
202. Bollati V, Schwartz J, Wright R, Litonjua A, Tarantini L, Suh H, et al. Decline in
genomic DNA methylation through aging in a cohort of elderly subjects. Mech Ageing
Dev. 2009; 130(4):234-9.
203. Wilson VL and Jones PA. DNA methylation decreases in aging but not in immortal cells.
Science. 1983;220(4601):1055-1057.
69
204. Ito S, Shen L, Dai Q, Wu SC, Collins LB, Swenberg JA, et al. Tet proteins can convert 5-
methylcytosine to 5-formylcytosine and 5-carboxylcytosine. Science.
2011;333(6047):1300-3.
205. Kohli RM and Zhang Y. TET enzymes, TDG and the dynamics of DNA demethylation.
Nature. 2013;502(7472):472-9.
206. Globisch D, Munzel M, Muller M, Michalakis S, Wagner M, Koch S, et al. Tissue
distribution of 5-hydroxymethylcytosine and search for active demethylation
intermediates. PloS one. 2010;5(12):e15367-e15367.
207. Wang T, Wu H, Li Y, Szulwach KE, Lin L, Li X, et al. Subtelomeric hotspots of aberrant
5-hydroxymethylcytosine-mediated epigenetic modifications during reprogramming to
pluripotency. Nat Cell Biol. 2013;15(6):700-11.
208. Saksouk N, Simboeck E, Dejardin J. Constitutive heterochromatin formation and
transcription in mammals. Epigenetics Chromatin. 2015;8:3.
209. Wagner EJ and Carpenter PB. Understanding the language of Lys36 methylation at
histone H3. Nat Rev Mol Cell Biol. 2012;13(2):115-26.
210. Jorgensen S, Schotta G, Sorensen CS. Histone H4 lysine 20 methylation: key player in
epigenetic regulation of genomic integrity. Nucleic Acids Res. 2013;41(5):2797-806.
211. Cedar H and Bergman Y. Linking DNA methylation and histone modification: patterns
and paradigms. Nat Rev Genet. 2009;10(5):295-304.
212. Ooi SK, Qiu C, Bernstein E, Li K, Jia D, Yang Z, et al. DNMT3L connects unmethylated
lysine 4 of histone H3 to de novo methylation of DNA. Nature. 2007;448(7154):714-7.
213. Kooistra SM and Helin K. Molecular mechanisms and potential functions of histone
demethylases. Nat Rev Mol Cell Biol. 2012;13(5):297-311.
214. Nguyen AT and Zhang Y. The diverse functions of Dot1 and H3K79 methylation. Genes
Dev. 2011;25(13):1345-58.
215. Bergman Y and Cedar H. DNA methylation dynamics in health and disease. Nat Struct
Mol Biol. 2013;20(3):274-81.
216. van Veldhoven K, Polidoro S, Baglietto L, Severi G, Sacerdote C, Panico S, et al.
Epigenome-wide association study reveals decreased average methylation levels years
before breast cancer diagnosis. Clin Epigenetics. 2015;7(1):1-12.
217. Xu Z, Bolick SC, DeRoo LA, Weinberg CR, Sandler DP, Taylor JA. Epigenome-wide
association study of breast cancer using prospectively collected sister study samples. J
Natl Cancer Inst. 2013;105(10):694-700.
70
218. Gao Y, Baccarrelli A, Shu XO, Ji BT, Yu K, Tarantini L, et al. Blood leukocyte Alu and
LINE-1 methylation and gastric cancer risk in the Shanghai Women's Health Study. Br J
Cancer. 2012;106(3):585-591.
219. Karami S, Andreotti G, Liao LM, Pfeiffer RM, Weinstein SJ, Purdue MP, et al. LINE1
methylation levels in pre-diagnostic leukocyte DNA and future renal cell carcinoma risk.
Epigenetics. 2015;10(4):282-92.
220. Baccarelli A, Wright R, Bollati V, Litonjua A, Zanobetti A, Tarantini L, et al. Ischemic
heart disease and stroke in relation to blood DNA methylation. Epidemiology.
2010;21(6):819.
221. Li F, Mao G, Tong D, Huang J, Gu L, Yang W, et al. The histone mark H3K36me3
regulates human DNA mismatch repair through its interaction with MutSα. Cell.
2013;153(3):590-600.
222. Schmidt CK and Jackson SP. On your mark, get SET (D2), go! H3K36me3 primes DNA
mismatch repair. Cell. 2013;153(3):513-515.
223. Pai CC, Deegan RS, Subramanian L, Gal C, Sarkar S, Blaikley EJ, et al. A histone
H3K36 chromatin switch coordinates DNA double-strand break repair pathway choice.
Nat Commun. 2014;5:4091.
224. Fnu S, Williamson EA, De Haro LP, Brenneman M, Wray J, Shaheen M, et al.
Methylation of histone H3 lysine 36 enhances DNA repair by nonhomologous end-
joining. Proc Natl Acad Sci U S A. 2011;108(2):540-545.
225. Kuo AJ, Cheung P, Chen K, Zee BM, Kioi M, Lauring J, et al. NSD2 links dimethylation
of histone H3 at lysine 36 to oncogenic programming. Mol Cell. 2011;44(4):609-620.
226. Fraga MF, Ballestar E, Villar-Garea A, Boix-Chornet M, Espada J, Schotta G, et al. Loss
of acetylation at Lys16 and trimethylation at Lys20 of histone H4 is a common hallmark
of human cancer. Nat Genet. 2005;37(4):391-400.
227. Benard A, Goossens-Beumer IJ, van Hoesel AQ, de Graaf W, Horati H, Putter H, et al.
Histone trimethylation at H3K4, H3K9 and H4K20 correlates with patient survival and
tumor recurrence in early-stage colon cancer. BMC cancer. 2014;14(1):1.
228. Benard A, Goossens-Beumer IJ, van Hoesel AQ, Horati H, de Graaf W, Putter H, et al.
Nuclear expression of histone deacetylases and their histone modifications predicts
clinical outcome in colorectal cancer. Histopathology. 2015;66(2):270-282.
229. Goossens-Beumer IJ, Benard A, van Hoessel AQ, Zeestraten EC, Putter H, Bohringer S,
et al. Age-dependent clinical prognostic value of histone modifications in colorectal
cancer. Transl Res. 2015;165(5):578-588.
71
230. Liu BL, Cheng JX, Zhang X, Wang R, Zhang W, Lin H, et al. Global histone
modification patterns as prognostic markers to classify glioma patients. Cancer
Epidemiol Biomarkers Prevention. 2010;19(11):2888-2896.
231. Chervona Y and Costa M. Histone modifications and cancer: biomarkers of prognosis?
Am J Cancer Res. 2012;2(5):589.
232. Zhang Q, Xue P, Li H, Bao Y, Wu L, Chang S, et al. Histone modification mapping in
human brain reveals aberrant expression of histone H3 lysine 79 dimethylation in neural
tube defects. Neurobiol Dis. 2013;54:404-413.
233. Rao JS, Keleshian VL, Klein S, Rapoport SI. Epigenetic modifications in frontal cortex
from Alzheimer's disease and bipolar disorder patients. Transl Psychiatry. 2012;2(7):
e132.
234. Tang B, Dean B, Thomas E. Disease-and age-related changes in histone acetylation at
gene promoters in psychiatric disorders. Transl Psychiatry. 2011;1(12):e64.
235. Daigle SR, Olhava EJ, Therkelsen CA, Basavapathruni A, Jin L, Boriack-Sjodin PA, et
al. Potent inhibition of DOT1L as treatment of MLL-fusion leukemia. Blood.
2013;122(6):1017-25.
236. Basavapathruni A, Olhava EJ, Daigle SR, Therkelsen CA, Jin L, Boriack-Sjodin PA, et
al. Nonclinical pharmacokinetics and metabolism of EPZ-5676, a novel DOT1L histone
methyltransferase inhibitor. Biopharm Drug Dispos. 2014;35(4):237-52.
237. Pilsner JR, Liu X, Ahsan H, Ilievski V, Slavkovich V, Levy D, et al. Genomic
methylation of peripheral blood leukocyte DNA: influences of arsenic and folate in
Bangladeshi adults. Am J Clin Nutr. 2007;86(4):1179-1186.
238. Majumdar S, Chanda S, Ganguli B, Mazumder DN, Lahiri S, Dasgupta UB. Arsenic
exposure induces genomic hypermethylation. Environ Toxicol. 2010;25(3):315-318.
239. Kile ML, Baccarelli A, Hoffman E, Tarantini L, Quamruzzaman Q, Rahman M, et al.
Prenatal arsenic exposure and DNA methylation in maternal and umbilical cord blood
leukocytes. 2012.
240. Lambrou A, Baccarelli A, Wright RO, Weisskopf M, Bollati V, Amarasiriwardena C, et
al. Arsenic exposure and DNA methylation among elderly men. Epidemiology.
2012;23(5):668.
241. Clayton JA and Collins FS. Policy: NIH to balance sex in cell and animal studies. Nature.
2014;509(7500):282-283.
72
242. Pilsner JR, Hall MN, Liu X, Ilievski V, Slavkovich V, Levy D, et al. Influence of
prenatal arsenic exposure and newborn sex on global methylation of cord blood DNA.
PLoS One. 2012;7(5):e37147.
243. Broberg K, Ahmed S, Engstrom K, Hossain MB, Jurkovic Mlakar S, Bottai M, et al.
Arsenic exposure in early pregnancy alters genome-wide DNA methylation in cord
blood, particularly in boys. J Dev Orig Health Dis. 2014;5(04):288-298.
244. Plongthongkum N, Diep DH, Zhang K. Advances in the profiling of DNA modifications:
cytosine methylation and beyond. Nat Rev Genet. 2014;15(10):647-661.
245. Niedzwiecki MM, Liu X, Hall MN, Thomas T, Slavkovich V, Ilievski V, et al. Sex-
specific associations of arsenic exposure with global DNA methylation and
hydroxymethylation in leukocytes: results from two studies in Bangladesh. Cancer
Epidemiol Biomarkers Prev. 2015;24(11):1748-1757.
246. Nohara K, Baba T, Murai H, Kobayashi Y, Suzuki T, Tateishi Y, et al. Global DNA
methylation in the mouse liver is affected by methyl deficiency and arsenic in a sex-
dependent manner. Arch Toxicol. 2011;85(6):653-661.
247. Arrigo AP. Acetylation and methylation patterns of core histones are modified after heat
or arsenite treatment of Drosophila tissue culture cells. Nucleic Acids Res. 1983;11(5):
1389-404.
248. Desrosiers R and Tanguay RM. Further characterization of the posttranslational
modifications of core histones in response to heat and arsenite stress in Drosophila.
Biochem Cell Biol. 1986;64(8):750-7.
249. Li J, Chen P, Sinogeeva N, Gorospe M, Wersto RP, Chrest FJ, et al. Arsenic trioxide
promotes histone H3 phosphoacetylation at the chromatin of CASPASE-10 in acute
promyelocytic leukemia cells. J Biol Chem. 2002;277(51):49504-49510.
250. Ramirez T, Brocher J, Stopper H, Hock R. Sodium arsenite modulates histone
acetylation, histone deacetylase activity and HMGN protein dynamics in human cells.
Chromosoma. 2008;117(2):147-157.
251. Zhou X, Sun H, Ellen TP, Chen H, Costa M. Arsenite alters global histone H3
methylation. Carcinogenesis. 2008;29(9):1831-1836.
252. Zhou X, Li Q, Arita A, Sun H, Costa M. Effects of nickel, chromate, and arsenite on
histone 3 lysine methylation. Toxicol Appl Pharmacol. 2009;236(1):78-84.
253. Chu F, Ren X, Chasse A, Hickman T, Zhang L, Yuh J, et al. Quantitative mass
spectrometry reveals the epigenome as a target of arsenic. Chem Biol Interact. 2011;
192(1-2): p. 113-7.
73
254. Herbert KJ, Holloway A, Cook AL, Chin SP, Snow ET. Arsenic exposure disrupts
epigenetic regulation of SIRT1 in human keratinocytes. Toxicol Appl Pharmacol.
2014;281(1):136-145.
255. Liu D, Wu D, Zhao L, Yang Y, Ding J, Dong L, et al. Arsenic Trioxide Reduces Global
Histone H4 Acetylation at Lysine 16 through Direct Binding to Histone Acetyltransferase
hMOF in Human Cells. PLoS One. 2015;10(10):e0141014.
256. Rahman S, Housein Z, Dabrowska A, Mayan MD, Boobis AR, Haiji N. E2F1-Mediated
FOS Induction in Arsenic Trioxide–Induced Cellular Transformation: Effects of Global
H3K9 Hypoacetylation and Promoter-Specific Hyperacetylation in Vitro. Environ Health
Perspect. 2015;123(5):484.
257. Perkins C, Kim CN, Fang G, Bhalla KN. Arsenic induces apoptosis of multidrug-resistant
human myeloid leukemia cells that express Bcr-Abl or overexpress MDR, MRP, Bcl-2,
or Bcl-xL. Blood. 2000;95(3):1014-1022.
258. Ray PD, Huang BW, Tsuji Y. Coordinated regulation of Nrf2 and histone H3 serine 10
phosphorylation in arsenite-activated transcription of the human heme oxygenase-1 gene.
Biochim Biophys Acta. 2015;10(88):18.
259. Treas JN, Tyagi T, Singh KP. Effects of chronic exposure to arsenic and estrogen on
epigenetic regulatory genes expression and epigenetic code in human prostate epithelial
cells. PloS One. 2012;7(8):e43880.
260. Jo WJ, Ren X, Chu F, Aleshin M, Wintz H, Burlingame A, et al. Acetylated H4K16 by
MYST1 protects UROtsa cells from arsenic toxicity and is decreased following chronic
arsenic exposure. Toxicol Appl Pharmacol. 2009;241(3): 294-302.
261. Kim HG, Kim DJ, Li S, Lee KY, Li X, Bode AM, et al. Polycomb (PcG) proteins, BMI1
and SUZ12, regulate arsenic-induced cell transformation. J Biol Chem. 2012;287(38):
31920-31928.
262. Suzuki T, Miyazaki K, Kita K, Ochi T. Trivalent dimethylarsenic compound induces
histone H3 phosphorylation and abnormal localization of Aurora B kinase in HepG2
cells. Toxicol Appl Pharmacol. 2009;241(3):275-282.
263. Suzuki T, Kita K, Ochi T. Phosphorylation of histone H3 at serine 10 has an essential
role in arsenite‐induced expression of FOS, EGR1 and IL8 mRNA in cultured human cell
lines. J Appl Toxicol. 2013;33(8):746-755.
264. Ge Y, Gong Z, Olson JR, Xu P, Buck MJ, Ren X. Inhibition of monomethylarsonous acid
(MMA III)-induced cell malignant transformation through restoring dysregulated histone
acetylation. Toxicology. 2013;312:30-35.
74
265. Cobo J, Valdez J, Gurley L. Inhibition of mitotic-specific histone phosphorylation by
sodium arsenite. Toxicol In Vitro. 1995;9(4):459-465.
266. Cronican AA, Fitz NF, Carter A, Saleem M, Shiva S, Barchowsky A, et al. Genome-wide
alteration of histone H3K9 acetylation pattern in mouse offspring prenatally exposed to
arsenic. PLoS One. 2013;8(2):e53478.
267. Tyler CR, Afez AK, Solomon ER, Allan AM. Developmental exposure to 50 parts-per-
billion arsenic influences histone modifications and associated epigenetic machinery in a
region-and sex-specific manner in the adult mouse brain. Toxicol Appl Pharmacol.
2015;288(1):40-51.
268. Cantone L, Nordio F, Hou L, Apostoli P, Bonzini M, Tarantini L, et al. Inhalable metal-
rich air particles and histone H3K4 dimethylation and H3K9 acetylation in a cross-
sectional study of steel workers. Environ Health Perspect. 2011;119(7):964-969.
269. Chervona Y, Hall MN, Arita A, Wu F, Sun H, Tseng HC, et al. Associations between
arsenic exposure and global posttranslational histone modifications among adults in
Bangladesh. Cancer Epidem Biomarkers Prev. 2012; 21(12):2252-2260.
270. Wilson MJ, Shivapurkar N, Poirier LA. Hypomethylation of hepatic nuclear DNA in rats
fed with a carcinogenic methyl-deficient diet. Biochem J. 1984;218(3):987.
271. Locker J, Reddy TV, Lombardi B. DNA methylation and hepatocarcinogenesis in rats fed
a choline-devoid diet. Carcinogenesis. 1986;7(8):1309-1312.
272. Wainfan E, Dizik M, Stender M, Christman JK. Rapid appearance of hypomethylated
DNA in livers of rats fed cancerpromoting, methyl-deficient diets. Cancer Res.
1989;49(15):4094-4097.
273. Balaghi M and Wagner C. DNA methylation in folate deficiency: use of CpG methylase.
Biochem Biophys Res Commun. 1993;193(3):1184-1190.
274. Varela‐Moreiras G, Alonso-Aperte E, Rubio M, Gasso M, Deulofeu R, Alvarez L, et al.
Carbon tetrachloride–induced hepatic injury is associated with global DNA
hypomethylation and homocysteinemia: Effect of S‐adenosylmethionine treatment.
Hepatology. 1995;22(4):1310-1315.
275. Duthie SJ, Narayanan S, Blum S, Pirie L, Brand GM. Folate deficiency in vitro induces
uracil misincorporation and DNA hypomethylation and inhibits DNA excision repair in
immortalized normal human colon epithelial cells. Nutr Cancer. 2000;37(2):245-251.
276. Pogribny IP, James SJ, Jernigan S, Pogribna M. Genomic hypomethylation is specific for
preneoplastic liver in folate/methyl deficient rats and does not occur in non-target tissues.
Mut Res. 2004;548(1):53-59.
75
277. Pogribny IP, Ross SA, Wise C, Pogribna M, Jones EA, Tryndyak VP, et al. Irreversible
global DNA hypomethylation as a key step in hepatocarcinogenesis induced by dietary
methyl deficiency. Mut Res. 2006;593(1):80-87.
278. Choi SW, Friso S, Ghandour H, Bagley PJ, Selhub J, Mason JB. Vitamin B-12 deficiency
induces anomalies of base substitution and methylation in the DNA of rat colonic
epithelium. J Nutr. 2004;134(4):750-755.
279. Niculescu MD, Craciunescu CN, Zeisel SH. Dietary choline deficiency alters global and
gene-specific DNA methylation in the developing hippocampus of mouse fetal brains.
FASEB J. 2006;20(1):43-49.
280. Keyes MK, Jang H, Mason JB, Liu Z, Crott JW, Smith DE, et al. Older age and dietary
folate are determinants of genomic and p16-specific DNA methylation in mouse colon. J
Nutr. 2007;137(7):1713-7.
281. Kim JM, Hong K, Lee JH, Lee S, Chang N. Effect of folate deficiency on placental DNA
methylation in hyperhomocysteinemic rats. J Nutr Biochem. 2009;20(3):172-6.
282. McKay JA, Waltham KJ, Williams EA, Mathers JC. Folate depletion during pregnancy
and lactation reduces genomic DNA methylation in murine adult offspring. Genes Nutr.
2011;6(2):189-196.
283. Choi SW, Friso S, Keyes MK, Mason JB. Folate supplementation increases genomic
DNA methylation in the liver of elder rats. Br J Nutr. 2005;93(01):31-35.
284. Duthie SJ, Grant G, Pirie LP, Watson AJ, Margison MP. Folate deficiency alters hepatic
and colon MGMT and OGG-1 DNA repair protein expression in rats but has no effect on
genome-wide DNA methylation. Cancer Prev Res. 2010;3(1):92-100.
285. Kim YI, Christman JK, Fleet JC, Cravo ML, Saloman RN, Smith D, et al. Moderate
folate deficiency does not cause global hypomethylation of hepatic and colonic DNA or
c-myc-specific hypomethylation of colonic DNA in rats. Am J Clin Nutr.
1995;61(5):1083-1090.
286. Duthie SJ, Narayanan S, Brand GM, Grant G. DNA stability and genomic methylation
status in colonocytes isolated from methyl-donor-deficient rats. Eur J Nutr. 2000;39(3):
106-11.
287. Le Leu RK, Young GP, McIntosh GH. Folate deficiency diminishes the occurrence of
aberrant crypt foci in the rat colon but does not alter global DNA methylation status. J
Gastroenterol Hepatol. 2000;15(10):1158-64.
288. Maloney CA, Hay SM, Rees WD. Folate deficiency during pregnancy impacts on methyl
metabolism without affecting global DNA methylation in the rat fetus. Br J Nutr. 2007;
97(6):1090-8.
76
289. Finnell RH, Spiegelstein O, Wlodarczyk B, Triplett A, Pogribny IP, Melnyk S, et al.
DNA methylation in Folbp1 knockout mice supplemented with folic acid during
gestation. J Nutr. 2002;132(8):2457S-2461S.
290. Kotsopoulos J, Sohn KJ, Kim YI. Postweaning dietary folate deficiency provided through
childhood to puberty permanently increases genomic DNA methylation in adult rat liver.
J Nutr. 2008;138(4):703-9.
291. Dolinoy DC, Huang D, Jirtle RL. Maternal nutrient supplementation counteracts
bisphenol A-induced DNA hypomethylation in early development. Proc Natl Acad Sci U
S A. 2007;104(32):13056-61.
292. Kannan-Thulasiraman P, Katsoulidis E, Tallman MS, Arthur JS, Platanias LC. Activation
of the mitogen-and stress-activated kinase 1 by arsenic trioxide. J Biol Chem.
2006;281(32):22446-22452.
293. Yi P, Melnyk S, Pogribna M, Pogribny IP, Hine RJ, James SJ. Increase in plasma
homocysteine associated with parallel increases in plasma S-adenosylhomocysteine and
lymphocyte DNA hypomethylation. J Biol Chem. 2000;275(38):29318-29323.
294. Fryer AA, Nafee TM, Ismail KM, Carroll WD, Emes RD, Farrell WE. LINE-1 DNA
methylation is inversely correlated with cord plasma homocysteine in man: a preliminary
study. Epigenetics. 2009;4(6):394-398.
295. Friso S, Choi SW, Girelli D, Mason JB, Dolnikowski GG, Bagley PJ, et al. A common
mutation in the 5,10-methylenetetrahydrofolate reductase gene affects genomic DNA
methylation through an interaction with folate status. Proc Natl Acad Sci U S A.
2002;99(8):5606-11.
296. Stern LL, Mason JB, Selhub J, Choi SW. Genomic DNA hypomethylation, a
characteristic of most cancers, is present in peripheral leukocytes of individuals who are
homozygous for the C677T polymorphism in the methylenetetrahydrofolate reductase
gene. Cancer Epidemiol Biomarkers Prev. 2000;9(8):849-53.
297. Castro R, Rivera I, Ravasco P, Camilo ME, Jakobs C, Blom HJ, et al. 5,10-
methylenetetrahydrofolate reductase (MTHFR) 677C→ T and 1298A→ C mutations are
associated with DNA hypomethylation. J Med Genet. 2004;41(6):454-458.
298. Jacob RA, Gretz DM, Taylor PC, James SJ, Pogribny IP, Miller BJ, et al. Moderate folate
depletion increases plasma homocysteine and decreases lymphocyte DNA methylation in
postmenopausal women. J Nutr. 1998;128(7):1204-1212.
299. Rampersaud GC, Kauwell GP, Hutson AS, Cerda JJ, Bailey LB. Genomic DNA
methylation decreases in response to moderate folate depletion in elderly women. Am J
Clin Nutr. 2000;72(4):998-1003.

77
300. Kok DE, Dhonukshe-Rutten RA, Lute C, Heil SG, Uitterlinden AG, van der Velde N, et
al. Effects of long-term daily folic acid and vitamin B12 supplementation on genome-
wide DNA methylation in elderly subjects. Clin Epigenetics. 2014;7:121.
301. Crider KS, Quinlivan EP, Berry RJ, Hao L, Li Z, Maneval D, et al. Genomic DNA
methylation changes in response to folic acid supplementation in a population-based
intervention study among women of reproductive age. PLoS One. 2011;6(12):12.
302. Boeke CE, Baccarelli A, Kleinman KP, Burris HH, Litonjua AA, Rifas-Shiman SL, et al.
Gestational intake of methyl donors and global LINE-1 DNA methylation in maternal
and cord blood: prospective results from a folate-replete population. Epigenetics.
2012;7(3):253-260.
303. Davison JM, Mellott TJ, Kovacheva VP, Blusztajn JK. Gestational choline supply
regulates methylation of histone H3, expression of histone methyltransferases G9a
(Kmt1c) and Suv39h1 (Kmt1a), and DNA methylation of their genes in rat fetal liver and
brain. J Biol Chem. 2009;284(4):1982-1989.
304. Sadhu MJ, Guan Q, Li F, Sales-Lee J, Iavarone AT, Hammond MC, et al. Nutritional
control of epigenetic processes in yeast and human cells. Genetics. 2013;195(3):831-844.
305. Mehedint MG, Niculescu MD, Craciunescu CN, Zeisel SH. Choline deficiency alters
global histone methylation and epigenetic marking at the Re1 site of the calbindin 1 gene.
FASEB J. 2010;24(1):184-195.
306. Lambrot R, Xu C, Saint-Phar S, Chountalos G, Cohen T, Paquet M, et al. Low paternal
dietary folate alters the mouse sperm epigenome and is associated with negative
pregnancy outcomes. Nat Commun. 2013;4:2889.
307. Pogribny IP, Ross SA, Tryndyak VP, Pogribna M, Poirier LA, Karpinets TV. Histone H3
lysine 9 and H4 lysine 20 trimethylation and the expression of Suv4-20h2 and Suv-39h1
histone methyltransferases in hepatocarcinogenesis induced by methyl deficiency in rats.
Carcinogenesis. 2006;27(6):1180-1186.
308. Latham JA and Dent SY. Cross-regulation of histone modifications. Nat Struct Mol Biol.
2007;14(11):1017-1024.
309. Bistulfi G, Vandette E, Matsui S, Smiraglia DJ. Mild folate deficiency induces genetic
and epigenetic instability and phenotype changes in prostate cancer cells. BMC Biol.
2010;8(1):6.
310. Luka Z, Moss F, Loukachevitch LV, Bornhop DJ, Wagner C. Histone demethylase LSD1
is a folate-binding protein. Biochemistry. 2011;50(21):4750-4756.
78
311. Luka Z, Pakhomova S, Loukachevitch LV, Calcutt MW, Newcomer ME, Wagner C.
Crystal structure of the histone lysine specific demethylase LSD1 complexed with
tetrahydrofolate. Protein Sci. 2014;23(7):993-998.
312. Garcia BA, Luka Z, Loukachevitch LV, Bhanu NV, Wagner C. Folate Deficiency Affects
Histone Methylation. Med Hypotheses. 2016;88:63-67.
313. Piyathilake CJ, Macaluso M, Celedonio JE, Badiga S, Bell WC, Grizzle WE. Mandatory
fortification with folic acid in the United States appears to have adverse effects on histone
methylation in women with pre-cancer but not in women free of pre-cancer. Int J
Womens Health. 2009;1:131.
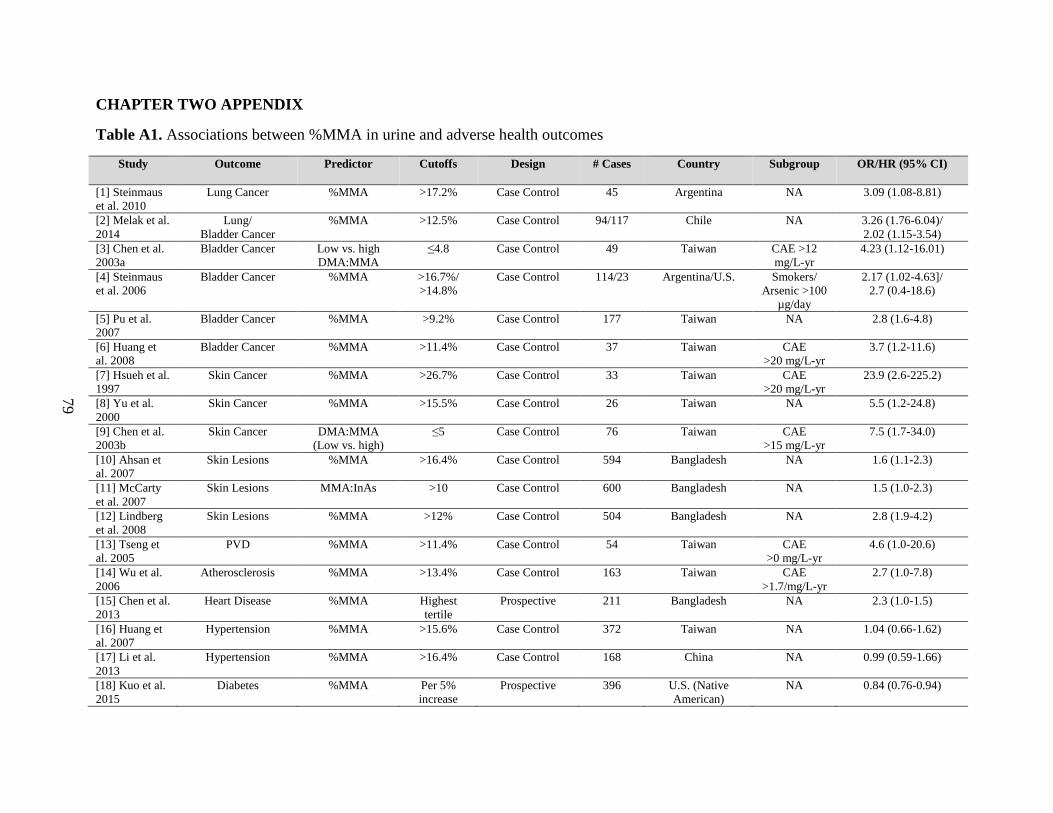
79
CHAPTER TWO APPENDIX
Table A1. Associations between %MMA in urine and adverse health outcomes
Study Outcome Predictor Cutoffs Design # Cases Country Subgroup OR/HR (95% CI)
[1] Steinmaus
et al. 2010
Lung Cancer %MMA >17.2% Case Control 45 Argentina NA 3.09 (1.08-8.81)
[2] Melak et al.
2014
Lung/
Bladder Cancer
%MMA >12.5% Case Control 94/117 Chile NA 3.26 (1.76-6.04)/
2.02 (1.15-3.54)
[3] Chen et al.
2003a
Bladder Cancer Low vs. high
DMA:MMA
≤4.8 Case Control 49 Taiwan CAE >12
mg/L-yr
4.23 (1.12-16.01)
[4] Steinmaus
et al. 2006
Bladder Cancer %MMA >16.7%/
>14.8%
Case Control 114/23 Argentina/U.S. Smokers/
Arsenic >100
µg/day
2.17 (1.02-4.63]/
2.7 (0.4-18.6)
[5] Pu et al.
2007
Bladder Cancer %MMA >9.2% Case Control 177 Taiwan NA 2.8 (1.6-4.8)
[6] Huang et
al. 2008
Bladder Cancer %MMA >11.4% Case Control 37 Taiwan CAE
>20 mg/L-yr
3.7 (1.2-11.6)
[7] Hsueh et al.
1997
Skin Cancer %MMA >26.7% Case Control 33 Taiwan CAE
>20 mg/L-yr
23.9 (2.6-225.2)
[8] Yu et al.
2000
Skin Cancer %MMA >15.5% Case Control 26 Taiwan NA 5.5 (1.2-24.8)
[9] Chen et al.
2003b
Skin Cancer DMA:MMA
(Low vs. high)
≤5 Case Control 76 Taiwan CAE
>15 mg/L-yr
7.5 (1.7-34.0)
[10] Ahsan et
al. 2007
Skin Lesions %MMA >16.4% Case Control 594 Bangladesh NA 1.6 (1.1-2.3)
[11] McCarty
et al. 2007
Skin Lesions MMA:InAs >10 Case Control 600 Bangladesh NA 1.5 (1.0-2.3)
[12] Lindberg
et al. 2008
Skin Lesions %MMA >12% Case Control 504 Bangladesh NA 2.8 (1.9-4.2)
[13] Tseng et
al. 2005
PVD %MMA >11.4% Case Control 54 Taiwan CAE
>0 mg/L-yr
4.6 (1.0-20.6)
[14] Wu et al.
2006
Atherosclerosis %MMA >13.4% Case Control 163 Taiwan CAE
>1.7/mg/L-yr
2.7 (1.0-7.8)
[15] Chen et al.
2013
Heart Disease %MMA Highest
tertile
Prospective 211 Bangladesh NA 2.3 (1.0-1.5)
[16] Huang et
al. 2007
Hypertension %MMA >15.6% Case Control 372 Taiwan NA 1.04 (0.66-1.62)
[17] Li et al.
2013
Hypertension %MMA >16.4% Case Control 168 China NA 0.99 (0.59-1.66)
[18] Kuo et al.
2015
Diabetes %MMA Per 5%
increase
Prospective 396 U.S. (Native
American)
NA 0.84 (0.76-0.94)
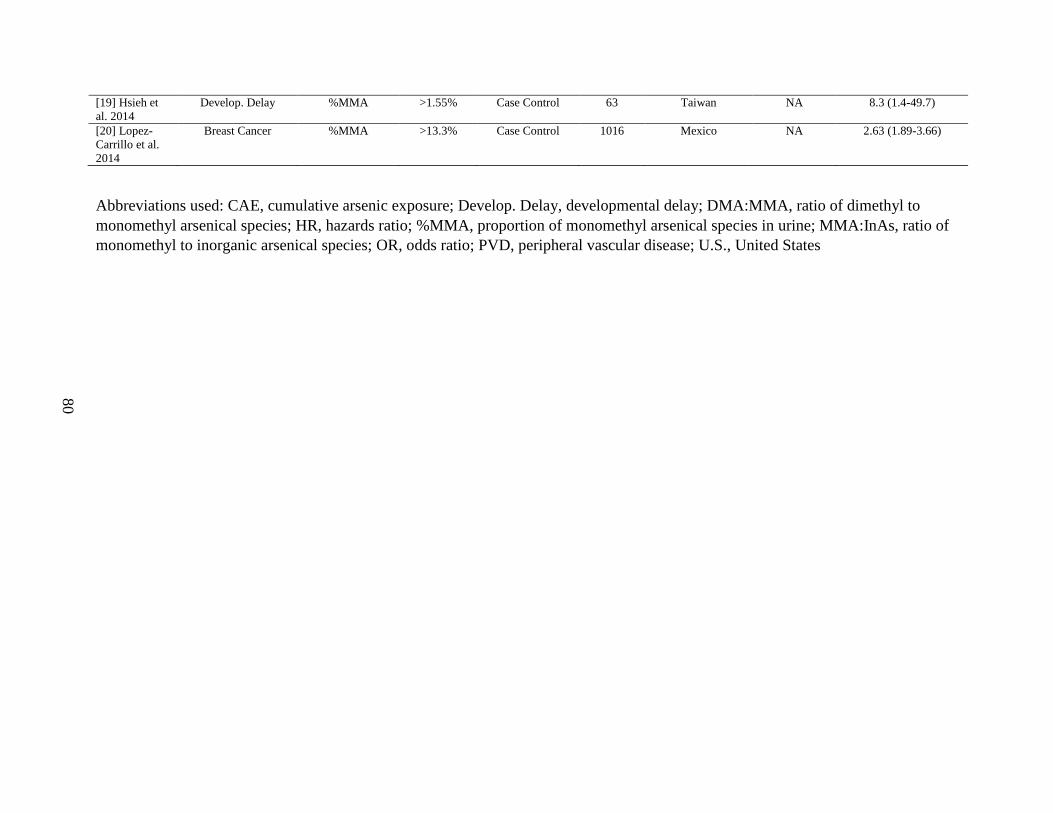
80
[19] Hsieh et
al. 2014
Develop. Delay %MMA >1.55% Case Control 63 Taiwan NA 8.3 (1.4-49.7)
[20] Lopez-
Carrillo et al.
2014
Breast Cancer %MMA >13.3% Case Control 1016 Mexico NA 2.63 (1.89-3.66)
Abbreviations used: CAE, cumulative arsenic exposure; Develop. Delay, developmental delay; DMA:MMA, ratio of dimethyl to
monomethyl arsenical species; HR, hazards ratio; %MMA, proportion of monomethyl arsenical species in urine; MMA:InAs, ratio of
monomethyl to inorganic arsenical species; OR, odds ratio; PVD, peripheral vascular disease; U.S., United States
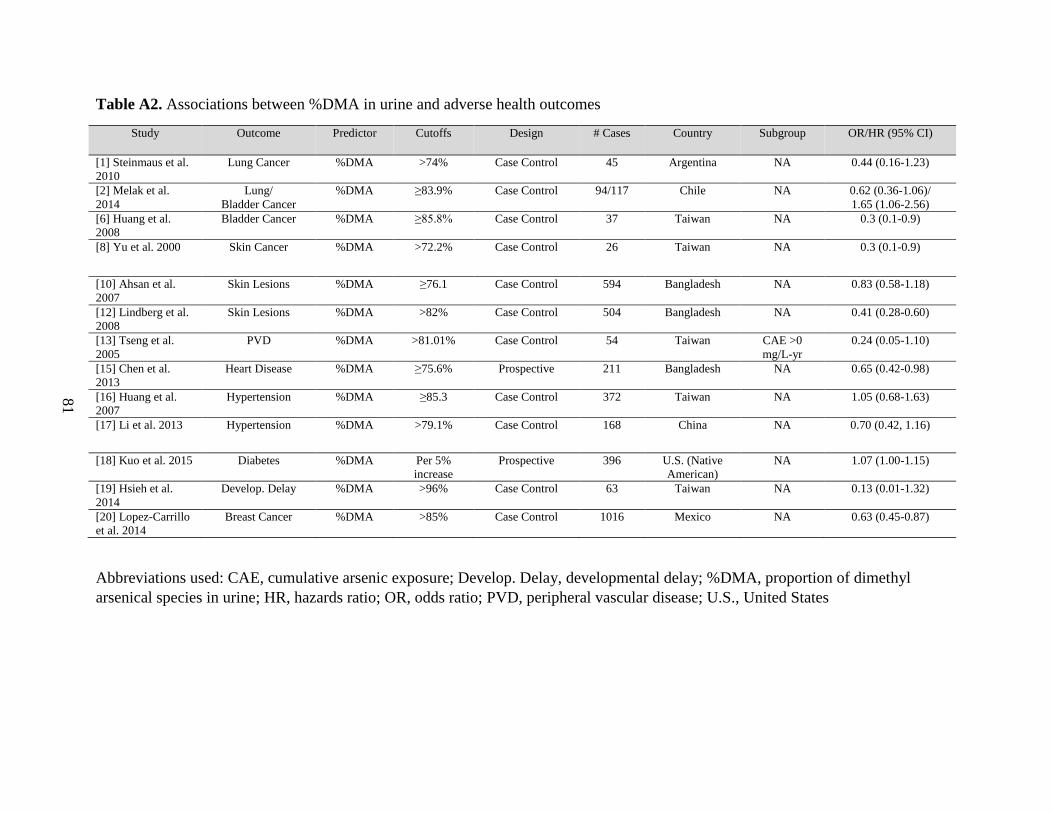
81
Table A2. Associations between %DMA in urine and adverse health outcomes
Study Outcome Predictor Cutoffs Design # Cases Country Subgroup OR/HR (95% CI)
[1] Steinmaus et al.
2010
Lung Cancer %DMA >74% Case Control 45 Argentina NA 0.44 (0.16-1.23)
[2] Melak et al.
2014
Lung/
Bladder Cancer
%DMA ≥83.9% Case Control 94/117 Chile NA 0.62 (0.36-1.06)/
1.65 (1.06-2.56)
[6] Huang et al.
2008
Bladder Cancer %DMA ≥85.8% Case Control 37 Taiwan NA 0.3 (0.1-0.9)
[8] Yu et al. 2000 Skin Cancer %DMA >72.2% Case Control 26 Taiwan NA 0.3 (0.1-0.9)
[10] Ahsan et al.
2007
Skin Lesions %DMA ≥76.1 Case Control 594 Bangladesh NA 0.83 (0.58-1.18)
[12] Lindberg et al.
2008
Skin Lesions %DMA >82% Case Control 504 Bangladesh NA 0.41 (0.28-0.60)
[13] Tseng et al.
2005
PVD %DMA >81.01% Case Control 54 Taiwan CAE >0
mg/L-yr
0.24 (0.05-1.10)
[15] Chen et al.
2013
Heart Disease %DMA ≥75.6% Prospective 211 Bangladesh NA 0.65 (0.42-0.98)
[16] Huang et al.
2007
Hypertension %DMA ≥85.3 Case Control 372 Taiwan NA 1.05 (0.68-1.63)
[17] Li et al. 2013 Hypertension %DMA >79.1% Case Control 168 China NA 0.70 (0.42, 1.16)
[18] Kuo et al. 2015 Diabetes %DMA Per 5%
increase
Prospective 396 U.S. (Native
American)
NA 1.07 (1.00-1.15)
[19] Hsieh et al.
2014
Develop. Delay %DMA >96% Case Control 63 Taiwan NA 0.13 (0.01-1.32)
[20] Lopez-Carrillo
et al. 2014
Breast Cancer %DMA >85% Case Control 1016 Mexico NA 0.63 (0.45-0.87)
Abbreviations used: CAE, cumulative arsenic exposure; Develop. Delay, developmental delay; %DMA, proportion of dimethyl
arsenical species in urine; HR, hazards ratio; OR, odds ratio; PVD, peripheral vascular disease; U.S., United States
82
CHAPTER TWO APPENDIX REFERENCES
1. Steinmaus C, Yuan Y, Kalman D, Omar RA, Skibola CF, Dauphine D, et al. Individual
differences in arsenic metabolism and lung cancer in a case-control study in Cordoba,
Argentina. Toxicol Appl Pharmacol. 2010;247(2):138-145.
2. Melak D, Ferreccio C, Kalman D, Parra R, Acevedo J, Perez L, et al. Arsenic methylation
and lung and bladder cancer in a case-control study in northern Chile. Toxicol Appl
Pharmacol. 2014;274(2):225-231.
3. Chen YC, Su HJ, Guo YL, Hsueh YM, Smith TJ, Ryan LM, et al. Arsenic methylation
and bladder cancer risk in Taiwan. Cancer Causes Control. 2003;14(4):303-310.
4. Steinmaus C, Bates MN, Yuan Y, Kalman D, Atallah R, Rey OA, et al. Arsenic
methylation and bladder cancer risk in case–control studies in Argentina and the United
States. J Occup Environ Med. 2006;48(5):478-488.
5. Pu YS, Yang SM, Huang YK, Chung CJ, Huang SK, Chiu AW, et al. Urinary arsenic
profile affects the risk of urothelial carcinoma even at low arsenic exposure. Toxicol
Appl Pharmacol. 2007;218(2):99-106.
6. Huang YK, Huang YL, Hsueh YM, Yang MH, Wu MM, et al. Arsenic exposure, urinary
arsenic speciation, and the incidence of urothelial carcinoma: a twelve-year follow-up
study. Cancer Causes Control. 2008;19(8):829-839.
7. Hsueh YM, Chiou HY, Huang YL, Wu WL, Huang CC, Yang MH, et al. Serum beta-
carotene level, arsenic methylation capability, and incidence of skin cancer. Cancer
Epidemiol Biomarkers Prev.1997;6(8):589-596.
8. Yu RC, Hsu KH, Chen CJ, Froines JR. Arsenic methylation capacity and skin cancer.
Cancer Epidemiol Biomarkers Prev. 2000;9(11):1259-1262.
9. Chen YC, Guo YL, Su HJ, Hsueh YM, Smith TJ, Ryan LM, et al. Arsenic methylation
and skin cancer risk in southwestern Taiwan. J Occup Environ Med. 2003;45(3):241-248.
10. Ahsan H, Chen Y, Kibriya MG, Slavkovich V, Parvez F, Jasmine F, et al. Arsenic
metabolism, genetic susceptibility, and risk of premalignant skin lesions in Bangladesh.
Cancer Epidemiol Biomarkers Prev. 2007;16(6):1270-1278.
11. McCarty KM, Chen YC, Quamruzzaman Q, Rahman M, Mahiuddin G, Hsueh YM, et al.
Arsenic methylation, GSTT1, GSTM1, GSTP1 polymorphisms, and skin lesions. Environ
Health Perspect. 2007;115(30:341-345.
83
12. Lindberg AL, Rahman M, Persson LA, Vahter M. The risk of arsenic induced skin
lesions in Bangladeshi men and women is affected by arsenic metabolism and the age at
first exposure. Toxicol Appl Pharmacol. 2008;230(1):9-16.
13. Tseng CH, Huang YK, Huang YL, Chung CJ, Yang MH, Chen CJ, et al. Arsenic
exposure, urinary arsenic speciation, and peripheral vascular disease in blackfoot disease-
hyperendemic villages in Taiwan. Toxicol Appl Pharmacol. 2005;206(3):299-308.
14. Wu MM, Chiou HY, Hsueh YM, Hong CT, Su CL, Chang SF, et al. Effect of plasma
homocysteine level and urinary monomethylarsonic acid on the risk of arsenic-associated
carotid atherosclerosis. Toxicology and applied pharmacology. 2006;216(1):168-175.
15. Chen Y, Wu F, Liu M, Parvez F, Slavkovich V, Eunus M, et al. A prospective study of
arsenic exposure, arsenic methylation capacity, and risk of cardiovascular disease in
Bangladesh. Environ Health Perspect. 2013;121(7):832.
16. Huang YK, Tseng CH, Huang YL, Yang MH, Chen CJ, Hsueh YM. Arsenic methylation
capability and hypertension risk in subjects living in arseniasis-hyperendemic areas in
southwestern Taiwan. Toxicol Appl Pharmacol. 2007;218(2):135-142.
17. Li X, Li B, Xi S, Zheng Q, Wang D, Sun G. Association of urinary monomethylated
arsenic concentration and risk of hypertension: a cross-sectional study from arsenic
contaminated areas in northwestern China. Environ Health, 2013;12:37.
18. Kuo CC, Howard BV, Umans JG, Gribble MO, Best LG, Francesconi KA, et al. Arsenic
Exposure, Arsenic Metabolism, and Incident Diabetes in the Strong Heart Study.
Diabetes Care. 2015;38(4):620-627.
19. Hsieh RL, Huang YL, Shiue HS, Huang SR, Lin MI, Mu SC, et al. Arsenic methylation
capacity and developmental delay in preschool children in Taiwan. Int J Hyg Environ
Health. 2014;217(6):678-686.
20. Lopez-Carrillo L, Hernandez-Ramirez RU, Gandolfi AJ, Ornelas-Aguirre JM, Torres-
Sanchez L, Cebrian ME. Arsenic methylation capacity is associated with breast cancer in
northern Mexico. Toxicol Appl Pharmacol. 2014;280(1):53-59.
84
CHAPTER THREE
Folate and cobalamin modify associations between S-adenosylmethionine and methylated
arsenic metabolites in arsenic-exposed, Bangladeshi adults
Caitlin G. Howe1 Megan M. Niedzwiecki1, Megan N. Hall2, Xinhua Liu3, Vesna Ilievski1,
Vesna Slavkovich1, Shafiul Alam4, Abu B. Siddique4, Joseph H. Graziano1, and Mary V.
Gamble1
Affiliations: Departments of 1Environmental Health Sciences, 2Epidemiology,
3Biostatistics, Mailman School of Public Health, Columbia University, New
York NY,10032, USA; 4Columbia University Arsenic Project in Bangladesh, Dhaka, Bangladesh
Published: http://www.ncbi.nlm.nih.gov/pubmed/24598884
Howe CG, Niedzwiecki MM, Hall MN, Liu X, Ilievski V, Slavkovich V, Alam S, Siddique AB,
Graziano JH, Gamble MV. Folate and Cobalamin Modify Associations between S-
adenosylmethionine and Methylated Arsenic Metabolites in Arsenic-Exposed, Bangladeshi
Adults. Journal of Nutrition. PMID: 24598884.
85
ABSTRACT
Chronic exposure to inorganic arsenic (InAs) through drinking water is a major problem
worldwide. InAs undergoes hepatic methylation to form mono- and dimethyl arsenical species
(MMA and DMA, respectively), facilitating arsenic elimination. Both reactions are catalyzed by
arsenic (+3 oxidation state) methyltransferase (AS3MT) using S-adenosylmethionine (SAM) as
the methyl donor, yielding the methylated product and S-adenosylhomocysteine (SAH), a potent
product-inhibitor of AS3MT. SAM biosynthesis depends on folate- and cobalamin-dependent
one-carbon metabolism. With the use of samples from 353 participants in the Folate and
Oxidative Stress study, our objective was to test the hypotheses that blood SAM and SAH
concentrations are associated with arsenic methylation and that these associations differ
by folate and cobalamin nutritional status. Blood SAM and SAH were measured by HPLC.
Arsenic metabolites in blood and urine were measured by HPLC coupled to dynamic reaction
cell inductively coupled plasma MS. In linear regression analyses, SAH was not associated with
any of the arsenic metabolites. However, log(SAM) was negatively associated with log(%
urinary InAs) (β: -0.11; 95% CI: -0.19, -0.02; P = 0.01), and folate and cobalamin nutritional
status significantly modified associations between SAM and the percentage of blood MMA
(%bMMA) and the percentage of blood DMA (%bDMA) (P = 0.02 and P = 0.01, respectively).
In folate- and cobalamin-deficient individuals, log(SAM) was positively associated with
%bMMA (β: 6.96; 95% CI: 1.86, 12.05; P < 0.01) and negatively associated with %bDMA (β: -
6.19; 95% CI: -12.71, 0.32; P = 0.06). These findings suggest that when exposure to InAs is
high, and methyl groups are limiting, SAM is used primarily for MMA synthesis rather than for
DMA synthesis, contributing additional evidence that nutritional status may explain some of the

86
interindividual differences in arsenic metabolism and, consequently, susceptibility to arsenic
toxicity.
INTRODUCTION
Worldwide, approximately 140 million people are exposed to arsenic at concentrations
that exceed the safe drinking water guideline set by the World Health Organization (10 μg/L) [1–
3], and >57 million of those exposed live in Bangladesh [4]. Exposure to arsenic is associated
with cancers of the skin, lung, bladder, liver, and kidney [5–8] in addition to non-cancer
outcomes including peripheral vascular disease [9], atherosclerosis [10], hypertension [11],
peripheral neuropathy [12], and decreased intellectual function in children [13]. However,
individuals vary in their susceptibility to arsenic-induced health outcomes, and some of this
interindividual variation may be explained by differences in arsenic metabolism [14]. In
contaminated drinking water, arsenic is present as inorganic arsenic (InAs). Ingested InAs can be
methylated to form mono- and dimethyl arsenical species (MMA and DMA, respectively)
(Figure 1), thereby facilitating arsenic elimination, because DMA has a shorter circulating half-
life than does InAs and is rapidly excreted in urine [14]. Arsenic-exposed individuals who have a
higher proportion of MMA and a lower proportion of DMA in their urine have an increased risk
of developing adverse health outcomes [15]. Therefore, methylation of arsenic to DMA is
considered a detoxification pathway [14].
Both steps of arsenic methylation are catalyzed by arsenic (+3 oxidation state)
methyltransferase (AS3MT) and require a methyl group from S-adenosylmethionine (SAM) [16].
Synthesis of SAM via one-carbon metabolism (OCM) depends on folate in the form of 5-
methyltetrahydrofolate (5-mTHF) and cobalamin; the latter acts as a cofactor for methionine
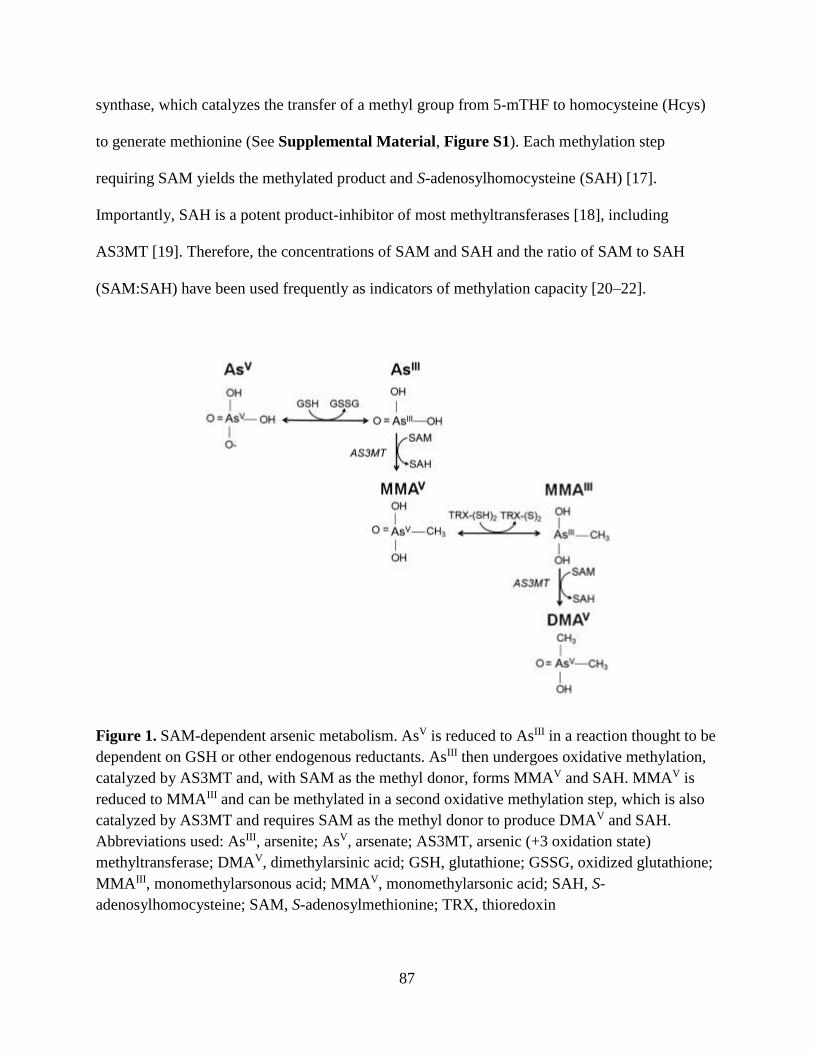
87
synthase, which catalyzes the transfer of a methyl group from 5-mTHF to homocysteine (Hcys)
to generate methionine (See Supplemental Material, Figure S1). Each methylation step
requiring SAM yields the methylated product and S-adenosylhomocysteine (SAH) [17].
Importantly, SAH is a potent product-inhibitor of most methyltransferases [18], including
AS3MT [19]. Therefore, the concentrations of SAM and SAH and the ratio of SAM to SAH
(SAM:SAH) have been used frequently as indicators of methylation capacity [20–22].
Figure 1. SAM-dependent arsenic metabolism. AsV is reduced to AsIII in a reaction thought to be
dependent on GSH or other endogenous reductants. AsIII then undergoes oxidative methylation,
catalyzed by AS3MT and, with SAM as the methyl donor, forms MMAV and SAH. MMAV is
reduced to MMAIII and can be methylated in a second oxidative methylation step, which is also
catalyzed by AS3MT and requires SAM as the methyl donor to produce DMAV and SAH.
Abbreviations used: AsIII, arsenite; AsV, arsenate; AS3MT, arsenic (+3 oxidation state)
methyltransferase; DMAV, dimethylarsinic acid; GSH, glutathione; GSSG, oxidized glutathione;
MMAIII, monomethylarsonous acid; MMAV, monomethylarsonic acid; SAH, S-
adenosylhomocysteine; SAM, S-adenosylmethionine; TRX, thioredoxin

88
Previously, our group reported that folic acid (FA) supplementation in folate-deficient
adults enhances methylation of InAs to DMA [23]. Because SAM synthesis relies on folate- and
cobalamin-dependent OCM (See Supplemental Material, Figure S1), FA supplementation
facilitates arsenic methylation by regenerating this methyl donor. However, the relations between
blood SAM and SAH and arsenic methylation have not been examined in a human population.
Therefore, the objective of this study was to test the hypothesis that blood SAM, like plasma
folate, is associated with increased arsenic methylation, whereas blood SAH is associated with
decreased arsenic methylation. We hypothesized that SAM would be negatively associated with
the percentage of InAs (%InAs) for all participants. However, we predicted that the relations
between SAM and the methylated metabolites (%MMA and %DMA) would differ between
individuals who were sufficient or deficient for folate and cobalamin, because the relation
between SAM and the methylated arsenic metabolites may depend on whether or not SAM is
limiting.
STUDY PARTICIPANTS AND METHODS
Study region. Our study site, which is the site of the Health Effects of Arsenic Longitudinal
Study (HEALS) cohort [24], is currently a 35-km2 area within Araihazar, Bangladesh, which is
situated ~30 km east of Dhaka.
Participants. The Folate and Oxidative Stress (FOX) study is a cross-sectional study in 378
participants selected from 5 water arsenic (wAs)–exposure categories [<10 μg/L (n = 76), 10–
100 μg/L (n = 104), 101–200 μg/L (n = 86), 201–300 μg/L (n = 67), and >300 μg/L (n = 45)
[25]] who were recruited between February and July of 2008. This study had 2 major aims: 1) to
study the dose-response relation between wAs exposure and oxidative stress [25, 26] and 2) to
study the hypotheses outlined herein. Participants between the ages of 30 and 65 y were eligible.
89
The following individuals were excluded: 1) women who were pregnant, 2) participants taking
nutritional supplements, and 3) participants with known diabetes, cardiovascular or renal disease,
or other diseases known to be associated with oxidative stress. Bangladeshi field staff physicians
obtained informed consent after reading an approved consent form to study participants. This
study was approved by both the Bangladesh Medical Research Council and the Institutional
Review Board of Columbia University Medical Center.
General characteristics of study participants. General characteristics of the study participants
(Table 1) were obtained by questionnaire. Body mass index (BMI) was calculated by using the
measured height and weight of each participant. Dietary intakes of folate and cobalamin were
determined by food frequency questionnaire [27].
Sample collection and handling. During each participant’s visit to our field clinic, a physician
collected a venous blood sample. Spot urine samples were collected in 50-mL acid-washed
polypropylene tubes and frozen at –20°C. After blood samples underwent initial processing in
the field clinic, aliquots of blood and plasma were immediately frozen at -80°C. Samples were
then transported on dry ice to Dhaka by car where they were again stored in -80°C (blood and
plasma) or -20°C (urine) freezers. In Dhaka, samples were packed on dry ice and flown to
Columbia University.
Water arsenic. Field sample collection and laboratory analysis procedures are described
elsewhere in detail [28, 29]. Water samples were analyzed by high-resolution inductively
coupled plasma MS after 1:10 dilution and addition of Ge to correct fluctuations in instrument
sensitivity. The detection limit of the method is typically <0.2 mg/L. Arsenic standards of known
concentration were run multiple times in each batch. The intra- and interassay CVs were 6.0%
and 3.8%, respectively.
90
Total blood arsenic. Total blood arsenic (bAs) concentrations were measured by using a Perkin-
Elmer Elan DRC II inductively coupled plasma mass spectrometer equipped with an AS 93+
autosampler, as described previously [30]. The intra- and interassay CVs were 3.2% and
5.7%, respectively.
Total urinary arsenic. Total urinary arsenic (uAs) concentrations were measured by graphite
furnace atomic absorption spectrometry [31] using the AAnalyst 600 graphite furnace system
(PerkinElmer), as previously described [25]. The intra- and interassay CVs were 3.8% and 5.1%,
respectively. A method based on the Jaffe reaction was used to measure urinary creatinine (uCr)
concentrations [32].
Blood and urine arsenic metabolites. Four arsenic metabolites [arsenite (AsIII), arsenate (AsV),
monomethylarsonous acid plus monomethylarsonic acid (MMAIII+V), and dimethylarsinous acid
plus dimethylarsinic acid (DMAIII+V)] were measured in blood and urine by coupling HPLC to
dynamic reaction cell inductively coupled plasma MS, as described previously [33]. The reduced
and oxidized forms of MMA and DMA cannot be separated by HPLC, so each metabolite is
measured as one variable (i.e., as MMAIII+V or DMAIII+V, respectively). All four bAs metabolites
could only be measured for individuals with bAs concentrations ≥5 μg/L. Each metabolite (with
AsIII + AsV combined as InAs) was calculated as a percentage of the total measured uAs or bAs.
The intra-assay CVs for urinary AsIII, AsV, MMA, and DMA were 3.6%, 4.5%, 1.5%, and 0.6%,
respectively; those for blood were 0.9%, 11.5%, 3.6%, and 2.6%, respectively. The inter-assay
CVs for urinary metabolites were 9.7%, 10.6%, 3.5%, and 2.8%, respectively, whereas those for
blood were 3.7%, 23.2%, 2.9%, and 3.5%, respectively.
91
Plasma folate and cobalamin. A radio-protein-binding assay (SimulTRACS; MP Biomedicals)
was used to measure folate and cobalamin, as previously described [25, 33]. The within- and
between-day CVs for folate were 9% and 14%, respectively, and for cobalamin these were 5%
and 9%, respectively.
Plasma total Hcys. Hcys concentrations were measured in plasma by HPLC with fluorescence
detection [34]. The within- and between-day CVs were 2% and 9%, respectively.
SAM and SAH. SAM and SAH were measured as described by Wise et al. [35] in whole blood.
Briefly, samples were thawed and mixed on a vortex, and 400 µL of blood was added to 200 µL
of 0.1 mol/L sodium acetate, pH 6.0, and 160 µL 40% trichloroacetic acid. After 30 min of
incubation on ice, tubes were centrifuged for 10 min at 20,817 x g. An aliquot of 200 µL of the
supernatant was filtered by using a 0.45-µm Ultra free MC filter (Millipore) and centrifuged for
3 min at 2,655 x g for measurement of SAM. For SAH, the remaining supernatant was extracted
twice with 100 µL of diethyl ether followed by filtration with another 0.45-µm filter. SAM and
SAH were separated by reversed phase HPLC on a 25 x 0.46 cm (5-µm particle size) column
(Beckman Instruments) by using a mobile phase consisting of 50 mmol/L NaH2PO4 and 10
mmol/L heptane sulfonic acid in 18% methanol, adjusted to pH 4.38 with phosphoric acid at a
flow rate of 0.9 mL/min. The running column was preceded by a precolumn filter (ChromTech).
By using a 996 Photodiode Array UV absorbance detector (Waters), SAM and SAH were
detected at 254 nm and were quantitated by comparing the integrated areas under HPLC peaks
with standard curves generated by using purified SAM and SAH (Sigma). The interassay CVs
for SAM and SAH were 9.6% and 16.1%, respectively.
92
Statistical analyses. Of the 378 participants recruited for the FOX study, 353 had complete
information for the predictor variables (SAM and SAH), urine outcome variables (%uAs
metabolites), and potential confounders. Descriptive statistics were calculated for general
characteristics of this study sample, including for arsenic metabolites and nutrition variables;
these values are reported as medians (ranges) for continuous variables and as frequencies (%) for
categorical variables. The Wilcoxon rank-sum test was used to detect differences in quantitative
variables, including SAM and SAH, by dichotomous characteristics, including folate and
cobalamin nutritional status (i.e., deficient vs. sufficient). Folate and cobalamin deficiencies were
defined by using cutpoints from Christenson et al., as follows: plasma folate <9 nmol/L and
plasma cobalamin <151 pmol/L [36]. Spearman correlation coefficients, reported as rho (ρ),
were used to assess bivariate relations between quantitative variables including SAM and SAH
concentrations, arsenic metabolites, and other continuous measures. To examine the bivariate
relations between blood InAs (bInAs) or blood MMA (bMMA) and the ratio of blood DMA
(bDMA) to bMMA (bDMA:bMMA), scatterplots and corresponding LOESS curves were plotted
in R (R Foundation) using the default smoothing parameter 0.7. Spearman
correlations were used to evaluate the statistical significance of the bivariate relations.
Linear regression models were used to evaluate the relation between each of the
predictors (SAM, SAH, SAM:SAH) and the outcome variables [% urinary InAs (uInAs), %
urinary MMA (uMMA), % urinary DMA (uDMA), %bInAs, %bMMA, %bDMA)]. The
estimated regression coefficient for each predictor of interest is reported as β (95% CI) and P
value. Because bAs metabolites could only be measured for individuals with total bAs
concentrations ≥5 µg/L, the sample size for bAs outcomes (%bAs metabolites) was smaller (n =
276) than the sample size for uAs outcomes (%uAs metabolites) (n = 353). To meet model
93
assumptions, a natural log transformation (log) was applied to arsenic metabolites with skewed
distributions (%uInAs, %uMMA, %bInAs) for approximate normality. To satisfy the linearity
assumption for regression models, SAM, SAH, SAM:SAH, age, BMI, folate, and cobalamin
were log-transformed, and a square root transformation was applied to wAs. Potential control
variables included sex, age, BMI, folate and cobalamin (measured continuously), television
ownership (an indicator of socioeconomic status in this population), years of education, cigarette
smoking status (ever or never smoker), uCr, estimated glomerular filtration rate, and amount of
time (days) that blood samples were stored at -80°C before SAM and SAH analysis by HPLC.
All linear regression models were adjusted for age, smoking status, sex, wAs exposure, and
blood sample storage time at -80°C. Results were not altered appreciably after further adjusting
for television ownership, years of education, BMI, folate, cobalamin, or estimated glomerular
filtration rate, so these variables were not included in the final models. The associations between
SAM, SAH, SAM:SAH, and arsenic metabolites were also assessed stratified by folate and
cobalamin status. The Wald test was used to detect differences between strata in the covariate-
adjusted regression coefficient for SAM with respect to methylated bAs metabolites. Because a
subset of individuals were deficient for both folate and cobalamin, stratified analyses were also
performed in the following four groups: deficient for both nutrients, deficient for folate only,
deficient for cobalamin only, sufficient for both nutrients. Due to the small sample size of the
group deficient for both folate and cobalamin (n = 32), the final models for the 4 groups were
adjusted for a restricted set of variables: sex, wAs, and blood sample storage time at -80°C,
because the exclusion of the covariates age and cigarette smoking status from regression models
did not appreciably alter the coefficient for SAM. SAS and R were used to conduct all statistical
analyses, and a significance level of 0.05 was used.
94
RESULTS
General characteristics of study participants. Descriptive statistics for general characteristics of
the FOX participants are shown in Table 1. By design, the participants were between the ages of
30 and 63 y. Approximately 32.9% of the participants were underweight (BMI <18.5 kg/m2).
Median (range) dietary intakes of folate and cobalamin were 241 (86–674) µg/d and 1.32 (0.09–
6.25) µg/d, respectively (Table 1); thus, in FOX participants the average dietary intakes of these
B vitamins were below the recommended dietary allowances for adults (folate: 400 µg/d;
cobalamin: 2.4 µg/d) [37, 38]. Prevalences (%) of folate and cobalamin deficiencies were 30.3%
and 34.8%, respectively. Due to the study design, the mean wAs exposure was 140 µg/L, which
is 14-fold higher than the World Health Organization standard of 10 μg/L. In blood, on average,
the %MMA exceeded the %InAs or %DMA. Conversely, in urine, the mean %DMA was higher
than the mean %InAs or %MMA.
SAM and SAH concentrations and relations with other indices of OCM. The relations between
SAM, SAH, and other bivariate variables are reported in Supplemental Material, Table S1.
SAH concentrations were significantly higher in folate-deficient individuals compared with
folate-sufficient individuals. SAM concentrations did not differ by folate nutritional status.
However, SAM concentrations were significantly higher in cobalamin-sufficient individuals.
Correlations between nutrition variables are reported in Supplemental Material, Table S2.
SAM and folate were not significantly correlated. However, SAM was positively correlated with
cobalamin (r = 0.17, P = 0.01). SAH was negatively correlated with folate (r = -0.15, P < 0.01)
and positively correlated with Hcys (r = 0.18, P < 0.001).
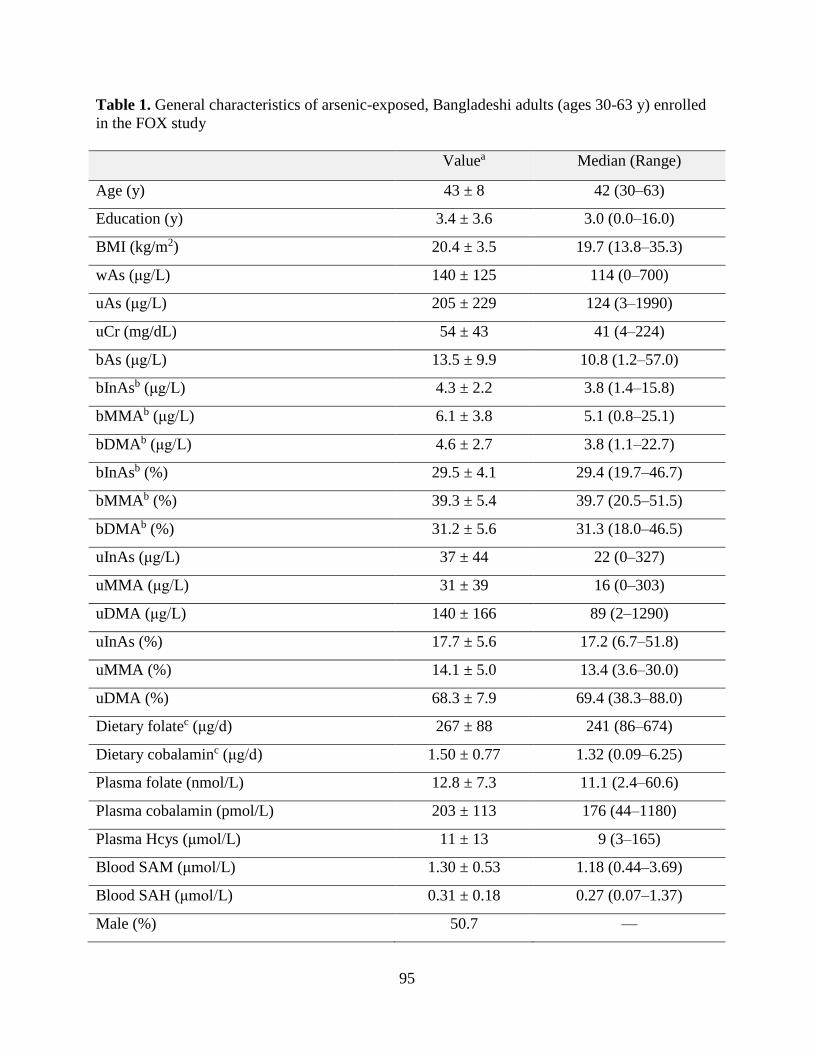
95
Table 1. General characteristics of arsenic-exposed, Bangladeshi adults (ages 30-63 y) enrolled
in the FOX study
Valuea Median (Range)
Age (y) 43 ± 8 42 (30–63)
Education (y) 3.4 ± 3.6 3.0 (0.0–16.0)
BMI (kg/m2) 20.4 ± 3.5 19.7 (13.8–35.3)
wAs (μg/L) 140 ± 125 114 (0–700)
uAs (μg/L) 205 ± 229 124 (3–1990)
uCr (mg/dL) 54 ± 43 41 (4–224)
bAs (μg/L) 13.5 ± 9.9 10.8 (1.2–57.0)
bInAsb (μg/L) 4.3 ± 2.2 3.8 (1.4–15.8)
bMMAb (μg/L) 6.1 ± 3.8 5.1 (0.8–25.1)
bDMAb (μg/L) 4.6 ± 2.7 3.8 (1.1–22.7)
bInAsb (%) 29.5 ± 4.1 29.4 (19.7–46.7)
bMMAb (%) 39.3 ± 5.4 39.7 (20.5–51.5)
bDMAb (%) 31.2 ± 5.6 31.3 (18.0–46.5)
uInAs (μg/L) 37 ± 44 22 (0–327)
uMMA (μg/L) 31 ± 39 16 (0–303)
uDMA (μg/L) 140 ± 166 89 (2–1290)
uInAs (%) 17.7 ± 5.6 17.2 (6.7–51.8)
uMMA (%) 14.1 ± 5.0 13.4 (3.6–30.0)
uDMA (%) 68.3 ± 7.9 69.4 (38.3–88.0)
Dietary folatec (μg/d) 267 ± 88 241 (86–674)
Dietary cobalaminc (μg/d) 1.50 ± 0.77 1.32 (0.09–6.25)
Plasma folate (nmol/L) 12.8 ± 7.3 11.1 (2.4–60.6)
Plasma cobalamin (pmol/L) 203 ± 113 176 (44–1180)
Plasma Hcys (μmol/L) 11 ± 13 9 (3–165)
Blood SAM (μmol/L) 1.30 ± 0.53 1.18 (0.44–3.69)
Blood SAH (μmol/L) 0.31 ± 0.18 0.27 (0.07–1.37)
Male (%) 50.7 —
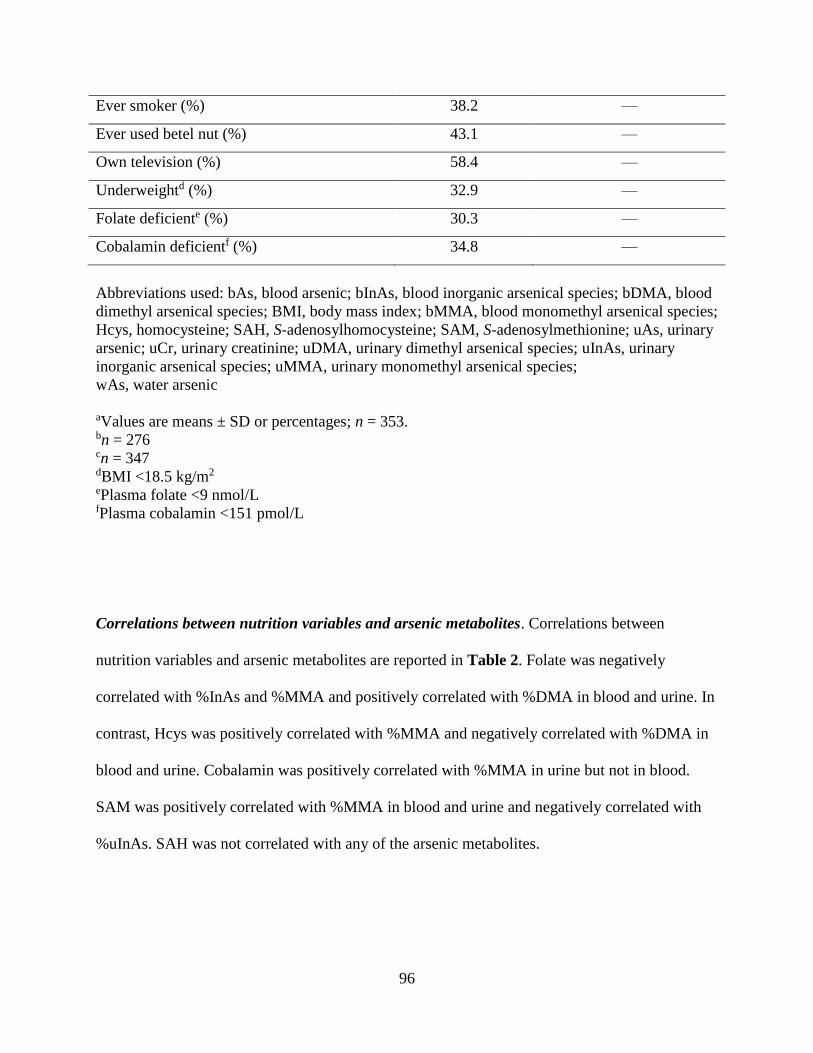
96
Ever smoker (%) 38.2 —
Ever used betel nut (%) 43.1 —
Own television (%) 58.4 —
Underweightd (%) 32.9 —
Folate deficiente (%) 30.3 —
Cobalamin deficientf (%) 34.8 —
Abbreviations used: bAs, blood arsenic; bInAs, blood inorganic arsenical species; bDMA, blood
dimethyl arsenical species; BMI, body mass index; bMMA, blood monomethyl arsenical species;
Hcys, homocysteine; SAH, S-adenosylhomocysteine; SAM, S-adenosylmethionine; uAs, urinary
arsenic; uCr, urinary creatinine; uDMA, urinary dimethyl arsenical species; uInAs, urinary
inorganic arsenical species; uMMA, urinary monomethyl arsenical species;
wAs, water arsenic
aValues are means ± SD or percentages; n = 353. bn = 276 cn = 347 dBMI <18.5 kg/m2 ePlasma folate <9 nmol/L fPlasma cobalamin <151 pmol/L
Correlations between nutrition variables and arsenic metabolites. Correlations between
nutrition variables and arsenic metabolites are reported in Table 2. Folate was negatively
correlated with %InAs and %MMA and positively correlated with %DMA in blood and urine. In
contrast, Hcys was positively correlated with %MMA and negatively correlated with %DMA in
blood and urine. Cobalamin was positively correlated with %MMA in urine but not in blood.
SAM was positively correlated with %MMA in blood and urine and negatively correlated with
%uInAs. SAH was not correlated with any of the arsenic metabolites.
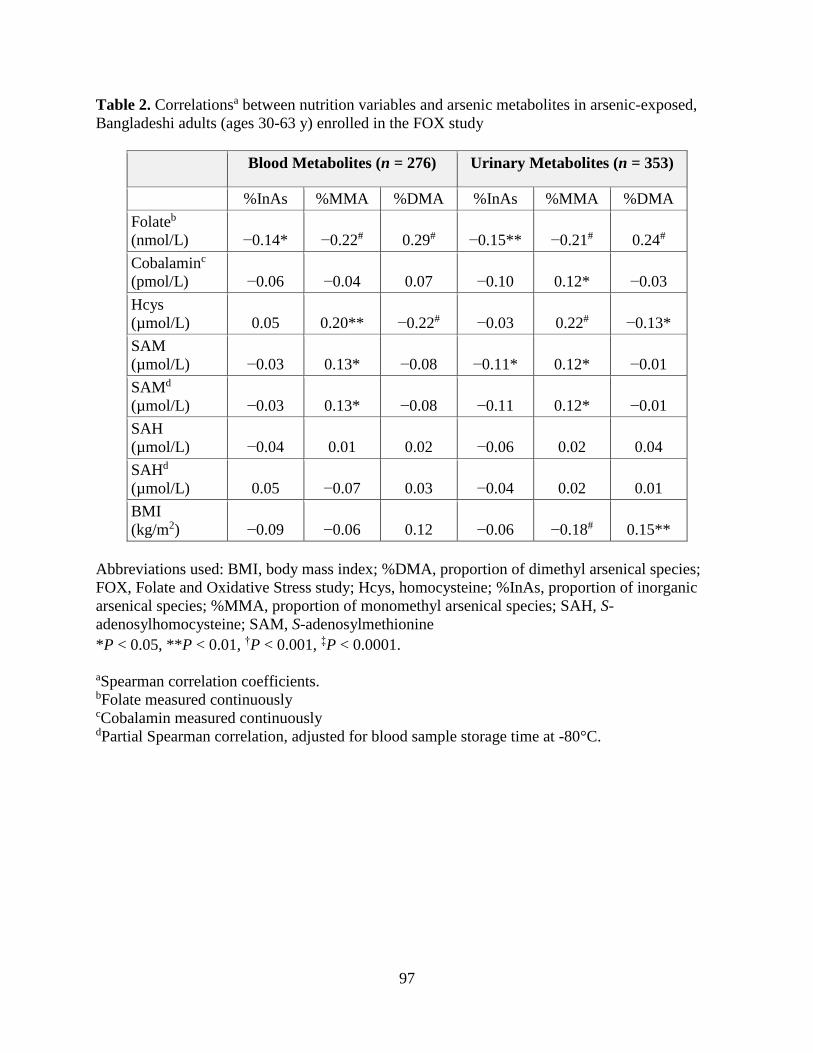
97
Table 2. Correlationsa between nutrition variables and arsenic metabolites in arsenic-exposed,
Bangladeshi adults (ages 30-63 y) enrolled in the FOX study
Blood Metabolites (n = 276) Urinary Metabolites (n = 353)
%InAs %MMA %DMA %InAs %MMA %DMA
Folateb
(nmol/L) −0.14* −0.22# 0.29# −0.15** −0.21# 0.24#
Cobalaminc
(pmol/L) −0.06 −0.04 0.07 −0.10 0.12* −0.03
Hcys
(µmol/L) 0.05 0.20** −0.22# −0.03 0.22# −0.13*
SAM
(µmol/L) −0.03 0.13* −0.08 −0.11* 0.12* −0.01
SAMd
(µmol/L) −0.03 0.13* −0.08 −0.11 0.12* −0.01
SAH
(µmol/L) −0.04 0.01 0.02 −0.06 0.02 0.04
SAHd
(µmol/L) 0.05 −0.07 0.03 −0.04 0.02 0.01
BMI
(kg/m2) −0.09 −0.06 0.12 −0.06 −0.18# 0.15**
Abbreviations used: BMI, body mass index; %DMA, proportion of dimethyl arsenical species;
FOX, Folate and Oxidative Stress study; Hcys, homocysteine; %InAs, proportion of inorganic
arsenical species; %MMA, proportion of monomethyl arsenical species; SAH, S-
adenosylhomocysteine; SAM, S-adenosylmethionine
*P < 0.05, **P < 0.01, †P < 0.001, ‡P < 0.0001.
aSpearman correlation coefficients. bFolate measured continuously cCobalamin measured continuously dPartial Spearman correlation, adjusted for blood sample storage time at -80°C.

98
Relation between blood arsenic metabolites. bDMA:bMMA decreased with increasing
concentrations of bInAs or bMMA (Figure 2). The Spearman correlations between bInAs or
bMMA and bDMA:bMMA were negative and significant (P < 0.05).
Figure 2. Scatterplots and LOESS curves showing relations between bDMA:bMMA and bInAs
(A) or bMMA (B) in arsenic-exposed, Bangladeshi adults (ages 30-63 y) enrolled in the FOX
study (n = 353). The black line is the smoothed regression line, with bDMA:bMMA as the
outcome and bInAs or bMMA concentration (μg/L) as the predictor. The gray shading is the
corresponding 95% confidence band. Abbreviations used: bDMA:bMMA, ratio of dimethyl to
monomethyl arsenical species in blood; bInAs, blood inorganic arsenical species; bMMA, blood
monomethyl arsenical species; FOX, Folate and Oxidative Stress study
99
SAM, SAH, and SAM:SAH as predictors of arsenic methylation. In regression analyses, after
adjusting for age, sex, wAs, cigarette smoking status, and blood sample storage time at -80°C,
there was a significant negative association between log(SAM) and log(%uInAs) (β: -0.11; 95%
CI: -0.19, -0.02; P = 0.01) (Table 3). No other significant associations were observed between
SAM and the arsenic metabolites (Table 3). SAH and SAM:SAH were not significantly
associated with any of the arsenic metabolites (Table 3). The results from the urinary metabolite
analyses were very similar after restricting the sample size to participants with measured blood
arsenic metabolites. The results were not appreciably altered when SAM and SAH were included
simultaneously in the regression models, nor were the results altered after adjusting for folate or
cobalamin as continuous predictors in the model. In analyses stratified by folate status,
log(SAM) was positively and significantly associated with %bMMA in those who were folate
deficient (β: 3.49; 95% CI: 0.40, 6.59; P = 0.03) but not in those who were folate sufficient (β: -
0.43; 95% CI: -2.47, 1.61; P = 0.68) (Table 4). Stratifying by cobalamin status revealed similar
findings; although not statistically significant, log(SAM) was positively associated with
%bMMA in those who were deficient for cobalamin (β: 2.58; 95% CI: -0.44, 5.60; P = 0.09) but
not in those who were sufficient for cobalamin (β: 0.15; 95% CI: -1.93, 2.24; P = 0.90). The
Wald test for the difference in the association between SAM and %bMMA across folate strata
was significant (P = 0.04). SAM was also negatively associated with %bDMA in the cobalamin-
deficient group (P = 0.01); this was not observed in the folate-deficient group. The association
between SAM and %bDMA differed significantly between cobalamin strata (P < 0.01).
Although the patterns of association were similar for uAs metabolites, the positive associations
between log(SAM) and log(%MMA) in folate-deficient participants (β: 0.17; 95% CI: -0.01,
0.35; P = 0.07) and cobalamin-deficient participants (β: 0.15; 95% CI: -0.03, 0.32; P = 0.10) did
100
not achieve statistical significance (Supplemental Material, Tables S3 and S4). When
individuals were stratified into four groups on the basis of joint folate and cobalamin status, there
was a strong, positive association between log(SAM) and %bMMA in individuals who were
deficient for both folate and cobalamin (β: 6.96; 95% CI: 1.86, 12.05; P < 0.01) (Table 5). The
Wald test for overall differences in the association between SAM and %bMMA across the four
nutrition groups was significant (P = 0.02), mainly due to the difference between those who were
deficient for both folate and cobalamin and those who were sufficient for the two nutrients (P <
0.01). In individuals deficient for cobalamin and in individuals deficient for both folate and
cobalamin, there was a negative association between SAM and %bDMA, although these
associations were not significant (0.05 < P < 0.10). However, the Wald test for overall
differences in the association between SAM and %bDMA across the four nutrition groups was
significant (P = 0.01) and was driven by the differences between those who were sufficient for
both nutrients and those who were deficient for both nutrients (P < 0.01) or deficient for
cobalamin only (P = 0.02).
DISCUSSION
In vitro [16, 39] and animal [40] studies have established that SAM is necessary for the
methylation of InAs to MMA and for the methylation of MMA to DMA and that SAH inhibits
both of these methylation steps [19]. However, the relations between SAM and the percentage of
arsenic metabolites in human populations may be particularly complex for 2 reasons: 1) there
is competition between InAs and MMA for methylation, because both methylation steps are
catalyzed by AS3MT and require a methyl group from SAM, and 2) these relations may depend
on nutritional status, because SAM is synthesized via folate- and cobalamin-dependent OCM. In
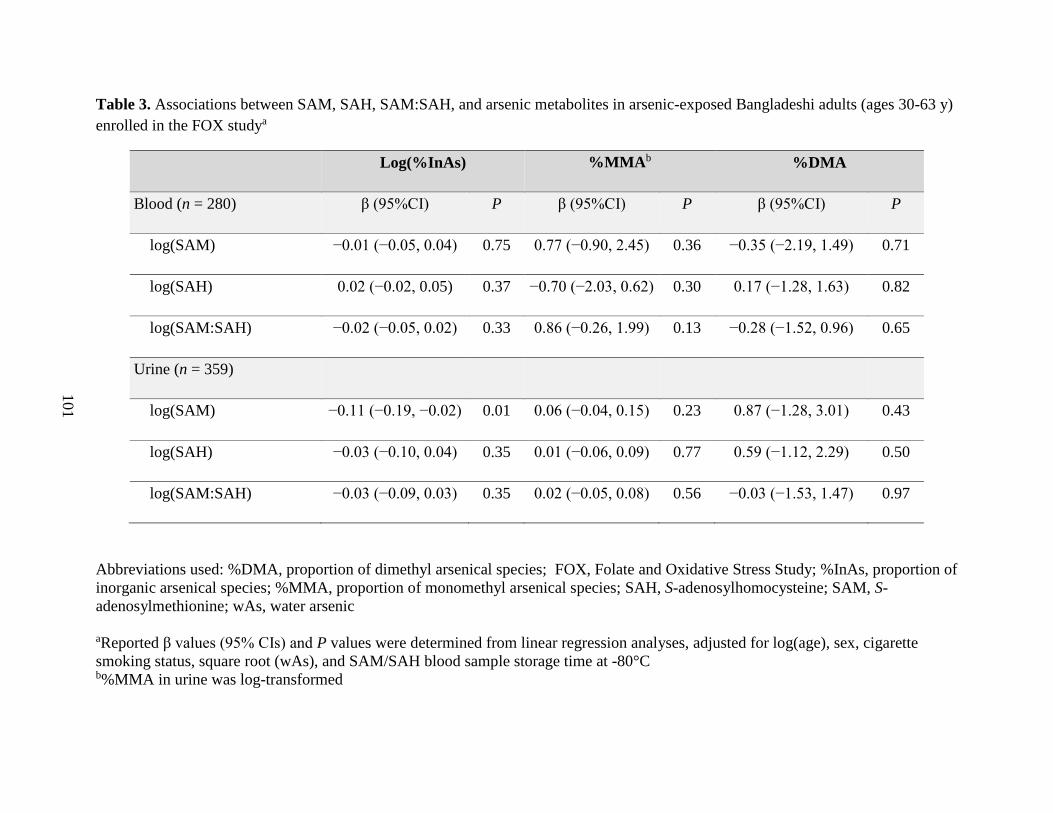
101
Table 3. Associations between SAM, SAH, SAM:SAH, and arsenic metabolites in arsenic-exposed Bangladeshi adults (ages 30-63 y)
enrolled in the FOX studya
Log(%InAs) %MMAb %DMA
Blood (n = 280) β (95%CI) P β (95%CI) P β (95%CI) P
log(SAM) −0.01 (−0.05, 0.04) 0.75 0.77 (−0.90, 2.45) 0.36 −0.35 (−2.19, 1.49) 0.71
log(SAH) 0.02 (−0.02, 0.05) 0.37 −0.70 (−2.03, 0.62) 0.30 0.17 (−1.28, 1.63) 0.82
log(SAM:SAH) −0.02 (−0.05, 0.02) 0.33 0.86 (−0.26, 1.99) 0.13 −0.28 (−1.52, 0.96) 0.65
Urine (n = 359)
log(SAM) −0.11 (−0.19, −0.02) 0.01 0.06 (−0.04, 0.15) 0.23 0.87 (−1.28, 3.01) 0.43
log(SAH) −0.03 (−0.10, 0.04) 0.35 0.01 (−0.06, 0.09) 0.77 0.59 (−1.12, 2.29) 0.50
log(SAM:SAH) −0.03 (−0.09, 0.03) 0.35 0.02 (−0.05, 0.08) 0.56 −0.03 (−1.53, 1.47) 0.97
Abbreviations used: %DMA, proportion of dimethyl arsenical species; FOX, Folate and Oxidative Stress Study; %InAs, proportion of
inorganic arsenical species; %MMA, proportion of monomethyl arsenical species; SAH, S-adenosylhomocysteine; SAM, S-
adenosylmethionine; wAs, water arsenic
aReported β values (95% CIs) and P values were determined from linear regression analyses, adjusted for log(age), sex, cigarette
smoking status, square root (wAs), and SAM/SAH blood sample storage time at -80°C b%MMA in urine was log-transformed
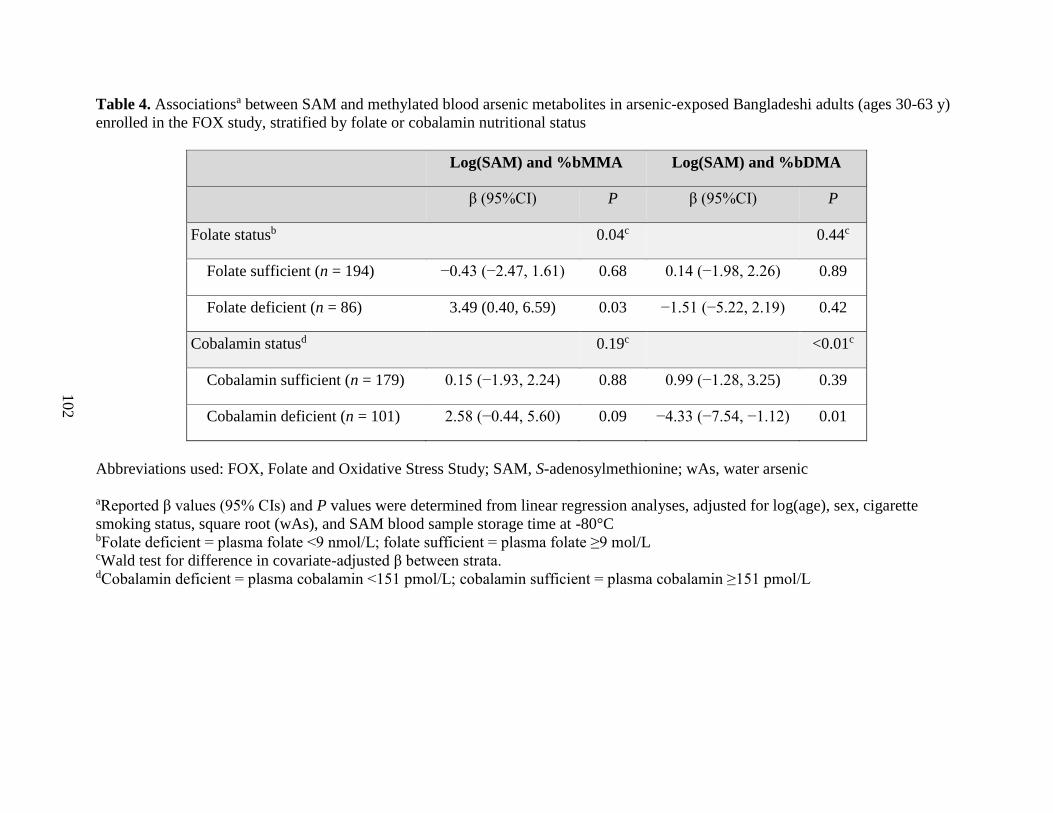
102
Table 4. Associationsa between SAM and methylated blood arsenic metabolites in arsenic-exposed Bangladeshi adults (ages 30-63 y)
enrolled in the FOX study, stratified by folate or cobalamin nutritional status
Log(SAM) and %bMMA Log(SAM) and %bDMA
β (95%CI) P β (95%CI) P
Folate statusb
0.04c
0.44c
Folate sufficient (n = 194) −0.43 (−2.47, 1.61) 0.68 0.14 (−1.98, 2.26) 0.89
Folate deficient (n = 86) 3.49 (0.40, 6.59) 0.03 −1.51 (−5.22, 2.19) 0.42
Cobalamin statusd
0.19c
<0.01c
Cobalamin sufficient (n = 179) 0.15 (−1.93, 2.24) 0.88 0.99 (−1.28, 3.25) 0.39
Cobalamin deficient (n = 101) 2.58 (−0.44, 5.60) 0.09 −4.33 (−7.54, −1.12) 0.01
Abbreviations used: FOX, Folate and Oxidative Stress Study; SAM, S-adenosylmethionine; wAs, water arsenic
aReported β values (95% CIs) and P values were determined from linear regression analyses, adjusted for log(age), sex, cigarette
smoking status, square root (wAs), and SAM blood sample storage time at -80°C bFolate deficient = plasma folate <9 nmol/L; folate sufficient = plasma folate ≥9 mol/L cWald test for difference in covariate-adjusted β between strata. dCobalamin deficient = plasma cobalamin <151 pmol/L; cobalamin sufficient = plasma cobalamin ≥151 pmol/L
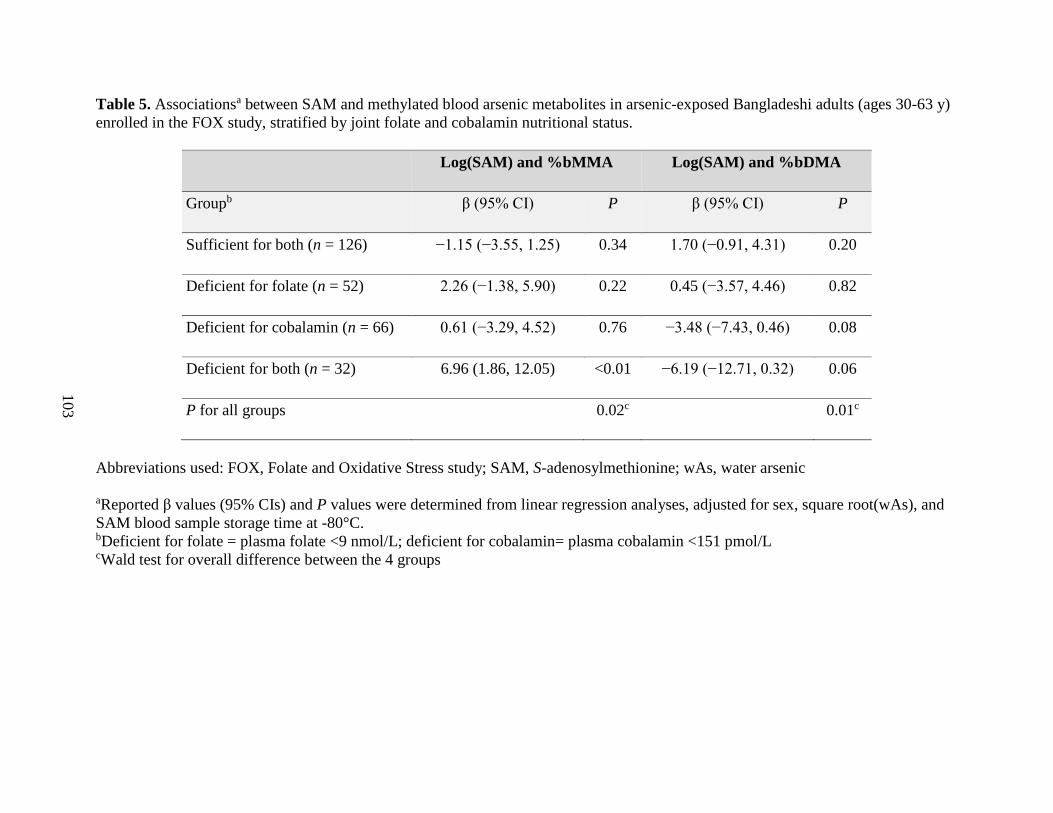
103
Table 5. Associationsa between SAM and methylated blood arsenic metabolites in arsenic-exposed Bangladeshi adults (ages 30-63 y)
enrolled in the FOX study, stratified by joint folate and cobalamin nutritional status.
Log(SAM) and %bMMA Log(SAM) and %bDMA
Groupb β (95% CI) P β (95% CI) P
Sufficient for both (n = 126) −1.15 (−3.55, 1.25) 0.34 1.70 (−0.91, 4.31) 0.20
Deficient for folate (n = 52) 2.26 (−1.38, 5.90) 0.22 0.45 (−3.57, 4.46) 0.82
Deficient for cobalamin (n = 66) 0.61 (−3.29, 4.52) 0.76 −3.48 (−7.43, 0.46) 0.08
Deficient for both (n = 32) 6.96 (1.86, 12.05) <0.01 −6.19 (−12.71, 0.32) 0.06
P for all groups
0.02c
0.01c
Abbreviations used: FOX, Folate and Oxidative Stress study; SAM, S-adenosylmethionine; wAs, water arsenic
aReported β values (95% CIs) and P values were determined from linear regression analyses, adjusted for sex, square root(wAs), and
SAM blood sample storage time at -80°C. bDeficient for folate = plasma folate <9 nmol/L; deficient for cobalamin= plasma cobalamin <151 pmol/L cWald test for overall difference between the 4 groups
104
a cross-sectional study in arsenic-exposed adults in Bangladesh, our group previously observed
that folate was negatively correlated with %InAs and %MMA and positively correlated with
%DMA in urine, suggesting that folate facilitates the methylation of InAs to DMA [41]; we also
observed this in the current study. However, in our previous study, we did not analyze blood
SAM and SAH concentrations.
With the use of purified recombinant human AS3MT, Song et al. [42] demonstrated that
when SAM concentrations are <0.5 mmol/L, the rate of MMA synthesis exceeds the rate of
DMA synthesis. Although there are few estimates of human liver SAM concentrations in healthy
individuals, reported SAM concentrations in rat liver vary from 60 to 160 μmol/L [43–45].
Therefore, according to the findings of Song et al. [42], the rate of MMA production should
exceed the rate of DMA production at physiologically relevant concentrations of SAM.
Consistent with this, we observed that the mean %MMA exceeded the mean %DMA in blood.
Song et al. [42] also observed that with increasing InAs concentrations, the %MMA increases,
the %DMA decreases, and the ratio of DMA to MMA decreases. Similarly, Styblo et al. [46]
demonstrated that human hepatocytes exposed to increasing concentrations of InAs produce
more MMA and less DMA. These studies indicate that the second step of arsenic methylation is
inhibited by InAs. Evidence from mathematical modeling also suggests that MMA can inhibit its
own methylation, likely due to substrate inhibition (Michael Reed and Fred Nijhout, Duke
University, personal communication). Thus, methylation of InAs to MMA may predominate over
the methylation of MMA to DMA in individuals who are continuously exposed to high
concentrations of InAs, such as the current study participants, because 1) high amounts of InAs
compete with MMA for methylation and 2) the second methylation step is inhibited by MMA.
Our finding of a decrease in bDMA:bMMA with increasing concentrations of bInAs and bMMA
105
is consistent with this. Furthermore, our observation that SAM is positively associated with
%bMMA but only in folate- and cobalamin-deficient participants suggests that limiting SAM
concentrations further reduces the ability to methylate MMA to DMA.
Although we had anticipated a strong positive association between SAM and %bDMA in
folate- and cobalamin-sufficient participants, many of the FOX participants were drinking from
wells with very high wAs concentrations; thus, the null association between SAM and %bDMA
in sufficient participants may reflect the strong inhibition of DMA synthesis by InAs and MMA.
Alternatively, it may reflect saturation of the AS3MT at higher concentrations of SAM.
Although Song et al. [42] observed that within the range of physiologically relevant
concentrations of SAM, DMA production increases with increasing SAM concentrations,
glutathione was the only reductant used in their assays; other groups have demonstrated that
arsenic methylation is more efficient in the presence of other reductants, such as thioredoxin
[47]. Thus, saturation of AS3MT may occur at lower physiologically relevant concentrations of
SAM.
Because folate and cobalamin are involved in SAM synthesis, a simplistic prediction was
that both folate and cobalamin would be positively correlated with blood SAM concentrations.
However, SAM was not correlated with plasma folate in the FOX participants. Increasing SAM
concentrations leads to inhibition of methylenetetrahydrofolate reductase through long-range
allosteric interactions, such that production of 5-mTHF decreases when SAM concentrations
increase. This negative feedback loop may explain why there is no observable correlation
between plasma 5-mTHF and SAM in our study. Loehrer et al. [48] similarly observed no
correlation between SAM and 5-mTHF in their case-control study examining the relation
between folate and coronary artery disease. As expected, in the FOX participants, plasma folate

106
was negatively correlated with both SAH and plasma Hcys concentrations and was positively
correlated with %DMA in blood and urine. Additionally, cobalamin was positively correlated
with SAM, and cobalamin-sufficient individuals had significantly higher SAM concentrations
than did cobalamin-deficient individuals. This finding is reasonable given that, unlike folate,
cobalamin concentrations are not regulated by SAM.
We did not find SAH to be significantly associated with any of the arsenic metabolites,
which was surprising given that SAH is a potent inhibitor of most SAM-dependent methylation
reactions in vitro [18]. However, it is important to note that we measured SAM and SAH in
blood, yet arsenic methylation primarily occurs in the liver. Although blood SAM and SAH
concentrations are considered indicators of methylation capacity and have been used as
biomarkers in several other studies [49–51], we are unaware of any studies that have directly
compared liver and whole-blood SAM and SAH concentrations. Although Hcys is readily
exported from cells [52], the transport of intact SAH across the plasma membrane is not well
characterized [53]. James et al. [53] proposed that Hcys may, in fact, serve as an exportable form
of SAH, because it is more readily transported out of the cell [54] and may therefore be a better
indicator of liver SAH concentrations than is blood SAH. As in previous studies, we found
plasma Hcys to be positively correlated with %MMA in blood and urine and negatively
correlated with %bDMA. If plasma Hcys is indeed a better indicator of hepatic SAH
concentrations than is blood SAH itself, these findings are consistent with inhibition of the
second methylation step of MMA to DMA by SAH in the liver.
The findings of this study have three major implications. First, the null associations
between SAH and the arsenic metabolites highlight the need for additional research examining
the utility of blood SAM and SAH (or alternatively plasma Hcys) as biomarkers of liver SAM
107
and SAH. Second, the inverse relation between either InAs or MMA and the ratio of DMA to
MMA indicates that arsenic metabolism may not be as efficient in populations that are
continuously exposed to high concentrations of InAs. Third, the observed positive association
between SAM and %bMMA in folate- and cobalamin-deficient individuals suggests that these
individuals may be particularly susceptible to arsenic-induced toxicity, because a higher %MMA
in urine has been associated with multiple adverse health outcomes [15]. Previously, we
observed that folate deficiency and hyperhomocysteinemia are risk factors for arsenic-induced
skin lesions [55]. The findings of this study contribute additional evidence that folate and
cobalamin deficiencies, and hyperhomocysteinemia, may help to explain a portion of the
interindividual variation in arsenic methylation capacity and in susceptibility to arsenic toxicity.
Although eliminating arsenic exposure should remain the primary target for reducing its toxicity,
this work and previous studies collectively indicate a significant need for public health
interventions directed toward alleviating these micronutrient deficiencies, particularly in arsenic-
exposed populations.
ACKNOWLEDGEMENTS
The authors thank Michael Reed and Fred Nijhout from Duke University for providing valuable
insight based on their findings from mathematical models of arsenic metabolism. This work was
supported by the following grants: RO1 CA133595, RO1 ES017875, P42 ES10349, P30
ES09089, and T32 CA0952925 from the NIH.
108
CHAPTER THREE REFERENCES
1. Bagchi S. Arsenic threat reaching global dimensions. CMAJ. 2007;177:1344–5.
2. Smith AH, Lingas E, Rahman M. Contamination of drinking-water by arsenic in
Bangladesh: a public health emergency. Bull World Health Organ. 2000;78:1093–103.
3. Kinniburgh D, Smedley PL, Davies J, Milne CJ, Gaus I, Trafford JM et al. The scale and
causes of the groundwater arsenic problem in Bangladesh. In: Arsenic in ground water:
geochemistry and occurrence. Editors:Welch AH, Stollenwerk KG. Boston: Kluwer
Academic Publishers: 2003. p. 211–57.
4. World Bank. 2005. Towards a more effective operational response: arsenic contamination
of groundwater in south and east asian countries. Vol. 1: Policy Report No. 31303.
5. Brown KG, Boyle KE, Chen CW, Gibb HJ. A dose-response analysis of skin cancer from
inorganic arsenic in drinking water. Risk Anal. 1989;9:519–28.
6. Hopenhayn-Rich C, Biggs ML, Smith AH. Lung and kidney cancer mortality associated
with arsenic in drinking water in Cordoba, Argentina. Int J Epidemiol. 1998;27:561–9.
7. Chiou H-Y, Hsueh Y-M, Liaw K-F, Horng S-F, Chiang M-H, Pu Y-S, et al. Incidence of
internal cancers and ingested inorganic arsenic: a seven year follow-up study in Taiwan.
Cancer Res. 1995;55:1296–300.
8. Hertz-Picciotto I, Smith AH. Observations on the dose-response curve for arsenic
exposure and lung cancer. Scand J Work Environ Health. 1993;19:217–26.
9. Tseng C-H, Huang, Y-K, Huang Y-L, Chung C-J, Yang M-H, Chen C-J, et al. Arsenic
exposure, urinary arsenic speciation, and peripheral vascular disease in Blackfoot disease
hyperendemic villages in Taiwan. Toxicol Appl Pharmacol. 2005;206:299–308.
10. Wu MM, Chiou HY, Hsueh YM, Hong CT, Su CL, Chang SF, et al. Effect of plasma
homocysteine level and urinary monomethylarsonic acid on the risk of arsenic-associated
carotid atherosclerosis. Toxicol Appl Pharmacol. 2006;216:168–75.
11. Huang YK, Tseng CH, Huang YL, Yang MH, Chen CJ, Hsueh YM. Arsenic methylation
capability and hypertension risk in subjects living in arseniasishyperendemic areas in
southwestern Taiwan. Toxicol Appl Pharmacol. 2007;218:135–42.
12. Hafeman DM, Ahsan H, Louis ED, Siddique AB, Slavkovich V, Cheng Z, et al.
Association between arsenic exposure and a measure of subclinical sensory neuropathy in
Bangladesh. J Occup Environ Med. 2005;47:778–84.
109
13. Wasserman GA, Liu X, Parvez F, Ahsan H, Factor-Litvak P, van Geen A, et al. Water
arsenic exposure and children’s intellectual function in Araihazar, Bangladesh. Environ
Health Perspect. 2004;112:1329–33.
14. Vahter M. Mechanisms of arsenic biotransformation. Toxicology. 2002;181–182:211–7.
15. Steinmaus C, Yuan Y, Kalman D, Rey OA, Skibola CF, Dauphine D, et al. Individual
differences in arsenic metabolism and lung cancer in a case control study in Cordoba,
Argentina. Toxicol Appl Pharmacol.
2010;247:138–45.
16. Buchet JP. Study of inorganic arsenic methylation by rat liver in vitro: relevance for the
interpretation of observations in man. Arch Toxicol. 1985;57:125–9.
17. Finkelstein J, Kyle KE, Harris BJ. Methionine metabolism in mammals: regulatory
effects of S-adenosylhomocysteine. Arch Biochem Biophys. 1974;165:744–8.
18. Eloranta TO, Kajander EO, Raina AM. A new method for the assay of tissue S-
adenosylhomocysteine and S-adenosylmethionine. Biochem J. 1976;160:287–94.
19. De Kimpe J, Cornelis R, Vanholder R. In vitro methylation of arsenite by rabbit liver
cytosol: effect of metal ions, metal chelating agents, methyltransferase inhibitors and
uremic toxins. Drug Chem Toxicol. 1999;22:613–28.
20. Cantoni GL. The role of S-adenosylhomocysteine in the biological utilization of S-
adenosylmethionine. Prog Clin Biol Res. 1985;198:47–65.
21. Chiang PK. Perturbation of biochemical transmethylations by 3- deazaadenosine in vivo.
Biochem Pharmacol. 1979;28:1897–902.
22. Hoffman DR, Marion DW, Cornatzer WE, Duerre JA. S-adenosylmethionine and S-
adenosylhomocysteine metabolism in isolated liver. J Biol Chem. 1980;255:10822–7.
23. Gamble MV, Liu X, Ahsan H, Pilsner JR, Ilievski V, Slavkovich V, et al. Folate and
arsenic metabolism: a double-blind, placebo-controlled folic acid–supplementation trial
in Bangladesh. Am J Clin Nutr. 2006;84:1093–101.
24. Ahsan H, Chen Y, Parvez F, Argos M, Hussain AI, Momotaj H, et al. Health Effects of
Arsenic Longitudinal Study (HEALS): description of a multidisciplinary epidemiologic
investigation. J Expo Sci Environ Epidemiol. 2006;16:191–205.
25. Hall MN, Niedzwiecki M, Liu X, Harper KN, Alam S, Slavkovich V, et al. Chronic
arsenic exposure and blood glutathione and glutathione disulfide concentrations in
Bangladeshi adults. Environ Health Perspect. 2013;121:1068–74.
110
26. Harper K, Liu X, Hall MN, Ilievski V, Oka J, Calancie L, et al. A dose-response study of
arsenic exposure markers of oxidative damage in Bangladesh. J Occup. Environ. Med. In
press 2014.
27. Chen Y, Ahsan H, Parvez F, Howe GR. Validity of a food-frequency questionnaire for a
large prospective cohort study in Bangladesh. Br J Nutr. 2004;92:851–9.
28. Cheng Z, Zheng Y, Mortlock R, Van Geen A. Rapid multi-element analysis of
groundwater by high-resolution inductively coupled plasma mass spectrometry. Anal
Bioanal Chem. 2004;379:512–8.
29. Van Geen A, Cheng Z, Seddique AA, Hoque MA, Gelman A, Graziano JH, et al.
Reliability of a commercial kit to test groundwater for arsenic in Bangladesh. Environ Sci
Technol. 2005;39:299–303.
30. Hall M, Chen Y, Ahsan H, Slavkovich V, van Geen A, Parvez F, et al. Blood arsenic as a
biomarker of arsenic exposure: results from a prospective study. Toxicology.
2006;225:225–33.
31. Nixon DE, Mussmann G, Eckdahl S, Moyer T. Total arsenic in urine: Palladium-
persulfate vs nickel as a matrix modifier for graphite furnace atomic absorption
spectrophotometry. Clin Chem. 1991;37:1575–9.
32. Slot C. Plasma creatinine determination: a new and specific Jaffe reaction method. Scand
J Clin Lab Invest. 1965;17:381–7.
33. Niedzwiecki MM, Hall MN, Liu X, Oka J, Harper KN, Slavkovich V, et al. A dose–
response study of arsenic exposure and global methylation of peripheral blood
mononuclear cell DNA in Bangladeshi adults. Environ Health Perspect. 2013;121:1306.
34. Pfeiffer CM, Caudill SP, Gunter EW, Osterloh J, Sampson EJ. Biochemical indicators of
B vitamin status in the US population after folic acid fortification: results from the
National Health and Nutrition Examination Survey 1999–2000. Am J Clin Nutr.
2005;82:442–50.
35. Wise CK, Cooney CA, Ali SF, Poirier LA. Measuring S-adenosylmethionine in whole
blood, red blood cells and cultured cells using a fast preparation method and high-
performance liquid chromatography. J Chromatogr B Biomed Sci Appl. 1997;696:145–
52.
36. Christenson RH, Dent GA, Tuszynski A. Two radioassays for serum vitamin B12 and
folate determination compared in a reference interval study. Clin Chem. 1985;31:1358–
60.
37. NIH. Dietary supplement fact sheet: vitamin B12. 2011 [cited 2014 Jan 26]. Available
from: http://ods.od.nih.gov/factsheets/VitaminB12-HealthProfessional/.
111
38. NIH. Dietary supplement fact sheet: folate. 2012 [cited 2014 Jan 26]. Available from:
http://ods.od.nih.gov/factsheets/Folate-HealthProfessional/.
39. Buchet JP. Role of thiols in the in vitro methylation of inorganic arsenic by rat liver
cytosol. Biochem Pharmacol. 1988;37:3149–53.
40. Takahashi KYH, Mashiko M, Yamamura Y. [Effect of S-adenosylmethionine on
methylation of inorganic arsenic.] Nippon Eiseigaku Zasshi. 1990;45:613–8.
41. Gamble MV, Liu X, Ahsan H, Pilsner JR, Ilievski V, Slavkovich V, et al. Folate,
homocysteine, and arsenic metabolism in arsenic-exposed individuals in Bangladesh.
Environ Health Perspect. 2005;113:1683–8.
42. Song X, Geng Z, Li X, Hu X, Bian N, Zhang X, et al. New insights into the mechanism
of arsenite methylation with the recombinant human arsenic (+3) methyltransferase
(hAS3MT). Biochimie. 2010;92:1397–406.
43. Finkelstein JD, Kyle WE, Harris BJ, Martin JJ. Methionine metabolism in mammals:
concentration of metabolites in rat tissues. J Nutr. 1982;112:1011.
44. Finkelstein JD, Martin JJ. Methionine metabolism in mammals: distribution of
homocysteine between competing pathways. J Biol Chem. 1984;259:9508–13.
45. Lawley SD, Cinderella M, Hall MN, Gamble MV, Nijhout HF, Reed MC. Mathematical
model insights into arsenic detoxification. Theor Biol Med Model. 2011;8:31.
46. Styblo M, Del Razo LM, LeCluyse EL, Hamilton GA, Wang C, Cullen WR, et al.
Metabolism of arsenic in primary cultures of human and rat hepatocytes. Chem Res
Toxicol. 1999;12:560–5.
47. Thomas DJ, Li J, Waters SB, Xing W, Adair BM, Drobna Z, et al. Arsenic (+3 oxidation
state) methyltransferase and the methylation of arsenicals. Exp Biol Med (Maywood).
2007;232:3–13.
48. Loehrer FM, Angst CP, Haefeli WE, Jordan PP, Ritz R, Fowler B. Low whole-blood S-
adenosylmethionine and correlation between 5-methyltetrahydrofolate and homocysteine
in coronary artery disease. Arterioscler Thromb Vasc Biol. 1996;16:727–33.
49. James SJ, Cutler P, Melnyk S, Jernigan S, Janak L, Gaylor DW, et al. Metabolic
biomarkers of increased oxidative stress and impaired methylation capacity in children
with autism. Am J Clin Nutr. 2004;80:1611–7.
50. Obeid R, Schadt A, Dillmann U, Kostopoulos P, Fassbender K, Herrmann W.
Methylation status and neurodegenerative markers in Parkinson disease. Clin Chem.
2009;55:1852–60.
112
51. Obeid R, Hartmuth K, Hermann W, Gortner L, Rohrer TR, Geisel J, et al. Blood
biomarkers of methylation in Down syndrome and metabolic simulations using a
mathematical model. Mol Nutr Food Res. 2012;56:1582–9.
52. Caudill MA, Wang JC, Melnyk S, Pogribny IP, Jernigan S, Collins MD, et al.
Intracellular S-adenosylhomocysteine concentrations predict global DNA
hypomethylation in tissues of methyl-deficient cystathione beta-synthase heterozygous
mice. J Nutr. 2001;131:2811–8.
53. James S, Melnyk S, Pogribna M, Pogribny IP, Caudill MA. Elevation in S-
adenosylhomocysteine and DNA hypomethylation: potential epigenetic mechanism for
homocysteine-related pathology. J Nutr. 2002;132 (8):2361S–6S.
54. Yi P, Melnyk S, Pogribna M, Pogribny IP, Hine RJ, James SJ. Increase in plasma
homocysteine associated with parallel increases in plasma S-adenosylhomocysteine and
lymphocyte DNA hypomethylation. J Biol Chem. 2000;275:29318–23.
55. Pilsner JR, Liu X, Ahsan H, Ilievski V, Slavkovich V, Levy D, et al. Folate deficiency,
hyperhomocysteinemia, low urinary creatinine, and hypomethylation of leukocyte DNA
are risk factors for arsenic
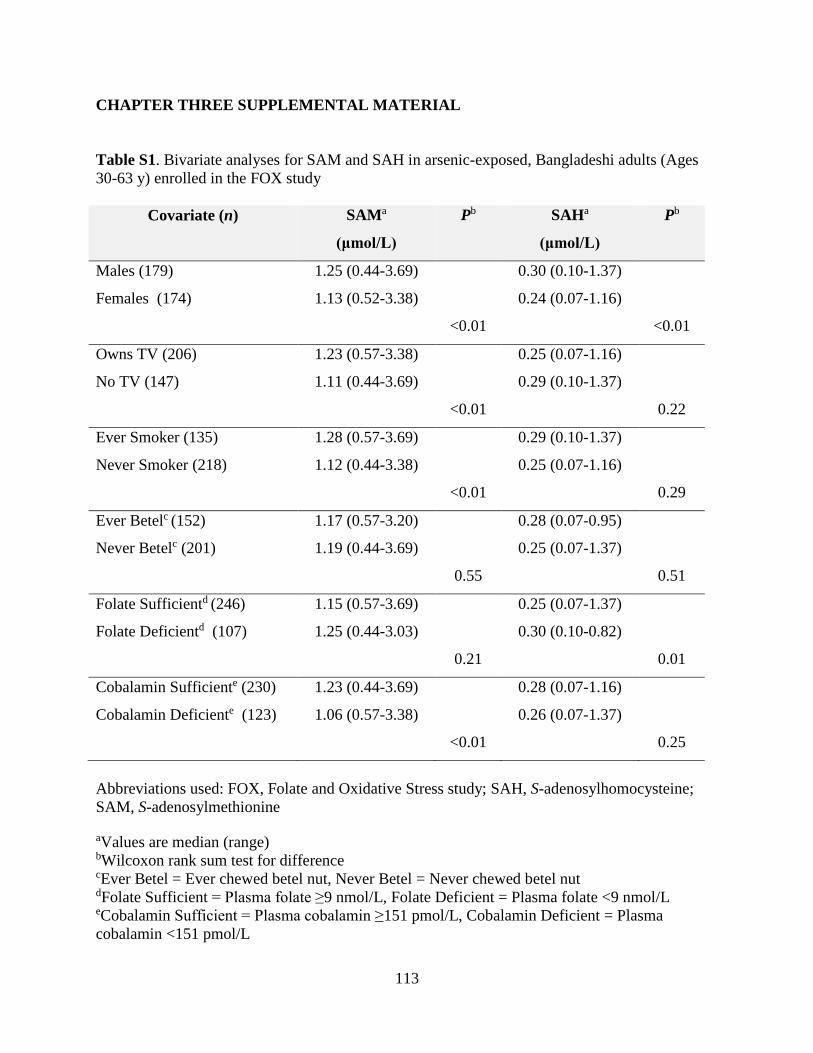
113
CHAPTER THREE SUPPLEMENTAL MATERIAL
Table S1. Bivariate analyses for SAM and SAH in arsenic-exposed, Bangladeshi adults (Ages
30-63 y) enrolled in the FOX study
Covariate (n) SAMa
(μmol/L)
Pb SAHa
(μmol/L)
Pb
Males (179) 1.25 (0.44-3.69) 0.30 (0.10-1.37)
Females (174) 1.13 (0.52-3.38) 0.24 (0.07-1.16)
<0.01 <0.01
Owns TV (206) 1.23 (0.57-3.38) 0.25 (0.07-1.16)
No TV (147) 1.11 (0.44-3.69) 0.29 (0.10-1.37)
<0.01 0.22
Ever Smoker (135) 1.28 (0.57-3.69) 0.29 (0.10-1.37)
Never Smoker (218) 1.12 (0.44-3.38) 0.25 (0.07-1.16)
<0.01 0.29
Ever Betelc (152) 1.17 (0.57-3.20) 0.28 (0.07-0.95)
Never Betelc (201) 1.19 (0.44-3.69) 0.25 (0.07-1.37)
0.55 0.51
Folate Sufficientd (246) 1.15 (0.57-3.69) 0.25 (0.07-1.37)
Folate Deficientd (107) 1.25 (0.44-3.03) 0.30 (0.10-0.82)
0.21 0.01
Cobalamin Sufficiente (230) 1.23 (0.44-3.69) 0.28 (0.07-1.16)
Cobalamin Deficiente (123) 1.06 (0.57-3.38) 0.26 (0.07-1.37)
<0.01 0.25
Abbreviations used: FOX, Folate and Oxidative Stress study; SAH, S-adenosylhomocysteine;
SAM, S-adenosylmethionine aValues are median (range) bWilcoxon rank sum test for difference cEver Betel = Ever chewed betel nut, Never Betel = Never chewed betel nut dFolate Sufficient = Plasma folate ≥9 nmol/L, Folate Deficient = Plasma folate <9 nmol/L eCobalamin Sufficient = Plasma cobalamin ≥151 pmol/L, Cobalamin Deficient = Plasma
cobalamin <151 pmol/L
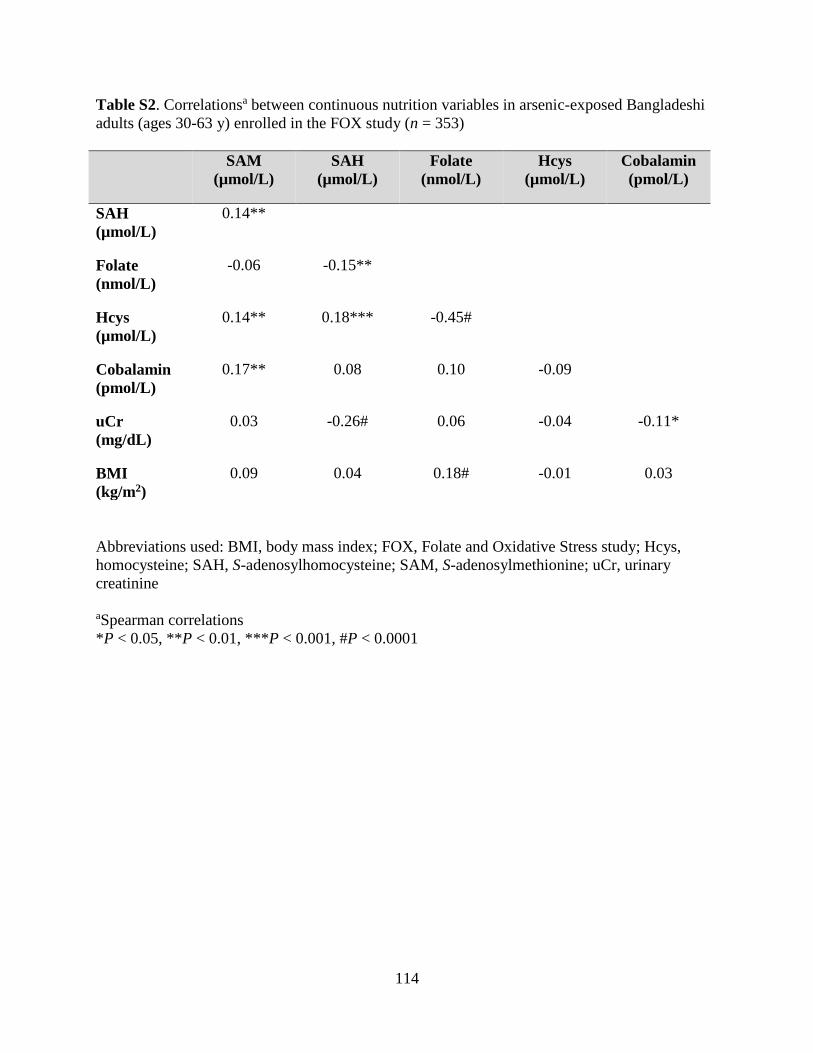
114
Table S2. Correlationsa between continuous nutrition variables in arsenic-exposed Bangladeshi
adults (ages 30-63 y) enrolled in the FOX study (n = 353)
SAM
(µmol/L)
SAH
(µmol/L)
Folate
(nmol/L)
Hcys
(µmol/L)
Cobalamin
(pmol/L)
SAH
(µmol/L)
0.14**
Folate
(nmol/L)
-0.06 -0.15**
Hcys
(µmol/L)
0.14** 0.18*** -0.45#
Cobalamin
(pmol/L)
0.17** 0.08 0.10 -0.09
uCr
(mg/dL)
0.03 -0.26# 0.06 -0.04 -0.11*
BMI
(kg/m2)
0.09 0.04 0.18# -0.01 0.03
Abbreviations used: BMI, body mass index; FOX, Folate and Oxidative Stress study; Hcys,
homocysteine; SAH, S-adenosylhomocysteine; SAM, S-adenosylmethionine; uCr, urinary
creatinine
aSpearman correlations
*P < 0.05, **P < 0.01, ***P < 0.001, #P < 0.0001
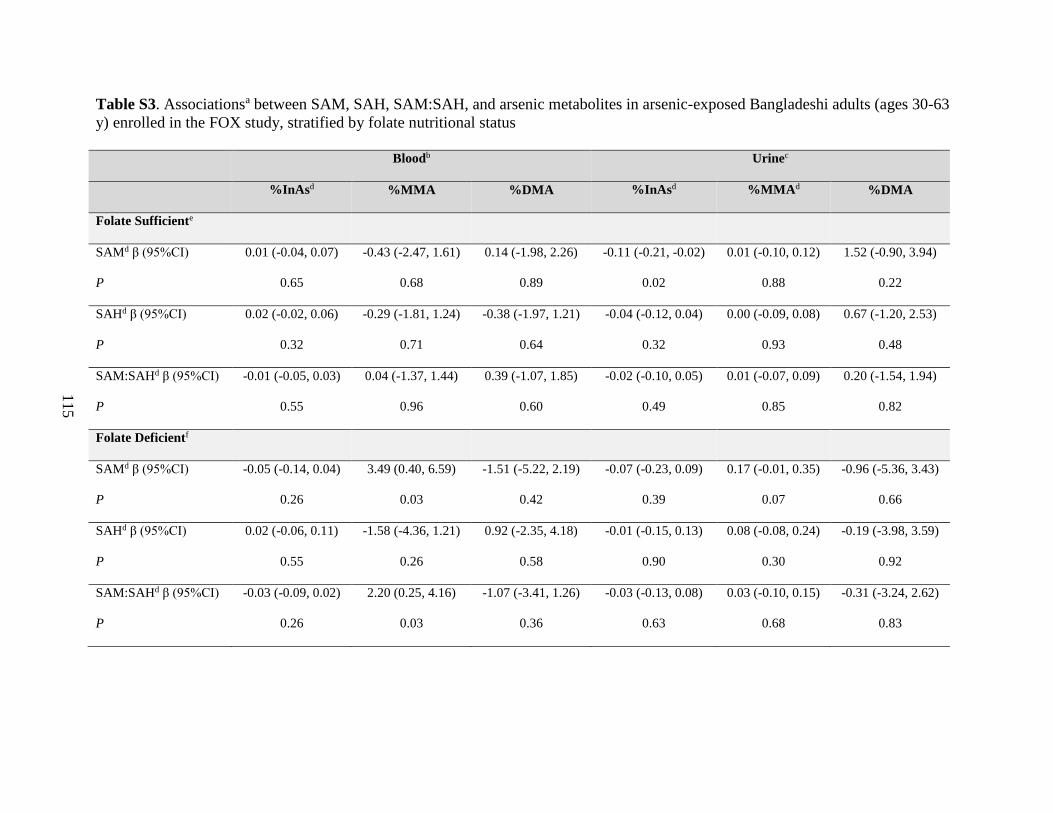
115
Table S3. Associationsa between SAM, SAH, SAM:SAH, and arsenic metabolites in arsenic-exposed Bangladeshi adults (ages 30-63
y) enrolled in the FOX study, stratified by folate nutritional status
Bloodb Urinec
%InAsd %MMA %DMA %InAsd %MMAd %DMA
Folate Sufficiente
SAMd β (95%CI) 0.01 (-0.04, 0.07) -0.43 (-2.47, 1.61) 0.14 (-1.98, 2.26) -0.11 (-0.21, -0.02) 0.01 (-0.10, 0.12) 1.52 (-0.90, 3.94)
P 0.65 0.68 0.89 0.02 0.88 0.22
SAHd β (95%CI) 0.02 (-0.02, 0.06) -0.29 (-1.81, 1.24) -0.38 (-1.97, 1.21) -0.04 (-0.12, 0.04) 0.00 (-0.09, 0.08) 0.67 (-1.20, 2.53)
P 0.32 0.71 0.64 0.32 0.93 0.48
SAM:SAHd β (95%CI) -0.01 (-0.05, 0.03) 0.04 (-1.37, 1.44) 0.39 (-1.07, 1.85) -0.02 (-0.10, 0.05) 0.01 (-0.07, 0.09) 0.20 (-1.54, 1.94)
P 0.55 0.96 0.60 0.49 0.85 0.82
Folate Deficientf
SAMd β (95%CI) -0.05 (-0.14, 0.04) 3.49 (0.40, 6.59) -1.51 (-5.22, 2.19) -0.07 (-0.23, 0.09) 0.17 (-0.01, 0.35) -0.96 (-5.36, 3.43)
P 0.26 0.03 0.42 0.39 0.07 0.66
SAHd β (95%CI) 0.02 (-0.06, 0.11) -1.58 (-4.36, 1.21) 0.92 (-2.35, 4.18) -0.01 (-0.15, 0.13) 0.08 (-0.08, 0.24) -0.19 (-3.98, 3.59)
P 0.55 0.26 0.58 0.90 0.30 0.92
SAM:SAHd β (95%CI) -0.03 (-0.09, 0.02) 2.20 (0.25, 4.16) -1.07 (-3.41, 1.26) -0.03 (-0.13, 0.08) 0.03 (-0.10, 0.15) -0.31 (-3.24, 2.62)
P 0.26 0.03 0.36 0.63 0.68 0.83
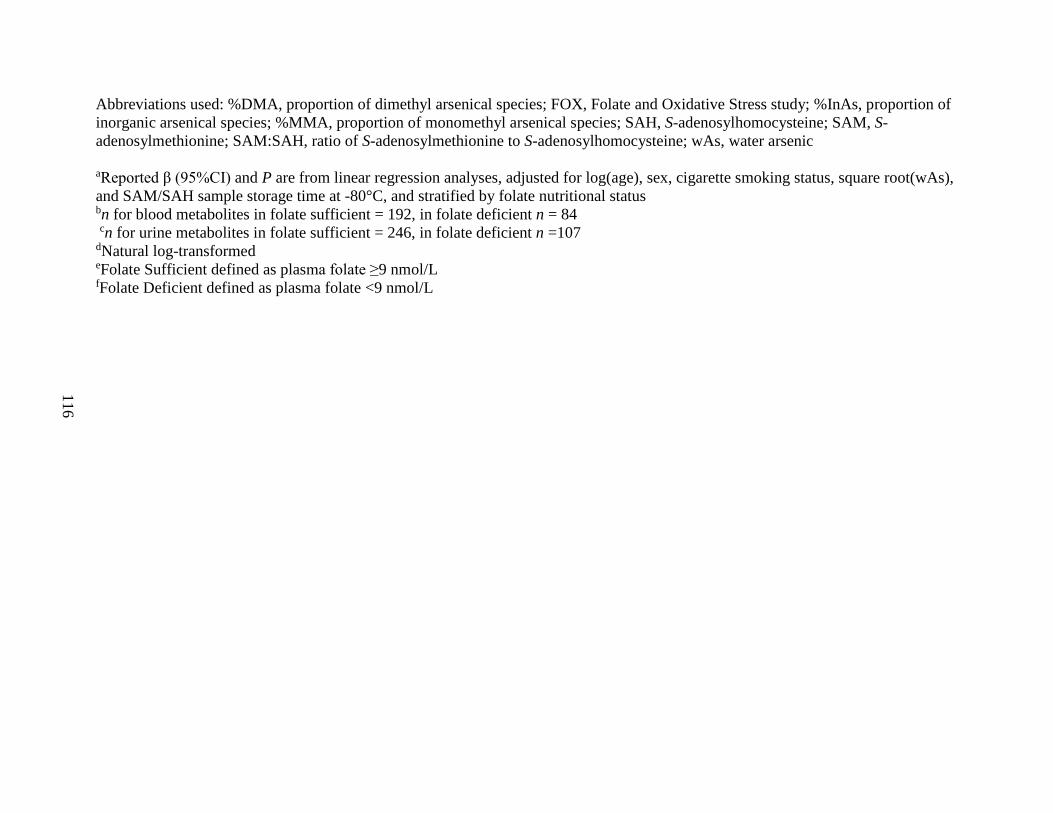
116
Abbreviations used: %DMA, proportion of dimethyl arsenical species; FOX, Folate and Oxidative Stress study; %InAs, proportion of
inorganic arsenical species; %MMA, proportion of monomethyl arsenical species; SAH, S-adenosylhomocysteine; SAM, S-
adenosylmethionine; SAM:SAH, ratio of S-adenosylmethionine to S-adenosylhomocysteine; wAs, water arsenic
aReported β (95%CI) and P are from linear regression analyses, adjusted for log(age), sex, cigarette smoking status, square root(wAs),
and SAM/SAH sample storage time at -80°C, and stratified by folate nutritional status bn for blood metabolites in folate sufficient = 192, in folate deficient n = 84
cn for urine metabolites in folate sufficient = 246, in folate deficient n =107 dNatural log-transformed eFolate Sufficient defined as plasma folate ≥9 nmol/L fFolate Deficient defined as plasma folate <9 nmol/L
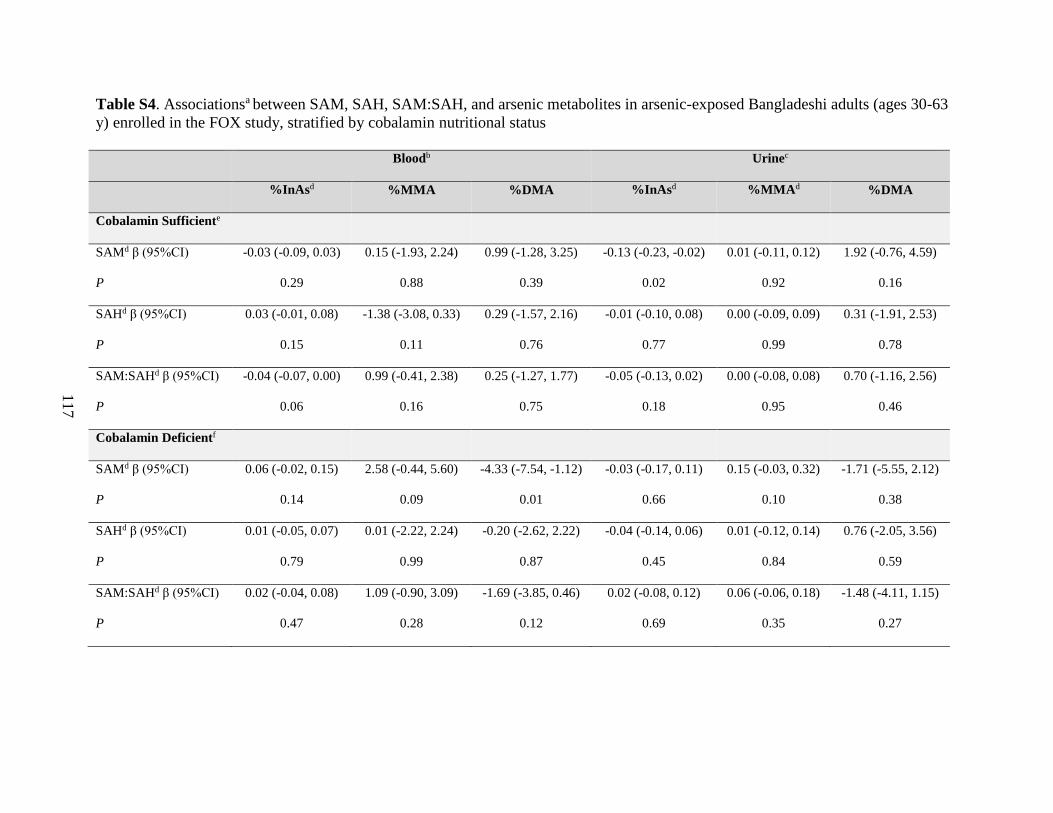
117
Table S4. Associationsa between SAM, SAH, SAM:SAH, and arsenic metabolites in arsenic-exposed Bangladeshi adults (ages 30-63
y) enrolled in the FOX study, stratified by cobalamin nutritional status
Bloodb Urinec
%InAsd %MMA %DMA %InAsd %MMAd %DMA
Cobalamin Sufficiente
SAMd β (95%CI) -0.03 (-0.09, 0.03) 0.15 (-1.93, 2.24) 0.99 (-1.28, 3.25) -0.13 (-0.23, -0.02) 0.01 (-0.11, 0.12) 1.92 (-0.76, 4.59)
P 0.29 0.88 0.39 0.02 0.92 0.16
SAHd β (95%CI) 0.03 (-0.01, 0.08) -1.38 (-3.08, 0.33) 0.29 (-1.57, 2.16) -0.01 (-0.10, 0.08) 0.00 (-0.09, 0.09) 0.31 (-1.91, 2.53)
P 0.15 0.11 0.76 0.77 0.99 0.78
SAM:SAHd β (95%CI) -0.04 (-0.07, 0.00) 0.99 (-0.41, 2.38) 0.25 (-1.27, 1.77) -0.05 (-0.13, 0.02) 0.00 (-0.08, 0.08) 0.70 (-1.16, 2.56)
P 0.06 0.16 0.75 0.18 0.95 0.46
Cobalamin Deficientf
SAMd β (95%CI) 0.06 (-0.02, 0.15) 2.58 (-0.44, 5.60) -4.33 (-7.54, -1.12) -0.03 (-0.17, 0.11) 0.15 (-0.03, 0.32) -1.71 (-5.55, 2.12)
P 0.14 0.09 0.01 0.66 0.10 0.38
SAHd β (95%CI) 0.01 (-0.05, 0.07) 0.01 (-2.22, 2.24) -0.20 (-2.62, 2.22) -0.04 (-0.14, 0.06) 0.01 (-0.12, 0.14) 0.76 (-2.05, 3.56)
P 0.79 0.99 0.87 0.45 0.84 0.59
SAM:SAHd β (95%CI) 0.02 (-0.04, 0.08) 1.09 (-0.90, 3.09) -1.69 (-3.85, 0.46) 0.02 (-0.08, 0.12) 0.06 (-0.06, 0.18) -1.48 (-4.11, 1.15)
P 0.47 0.28 0.12 0.69 0.35 0.27
118
Abbreviations used: %DMA, proportion of dimethyl arsenical species; FOX, Folate and Oxidative Stress study; %InAs, proportion of
inorganic arsenical species; %MMA, proportion of monomethyl arsenical species; SAH, S-adenosylhomocysteine; SAM, S-
adenosylmethionine; SAM:SAH, ratio of S-adenosylmethionine to S-adenosylhomocysteine; wAs, water arsenic
aReported β (95%CI) and P are from linear regression analyses, adjusted for log(age), sex, cigarette smoking status, square root(wAs),
and SAM/SAH sample storage time at -80°C, and stratified by cobalamin nutritional status bn for blood metabolites in cobalamin sufficient = 178, in cobalamin deficient n = 98 cn for urine metabolites in cobalamin sufficient = 230, in cobalamin deficient n = 123 dNatural log-transformed eCobalamin Sufficient defined as plasma cobalamin ≥151 pmol/L fCobalamin Deficient defined as plasma cobalamin <151 pmol/L

119
Figure S1. One-carbon metabolism. (1) Dihydrofolate reductase (DHFR) reduces dietary folates
to dihydrofolate (DHF) and tetrahydrofolate (THF). (2) Serine hydroxymethyltransferase
transfers the β-carbon of serine to THF, forming 5,10-methenyl-THF and glycine. (3) At a major
branch point between transmethylation reactions and nucleotide biosynthesis, 5,10-methenyl-
THF can be reduced to 5,10-methylene-THF and further reduced to 5-methyl-THF (5-mTHF) by
5,10-methylene-THF reductase (MTHFR). (4) Methionine synthase (MTR), a cobalamin-
dependent enzyme, catalyzes the transfer of a methyl group from 5-mTHF to homocysteine
(Hcys), generating methionine and regenerating THF. (5) Methionine adenosyl-transferase
activates methionine to form S-adenosylmethionine (SAM). (6) SAM serves as a universal
methyl donor for numerous acceptors, including inorganic (InAs) and monomethylarsonous acid
(MMA), yielding MMA and dimethylarsinic acid (DMA), respectively. Matching colors indicate
methyl acceptors and their corresponding methylated products. Both arsenic methylation steps
are catalyzed by arsenic (+3) methyltransferase (AS3MT). Upon donating a methyl group, SAM
is converted to S-adenosylhomocysteine (SAH), a potent inhibitor of most SAM-dependent
methylation reactions. (7) SAH is hydrolyzed to generate Hcys, which is used to regenerate
methionine or is (8) directed to the transsulfuration pathway through which it is ultimately
catabolized for the synthesis of glutathione (GSH).
120
CHAPTER FOUR
Enzymatic cleavage of histone H3: a new consideration when measuring histone
modifications in human samples
Caitlin G. Howe1 and Mary V. Gamble
1
Affiliations: 1Department of Environmental Health Sciences, Mailman School of Public Health,
Columbia University, New York NY, 10032, USA
Published: http://www.clinicalepigeneticsjournal.com/content/7/1/7
Howe CG and Gamble MV. Enzymatic cleavage of histone H3: a new consideration when
measuring histone modifications in human samples. Clinical Epigenetics. 2015;7:7.
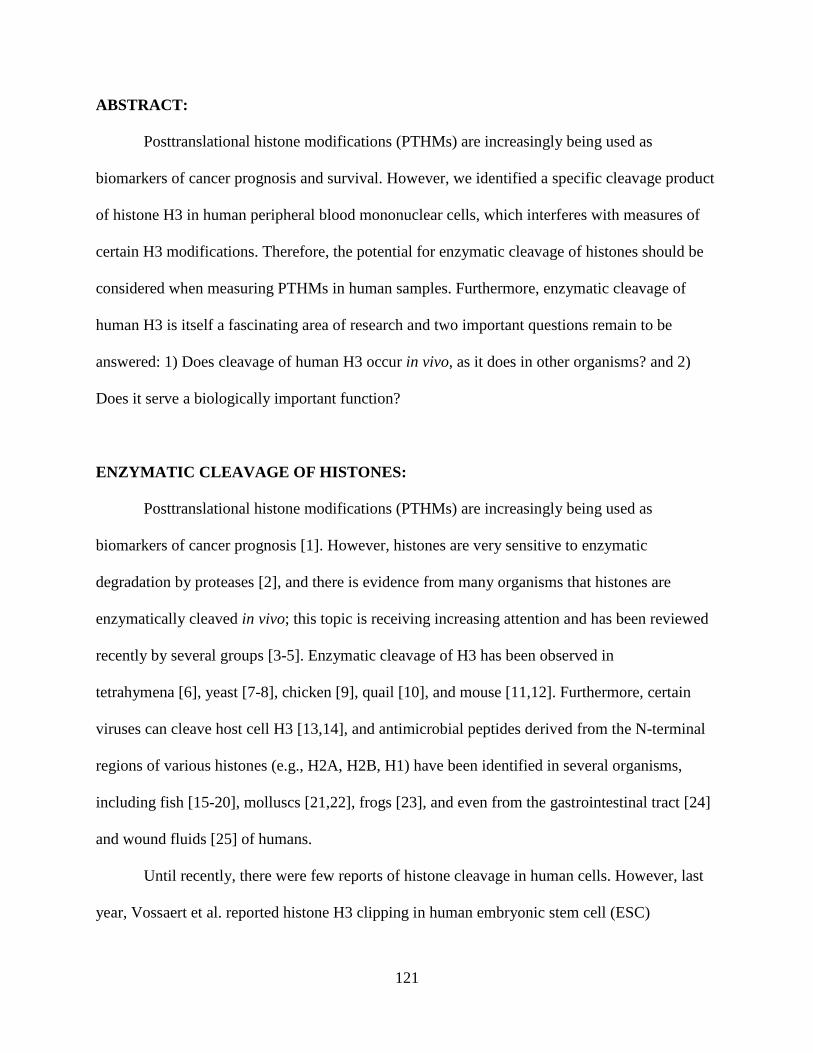
121
ABSTRACT:
Posttranslational histone modifications (PTHMs) are increasingly being used as
biomarkers of cancer prognosis and survival. However, we identified a specific cleavage product
of histone H3 in human peripheral blood mononuclear cells, which interferes with measures of
certain H3 modifications. Therefore, the potential for enzymatic cleavage of histones should be
considered when measuring PTHMs in human samples. Furthermore, enzymatic cleavage of
human H3 is itself a fascinating area of research and two important questions remain to be
answered: 1) Does cleavage of human H3 occur in vivo, as it does in other organisms? and 2)
Does it serve a biologically important function?
ENZYMATIC CLEAVAGE OF HISTONES:
Posttranslational histone modifications (PTHMs) are increasingly being used as
biomarkers of cancer prognosis [1]. However, histones are very sensitive to enzymatic
degradation by proteases [2], and there is evidence from many organisms that histones are
enzymatically cleaved in vivo; this topic is receiving increasing attention and has been reviewed
recently by several groups [3-5]. Enzymatic cleavage of H3 has been observed in
tetrahymena [6], yeast [7-8], chicken [9], quail [10], and mouse [11,12]. Furthermore, certain
viruses can cleave host cell H3 [13,14], and antimicrobial peptides derived from the N-terminal
regions of various histones (e.g., H2A, H2B, H1) have been identified in several organisms,
including fish [15-20], molluscs [21,22], frogs [23], and even from the gastrointestinal tract [24]
and wound fluids [25] of humans.
Until recently, there were few reports of histone cleavage in human cells. However, last
year, Vossaert et al. reported histone H3 clipping in human embryonic stem cell (ESC)

122
lines [26], and our group recently identified a cleavage product of H3 in human peripheral blood
mononuclear cells (PBMCs) (Figure 1).
Figure 1. Enzymatic cleavage of H3 interferes with the measurement of certain PTHMs.
(A) Known enzymatic cleavage sites in H3 for mouse ESCs [11]. Bold solid lines indicate sites
that are frequently cleaved, thin solid lines indicate sites that are less frequently cleaved, and
dotted lines indicate sites that are rarely cleaved [11]. (B) Western blot (Odyssey® CLx Infrared
Imaging System, Li-Cor) was used to measure total H3 protein levels (Sigma, H0164, 1:4,000) in
11 representative histone samples that had been isolated, using an acid-extraction method [27],
from PBMCs collected from arsenic-exposed Bangladeshi adults enrolled in the FACT study, a
randomized controlled trial of folic acid and creatine supplementation; sample collection and
processing for this study has been described previously [28]. The expected size of H3 is
~17 kDa. A distinct cleavage product of H3 is observed at ~15 kDa, and an additional H3
cleavage product between 15 and 17 kDa is also present in several of the samples (top panel). In
the same 11 samples, three PTHMs that are located in different regions of H3 were assessed by
Western blot: H3K9me2 (Abcam, ab1220, 1:1,000, mouse) (second panel), H3K36me2 (Abcam,
ab9049, 1:1,000, rabbit) (third panel), and H3K79me2 (Abcam, ab3594, 1:400, rabbit) (fourth
panel). Abbreviations used: ESC, embryonic stem cell; FACT, Folic Acid and Creatine Trial;
H3K9me2, di-methylation at lysine 9 of histone H3; H3K36me2, di-methylation at lysine 36 of
histone H3; H3K79me2, di-methylation at lysine 79 of histone H3; PBMC, peripheral blood
mononuclear cell; PTHM, posttranslational histone modification
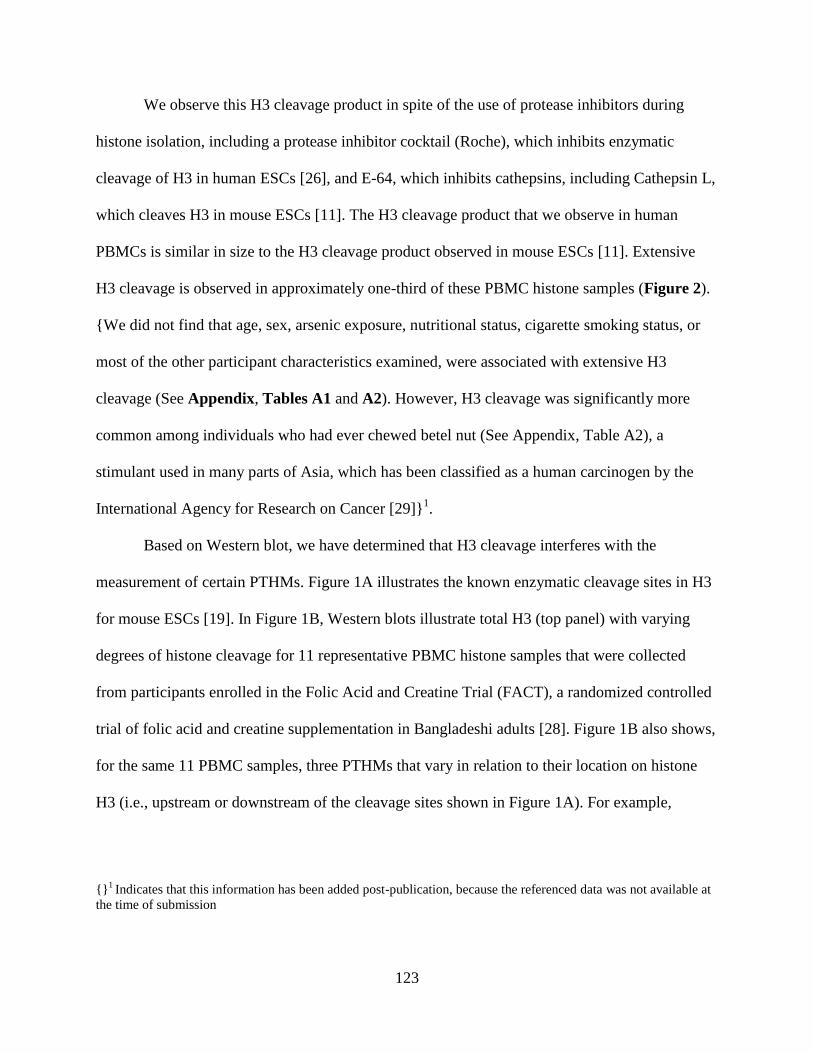
123
We observe this H3 cleavage product in spite of the use of protease inhibitors during
histone isolation, including a protease inhibitor cocktail (Roche), which inhibits enzymatic
cleavage of H3 in human ESCs [26], and E-64, which inhibits cathepsins, including Cathepsin L,
which cleaves H3 in mouse ESCs [11]. The H3 cleavage product that we observe in human
PBMCs is similar in size to the H3 cleavage product observed in mouse ESCs [11]. Extensive
H3 cleavage is observed in approximately one-third of these PBMC histone samples (Figure 2).
{We did not find that age, sex, arsenic exposure, nutritional status, cigarette smoking status, or
most of the other participant characteristics examined, were associated with extensive H3
cleavage (See Appendix, Tables A1 and A2). However, H3 cleavage was significantly more
common among individuals who had ever chewed betel nut (See Appendix, Table A2), a
stimulant used in many parts of Asia, which has been classified as a human carcinogen by the
International Agency for Research on Cancer [29]}1.
Based on Western blot, we have determined that H3 cleavage interferes with the
measurement of certain PTHMs. Figure 1A illustrates the known enzymatic cleavage sites in H3
for mouse ESCs [19]. In Figure 1B, Western blots illustrate total H3 (top panel) with varying
degrees of histone cleavage for 11 representative PBMC histone samples that were collected
from participants enrolled in the Folic Acid and Creatine Trial (FACT), a randomized controlled
trial of folic acid and creatine supplementation in Bangladeshi adults [28]. Figure 1B also shows,
for the same 11 PBMC samples, three PTHMs that vary in relation to their location on histone
H3 (i.e., upstream or downstream of the cleavage sites shown in Figure 1A). For example,
{}1 Indicates that this information has been added post-publication, because the referenced data was not available at
the time of submission
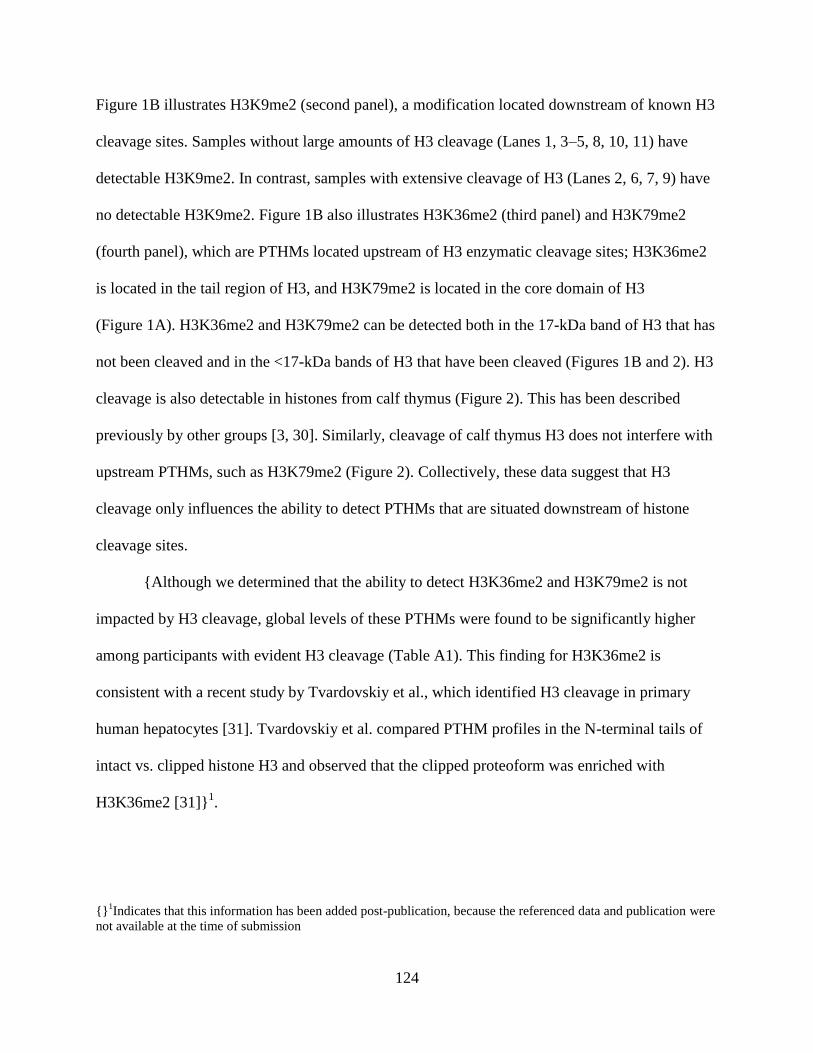
124
Figure 1B illustrates H3K9me2 (second panel), a modification located downstream of known H3
cleavage sites. Samples without large amounts of H3 cleavage (Lanes 1, 3–5, 8, 10, 11) have
detectable H3K9me2. In contrast, samples with extensive cleavage of H3 (Lanes 2, 6, 7, 9) have
no detectable H3K9me2. Figure 1B also illustrates H3K36me2 (third panel) and H3K79me2
(fourth panel), which are PTHMs located upstream of H3 enzymatic cleavage sites; H3K36me2
is located in the tail region of H3, and H3K79me2 is located in the core domain of H3
(Figure 1A). H3K36me2 and H3K79me2 can be detected both in the 17-kDa band of H3 that has
not been cleaved and in the <17-kDa bands of H3 that have been cleaved (Figures 1B and 2). H3
cleavage is also detectable in histones from calf thymus (Figure 2). This has been described
previously by other groups [3, 30]. Similarly, cleavage of calf thymus H3 does not interfere with
upstream PTHMs, such as H3K79me2 (Figure 2). Collectively, these data suggest that H3
cleavage only influences the ability to detect PTHMs that are situated downstream of histone
cleavage sites.
{Although we determined that the ability to detect H3K36me2 and H3K79me2 is not
impacted by H3 cleavage, global levels of these PTHMs were found to be significantly higher
among participants with evident H3 cleavage (Table A1). This finding for H3K36me2 is
consistent with a recent study by Tvardovskiy et al., which identified H3 cleavage in primary
human hepatocytes [31]. Tvardovskiy et al. compared PTHM profiles in the N-terminal tails of
intact vs. clipped histone H3 and observed that the clipped proteoform was enriched with
H3K36me2 [31]}1.
{}1Indicates that this information has been added post-publication, because the referenced data and publication were
not available at the time of submission
125
Figure 2. Extensive H3 cleavage is evident in approximately one-third of PBMC histone
samples, but it does not affect measures of H3K36me2 and H3K79me2. Total H3 was measured
in an additional 32 histone PBMC samples from the FACT study and in histones from calf
thymus (Sigma-Aldrich). H3K36me2 was also measured in 22 of the PBMC samples (Samples
1–22), and H3K79me2 was measured in calf histones and in ten of the PBMC samples (Samples
23–32). Abbreviations used: FACT, Folic Acid and Creatine Trial; H3K36me2, di-methylation at
lysine 36 of histone H3; H3K79me2, di-methylation at lysine 79 of histone H3; PBMC,
peripheral blood mononuclear cell
IMPLICATIONS FOR MOLECULAR EPIDEMIOLOGY STUDIES:
Since it is unclear when enzymatic cleavage of H3 occurs in human PBMC samples, it is
difficult to know if it is of biological or methodological interest. Regardless, enzymatic cleavage
of H3 has important implications for measuring global PTHMs in human samples. Currently, the
most commonly studied PTHMs include methylation and acetylation marks on H3K4, H3K9,
and H3K27, which all fall within the N-terminal tail region of H3. However, the portion of H3
that is clipped off in mouse and human cells includes these residues. Thus, measures of marks on
H3K4, H3K9, and H3K27 may be underestimated if samples have experienced enzymatic
cleavage of H3. This is particularly true for antibody-based methods, such as ELISA and
immunohistochemistry methods, which cannot take into account H3 cleavage. PTHMs that lie on

126
amino acid residues upstream of H3 enzymatic cleavage sites, such as H3K36 and H3K79, do
not appear to be affected by the enzymatic cleavage of H3 and therefore can be measured
accurately, regardless of cleavage.
A better understanding of when and why enzymatic cleavage of H3 occurs is essential. If
enzymatic cleavage of human H3 occurs in vivo, this may be an important biological
phenomenon. Alternatively, if enzymatic cleavage occurs as a result of sample collection and
processing, preventive measures must be developed such that all PTHMs on H3, including
modifications on H3K4, H3K9, and H3K27, can be accurately measured. In the meantime, for
banked samples previously collected for the measurement of global PTHMs, Western blot can be
used to check samples for enzymatic cleavage of histones. If histone cleavage products are
observed in samples, it may not be appropriate to measure certain PTHMs based on their
location.
ACKNOWLEDGEMENTS:
This work was supported by funding from NIH grants P42 ES10349 and RO1 CA133595.

127
CHAPTER FOUR REFERENCES:
1. Chervona Y and Costa M. Histone modifications and cancer: biomarkers of prognosis?
Am J Cancer Res. 2012;2(5):589-97.
2. Suganuma T, Workman JL: Crosstalk among histone modifications. Cell. 2008,
135(4):604-7.
3. Dhaenens M, Glibert P, Meert P, Vossaert L, Deforce D. Histone proteolysis: a proposal
for categorization into ‘clipping’ and ‘degradation’. Bioessay. 2014;37(1):70-9.
4. Azad G and Tomar RS. Proteolytic clipping of histone tails: the emerging role of
proteases in regulation of various biological processes. Mol Bio Rep. 2014;41(5):2717-
30.
5. Zhou P, Wu E, Alam HB, Li Y. Histone cleavage as a mechanism for epigenetic
regulation: current insights and perspectives. Curr Mol Med. 2014;14(9):1164-72.
6. Allis CD, Bowen JK, Abraham GN, Glover CV, Gorovsky MA. Proteolytic processing of
histone H3 in chromatin: a physiologically regulated event in Tetrahymena micronuclei.
Cell. 1980;20(1):55-64.
7. Santos-Rosa H, Kirmizis A, Nelson C, Bartke T, Saksouk N, Cote J, et al. Histone H3 tail
clipping regulates gene expression. Nat Struct Mol Biol. 2009;16(1):17-22.
8. Xue Y, Vashisht AA, Tan Y, Su T, Wohlschlegel JA. PRB1 is required for clipping of
the histone H3 N terminal tail in Saccharomyces cerevisiae. PLoS One. 2014;9(2).
9. Mandal P, Azad GK, Tomar RS. Identification of a novel histone H3 specific protease
activity in nuclei of chicken liver. Biochem Biophys Res Commun. 2012;421(2):261-7.
10. Mahendra G and Kanungo MS. Age-related and steroid induced changes in the histones
of the quail liver. Arch Gerontol Geriatr. 2000;30(2):109-14.
11. Duncan E, Muratore-Schroeder TL, Cook RG, Garcia BA, Shabanowitz J, Hunt DF, et al.
Cathepsin L proteolytically processes histone H3 during mouse embryonic stem cell
differentiation. Cell. 2008;135(2):284-94.
12. Khalkhali-Ellis Z, Goossens W, Margaryan NV, Hendrix MJ. Cleavage of histone 3 by
Cathepsin D in the involuting mammary gland. PLoS One. 2014;9(7).
13. Falk M, Grigera PR, Bergmann IE, Zibert A, Multhaup G, Beck E. Foot-and-mouth
disease virus protease 3C induces specific proteolytic cleavage of host cell histone H3. J
Virol. 1990;64(2):748-56.
128
14. Tesar M and Marquardt O. Foot-and-mouth disease virus protease 3c inhibits cellular
transcription and mediates cleavage of histone H3. Virology. 1990;174(2):364-74.
15. Cho J, Park IY, Kim HS, Lee WT, Kim MS, Kim SC. Cathepsin D produces
antimicrobial peptide parasin I from histone H2a in the skin mucosa of fish. FASEB J.
2002;16(3):429-31.
16. Birkemo G, Lüders T, Andersen Ø, Nes IF, Nissen-Meyer J. Hipposin: a histone-derived
antimicrobrial peptide in Atlantic halibut (Hippoglossus hippoglossus L.). Biochim
Biophys Acta. 2003;1646(1):207-15.
17. Lüders T, Birkemo GA, Nissen-Meyer J, Andersen Ø, Nes IF. Proline conformation-
dependent antimicrobial activity of a proline-rich histone H1 N-terminal peptide fragment
isolated from the skin mucus of Atlantic salmon. Antimicrob Agents Chemother.
2005;49(6):2399-406.
18. Sathyan N, Philip R, Chaithanya ER, Anil Kumar PR, Sanjeevan VN, Singh IS.
Characterization of Histone H2A derived antimicrobial peptides, Harriottins, from
Sicklefin Chimaera Neoharriatta pinnata (Schnakenbeck, 1931) and its evolutionary
divergence with respect to CO1 and Histone H2A. ISRN Mol Biol. 2013;2013:1-10.
19. Chaithanya ER, Philip R, Sathyan N, Anil Kumar PR. Molecular characterization and
phylogenetic analysis of a histone-derived antimicrobial peptide teleostin from the marine
teleost fishes, Tachysurus jella and Cynoglossus semifasciatus. ISRN Mol Biol. 2013;
2013:1-7.
20. Park I, Park CB, Kim MS, Kim SC. Parasin I, an antimicrobial peptide derived from
histone H2A in the catfish, Parasilurus asotus. FEBS Lett. 1998;437(3):258-62.
21. Sathyan N, Philip R, Chaithanya ER, Anil Kumar PR. Identification and molecular
characterization of molluskin, a histone-H2A-derived antimicrobial peptide from
molluscs. ISRN Mol Biol. 2012;2012:1-6.
22. De Zoysa M, Nikapitiya C, Whang I, Lee J-S, Lee J. Abhisin: a potential antimicrobial
peptide derived from histone H2A of disk abalone (haliotis discus discus). Fish Shellfish
Immunol. 2009;27(5):639-46.
23. Kawasaki H, Isaacson T, Iwamuro S, Conlon JM: A protein with antimicrobial activity
in the skin of Schlegel’s green tree frog Rhacophorus schlegelii (Rhacophoridae)
identified as histone H2B. Biochem Biophys Res Commun. 2003;312(4):1082-86.
24. Rose F, Bailey K, Keyte JW, Chan WC, Greenwood D, Mahida YR. Potential role of
epithelial cell-derived histone H1 proteins in innate antimicrobial defense in the human
gastrointestinal tract. Infect Immun. 1998;66(7):3255-63.
129
25. Frohm M, Gunne H, Bergman AC, Agerberth B, Bergman T, Boman A, et al.
Biochemical and antibacterial analysis of human wound and blister fluid. Eur J Biochem.
1996;237(1):86-92.
26. Vossaert L, Meert P, Scheerlinck E, Glibert P, Van Roy N, Heindryckx B, et al.
Identification of histone H3 clipping activity in human embryonic stem cells. Stem Cell
Res. 2014;13(1):123-34.
27. Arita A, Niu J, Qu Q, Zhao N, Ruan Y, Nadas A, et al. Global levels of histone
modifications in peripheral blood mononuclear cells of subjects with exposure to nickel.
Environ Health Perspect, 2012; 120(2):198.
28. Harper K, Peters BA, Gamble MV. Batch effects and pathway analysis: two potential
perils in cancer studies involving DNA methylation array analysis. Cancer Epidemiol
Biomarkers Prev. 2013;22(6):1052-60.
29. World Health Organization. Betel-quid and Areca-nut Chewing and Some Areca-Nut-
derived Nitrosamines. IARC Monographs on the Evaluation of Carcinogenic Risks to
Humans. 2004;85.
30. Huyen Y, Zgheib O, DiTullio RA Jr, Gorgoulis VG, Zacharatos P, Petty TJ, et al.
Methylated lysine 79 of histone H3 targets 53BP1 to DNA double-strand breaks. Nature
2004. 432;(7015):406-11.
31. Tvardovskiy A, Wrzesinski K, Sidoli S, Fey SJ, Rogowska-Wrzesinska A, Jensen ON.
Top-down and middle-down protein analysis reveals that intact and clipped human
histones differ in post-translational modification patterns. Mol Cell Proteomics.
2015;14(12):3142-53.
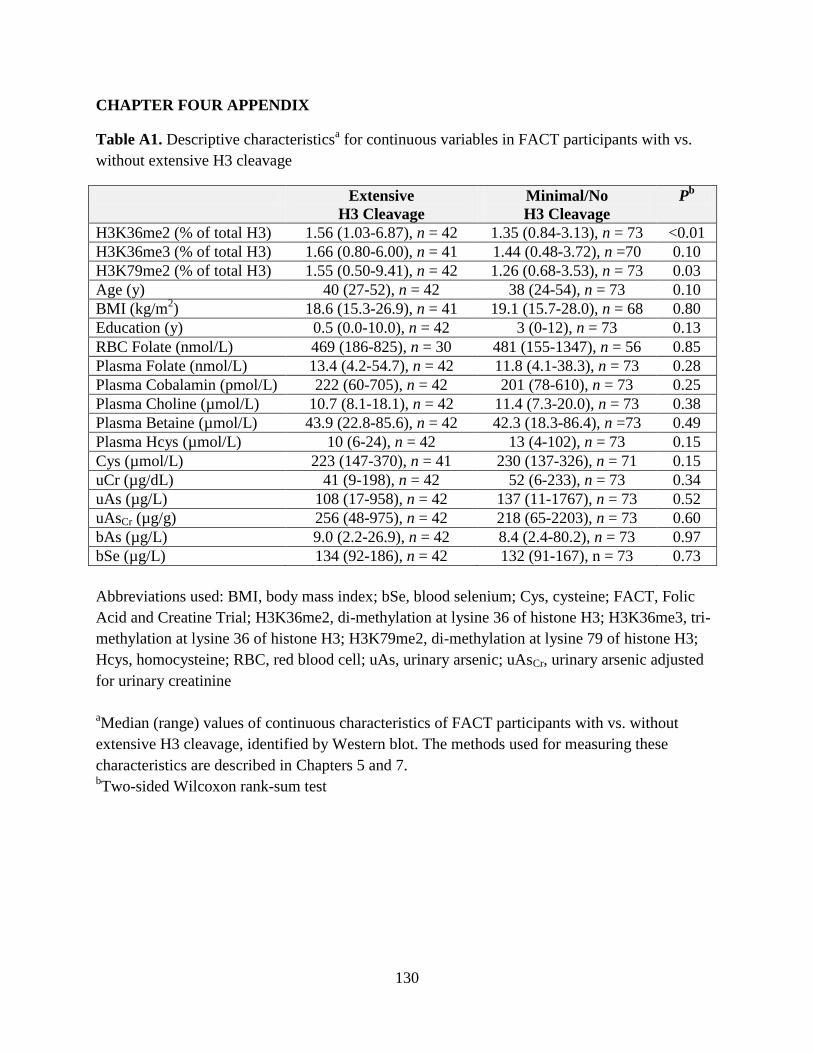
130
CHAPTER FOUR APPENDIX
Table A1. Descriptive characteristicsa for continuous variables in FACT participants with vs.
without extensive H3 cleavage
Extensive
H3 Cleavage
Minimal/No
H3 Cleavage
Pb
H3K36me2 (% of total H3) 1.56 (1.03-6.87), n = 42 1.35 (0.84-3.13), n = 73 <0.01
H3K36me3 (% of total H3) 1.66 (0.80-6.00), n = 41 1.44 (0.48-3.72), n =70 0.10
H3K79me2 (% of total H3) 1.55 (0.50-9.41), n = 42 1.26 (0.68-3.53), n = 73 0.03
Age (y) 40 (27-52), n = 42 38 (24-54), n = 73 0.10
BMI (kg/m2) 18.6 (15.3-26.9), n = 41 19.1 (15.7-28.0), n = 68 0.80
Education (y) 0.5 (0.0-10.0), n = 42 3 (0-12), n = 73 0.13
RBC Folate (nmol/L) 469 (186-825), n = 30 481 (155-1347), n = 56 0.85
Plasma Folate (nmol/L) 13.4 (4.2-54.7), n = 42 11.8 (4.1-38.3), n = 73 0.28
Plasma Cobalamin (pmol/L) 222 (60-705), n = 42 201 (78-610), n = 73 0.25
Plasma Choline (µmol/L) 10.7 (8.1-18.1), n = 42 11.4 (7.3-20.0), n = 73 0.38
Plasma Betaine (µmol/L) 43.9 (22.8-85.6), n = 42 42.3 (18.3-86.4), n =73 0.49
Plasma Hcys (µmol/L) 10 (6-24), n = 42 13 (4-102), n = 73 0.15
Cys (µmol/L) 223 (147-370), n = 41 230 (137-326), n = 71 0.15
uCr (µg/dL) 41 (9-198), n = 42 52 (6-233), n = 73 0.34
uAs (µg/L) 108 (17-958), n = 42 137 (11-1767), n = 73 0.52
uAsCr (µg/g) 256 (48-975), n = 42 218 (65-2203), n = 73 0.60
bAs (µg/L) 9.0 (2.2-26.9), n = 42 8.4 (2.4-80.2), n = 73 0.97
bSe (µg/L) 134 (92-186), n = 42 132 (91-167), n = 73 0.73
Abbreviations used: BMI, body mass index; bSe, blood selenium; Cys, cysteine; FACT, Folic
Acid and Creatine Trial; H3K36me2, di-methylation at lysine 36 of histone H3; H3K36me3, tri-
methylation at lysine 36 of histone H3; H3K79me2, di-methylation at lysine 79 of histone H3;
Hcys, homocysteine; RBC, red blood cell; uAs, urinary arsenic; uAsCr, urinary arsenic adjusted
for urinary creatinine
aMedian (range) values of continuous characteristics of FACT participants with vs. without
extensive H3 cleavage, identified by Western blot. The methods used for measuring these
characteristics are described in Chapters 5 and 7. bTwo-sided Wilcoxon rank-sum test
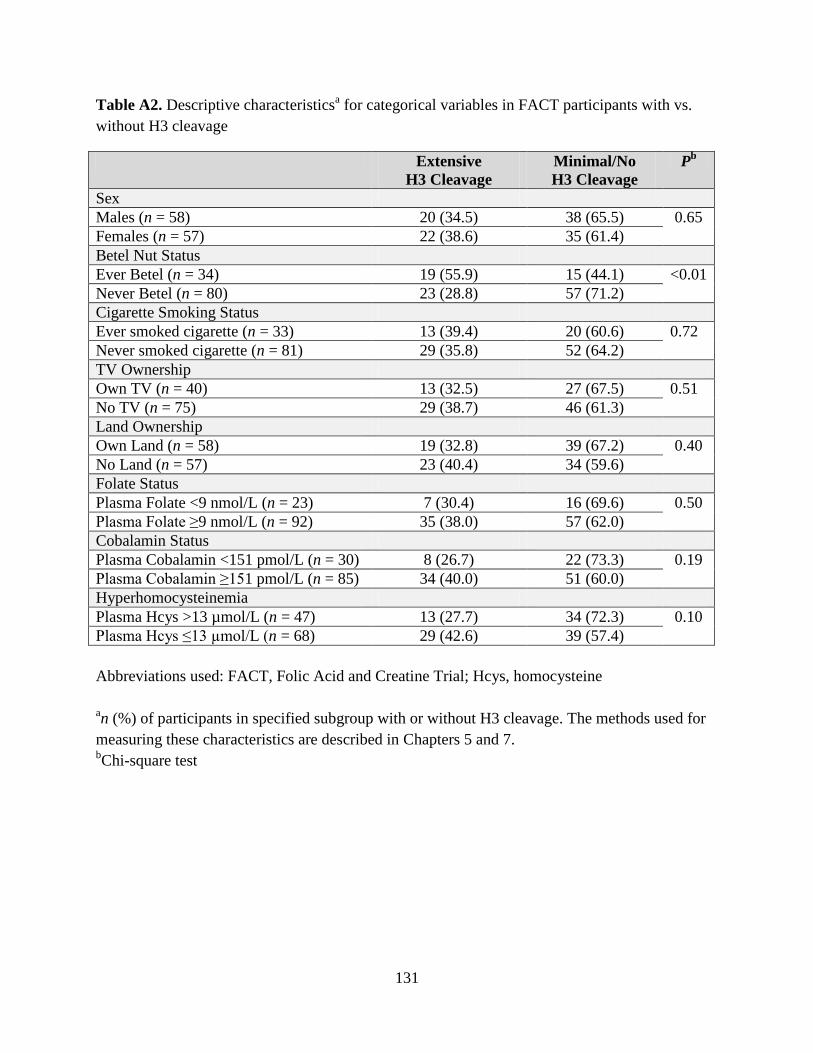
131
Table A2. Descriptive characteristicsa for categorical variables in FACT participants with vs.
without H3 cleavage
Extensive
H3 Cleavage
Minimal/No
H3 Cleavage
Pb
Sex
Males (n = 58) 20 (34.5) 38 (65.5) 0.65
Females (n = 57) 22 (38.6) 35 (61.4)
Betel Nut Status
Ever Betel (n = 34) 19 (55.9) 15 (44.1) <0.01
Never Betel (n = 80) 23 (28.8) 57 (71.2)
Cigarette Smoking Status
Ever smoked cigarette (n = 33) 13 (39.4) 20 (60.6) 0.72
Never smoked cigarette (n = 81) 29 (35.8) 52 (64.2)
TV Ownership
Own TV (n = 40) 13 (32.5) 27 (67.5) 0.51
No TV (n = 75) 29 (38.7) 46 (61.3)
Land Ownership
Own Land (n = 58) 19 (32.8) 39 (67.2) 0.40
No Land (n = 57) 23 (40.4) 34 (59.6)
Folate Status
Plasma Folate <9 nmol/L (n = 23) 7 (30.4) 16 (69.6) 0.50
Plasma Folate ≥9 nmol/L (n = 92) 35 (38.0) 57 (62.0)
Cobalamin Status
Plasma Cobalamin <151 pmol/L (n = 30) 8 (26.7) 22 (73.3) 0.19
Plasma Cobalamin ≥151 pmol/L (n = 85) 34 (40.0) 51 (60.0)
Hyperhomocysteinemia
Plasma Hcys >13 µmol/L (n = 47) 13 (27.7) 34 (72.3) 0.10
Plasma Hcys ≤13 µmol/L (n = 68) 29 (42.6) 39 (57.4)
Abbreviations used: FACT, Folic Acid and Creatine Trial; Hcys, homocysteine
an (%) of participants in specified subgroup with or without H3 cleavage. The methods used for
measuring these characteristics are described in Chapters 5 and 7. bChi-square test
132
CHAPTER FIVE
Associations between blood and urine arsenic concentrations and global levels of
posttranslational histone modifications in Bangladeshi men and women
Caitlin G. Howe1, Xinhua Liu2, Megan N. Hall3, Vesna Slavkovich1, Vesna Ilievski1, Faruque
Parvez1, Abu B. Siddique4, Hasan Shahriar4, Mohammad N. Uddin4, Tariqul Islam4, Joseph H.
Graziano1, Max Costa5, Mary V. Gamble1
Affiliations: Departments of 1Environmental Health Sciences, 2Biostatistics, and 3Epidemiology,
Mailman School of Public Health, Columbia University, New York, New York, USA;
4Columbia University Arsenic Project in Bangladesh, Dhaka, Bangladesh; and the 5Department
of Environmental Medicine, Langone Medical Center, New York University, New York, New
York, USA
Published: http://ehp.niehs.nih.gov/15-10412/
Howe CG, Liu X, Hall MN, Slavkovich V, Ilievski V, Parvez F, Siddique AB, Shahriar H, Uddin
MN, Islam T, Graziano JH, Costa M, Gamble MV. Associations between blood and urine
arsenic concentrations and global levels of posttranslational histone modifications in
Bangladeshi men and women. Environmental Health Perspectives. [Epub ahead of print]
133
ABSTRACT
Background: Exposure to inorganic arsenic is associated with numerous adverse health
outcomes, with susceptibility differing by sex. While evidence from in vitro studies suggests that
arsenic alters posttranslational histone modifications (PTHMs), evidence in humans is limited.
Objectives: The objectives were to determine: 1) if arsenic exposure is associated with global
levels of PTHMs: H3K36me2, H3K36me3, and H3K79me2 in a sex-dependent manner and 2) if
PTHMs are stable when arsenic exposure is reduced.
Methods: We examined associations between arsenic, measured in blood and urine, and PTHMs
in peripheral blood mononuclear cells from 317 participants enrolled in the Bangladesh Folic
Acid and Creatine Trial (FACT). We also examined the stability of PTHMs after the use of
arsenic-removal water filters (n = 60).
Results: Associations between natural log-transformed (log) urinary arsenic, adjusted for
creatinine (uAsCr), and H3K36me2 differed significantly between men and women (P = 0.01).
Log(uAsCr) was positively associated with H3K36me2 in men (β: 0.12; 95% CI: 0.01, 0.23; P =
0.03), but was negatively associated with H3K36me2 in women (β: -0.05; 95% CI: -0.12, 0.02; P
= 0.19). The patterns of associations with blood arsenic were similar. On average, water filter use
was also associated with reductions in H3K36me2 (P < 0.01), but this did not differ significantly
by sex. Arsenic was not significantly associated with H3K36me3 or H3K79me2 in men or
women.
Conclusions: Arsenic exposure was associated with H3K36me2 in a sex-specific manner, but
was not associated with H3K36me3 or H3K79me2. Additional studies are needed to assess
changes in H3K36me2 after arsenic removal.
134
INTRODUCTION
Worldwide, more than 140 million people are exposed to arsenic-contaminated drinking
water [1]; in Bangladesh alone, up to 57 million individuals are exposed [2]. Chronic exposure to
arsenic causes bladder, lung, and skin cancers and is also associated with numerous non-cancer
health outcomes [3]. Susceptibility to many of these arsenic-related health outcomes differs by
sex, with some outcomes preferentially afflicting males and others females [3]. For example,
males are more likely to develop arsenic-induced skin lesions [4,5] and skin, liver, and bladder
cancers [6-8], while females may be more susceptible to arsenic-induced developmental
outcomes [9-11] and cardiovascular disease [12]. However, the mechanisms underlying these sex
differences remain unknown.
Experimental studies and observational studies in human populations have demonstrated
that arsenic alters epigenetic modifications, including global 5-methylcytosine (5-mC) [13-16]
and 5-hydroxymethylcytosine (5-hmC) [17,18], and there is evidence that these effects differ by
sex [17, 19-21]. In vitro and rodent studies have also shown that arsenic alters global levels of
posttranslational histone modifications (PTHMs) in tissues or cell lines derived from tissues that
are targets of arsenic toxicity, such as the lung [22], bladder [23], and brain [24], and the effects
of arsenic on PTHMs in the brain have been shown to be sex-dependent in mice [25]. An
epidemiological study of 63 male steel workers also reported that arsenic exposure via inhalation
was associated with higher global levels of histone H3 lysine 4 dimethylation in white blood
cells (WBCs) [26]; however, since this study only included men, potential differences by sex
could not be examined.

135
In a previous study of 40 Bangladeshi adults, we observed sex-specific associations
between arsenic, measured in urine, and several PTHMs (H3 lysine 4 trimethylation, H3 lysine
27 trimethylation, and H3 lysine 27 acetylation) in peripheral blood mononuclear cells (PBMCs)
[27]. We have also previously observed sex-specific associations between arsenic exposure and
global levels of both 5-mC and 5-hmC in PBMC DNA [17]. Thus, we now present data on three
PTHMs: histone H3 lysine 79 di-methylation (H3K79me2), selected because it has been shown
to regulate the expression of Tet1 [28,29], which converts 5-mC to 5-hmC [30], and it is
dysregulated in cancers [31,32], and histone H3 lysine 36 di- and tri-methylation (H3K36me2
and H3K36me3, respectively), because these two PTHMs have been shown to be altered by
arsenic in vitro [22] and they are also dysregulated in several types of cancer [33-36]. This study
utilized a subset of PBMC samples collected from participants enrolled in the Folic Acid and
Creatine Trial (FACT) [37]. First we evaluated sex-specific associations between arsenic and our
candidate PTHMs using baseline FACT samples. Then, since all participants in the trial were
provided with arsenic-removal water filters at enrollment, we evaluated whether PTHMs were
altered after reducing arsenic exposure; this was achieved using samples collected at baseline
and week 12 from participants who did not receive a dietary supplement. The data reported
herein add to a growing body of evidence that arsenic induces epigenetic dysregulation on a
global level and, moreover, that this often occurs in a sex-specific manner.
STUDY PARTICIPANTS AND METHODS
Region and Participants
In 2010, participants for the current study (FACT) were recruited from the Health Effects
of Arsenic Longitudinal Study (HEALS), a prospective cohort study which initially recruited
11,746 adults (between the ages of 20 and 65) living in a 25 km2 region in Araihazar,

136
Bangladesh [38]. FACT participants were randomly selected from all HEALS participants who
had been drinking from household wells with water arsenic ≥50 μg/L, the Bangladesh standard
for safe drinking water. Exclusion criteria included: pregnancy, nutritional supplement use, and
adverse health outcomes, including proteinuria, renal disease, diabetes, gastrointestinal disease,
chronic obstructive pulmonary disease, skin lesions, and cancer. Informed consent was obtained
by Bangladeshi field staff physicians. This study was approved by the Institutional Review
Board of Columbia University Medical Center and the Bangladesh Medical Research Council.
Study Design
The FACT study is a randomized, placebo-controlled trial that had the primary goal of
determining whether folic acid (FA) and/or creatine supplementation reduces blood arsenic
(bAs) concentrations in arsenic-exposed, Bangladeshi adults [37]. All FACT participants
received an arsenic-removal water filter (READ-F filter, Brota Services International,
Bangladesh) at baseline to be used for the duration of the study and thereafter. Participants (n =
622) were also randomized to one of five nutrition intervention treatment arms: placebo (n
=104), 400 µg FA/day (n = 156), 800 µg FA/day (n = 154), 3 g creatine/day (n = 104), and 3 g
creatine + 400 µg FA/day (n = 104) [37]. Whole blood and urine samples were collected from
participants at baseline, week 12, and week 24; sample collection and handling have been
described previously [27,37]. For the current study, we used histones isolated from baseline (i.e.,
pre-intervention)-collected PBMCs from a subset of FACT participants from all five treatment
arms (see Supplemental Material, Figure S1), who had whole blood, urine, and PBMC
samples and complete data for arsenic measures, PTHMs, and potential confounders (n = 317).
We also used all available PBMCs collected at baseline and week 12 from participants in the
placebo group (n = 60) to examine if PTHMs were altered after the use of arsenic-removal water
137
filters; due to filter use, participants in the placebo group experienced a significant decrease in
bAs concentrations from baseline to week 12 [37].
General Characteristics
General characteristics of the study participants were determined at baseline by an in-
person questionnaire. Body mass index (BMI) was calculated from the measured weight and
height of each participant (kg/m2) at baseline.
Total Blood Arsenic
As described previously [37], total bAs concentrations were measured using a Perkin-
Elmer Elan DRC II ICP-MS equipped with an AS10+ autosampler. The intra- and inter-assay
CVs for bAs were 2.7% and 5.7%, respectively.
Total Urinary Arsenic
We measured total urinary arsenic (uAs) by graphite furnace atomic absorption
spectrophotometry, using the AAnalyst 600 graphite furnace system (Perkin Elmer, Shelton,
CT), based on a method by Nixon et al. [39]. Intra- and inter-assay CVs for uAs were 3.1% and
5.4%, respectively. These values were adjusted for urinary creatinine (uCr) concentrations,
measured by a method based on the Jaffe reaction [40]. The intra- and inter-assay CVs for uCr
were 1.3% and 2.9%, respectively.
Plasma Folate and Cobalamin
Plasma folate and cobalamin were measured by radio-protein-binding assay
(SimulTRAC-SNB, MP Biomedicals). The intra- and inter-assay CVs were 5% and 13%,
respectively, for folate and 6% and 17%, respectively for cobalamin.
138
Histone Isolation
While we recently identified a cleavage product of histone H3 in human PBMCs that
interferes with the measurement of PTHMs residing downstream of H3 cleavage sites [41], we
note that the PTHMs in the current study are located upstream of cleavage sites and are therefore
not impacted by this. Histones were isolated from PBMCs by acid extraction, as described
previously [27]. Briefly, PBMCs were lysed in radioimmunoprecipitation assay buffer,
supplemented with a protease inhibitor cocktail (Roche) and 1 µM of protease inhibitor E-64, for
10 min. The cell lysate was passed through a 21-gauge needle, and the pellet was collected by
centrifugation, washed in histone washing buffer, collected again after centrifugation, and
resuspended in 0.4 N H2SO4. After incubation at 4°C overnight, the supernatant was collected by
centrifugation, mixed with acetone, and incubated overnight at -20°C. Pellets were collected by
centrifugation, washed with acetone, dried, and resuspended in 4 M urea. Histone concentrations
were determined by the Bradford Assay, according to the manufacturer’s instructions (Bio-Rad
Laboratories, Hercules, CA). Samples were aliquoted and stored at -80°C.
H3K36me2, H3K36me3, H3K79me2
PTHMs were measured by sandwich ELISA, based on a previously described method
[27]. Polystyrene 96-well microplates (Fisher Scientific) were coated with a capture antibody for
total histone H3 (Abcam, 1:20,000) and incubated overnight at 4ºC. The next day, plates were
blocked with 3% milk diluted in PBST (1 X PBS, 0.05% TWEEN-20) for 2 hr and then washed
with PBST. Histone samples from FACT participants were diluted with ddH2O. Sample dilutions
for each assay were as follows: H3K36me2, 1 ng/µL; H3K36me3, 1.5 ng/µL; H3K79me2, 2.0
ng/µL. A standard curve was made with mixed histones from calf thymus (Sigma), and a pooled
blood sample was included on each plate for calculating inter-assay CVs. FACT histone samples,
139
calf histones, and the pooled blood sample were plated in duplicate. Plates were incubated on an
orbital shaker at room temperature for 1.5 hr, then wells were washed with PBST. Detection
antibodies were diluted in 1% milk PBST, to further prevent potential background signal, and
100 µL was added to each well of the appropriate plate. Detection antibody dilutions were as
follows: total H3, Sigma, 1:40,000; H3K36me2, Abcam, 1:2,000; H3K36me3, Abcam, 1:2,000;
H3K79me2, Active Motif, 1:1,000. Plates were incubated for 1 hr at room temperature on an
orbital shaker. Plates were washed with TBST (0.1% TWEEN-20), and 100 µL of secondary
antibody (Santa Cruz, goat anti-rabbit IgG-HRP, 1:2000, diluted in TBS) was added to each well.
Plates were incubated for 1 hr at room temperature without agitation. Subsequently, plates were
washed with TBST followed by ddH2O, and 100 µL of 3,3’,5,5’-tetramethylbenzidine was added
to each well. Plates were incubated in the dark for 10 min. The reaction was quenched with 2 N
H2SO4, and the optical density was read at 450 nm using a SpectraMax 190 plate reader
(Molecular Devices) with SoftMax Pro software (version 6.3). Total H3 and each of the three
PTHMs were calculated relative to mixed calf histones based on a 4-parameter logistic standard
curve. The % PTHM level was calculated by dividing the PTHM measure by the total H3
measure. Samples from the same individual, but from different time points, were run on the same
plate. H3K79me2 values were normalized to the pooled blood sample to reduce potential batch
effects [42]. The inter-assay CV for H3K79me2 was calculated from a subset of samples (n = 16)
measured on two separate days. The intra- and inter-assay CVs, respectively, for each ELISA
method were as follows: H3K36me2: 3.4% and 9.6%, H3K36me3: 4.9% and 11.9%, and
H3K79me2: 7.1% and 7.0%. Since there were limited histone aliquots for the final assays, and
since samples with poor reproducibility were excluded, final sample sizes for H3K36me2 (n =
311) and H3K36me3 (n = 300) were smaller than the final sample size for H3K79me2 (n = 315).

140
Statistical Methods
Summary statistics were calculated for each variable (median (range) for continuous
variables and % for categorical variables) in all participants and also separately by sex.
Differences in continuous and categorical variables, between men and women and also between
participants with and without PTHM measures, were determined by Wilcoxon rank-sum and
Chi-square tests, respectively. Transformations were applied to variables with skewed
distributions to stabilize variances for parametric model assumptions and to reduce the influence
of extreme values. A natural log-transformation (log(X)) was applied to each of the predictors,
bAs and uAs, which was adjusted for uCr (uAsCr); to the covariate BMI; and also to two of the
outcome variables, H3K36me3, H3K79me2. An inverse transformation (1/Y) was applied to the
third outcome variable, H3K36me2.
A generalized linear model, with an inverse-link function applied to the mean of (1/Y),
was used to model the association between log(bAs) or log(uAsCr) and the harmonic mean of
H3K36me2. Associations between the predictors, log(bAs) and log(uAsCr) and the outcomes,
log(H3K36me3) and log(H3K79me2), were examined with linear models. Arsenic regression
coefficients (β) in models for H3K36me2 indicate the change in the harmonic mean of
H3K36me2 for a unit increase in log(bAs) or log(uAsCr), controlling for other variables in the
model, while those for H3K36me3 and H3K79me2 indicate the change in the mean of the
log(PTHM) for a unit increase in log(bAs) or log(uAsCr), controlling for other variables in the
model. Variables were considered potential confounders if they were correlated with arsenic
exposure measures and the PTHM in men or women and their addition to models changed
arsenic exposure coefficients by >10%. Therefore, we also present models adjusted for age,
log(BMI), education, and sex. To demonstrate the robustness of the associations between arsenic
141
measures and PTHMs, we also present analyses in supplemental materials showing adjustment
for additional variables: log(uCr), log(plasma folate), and log(plasma cobalamin), and also
cigarette and betel nut use (ever vs. never). All variables were included in models as continuous
variables, except for sex and education; the latter was dichotomized (education >5 years vs. ≤5
years), since many participants had 0 years of education. Models were also run separately by sex,
and differences by sex were determined using the Wald test, which compares regression
coefficients between models [43].
We also present Spearman correlations, which remain the same with or without applying
the specified transformations to variables, showing the relationships between arsenic measures
and PTHMs to confirm that the directions of the associations are consistent with model-based
results and to facilitate comparisons between PTHMs.
Relationships between baseline and week 12 measures of each PTHM were examined
using Spearman correlations. The Wilcoxon signed-rank test was used to evaluate whether
PTHMs (untransformed) changed on average over a 12 week period; this was examined in a
subset of participants (n = 60) in the placebo group (n = 56 for H3K36me2 and H3K79me2, n =
55 for H3K36me3). We also examined the within-person changes in the PTHMs separately by
sex and tested for differences using the Wilcoxon rank-sum test.
A significance level of 0.05 was used for all statistical tests and regression models, which
were performed with SAS (version 9.3, Cary, NC).
142
RESULTS
General Characteristics, Arsenic Measures, and PTHMs
General characteristics for the study participants are presented in Table 1. Participants
were between 24 and 54 years old. Approximately 22.4% of the study participants had >5 years
of education. Blood arsenic concentrations ranged from 1.0 to 80.2 μg/L. Concentrations of
uAsCr ranged from 35 to 2200 μg/g uCr. Compared with women, male study participants were
older, had lower BMIs, and had higher uCr and bAs concentrations and lower uAsCr
concentrations. Men were also more likely to have low plasma folate concentrations and to be
cigarette smokers. Individuals in the placebo group with PTHM measures (See Supplemental
Material, Table S1) were very similar to the overall study population (Table 1). The only
variables which differed were uCr concentrations and, consequently, uAs concentrations, which
were both lower in the placebo group participants. However, uAsCr concentrations were similar
between groups.
FACT participants with PTHM measures were generally comparable to FACT
participants without PTHM measures (See Supplemental Material, Table S2), although
participants with PTHM measures were slightly older, were more likely to have low folate, and
had higher uCr and uAs concentrations (before adjustment for uCr).
Associations between Arsenic Exposure and PTHMs
In the whole sample, neither log(bAs) nor log(uAsCr) was significantly associated with
any of the PTHMs (Table 2). However, log(uAsCr) was positively associated with H3K36me2 in
men both before (β: 0.13; 95% CI: 0.02, 0.24; P = 0.02) and after (β: 0.12; 95% CI: 0.01, 0.23; P
= 0.03) adjusting for age, education, and log(BMI). The association between log(uAsCr) and
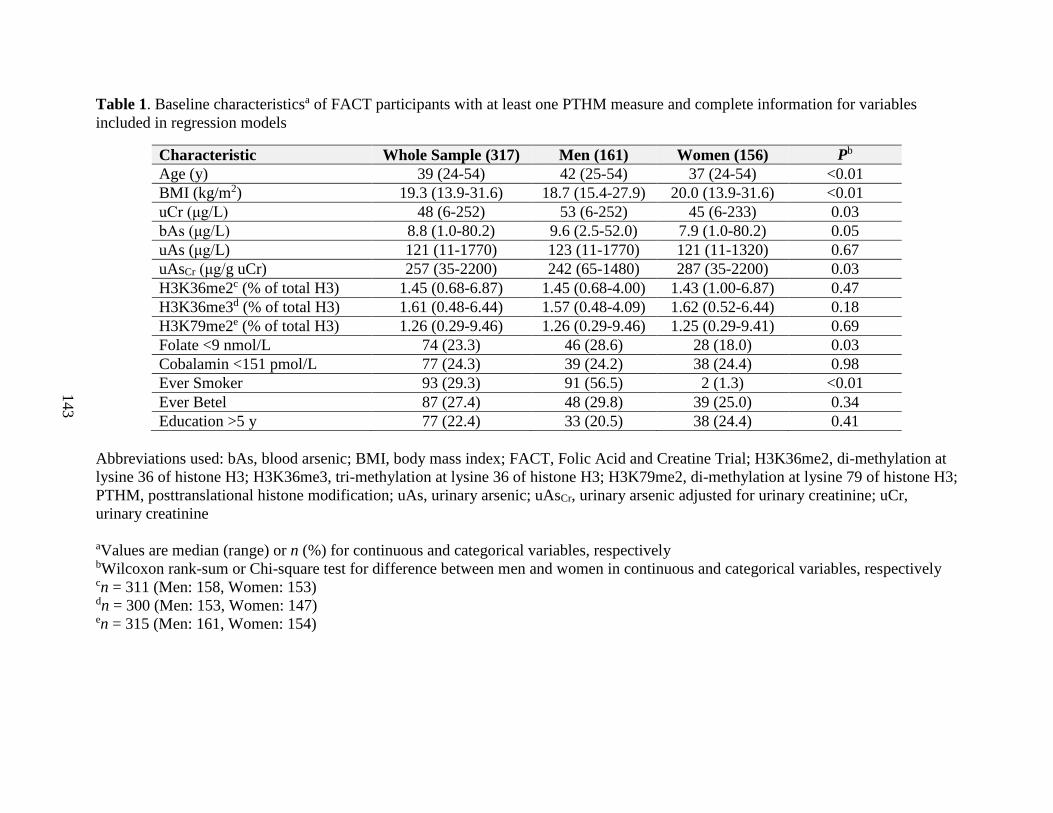
143
Table 1. Baseline characteristicsa of FACT participants with at least one PTHM measure and complete information for variables
included in regression models
Characteristic Whole Sample (317) Men (161) Women (156) Pb
Age (y) 39 (24-54) 42 (25-54) 37 (24-54) <0.01
BMI (kg/m2) 19.3 (13.9-31.6) 18.7 (15.4-27.9) 20.0 (13.9-31.6) <0.01
uCr (μg/L) 48 (6-252) 53 (6-252) 45 (6-233) 0.03
bAs (μg/L) 8.8 (1.0-80.2) 9.6 (2.5-52.0) 7.9 (1.0-80.2) 0.05
uAs (μg/L) 121 (11-1770) 123 (11-1770) 121 (11-1320) 0.67
uAsCr (μg/g uCr) 257 (35-2200) 242 (65-1480) 287 (35-2200) 0.03
H3K36me2c (% of total H3) 1.45 (0.68-6.87) 1.45 (0.68-4.00) 1.43 (1.00-6.87) 0.47
H3K36me3d (% of total H3) 1.61 (0.48-6.44) 1.57 (0.48-4.09) 1.62 (0.52-6.44) 0.18
H3K79me2e (% of total H3) 1.26 (0.29-9.46) 1.26 (0.29-9.46) 1.25 (0.29-9.41) 0.69
Folate <9 nmol/L 74 (23.3) 46 (28.6) 28 (18.0) 0.03
Cobalamin <151 pmol/L 77 (24.3) 39 (24.2) 38 (24.4) 0.98
Ever Smoker 93 (29.3) 91 (56.5) 2 (1.3) <0.01
Ever Betel 87 (27.4) 48 (29.8) 39 (25.0) 0.34
Education >5 y 77 (22.4) 33 (20.5) 38 (24.4) 0.41
Abbreviations used: bAs, blood arsenic; BMI, body mass index; FACT, Folic Acid and Creatine Trial; H3K36me2, di-methylation at
lysine 36 of histone H3; H3K36me3, tri-methylation at lysine 36 of histone H3; H3K79me2, di-methylation at lysine 79 of histone H3;
PTHM, posttranslational histone modification; uAs, urinary arsenic; uAsCr, urinary arsenic adjusted for urinary creatinine; uCr,
urinary creatinine
aValues are median (range) or n (%) for continuous and categorical variables, respectively bWilcoxon rank-sum or Chi-square test for difference between men and women in continuous and categorical variables, respectively cn = 311 (Men: 158, Women: 153) dn = 300 (Men: 153, Women: 147) en = 315 (Men: 161, Women: 154)

144
H3K36me2 was in the opposite direction for women (covariate-adjusted β: -0.05; 95% CI: -0.12,
0.02; P = 0.19) and differed significantly from the corresponding estimate in men (P = 0.01)
(Table 2). While not statistically significant, associations between log(bAs) and H3K36me2 were
similar to those for log(uAsCr), with estimates that were positive in men and negative in women
(P for difference between men and women = 0.08 for covariate-adjusted models). The patterns of
associations according to sex were similar for log(H3K36me3). Since coefficients in models for
H3K36me2 represent changes in the harmonic mean of H3K36me2, while coefficients in models
for H3K36me3 represent changes in the mean of log(H3K36me3), the magnitudes of the
associations cannot be directly compared. However, the findings were consistent when examined
by Spearman correlation, which does not require that variables be transformed and thus allows
for more direct comparisons between PTHMs (See Supplemental Material, Table S3).
Although associations between log-transformed arsenic measures and log(H3K36me3) were not
significant in either men or women, differences by sex were significant or suggestive (Table 2).
Log-transformed arsenic measures were not associated with log(H3K79me2) in men or women,
and differences by sex were not significant (Table 2). Associations between arsenic measures
and PTHMs were very similar after additionally adjusting for log(uCr), log(plasma folate),
log(plasma cobalamin), cigarette smoking status, and betel nut use (See Supplemental Material,
Table S4).
Stability of PTHMs after Reductions in Arsenic Exposure
Arsenic-removal water filter use for 12 weeks was associated with significant reductions
in bAs (see [37]) and uAsCr (P < 0.01, Wilcoxon signed-rank test) in the placebo group.
Summary statistics for within-person changes in H3K36me2, H3K36me3, and H3K79me2
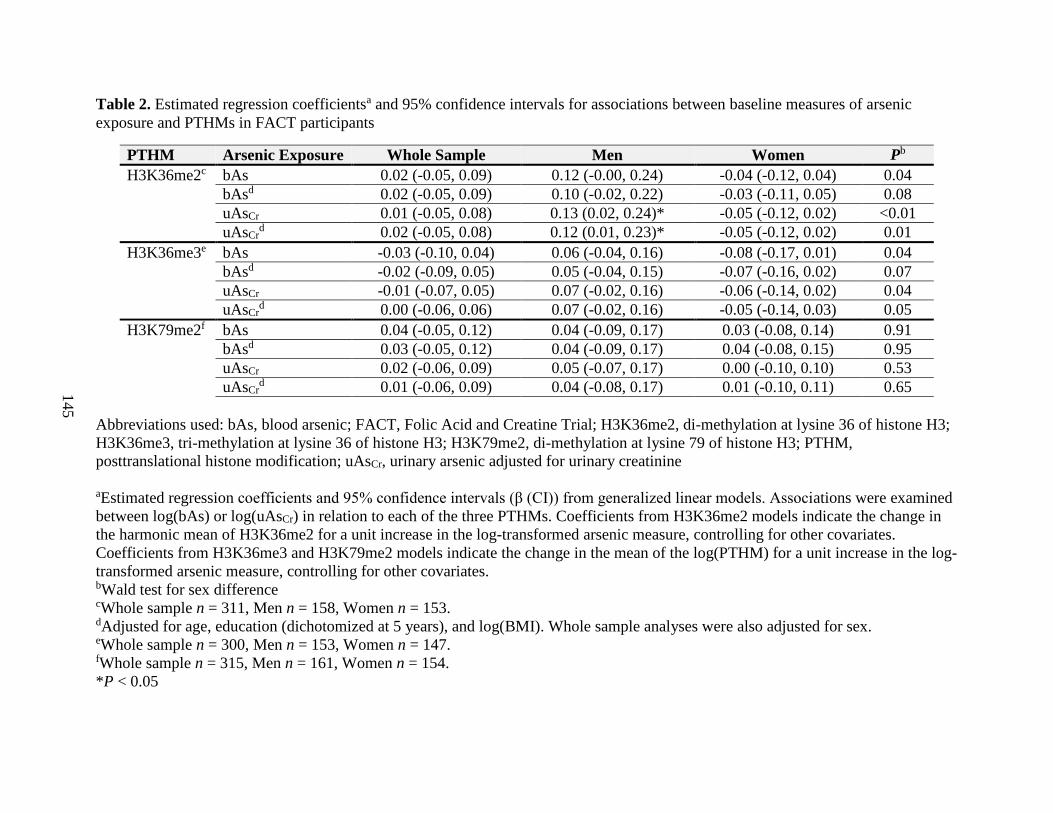
145
Table 2. Estimated regression coefficientsa and 95% confidence intervals for associations between baseline measures of arsenic
exposure and PTHMs in FACT participants
PTHM Arsenic Exposure Whole Sample Men Women Pb
H3K36me2c bAs 0.02 (-0.05, 0.09) 0.12 (-0.00, 0.24) -0.04 (-0.12, 0.04) 0.04
bAsd 0.02 (-0.05, 0.09) 0.10 (-0.02, 0.22) -0.03 (-0.11, 0.05) 0.08
uAsCr 0.01 (-0.05, 0.08) 0.13 (0.02, 0.24)* -0.05 (-0.12, 0.02) <0.01
uAsCrd 0.02 (-0.05, 0.08) 0.12 (0.01, 0.23)* -0.05 (-0.12, 0.02) 0.01
H3K36me3e bAs -0.03 (-0.10, 0.04) 0.06 (-0.04, 0.16) -0.08 (-0.17, 0.01) 0.04
bAsd -0.02 (-0.09, 0.05) 0.05 (-0.04, 0.15) -0.07 (-0.16, 0.02) 0.07
uAsCr -0.01 (-0.07, 0.05) 0.07 (-0.02, 0.16) -0.06 (-0.14, 0.02) 0.04
uAsCrd 0.00 (-0.06, 0.06) 0.07 (-0.02, 0.16) -0.05 (-0.14, 0.03) 0.05
H3K79me2f bAs 0.04 (-0.05, 0.12) 0.04 (-0.09, 0.17) 0.03 (-0.08, 0.14) 0.91
bAsd 0.03 (-0.05, 0.12) 0.04 (-0.09, 0.17) 0.04 (-0.08, 0.15) 0.95
uAsCr 0.02 (-0.06, 0.09) 0.05 (-0.07, 0.17) 0.00 (-0.10, 0.10) 0.53
uAsCrd 0.01 (-0.06, 0.09) 0.04 (-0.08, 0.17) 0.01 (-0.10, 0.11) 0.65
Abbreviations used: bAs, blood arsenic; FACT, Folic Acid and Creatine Trial; H3K36me2, di-methylation at lysine 36 of histone H3;
H3K36me3, tri-methylation at lysine 36 of histone H3; H3K79me2, di-methylation at lysine 79 of histone H3; PTHM,
posttranslational histone modification; uAsCr, urinary arsenic adjusted for urinary creatinine
aEstimated regression coefficients and 95% confidence intervals (β (CI)) from generalized linear models. Associations were examined
between log(bAs) or log(uAsCr) in relation to each of the three PTHMs. Coefficients from H3K36me2 models indicate the change in
the harmonic mean of H3K36me2 for a unit increase in the log-transformed arsenic measure, controlling for other covariates.
Coefficients from H3K36me3 and H3K79me2 models indicate the change in the mean of the log(PTHM) for a unit increase in the log-
transformed arsenic measure, controlling for other covariates. bWald test for sex difference cWhole sample n = 311, Men n = 158, Women n = 153. dAdjusted for age, education (dichotomized at 5 years), and log(BMI). Whole sample analyses were also adjusted for sex. eWhole sample n = 300, Men n = 153, Women n = 147. fWhole sample n = 315, Men n = 161, Women n = 154.
*P < 0.05
146
from baseline to week 12 for participants in the placebo group are presented in Table 3.
Although for each of the three PTHMs analyzed, baseline values were significantly correlated
with values measured at week 12 (P-values from Spearman correlations < 0.01), the median
change in H3K36me2 from baseline to week 12 was negative (-0.15). Thus, on average
H3K36me2 declined over time (P < 0.01), although the interquartile range (IQR) for the within-
person change (-0.43, 0.11) indicates that this mark did increase over time in at least 25% of
participants. In sex-stratified analyses, H3K36me2 was found to decrease on average among both
men and women. However, the decline was only statistically significant among women (P <
0.01). H3K36me3 did not change significantly during the 12 week period, but there was a
suggestive decrease in H3K79me2 (median within-person change: -0.05; IQR: -0.24, 0.04), P =
0.07). The within-person changes in PTHMs did not differ significantly by sex (Table 3).
DISCUSSION
In an adult population in Bangladesh, we examined associations between arsenic
exposure and three PTHMs (H3K36me2, H3K36me3, and H3K79me2), which were selected
because they are dysregulated in several types of cancer [31-36] and are altered by arsenic in
vitro [22] or regulate 5-hmC [28,29]. Percent 5-hmC has been shown to be altered by arsenic in
male rats [18] and in humans in a sex-dependent manner [17]. We observed that arsenic was
associated with higher levels of H3K36me2, but only in men. Interestingly, the use of arsenic-
removal water filters, which was associated with significant reductions in both bAs [37] and
uAsCr, was also associated with significant reductions in H3K36me2 in the full sample.
However, in sex-stratified analyses, while we observed that H3K36me2 declined in both men
and women, this only achieved statistical significance among women. Given that there was no

147
Table 3. Within-person changes in PTHMs from baseline to week 12 for FACT participants in the placebo group
PTHM Whole Sample Men Women pa
n Median (IQR) Pb n Median (IQR) Pb n Median (IQR) Pb
H3K36me2 56 -0.15 (-0.43, 0.11) <0.01 27 -0.07 (-0.44, 0.16) 0.14 29 -0.17 (-0.37, 0.04) <0.01 0.62
H3K36me3 55 0.02 (-0.23, 0.30) 0.61 28 0.05 (-0.23, 0.47) 0.35 27 0.02 (-0.22, 0.12) 0.93 0.35
H3K79me2 56 -0.05 (-0.24, 0.04) 0.07 29 -0.03 (-0.28, 0.09) 0.36 27 -0.05 (-0.18, 0.04) 0.10 0.88
Abbreviations used: FACT, Folic Acid and Creatine Trial; H3K36me2, di-methylation at lysine 36 of histone H3; H3K36me3, tri-
methylation at lysine 36 of histone H3; H3K79me2, di-methylation at lysine 79 of histone H3; IQR, interquartile range; PTHM,
posttranslational histone modification
aWilcoxon rank-sum test for difference between men and women in the within-person change for each PTHM bWilcoxon signed-rank test for within-person change in PTHM from baseline to week 12
148
comparison group that did not receive arsenic-removal water filters due to ethical considerations,
we cannot rule out the possibility that the decline in H3K36me2 may have been caused by
extrinsic factors. Additional studies will be needed to confirm the changes we observed
in H3K36me2 in association with arsenic removal. In cross-sectional analyses, arsenic exposure
was not associated with H3K36me3. Additionally, H3K36me3 did not change over time, despite
reductions in arsenic exposure. Thus, arsenic does not appear to alter H3K36me3 in histones
derived from PBMCs. Although in cross-sectional analyses arsenic exposure was not associated
with H3K79me2, which has been shown to regulate the expression of Tet1 [28,29], we did
observe a suggestive (P = 0.07) decline in H3K79me2 over time after individuals received
arsenic-removal water filters; this needs to be confirmed in a larger sample.
Although neither H3K36me3 nor H3K79me2 changed significantly over the 12 week
period, we cannot make definitive conclusions about the stability of these marks, since all
participants received arsenic-removal water filters at baseline and were thus subject to an
intervention; furthermore, these marks did vary over time in some participants. Little is known
about the stability of PTHMs in human PBMCs. One study by Zhang et al. examined the stability
of PTHMs during adipogenesis and observed that while gene-specific levels of PTHMs were
highly dynamic, global levels of PTHMs were remarkably stable [44]. However, since Zhang et
al. used murine adipocyte cell lines, it is unclear if these findings are relevant to PTHM stability
in human PBMCs. One previous epidemiological study measured PTHMs in PBMCs collected at
three one-week intervals from 15 nickel refinery workers and 15 individuals who had not been
exposed occupationally to nickel, and observed that the inter-individual variances in PTHMs
were much higher than the intra-individual variances, suggesting that PTHMs are relatively

149
stable over time in human PBMCs [45]. However, since this was evaluated over a short duration,
and in a small number of participants, this is an area that requires additional investigation.
Our study has several potential limitations. First, given the cross-sectional nature of some
of the analyses, we need to consider the possibility of reverse causality. Since several previous
experimental studies have shown that arsenic influences PTHMs, it is unlikely that reverse
causality would explain our findings. However, it is possible that PTHMs influence the
expression of genes involved in arsenic metabolism, such as the arsenic (+3 oxidation state)
methyltransferase, which could thereby influence the excretion of arsenic, thus altering bAs and
uAsCr concentrations. Although residual confounding is another important consideration, the
associations between arsenic measures and PTHMs were quite robust, even after adjusting for
additional covariates. Another important consideration for our study is the fact that PTHMs were
measured in human PBMCs, which consists of a mixed population of cell types. However, global
DNA methylation levels, which are closely related to PTHMs, have been shown to be very
similar between blood cell types (reviewed in [46]). Additionally, a cross-sectional study of 63
male steel workers, which examined associations between inhalation exposure to occupational
toxicants, including arsenic, and PTHMs in total WBCs, evaluated the influence of cell type
distribution on these associations, and observed that while adjusting for the proportion of
granulocytes influenced their results, adjusting for other cell types did not have a major impact
[26]. Since we measured PTHMs in PBMCs, which do not include granulocytes, potential shifts
in the proportion of granulocytes could not explain the associations we observed between arsenic
and PTHMs. However, we cannot rule out the possibility that alterations in the proportion of
monocytes, natural killer cells, T cells, or B cells, or their subpopulations, may have affected our
findings, and this is an area that merits additional investigation. Another important limitation of
150
our study is that the sample sizes for prospective analyses were small. Therefore, we may have
had insufficient statistical power to formally examine sex differences in the influence of arsenic
removal on PTHMs. Finally, we recently identified a specific cleavage product of histone H3 in
human PBMCs and observed that global levels of H3K36me2 and H3K79me2 were significantly
higher in samples with extensive H3 cleavage ([41] and see Chapter 4). Therefore, while H3
cleavage does not impact the measurement of PTHMs, it is possible that this phenomenon
nevertheless impacted our findings.
Despite some of the limitations of this study, our findings support a previous
experimental study in A549 cells, which examined the effects of arsenite (2.5 and 5 µM) on
H3K36me2 and H3K36me3 [22] and observed that arsenic decreased H3K36me2 and increased
H3K36me3. Although we observed a positive association between uAsCr and H3K36me2 in men
and did not observe a significant association between uAsCr and H3K36me3, we studied a
population exposed to arsenic-contaminated drinking water for years to decades, while Zhou et
al. measured PTHMs in a cell line that was exposed to arsenic for a 24 hour period. Furthermore,
our study participants were healthy individuals, whereas A549 cells are alveolar basal epithelial
cells derived from a male human lung tumor; arsenic may have distinct effects in different
tissues and may also have differential effects in normal vs. cancerous cells. Additionally, in vitro
studies are limited in that they cannot account for the numerous systemic differences associated
with sex in vivo. Nevertheless, it is quite interesting that arsenic appears to target H3K36me2 in
such diverse models.
Although the consequences of arsenic-induced increases in H3K36me2 are currently
unknown, H3K36me2 has been implicated in oncogenic programming [47], and some of the
enzymes responsible for regulating this mark, such as methyltransferase NSD2, are
151
overexpressed in multiple cancers, including those caused by arsenic, such as bladder, lung, and
skin cancers [48]. A global increase in H3K36me2 leads to widespread increases in this mark
across the genome, thereby altering its typical distribution [49]; this may have profound effects
on both gene expression and genomic stability. For example, a global increase in H3K36me2 is
associated with increased levels of H3K36me2 within gene bodies, which in turn is associated
with increased expression of genes involved in oncogenic programming [47].
Similar to our findings, several studies have observed sex-specific effects of arsenic on
other epigenetic marks, such as DNA methylation [19-21], including our previous finding that
arsenic exposure is associated with increased global levels of 5-mC and 5-hmC in men but not
women [17]. Sex-specific effects of other environmental contaminants, such as cadmium and
lead, on DNA methylation have also been observed [50,51]. Since PTHMs can direct DNA
methylation patterns [52], PTHMs may mediate the effects of environmental contaminants, such
as arsenic, on DNA methylation marks. In addition to the sex-specific findings for uAsCr and
H3K36me2 reported here, our group previously observed sex-specific correlations between
uAsCr and several other PTHMs [27]. Additionally, Tyler et al. recently demonstrated that arsenic
alters PTHMs in a sex-dependent manner in the mouse brain [25]. Although the mechanisms are
not fully understood, arsenic also altered the expression of corresponding histone modifying
enzymes, including MLL and KDM5B, in a sex-dependent manner [25]. Many histone
modifying enzymes have also been shown to interact with androgen receptor [53], and some
histone demethylases are dosage-sensitive regulators that are coded for by genes that reside on
the Y chromosome and are highly conserved across mammalian species and broadly expressed
across tissues and cell types [54]. Thus, both hormonal influences and genetic differences may
contribute to the sex-specific effects of arsenic on PTHMs.
152
For many arsenic-induced health outcomes, susceptibility differs by sex [3]. For example,
men are more susceptible to developing arsenic-induced skin lesions [4,5], and cancers of the
skin, liver, and bladder [6-8]. In contrast, several studies have reported that early life exposure to
arsenic is associated with impaired intellectual function and other developmental outcomes
among female, but not male, children [9-11]. Additionally, in the United States the arsenic-
associated risk for cardiovascular disease was found to be higher among women [12]. Animal
studies have also demonstrated sex-specific effects of arsenic for many outcomes. For example,
female mice are more susceptible to arsenic-induced changes in locomotor activity [55] and are
more likely to develop lung tumors as a result of prenatal exposure to arsenic, while males are
more likely to develop liver and adrenal tumors [56].
Although some of the sex-specific effects of arsenic observed in human populations may
be explained by gender-differences in co-exposures (e.g., cigarette smoking, UV exposure, and
nutritional deficiencies), the dramatic sex differences observed in well-controlled animal studies
of arsenic toxicity suggest that co-exposures are not solely responsible for these differences. One
consideration is that women have a higher capacity to fully methylate inorganic arsenic to
dimethyl arsenic species, which facilitates arsenic elimination in urine [57-59]. This should
generally reduce arsenic toxicity for women. However, some arsenic-related health outcomes
preferentially afflict women, thus, there are likely other contributing factors. Epigenetic
dysregulation has been implicated in the development of arsenic-induced health outcomes,
including skin lesions and cancers of the skin and bladder [60-63]. Thus, epigenetic
dysregulation may be one important mechanism contributing to the sex differences observed for
multiple arsenic-related health outcomes. Previous studies examining the sex-specific effects of
153
arsenic on epigenetics have focused on DNA methylation. However, this study and our previous
study [27] suggest that arsenic also induces sex-specific alterations in PTHMs.
CONCLUSIONS
Our findings have two major implications that warrant further investigation. First, arsenic
exposure was associated with H3K36me2 in a sex-dependent manner in our study population of
adults in Bangladesh. While it is tempting to speculate that these findings may explain some of
the observed sex differences in susceptibility to arsenic-induced diseases, the impact of
H3K36me2 and other PTHMs on health outcomes will require further study. Secondly, the
arsenic-associated increase in H3K36me2 observed in men decreased, albeit non-significantly,
after the use of arsenic-removal water filters. However, since we did not have a comparison
group that did not receive water filters, and since H3K36me2 decreased significantly in women,
future studies will be needed to evaluate the effects of arsenic removal on H3K36me2 and to
investigate whether downstream effects of alterations in PTHMs, such as changes in DNA
methylation patterns, persist over time.
ACKNOWLEDGEMENTS
This study was funded by NIH grants P42 ES010349, RO1 CA133595, RO1 ES017875, T32
ES007322, F31 ES025100, and P30 ES009089
154
CHAPTER FIVE REFERENCES
1. Bagchi S. Arsenic threat reaching global dimensions. CMAJ. 2007;177(11):1344-1345.
2. Kinniburgh DG, Smedley PL, Davies J, Milne CJ, Gaus I, Trafford JM, et al. The scale and
causes of the groundwater arsenic problem in Bangladesh. In: Arsenic in Ground Water:
(Welch AH, Stollenwerk KG, eds). Boston, MA: Kluwer Academic Publishers: 2003.
p.211-257.
3. National Research Council. 2013. Critical aspects of EPA's IRIS assessment of inorganic
arsenic. National Research Council Interim Report.
4. Ahsan H, Chen Y, Parvez F, Zablotska L, Argos M, Hussain I, et al. Arsenic exposure
from drinking water and risk of premalignant skin lesions in bangladesh: baseline results
from the Health Effects of Arsenic Longitudinal Study. Am J Epidemiol. 2006;163:1138-
1148.
5. Watanabe C, Inaoka T, Kadono T, Nagano M, Nakamura S, Ushijima K, et al. Males in
rural Bangladeshi communities are more susceptible to chronic arsenic poisoning than
females: analyses based on urinary arsenic. Environ Health Perspect. 2001;109:1265.
6. Chen C-J, Wang C-J. Ecological correlation between arsenic level in well water and age-
adjusted mortality from malignant neoplasms. Cancer Res. 1990;50:5470-5474.
7. Chen Y-C, Guo Y-LL, Su H-JJ, Hsueh Y-M, Smith TJ, Ryan LM, et al. Arsenic
methylation and skin cancer risk in southwestern Taiwan. J Occup Environ Med.
2003;45:241-248.
8. Leonardi G, Vahter M, Clemens F, Goessler W, Gurzau E, Hemminki K, et al. Inorganic
arsenic and basal cell carcinoma in areas of Hungary, Romania, and Slovakia: a case-
control study. Environmental Health Perspect. 2012;120:721-726.
9. Gardner RM, Kippler M, Tofail F, Bottai M, Hamadani J, Grandér M, et al. Environmental
exposure to metals and children's growth to age 5 years: a prospective cohort study. Am J
Epidemiol. 2013;177(12):1356-67.
10. Hamadani J, Tofail F, Nermell B, Gardner R, Shiraji S, Bottai M, et al. Critical
windows of exposure for arsenic-associated impairment of cognitive function in pre-school
girls and boys: a population-based cohort study. Int J Epidemiol. 2011;40:1593-1604.
11. Saha KK, Engström A, Hamadani JD, Tofail F, Rasmussen KM, Vahter M. Pre- and
postnatal arsenic exposure and body size to 2 years of age: a cohort study in rural
Bangladesh. Environ Health Perspect. 2012;120:1209.
155
12. Moon KA, Guallar E, Umans JG, Devereux RB, Best LG, Francesconi KA, et al.
Association between exposure to low to moderate arsenic levels and incident
cardiovascular disease: a prospective cohort study. Ann Intern Med. 2013;159:649-659.
13. Niedzwiecki MM, Hall MN, Liu X, Oka J, Harper KN, Slavkovich V, et al. A dose–
response study of arsenic exposure and global methylation of peripheral blood
mononuclear cell DNA in Bangladeshi adults. Environ Health Perspect. 2013;121:1306.
14. Pilsner JR, Liu X, Ahsan H, Ilievski V, Slavkovich V, Levy D, et al. Genomic
methylation of peripheral blood leukocyte DNA: influences of arsenic and folate in
Bangladeshi adults. Am J Clin Nutr. 2007;86:1179-1186.
15. Ren X, McHale CM, Skibola CF, Smith AH, Smith MT, Zhang L. An emerging role
for epigenetic dysregulation in arsenic toxicity and carcinogenesis. Environ Health
Perspect. 2010;119:11-19.
16. Tellez-Plaza M, Tang WY, Shang Y, Umans JG, Francesconi KA, Goessler W, et al.
Association of global DNA methylation and global DNA hydroxymethylation with metals
and other exposures in human blood DNA samples. Environ Health Perspect.
2014;122:946-954.
17. Niedzwiecki MM, Liu X, Hall MN, Thomas T, Slavkovich V, Ilievski V, et al. Sex-
specific associations of arsenic exposure with global DNA methylation and
hydroxymethylation in leukocytes: results from two cross-sectional studies in Bangladesh.
Cancer Epidemiol Biomarkers & Prev. 2015;24:1748-1757.
18. Zhang J, Mu X, Xu W, Martin FL, Alamdar A, Liu L, et al. Exposure to arsenic via
drinking water induces 5-hydroxymethylcytosine alteration in rat. Sci Total Environ. 2014;
498:618-625.
19. Broberg K, Ahmed S, Engstrom K, Hossain MB, Jurkovic Mlakar S, Bottai M, et al.
Arsenic exposure in early pregnancy alters genome-wide DNA methylation in cord blood,
particularly in boys. J Dev Orig Health Dis. 2014;5:288-298.
20. Nohara K, Baba T, Murai H, Kobayashi Y, Suzuki T, Tateishi Y, et al. Global DNA
methylation in the mouse liver is affected by methyl deficiency and arsenic in a sex-
dependent manner. Arch Toxicol. 2011;85:653-661.
21. Pilsner JR, Hall MN, Liu X, Ilievski V, Slavkovich V, Levy D, et al. Influence of
prenatal arsenic exposure and newborn sex on global methylation of cord blood DNA.
PLoS One. 2012;7:25.
22. Zhou X, Sun H, Ellen TP, Chen H, Costa M. Arsenite alters global histone H3
methylation. Carcinogenesis. 2008;29:1831-1836.
156
23. Chu F, Ren X, Chasse A, Hickman T, Zhang L, Yuh J, et al. Quantitative mass
spectrometry reveals the epigenome as a target of arsenic. Chem Biological Interact. 2011;
192:113-117.
24. Cronican AA, Fitz NF, Carter A, Saleem M, Shiva S, Barchowsky A, et al. Genome-
wide alteration of histone H3K9 acetylation pattern in mouse offspring prenatally exposed
to arsenic. PLoS One. 2013;8:6.
25. Tyler CR, Hafez AK, Solomon ER, Allan AM. Developmental exposure to 50 parts-
per-billion arsenic influences histone modifications and associated epigenetic machinery in
a region- and sex-specific manner in the adult mouse brain. Toxicol Appl Pharmacol. 2015;
288:40-51.
26. Cantone L, Nordio F, Hou L, Apostoli P, Bonzini M, Tarantini L, et al. Inhalable
metal-rich air particles and histone H3K4 dimethylation and H3K9 acetylation in a cross-
sectional study of steel workers. Environ Health Perspect. 2011;119:964-969.
27. Chervona Y, Hall MN, Arita A, Wu F, Sun H, Tseng HC, et al. Associations between
arsenic exposure and global posttranslational histone modifications among adults in
Bangladesh. Cancer Epidemiol Biomarkers Prev. 2012;21:2252-2260.
28. Huang H, Jiang X, Li Z, Li Y, Song C-X, He C, et al. TET1 plays an essential
oncogenic role in MLL-rearranged leukemia. Proc Natl Acad Sci U S A. 2013;110:11994-
11999.
29. Williams K, Christensen J, Pedersen MT, Johansen JV, Cloos PA, Rappsilber J, et al.
TET1 and hydroxymethylcytosine in transcription and DNA methylation fidelity. Nature.
2011;473:343-348.
30. Ito S, Shen L, Dai Q, Wu SC, Collins LB, Swenberg JA, et al. Tet proteins can
convert 5-methylcytosine to 5-formylcytosine and 5-carboxylcytosine. Science. 2011;
333:1300-1303.
31. Bernt KM, Zhu N, Sinha AU, Vempati S, Faber J, Krivtsov AV, et al. MLL-
rearranged leukemia is dependent on aberrant H3K79 methylation by DOT1L. Cancer Cell.
2011;20:66-78.
32. Zhang L, Deng L, Chen F, Yao Y, Wu B, Wei L, et al. Inhibition of histone H3K79
methylation selectively inhibits proliferation, self-renewal and metastatic potential of breast
cancer. Oncotarget. 2014;5:10665.
33. Duns G, van den Berg E, van Duivenbode I, Osinga J, Hollema H, Hofstra RM, et al.
Histone methyltransferase gene SETD2 is a novel tumor suppressor gene in clear cell renal
cell carcinoma. Cancer Res. 2010;70:4287-4291.
157
34. Fontebasso AM, Schwartzentruber J, Khuong-Quang DA, Liu XY, Sturm D, Korshunov A,
et al. Mutations in SETD2 and genes affecting histone H3K36 methylation target
hemispheric high-grade gliomas. Acta Neuropathol. 2013;125:659-669.
35. He J, Nguyen AT, Zhang Y. KDM2b/JHDM1b, an H3K36me2-specific demethylase,
is required for initiation and maintenance of acute myeloid leukemia. Blood.
2011;117:3869-3880.
36. Tamagawa H, Oshima T, Numata M, Yamamoto N, Shiozawa M, Morinaga S, et al.
Global histone modification of H3K27 correlates with the outcomes in patients with
metachronous liver metastasis of colorectal cancer. Eur J Surg Oncol. 2013;39:655-661.
37. Peters BA, Hall MN, Liu X, Parvez F, Sanchez TR, van Geen A, et al. Folic acid and
creatine as therapeutic approaches to lower blood arsenic: a randomized controlled trial.
Environ Health Perspect. 2015;123:1294-1301.
38. Ahsan H, Chen Y, Parvez F, Argos M, Hussain AI, Momotaj H, et al. Health
Effects of Arsenic Longitudinal Study (HEALS): description of a multidisciplinary
epidemiologic investigation. J Exp Sci Environ Epidemiol. 2006;16:191-205.
39. Nixon DE, Mussmann G, Eckdahl SJ, Moyer TP. Total arsenic in urine: palladium-
persulfate vs nickel as a matrix modifier for graphite furnace atomic absorption
spectrophotometry. Clin Chem. 1991;37:1575-1579.
40. Slot C. Plasma creatinine determination. A new and specific Jaffe reaction method.
Scand J Clin Lab Invest. 1965;17:381-387.
41. Howe CG and Gamble MV. Enzymatic cleavage of histone H3: a new consideration
when measuring histone modifications in human samples. Clin Epigenetics. 2015;7:7.
42. Ramanakumar AV, Thomann P, Candeias JM, Ferreira S, Villa LL, Franco EL. Use
of the normalized absorbance ratio as an internal standardization approach to minimize
measurement error in enzyme-linked immunosorbent assays for diagnosis of human
papillomavirus infection. J Clin Microbiol. 2010;48:791-796.
43. Clogg CC, Petkova E, Haritou A. Statistical methods for comparing regression
coefficients between models. Am J Sociol. 1995;100:1261-1293.
44. Zhang Q, Ramlee MK, Brunmeir R, Villanueva CJ, Halperin D, Xu F. Dynamic and
distinct histone modifications modulate the expression of key adipogenesis regulatory
genes. Cell Cycle. 2012;11:4310-4322.
45. Arita A, Niu J, Qu Q, Zhao N, Ruan Y, Nadas A, et al. Global levels of histone
modifications in peripheral blood mononuclear cells of subjects with exposure to nickel.
Environ Health Perspect. 2012;120:198.
158
46. Smith ZD and Meissner A. DNA methylation: roles in mammalian development. Nat Rev
Genet. 2013;14:204-220.
47. Kuo AJ, Cheung P, Chen K, Zee BM, Kioi M, Lauring J, et al. NSD2 links
dimethylation of histone H3 at lysine 36 to oncogenic programming. Mol Cell.
2011;44:609-620.
48. Hudlebusch HR, Santoni-Rugiu E, Simon R, Ralfkiaer E, Rossing HH, Johansen JV, et al.
The histone methyltransferase and putative oncoprotein MMSET is overexpressed in a
large variety of human tumors. Clin Cancer Res. 2011;17:2919-2933.
49. Popovic R, Martinez-Garcia E, Giannopoulou EG, Zhang Q, Ezponda T, Shah MY, et al.
Histone methyltransferase MMSET/NSD2 alters EZH2 binding and reprograms the
myeloma epigenome through global and focal changes in H3K36 and H3K27 methylation.
PLoS Genet. 2014;10.
50. Faulk C, Barks A, Liu K, Goodrich JM, Dolinoy DC. Early-life lead exposure results
in dose-and sex-specific effects on weight and epigenetic gene regulation in weanling mice.
Epigenomics. 2013;5:487-500.
51. Kippler M, Engström K, Mlakar SJ, Bottai M, Ahmed S, Hossain MB, et al. Sex-
specific effects of early life cadmium exposure on DNA methylation and implications for
birth weight. Epigenetics 2013;8:494-503.
52. Cedar H, Bergman Y. Linking DNA methylation and histone modification: patterns
and paradigms. Nat Rev Genet. 2009;10:295-304.
53. Heemers HV, Tindall DJ. Androgen receptor (AR) coregulators: a diversity of
functions converging on and regulating the AR transcriptional complex. Endocr Rev. 2007;
28:778-808.
54. Bellott DW, Hughes JF, Skaletsky H, Brown LG, Pyntikova T, Cho TJ, et al. Mammalian
Y chromosomes retain widely expressed dosage-sensitive regulators. Nature.
2014;508:494-499.
55. Bardullas U, Limón-Pacheco J, Giordano M, Carrizales L, Mendoza-Trejo M, Rodríguez
V. Chronic low-level arsenic exposure causes gender-specific alterations in locomotor
activity, dopaminergic systems, and thioredoxin expression in mice. Toxicol Appl P
Pharmacol. 2009; 239:169-177.
56. Waalkes MP, Ward JM, Liu J, Diwan BA. Transplacental carcinogenicity of inorganic
arsenic in the drinking water: induction of hepatic, ovarian, pulmonary, and adrenal tumors
in mice. Toxicol Appl Pharmacol. 2003;186:7-17.

159
57. Hopenhayn-Rich C, Biggs ML, Smith AH, Kalman DA, Moore LE. Methylation study of a
population environmentally exposed to arsenic in drinking water. Environ Health
Perspect. 1996;104:620.
58. Hsueh YM, Ko YF, Huang YK, Chen HW, Chiou HY, Huang YL, et al. Determinants
of inorganic arsenic methylation capability among residents of the Lanyang Basin, Taiwan:
arsenic and selenium exposure and alcohol consumption. Toxicol Lett. 2003;137:49-63.
59. Lindberg AL, Kumar R, Goessler W, Thirumaran R, Gurzau E, Koppova K, et al.
Metabolism of low-dose inorganic arsenic in a central European population: influence of
sex and genetic polymorphisms. Environ Health Perspect. 2007;115:1081-1086.
60. Chanda S, Dasgupta UB, Guhamazumder D, Gupta M, Chaudhuri U, Lahiri S, et al. DNA
hypermethylation of promoter of gene p53 and p16 in arsenic-exposed people with and
without malignancy. Toxicol Sci. 2006;89:431-437.
61. Pilsner RJ, Liu X, Ahsan H, Ilievski V, Slavkovich V, Levy D, et al. Folate deficiency,
hyperhomocysteinemia, low urinary creatinine, and hypomethylation of leukocyte DNA are
risk factors for arsenic-induced skin lesions. Environ Health Perspect. 2009;117:254-260.
62. Smeester L, Rager JE, Bailey KA, Guan X, Smith N, Garcia-Vargas G, et al. Epigenetic
changes in individuals with arsenicosis. Chem Res Toxicol. 2011;24:165-167.
63. Wilhelm CS, Kelsey KT, Butler R, Plaza S, Gagne L, Zens MS, et al. Implications of
LINE1 methylation for bladder cancer risk in women. Clin Cancer Res. 2010;16:1682-
1689.
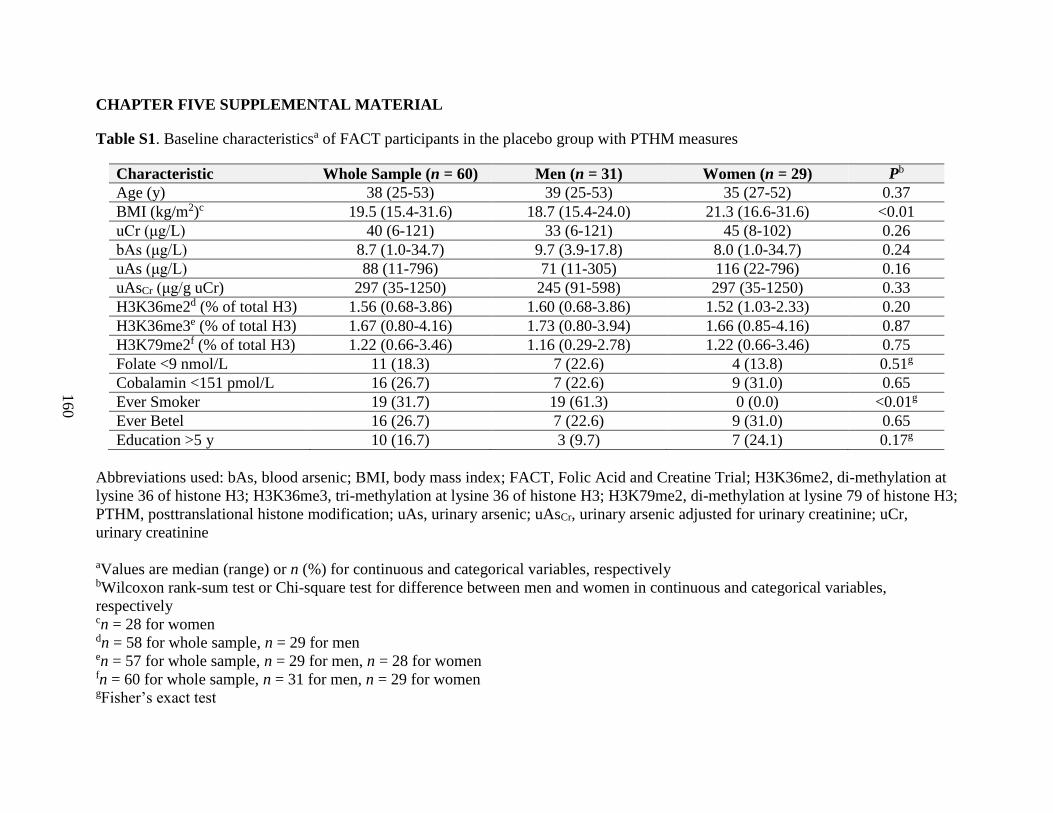
160
CHAPTER FIVE SUPPLEMENTAL MATERIAL
Table S1. Baseline characteristicsa of FACT participants in the placebo group with PTHM measures
Characteristic Whole Sample (n = 60) Men (n = 31) Women (n = 29) Pb
Age (y) 38 (25-53) 39 (25-53) 35 (27-52) 0.37
BMI (kg/m2)c 19.5 (15.4-31.6) 18.7 (15.4-24.0) 21.3 (16.6-31.6) <0.01
uCr (μg/L) 40 (6-121) 33 (6-121) 45 (8-102) 0.26
bAs (μg/L) 8.7 (1.0-34.7) 9.7 (3.9-17.8) 8.0 (1.0-34.7) 0.24
uAs (μg/L) 88 (11-796) 71 (11-305) 116 (22-796) 0.16
uAsCr (μg/g uCr) 297 (35-1250) 245 (91-598) 297 (35-1250) 0.33
H3K36me2d (% of total H3) 1.56 (0.68-3.86) 1.60 (0.68-3.86) 1.52 (1.03-2.33) 0.20
H3K36me3e (% of total H3) 1.67 (0.80-4.16) 1.73 (0.80-3.94) 1.66 (0.85-4.16) 0.87
H3K79me2f (% of total H3) 1.22 (0.66-3.46) 1.16 (0.29-2.78) 1.22 (0.66-3.46) 0.75
Folate <9 nmol/L 11 (18.3) 7 (22.6) 4 (13.8) 0.51g
Cobalamin <151 pmol/L 16 (26.7) 7 (22.6) 9 (31.0) 0.65
Ever Smoker 19 (31.7) 19 (61.3) 0 (0.0) <0.01g
Ever Betel 16 (26.7) 7 (22.6) 9 (31.0) 0.65
Education >5 y 10 (16.7) 3 (9.7) 7 (24.1) 0.17g
Abbreviations used: bAs, blood arsenic; BMI, body mass index; FACT, Folic Acid and Creatine Trial; H3K36me2, di-methylation at
lysine 36 of histone H3; H3K36me3, tri-methylation at lysine 36 of histone H3; H3K79me2, di-methylation at lysine 79 of histone H3;
PTHM, posttranslational histone modification; uAs, urinary arsenic; uAsCr, urinary arsenic adjusted for urinary creatinine; uCr,
urinary creatinine
aValues are median (range) or n (%) for continuous and categorical variables, respectively bWilcoxon rank-sum test or Chi-square test for difference between men and women in continuous and categorical variables,
respectively cn = 28 for women dn = 58 for whole sample, n = 29 for men en = 57 for whole sample, n = 29 for men, n = 28 for women fn = 60 for whole sample, n = 31 for men, n = 29 for women gFisher’s exact test
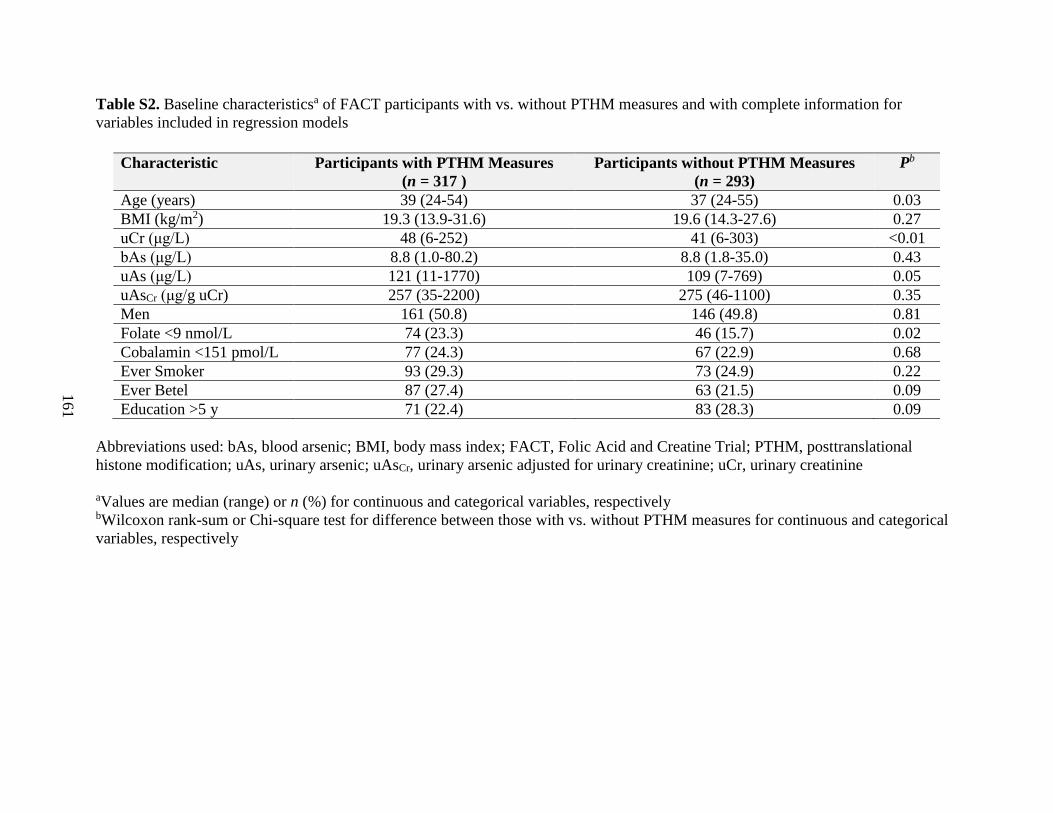
161
Table S2. Baseline characteristicsa of FACT participants with vs. without PTHM measures and with complete information for
variables included in regression models
Characteristic Participants with PTHM Measures
(n = 317 )
Participants without PTHM Measures
(n = 293)
Pb
Age (years) 39 (24-54) 37 (24-55) 0.03
BMI (kg/m2) 19.3 (13.9-31.6) 19.6 (14.3-27.6) 0.27
uCr (μg/L) 48 (6-252) 41 (6-303) <0.01
bAs (μg/L) 8.8 (1.0-80.2) 8.8 (1.8-35.0) 0.43
uAs (μg/L) 121 (11-1770) 109 (7-769) 0.05
uAsCr (μg/g uCr) 257 (35-2200) 275 (46-1100) 0.35
Men 161 (50.8) 146 (49.8) 0.81
Folate <9 nmol/L 74 (23.3) 46 (15.7) 0.02
Cobalamin <151 pmol/L 77 (24.3) 67 (22.9) 0.68
Ever Smoker 93 (29.3) 73 (24.9) 0.22
Ever Betel 87 (27.4) 63 (21.5) 0.09
Education >5 y 71 (22.4) 83 (28.3) 0.09
Abbreviations used: bAs, blood arsenic; BMI, body mass index; FACT, Folic Acid and Creatine Trial; PTHM, posttranslational
histone modification; uAs, urinary arsenic; uAsCr, urinary arsenic adjusted for urinary creatinine; uCr, urinary creatinine
aValues are median (range) or n (%) for continuous and categorical variables, respectively bWilcoxon rank-sum or Chi-square test for difference between those with vs. without PTHM measures for continuous and categorical
variables, respectively
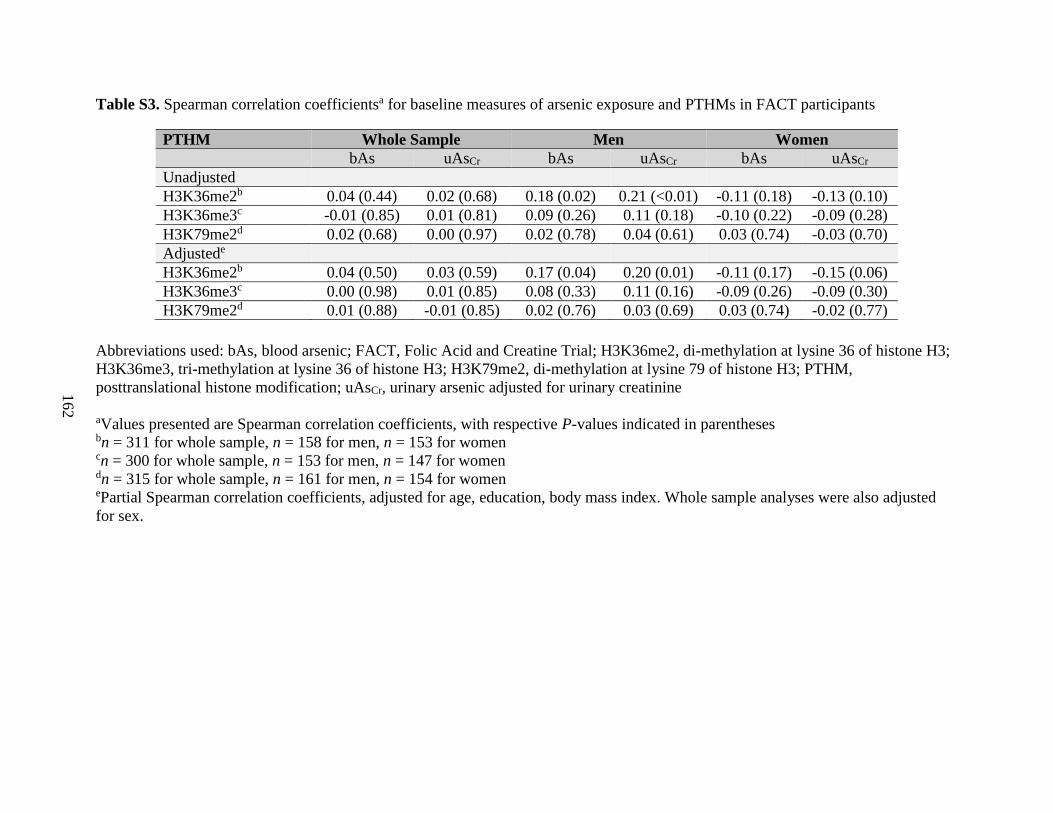
162
Table S3. Spearman correlation coefficientsa for baseline measures of arsenic exposure and PTHMs in FACT participants
PTHM Whole Sample Men Women
bAs uAsCr bAs uAsCr bAs uAsCr
Unadjusted
H3K36me2b 0.04 (0.44) 0.02 (0.68) 0.18 (0.02) 0.21 (<0.01) -0.11 (0.18) -0.13 (0.10)
H3K36me3c -0.01 (0.85) 0.01 (0.81) 0.09 (0.26) 0.11 (0.18) -0.10 (0.22) -0.09 (0.28)
H3K79me2d 0.02 (0.68) 0.00 (0.97) 0.02 (0.78) 0.04 (0.61) 0.03 (0.74) -0.03 (0.70)
Adjustede
H3K36me2b 0.04 (0.50) 0.03 (0.59) 0.17 (0.04) 0.20 (0.01) -0.11 (0.17) -0.15 (0.06)
H3K36me3c 0.00 (0.98) 0.01 (0.85) 0.08 (0.33) 0.11 (0.16) -0.09 (0.26) -0.09 (0.30)
H3K79me2d 0.01 (0.88) -0.01 (0.85) 0.02 (0.76) 0.03 (0.69) 0.03 (0.74) -0.02 (0.77)
Abbreviations used: bAs, blood arsenic; FACT, Folic Acid and Creatine Trial; H3K36me2, di-methylation at lysine 36 of histone H3;
H3K36me3, tri-methylation at lysine 36 of histone H3; H3K79me2, di-methylation at lysine 79 of histone H3; PTHM,
posttranslational histone modification; uAsCr, urinary arsenic adjusted for urinary creatinine
aValues presented are Spearman correlation coefficients, with respective P-values indicated in parentheses bn = 311 for whole sample, n = 158 for men, n = 153 for women cn = 300 for whole sample, n = 153 for men, n = 147 for women dn = 315 for whole sample, n = 161 for men, n = 154 for women ePartial Spearman correlation coefficients, adjusted for age, education, body mass index. Whole sample analyses were also adjusted
for sex.
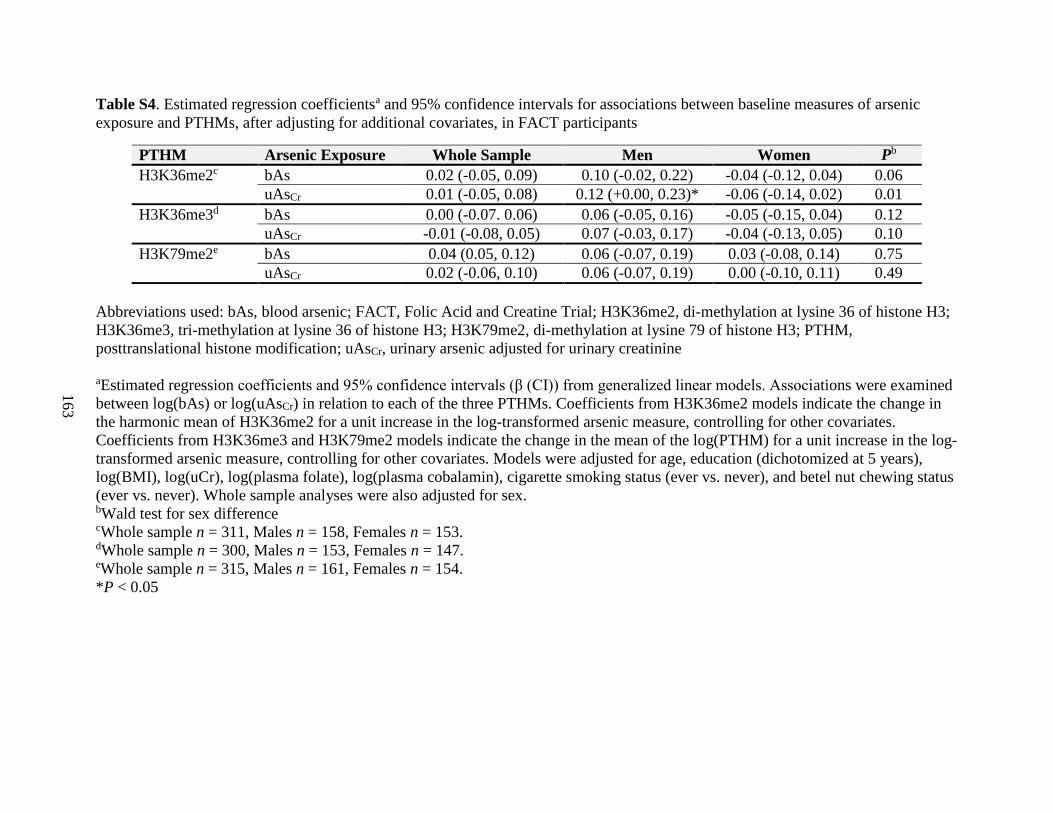
163
Table S4. Estimated regression coefficientsa and 95% confidence intervals for associations between baseline measures of arsenic
exposure and PTHMs, after adjusting for additional covariates, in FACT participants
PTHM Arsenic Exposure Whole Sample Men Women Pb
H3K36me2c bAs 0.02 (-0.05, 0.09) 0.10 (-0.02, 0.22) -0.04 (-0.12, 0.04) 0.06
uAsCr 0.01 (-0.05, 0.08) 0.12 (+0.00, 0.23)* -0.06 (-0.14, 0.02) 0.01
H3K36me3d bAs 0.00 (-0.07. 0.06) 0.06 (-0.05, 0.16) -0.05 (-0.15, 0.04) 0.12
uAsCr -0.01 (-0.08, 0.05) 0.07 (-0.03, 0.17) -0.04 (-0.13, 0.05) 0.10
H3K79me2e bAs 0.04 (0.05, 0.12) 0.06 (-0.07, 0.19) 0.03 (-0.08, 0.14) 0.75
uAsCr 0.02 (-0.06, 0.10) 0.06 (-0.07, 0.19) 0.00 (-0.10, 0.11) 0.49
Abbreviations used: bAs, blood arsenic; FACT, Folic Acid and Creatine Trial; H3K36me2, di-methylation at lysine 36 of histone H3;
H3K36me3, tri-methylation at lysine 36 of histone H3; H3K79me2, di-methylation at lysine 79 of histone H3; PTHM,
posttranslational histone modification; uAsCr, urinary arsenic adjusted for urinary creatinine
aEstimated regression coefficients and 95% confidence intervals (β (CI)) from generalized linear models. Associations were examined
between log(bAs) or log(uAsCr) in relation to each of the three PTHMs. Coefficients from H3K36me2 models indicate the change in
the harmonic mean of H3K36me2 for a unit increase in the log-transformed arsenic measure, controlling for other covariates.
Coefficients from H3K36me3 and H3K79me2 models indicate the change in the mean of the log(PTHM) for a unit increase in the log-
transformed arsenic measure, controlling for other covariates. Models were adjusted for age, education (dichotomized at 5 years),
log(BMI), log(uCr), log(plasma folate), log(plasma cobalamin), cigarette smoking status (ever vs. never), and betel nut chewing status
(ever vs. never). Whole sample analyses were also adjusted for sex. bWald test for sex difference cWhole sample n = 311, Males n = 158, Females n = 153. dWhole sample n = 300, Males n = 153, Females n = 147. eWhole sample n = 315, Males n = 161, Females n = 154.
*P < 0.05

164
A
B
C
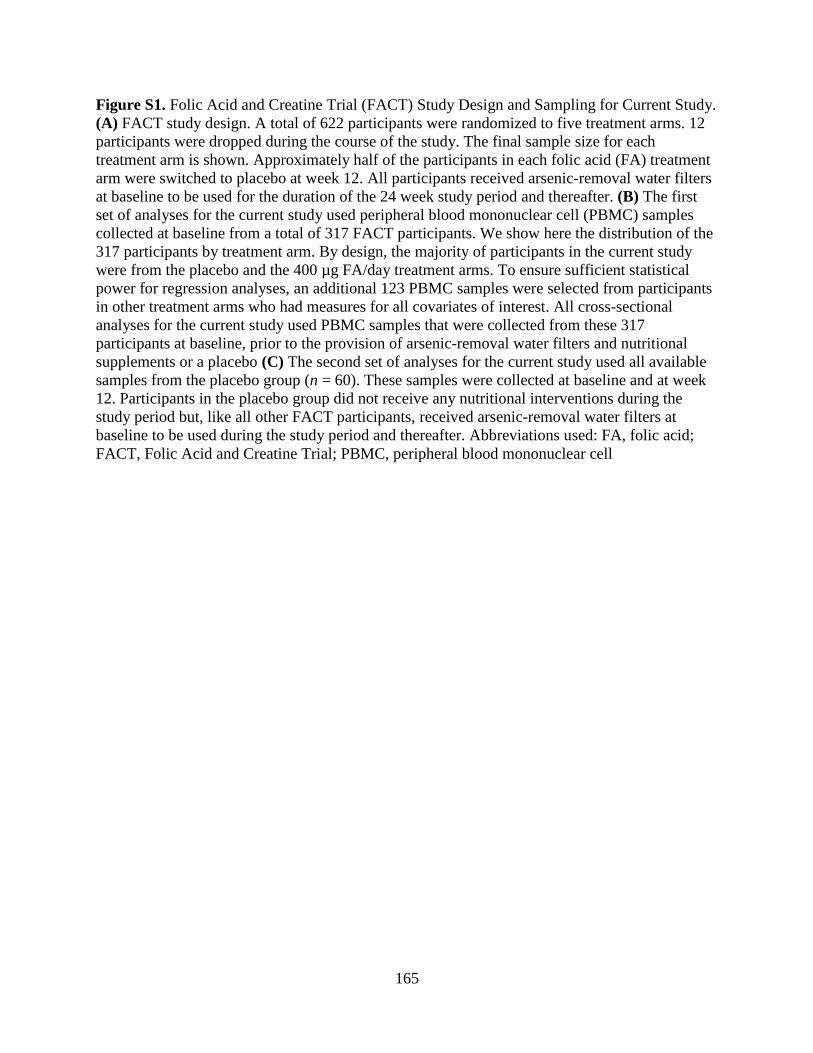
165
Figure S1. Folic Acid and Creatine Trial (FACT) Study Design and Sampling for Current Study.
(A) FACT study design. A total of 622 participants were randomized to five treatment arms. 12
participants were dropped during the course of the study. The final sample size for each
treatment arm is shown. Approximately half of the participants in each folic acid (FA) treatment
arm were switched to placebo at week 12. All participants received arsenic-removal water filters
at baseline to be used for the duration of the 24 week study period and thereafter. (B) The first
set of analyses for the current study used peripheral blood mononuclear cell (PBMC) samples
collected at baseline from a total of 317 FACT participants. We show here the distribution of the
317 participants by treatment arm. By design, the majority of participants in the current study
were from the placebo and the 400 µg FA/day treatment arms. To ensure sufficient statistical
power for regression analyses, an additional 123 PBMC samples were selected from participants
in other treatment arms who had measures for all covariates of interest. All cross-sectional
analyses for the current study used PBMC samples that were collected from these 317
participants at baseline, prior to the provision of arsenic-removal water filters and nutritional
supplements or a placebo (C) The second set of analyses for the current study used all available
samples from the placebo group (n = 60). These samples were collected at baseline and at week
12. Participants in the placebo group did not receive any nutritional interventions during the
study period but, like all other FACT participants, received arsenic-removal water filters at
baseline to be used during the study period and thereafter. Abbreviations used: FA, folic acid;
FACT, Folic Acid and Creatine Trial; PBMC, peripheral blood mononuclear cell
166
CHAPTER SIX
Sex-specific associations between arsenic exposure and DNA methylation and mRNA
expression of candidate genes in Bangladeshi adults with arsenicosis
Caitlin G. Howe1*, Maria Argos
2*, Farzana Jasmine
2, Faruque Parvez
1, Mahfuzar Rahman
3,
Muhammad Rakibuz-Zaman3, Vesna Slavkovich
1, John A. Baron
4, Joseph H. Graziano
1,
Muhammad G. Kibriya2, Mary V. Gamble
1, Habibul Ahsan
2, 5, 6
*These authors contributed equally to this manuscript
Affiliations: 1Department of Environmental Health Sciences, Mailman School of Public Health,
Columbia University, New York, New York, USA; 2Department of Public Health Sciences, The
University of Chicago, Chicago, Illinois, USA; 3U-Chicago Research Bangladesh, Dhaka,
Bangladesh; 4Department of Medicine, University of North Carolina School of Medicine, Chapel
Hill, North Carolina, USA; 5Department of Medicine, and
6Department of Human Genetics and
Comprehensive Cancer Center, The University of Chicago, Chicago, Illinois, USA
167
ABSTRACT
Arsenic is a human carcinogen which has also been associated with numerous non-cancer
health outcomes. Based on our prior research, we were interested in genes involved in pathways
implicated in arsenic toxicity, including arsenic metabolism, one-carbon metabolism, epigenetic
regulation, DNA repair, and tumor suppression; thus we selected 47 relevant candidate genes.
For many arsenic-related health outcomes, susceptibility differs by sex. There is also increasing
evidence that arsenic induces epigenetic dysregulation in a sex-dependent manner. Whether or
not arsenic also alters gene expression in a sex-dependent manner has not been confirmed in a
large epidemiological study. We therefore examined sex-specific associations between baseline
measures of creatinine-adjusted urinary arsenic (uAsCr) and gene-specific DNA methylation
(whole blood, n = 400) and mRNA expression (peripheral blood mononuclear cells, n = 1799)
for the 47 selected candidate genes among participants in the Bangladesh Vitamin E and
Selenium Trial. DNA methylation and mRNA expression levels were measured using Illumina’s
HumanMethylation450 BeadChip and HumanHT-12-v4 BeadChip kits, respectively. In linear
regression analyses, which were adjusted for multiple comparisons using the Bonferroni
correction, we observed that uAsCr was associated with methylation at five CpG sites within four
of the candidate genes. Three of these CpG sites were differentially methylated by arsenic
exposure among women only. In similar analyses, we observed that uAsCr was significantly
associated with the expression of 18 candidate genes. Of these genes, six were differentially
expressed by arsenic exposure among men only and five among women only. Our findings
contribute to growing evidence that arsenic alters epigenetic modifications, such as DNA
methylation, in a sex-dependent manner, and suggest that this may have functional
consequences, such as alterations in gene expression.
168
INTRODUCTION
Exposure to arsenic-contaminated drinking water is a global problem. In Bangladesh
alone, more than 57 million individuals are exposed to arsenic concentrations exceeding the
World Health Organization guideline of 10 µg/L [1]. Exposure to inorganic arsenic has been
associated with both cancer and non-cancer outcomes, with susceptibility often differing by sex
[2]. For example, men are more prone to developing arsenic-induced skin lesions and skin, liver,
and bladder cancers, while women and girls may be more susceptible to arsenic-induced
cardiovascular disease and developmental outcomes, respectively ([3-9] and reviewed in [2]).
Although gender-based differences in co-exposures may explain some of the differences in
susceptibility, animal studies have similarly demonstrated sex-dependent effects of arsenic [10,
11], suggesting contributions from biological sex. While the mechanisms underlying these sex
differences are likely multifactorial, there is evidence that arsenic induces epigenetic
dysregulation, including alterations in DNA methylation and posttranslational histone
modifications (PTHMs), and these effects may differ by sex [12-18]. Exposure to arsenic has
also been shown to alter gene expression [19-22]. However, while one small human study (n =
29) has observed dramatic sex differences in the effects of arsenic on gene expression [23], this
has not been confirmed in a larger epidemiological study.
The effects of arsenic on genome-wide DNA methylation and gene expression were
previously investigated in participants from the Bangladesh Vitamin E and Selenium Trial
(BEST) [24]. The original report evaluated all 485,577 CpG sites, representing >99% of RefSeq
genes, on Illumina’s HumanMethylation450 platform, and differences between men and women
were not examined. For the current study, we used a candidate gene approach and evaluated the
relationships between arsenic exposure, gene-specific DNA methylation, and mRNA expression
169
in BEST study participants separately by sex. For our candidate genes, we selected a total of 47
genes which are involved in arsenic metabolism, one-carbon metabolism (OCM), epigenetic
regulation, DNA repair, and tumor suppression, since these pathways have been implicated in
arsenic metabolism and toxicity [25-30]. Our approach for identifying candidate genes was two-
pronged: 1) we used the Comparative Toxicogenomics Database (CTD) [31] to identify genes
involved in our pathways of interest that have previously been shown to be affected by arsenic
exposure (32 genes) and 2) we selected additional genes in these same pathways that were not
necessarily identified by the CTD as known targets of arsenic (15 genes).
STUDY PARTICIPANTS AND METHODS
Study Population
For the current study, we used baseline-collected (i.e., pre-intervention) samples from
1799 participants in the BEST study [32]. These participants were the first 1799 individuals
enrolled into the study. Of these 1799 participants, 400 were randomly selected for DNA
methylation measures for an epigenome-wide study, which has been published [24]. The BEST
study is a 2x2 factorial randomized chemoprevention trial, which was designed to examine
whether vitamin E and/or selenium supplementation prevent non-melanoma skin cancer risk in
Bangladeshi adults with arsenicosis. Participants were eligible for the BEST study if they were
between the ages of 25 and 65, had a permanent residence within the study area in central
Bangladesh, exhibited manifest arsenical skin lesions, and had no prior history of cancer.
Individuals who met these eligibility criteria (n = 7000) were enrolled between April 2006 and
August 2009.
170
Urinary Arsenic
Total urinary arsenic was measured in baseline-collected urine samples by graphite
furnace atomic absorption spectrometry (AAnalyst 600 spectrometer; PerkinElmer, Norwalk,
CT, USA) in the Trace Metals Core Lab at Columbia University [33]. The intra- and inter-assay
CVs were 6.2% and 4.4%, respectively. Total urinary arsenic concentrations were adjusted for
urinary creatinine, which was measured by a method based on the Jaffe method [34]. The intra-
and inter-assay CVs for creatinine were 3.5% and 2.2%, respectively.
Selection of Candidate Genes
The 47 candidate genes selected for the current study are listed in Table 1. The CTD was
used to identify genes in our pathways of interest that had previously been examined in relation
to arsenic exposure. To identify all genes affected by arsenic exposure at the gene, mRNA, and
protein level, we entered “arsenic” as our chemical of interest in the CTD Chemical-Gene
Interaction Query. Of the genes identified as targets of arsenic, we then searched for those
involved in the one-carbon metabolism pathway, arsenic metabolism, epigenetic regulation (with
a particular focus on DNA methyltransferases and histone modifying enzymes), DNA repair, and
tumor suppression/oncogenesis. The CTD is updated every month; we used the August 2015
release.
DNA Methylation
DNeasy Blood kits (Qiagen, Valencia, CA, USA) were used to isolate DNA from whole
blood. DNA was bisulfite-converted using the EZ DNA Methylation Kit (Zymo Research,
Irvine, CA, USA), and 500 ng was used for measuring DNA methylation by Illumina’s
HumanMethylation450 BeadChip kit (Illumina, San Diego, CA, USA). Quantile normalization
171
was applied to the methylation score (β), which is a continuous measure from 0 to 1 for each
CpG site, with 0 representing no methylation and 1 representing complete methylation. Of the
413 samples for which DNA methylation was measured, 13 were excluded for reasons that have
been described previously [24]. β values with a P for detection > 0.05 were excluded. A logit-
transformation was applied to quantile-normalized β values, and ComBat software was used to
adjust for potential batch effects [35].
Gene Expression
As described previously [24], RNA was isolated from peripheral blood mononuclear
cells, which had been stored at -80ºC in Buffer RLT, using the RNeasy Micro Kit from QIAGEN
(Valencia, CA, USA). Illumina’s TotalPrep 96 RNA Amplification kit was used to synthesize
cRNA from 250 ng RNA, and 750 ng of cRNA was used to measure gene expression via
Illumina’s HumanHT-12-v4 BeadChip kit, which evaluates >30,000 genes. Gene expression data
were available for 1799 participants, including the 400 participants for which there was also
complete DNA methylation data. A log2-transformation was applied to quantile normalized
mRNA expression values, and ComBat software was used to adjust for potential batch effects
[35].
Statistical Methods
Separate linear regression models were used to examine associations between creatinine-
adjusted urinary arsenic (uAsCr), measured continuously, and the logit-transformed β for each
CpG site or the log2-transformed expression value for each gene. A total of 1959 CpG sites and
78 mRNA transcripts, representing the 47 candidate genes, were evaluated. Models were run in
all participants, and were adjusted for age and sex. Analyses were also run separately by sex and

172
adjusted for age. Since arsenic was not associated with white blood cell type fractions [24],
which were estimated using the method by Houseman et al. [36], we did not adjust for cell type
distribution in our models. A Bonferroni correction was used to adjust for multiple comparisons,
which was based on the number of probes representing each gene.
RESULTS
General characteristics of the study participants have been reported previously [24].
Participants were between 25 and 65 years old. 53% of the participants were male. The mean (±
SD) uAsCr concentration was 302 ± 365 µg/g creatinine for the 1799 participants with gene
expression measures and 302 ± 365 µg/g creatinine for the subset that also had DNA methylation
measures.
DNA Methylation
Before correcting for multiple comparisons, a total of 178 CpG sites (out of 1959 CpG
sites), representing 40 of the 47 candidate genes, were differentially methylated by arsenic
exposure (P < 0.05), either in the whole sample or in men or women alone (Supplemental
Material, Table S1). When restricting to sex-stratified analyses, a total of 146 CpG sites were
differentially methylated by arsenic exposure; 51 sites were differentially methylated in men
only, 94 in women only, and 1 site (cg03315649), located in a CpG island within the gene body
of KDM4B, was differentially methylated in both men (t-statistic: -2.14, P = 0.033) and women
(t-statistic: -3.01, P = 0.003).
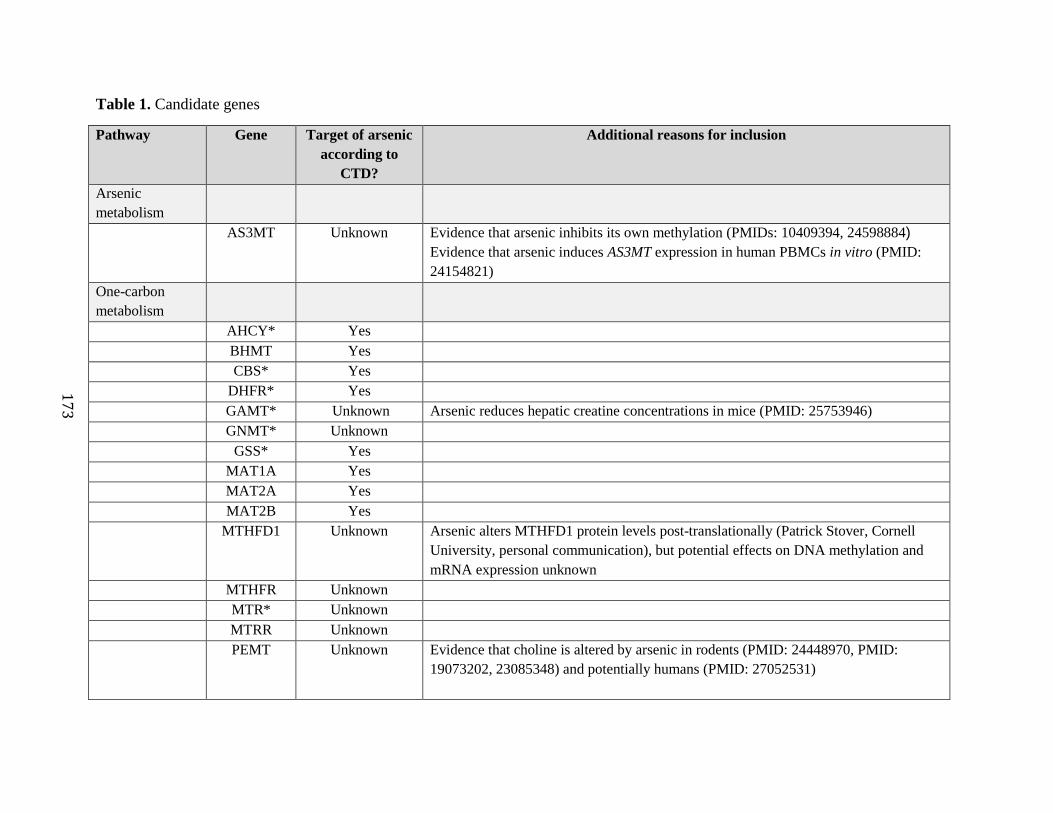
17
3
Table 1. Candidate genes
Pathway Gene Target of arsenic
according to
CTD?
Additional reasons for inclusion
Arsenic
metabolism
AS3MT Unknown Evidence that arsenic inhibits its own methylation (PMIDs: 10409394, 24598884)
Evidence that arsenic induces AS3MT expression in human PBMCs in vitro (PMID:
24154821)
One-carbon
metabolism
AHCY* Yes
BHMT Yes
CBS* Yes
DHFR* Yes
GAMT* Unknown Arsenic reduces hepatic creatine concentrations in mice (PMID: 25753946)
GNMT* Unknown
GSS* Yes
MAT1A Yes
MAT2A Yes
MAT2B Yes
MTHFD1 Unknown Arsenic alters MTHFD1 protein levels post-translationally (Patrick Stover, Cornell
University, personal communication), but potential effects on DNA methylation and
mRNA expression unknown
MTHFR Unknown
MTR* Unknown
MTRR Unknown
PEMT Unknown Evidence that choline is altered by arsenic in rodents (PMID: 24448970, PMID:
19073202, 23085348) and potentially humans (PMID: 27052531)

17
4
Epigenetic
regulation
DNMT1 Yes
DNMT3A Yes
DNMT3B Yes
DOT1L Unknown Related to 5-hmC, which is altered by arsenic in multiple tissues in rats (PMID:
25256144) and is associated with 5-hmC in human WBCs (PMID: 26364164)
EHMT1 Yes
EHMT2 Yes
EZH2* Yes
HDAC4* Yes
HDAC5 Yes
KDM2B Yes Arsenic is positively associated with DNA methylation in the promoter region among
men only (unpublished data). Arsenic is positively associated with its target,
H3K36me2, in human PBMCs among men only (PMID: 26967670)
KDM4B Yes
KDM5B Unknown Altered by arsenic in mouse brain (PMID: 26193056)
MLL* Unknown Altered by arsenic in mouse brain (PMID: 26193056). Arsenic exposure is also
associated with methylation of its target, H3K4, in human PBMCs (PMID: 23064002)
and WBCs (PMID: 21385672)
NSD1 Unknown Arsenic alters methylation of its target, H3K36, in cultured A549 cells (PMID:
18321869) and is associated with H3K36me2 in human PBMCs among men only
(PMID: 26967670)
PRDM2* Yes
TET1 Unknown Arsenic alters its product (5-hmC) in multiple rat tissues (PMID: 25256144) and is
associated with 5-hmC in human WBCs in a sex-dependent manner (PMID: 26364164)
TET2* Yes Arsenic alters its product (5-hmC) in multiple rat tissues (PMID: 25256144) and is
associated with 5-hmC in human WBCs in a sex-dependent manner (PMID: 26364164)
TET3 Unknown Arsenic alters its product (5-hmC) in multiple rat tissues (PMID: 25256144) and is
associated with 5-hmC in human WBCs in a sex-dependent manner (PMID: 26364164)

17
5
DNA repair
MSH2* Yes
OGG Yes
PARP1 Yes
PCNA Yes
POLB* Yes
XRCC1 Yes
XRCC2 Unknown
XRCC3* Yes
XRCC4 Yes
XRCC5* Yes
XRCC6* Unknown
Tumor
suppression
EGFR Yes
P53* Yes
Abbreviations used: 5-hmC, 5-hydroxymethylcytosine; CTD, Comparative Toxicogenomics Database; H3K4, lysine 4 of histone H3; H3K36,
lysine 36 of histone H3; H3K36me2, di-methylation at lysine 36 of histone H3; PBMC, peripheral blood mononuclear cell; WBC, white blood cell
*In the current study, mRNA expression was found to be significantly associated with arsenic exposure in either men, women, or the whole
sample, after adjusting for multiple comparisons
176
After adjusting for multiple comparisons using a Bonferroni correction (based on the
number of probes per gene), arsenic exposure was associated with differential methylation of 5
CpG sites located in 4 genes, either in the whole sample, or in men or women alone (Table 2,
Figure 1). Differences by sex were observed for 3 of the 4 differentially methylated genes.
Among women, but not men, arsenic exposure was inversely associated with methylation at a
CpG site (cg02978542) within the transcription start site (TSS) of MTHFR. In contrast, among
women, but not men, arsenic exposure was positively associated with methylation at a CpG site
(cg05998850) located within the gene body of XRCC5. Among both men and women, arsenic
exposure was negatively associated with methylation at a CpG site (cg03315649) located within
the gene body of KDM4B. Arsenic exposure was also inversely associated with methylation
levels at two CpG sites within PCNA. However, one site (cg09011324), located in the TSS of
PCNA, was only differentially methylated among women, whereas the other site (cg22960971),
located within the gene body, was differentially methylated among both men and women (Table
1). Arsenic exposure was also positively associated with the methylation of two CpG sites within
the gene body of AS3MT, although this was not statistically significant after adjusting for
multiple comparisons (Supplemental Material, Table S1).
mRNA Expression
Before correcting for multiple comparisons, 22 of the 47 genes examined were found to
be differentially expressed by arsenic exposure (P < 0.05), either in the whole sample or in men
or women alone (Supplemental Material, Table S2). When restricting to sex-stratified
analyses, 14 genes were significantly associated with arsenic exposure among men and 11 genes
were significantly associated with arsenic exposure among women. Of these genes, only 6 were
177
significantly associated with arsenic exposure in both men and women: GSS, EZH2, MLL,
POLB, PRDM2, and XRCC6.
After adjusting for multiple comparisons, arsenic exposure was associated with
differential expression of 18 genes (Table 3, Figure 1). Of these genes, 6 were differentially
expressed among men only, and 5 among women only. There was also a suggestive inverse
association between arsenic exposure and AS3MT expression among men (P = 0.051) (data not
shown).
Genes that were both differentially methylated and expressed by arsenic exposure
After correcting for multiple comparisons, XRCC5 was the only gene for which both
DNA methylation and gene expression were significantly associated with arsenic exposure.
Among women, arsenic exposure was positively associated with methylation at a CpG site
(cg05998850) within the gene body of XRCC5 (P = 0.002) and was also negatively associated
with XRCC5 mRNA levels (P = 0.003) (Tables 1 and 2, Figure 1).
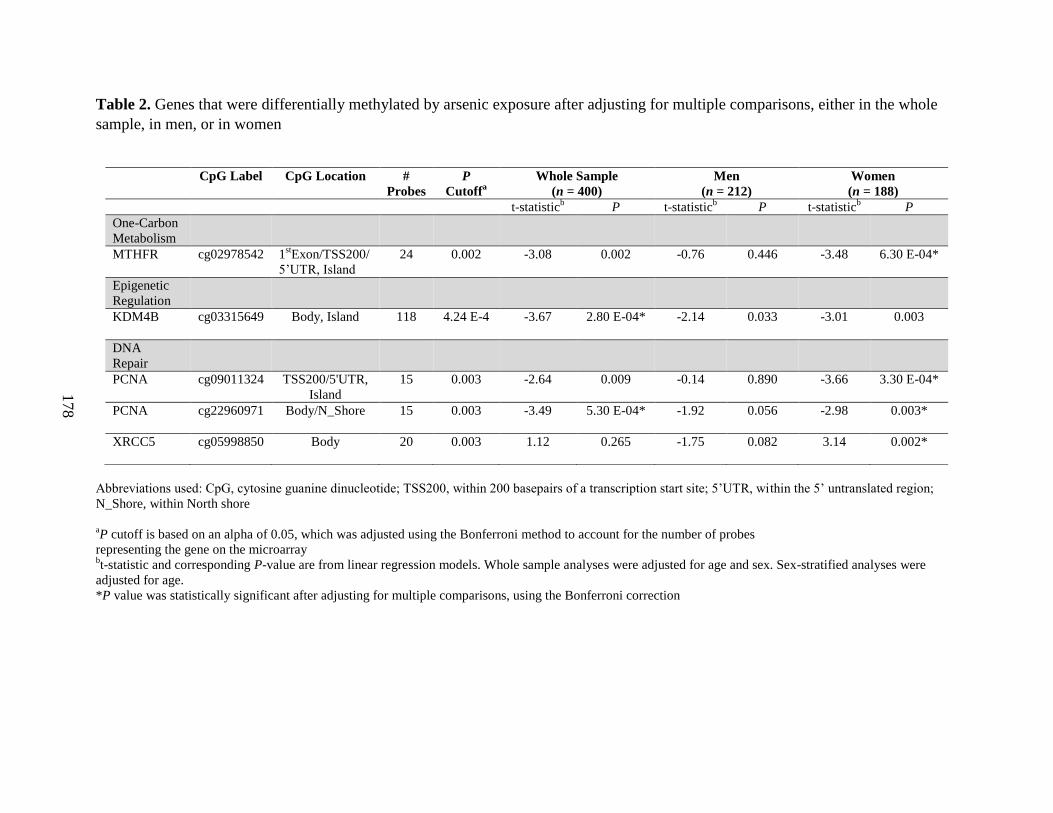
178
Table 2. Genes that were differentially methylated by arsenic exposure after adjusting for multiple comparisons, either in the whole
sample, in men, or in women
Abbreviations used: CpG, cytosine guanine dinucleotide; TSS200, within 200 basepairs of a transcription start site; 5’UTR, within the 5’ untranslated region;
N_Shore, within North shore
aP cutoff is based on an alpha of 0.05, which was adjusted using the Bonferroni method to account for the number of probes
representing the gene on the microarray bt-statistic and corresponding P-value are from linear regression models. Whole sample analyses were adjusted for age and sex. Sex-stratified analyses were
adjusted for age.
*P value was statistically significant after adjusting for multiple comparisons, using the Bonferroni correction
CpG Label CpG Location #
Probes
P
Cutoffa
Whole Sample
(n = 400)
Men
(n = 212)
Women
(n = 188)
t-statisticb P t-statistic
b P t-statistic
b P
One-Carbon
Metabolism
MTHFR cg02978542 1stExon/TSS200/
5’UTR, Island
24 0.002 -3.08 0.002 -0.76 0.446 -3.48 6.30 E-04*
Epigenetic
Regulation
KDM4B cg03315649 Body, Island
118 4.24 E-4 -3.67 2.80 E-04* -2.14 0.033 -3.01 0.003
DNA
Repair
PCNA cg09011324 TSS200/5'UTR,
Island
15 0.003 -2.64 0.009 -0.14 0.890 -3.66 3.30 E-04*
PCNA cg22960971 Body/N_Shore
15 0.003 -3.49 5.30 E-04* -1.92 0.056 -2.98 0.003*
XRCC5 cg05998850 Body
20 0.003 1.12 0.265 -1.75 0.082 3.14 0.002*
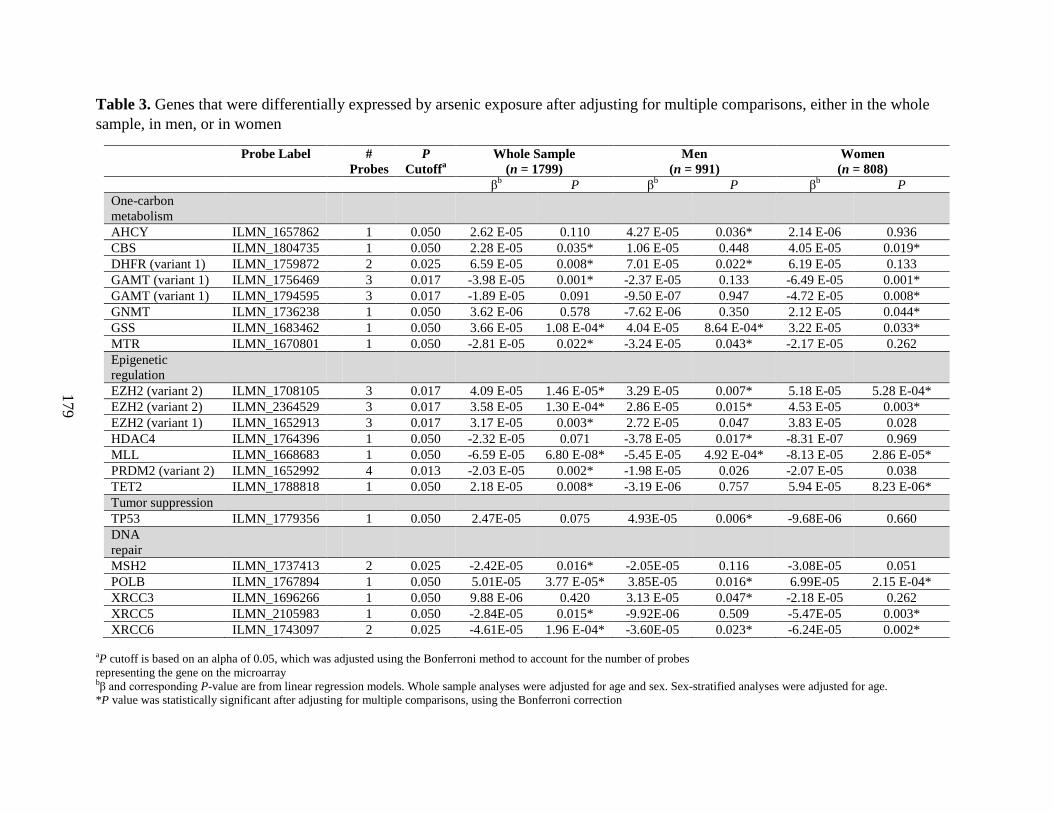
179
Table 3. Genes that were differentially expressed by arsenic exposure after adjusting for multiple comparisons, either in the whole
sample, in men, or in women
Probe Label #
Probes
P
Cutoffa
Whole Sample
(n = 1799)
Men
(n = 991)
Women
(n = 808)
βb P β
b P β
b P
One-carbon
metabolism
AHCY ILMN_1657862 1 0.050 2.62 E-05 0.110 4.27 E-05 0.036* 2.14 E-06 0.936
CBS ILMN_1804735 1 0.050 2.28 E-05 0.035* 1.06 E-05 0.448 4.05 E-05 0.019*
DHFR (variant 1) ILMN_1759872 2 0.025 6.59 E-05 0.008* 7.01 E-05 0.022* 6.19 E-05 0.133
GAMT (variant 1) ILMN_1756469 3 0.017 -3.98 E-05 0.001* -2.37 E-05 0.133 -6.49 E-05 0.001*
GAMT (variant 1) ILMN_1794595 3 0.017 -1.89 E-05 0.091 -9.50 E-07 0.947 -4.72 E-05 0.008*
GNMT ILMN_1736238 1 0.050 3.62 E-06 0.578 -7.62 E-06 0.350 2.12 E-05 0.044*
GSS ILMN_1683462 1 0.050 3.66 E-05 1.08 E-04* 4.04 E-05 8.64 E-04* 3.22 E-05 0.033*
MTR ILMN_1670801 1 0.050 -2.81 E-05 0.022* -3.24 E-05 0.043* -2.17 E-05 0.262
Epigenetic
regulation
EZH2 (variant 2) ILMN_1708105 3 0.017 4.09 E-05 1.46 E-05* 3.29 E-05 0.007* 5.18 E-05 5.28 E-04*
EZH2 (variant 2) ILMN_2364529 3 0.017 3.58 E-05 1.30 E-04* 2.86 E-05 0.015* 4.53 E-05 0.003*
EZH2 (variant 1) ILMN_1652913 3 0.017 3.17 E-05 0.003* 2.72 E-05 0.047 3.83 E-05 0.028
HDAC4 ILMN_1764396 1 0.050 -2.32 E-05 0.071 -3.78 E-05 0.017* -8.31 E-07 0.969
MLL ILMN_1668683 1 0.050 -6.59 E-05 6.80 E-08* -5.45 E-05 4.92 E-04* -8.13 E-05 2.86 E-05*
PRDM2 (variant 2) ILMN_1652992 4 0.013 -2.03 E-05 0.002* -1.98 E-05 0.026 -2.07 E-05 0.038
TET2 ILMN_1788818 1 0.050 2.18 E-05 0.008* -3.19 E-06 0.757 5.94 E-05 8.23 E-06*
Tumor suppression
TP53 ILMN_1779356 1 0.050 2.47E-05 0.075 4.93E-05 0.006* -9.68E-06 0.660
DNA
repair
MSH2 ILMN_1737413 2 0.025 -2.42E-05 0.016* -2.05E-05 0.116 -3.08E-05 0.051
POLB ILMN_1767894 1 0.050 5.01E-05 3.77 E-05* 3.85E-05 0.016* 6.99E-05 2.15 E-04*
XRCC3 ILMN_1696266 1 0.050 9.88 E-06 0.420 3.13 E-05 0.047* -2.18 E-05 0.262
XRCC5 ILMN_2105983 1 0.050 -2.84E-05 0.015* -9.92E-06 0.509 -5.47E-05 0.003*
XRCC6 ILMN_1743097 2 0.025 -4.61E-05 1.96 E-04* -3.60E-05 0.023* -6.24E-05 0.002*
aP cutoff is based on an alpha of 0.05, which was adjusted using the Bonferroni method to account for the number of probes
representing the gene on the microarray bβ and corresponding P-value are from linear regression models. Whole sample analyses were adjusted for age and sex. Sex-stratified analyses were adjusted for age.
*P value was statistically significant after adjusting for multiple comparisons, using the Bonferroni correction

180
A
B
Figure 1. Venn diagrams representing genes that were differentially methylated (A) or expressed
(B) by arsenic exposure in males (blue) compared with females (pink). The intersections show
genes that were differentially methylated or expressed in both males and females. Arrows
indicate whether associations with urinary arsenic exposure were positive (↑) or negative (↓).
Sample sizes for DNA methylation: 212 for men, 188 for women. Sample sizes for mRNA
expression: 991 for men, 808 for women
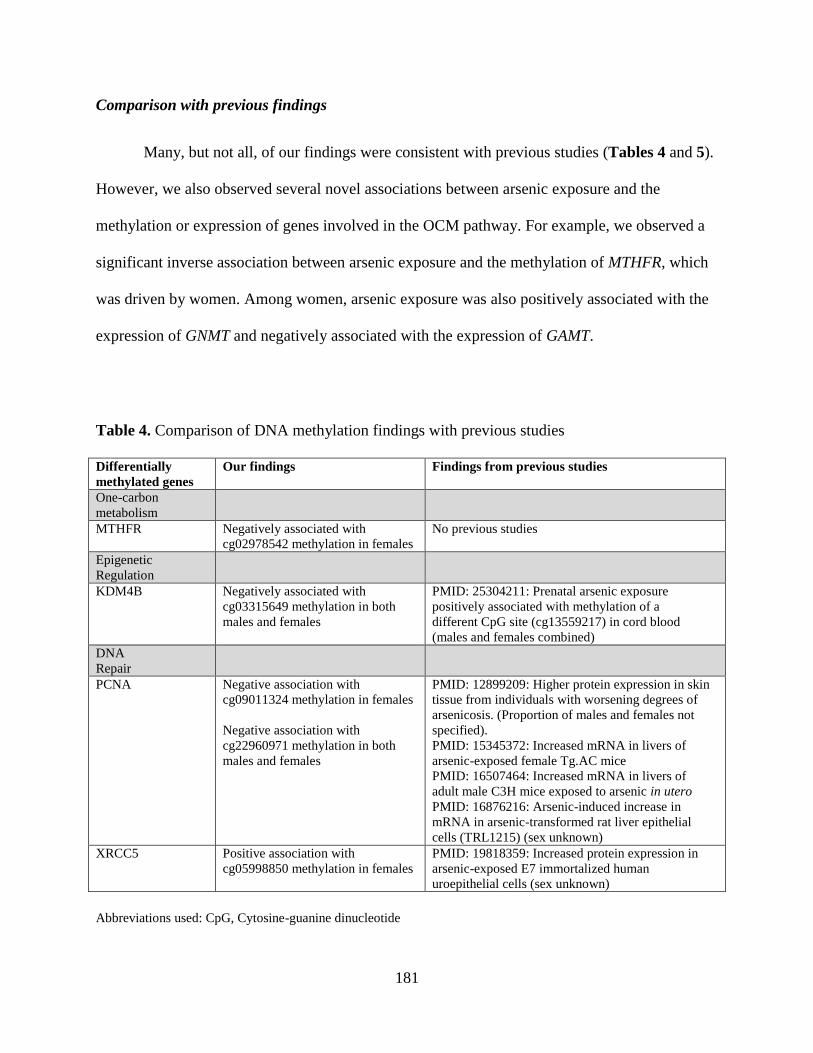
181
Comparison with previous findings
Many, but not all, of our findings were consistent with previous studies (Tables 4 and 5).
However, we also observed several novel associations between arsenic exposure and the
methylation or expression of genes involved in the OCM pathway. For example, we observed a
significant inverse association between arsenic exposure and the methylation of MTHFR, which
was driven by women. Among women, arsenic exposure was also positively associated with the
expression of GNMT and negatively associated with the expression of GAMT.
Table 4. Comparison of DNA methylation findings with previous studies
Differentially
methylated genes
Our findings Findings from previous studies
One-carbon
metabolism
MTHFR Negatively associated with
cg02978542 methylation in females
No previous studies
Epigenetic
Regulation
KDM4B Negatively associated with
cg03315649 methylation in both
males and females
PMID: 25304211: Prenatal arsenic exposure
positively associated with methylation of a
different CpG site (cg13559217) in cord blood
(males and females combined)
DNA
Repair
PCNA Negative association with
cg09011324 methylation in females
Negative association with
cg22960971 methylation in both
males and females
PMID: 12899209: Higher protein expression in skin
tissue from individuals with worsening degrees of
arsenicosis. (Proportion of males and females not
specified). PMID: 15345372: Increased mRNA in livers of
arsenic-exposed female Tg.AC mice
PMID: 16507464: Increased mRNA in livers of
adult male C3H mice exposed to arsenic in utero
PMID: 16876216: Arsenic-induced increase in
mRNA in arsenic-transformed rat liver epithelial
cells (TRL1215) (sex unknown)
XRCC5 Positive association with
cg05998850 methylation in females
PMID: 19818359: Increased protein expression in
arsenic-exposed E7 immortalized human
uroepithelial cells (sex unknown)
Abbreviations used: CpG, Cytosine-guanine dinucleotide

182
Table 5. Comparison of mRNA expression findings with previous studies
Differentially
expressed genes
Our findings Findings from previous studies
One-Carbon
Metabolism
AHCY Positive association in males PMID: 18487201: Increased mRNA and protein
expression in arsenic-exposed human prostate epithelial
cell line
CBS Positive association, only
significant in females
PMID: 25304211: Prenatal arsenic (maternal arsenic)
exposure positively associated with cg11815682 methylation
in newborn cord blood (males and females combined)
PMID: 18487201: Increased mRNA expression in arsenic-
exposed human prostate epithelial cell line
DHFR Positive association, only
significant in males
PMID: 25304211: Prenatal arsenic (maternal arsenic)
exposure negatively associated with cg08244028 methylation
in newborn cord blood (males and females combined)
GAMT Negative association in
females
No previous studies
GNMT Positive association in females No previous studies
GSS Positive association in both
males and females
PMID: 18487201: Protein expression increased in arsenic-
exposed prostate epithelial cell line
PMID: 12634122: mRNA expression decreased in
arsenic-exposed human keratinocytes (male-derived)
MTR Negative association, only
significant in males
PMID: 25697676: Increased mRNA in serum from arsenic-
exposed male rats
Epigenetic
Regulation
EZH2 Positive association in both
males and females (Variant 2,
ILMN_1708105).
Positive association in both
males and females (Variant 2, ILMN_2364529)
Positive association in both
males and females (Variant 1,
ILMN_1652913)
PMID: 22426358: Increased protein expression in arsenic-
exposed C2C12 cells (immortalized mouse myoblast cells,
female-derived)
PMID: 22843710: Increased protein expression in BALB/c
3T3 cells (mouse embryonic fibroblast cells, female-derived)
HDAC4 Negative association, only
significant in males
PMID: 25304211: Prenatal arsenic exposure positively
associated with methylation at five CpG sites (cg16202803,
cg06107260, cg16360836, cg26673264, cg11707035) and
negatively associated with mRNA expression in newborn
cord blood (males and females combined)
MLL Negative association in both
males and females
PMID: 26193056: Increased protein expression in male
mouse dentate gyrus, decreased in female mouse dentate
gyrus
PRDM2 Negative association in both
males and females (Variant 2,
ILMN_1652992)
PMID: 21291286: Higher methylation in promoter region in
peripheral blood from individuals with arsenic-induced skin
lesions (males and females combined) PMID: 26039340: Hypomethylation at promoter region in
exfoliated bladder cells from arsenic-exposed adults
(males and females combined)
PMID: 12776498: Decreased mRNA in NB4 cells
(female-derived)
TET2 Positive association, driven by
females
PMID: 25304211: Prenatal arsenic exposure positively
associated with cg09295382 methylation in newborn cord
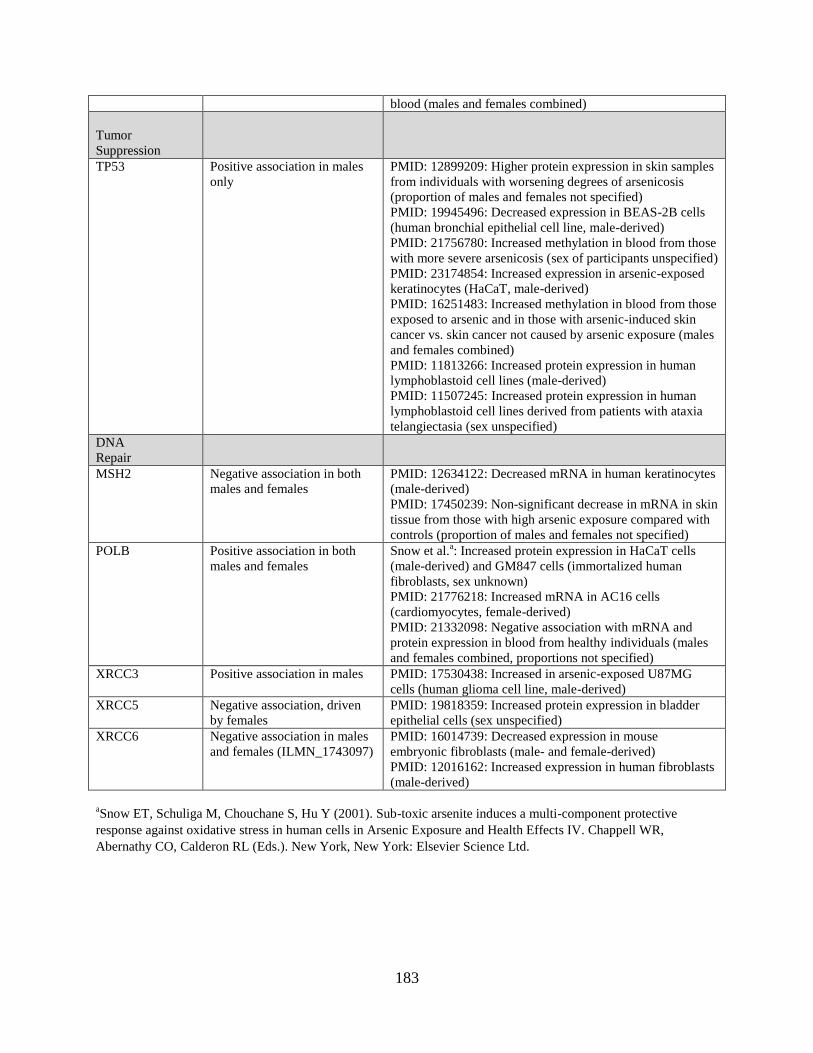
183
blood (males and females combined)
Tumor
Suppression
TP53 Positive association in males
only
PMID: 12899209: Higher protein expression in skin samples
from individuals with worsening degrees of arsenicosis
(proportion of males and females not specified) PMID: 19945496: Decreased expression in BEAS-2B cells
(human bronchial epithelial cell line, male-derived) PMID: 21756780: Increased methylation in blood from those
with more severe arsenicosis (sex of participants unspecified)
PMID: 23174854: Increased expression in arsenic-exposed
keratinocytes (HaCaT, male-derived)
PMID: 16251483: Increased methylation in blood from those
exposed to arsenic and in those with arsenic-induced skin
cancer vs. skin cancer not caused by arsenic exposure (males
and females combined) PMID: 11813266: Increased protein expression in human
lymphoblastoid cell lines (male-derived)
PMID: 11507245: Increased protein expression in human
lymphoblastoid cell lines derived from patients with ataxia
telangiectasia (sex unspecified)
DNA
Repair
MSH2 Negative association in both
males and females
PMID: 12634122: Decreased mRNA in human keratinocytes
(male-derived)
PMID: 17450239: Non-significant decrease in mRNA in skin
tissue from those with high arsenic exposure compared with
controls (proportion of males and females not specified)
POLB Positive association in both
males and females
Snow et al.a: Increased protein expression in HaCaT cells
(male-derived) and GM847 cells (immortalized human
fibroblasts, sex unknown)
PMID: 21776218: Increased mRNA in AC16 cells
(cardiomyocytes, female-derived)
PMID: 21332098: Negative association with mRNA and
protein expression in blood from healthy individuals (males
and females combined, proportions not specified)
XRCC3 Positive association in males PMID: 17530438: Increased in arsenic-exposed U87MG
cells (human glioma cell line, male-derived)
XRCC5 Negative association, driven
by females
PMID: 19818359: Increased protein expression in bladder
epithelial cells (sex unspecified)
XRCC6 Negative association in males
and females (ILMN_1743097)
PMID: 16014739: Decreased expression in mouse
embryonic fibroblasts (male- and female-derived)
PMID: 12016162: Increased expression in human fibroblasts
(male-derived)
aSnow ET, Schuliga M, Chouchane S, Hu Y (2001). Sub-toxic arsenite induces a multi-component protective
response against oxidative stress in human cells in Arsenic Exposure and Health Effects IV. Chappell WR,
Abernathy CO, Calderon RL (Eds.). New York, New York: Elsevier Science Ltd.
184
DISCUSSION
We observed that arsenic exposure was associated with the methylation and/or expression
of several candidate genes involved in OCM, DNA repair, epigenetic regulation, and tumor
suppression/oncogenesis. These associations often differed between men and women, consistent
with previous reports which have shown that arsenic alters epigenetic modifications, including
DNA methylation and PTHMs, in a sex-dependent manner [12-18].
Among women, arsenic exposure was negatively associated with methylation at a CpG
site (cg02978542) within the TSS of MTHFR, an enzyme involved in folate metabolism.
MTHFR methylation and expression have not previously been examined in relation to arsenic
exposure. Given the findings for MTHFR methylation, we would have expected arsenic exposure
to be associated with increased MTHFR expression, which would likely be protective, as folate is
a methyl donor which facilitates arsenic metabolism and excretion [37, 38], and folate deficiency
is a risk factor for arsenic-induced skin lesions [39]. However, we did not observe significant
associations between arsenic exposure and MTHFR expression in this study.
After correcting for multiple comparisons, KDM4B was differentially methylated by
arsenic exposure in the whole study sample, and in the same direction for both men and women.
KDM4B codes for a histone demethylase, which removes a single methyl group from the tri-
methylated forms of lysines 9 and 36 on histone H3 (H3K9me3 and H3K36me3, respectively)
[40]; this leads to increased levels of their di-methyl forms (H3K9me2 and H3K36me2,
respectively). We have previously observed that arsenic exposure is associated with higher
global levels of H3K9me2 among both men and women [13] and with higher global levels of
H3K36me2 among men [18]. Thus, arsenic-induced alterations in histone demethylases, such as
KDM4B, may explain some of the observed effects of arsenic on PTHMs.

185
After correcting for multiple comparisons, XRCC5 was the only gene that was both
differentially methylated and differentially expressed by arsenic exposure. XRCC5 assists with
non-homologous end joining (NHEJ), a mechanism that is important for both DNA repair and
V(D)J recombination [41]. Among women, arsenic was positively associated with methylation at
a CpG site (cg05998850) within the gene body of XRCC5 and was negatively associated with
XRCC5 mRNA expression. Recent evidence suggests that methylation at certain intragenic CpG
sites is more highly correlated with mRNA levels than is methylation within promoter regions
[42]. Therefore, it is possible that methylation at cg05998850 regulates XRCC5 expression,
which should be explored in future studies. In contrast with our findings, a previous in vitro
study by Chen et al. observed higher XRCC5 protein expression in arsenic-exposed bladder
epithelial cells [43]. It is possible that tissue and/or sex differences may have contributed to this
discrepancy, though it is not clear from what sex the cell line used by Chen et al. was derived.
Several other genes involved in DNA repair were differentially expressed by arsenic
exposure. Consistent with previous in vitro studies [44-47], arsenic exposure was inversely
associated with expression levels of XRCC5, XRCC6, and MSH2, which are enzymes involved in
NHEJ and mismatch repair, respectively [41, 48]. Inhibition of DNA repair is one hypothesized
mechanism of arsenic carcinogenicity; in particular, arsenic has been shown to inhibit the
activity of DNA repair enzymes which contain zinc finger domains, such as PARP-1 [49]. Our
study, along with several others [44-47], suggests that arsenic may also reduce the expression of
key enzymes involved in DNA repair pathways, including NHEJ and mismatch repair. However,
three of the candidate genes involved in DNA repair or damage responses did not follow this
trend. Consistent with previous studies [50-52], we observed that arsenic exposure was positively
associated with the expression of POLB, a DNA polymerase involved in base excision repair
186
[53], and also with XRCC3, which is involved in homologous recombination [41], although only
among men. Furthermore, we did not observe associations between arsenic exposure and the
expression of PCNA, a DNA clamp which is involved in both normal DNA replication and the
DNA damage response [54].
Although the role of OCM in facilitating arsenic metabolism has been well-studied [25],
the effects of arsenic on the OCM pathway are less well understood. However, two
metabolomics studies in mice have observed that several metabolites involved in the OCM
pathway, including betaine, choline, homocysteine, and methionine, are altered by arsenic [55,
56]. Furthermore, a previous in vitro study, which utilized a normal human prostate epithelial
cell line, observed that arsenic altered the expression of several genes involved in the OCM
pathway [57]. In particular, they found that genes involved in the synthesis of glutathione, the
primary endogenous antioxidant, were upregulated in response to arsenic exposure [57].
Similarly, we observed that arsenic exposure was positively associated with the expression of
two genes involved in glutathione synthesis: CBS among women and GSS among both men and
women. Several other genes in the OCM pathway were also differentially expressed by arsenic
exposure, including AHCY, DHFR, GAMT, GNMT, and MTR, and many of these associations
differed by sex (Figure 2). The effects of arsenic on GAMT, an enzyme involved in creatine
synthesis [58], had not been examined previously. However, arsenic has been shown to reduce
hepatic mitochondrial creatine concentrations in mice [56]. Consistent with this, we observed
that arsenic exposure was negatively associated with GAMT expression, but only among women.
We also observed a positive association between arsenic exposure and GNMT expression among
women, but not men. GNMT codes for an enzyme which regulates concentrations of S-
adenosylmethionine (SAM), the universal methyl donor [59]. Arsenic reduces SAM
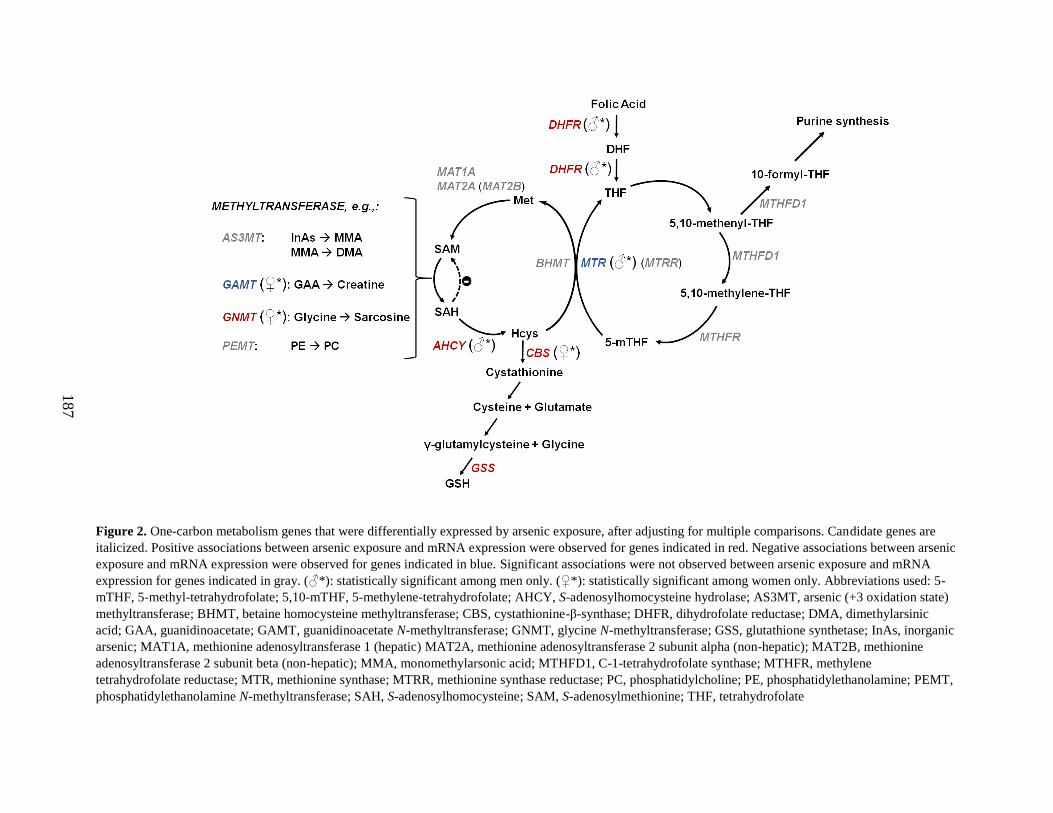
187
Figure 2. One-carbon metabolism genes that were differentially expressed by arsenic exposure, after adjusting for multiple comparisons. Candidate genes are
italicized. Positive associations between arsenic exposure and mRNA expression were observed for genes indicated in red. Negative associations between arsenic
exposure and mRNA expression were observed for genes indicated in blue. Significant associations were not observed between arsenic exposure and mRNA
expression for genes indicated in gray. (♂*): statistically significant among men only. (♀*): statistically significant among women only. Abbreviations used: 5-
mTHF, 5-methyl-tetrahydrofolate; 5,10-mTHF, 5-methylene-tetrahydrofolate; AHCY, S-adenosylhomocysteine hydrolase; AS3MT, arsenic (+3 oxidation state)
methyltransferase; BHMT, betaine homocysteine methyltransferase; CBS, cystathionine-β-synthase; DHFR, dihydrofolate reductase; DMA, dimethylarsinic
acid; GAA, guanidinoacetate; GAMT, guanidinoacetate N-methyltransferase; GNMT, glycine N-methyltransferase; GSS, glutathione synthetase; InAs, inorganic
arsenic; MAT1A, methionine adenosyltransferase 1 (hepatic) MAT2A, methionine adenosyltransferase 2 subunit alpha (non-hepatic); MAT2B, methionine
adenosyltransferase 2 subunit beta (non-hepatic); MMA, monomethylarsonic acid; MTHFD1, C-1-tetrahydrofolate synthase; MTHFR, methylene
tetrahydrofolate reductase; MTR, methionine synthase; MTRR, methionine synthase reductase; PC, phosphatidylcholine; PE, phosphatidylethanolamine; PEMT,
phosphatidylethanolamine N-methyltransferase; SAH, S-adenosylhomocysteine; SAM, S-adenosylmethionine; THF, tetrahydrofolate
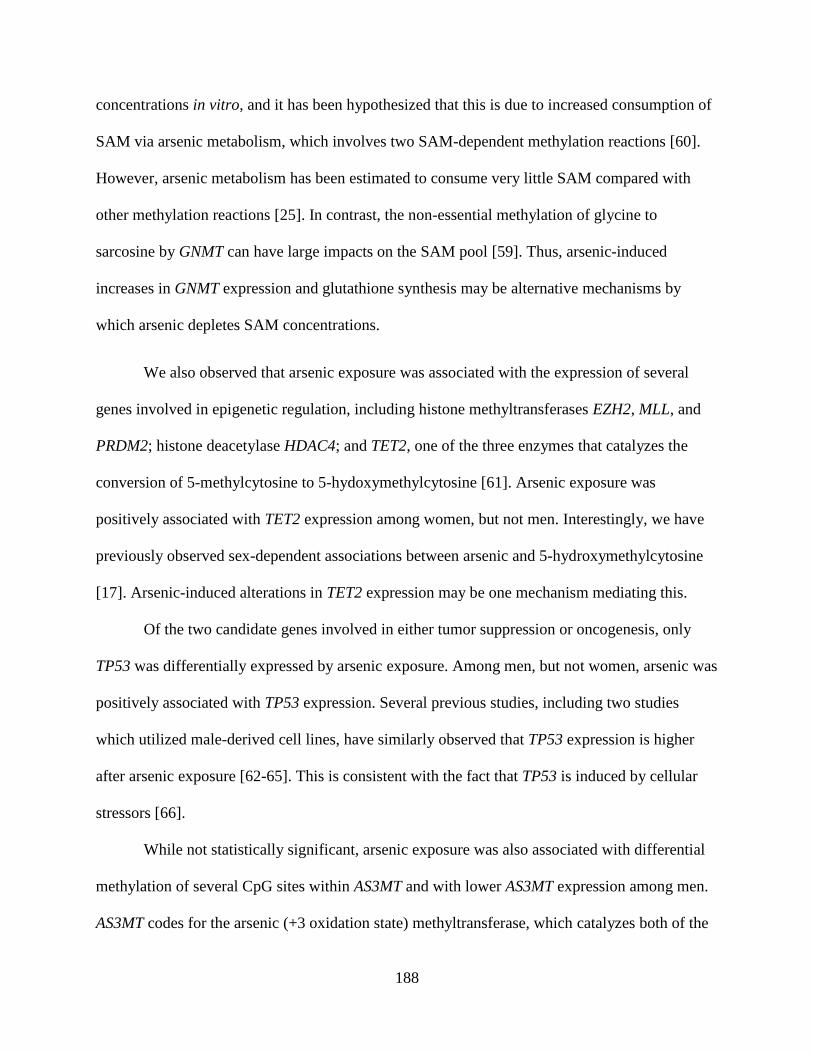
188
concentrations in vitro, and it has been hypothesized that this is due to increased consumption of
SAM via arsenic metabolism, which involves two SAM-dependent methylation reactions [60].
However, arsenic metabolism has been estimated to consume very little SAM compared with
other methylation reactions [25]. In contrast, the non-essential methylation of glycine to
sarcosine by GNMT can have large impacts on the SAM pool [59]. Thus, arsenic-induced
increases in GNMT expression and glutathione synthesis may be alternative mechanisms by
which arsenic depletes SAM concentrations.
We also observed that arsenic exposure was associated with the expression of several
genes involved in epigenetic regulation, including histone methyltransferases EZH2, MLL, and
PRDM2; histone deacetylase HDAC4; and TET2, one of the three enzymes that catalyzes the
conversion of 5-methylcytosine to 5-hydoxymethylcytosine [61]. Arsenic exposure was
positively associated with TET2 expression among women, but not men. Interestingly, we have
previously observed sex-dependent associations between arsenic and 5-hydroxymethylcytosine
[17]. Arsenic-induced alterations in TET2 expression may be one mechanism mediating this.
Of the two candidate genes involved in either tumor suppression or oncogenesis, only
TP53 was differentially expressed by arsenic exposure. Among men, but not women, arsenic was
positively associated with TP53 expression. Several previous studies, including two studies
which utilized male-derived cell lines, have similarly observed that TP53 expression is higher
after arsenic exposure [62-65]. This is consistent with the fact that TP53 is induced by cellular
stressors [66].
While not statistically significant, arsenic exposure was also associated with differential
methylation of several CpG sites within AS3MT and with lower AS3MT expression among men.
AS3MT codes for the arsenic (+3 oxidation state) methyltransferase, which catalyzes both of the
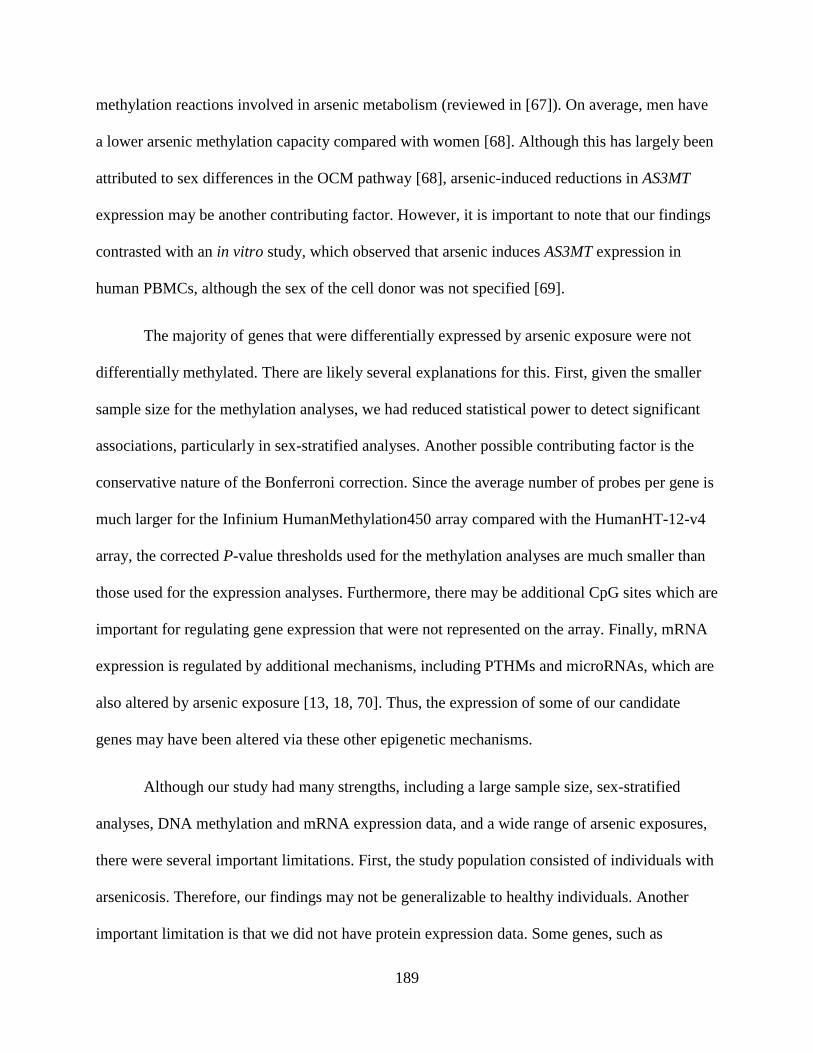
189
methylation reactions involved in arsenic metabolism (reviewed in [67]). On average, men have
a lower arsenic methylation capacity compared with women [68]. Although this has largely been
attributed to sex differences in the OCM pathway [68], arsenic-induced reductions in AS3MT
expression may be another contributing factor. However, it is important to note that our findings
contrasted with an in vitro study, which observed that arsenic induces AS3MT expression in
human PBMCs, although the sex of the cell donor was not specified [69].
The majority of genes that were differentially expressed by arsenic exposure were not
differentially methylated. There are likely several explanations for this. First, given the smaller
sample size for the methylation analyses, we had reduced statistical power to detect significant
associations, particularly in sex-stratified analyses. Another possible contributing factor is the
conservative nature of the Bonferroni correction. Since the average number of probes per gene is
much larger for the Infinium HumanMethylation450 array compared with the HumanHT-12-v4
array, the corrected P-value thresholds used for the methylation analyses are much smaller than
those used for the expression analyses. Furthermore, there may be additional CpG sites which are
important for regulating gene expression that were not represented on the array. Finally, mRNA
expression is regulated by additional mechanisms, including PTHMs and microRNAs, which are
also altered by arsenic exposure [13, 18, 70]. Thus, the expression of some of our candidate
genes may have been altered via these other epigenetic mechanisms.
Although our study had many strengths, including a large sample size, sex-stratified
analyses, DNA methylation and mRNA expression data, and a wide range of arsenic exposures,
there were several important limitations. First, the study population consisted of individuals with
arsenicosis. Therefore, our findings may not be generalizable to healthy individuals. Another
important limitation is that we did not have protein expression data. Some genes, such as
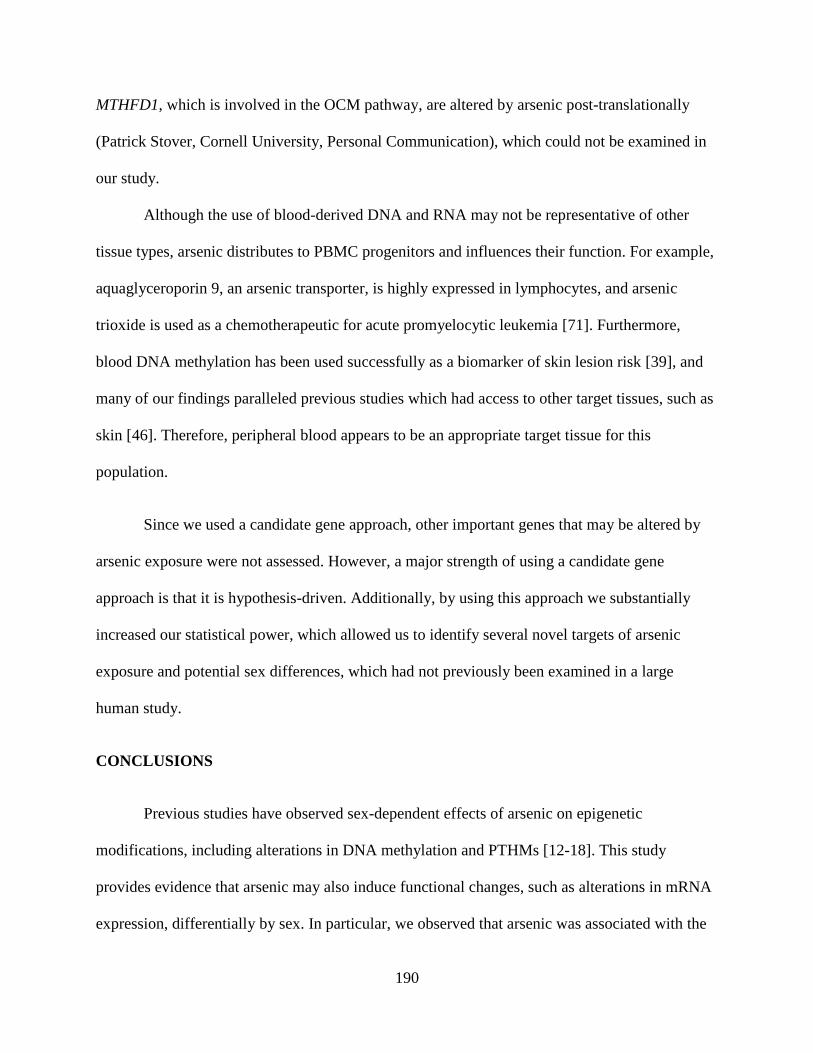
190
MTHFD1, which is involved in the OCM pathway, are altered by arsenic post-translationally
(Patrick Stover, Cornell University, Personal Communication), which could not be examined in
our study.
Although the use of blood-derived DNA and RNA may not be representative of other
tissue types, arsenic distributes to PBMC progenitors and influences their function. For example,
aquaglyceroporin 9, an arsenic transporter, is highly expressed in lymphocytes, and arsenic
trioxide is used as a chemotherapeutic for acute promyelocytic leukemia [71]. Furthermore,
blood DNA methylation has been used successfully as a biomarker of skin lesion risk [39], and
many of our findings paralleled previous studies which had access to other target tissues, such as
skin [46]. Therefore, peripheral blood appears to be an appropriate target tissue for this
population.
Since we used a candidate gene approach, other important genes that may be altered by
arsenic exposure were not assessed. However, a major strength of using a candidate gene
approach is that it is hypothesis-driven. Additionally, by using this approach we substantially
increased our statistical power, which allowed us to identify several novel targets of arsenic
exposure and potential sex differences, which had not previously been examined in a large
human study.
CONCLUSIONS
Previous studies have observed sex-dependent effects of arsenic on epigenetic
modifications, including alterations in DNA methylation and PTHMs [12-18]. This study
provides evidence that arsenic may also induce functional changes, such as alterations in mRNA
expression, differentially by sex. In particular, we observed that arsenic was associated with the

191
expression of genes involved in the OCM pathway, epigenetic regulation, DNA repair, and
tumor suppression. Dysregulation of these pathways has been implicated in arsenic toxicity.
Therefore, sex-dependent perturbations in these pathways may contribute to some of the
observed sex differences in susceptibility to arsenic toxicity. However, additional studies will be
needed to determine if the alterations in DNA methylation and gene expression observed in this
study translate to increased risks of developing arsenic-related health outcomes.
ACKNOWLEDGEMENTS
This work was supported by the National Institutes of Health, grants R01 CA107431, R21
ES024834, and F31 ES025100
192
CHAPTER SIX REFERENCES
1. Kinniburgh DG, Smedley PL, Davies J, Milne CJ, Gaus I, Trafford JM, et al (2001). The
Scale and Causes of Groundwater Arsenic Problem in Bangladesh, in: Arsenic in
Groundwater (p. 211-257). Welch AH and Stollenwerk KG (Eds.). Boston, MA: Kluwer
Academic.
2. National Research Council. Critical Aspects of EPA's IRIS Assessment of Inorganic
Arsenic. National Research Council Interim Report. 2013.
3. Chen CJ and Wang CJ. Ecological correlation between arsenic level in well water and age-
adjusted mortality from malignant neoplasms. Cancer Res. 1990;50(17):5470-5474.
4. Chen YC, Su HJ, Guo YL, Hsueh YM, Smith TJ, Ryan LM, et al. Arsenic methylation and
bladder cancer risk in Taiwan. Cancer Causes Control. 2003;14(4):303-310.
5. Moon KA, Guallar E, Umans JG, Devereuk RB, Best LG, Francesconi KA, et al.
Association between exposure to low to moderate arsenic levels and incident
cardiovascular disease: a prospective cohort study. Ann Intern Med. 2013;159(10):649-
659.
6. Hamadani JD, Tofail F, Nermell B, Gardner R, Shiraji S, Bottai M, et al. Critical windows
of exposure for arsenic-associated impairment of cognitive function in pre-school girls and
boys: a population-based cohort study. Int J Epidemiol. 2011;40(6): 1593-1604.
7. Davis MA, Higgins J, Li Z, Gilbert-Diamond D, Baker ER, Das A, et al. Preliminary
analysis of in utero low-level arsenic exposure and fetal growth using biometric
measurements extracted from fetal ultrasound reports. Environ Health. 2015;14(1):12.
8. Saha KK, Engstrom A, Hamadani JD, Tofail F, Rasmussen KM, Vahter M. Pre- and
postnatal arsenic exposure and body size to 2 years of age: a cohort study in rural
Bangladesh. Environ Health Perspect. 2012;120(8):1209.
9. Gardner RM, Kippler M, Tofail F, Bottai M, Hamadani J, Grander M, et al. Environmental
exposure to metals and children's growth to age 5 years: a prospective cohort study. Ame J
Epidemiol. 2013;177(12):1356-67.
10. Waalkes MP, Ward JM, Liu J, Diwan BA. Transplacental carcinogenicity of inorganic
arsenic in the drinking water: induction of hepatic, ovarian, pulmonary, and adrenal tumors
in mice. Toxicol Appl Pharmacol. 2003;186(1):7-17.
11. Allan AM, Hafez AK, Labrecque MT, Solomon ER, Shaikh MN, Zheng X, et al. Sex-
dependent effects of developmental arsenic exposure on methylation capacity and
methylation regulation of the glucocorticoid receptor system in the embryonic mouse
brain. Toxicol Rep. 2015;2:1376-1390.
193
12. Pilsner JR, Hall MN, Liu X, Ilievski V, Slavkovich V, Levy D, et al. Influence of
prenatal arsenic exposure and newborn sex on global methylation of cord blood DNA.
PloS One. 2012;7(5):e37147.
13. Chervona Y, Hall MN, Arita A, Wu F, Sun H, Tseng HC, et al. Associations between
arsenic exposure and global posttranslational histone modifications among adults in
Bangladesh. Cancer Epidemiol Biomarkers Prev. 2012;21(12):2252-2260.
14. Nohara K, Baba T, Murai H, Kobayashi Y, Suzuki T, Tateishi Y, et al. Global DNA
methylation in the mouse liver is affected by methyl deficiency and arsenic in a sex-
dependent manner. Arch Toxicol. 2011;85(6):653-661.
15. Broberg K, Ahmed S, Engstrom K, Hossain MB, Jurkovic Mlakar S, et al. Arsenic
exposure in early pregnancy alters genome-wide DNA methylation in cord blood,
particularly in boys. J Dev Orig Health Dis. 2014;5(04):288-298.
16. Tyler CR, Hafez AK, Solomon ER, Allan AM. Developmental exposure to 50 parts-per-
billion arsenic influences histone modifications and associated epigenetic machinery in a
region-and sex-specific manner in the adult mouse brain. Toxicol Appl Pharmacol. 2015;
288(1):40-51.
17. Niedzwiecki MM, Liu X, Hall MN, Thomas T, Slavkovich V, Ilievski V, et al. Sex-
specific associations of arsenic exposure with global DNA methylation and
hydroxymethylation in leukocytes: results from two studies in Bangladesh. Cancer
Epidemiol Biomarkers Prev. 2015;24(11):1748-1757.
18. Howe CG, Liu X, Hall MN, Slavkovich V, Ilievski V, Parvez F, et al. Associations
between blood and urine arsenic concentrations and post-translational histone
modifications in Bangladeshi men and women. Environ Health Perspect. [Epub ahead of
print].
19. Rojas D, Rager JE, Smeester L, Bailey KA, Drobna Z, Rubio-Andrade M, et al. Prenatal
arsenic exposure and the epigenome: identifying sites of 5-methylcytosine alterations that
predict functional changes in gene expression in newborn cord blood and subsequent
birth outcomes. Toxicol Sci. 2015;143(1):97-106.
20. Xie Y, Liu J, Benbrahim-Tallaa L, Ward JM, Logsdon D, Diwan BA, et al. Aberrant
DNA methylation and gene expression in livers of newborn mice transplacentally
exposed to a hepatocarcinogenic dose of inorganic arsenic. Toxicology. 2007;236(1):7-
15.
21. Andrew AS, Jewell DA, Mason RA, Whitfield ML, Moore JH, Karagas MR. Drinking-
water arsenic exposure modulates gene expression in human lymphocytes from a US
population. Environmen Health Perspect. 2008;116(4):524.

194
22. Argos M, Kibriya MG, Parvez F, Jasmine F, Rakibuz-Zaman M, Ahsan H. Gene
expression profiles in peripheral lymphocytes by arsenic exposure and skin lesion status
in a Bangladeshi population. Cancer Epidemiol Biomarkers Prev. 2006;15(7):1367-1375.
23. Muñoz A, Chervona Y, Hall M, Kluz T, Gamble MV, Costa M. Sex-specific patterns and
deregulation of endocrine pathways in the gene expression profiles of Bangladeshi adults
exposed to arsenic contaminated drinking water. Toxicol Appl Pharmacol.
2015;284(3):330-338.
24. Argos M, Chen L, Jasmine F, Tong L, Pierce BL, Roy S, et al. Gene-specific differential
DNA methylation and chronic arsenic exposure in an epigenome-wide association study
of adults in Bangladesh. Environ Health Perspect. 2015;123(1):64-71.
25. Hall MN and Gamble MV. Nutritional manipulation of one-carbon metabolism: effects
on arsenic methylation and toxicity. J Toxicol. 2012;2012:595307
26. Pierce BL, Tong L, Argos M, Gao J, Farzana J, Roy S, et al. Arsenic metabolism
efficiency has a causal role in arsenic toxicity: Mendelian randomization and gene-
environment interaction. Int J Epidemiol. 2013;42(6):1862-1872.
27. Bustaffa E, Stoccoro A, Bianchi F, Migliore L. Genotoxic and epigenetic mechanisms in
arsenic carcinogenicity. Arch Toxicol. 2014;88(5):1043-1067.
28. Applebaum KM, Karagas MR, Hunter DJ, Catalano PJ, Byler SH, Morris S, et al.
Polymorphisms in nucleotide excision repair genes, arsenic exposure, and non-melanoma
skin cancer in New Hampshire. Environ Health Perspect. 2007;115(8):1231-1236.
29. Lai Y, Zhao W, Chen C, Wu M, Zhang Z. Role of DNA polymerase beta in the
genotoxicity of arsenic. Environ Mol Mutagen. 2011;52(6):460-468.
30. Ebert F, Weiss A, Bultemeyer M, Hamann I, Hartwig A, Schwerdtle T. Arsenicals affect
base excision repair by several mechanisms. Mutat Res. 2011;715(1):32-41.
31. Davis AP, Grondin CJ, Lennon-Hopkins K, Saraceni-Richards C, Sciaky D, King BL, et
al. The Comparative Toxicogenomics Database's 10th year anniversary: update 2015.
Nucleic Acids Res. 2015;43(D1): D914-D920.
32. Argos M, Rahman M, Parvez F, Dignam J, Islam T, Quasem I, et al. Baseline
comorbidities in a skin cancer prevention trial in Bangladesh. Eur J Clin Invest.
2013;43(6):579-88.
33. Nixon DE, Mussmann GV, Eckdahl SJ, Moyer TP. Total arsenic in urine: palladium-
persulfate vs nickel as a matrix modifier for graphite furnace atomic absorption
spectrophotometry. Clin Chem. 1991;37(9):1575-1579.
195
34. Slot C. Plasma creatinine determination a new and specific Jaffe reaction method. Scand
J Clin Lab Invest. 1965;17(4):381-387.
35. Johnson WE, Li C, Rabinovic A. Adjusting batch effects in microarray expression data
using empirical Bayes methods. Biostatistics. 2007;8(1):118-27.
36. Houseman EA, Accomando WP, Koestler DC, Christensen BC, Marsit CJ, Nelson HH, et
al. DNA methylation arrays as surrogate measures of cell mixture distribution. BMC
Bioinformatics. 2012;13(1):1.
37. Gamble MV, Liu X, Slavkovich V, Pilsner JR, Ilievski V, Factor-Litvak P, et al. Folic
acid supplementation lowers blood arsenic. Am J Clin Nutr. 2007;86(4):1202-1209.
38. Peters BA, Hall MN, Liu X, Parvez F, Sanchez TR, van Geen A, et al. Folic Acid and
Creatine as Therapeutic Approaches to Lower Blood Arsenic: A Randomized Controlled
Trial. Environ Health Perspect. 2015;123(12):1294-301.
39. Pilsner JR, Liu X, Ahsan H, Ilievski V, Slavkovich V, Levy D, et al. Folate deficiency,
hyperhomocysteinemia, low urinary creatinine, and hypomethylation of leukocyte DNA
are risk factors for arsenic-induced skin lesions. Environ Health Perspect.
2009;117(2):254-60.
40. Fodor BD, Kubicek S, Yonezawa M, O’Sullivan RJ, Sengupta R, Perez-Burgos L, et al.
Jmjd2b antagonizes H3K9 trimethylation at pericentric heterochromatin in mammalian
cells. Genes Dev. 2006;20(12):1557-1562.
41. Thacker J and Zdzienicka MZ. The mammalian XRCC genes: their roles in DNA repair
and genetic stability. DNA Repair (Amst). 2003;2(6):655-72.
42. Schultz MD, He Y, Whitaker JW, Hariharan M, Mukamel EA, Leung D, et al. Human
body epigenome maps reveal noncanonical DNA methylation variation. Nature, 2015.
523(7559): p. 212-6.
43. Chen SH, Wang YW, Hsu JL, Chang HY, Wang CY, Shen PT, et al. Nucleophosmin in
the pathogenesis of arsenic-related bladder carcinogenesis revealed by quantitative
proteomics. Toxicol Appl Pharmacol. 2010;242(2):126-135.
44. Kann S, Estes C, Reichard JF, Huang MY, Sartor MA, Schwemberger S, et al.
Butylhydroquinone protects cells genetically deficient in glutathione biosynthesis from
arsenite-induced apoptosis without significantly changing their prooxidant status. Toxicol
Sci. 2005;87(2):365-84.
45. Zhao S, Zhang J, Zhang X, Dong X, Sun X. Arsenic trioxide induces different gene
expression profiles of genes related to growth and apoptosis in glioma cells dependent on
the p53 status. Mol Biol Rep. 2008;35(3):421-429.
196
46. Zhang A, Feng H, Yang G, Pan X, Jiang X, Huang X, et al. Unventilated indoor coal-
fired stoves in Guizhou province, China: cellular and genetic damage in villagers exposed
to arsenic in food and air. Environ Health Perspect. 2007;115(4):653-658.
47. Bae DS, Hanneman WH, Yang RS, Campain JA. Characterization of gene expression
changes associated with MNNG, arsenic, or metal mixture treatment in human
keratinocytes: application of cDNA microarray technology. Environ Health Perspect.
2002;110(Suppl 6):931.
48. Buermeyer AB, Deschênes SM, Baker SM, Liskay RM. Mammalian DNA mismatch
repair. Annu Rev Genet. 1999;33:533-64.
49. Sun X, Zhou Z, Du L, Liu W, Liu Y, Hudson LG, et al. Arsenite binding-induced zinc
loss from PARP-1 is equivalent to zinc deficiency in reducing PARP-1 activity, leading
to inhibition of DNA repair. Toxicol Appl Pharmacol. 2014;274(2):313-318.
50. Snow ET, Schuliga M, Chouchane S, Hu Y (2001). Sub-toxic arsenite induces a multi-
component protective response against oxidative stress in human cells in Arsenic
Exposure and Health Effects, IV (p. 265-275). Chappel WR, Abernathy CO, Calderon R
(Eds). San Diego, CA: Elsevier Science, Ltd.
51. Mo J, Xia Y, Wade TJ, DeMarini DM, Davidson M, Mumford J. Altered gene expression
by low-dose arsenic exposure in humans and cultured cardiomyocytes: assessment by
real-time PCR arrays. Int J Environ Res Public Health. 2011;8(6):2090-2108.
52. Zhao S, Zhang J, Zhang X, Dong X, Sun X. Arsenic trioxide induces different gene
expression profiles of genes related to growth and apoptosis in glioma cells dependent on
the p53 status. Mol Biol Rep. 2008;35(3):421-9.
53. Robertson AB, Klungland A, Rognes T, Leiros I. DNA repair in mammalian cells: Base
excision repair: the long and short of it. Cell Mol Life Sci. 2009;66(6):981-993.
54. Shivji KK, Kenny MK, Wood RD. Proliferating cell nuclear antigen is required for DNA
excision repair. Cell. 1992;69(2):367-374.
55. García-Sevillano MA, Contreras-Acuna M, Garcia-Barrera T, Navarro F, Gomez-Ariza
JL. Metabolomic study in plasma, liver and kidney of mice exposed to inorganic arsenic
based on mass spectrometry. Anal Bioanal Chem. 2014;406(5):1455-1469.
56. García-Sevillano MA, Garcia-Barrera T, Navarro F, Montero-Lobato Z, Gomez-Ariza JL.
Shotgun metabolomic approach based on mass spectrometry for hepatic mitochondria of
mice under arsenic exposure. Biometals. 2015;28(2):341-351.
57. Coppin JF, Qu W, Waalkes MP. Interplay between cellular methyl metabolism and
adaptive efflux during oncogenic transformation from chronic arsenic exposure in human
cells. J Biol Chem. 2008;283(28):19342-19350.
197
58. Joncquel-Chevalier CM, Voicu PM, Fontaine M, Dessein AF, Porchet N, Mention-
Mulliez K, et al. Creatine biosynthesis and transport in health and disease. Biochimie.
2015;119:146-65.
59. Luka Z, Mudd SH, Wagner C. Glycine N-methyltransferase and regulation of S-
adenosylmethionine levels. J Biol Chem. 2009;284(34):22507-22511.
60. Reichard JF, Schnekenburger M, Puga A. Long term low-dose arsenic exposure induces
loss of DNA methylation. Biochem Biophys Res Commun. 2007;352(1):188-192.
61. Ito S, D’Alessio AC, Taranova OV, Hong K, Sowers LC, Zhang Y. Role of Tet proteins
in 5mC to 5hmC conversion, ES-cell self-renewal and inner cell mass specification.
Nature. 2010;466(7310):1129-33.
62. Hu CJ, Zhang AH, Huang HH. Molecular pathology of skin carcinogenesis due to
arsenicalism from coal-burning. Arch Environ Health. 2003;58(2):92-6.
63. Wu CH, Tseng YS, Kao YT, Sheu HM, Liu HS. Low concentration of arsenic-induced
aberrant mitosis in keratinocytes through E2F1 transcriptionally regulated Aurora-A.
Toxicol Sci. 2013;132(1):43-52.
64. Chou RH and Huang H. Sodium arsenite suppresses human papillomavirus‐16 E6 gene
and enhances apoptosis in E6‐transfected human lymphoblastoid cells. J Cell Biochem.
2002;84(3):615-624.
65. Menendez D, Mora G, Salazar AM, Ostrosky-Wegman P. ATM status confers sensitivity
to arsenic cytotoxic effects. Mutagenesis. 2001;16(5):443-448.
66. Ljungman M. Dial 9-1-1 for p53: mechanisms of p53 activation by cellular stress.
Neoplasia. 2000;2(3):208-25.
67. Thomas DJ. Molecular processes in cellular arsenic metabolism. Toxicol Appl
Pharmacol. 2007;222(3):365-373.
68. Vahter ME. Interactions between arsenic-induced toxicity and nutrition in early life. The
J Nutr. 2007;137(12):2798-2804.
69. Gribble MO, Tang WY, Shang Y, Pollak J, Umans JG, Francesconi KA, et al.
Differential methylation of the arsenic (III) methyltransferase promoter according to
arsenic exposure. Arch Toxicol. 2014;88(2):275-82.
70. Rager JE, Bailey KA, Smeester L, Miller SK, Parker JS, Laine JE, et al. Prenatal arsenic
exposure and the epigenome: altered microRNAs associated with innate and adaptive
immune signaling in newborn cord blood. Environ Mol Mutagen. 2014;55(3):196-208.

198
71. Leung J, Pang A, Yuen WH, Kwong YL, Tse EW. Relationship of expression of
aquaglyceroporin 9 with arsenic uptake and sensitivity in leukemia cells. Blood. 2007;
109(2):740-746.
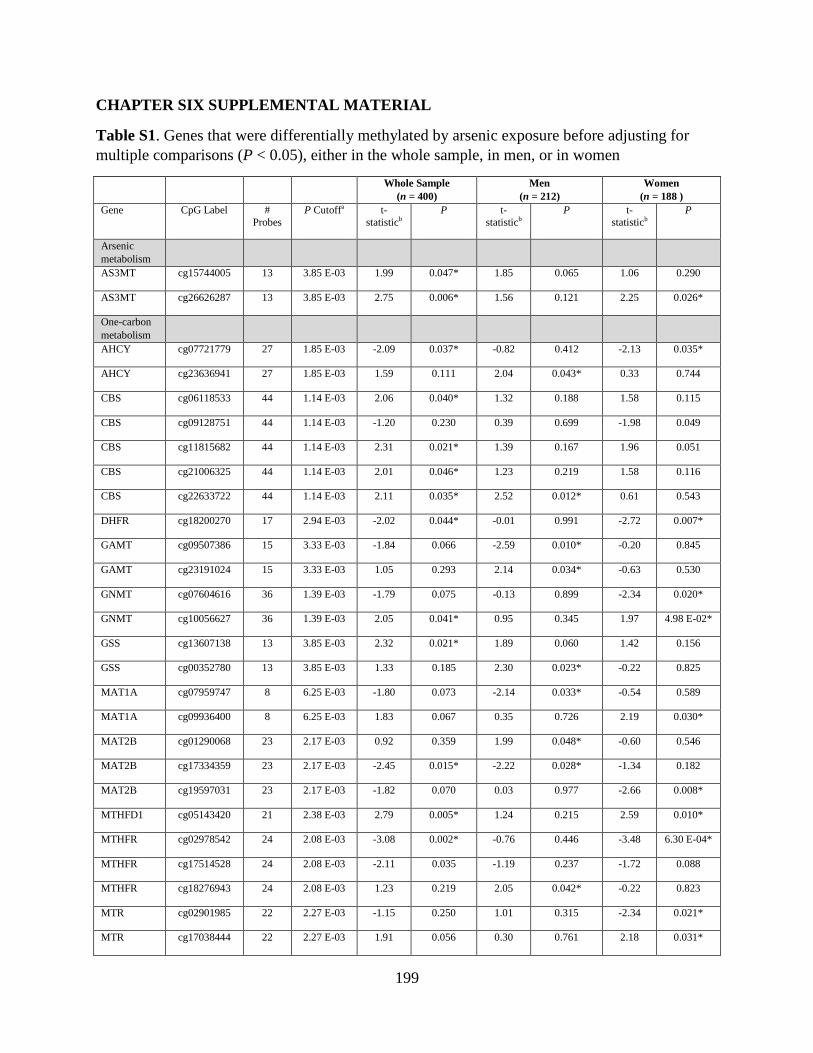
199
CHAPTER SIX SUPPLEMENTAL MATERIAL
Table S1. Genes that were differentially methylated by arsenic exposure before adjusting for
multiple comparisons (P < 0.05), either in the whole sample, in men, or in women
Whole Sample
(n = 400)
Men
(n = 212)
Women
(n = 188 )
Gene CpG Label #
Probes
P Cutoffa t-
statisticb
P t-
statisticb
P t-
statisticb
P
Arsenic
metabolism
AS3MT cg15744005 13 3.85 E-03 1.99 0.047* 1.85 0.065 1.06 0.290
AS3MT cg26626287 13 3.85 E-03 2.75 0.006* 1.56 0.121 2.25 0.026*
One-carbon
metabolism
AHCY cg07721779 27 1.85 E-03 -2.09 0.037* -0.82 0.412 -2.13 0.035*
AHCY cg23636941 27 1.85 E-03 1.59 0.111 2.04 0.043* 0.33 0.744
CBS cg06118533 44 1.14 E-03 2.06 0.040* 1.32 0.188 1.58 0.115
CBS cg09128751 44 1.14 E-03 -1.20 0.230 0.39 0.699 -1.98 0.049
CBS cg11815682 44 1.14 E-03 2.31 0.021* 1.39 0.167 1.96 0.051
CBS cg21006325 44 1.14 E-03 2.01 0.046* 1.23 0.219 1.58 0.116
CBS cg22633722 44 1.14 E-03 2.11 0.035* 2.52 0.012* 0.61 0.543
DHFR cg18200270 17 2.94 E-03 -2.02 0.044* -0.01 0.991 -2.72 0.007*
GAMT cg09507386 15 3.33 E-03 -1.84 0.066 -2.59 0.010* -0.20 0.845
GAMT cg23191024 15 3.33 E-03 1.05 0.293 2.14 0.034* -0.63 0.530
GNMT cg07604616 36 1.39 E-03 -1.79 0.075 -0.13 0.899 -2.34 0.020*
GNMT cg10056627 36 1.39 E-03 2.05 0.041* 0.95 0.345 1.97 4.98 E-02*
GSS cg13607138 13 3.85 E-03 2.32 0.021* 1.89 0.060 1.42 0.156
GSS cg00352780 13 3.85 E-03 1.33 0.185 2.30 0.023* -0.22 0.825
MAT1A cg07959747 8 6.25 E-03 -1.80 0.073 -2.14 0.033* -0.54 0.589
MAT1A cg09936400 8 6.25 E-03 1.83 0.067 0.35 0.726 2.19 0.030*
MAT2B cg01290068 23 2.17 E-03 0.92 0.359 1.99 0.048* -0.60 0.546
MAT2B cg17334359 23 2.17 E-03 -2.45 0.015* -2.22 0.028* -1.34 0.182
MAT2B cg19597031 23 2.17 E-03 -1.82 0.070 0.03 0.977 -2.66 0.008*
MTHFD1 cg05143420 21 2.38 E-03 2.79 0.005* 1.24 0.215 2.59 0.010*
MTHFR cg02978542 24 2.08 E-03 -3.08 0.002* -0.76 0.446 -3.48 6.30 E-04*
MTHFR cg17514528 24 2.08 E-03 -2.11 0.035 -1.19 0.237 -1.72 0.088
MTHFR cg18276943 24 2.08 E-03 1.23 0.219 2.05 0.042* -0.22 0.823
MTR cg02901985 22 2.27 E-03 -1.15 0.250 1.01 0.315 -2.34 0.021*
MTR cg17038444 22 2.27 E-03 1.91 0.056 0.30 0.761 2.18 0.031*
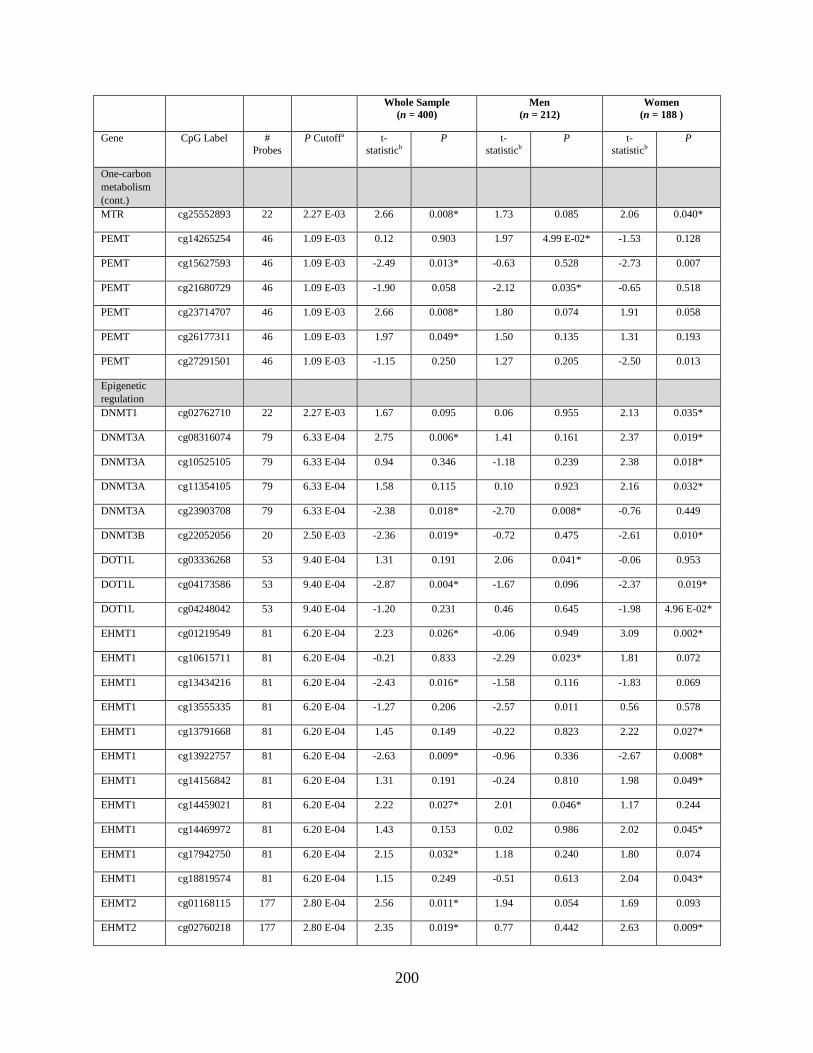
200
Whole Sample
(n = 400)
Men
(n = 212)
Women
(n = 188 )
Gene CpG Label #
Probes
P Cutoffa t-
statisticb
P t-
statisticb
P t-
statisticb
P
One-carbon
metabolism
(cont.)
MTR cg25552893 22 2.27 E-03 2.66 0.008* 1.73 0.085 2.06 0.040*
PEMT cg14265254 46 1.09 E-03 0.12 0.903 1.97 4.99 E-02* -1.53 0.128
PEMT cg15627593 46 1.09 E-03 -2.49 0.013* -0.63 0.528 -2.73 0.007
PEMT cg21680729 46 1.09 E-03 -1.90 0.058 -2.12 0.035* -0.65 0.518
PEMT cg23714707 46 1.09 E-03 2.66 0.008* 1.80 0.074 1.91 0.058
PEMT cg26177311 46 1.09 E-03 1.97 0.049* 1.50 0.135 1.31 0.193
PEMT cg27291501 46 1.09 E-03 -1.15 0.250 1.27 0.205 -2.50 0.013
Epigenetic
regulation
DNMT1 cg02762710 22 2.27 E-03 1.67 0.095 0.06 0.955 2.13 0.035*
DNMT3A cg08316074 79 6.33 E-04 2.75 0.006* 1.41 0.161 2.37 0.019*
DNMT3A cg10525105 79 6.33 E-04 0.94 0.346 -1.18 0.239 2.38 0.018*
DNMT3A cg11354105 79 6.33 E-04 1.58 0.115 0.10 0.923 2.16 0.032*
DNMT3A cg23903708 79 6.33 E-04 -2.38 0.018* -2.70 0.008* -0.76 0.449
DNMT3B cg22052056 20 2.50 E-03 -2.36 0.019* -0.72 0.475 -2.61 0.010*
DOT1L cg03336268 53 9.40 E-04 1.31 0.191 2.06 0.041* -0.06 0.953
DOT1L cg04173586 53 9.40 E-04 -2.87 0.004* -1.67 0.096 -2.37 0.019*
DOT1L cg04248042 53 9.40 E-04 -1.20 0.231 0.46 0.645 -1.98 4.96 E-02*
EHMT1 cg01219549 81 6.20 E-04 2.23 0.026* -0.06 0.949 3.09 0.002*
EHMT1 cg10615711 81 6.20 E-04 -0.21 0.833 -2.29 0.023* 1.81 0.072
EHMT1 cg13434216 81 6.20 E-04 -2.43 0.016* -1.58 0.116 -1.83 0.069
EHMT1 cg13555335 81 6.20 E-04 -1.27 0.206 -2.57 0.011 0.56 0.578
EHMT1 cg13791668 81 6.20 E-04 1.45 0.149 -0.22 0.823 2.22 0.027*
EHMT1 cg13922757 81 6.20 E-04 -2.63 0.009* -0.96 0.336 -2.67 0.008*
EHMT1 cg14156842 81 6.20 E-04 1.31 0.191 -0.24 0.810 1.98 0.049*
EHMT1 cg14459021 81 6.20 E-04 2.22 0.027* 2.01 0.046* 1.17 0.244
EHMT1 cg14469972 81 6.20 E-04 1.43 0.153 0.02 0.986 2.02 0.045*
EHMT1 cg17942750 81 6.20 E-04 2.15 0.032* 1.18 0.240 1.80 0.074
EHMT1 cg18819574 81 6.20 E-04 1.15 0.249 -0.51 0.613 2.04 0.043*
EHMT2 cg01168115 177 2.80 E-04 2.56 0.011* 1.94 0.054 1.69 0.093
EHMT2 cg02760218 177 2.80 E-04 2.35 0.019* 0.77 0.442 2.63 0.009*
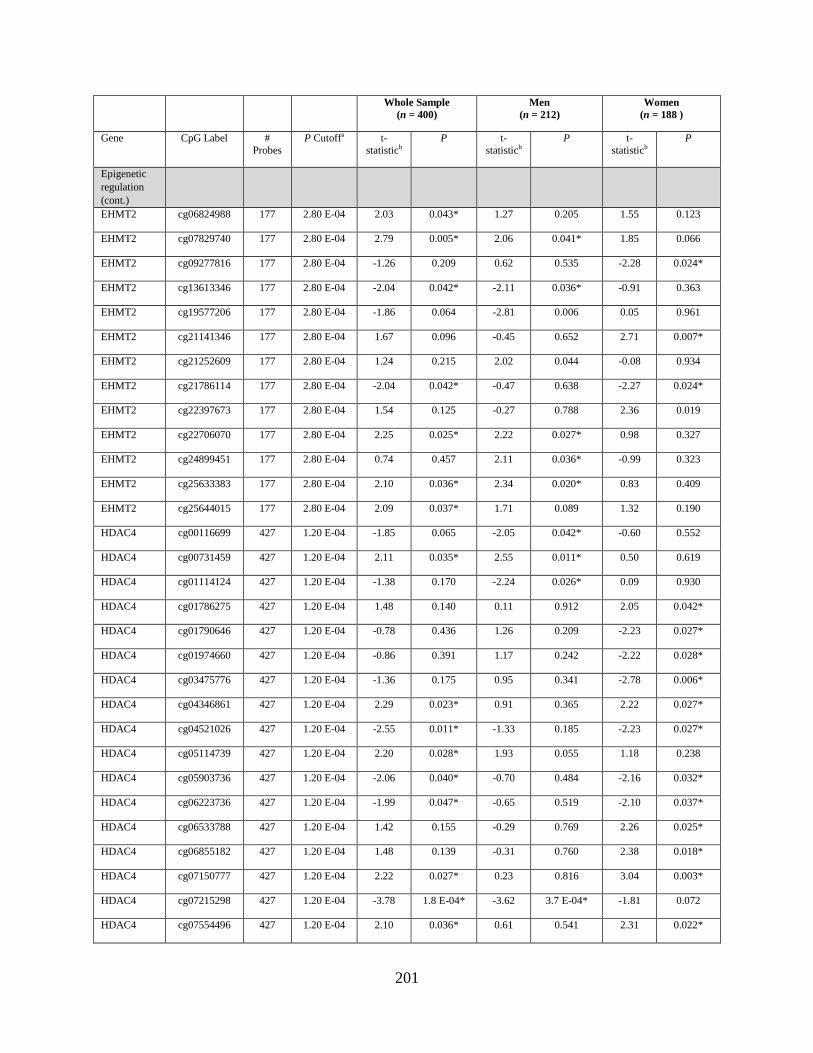
201
Whole Sample
(n = 400)
Men
(n = 212)
Women
(n = 188 )
Gene CpG Label #
Probes
P Cutoffa t-
statisticb
P t-
statisticb
P t-
statisticb
P
Epigenetic
regulation
(cont.)
EHMT2 cg06824988 177 2.80 E-04 2.03 0.043* 1.27 0.205 1.55 0.123
EHMT2 cg07829740 177 2.80 E-04 2.79 0.005* 2.06 0.041* 1.85 0.066
EHMT2 cg09277816 177 2.80 E-04 -1.26 0.209 0.62 0.535 -2.28 0.024*
EHMT2 cg13613346 177 2.80 E-04 -2.04 0.042* -2.11 0.036* -0.91 0.363
EHMT2 cg19577206 177 2.80 E-04 -1.86 0.064 -2.81 0.006 0.05 0.961
EHMT2 cg21141346 177 2.80 E-04 1.67 0.096 -0.45 0.652 2.71 0.007*
EHMT2 cg21252609 177 2.80 E-04 1.24 0.215 2.02 0.044 -0.08 0.934
EHMT2 cg21786114 177 2.80 E-04 -2.04 0.042* -0.47 0.638 -2.27 0.024*
EHMT2 cg22397673 177 2.80 E-04 1.54 0.125 -0.27 0.788 2.36 0.019
EHMT2 cg22706070 177 2.80 E-04 2.25 0.025* 2.22 0.027* 0.98 0.327
EHMT2 cg24899451 177 2.80 E-04 0.74 0.457 2.11 0.036* -0.99 0.323
EHMT2 cg25633383 177 2.80 E-04 2.10 0.036* 2.34 0.020* 0.83 0.409
EHMT2 cg25644015 177 2.80 E-04 2.09 0.037* 1.71 0.089 1.32 0.190
HDAC4 cg00116699 427 1.20 E-04 -1.85 0.065 -2.05 0.042* -0.60 0.552
HDAC4 cg00731459 427 1.20 E-04 2.11 0.035* 2.55 0.011* 0.50 0.619
HDAC4 cg01114124 427 1.20 E-04 -1.38 0.170 -2.24 0.026* 0.09 0.930
HDAC4 cg01786275 427 1.20 E-04 1.48 0.140 0.11 0.912 2.05 0.042*
HDAC4 cg01790646 427 1.20 E-04 -0.78 0.436 1.26 0.209 -2.23 0.027*
HDAC4 cg01974660 427 1.20 E-04 -0.86 0.391 1.17 0.242 -2.22 0.028*
HDAC4 cg03475776 427 1.20 E-04 -1.36 0.175 0.95 0.341 -2.78 0.006*
HDAC4 cg04346861 427 1.20 E-04 2.29 0.023* 0.91 0.365 2.22 0.027*
HDAC4 cg04521026 427 1.20 E-04 -2.55 0.011* -1.33 0.185 -2.23 0.027*
HDAC4 cg05114739 427 1.20 E-04 2.20 0.028* 1.93 0.055 1.18 0.238
HDAC4 cg05903736 427 1.20 E-04 -2.06 0.040* -0.70 0.484 -2.16 0.032*
HDAC4 cg06223736 427 1.20 E-04 -1.99 0.047* -0.65 0.519 -2.10 0.037*
HDAC4 cg06533788 427 1.20 E-04 1.42 0.155 -0.29 0.769 2.26 0.025*
HDAC4 cg06855182 427 1.20 E-04 1.48 0.139 -0.31 0.760 2.38 0.018*
HDAC4 cg07150777 427 1.20 E-04 2.22 0.027* 0.23 0.816 3.04 0.003*
HDAC4 cg07215298 427 1.20 E-04 -3.78 1.8 E-04* -3.62 3.7 E-04* -1.81 0.072
HDAC4 cg07554496 427 1.20 E-04 2.10 0.036* 0.61 0.541 2.31 0.022*
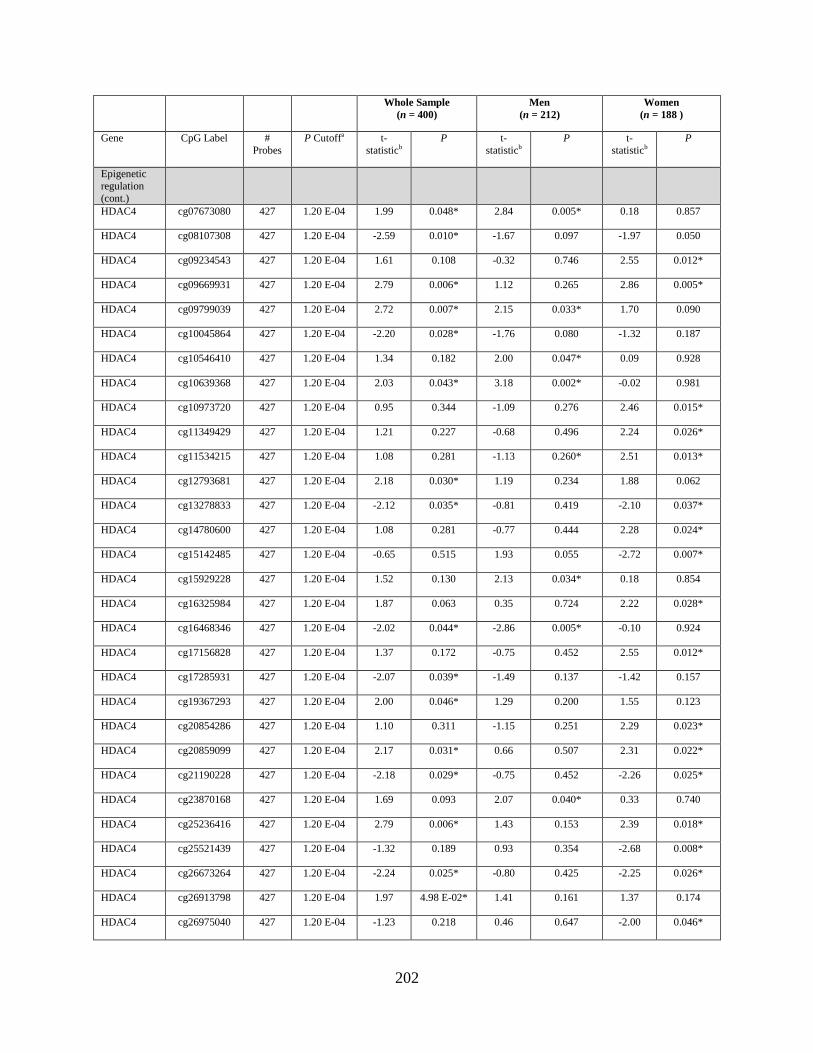
202
Whole Sample
(n = 400)
Men
(n = 212)
Women
(n = 188 )
Gene CpG Label #
Probes
P Cutoffa t-
statisticb
P t-
statisticb
P t-
statisticb
P
Epigenetic
regulation
(cont.)
HDAC4 cg07673080 427 1.20 E-04 1.99 0.048* 2.84 0.005* 0.18 0.857
HDAC4 cg08107308 427 1.20 E-04 -2.59 0.010* -1.67 0.097 -1.97 0.050
HDAC4 cg09234543 427 1.20 E-04 1.61 0.108 -0.32 0.746 2.55 0.012*
HDAC4 cg09669931 427 1.20 E-04 2.79 0.006* 1.12 0.265 2.86 0.005*
HDAC4 cg09799039 427 1.20 E-04 2.72 0.007* 2.15 0.033* 1.70 0.090
HDAC4 cg10045864 427 1.20 E-04 -2.20 0.028* -1.76 0.080 -1.32 0.187
HDAC4 cg10546410 427 1.20 E-04 1.34 0.182 2.00 0.047* 0.09 0.928
HDAC4 cg10639368 427 1.20 E-04 2.03 0.043* 3.18 0.002* -0.02 0.981
HDAC4 cg10973720 427 1.20 E-04 0.95 0.344 -1.09 0.276 2.46 0.015*
HDAC4 cg11349429 427 1.20 E-04 1.21 0.227 -0.68 0.496 2.24 0.026*
HDAC4 cg11534215 427 1.20 E-04 1.08 0.281 -1.13 0.260* 2.51 0.013*
HDAC4 cg12793681 427 1.20 E-04 2.18 0.030* 1.19 0.234 1.88 0.062
HDAC4 cg13278833 427 1.20 E-04 -2.12 0.035* -0.81 0.419 -2.10 0.037*
HDAC4 cg14780600 427 1.20 E-04 1.08 0.281 -0.77 0.444 2.28 0.024*
HDAC4 cg15142485 427 1.20 E-04 -0.65 0.515 1.93 0.055 -2.72 0.007*
HDAC4 cg15929228 427 1.20 E-04 1.52 0.130 2.13 0.034* 0.18 0.854
HDAC4 cg16325984 427 1.20 E-04 1.87 0.063 0.35 0.724 2.22 0.028*
HDAC4 cg16468346 427 1.20 E-04 -2.02 0.044* -2.86 0.005* -0.10 0.924
HDAC4 cg17156828 427 1.20 E-04 1.37 0.172 -0.75 0.452 2.55 0.012*
HDAC4 cg17285931 427 1.20 E-04 -2.07 0.039* -1.49 0.137 -1.42 0.157
HDAC4 cg19367293 427 1.20 E-04 2.00 0.046* 1.29 0.200 1.55 0.123
HDAC4 cg20854286 427 1.20 E-04 1.10 0.311 -1.15 0.251 2.29 0.023*
HDAC4 cg20859099 427 1.20 E-04 2.17 0.031* 0.66 0.507 2.31 0.022*
HDAC4 cg21190228 427 1.20 E-04 -2.18 0.029* -0.75 0.452 -2.26 0.025*
HDAC4 cg23870168 427 1.20 E-04 1.69 0.093 2.07 0.040* 0.33 0.740
HDAC4 cg25236416 427 1.20 E-04 2.79 0.006* 1.43 0.153 2.39 0.018*
HDAC4 cg25521439 427 1.20 E-04 -1.32 0.189 0.93 0.354 -2.68 0.008*
HDAC4 cg26673264 427 1.20 E-04 -2.24 0.025* -0.80 0.425 -2.25 0.026*
HDAC4 cg26913798 427 1.20 E-04 1.97 4.98 E-02* 1.41 0.161 1.37 0.174
HDAC4 cg26975040 427 1.20 E-04 -1.23 0.218 0.46 0.647 -2.00 0.046*

203
Whole Sample
(n = 400)
Men
(n = 212)
Women
(n = 188 )
Gene CpG Label #
Probes
P Cutoffa t-
statisticb
P t-
statisticb
P t-
statisticb
P
Epigenetic
regulation
(cont.)
HDAC4 cg27074582 427 1.20 E-04 -0.97 0.335 1.11 0.269 -2.45 0.015*
HDAC4 cg27144223 427 1.20 E-04 -1.87 0.063 -0.18 0.856 -2.53 0.012*
HDAC5 cg08531489 22 2.27 E-03 -1.52 0.128 0.45 0.650 -2.44 0.016
HDAC5 cg11049075 22 2.27 E-03 -0.90 0.368 0.87 0.384 -2.20 0.029*
HDAC5 cg25334369 22 2.27 E-03 1.37 0.171 2.03 0.043* -0.02 0.981
KDM2B cg04682193 84 6.00 E-04 -1.98 0.048* -0.98 0.329 -1.75 0.082
KDM2B cg09411874 84 6.00 E-04 1.98 0.048* 1.53 0.129 1.24 0.218
KDM2B cg10507156 84 6.00 E-04 1.58 0.116 -0.18 0.858 2.31 0.022*
KDM2B cg16655291 84 6.00 E-04 2.25 0.025* 1.28 0.204 1.75 0.082
KDM2B cg23877401 84 6.00 E-04 -2.57 0.011* -0.74 0.460 -2.79 0.006*
KDM2B cg26509318 84 6.00 E-04 -1.34 0.182 0.41 0.683 -2.07 0.040*
KDM2B cg26995224 84 6.00 E-04 2.17 0.031* 1.81 0.072 1.29 0.200
KDM4B cg02302043 118 4.20 E-04 -1.32 0.187 -2.15 0.033* 0.19 0.847
KDM4B cg03315649 118 4.20 E-04 -3.67 2.8 E-04* -2.14 0.033* -3.01 0.003*
KDM4B cg05877783 118 4.20 E-04 -1.07 0.284 -2.15 0.032* 0.64 0.520
KDM4B cg09527670 118 4.20 E-04 2.03 0.043* 1.62 0.107 1.28 0.203
KDM4B cg11645724 118 4.20 E-04 -2.08 0.038* -1.58 0.116 -1.35 0.178
KDM4B cg18362538 118 4.20 E-04 -1.22 0.224 -2.23 0.027* 0.48 0.634
KDM4B cg20347343 118 4.20 E-04 1.18 0.238 2.31 0.022* -0.53 0.595
KDM4B cg22960833 118 4.20 E-04 -1.10 0.270 -2.19 0.030* 0.52 0.604
MLL cg02871053 18 2.78 E-03 -2.00 0.047* -1.59 0.113 -1.22 0.226
NSD1 cg10821304 28 1.79 E-03 -1.80 0.073 -2.14 0.033 -0.46 0.649
NSD1 cg17493885 28 1.79 E-03 1.68 0.094 0.07 0.948 1.99 0.048*
NSD1 cg19731612 28 1.79 E-03 2.00 0.046* -0.31 0.754 2.55 0.012*
PRDM2 cg06604289 65 7.70 E-04 -2.14 0.033* -0.77 0.441 -2.22 0.028*
PRDM2 cg06991148 65 7.70 E-04 2.19 0.029* 0.35 0.725 2.82 0.005*
PRDM2 cg10444683 65 7.70 E-04 2.28 0.023* 0.69 0.492 2.38 0.018*
PRDM2 cg21605566 65 7.70 E-04 1.97 4.95 E-02* 1.42 0.158 1.36 0.175
TET1 cg05400741 30 1.67 E-03 1.53 0.126 -0.03 0.976 2.12 0.035*
TET1 cg12548760 30 1.67 E-03 1.57 0.118 0.20 0.840 1.99 0.048*
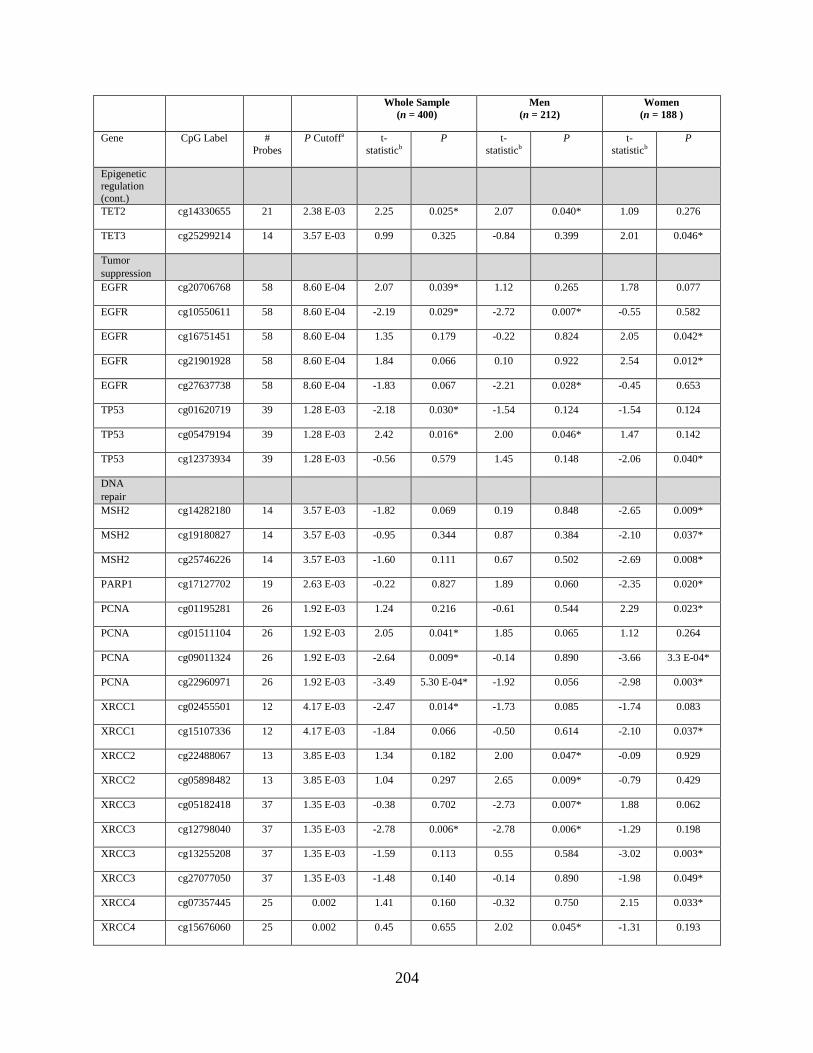
204
Whole Sample
(n = 400)
Men
(n = 212)
Women
(n = 188 )
Gene CpG Label #
Probes
P Cutoffa t-
statisticb
P t-
statisticb
P t-
statisticb
P
Epigenetic
regulation
(cont.)
TET2 cg14330655 21 2.38 E-03 2.25 0.025* 2.07 0.040* 1.09 0.276
TET3 cg25299214 14 3.57 E-03 0.99 0.325 -0.84 0.399 2.01 0.046*
Tumor
suppression
EGFR cg20706768 58 8.60 E-04 2.07 0.039* 1.12 0.265 1.78 0.077
EGFR cg10550611 58 8.60 E-04 -2.19 0.029* -2.72 0.007* -0.55 0.582
EGFR cg16751451 58 8.60 E-04 1.35 0.179 -0.22 0.824 2.05 0.042*
EGFR cg21901928 58 8.60 E-04 1.84 0.066 0.10 0.922 2.54 0.012*
EGFR cg27637738 58 8.60 E-04 -1.83 0.067 -2.21 0.028* -0.45 0.653
TP53 cg01620719 39 1.28 E-03 -2.18 0.030* -1.54 0.124 -1.54 0.124
TP53 cg05479194 39 1.28 E-03 2.42 0.016* 2.00 0.046* 1.47 0.142
TP53 cg12373934 39 1.28 E-03 -0.56 0.579 1.45 0.148 -2.06 0.040*
DNA
repair
MSH2 cg14282180 14 3.57 E-03 -1.82 0.069 0.19 0.848 -2.65 0.009*
MSH2 cg19180827 14 3.57 E-03 -0.95 0.344 0.87 0.384 -2.10 0.037*
MSH2 cg25746226 14 3.57 E-03 -1.60 0.111 0.67 0.502 -2.69 0.008*
PARP1 cg17127702 19 2.63 E-03 -0.22 0.827 1.89 0.060 -2.35 0.020*
PCNA cg01195281 26 1.92 E-03 1.24 0.216 -0.61 0.544 2.29 0.023*
PCNA cg01511104 26 1.92 E-03 2.05 0.041* 1.85 0.065 1.12 0.264
PCNA cg09011324 26 1.92 E-03 -2.64 0.009* -0.14 0.890 -3.66 3.3 E-04*
PCNA cg22960971 26 1.92 E-03 -3.49 5.30 E-04* -1.92 0.056 -2.98 0.003*
XRCC1 cg02455501 12 4.17 E-03 -2.47 0.014* -1.73 0.085 -1.74 0.083
XRCC1 cg15107336 12 4.17 E-03 -1.84 0.066 -0.50 0.614 -2.10 0.037*
XRCC2 cg22488067 13 3.85 E-03 1.34 0.182 2.00 0.047* -0.09 0.929
XRCC2 cg05898482 13 3.85 E-03 1.04 0.297 2.65 0.009* -0.79 0.429
XRCC3 cg05182418 37 1.35 E-03 -0.38 0.702 -2.73 0.007* 1.88 0.062
XRCC3 cg12798040 37 1.35 E-03 -2.78 0.006* -2.78 0.006* -1.29 0.198
XRCC3 cg13255208 37 1.35 E-03 -1.59 0.113 0.55 0.584 -3.02 0.003*
XRCC3 cg27077050 37 1.35 E-03 -1.48 0.140 -0.14 0.890 -1.98 0.049*
XRCC4 cg07357445 25 0.002 1.41 0.160 -0.32 0.750 2.15 0.033*
XRCC4 cg15676060 25 0.002 0.45 0.655 2.02 0.045* -1.31 0.193
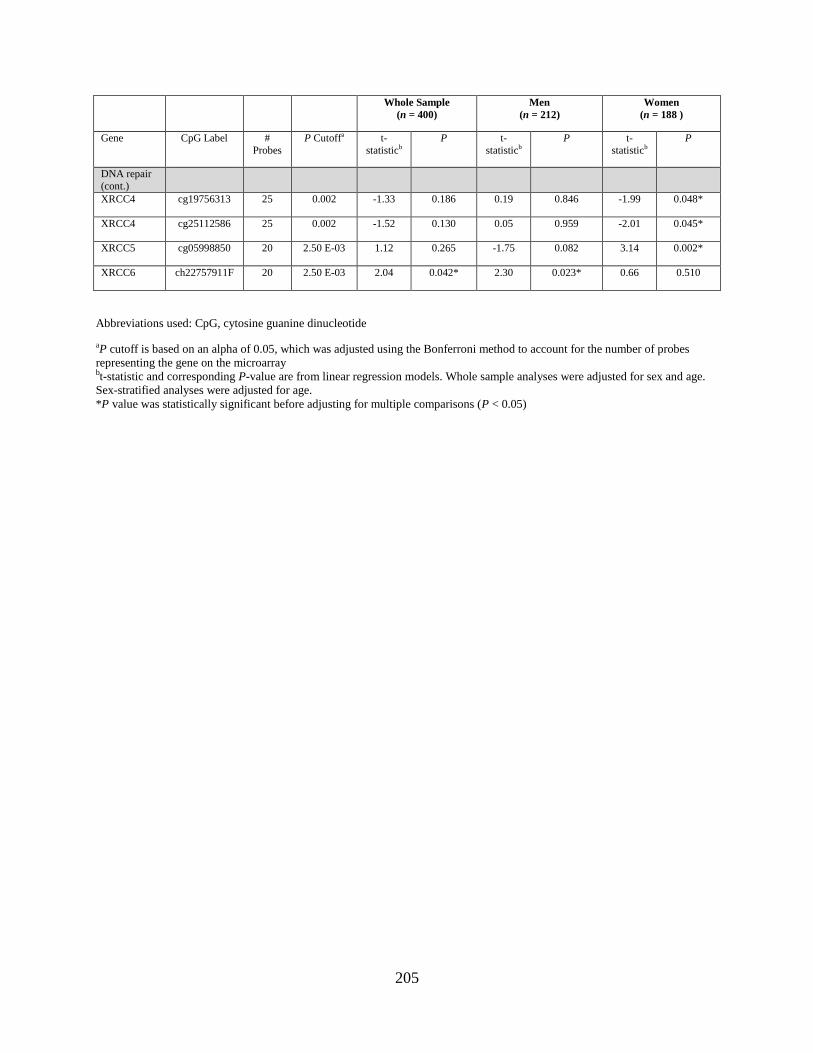
205
Whole Sample
(n = 400)
Men
(n = 212)
Women
(n = 188 )
Gene CpG Label #
Probes
P Cutoffa t-
statisticb
P t-
statisticb
P t-
statisticb
P
DNA repair
(cont.)
XRCC4 cg19756313 25 0.002 -1.33 0.186 0.19 0.846 -1.99 0.048*
XRCC4 cg25112586 25 0.002 -1.52 0.130 0.05 0.959 -2.01 0.045*
XRCC5 cg05998850 20 2.50 E-03 1.12 0.265 -1.75 0.082 3.14 0.002*
XRCC6 ch22757911F 20 2.50 E-03 2.04 0.042* 2.30 0.023* 0.66 0.510
Abbreviations used: CpG, cytosine guanine dinucleotide
aP cutoff is based on an alpha of 0.05, which was adjusted using the Bonferroni method to account for the number of probes
representing the gene on the microarray bt-statistic and corresponding P-value are from linear regression models. Whole sample analyses were adjusted for sex and age.
Sex-stratified analyses were adjusted for age.
*P value was statistically significant before adjusting for multiple comparisons (P < 0.05)
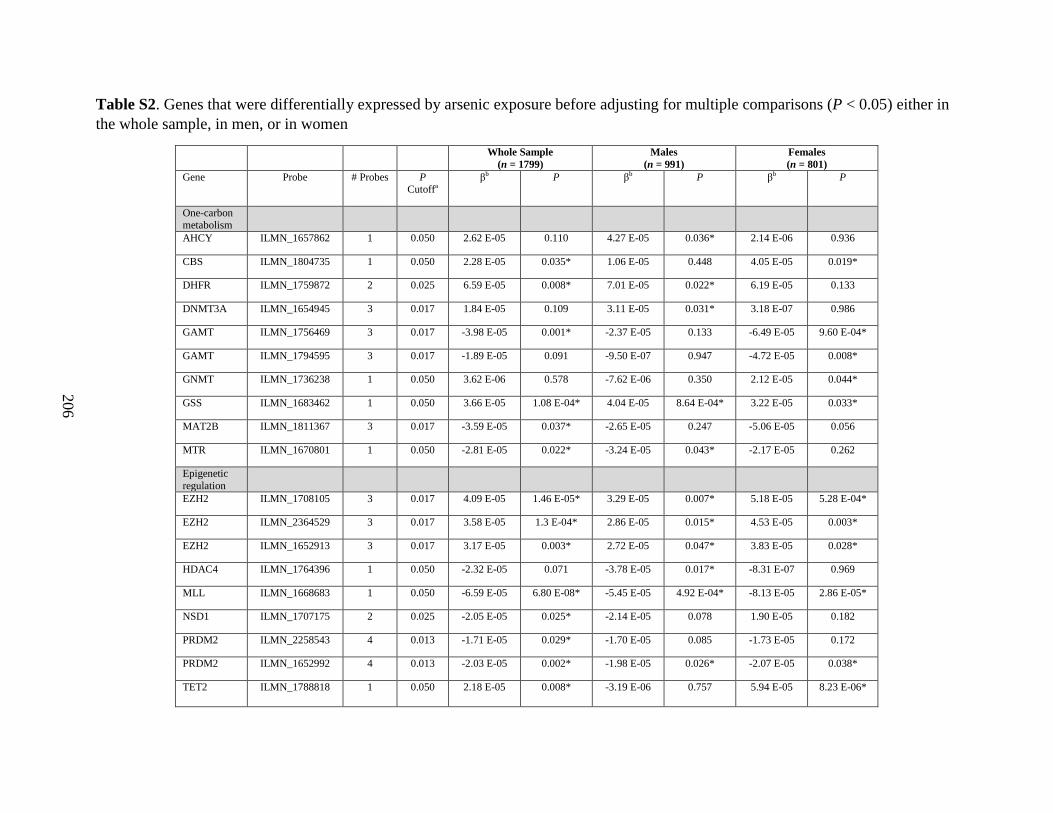
206
Table S2. Genes that were differentially expressed by arsenic exposure before adjusting for multiple comparisons (P < 0.05) either in
the whole sample, in men, or in women
Whole Sample
(n = 1799)
Males
(n = 991)
Females
(n = 801)
Gene Probe # Probes P Cutoffa
βb P βb P βb P
One-carbon metabolism
AHCY ILMN_1657862 1 0.050 2.62 E-05 0.110 4.27 E-05 0.036* 2.14 E-06 0.936
CBS ILMN_1804735 1 0.050 2.28 E-05 0.035* 1.06 E-05 0.448 4.05 E-05 0.019*
DHFR ILMN_1759872 2 0.025 6.59 E-05 0.008* 7.01 E-05 0.022* 6.19 E-05 0.133
DNMT3A ILMN_1654945 3 0.017 1.84 E-05 0.109 3.11 E-05 0.031* 3.18 E-07 0.986
GAMT ILMN_1756469 3 0.017 -3.98 E-05 0.001* -2.37 E-05 0.133 -6.49 E-05 9.60 E-04*
GAMT ILMN_1794595 3 0.017 -1.89 E-05 0.091 -9.50 E-07 0.947 -4.72 E-05 0.008*
GNMT ILMN_1736238 1 0.050 3.62 E-06 0.578 -7.62 E-06 0.350 2.12 E-05 0.044*
GSS ILMN_1683462 1 0.050 3.66 E-05 1.08 E-04* 4.04 E-05 8.64 E-04* 3.22 E-05 0.033*
MAT2B ILMN_1811367 3 0.017 -3.59 E-05 0.037* -2.65 E-05 0.247 -5.06 E-05 0.056
MTR ILMN_1670801 1 0.050 -2.81 E-05 0.022* -3.24 E-05 0.043* -2.17 E-05 0.262
Epigenetic
regulation
EZH2 ILMN_1708105 3 0.017 4.09 E-05 1.46 E-05* 3.29 E-05 0.007* 5.18 E-05 5.28 E-04*
EZH2 ILMN_2364529 3 0.017 3.58 E-05 1.3 E-04* 2.86 E-05 0.015* 4.53 E-05 0.003*
EZH2 ILMN_1652913 3 0.017 3.17 E-05 0.003* 2.72 E-05 0.047* 3.83 E-05 0.028*
HDAC4 ILMN_1764396 1 0.050 -2.32 E-05 0.071 -3.78 E-05 0.017* -8.31 E-07 0.969
MLL ILMN_1668683 1 0.050 -6.59 E-05 6.80 E-08* -5.45 E-05 4.92 E-04* -8.13 E-05 2.86 E-05*
NSD1 ILMN_1707175 2 0.025 -2.05 E-05 0.025* -2.14 E-05 0.078 1.90 E-05 0.182
PRDM2 ILMN_2258543 4 0.013 -1.71 E-05 0.029* -1.70 E-05 0.085 -1.73 E-05 0.172
PRDM2 ILMN_1652992 4 0.013 -2.03 E-05 0.002* -1.98 E-05 0.026* -2.07 E-05 0.038*
TET2 ILMN_1788818 1 0.050 2.18 E-05 0.008* -3.19 E-06 0.757 5.94 E-05 8.23 E-06*
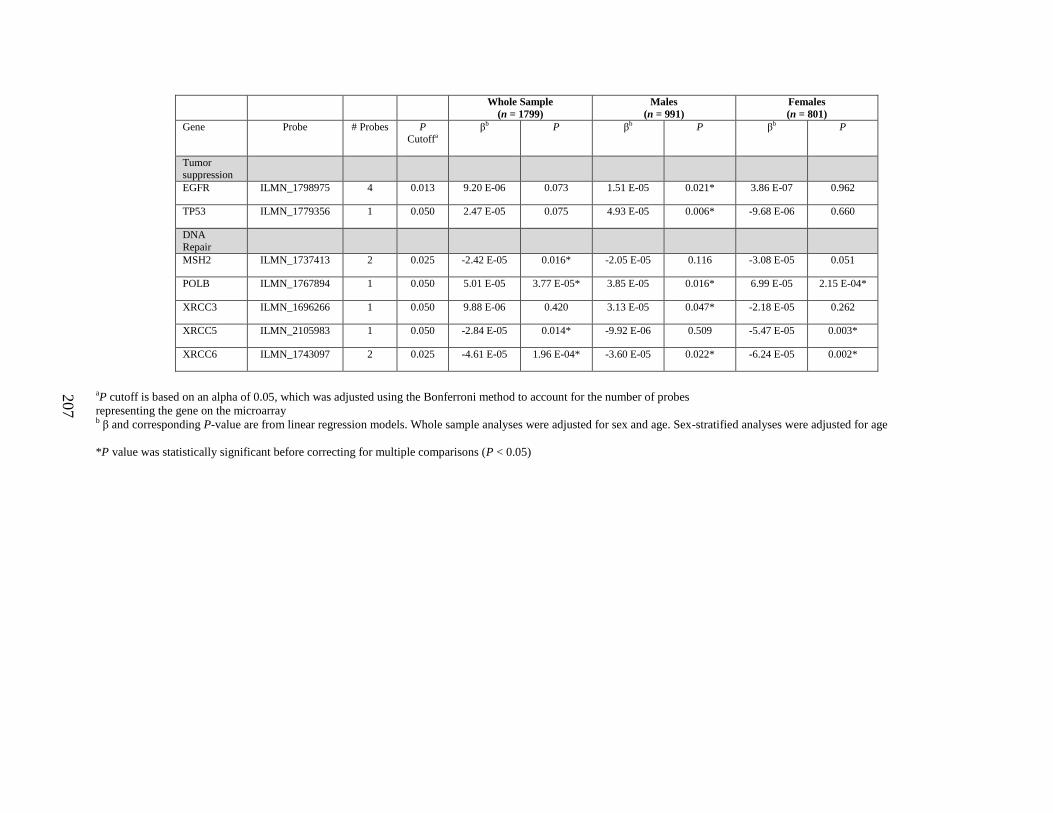
207
Whole Sample
(n = 1799)
Males
(n = 991)
Females
(n = 801)
Gene Probe # Probes P Cutoffa
βb P βb P βb P
Tumor suppression
EGFR ILMN_1798975 4 0.013 9.20 E-06 0.073 1.51 E-05 0.021* 3.86 E-07 0.962
TP53 ILMN_1779356 1 0.050 2.47 E-05 0.075 4.93 E-05 0.006* -9.68 E-06 0.660
DNA
Repair
MSH2 ILMN_1737413 2 0.025 -2.42 E-05 0.016* -2.05 E-05 0.116 -3.08 E-05 0.051
POLB ILMN_1767894 1 0.050 5.01 E-05 3.77 E-05* 3.85 E-05 0.016* 6.99 E-05 2.15 E-04*
XRCC3 ILMN_1696266 1 0.050 9.88 E-06 0.420 3.13 E-05 0.047* -2.18 E-05 0.262
XRCC5 ILMN_2105983 1 0.050 -2.84 E-05 0.014* -9.92 E-06 0.509 -5.47 E-05 0.003*
XRCC6 ILMN_1743097 2 0.025 -4.61 E-05 1.96 E-04* -3.60 E-05 0.022* -6.24 E-05 0.002*
aP cutoff is based on an alpha of 0.05, which was adjusted using the Bonferroni method to account for the number of probes
representing the gene on the microarray b β and corresponding P-value are from linear regression models. Whole sample analyses were adjusted for sex and age. Sex-stratified analyses were adjusted for age
*P value was statistically significant before correcting for multiple comparisons (P < 0.05)
208
CHAPTER SEVEN
Folic acid supplementation and sex-specific associations between one-carbon metabolism
indices and histone modifications in arsenic-exposed Bangladeshi adults
Caitlin G. Howe1, Xinhua Liu
2, Megan N. Hall
3, Vesna Ilievski
1, Marie A. Caudill
4, Olga
Malysheva4, Angela M. Lomax-Luu
1, Faruque Parvez
1, Abu B. Siddique
5, Hasan Shahriar
5,
Mohammad N. Uddin5, Tariqul Islam
5, Joseph H. Graziano
1, Max Costa
6, Mary V. Gamble
1
Affiliations: Departments of 1Environmental Health Sciences,
2Biostatistics,
3Epidemiology,
Mailman School of Public Health, New York, New York; 4Division of Nutritional Sciences,
Cornell University, Ithaca, New York; 5Columbia University Arsenic Project in Bangladesh,
Dhaka, Bangladesh; 6Department of Environmental Medicine, NYU Langone Medical Center,
New York University, New York, New York
209
ABSTRACT:
Background: Posttranslational histone modifications (PTHMs) are altered by arsenic, an
environmental carcinogen. PTHMs are also influenced by nutritional methyl donors involved in
one-carbon metabolism (OCM), which may protect against epigenetic dysregulation.
Methods: We measured global levels of three PTHMs, which are dysregulated in cancers
(H3K36me2, H3K36me3, H3K79me2), in peripheral blood mononuclear cells (PBMCs)
collected from 324 participants enrolled in the Folic Acid and Creatine Trial, a randomized trial
in arsenic-exposed Bangladeshi adults. Sex-specific associations between blood OCM indices
(folate, cobalamin, choline, betaine, homocysteine) and PTHMs were examined at baseline using
regression models. We also evaluated the effects of FA supplementation (400 µg/day for 12
weeks), compared with placebo, on PTHMs.
Results: Associations between choline and H3K36me2 differed by sex (Pinteraction < 0.01). This
was also true for associations between cobalamin and H3K79me2 (Pinteraction < 0.05). Among
men, plasma choline was positively associated with H3K36me2 (P < 0.01), and among women,
plasma cobalamin was positively associated with H3K79me2 (P < 0.01). FA supplementation
did not alter any of the PTHMs examined (P > 0.05).
Conclusion: OCM indices may influence PTHMs in a sex-dependent manner, and FA
supplementation, at this dose and duration, does not alter PTHMs in PBMCs.
Impact: This is the first study to examine the influences of OCM indices on PTHMs in a
population that may have increased susceptibility to cancer development due to widespread
exposure to arsenic-contaminated drinking water and a high prevalence of
hyperhomocysteinemia.
210
INTRODUCTION:
More than 150 different methyltransferases, including DNA methyltransferases and
lysine histone methyltransferases, depend on methyl donations from S-adenosylmethionine
(SAM) [1]. Synthesis of SAM via one-carbon metabolism (OCM) involves the remethylation of
homocysteine (Hcys) to methionine, which requires nutritional methyl donors and cofactors,
such as folate, cobalamin, choline, and betaine. There are important sex differences in the OCM
pathway. For example, plasma Hcys concentrations are higher in men, and there is evidence that
this may be due to both higher methyl demand for creatine synthesis as a result of greater muscle
mass [2] and also lower remethylation and transmethylation rates among men [3]. Circulating
concentrations of folate, cobalamin, and choline also differ by sex [4, 5].
Hyperhomocysteinemia (HHcys) and insufficient intake of nutritional methyl donors
have been implicated in the development of human cancers [6]. Studies in rodents have
demonstrated that this may be mediated by alterations in epigenetic modifications [7, 8],
including PTHMs [9, 10]. Nutritional methyl donors have also been shown to modify, or buffer
against, epigenetic dysregulation caused by environmental toxicants. For example, mice exposed
in utero to the endocrine disruptor bisphenol A have reduced levels of DNA methylation in
several tissues, but this phenotype can be prevented with maternal supplementation with folic
acid (FA), cobalamin, choline, and betaine [11]. Similarly, Bangladeshi adults exposed
chronically to arsenic, a human carcinogen, have higher global levels of DNA methylation in
leukocytes, but only in those that are folate sufficient (plasma folate >9 nmol/L) [12]; this may
be a protective compensatory mechanism, as leukocyte hypomethylation and folate deficiency
are both risk factors for arsenic-induced skin lesions [13]. Concurrent exposure to arsenic and a
methyl deficient diet also alters global DNA methylation in the mouse liver in a sex-dependent

211
manner [14]. We, and others, have previously observed sex-specific effects of arsenic exposure
on global levels of DNA methylation and PTHMs in human populations [15-18]. However, the
relationships between OCM indices and PTHMs, and potential differences by sex, have not been
investigated.
We therefore examined sex-specific associations between OCM indices and global levels
of PTHMs in a population in Bangladesh that may have increased susceptibility to cancer
development due to a high prevalence of HHcys and widespread exposure to arsenic-
contaminated drinking water. We also examined the effect of folic acid (FA) supplementation
(400 µg/day for 12 weeks) on PTHMs. We selected three PTHMs (histone H3 lysine 36 di- and
tri-methylation (H3K36me2 and H3K36me3, respectively), and histone H3 lysine 79 di-
methylation (H3K79me2)), which are dysregulated in several types of cancer [19-24] and are
altered by arsenic and/or nutritional methyl donors in experimental models [25-28]. PTHMs
were measured in peripheral blood mononuclear cells (PBMCs) collected from participants in the
Folic Acid and Creatine Trial (FACT). FACT is a randomized clinical trial that was originally
designed to examine whether FA and/or creatine supplementation can be used as therapeutic
approaches to reduce blood arsenic concentrations; the primary findings of this trial have been
published [29].
STUDY PARTICIPANTS AND METHODS:
Region and Participants
Participants for the FACT study were recruited from the Health Effects of Arsenic
Longitudinal Study, a prospective cohort study that initially recruited 11,746 adults living in a 25
km2 region in Araihazar, Bangladesh [30]. FACT is a double-blind randomized, placebo-
212
controlled trial [29]. FACT participants were between the ages of 20 and 65 and had been
drinking from household wells with water arsenic ≥50 μg/L, the Bangladesh standard for safe
drinking water. Exclusion criteria included: pregnancy, nutritional supplement use, and known
health problems, including cancers. Informed consent was obtained by Bangladeshi field staff
physicians, and this study was approved by the Institutional Review Board of Columbia
University Medical Center and the Bangladesh Medical Research Council.
Study Design
As described previously [29], FACT participants (n = 622) were randomized to one of
five treatment arms: placebo (n = 104), 400 µg FA/day (n = 156), 800 µg FA/day (n = 154), 3 g
creatine/day (n = 104), and 3 g creatine + 400 µg FA/day (n = 104) (Supplemental Material,
Figure S1). Due to ethical considerations, all participants received arsenic-removal water filters
(READ-F filter, Brota Services International, Bangladesh) at baseline to be used during the 24
week study period and thereafter.
Whole blood samples were collected from participants at baseline, week 12, and week
24; sample collection and handling have been described previously [15, 29]. For the current
study, we used histones isolated from baseline (i.e., pre-intervention)-collected PBMCs from a
subset of participants with all necessary biological samples and complete data for relevant
covariates (n = 324), as well as available PBMCs collected at week 12 from participants in the
placebo (n = 60) and 400 µg FA (n = 107) treatment arms (Supplemental Material, Figure S1).
The 400 µg FA dose was selected based on the U.S. recommended dietary allowance for adults
[31].
213
Folate and Cobalamin
Plasma folate and cobalamin were measured by radio-protein-binding assay
(SimulTRAC-SNB, MP Biomedicals). The intra- and inter-assay CVs were 5% and 13%,
respectively, for folate and 6% and 17%, respectively, for cobalamin. Folate in whole blood
hemolysate was also measured by radio-protein-binding assay (SimulTRAC-S, MP Biomedicals)
in participants from the placebo, 400 µg FA/day, and 800 µg FA/day treatment arms, as
described previously [29]; red blood cell (RBC) folate was calculated by dividing these measures
by [%hematocrit/100]. The intra- and inter-assay CVs for RBC folate were 4% and 9%,
respectively.
Plasma Choline and Betaine
Plasma choline and betaine concentrations were measured by LC-MS/MS, using the
method of Holm et al. [32], with some modifications, as described previously [33]. The intra-
and inter-assay CVs for plasma choline were 2.2% and 5.8%, respectively, and were 2.5% and
5.6%, respectively, for plasma betaine.
Plasma Homocysteine
Plasma total homocysteine (Hcys) was measured by HPLC with fluorescence detection,
based on a method described by Pfeiffer et al. [34]. The intra- and inter-assay CVs were 5% and
7%, respectively.
Blood Arsenic and Selenium
Total blood arsenic and selenium (bSe) concentrations were measured using a Perkin-
Elmer Elan DRC II ICP-MS equipped with an AS10+ autosampler based on a previously
214
described method [35]. The intra- and inter-assay CVs for arsenic were 2.7% and 5.7%,
respectively, and were 1.5% and 4.6%, respectively, for bSe.
Urinary Creatinine
Urinary creatinine (uCr) was measured by a method based on the Jaffe reaction [36], and
the intra- and inter-assay CVs were 1.3% and 2.9%, respectively
Histone Isolation
Histones were isolated from PBMCs by acid extraction, as described previously [15, 16].
Isolated histones were diluted in 4 M urea, and aliquots were stored at -80ºC.
H3K36me2, H3K36me3, H3K79me2
Although we previously identified a specific cleavage product of histone H3 which
interferes with the measurement of downstream PTHMs, H3K36me2, H3K36me3, and
H3K79me2 are not impacted by H3 cleavage [37]. These PTHMs were measured by sandwich
ELISA [16]. The intra- and inter-assay CVs, respectively, for each ELISA method were as
follows: H3K36me2: 3.4% and 9.6%, H3K36me3: 4.9% and 11.9%, and H3K79me2: 7.1% and
7.0%. Since there were limited histone aliquots for the final assays, and since samples with poor
reproducibility were excluded, final sample sizes for H3K36me2 (n = 318) and H3K36me3 (n =
306) were smaller than the final sample size for H3K79me2 (n = 321).
Statistical methods
Differences in continuous and categorical variables between men and women and also
between participants with and without PTHM measures and with and without RBC folate
measures were assessed using Wilcoxon rank-sum and Chi-square tests, respectively.

215
Transformations were applied to variables with skewed distributions to stabilize variances for
parametric model assumptions and to reduce the influence of extreme values. Natural log-
transformations were applied to H3K36me3, H3K79me2, bSe, RBC folate, and plasma folate,
choline, betaine, cobalamin, and Hcys. An inverse transformation (1/x) was applied to
H3K36me2.
Due to the distribution of H3K36me2, a generalized linear model with an inverse-link
function (which effectively back-transforms the inverse-transformed H3K36me2 variable) was
used to examine associations between the log-transformed OCM indices and the harmonic mean
of H3K36me2. Linear models were used to examine associations between log-transformed OCM
indices and log(H3K36me3) and log(H3K79me2). Plasma folate, choline, betaine, cobalamin,
and Hcys were included simultaneously in models. Alternative models replacing plasma folate
with RBC folate were applied to the subset of participants with RBC folate measures (n = 250).
Models were run separately by sex, and the Wald test was used to determine if associations
between each OCM variable and PTHM differed by sex. Models were additionally adjusted for
hypothesized confounders of the relationships between OCM indices and PTHMs, and any
variables that were associated with PTHMs in bivariate analyses. Age, education, TV ownership,
log(bSe), and cigarette smoking (for analyses of H3K36me3 and H3K79me2 in men) were
included as covariates in final models. All covariates were included as continuous variables,
except for TV ownership, cigarette smoking status, and education; the latter was included as a
binary variable (education >5 y vs. ≤5 y) because many participants had 0 or few years of
education. In sensitivity analyses, we also examined models that 1) were additionally adjusted
for log(BMI) and log-transformed arsenic measures and 2) evaluated each of the OCM indices
individually. The difference in the within-person change for each PTHM between the two
216
treatment arms (400 µg FA vs. placebo) was examined using the Wilcoxon rank-sum test. In
exploratory analyses, we also examined potential differences in the effects of FA on PTHMs
separately by sex. The significance level was set at P < 0.05 for all statistical tests. Analyses
were conducted using SAS (version 9.3, Cary, NC) and R (version 3.1.3).
RESULTS:
General Characteristics, Nutritional Indices, and PTHMs
General characteristics of the study participants have been described previously [29], and
are presented separately by sex in Supplemental Material, Table S1. Participants were between
24 and 54 years old with a median BMI of 19.2 kg/m2. Median plasma choline and betaine
concentrations were 11.0 and 42.8 µmol/L, respectively. Approximately, 23% of participants
were folate deficient (plasma folate <9 nmol/L [38]) and 24% were cobalamin deficient (plasma
cobalamin <151 pmol/L [38]). The prevalence of HHcys (plasma Hcys ≥13 µmol/L) was 40.7%.
Compared with women, men in the study sample were generally older; were less likely to own a
TV (an indicator of socioeconomic status in this population); had lower BMIs; had higher bAs,
choline, betaine, and Hcys concentrations; and were more likely to be folate deficient and to
have HHcys. Men were also much more likely to have ever smoked cigarettes. The prevalence of
ever smoking was 56.2% in men compared with 1.2% in women. Baseline measures of PTHMs
did not differ significantly between men and women.
Study participants with PTHM measures were generally comparable to the rest of the
FACT participants, but were slightly older, had lower plasma folate, betaine, and choline
concentrations, and were less likely to own TVs (Supplemental Material, Table S2). The
subset of participants with RBC folate measures had lower plasma cobalamin concentrations and
217
uCr concentrations and were more likely to own TVs, but were otherwise comparable to FACT
participants who did not have RBC folate measures (Supplemental Material, Table S3).
Sex-Specific Associations between OCM Indices and PTHMs
Sex-specific associations between OCM indices and PTHMs are shown in Figure 1.
Alternative models, which replaced plasma folate with RBC folate, are shown in Supplemental
Material, Figure S2. Plasma betaine was excluded from final models as it was not associated
with any of the PTHMs in men or women after adjusting for plasma choline, and its addition to
models did not alter coefficients for any of the other OCM indices.
H3K36me2
Log(RBC folate) was negatively and significantly associated with H3K36me2 among
men (β: -0.23; 95% CI: -0.41, -0.05; P = 0.01). There was a similar trend among women (β: -
0.08; 95% CI: -0.21, 0.04; P = 0.19). Neither log(plasma folate) nor log(cobalamin) was
associated with H3K36me2 in men or women. Associations between log(choline) and
H3K36me2 differed by sex (P < 0.01). Log(choline) was positively associated with H3K36me2
in men (β: 0.39; 95% CI: 0.11, 0.66; P < 0.01), but not women (β: -0.11; 95% CI: -0.36, 0.14; P
= 0.40). There was also a negative association between log(Hcys) and H3K36me2 among men
(β: -0.19; 95% CI: -0.30, -0.07; P < 0.01), but not women (β: 0.00; 95% CI: -0.16, 0.15; P =
0.97).
H3K36me3
Similar to the findings for H3K36me2, log(RBC folate) was inversely associated with
log(H3K36me3) in men (β: -0.19; 95% CI: -0.38, 0.01; P = 0.06). Log(plasma folate) was not
significantly associated with log(H3K36me3) in either men or women. Among women, both
218
log(cobalamin) (β: 0.11; 95% CI: 0.00, 0.22; P = 0.05) and log(choline) (β: 0.35; 95% CI: 0.08,
0.62; P = 0.01) were positively associated with log(H3K36me3). There was a similar trend for
log(choline) and log(H3K36me3) among men (β: 0.17; 95% CI: -0.09, 0.43; P = 0.21).
Log(Hcys) was inversely associated with log(H3K36me3) in men (β: -0.15; 95% CI: -0.29, -
0.02; P = 0.03), but this was not significant among women.
H3K79me2
Although not significant, both log(RBC folate) (β: -0.18; 95% CI: -0.38, 0.02; P = 0.08)
and log(plasma folate) (β: 0.11; 95% CI: -0.28, 0.05; P = 0.18) were inversely related to
log(H3K79me2) among women. There was a similar trend for log(RBC folate) among men (β: -
0.17; 95% CI: -0.43, 0.08; P = 0.18). Additionally, both log(choline) (β: 0.28; 95% CI: -0.06,
0.62; P = 0.10) and log(cobalamin) (β: 0.23; 95% CI: 0.09, 0.37; P < 0.01) were positively
associated with log(H3K79me2) in women, but not men, and the associations between
log(cobalamin) and log(H3K79me2) differed by sex (P < 0.05). Log(Hcys) concentrations were
not significantly associated with log(H3K79me2) in either men or women.
Sensitivity Analyses
Associations between OCM indices and PTHMs were very similar after additionally
adjusting for BMI (Supplemental Material, Table S4) and measures of arsenic exposure (data
not shown). Associations were also similar when OCM indices were examined individually,
rather than in the same model, although some of the effects were slightly attenuated
(Supplemental Material, Table S5).
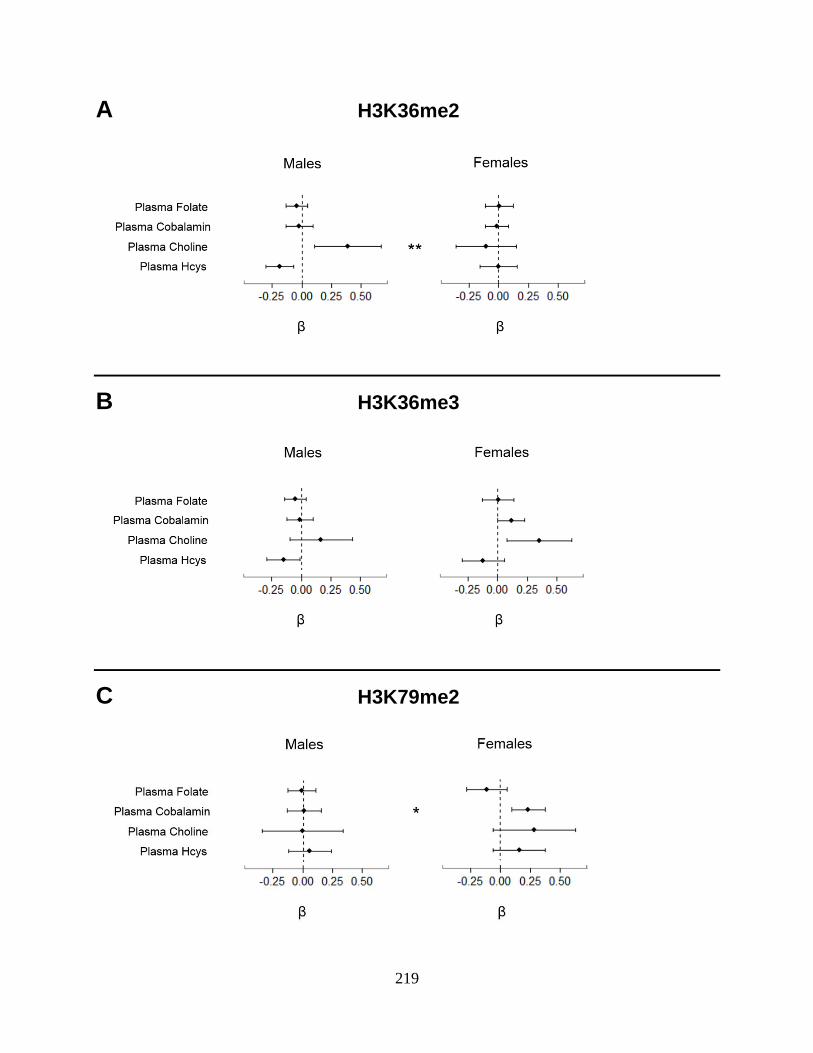
219
A H3K36me2
B H3K36me3
C H3K79me2
220
Figure 1. Sex-specific associations between OCM indices and PTHMs in FACT participants
Estimated regression coefficients and 95% confidence intervals for associations between each
OCM index and (A) H3K36me2, (B) H3K36me3, and (C) H3K79me2 are shown separately by
sex. The dashed line represents the null (β = 0). Associations with confidence intervals that do
not cross the null are statistically significant (P < 0.05). Asterisks (*P < 0.05, **P < 0.01)
indicate sex differences with P-values calculated from the Wald test. OCM indices were natural
log-transformed and were included simultaneously in models. Models were adjusted for age,
education, TV ownership, and log(bSe). Analyses for H3K36me3 and H3K79me2 in men were
additionally adjusted for cigarette smoking status. H3K36me2 was inverse-transformed and was
modeled using a generalized linear model with an inverse-link function. H3K36me3 and
H3K79me2 were natural log transformed and were modeled using linear models. Sample sizes
for the main analyses were as follows H3K36me2: n = 159 for men, n = 159 for women;
H3K36me3: n = 154 for men, n = 152 for women; H3K79me2: n = 162 for men, n = 159 for
women. Abbreviations used: bSe, blood selenium; FACT, Folic Acid and Creatine Trial;
H3K36me2, di-methylation at lysine 36 of histone H3; H3K36me3, tri-methylation at lysine 36
of histone H3; H3K79me2, di-methylation at lysine 79 of histone H3; Hcys, homocysteine;
OCM, one-carbon metabolism; PTHM, posttranslational histone modification
Effect of FA Supplementation on PTHMs
Baseline characteristics of participants with PTHM measures were generally comparable
between the 400 µg FA and placebo treatment arms, except for uCr, which was significantly
higher in the 400 µg FA group (Supplemental Material, Table S6). However, uCr was not
associated with any of the PTHMs at baseline, nor was it associated with the intra-person change
in any of the PTHMs.
Compared with placebo, FA supplementation (400 µg/day for 12 weeks) did not alter any
of the PTHMs (Table 1). In sex-stratified analyses, there was also no effect of FA compared
with placebo on any of the PTHMs (Table 1).
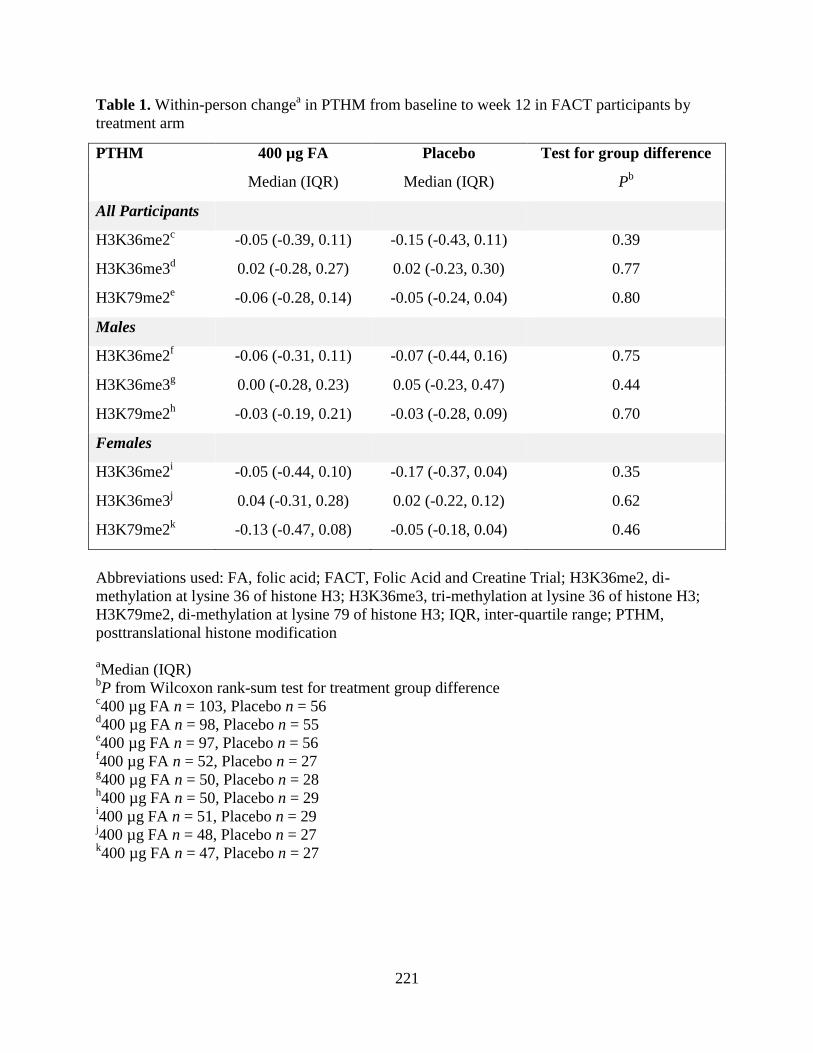
221
Table 1. Within-person changea in PTHM from baseline to week 12 in FACT participants by
treatment arm
PTHM 400 µg FA Placebo Test for group difference
Median (IQR) Median (IQR) Pb
All Participants
H3K36me2c -0.05 (-0.39, 0.11) -0.15 (-0.43, 0.11) 0.39
H3K36me3d 0.02 (-0.28, 0.27) 0.02 (-0.23, 0.30) 0.77
H3K79me2e -0.06 (-0.28, 0.14) -0.05 (-0.24, 0.04) 0.80
Males
H3K36me2f -0.06 (-0.31, 0.11) -0.07 (-0.44, 0.16) 0.75
H3K36me3g 0.00 (-0.28, 0.23) 0.05 (-0.23, 0.47) 0.44
H3K79me2h -0.03 (-0.19, 0.21) -0.03 (-0.28, 0.09) 0.70
Females
H3K36me2i -0.05 (-0.44, 0.10) -0.17 (-0.37, 0.04) 0.35
H3K36me3j 0.04 (-0.31, 0.28) 0.02 (-0.22, 0.12) 0.62
H3K79me2k -0.13 (-0.47, 0.08) -0.05 (-0.18, 0.04) 0.46
Abbreviations used: FA, folic acid; FACT, Folic Acid and Creatine Trial; H3K36me2, di-
methylation at lysine 36 of histone H3; H3K36me3, tri-methylation at lysine 36 of histone H3;
H3K79me2, di-methylation at lysine 79 of histone H3; IQR, inter-quartile range; PTHM,
posttranslational histone modification
aMedian (IQR)
bP from Wilcoxon rank-sum test for treatment group difference
c400 µg FA n = 103, Placebo n = 56
d400 µg FA n = 98, Placebo n = 55
e400 µg FA n = 97, Placebo n = 56
f400 µg FA n = 52, Placebo n = 27
g400 µg FA n = 50, Placebo n = 28
h400 µg FA n = 50, Placebo n = 29
i400 µg FA n = 51, Placebo n = 29
j400 µg FA n = 48, Placebo n = 27
k400 µg FA n = 47, Placebo n = 27
222
DISCUSSION:
Since lysine histone methyltransferases are dependent on SAM, many PTHMs are
sensitive to nutritional methyl donors and other OCM indices [9, 25, 26, 39-42]. However, few
studies have examined the influences of nutritional methyl donors on PTHMs in human
populations. This has been particularly understudied in populations with a high prevalence of
HHcys or chronic exposure to environmental carcinogens, such as arsenic. In this study of
arsenic-exposed Bangladeshi adults, we observed sex-dependent associations between several
OCM indices and three PTHMs (H3K36me2, H3K36me3, and H3K79me2), which were selected
because they are dysregulated in cancers [19-24] and are altered by nutritional methyl donors
and/or arsenic in experimental studies [25-28].
Although the nutritional methyl donors and cofactors examined in this study were
generally positively associated with the PTHMs examined, this was not the case for folate. We
had hypothesized a priori that folate would be positively associated with PTHMs. However,
plasma folate was not associated with these PTHMs, and supplementation with 400 µg FA/day
for 12 weeks did not alter them. In contrast, among men we observed inverse relationships
between RBC folate and PTHMs, similar to a previous in vitro study, which found that mild
folate deficient conditions induced higher global levels of H3K36me2 in a prostate cancer cell
line [25]. There is evidence that tetrahydrofolate may facilitate histone demethylation by
accepting one-carbon groups as they are removed from histones [43, 44]. Thus, folate may have
dual roles in regulating PTHMs, complicating predictions of its net effects on these marks.
Although we observed discrepancies between the findings for RBC and plasma folate, this may
not be surprising, as RBC folate is a better indicator of long-term folate status. Since both RBCs
223
and PBMCs originate from hematopoietic stem cells, RBC folate may also better reflect folate
status during the epigenetic programming of PBMC progenitor cells.
There are several possible explanations for the sex differences observed in our study.
First, consistent with other reports [4, 5], plasma choline, betaine, and Hcys concentrations were
higher among men, and men were more likely to be folate deficient. Given that long range
allosteric interactions normally regulate SAM concentrations, it is possible that PTHMs are only
perturbed under conditions of nutritional deficiencies or excess. There are also underlying sex
differences in the OCM pathway. For example, phosphatidylethanolamine N-methyltransferase,
which catalyzes phosphatidylcholine synthesis, is up-regulated by estrogen [45]. Furthermore,
there are sex differences in epigenetic regulation. For example, many histone methyltransferases
and histone demethylases bind to androgen receptor [46], and the presence or absence of
androgen has been shown to influence the particular PTHMs targeted by these enzymes [47].
Additionally, some histone demethylase genes reside exclusively on the Y chromosome [48].
Both epidemiological and animal studies have shown that susceptibility to arsenic
toxicity differs by sex, with some outcomes preferentially affecting males and others females.
For example, men are more susceptible to developing cancers of the skin, liver, and bladder after
chronic exposure to arsenic [49-51]. It is possible that differential effects of arsenic and OCM
indices on epigenetic marks, such as PTHMs, contribute to these differences. We have
previously observed that arsenic exposure is associated with DNA methylation and PTHMs in a
sex-dependent manner [15-17, 52]. The findings from this study suggest that some of the OCM
indices analyzed, e.g. choline and cobalamin, also influence certain PTHMs differentially by sex.
Our findings may also have important implications for targeted clinical interventions.
While the majority of epigenetic therapies are still being evaluated in vitro and/or in preclinical
224
studies, others are in early clinical trials or have already been approved by the Food and Drug
Administration [53]. Many of these epigenetic therapies target the OCM pathway. For example,
EPZ-5676, which is currently in a Phase I trial for the treatment of MLL-rearranged leukemia, is
a SAM-competitive inhibitor of DOT1L, a histone methyltransferase which targets H3K79 [54].
Thus, it is possible that nutritional factors and/or the use of supplements that influence SAM
concentrations could counteract the effects of EPZ-5676 and other epigenetic drugs. By analogy,
there is evidence that antifolates, such as methotrexate, are more effective in patients with low
baseline folate concentrations and less effective in individuals taking FA supplements (reviewed
in [55]). Thus, a better understanding of how methyl donors influence the epigenetic machinery
may ultimately inform therapeutic approaches that target specific epigenetic marks.
The data reported herein suggest that OCM indices influence PTHMs in a sex-dependent
manner and further demonstrate that FA supplementation, at least at a dose of 400 µg/day for 12
weeks, does not influence PTHMs in PBMCs. Nevertheless, we cannot rule out the possibility
that PTHMs in other target tissues, or other PTHMs, may have been influenced by FA
supplementation. Thus, understanding the effects of FA and other nutritional donors on PTHMs
in human populations merits additional study.
ACKNOWLEDGEMENTS:
Authors’ contributions to manuscript: M.V.G designed the study. C.G.H. wrote the manuscript
with feedback from M.V.G, M.N.H., X.L., and J.H.G. Statistical analyses were conducted by
C.G.H. with feedback from X.L. PTHMs were measured by C.G.H based on a method developed
in the laboratory of M.C. Folate and Hcys were measured by V.I., in the laboratory of M.V.G.
225
Plasma choline and betaine were measured by O.M. in the laboratory of M.A.C. Arsenic and bSe
were measured by A.M.L-L in the laboratory of J.G.H. Field work was completed by F.P.,
A.B.S., H.S., N.U., and T.I.
This study was funded by NIH grants P42 ES010349, RO1 CA133595, RO1 ES017875, F31
ES025100, T32 ES007322, and P30 ES009089
226
CHAPTER SEVEN REFERENCES:
1. Lee BWK, Sun HG, Zang T, Kim BJ, Alfaro JF, Zhou ZS. Enzyme-catalyzed transfer of
a ketone group from an S-adenosylmethionine analogue: a tool for the functional analysis
of methyltransferases. J Am Chem Soc. 2010;132(11):3642-3643.
2. Mudd SH and Poole JR. Labile methyl balances for normal humans on various dietary
regimens. Metabolism. 1975;24(6):721-735.
3. Fukagawa NK, Martin JM, Wurthmann A, Prue AH, Ebenstein D, O’Rourke B. Sex-
related differences in methionine metabolism and plasma homocysteine concentrations.
Am J Clin Nutr. 2000;72(1):22-29.
4. Gamble MV, Ahsan H, Liu X, Factor-Litvak P, Ilievski V, Slavkovich V et al. Folate and
cobalamin deficiencies and hyperhomocysteinemia in Bangladesh. Am J Clin Nutr. 2005;
81(6):1372-7.
5. Konstantinova SV, Tell GS, Vollset SE, Nygård O, Bleie Ø, Ueland PM. Divergent
associations of plasma choline and betaine with components of metabolic syndrome in
middle age and elderly men and women. J Nutr. 2008;138(5):914-20.
6. Zhang D, Wen X, Wu W, Guo Y, Cui W. Elevated homocysteine level and folate
deficiency associated with increased overall risk of carcinogenesis: meta-analysis of 83
case-control studies involving 35,758 individuals. PLoS One. 2015;10(5):e0123423.
7. Pogribny IP, Shpyleva SI, Muskhelishvili L, Bagnyukova TV, James SJ, Beland FA.
Role of DNA damage and alterations in cytosine DNA methylation in rat liver
carcinogenesis induced by a methyl-deficient diet. Mutat Res. 2009;669(1-2):56-62.
8. Pogribny IP, James SJ, and Beland FA, Molecular alterations in hepatocarcinogenesis
induced by dietary methyl deficiency Mol Nutr Food Res. 2012;56(1):116-25.
9. Pogribny IP, Tryndyak VP, Muskhelishvili L, Rusyn I, Ross SA. Methyl deficiency,
alterations in global histone modifications, and carcinogenesis. J Nutr. 2007;137(1
Suppl):216s-222s.
10. Zhou W, Alonso S, Takai D, Lu SC, Yamamoto F, Perucho M, et al. Requirement of
RIZ1 for cancer prevention by methyl-balanced diet. PLoS One. 2008;3(10):e3390.
11. Dolinoy DC, Huang D, Jirtle RL. Maternal nutrient supplementation counteracts
bisphenol A-induced DNA hypomethylation in early development. Proc Natl Acad Sci U
S A. 2007;104(32):13056-61.
227
12. Pilsner JR, Liu X, Ahsan H, Ilievski V, Slavkovich V, Levy D, et al. Genomic
methylation of peripheral blood leukocyte DNA: influences of arsenic and folate in
Bangladeshi adults. Am J Clin Nutr. 2007;86(4):1179-1186.
13. Pilsner JR, Liu X, Ahsan H, Ilievski V, Slavkovich V, Levy D, et al. Folate deficiency,
hyperhomocysteinemia, low urinary creatinine, and hypomethylation of leukocyte DNA
are risk factors for arsenic-induced skin lesions. Environ Health Perspect.
2009;117(2):254-260.
14. Nohara K, Baba T, Murai H, Kobayashi Y, Suzuki T, Tateishi Y, et al. Global DNA
methylation in the mouse liver is affected by methyl deficiency and arsenic in a sex-
dependent manner. Arch Toxicol. 2011;85(6):653-661.
15. Chervona Y, Hall MN, Arita A, Wu F, Sun H, Tseng HC, et al. Associations between
arsenic exposure and global posttranslational histone modifications among adults in
Bangladesh. Cancer Epidemiol Biomarkers Prev. 2012;21(12):2252-60.
16. Howe CG, Liu X, Hall MN, Slavkovich V, Ilievski V, Parvez F, et al. Associations
between blood and urine arsenic concentrations and global levels of post-translational
histone modifications in Bangladeshi men and women. Environ Health Perspect. [Epub
ahead of print].
17. Niedzwiecki MM, Liu X, Hall MN, Thomas T, Slavkovich V, Ilievski V, et al. Sex-
specific associations of arsenic exposure with global DNA methylation and
hydroxymethylation in leukocytes: results from two studies in Bangladesh. Cancer
Epidemiol Biomarkers Prev. 2015;24(11):1748-57.
18. Broberg K, Ahmed S, Engström K, Hossain MB, Jurkovic MS, Bottai M, et al. Arsenic
exposure in early pregnancy alters genome-wide DNA methylation in cord blood,
particularly in boys. J Dev Orig Health Dis. 2014;5(04):288-298.
19. Duns G, van den Berg E, van Duivenbode I, Osinga J, Hollema H, Hofstra RM, et al.
Histone methyltransferase gene SETD2 is a novel tumor suppressor gene in clear cell
renal cell carcinoma. Cancer Res. 2010;70(11):4287-4291.
20. Fontebasso AM, Schwartzentruber J, Khuong-Quang DA, Liu XY, Sturm D, Korshunov
A, et al. Mutations in SETD2 and genes affecting histone H3K36 methylation target
hemispheric high-grade gliomas. Acta Neuropathol. 2013;125(5):659-669.
21. He J, Nguyen AT, Zhang Y. KDM2b/JHDM1b, an H3K36me2-specific demethylase, is
required for initiation and maintenance of acute myeloid leukemia. Blood. 2011;117(14):
3869-3880.
22. Tamagawa H, Oshima T, Numata M, Yamamoto N, Shiozawa M, Morinaga S, et al.
Global histone modification of H3K27 correlates with the outcomes in patients with
228
metachronous liver metastasis of colorectal cancer. Eur J Surg Oncol. 2013;39(6):655-
661.
23. Bernt KM, Zhu N, Sinha AU, Vempati S, Faber J, Krivstov AV, et al. MLL-rearranged
leukemia is dependent on aberrant H3K79 methylation by DOT1L. Cancer Cell. 2011;
20(1):66-78.
24. Zhang L, Deng L, Chen F, Yao Y, Wu B, Wei L, et al. Inhibition of histone H3K79
methylation selectively inhibits proliferation, self-renewal and metastatic potential of
breast cancer. Oncotarget. 2014;5(21):10665.
25. Bistulfi G, Vandette E, Matsui S, Smiraglia DJ. Mild folate deficiency induces genetic
and epigenetic instability and phenotype changes in prostate cancer cells. BMC Biol.
2010;8(6):1741-7007.
26. Sadhu MJ, Guan Q, Li F, Sales-Lee J, Iavarone AT, Hammond MC, et al. Nutritional
control of epigenetic processes in yeast and human cells. Genetics. 2013;195(3):831-44.
27. Zhang Q, Xue P, Li H, Bao Y, Wu L, Chang S, et al. Histone modification mapping in
human brain reveals aberrant expression of histone H3 lysine 79 dimethylation in neural
tube defects. Neurobiol Dis. 2013;54:404-13.
28. Zhou X, Sun H, Ellen TP, Chen H, Costa M. Arsenite alters global histone H3
methylation. Carcinogenesis. 2008;29(9):1831-1836.
29. Peters BA, Hall MN, Liu X, Parvez F, Sanchez TR, van Geen A, et al. Folic Acid and
Creatine as Therapeutic Approaches to Lower Blood Arsenic: A Randomized Controlled
Trial. Environ Health Perspect. 2015;123(12):1294-301.
30. Ahsan H, Chen Y, Parvez F, Argos M, Hussain AI, Momotaj A, et al. Health Effects of
Arsenic Longitudinal Study (HEALS): description of a multidisciplinary epidemiologic
investigation. J Expo Sci Environ Epidemiol. 2006;16(2):191-205.
31. Food and Nutrition Board, Institute of Medicine. Dietary reference intakes for thiamine,
riboflavin, niacin, vitamin B6, folate, vitamin B12, panthotenic acid biotin and choline.
1998, Washington, DC: National Academy Press.
32. Holm PI, Ueland PM, Kvalheim G, Lien EA. Determination of choline, betaine, and
dimethylglycine in plasma by a high-throughput method based on normal-phase
chromatography-tandem mass spectrometry. Clin Chem. 2003;49(2):286-94.
33. Yan J, Jiang X, West AA, Perry CA, Malysheva OV, Devapatla S, et al. Maternal choline
intake modulates maternal and fetal biomarkers of choline metabolism in humans. Am J
Clin Nutr. 2012;95(5):1060-71.
229
34. Pfeiffer CM, Huff DL, Gunter EW. Rapid and accurate HPLC assay for plasma total
homocysteine and cysteine in a clinical laboratory setting. Clin Chem. 1999;45(2):290-2.
35. Pruszkowski E, Neubauer K, Thomas R. An overview of clinical applications by
inductively coupled plasma mass spectrometry. Atomic spectroscopy. 1998;19(4):111-
115.
36. Slot C. Plasma creatinine determination a new and specific Jaffe reaction method. Scand
J Clin Lab Invest. 1965;17(4):381-387.
37. Howe CG and Gamble MV. Enzymatic cleavage of histone H3: a new consideration
when measuring histone modifications in human samples. Clin Epigenetics. 2015;7(1):7.
38. Christenson RH, Dent GA, Tuszynski A. Two radioassays for serum vitamin B12 and
folate determination compared in a reference interval study. Clin Chem.
1985;31(8):1358-60.
39. Mehedint MG, Niculescu MD, Craciunescu CN, Zeisel SH. Choline deficiency alters
global histone methylation and epigenetic marking at the Re1 site of the calbindin 1 gene.
FASEB J. 2010;24(1):184-95.
40. Davison JM, Mellott TJ, Kovacheva VP, Blusztajn JK. Gestational choline supply
regulates methylation of histone H3, expression of histone methyltransferases G9a
(Kmt1c) and Suv39h1 (Kmt1a), and DNA methylation of their genes in rat fetal liver and
brain. J Biol Chem. 2009;284(4):1982-9.
41. Dobosy JR, Fu VX, Desotelle JA, Srinivasan R, Kenowski ML, Almassi N, et al. A
methyl-deficient diet modifies histone methylation and alters Igf2 and H19 repression in
the prostate. Prostate. 2008;68(11):1187-95.
42. Lambrot R, Xu C, Saint-Phar S, Chountalos G, Cohen T, Paquet M, et al. Low paternal
dietary folate alters the mouse sperm epigenome and is associated with negative
pregnancy outcomes. Nat Commun. 2013;4:2889.
43. Luka Z, Pakhomova S, Loukachevitch LV, Calcutt MW, Newcomer ME, Wagner C.
Crystal structure of the histone lysine specific demethylase LSD1 complexed with
tetrahydrofolate. Protein Sci. 2014;23(7):993-8.
44. Garcia BA, Luka Z, Loukachevitch LV, Bhanu NV, Wagner C. Folate Deficiency Affects
Histone Methylation. Med Hypotheses. 2016;88:63-7.
45. Zeisel SH. Choline: critical role during fetal development and dietary requirements in
adults. Annu Rev Nutr. 2006;26:229-50.
46. Heemers HV and Tindall DJ. Androgen receptor (AR) coregulators: a diversity of
functions converging on and regulating the AR transcriptional complex. Endocr Rev.
2007;28(7)778-808.
230
47. Cai C, He HH, Gao S, Chen S, Yu Z, Gao Y, et al. Lysine-specific demethylase 1 has
dual functions as a major regulator of androgen receptor transcriptional activity. Cell
Rep. 2014;9(5):1618-27.
48. Bellott DW, Hughes JF, Skaletsky H, Brown LG, Pytinkova T, Cho TJ, et al. Mammalian
Y chromosomes retain widely expressed dosage-sensitive regulators. Nature.
2014;508(7497):494-9.
49. Chen CJ and Wang CJ. Ecological correlation between arsenic level in well water and
age-adjusted mortality from malignant neoplasms. Cancer Res. 1990;50(17):5470-5474.
50. Chen YC, Guo YL, Su HJ, Hseuh YM, Smith TJ, Ryan LM, et al. Arsenic methylation
and skin cancer risk in southwestern Taiwan. J Occup Environ Med. 2003;45(3):241-248.
51. Leonardi G, Vahter M, Clemens F, Goessler W, Gurzau E, Hemminki K, et al. Inorganic
arsenic and basal cell carcinoma in areas of Hungary, Romania, and Slovakia: a case-
control study. Environ Health Perspect. 2012;120(5):721-726.
52. Pilsner JR, Hall MN, Liu X, Ilievski V, Slavkovich V, Levy D, et al. Influence of
prenatal arsenic exposure and newborn sex on global methylation of cord blood DNA.
PLoS One 2012;7(5):25.
53. Popovic R, Shah MY, Licht JD. Epigenetic therapy of hematological malignancies:
where are we now? Ther Adv Hematol. 2013;4(2):81-91.
54. Stein EM and Tallman MS. Mixed lineage rearranged leukaemia: pathogenesis and
targeting DOT1L. Curr Opin Hematol. 2015;22(2):92-6.
55. Smith AD, Kim YI, Refsum H. Is folic acid good for everyone? Am J Clin Nutr. 2008;
87(3):517-33.
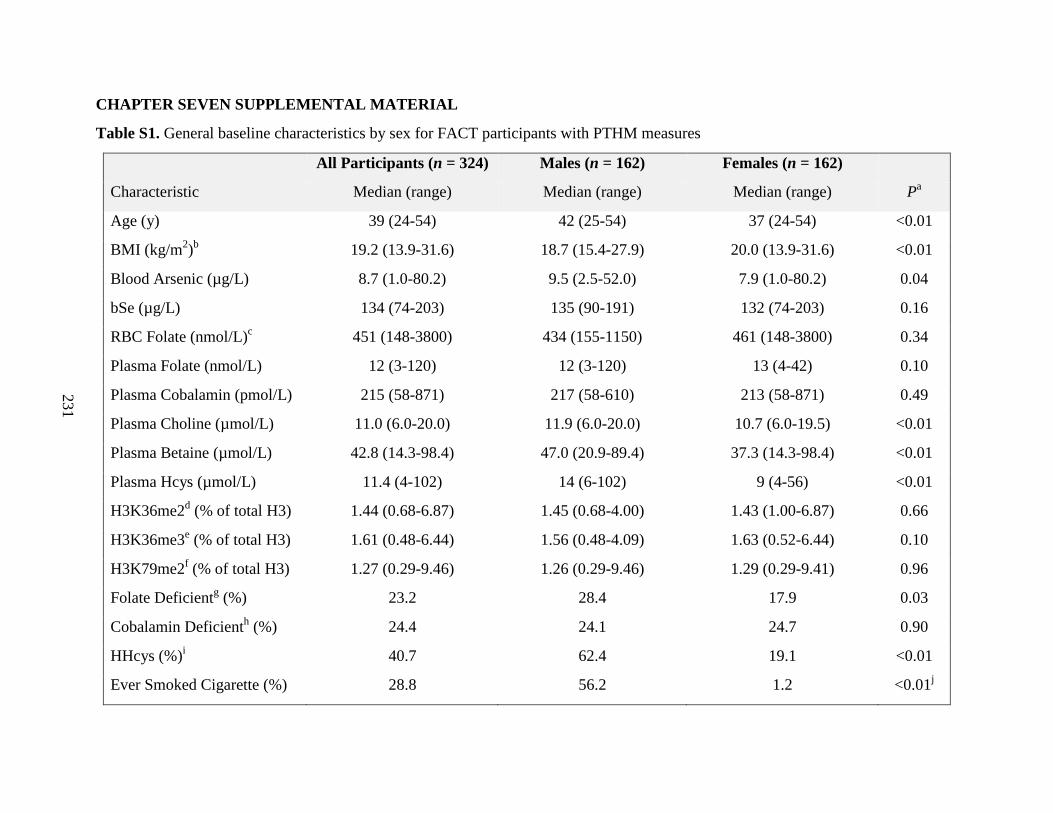
231
CHAPTER SEVEN SUPPLEMENTAL MATERIAL
Table S1. General baseline characteristics by sex for FACT participants with PTHM measures
All Participants (n = 324) Males (n = 162) Females (n = 162)
Characteristic Median (range) Median (range) Median (range) Pa
Age (y) 39 (24-54) 42 (25-54) 37 (24-54) <0.01
BMI (kg/m2)b 19.2 (13.9-31.6) 18.7 (15.4-27.9) 20.0 (13.9-31.6) <0.01
Blood Arsenic (µg/L) 8.7 (1.0-80.2) 9.5 (2.5-52.0) 7.9 (1.0-80.2) 0.04
bSe (µg/L) 134 (74-203) 135 (90-191) 132 (74-203) 0.16
RBC Folate (nmol/L)c 451 (148-3800) 434 (155-1150) 461 (148-3800) 0.34
Plasma Folate (nmol/L) 12 (3-120) 12 (3-120) 13 (4-42) 0.10
Plasma Cobalamin (pmol/L) 215 (58-871) 217 (58-610) 213 (58-871) 0.49
Plasma Choline (µmol/L) 11.0 (6.0-20.0) 11.9 (6.0-20.0) 10.7 (6.0-19.5) <0.01
Plasma Betaine (µmol/L) 42.8 (14.3-98.4) 47.0 (20.9-89.4) 37.3 (14.3-98.4) <0.01
Plasma Hcys (µmol/L) 11.4 (4-102) 14 (6-102) 9 (4-56) <0.01
H3K36me2d (% of total H3) 1.44 (0.68-6.87) 1.45 (0.68-4.00) 1.43 (1.00-6.87) 0.66
H3K36me3e (% of total H3) 1.61 (0.48-6.44) 1.56 (0.48-4.09) 1.63 (0.52-6.44) 0.10
H3K79me2f (% of total H3) 1.27 (0.29-9.46) 1.26 (0.29-9.46) 1.29 (0.29-9.41) 0.96
Folate Deficientg (%) 23.2 28.4 17.9 0.03
Cobalamin Deficienth (%) 24.4 24.1 24.7 0.90
HHcys (%)i 40.7 62.4 19.1 <0.01
Ever Smoked Cigarette (%) 28.8 56.2 1.2 <0.01j
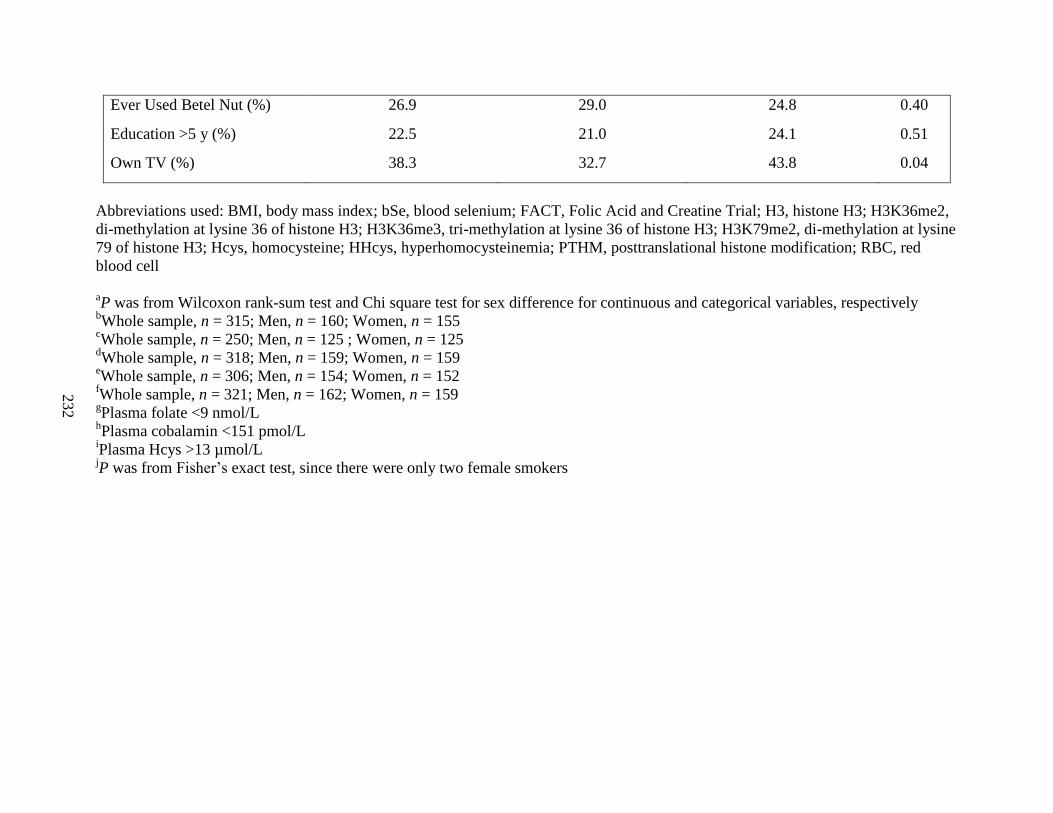
232
Ever Used Betel Nut (%) 26.9 29.0 24.8 0.40
Education >5 y (%) 22.5 21.0 24.1 0.51
Own TV (%) 38.3 32.7 43.8 0.04
Abbreviations used: BMI, body mass index; bSe, blood selenium; FACT, Folic Acid and Creatine Trial; H3, histone H3; H3K36me2,
di-methylation at lysine 36 of histone H3; H3K36me3, tri-methylation at lysine 36 of histone H3; H3K79me2, di-methylation at lysine
79 of histone H3; Hcys, homocysteine; HHcys, hyperhomocysteinemia; PTHM, posttranslational histone modification; RBC, red
blood cell
aP was from Wilcoxon rank-sum test and Chi square test for sex difference for continuous and categorical variables, respectively
bWhole sample, n = 315; Men, n = 160; Women, n = 155
cWhole sample, n = 250; Men, n = 125 ; Women, n = 125
dWhole sample, n = 318; Men, n = 159; Women, n = 159
eWhole sample, n = 306; Men, n = 154; Women, n = 152
fWhole sample, n = 321; Men, n = 162; Women, n = 159
gPlasma folate <9 nmol/L
hPlasma cobalamin <151 pmol/L
iPlasma Hcys >13 µmol/L
jP was from Fisher’s exact test, since there were only two female smokers
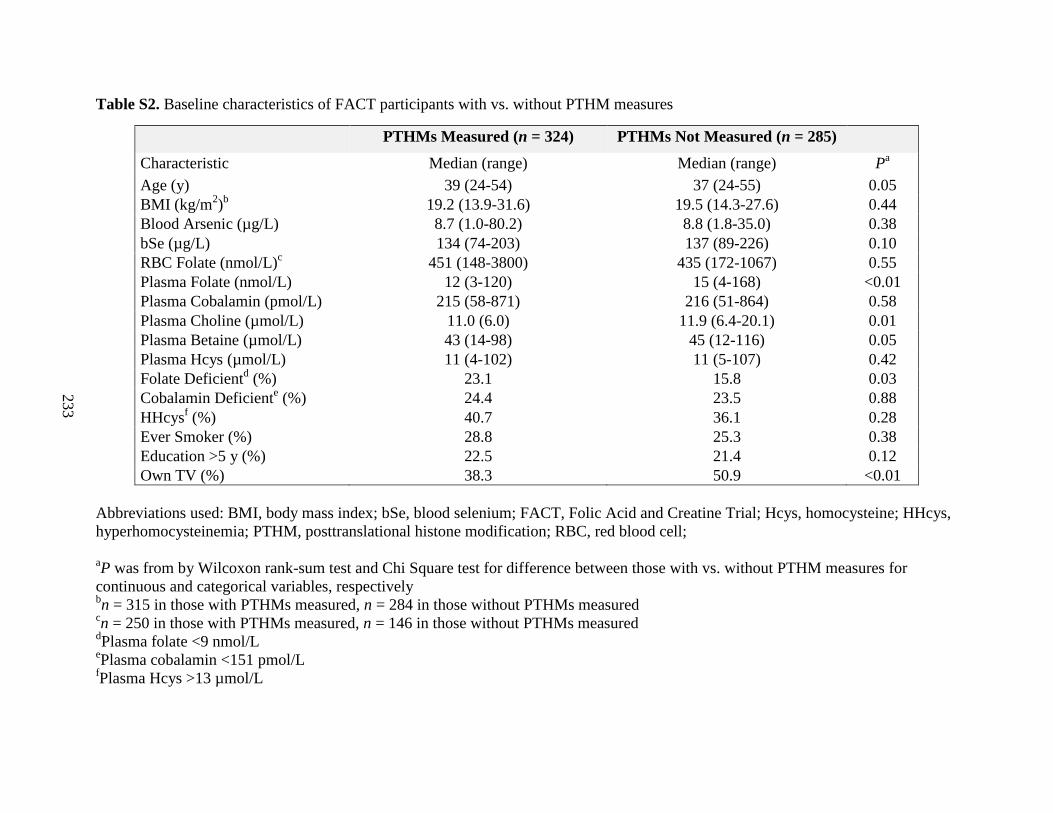
233
Table S2. Baseline characteristics of FACT participants with vs. without PTHM measures
PTHMs Measured (n = 324) PTHMs Not Measured (n = 285)
Characteristic Median (range) Median (range) Pa
Age (y) 39 (24-54) 37 (24-55) 0.05
BMI (kg/m2)b 19.2 (13.9-31.6) 19.5 (14.3-27.6) 0.44
Blood Arsenic (µg/L) 8.7 (1.0-80.2) 8.8 (1.8-35.0) 0.38
bSe (µg/L) 134 (74-203) 137 (89-226) 0.10
RBC Folate (nmol/L)c 451 (148-3800) 435 (172-1067) 0.55
Plasma Folate (nmol/L) 12 (3-120) 15 (4-168) <0.01
Plasma Cobalamin (pmol/L) 215 (58-871) 216 (51-864) 0.58
Plasma Choline (µmol/L) 11.0 (6.0) 11.9 (6.4-20.1) 0.01
Plasma Betaine (µmol/L) 43 (14-98) 45 (12-116) 0.05
Plasma Hcys (µmol/L) 11 (4-102) 11 (5-107) 0.42
Folate Deficientd (%) 23.1 15.8 0.03
Cobalamin Deficiente (%) 24.4 23.5 0.88
HHcysf (%) 40.7 36.1 0.28
Ever Smoker (%) 28.8 25.3 0.38
Education >5 y (%) 22.5 21.4 0.12
Own TV (%) 38.3 50.9 <0.01
Abbreviations used: BMI, body mass index; bSe, blood selenium; FACT, Folic Acid and Creatine Trial; Hcys, homocysteine; HHcys,
hyperhomocysteinemia; PTHM, posttranslational histone modification; RBC, red blood cell;
aP was from by Wilcoxon rank-sum test and Chi Square test for difference between those with vs. without PTHM measures for
continuous and categorical variables, respectively bn = 315 in those with PTHMs measured, n = 284 in those without PTHMs measured
cn = 250 in those with PTHMs measured, n = 146 in those without PTHMs measured
dPlasma folate <9 nmol/L
ePlasma cobalamin <151 pmol/L
fPlasma Hcys >13 µmol/L

234
Table S3. Baseline characteristics of FACT participants with vs. without RBC folate measures
RBC Folate Measured (n = 250) RBC Folate Not Measured (n = 74)
Characteristic Median (Range) Median (Range) Pa
Age (y) 39 (24-54) 38 (26-54) 0.52
BMI (kg/m2)b 19.1 (13.9-31.6) 19.7 (14.8-26.9) 0.73
Plasma Folate (nmol/L) 13 (3-120) 12 (3-50) 0.81
Plasma Cobalamin (pmol/L) 209 (58-634) 247 (69-871) 0.04
Plasma Choline (µmol/L) 11.0 (6.0-19.5) 11.3 (6.0-20.0) 0.64
Plasma Betaine (µmol/L) 43.2 (14.3-89.4) 40.5 (19.1-98.4) 0.49
Plasma Hcys (µmol/L) 12 (5-102) 11 (4-31) 0.21
Blood Arsenic (µg/L) 8.8 (1.0-80.2) 8.2 (2.2-53.9) 0.53
bSe (µg/L) 134 (74-203) 134 (92-186) 0.39
uCr (mg/dL) 46 (6-233) 59 (7-252) 0.04
H3K36me2c (% of total H3) 1.46 (0.68-6.87) 1.39 (1.01-5.98) 0.41
H3K36me3d (% of total H3) 1.61 (0.48-6.00) 1.61 (0.54-6.44) 0.45
H3K79me2e (% of total H3) 1.25 (0.29-9.46) 1.32 (0.70-5.87) 0.52
Folate Deficient (%)f 23.6 21.6 0.72
Cobalamin Deficient (%)g 26.0 18.9 0.21
HHcys (%)h 41.6 37.8 0.56
Male (%) 50.0 50.0 0.99
Ever Smoker (%) 26.9 35.1 0.17
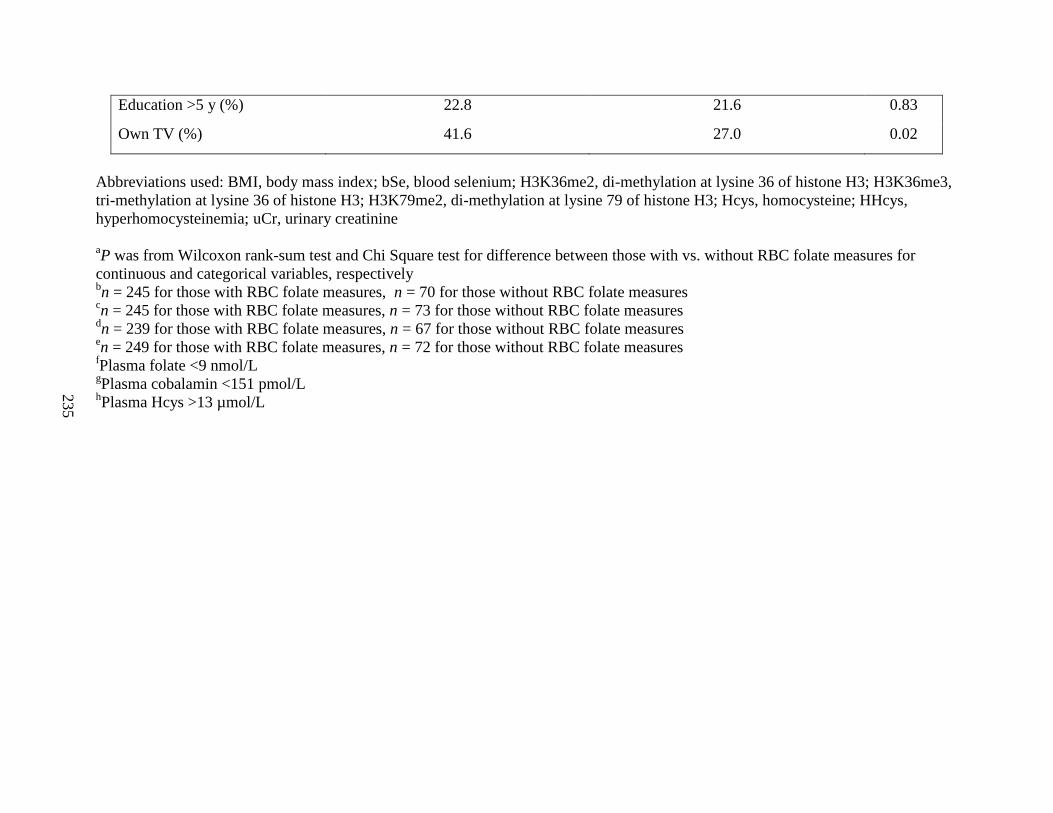
235
Education >5 y (%) 22.8 21.6 0.83
Own TV (%) 41.6 27.0 0.02
Abbreviations used: BMI, body mass index; bSe, blood selenium; H3K36me2, di-methylation at lysine 36 of histone H3; H3K36me3,
tri-methylation at lysine 36 of histone H3; H3K79me2, di-methylation at lysine 79 of histone H3; Hcys, homocysteine; HHcys,
hyperhomocysteinemia; uCr, urinary creatinine
aP was from Wilcoxon rank-sum test and Chi Square test for difference between those with vs. without RBC folate measures for
continuous and categorical variables, respectively bn = 245 for those with RBC folate measures, n = 70 for those without RBC folate measures
cn = 245 for those with RBC folate measures, n = 73 for those without RBC folate measures
dn = 239 for those with RBC folate measures, n = 67 for those without RBC folate measures
en = 249 for those with RBC folate measures, n = 72 for those without RBC folate measures
fPlasma folate <9 nmol/L
gPlasma cobalamin <151 pmol/L
hPlasma Hcys >13 µmol/L
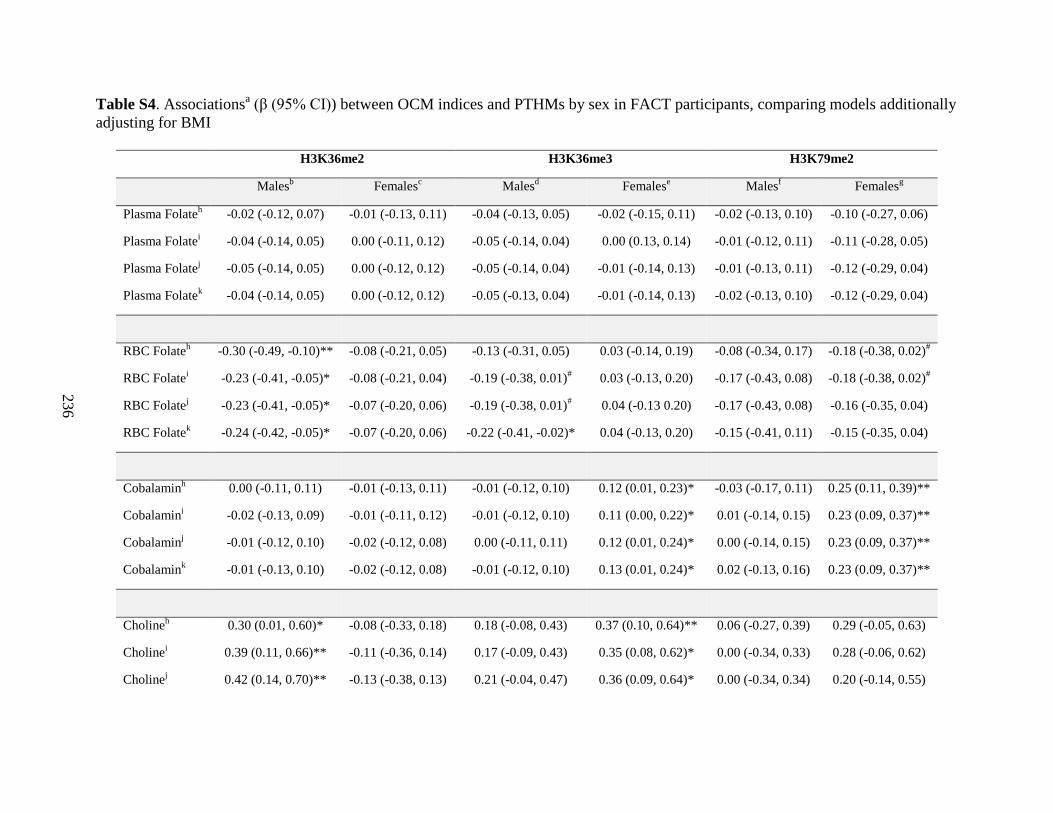
236
Table S4. Associationsa (β (95% CI)) between OCM indices and PTHMs by sex in FACT participants, comparing models additionally
adjusting for BMI
H3K36me2 H3K36me3 H3K79me2
Malesb Females
c Males
d Females
e Males
f Females
g
Plasma Folateh -0.02 (-0.12, 0.07) -0.01 (-0.13, 0.11) -0.04 (-0.13, 0.05) -0.02 (-0.15, 0.11) -0.02 (-0.13, 0.10) -0.10 (-0.27, 0.06)
Plasma Folatei -0.04 (-0.14, 0.05) 0.00 (-0.11, 0.12) -0.05 (-0.14, 0.04) 0.00 (0.13, 0.14) -0.01 (-0.12, 0.11) -0.11 (-0.28, 0.05)
Plasma Folatej -0.05 (-0.14, 0.05) 0.00 (-0.12, 0.12) -0.05 (-0.14, 0.04) -0.01 (-0.14, 0.13) -0.01 (-0.13, 0.11) -0.12 (-0.29, 0.04)
Plasma Folatek -0.04 (-0.14, 0.05) 0.00 (-0.12, 0.12) -0.05 (-0.13, 0.04) -0.01 (-0.14, 0.13) -0.02 (-0.13, 0.10) -0.12 (-0.29, 0.04)
RBC Folateh -0.30 (-0.49, -0.10)** -0.08 (-0.21, 0.05) -0.13 (-0.31, 0.05) 0.03 (-0.14, 0.19) -0.08 (-0.34, 0.17) -0.18 (-0.38, 0.02)
#
RBC Folatei -0.23 (-0.41, -0.05)* -0.08 (-0.21, 0.04) -0.19 (-0.38, 0.01)
# 0.03 (-0.13, 0.20) -0.17 (-0.43, 0.08) -0.18 (-0.38, 0.02)
#
RBC Folatej -0.23 (-0.41, -0.05)* -0.07 (-0.20, 0.06) -0.19 (-0.38, 0.01)
# 0.04 (-0.13 0.20) -0.17 (-0.43, 0.08) -0.16 (-0.35, 0.04)
RBC Folatek -0.24 (-0.42, -0.05)* -0.07 (-0.20, 0.06) -0.22 (-0.41, -0.02)* 0.04 (-0.13, 0.20) -0.15 (-0.41, 0.11) -0.15 (-0.35, 0.04)
Cobalaminh 0.00 (-0.11, 0.11) -0.01 (-0.13, 0.11) -0.01 (-0.12, 0.10) 0.12 (0.01, 0.23)* -0.03 (-0.17, 0.11) 0.25 (0.11, 0.39)**
Cobalamini -0.02 (-0.13, 0.09) -0.01 (-0.11, 0.12) -0.01 (-0.12, 0.10) 0.11 (0.00, 0.22)* 0.01 (-0.14, 0.15) 0.23 (0.09, 0.37)**
Cobalaminj -0.01 (-0.12, 0.10) -0.02 (-0.12, 0.08) 0.00 (-0.11, 0.11) 0.12 (0.01, 0.24)* 0.00 (-0.14, 0.15) 0.23 (0.09, 0.37)**
Cobalamink -0.01 (-0.13, 0.10) -0.02 (-0.12, 0.08) -0.01 (-0.12, 0.10) 0.13 (0.01, 0.24)* 0.02 (-0.13, 0.16) 0.23 (0.09, 0.37)**
Cholineh 0.30 (0.01, 0.60)* -0.08 (-0.33, 0.18) 0.18 (-0.08, 0.43) 0.37 (0.10, 0.64)** 0.06 (-0.27, 0.39) 0.29 (-0.05, 0.63)
Cholinei 0.39 (0.11, 0.66)** -0.11 (-0.36, 0.14) 0.17 (-0.09, 0.43) 0.35 (0.08, 0.62)* 0.00 (-0.34, 0.33) 0.28 (-0.06, 0.62)
Cholinej 0.42 (0.14, 0.70)** -0.13 (-0.38, 0.13) 0.21 (-0.04, 0.47) 0.36 (0.09, 0.64)* 0.00 (-0.34, 0.34) 0.20 (-0.14, 0.55)
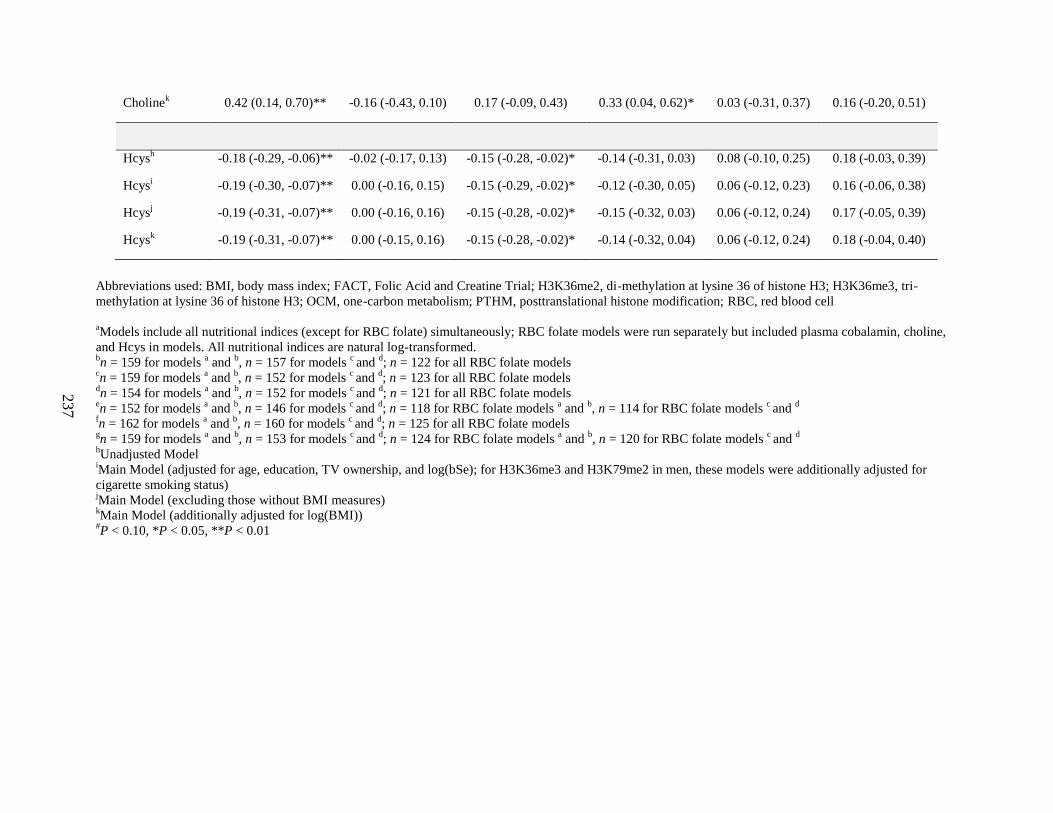
237
Cholinek 0.42 (0.14, 0.70)** -0.16 (-0.43, 0.10) 0.17 (-0.09, 0.43) 0.33 (0.04, 0.62)* 0.03 (-0.31, 0.37) 0.16 (-0.20, 0.51)
Hcysh -0.18 (-0.29, -0.06)** -0.02 (-0.17, 0.13) -0.15 (-0.28, -0.02)* -0.14 (-0.31, 0.03) 0.08 (-0.10, 0.25) 0.18 (-0.03, 0.39)
Hcysi -0.19 (-0.30, -0.07)** 0.00 (-0.16, 0.15) -0.15 (-0.29, -0.02)* -0.12 (-0.30, 0.05) 0.06 (-0.12, 0.23) 0.16 (-0.06, 0.38)
Hcysj -0.19 (-0.31, -0.07)** 0.00 (-0.16, 0.16) -0.15 (-0.28, -0.02)* -0.15 (-0.32, 0.03) 0.06 (-0.12, 0.24) 0.17 (-0.05, 0.39)
Hcysk -0.19 (-0.31, -0.07)** 0.00 (-0.15, 0.16) -0.15 (-0.28, -0.02)* -0.14 (-0.32, 0.04) 0.06 (-0.12, 0.24) 0.18 (-0.04, 0.40)
Abbreviations used: BMI, body mass index; FACT, Folic Acid and Creatine Trial; H3K36me2, di-methylation at lysine 36 of histone H3; H3K36me3, tri-
methylation at lysine 36 of histone H3; OCM, one-carbon metabolism; PTHM, posttranslational histone modification; RBC, red blood cell
aModels include all nutritional indices (except for RBC folate) simultaneously; RBC folate models were run separately but included plasma cobalamin, choline,
and Hcys in models. All nutritional indices are natural log-transformed. bn = 159 for models
a and
b, n = 157 for models
c and
d; n = 122 for all RBC folate models
cn = 159 for models
a and
b, n = 152 for models
c and
d; n = 123 for all RBC folate models
dn = 154 for models
a and
b, n = 152 for models
c and
d; n = 121 for all RBC folate models
en = 152 for models
a and
b, n = 146 for models
c and
d; n = 118 for RBC folate models
a and
b, n = 114 for RBC folate models
c and
d
fn = 162 for models
a and
b, n = 160 for models
c and
d; n = 125 for all RBC folate models
gn = 159 for models
a and
b, n = 153 for models
c and
d; n = 124 for RBC folate models
a and
b, n = 120 for RBC folate models
c and
d
hUnadjusted Model
iMain Model (adjusted for age, education, TV ownership, and log(bSe); for H3K36me3 and H3K79me2 in men, these models were additionally adjusted for
cigarette smoking status) jMain Model (excluding those without BMI measures)
kMain Model (additionally adjusted for log(BMI))
#P < 0.10, *P < 0.05, **P < 0.01
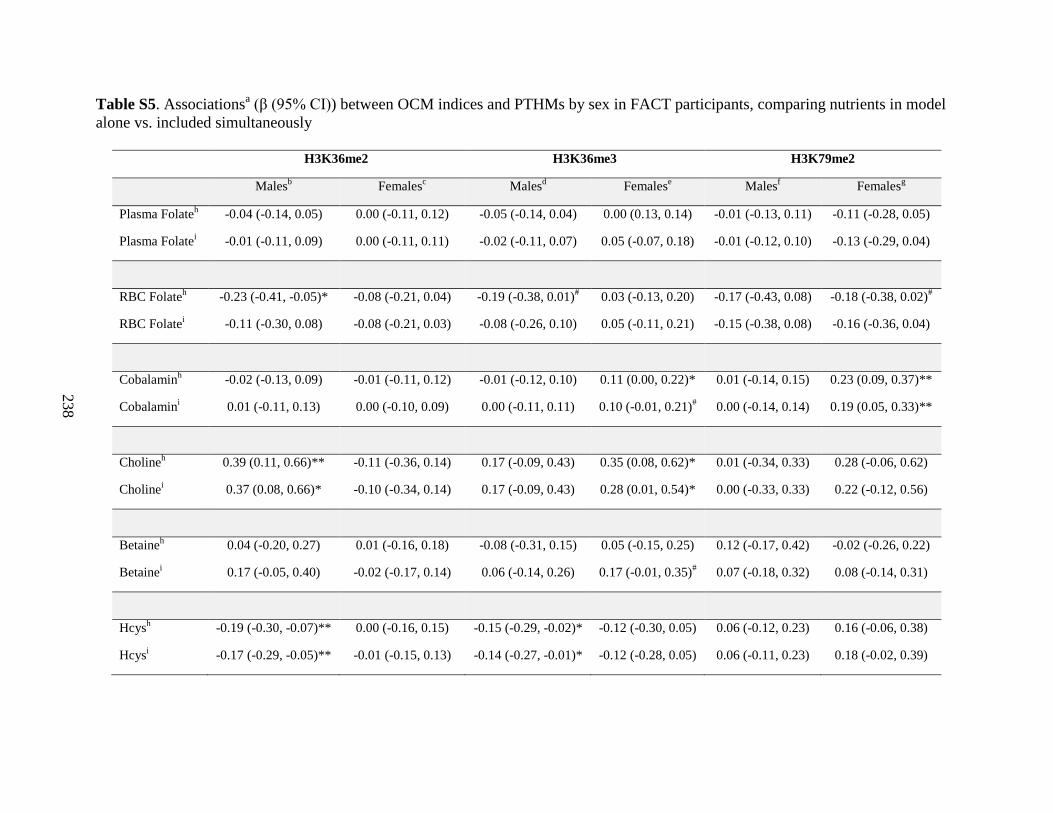
238
Table S5. Associationsa (β (95% CI)) between OCM indices and PTHMs by sex in FACT participants, comparing nutrients in model
alone vs. included simultaneously
H3K36me2 H3K36me3 H3K79me2
Malesb Females
c Males
d Females
e Males
f Females
g
Plasma Folateh -0.04 (-0.14, 0.05) 0.00 (-0.11, 0.12) -0.05 (-0.14, 0.04) 0.00 (0.13, 0.14) -0.01 (-0.13, 0.11) -0.11 (-0.28, 0.05)
Plasma Folatei -0.01 (-0.11, 0.09) 0.00 (-0.11, 0.11) -0.02 (-0.11, 0.07) 0.05 (-0.07, 0.18) -0.01 (-0.12, 0.10) -0.13 (-0.29, 0.04)
RBC Folateh -0.23 (-0.41, -0.05)* -0.08 (-0.21, 0.04) -0.19 (-0.38, 0.01)
# 0.03 (-0.13, 0.20) -0.17 (-0.43, 0.08) -0.18 (-0.38, 0.02)
#
RBC Folatei -0.11 (-0.30, 0.08) -0.08 (-0.21, 0.03) -0.08 (-0.26, 0.10) 0.05 (-0.11, 0.21) -0.15 (-0.38, 0.08) -0.16 (-0.36, 0.04)
Cobalaminh -0.02 (-0.13, 0.09) -0.01 (-0.11, 0.12) -0.01 (-0.12, 0.10) 0.11 (0.00, 0.22)* 0.01 (-0.14, 0.15) 0.23 (0.09, 0.37)**
Cobalamini 0.01 (-0.11, 0.13) 0.00 (-0.10, 0.09) 0.00 (-0.11, 0.11) 0.10 (-0.01, 0.21)
# 0.00 (-0.14, 0.14) 0.19 (0.05, 0.33)**
Cholineh 0.39 (0.11, 0.66)** -0.11 (-0.36, 0.14) 0.17 (-0.09, 0.43) 0.35 (0.08, 0.62)* 0.01 (-0.34, 0.33) 0.28 (-0.06, 0.62)
Cholinei 0.37 (0.08, 0.66)* -0.10 (-0.34, 0.14) 0.17 (-0.09, 0.43) 0.28 (0.01, 0.54)* 0.00 (-0.33, 0.33) 0.22 (-0.12, 0.56)
Betaineh 0.04 (-0.20, 0.27) 0.01 (-0.16, 0.18) -0.08 (-0.31, 0.15) 0.05 (-0.15, 0.25) 0.12 (-0.17, 0.42) -0.02 (-0.26, 0.22)
Betainei 0.17 (-0.05, 0.40) -0.02 (-0.17, 0.14) 0.06 (-0.14, 0.26) 0.17 (-0.01, 0.35)
# 0.07 (-0.18, 0.32) 0.08 (-0.14, 0.31)
Hcysh -0.19 (-0.30, -0.07)** 0.00 (-0.16, 0.15) -0.15 (-0.29, -0.02)* -0.12 (-0.30, 0.05) 0.06 (-0.12, 0.23) 0.16 (-0.06, 0.38)
Hcysi -0.17 (-0.29, -0.05)** -0.01 (-0.15, 0.13) -0.14 (-0.27, -0.01)* -0.12 (-0.28, 0.05) 0.06 (-0.11, 0.23) 0.18 (-0.02, 0.39)
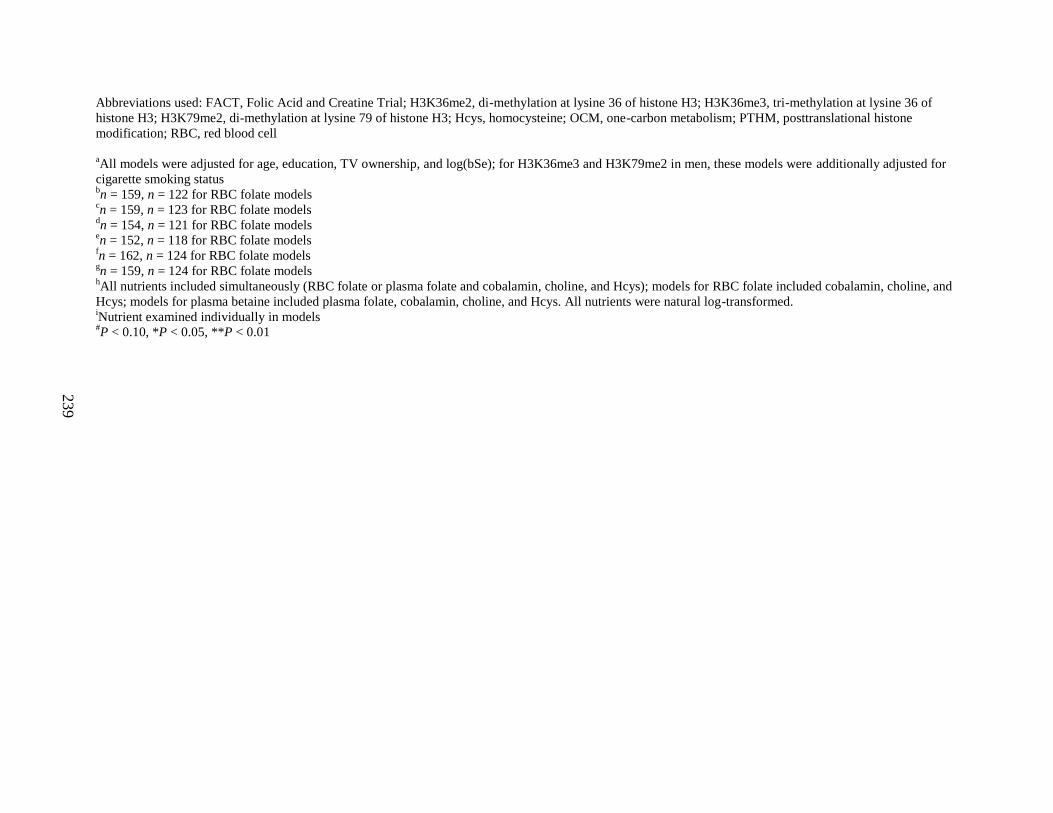
239
Abbreviations used: FACT, Folic Acid and Creatine Trial; H3K36me2, di-methylation at lysine 36 of histone H3; H3K36me3, tri-methylation at lysine 36 of
histone H3; H3K79me2, di-methylation at lysine 79 of histone H3; Hcys, homocysteine; OCM, one-carbon metabolism; PTHM, posttranslational histone
modification; RBC, red blood cell
aAll models were adjusted for age, education, TV ownership, and log(bSe); for H3K36me3 and H3K79me2 in men, these models were additionally adjusted for
cigarette smoking status bn = 159, n = 122 for RBC folate models
cn = 159, n = 123 for RBC folate models
dn = 154, n = 121 for RBC folate models
en = 152, n = 118 for RBC folate models
fn = 162, n = 124 for RBC folate models
gn = 159, n = 124 for RBC folate models
hAll nutrients included simultaneously (RBC folate or plasma folate and cobalamin, choline, and Hcys); models for RBC folate included cobalamin, choline, and
Hcys; models for plasma betaine included plasma folate, cobalamin, choline, and Hcys. All nutrients were natural log-transformed. iNutrient examined individually in models
#P < 0.10, *P < 0.05, **P < 0.01
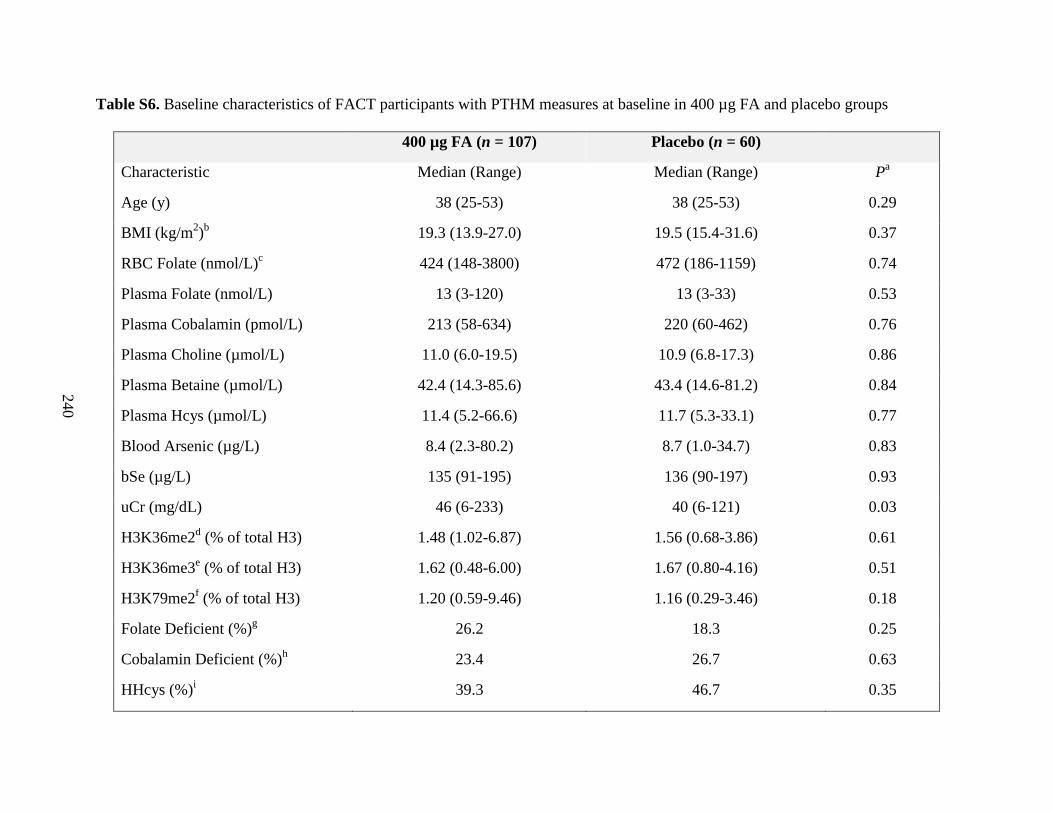
240
Table S6. Baseline characteristics of FACT participants with PTHM measures at baseline in 400 µg FA and placebo groups
400 µg FA (n = 107) Placebo (n = 60)
Characteristic Median (Range) Median (Range) Pa
Age (y) 38 (25-53) 38 (25-53) 0.29
BMI (kg/m2)b 19.3 (13.9-27.0) 19.5 (15.4-31.6) 0.37
RBC Folate (nmol/L)c 424 (148-3800) 472 (186-1159) 0.74
Plasma Folate (nmol/L) 13 (3-120) 13 (3-33) 0.53
Plasma Cobalamin (pmol/L) 213 (58-634) 220 (60-462) 0.76
Plasma Choline (µmol/L) 11.0 (6.0-19.5) 10.9 (6.8-17.3) 0.86
Plasma Betaine (µmol/L) 42.4 (14.3-85.6) 43.4 (14.6-81.2) 0.84
Plasma Hcys (µmol/L) 11.4 (5.2-66.6) 11.7 (5.3-33.1) 0.77
Blood Arsenic (µg/L) 8.4 (2.3-80.2) 8.7 (1.0-34.7) 0.83
bSe (µg/L) 135 (91-195) 136 (90-197) 0.93
uCr (mg/dL) 46 (6-233) 40 (6-121) 0.03
H3K36me2d (% of total H3) 1.48 (1.02-6.87) 1.56 (0.68-3.86) 0.61
H3K36me3e (% of total H3) 1.62 (0.48-6.00) 1.67 (0.80-4.16) 0.51
H3K79me2f (% of total H3) 1.20 (0.59-9.46) 1.16 (0.29-3.46) 0.18
Folate Deficient (%)g 26.2 18.3 0.25
Cobalamin Deficient (%)h 23.4 26.7 0.63
HHcys (%)i 39.3 46.7 0.35
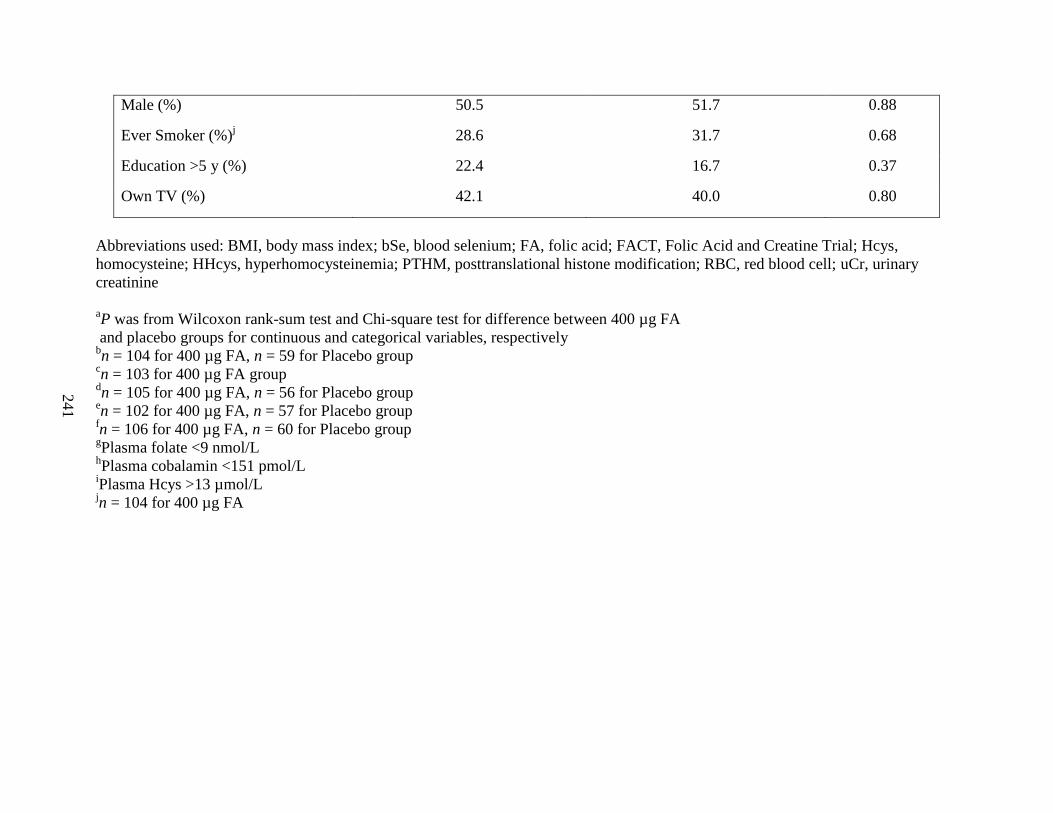
241
Male (%) 50.5 51.7 0.88
Ever Smoker (%)j 28.6 31.7 0.68
Education >5 y (%) 22.4 16.7 0.37
Own TV (%) 42.1 40.0 0.80
Abbreviations used: BMI, body mass index; bSe, blood selenium; FA, folic acid; FACT, Folic Acid and Creatine Trial; Hcys,
homocysteine; HHcys, hyperhomocysteinemia; PTHM, posttranslational histone modification; RBC, red blood cell; uCr, urinary
creatinine
aP was from Wilcoxon rank-sum test and Chi-square test for difference between 400 µg FA
and placebo groups for continuous and categorical variables, respectively bn = 104 for 400 µg FA, n = 59 for Placebo group
cn = 103 for 400 µg FA group
dn = 105 for 400 µg FA, n = 56 for Placebo group
en = 102 for 400 µg FA, n = 57 for Placebo group
fn = 106 for 400 µg FA, n = 60 for Placebo group
gPlasma folate <9 nmol/L
hPlasma cobalamin <151 pmol/L
iPlasma Hcys >13 µmol/L
jn = 104 for 400 µg FA
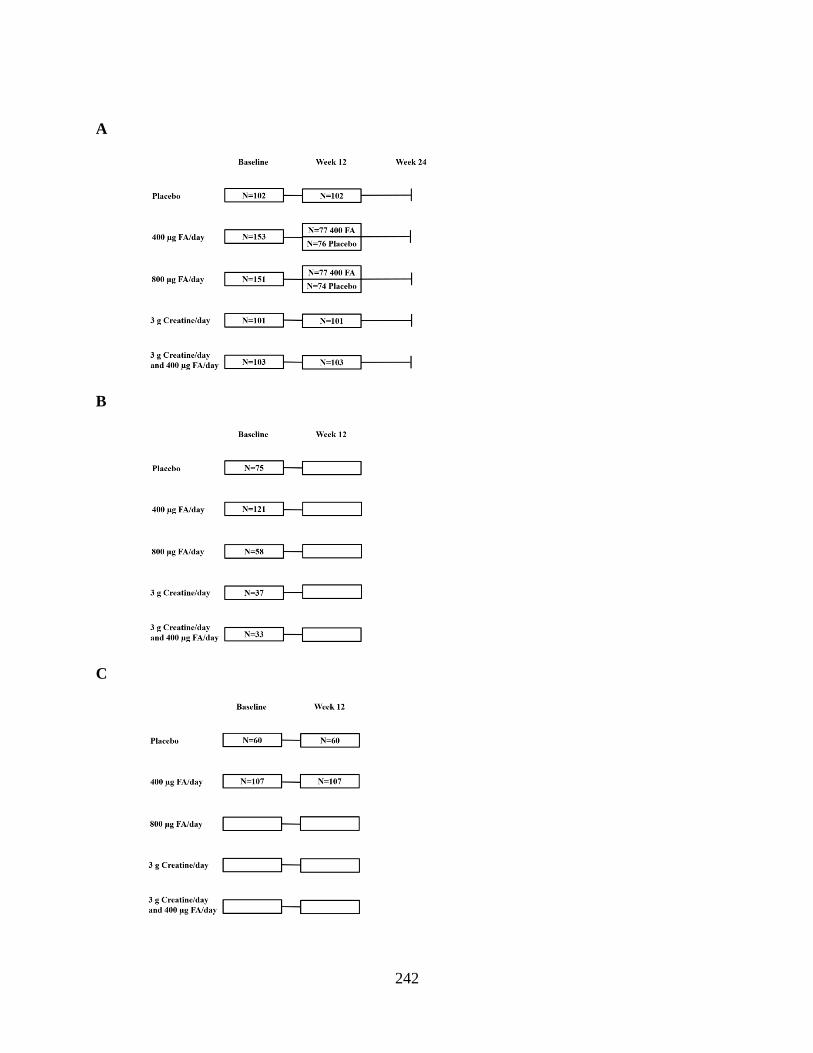
242
A
B
C
243
Figure S1. FACT design and sampling for current study. A) FACT design (primary outcome:
blood arsenic). Bangladeshi adults (n = 622) who met eligibility criteria for the FACT study were
randomized to five treatment arms: placebo, 400 µg folic acid (FA) per day, 800 µg FA per day,
3 g creatine per day, and 3 g creatine + 400 µg FA per day. Participants also received arsenic-
removal water filters at baseline to reduce their exposure to arsenic-contaminated drinking water.
The study duration was 24 weeks. At week 12, half of the participants in the FA treatment arms
were switched to placebo for the duration of the study. The number of participants in each
treatment group are shown. 12 participants were dropped from the study for various reasons
which have been reported previously [1]. Therefore, a total of 610 participants were included in
the primary analyses, which examined the effects of these nutritional interventions on blood
arsenic concentrations; the main findings from this trial have been reported [1]. B) Participants
selected for cross-sectional analyses (secondary outcome: posttranslational histone modifications
(PTHMs)). Baseline-collected (i.e., pre-intervention) samples from 324 FACT participants were
included in cross-sectional analyses for the current study, which examined associations between
one-carbon metabolism (OCM) indices and global levels of PTHMs. All participants from the
placebo and 400 µg FA/day treatment arms who had complete information for predictors (OCM
indices), PTHMs, and potential confounders were included in these analyses (n = 75 for placebo
group, n = 121 for 400 µg FA/day group); an additional 128 participants with complete
information for all relevant variables were randomly selected from the remaining three treatment
arms. The distribution of these participants are shown by treatment arm. C) Participants selected
for examination of FA treatment effects on PTHMs (secondary outcome: PTHMs). Participants
with PTHM measures at both time points of interest (baseline and week 12) were included in
analyses for the current study to examine the effect of 400 µg FA/day (n = 107) vs placebo (n =
60) for 12 weeks on PTHMs. Abbreviations used: FA, folic acid; FACT, Folic Acid and Creatine
Trial; OCM, one-carbon metabolism; PTHM, posttranslational histone modification
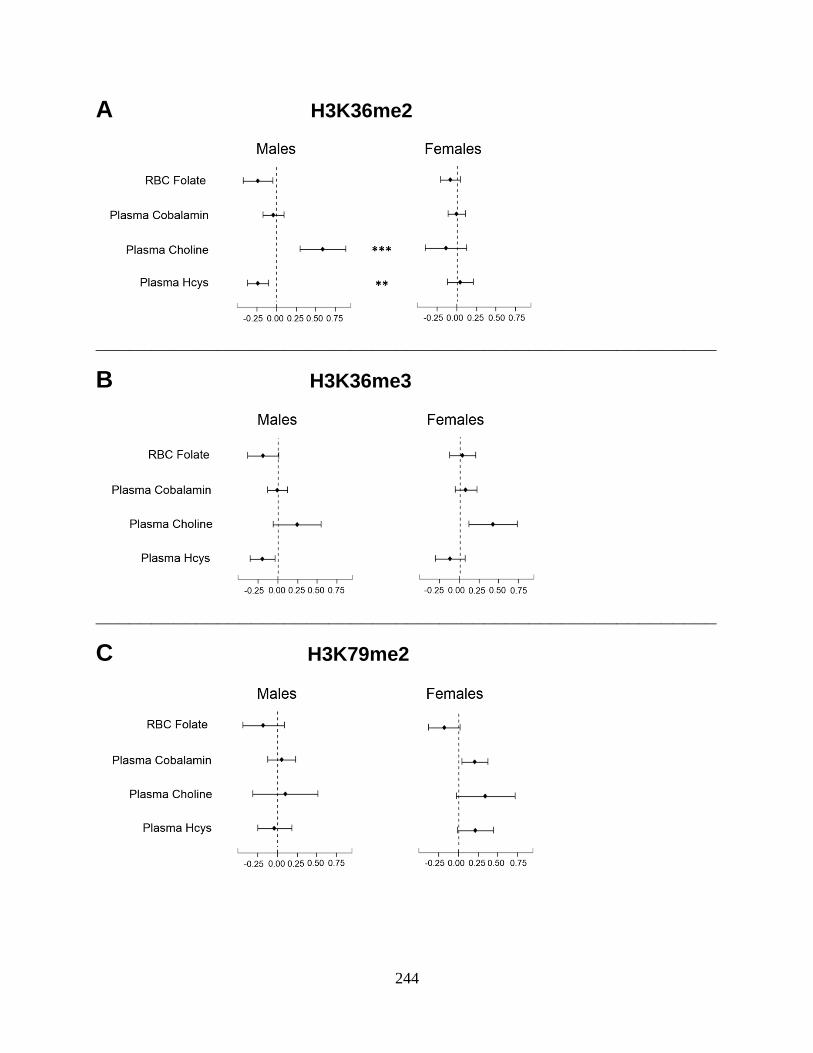
244
A H3K36me2
________________________________________________________
B H3K36me3
________________________________________________________
C H3K79me2
245
Figure S2. Sex-specific associations between OCM indices and PTHMs in FACT participants
with RBC folate measures. Estimated regression coefficients and 95% confidence intervals for
associations between each OCM index and (A) H3K36me2, (B) H3K36me3, and (C) H3K79me2
are shown separately by sex. The dashed line represents the null (β = 0). Associations with
confidence intervals that do not cross the null are statistically significant (P < 0.05). Asterisks
(**P < 0.01, ***P < 0.001) indicate sex differences with P-values calculated from the Wald test.
OCM indices were natural log-transformed and were included simultaneously in models. Models
were adjusted for age, education, TV ownership, and log(bSe). Analyses for H3K36me3 and
H3K79me2 in men were additionally adjusted for cigarette smoking status. H3K36me2 was
inverse-transformed and was modeled using a generalized linear model with an inverse-link
function. H3K36me3 and H3K79me2 were natural log-transformed and were modeled using
linear models. Sample sizes were as follows: H3K36me2: n = 122 for men, n = 123 for women;
H3K36me3: n = 121 for men, n = 118 for women; H3K79me2: n = 125 for men, n = 124 for
women. Abbreviations used: FACT; Folic Acid and Creatine Trial; H3K36me2, di-methylation
at lysine 36 of histone H3; H3K36me3, tri-methylation at lysine 36 of histone H3; H3K79me2,
di-methylation at lysine 79 of histone H3; Hcys, homocysteine; OCM, one-carbon metabolism;
PTHM, posttranslational histone modification; RBC, red blood cell

246
CHAPTER SEVEN SUPPLEMENTAL MATERIAL REFERENCES:
1. Peters BA, Hall MN, Liu X, Parvez F, Sanchez TR, van Geen L, et al. Folic Acid and
Creatine as Therapeutic Approaches to Lower Blood Arsenic: A Randomized Controlled
Trial. Environ Health Perspect. 2015;123(12): 1294-1301.
247
CHAPTER EIGHT
Conclusions and future directions
A. Summary of main findings
The overarching goal of this dissertation was to gain a better understanding of how
nutrients involved in one-carbon metabolism (OCM) influence two mechanisms implicated in
arsenic toxicity. The main objectives were 1) to examine the relationships between S-
adenosylmethionine (SAM), S-adenosylhomocysteine (SAH), and arsenic metabolism, and the
potential modifying effects of folate and cobalamin, two nutrients involved in the OCM pathway,
and 2) to characterize the effects of arsenic and OCM indices on epigenetic modifications, with a
particular focus on posttranslational histone modifications (PTHMs). Since susceptibility to
arsenic toxicity differs by sex [1], we further investigated whether the effects of arsenic and
OCM indices were sex-dependent. We tested these hypotheses using data from three
epidemiological studies in arsenic-exposed Bangladeshi adults: the Folate and Oxidative Stress
(FOX) study, the Folic Acid and Creatine Trial (FACT), and the Bangladesh Vitamin E and
Selenium Trial (BEST).
Chapter 3 (Specific Aims 1a and 1b).
We hypothesized that 1) SAM would be associated with a ↓ proportion of inorganic
arsenical species (%InAs) in blood and urine, 2) the associations between SAM and the
proportions of monomethyl (%MMA) and dimethyl (%DMA) arsenical species in blood and
urine would be modified by folate and cobalamin nutritional status, and 3) SAH would be
associated with an arsenic metabolite profile indicative of reduced methylation capacity (i.e.,
↑%InAs, ↑%MMA, ↓%DMA in blood and urine).
248
Main findings from Chapter 3 (Specific Aims 1a and 1b).
In Chapter 3, we observed that among FOX participants, blood SAM was negatively
associated with the %InAs in urine, while the associations between SAM and the methylated
arsenic metabolites (%MMA and %DMA) differed depending on folate and cobalamin
nutritional status. Among individuals who were deficient for both folate and cobalamin, SAM
was associated with an arsenic metabolite profile indicative of reduced methylation capacity (i.e.,
↑%MMA, ↓%DMA), which has been associated with cancers, cardiovascular disease, and other
adverse health outcomes ([2-7] and reviewed in [8]). Since folate and cobalamin play important
roles in the regeneration of SAM, these findings suggest that when folate and cobalamin
concentrations are low, available SAM is used primarily for the synthesis of MMA, a toxic
intermediate of arsenic metabolism, at the expense of DMA, a less toxic metabolite that is
rapidly eliminated in urine. Although blood SAH was not associated with any of the arsenic
metabolites, plasma homocysteine (Hcys) was associated with an arsenic metabolite profile
indicative of reduced methylation capacity (↑%MMA, ↓%DMA), suggesting that plasma Hcys
may be a better biomarker of hepatic SAH concentrations than blood SAH itself. This is
consistent with a hypothesis by James et al. that Hcys is an “exportable form of SAH” [9]. To
our knowledge, this is the first human study to examine the relationships between SAM, SAH,
and arsenic metabolites.
In Chapter 3, we also observed decreasing ratios of DMA to MMA concentrations in
blood (µg/L) among individuals with increasing concentrations of blood InAs or MMA,
suggesting that both InAs and MMA may inhibit the second arsenic methylation step (i.e., the
methylation of MMA to DMA). While these findings are associative and do not establish

249
causality, they support previous experimental studies conducted in primary rat and human
hepatocytes, which demonstrated that the production of methylated metabolites, particularly
DMA, decrease with exposure to increasing concentrations of InAs [10], and in silico models,
which predict that MMA inhibits its own methylation, likely via substrate inhibition (Michael
Reed and Fred Nijhout, Duke University, personal communication).
Collectively, these findings suggest that individuals deficient for both folate and
cobalamin, and individuals exposed to higher concentrations of arsenic, have a reduced capacity
to completely methylate InAs to DMA. Consequently, these individuals may be more susceptible
to arsenic toxicity.
Chapter 4.
In our early analyses of PTHMs, we identified a specific cleavage product of histone H3
in human peripheral blood mononuclear cells (PBMCs). The objectives of this chapter were to 1)
briefly describe and characterize this cleavage product, 2) determine the prevalence of H3
cleavage among PBMC samples, and 3) evaluate the impact of H3 cleavage on the measurement
of PTHMs located upstream vs. downstream of H3 cleavage sites.
Main findings from Chapter 4.
In Chapter 4, we presented Western blots showing differential cleavage of histone H3 in
a subset of human PBMC samples collected from FACT participants. Although H3 cleavage or
“clipping” has been observed in many other species and in other human cell types (reviewed in
[11-13]), this is the first study to describe H3 cleavage in human PBMCs. We observed extensive
H3 cleavage in approximately one third of the PBMC samples examined. Furthermore, we
demonstrated that PTHMs located downstream of published H3 cleavage sites [14], such as di-
250
methylation at lysine 9 of histone H3, are reduced or non-detectable in samples with extensive
cleavage. In contrast, PTHMs located upstream of cleavage sites, such as di-methylation at lysine
36 of histone H3 (H3K36me2) and di-methylation at lysine 79 of histone H3 (H3K79me2), were
not affected by H3 cleavage.
Currently, it is unclear if H3 cleavage is a biological or methodological phenomenon. A
recent publication provides an in-depth description of the difficulties in distinguishing between
histone degradation and biological histone “clipping” [11]. We did not observe that age, sex,
nutritional status, cigarette smoking status, or most other general characteristics among FACT
participants, were associated with the presence or absence of H3 cleavage in PBMCs. However,
we did observe that H3 cleavage was significantly more prevalent among those who had ever
chewed betel nut, a stimulant and established human carcinogen that is commonly used in parts
of Asia, including Bangladesh [15]. Whether or not this relationship is causal merits additional
investigation.
Regardless of the underlying cause of H3 cleavage, our findings have important
implications for molecular epidemiology studies. Moving forward, Western blot analysis can be
used to screen banked or recently collected samples for histone cleavage to determine if it is
appropriate to measure certain PTHMs. However, previous studies which did not screen for
histone cleavage, and which measured potentially affected PTHMs, should be interpreted with
caution.
Chapter 5 (Specific Aims 2a and b).
We hypothesized that arsenic exposure would be associated with global levels of three
PTHMs located on histone H3: H3K36me2, H3K79me2, and tri-methylation at lysine 36 of

251
histone H3 (H3K36me3), measured in PBMCs collected from FACT participants. These PTHMs
were selected because they are dysregulated in cancers [16-21] and influenced by arsenic and/or
nutritional methyl donors in experimental models [22-25]. We also selected H3K36me2 and
H3K79me2 based on our preliminary data on a) lysine demethylase 2B, a histone demethylase
which targets H3K36me2, and on b) 5-hydroxymethylcytosine (5-hmC) [26], since H3K79me2
has been shown to regulate the expression of TET1, one of the enzymes which converts 5-
methylcytosine (5-mC) to 5-hmC [27, 28]. Our candidate PTHMs are not affected by H3
cleavage. Given that previous studies have observed sex-dependent effects of arsenic on DNA
methylation [26, 29-31] and other PTHMs [32, 33], we further hypothesized that the associations
between arsenic and our candidate PTHMs would differ by sex. We also hypothesized that
PTHMs would be stable after the use of arsenic-removal water filters, since epigenetic
dysregulation may be one mechanism contributing to the persistent cancer risks observed in
populations that were previously exposed to arsenic [34].
Main findings of Chapter 5 (Specific Aims 2a and b).
In Chapter 5, we observed that the associations between creatinine-adjusted urinary
arsenic (uAsCr) and H3K36me2 differed significantly by sex. Arsenic exposure was positively
associated with global levels of H3K36me2 among men, but not women. Our findings support
several previous epidemiological and experimental studies, which have also observed sex-
dependent effects of arsenic on epigenetic modifications [26, 29-33], including PTHMs [32, 33].
In particular, these findings parallel our previous observation that arsenic exposure is positively
associated with global levels of 5-mC among Bangladeshi men, but not women [26]. Since 5-mC
and PTHMs are highly interrelated [35, 36], and since PTHMs are thought to be more labile than
5-mC [35], alterations in H3K36me2 may mediate the sex-dependent effects of arsenic on 5-mC.

252
This has potential public health implications, as DNA hypomethylation has been associated with
an increased risk of developing arsenic-induced skin lesions [37]. Therefore, the potential
mediating effects of H3K36me2 and other PTHMs should be examined in future studies.
In Chapter 5 we also observed that H3K36me2 declined simultaneously with the use of
arsenic-removal water filters. However, in sex-stratified analyses, this was observed among both
men and women and only achieved statistical significance among women. Since we did not have
a comparison group that did not receive arsenic-removal water filters, we cannot rule out the
possibility that the decline in H3K36me2 was caused by extrinsic factors. The potential
reversibility of arsenic-induced alterations in PTHMs, and downstream epigenetic marks such as
DNA methylation, will need to be evaluated in future studies. This is a largely understudied
research area that is important for understanding the contribution of epigenetic dysregulation to
arsenic-induced health outcomes.
Importantly, we did not observe associations between arsenic exposure and either
H3K36me3 or H3K79me2, nor did we observe alterations in these marks as a consequence of
arsenic-removal, suggesting that arsenic exposure does not perturb these PTHMs in PBMCs.
However, we cannot rule out the possibility that arsenic exposure may influence these PTHMs in
other target tissues.
Chapter 6 (Specific Aim 2c).
We hypothesized that uAsCr would be associated with gene-specific DNA methylation
and mRNA expression, measured in whole blood and PBMCs, respectively, collected from
Bangladeshi adults with arsenicosis. Based on our prior research, we were interested in genes
involved in pathways implicated in arsenic toxicity, including OCM, arsenic metabolism,
253
epigenetic regulation, DNA repair, and tumor suppression [38-43]. We selected a total of 47
relevant candidate genes. Since previous studies have observed sex-dependent effects of arsenic
on several epigenetic marks [26, 29-33], we further hypothesized that these associations would
differ by sex.
Main findings of Chapter 6 (Specific Aim 2c).
In Chapter 6, we observed that uAsCr was associated with the differential methylation
and expression of several genes involved in OCM, epigenetic regulation, DNA repair, and tumor
suppression/oncogenesis. Although our findings generally supported previous studies which
evaluated many of the same genes, we identified several novel associations. In particular, we
observed differential methylation or expression of several genes involved in the OCM pathway,
including MTHFR, GAMT, and GNMT, which had not previously been examined in relation to
arsenic exposure.
To our knowledge this was the first large (n = 1799) human study to examine the
relationships between arsenic exposure and gene expression separately in men and women.
Similar to a previous small human study (n = 29) [44], we observed many sex differences. These
findings support our observations from Chapter 5 and the findings of previous studies [26, 29-
33], which demonstrated that arsenic exposure is associated with epigenetic modifications,
including both DNA methylation and PTHMs, in a sex-dependent manner. For many outcomes,
susceptibility to arsenic toxicity has been shown to differ by sex [1]. Sex-specific alterations in
epigenetic modifications, and corresponding changes in gene expression, may be one mechanism
contributing to this.

254
Chapter 7 (Specific Aims 3a and 3b).
We hypothesized that OCM indices, including folate, cobalamin, choline, and betaine
would be associated with higher global levels of histone methylation marks, while Hcys would
be inversely associated with these marks. We additionally hypothesized that folic acid (FA)
supplementation would increase global levels of certain histone methylation marks, since lysine
histone methyltransferases are SAM-dependent enzymes, and several previous studies have
observed that global levels of histone methylation marks are increased by FA or reduced by
folate deficiency [23, 24, 45, 46]. Since arsenic has been shown to alter PTHMs in a sex-
dependent manner [32, 33], and circulating concentrations of OCM indices differ by sex [47, 48],
we further hypothesized that these relationships would differ for men and women.
Main findings of Chapter 7 (Specific Aims 3a and 3b).
In Chapter 7, we observed sex-dependent associations between several OCM indices and
PTHMs. In particular, the associations between choline and H3K36me2, and between cobalamin
and H3K79me2, differed significantly between men and women. Positive associations were
observed between choline and H3K36me2 among men and between cobalamin and H3K79me2
among women. However, 400 µg FA per day for 12 weeks did not significantly influence any of
the PTHMs examined; this finding was consistent with cross-sectional analyses, which did not
find that plasma folate was associated with PTHMs in either men or women. Although our
findings suggest that FA does not alter PTHMs, we cannot rule out the possibility that a higher
dose or a longer duration may alter these PTHMs. It is also possible that other PTHMs, or
PTHMs in other target tissues, may have been affected by this dose of FA for 12 weeks.
255
Nutritional methyl donors have been shown to protect against toxicant-induced epigenetic
dysregulation. For example, one study in mice demonstrated that methyl donor supplementation
prevents DNA hypomethylation caused by in utero exposure to bisphenol A [49]. Folate and
hyperhomocysteinemia have also been shown to modify associations between arsenic and global
levels of DNA methylation in human populations [26, 50]. Nutritional methyl donors may also
protect against or modify arsenic-induced alterations in global PTHMs. However, a more in
depth understanding of the effects of nutritional methyl donors on individual PTHMs is needed.
Our findings suggest that FA supplementation, at a dose based on the recommended dietary
allowance for folate, does not alter global levels of H3K36me2, H3K36me3, or H3K79me2 in
PBMCs. However, choline and cobalamin may influence these PTHMs, and in a sex-dependent
manner. To rule out potential reverse causality, the effects of these nutrients on PTHMs will
need to be confirmed in prospective studies.
B. Future directions
Although our findings begin to fill some of the many gaps in the literature, they also
highlight areas that require additional research. In particular, there is a need for studies which 1)
examine the relationships between blood SAM and SAH concentrations with their respective
concentrations in the liver, 2) evaluate the causes and consequences of histone cleavage, 3)
investigate the impact of arsenic-induced alterations in epigenetic modifications on health and
disease, and 4) examine the potential role of PTHMs in mediating arsenic-induced alterations in
5-mC and 5-hmC. The latter can be more fully examined in the near future, as global 5-mC and
5-hmC levels have been measured in samples collected from the FACT study and are currently
256
being analyzed in relation to arsenic exposure. Other possible future directions are outlined
below.
1. New and complementary approaches
Combining multiplex laboratory techniques with cluster analysis
Until recently, large epidemiological studies were limited to measuring individual
PTHMs. However, multiplex assays are now available which allow for the simultaneous
measurement of PTHMs, and in a relatively high throughput capacity. Since it is the combination
of PTHMs which ultimately influences chromatin structure, these methods may improve the
ability to use PTHMs as biomarkers. Future studies can combine multiplex assays with cluster
analysis to group individuals according to their overall epigenetic profile. For example, multiple
PTHM measures could be combined with 5-mC and 5-hmC measures. This overall epigenetic
profile could then be examined in relation to environmental exposures, such as arsenic, and
related health outcomes. Similar methods have been used previously to predict cancer prognosis
based on PTHM profiles (e.g., see [51]).
Gene-specific approaches
Although our findings contribute to growing evidence that arsenic and OCM indices alter
global levels of PTHMs in a sex-dependent manner [32, 33], there is a dearth of information on
their impacts at the gene-specific level, particularly in humans. This is largely due to the expense
of available laboratory methods. However, as these methods become more affordable, they will
be critical for better understanding the functional consequences of alterations in global PTHMs.
In particular, ChIP-seq, which combines chromatin immunoprecipitation with next generation
sequencing, and ATAC-seq, which maps transposase-accessible chromatin [52], can be used
257
such that arsenic exposure and OCM indices can be examined in relation to PTHM levels within
particular genes and also in relation to the overall chromatin landscape.
Mathematical models
Our group has previously used mathematical models of the OCM pathway to successfully
predict the effect of FA supplementation on blood arsenic concentrations [53]. Recently, DNA
methyltransferases have been incorporated into these models [54]. As we learn more about the
properties and kinetics of enzymes involved in PTHM regulation (e.g., [55-57]), this information
can be incorporated into similar mathematical models to make predictions about how
perturbations in the OCM pathway might affect certain PTHMs. These models could then be
used to inform the selection of nutrients, doses, and candidate PTHMs to examine in future
studies.
2. Discerning the role of exposure timing
Our studies provide compelling evidence that arsenic is associated with PTHMs, DNA
methylation, and gene expression in a sex-dependent manner in adults. However, early life
exposure to arsenic may have more profound effects on epigenetic modifications. The perinatal
period is thought to be particularly vulnerable to epigenetic dysregulation [58], and there is
evidence that individuals are more susceptible to arsenic toxicity after early life exposure. For
example, while most animal models do not develop cancers after exposure to arsenic in
adulthood, in utero exposure to arsenic induces tumor development in adult mice, and in a sex-
dependent manner [59]. There is also evidence from human populations that the risk of
developing cancers and other adverse health outcomes is greater after in utero or early life
exposure to arsenic [60-62]. However, for some outcomes postnatal exposure to arsenic may be
258
more important than prenatal exposure. For example, one study observed that early childhood,
but not prenatal, exposure to arsenic was associated with a lower attained body weight and length
among girls [63].
Few studies have evaluated the importance of exposure timing on arsenic-induced
epigenetic dysregulation. One possibility would be to take advantage of a unique study, nested
within the Health Effects of Arsenic Longitudinal Study (HEALS) cohort, consisting of
adolescents (14-17.5 years) with four different arsenic exposure patterns: 1) low lifetime
exposure (water arsenic <10 µg/L), 2) moderate lifetime exposure (10 µg/L< water arsenic <50
µg/L), 3) high lifetime exposure (water arsenic ≥50 µg/L), and 4) high perinatal exposure (water
arsenic ≥50 µg/L), but moderate exposure thereafter (water arsenic <50 µg/L). PBMCs have
been collected from these adolescents. Thus, epigenetic marks and gene expression can be
examined in relation to these four distinct lifetime exposure patterns to ascertain the contribution
of early life exposure to arsenic. Animal studies, which can easily control the timing of exposure,
can also complement epidemiological studies, such that the contributions of pre- vs. postnatal, or
early vs. late life, exposure to arsenic can be evaluated in relation to epigenetic outcomes.
3. Mechanistic studies of sex differences
The mechanisms underlying the sex-dependent effects of arsenic on epigenetics remain
largely unknown. In epidemiological studies, it is difficult to distinguish between the
contributions of biological sex vs. gender. While it is important to understand the gender-related
factors which contribute to sex differences (e.g., differences in co-exposures, such as UV
radiation and cigarette smoke), it is also essential to understand the contributions of biological
sex. Although animal models of arsenic toxicity have important limitations, they offer many

259
advantages for studying the role of biological sex. One particularly well-suited model is the four
core genotype mouse model (Figure 1), which distinguishes between gonadal vs. genetic
contributions to biological sex differences [64].
Figure 1. Four core genotype mouse model. This model dissociates genetic sex from gonadal
sex. This is accomplished by creating two additional “sex” genotypes by deleting the gene
responsible for testis development (Sry) from the Y chromosome in male animals (XY) and
inserting an Sry transgene in an autosome in female animals (XX). The result is four core
genotypes (clockwise from top left): 1) genetically female animals (XX) without the Sry gene,
which develop ovaries (purple), 2) genetically male animals (XY) without the Sry gene, which
develop ovaries (red), 3) genetically female animals (XX) with the Sry transgene, which develop
testes (green), and 4) genetically male (XY) animals with the Sry gene, which develop testes
(blue). Genetic contributions to sex differences can then be determined by comparing animals
with the same gonads but with different genotypes (e.g., purple compared with red or green
compared with blue). Gonadal contributions to sex differences can be determined by comparing
animals with the same genotype but with different gonads (e.g., purple compared with green or
red compared with blue). Figure adapted from McCarthy et al. [65].
260
The effects of arsenic exposure and nutritional interventions on epigenetic modifications,
gene expression, and tumor development could be examined in this model to better understand
how sex-related genes and/or hormones modify these relationships. Better understanding these
mechanisms will be important for developing public health interventions which effectively
reduce disease burden among both men and women in arsenic-exposed populations.
C. Conclusions
Collectively, the studies presented in this dissertation provide evidence that 1)
deficiencies in folate and cobalamin, and exposure to high arsenic concentrations, reduce arsenic
methylation capacity, and 2) arsenic and OCM indices influence PTHMs in a sex-dependent
manner. This dissertation also presents the first data demonstrating sex-specific associations
between arsenic exposure and gene expression in a large human study and the first evidence
from a randomized clinical trial that FA supplementation for 12 weeks, at a dose based on the
recommended dietary allowance for folate, does not alter global levels of PTHMs in human
PBMCs.
Since arsenic metabolism facilitates urinary arsenic excretion, our data suggest that
individuals who are deficient for folate and cobalamin, and individuals exposed to higher
concentrations of arsenic, may be particularly susceptible to arsenic toxicity. Our findings also
suggest that both arsenic exposure and nutrients involved in the OCM pathway influence PTHMs
in a sex-dependent manner, and that arsenic additionally alters gene-specific DNA methylation
and mRNA expression differentially by sex. While it is tempting to speculate that these findings
may explain some of the sex differences in susceptibility to arsenic toxicity, the clinical
implications of these epigenetic alterations will require further investigation. Nevertheless, our
261
findings contribute to a growing body of evidence that arsenic and OCM indices influence
epigenetic modifications, including PTHMs, and that these effects may differ by sex. Our
findings are timely, given the recent initiative by the National Institutes of Health to better
understand biological sex differences, with the hope that this will reduce inconsistencies between
studies and generate findings that will ultimately lead to improvements in health among both
men and women [66].

262
CHAPTER EIGHT REFERENCES:
1. National Research Council. Critical Aspects of EPA's IRIS Assessment of Inorganic
Arsenic. National Research Council Interim Report. 2013.
2. Melak D, Ferreccio C, Kalman D, Parra R, Acevedo J, Perez L, et al. Arsenic methylation
and lung and bladder cancer in a case-control study in northern Chile. Toxicol Appl
Pharmacol. 2014;274(2):225-231.
3. Chen Y, Wu F, Liu M, Parvez F, Slavkovich V, Eunus M, et al. A prospective study of
arsenic exposure, arsenic methylation capacity, and risk of cardiovascular disease in
Bangladesh. Environ Health Perspect. 2013;121(7): p. 832.
4. Li X, Li B, Xi S, Zheng Q, Wang D, Sun G. Association of urinary monomethylated
arsenic concentration and risk of hypertension: a cross-sectional study from arsenic
contaminated areas in northwestern China. Environ. Health. 2013;12:37.
5. Kuo CC, Howard BV, Umans JG, Gribble MO, Best LG, Francesconi KA, et al. Arsenic
Exposure, Arsenic Metabolism, and Incident Diabetes in the Strong Heart Study.
Diabetes Care. 2015;38(4):620-627.
6. Hsieh RL, Huang YL, Shiue HS, Huang SR, Lin MI, Mu SC, et al. Arsenic methylation
capacity and developmental delay in preschool children in Taiwan. Int J Hyg Environ
Health. 2014;217(6):678-686.
7. López-Carrillo L, Hernández-Ramírez RU, Gandolfi AJ, Ornelas-Aguirre JM, Torres-
Sánchez L, Cebrian ME, et al. Arsenic methylation capacity is associated with breast
cancer in northern Mexico. Toxicol Appl Pharmacol. 2014;280(1):53-59.
8. Steinmaus C, Yuan Y, Kalman D, Rey OA, Skibola CF, Dauphine D, et al. Individual
differences in arsenic metabolism and lung cancer in a case-control study in Cordoba,
Argentina. Toxicol Appl Pharmacol. 2010;247(2):138-145.
9. James SJ, Melnyk S, Pogribna M, Pogribny IP, Caudill MA. Elevation in S-
adenosylhomocysteine and DNA hypomethylation: potential epigenetic mechanism for
homocysteine-related pathology. J Nutr. 2002;132(8): 2361S-2366S.
10. Styblo M, Del Razo LM, LeCluyse EL, Hamilton GA, Wang C, Cullen WR, et al.
Metabolism of arsenic in primary cultures of human and rat hepatocytes. Chem Res
Toxicol. 1999;12(7):560-565.
11. Dhaenens M, Gilbert P, Meert P, Vossaert L, Deforce D. Histone proteolysis: a proposal
for categorization into ‘clipping’and ‘degradation’. Bioessays. 2015;37(1):70-79.
263
12. Azad GK and Tomar RS. Proteolytic clipping of histone tails: the emerging role of
histone proteases in regulation of various biological processes. Mol Biol Rep.
2014;41(5):2717-2730.
13. Zhou P, Wu E, Alam HB, Li Y. Histone cleavage as a mechanism for epigenetic
regulation: current insights and perspectives. Curr Mol Med. 2014;14(9):1164-72.
14. Duncan EM, Muratore-Schroeder TL, Cook RG, Garcia BA, Shabanowitz J, Hunt DF et
al. Cathepsin L proteolytically processes histone H3 during mouse embryonic stem cell
differentiation. Cell. 2008;135(2):284-294.
15. World Health Organization. Betel-quid and Areca-nut Chewing and Some Areca-Nut-
derived Nitrosamines. IARC Monographs on the Evaluation of Carcinogenic Risks to
Humans. 2004;85.
16. Duns G, van den Berg E, van Duivenbode I, Osinga J, Hollema H, Hofstra RM, et al.
Histone methyltransferase gene SETD2 is a novel tumor suppressor gene in clear cell
renal cell carcinoma. Cancer Res. 2010;70(11):4287-4291.
17. Fontebasso AM, Schwartzentruber J, Khuong-Quang DA, Liu XY, Sturm D, Korshunov
A, et al. Mutations in SETD2 and genes affecting histone H3K36 methylation target
hemispheric high-grade gliomas. Acta Neuropathol. 2013;125(5):659-669.
18. He J, Nguyen AT, Zhang Y. KDM2b/JHDM1b, an H3K36me2-specific demethylase, is
required for initiation and maintenance of acute myeloid leukemia. Blood. 2011;117(14):
3869-3880.
19. Tamagawa H, Oshima T, Numata M, Yamamoto N, Shiozawa M. Global histone
modification of H3K27 correlates with the outcomes in patients with metachronous liver
metastasis of colorectal cancer. Eur J Surg Oncol. 2013;39(6):655-661.
20. Bernt KM, Zhu N, Sinha AU, Vempati S, Faber J, Krivstov AV. MLL-rearranged
leukemia is dependent on aberrant H3K79 methylation by DOT1L. Cancer Cell.
2011;20(1):66-78.
21. Zhang L, Deng L, Chen F, Yao Y, Wu B, Wei L, et al. Inhibition of histone H3K79
methylation selectively inhibits proliferation, self-renewal and metastatic potential of
breast cancer. Oncotarget. 2014;5(21):10665.
22. Bistulfi G, Vandette E, Matsui S, Smiraglia DJ. Mild folate deficiency induces genetic
and epigenetic instability and phenotype changes in prostate cancer cells. BMC Biol.
2010;8(1):6.
23. Sadhu MJ, Guan Q, Li F, Sales-Lee J, Iavarone AT, Hammond MC, et al. Nutritional
control of epigenetic processes in yeast and human cells. Genetics. 2013;195(3):831-844.

264
24. Zhang Q, Xue P, Li H, Bao Y, Wu L, Chang S, et al. Histone modification mapping in
human brain reveals aberrant expression of histone H3 lysine 79 dimethylation in neural
tube defects. Neurobiol Dis. 2013;54:404-413.
25. Zhou X, Sun H, Ellen TP, Chen H, Costa M.Arsenite alters global histone H3
methylation. Carcinogenesis. 2008;29(9):1831-1836.
26. Niedzwiecki MM, Liu X, Hall MN, Thomas T, Slavkovich V, Ilievski V, et al. Sex-
specific associations of arsenic exposure with global DNA methylation and
hydroxymethylation in leukocytes: results from two studies in Bangladesh. Cancer
Epidemiol Biomarkers Prev. 2015;24(11):1748-1757.
27. Huang H, Jiang X, Li Z, Li Y, Song CX, He C, et al. TET1 plays an essential oncogenic
role in MLL-rearranged leukemia. Proc Natl Acad Sci U S A. 2013;110(29):11994-
11999.
28. Williams K, Christensen J, Pederson MT, Johansen JV, Cloos PA, Rappsilber J, et al.
TET1 and hydroxymethylcytosine in transcription and DNA methylation fidelity. Nature.
2011; 473(7347):343-348.
29. Pilsner JR, Hall MN, Liu X, Ilievski V, Slavkovich V, Levy D, et al. Influence of
prenatal arsenic exposure and newborn sex on global methylation of cord blood DNA.
PloS One. 2012;7(5):e37147.
30. Broberg K, Ahmed S, Engstrom K, Hossain MB, Jurkovic Mlakar S, Bottai M, et al.
Arsenic exposure in early pregnancy alters genome-wide DNA methylation in cord
blood, particularly in boys. J Dev Orig Health Dis. 2014;5(04):288-298.
31. Nohara K, Baba T, Murai H, Kobayashi Y, Suzuki T, Tateishi Y, et al. Global DNA
methylation in the mouse liver is affected by methyl deficiency and arsenic in a sex-
dependent manner. Arch Toxicol. 2011;85(6):653-661.
32. Chervona Y, Hall MN, Arita A, Wu F, Sun H, Tseng HC, et al. Associations between
arsenic exposure and global posttranslational histone modifications among adults in
Bangladesh. Cancer Epidemiol Biomarkers Prev. 2012. 21(12):2252-2260.
33. Tyler CR, Hafez AK, Solomon ER, Allan AM. Developmental exposure to 50 parts-per-
billion arsenic influences histone modifications and associated epigenetic machinery in a
region-and sex-specific manner in the adult mouse brain. Toxicol Appl Pharmacol.
2015;288(1):40-51.
34. Steinmaus CM, Ferreccio C, Romo JA, Yuan Y, Cortes S, Marshall G, et al. Drinking
water arsenic in northern Chile: high cancer risks 40 years after exposure cessation.
Cancer Epidemiol Biomarkers Prev. 2013;22(4):623-630.

265
35. Cedar H and Bergman Y. Linking DNA methylation and histone modification: patterns
and paradigms. Nat Rev Genet. 2009;10(5):295-304.
36. Rose NR and Klose RJ. Understanding the relationship between DNA methylation and
histone lysine methylation. Biochim Biophys Acta. 2014;1839(12):1362-1372.
37. Pilsner RJ, Liu X, Ahsan H, Ilievski V, Slavkovich V, Levy D, et al. Folate deficiency,
hyperhomocysteinemia, low urinary creatinine, and hypomethylation of leukocyte DNA
are risk factors for arsenic-induced skin lesions. Environ Health Perspect.
2009;117(2):254-260.
38. Hall MN and Gamble MV. Nutritional manipulation of one-carbon metabolism: effects
on arsenic methylation and toxicity. J Toxicol. 2012;2012.
39. Pierce BL, Tong L, Argos M, Gao J, Farzana J, Roy S, et al. Arsenic metabolism
efficiency has a causal role in arsenic toxicity: Mendelian randomization and gene-
environment interaction. Int J Epidemiol. 2013;42(6):1862-1872.
40. Bustaffa E, Stoccoro A, Bianchi F, Migliore L. Genotoxic and epigenetic mechanisms in
arsenic carcinogenicity. Arch Toxicol. 2014;88(5):1043-1067.
41. Applebaum KM, Karagas MR, Hunter DJ, Catalano PJ, Byler SH, Morris S, et al.
Polymorphisms in nucleotide excision repair genes, arsenic exposure, and non-melanoma
skin cancer in New Hampshire. Environ Health Perspect. 2007; 1231-1236.
42. Lai Y, Zhao W, Chen C, Wu M, Zhang Z. Role of DNA polymerase beta in the
genotoxicity of arsenic. Environ Mol Mutagen. 2011;52(6):460-468.
43. Ebert F, Weiss A, Bultemeyer M, Hamann I, Hartwig A, Schwerdtle T. Arsenicals affect
base excision repair by several mechanisms. Mutat Res. 2011;715(1):32-41.
44. Muñoz A, Chervona Y, Hall M, Kluz T, Gamble MV, Costa M. Sex-specific patterns and
deregulation of endocrine pathways in the gene expression profiles of Bangladeshi adults
exposed to arsenic contaminated drinking water. Toxicol Appl Pharmacol.
2015;284(3):330-338.
45. Lambrot R, Xu C, Saint-Phar S, Chountalos G, Cohen T, Paquet M, et al. Low paternal
dietary folate alters the mouse sperm epigenome and is associated with negative
pregnancy outcomes. Nat Commun. 2013;4.
46. Piyathilake CJ, Macaluso M, Celedonio JE, Badiga S, Bell WC, Grizzle WE. Mandatory
fortification with folic acid in the United States appears to have adverse effects on histone
methylation in women with pre-cancer but not in women free of pre-cancer. Int J
Womens Health. 2009;1:131-137.
266
47. Gamble MV, Ahsan H, Liu X, Factor-Litvak P, Ilievski V, Slavkovich V, et al. Folate
and cobalamin deficiencies and hyperhomocysteinemia in Bangladesh. Am J Clin Nutr.
2005;81(6):1372-1377.
48. Konstantinova SV, Tell GS, Vollset SE, Nygard O, Bleie O, Ueland PM. Divergent
associations of plasma choline and betaine with components of metabolic syndrome in
middle age and elderly men and women. J Nutr. 2008;138(5):914-920.
49. Dolinoy DC, Huang D, Jirtle RL. Maternal nutrient supplementation counteracts
bisphenol A-induced DNA hypomethylation in early development. Proc Natl Acad Sci U
S A. 2007;104(32):13056-13061.
50. Pilsner JR, Liu X, Ahsan H, Ilievski V, Slavkovich V, Levy D, et al. Genomic
methylation of peripheral blood leukocyte DNA: influences of arsenic and folate in
Bangladeshi adults. Am J Clin Nutr. 2007;86(4):1179-1186.
51. Seligson DB, Horvath S, Shi T, Yu H, Tze S, Grunstein M, et al. Global histone
modification patterns predict risk of prostate cancer recurrence. Nature.
2005;435(7046):1262-1266.
52. Buenrostro JD, Wu B, Chang HY, Greenleaf WJ. ATAC‐seq: A Method for Assaying
Chromatin Accessibility Genome‐Wide. Curr Protoc Mol Biol. 2015;21.29.1-9.
53. Lawley SD, Cindarella M, Hall MN, Gamble MV, Nijhout HF, Reed MC. Mathematical
model insights into arsenic detoxification. Theor Biol Med Model. 2011;8(31):1742-
4682.
54. Reed MC, Gamble MV, Hall MN, Nijhout HF. Mathematical analysis of the regulation of
competing methyltransferases. BMC Syst Biol. 2015;9(1):69.
55. Luka Z, Pakhomova S, Loukachevitch LV, Calcutt MW, Newcomer ME, Wagner C.
Crystal structure of the histone lysine specific demethylase LSD1 complexed with
tetrahydrofolate. Protein Sci. 2014;23(7):993-8.
56. Chin HG, Patnaik D, Esteve PO, Jacobsen SE, Pradhan S. Catalytic properties and kinetic
mechanism of human recombinant Lys-9 histone H3 methyltransferase SUV39H1:
participation of the chromodomain in enzymatic catalysis. Biochemistry. 2006;45(10):
3272-3284.
57. Horiuchi KY, Eason MM, Ferry JJ, Planck JL, Walsh CP, Smith RF, et al. Assay
development for histone methyltransferases. Assay Drug Dev Tech. 2013;11(4):227-236.
58. Faulk C and Dolinoy DC. Timing is everything: the when and how of environmentally
induced changes in the epigenome of animals. Epigenetics. 2011;6(7):791-797.
267
59. Waalkes MP, Ward JM, Liu J, Diwan BA. Transplacental carcinogenicity of inorganic
arsenic in the drinking water: induction of hepatic, ovarian, pulmonary, and adrenal
tumors in mice. Toxicol Appl Pharmacol. 2003;186(1):7-17.
60. Marshall G, Ferreccio C, Yuan Y, Bates MN, Steinmaus C, Selvin S, et al. Fifty-year
study of lung and bladder cancer mortality in Chile related to arsenic in drinking water. J
Natl Cancer Inst. 2007;99(12):920-928.
61. Smith AH, Marshall G, Yuan Y, Ferreccio C, Liaw J, von Ehrenstein O, et al. Increased
mortality from lung cancer and bronchiectasis in young adults after exposure to arsenic in
utero and in early childhood. Environ Health Perspect. 2006;114(8):1293-1296.
62. Yuan Y, Marshall G, Ferreccio C, Steinmaus C, Selvin S, Liaw J, et al. Acute myocardial
infarction mortality in comparison with lung and bladder cancer mortality in arsenic-
exposed region II of Chile from 1950 to 2000. Am J Epidemiol. 2007;166(12):1381-
1391.
63. Saha KK, Engstrom A, Hamadani JD, Tofail F, Rasmussen KM, Vahter M. Pre-and
postnatal arsenic exposure and body size to 2 years of age: a cohort study in rural
Bangladesh. Environ Health Perspect. 2012;120(8):1208.
64. Arnold AP and Chen X. What does the “four core genotypes” mouse model tell us about
sex differences in the brain and other tissues? Front Neuroendocrinol. 2009;30(1):1-9.
65. McCarthy MM, Arnold AP, Ball GF, Blaustein JD, De Vries GJ. Sex differences in the
brain: the not so inconvenient truth. J Neurosci. 2012;32(7):2241-2247.
66. Clayton JA and Collins FS. NIH to balance sex in cell and animal studies. Nature. 2014;
509(7500):282-283.
Copyright © 2022 FDOKUMEN