dendrite interplay during axonal regrowt - Lirias
255
Mitochondrial dynamics and autophagy as underlying mechanisms for an antagonistic axon- dendrite interplay during axonal regrowth An Beckers Supervisor: Prof. L. Moons Co-supervisor: Prof. G. Baggerman Members of the Examination Committee: Prof. L. Arckens Prof. V. Darras Prof. P. de Witte Dr. Tine Verreet Prof. E. Yaksi Dissertation presented in partial fulfilment of the requirements for the degree of Doctor of Science: Biochemistry and Biotechnology July 2020
-
Upload
khangminh22 -
Category
Documents
-
view
0 -
download
0
Transcript of dendrite interplay during axonal regrowt - Lirias

Mitochondrial dynamics and autophagy as
underlying mechanisms for an antagonistic axon-
dendrite interplay during axonal regrowth
An Beckers
Supervisor:
Prof. L. Moons
Co-supervisor:
Prof. G. Baggerman
Members of the Examination
Committee:
Prof. L. Arckens
Prof. V. Darras
Prof. P. de Witte
Dr. Tine Verreet
Prof. E. Yaksi
Dissertation presented in partial
fulfilment of the requirements for the
degree of Doctor of Science:
Biochemistry and Biotechnology
July 2020

© 2020 KULEUVEN, SCIENCE
Uitgegeven in eigen beheer, An Beckers, Kessel-Lo
Alle rechten voorbehouden. Niets uit deze uitgave mag worden vermenigvuldigd en/of openbaar
gemaakt worden door middel van druk, fotokopie, microfilm, elektronisch of op welke andere wijze
ook zonder voorafgaandelijke schriftelijke toestemming van de uitgever.
All rights reserved. No part of the publication may be reproduced in any form by print, photoprint,
microfilm, electronic or any other means without written permission from the publisher.

I
ACKNOWLEDGEMENTS
Een hete zomerdag in Breskens, juli 2015. Met een groepje vrienden van Biochemie gingen we
het einde van onze master vieren, onze laatste zomer voor het ‘echte’ leven zou beginnen. We waren
net het (grandioos teveel aan) eten en drinken weg aan het zetten, klaar om erin te vliegen en te
genieten, toen plots mijn telefoon rinkelde: de voorzitster van de jury L’Oréal/UNESCO for Women in
Science met de boodschap dat ik een PhD-fellowship zou krijgen. Zo enthousiast als ik was, zo
geschrokken was mijn medethesisstudent en toekomstige collega Jurgen … “Wa?!! Gij gaat voor
L’Oréal werken? In Brussel dan ofwa?”.
Dat telefoontje en Jurgens onvergetelijke reactie vormden het startschot voor mijn doctoraat,
niet in Brussel, maar wel in Leuven in hetzelfde labo als waar ik mijn thesis heb gedaan, en jawel, terug
met zebravissen. Zes jaar geleden had ik van deze beestjes nog nooit gehoord, maar ondertussen heb
ik misschien al meer in de ogen van zebravissen gestaard, dan in die van mijn eigen vriend … Sorry
Ralph! Nu op het einde van de rit ben ik ongelofelijk trots dat, na de gekende ups-and-downs, ik
eindelijk dit boekje in mijn handen heb. Mijn thesis is wel wat langer geworden dan dat ik voorzien
had, maar hetzelfde kan ik zeggen over mijn dankwoord. Dit komt omdat ik er rotsvast van overtuigd
ben dat ik dit doctoraat nooit alleen had kunnen afmaken, dit is het werk van een wetenschappelijk
team en ook van een groepje supporters. Ik vertik het dan ook om dit dankwoord in te korten want
jullie verdienen niet enkel een woord, maar een paar pagina’s van dank.
Ik wil enorm graag mijn promotor Prof. Lieve Moons bedanken, en dit zonder twijfel als
allereerste (en niet enkel omdat dat de etiquette is!). Lieve, als er één iemand is die het mogelijk heeft
gemaakt om dit werk te realiseren, ben jij dit wel. Bedankt voor het vertrouwen in mij en de kans om
in jouw labo een doctoraat te mogen starten, maar bovenal merci voor het voortdurend aanbrengen
van nieuwe ideeën, jouw onvermoeibaar enthousiasme, de kritische inbreng (en de lekkere koekskes)
tijdens de brainstorm meetings en de vele uren verbeterwerk aan dit boekje. Doorheen de jaren ben
ik dankzij jou niet enkel gegroeid als wetenschapper, maar ook als mens, waarbij leren relativeren en
zaken op tafel gooien als je ergens mee zit, de belangrijkste programmapunten waren. Ik heb dan ook
geregeld bij ons de trap genomen naar jouw bureau, en vaak nog hijgend (ik moet dringend afleren
om die trap half spurtend op te rennen) gevraagd “Lieve, mag ik eventjes komen storen? Ik moet je
iets vragen”. Bedankt dus dat jouw deur, letterlijk en figuurlijk, altijd open stond! Daarnaast wil ik ook
mijn co-promotor Prof. Geert Baggerman bedanken voor zijn uitstekende hulp bij het uitvoeren van
het proteomics experiment en de suggesties voor het verwerken van deze data.
I would also like to express my gratitude to the members of the examination committee for
taking time to critically read and evaluate this thesis. Your constructive comments/feedback improved
this manuscript and the advised future experiments will certainly add value to our research.
“Beter een goede buur dan een verre vriend”, zeggen ze altijd, maar dit geldt misschien nog
wel meer voor goede collega’s. Dag in, dag uit hebben we wetenschappelijke frustraties,
euforiemomenten, een koffietje, en zoveel meer met elkaar gedeeld. Niet de zebravissen of de muizen,
niet de pipetten of de cryostaat en niet de artikels of de FWO-projecten, maar wel jullie vormen voor
mij het kloppende hart en de warme glimlach van ons labo. Een welgemeende, dikke merci om van de
Naamsestraat 61 een enorm aangename werkplek te maken! En hoewel ik onze wetenschappelijke
discussies of het samen voorbereiden van experimenten zeer sterk apprecieer, heb ik toch nog meer
genoten van onze lunchmomenten op ons paars picknickkleed in het park, de bowling/pooluitjes, de

II
kerstfeestjes, de spelletjesavonds, en uiteraard de geweldige laboweekends (bedankt aan al de
organisatoren!).
Mijn eerste collega’s die ik graag wil bedanken zijn de dierenverzorgers Véronique, Arnold en
Evelien. Gezonde proefdieren vormen de basis van elk uitgevoerd experiment en daarom hebben jullie
voor onze onderzoeksgroep zo’n onmisbare en centrale rol. Ik heb het even uitgerekend: sinds mijn
thesisjaar hebben de visjes ongeveer 2100 keer artemia en droogvoer gekregen en telkens, met
uitzondering van de weekends, feestdagen en kerstvakanties, waren jullie de personen die ervoor
hebben gezorgd dat onze zwemmende vriendjes geen honger moesten lijden. Ik denk dus dat niet
alleen ik, maar ook zij, jullie zeer dankbaar zijn!
Lut, Marijke, Evert en Stéphanie, bedankt voor jullie technische hulp en tijd die jullie in dit
project hebben gestoken. Lut, ik denk dat niemand uit ons labo zo een uitgebreide functiebeschrijving
heeft als jij: laborant, manager van het labogebeuren, technische ondersteuning, manusje-van-alles,
portier, redder in nood, … Een hele dikke merci dus voor de algemene hulp en zeker en vast ook voor
het uitvoeren van vele kleuringen/WBs, het snijden van cryocoupes en proteïnebepalingen. Marijke,
vibratoomcoupes snijden van zebravishersenen en DAB/whole mount kleuringen, met twee vingers in
de neus heb je dit telkens voor mij uitgevoerd. Enorm bedankt dat ik altijd op je kon rekenen en voor
het mooie resultaat dat ik keer op keer te zien kreeg!
Daarnaast ben ik ook enorm blij en dankbaar voor de hulp en vriendschap van al de
doctoraatsstudenten en postdocs die ik doorheen de jaren heb leren kennen. Naast Pieter, Kim, Jessie,
Emiel, Ilse, Anne, Lies, Marjan, Géraldine, Astrid, Anna, Tania, Manuela, Ruth en Ali wil ik graag een
paar collega’s extra in de kijker zetten.
Evy, ondertussen ben je jammer genoeg niet meer in ons labo, maar wat een zalige overbuur
ben je al die jaren voor mij geweest! “Psst, Evy” en een halve seconde later stak jouw hoofd al naast
het scherm om mij met raad en daad bij te staan als ik weer maar eens een vraag had over WB, over
de praktische kanten van het maken van een thesis of gewoon om even te bespreken wie dat zojuist
was die langs onze bureau passeerde. Je was een fantastisch eilandhoofd en stiekem ben je dat nog
steeds aangezien de officiële overdracht tijdelijk is uitgesteld. Door de coronacrisis is het besef er bij
mij nog niet helemaal dat je weg bent, maar ik ga jou enorm missen in het labo, een bezoekje samen
met Amélie moet er dus snel eens van komen!
Jurgen en Lien, samen hebben we onze eerste stappen gezet in labo Moons en dat schept toch
een band. Onze ettelijke nachtelijke cryofoto’s, de book of love zangpartijtjes in het groot labo, het
samen schrijven (of Samson en Gert kijken) in het studentenlokaal, het maakt allemaal deel uit van dat
belangrijke laatste jaar als student. Ik vind het echt fantastisch dat we alle drie dit jaar samen doctor
zullen worden, we hebben ons ‘klasje’ biochemie en biotechnologie goed vertegenwoordigd! Jurgen,
bedankt dat ik altijd op u kon rekenen als ik een mening over een bepaalde figuur nodig had, als mijn
handschoenen plots in brand vlogen of wanneer ik echt geen zin had om te noteren bij de labomeetings
en jij wel wilde overnemen. Een merci in de vorm van een Duveltje zal uiteraard snel volgen. Lien,
meermaals heb ik aan jouw bureau gestaan om advies over een experiment te vragen, maar ook na
het werk hebben we vaak genoeg onze hoofden bij elkaar gestoken om een laboweekend of afscheid
van iemand voor te bereiden, met regelmatig een opgenomen liedje als resultaat. Of de wereld hier
nu echt op wachtte, dat laat ik in het midden, maar plezant vond ik het zeker wel!
Lien Veys en Marie, merci dat jullie er voor mij waren op het moment dat ik heel erg hard nodig
had. Jullie zijn echt zo’n lieve en toffe dames!

III
Annelies, ik ben met m’n gat in de boter gevallen met jou als allereerste thesisstudent en wat
ben ik blij dat je sinds een paar jaar ook deel uitmaakt van ons groot zebravisonderzoeksteam, met
momenteel welgeteld twee leden! We mogen echt fier zijn dat we, samen met de hulp van de
dierenverzorgers, de visfasciliteit up and running houden. Ik heb het trouwens énorm gemist tijdens
de afgelopen periode om elke dag langs je te zitten want je weet de dag wel altijd op te fleuren met
een leuk verhaal en ook het wetenschappelijk overleggen gaat toch wat vlotter in real life dan via
Whatsapp of Skype for business. Annelies, ik apprecieerde je echt al tijdens je thesisjaar, maar nu als
collega nog 1000 keer meer want jouw wetenschappelijk ideeën en onze ontelbare
overleggingsmomentjes zijn voor mij simpelweg onmisbaar op het labo. Ik vind ons echt een topteam!
Luca, from all the people in our lab, you are definitely the one who taught me the most. Thanks
for all your help, especially with the Python Script. We have conquered donut-shaped mitochondria
and Opa1 sausages and together, we have eaten them alive! Thank you for not judging my need to use
paint, for the countless discussions on the mitochondrial data and for answering the same questions
about the script over and over again (AUC or not?). My sweet Italian friend, it’s safe to say that you are
definitely not in my top ten list of things I don’t give a …. about!
Steven, de overgang van Luca naar u is heel eenvoudig te maken. Wat een geweldig duo zijn
jullie (idiot and idiot, zoals je zelf zegt), onbeschrijfelijk! Jullie verwachte en onverwachte bezoekjes
aan mijn balkon ten tijde van corona waren dan ook altijd enorm welkom, een periode die voor mij
symbolisch (voorlopig) geëindigd is met dat eerste zonnige Kubbavondje. Steven, ook al ben je nog niet
zo lang als PhD student aan de slag, je toont al enorm veel inzicht, geeft veel nuttige input tijdens de
labomeetings en werkt ongelofelijk hard. Ik heb nog maar weinig studenten zo vlot aan een doctoraat
weten te beginnen dus ik ben er zeker van dat je op het einde een fantastisch mooi werk zal afleveren.
Moest jouw wetenschappelijke carrière dan toch op niets uitdraaien, zal er zeker en vast wel een
mooie positie bij Zebtec, Altec of elke andere ‘tec’ beschikbaar voor jou zijn, want jij bent van alle
markten thuis.
Maar ook buiten het labo wil ik een aantal lieve mensen bedanken. Sophie (een specialleke
dat eigenlijk ook hierboven thuis hoort), Lina en Elise, onze meisjesgroep uit Leuven, bedankt om er
voor mij te zijn de afgelopen jaren, voor de pogingen om mij vis te leren eten en voor onze zalige door-
de-weekse vriendinnenavondjes die mij instant een weekendgevoel gaven. Sophie, je bent een collega
uit de duizend (sinds kort zijn we zelfs co-auteurs!), maar ook een echte hartsvriendin én uiteraard de
officiële meter van Fons. Ik ben trouwens benieuwd of er ooit iets komt van al die businessplannen die
we hebben opgesteld, op momenten dat we hiertoe eigenlijk niet in staat waren … Zo niet, dan hebben
we toch in ieder geval wel al de beste moelleux van heel de wereld gemaakt, eentje waardoor je begint
te rollen op de grond van het lachen! Liefste Elise, ik denk dat het meant-to-be was dat je de wereld
rond hebt gereisd, uiteindelijk in België bent beland en ons hebt leren kennen om dan ook nog eens
verschillende vriendengroepen bij elkaar te brengen. Bedankt om ons zo vaak mee te nemen naar één
van je vroegere woonplaatsen, Den Haag/Scheveningen, ik ben er helemaal kind aan huis nu! Ik ben
trouwens enorm blij dat we ongeveer samen afleggen want de onzekerheid over de impact van corona
op het einde van ons doctoraat was echt niet plezant, maar aangezien jij hetzelfde doormaakte,
hebben we elkaar daarin wel heel goed gesteund. Elise, je bent echt een topgriet! Lina, absoluut de
leukste ginger ever, bedankt om mij altijd te doen lachen met je heerlijke verhalen/uitspraken. Je zorgt
echt voor de sfeer in onze groep en een vriendinnenavondje zonder jou erbij is dan ook echt niet
hetzelfde! Ik heb trouwens enorm genoten van onze recente lockdown fietstochtjes doorheen de
mooie streken van Leuven, samen even weg zijn, moeten we zeker blijven doen. Tegen jou kan je echt

IV
alles vertellen want je weet dat je geen oordeel zal vellen, bedankt daarvoor. Lize, ook al woon je niet
meer in Leuven, je hoort nog steeds wel bij ons Leuvengroepje. Ik zal nooit de allereerste momenten
aan de universiteit vergeten, letterlijk na de eerste vijf minuten op de campus, hadden wij al de basis
gelegd voor onze jarenlange vriendschap. Dat Limburgs bloed trekt elkaar aan, denk ik! Hoe vaak
hebben we die eerste maanden toch gedacht ‘waar zijn wij in godsnaam terecht gekomen. Hoeveel
rare mensen kunnen er in onze richting zitten …’. Gelukkig hadden we elkaar. Jammer dat dit jaar Tokio
niet is kunnen doorgaan, we hadden met de meisjes onze pyjamaparty al gepland zodat we midden in
de nacht samen voor jou konden supporteren. 2021 wordt jouw jaar, daar ben ik zeker van!
Lotte, Laure en Marjoleine, we go way back. Vanaf dat een vriendschap tien jaar duurt, is het
voor het leven en wij zijn die symbolische grens al lang gepasseerd, zit dik in de sacoche dus! We zien
elkaar misschien niet wekelijks, maar dat is geen probleem aangezien onze band enorm sterk is. Jullie
betekenen voor mij zoveel … Lieve vriendinnetjes, ik wil jullie bedanken voor de steun als ik mijn PhD
zorgen op tafel gooide, of voor jullie advies bij een situatie op het werk, maar vooral om mij vaak uit
het hele doctoraatsgebeuren te halen. Onze gezellige ontbijtjes, shopnamiddagen, terrasjes of
weekendjes weg zijn keer op keer gevuld met talloze verhalen, lachbuien en hechte vriendschap. We
hebben al zoveel fases en belangrijke momenten van ons leven met elkaar kunnen delen en mijn
droom is dat we dat voor altijd kunnen blijven doen, totdat we samen als oude omaatjes trots onze
achterkleinkinderen aan elkaar kunnen tonen, met een lekker stukje taart en glaasje champagne erbij.
Dat zou fantastisch zijn!
Thanks ook aan de Keunings, uiteraard uitgedost in Bralph Lauren. Jullie bezorgden me de
afgelopen jaren tientallen memorabele avondjes, festivals en weekendjes! Dankzij jullie ben ik een kei
in kansberekeningen, ken ik nu de juiste uitspraak van H2O, en weet ik hoe joggen en zingen te
combineren valt.
Ben en Anne-Cathérine, jullie thuis is een warm nest waarin Ralph en ik bijna wekelijks welkom
zijn. Zalig toch dat we over een paar jaar op 8 minuten van elkaar zullen wonen. Dat kan geen toeval
zijn dus die gewoonte zullen we moeten blijven behouden …
Tim, Ben en Jomme, de patres familias van Whatskeburt?!, jullie kunnen toch echt niet
ontbreken uit dit lijstje, daarvoor zijn teveel toffe herinneringen aan jullie gelinkt. Ik vond het echt heel
fijn dat jullie erbij waren bij de zalige Moodstock (en andere) feestjes, de vele barbecues,
zwempartijtjes en bedankt ook om de middelbare schooltijd op te fleuren met al jullie fratsen en
imitaties (80% van de keren waren ze grappiger dan het originele!).
Vervolgens wil ik ook mijn schoonfamilie bedanken. Richard en Kathleen, jullie energie en
enthousiasme aan de eettafel werkt altijd heel aanstekelijk en dit zorgde er dan ook voor dat ik me
heel erg welkom voelde vanaf de eerste momenten dat ik in Aartselaar was. Ik ben er trouwens vrij
zeker van: ooit gaan we die Win for Life eens binnenhengelen! En zo niet, dan hebben we toch elke
Kerst eventjes dat gevoel van spanning en bijna-euforie meegepikt, keer op keer geweldig. Diane en
Peter, bedankt om zo een toffe, warme, behulpzame schoonouders voor mij te zijn. Jullie zijn er altijd
voor mij en Ralph, geven wijze en waardevolle raad, maar laten ons uiteindelijk ook ons ding doen en
dat is niet zo vanzelfsprekend. Bij jullie thuis kan je gemakkelijk tot rust komen, genieten van Diane’s
lekker eten of samen in het zonnetje lezen, heerlijk! Peter, ongelofelijk hoe je mijn eerste artikel 3
dagen lang hebt bestudeerd, extra dingen hebt opgezocht, mij nog wat vragen hebt gesteld, totdat je
helemaal mee was met het verhaal. Jouw interesse in mijn onderzoek vond ik geweldig en ik heb dan

V
ook met heel veel trots de foto’s van jouw ontelbare aantekeningen bij mijn artikel aan vele mensen
laten zien.
En dan een grote dankjewel voor mijn broers, schoonzussen en neefjes. Kim, Wim, Tim
en Tom, ik ben heel blij en dat ik jullie kleine zus ben! Weinigen kunnen zeggen dat ze vier broers
hebben, maar ik zou me echt niets beters kunnen inbeelden. Michèle en Heidi, een beetje de zussen
die ik nooit heb gehad, heel fijn dat jullie er vaak bij zijn om toch de verhouding man/vrouw wat meer
in evenwicht te brengen ten huize Beckers, maar uiteraard ook voor de vele gezellige en toffe babbels!
Ik geniet er echt van als jullie erbij zijn. Emiel, Arthur en Bram, ik vind het fantastisch om jullie te zien
opgroeien als stoere, knappe jongens. Jullie hebben mij de afgelopen jaren enorm doen lachen met
jullie gespetter in het zwembad, jullie fantasievolle verhalen en jullie speelse karaktertjes.
Lieve mama en papa, jullie verdienen een heel speciaal plekje in dit dankwoord. Vijf kinderen
hebben jullie grootgebracht en allemaal hebben ze de kans gekregen om te studeren. Ik weet niet hoe
jullie dit voor elkaar hebben gekregen, maar ik heb tonnen respect voor jullie. Jullie mogen apetrots
zijn op wat jullie verwezenlijkt hebben! Zonder jullie onvoorwaardelijke steun, goede zorgen,
luisterend oor en wekelijkse telefoontjes tijdens mijn studies en doctoraat was dit werk nooit mogelijk
geweest. Mijn batterijen opladen om in een nieuwe werkweek te vliegen, dat kon ik steevast bij jullie
in het weekend. Gezellig met z’n allen in de tuin in het zonnetje, of voor de stoof in de zetel, voor mij
is een bezoek aan Peer altijd een beetje zoals op vakantie gaan. Papa (een man van weinig woorden
maar van zoveel geweldige daden) en mama (een vrouw die je kan omschrijven als warm, positief en
ontzettend zorgzaam), woorden schieten tekort om duidelijk te maken wat voor een fantastische
ouders jullie zijn, dus kan ik enkel maar zeggen: bedankt voor alles.
Saved the best for last … onze katten Fons en Mieke. Nee nee, Ralph, hier verdien jij te staan!
Je vond dat onze panter en tijger absoluut ook in het dankwoord moesten staan en inderdaad, het is
zot hoeveel we aan deze beestjes hebben en hoe hard we samen telkens ernaar uitkijken om ze terug
te zien na een weekendje weg, maar lieve schat, dat valt niet te vergelijken met hoe ongelofelijk graag
ik jou zie. Ik heb meer dan 200 pagina’s volgeschreven over dendrieten, mitochondriën en RGC’s, maar
wees gerust, hetzelfde zou ik kunnen doen over de redenen waarom ik jou boven iedereen verkies,
over onze geweldige reizen en over hoe ik de toekomst alleen met jou samen wil doorbrengen. Bij dat
laatste hoort uiteraard het bouwen van onze toekomstige thuis. Dit is een grote (soms zelfs enge) stap,
maar ik ben hier echt ENORM enthousiast over en dit vooral omdat we dit echt samen kunnen doen.
Ik kan niet wachten om hier ons leven verder uit te bouwen. Lieve Ralph, eeuwige dank om mij tijdens
de afgelopen jaren te steunen en om te proberen begrijpen wat een doctoraat inhoudt. Op de
momenten dat ik het minder zag zitten, was jij er telkens om mij op te beuren, of om, als dit niet
werkte, een spreekwoordelijke ‘sjot onder mijn gat’ te geven. Ik bewonder echt dat jij zo goed weet
wat je wilt op verschillende vlakken, dat je zoveel moed en durf vertoont en geen risico’s uit de weg
gaat. Dat ligt minder in mijn aard en net daarom ben je voor mij een echte inspiratiebron. Bedankt
voor je liefde en steun de afgelopen jaren, om mij elke dag te doen lachen, om de spaghetti op te
warmen en de vuilniszakken buiten te zetten, om mijn allerbeste vriend te zijn, en vooral om de ultieme
reden te zijn om na het werk met een grote glimlach naar huis te fietsen. Duizendmaal dank!
Heel erg bedankt aan iedereen. Ik beschouw jullie allemaal een beetje als co-auteurs van deze thesis.
An

VI

VII
TABLE OF CONTENTS
Acknowledgements …………..…………………………………………………………………………………………I
Table of contents …….………..…………………………………………………………………………………...…VII
List of abbreviations …...…………………………………………………………………………………………..…IX
Nomenclature guidelines ……………………………………………………………………………………..…XIII
Preface ……………….………………….……………………………………………………………………………..…XV
Chapter 1. General introduction……………….…………………….…………………………………………..1
Chapter 2. Potential underlying mechanisms for an antagonistic axon-dendrite
interplay ……………….…………………….……………………………………………….…………………………..27
Chapter 3. Identification of an antagonistic axon-dendrite interplay after ONC
in adult zebrafish ……………….…………………………………………….………………………………..……..57
Chapter 4. Mitochondrial dynamics after ONC in the zebrafish retinotectal system,
with a closer look at the role of fission in axon repair……………….………………………………...105
Chapter 5. The role of autophagy in axonal regeneration after ONC
in adult zebrafish ……………….…………………………………………………………………………………...161
Chapter 6. General discussion and future perspectives………………………..…………………...195
Summary ………………………………………………………………………………………….……………………227
Samenvatting ……………………………………………..…….……………………………….……………………229
List of publications ……..………….…………………….…………………………….………………………..…232

VIII

IX
LIST OF ABBREVIATIONS
3-MA 3-methyladenine
AC Aspiration chamber
ACT Acetylated-tubulin
AD Alzheimer’s disease
ADP Adenosine diphosphate
AIS Axon initial segment
ALS Amyotrophic lateral sclerosis
ANOVA Analysis of variance
ARMCX1 Armadillo repeat containing X‐linked 1
ATG Autophagy related gene
ATP Adenosine triphosphate
BAX Bcl2-asscoiated protein
BBB Blood-brain barrier
BCL2 B-cell lymphoma 2
BDNF Brain-derived neurotrophic factor
BFP Blue fluorescent protein
cAMP Cyclic adenosine monophosphate
CCCP Carbonyl cyanide m-chlorophenyl hydrazon
CHAT Choline acetyltransferase
CID Collision induced dissociation
CMV Cytomegalovirus
CMZ Ciliary marginal zone
CNS Central nervous system
CNTF Ciliary neurotrophic factor
COX8 Cytochrome c oxidase subunit 8
CRISPR/Cas Regulary interspaced short palindromic repeats/CRISPR-associated
CRMP5 Collapsin response mediator protein 5
CSPG Chondroitin sulfate proteoglycan
Cy3 Cyanine 3
DAPI 4’,6’-diamono-2-phenylindole
DE Differentially expressed
DLR Dorsal light reflex
DMSO Dimethyl sulfoxide

X
DNA Deoxyribonucleic acid
dpi Days post-injury
DRG Dorsal root ganglion
DRP1 Dynamin-related protein 1
ECM Extracellular matrix
EGFP Enhanced green fluorescent protein
EM Electron microscopy
ENO Enolase
ER Estrogen-receptor controlled
ERG Electroretinogram
FACS Fluorescence-activated cell sorting
FADH2 Flavin adenine dinucleotide
FIS1 Fission 1 protein
FITC Fluorescein isothiocyanate
GAP-43 Growth-associated protein 43
GFAP Glial fibrillary acid protein
GFP Green fluorescent protein
GLT Glutamate transporter
GLUT Glucose transporter
GTP Guanine triphosphate
h Hour
H&E Hematoxylin and eosin
HB-GAM Heparin-binding growth-associated molecule
HCD High energy collision activated dissociation
HIF1 Hypoxia-inducible factor
hpf Hours post-fertilization
hpi Hours post-injury
HPRT1 Hypoxanthine phosphoribosyl-transferase 1
HRP Horseradish peroxidase
HSP Heat-shock protein
IGF-1 Insulin-like growth factor 1
IHC Immunohistochemistry
INL Inner nuclear layer
IOP Intraocular pressure
IPL Inner plexiform layer

XI
JAK Janus kinase
KEGG Kyoto encyclopedia of genes and genomes
KGH Ketoglutarate
KLF Krüppel-like factor
LAMP Lysosome-associate membrane protein
LAP Lc3-associated phagocytosis
LC3 Microtubule-associated protein 1A/1B-light chain 3
LDH Lactate dehydrogenease
LIF Leukemia inhibitory factor
LPS Lipopolysacharide
LTQ Orbitrap velos quadropole
MAG Myelin-associated glycoprotein
MAI Myelin-associated inhibitor
MAP2 Microtubule-associated protein
MCT Monocarboxylate transporter
MFF Mitochondrial fission factor
MFN Mitofusin
MIRO Mitochondrial Rho GTPase
MMP Matrix metalloproteinase
mRNA Messenger ribonucleic acid
MS Mass spectrometry
mtDNA Mitochondrial deoxyribonucleic acid
MTFP1 Mitochondrial fission process protein 1
mTOR Mechanistic target of rapamycin
MTP18 Mitochondrial fission process 1,18 kDa
NADH Nicotinamide adenine dinucleotide
NCAM Neural cell adhesion molecule
NFL Nerve fiber layer
NMDA N-methyl-D-aspatate
Nogo-A Neurite outgrowth inhibitor A
OLIG2 Oligodendrocyte transcription factor 2
ONC Optic nerve crush
ONT Optic nerve transection
OPA1 Optic atrophy gene 1
OPL Outer plexiform layer

XII
OT Optic tectum
PBS Phosphate buffered saline
PC Perfusion channel
PCD Purkinje cell degeneration
PD Parkinson’s disease
PFA Paraformaldehyde
PGC-1α Peroxisome proliferator-activated receptor gamma coactivator 1α
PGZ Periventricular gray zone
PI3K Phosphoinositide 3-kinase
PINK1 PTEN-induced putative kinase 1
PNS Peripheral nervous system
PRL Photoreceptor layer
pS6 Phosphorylated S6
PSD-95 Post-synaptic density protein 95
PTEN Phosphatase and tensin homolog
QC Quality control
RA Retinoic acid
Rap Rapamycin
RC Retinal chamber
REDD2 Regulated in development and DNA damage response 2
RFP Red fluorescent protein
RGC Retinal ganglion cell
RGCL Retinal ganglion cell layer
RhoA Ras homolog family member A
RNA Ribonucleic acid
ROCK Rho-associated protein kinase 1
ROS Reactive oxygen species
rRNA Ribosomal ribonucleic acid
RT-qPCR Real-time polymerase chain reaction
SAC Stratum album centrale
SCG10 Superior cervical ganglia protein 10
SDHA Succinate dehydrogenase complex subunit A flavoprotein
SFGS Stratum fibrosum et griseum superficiale
SGC Stratum griseum centrale
SO Stratum opticum

XIII
SOCS Suppressor of cytokine signaling
SPNS1 Spinster homolog 1
SPV Stratum periventriculare
STAT Signal transducers and activators of transcription
STRING Search tool for recurring instances of neighboring genes
SV2 Synaptic vesicle protein 2
SYBU Syntabulin
TALEN Transcription activator-like effector nucleases
TCA Tricarboxylic acid cycle
TCEP Tris(2-carboxyethyl) phosphine
TEAB Triethylammoniumbicarbonate
Tet Tetracycline
TMT Tandem mass tag
TRAK Trafficking kinesin
TRE Tet response element
tRNA Transfer ribonucleic acid
TSA Tyramide signal amplification
TSC Tuberous sclerosis
TUNEL Terminal deocynucleotidyl transferase dUTP nick end labeling
UAS Upstream activator sequence
WB Western blotting
WT Wild-type
ZIRC Zebrafish international research center
NOMENCLATURE GUIDELINES
Species Gene Protein
Zebrafish gap43 Gap43
Rodents Gap43 GAP43

XIV

XV
PREFACE
Brain injury and neurological disorders represent a growing social and economic burden
in our aging society, partly because the central nervous system (CNS) of mammals has a limited
regenerative capacity1,2. Over the years, several mechanisms stimulating the regenerative
potential of neurons in the mammalian CNS have been identified, largely by studying
experimentally induced optic nerve regeneration within the visual system, a powerful model
to study neuronal survival and axonal regrowth2,3. Unfortunately, functional regeneration is
not yet possible and a useful clinical strategy still needs to be developed4–6. Notably, the
contribution of cellular and molecular processes in the dendrites has been consistently
overlooked in regenerative research, even though dendrites form an essential component of
the neuronal circuitry and are clearly affected in neurodegenerative diseases. Early defects in
the dendritic arbors, including dendritic shrinkage, reduced complexity of the dendritic tree
and synaptic losses, often precede axonal degeneration and neuronal death that ultimately
result in permanent functional deficits7–9. Importantly, within the retinofugal system, the
retinal ganglion cells (RGCs), the only retinal cells that project their axons to the visual target
areas in the brain, show a distinct localization of their dendrites and axons, i.e. inside the inner
plexiform layer (IPL) of the retina and within the nerve fiber layer (NFL) and optic nerve,
respectively. This unique anatomy creates the opportunity to separately investigate their
injury-induced growth responses and identify the crucial pathways/molecules underlying both
axon and dendrite regeneration during functional neural circuit repair.
The adult zebrafish (Danio rerio) is a well-established and powerful model system for
the molecular and mechanistic study of axonal regeneration, since these teleost fish possess
phylogenetically conserved yet robust regenerative capacities10,11. In this thesis, I therefore
used this model organism to investigate the inherent dendritic response necessary for
spontaneous axonal regeneration, as this can offer great potential to develop new therapeutic
strategies to induce full functional CNS repair.
In chapter 1 of this thesis, I first outline the clear gap in dendrite regenerative research,
and the lack of knowledge concerning the question whether and how neurons can regenerate
dendrites. As inducing axonal regeneration has been the subject of numerous studies over the
past decades, a summary of the current regenerative strategies is provided here. Further on,
I give an overview of the information regarding dendrite remodeling during development, as

XVI
well as the limited studies reporting about dendritic regeneration after injury in both
vertebrate and invertebrate animal models. Next, I describe the general cellular organization
of the visual system and point out the unique and distinct RGC axon versus dendrite
localization. Further on, I focus on adult zebrafish as a model organism to study successful
regeneration, and on the preliminary data from the host lab, gathered using these fish, and
suggesting that dendritic shrinkage is necessary to induce axonal repair after optic nerve
injury.
The goal of the following introductory chapter 2, is to describe two potential underlying
mechanisms for the antagonistic axon-dendrite interplay: (1) an intraneuronal energy
restriction or trade-off, or (2) a restriction of building blocks. First, I outline the energy
hypothesis, and highlight that neuronal development, as well as physiological brain
functioning, requires a massive amount of adenosine triphosphate (ATP). These ATP-
molecules mainly derive from cellular respiration, which depends on mitochondria, the main
energy producers of the cell. I then present the current idea that these mitochondria are of
uttermost importance for axonal regeneration after injury, as shown by many recent papers.
Furthermore, I discuss mitochondria as dynamic organelles which can undergo biogenesis,
fission/fusion and mitophagy, and I describe the current literature linking these dynamics with
axon/dendrite (re)growth during development or after injury. Hereafter, the second
hypothesis underlying the segregation of dendritic and axonal growth is explained, i.e. a
restriction of building blocks, as provided by autophagy. The different types of intracellular
recycling mechanisms, as well as the role of autophagy in neuronal survival, axonal regrowth
and neurite deterioration are discussed.
In chapter 3, I build further upon the preliminary data described in chapter 1, and
perform a longitudinal in-depth characterization of the dendritic and axonal responses after
optic nerve crush (ONC) in adult zebrafish, using immunostainings and western blot analysis
for dendritic, synaptic and axonal markers. To further elucidate the role of dendritic shrinkage
in the process of axonal regeneration, I pharmacologically prevent dendrite deterioration via
retinal inhibition of mechanistic target of rapamycin (mTOR) and broad-spectrum matrix
metalloproteinases (MMP) and test the effect on regenerative outcome. Finally, I perform a
differential proteomics study using retinal and optic nerve samples of naive versus crushed
zebrafish at the post-injury time of maximal RGC dendrite retraction, with the goal to identify

XVII
proteins/pathways underlying dendrite pruning and axonal regeneration, or the antagonistic
axon-dendrite interplay.
Next, I focus in chapter 4 on the role of mitochondria in axonal regeneration and
dendrite remodeling after ONC in adult zebrafish, based on the idea that a neuronal energy
restriction might underlie the positive effect of dendrite shrinkage on axonal regrowth. For
this, mitochondrial reporter fish are used, in which I first characterize the retinal and optic
tectal mitochondrial distribution at multiple time points post-ONC, and take a brief look in the
optic nerve/tract of naive fish or animals harvested at three days after injury. Furthermore,
biogenesis, fission and fusion are studied using immunostainings and western blotting for the
respective markers, i.e. peroxisome proliferator-activated receptor gamma coactivator 1α
(Pgc-1α), phosphorylated dynamin-related protein 1 (Drp1) and optic atrophy gene 1 (Opa1).
At the end of this chapter, axonal regrowth is investigated in three mutant zebrafish lines with
altered mitochondrial transport or fission to evaluate the role of these dynamics in CNS repair.
The second potential underlying mechanism for the antagonistic interplay is
investigated in chapter 5, namely autophagy. In this chapter I assess whether the cellular
recycling mechanism is up- or downregulated after ONC in the retina, optic fibers and optic
tectum of adult zebrafish subjected to ONC, and to achieve this, I employ a widely used
autophagy reporter line. To gain further insight in the role of autophagy in axonal regeneration
and dendrite remodeling, I test three autophagy-suppressive systemic treatments to evaluate
their effect on the axonal regenerative outcome after optic nerve injury.
Finally, in chapter 6, the results obtained throughout this thesis are discussed, together
with some technical and scientific considerations to take along in follow-up experiments, and
I end with a proposed working mechanism regarding the changes in mitochondrial dynamics
in the different neuronal compartments, crucial to obtain axon/dendrite regrowth.

XVIII
1. Verslegers, M., Lemmens, K., Van Hove, I. & Moons, L. Matrix metalloproteinase-2 and -9 as promising benefactors in development, plasticity and repair of the nervous system. Progress in Neurobiology 105, 60–78 (2013).
2. Benowitz, L. I., He, Z. & Goldberg, J. L. Reaching the brain: Advances in optic nerve regeneration. Experimental Neurology 287, 365–373 (2017).
3. Berry, M., Ahmed, Z., Lorber, B., Douglas, M. & Logan, A. Regeneration of axons in the visual system. Restor. Neurol. Neurosci. 26, 147–174 (2008).
4. de Lima, S. et al. Full-length axon regeneration in the adult mouse optic nerve and partial recovery of simple visual behaviors. Proc. Natl. Acad. Sci. 109, 9149–9154 (2012).
5. Belin, S. et al. Injury-Induced Decline of Intrinsic Regenerative Ability Revealed by Quantitative Proteomics. Neuron 86, 1000–1014 (2015).
6. Leibinger, M. et al. Boosting central nervous system axon regeneration by circumventing limitations of natural cytokine signaling. Mol. Ther. 24, 1712–1725 (2016).
7. Della Santina, L., Inman, D. M., Lupien, C. B., Horner, P. J. & Wong, R. O. L. Differential Progression of Structural and Functional Alterations in Distinct Retinal Ganglion Cell Types in a Mouse Model of Glaucoma. J. Neurosci. 33, 17444–17457 (2013).
8. Pang, J.-J., Frankfort, B. J., Gross, R. L. & Wu, S. M. Elevated intraocular pressure decreases response sensitivity of inner retinal neurons in experimental glaucoma mice. Proc. Natl. Acad. Sci. U. S. A. 112, 2593–8 (2015).
9. Morquette, B. et al. REDD2-mediated inhibition of mTOR promotes dendrite retraction induced by axonal injury. Cell Death Differ. 22, 612–625 (2015).
10. Becker, T. & Becker, C. G. Axonal regeneration in zebrafish. Current Opinion in Neurobiology 27, 186–191 (2014).
11. Becker, C. G. & Becker, T. Adult zebrafish as a model for successful central nervous system regeneration. Restor. Neurol. Neurosci. 26, 71–80 (2008).

CHAPTER 1
GENERAL INTRODUCTION

2 | Chapter 1
CHAPTER 1 ……………………………………………………………………………………………………………………….1
1 DENDRITE REGENERATION HARDLY STUDIED …………………………………..……..…………….3
2 RGCS AS CNS NEURONS TO STUDY DENDRITE REGENERATION ………………….……………4
3 INDUCING AXONAL REGENERATION IN THE ADULT MAMMALIAN CNS …………………...8
4 CURRENT KNOWLEDGE CONCERNING DENDRITIC REMODELING AND
REGENERATION IN THE ADULT CNS ............…………………………………………………………….12
4.1 DENDRITIC REMODELING DURING CNS DEVELOPMENT …………………………………………..12
4.2 DENDRITIC ABNORMALITIES UNDER PATHOLOGICAL OR EXPERIMENTAL
CONDITIONS ……………………………………………………………………………………………………….…………13
4.3 SYNAPTIC/DENDRITIC SPINE REMODELING THROUGHOUT LIFE ……………………………..14
4.4 DENDRITIC REGENERATION AFTER INJURY ……………………………………………………………..15
5 UNRAVELING AN AXON-DENDRITE INTERPLAY AFTER CNS INJURY IN ADULT
ZEBRAFISH ……………………....…………………………………….……………………………………………...17
5.1 SUCCESSFUL AXONAL REGENERATION AFTER CNS INJURY IN ADULT ZEBRAFISH ……18
5.2 AN ANTAGONISTIC AXON-DENDRITE INTERPLAY AFTER CNS INJURY IN ADULT
ZEBRAFISH ………………………………………………………………………………………………………..…….…….19
6 REFERENCES …….…………………………………………………………………………………………………….21

General introduction | 3
1 DENDRITE REGENERATION HARDLY STUDIED
Neurodegenerative diseases, including Alzheimer’s (AD) and Parkinson’s disease (PD),
are one of the leading causes of disability and death, with more than 40 million patients
worldwide in 20151. As our western society is characterized by extended lifespans due to
improved living conditions, the number of patients will grow even more over time because
disease prevalence rises with increasing age. Unfortunately, neuronal degeneration caused by
these diseases or central nervous system (CNS) injuries in general, is an irreversible process as
adult mammals only have a limited capacity to replace/repair lost or damaged neurons.
Moreover, no effective treatments are developed yet and only symptomatic therapies,
tackling memory decline, behavioral changes and motor deficits, are available2. The disease-
related socio-economic burden is therefore one of the major challenges of modern times,
which makes the scientific quest to develop a treatment to replace lost neurons (neuronal
regeneration) or to slow down or halt degradation of cells/neurites (neuroprotection) of
uttermost importance. A principle element is, however, that complete CNS repair will only be
achieved when the new or protected neurons are afterwards also able to form axons and
dendrites, a process called axonal/dendritic regeneration, as the transfer of electrical signals
from one neuron to another via synaptic transmission is critical for correct neuronal
functioning.
Over the past decades, extensive progress has been made in the search for axonal
regenerative treatments using different animal models, and addressing both extrinsic and
intrinsic factors, that underlie the failure of axonal regrowth in the mammalian CNS (Fig. 1.1).
These different strategies to induce axonal regeneration will be discussed in section 3 of this
introductory chapter. Besides axonal damage, neurodegenerative diseases or CNS injury are
also characterized by dendrite pathology, including dendritic shrinkage and loss of dendritic
tree complexity, as shown in both animal models and patients. Strikingly however, dendrites
have been overlooked for many decades in the neuroregenerative field. As shown in Fig. 1.1,
research concerning vertebrate dendrite regeneration is still in its infancy, as compared to
investigations on axonal regrowth or neuronal survival. Indeed, Peterson and Benowitz (2018)
mapped the relative number of papers found on PubMed using the keywords “axonal
regeneration”, “neuronal survival” or “dendrite regeneration”, without making a distinction
between peripheral nervous system (PNS) or CNS research. This comparison revealed a clear

4 | Chapter 1
bias towards axonal regeneration and neuronal survival studies as, respectively, a relative
number of 15 and 50 publications can be found on these two topics, for every single paper on
dendrite regeneration3. Due to this gap in dendrite research, it remains largely elusive if and
how neurons are capable to regrow dendrites after damage (Fig. 1.1). An ideal neuronal
subtype for the study of this complex matter is the retinal ganglion cell (RGC), that resides in
the retina and projects visual information towards the target areas in the brain, and will be
discussed in the next paragraph.
Fig. 1.1 Comparing the relative number of papers reporting on the main mammalian CNS regenerative
strategies reveals a clear knowledge gap in the field of dendrite regeneration.
Although central nervous system (CNS) injury or neurodegenerative diseases affect all neuronal compartments
(axon, soma and dendrites), research focused almost exclusively on promoting neuron survival and inducing axon
regeneration, which did unravel important pathways and targets related to these two therapeutic goals. As
dendrite abnormalities are early pathologies after CNS injury or disease, dendritic regeneration is a necessity to
re-obtain a full functional neuronal network. However, little is known about mammalian CNS dendrite
regeneration, which is obvious when comparing the relative number of papers popping up on PubMed using the
keywords “axon regeneration”, “neuron survival” and “dendrite regeneration”. Indeed, for every paper on
dendrite regrowth, 50 publications for neuron survival can be found and 15 for axon regeneration. Figure from
Peterson et al. (2018).
2 RGCS AS CNS NEURONS TO STUDY DENDRITE REGENERATION
Most of our current knowledge about the molecules and pathways necessary for
successful axonal regeneration has been gathered by studying axon regrowth in the visual
system, composed of the retina, the optic nerves/chiasm/tracts and the visual target areas in
the brain. Incoming light first passes the cornea, pupil and lens before reaching the retina,
which is the layered neuronal compartment of the eye. The photoreceptors, comprising the

General introduction | 5
rods and cones, transform light into electrochemical signals and send it via the bipolar cells to
the RGCs, which then convey the information to the brain. The electrical impulses can be
modified on the way by both horizontal and amacrine cells. RGC dendrites receive direct
information of bipolar or amacrine cells and the synaptic connections between their axons
and the RGC dendrites are established in the inner plexiform layer (IPL). The RGC somas on
their turn are located in the retinal ganglion cell layer (RGCL), while their axons bundle inside
the retina in the nerve fiber layer (NFL) and leave the eye to form the optic nerve (Fig. 1.2 and
1.3). In mammals, the axons of the nasal retina decussate at the optic chiasm, and both the
uncrossed and crossed fibers will thereafter follow their way in the optic tract, to finally
innervate various visual brain regions, where the received graphical information will be
processed4–7 (Fig. 1.3).
Fig. 1.2 Laminar organization of the mammalian retina.
Light passes the different layers of the retina, before being captured and transformed to electrical signals by the
photoreceptor cells. These rods and cones send this energy via the bipolar cells to the RGCs, which make synaptic
contacts inside the IPL. At the same time, horizontal and amacrine cells can fine-tune these electrical impulses.
The axons of the RGCs bundle inside the NFL and leave the eye to travel towards the brain.
INL, inner nuclear layer; IPL inner plexiform layer; NFL, nerve fiber layer; ONL, outer nuclear layer; OPL, outer
plexiform layer; PRL, photoreceptor layer; RGCL, retinal ganglion cell layer.

6 | Chapter 1
The visual system has been considered a powerful model in regenerative research as it
has many advantages for preclinical research. First of all, the retina is a part of the CNS and
shows many similarities to the brain and spinal cord with regard to anatomy, functionality and
immunological responses. The morphology, layered organization and functionality of the
retina is also highly conserved among vertebrates, which increases chances to discover
extrapolatable research findings across species. Also, from a practical point of view, the
retinofugal system is a good research model as it is relatively accessible compared to the brain
and administration of compounds can easily be performed by topical application or intraocular
injections. In addition, only one neuronal cell type in the eye sends information towards the
brain, namely the RGCs, which forms an additional valuable feature for axonal regenerative
research4–7 (Fig. 1.2). Importantly, the distinct retinal localization of RGC dendrites and axons,
inside the IPL and NFL respectively, creates the opportunity to use the same model for
deciphering the pathways/molecules underlying dendrite regeneration and to study a
potential interplay between axons and dendrites during CNS repair.
Fig. 1.3 Schematic representation of the
retinofugal system, showing the localization
of RGC dendrites, somas and axons.
While RGC somas and dendrites are located
inside the retina, their axons bundle outside
the eye to form the optic nerve. In mammals,
half of the axons cross over to the other
hemisphere at the optic chiasm, resulting in
partial decussation, after which the optic tracts
finally innervate the different visual brain
targets. Visual system adapted from Liu et al.
(2011).
RGC, retinal ganglion cell.

General introduction | 7
Axons and dendrites in general, differ in morphology, basic structure and function, with
the latter distinction being the most evident one. Indeed, while dendrites form postsynaptic
connections and are specialized in receiving electrochemical signals from other neurons,
axons send the information to target neurons8–11 (Table 1.1). Moreover, only one, often long,
axon protrudes from the neuronal cell body and only branches upon reaching the target, while
multiple short, highly branched dendrites can be formed. This morphology (one axon, multiple
primary dendrites) is the textbook example of a neuron and describes a multipolar neuron.
However, most RGCs only contain a few or even only one primary dendrite12,13. In addition,
dendrites tend to have an irregular, dotted appearance, due to thinner diameters near the
synapses and numerous dendritic spines, small protrusions extending from the dendrites.
Axons, in contrast, have a uniform diameter and can be surrounded by a myelin sheath, which
is not present around dendrites. Moreover, as the transition from cell soma to dendrite is
more gradual, proximal dendrites can contain abundant ribosomes, rough endoplasmic
reticulum and Golgi elements, while in general only few ribosomes are found in axons to
induce local axonal protein translation. Axon-dendrite differences can also be found in the
neurite cytoskeleton in which the microtubules of axons are uniformly oriented with plus ends
distal to the cell body, while a mixed microtubule arrangement is characteristic for dendrites.
In addition, the dendrite cytoskeleton contains the high molecular weight protein
microtubule-associated protein 2 (MAP2), whereas lower molecular weight microtubule tau
proteins are abundantly present in axons, without MAP2.
Table 1.1 Main differences between axons and dendrites in neurons.
ER, endoplasmic reticulum; MAP2, microtubule-associate protein 2.
Dendrite Axon
Function Receiving electrical signals Sending electrical signals
Number of neurites One or multiple dendrites One axon
Morphological appearance Short, highly branched and tapered with spines
Long, non-branched and uniform thickness
Myelinated No Yes
Cytoplasmic organelles Numerous ribosomes, rough ER and Golgi elements
Low number of ribosomes
Cytoskeleton organization
Mixed microtubule organization Uniform microtubule organization (plus-end-out)
Contains high molecular weight protein MAP2
Contains low molecular weight protein Tau

8 | Chapter 1
Due to these structural and functional axon-dendrite differences, it seems plausible that
strategies to induce axonal regeneration after CNS injury in mammals, which will be discussed
in the next paragraphs, are not efficient for improving dendrite regrowth. As there is almost
no knowledge concerning the last, there is an urgent need to dive into this matter, as regaining
functional neuronal networks after CNS injury is equally dependent on dendritic regrowth as
on axonal regrowth.
3 INDUCING AXONAL REGENERATION IN THE ADULT MAMMALIAN CNS
Extrinsic factors modulating axonal regeneration
Axonal damage negatively affects axonal transport and consequently hinders the supply
of vital biomolecules, including neurotrophic factors, resulting in neuronal cell death and a
decrease in axonal regrowth potential. In vitro and in vivo studies using different animal
models indeed indicated that experimental delivery of these neurotrophic factors after CNS
damage increased the survival rate of neurons. Moreover, some of these factors, including
ciliary neurotrophic factor (CNTF) and brain-derived neurotrophic factor (BDNF) were found
to stimulate axonal regeneration. Strikingly, not all pro-survival molecules showed this
positive effect on axon regrowth, and BDNF even reduced neuronal survival, while
simultaneously inducing axonal regeneration in one and the same study, indicating that
neuronal survival and axonal regrowth can be regulated via different mechanism/pathways14–
17. Although preclinical research indicated promising therapeutic potential for these
molecules, clinical trials showed that neurotrophin-mediated treatments still need to
overcome some obstacles including poor blood-brain barrier (BBB) permeability, short half-
life and off-target effects18,19.
Besides the loss of neurotrophic support, another barrier for axonal growth is the
inhibitory environment, installed by the glial scar and myelin-associated inhibitors (MAIs) that
form from myelin degradation. To protect the bruised tissue and prevent the spread of the
damage after CNS injury, a glial scar composed of astrocytes, microglia and connective tissue
elements, develops. This glial scar forms a physical, impenetrable seal around the injury site
and contains astrocyte-expressed chondroitin sulfate proteoglycans (CSPGs), that further
block axonal regeneration20–23. A second component of the inhibitory environment are the
MAIs, which are released after damage to myelin sheaths and prevent axonal regrowth, for

General introduction | 9
example, by inducing actin depolymerisation and axonal growth cone collapse21,24,25.
Neutralization of this inhibitory environment in in vitro and in vivo studies, e.g. by enzymatic
removal of CSPGs or genetic deletion of the MAI receptors, has been assigned as a promising
therapeutic strategy to induce axonal growth. In addition, the downstream pathways of both
MAIs and CSPGs converge on the Ras homolog family member A (RhoA)/Rho-associated
protein kinase 1 (ROCK) signaling cascade, which creates the opportunity to stimulate axonal
regrowth by inhibiting this pathway. Indeed, different RhoA/ROCK inhibitors have been
developed and tested in animal models of CNS injury and were found to (partly) reverse the
inhibitory effects, resulting in improved axonal regeneration and functional recovery23,26,27.
While promising, one clinical implication that researchers should take into account is that
therapeutic approaches preventing glial scar formation also abolish the beneficial effects of
this structure, namely the formation of a biochemical and physical barrier that protects
surrounding tissue and prevents a massive inflammatory response. It will therefore be key to
define the optimal time window to eliminate this glial scar so that the acute injury phase can
still benefit from this defense mechanism23.
A third extrinsic factor modulating axon regeneration is inflammation, the natural fight
response of our body in case of infection or injury, that involves numerous cell types like
resident microglia and infiltrating neutrophils and macrophages. In the past, inflammation was
considered detrimental for CNS regeneration, and anti-inflammatory treatments were tested
in different experimental injury models in the search for a regenerative therapy. The current
concept is now that a balanced inflammatory response is a key component underlying
successful regeneration6,28,29. Indeed, this finding was first highlighted when optic nerve
damage was combined with lens injury, evoking a massive infiltration/activation of
macrophages and inducing a significantly more robust axonal regrowth30. Also the injection of
Toll-like receptor 2 agonists, such as zymosan, a glycan derived from the cell wall of
Saccharomyces cerevisiae, and the lipopeptide Pam3Cys, in rodent models of optic nerve and
spinal cord injury, resulted in a combined pro-inflammatory response and augmented axonal
regeneration6,31,32. The induced infiltration of neutrophils and macrophages, the reactivation
of microglia, and activation of astrocytes and Müller glia, resulted in an increased expression
of important cytokines, including CNTF and leukemia inhibitory factor (LIF), and the Ca2+-
binding protein oncomodulin, both activating important pro-regenerative pathways20,24,33,34.

10 | Chapter 1
Of note, as inducing a massive uncontrollable inflammatory response in patients with CNS
trauma is not an ideal therapeutic approach, unraveling the exact underlying inflammation-
related molecules boosting axonal regeneration is critical.
Intrinsic factors modulating axonal regeneration
Besides the above-mentioned extrinsic factors, the axonal outgrowth potential of adult
vertebrates could also be enhanced by manipulating intrinsic neuronal features. After
mammalian development, this axon outgrowth capacity drastically declines, due to changes
in expression of pro-regenerative molecules, endogenous growth suppressors and other
players of intrinsic growth pathways24. Growth-associated protein 43 (GAP-43), the best know
regenerative molecule, is indeed highly expressed in growth cones during development, after
which its expression significantly declines, together with the potential of neurons to regrow
axons35,36. Another molecule with decreased postnatal expression in vertebrates is cyclic
adenosine monophosphate (cAMP). High levels of cAMP favours growth cone attraction,
which is reversed to repulsion if levels are low37. Elevating levels of GAP-43 or cAMP via
injection or genetic overexpression has been shown to induce more axonal sprouting in
different neuronal subtypes including dorsal root ganglia (DRG), RGCs and Purkinje cells,
although the effect on axonal elongation was neglectable in most cases24,38–41.
Another major reason for the low axon regeneration potential of adult mammals is a
low intrinsic growth capacity due to the presence of endogenous growth inhibitors or the
suppression of important growth promoting pathways. As described earlier, the RhoA/ROCK
pathway is a growth inhibitory pathway and both the repressive effect of CSPGs and MAIs are
mediated using this signaling cascade26 (Fig. 1.4). Activation of the mechanistic target of
rapamycin (mTOR) pathway, in contrast, has been shown to have significant axon outgrowth
stimulating effects, likely due to increased protein expression. Unfortunately, this pathway is
repressed after development and its inhibition is even more pronounced upon injury.
Knockdown of regulated in development and DNA damage response 2 (REDD2), the tuberous
sclerosis (TSC)1/2 complex or knockout of phosphatase and tensin homolog (PTEN), all mTOR
inhibiting proteins, reactivates this pathway, resulting in axonal growth promoting effects in
rodent RGCs, cortical and spinal neurons42–45 (Fig. 1.4). Lastly, the reactivation of the Janus
kinase/signal transducers and activators of transcription (JAK/STAT) pathway, as obtained by
deletion of suppressor of cytokine signaling 3 (SOCS3), seems key for optic nerve regeneration

General introduction | 11
in rodent animal models24,43,46 (Fig. 1.4). Of note, combining both PTEN and SOCS3 deletion
boosts axonal regeneration enormously, although target reinnervation and subsequent
functional recovery is still not possible43.
Fig. 1.4 Simplified overview of important signaling cascades influencing axonal regeneration.
In the first panel, the JAK/STAT pathway is shown, which is suppressed by the SOCS3 protein. Reactivation of
JAK/STAT, by SOCS3 deletion, is known to induce axon regrowth initiation and to upregulate regeneration-
associated proteins. Next, the mTOR pathway is downregulated after injury in mammals, which can be reversed
by deletion of REDD2, PTEN or TSC1/TSC2, all inhibitors of this signaling cascade, resulting in increased protein
translation and axonal regeneration. The last panel visualizes that both CSPGs and MAIs, derived from the glial
scar and disrupted myelin sheaths respectively, activate the RhoA/ROCK pathway. Consequently, actin
depolymerisation and growth cone collapse is induced, reducing the potential for axonal regrowth.
CSPG, chondroitin sulfate proteoglycan; JAK/STAT, Janus kinase/signal transducers and activators of
transcription; MAI, myelin-associated inhibitors; mTOR, mechanistic target of rapamycin; PI3K, Phosphoinositide
3-kinase, REDD, regulated in development and DNA damage response; RhoA/ROCK, Ras homolog family
member A (RhoA)/Rho-associated protein kinase 1 (ROCK); SOCS, suppressor of cytokine signaling; TSC, tuberous
sclerosis complex.

12 | Chapter 1
All in all, several possibilities have been identified to stimulate axon regeneration in the
adult mammalian CNS, although inducing extensive axonal regrowth towards the target area,
combined with correct reinnervation after injury is still a scientific utopia. It has become
increasingly clear that re-establishing a functional network is an extremely complex matter,
likely not depending on one or two factors, but requiring a combinatorial strategy making use
of the aforementioned underlying molecules and pathways. Moreover, a neuronal network
does not only depend on axons. Strikingly, for a long time, regenerative research has been
ignoring the dendrites, although these neurites are also and often primarily affected in
neurodegenerative diseases. Different research questions therefore remain unanswered: (1)
Can adult (in)vertebrates spontaneously regenerate dendrites and what are the key
players/pathways to induce dendrite regrowth? (2) Are the underlying mechanisms for
dendrite regeneration after injury different from axonal regrowth? (3) Is there a (synergistic
or antagonistic) interplay between axonal and dendritic regeneration after injury and, if yes,
how to deal with this in the light of a regenerative therapy? In the next paragraphs an overview
of what is known about spontaneous or induced dendrite regeneration is provided, as well as
what is recognized about their outgrowth during development.
4 CURRENT KNOWLEDGE CONCERNING DENDRITIC REMODELING AND
REGENERATION IN THE ADULT CNS
Dendrites are the receiving neurites crucial to propagate electrical information towards
the soma. The highly branched dendritic tree can undergo morphological modifications under
different circumstances including development, normal physiological functioning, injury and
disease47–49.
4.1 DENDRITIC REMODELING DURING CNS DEVELOPMENT
The way axon-dendrite polarity is established in developing neurons is cell-type
dependent. For most neurons, there is a distinct temporal time window and order in which
neurite outgrowth occurs, which is surely the case for RGCs, the neurons of interest in this
thesis47. During RGC development, different immature neurites sprout first, from which one
will become the leading process and forms the axon. From the moment the RGC axons reach
their target neurons in the brain or establish synaptogenesis, dendrites emerge in the retina
to connect with bipolar and amacrine cells. Both the length of dendritic segments as well as

General introduction | 13
the number of branching points will increase during this time frame, resulting in an elaborate
dendritic tree50–53 (Fig. 1.5). An important final step in the neurite outgrowth process is
dendritic and synaptic pruning, in which the dendritic tree will be finalized by removing excess
synapses, dendritic spines and dendritic branches, thereby fine-tuning and optimizing an
efficient neuronal network54,55. Thus, during RGC development there is a clear switch between
an axonal and a dendritic growth mode and this shift from high axonal to high dendritic growth
potential consequently has been proposed over the years as one of the factors contributing
to the lack of axonal regeneration in the adult CNS50,56.
Fig. 1.5 Overview of the developmental neurite outgrowth order in RGCs.
First, new-born RGCs develop immature neurites (stages 1-2), from which one leading process will extensively
elongate to form an axon (stage 3). The axon will eventually enter and form synapses in the targeted brain area;
and at that moment one or more dendrites emerge and form a highly branched dendritic tree in the inner
plexiform layer of the retina (stage 4).
RGC, retinal ganglion cell.
4.2 SYNAPTIC/DENDRITIC SPINE REMODELING THROUGHOUT LIFE
In healthy adult organisms, changing the strength of synapses in response to experience,
e.g. via modifying the number of incorporated glutamate transmembrane receptors, is a
dynamic and continuous process which is involved in learning and memory formation47–49. This
activity-dependent synaptic plasticity is strongly linked with adjustments in spine

14 | Chapter 1
number/density or spine head diameter. Long-term potentiation, i.e. the strengthening of
synapses, is associated with a positive effect on these spine parameters, while long-term
depression has the opposite result57–60. The critical importance of synaptic plasticity is
undeniable as abnormalities regarding this process result in impaired learning abilities, e.g. in
patients with Down syndrome61.
4.3 DENDRITIC ABNORMALITIES UNDER PATHOLOGICAL OR EXPERIMENTAL
CONDITIONS
Besides advantageous modifications during development or adult physiological
functioning, dendrite/synapse structure is altered in many neurodegenerative diseases and
neurodevelopmental or psychiatric disorders including AD, amyotrophic lateral sclerosis (ALS),
schizophrenia, autism, depression and many more. These (sometimes only subtle) dendritic
pathologies observed both in human patients and in animal disease models include shortened
dendritic length, loss of spines, reduced dendritic tree complexity and loss of synapses55,62,63
(Fig. 1.6) and all can have a drastic detrimental effect on normal network functioning. Also
glaucomatous optic neuropathies are characterized by early retinal synapse loss, RGC
dendritic shrinkage, and a reduced dendritic complexity, which, based on animal studies and
clinical data, likely precede irreversible structural damage to the optic nerve and RGC
death64,65. These dendritic changes can be considered as one of the earliest stages of many
diseases and are not just a side-effect of neuronal cell death. Dendritic pathologies early in
disease progression even differ phenotypically, compared to dendritic disruption observed in
dying neurons. Indeed, acute damage circumstances including hypoxia or excitotoxicity,
leading to apoptosis or necrosis, cause rapid dendrite blebbing and dendrite cytoskeleton
cleavage49,66,67. Dendrite pathologies in neurodegenerative diseases, on the contrary, only
slowly progress and accumulate over time49,55.
In the search for axon growth-inducing therapies, different acute optic nerve injury
models were used in various animal models, including optic nerve crush (ONC) or optic nerve
transection (ONT). Remarkably, these damage models, although only physically disturbing
axons, were found to evoke the same aforementioned morphological changes in
dendrites42,68–71 (Fig. 1.6). An effect of axonal injury on dendrites was also observed using
other neuronal subtypes, albeit this was only studied in an in vitro set-up. Indeed, axotomy of
rat hippocampal neurons in a microfluidic device, resulted in the loss of dendritic spines, while

General introduction | 15
axonal stretch injury in rat cortical neurons triggered dendritic beading, i.e. the swelling of
dendritic shafts harboring the dendritic spines71,72.
All in all, these data show that intact dendrites are vital for signaling transport, that they
are often the first affected neuronal compartment after CNS injury, that they are extremely
fragile, even disturbed by indirect axonal damage, altogether showing that dendrite
regeneration is a necessary therapeutic requirement to reestablish a functional neuronal
network.
4.4 DENDRITIC REGENERATION AFTER INJURY
In the next paragraph, we will discuss dendrite regeneration after injury, meaning the
regrowth of dendrites/synaptic connections as before the insult. We will not discuss dendritic
remodeling processes during injury-induced neuroplasticity, which can be defined as
reorganizations of the nervous system structure, function and connections after neural
damage73,74. A typical example of neuroplasticity is improved tactile discrimination and
enhanced sound-localization in patients after complete loss of vision, and this is due to
thorough sensory cortex reorganizations. Thus, while neuroplasticity is characterized by
adaptations of the brain circuitry to compensate for the loss of neurons and connections, the
main goal of neural regeneration is to return to the naive situation by restoring pre-injury
connections73–75.
Fig. 1.6 Schematic representation of
dendritic pathology occurring in
neurodegenerative diseases or after
experimental axonal injury, that
includes the loss of synapses and
dendritic spines, dendritic shrinkage
and a reduced dendritic tree
complexity.

16 | Chapter 1
Research on dendrite regeneration after neuronal insult in mammals
Little is known about dendrite regeneration in mammals, with only two papers in this
field. In a first study, dendrite regrowth was induced after stereotaxic prick-injury in the adult
cerebral cortex of mice, by applying heparin-binding growth-associated molecule (HB-GAM).
Cortical injection of HB-GAM, which is known to reverse the effect of CSPGs in the glial scar
from inhibitory to attractive, induced robust regeneration of dendrites: three weeks after
injury both the number of apical dendrites per neuron, as well as the density of the dendritic
tree, was increased3,76,77. In a second study by Agostinone et al. (2018), prominent dendrite-
regeneration after axotomy-induced dendrite retraction in mouse RGCs was achieved upon
mTOR activity restoration. In this study, topical or intraperitonal administration of insulin,
which is known to activate phosphoinositide-3′ kinase (PI3K), an upstream activator of mTOR,
was used. Seven days after axotomy, different dendritic parameters restored to baseline
levels, including dendritic length, area and number of branches, as well as postsynaptic
densities. In addition, cell counting revealed a neuroprotective effect on the RGCs, and
functional analysis via electroretinography (ERG) even indicated improved retinal
functionality, as compared to untreated injured animals3,70,77. Of note, both animal research
and post-mortem human studies have associated AD with decreased levels of insulin in
cerebrospinal fluid and decreased insulin sensitivity. Clinical studies using intranasal insulin
administration in AD patients has then also shown to improve memory and attention,
although the exact working mechanism is not clear70,78,79. Based on their data, Agostinone et
al. thus hypothesized that dendritic recovery and enhanced synaptic transmission could play
a role in this insulin-induced performance improvement in AD patients.
Research on dendrite regeneration after neuronal insult in invertebrates
Successful dendrite regeneration has also been occasionally reported in different
invertebrate species. In C. elegans, in vivo laser-induced dendritomy of sensory PVD neurons
triggered the severed primary dendrite to regrow both the distal and proximal stump and
reconnect via fusion. This dendritic capacity to regrow and auto-fuse after injury declined with
age but could be restored in e.g. mutants for daf-2, an insulin-like growth factor (IGF) receptor
important for the insulin/IGF-1 signaling pathway inside these worms3,77,80,81. In Drosophila,
sensory neurons also displayed dendrite regeneration upon laser injury in vivo, although only
in an all-or-none fashion, meaning that approximately half of the cells initiated dendritic

General introduction | 17
regrowth, which was successful and complete, while the remaining cells did not regenerate at
all. Moreover, the percentage of dendrite regeneration failure in these fruit flies decreased
with loss of PTEN function or in case of overexpression of Akt, both again activating the mTOR
pathway3,77,82,83. C. elegans and Drosophila thus have a robust axonal regeneration capacity,
and the aforementioned studies indicate that they can regrow (at least some of) their
dendrites, enabling (partial) functional nervous system repair after injury.
To conclude, only a limited number of papers tackling dendrite regeneration are
available and what is even more striking is that they did not evaluate the effect on axons
simultaneously, leaving the link between axon and dendrites after CNS injury almost
untouched. An exciting observed fact is, however, that one extrinsic cue and one intrinsic
pathway seems to regulate both axon and dendrite regeneration in (in)vertebrates, namely
the glial scar and the mTOR signaling cascade, respectively, which opens the doors for
combined therapeutic strategies covering both axon and dendrite regrowth3,22,70,76,84.
However, more research is necessary to unravel this possible axon-dendrite relationship,
which could be synergistic but also antagonistic, in which axons or dendrites could inhibit
regrowth of the other neurite type. In the latter case, this would have serious implications for
future therapeutic strategies, especially regarding the correct timing of intervention. One
possible way to unravel the true association between axonal regeneration and dendritic
remodeling after CNS injury, is to investigate the inherent dendritic response during
spontaneous axonal recovery. Therefore, zebrafish or Danio rerio, was used in this thesis as
these fish have, even in the adult stage, the potential to successfully induce regeneration of
heart tissue, skeletal muscles and PNS neurons but also, and most importantly for our
research, CNS neurons.
5 UNRAVELING AN AXON-DENDRITE INTERPLAY AFTER CNS INJURY IN
ADULT ZEBRAFISH
The zebrafish is a small tropical freshwater fish belonging to the order of the carp-like
animals (Cypriniformes), which lives in rivers of India, Pakistan and Nepal. Due to its small size,
a short generation time of three to four months and easy maintenance, this teleost is widely
used since the 70's as a model organism. Moreover, the entire genome of the zebrafish is
sequenced, and shows a high degree of conservation with mammals. The strength of the

18 | Chapter 1
zebrafish as a model organism is further highlighted as genetic modifications can be relatively
easily performed using the Tol2 transposon system, transcription activator-like effector
nucleases (TALENs) and clustered regularly interspaced short palindromic repeats/CRISPR-
associated (CRISPR/Cas9). Consequently, numerous reporter and mutant zebrafish lines have
been created over the past decades, and are at the root of many discoveries regarding disease
mechanisms, drug discovery and tissue regeneration85–88.
5.1 SUCCESSFUL AXONAL REGENERATION AFTER CNS INJURY IN ADULT
ZEBRAFISH
In sharp contrast to adult mammals, CNS axons of adult zebrafish can regrow and
correctly reinnervate their target after insult. In most of these regenerative studies, including
those from the host lab, young adult zebrafish were used, to investigate regeneration in a fully
developed animal. Although the transparency of zebrafish larvae (naturally until 7 days post-
fertilization (dpf), but prolonged up till 14 dpf by addition of melanin synthesis inhibitors89)
could be of benefit for in vivo imaging techniques in reporter animals, adult zebrafish are
mostly chosen because here neural circuit development is finalized, and biological parameters
have reached the adult-stage equilibrium, e.g. mitochondrial motility has dropped to post-
developmental stages. As the axonal regeneration potential of zebrafish is reduced upon
ageing (from 12 months)90, older animals are, besides from the practical side, not the first
choice to unravel the mechanisms underlying successful axonal regeneration, but could be
used to test the effect of a pro-regenerative therapy on axonal regrowth. Several underlying
mechanisms for this high regenerative capacity have already been discovered in the zebrafish
retinotectal system. First of all, the RGC survival percentage after optic nerve injury is
significantly higher compared to that of mammalian retinal neurons. Indeed, after ONC most
RGCs survive in zebrafish, whereas more than half of the RGCs are found to be dead at 7 days
after ONC in mice91–93. Different neuroprotective molecules can be assigned to this increased
survival rate in fish, including the upregulation of heat-shock protein 70 (Hsp70) and insulin-
like growth factor 1 (Igf-1), which prevent neuronal apoptosis93,94. After this first survival
response, axonal regeneration and correct pathfinding towards the optic tectum, the homolog
of the mammalian superior colliculus, is secured due to the upregulation of different proteins
important for cytoskeleton construction (e.g. α-tubulin), cell adhesion (e.g. neural cell
adhesion molecule 180 (Ncam-180)), axon guidance (e.g. Ephrin-A), and axonal growth (e.g.
Gap-43)94–96. Additional growth-promoting pathways/molecules, shared with mammalian CNS

General introduction | 19
regeneration, are induced, including the mTOR signaling cascade, Krüppel-like factor 6/7 (Klf
6/7) and reggie proteins6,95,97–100. Furthermore, axons are not physically blocked by the glial
scar, which is absent after injury in adult zebrafish, nor do they seem to be inhibited by MAIs.
At least it is known for neurite outgrowth inhibitor A (Nogo-A), which is assumed to be one of
the most potent MAIs, that it lacks an axonal inhibitory domain92,93. Lastly, a balanced and
transient inflammatory response after injury with increased numbers of microglia and
macrophages and induced expression of growth-promoting chemokines and cytokines, e.g. Lif
and Cntf, further enhances regeneration6,92,101. The timed resolution of this inflammatory
response is of critical importance, as chronic inflammatory effects are known to be
detrimental for RGC survival6,102.
To summarize, zebrafish RGCs have a higher intrinsic potential for axonal regeneration,
which can flourish in a growth-permissive environment, without extrinsic inhibitory factors.
Whether dendrite regeneration is equally efficient in zebrafish or if an axon-dendrite interplay
during CNS exists, has not been studied, although it could reveal important insights necessary
to develop a complete regenerative strategy.
5.2 AN ANTAGONISTIC AXON-DENDRITE INTERPLAY AFTER CNS INJURY IN
ADULT ZEBRAFISH
A few recent studies already hinted towards an antagonistic axon-dendrite interplay
during spontaneous or experimentally induced axonal regeneration, in which mature
dendrites actively restrain axonal regrowth. Indeed, in C. elegans, axonal regeneration of ASJ
neurons in larvae or adults was enhanced when axotomy was performed simultaneously with
dendritomy, as compared to axonal injury only. Both the outgrowth length, as well as the
incidence of re-entering the nerve ring, which can be considered as the brain of C. elegans,
was significantly improved77,103,104. Moreover, intravitreal administration of CNTF, known to
promote axonal regeneration, in mice after optic nerve damage, was found to be
accompanied with a more severe reduction in dendritic arbor length/complexity compared to
injury alone, again hinting towards the hypothesis that dendrites hinder axonal
regrowth77,105,106.
Previous data obtained in the host lab by dr. Kim Lemmens at the end of her doctoral
work, further supported the concept of an antagonistic axon-dendrite interplay during
regeneration, in which dendritic shrinkage can boost axonal regeneration. Dr. Lemmens used

20 | Chapter 1
the zebrafish retinotectal system, a powerful model widely used for neuroregenerative
research in the CNS, in combination with an ONC, a mild injury method that is easy to
reproduce and exclusively damages the RGC axons, without hindering ocular blood flow or
inducing a massive inflammatory response. First, axonal RGC dendritic remodeling and axonal
regeneration were assessed side-by-side, and this provided first indications that ONC in adult
zebrafish evokes dendrites to shrink, similar to the mammalian situation. However, zebrafish
were seemingly able to restore both neurite types, indicating a robust axon and dendrite
regenerative capacity, features clearly missing in mammals77,106. In a second set of
experiments, dr. Lemmens induced general inhibition of matrix metalloproteinases (MMPs),
which are known to have a role in axonal regeneration, as well as dendritic stability. This
treatment inhibited RGC synapto-dendritic detioriation, and had an inhibitory effect on axonal
regrowth, strengthening the idea of an antagonistic interplay wherein mature dendrites
restrain axonal regrowth77,106.
Triggered by these intriguing data, I built further upon these results in order to
characterize the axonal and dendritic remodeling process in detail and to further support the
antagonistic axon-dendrite interplay. My findings are described/discussed in chapter 3. In the
following chapter, two possible mechanisms underlying the segregation of dendritic and
axonal growth during development and regeneration, will be discussed: (1) an intraneuronal
energy restriction or trade-off, in the form of adenosine triphosphate (ATP) produced by
mitochondria or (2) a restriction of building blocks, as provided by the intracellular autophagic
recycling mechanism.

General introduction | 21
6 REFERENCES
1. Wood, L. B., Winslow, A. R. & Strasser, S. D. Systems biology of neurodegenerative diseases. Integrative Biology (United Kingdom) 7, 758–775 (2015).
2. Chen, X. & Pan, W. The Treatment Strategies for Neurodegenerative Diseases by Integrative Medicine. Integr. Med. Int. 1, 223–225 (2015).
3. Peterson, S. L. & Benowitz, L. I. Mammalian dendritic regrowth: A new perspective on neural repair. Brain 141, 1891–1894 (2018).
4. Purves, D. 3,4 Neuroscience Third Edition. Vascular 3, (2004). 5. Wood, I. K. Neuroscience: Exploring the brain. Journal of Child and Family Studies 5, (1996). 6. Bollaerts, I., Van Houcke, J., Andries, L., De Groef, L. & Moons, L. Neuroinflammation as Fuel for
Axonal Regeneration in the Injured Vertebrate Central Nervous System. Mediators of Inflammation 2017, (2017).
7. London, A., Benhar, I. & Schwartz, M. The retina as a window to the brain - From eye research to CNS disorders. Nature Reviews Neurology 9, 44–53 (2013).
8. Stone, M. C., Roegiers, F. & Rolls, M. M. Microtubules have opposite orientation in axons and dendrites of Drosophila neurons. Mol. Biol. Cell 19, 4122–4129 (2008).
9. Hammond, C. The ionotropic nicotinic acetylcholine receptors. Cell. Mol. Neurophysiol. Fourth Ed. 173–197 (2015).
10. Barrett, K. E. & Raybould, H. E. The Hypothalamus and Pituitary Gland. Berne &amp Levy Physiology 706–724 (2010).
11. Sargent, P. B. What distinguishes axons from dendrites? Neurons know more than we do. Trends Neurosci. 12, 203–205 (1989).
12. Peng, Y. R. et al. Satb1 Regulates Contactin 5 to Pattern Dendrites of a Mammalian Retinal Ganglion Cell. Neuron 95, 869-883.e6 (2017).
13. Sanes, J. R. & Masland, R. H. The Types of Retinal Ganglion Cells: Current Status and Implications for Neuronal Classification. Annu. Rev. Neurosci. 38, 221–246 (2015).
14. Mamounas, L. A. et al. BDNF promotes the regenerative sprouting, but not survival, of injured serotonergic axons in the adult rat brain. J. Neurosci. 20, 771–782 (2000).
15. Pernet, V. et al. Long-distance axonal regeneration induced by CNTF gene transfer is impaired by axonal misguidance in the injured adult optic nerve. Neurobiol. Dis. 51, 202–213 (2013).
16. Hu, Y. et al. Lentiviral-mediated transfer of CNTF to Schwann cells within reconstructed peripheral nerve grafts enhances adult retinal ganglion cell survival and axonal regeneration. Mol. Ther. 11, 906–915 (2005).
17. Claes, M., De Groef, L. & Moons, L. Target-derived neurotrophic factor deprivation puts retinal ganglion cells on death row: Cold hard evidence and caveats. International Journal of Molecular Sciences 20, (2019).
18. Houlton, J., Abumaria, N., Hinkley, S. F. R. & Clarkson, A. N. Therapeutic potential of neurotrophins for repair after brain injury: A helping hand from biomaterials. Frontiers in Genetics 10, (2019).
19. Chan, S. J. et al. Endogenous regeneration: Engineering growth factors for stroke. Neurochemistry International 107, 57–65 (2017).
20. Leibinger, M., Andreadaki, A., Diekmann, H. & Fischer, D. Neuronal STAT3 activation is essential for CNTF- and inflammatory stimulation-induced CNS axon regeneration. Cell Death Dis. 4, (2013).
21. Moeendarbary, E. et al. The soft mechanical signature of glial scars in the central nervous system. Nat. Commun. 8, (2017).
22. Bradbury, E. J. & Burnside, E. R. Moving beyond the glial scar for spinal cord repair. Nature Communications 10, (2019).
23. Rolls, A., Shechter, R. & Schwartz, M. The bright side of the glial scar in CNS repair. Nature Reviews Neuroscience 10, 235–241 (2009).
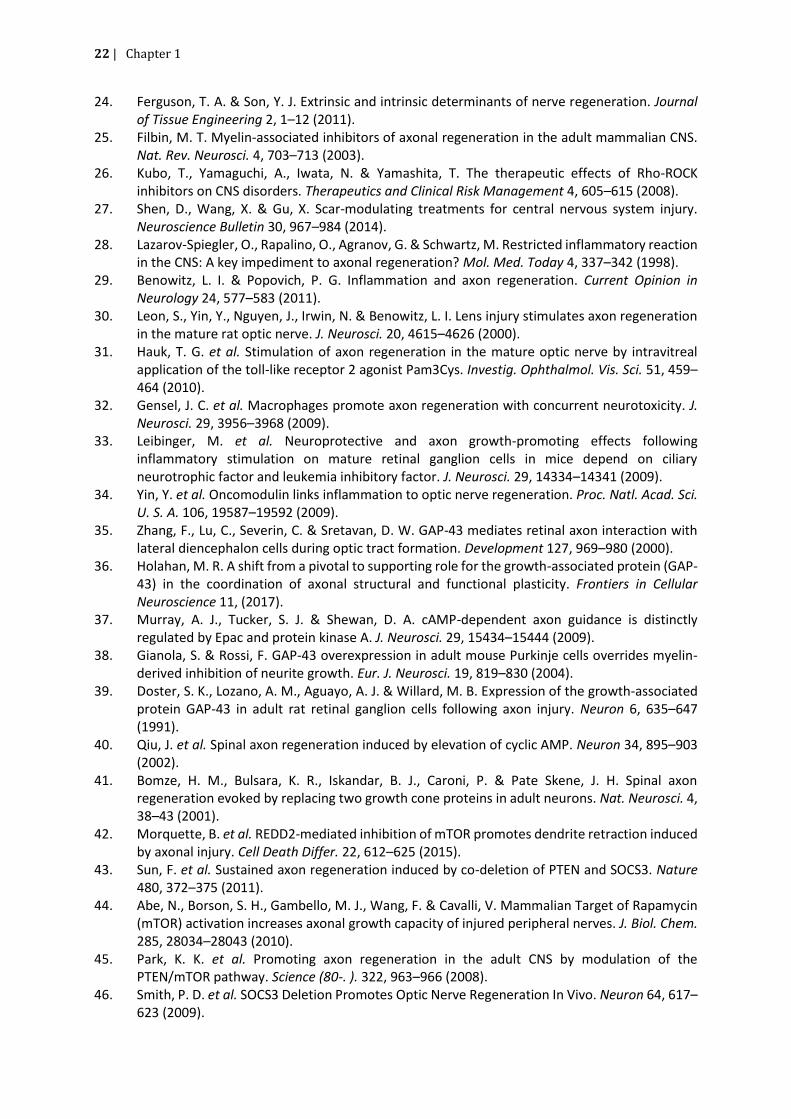
22 | Chapter 1
24. Ferguson, T. A. & Son, Y. J. Extrinsic and intrinsic determinants of nerve regeneration. Journal of Tissue Engineering 2, 1–12 (2011).
25. Filbin, M. T. Myelin-associated inhibitors of axonal regeneration in the adult mammalian CNS. Nat. Rev. Neurosci. 4, 703–713 (2003).
26. Kubo, T., Yamaguchi, A., Iwata, N. & Yamashita, T. The therapeutic effects of Rho-ROCK inhibitors on CNS disorders. Therapeutics and Clinical Risk Management 4, 605–615 (2008).
27. Shen, D., Wang, X. & Gu, X. Scar-modulating treatments for central nervous system injury. Neuroscience Bulletin 30, 967–984 (2014).
28. Lazarov-Spiegler, O., Rapalino, O., Agranov, G. & Schwartz, M. Restricted inflammatory reaction in the CNS: A key impediment to axonal regeneration? Mol. Med. Today 4, 337–342 (1998).
29. Benowitz, L. I. & Popovich, P. G. Inflammation and axon regeneration. Current Opinion in Neurology 24, 577–583 (2011).
30. Leon, S., Yin, Y., Nguyen, J., Irwin, N. & Benowitz, L. I. Lens injury stimulates axon regeneration in the mature rat optic nerve. J. Neurosci. 20, 4615–4626 (2000).
31. Hauk, T. G. et al. Stimulation of axon regeneration in the mature optic nerve by intravitreal application of the toll-like receptor 2 agonist Pam3Cys. Investig. Ophthalmol. Vis. Sci. 51, 459–464 (2010).
32. Gensel, J. C. et al. Macrophages promote axon regeneration with concurrent neurotoxicity. J. Neurosci. 29, 3956–3968 (2009).
33. Leibinger, M. et al. Neuroprotective and axon growth-promoting effects following inflammatory stimulation on mature retinal ganglion cells in mice depend on ciliary neurotrophic factor and leukemia inhibitory factor. J. Neurosci. 29, 14334–14341 (2009).
34. Yin, Y. et al. Oncomodulin links inflammation to optic nerve regeneration. Proc. Natl. Acad. Sci. U. S. A. 106, 19587–19592 (2009).
35. Zhang, F., Lu, C., Severin, C. & Sretavan, D. W. GAP-43 mediates retinal axon interaction with lateral diencephalon cells during optic tract formation. Development 127, 969–980 (2000).
36. Holahan, M. R. A shift from a pivotal to supporting role for the growth-associated protein (GAP-43) in the coordination of axonal structural and functional plasticity. Frontiers in Cellular Neuroscience 11, (2017).
37. Murray, A. J., Tucker, S. J. & Shewan, D. A. cAMP-dependent axon guidance is distinctly regulated by Epac and protein kinase A. J. Neurosci. 29, 15434–15444 (2009).
38. Gianola, S. & Rossi, F. GAP-43 overexpression in adult mouse Purkinje cells overrides myelin-derived inhibition of neurite growth. Eur. J. Neurosci. 19, 819–830 (2004).
39. Doster, S. K., Lozano, A. M., Aguayo, A. J. & Willard, M. B. Expression of the growth-associated protein GAP-43 in adult rat retinal ganglion cells following axon injury. Neuron 6, 635–647 (1991).
40. Qiu, J. et al. Spinal axon regeneration induced by elevation of cyclic AMP. Neuron 34, 895–903 (2002).
41. Bomze, H. M., Bulsara, K. R., Iskandar, B. J., Caroni, P. & Pate Skene, J. H. Spinal axon regeneration evoked by replacing two growth cone proteins in adult neurons. Nat. Neurosci. 4, 38–43 (2001).
42. Morquette, B. et al. REDD2-mediated inhibition of mTOR promotes dendrite retraction induced by axonal injury. Cell Death Differ. 22, 612–625 (2015).
43. Sun, F. et al. Sustained axon regeneration induced by co-deletion of PTEN and SOCS3. Nature 480, 372–375 (2011).
44. Abe, N., Borson, S. H., Gambello, M. J., Wang, F. & Cavalli, V. Mammalian Target of Rapamycin (mTOR) activation increases axonal growth capacity of injured peripheral nerves. J. Biol. Chem. 285, 28034–28043 (2010).
45. Park, K. K. et al. Promoting axon regeneration in the adult CNS by modulation of the PTEN/mTOR pathway. Science (80-. ). 322, 963–966 (2008).
46. Smith, P. D. et al. SOCS3 Deletion Promotes Optic Nerve Regeneration In Vivo. Neuron 64, 617–623 (2009).

General introduction | 23
47. Barnes, A. P. & Polleux, F. Establishment of Axon-Dendrite Polarity in Developing Neurons. Annu. Rev. Neurosci. 32, 347–381 (2009).
48. Ye, B. et al. Differential regulation of dendritic and axonal development by the novel Krüppel-like factor dar1. J. Neurosci. 31, 3309–3319 (2011).
49. Kweon, J. H., Kim, S. & Lee, S. B. The cellular basis of dendrite pathology in neurodegenerative diseases. BMB Rep. 50, 5–11 (2017).
50. Goldberg, J. L., Klassen, M. P., Hua, Y. & Barres, B. A. Amacrine-signaled loss of intrinsic axon growth ability by retinal ganglion cells. Science (80-. ). 296, 1860–1864 (2002).
51. Choi, J. H., Law, M. Y., Chien, C. Bin, Link, B. A. & Wong, R. O. L. In vivo development of dendritic orientation in wild-type and mislocalized retinal ganglion cells. Neural Dev. 5, (2010).
52. Haupt, C. & Huber, A. B. How axons see their way - Axonal guidance in the visual system. Frontiers in Bioscience 13, 3136–3149 (2008).
53. Bao, Z. Z. Intraretinal projection of retinal ganglion cell axons as a model system for studying axon navigation. Brain Res. 1192, 165–177 (2008).
54. Riccomagno, M. M. & Kolodkin, A. L. Sculpting Neural Circuits by Axon and Dendrite Pruning. Annu. Rev. Cell Dev. Biol. 31, 779–805 (2015).
55. Di Polo, A. Dendrite pathology and neurodegeneration: Focus on mTOR. Neural Regeneration Research 10, 559–561 (2015).
56. Goldberg, J. L. How does an axon grow? Genes and Development 17, 941–958 (2003). 57. McCann, R. F. & Ross, D. A. A Fragile Balance: Dendritic Spines, Learning, and Memory.
Biological Psychiatry 82, e11–e13 (2017). 58. Gipson, C. D. & Olive, M. F. Structural and functional plasticity of dendritic spines – root or result
of behavior? Genes, Brain and Behavior 16, 101–117 (2017). 59. Takeuchi, T., Duszkiewicz, A. J. & Morris, R. G. M. The synaptic plasticity and memory
hypothesis: Encoding, storage and persistence. Philosophical Transactions of the Royal Society B: Biological Sciences 369, (2014).
60. Bliss, T. V. P., Collingridge, G. L. & Morris, R. G. M. Synaptic plasticity in health and disease: Introduction and overview. Philos. Trans. R. Soc. B Biol. Sci. (2014).
61. Cramer, N. & Galdzicki, Z. From abnormal hippocampal synaptic plasticity in down syndrome mouse models to cognitive disability in down syndrome. Neural Plasticity 2012, (2012).
62. Johnston, D., Frick, A. & Poolos, N. P. Dendrites and disease. in Dendrites 677–702 (2016). 63. Emoto, K. Dendrite remodeling in development and disease. Development Growth and
Differentiation 53, 277–286 (2011). 64. Frankfort, B. J. et al. Elevated intraocular pressure causes inner retinal dysfunction before cell
loss in a mouse model of experimental glaucoma. Investig. Ophthalmol. Vis. Sci. 54, 762–770 (2013).
65. Santina, L. Della, Inman, D. M., Lupien, C. B., Horner, P. J. & Wong, R. O. L. Differential progression of structural and functional alterations in distinct retinal ganglion cell types in a mouse model of glaucoma. J. Neurosci. 33, 17444–17457 (2013).
66. Lee, S. B., Bagley, J. A., Lee, H. Y., Jan, L. Y. & Jan, Y. N. Pathogenic polyglutamine proteins cause dendrite defects associated with specific actin cytoskeletal alterations in Drosophila. Proc. Natl. Acad. Sci. U. S. A. 108, 16795–16800 (2011).
67. Park, J. S., Bateman, M. C. & Goldberg, M. P. Rapid alterations in dendrite morphology during sublethal hypoxia or glutamate receptor activation. Neurobiol. Dis. 3, 215–227 (1996).
68. Kalesnykas, G. et al. Retinal ganglion cell morphology after optic nerve crush and experimental glaucoma. Investig. Ophthalmol. Vis. Sci. 53, 3847–3857 (2012).
69. Lindsey, J. D. et al. Differential protection of injured retinal ganglion cell dendrites by brimonidine. Invest. Ophthalmol. Vis. Sci. 56, 1789–1804 (2015).
70. Agostinone, J. et al. Insulin signalling promotes dendrite and synapse regeneration and restores circuit function after axonal injury. Brain 141, 1963–1980 (2018).
71. Monnerie, H. et al. Dendritic alterations after dynamic axonal stretch injury in vitro. Exp. Neurol. 224, 415–423 (2010).

24 | Chapter 1
72. Nagendran, T. et al. Distal axotomy enhances retrograde presynaptic excitability onto injured pyramidal neurons via trans-synaptic signaling. Nat. Commun. 8, (2017).
73. Li, S. Spasticity, motor recovery, and neural plasticity after stroke. Frontiers in Neurology 8, (2017).
74. Cramer, S. C. et al. Harnessing neuroplasticity for clinical applications. Brain (2011). 75. So, K. F. & Xu, X. M. Neural Regeneration. Neural Regeneration (2015). 76. Paveliev, M. et al. HB-GAM (pleiotrophin) reverses inhibition of neural regeneration by the CNS
extracellular matrix. Sci. Rep. 6, (2016). 77. Beckers, A. & Moons, L. Dendritic shrinkage after injury: A cellular killer or a necessity for axonal
regeneration? Neural Regeneration Research 14, 1313–1316 (2019). 78. Freiherr, J. et al. Intranasal insulin as a treatment for alzheimer’s disease: A review of basic
research and clinical evidence. CNS Drugs 27, 505–514 (2013). 79. Bedse, G., Di Domenico, F., Serviddio, G. & Cassano, T. Aberrant insulin signaling in Alzheimer’s
disease: Current knowledge. Front. Neurosci. 9, (2015). 80. Kravtsov, V., Oren-Suissa, M. & Podbilewicz, B. The fusogen AFF-1 can rejuvenate the
regenerative potential of adult dendritic trees by self-fusion. Dev. 144, 2364–2374 (2017). 81. Oren-Suissa, M., Gattegno, T., Kravtsov, V. & Podbilewicz, B. Extrinsic repair of injured dendrites
as a paradigm for regeneration by fusion in Caenorhabditis elegans. Genetics 206, 215–230 (2017).
82. Song, Y. et al. Regeneration of Drosophila sensory neuron axons and dendrites is regulated by the Akt pathway involving Pten and microRNA bantam. Genes Dev. 26, 1612–1625 (2012).
83. Stone, M. C., Albertson, R. M., Chen, L. & Rolls, M. M. Dendrite injury triggers DLK-independent regeneration. Cell Rep. 6, 247–253 (2014).
84. de Lima, S., Habboub, G. & Benowitz, L. I. Combinatorial Therapy Stimulates Long-Distance Regeneration, Target Reinnervation, and Partial Recovery of Vision After Optic Nerve Injury in Mice. Int. Rev. Neurobiol. 106, 153–172 (2012).
85. Hwang, W. Y. et al. Efficient genome editing in zebrafish using a CRISPR-Cas system. Nat. Biotechnol. 31, 227–229 (2013).
86. Siew, H. L. et al. Zebrafish whole-adult-organism chemogenomics for large-scale predictive and discovery chemical biology. PLoS Genet. 4, (2008).
87. Meyers, J. R. Zebrafish: Development of a Vertebrate Model Organism. Curr. Protoc. Essent. Lab. Tech. 16, (2018).
88. Clark, K. J., Urban, M. D., Skuster, K. J. & Ekker, S. C. Transgenic zebrafish using transposable elements. in Methods in Cell Biology 104, 137–149 (2011).
89. Zhao, S., Huang, J. & Ye, J. A fresh look at zebrafish from the perspective of cancer research. Journal of Experimental and Clinical Cancer Research 34, (2015).
90. Van houcke, J. et al. Successful optic nerve regeneration in the senescent zebrafish despite age-related decline of cell intrinsic and extrinsic response processes. Neurobiol. Aging 60, 1–10 (2017).
91. Dekeyster, E. et al. Tackling glaucoma from within the brain: An unfortunate interplay of BDNF and TrkB. PLoS One 10, (2015).
92. Becker, T. & Becker, C. G. Axonal regeneration in zebrafish. Current Opinion in Neurobiology 27, 186–191 (2014).
93. Becker, C. G. & Becker, T. Adult zebrafish as a model for successful central nervous system regeneration. Restor. Neurol. Neurosci. 26, 71–80 (2008).
94. McCurley, A. T. & Callard, G. V. G. V. Time course analysis of gene expression patterns in zebrafish eye during optic nerve regeneration. J. Exp. Neurosci. 4, 17–33 (2010).
95. Becker, C. G., Becker, T. & Meyer, R. L. Increased NCAM-180 immunoreactivity and maintenance of L1 immunoreactivity in injured optic fibers of adult mice. Exp. Neurol. 169, 438–448 (2001).
96. Becker, C. G. & Becker, T. Gradients of ephrin-A2 and ephrin-A5b mRNA during retinotopic regeneration of the optic projection in adult zebrafish. J. Comp. Neurol. 427, 469–483 (2000).

General introduction | 25
97. Stuermer, C. A. O. How reggies regulate regeneration and axon growth. Cell and Tissue Research 349, 71–77 (2012).
98. Stuermer, C. A. O. The reggie/flotillin connection to growth. Trends Cell Biol. 20, 6–13 (2010). 99. Diekmann, H., Kalbhen, P. & Fischer, D. Active mechanistic target of rapamycin plays an ancillary
rather than essential role in zebrafish CNS axon regeneration. Front. Cell. Neurosci. 9, 251 (2015).
100. McConnell, B. B. & Yang, V. W. Mammalian Krüppel-Like factors in health and diseases. Physiological Reviews 90, 1337–1381 (2010).
101. Ogai, K. et al. Upregulation of Leukemia Inhibitory Factor (LIF) during the early stage of optic nerve regeneration in zebrafish. PLoS One 9, (2014).
102. Zou, S., Tian, C., Ge, S. & Hu, B. Neurogenesis of Retinal Ganglion Cells Is Not Essential to Visual Functional Recovery after Optic Nerve Injury in Adult Zebrafish. PLoS One 8, (2013).
103. Chung, S. H. et al. Novel DLK-independent neuronal regeneration in Caenorhabditis elegans shares links with activity-dependent ectopic outgrowth. Proc. Natl. Acad. Sci. U. S. A. 113, E2852–E2860 (2016).
104. Francis, M. M. & Freeman, M. R. Dendrites actively restrain axon outgrowth and regeneration. Proceedings of the National Academy of Sciences of the United States of America 113, 5465–5466 (2016).
105. Drummond, E. S. et al. Effects of intravitreal injection of a Rho-GTPase inhibitor (BA-210), or CNTF combined with an analogue of cAMP, on the dendritic morphology of regenerating retinal ganglion cells. Restor. Neurol. Neurosci. 32, 391–402 (2014).
106. Beckers, A. et al. An Antagonistic Axon-Dendrite Interplay Enables Efficient Neuronal Repair in the Adult Zebrafish Central Nervous System. Mol. Neurobiol. 56, 3175–3192 (2019).

26 | Chapter 1

CHAPTER 2
POTENTIAL UNDERLYING MECHANISMS FOR AN ANTAGONISTIC
AXON-DENDRITE INTERPLAY
Parts of this chapter have been published in:
Beckers, A., Moons, L. Dendritic shrinkage after injury: a cellular killer or a necessity for axonal
regeneration? Neural. Regeneration Research, 14, 1313-1316 (2019).

28 | Chapter 2
CHAPTER 2 …………………………………..…………………………………………………………………………………27
1 AN ENERGY RESTRICTION-BASED TRADE-OFF IN NEURITE OUTGROWTH ……...…….29
1.1 HIGH ENERGY DEMAND DURING NEURITE DEVELOPMENT COVERED BY
MITOCHONDRIA …………………………………………………………………………………………………………….29
1.2 MITOCHONDRIAL DYSFUNCTION AFTER AXONAL DAMAGE …………..…………………………32
1.3 INCREASED MITOCHONDRIAL TRANSPORT AND DENSITY IN AXONS ENFORCES
AXONAL REGENERATION ………………………………………………………………………………………………32
1.4 NEURONAL ACTIVITY AS A REGULATOR OF MITOCHONDRIAL MOTILITY …………………34
1.5 MITOCHONDRIAL DYNAMICS …………………………………………………………………………………..38
2 A BUILDING BLOCK RESTRICTION-BASED MECHANISM UNDERLYING THE
ANTAGONISTIC AXON-DENDRITE INTERPLAY ...…………………………………………………….45
2.1 ROLE OF AUTOPHAGY IN NEURONAL SURVIVAL, AXON REGENERATION AND
NEURITE DETERIORATION …………………………………………………………………………………………….47
3 REFERENCES ………………………………………………………………………………………………………….51

Potential mechanisms underlying an antagonistic axon-dendrite interplay | 29
1 AN ENERGY RESTRICTION-BASED TRADE-OFF IN NEURITE
OUTGROWTH
Although our brain accounts for only 2% of our total body weight, it consumes 20% of
the total produced energy1,2. Normal neuronal functioning is therefore an extremely high
energy-demanding process, with ~75% of the energy consumption going to signaling
processes, while the remaining 25% is necessary for housekeeping functions, including protein
synthesis and lipid turnover2–4. The main energy source for brain metabolism is glucose, that
should be constantly provided via the blood stream to ensure optimal neuronal functioning.
In contrast to muscles and adipose tissue, the central nervous system (CNS) stores only a
limited amount of glucose in the form of glycogen as a backup energy source, which has the
disadvantage that under aglycemic conditions correct neuronal functioning can only be
maintained for a few minutes, whereafter body functions can drastically be affected5–8. All this
information clearly indicates that maintaining a correct energy balance inside neurons is of
vital importance as energy delivery/production is limited. A possible explanation for an
antagonistic axon-dendrite interplay after axonal insult in adult zebrafish, in which dendrite
shrinkage is necessary for efficient axonal regeneration, could therefore be found in an
intraneuronal energy restriction. It is indeed reasonable to speculate that simultaneous axonal
regrowth and preservation of functional dendrites, both high energy-intensive processes, do
not fit the neuronal energy budget, but need to follow a step-by-step approach including a
first synaptic and dendritic deterioration phase, providing the necessary energy for the
following axonal regrowth phase. After proper axogenesis and target innervation, this energy
should then shift again to the dendrites to induce their growth and synaptogenesis.
1.1 HIGH ENERGY DEMAND DURING NEURITE DEVELOPMENT COVERED BY
MITOCHONDRIA
Outgrowth of neurites, thus dendrites and axons, requires a massive amount of energy,
mostly inside growth cones, which are the highly motile tips at the neurite ends where
membrane expansion occurs in order to elongate the neuronal protrusions. This actin
polymerization-based process utilizes 50% of the energy in a developing neuron, provided in
the form of adenosine triphosphate (ATP). In the peripheral region of the growth cone, actin
monomers are loaded with ATP, after which actin polymerization provides the pushing force
for elongation of the neurite. Upon incorporation into the leading edge of the filament, ATP
30 | Chapter 2
will by hydrolyzed to adenosine diphosphate (ADP), and ADP-bound actin will be released over
time at the opposite end in order to be reloaded and recycled9–14 (Fig. 2.1).
Fig. 2.1 Schematic representation of the actin polymerization process inside the growth cone, underlying
neurite elongation.
In the peripheral region of the active growth cone, actin monomers will first be loaded with ATP, after which
these activated molecules can form di- and trimers and eventually a full-length actin filament. ATP hydrolysis
inside this structure will result in disassembly of unloaded actin at the - end, which can be reactivated and
recycled at the + end of the filament.
ATP, adenosine triphosphate.
The ATP molecules driving neurite elongation are mostly generated by mitochondria,
which are dynamic double-membrane bounded organelles that continuously change size,
shape and location in order to meet the energy requirements of cells15. These organelles are
important for the catabolic cellular respiration process, in which glucose molecules are broken
down in the presence of oxygen, resulting in ATP production. In addition to sugar, other
metabolites like fatty acids, amino acids and proteins can be processed to intermediates that
can feed the different steps of cellular respiration. In general, glucose molecules are first
metabolized to pyruvate, in a process called glycolysis, which takes place in the cytosol.
Pyruvate will then be transported to the mitochondrial matrix, and oxidized using the
tricarboxylic acid cycle (TCA) cycle or the Krebs cycle, which produces nicotinamide adenine
dinucleotide (NADH) and flavin adenine dinucleotide (FADH2). Both glycolysis and the TCA
cycle yield two ATP units, starting from one glucose molecule. Next, NADH and FADH2,
delivered by the TCA cycle and glycolysis, are oxidized inside mitochondria during a process

Potential mechanisms underlying an antagonistic axon-dendrite interplay | 31
called oxidative phosphorylation, and the released electrons are passed by four electron
carriers embedded in the inner mitochondrial membrane, called complex I-IV of the electron
transport chain. These electrons will eventually be transferred to oxygen together with two
protons, thereby making a water molecule. During the electron-transport process, a proton-
gradient is formed across the inner mitochondrial membrane, which will be used by the ATP
synthase enzyme to drive ATP production16,17 (Fig. 2.2). This last step yields 32 extra ATP
molecules per glucose molecule, making oxidative phosphorylation the most efficient energy-
producing step of cellular respiration.
Fig. 2.2 Overview of cellular respiration inside neurons.
High-energy molecules, like glucose, are gradually broken down during the different steps of cellular respiration
in order to drive ATP synthesis. Glycolysis, which takes place in the cytosol, will provide the substrates for the
TCA or Krebs cycle, performed in the matrix of mitochondria and both steps will each yield two molecules of ATP.
NADH and FADH2, produced during the TCA cycle, will be used in the electron transport chain where they are
oxidized and release electrons and protons. The protons are shuttled across the inner mitochondrial membrane,
and the resulting proton gradient will drive the ATP synthase enzyme, which can generate 32 ATP units, starting
from one glucose molecule. Oxidative phosphorylation figure adapted from Medicine (2018).
ADP, adenosine diphosphate; ATP, adenosine triphosphate; FADH2, Flavin adenine dinucleotide; NADH,
nicotinamide adenine dinucleotide; TCA, citric acid; OXPHOS, oxidative phosphorylation.
In addition to energy production, mitochondria fulfill numerous other functions in
neurons including neurotransmitter synthesis, Ca2+ buffering, restoration of ion gradients and
reactive oxygen species (ROS) production and sequestration15,18. Abnormalities in
mitochondrial morphology, dynamics and/or function are frequently observed in and
sometimes at the root of CNS disorders and neurodegenerative diseases, further highlighting
mitochondria as one of the most essential organelles inside neurons15,18–21.

32 | Chapter 2
1.2 MITOCHONDRIAL DYSFUNCTION AFTER AXONAL DAMAGE
To overcome neurite damage/dysfunction caused by CNS injury or neurodegenerative
diseases, enormous amounts of ATP boosting axonal and/or dendritic regrowth are critical.
Right at that time, unfortunately, mitochondria surrounding the injured/severed site are likely
unable to produce the necessary energy22,23. Indeed, it has been shown in different axonal
injury models that damage causes a drop in inner mitochondrial membrane potential, which
depolarizes mitochondria and abolishes their capacity for oxidative phosphorylation23–25.
Injured neurons thus require an additional energy source to repair axons, or are otherwise
doomed to never reconnect with other cells. Producing ATP on a distant location, e.g. in the
soma, does not seem an adequate approach for axonal regrowth due to a low diffusion rate
of this molecule, a short ATP half-life of less than one second and the extended structure of
axons26,27. The ideal method to reverse this injury-induced energy deficit would therefore be
a translocation of healthy mitochondria towards the axonal injury site, enabling growth cone
formation and axon outgrowth initiation22.
1.3 INCREASED MITOCHONDRIAL TRANSPORT AND DENSITY IN AXONS
ENFORCES AXONAL REGENERATION
In general, mitochondrial transport is active, can proceed in both directions and is often
interrupted with pausing steps and orientation changes. Long-range movements depend on
both motor proteins moving along microtubules, with the kinesin-1 family responsible for
anterograde transport and dynein proteins for retrograde transport, and on an adaptor
complex, which forms a connection between the outer mitochondrial membrane and the
motor proteins15,28,29.
Mitochondria are very motile during development but most of them become stationary
in mature mammalian CNS neurons, and this in regions with the highest metabolic needs, such
as synapses, axonal/dendritic branch points and nodes of Ranvier, often regulated by
docking/anchoring molecules. Indeed, only 20-30% of axonal mitochondria are motile in
mature neurons in vivo, and different in vitro studies even report that the pool of immobilized
mitochondria is as large as 95%30–33. Although this non-uniform mitochondrial distribution is
critical to ensure sufficient ATP-supply there where it is required for efficient neuronal
functioning, this reduction in mitochondrial motility has been put forward as an important

Potential mechanisms underlying an antagonistic axon-dendrite interplay | 33
limiting factor for CNS axonal regeneration in adult mammals as after injury energy
requirements can spatially be shifted, e.g. in axonal growth cones22,24,34.
In fact, it has been reported that animals showing robust axon regeneration, augment
their axonal mitochondrial transport rate after injury. In C. elegans, 70% of the axons of γ-
aminobutyric acid motor neurons regenerate after laser axotomy in vivo, while 30% fail to
form a functional growth cone. The growing axons were found to be characterized by an
increased mitochondrial density compared to control or injured non-regrowing axons, and this
was due to elevated mitochondrial transport and not to enhanced mitochondrial
biogenesis/fission or reduced mitophagy. Notably, experimentally in- or decreasing
mitochondrial density in these injured axons did not change the percentage of successful
growth cone formation, but had the expected positive, respectively, negative effect on
elongation in the axons that did regenerate26. Another study reported a positive impact of
mitochondrial motility on axonal outgrowth in spontaneously regenerating zebrafish larvae.
After spinal cord laser axotomy, an increased number of mobile mitochondria was observed
in the axons that regenerated over a long distance as compared to the short ones, and
stimulating axonal outgrowth using dibutyryl cyclic adenosine monophosphate enhanced
mitochondrial motility35. Also in the peripheral nervous system (PNS), which is capable to
repair axons even in mammalian models, it is reported that mitochondrial transport increases
following axonal injury. Indeed, after in vivo axonal transection of the peripheral branch of
dorsal root ganglia (DRG) and intercostal nerves of mice, axonal mitochondrial mobility,
analyzed in the corresponding explants in vitro, was found to be elevated36. Finally, Zhou et
al. (2016) showed that improved mitochondrial transport via deletion of the axonal
mitochondria-anchoring protein syntaphilin accelerated axonal regrowth after sciatic nerve
crush in mice, providing evidence that mitochondrial transport also underlies the axonal
regenerative outcome in the mammalian PNS24.
In contrast to the PNS, the mammalian CNS does not regenerate spontaneously, but
over the years different methods have been developed to experimentally stimulate axonal
regrowth. For a few of these axonal-inducing paradigms, increased mitochondrial transport
was recently identified as an underlying factor for the beneficial effect. Indeed, a regenerative
response of the central branch of mouse DRG neurons after spinal cord injury is absent under
normal physiological conditions, but can be evoked following a peripheral branch lesion in the
34 | Chapter 2
form of sciatic nerve injury. This “peripheral lesion condition” boosts global axonal transport
including that of mitochondria, both in the peripheral and the central branch, measured using
DRG explants. Notably, only severing the central branch of DRG neurons did not increase
mitochondrial transport, nor did it lead to axonal regrowth36. Secondly, retinoic acid (RA)
signaling is beneficial for neurite outgrowth during development, and experimentally
increasing RA signaling likewise improved mammalian CNS axonal outgrowth both in vitro and
in vivo. A recent paper now reports that stimulating RA signaling is associated with higher
mitochondrial transport rates and mitochondrial density in the growth cone, as shown using
primary cell cultures of mouse cortical neurons37,38. Again only shown in culture, adding brain-
derived neurotrophic factor (BDNF), a known stimulant for axonal regrowth, increased
mitochondrial density in the growth cone of hippocampal neurons38,39. Lastly, mice with a co-
deletion of phosphate and tensin homolog (PTEN) and suppressor of cytokine signaling 3
(SOCS3), known to robustly enhance RGC axonal regrowth, showed an increased expression
of armadillo repeat containing X‐linked 1 (ARMCX1), a mitochondrial protein that interacts
with the transport machinery via mitochondrial Rho guanine triphosphate (GTP) GTPase 1.
Subsequent overexpression and knockdown experiments indicated that ARMCX1 is crucial for
the positive axonal regeneration effect after optic nerve crush (ONC) and does so by releasing
stationary mitochondria and thus promoting mitochondrial mobility inside axons. Similar
results were found using cultured E18 mouse cortical neurons, indicating that the positive
effect of ARMCX1 on axon outgrowth and mitochondrial motility was not only RGC-
specific24,40. In a very recent paper by Han et al. (2020), the role of enhanced mitochondrial
transport on CNS axonal regrowth was studied in a more direct way, by the use of Snph-/- mice,
lacking the syntaphilin mitochondrial anchoring protein. The authors reported increased
axonal regeneration and functional recovery after spinal cord injury in these Snph-/- mice,
compared to wild-type animals41. Overall, these data in the mammalian CNS and
spontaneously regenerating nervous systems support a crucial role of mitochondrial transport
in axonal repair.
1.4 NEURONAL ACTIVITY AS A REGULATOR OF MITOCHONDRIAL MOTILITY
Although mitochondrial motility is rather low in mammalian adult neurons, it is
enhanced upon a reduced synaptic/neuronal activity. Indeed, in primary cultures of mouse
hippocampal neurons mitochondrial mobility was enhanced by the action potential blocker

Potential mechanisms underlying an antagonistic axon-dendrite interplay | 35
tetrodotoxin and reduced by neuronal depolarization using KCl42. Glutamate application to rat
primary cortical cultures to increase neuronal firing, triggered mitochondrial
immobilization29,42,43. Different independent studies have described that the resulting Ca2+
influx is the underlying mechanism for stalled mitochondria upon neuronal activity, mediated
by the important mitochondrial anchoring protein mitochondrial Rho GTPase (Miro). Miro,
which is located on the mitochondrial outer membrane, binds to adaptor proteins of the
trafficking kinesin proteins (TRAK) family that can, on their turn, form a connection with the
microtubule motor proteins. Calcium binding provokes a conformational change inside Miro
that either disrupts the connection between the adaptor and motor proteins, or between the
mitochondrial-motor complex and the microtubule, with stationary mitochondria as a result
(Fig. 2.3). Inducing expression of a mutant Miro unable to bind Ca2+, abolished the observed
stalling effect upon ion influx, identifying Miro as a calcium-sensor for regulating
mitochondrial motility29,44–47.
Fig. 2.3 Ca2+ influx upon neuronal activity evokes a conformational change of Miro resulting in mitochondrial
arrest.
The mitochondrial anchoring protein Miro, located at the outer mitochondrial membrane can bind to different
proteins of the TRAK mitochondrial adaptor family, connected to the microtubule motor proteins, kinesin and
dynein. Neuronal firing leads to the influx of Ca2+ ions that then bind to Miro, which triggers a conformational
change inside this protein, thereby disrupting the connection between TRAK and motor proteins or between the
motor proteins and the microtubule. In both cases, mitochondria are thereafter immobilized due to detached
mitochondrial transport machinery.
Miro, mitochondrial Rho GTPase; TRAK, trafficking kinesin.

36 | Chapter 2
In this view, the observed synapse loss and dendritic shrinkage after axonal injury in
zebrafish could result in a reduced synaptic input and hence, a release of mitochondria within
the dendrites/soma that then translocate to the axonal growth cone in order to boost axonal
regeneration (Fig. 2.4). After finalizing axon regrowth and target contact, the reverse
mitochondrial translocation from axons to dendrites could enable dendrite repair.
Importantly, by manipulating the Miro/TRAK complexes explained above, Van Spronsen et al.
(2013) already provided some preliminary indications that a release of dendritic mitochondria
can indeed stimulate axonal regeneration. Using cultures of embryonic rat hippocampal cells,
they unraveled that in these neurons the members of the TRAK family, TRAK1 and TRAK2,
differed in cellular localization and function. Indeed, while TRAK1 was mainly found in axons
and steered mitochondria into these neurites via the binding with kinesin-1 or dynein, TRAK2,
in contrast, had an exclusive dendritic location and was important to move mitochondria
inside dendrites via the association with dynein. Strikingly, knockdown of TRAK2 did not only
have the expected negative effect on dendrite outgrowth in these cells, due to a reduction in
the number of mitochondria moving inside dendrites, but simultaneously increased axonal
outgrowth, probably due to the availability of extra ‘dendrite-derived’ energy producing
organelles48. While not highlighted or discussed in this study, these findings then also enforce
the idea that internal energy released from dendrites after axonal injury could enable axonal
regrowth. Later on, dendritic regrowth probably requires similar energy levels, so the reverse
energy transport could be necessary to obtain a full functional neuronal network again.
Translocation of healthy mitochondria towards the injury site thus seems to be
important to induce axonal regeneration but a remaining pertinent question is where these
mitochondria need to come from. As explained above, moving existing mitochondria from
dendrites/soma is one option to induce axonal regrowth, (Fig. 2.4) which should then be
followed by an internal mitochondrial shuffling from axons to dendrites to subsequently
induce dendritic regrowth. However, mitochondria are dynamic organelles that constantly
undergo different modification processes including biogenesis, fission, fusion, and mitophagy.
These processes, altogether called mitochondrial dynamics, can have a potential role in
axon/dendrite regeneration by providing healthy mitochondria at the growing neurite tip. In
the next paragraphs these processes will be briefly explained, together with their hypothetical
beneficial effect on axonal/dendritic regrowth, as well as the current evidence linking

Potential mechanisms underlying an antagonistic axon-dendrite interplay | 37
mitochondrial dynamics with axonal/dendritic regeneration or dendritic shrinkage. Of note, if
the term “neurite” outgrowth/regrowth is used in the following paragraphs, no distinction
between axons and dendrites was made in the discussed paper.

38 | Chapter 2
1.5 MITOCHONDRIAL DYNAMICS
1.5.1 Mitochondrial biogenesis
Mitochondrial biogenesis is a complex multi-step process, which can be defined as the
consecutive growth and division of pre-existing mitochondria (Fig. 2.5). Important is thus that,
de novo mitochondrial production, starting from scratch, is not possible. As mitochondria are
descendants of endosymbiotic bacteria, they contain their own genome which encodes in
almost all animals 13 proteins essential for oxidative phosphorylation together with 22
transfer ribonucleic acids (tRNA) and two ribosomal ribonucleic acids (rRNA), underlying their
auto-replicative capacity. Transcription and translation of this mitochondrial deoxyribonucleic
acid (mtDNA) and the mitochondrial import of ~1000-1500 nuclear-encoded mitochondrial
proteins in the cytosol, results in the expansion of the pre-existing organelle, whereafter it
splits into two mitochondria, both containing their own circular mitochondrial genome.
Mitochondrial biogenesis is tightly regulated to maintain the correct number of mitochondria
and is influenced by different physiological parameters and intra/extracellular cues including
cell division, the availability of nutrients/growth factors, hormones, temperature, and even
physical exercise. Many of these stimuli, although signaling via different pathways, influence
the transcription of one key determinant for mitochondrial biogenesis: the transcriptional
coactivator peroxisome proliferator-activated receptor γ coactivator 1α (PGC-1α). This
protein, which is also known as the master regulator of mitochondrial biogenesis, will activate
different nuclear and mitochondrial transcription factors, which in their turn, respectively,
stimulate the gene expression of mitochondrial proteins encoded by the nuclear DNA or
induce replication, transcription and translation of the mitochondrial genome15,49–53.
< Fig. 2.4 Schematic representation of the hypothesis that dendritic shrinkage after optic nerve crush could be
accompanied by the mobilization of mitochondria, as the driving force for axonal regeneration.
A In normal physiological conditions, most mitochondria in neurons are stationary and accumulate at sites with
a high energy need, especially in synapses, where they play an essential role in synapse maintenance and
neurotransmission. B Axonal injury induces a drop in mitochondrial membrane potential (ΔΨm) in the nearby
mitochondria, resulting in mitochondrial depolarization. These dysfunctional mitochondria are not able to
produce the necessary energy for growth cone formation. Within our literature-based energy trade-off
hypothesis, dendrites then start to retract after axonal injury, which could go hand in hand with mitochondrial
reshuffling towards the cell soma, as reduced synaptic input increases mitochondrial mobility. C After massive
synaptic and dendritic degeneration, these mitochondria end up in the axons where they could reverse the
injury-induced energy deficit, thereby enabling growth cone formation and axonal regrowth. Figure published in
Beckers and Moons (2019).

Potential mechanisms underlying an antagonistic axon-dendrite interplay | 39
Noteworthy, not all steps of mitochondrial biogenesis are restricted to the soma as
evidenced by papers suggesting local mtDNA synthesis and mRNA translation for
mitochondrial proteins in axons, followed by fission, although the transcription of the nuclear-
encoded mitochondrial proteins always takes place inside the nucleus54–56.
Assuming that mitochondrial biogenesis increases after axonal injury and dendritic
shrinkage, one logical advantage would be the resulting enhanced ATP production capacity,
which could drive axonal growth cone initiation/expansion, as well as dendritic and synaptic
restoration later on57. Mitochondrial biogenesis additionally plays a role in the mitochondrial
quality control process that is responsible for the removal of damaged, dysfunctional or
potentially harmful mitochondria. Thus, as axonal injury results in depolarized mitochondria
near the injury site, they should be removed, and, in order to maintain mitochondrial
homeostasis, could be replaced by new mitochondria via biogenesis, either locally in axons or
inside the soma followed by axonal transport58,59.
Fig. 2.5 Schematic overview of the mitochondrial life-cycle including all mitochondrial dynamics.
“New” mitochondria can be produced during biogenesis, under the control of PGC-1α, in which the incorporation
of mitochondrial proteins and the replication of mtDNA in an existing mitochondrion will result in an enlarged
organelle with increased mitochondrial mass. Using the scission power of mitochondrial fission, guided by DRP1,
one mitochondrion can be split into multiple mitochondria. OPA1 and MFN proteins are essential for the opposite
process, called mitochondrial fusion, in which the mitochondrial membranes of multiple mitochondria are
merged. Essential for the mitochondrial quality control mechanism is mitophagy, often relying on the
PINK/Parkin pathway, in which damaged or unnecessary mitochondria are removed. Lastly, mitochondria can
also be translocated by the means of motor proteins moving across microtubules and adaptor proteins linking
mitochondria with the transport machinery, although mitochondrial mobility is rather low in adult vertebrates.
DRP1, dynamin-1-like protein; mtDNA, mitochondrial deoxyribonucleic acid; MFN, mitofusin; OPA1, optic
atrophy protein-1; PGC-1 α, proliferator-activated receptor γ coactivator 1α; PINK, phosphatase and tensin
homologue-induced putative kinase 1.

40 | Chapter 2
Several developmental studies indeed highlighted the importance of mitochondrial
biogenesis for axonal/dendritic outgrowth. Knock-down or overexpression of PGC-1α in
cortical rat neurons in vitro decreased/increased, respectively, mitochondrial biogenesis,
mitochondrial density and ATP production, which resulted in reduced/enhanced neurite
lengthening60. Using the same experimental design the link between mitochondrial biogenesis
on the one hand and dendritic growth and synaptic development/maintenance on the other
hand, was confirmed in hippocampal neurons in vitro and in vivo61,62. Moreover, for two
molecules known to enhance dendritic growth during development, namely BDNF and the
thyroid hormone T3, increased PGC-1α expression and subsequent mitochondrial biogenesis
is defined as the underlying growth promoting mechanism, shown in vitro for developing
hippocampal neurons and Purkinje cells60,63. In contrast to development, only one paper hints
towards a positive role of biogenesis for neurite regrowth after injury. In this study, the drug
Rosuvastatin, known to have neuroprotective and regenerative effects after acute brain
injury, was delivered to cultured mice cortical neurons, deprived from oxygen, an in vitro
model for ischemic injury64. The effects of Rosuvastatin application were increased ATP
production and mitochondrial biogenesis, together with improved neurite outgrowth64.
Together these data suggest a positive role for mitochondrial biogenesis in axonal/dendritic
outgrowth and repair.
1.5.2 Mitochondrial fission and fusion
Mitochondria constantly change shape due to fission, the scission of one mitochondrion
into multiple mitochondria, and fusion events, in which different mitochondria merge to form
one large organelle (Fig. 2.5). This fission-fusion balance is affected by many physiological
conditions and results in a variety of mitochondrial sizes ranging from small puncta to long,
often interconnected mitochondrial networks15,65–68. When mitochondria need to divide, the
translocation of dynamin-related protein 1 (DRP1) from the cytosol to the outer mitochondrial
membrane is a critical step. Indeed, this GTPase will oligomerize and form a spiral fission
complex with other proteins at the edge of the mitochondrion. DRP1 will then hydrolyze GTP,
evoking a conformational change that results in spiral contraction and the eventual pinching
off of the outer and inner mitochondrial membranes, resulting in mitochondrial cleavage69–71.
Unlike fission, mitochondrial fusion is a two-step process in which first the outer mitochondrial
membranes of two adjacent mitochondria are fused, which involves the GTPases mitofusin-1

Potential mechanisms underlying an antagonistic axon-dendrite interplay | 41
and 2 (MFN/2), whereafter the inner mitochondrial membranes are merged by optic atrophy
protein-1 (OPA1)65,68. Both MFN1/2 and OPA1 are embedded in the structure in which they
perform their fusion function, being the outer and inner mitochondrial membrane,
respectively.
Fission and fusion give neurons possibilities to cope with the changing cellular
environment after injury or in pathological conditions as adapting mitochondrial morphology
often has functional implications. First of all, both fission and fusion play a role in
mitochondrial quality control: while fusion of a (partly) damaged mitochondrion with a
healthy organelle dilutes the harmful mtDNA and/or damaged mitochondrial proteins, fission
can physically separate damaged mitochondrial material as a first step in the removal of these
potentially dangerous structures, which is then followed by mitophagy66,72. Fusion can also
take place as a stress response because large mitochondria are in general more stress-
resistant and they are associated with increased mitochondrial membrane potential and ATP
production capacity, due to increased dimensions of the inner mitochondrial membrane
harboring more energy-producing mitochondrial enzymes73,74. Lastly, fission facilitates
mitochondrial trafficking because small mitochondria are more mobile, while large
mitochondria are often found in a stationary state15,66,75. In this regard, it is also interesting to
mention that in mouse cortical neurons, studied in vitro and in vivo, and in hippocampal
neurons of rat and ground squirrel in vivo, mitochondrial morphology is different in the axonal
vs. dendritic compartments: while dendritic mitochondria were found to be long and tubular
in shape, axonal mitochondria are short and punctate76,77. A similar observation has not been
reported for RGCs yet, but if the same would hold for zebrafish RGCs, mitochondrial fission
would be of uttermost importance to enable the release of these hypothetical long dendritic
mitochondria in order to translocate to the axonal injury site.
So, what is currently known about the role of fission/fusion in neurite outgrowth during
development? First of all, the vital importance of fission and DRP1 is obvious as neural cell-
specific Drp1-/- mice die shortly after birth. The use of primary forebrain cultures of these mice
could already hint towards a possible underlying mechanism, as defects in neurite and synapse
formation were observed, likely due to failure of the aggregated/enlarged mitochondria to
move inside the cellular processes78. Fukumitsu et al. (2016), also showed altered
mitochondrial morphologies and reduced mitochondrial entry inside neuronal processes in

42 | Chapter 2
developing Purkinje cells containing a dominant negative form of DRP1 both in vitro and in
vivo. They specifically reported this for dendrites, which were shorter and unstable, compared
to dendrites of wild-type mice79. Concluding that mitochondrial fission is the only key driver
for neurite development would however be too short-sighted as mice without functional
OPA1 also die before birth, and downregulation of this protein in developing cortical neurons
in vitro resulted in decreased synaptogenesis and dendritic outgrowth/arborization, similar as
in mice lacking functional DRP180,81. These data clearly indicate that neurite/synaptic
development is a complex matter, critically depending on the coordinated and timed balance
between mitochondrial fission and fusion.
Whether the same requirement of both fission and fusion holds for neurite outgrowth
after injury remains controversial, but increased fission is already a frequently observed
response after axonal insults or under pathological conditions. This is mostly reported for
RGCs, and both beneficial and detrimental effects of fission on neurite
outgrowth/degeneration and neuron survival were shown, so again no straight-forward link
can be made. In the first (non-RGC) example by Seo et al. (2016), increased fission and reduced
mitochondrial sizes in axons were reported after injury of the sciatic nerve, part of the PNS, in
mice. As experimentally inhibiting fission resulted in more neuronal cell death and increased
axonal degeneration, the authors concluded that fission is a positive injury response to
increase neuronal survival and to preserve axons24,34. Augmented fission and consequently
smaller mitochondria were also reported in the RGC soma and axons in the DBA/2J glaucoma
mouse model, as compared to those in wild-type animals. However, upon inhibition of DRP1
or overexpression of OPA1 in these mice, RGC soma and axon survival was improved82,83,
suggesting a detrimental effect of fission on RGC survival and axonal integrity, which is in sharp
contrast with the positive effect of fission on these processes described by Seo et al. (2016).
Whether increased mitochondrial fission enhances or hinders RGC axonal outgrowth, has
been studied using the ONC model in rats. After this insult, the expression of a pro-fission
protein called mitochondrial fission process 1,18 kDa (MTP18) was significantly increased,
with smaller axonal mitochondrial as a consequence. Knockdown of this protein did not show
any significant effect on axonal outgrowth in this in vivo injury model, although increased
neurite lengths were observed in the same study in an in vitro culture of MTP18 knockdown
RGCs, as compared to wild-type cells84. Strikingly, Sketee et al. also inhibited mitochondrial

Potential mechanisms underlying an antagonistic axon-dendrite interplay | 43
fission in rat RGCs in vitro, this time using a pharmacological inhibitor, and observed a
contrasting effect, namely reduced neurite outgrowth, hinting towards a positive effect of
fission on neurite outgrowth in vitro85.
All in all, there is no doubt that more research is urgently needed to elucidate the exact
role of mitochondrial fission/fusion in neuronal survival, axonal preservation and neurite
outgrowth, as no consensus can be drawn based on literature. One remaining but important
remark is that synaptic activity can also modulate the balance of mitochondrial fission/fusion,
similar as for mitochondrial motility, which was specifically shown in vitro in dendrites of
mouse hippocampal neurons. While blocking action potentials by tetrodotoxin application
elevated mitochondrial fusion, increased mitochondrial fission was seen when neurons were
depolarized under the influence of K+ ions43. With this in mind, it is possible that a reduced
neuronal activity caused by dendritic shrinkage after ONC in adult zebrafish, evokes a
mitochondrial fusion response inside dendrites, with the advantage that large mitochondria
can produce higher levels of ATP.
1.5.3 Mitophagy
The endpoint of the mitochondrial life-cycle is often mediated by the process of
mitophagy, the degradation of unnecessary or damaged mitochondria in lysosomes (Fig. 2.5).
The selective removal of these whole organelles can proceed via different signaling pathways,
of which PTEN-induced putative kinase 1 (PINK1)-Parkin-mediated mitophagy is the best
studied. PINK1 acts herein as a mitochondrial stress sensor that translocates from the cytosol
to the outer mitochondrial membrane. In healthy mitochondria it will eventually end up in the
inner membrane via a mitochondrial membrane potential dependent mechanism where it is
subsequently degraded. Because damaged mitochondria lose their membrane potential, this
translocation step of PINK1 from the outer to the inner mitochondrial membrane will not
proceed. The accumulation of PINK1 at the outer membrane will then activate and translocate
Parkin from the cytosol to the injured mitochondrion. Activated Parkin will eventually
ubiquinate numerous outer mitochondrial membrane proteins, which is the cue for the
mitophagy machinery to degrade the tagged mitochondrion51,86–88.
Mitophagy is logically a critical player in the mitochondrial quality control mechanism,
necessary under basal conditions to maintain homeostasis, as well as under stress or injury
conditions to prevent cellular apoptosis. Indeed, critically damaged mitochondria are at risk
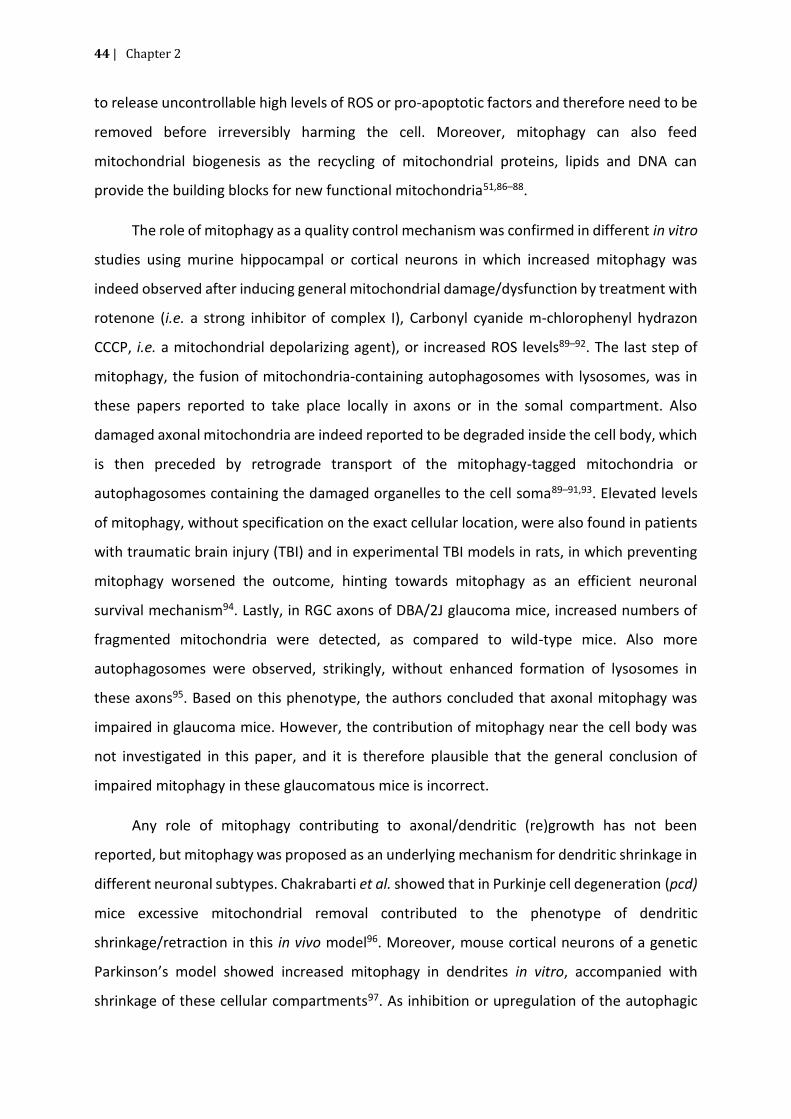
44 | Chapter 2
to release uncontrollable high levels of ROS or pro-apoptotic factors and therefore need to be
removed before irreversibly harming the cell. Moreover, mitophagy can also feed
mitochondrial biogenesis as the recycling of mitochondrial proteins, lipids and DNA can
provide the building blocks for new functional mitochondria51,86–88.
The role of mitophagy as a quality control mechanism was confirmed in different in vitro
studies using murine hippocampal or cortical neurons in which increased mitophagy was
indeed observed after inducing general mitochondrial damage/dysfunction by treatment with
rotenone (i.e. a strong inhibitor of complex I), Carbonyl cyanide m-chlorophenyl hydrazon
CCCP, i.e. a mitochondrial depolarizing agent), or increased ROS levels89–92. The last step of
mitophagy, the fusion of mitochondria-containing autophagosomes with lysosomes, was in
these papers reported to take place locally in axons or in the somal compartment. Also
damaged axonal mitochondria are indeed reported to be degraded inside the cell body, which
is then preceded by retrograde transport of the mitophagy-tagged mitochondria or
autophagosomes containing the damaged organelles to the cell soma89–91,93. Elevated levels
of mitophagy, without specification on the exact cellular location, were also found in patients
with traumatic brain injury (TBI) and in experimental TBI models in rats, in which preventing
mitophagy worsened the outcome, hinting towards mitophagy as an efficient neuronal
survival mechanism94. Lastly, in RGC axons of DBA/2J glaucoma mice, increased numbers of
fragmented mitochondria were detected, as compared to wild-type mice. Also more
autophagosomes were observed, strikingly, without enhanced formation of lysosomes in
these axons95. Based on this phenotype, the authors concluded that axonal mitophagy was
impaired in glaucoma mice. However, the contribution of mitophagy near the cell body was
not investigated in this paper, and it is therefore plausible that the general conclusion of
impaired mitophagy in these glaucomatous mice is incorrect.
Any role of mitophagy contributing to axonal/dendritic (re)growth has not been
reported, but mitophagy was proposed as an underlying mechanism for dendritic shrinkage in
different neuronal subtypes. Chakrabarti et al. showed that in Purkinje cell degeneration (pcd)
mice excessive mitochondrial removal contributed to the phenotype of dendritic
shrinkage/retraction in this in vivo model96. Moreover, mouse cortical neurons of a genetic
Parkinson’s model showed increased mitophagy in dendrites in vitro, accompanied with
shrinkage of these cellular compartments97. As inhibition or upregulation of the autophagic

Potential mechanisms underlying an antagonistic axon-dendrite interplay | 45
response in these mice, respectively prevented or augmented dendrite shortening, the data
hint towards autophagy-mediated mitochondrial removal as an incentive for dendrite
shrinkage. It is indeed possible that upon mitochondrial removal, dendrites cannot be
maintained due to energy shortage as dendritic preservation and synaptic transmission are
high-energy demanding processes. Strikingly, in cell cultures of mouse hippocampal neurons,
low levels of mitophagy were detected in the elongating axon, in comparison with excessive
mitochondrial removal within the immature future dendrites. This effect was mediated by the
collapsin response mediator proteins 5 (CRMP5) protein, which is highly expressed in
dendrites at early developmental stages and was shown to keep them in a quiescent state
during axonal outgrowth by removing mitochondria in the dendrite compartment. In this
regard, it is possible that the observed dendritic deterioration after ONC in adult zebrafish, is
merely a consequence of mitophagy in dendrites, that would lose their morphological integrity
due to the loss of mitochondrial support.
Collectively these paragraphs make it undoubtedly clear that (1) the role of
mitochondrial dynamics in axonal or dendritic regeneration is not sufficiently studied,
definitely not in an in vivo system, that (2) a combinatorial, complex, timed and potentially
spatial mitochondrial response could be underlying successful axonal regeneration and that
(3) dendritic shrinkage could be a driver for axonal regrowth because it can potentially release
dendritic/somatic mitochondria from their immobilized state or it can just be a consequence
of reduced mitochondrial support due to a high level of dendritic mitophagy.
2 A BUILDING BLOCK RESTRICTION-BASED MECHANISM UNDERLYING
THE ANTAGONISTIC AXON-DENDRITE INTERPLAY
Besides an intraneuronal energy restriction, another potential mechanism responsible
for the segregation of dendritic and axonal growth during development and possibly during
CNS repair, could be found in the restriction of building blocks, and here autophagy, the
intracellular recycling mechanism, could play a role.
Autophagy, coming from the Greek “auto”, oneself, and “phagy”, to eat, is the self-
degradative and recycling mechanism inside cells that serves as an important internal quality
control pathway. Indeed, autophagy can remove long-lived, aggregated or misfolded proteins,
damaged or dysfunctional organelles such as mitochondria and peroxisomes, as well as

46 | Chapter 2
intracellular pathogens including bacteria and viruses. While basal autophagy levels in healthy
cells are essential to maintain homeostasis, autophagy can be dramatically induced under
stress conditions, such as nutrient shortage, injury or infection, to cope with these high-risk
situations. An important player in this regard, is the mechanistic target of rapamycin (mTOR)
pathway which is a key regulator of cellular growth/proliferation by controlling the balance
between anabolic and catabolic processes, depending on cellular and environmental
conditions. Indeed, mTOR is a nutrient/stress sensing signaling cascade, which is activated
under favorable circumstances and in this case promotes protein translation necessary for
cellular growth and division, while stress inhibits mTOR, thereby inducing autophagy as a form
of defense mechanism. Besides mTOR-dependent control of autophagy, other
pathways/molecules can induce/inhibit this process, including inositol signaling, Ca2+, cyclic
adenosine monophosphate (cAMP) and different unknown mTOR-independent regulators. Of
note, the vital importance of correct autophagy regulation is worldwide accepted as many
neurodegenerative diseases are associated with inappropriately low or high autophagy levels
or autophagy impairment98–105.
In general, three different classes of autophagy can be distinguished: macroautophagy,
microautophagy and chaperone-mediated autophagy (Fig. 2.6). The most prevalent form is
macroautophagy, which critically depends on the formation of a double-membrane
containing autophagosome that engulfs a group of proteins and/or organelles (in-bulk
macroautophagy) or selected organelles (selective macroautophagy). This autophagosome
will subsequently fuse with a lysosome, where the degradation process will actually take place
(Fig. 2.6). In microautophagy on the other hand, the substrates are immediately internalized
by the lysosome via invagination of the lysosomal membrane and formation of a small vesicle,
that is then released inside the lysosomal lumen. Similar to macroautophagy, microautophagy
can proceed via an in-bulk principle or selective, using recognition of proteins containing a
KFERQ-like motive. This sequence can be recognized and bound by heat shock cognate 71 kDA
protein (HSC70), followed by lysosomal uptake (Fig. 2.6). Lastly, chaperone-mediated
autophagy depends on the recognition and tethering of the same KFERQ by HSC70 but
translocation inside the lysosome is enabled via lysosome-associate membrane protein 2A
(LAMP-2A) (Fig. 2.6). All three types of autophagy end with a final degradation step in the
lysosome, which indeed contains proteases, nucleases, lipases etc., to degrade the delivered

Potential mechanisms underlying an antagonistic axon-dendrite interplay | 47
targets. The end products, including nucleotides, fatty acids, sugars and amino acids, will be
released into the cytosol, where they can be recycled and used to produce new proteins and
organelles102,103,106.
Fig. 2.6 Schematic representation of the three different autophagy subtypes.
A In-bulk or selective macroautophagy both require the formation of an autophagosome surrounding the targets,
that then fuses with the lysosome in order to degrade the delivered proteins/organelles. B While in-bulk
microautophagy starts with the invagination of the lysosomal membrane and subsequent vesical capture of
cytosolic substrates, selective microautophagy is initiated upon recognition of the KFERQ motif by HSC70. This
complex will then be internalized by the lysosome. C Chaperone-mediated autophagy also relies on the tethering
of the KFERQ motif, but translocation of the cargo to the lysosome is here mediated by the LAMP2A complex.
Adapted from Kaushik and Cuervo (2018).
HSC70, heat shock cognate 71 kDA protein; LAMP2A, lysosome-associate membrane protein 2A.
2.1 ROLE OF AUTOPHAGY IN NEURONAL SURVIVAL, AXON REGENERATION
AND NEURITE DETERIORATION
Injury-induced autophagy has been reported in different animal models of CNS damage,
including TBI, spinal cord and optic nerve injury107–110. In acute optic nerve injury models (optic
nerve transection (ONT) and ONC), autophagy was reported to increase as soon as 6 hours
after severing the optic nerve, with a peak around 3-5 days. The autophagosomes were here
detected in the RGC somas, as well as in the optic nerve axons, while autophagy induction
inside the dendrites was not studied111–113. Park et al. (2012) did report increased levels of this
recycling mechanism inside RGC dendrites in a glaucoma mouse model with chronic elevated
intraocular pressure (IOP). Autophagy peaked in this cellular compartment already one week
after elevating the IOP, and was, besides the RGC dendrites, also observed in the RGC somas,

48 | Chapter 2
although in a later stage with maximum expression four weeks after inducing the glaucoma
model. No autophagosomes were visible in the RGC axons114. Strikingly, inhibiting autophagy
in this model, using intravitreal injection of 3-methyladenine (3-MA) that blocks
autophagosome formation via the inhibition of class III phosphoinositide 3-kinases (PI3K),
increased RGC survival114. In contrast to this apparent detrimental effect of autophagy on
neuronal survival, numerous other studies reported the opposite effect. First of all, higher
levels of RGC death were detected in cultured rat RGCs after serum starvation, when
autophagy was inhibited using pharmacological treatment or by inducing Beclin-1 knockdown,
an initiator of autophagosome formation115.
In addition, Rodriguez-Muela et al. (2012) reported that mice deficient for autophagy
related gene 5 (ATG5), which is important for autophagosome formation, showed decreased
RGC survival after ONT compared to wild-type mice. In another experimental set-up using
normal mice, the authors enhanced autophagy using intraperitoneal injection of rapamycin,
an inhibitor of mTOR and thus inducer of mTOR-dependent autophagy, and detected a higher
number of surviving RGCs after ONT, compared to untreated animals116. Finally, the same pro-
survival effect of rapamycin, and thus of raised autophagy levels, likewise improved neuron
survival in a retinal ischemia model, a rat spinal cord injury model and in mice subjected to
motor neuron axotomy117. Most of these papers thus indicate that neuronal autophagy
induction after injury is an advantageous stress response to prevent cell death.
Next to a general pro-survival effect, autophagy was also shown to stimulate axonal
regeneration after injury in various models. First of all, different independent studies indicated
that autophagy induction/inhibition, respectively, enhanced or decreased axonal
regeneration after sciatic nerve crush in rats118–121. Next, in rat DRG neurons, 3-MA treatment
used to prevent the recycling response, diminished the lengths and branching complexity of
the growing neurites, without making an axon or dendrite distinction in this in vitro set-up122.
A similar regenerative effect of autophagy was also shown by He et al. (2016) as increasing
autophagy by local administration of a Beclin-1 like peptide, enhanced axonal regrowth and
subsequent functional recovery in mice after spinal cord injury, as compared to injured
untreated animals. The authors even revealed a potential underlying mechanism using an in
vitro experiment with rat cortical neurons. Herein, Beclin-1 or rapamycin-mediated autophagy
induction promoted axonal outgrowth due to microtubule stabilization, mediated by the

Potential mechanisms underlying an antagonistic axon-dendrite interplay | 49
autophagic degradation of superior cervical ganglia protein 10 (SCG10), a microtubule
destabilizing factor123. Strikingly however, Ban et al. (2013) used the same experimental set-
up, in which rat cortical neurons were subjected to rapamycin-mediated autophagy induction,
and reported axonal growth suppression. The suggested inhibitory role of autophagy on
axonal elongation in this model, was further reinforced in the paper by autophagy-inhibition
experiments using knockdown of atg7 or 3-MA treatment, which both resulted in increased
axonal lengths. Of note, no significant effects on dendrite outgrowth were detected.
Importantly, in these autophagy-inhibited cells, lower protein levels of Ras homolog gene
family member A (RhoA), a critical mediator of the axonal inhibitory pathway Rhoa/rho-
associated protein kinase (ROCK) pathway, were observed. Moreover, the axonal elongation
phenotype observed upon autophagy inhibition in these neurons, was abolished when
Rhoa/ROCK signaling was stimulated using transfection of a constitutively active form of RhoA.
Overall, the authors suggested that autophagy negatively regulates axon extension in these
cultured cortical rat neurons, via inhibition of an axonal-growth suppressive pathway, namely
the RhoA-ROCK signaling cascade124. The hypothesis that autophagy diminishes axon growth,
is supported by a second paper, dating from 1991, in which bafilomycin A1, a commonly used
late-stage autophagy inhibitor that prevents autophagosome-lysosome fusion, increased
neurite outgrowth in rat PC12 cells, derived from adrenal medulla and used as a neuronal cell
model125. All in all, no consensus can be found in literature concerning a
beneficial/detrimental role of autophagy in axonal or dendrite (re)growth, possibly indicating
that the outcome of autophagy modulation can differ depending on the cell type, the used
experimental method to induce autophagy inhibition/induction or the duration/level of the
effect.
Besides neuron survival and outgrowth, autophagy can also affect axon and dendrite
degradation/shrinkage. Indeed, as previously explained in this chapter (1.5.3), in pcd mice,
with spontaneous Purkinje cell death, and a mouse Parkinsons’s model, dendritic shrinkage
was associated with increased levels of autophagy, more specifically with the excessive
removal of mitochondria96,97,126. Wang et al. (2006) used another Purkinje cell degeneration
mouse model, i. e. Lurcher mice with a mutated glutamate receptor underlying cell death, and
observed an association between axonal autophagy and axonal deterioration126,127. However,
no hard proof for axonal autophagy as driver for degradation of these processes was provided

50 | Chapter 2
as the authors did not manipulate the autophagic response to examine the effect on axonal
integrity127. In a rat ONC model, in contrast, it was show that autophagy inhibition via
intravitreal injection of 3-MA, delayed axonal degeneration, compared to control-treated
animals, suggesting that axonal autophagy indeed plays a key role in axonal
degeneration126,128.
In general, autophagy seems to promote the survival of injured neurons, as well as axon
and dendrite degradation/shrinkage, while the role of autophagy in axon/dendrite growth
seems controversial. With these effects in mind, it is worth to investigate if (dendritic)
autophagy could also play a role in axonal regeneration after ONC in adult zebrafish, and if
there is a link with the antagonistic axon-dendrite interplay during CNS repair.

Potential mechanisms underlying an antagonistic axon-dendrite interplay | 51
3 REFERENCES
1. Harris, J. J., Jolivet, R. & Attwell, D. Synaptic Energy Use and Supply. Neuron 75, 762–777 (2012). 2. Remme, M. W. H., Rinzel, J. & Schreiber, S. Function and energy consumption constrain
neuronal biophysics in a canonical computation: Coincidence detection. PLoS Comput. Biol. 14, (2018).
3. Magistretti, P. J. & Allaman, I. A Cellular Perspective on Brain Energy Metabolism and Functional Imaging. Neuron 86, 883–901 (2015).
4. Engl, E. & Attwell, D. Non-signalling energy use in the brain. Journal of Physiology 593, 3417–3429 (2015).
5. Waitt, A. E., Reed, L., Ransom, B. R. & Brown, A. M. Emerging roles for glycogen in the CNS. Frontiers in Molecular Neuroscience 10, (2017).
6. Zhao, Y. et al. Decreased Glycogen Content Might Contribute to Chronic Stress-Induced Atrophy of Hippocampal Astrocyte volume and Depression-like Behavior in Rats. Sci. Rep. 7, (2017).
7. Obel, L. F. et al. Brain glycogen - new perspectives on its metabolic function and regulation at the subcellular level. Frontiers in Neuroenergetics (2012).
8. Mathieu, C. et al. Insights into brain glycogen metabolism the structure of human brain glycogen phosphorylase. J. Biol. Chem. 291, 18072–18083 (2016).
9. Letourneau, P. C. Cytoskeleton in Axon Growth. in eLS 1–10 (2016). 10. Smith, S. J. Neuronal cytomechanics: The actin-based motility of growth cones. Science (80-. ).
242, 708–715 (1988). 11. Gungabissoon, R. A. & Bamburg, J. R. Regulation of growth cone actin dynamics by ADF/cofilin.
in Journal of Histochemistry and Cytochemistry 51, 411–420 (2003). 12. Tamariz, E. & Varela-Echavarría, A. The discovery of the growth cone and its influence on the
study of axon guidance. Frontiers in Neuroanatomy 9, (2015). 13. Gomez, T. M. & Letourneau, P. C. Actin dynamics in growth cone motility and navigation.
Journal of Neurochemistry 129, 221–234 (2014). 14. Smith, G. M. & Gallo, G. The role of mitochondria in axon development and regeneration.
Developmental Neurobiology 78, 221–237 (2018). 15. Ito, Y. A. & Di Polo, A. Mitochondrial dynamics, transport, and quality control: A bottleneck for
retinal ganglion cell viability in optic neuropathies. Mitochondrion 36, 186–192 (2017). 16. Berg, J., Tymoczko, J. & Stryer, L. Biochemistry, 5th edition. Biochemistry (2002). 17. Chaban, Y., Boekema, E. J. & Dudkina, N. V. Structures of mitochondrial oxidative
phosphorylation supercomplexes and mechanisms for their stabilisation. Biochimica et Biophysica Acta - Bioenergetics 1837, 418–426 (2014).
18. Flippo, K. H. & Strack, S. Mitochondrial dynamics in neuronal injury, development and plasticity. Journal of Cell Science 130, 671–681 (2017).
19. Petrozzi, L., Ricci, G., Giglioli, N. J., Siciliano, G. & Mancuso, M. Mitochondria and neurodegeneration. in Bioscience Reports 27, 87–104 (2007).
20. Lin, M. T. & Beal, M. F. Mitochondrial dysfunction and oxidative stress in neurodegenerative diseases. Nature 443, 787–795 (2006).
21. Johri, A. & Beal, M. F. Mitochondrial dysfunction in neurodegenerative diseases. Journal of Pharmacology and Experimental Therapeutics 342, 619–630 (2012).
22. Beckers, A. & Moons, L. Dendritic shrinkage after injury: A cellular killer or a necessity for axonal regeneration? Neural Regeneration Research 14, 1313–1316 (2019).
23. Patrón, L. A. & Zinsmaier, K. E. Mitochondria on the Road to Power Axonal Regeneration. Neuron 92, 1152–1154 (2016).
24. Zhou, B. et al. Facilitation of axon regeneration by enhancing mitochondrial transport and rescuing energy deficits. J. Cell Biol. 214, 103–119 (2016).
25. Cavallucci, V. et al. Acute focal brain damage alters mitochondrial dynamics and autophagy in axotomized neurons. Cell Death Dis. 5, (2014).

52 | Chapter 2
26. Han, S. M., Baig, H. S. & Hammarlund, M. Mitochondria Localize to Injured Axons to Support Regeneration. Neuron 92, 1308–1323 (2016).
27. Mortensen, S. P., Thaning, P., Nyberg, M., Saltin, B. & Hellsten, Y. Local release of ATP into the arterial inflow and venous drainage of human skeletal muscle: Insight from ATP determination with the intravascular microdialysis technique. J. Physiol. 589, 1847–1857 (2011).
28. Lin, M. Y. & Sheng, Z. H. Regulation of mitochondrial transport in neurons. Experimental Cell Research 334, 35–44 (2015).
29. Cai, Q. & Sheng, Z. H. Mitochondrial transport and docking in axons. Experimental Neurology 218, 257–267 (2009).
30. Lewis, T. L., Turi, G. F., Kwon, S. K., Losonczy, A. & Polleux, F. Progressive Decrease of Mitochondrial Motility during Maturation of Cortical Axons In Vitro and In Vivo. Curr. Biol. 26, 2602–2608 (2016).
31. Niescier, R. F., Hong, K., Park, D. & Min, K. T. MCU interacts with miro1 to modulate mitochondrial functions in neurons. Journal of Neuroscience 38, 4666–4677 (2018).
32. Loss, O. & Stephenson, F. A. Developmental changes in trak-mediated mitochondrial transport in neurons. Mol. Cell. Neurosci. 80, 134–147 (2017).
33. Misgeld, T. & Schwarz, T. L. Mitostasis in Neurons: Maintaining Mitochondria in an Extended Cellular Architecture. Neuron 96, 651–666 (2017).
34. Kiryu-Seo, S. & Kiyama, H. Mitochondrial behavior during axon regeneration/degeneration in vivo. Neuroscience Research 139, 42–47 (2019).
35. Xu, Y., Chen, M., Hu, B., Huang, R. & Hu, B. In vivo imaging of mitochondrial transport in single-axon regeneration of zebrafish mauthner cells. Front. Cell. Neurosci. 11, (2017).
36. Mar, F. M. et al. CNS axons globally increase axonal transport after peripheral conditioning. J. Neurosci. 34, 5965–5970 (2014).
37. Puttagunta, R. & Di Giovanni, S. Retinoic acid signaling in axonal regeneration. Front. Mol. Neurosci. (2012).
38. Trigo, D., Goncalves, M. B. & Corcoran, J. P. T. The regulation of mitochondrial dynamics in neurite outgrowth by retinoic acid receptor β signaling. FASEB J. 33, 7225–7235 (2019).
39. Beck, H. et al. Serum response factor (SRF)-cofilin-actin signaling axis modulates mitochondrial dynamics. Proc. Natl. Acad. Sci. U. S. A. 109, (2012).
40. Cartoni, R. et al. The Mammalian-Specific Protein Armcx1 Regulates Mitochondrial Transport during Axon Regeneration. Neuron 92, 1294–1307 (2016).
41. Han, Q. et al. Restoring Cellular Energetics Promotes Axonal Regeneration and Functional Recovery after Spinal Cord Injury. Cell Metab. 31, 623-641.e8 (2020).
42. Rintoul, G. L., Filiano, A. J., Brocard, J. B., Kress, G. J. & Reynolds, I. J. Glutamate decreases mitochondrial size and movement in primary forebrain neurons. J. Neurosci. 23, 7881–7888 (2003).
43. Li, Z., Okamoto, K. I., Hayashi, Y. & Sheng, M. The importance of dendritic mitochondria in the morphogenesis and plasticity of spines and synapses. Cell 119, 873–887 (2004).
44. Saotome, M. et al. Bidirectional Ca2+-dependent control of mitochondrial dynamics by the Miro GTPase. Proc. Natl. Acad. Sci. U. S. A. 105, 20728–20733 (2008).
45. MacAskill, A. F. et al. Miro1 Is a Calcium Sensor for Glutamate Receptor-Dependent Localization of Mitochondria at Synapses. Neuron 61, 541–555 (2009).
46. Wang, X. & Schwarz, T. L. The Mechanism of Ca2+-Dependent Regulation of Kinesin-Mediated Mitochondrial Motility. Cell 136, 163–174 (2009).
47. Cai, Q. & Sheng, Z. H. Moving or Stopping Mitochondria: Miro as a Traffic Cop by Sensing Calcium. Neuron 61, 493–496 (2009).
48. van Spronsen, M. et al. TRAK/Milton Motor-Adaptor Proteins Steer Mitochondrial Trafficking to Axons and Dendrites. Neuron 77, 485–502 (2013).
49. Palikaras, K. & Tavernarakis, N. Mitochondrial homeostasis: The interplay between mitophagy and mitochondrial biogenesis. Experimental Gerontology 56, 182–188 (2014).
50. Jornayvaz, F. R. & Shulman, G. I. Regulation of mitochondrial biogenesis. Essays Biochem. 47,

Potential mechanisms underlying an antagonistic axon-dendrite interplay | 53
69–84 (2010). 51. Palikaras, K., Lionaki, E. & Tavernarakis, N. Balancing mitochondrial biogenesis and mitophagy
to maintain energy metabolism homeostasis. Cell Death and Differentiation 22, 1399–1401 (2015).
52. Fernandez-Marcos, P. J. & Auwerx, J. Regulation of PGC-1α, a nodal regulator of mitochondrial biogenesis. in American Journal of Clinical Nutrition 93, (2011).
53. Ventura-Clapier, R., Garnier, A. & Veksler, V. Transcriptional control of mitochondrial biogenesis: The central role of PGC-1α. Cardiovascular Research 79, 208–217 (2008).
54. Kuzniewska, B. et al. Mitochondria biogenesis in the synapse is supported by local translation. bioRxiv 789164 (2019).
55. Van Laar, V. S. et al. Evidence for compartmentalized axonal mitochondrial biogenesis: Mitochondrial DNA replication increases in distal axons as an early response to Parkinson’s disease-relevant stress. J. Neurosci. 38, 7505–7515 (2018).
56. Amiri, M. & Hollenbeck, P. J. Mitochondrial biogenesis in the axons of vertebrate peripheral neurons. Dev. Neurobiol. 68, 1348–1361 (2008).
57. Prasun, P. Treatment of Mitochondrial Diseases. in Mitochondrial Medicine 15–20 (2019). 58. Fischer, F., Hamann, A. & Osiewacz, H. D. Mitochondrial quality control: An integrated network
of pathways. Trends in Biochemical Sciences 37, 284–292 (2012). 59. Ni, H. M., Williams, J. A. & Ding, W. X. Mitochondrial dynamics and mitochondrial quality
control. Redox Biology 4, 6–13 (2015). 60. Vaarmann, A. et al. Mitochondrial biogenesis is required for axonal growth. Dev. 143, 1981–
1992 (2016). 61. Bedse, G., Di Domenico, F., Serviddio, G. & Cassano, T. Aberrant insulin signaling in Alzheimer’s
disease: Current knowledge. Front. Neurosci. 9, (2015). 62. Cheng, A. et al. Involvement of PGC-1α in the formation and maintenance of neuronal dendritic
spines. Nat. Commun. 3, (2012). 63. Hatsukano, T., Kurisu, J., Fukumitsu, K., Fujishima, K. & Kengaku, M. Thyroid hormone induces
PGC-1α during dendritic outgrowth in mouse cerebellar purkinje cells. Front. Cell. Neurosci. 11, (2017).
64. He, W., Liu, Y. & Tian, X. Rosuvastatin improves neurite outgrowth of cortical neurons against oxygen-glucose deprivation via notch1-mediated mitochondrial biogenesis and functional improvement. Front. Cell. Neurosci. 12, (2018).
65. Scott, I. & Youle, R. J. Mitochondrial fission and fusion. Essays Biochem. 47, 85–98 (2010). 66. Youle, R. J. & Van Der Bliek, A. M. Mitochondrial fission, fusion, and stress. Science 337, 1062–
1065 (2012). 67. Serasinghe, M. N. & Chipuk, J. E. Mitochondrial fission in human diseases. in Handbook of
Experimental Pharmacology 240, 159–188 (2017). 68. Westermann, B. Mitochondrial fusion and fission in cell life and death. Nature Reviews
Molecular Cell Biology 11, 872–884 (2010). 69. Bui, H. T. & Shaw, J. M. Dynamin assembly strategies and adaptor proteins in mitochondrial
fission. Current Biology 23, (2013). 70. Pagliuso, A., Cossart, P. & Stavru, F. The ever-growing complexity of the mitochondrial fission
machinery. Cellular and Molecular Life Sciences 75, 355–374 (2018). 71. van der Bliek, A. M., Shen, Q. & Kawajiri, S. Mechanisms of mitochondrial fission and fusion.
Cold Spring Harb. Perspect. Biol. 5, (2013). 72. Westrate, L. M., Drocco, J. A., Martin, K. R., Hlavacek, W. S. & MacKeigan, J. P. Mitochondrial
morphological features are associated with fission and fusion events. PLoS One 9, (2014). 73. Hoitzing, H., Johnston, I. G. & Jones, N. S. What is the function of mitochondrial networks? A
theoretical assessment of hypotheses and proposal for future research. BioEssays 37, 687–700 (2015).
74. Dickey, A. S. & Strack, S. PKA/AKAP1 AND PP2A/Bβ2 regulate neuronal morphogenesis via Drp1 phosphorylation and mitochondrial bioenergetics. J. Neurosci. 31, 15716–15726 (2011).

54 | Chapter 2
75. Misgeld, T., Kerschensteiner, M., Bareyre, F. M., Burgess, R. W. & Lichtman, J. W. Imaging axonal transport of mitochondria in vivo. Nat. Methods 4, 559–561 (2007).
76. Lewis, T. L., Kwon, S. K., Lee, A., Shaw, R. & Polleux, F. MFF-dependent mitochondrial fission regulates presynaptic release and axon branching by limiting axonal mitochondria size. Nat. Commun. 9, 276691 (2018).
77. Popov, V., Medvedev, N. I., Davies, H. A. & Stewart, M. G. Mitochondria form a filamentous reticular network in hippocampal dendrites but are present as discrete bodies in axons: A three-dimensional ultrastructural study. J. Comp. Neurol. 492, 50–65 (2005).
78. Ishihara, N. et al. Mitochondrial fission factor Drp1 is essential for embryonic development and synapse formation in mice. Nat. Cell Biol. 11, 958–966 (2009).
79. Fukumitsu, K. et al. Mitochondrial fission protein Drp1 regulates mitochondrial transport and dendritic arborization in cerebellar Purkinje cells. Mol. Cell. Neurosci. 71, 56–65 (2016).
80. Bertholet, A. M. et al. OPA1 loss of function affects in vitro neuronal maturation. Brain 136, 1518–1533 (2013).
81. Davies, V. J. et al. Opa1 deficiency in a mouse model of autosomal dominant optic atrophy impairs mitochondrial morphology, optic nerve structure and visual function. Hum. Mol. Genet. 16, 1307–1318 (2007).
82. Agostinone, J. et al. Insulin signalling promotes dendrite and synapse regeneration and restores circuit function after axonal injury. Brain 141, 1963–1980 (2018).
83. Kim, K. Y. et al. DRP1 inhibition rescues retinal ganglion cells and their axons by preserving mitochondrial integrity in a mouse model of glaucoma. Cell Death Dis. 6, (2015).
84. Kreymerman, A. et al. MTP18 is a Novel Regulator of Mitochondrial Fission in CNS Neuron Development, Axonal Growth, and Injury Responses. Sci. Rep. 9, (2019).
85. Steketee, M. B. et al. Mitochondrial dynamics regulate growth cone motility, guidance, and neurite growth rate in perinatal retinal ganglion cells in vitro. Investig. Ophthalmol. Vis. Sci. 53, 7402–7411 (2012).
86. Martinez-Vicente, M. Neuronal mitophagy in neurodegenerative diseases. Frontiers in Molecular Neuroscience 10, (2017).
87. Palikaras, K., Lionaki, E. & Tavernarakis, N. Mechanisms of mitophagy in cellular homeostasis, physiology and pathology. Nature Cell Biology 20, 1013–1022 (2018).
88. Evans, C. S. & Holzbaur, E. L. F. Quality Control in Neurons: Mitophagy and Other Selective Autophagy Mechanisms. Journal of Molecular Biology 432, 240–260 (2020).
89. Ashrafi, G., Schlehe, J. S., LaVoie, M. J. & Schwarz, T. L. Mitophagy of damaged mitochondria occurs locally in distal neuronal axons and requires PINK1 and Parkin. J. Cell Biol. 206, 655–670 (2014).
90. Cai, Q., Zakaria, H. M., Simone, A. & Sheng, Z. H. Spatial parkin translocation and degradation of damaged mitochondria via mitophagy in live cortical neurons. Curr. Biol. 22, 545–552 (2012).
91. Lu, B. Neuronal mitophagy: Long-distance delivery or eating locally? Current Biology 24, R1006–R1008 (2014).
92. Joselin, A. P. et al. ROS-dependent regulation of parkin and DJ-1 localization during oxidative stress in neurons. Hum. Mol. Genet. 21, 4888–4903 (2012).
93. Zheng, Y., Wu, X., Chen, Z. & Zhang, X. Come and eat: mitochondrial transport guides mitophagy in ischemic neuronal axons. Autophagy 15, 1483–1484 (2019).
94. Chao, H. et al. Cardiolipin-dependent mitophagy guides outcome after traumatic brain injury. J. Neurosci. 39, 1930–1943 (2019).
95. Coughlin, L., Morrison, R. S., Horner, P. J. & Inman, D. M. Mitochondrial morphology differences and mitophagy deficit in murine glaucomatous optic nerve. Investig. Ophthalmol. Vis. Sci. 56, 1437–1446 (2015).
96. Chakrabarti, L., Eng, J., Ivanov, N. & Garden, G. A. Autophagy activation and enhanced mitophagy characterize the Purkinje cells of pcd mice prior to neuronal death. Mol. Brain 2, (2009).
97. Cherra, S. J., Steer, E., Gusdon, A. M., Kiselyov, K. & Chu, C. T. Mutant LRRK2 elicits calcium

Potential mechanisms underlying an antagonistic axon-dendrite interplay | 55
imbalance and depletion of dendritic mitochondria in neurons. Am. J. Pathol. 182, 474–484 (2013).
98. Nixon, R. A. The role of autophagy in neurodegenerative disease. Nature Medicine 19, 983–997 (2013).
99. Guo, F., Liu, X., Cai, H. & Le, W. Autophagy in neurodegenerative diseases: pathogenesis and therapy. Brain Pathology 28, 3–13 (2018).
100. Mizushima, N. & Komatsu, M. Autophagy: Renovation of cells and tissues. Cell 147, 728–741 (2011).
101. Glick, D., Barth, S. & Macleod, K. F. Autophagy: Cellular and molecular mechanisms. Journal of Pathology 221, 3–12 (2010).
102. Parzych, K. R. & Klionsky, D. J. An overview of autophagy: Morphology, mechanism, and regulation. Antioxidants and Redox Signaling 20, 460–473 (2014).
103. Scrivo, A., Bourdenx, M., Pampliega, O. & Cuervo, A. M. Selective autophagy as a potential therapeutic target for neurodegenerative disorders. The Lancet Neurology 17, 802–815 (2018).
104. Sarkar, S., Ravikumar, B., Floto, R. A. & Rubinsztein, D. C. Rapamycin and mTOR-independent autophagy inducers ameliorate toxicity of polyglutamine-expanded huntingtin and related proteinopathies. Cell Death and Differentiation 16, 46–56 (2009).
105. Schmeisser, K. & Parker, J. A. Pleiotropic effects of mTOR and autophagy during development and aging. Front. Cell Dev. Biol. 7, (2019).
106. Kaushik, S. & Cuervo, A. M. The coming of age of chaperone-mediated autophagy. Nature Reviews Molecular Cell Biology 19, 365–381 (2018).
107. Wu, J. & Lipinski, M. M. Autophagy in Neurotrauma: Good, Bad, or Dysregulated. Cells 8, 693 (2019).
108. Lai, Y. et al. Autophagy is increased after traumatic brain injury in mice and is partially inhibited by the antioxidant γ-glutamylcysteinyl ethyl ester. J. Cereb. Blood Flow Metab. 28, 540–550 (2008).
109. Kjell, J. & Olson, L. Rat models of spinal cord injury: From pathology to potential therapies. DMM Disease Models and Mechanisms 9, 1125–1137 (2016).
110. Clark, R. S. B. et al. Autophagy is increased in mice after traumatic brain injury and is detectable in human brain after trauma and critical illness. Autophagy 4, 88–90 (2008).
111. Kang, L. H., Zhang, S., Jiang, S. & Hu, N. Activation of autophagy in the retina after optic nerve crush injury in rats. Int. J. Ophthalmol. 12, 1395–1401 (2019).
112. Rodríguez-Muela, N., Germain, F., Marĩo, G., Fitze, P. S. & Boya, P. Autophagy promotes survival of retinal ganglion cells after optic nerve axotomy in mice. Cell Death Differ. 19, 162–169 (2012).
113. Knöferle, J. et al. Mechanisms of acute axonal degeneration in the optic nerve in vivo. Proc. Natl. Acad. Sci. U. S. A. 107, 6064–6069 (2010).
114. Park, H. Y. L., Kim, J. H. & Park, C. K. Activation of autophagy induces retinal ganglion cell death in a chronic hypertensive glaucoma model. Cell Death Dis. 3, (2012).
115. Anwar, T. et al. ER-Targeted Beclin 1 Supports Autophagosome Biogenesis in the Absence of ULK1 and ULK2 Kinases. Cells 8, 475 (2019).
116. Rodríguez-Muela, N., Germain, F., Marĩo, G., Fitze, P. S. & Boya, P. Autophagy promotes survival of retinal ganglion cells after optic nerve axotomy in mice. Cell Death Differ. 19, 162–169 (2012).
117. Li, X. G., Du, J. H., Lu, Y. & Lin, X. J. Neuroprotective effects of rapamycin on spinal cord injury in rats by increasing autophagy and Akt signaling. Neural Regen. Res. 14, 721–727 (2019).
118. Romeo-Guitart, D., Leiva-Rodriguez, T., Forés, J. & Casas, C. Improved Motor Nerve Regeneration by SIRT1/Hif1a-Mediated Autophagy. Cells 8, 1354 (2019).
119. Huang, H. cheng et al. Autophagy Promotes Peripheral Nerve Regeneration and Motor Recovery Following Sciatic Nerve Crush Injury in Rats. J. Mol. Neurosci. 58, 416–423 (2016).
120. Liu, L., Tian, D., Liu, C., Yu, K. & Bai, J. Metformin enhances functional recovery of peripheral nerve in rats with sciatic nerve crush injury. Med. Sci. Monit. 25, 10067–10076 (2019).
121. Leiva-Rodríguez, T. et al. ATG5 overexpression is neuroprotective and attenuates cytoskeletal and vesicle-Trafficking alterations in axotomized motoneurons article. Cell Death Dis. 9, (2018).

56 | Chapter 2
122. Clarke, J. P. & Mearow, K. Autophagy inhibition in endogenous and nutrient-deprived conditions reduces dorsal root ganglia neuron survival and neurite growth in vitro. J. Neurosci. Res. 94, 653–670 (2016).
123. He, M. et al. Autophagy induction stabilizes microtubules and promotes axon regeneration after spinal cord injury. Proc. Natl. Acad. Sci. U. S. A. 113, 11324–11329 (2016).
124. Ban, B.-K. et al. Autophagy Negatively Regulates Early Axon Growth in Cortical Neurons. Mol. Cell. Biol. 33, 3907–3919 (2013).
125. Tamura, H. omi & Ohkuma, S. Induction of neurite outgrowth of PC12 cells by an inhibitor of vacuolar H+-ATPase, bafilomycin A1. FEBS Lett. 294, 51–55 (1991).
126. Yang, Y., Coleman, M., Zhang, L., Zheng, X. & Yue, Z. Autophagy in axonal and dendritic degeneration. Trends in Neurosciences 36, 418–428 (2013).
127. Wang, Q. J. et al. Induction of autophagy in axonal dystrophy and degeneration. J. Neurosci. 26, 8057–8068 (2006).
128. Knöferle, J. et al. Mechanisms of acute axonal degeneration in the optic nerve in vivo. Proc. Natl. Acad. Sci. U. S. A. 107, 6064–6069 (2010).

CHAPTER 3
IDENTIFICATION OF AN ANTAGONISTIC AXON-DENDRITE
INTERPLAY AFTER ONC IN ADULT ZEBRAFISH
Parts of the data have been published in:
Beckers, A., et al. An antagonistic axon-dendrite interplay enables efficient neuronal repair in the adult
zebrafish central nervous system. Molecular Neurobiology, 56, 3175-3192 (2018).

58 | Chapter 3
CHAPTER 3 ……………………………………………………………………………………………………………………..57
1 INTRODUCTION ……………………………………………………………………………………………………..59
2 OBJECTIVES ……………………………………………………………………………………………………………60
3 MATERIALS AND METHODS ……….………………………………………………………………………….61
3.1 ZEBRAFISH MAINTENANCE ………………………………….………………………………………………… 61
3.2 OPTIC NERVE CRUSH MODEL ……………….……………..……………………………………………………61
3.3 REAL-TIME POLYMERASE CHAIN REACTION …………………………….……………………………...61
3.4 HISTOLOGY, IMMUNOHISTOCHEMISTRY AND HISTOMORPHOMETRIC ANALYSIS …….62
3.5 WESTERN BLOTTING …………………………….…………………………………………………………………63
3.6 DORSAL LIGHT REFLEX …………………………….……………………………………………………………...63
3.7 RETINAL MTOR AND MATRIX METALLOPROTEINASE INHIBITION …………………………..64
3.8 TRACING AND QUANTIFICATION OF TECTAL (RE)INNERVATION ……………………………..64
3.9 DIFFERENTIAL PROTEOMICS STUDY ………………………………………………………………………..65
3.10 STATISTICAL ANALYSIS …………………………………………………………….…………………………...67
4 RESULTS ………………………………………………………………………………………………………………..69
4.1 CHARACTERIZATION OF RETINAL DENDRITIC REMODELING AFTER OPTIC NERVE
INJURY …………….………..…………………………………………………………………….…………………………….69
4.2 CHARACTERIZATION OF RGC AXONAL REGENERATION AFTER OPTIC NERVE
INJURY …………………………….…………………………………………………………………….……………………..73
4.3 CHARACTERIZATION OF RETINAL DENDRITIC REMODELING AND AXONAL
REGENERATION AFTER OPTIC NERVE INJURY IN MTOR-INHIBITED FISH ………………………80
4.4 CHARACTERIZATION OF RETINAL DENDRITIC REMODELING AND AXONAL
REGENERATION AFTER OPTIC NERVE INJURY IN MMP-INHIBITED FISH ………………………..84
4.5 A DIFFERENTIAL PROTEOMICS STUDY TO IDENTIFY ENRICHED KEGG PATHWAYS IN THE RETINA AND OPTIC NERVE AFTER ONC ……………………………………………………………..87
5 DISCUSSION ……………………………………………………………………………………………………………90
6 CONCLUSION ………………………………………………………………………………………………………….99
7 REFERENCES …….………………………………………………………………………………………………….100

Identification of an antagonistic axon-dendrite interplay | 59
1 INTRODUCTION
Defects in dendritic arborization and connectivity represent one of the first stages of
mammalian central nervous system (CNS) neurodegeneration. Also glaucomatous optic
neuropathies are characterized by early retinal synapse loss, retinal ganglion cell (RGC)
dendritic shrinkage and a reduced dendritic complexity, which likely precede irreversible
structural damage to the optic nerve and RGC death1,2. Recent strategies aiming to preserve
RGC functioning therefore strive to maintain their dendritic and synaptic stability3.
Unfortunately, as the majority of patients diagnosed with a glaucomatous optic neuropathy
already suffer from severe optic nerve and RGC damage, functional neuronal network repair
not only requires neuroprotection but also axonal/dendritic regeneration of harmed RGCs.
Over the years, multifactorial strategies able to boost the regenerative potential of the
mammalian CNS have been identified by investigating both spontaneous (e.g. zebrafish) and
experimentally induced (e.g. rodents) optic nerve regeneration within the visual system, still
one of the most powerful model systems available to study axonal regrowth4,5. Dendrites,
however, despite being an equal essential component of the neuronal circuitry, have been
overlooked for decades in regenerative research. In addition, developmental studies indicate
a strict temporal separation of axogenesis and dendritogenesis6 and thus suggest a potential
interdependency of axonal and dendritic outgrowth, but a possible axon-dendrite
interaction during regeneration remains unexplored.
The adult teleost Danio rerio is a well-established and powerful model system for the
molecular and mechanistic study of neuronal regeneration, since it possesses phylogenetically
conserved and robust neuroregenerative capacities in both brain and retina7–13. Moreover, it
has also proven to be a perfect model to investigate the underlying mechanisms of axonal
regeneration and will therefore be used in this study to examine a possible interplay between
dendrite remodeling and axon regrowth in regeneration-competent adult neurons (RGCs)
subjected to axonal injury.

60 | Chapter 3
2 OBJECTIVES
Intrigued by the preliminary results obtained by dr. Kim Lemmens (see chapter 2), which
formed the basis of the antagonistic axon-dendrite interplay hypothesis, we further aimed to
map the inherent dendritic responses of vertebrate neurons undergoing successful axonal
regeneration. For this, we again used adult zebrafish and subjected them to optic nerve crush
(ONC), whereafter RGC dendritic remodeling and axonal regrowth were assessed side-by-side
at various time points after injury, this in order to investigate whether RGC axogenesis
precedes dendritogenesis during CNS repair, —as during development—. To further support
a potential antagonistic interplay, we interfered with retinal mechanistic target of rapamycin
(mTOR) functioning upon ONC in adult zebrafish. mTOR, a serine/threonine kinase of the
phosphoinositide 3-kinase (PI3K)-related kinase family, has been suggested as a key player in
zebrafish and mammalian RGC axonal regeneration14–17. Importantly, it is also a known
regulator of synaptogenesis and of neuronal dendrite development, stabilization and dendritic
remodeling18–21. Therefore, we hypothesized that inhibiting this pathway could have an effect
on dendrites in adult zebrafish subjected to ONC. Lastly, a proteomics study was performed
using both retinal and optic nerve samples of naive versus crushed zebrafish at a time point
characterized by a maximum RGC dendrite retraction, to identify proteins and pathways
underlying dendrite shrinkage, axonal regeneration or the observed antagonistic axon-
dendrite interplay.

Identification of an antagonistic axon-dendrite interplay | 61
3 MATERIALS AND METHODS
3.1 ZEBRAFISH MAINTENANCE
Zebrafish were maintained under standard laboratory conditions at 28°C on a 14h
light/10h dark cycle. Fish were fed twice daily with a combination of dry food and brine
shrimp. All experiments were performed on equally sized, 5-month-old adult zebrafish of
either sex (AB wild-type) and were approved by the KU Leuven Animal Ethics Committee and
executed in strict accordance with the European Communities Council Directive of 20 October
2010 (2010/63/EU).
3.2 OPTIC NERVE CRUSH MODEL
To perform an ONC, zebrafish were anesthetized in a buffered 0.03% solution of tricaine
(MS-222, Sigma Aldrich) and put under a dissecting microscope (Leica) on moist tissue paper,
left side facing upward. After removal of the surrounding connective tissue, the eyeball was
lifted out of its orbit, thereby exposing the optic nerve and ophthalmic artery. Sterile forceps
were carefully placed around the left optic nerve, which was crushed for 10 s at 0.5 mm
distance of the optic nerve head, thereby avoiding damage to the ophthalmic artery. A
successful ONC was indicated by the appearance of a clear gap inside the translucent nerve
sheath. Fish were returned to system water in separate tanks to recover.
3.3 REAL-TIME POLYMERASE CHAIN REACTION
Quantitative real-time polymerase chain reaction (RT-qPCR) was used to measure the
transcript levels of gap-43 before and at early time points after ONC injury (6 hours post injury
(hpi), 1 day post injury (dpi), 4 dpi). Thereto, fish were euthanized using 0.1% tricaine, after
which retinas were quickly dissected on ice and pooled per three. The tissues were digested
using Tri Reagent (Sigma-Aldrich) before total RNA isolation using the NucleoSpin RNA
isolation kit (Machery-Nagel). Oligo dT primers and Superscript III reverse transcriptase
(Invitrogen, Belgium) were used to execute reverse transcription reactions to synthesize
cDNA, followed by RT-qPCR using SYBR Green Mastermix (Bio-Rad), 250 nM of both primers
and a CFX96 Real-Time detection system (Bio-Rad). Both the gap-43 FW (5’-
CAGCCGACGTGCCTGAA-3’) and gap-43 REV (5’-TCCTCAGCAGCGTCTGGTTT-3’) primers were
already used to detect gap-43 mRNA levels in zebrafish22. Samples were run in duplicate with
56°C as annealing temperature. Gene expression was finally analyzed using GeNorm (qBase

62 | Chapter 3
software) and normalized against two housekeeping genes (hypoxanthine phosphoribosyl-
transferase 1 (hprt1), succinate dehydrogenase complex subunit A flavoprotein (sdha)).
3.4 HISTOLOGY, IMMUNOFLUORESCENCE AND HISTOMORPHOMETRIC
ANALYSIS
For all immunofluorescent stainings, fish were first euthanized by submersion in
buffered 0.1% tricaine. After transcardial perfusion with phosphate buffered saline (PBS,
0.01M, pH 7.4) and 4% paraformaldehyde (PFA) in PBS, eyes/brains of adult fish were
dissected at various stages post-injury (at baseline (naive) and at 6 hpi, 1, 4, 7, 10, 14 and 18
dpi). Hereafter, the tissues were fixed overnight in 4% PFA in PBS and kept in 30% sucrose in
PBS until further processing for cryosectioning (Cryostar NX70 cryostat, Thermo Fisher
Scientific, MA, USA). Ten µm thick sagittal sections of the retina and ten µm coronal brain
sections, taken at the level of the optic tecti, were made. Immunostainings for post-synaptic
density protein 95 (Psd-95), Znp-1, phosphorylated S6 (pS6), acetylated-tubulin (AcT), choline
acetyltransferase (Chat) and microtubule-associated protein 2 (Map2), were performed using
the following primary antibodies: mouse anti-Psd-95 (1:500, Abcam, ab2723), mouse anti-
Znp-1 (1:1000, Developmental Studies Hybridoma Bank), rabbit anti-pS6 (1:200, Cell Signaling
Technology), mouse anti-acetylated-tubulin (1:1000, Sigma), goat anti-choline acetyl
transferase (1:100, Millipore), mouse anti-Map2 (1:2000, Sigma, M1406) and were detected
with Alexa-conjugated secondary antibodies or horseradish peroxidase (HRP)-labeled
antibodies (Dako), using the Tyramide Signal Amplification (TSA) Fluorescein
isothiocyanate(FITC)/Cyanine 3 (Cy3) System (PerkinElmer). Retinal/brain sections from at
least three fish per post-injury stage were stained. All immunolabelings were visualized with
an Olympus FV1000 confocal microscope at 60x magnification. Retinal morphology was
studied at baseline, 6 hpi, 1, 4, 7, 10 and 14 dpi by hematoxylin and eosin (H&E) staining on
retinal sections. Histological pictures were acquired with a microscope Zeiss imager Z1 at 20x
magnification. For morphometric analysis of the ratio inner plexiform layer (IPL)/total retinal
thickness, the IPL and total retinal thickness were measured in the central retina on both sides
adjacent to the optic nerve on six retinal sections (80 µm apart) per fish, using Image J
software. For characterization of mTOR activation, a triple labeling was performed for pS6,
AcT and Chat, and the percentage of cells positive for pS6 was quantified in relation to the
AcT-positive cells in the retinal ganglion cell layer (RGCL) on at least four sections of three

Identification of an antagonistic axon-dendrite interplay | 63
different fish. Cells that were immunopositive for Chat in the RGCL were excluded as they
represent displaced amacrine cells.
3.5 WESTERN BLOTTING
After fish were sacrificed in buffered 0.1% tricaine, retinas were dissected at baseline
(naive), 6 hpi, 1, 4, 7, 10, 14 or 18 dpi after ONC and homogenized in lysis buffer (10 mM Tris-
HCl pH 8, 1% Triton X-100, 150 mM NaCl, 0.1% SDS, 0.5% sodium deoxycholate, 0.2% sodium
azide), supplemented with protease inhibitors (Roche). Homogenates were loaded at 10 µg
onto 4-12% Bis-Tris gels (Biorad) and transferred onto a nitrocellulose membrane (Biorad).
Overnight incubation with mouse anti-Synaptic vesicle protein 2 (Sv2) (1:1000, Developmental
Studies Hybridoma Bank) or mouse anti-Map2 (1:1000, Sigma Aldrich, M9942) primary
antibodies, was followed by 45’ incubation with goat anti-mouse HRP-conjugated antibody
(Dako). Protein bands were visualized using a luminol-based enhanced chemiluminescent kit
(Thermo Scientific) by means of an imaging system (Biorad, ChemiDoc MP imaging system),
and semi-quantitatively evaluated by densitometry (Image Lab 4.1, Biorad). To reduce the risk
for bias during analysis, protein bands were automatically detected and evaluated by the
software. Swift membrane total protein staining (G-Biosciences) of the nitrocellulose
membrane served as loading control and was used for normalization of protein values. Data
were plotted as a relative percentage to and statistically compared to the baseline (naive)
condition, which was set as 100%.
3.6 DORSAL LIGHT REFLEX
The dorsal light reflex (DLR) was used to assess functional recovery of primary vision
after an optic nerve lesion in adult zebrafish. A total of nine adult zebrafish was subjected to
a DLR test at 10, 12, 14 and 18 dpi. In brief, fish were put in a cylindrical container, filled with
system water, of 500 mm long and 120 mm in diameter. First, a light source was slowly rotated
from the dorsal (0°) to the right lateral side of the fish (90°), ultimately giving sole input to the
right eye. Since the right optic nerve was uninjured, fish were expected to show a normal
inclination of their dorsoventral axis in this set-up, thus serving as an internal control. Next,
the left crushed eye of the fish was subjected to the same protocol. The response of the adult
fish was divided into three categories, based on the position of the light-exposed eye relative
to the non-light-exposed eye at the end of the DLR, when the light source was positioned

64 | Chapter 3
completely lateral (90°): A ‘full DLR’ corresponds to a fish where the body axis completely
followed the movement of the light bundle, resulting in a position of the light-exposed eye
below the non-light-exposed eye, when drawing a fictive horizontal line through both eyes.
During a ‘partial DLR’ the fish did show body axis tilting but maximally tilted in such a way that
the targeted eye was not completely located beneath the non-targeted eye. Fish with ‘no DLR’
did not respond to the moving light influx at all and thus did not tilt their body axis, which
indicated a pronounced default in basic visual perception.
3.7 RETINAL MTOR AND MATRIX METALLOPROTEINASE INHIBITION
The effect of retinal mTOR inhibition on zebrafish retinotectal regeneration was studied
using intravitreal injections with 300 nl of 20 µM rapamycin (LC Laboratories) at 0 and 1 dpi
using a micro-injector (UMP3, World Precision Instruments). To study if delayed rapamycin
treatment would still interfere with axonal regeneration, rapamycin and the vehicle were also
injected at 4 and 5 dpi in another set of fish. Alternatively, to obtain retinal broad-spectrum
MMP inhibition, 300 nl of 5 mM GM6001 (Santa Cruz, sc-203979) was IVT injected at 0 and 2
dpi. Both naive and vehicle- (rapamycin: 5% DMSO in PBS; GM6001: 10% DMSO in PBS)
injected fish were implemented in the experimental set-ups as controls. One note, the MMP
inhibition experiments were conducted by dr. Kim Lemmens.
3.8 TRACING AND QUANTIFICATION OF TECTAL (RE)INNERVATION
Regenerating axons from the retina towards the optic tectum were visualized by means
of biocytin tracing. For this, fish were anesthetized (0.03% tricaine), after which the optic
nerve was transected between the eye and the crush site and a piece of gelfoam soaked in
biocytin (Sigma Aldrich) was placed on the nerve stump. The eye was placed back and fish
were revived. After 3h, when the tracer was anterogradely transported to the optic tectum,
fish were euthanized (0.1% tricaine) and transcardially perfused with 4% PFA in PBS. Brains
were then dissected and overnight fixated (4% PFA). After rinsing, the brains were embedded
and cut in 50 µm coronal sections using a Micron H650 vibratome (Thermo Fischer Scientific,
MA, USA). Biocytin was visualized by means of a Vectastain ABC kit (Vector laboratories), using
diaminobenzidine as chromogen. Sections were dried on gelatin-coated slides and
counterstained with neutral red solution to allow for brain nuclei identification. Brain sections
through the central optic tecti were identified based on the presence of specific nuclei and

Identification of an antagonistic axon-dendrite interplay | 65
histological photographs were acquired with a microscope Zeiss imager Z1 at 10x
magnification. Tectal (re)innervation was quantified via an in house developed Image J script,
in which the biocytin-labeled area was measured using manual thresholding. Next, axonal
density was defined as the ratio of the biocytin+ area to the area of reinnervation, being the
stratum opticum (SO) and stratum fibrosum et griseum superficiale (SFGS) of the optic tectum.
Per fish, tectal reinnervation was analyzed on at least five sections containing the central optic
tectum, using 4-9 fish per condition. Of note, in all experiments, naive fish were included, in
which tectal innervation was analyzed and set as a 100% reference value. Reinnervation values
obtained from the injury conditions were expressed in %, relative to this reference control.
In addition, tectal reinnervation was investigated in Tg(fGap-43:GFP) zebrafish, which
express green fluorescent protein (GFP) under the control of a gap-43 promotor region.
Images of at least four brain sections of three different fish per time point were obtained using
an Olympus FV1000 confocal microscope at 20x magnification and analysis was performed
using the methodology described above. As Gap-43 is not expressed in non-injured fish, the
Gap-43-immunopositive tectal area of fish at 14 dpi was used as a reference and set as 100%,
as this was the time point of complete innervation and maximum value.
3.9 DIFFERENTIAL PROTEOMICS STUDY
Sample preparation
To unravel the underlying molecules/mechanisms underlying axonal regeneration,
dendritic retraction or the antagonistic axon-dendrite interplay, a differential proteomics
study was executed to find differentially expressed (DE) proteins between naive and crushed
zebrafish, three days after injury, in collaboration with Dr. Geert Baggerman (Center for
Proteomics, UAntwerp). Per condition three biological replicates were used, and eight tissues
were collected per sample. For this, fish were first euthanized (0.1% tricaine) after which the
fast-dissected retinas or optic nerves were collected in a LoBind Eppendorf tube and lysed
using an extraction buffer containing 65 mM Tris HCL, 2% SDS w/v and protease inhibitors.
Next, the samples were mechanically homogenized using drill-driven pestles and sonication
(five times 10 s), followed by a 5 min heating step at 70°C and centrifugation for 15 min at
13,000 x g at 4°C. The supernatant was then collected, of which the protein concentration was
determined using the Nanodrop 2000 (Thermo Scientific) and stored at -80°C.

66 | Chapter 3
Digestion and tandem mass tag labeling
Before tandem mass tag (TMT) labeling, 10 µg of proteins were reduced using 1.25 µL
of 500 mM tris(2-carboxyethyl) phosphine (TCEP) in 100 μl of 100 mM
triethylammoniumbicarbonate (TEAB), all supplied in the TMT labeling kit (Thermo Scientific) and
heated for 1h at 55°C. Alkylation of the samples was executed by adding 0.5 µL of a 375 mM
iodoacetamide, for 30 min at room temperature in a dark room. Overnight trypsin digestion at 37°C
was the next step in which the enzyme was added in an enzyme:protein ration of 1:20, followed by
desalting of the trypsin digests using Pierce C18 spin columns (Thermo Scientific). The eluted
peptides were then vacuum dried and resolved in 100mM TEAB to a final concentration of 1
μg/μl.
To prepare the TMT labels, they were first dissolved in 41 μl acetonitrile according to
the manufacturer’s protocol. 5 µg of every sample was labeled with 4 µL of an individual tag
and incubated for 1h at room temperature. The three control samples were labeled with TMT
126-128, while the samples obtained after ONC were labeled with TMT 129-131, after which
the reaction is stopped by adding 5 µL of 5% hydroxylamine. Samples were pooled into one,
which was finally cleaned/desalted using C18 spin columns and vacuum dried.
Reversed phase liquid chromatography and mass spectrometry
Reverse phase chromatography was used to separate the peptide mixtures on a nano-
LC1000 system using a Pepmap100 C18, coupled to an acclaim C18 column (Thermo Scientific,
San Jose, CA). Before loading, the samples were dissolved in mobile phase A, containing 2%
acetonitrile and 0.1% formic acid, and spiked with 20 fmol Glu-1-fibrinopeptide B (Glu-fib,
Protea Biosciences, Morgantown, WV). Thereafter, a linear gradient of mobile phase B (0.1%
formic acid in 98% acetonitrile) to ~40%, followed by a steep increase to ~95%, was used at a
flow rate of 300 nl/min. This liquid chromatography step was followed by mass spectrometry
with the Linear Trap Quadropole (LTQ ) Orbitrap Velos (Thermo Scientific, San Jose, CA) set up
in a mass spectrometry (MS)/MS mode where a full scan spectrum was followed by five dual
collision induced dissociation (CID) CID/ high energy collision activated dissociation (HCD)
tandem mass spectra. Peptide ions were selected for further interrogation by tandem MS as the
five most intense peaks of a full scan mass spectrum. The normalized collision energy used was
35% in CID and 55% in HCD, and a dynamic exclusion list of 30 s for data dependent acquisition was
applied.

Identification of an antagonistic axon-dendrite interplay | 67
Data analysis and visualization
The obtained spectra were analyzed using database searching with the Proteome discoverer
(2.1) software (Thermo Scientific, San Jose, CA) against the zebrafish reference database using both
the SEQUEST and Mascot algorithms. The following settings were used: trypsin was indicated as
the digesting enzyme, two missed cleavages were allowed, and only medium/high confident
peptides (false discovery rate < 5%) were included in the output. Using the web-based tool QCQuan
the peptides were matched to proteins, and a list was created with the detected proteins, together
with their log2 fold changes and p-value for the t test to calculate differential expression between
the two conditions23. Proteins were indicated as DE in case of p-value < 0.05 and a fold change
larger than 5%. Significantly changed proteins were analyzed to find statistically enriched
pathways using STRING v11.0 (Search Tool for Recurring Instances of Neighboring Genes;
https://string-db.org)24 with the Danio rerio genome as background genome. The up- and
downregulated proteins, compared to the naive condition, were analyzed separately using
STRING with the minimum required interaction score set to 0.500 (medium-high). Only KEGG
pathways with a false discovery rate of < 0.05 and at least three DE proteins are classified as
enriched. As the results for enriched GO terms were similar as for enriched Kyoto Encyclopedia
of Genes and Genomes (KEGG) pathways, we will only describe the latter. For easier
interpretation, only the DE proteins which were found in enriched KEGG pathways will be
shown in the figures, because the other DE proteins form disconnected nodes or belong to an
unchanged pathway. For the upregulated proteins found in the optic nerve after ONC, the ten
KEGG pathways with the lowest false discovery rate will be shown, while for the other analyses
all enriched pathways will be visualized, as these are less than ten.
3.10 STATISTICAL ANALYSIS
All data are represented as mean ± SEM, except the RT-qPCR data for gap-43 in which
mean fold change values, relative to naive ± SEM are shown. The value of n represents the
number of animals used per condition (biological replicates). All statistical tests were
performed using Graphpad Prism 7.03. In all cases, raw data were tested for normal
distribution using the Kolmogorov-Smirnov normality test and variance between groups was
checked via the Brown-Forsythe’s test for equality of variances. To evaluate a difference in
optic tectum reinnervation at 0 and 10 dpi, a two-tailed Student’s t-test was performed. To
compare three or more independent groups, a one-way ANalysis Of Variance (ANOVA) was

68 | Chapter 3
performed if the data showed a normal distribution and variances between groups were
homogeneous. A Dunnet or Tukey post-hoc test was performed. When the ANOVA
assumptions were violated, a Kruskal-Wallis test was used. DLR data were analyzed using Chi-
square statistics. P < 0.05 was considered statistically significant.

Identification of an antagonistic axon-dendrite interplay | 69
4 RESULTS
4.1 CHARACTERIZATION OF RETINAL DENDRITIC REMODELING AFTER OPTIC
NERVE INJURY
In a first attempt to assess retinal dendritic remodeling after ONC, the ratio IPL/total
retinal thickness was analyzed on H&E stained retinal sections of eyes isolated at baseline
(naive) and at 1, 4, 7, 10, 14 and 18 dpi. Representative images of the central retina are shown
at preeminent time points in Fig. 3.1. At both 4 and 7 dpi, a significant reduction in relative IPL
thickness of approximately 20% was observed in the central retina in comparison to naive fish
(Fig. 3.1). Notably, IPL thickness had again increased by 10 dpi relative to 4 and 7 dpi, and re-
approached baseline values from 14 dpi onwards, altogether suggestive of the occurrence of
dendritic remodeling after optic nerve injury.
Fig. 3.1 Inner plexiform layer thickness measurements after ONC in zebrafish.
Representative images of H&E stained retinal sections and quantitative analysis of IPL/total retinal thickness
show a significant reduction in IPL thickness in retinas of fish at 4 and 7 dpi as opposed to naive retinas. Baseline
IPL/total retinal thickness values were regained at two weeks after ONC. Data represent mean ± SEM. N = 3-6,
One-way ANOVA with Dunnet post-hoc test, * p < 0.05. Scale bar = 20 µm.
INL, inner nuclear layer; IPL, inner plexiform layer; NFL, nerve fiber layer; ONC, optic nerve crush; ONL, outer
nuclear layer; OPL, outer plexiform layer; PRL, photoreceptor layer; RGCL, retinal ganglion cell layer.
As the maintenance of synaptic input is important to assure dendritic stability25, the
spatiotemporal expression pattern of Sv2, a validated marker of synaptic vesicles in the IPL
and outer plexiform layer (OPL) of fish retina26,27, was determined using WB on retinal lysates
harvested at baseline (naive), 6 hpi, and 1, 4, 7, 10, 14 and 18 dpi. A ~25% decrease in Sv2
expression was already perceptible at 6 hpi and became significant by 4 dpi as compared to
naive fish (Fig. 3.2A). Recovery of Sv2 expression was induced from 10 dpi onwards and again
reached control levels by 14 dpi.

70 | Chapter 3
To strengthen this observation more specifically for RGC retinal synapses, an
immunostaining for Psd-95, an excitatory post-synaptic density marker known to label
synapses on RGC dendrites in both fish and mammals, was performed on retinal sections of
naive and crushed fish at various days post-injury. Representative images in Fig. 3.2B clearly
show abundant expression of Psd-95 in the IPL of naive fish and a subsequent reduction in
Psd-95 signal shortly after ONC, at 1 dpi. The Psd-95 signal in the IPL diminished even further
at 4 (and 7) dpi with respect to naive retinas (Fig. 3.2B). In accordance with the Sv2 WB data,
these findings indicate a rapid reduction in RGC post-synaptic connectivity after ONC. Of note,
no reduction in Psd-95 signal in the IPL was observed at 6 hpi (data not shown), in contrast to
the Sv2 WB data, likely because IHC is less quantitative and not as sensitive as WB to detect
minor changes in protein levels. Notably, Psd-95 staining could again be observed in the IPL
from 10 dpi onwards, which likely represents the initiation of synapse formation between RGC
dendrites and bipolar cell neurites as the PSD-95 family is thought to regulate synapse
assembly and function28. This generation of novel synapses was seemingly completed
between 14 and 18 days post-ONC as the Psd-95 staining pattern then again resembled
baseline conditions. Confirmatory, also for Znp-1, a known marker of bipolar/amacrine cell
pre-synaptic nerve terminals in the IPL of the vertebrate retina, an identical temporal decrease
in signal could be observed (Fig. 3.2B)29,30. Taken together, these data are indicative of early
synaptic degeneration and subsequent synaptogenesis in the inner retina of adult zebrafish,
subjected to optic nerve injury.
To obtain direct insights into retinal dendritic changes after ONC, the spatiotemporal
expression pattern of Map2 was first characterized via WB on retinal lysates harvested at
baseline (naive) and at 6 hpi, 1, 4, 7, 10, 14 and 18 dpi. Map2 is a validated marker for dendrites
and is known to be essential for dendritic stabilization and outgrowth in vertebrates31–33. A
decrease in Map2 levels was already observed six hours after damage and became significant
at 1 dpi. Map2 levels eventually augmented again around 10 dpi and re-attained control levels
by two weeks after ONC (Fig. 3.2A). An immunostaining for Map2 on retinal sections
confirmed these results. Indeed, the clear Map2 dendritic labeling that was visible in naive
conditions, already decreased at 1 dpi, but not at 6 hpi, and reached minimal expression at 4
dpi. Hereafter the Map2-immunopositive area was increased again from 10 dpi onwards and
reached baseline expression four days later (Fig. 3.2B). As Map2 prevents microtubule

Identification of an antagonistic axon-dendrite interplay | 71
depolymerization and thus preserves dendritic morphology, the reduction of retinal Map2
expression, suggests a profound degeneration/collapse of dendrites in the retina immediately
after ONC31,34,35. Likewise, the subsequent gradual restoration of Map2 protein towards
baseline values by 14 dpi, marks the graduated return of stable and mature RGC dendrites
(Fig. 3.2B).

72 | Chapter 3
Fig. 3.2 Characterization of synaptic and dendritic remodeling in the retina after ONC using WB for Sv2 and
Map2, and immunostainings for Map2, Psd-95 and Znp-1.
A Representative picture and bar graph showing WB analysis data for Sv2 and Map2 expression in retinal extracts
after ONC, each plotted as a relative percentage to the their expression in naive fish retinas. Both Sv2 and Map2
levels were decreased from 6 hpi onwards and started to increase again around 10 dpi to re-attain control values
at 14 dpi, thus pointing to consecutive synaptic/dendritic degeneration and regrowth. Data represent mean ±
SEM. Sv2: N = 3-6, One-way ANOVA with Dunnet post-hoc test, * p < 0.05. Map2: N = 6-18, One-way ANOVA with
Kruskal-Wallis post-hoc test, * p < 0.05. B Immunostainings for Psd-95 and Znp-1 show a decline in fluorescent
signal in the IPL by 1 dpi, indicating post-synaptic and amacrine/bipolar cell pre-synaptic terminal degeneration,
which goes hand in hand with dendritic shrinkage as also Map2-immunopositivity was decreased from 1 dpi on.
From 10 dpi onwards, Psd-95, Znp-1 and Map2 signals started to re-appear, pointing towards the restoration of
dendritic trees and the generation of novel synaptic contacts between RGCs and amacrine/bipolar cells. Between
14 and 18 dpi, baseline levels were regained, indicating near completion of dendritic regrowth and retinal
synaptogenesis. DAPI (blue) was used as nuclear counterstain. Scale bar: 20 µm.
Dpi, days post-injury; hpi, hours post-injury; INL, inner nuclear layer; IPL, inner plexiform layer; Map2,
microtubule-associated protein 2; NFL, nerve fiber layer; Psd, post-synaptic density; RGCL, retinal ganglion cell
layer; Sv2, synaptic vesicle protein 2; WB, western blotting.

Identification of an antagonistic axon-dendrite interplay | 73
4.2 CHARACTERIZATION OF RGC AXONAL REGENERATION AFTER OPTIC
NERVE INJURY
To diversify dendritic alterations in relation to the different phases of axonal
regeneration and in order to map the temporal occurrence of the axonal growth response in
detail, we next determined the injury response, axonal regrowth, optic tectum reinnervation
and target contact phases after optic nerve injury. For this, retinal mRNA levels of gap-43 – a
validated marker for axonal growth – were determined at baseline, 6 hpi, 1 and 4 dpi. Gap-43
showed no significant induction at the earliest time points after ONC (6 hpi and 1 dpi), but was
highly up-regulated by 4 dpi as compared to baseline (Fig. 3.3A). This highly corresponds with
the previously determined retinal Gap-43 expression pattern at the protein level in our lab, in
which also no detectable Gap-43 protein upregulation until 1 dpi was observed, and a peak in
expression at 4 dpi16. In accordance with previous publications, these data allow us to define
the injury response phase from 0 to 1 dpi, in which there is no significant induction of gap-43
expression. The small, though non-significant rise in gap-43 mRNA expression seen at 1 dpi,
likely indicates the start of the axonal regrowth phase, in which a small number of pioneering
neurons already starts to regrow their axons. As previously described, axonal regrowth then
starts around 1 dpi and is maximally ongoing at 4 dpi, with retinal mRNA and protein
expression of Gap-43 peaking at that moment (Fig. 3.3A)16,36.
Our lab previously showed – by means of analysis of optic tectum reinnervation via
anterograde biocytin tracing - that the first regrowing RGC axons re-entered the optic tectum
at 5 dpi and that already ~70% of the optic tectum was reinnervated at 7 dpi, as compared to
the RGC innervated tectal area in naive fish, demonstrating that optic tectum innervation by
RGC axons was fully ongoing at that time16,37. Using the same analysis of tectal reinnervation
at later time points post-injury, we now revealed that optic tectum reinnervation was fully
completed by 10 dpi (Fig. 3.3B). These data were confirmed using Tg(fGap-43:GFP) zebrafish
(Fig. 3.3C)38. Indeed, Gap-43 was visible in the optic tectum from 4-5 days after ONC,
visualizing the pioneering axons. Two days later, already 70% of the tectal area was Gap-43+,
as compared to the labeled area 14 days after ONC, a time-point at which previous biocytin
tracing experiments indicated that optic tectum reinnervation was already fully completed.
Similar as shown with biocytin tracing, optic tectum reinnervation was already finalized at 10
dpi.

74 | Chapter 3
Fig. 3.3 Mapping of RGC axonal regrowth after ONC in adult zebrafish.
A RT-qPCR for retinal gap-43 revealed a rise in gene expression from 1 dpi onwards, which became statistically
significant at 4 dpi, compared to baseline levels. Data represent mean fold change values relative to naive ± SEM.
N = 4-5, one-way ANOVA with Dunnet post-hoc test, **** p < 0.0001. B Microscopic images of biocytin-labeled
brain sections of naive and injured fish at 10 dpi visualizing innervation in the contralateral optic tectum by RGC
axons. Arrows indicate RGC terminals entering the optic tectum. Quantification of the area covered by RGC axons
in the optic tectum of 10 dpi fish, relative to naive fish, confirmed that tectal reinnervation was completed at 10
dpi. Scale bar = 200 µm. Data represent mean ± SEM. N = 4, two-tailed t-test. C Analysis of Gap-43+ area in
Tg(fGap-43:GFP) fish after ONC indicated that the first axons arrived at 5 dpi. The optic tectum was reinnervated
for 70% and for 100% at 7 and 10/14 days, respectively. Data represent mean ± SEM. N = 3, one-way ANOVA
with Dunnet post-hoc test, *** p < 0.001, **** p < 0.0001.
Dpi, days post-injury; Gap-43, growth-associated protein 43; hpi, hours post-injury; RGC, retinal ganglion cell;
ONC, optic nerve crush; OT, optic tectum.

Identification of an antagonistic axon-dendrite interplay | 75
Furthermore, immunostainings for Znp-1 (anti-synaptotagmin 2) were performed on
optic tectum sections of naive fish and fish at different time points post-ONC to assess the
presence of RGC pre-synaptic termini in the tectum during the course of retinotectal
regeneration, and thus to define the start of the target contact reinnervation phase. As
depicted in Fig. 3.4 naive fish show abundant staining for RGC terminals in the SO and SFGS,
the primary RGC synaptic contact layers, and to a lesser extent in the stratum griseum centrale
(SGC) and a projection zone (S/S) between the stratum album centrale (SAC) and stratum
periventriculare (SPV), both innervated by a small subset of RGCs39. The Znp-1 signal
decreased after injury to reach very low expression levels at 7 dpi, which then gradually re-
emerged at 10 dpi, marking an initiation of RGC target contact restoration near the time point
at which tectal reinnervation is completed. At two weeks post-injury, Znp-1 staining intensity
returned to baseline levels in all layers, thus showing extensive repair of RGC synaptic contacts
with their neuronal targets in the optic tectum between 10 and 14 dpi (Fig. 3.4).

76 | Chapter 3
Fig. 3.4 Mapping of RGC synaptogenesis in the optic tectum after ONC in adult zebrafish.
Representative immunostainings for Znp-1 on transverse optic tectum sections at various stages post-injury show
Znp-1 downregulation in the SO and SFGS at 7 and 10 dpi relative to naive fish. Znp-1 signal re-approached
baseline levels in the SO and SFGS of the optic tectum at 14 dpi, indicative of synaptic repair between RGC
terminals and their primary neuronal targets in the brain. DAPI (blue) was used as nuclear counterstain, white
arrows indicate newly formed synapses in the SO. Scale bar = 20 µm.
Dpi, days post-injury; ONC, optic nerve crush; RGC, retinal ganglion cell; SGC, stratum griseum centrale; SFGS,
stratum fibrosum et griseum superficiale; SO, stratum opticum; S/S, zone between album centrale (SAC) and
stratum periventriculare (SPV).
Next, to analyze functional recovery of primary vision, DLR testing was applied in adult
zebrafish after optic nerve lesion40,41. Fish were subjected to a DLR test at four consecutive
time points after ONC, using the right uncrushed eye as a positive control. At 10 dpi, most
(67%) fish were unable to perform a DLR and only 33% of the fish showed a partial DLR (partial
tilting of the body axis). Yet, four days later, all fish could accomplish a partial (44%) or even
complete (56%) DLR response (Fig. 3.5). In accordance with the Znp-1 data, these results
suggest a massive RGC target reconnection in the optic tectum at two weeks post-injury. By
18 dpi, DLR responses of the left crushed and right control eye were similar in all fish,
indicating a fully restored DLR and thus complete recovery of primary visual function (Fig.
3.5)42.

Identification of an antagonistic axon-dendrite interplay | 77
Fig. 3.5 Mapping of functional restoration of vision after ONC in adult zebrafish using the DLR test.
Complete, mild and absence of body axis tilting in response to a dorsal to ventral moving light influx, was assessed
for both eyes (control right eye: RE, crushed left eye: LE) and denoted as a full, partial and no DLR, respectively.
The degree of body axis tilting remained significantly different between the control right and crushed left eye
until 14 dpi. At 18 dpi, the DLR of the left crushed eye was restored as compared to that of the right control eye.
Graph represents semi-quantitative scoring of DLRs. N = 9, Chi-square test, *p < 0.05; ***p < 0.001.
DLR, dorsal light response; dpi, days post-injury; ONC, optic nerve crush.
A distinct and time-restricted dendritic and axonal growth response during RGC
regeneration
To obtain detailed insight into the time course and extent of dendritic remodeling versus
axonal regrowth after ONC, the rate of the growth responses of both processes were
estimated based on gathered experimental data (Fig. 3.1-3.5) and were plotted in relation to
time (Fig. 3.6A). The drawings below visualize a neuron undergoing dendritic shrinkage and
axonal regeneration after ONC in relation to time (Fig. 3.6B). The orange line in Fig. 3.6A
depicts the dendritic growth response curve and indicates that, similar as in mammals, optic
nerve damage rapidly reduces retinal synaptic density and triggers dendritic shrinkage
immediately after ONC. This results in a negative growth response that reaches its minimum
around 4 dpi (cfr. maximum decline in IPL thickness and Sv2, Psd-95, Znp-1 and Map2
expression, Fig. 3.1-2), and stays that way until about 10 dpi. Notably, the observed dendrite
retraction is followed by a clear dendrite outgrowth response, increasing from 10 to 14 dpi, a
timing during which retinal synapse and dendrite integrity is fully regained (cfr. IPL thickness
and Sv2, Psd-95, Znp-1 and Map2 expression re-reach control values, Fig. 3.1-2).
The axonal growth response curve, pictured by a blue line in the schematic time-course
overview (Fig. 3.6A), reveals that axon outgrowth only starts around 1 dpi (cfr. slight increase
in gap-43 expression in Fig. 3.3A), thus after the start of dendritic retraction and steadily rises

78 | Chapter 3
until 4 dpi (cfr. peak in Gap-43 expression in Fig. 3.3A and shown by Lemmens et al. (2016)16),
exactly when the dendritic growth response is at its minimum. Hereafter, optic tectum
reinnervation starts, resulting in 70% tectum reinnervation at 7 dpi (Fig. 3.3C). The axonal
growth response then peaks at 7 dpi, and declines after this to reach zero outgrowth at and
near 10 dpi (cfr. completion of tectal reinnervation, Fig. 3.3B-C), simultaneous with the
initiation of dendritic regrowth. Finally, the completed tectal innervation is followed by RGC
synaptic target contact initiation in the brain and primary visual recovery (cfr. increase in Znp-
1 signal in the optic tectum from 10 dpi onwards, Fig. 3.4 and restoration of DLR by 18 dpi, Fig.
3.5). Our data thus reveal that adult injured regeneration-competent neurons possess a
remarkable synaptic/dendritic remodeling potential, and that they are programmed to
recapitulate developmental neurite outgrowth, wherein axogenesis precedes
dendritogenesis43,44. Remarkably, and potentially even more intriguing than these findings, is
the meticulous orchestration of the axonal and dendrite growth response over time. Indeed,
both responses nicely complement each other. ONC first evokes clear synaptic degeneration
and RGC dendritic shrinkage in the inner retina before RGC axonal regrowth is initiated.
Thereafter, dendrites are only triggered to regrow during the transition from RGC optic tectum
innervation to synaptic target contact repair in the brain. Overall, our data are suggestive of
an antagonistic and hence interdependent interplay between RGC axonal regrowth and
dendritic remodeling during CNS regeneration.
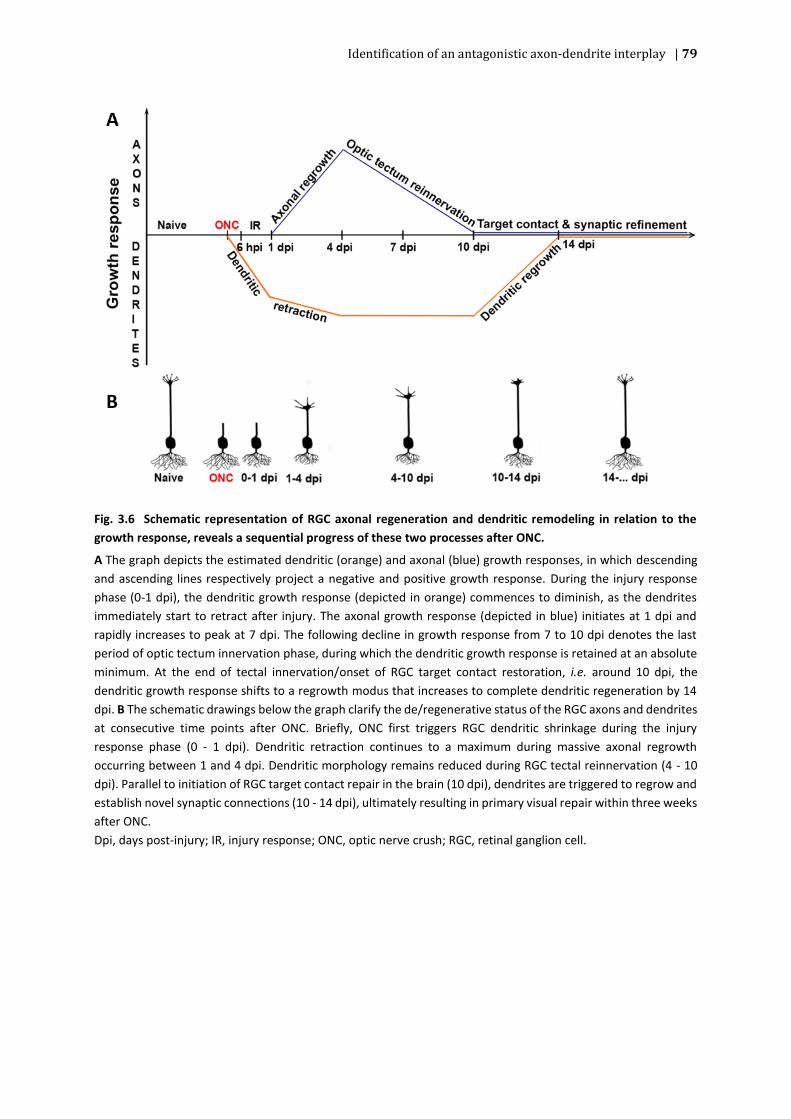
Identification of an antagonistic axon-dendrite interplay | 79
Fig. 3.6 Schematic representation of RGC axonal regeneration and dendritic remodeling in relation to the
growth response, reveals a sequential progress of these two processes after ONC.
A The graph depicts the estimated dendritic (orange) and axonal (blue) growth responses, in which descending
and ascending lines respectively project a negative and positive growth response. During the injury response
phase (0-1 dpi), the dendritic growth response (depicted in orange) commences to diminish, as the dendrites
immediately start to retract after injury. The axonal growth response (depicted in blue) initiates at 1 dpi and
rapidly increases to peak at 7 dpi. The following decline in growth response from 7 to 10 dpi denotes the last
period of optic tectum innervation phase, during which the dendritic growth response is retained at an absolute
minimum. At the end of tectal innervation/onset of RGC target contact restoration, i.e. around 10 dpi, the
dendritic growth response shifts to a regrowth modus that increases to complete dendritic regeneration by 14
dpi. B The schematic drawings below the graph clarify the de/regenerative status of the RGC axons and dendrites
at consecutive time points after ONC. Briefly, ONC first triggers RGC dendritic shrinkage during the injury
response phase (0 - 1 dpi). Dendritic retraction continues to a maximum during massive axonal regrowth
occurring between 1 and 4 dpi. Dendritic morphology remains reduced during RGC tectal reinnervation (4 - 10
dpi). Parallel to initiation of RGC target contact repair in the brain (10 dpi), dendrites are triggered to regrow and
establish novel synaptic connections (10 - 14 dpi), ultimately resulting in primary visual repair within three weeks
after ONC.
Dpi, days post-injury; IR, injury response; ONC, optic nerve crush; RGC, retinal ganglion cell.

80 | Chapter 3
4.3 CHARACTERIZATION OF RETINAL DENDRITIC REMODELING AND AXONAL
REGENERATION AFTER OPTIC NERVE INJURY IN MTOR-INHIBITED FISH
Regarding the established role of mTOR as keeper of cellular homeostasis, its capacity to
promote vertebrate optic nerve regeneration and its alleged contribution to dendrite
dynamics, we postulated that interfering with retinal mTOR activity in adult zebrafish after ONC
might provide primary insights into this potential dendrite-axon interrelatedness and its
importance in successful neuronal regeneration. Diekmann et al. (2015), already described that
a rise in mTOR activation was detected in the RGCL of crushed zebrafish at 1 dpi that peaked
one day later and was completely resolved by 4 dpi17. As dendritic remodeling immediately
starts after ONC (Fig. 3.1-2 & 3.6), and we wanted to affect this process via mTOR inhibition,
we first characterized early mTOR activity at 6 hpi. For this, a triple staining for phosphorylated
S6 (pS6, mTOR activity marker), AcT to count RGCs, and Chat (amacrine cells) was performed
on retinal sections following ONC at different time points after ONC (6 hpi, 1, 2, 4 and 7 dpi).
As published by Diekmann et al., almost no AcT+ RGCs or displaced amacrine cells in the RGCL
were labeled with pS6 in naive retinas (Fig. 3.7A)17. However, six hours after injury there is a
trend that ~6% of the RGCs (AcT+, Chat-) were labeled with pS6 and this percentage increased
until 24% at one day post-ONC. mTOR activation finally peaked two days after ONC and reached
minimum levels again at 4 dpi (Fig. 3.7A).
To evaluate efficient mTOR inhibition after intravitreal administration of rapamycin, the
same triple staining was performed on retinal sections following vehicle or rapamycin
treatment at different time points after ONC (6 hpi, 1, 2, 4 and 7 dpi). In Fig. 3.7B, a clear
increase in pS6+ RGCs iss observed in retinas of vehicle-treated injured fish, similar as after ONC
without intravitreal injections, ruling out compromising effects of vehicle treatment on mTOR
activation. Importantly, mTOR activation was clearly absent in rapamycin-treated fish at every
time point (2 dpi is shown in Fig. 3.7B), thus indicating that an effective and sustained mTOR
inhibition can be obtained in adult RGCs after intravitreal rapamycin injection (Fig. 3.7B).

Identification of an antagonistic axon-dendrite interplay | 81
Fig. 3.7 Characterization of early mTOR activation after ONC in untreated adult zebrafish, or after mTOR
inhibition using rapamycin.
A Quantification of the mTOR activation pattern after ONC, using triple immunostainings for pS6 (mTOR
activation), AcT (to count RGCs), and Chat (amacrine cells), revealed an immediate 6% increase in the number of
pS6+, AcT+, Chat- RGCs, six hours after ONC. At two days post-ONC, mTOR activation peaked, and then decreased
again two days later as at 4 dpi none or very few pS6+ RGCs could be detected. Data represent mean ± SEM. N =
3, One-way ANOVA with Dunnet post-hoc test, **** p < 0.0001. B In contrast to uninjected or vehicle-injected
eyes, no increase in mTOR activation was visible after intravitreal injections of rapamycin at 0 and 1 dpi, here
shown at 2 dpi. Scale bar = 20 µm.
AcT, acetylated-tubulin; Chat, choline acetyltransferase; dpi, days post-injury; hpi, hours post-injury; INL, inner
nuclear layer; IPL, inner plexiform layer; mTOR, mechanistic target of rapamycin; NFL, nerve fiber layer; ONC,
optic nerve crush; pS6, phosphorylated S6; Rap, rapamycin; RGC, retinal ganglion cell; RGCL, retinal ganglion cell
layer.
Consistent with our previous observations, analysis of IPL thickness, Sv2, Znp-1 and Map2
retinal expression in naive and vehicle-treated fish at 4 dpi, revealed a clear retinal synaptic
decay and dendritic shrinkage after ONC (Fig. 3.8A-C). However, and most notably, IPL
thickness, as well as Sv2, Znp-1 and Map2 expression values in retinal samples of rapamycin-
treated fish at 4 dpi still resembled baseline values, implying that fish with a reduced retinal
mTOR activity were unable to retract their dendrites and degrade their synapses immediately
after ONC (Fig. 3.8A-C). Of note, to ascertain immediate preservation of synapto-dendritic trees
after mTOR inhibition, a Znp-1 staining was concurrently performed on retinal sections of
vehicle- and rapamycin-treated fish at 1 dpi. In line with expectations, rapamycin-treated fish
did not show a reduction in Znp-1 intensity as compared to naive fish, whereas clear synaptic
degradation could already be observed in vehicle-treated retinas at 1 dpi (Fig. 3.8C).

82 | Chapter 3
Fig. 3.8 Characterization of synaptic and dendritic deterioration after ONC in vehicle-treated adult zebrafish,
or after mTOR inhibition using rapamycin.
A Representative images of H&E stained retinal sections and quantitative analysis of IPL/total retinal thickness
reveal IPL thinning in vehicle-treated fish at 4 dpi as compared to naive fish, yet not in fish intravitreally injected
with rapamycin at 0 and 1 dpi. Scale bar = 20 µm. Data represent mean ± SEM. N = 9-10, One-way ANOVA with
Dunnet post-hoc test, ** p < 0.01. B Representative picture and bar graph showing WB analysis for Sv2 and Map2
on retinal extracts of naive and vehicle- or rapamycin-treated fish at 4 dpi, plotted as a relative percentage to
naive fish. Significantly decreased Sv2 and Map2 protein levels were observed after vehicle treatment,
respectively indicating synaptic and dendritic degeneration during RGC axonal regrowth. Rapamycin-treated fish
did not show a decrease in Sv2, nor in Map2 protein. Data represent mean ± SEM. Sv2: N = 9-13, One-way ANOVA
with Kruskal-Wallis post-hoc test, * p < 0.05. Map2: N = 12-14, One-way ANOVA with Dunnet post-hoc test, ** p
< 0.01. C Immunostainings for Znp-1 on retinal sections of naive and vehicle- or Rap-treated fish at 1 or 4 dpi,
reveal a decrease in Znp-1 intensity in vehicle-treated but not in rapamycin-treated animals, again confirming
mTOR as a driver of synaptic degeneration after ONC. DAPI (blue) was used as nuclear counterstain. Scale bar =
20 µm.
Dpi, days post-injury; INL, inner nuclear layer; IPL, inner plexiform layer; Map2, microtubule-associated protein
2; mTOR, mechanistic target of rapamycin; NFL, nerve fiber layer; ONL, outer nuclear layer; OPL, outer plexiform
layer; PRL, photoreceptor layer; Psd, post-synaptic density; Rap, rapamycin; RGCL, retinal ganglion cell layer; Sv2,
synaptic vesicle protein; WB, western blotting.

Identification of an antagonistic axon-dendrite interplay | 83
To evaluate whether inhibition of retinal mTOR activation after ONC also interferes with
RGC axonal regeneration, axons of naive and of vehicle- and rapamycin-treated fish were
anterogradely traced with biocytin at 7 dpi and axonal regeneration was quantified at the level
of the contralateral optic tectum as previously described16. A 50% decrease in tectal
reinnervation was observed in crushed fish injected with rapamycin as compared to vehicle-
treated injured fish, which showed the expected reinnervation percentage of ~75% (Fig. 3.9).
Furthermore, rapamycin treatment did not affect cell survival, as activated Caspase-3 stainings
on retinal sections of naive, vehicle- and rapamycin-treated fish at 4 dpi did not unveil caspase-
3-immunopositive cells (data not shown). These data then also confirm recently published
observations that mTOR drives zebrafish optic nerve regeneration17. Interestingly, our data
now suggest that inhibition of retinal mTOR activation after ONC immediately prevents retinal
dendritic and synaptic deterioration after ONC, which later on results in a reduced RGC axonal
regrowth capacity.
To further support this theory, optic tectum reinnervation was quantified after delayed
rapamycin treatment (intravitreal injections at 4 and 5 dpi), when dendritic shrinkage has
already occurred (Fig. 3.9). As expected and already reported by Diekmann et al. (2015), this
delayed treatment did not negatively affect axonal regeneration, as there was no difference in
optic tectum reinnervation after delayed rapamycin, immediate or delayed vehicle
treatment17. Together, these data indicate that the detrimental effect of early mTOR inhibition
on axonal regeneration is, at least partly, caused by the lack of dendritic shrinkage and synaptic
pruning.

84 | Chapter 3
Fig. 3.9 Quantification of tectal reinnervation via retrograde biocytin tracing after retinal mTOR inhibition.
Representative images and semi-quantitative analysis of the area covered by RGC axons reveal a clearly
diminished reinnervated tectal area after intravitreal injections of rapamycin at 0 and 1 dpi as opposed to vehicle-
treated and naive fish (indicated with black arrows). Notably, delayed mTOR inhibition, using rapamycin
treatment at 4 and 5 dpi, did not affect tectal innervation as compared to vehicle-injected fish. Scale bar = 200
µm. Data represent mean ± SEM. N = 4-9, One-Way ANOVA with Tukey post-hoc test,** p < 0.01, **** p < 0.0001.
Dpi, days post-injury; OT, optic tectum; Rap, rapamycin.
4.4 CHARACTERIZATION OF RETINAL DENDRITIC REMODELING AND AXONAL
REGENERATION AFTER OPTIC NERVE INJURY IN MMP-INHIBITED FISH
Our lab previously published that fish subjected to broad-spectrum retinal MMP
inhibition, obtained via repeated intravitreal injections of GM6001, suffered from aberrant
tectal reinnervation at one week after optic nerve injury (Fig. 3.10)16. Additional retinal
analyses, performed by dr. Kim Lemmens, demonstrated that GM6001-treated fish did not
show IPL thinning after ONC (Fig. 3.11A) and failed to significantly degrade retinal synapses

Identification of an antagonistic axon-dendrite interplay | 85
and retract their dendrites at least until 4 dpi as opposed to vehicle-treated fish, as shown by
analysis of Sv2 and Map2 protein expression, respectively (Fig. 3.11B). This finding is in
accordance with reports that support a critical role of dendrite–extracellular matrix (ECM)
interactions - and thus of MMPs, which are well known for their extensive ECM remodeling
capacity - in maintaining neuronal dendrites and reactivating their structural plasticity in
matured neuronal circuits45,46. As such, and similar to the mTOR data, also GM6001-treated
fish, known to have a decreased RGC axonal regrowth capacity upon ONC, primarily seem to
suffer from an inability to degrade their synapto-dendritic compartments.
Fig. 3.10 Quantification of tectal reinnervation via retrograde biocytin tracing after retinal broad-spectrum
MMP inhibition.
Representative images and semi-quantitative analysis of the area covered by RGC axons in the optic tectum
reveal a clearly diminished reinnervated tectal area after GM6001 treatment, as opposed to vehicle-treated and
naive fish. Scale bar = 200 µm. Data represent mean ± SEM. N = 8-15, One-way ANOVA with Tukey post-hoc test,
** p < 0.01, **** p < 0.0001. Published in Lemmens et al. (2016).
Dpi, days post-injury; MMP, matrix metalloproteinase; OT, optic tectum.
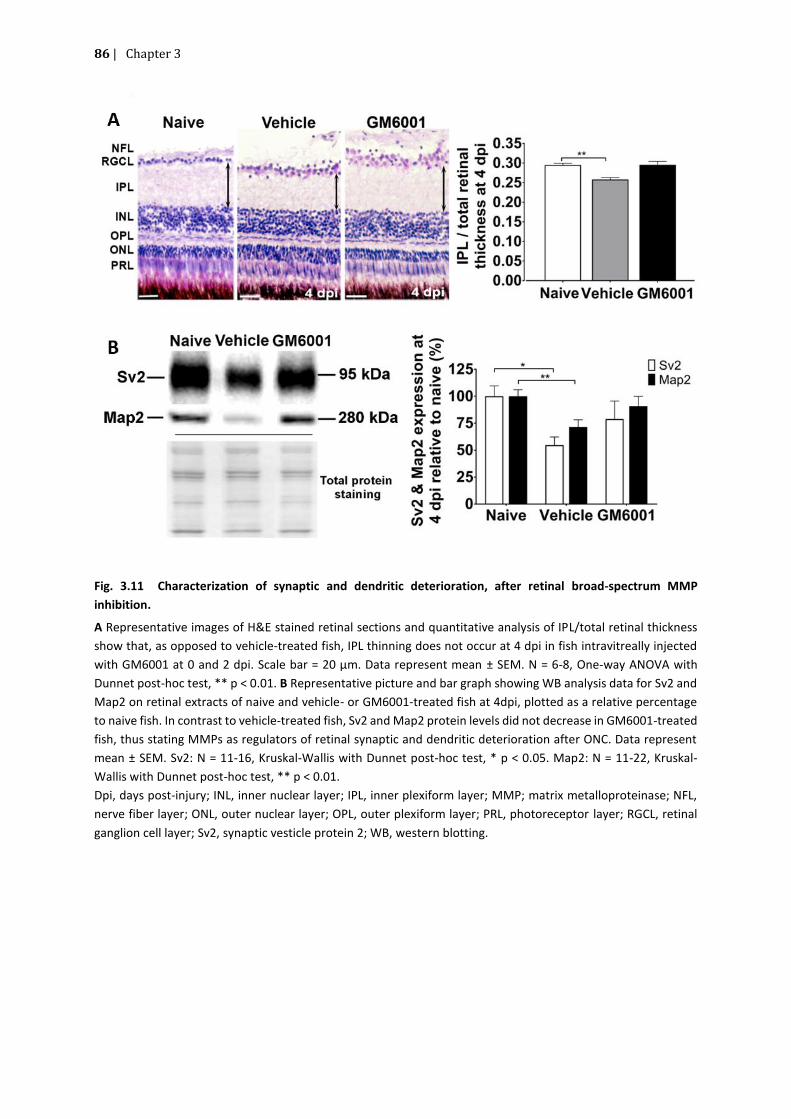
86 | Chapter 3
Fig. 3.11 Characterization of synaptic and dendritic deterioration, after retinal broad-spectrum MMP
inhibition.
A Representative images of H&E stained retinal sections and quantitative analysis of IPL/total retinal thickness
show that, as opposed to vehicle-treated fish, IPL thinning does not occur at 4 dpi in fish intravitreally injected
with GM6001 at 0 and 2 dpi. Scale bar = 20 µm. Data represent mean ± SEM. N = 6-8, One-way ANOVA with
Dunnet post-hoc test, ** p < 0.01. B Representative picture and bar graph showing WB analysis data for Sv2 and
Map2 on retinal extracts of naive and vehicle- or GM6001-treated fish at 4dpi, plotted as a relative percentage
to naive fish. In contrast to vehicle-treated fish, Sv2 and Map2 protein levels did not decrease in GM6001-treated
fish, thus stating MMPs as regulators of retinal synaptic and dendritic deterioration after ONC. Data represent
mean ± SEM. Sv2: N = 11-16, Kruskal-Wallis with Dunnet post-hoc test, * p < 0.05. Map2: N = 11-22, Kruskal-
Wallis with Dunnet post-hoc test, ** p < 0.01.
Dpi, days post-injury; INL, inner nuclear layer; IPL, inner plexiform layer; MMP; matrix metalloproteinase; NFL,
nerve fiber layer; ONL, outer nuclear layer; OPL, outer plexiform layer; PRL, photoreceptor layer; RGCL, retinal
ganglion cell layer; Sv2, synaptic vesticle protein 2; WB, western blotting.

Identification of an antagonistic axon-dendrite interplay | 87
A Enriched Kegg pathways in the retina– upregulated proteins
B Enriched Kegg pathways in the retina – downregulated proteins
4.5 A DIFFERENTIAL PROTEOMICS STUDY TO IDENTIFY ENRICHED KEGG
PATHWAYS IN THE RETINA AND OPTIC NERVE AFTER ONC
To identify proteins underlying axonal regeneration, dendritic remodeling or an
antagonistic axon-dendrite interplay, a differential proteomics was performed using both
retinal and optic nerve samples obtained at baseline or at 3 dpi, a time point at which RGC
dendrites maximally retracted. In the retina, a total of 1059 proteins was detected, of which
48 were significantly upregulated three days after crush in comparison with the control (p <
0.05 and fold change > 5%) and 17 proteins were significantly downregulated. STRING analysis
was used on both protein lists separately (increased and decreased DE proteins) to identify
the enriched KEGG pathways. Fig. 3.12 illustrates that the ribosome and phagosome pathways
are, respectively, up- or downregulated and shows the corresponding DE proteins.
KEGG Pathway Upregulated DE proteins
Ribosome rpl10a, rpl13, rpl23a, rpl26, rpl28, rpl3, rpl30, rpl35a, rps13, rps15a, rps18, rps2, rps24, rps26, rps3, rps4x, rps8a
KEGG Pathway Downregulated DE proteins Phagosome Tuba2,canx,atp6v1g1, zgc:112335
Fig. 3.12 Enriched KEGG pathways after STRING analysis of the (A) up- or (B) downregulated differentially
expressed proteins in the retina of control or crushed zebrafish (three days after injury).
In the optic nerve, only 761 proteins were detected but the number of DE proteins was
higher as compared to the retinal data: 244 significantly upregulated and 53 significantly
downregulated proteins were identified in optic nerve samples of crushed zebrafish, in
comparison to the basal situation. STRING analysis also revealed more enriched KEGG
pathways, especially using the list of proteins with enhanced expression (Fig. 3.13).

88 | Chapter 3
B Enriched Kegg pathways in the optic nerve - downregulated proteins
KEGG Pathway Upregulated DE proteins
Ribosome
Faua, Rpl13, Rpl13a, Rpl17, Rpl19, Rpl23, Rpl23a, Rpl3, Rpl31, Rpl32, Rpl36a, Rpl38, Rpl4, Rpl6, Rpl7, Rplp0, Rps10, Rps11, Rps13, Rps14, Rps15a, Rps16, Rps18, Rps2, Rps21, Rps23, Rps24, Rps26, Rps27a, Rps29, Rps3, Rps3a, Rps5, Rps7, Rps8a, Rpsa
Tight junction
ENSDARG00000076772, Ppp2cA, Actn4, Actr2a, Ezrb, Hspa4b, Msna, Myh9b, Myhz2, Myl6, Myl9a, Ppp2r1a, Tuba8l, Tuba8l4
Oocyte meiosis
Ppp2cA, Ppp1caa, Ppp1cb, Ppp2r1a, Ywhaba, Ywhae1, Ywhae2, Ywhag2, Ywhaqa, Ywha
Proteasome Psma1, Psma8, Psmb1, Psmb5, Psmc2, Psmc3, Psmd14
Protein processing in
endoplasmatic reticulum
Calrl, Hsc70, Hsp90ab1, Hspa5, Hspa8, Pdia3, Rpn1, Rrbp1a, Vcp
Regulation of actin
cytoskeleton
Actn4, Arpc2, cfl2l, Ezrb, Gsna, Msna, Myl9a, Ppp1caa, Ppp1cb, Rras2
Carbon metabolism Aldoaa, dlst, Echs1, Eno1a, Got2b, Ogdha, Tktb
mRNA surveillance pathway Ppp2cA, Cpsf6, Ppp1caa, Ppp1cb, Ppp2r1a
Cell cycle Ywhaba, Ywhae1, Ywhae2, ywhag2, Ywhaqa, Ywhaz
Phagosome Atp6v1aa, C3a, calrl, Tuba8l, Tuba8l4, Tubb5
KEGG Pathway Downregulated DE proteins Gap junction Gnai2b, Tuba2, zgc:112335, zgc:123194, zgc:55461, zgc:65894
Phagosome
Tuba2, zgc:112335, zgc:123194, zgc:55461, zgc:65894
Carbon metabolism
Eno2, Mdh1aa, Pgam1b, Suclg1
Metabolic pathways
Atp5l, Ckbb, Eno2, Glulb, Mdh1aa, Pgam1b, Suclg1
Biosynthesis of amino acids
Eno2, Glulb, Pgam1b
Adrenergic signaling in
cardiomyocytes
Atp1a3a, Atp1b3b, Gnai2b
Fig. 3.13 Enriched KEGG pathways after STRING analysis of the (A) up- or (B) downregulated differentially
expressed proteins in the optic nerve of control or crushed zebrafish (three days after injury).
A Enriched Kegg pathways in the optic nerve
- upregulated proteins
B Enriched Kegg pathways in the optic nerve
- downregulated proteins
A Enriched Kegg pathways in the optic nerve - upregulated proteins

Identification of an antagonistic axon-dendrite interplay | 89
Based on our previous data combined with a thorough literature study, an energy
restriction inside neurons was hypothesized to be at the root of the antagonistic axon-
dendrite interplay observed after ONC in adult zebrafish. Therefore, we focused on
upregulated and downregulated DE proteins of the carbon metabolism and metabolic
pathway KEGG pathways, which are listed in table 3.1 and 3.2, respectively, together with
their function in energy metabolism. The numerous DE proteins involved in glycolysis, the
tricarboxylic acid cycle (TCA) and oxidative phosphorylation, both up-and downregulated, hint
that these injured neurons and their surrounding environment undergo bioenergetic changes.
Table 3.1 List of upregulated differentially expressed proteins in the optic nerve which are part of the carbon
metabolism KEGG pathway.
Protein Function
Tktb2 Transketolase 2 Connects pentose phosphate pathway with glycolysis
Aldoaa Fructose-biphosphate aldolase Enzyme necessary for the 4th step of glycolysis
Eno1a Enolase 1 Enzyme necessary for the 9th step of glycolysis
Echs1 Enoyl Coenzyme A hydratase, short chain, 1,
Mitochondrial enzyme involved in fatty acid oxidation, which can feed the TCA cycle
Got2 Aspartate aminotransferase Mitochondrial enzyme involved in amino acid metabolism and the malatate-aspartate shuttle between glycolysis and oxidative phosphorylation
Dlst Enzyme of the 2-oxoglutarate dehydrogenase complex
Mitochondrial enzyme involved in 4th step of TCA cycle
Ogdha Enzyme of the 2-oxoglutarate dehydrogenase complex
Mitochondrial enzyme involved in 4th step of TCA cycle
Table 3.2 List of downregulated differentially expressed proteins in the optic nerve which are part of the
carbon metabolism and metabolic KEGG pathways.
Protein Function
Pgam1b Phosphoglycerate mutase Enzyme necessary for the 8th step of glycolysis
Eno2 Enolase 2 Enzyme necessary for the 9th step of glycolysis
Suclg1 Succinyl-CoA ligase Mitochondrial enzyme involved in 5th step of TCA cycle
Mdh1aa Malate dehydrogenase Mitochondrial enzyme involved in 8th step of TCA cycle
Atp5l ATP synthase subunit g Mitochondrial enzyme necessary for ATP production in
oxidative phosphorylation
Glulb Glutamate-ammonia ligase Mitochondrial enzyme involved in amino acid
metabolism
Ckbb Creatine kinase, brain
subtype
Cytosolic or mitochondrial enzyme with diverse roles in
energy metabolism

90 | Chapter 3
5 DISCUSSION
While a distinct time frame for RGC axon growth versus dendrite expansion has been
described during development of the retinofugal system, the temporal relationship between
axon and dendrite regeneration in adult injured neurons remains largely unknown.
Intriguingly, by using the zebrafish ONC model as an injury paradigm, we now demonstrate
that mature regeneration-competent neurons are programmed to repeat the developmental
order of neurite outgrowth upon injury, thus prioritizing axonal regeneration followed by
dendritic regrowth (Fig. 3.1-3.6)43,44. RGCs indeed undergo major dendritic retraction before
they start to regrow their axons, and they only begin to reconstruct their dendrites upon
axonal target contact. These findings impose the question whether dendrites need to retract
in order to boost RGC axonal regrowth. To address this ‘antagonistic axon-dendrite interplay’
hypothesis, mTOR was chosen as a lead molecule as several publications reported mTOR as a
major driver of vertebrate RGC axonal regeneration, but also denoted its importance in
regulating RGC dendritic morphology upon axotomy in mammals14,19. mTOR activity, which is
highly involved in driving neuronal development, is reduced to low levels in adult mammalian
neurons, and is reported to even further decrease upon axonal injury. Maintaining active
mTOR levels at a pre-injury status via phosphatase and tensin homolog (PTEN) deletion upon
axonal lesion, markedly increased the regenerative ability of adult injured RGCs in vivo, and
thus promoted axonal regeneration17. Besides stimulating axonal regeneration, mTOR is also
involved in dendrite stability and regeneration. Indeed, two independent studies showed that
RGC dendrite degeneration upon optic nerve damage in mice can be prevented by
counteracting the injury-induced mTOR deactivation, using RNA-mediated knockdown of
Regulated in development and DNA damage response 2 (REDD2), or using PTEN knockout
mice, both methods addressing mTOR inhibitors3,47. In addition, topical or intraperitoneal
administration of insulin, another paradigm to restore mTOR activity, even resulted in
dendrite regrowth and improved retinal functionality, after axotomy-induced dendrite
retraction48.
In sharp contrast to mammals, mTOR activity is rather low in basal conditions but is
significantly increased after axonal injury in adult zebrafish. Indeed, a short and early peak in
mTOR activity after ONC in adult zebrafish RGCs was already observed by Diekmann et al.
(2015). Interference with this early burst in mTOR activation via systemic rapamycin

Identification of an antagonistic axon-dendrite interplay | 91
treatment, partially reduced RGC axonal regrowth from 2.5 dpi onwards, and compromised
functional recovery17. Yet, potential effects on dendrite retraction upon rapamycin treatment
remained unmonitored. In order to explore if mTOR inhibition could affect early dendrite
shrinkage after injury, we first showed that mTOR is active in a subset of fish RGCs from 6 hpi
on. Next, we confirmed that local inhibition of mTOR activation, immediately after ONC,
indeed reduces RGC axonal regeneration, but importantly, also completely prevents dendritic
retraction/synaptic decay. Moreover, as dendrites already retract before axons start to
regrow (cfr. no visible Gap-43 induction in intraretinal RGC axons until 2 dpi49, and no
significant gap-43 mRNA induction at 1 dpi, but already a significant decrease in Map2 protein
levels at this time point in our study, Fig. 3.2-3), it is plausible to speculate that the incapacity
of regeneration-competent neurons to decently regrow RGC axons upon mTOR inhibition,
might follow directly from their inability to first retract their dendrites.
Surprisingly, this observation that mTOR activity is accompanied with dendrites that
retract in adult zebrafish, is in contrast with published data in mammals, in which restoring
mTOR activity in RGCs after ONC in mice resulted in dendrite stability or dendrite regrowth, in
case of immediate intervention after axotomy or delayed intervention after axotomy when
dendrites already retracted, respectively47. Nonetheless, mTOR driving dendritic retraction in
injured adult zebrafish, can be linked to leukemia inhibitory factor (Lif) functioning in this
model. Indeed, in adult zebrafish, the expression of Lif, which is reported to activate the mTOR
pathway in rodents and to cause major dendrite retraction of rat sympathetic neurons in
vitro50, strongly coincides with the mTOR activity burst after ONC17,51.
Overall, we can conclude that the intrinsic mTOR activity pattern in both naive and
injured RGCs fundamentally differs between zebrafish and mammals, as well as the outcome
of this pathway on dendrite morphology. These important differences in mTOR regulation,
could therefore well underlie the distinct regenerative capacities between mammals and fish,
and encourages further in-depth investigation. Of note, the major enriched KEGG pathway
observed in our proteomics experiment was the ribosome component, in both retinal and
optic nerve samples (Fig. 3.12-13). Indeed, numerous ribosomal proteins were significantly
upregulated three days after injury in both tissues, which perfectly matches with the
activation peak of mTOR in RGCs after ONC in adult zebrafish17,52. This is not surprising as
mTOR is the major regulator of protein translation, which is highly dependent on ribosomes.
In addition, Norrmén and others (2018) reported that mTOR is activated after sciatic nerve

92 | Chapter 3
injury in mice, which is part of the spontaneously regenerating PNS, and that increased
expression of mTOR was not only found in the soma, but additionally in the injured axons53.
mTOR mRNA was therefore transported into the axons and locally translated, after which
mTOR controlled nearby protein synthesis in these injured axons. The increased expression of
ribosomal proteins in the retina and optic nerve in our data, probably mediated by the
presence of active mTOR, suggests a pivotal role of enhanced protein synthesis in axonal
regeneration, by providing the necessary building blocks and growth-stimulators for this
process.
The antagonistic interplay between dendrites and axons in injured RGCs in adult
zebrafish is reinforced by the fact that retinal MMP inhibition after ONC, also showed a
consecutive inability to degrade their dendrites and regrow their axons (Fig. 3.10-11). MMPs
have been previously reported as regulators of dendrite degradation upon neuronal injury,
e.g. in Drosophila larvae, wherein severed dendrites of sensory neurons failed to degenerate
in Mmp-1 and Mmp-2 mutants, while wild-type neurons showed consecutive dendritic
clearance and regrowth after injury20. Moreover, our lab observed a clear upregulation of
Mmp-9, -13 and -14a protein levels in IPL dendrites/synapses during distinct phases of
retinotectal regeneration, likely implicating these proteinases in retinal dendritic and synaptic
remodeling in adult zebrafish after ONC49.
Overall, the consecutive perturbation of dendritic shrinkage/synaptic deterioration and
RGC axonal regrowth after ONC, seen in rapamycin- and GM6001-treated fish, suggests that
transient RGC dendritic shrinkage might be conditional for axonal regeneration upon
optic nerve injury. Moreover, it unveiled the involvement of intrinsic (e.g. mTOR), as well as
extrinsic (e.g. MMPs) signaling pathways in this dendrite-axon interplay. This study therefore
emphasizes the importance of monitoring/manipulating RGC dendritic remodeling upon optic
nerve injury in mammalian optic neuropathy models, as a potential means to obtain successful
CNS regeneration.
Remarkably, the causal/antagonistic link between dendritic remodeling and axonal
regeneration is not an established idea as only a few papers hint towards this connection.
Chung et al. (2016), reported that concurrent severing of the ASJ axon and sensory dendrites
in larval and young C. elegans significantly enhanced axonal regrowth, as compared to ASJ
neurons subjected to axotomy alone54. Moreover, for two distinct axonal-inducing methods,

Identification of an antagonistic axon-dendrite interplay | 93
being ciliary neurotrophic factor (CNTF) administration or inflammatory stimulation
(unpublished host lab data), a more severe reduction in RGC dendritic complexity/length, was
independently observed after optic nerve injury in mice, compared to untreated injured
animals, suggesting that dendritic shrinkage can be beneficial to induce axonal regrowth47,55.
Altogether, these (reported and our current) findings reveal a conserved neuronal remodeling
mechanism upon injury in both adult invertebrate and vertebrate nervous systems and
suggests that dendritic shrinkage can boost the regrowth of axons. Moreover, it has been
described that developing mammalian neurons, e.g. RGCs, irreversibly switch from an axonal
to a dendritic growth mode, which has been put forward as a reason for the inability of adult
CNS neurons to regenerate in vivo56. As it is assumed that this ‘switch signal’ represents a
contact-mediated or membrane-associated signal from amacrine cells, substantial loss of
synaptic contacts and subsequent dendritic shrinkage upon injury, as seen in adult zebrafish
subjected to ONC, might pose an important means for adult neurons to regain their axonal
regrowth mode44,56.
As this research is utterly novel, the underlying processes for the restriction of mature
dendrites on axonal regrowth in adult neurons remains open for speculation but an energy-
based trade-off inside neurons could play a role. The literature overview shown in chapter 2
indicated that both developing and mature neurons are high energy-demanding and that their
growth potential heavily relies on adequate energy supply43,57,58. Indeed, different in vitro and
in vivo models with spontaneous or induced regeneration indicated that increased
mitochondrial ATP supply near the active growth cone is essential for axonal outgrowth. We
therefore hypothesize that dendritic retraction might occur before axonal regeneration to
provide the necessary translocation of energy-producing mitochondria towards the axonal
growth cone and reassure axonal outgrowth, which should be followed by the reverse
translocation of mitochondria towards the dendrites to stimulate their restoration. A study of
Van Spronsen et al. (2016) already supported our axon-dendrite energy trade-off hypothesis
as knockdown of trafficking kinesin (TRAK) 2, a mitochondrial adaptor protein steering
mitochondria inside dendrites, in cultured hippocampal rat neurons resulted in reduced
dendrite outgrowth, probably due to energy shortage, but simultaneously enhanced the
growth of axons, likely because of the extra available mitochondria in the axonal
compartment.
94 | Chapter 3
The proteomics data revealing DE proteins in the optic nerves of naive compared to
injured zebrafish, at a time point characterized by retinal dendritic shrinkage and synapse
removal, further indicate that energetic adaptations are triggered upon injury. Indeed,
enriched KEGG pathways found in the optic nerve were carbon metabolism and metabolic
pathways, with differential expression of glycolytic and mitochondrial enzymes (Fig. 3.12-13,
Table 3.1-2). The fact that there is no clear direction in enhanced or reduced glycolysis, TCA
cycle or oxidative phosphorylation, as shown by both increased and decreased expression of
involved key enzymes, highlights the complexity of interactions between multiple energy
pathways, possibly in different cells. Moreover, not all RGC axons will have grown equally far
or will be in the same growth phase, and thus these distinctive (e.g. pioneering and later
following) RGC axons potentially rely on different energy sources. Consequently, based on
these bulk proteomics data no conclusion can be drawn on what is exactly ongoing in the optic
nerve during axonal regeneration concerning energy production/regulation, but different
hypothetic situations can be premised, based on literature.
It is for example known that axonal injury depolarizes mitochondria near the crushed
site, resulting in mitochondrial dysfunction or even the removal of these organelles, both
situations potentially visualized by the reduced detection of TCA cycle and oxidative
phosphorylation enzymes at the injury site 59–62. Simultaneously however, RGC axons do need
more energy after ONC as compared to basal conditions in order to drive growth cone
initiation and axonal elongation63. Two reasonable ways for RGCs to reverse this injury-
induced energy shortage, are the transport of healthy mitochondria towards the axonal
stump, or increased glycolysis to produce the necessary ATP, although this is less efficient in
comparison to oxidative phosphorylation. As mentioned before, regeneration-competent
neurons were indeed previously shown to enhance their mitochondrial transport rate inside
axons to increase mitochondrial density, thereby effectively boosting axonal elongation59,63–
67. Of note, a reduction in neuronal activity is also known to relieve dendritic mitochondria
from their role in maintaining synapses and to improve mitochondrial mobility, thereby
leading to the translocation of mitochondria towards the injury site. This potentially underlies
the increase of some mitochondrial enzymes in the list of DE proteins in the damaged optic
nerve57,59,68.

Identification of an antagonistic axon-dendrite interplay | 95
Moreover, the rise in glycolytic enzymes observed in the optic nerve after insult, can
indicate that adult zebrafish RGCs reprogram their energy metabolism from oxidative
phosphorylation to glycolysis after injury, which is, as a matter of fact, the opposite of what
happens during neuronal development and differentiation69–72. Indeed, embryonic rat RGCs
with high axonal outgrowth capacity maintain adequate energy levels mainly via cytoplasmic
glycolysis, compared to postnatal RGCs, which switch to a more oxidative phosphorylation-
dependent energy state and are characterized by a low axonal regrowth potential. A similar
shift has been demonstrated to occur during mammalian embryonic and adult
neurogenesis/differentiation. The reversed switch (oxidative phosphorylation to glycolysis),
called the Warburg effect, however, has shown to have pro-growth/regenerative effects as
well, of which cancer growth is the best known69,71. Indeed, most cancer cells have an altered
metabolism in which they increase glucose uptake and produce energy by a high rate of
glycolysis, not followed by further mitochondrial oxidation. Although the exact function of this
Warburg effect is not fully unraveled, one of the potential benefits for cancer cells is that
increased glycolysis is characterized by more rapid ATP production, compared to complete
oxidation of glucose, which is slower but more efficient. This switch from oxidative
phosphorylation to glycolysis was also observed in other regeneration/growth conditions.
Indeed, lateral cutting of planarians, free-living flatworms, triggers the development of a
complete organism out of every piece and is associated with increased glycolytic activity73.
Moreover, during heart regeneration after cryoinjury of the ventricle in adult zebrafish, the
Warburg effect is also reported and found necessary for proliferation of cardiomyocytes74.
Another benefit of glycolysis could lay in its fueling of fast axonal transport of vesicles, as
shown in Drosophila larvae and embryonic rat cortical cultures, which could be important for
delivering building blocks and growth factors to the growth cone during axonal
regeneration75–77. Interestingly, a peripheral lesion condition, a method to induce
regeneration of the central branch of dorsal root ganglia (DRG) neurons in mice, enhances
global axonal transport, as analyzed in the corresponding explants in vitro. This increased
transport possibly underlies the pro-regenerative effect of peripheral branch lesioning.
Strikingly, among the substrates transported in the central branch, different glycolytic
enzymes were identified, which could help to increase energy production at the growth
cone78. Because of all these reported beneficial effects of glycolysis on
proliferation/growth/regeneration of cells, the hypothesis arose that also a shift to a

96 | Chapter 3
developmental glycolytic energy metabolism could enhance axonal elongation after injury and
that the oxidative phosphorylation energetic state in adult neurons potentially suppresses
axonal regeneration79. One noteworthy observation by Zhen et al. (2016) is that, during
differentiation of human neural progenitor cells to neurons, the expression of one key
glycolytic enzyme was not fitting the developmental glycolytic to oxidative phosphorylation
switch, namely enolase 2 (ENO2). Indeed, the expression of this enzyme was enhanced by
two-fold during neuronal differentiation, while ENO1 was decreased, similar to the other
glycolytic enzymes75,77. Here, the undifferentiated neuronal state was thus characterized by a
high expression of glycolytic enzymes, except for ENO2, from which the expression increased
upon differentiation. Strikingly, our proteomics data also indicate an opposite effect of injury
on Eno1 vs. Eno2 expression, with respectively increased and decreased detection after ONC,
which is comparable to an early developmental state in the paper of Zhen et al.. These data
therefore suggest that zebrafish RGCs obtain a more dedifferentiated, growth-competent
phenotype after optic nerve injury (Table 3.1-2).
Besides affecting RGC energy status/metabolic profile, ONC can also influence the same
factors in the surrounding cells, that are in close contact with RGC axons. These environmental
energy metabolism changes are potentially detected in the bulk proteomics experiment
performed on optic nerve lysates, which do not only contain the RGC axons, but also their
surrounding (damaged) myelin sheaths, oligodendrocytes and cells involved in the
inflammatory response. An important concept here, is the astrocyte-oligodendrocyte-neuron
lactate shuttle, shown in Fig. 3.14, in which both astrocytes and oligodendrocytes can take up
glucose and metabolize it to lactate via glycolysis. Lactate can then be either used inside
mitochondria of the astrocytes/oligodendrocytes, or shuttled to neurons that then direct it to
oxidative phosphorylation processes. Moreover, glutamate released upon neuronal firing, and
predominantly taken up by perisynaptic astrocytes, can be converted inside these cells to α-
ketoglutarate, thereafter used by mitochondria, or can be converted to glutamine. This
glutamine can then subsequently be transported to neurons and reconverted to glutamate
for feeding the TCA cycle in mitochondria80–83. Injury-induced effects on this energy shuttle
could thus also underlie the DE proteins observed between the optic nerve samples harvested
from naive vs. crushed zebrafish.

Identification of an antagonistic axon-dendrite interplay | 97
Another environmental component which we need to consider, are the microglia and
macrophages that are involved in the inflammatory response triggered in the optic nerve of
zebrafish after ONC, as shown in literature and unpublished data by the host5. It is known that
microglia/macrophages change from an oxidative phosphorylation to a more glycolytic status
upon activation, e.g. by stimulation of lipopolysaccharides (LPS), visualized using murine
immune cells in vitro84–87. On the other hand however, increased mitochondria were found
upon activation of cultured rat microglia by administration of LPS. These conflicting data again
pinpoints the complex interaction between different energy inducing pathways87–89.
All in all, we can hypothesize that optic nerve injury in adult zebrafish triggers one or
more of the following events: mitochondrial dysfunction near the injury site, healthy
mitochondrial translocation, changes in RGC glycolytic activity, a switch to a more
developmental state, adaptations in the astrocyte-oligodendrocyte lactate shuttle or in the
energy metabolism of inflammatory cells. Once again, we wish to emphasize that no single
Fig. 3.14 Schematic overview of the
astrocyte-oligodendrocyte-neuron lactate
shuttle.
Glucose, taken up via de bloodstream using
glucose transporters (GLUT1), can enter
different cell types and will be converted to
lactate via glycolysis. Both the lactate in
astrocytes and oligodendrocytes can be used
inside mitochondria to feed the TCA cycle
and oxidative phosphorylation, or can be
transported to neurons via monocarboxylate
transporters (MCT) for the same purpose. In
addition, the neurotransmitter glutamate,
which is released upon neuronal stimulation,
is mainly buffered via astrocyte uptake using
glutamate transports (GLT-1). Again,
glutamate can be converted to a substrate
for the TCA cycle inside astrocytic
mitochondria, or can be transported to
neurons.
Figure adapted from Philips et al. (2017).
CX, gap junctions composed of connexin
hemichannels; GLUT, glucose transporter;
GLT, glutamate transporter; KGH,
ketoglutarate; LDH, lactate dehydrogenease;
MCT; monocarboxylate transporter; NMDA,
N-methyl-D-aspatate; TCA, tricarboxylic acid.

98 | Chapter 3
conclusion can be drawn concerning the contribution of the different energy pathways in
axonal regeneration in our model, but from the proteomic data, a general effect on energy
metabolism is obvious. Of note, and to make it even more complicated, adaptations of
mitochondrial dynamics probably go hand-in-hand with changes in metabolic profiling. It is for
example known that a glycolytic cell status is associated with increased mitochondrial fission
and thus smaller and mobile mitochondria90. It is thus clear that more research is needed to
disentangle the energetic adaptations at play in the zebrafish optic nerve during axonal
regeneration after ONC.
Using the retinal samples in the proteomics set-up, no metabolic changes were
observed. Moreover, based on our results in this research chapter, we expected to detect DE
proteins in this proteomics experiment that would reflect the observed dendritic and synaptic
changes. While Psd95 and znp-1 were not picked up, Map2, Sv2a, Sv2b and synaptosomal-
associated protein 25 were detected in both the naive and 3 dpi retinal samples, but their
expression levels were found to be unchanged within the two conditions. Strikingly, also
expression of Gap-43, a growth-associated protein expressed in regrowing axons, and for
which it is known to be massively upregulated in RGC somata and axons after ONC in
zebrafish16, was found to be unaffected in our retinal data. As Gap-43 can be seen as a positive
control molecule within this experiment, we believe that the used retinal samples and/or
proteomics set-up are not ideal to unravel RGC-specific changes after ONC. The absence of DE
proteins related to dendritic/synaptic changes could be explained by several reasons, firstly
by the use of total retinal samples. Indeed, while we were particularly interested in the DE
proteins inside the RGCs, the main affected cells after ONC, total retinal samples were used
because isolation/enrichment of RGCs in zebrafish was rather difficult to achieve at that time.
As RGCs only represent 1-3% of all retinal cells91, a dilution effect could hide synaptic/dendritic
changes, as well as metabolic changes in RGCs. Importantly, in the optic nerve samples, Gap-
43 protein expression was found to be significantly upregulated after ONC, again hinting that
in the retinal samples the dilution effect can be detrimental to find RGC-specific differences in
protein levels. Additionally, based on experience from the host lab regarding isolation of
murine RGCs we know that RGCs are very vulnerable cells and that they are easily lost during
sample preparation. If this also holds for zebrafish RGCs, it worsens the already unfavorable
situation to find RGC-specific effects using total retinal samples. Moreover, we only used three
samples per condition, as we worked with a TMTsixplex labeling kit with only six different
Identification of an antagonistic axon-dendrite interplay | 99
mass tags. The use of a TMT 10plex or TMTpro (16plex) labeling kit would increase the number
of analyzed samples92. Besides, to more easily detect synaptic changes, we should focus more
on plasma membrane-enriched preparations, e.g. by using the Acute Slice Biotinylation Assay
(ASBA) technique, to obtain a more zoomed-in sample for synaptic, membrane-associated
proteins. Thereto, retinal whole mounts would be incubated with biotin to biotinylate the
external membrane-associated proteins. This step is then followed by streptavidin pull down
of the biotinylated and thus cell surface-exposed proteins93. Lastly, although our IHC and WB
data indicated that at 1 and 4 dpi synaptic/dendritic deterioration was already substantially
evolved and at its maximum levels, respectively, the comparative proteomics analysis at 3 dpi
might have been too early to detect synaptic/dendritic changes in these RGC-diluted samples.
6 CONCLUSION
Overall, our longitudinal study characterizing axonal regeneration and dendrite
remodeling simultaneously over time revealed an antagonistic axon-dendrite interaction,
which is reinforced by recent observations made on (in)vertebrate neurons. An energetic
restriction inside neurons could underlie this effect, which is also suggested by our proteomics
data which clearly indicate an effect of axonal injury on energy metabolism, although the exact
spatiotemporal contribution of glycolysis or mitochondrial respiration is not clear yet. Further
research is urgently needed, as unravelling the possible energy-dependent mechanism of an
axon-dendrite interplay could provide new insights for an intriguing strategy to promote
axonal regeneration.

100 | Chapter 3
7 REFERENCES
1. Santina, L. Della, Inman, D. M., Lupien, C. B., Horner, P. J. & Wong, R. O. L. Differential progression of structural and functional alterations in distinct retinal ganglion cell types in a mouse model of glaucoma. J. Neurosci. 33, 17444–17457 (2013).
2. Frankfort, B. J. et al. Elevated intraocular pressure causes inner retinal dysfunction before cell loss in a mouse model of experimental glaucoma. Investig. Ophthalmol. Vis. Sci. 54, 762–770 (2013).
3. Morquette, B. et al. REDD2-mediated inhibition of mTOR promotes dendrite retraction induced by axonal injury. Cell Death Differ. 22, 612–625 (2015).
4. Benowitz, L. I., He, Z. & Goldberg, J. L. Reaching the brain: Advances in optic nerve regeneration. Experimental Neurology 287, 365–373 (2017).
5. Becker, T. & Becker, C. G. Axonal regeneration in zebrafish. Current Opinion in Neurobiology 27, 186–191 (2014).
6. Choi, J. H., Law, M. Y., Chien, C. Bin, Link, B. A. & Wong, R. O. L. In vivo development of dendritic orientation in wild-type and mislocalized retinal ganglion cells. Neural Dev. 5, (2010).
7. Kizil, C., Kaslin, J., Kroehne, V. & Brand, M. Adult neurogenesis and brain regeneration in zebrafish. Dev. Neurobiol. 72, 429–461 (2012).
8. Fimbel, S. M., Montgomery, J. E., Burket, C. T. & Hyde, D. R. Regeneration of inner retinal neurons after intravitreal injection of ouabain in zebrafish. J. Neurosci. 27, 1712–1724 (2007).
9. Kroehne, V., Freudenreich, D., Hans, S., Kaslin, J. & Brand, M. Regeneration of the adult zebrafish brain from neurogenic radial glia-type progenitors. Development 138, 4831–4841 (2011).
10. Wan, J. & Goldman, D. Retina regeneration in zebrafish. Current Opinion in Genetics and Development 40, 41–47 (2016).
11. Alunni, A. & Bally-Cuif, L. A comparative view of regenerative neurogenesis in vertebrates. Development (Cambridge) 143, 741–753 (2016).
12. Bollaerts, I. et al. Complementary research models and methods to study axonal regeneration in the vertebrate retinofugal system. Brain Structure and Function 223, 545–567 (2018).
13. Gemberling, M., Bailey, T. J., Hyde, D. R. & Poss, K. D. The zebrafish as a model for complex tissue regeneration. Trends in Genetics 29, 611–620 (2013).
14. Berry, M., Ahmed, Z., Morgan-Warren, P., Fulton, D. & Logan, A. Prospects for mTOR-mediated functional repair after central nervous system trauma. Neurobiology of Disease 85, 99–110 (2016).
15. Andries, L., Van Hove, I., Moons, L. & De Groef, L. Matrix Metalloproteinases During Axonal Regeneration, a Multifactorial Role from Start to Finish. Molecular Neurobiology 54, 2114–2125 (2017).
16. Lemmens, K. et al. Matrix metalloproteinases as promising regulators of axonal regrowth in the injured adult zebrafish retinotectal system. J. Comp. Neurol. 524, 1472–1493 (2016).
17. Diekmann, H., Kalbhen, P. & Fischer, D. Active mechanistic target of rapamycin plays an ancillary rather than essential role in zebrafish CNS axon regeneration. Front. Cell. Neurosci. 9, 251 (2015).
18. Jaworski, J. & Sheng, M. The growing role of mTOR in neuronal development and plasticity. Mol. Neurobiol. 34, 205–219 (2006).
19. Di Polo, A. Dendrite pathology and neurodegeneration: Focus on mTOR. Neural Regeneration Research 10, 559–561 (2015).
20. Kuo, C. T., Jan, L. Y. & Jan, Y. N. Dendrite-specific remodeling of Drosophila sensory neurons requires matrix metalloproteases, ubiquitin-proteasome, and ecdysone signaling. Proc. Natl. Acad. Sci. U. S. A. 102, 15230–15235 (2005).
21. Szklarczyk, A., Lapinska, J., Rylski, M., McKay, R. D. G. & Kaczmarek, L. Matrix metalloproteinase-9 undergoes expression and activation during dendritic remodeling in adult hippocampus. J.

Identification of an antagonistic axon-dendrite interplay | 101
Neurosci. 22, 920–930 (2002). 22. McCurley, A. T. & Callard, G. V. G. V. Time course analysis of gene expression patterns in
zebrafish eye during optic nerve regeneration. J. Exp. Neurosci. 4, 17–33 (2010). 23. Van Houtven, J. et al. QCQuan: A Web Tool for the Automated Assessment of Protein Expression
and Data Quality of Labeled Mass Spectrometry Experiments. J. Proteome Res. 18, 2221–2227 (2019).
24. Szklarczyk, D. et al. The STRING database in 2017: Quality-controlled protein-protein association networks, made broadly accessible. Nucleic Acids Res. 45, D362–D368 (2017).
25. Lin, Y.-C. & Koleske, A. J. Mechanisms of Synapse and Dendrite Maintenance and Their Disruption in Psychiatric and Neurodegenerative Disorders. Annu. Rev. Neurosci. 33, 349–378 (2010).
26. Battista, A. G., Ricatti, M. J., Pafundo, D. E., Gautier, M. A. & Faillace, M. P. Extracellular ADP regulates lesion-induced in vivo cell proliferation and death in the zebrafish retina. J. Neurochem. 111, 600–613 (2009).
27. Yazulla, S. & Studholme, K. M. Neurochemical anatomy of the zebrafish retina as determined by immunocytochemistry. J. Neurocytol. 30, 551–592 (2001).
28. Meyer, M. P., Trimmer, J. S., Gilthorpe, J. D. & Smith, S. J. Characterization of zebrafish PSD-95 gene family members. J. Neurobiol. 63, 91–105 (2005).
29. Liu, Q. et al. Cadherin-6 function in zebrafish retinal development. Dev. Neurobiol. 68, 1107–1122 (2008).
30. Fox, M. A. & Sanes, J. R. Synaptotagmin I and II are present in distinct subsets of central synapses. J. Comp. Neurol. 503, 280–296 (2007).
31. Riederer, B. & Matus, A. Differential expression of distinct microtubule-associated proteins during brain development. Proc. Natl. Acad. Sci. U. S. A. 82, 6006–6009 (1985).
32. Lieven, C. J., Millet, L. E., Hoegger, M. J. & Levin, L. A. Induction of axon and dendrite formation during early RGC-5 cell differentiation. Exp. Eye Res. 85, 678–683 (2007).
33. Okabe, S., Shiomura, Y. & Hirokawa, N. Immunocytochemical localization of microtubule-associated proteins 1A and 2 in the rat retina. Brain Res. 483, 335–346 (1989).
34. Faruki, S., Doree, M. & Karsenti, E. cdc2 kinase-induced destabilization of MAP2-coated microtubules in Xenopus egg extracts. J. Cell Sci. 101, 69–78 (1992).
35. Cabrera, J. R. & Lucas, J. J. MAP2 Splicing is Altered in Huntington’s Disease. Brain Pathol. 27, 181–189 (2017).
36. Diekmann, H., Kalbhen, P. & Fischer, D. Characterization of optic nerve regeneration using transgenic zebrafish. Front. Cell. Neurosci. 9, 118 (2015).
37. Bhumika, S., Lemmens, K., Vancamp, P., Moons, L. & Darras, V. M. Decreased thyroid hormone signaling accelerates the reinnervation of the optic tectum following optic nerve crush in adult zebrafish. Mol. Cell. Neurosci. 68, 92–102 (2015).
38. Udvadia, A. J. 3.6 kb Genomic sequence from Takifugu capable of promoting axon growth-associated gene expression in developing and regenerating zebrafish neurons. Gene Expr. Patterns 8, 382–388 (2008).
39. Nevin, L. M., Robles, E., Baier, H. & Scott, E. K. Focusing on optic tectum circuitry through the lens of genetics. BMC Biol. 8, 126 (2010).
40. Brodsky, M. C. Dissociated vertical divergence: a righting reflex gone wrong. Arch Ophthalmol 117, 1216–1222 (1999).
41. Yanagihara, D., Watanabe, S., Takagi, S. & Mitarai, G. Neuroanatomical substrate for the dorsal light response. II. Effects of kainic acid-induced lesions of the valvula cerebelli on the goldfish dorsal light response. Neurosci. Res. 16, 33–37 (1993).
42. Kaneda, M. et al. Changes of phospho-growth-associated protein 43 (phospho-GAP43) in the zebrafish retina after optic nerve injury: A long-term observation. Neurosci. Res. 61, 281–288 (2008).
43. Ramamurthy, S., Chang, E., Cao, Y., Zhu, J. & Ronnett, G. V. AMPK activation regulates neuronal structure in developing hippocampal neurons. Neuroscience 259, 13–24 (2014).

102 | Chapter 3
44. Goldberg, J. L., Klassen, M. P., Hua, Y. & Barres, B. A. Amacrine-signaled loss of intrinsic axon growth ability by retinal ganglion cells. Science (80-. ). 296, 1860–1864 (2002).
45. Levy, A. D., Omar, M. H. & Koleske, A. J. Extracellular matrix control of dendritic spine and synapse structure and plasticity in adulthood. Frontiers in Neuroanatomy 8, (2014).
46. Emoto, K. Dendrite remodeling in development and disease. Development Growth and Differentiation 53, 277–286 (2011).
47. Mak, H. K., Ng, S. H., Ren, T., Ye, C. & Leung, C. K. shun. Impact of PTEN/SOCS3 deletion on amelioration of dendritic shrinkage of retinal ganglion cells after optic nerve injury. Exp. Eye Res. 192, (2020).
48. Agostinone, J. et al. Insulin signalling promotes dendrite and synapse regeneration and restores circuit function after axonal injury. Brain 141, 1963–1980 (2018).
49. Lemmens, K. et al. Matrix metalloproteinases as promising regulators of axonal regrowth in the injured adult zebrafish retinotectal system. J. Comp. Neurol. 524, 1472–1493 (2016).
50. Sun, F. et al. Sustained axon regeneration induced by co-deletion of PTEN and SOCS3. Nature 480, 372–375 (2011).
51. Ogai, K. et al. Upregulation of Leukemia Inhibitory Factor (LIF) during the early stage of optic nerve regeneration in zebrafish. PLoS One 9, (2014).
52. Beckers, A. et al. An Antagonistic Axon-Dendrite Interplay Enables Efficient Neuronal Repair in the Adult Zebrafish Central Nervous System. Mol. Neurobiol. 56, 3175–3192 (2019).
53. Norrmén, C. et al. mTORC1 is transiently reactivated in injured nerves to promote c-Jun elevation and schwann cell dedifferentiation. J. Neurosci. 38, 4811–4828 (2018).
54. Chung, S. H. et al. Novel DLK-independent neuronal regeneration in Caenorhabditis elegans shares links with activity-dependent ectopic outgrowth. Proc. Natl. Acad. Sci. U. S. A. 113, E2852–E2860 (2016).
55. Bray, E. R. et al. 3D visualization of individual regenerating retinal ganglion cell axons reveals surprisingly complex growth paths. eNeuro 4, (2017).
56. Jan, Y. N. & Jan, L. Y. The Control of Dendrite Development. Neuron 40, 229–242 (2003). 57. Li, Z., Okamoto, K. I., Hayashi, Y. & Sheng, M. The importance of dendritic mitochondria in the
morphogenesis and plasticity of spines and synapses. Cell 119, 873–887 (2004). 58. Maeder, C. I., Shen, K. & Hoogenraad, C. C. Axon and dendritic trafficking. Current Opinion in
Neurobiology 27, 165–170 (2014). 59. Zhou, B. et al. Facilitation of axon regeneration by enhancing mitochondrial transport and
rescuing energy deficits. J. Cell Biol. 214, 103–119 (2016). 60. Cavallucci, V. et al. Acute focal brain damage alters mitochondrial dynamics and autophagy in
axotomized neurons. Cell Death Dis. 5, (2014). 61. Patrón, L. A. & Zinsmaier, K. E. Mitochondria on the Road to Power Axonal Regeneration.
Neuron 92, 1152–1154 (2016). 62. Coughlin, L., Morrison, R. S., Horner, P. J. & Inman, D. M. Mitochondrial morphology differences
and mitophagy deficit in murine glaucomatous optic nerve. Investig. Ophthalmol. Vis. Sci. 56, 1437–1446 (2015).
63. Beckers, A. & Moons, L. Dendritic shrinkage after injury: A cellular killer or a necessity for axonal regeneration? Neural Regeneration Research 14, 1313–1316 (2019).
64. Song, Y. et al. Regeneration of Drosophila sensory neuron axons and dendrites is regulated by the Akt pathway involving Pten and microRNA bantam. Genes Dev. 26, 1612–1625 (2012).
65. Xu, Y., Chen, M., Hu, B., Huang, R. & Hu, B. In vivo imaging of mitochondrial transport in single-axon regeneration of zebrafish mauthner cells. Front. Cell. Neurosci. 11, (2017).
66. Puttagunta, R. & Di Giovanni, S. Retinoic acid signaling in axonal regeneration. Front. Mol. Neurosci. (2012).
67. Trigo, D., Goncalves, M. B. & Corcoran, J. P. T. The regulation of mitochondrial dynamics in neurite outgrowth by retinoic acid receptor β signaling. FASEB J. 33, 7225–7235 (2019).
68. Cai, Q. & Sheng, Z. H. Mitochondrial transport and docking in axons. Experimental Neurology 218, 257–267 (2009).

Identification of an antagonistic axon-dendrite interplay | 103
69. Zheng, X. et al. Metabolic reprogramming during neuronal differentiation from aerobic glycolysis to neuronal oxidative phosphorylation. Elife 5, (2016).
70. Goyal, M. S., Hawrylycz, M., Miller, J. A., Snyder, A. Z. & Raichle, M. E. Aerobic glycolysis in the human brain is associated with development and neotenous gene expression. Cell Metab. 19, 49–57 (2014).
71. Khacho, M., Harris, R. & Slack, R. S. Mitochondria as central regulators of neural stem cell fate and cognitive function. Nature Reviews Neuroscience 20, 34–48 (2019).
72. Khacho, M. & Slack, R. S. Mitochondrial dynamics in the regulation of neurogenesis: From development to the adult brain. Developmental Dynamics 247, 47–53 (2018).
73. Osuma, E. A., Riggs, D. W., Gibb, A. A. & Hill, B. G. High throughput measurement of metabolism in planarians reveals activation of glycolysis during regeneration. Regeneration 5, 78–86 (2018).
74. Honkoop, H. et al. A metabolic switch from OXPHOS to glycolysis is essential for cardiomyocyte proliferation in the regenerating heart. bioRxiv 498899 (2018).
75. Hinckelmann, M. V. et al. Self-propelling vesicles define glycolysis as the minimal energy machinery for neuronal transport. Nat. Commun. 7, (2016).
76. Yates, D. Cell biology of the neuron: Fuelling transport. Nat. Rev. Neurosci. 14, 156–157 (2013). 77. Zala, D. et al. Vesicular glycolysis provides on-board energy for fast axonal transport. Cell 152,
479–491 (2013). 78. Mar, F. M. et al. CNS axons globally increase axonal transport after peripheral conditioning. J.
Neurosci. 34, 5965–5970 (2014). 79. Steketee, M. B. et al. Mitochondrial dynamics regulate growth cone motility, guidance, and
neurite growth rate in perinatal retinal ganglion cells in vitro. Investig. Ophthalmol. Vis. Sci. 53, 7402–7411 (2012).
80. Bélanger, M., Allaman, I. & Magistretti, P. J. Brain energy metabolism: Focus on Astrocyte-neuron metabolic cooperation. Cell Metabolism 14, 724–738 (2011).
81. Magistretti, P. J. & Allaman, I. A Cellular Perspective on Brain Energy Metabolism and Functional Imaging. Neuron 86, 883–901 (2015).
82. Philips, T. & Rothstein, J. D. Oligodendroglia: Metabolic supporters of neurons. Journal of Clinical Investigation 127, 3271–3280 (2017).
83. Amaral, A. I., Meisingset, T. W., Kotter, M. R. & Sonnewald, U. Metabolic aspects of Neuron-Oligodendrocyte-Astrocyte interactions. Frontiers in Endocrinology 4, (2013).
84. Gimeno-Bayón, J., López-López, A., Rodríguez, M. J. & Mahy, N. Glucose pathways adaptation supports acquisition of activated microglia phenotype. J. Neurosci. Res. 92, 723–731 (2014).
85. Voloboueva, L. A., Emery, J. F., Sun, X. & Giffard, R. G. Inflammatory response of microglial BV-2 cells includes a glycolytic shift and is modulated by mitochondrial glucose-regulated protein 75/mortalin. FEBS Lett. 587, 756–762 (2013).
86. Galván-Peña, S. & O’Neill, L. A. J. Metabolic reprogramming in macrophage polarization. Front. Immunol. 5, (2014).
87. Ghosh, S., Castillo, E., Frias, E. S. & Swanson, R. A. Bioenergetic regulation of microglia. Glia 66, 1200–1212 (2018).
88. Banati, R. B. et al. Mitochondria in activated microglia in vitro. J. Neurocytol. 33, 535–541 (2004).
89. Ferger, A. I. et al. Effects of mitochondrial dysfunction on the immunological properties of microglia. J. Neuroinflammation 7, (2010).
90. Yu, S. B. & Pekkurnaz, G. Mechanisms Orchestrating Mitochondrial Dynamics for Energy Homeostasis. Journal of Molecular Biology 430, 3922–3941 (2018).
91. Rheaume, B. A. et al. Single cell transcriptome profiling of retinal ganglion cells identifies cellular subtypes. Nat. Commun. 9, (2018).
92. Thompson, A. et al. TMTpro: Design, Synthesis, and Initial Evaluation of a Proline-Based Isobaric 16-Plex Tandem Mass Tag Reagent Set. Anal. Chem. (2019).
93. Smolders, K., Lombaert, N., Valkenborg, D., Baggerman, G. & Arckens, L. An effective plasma membrane proteomics approach for small tissue samples. Sci. Rep. (2015).

104 | Chapter 3

CHAPTER 4
MITOCHONDRIAL DYNAMICS AFTER ONC IN THE ZEBRAFISH
RETINOTECTAL SYSTEM, WITH A CLOSER LOOK AT THE ROLE
OF FISSION IN AXON REPAIR

106 | Chapter 4
CHAPTER 4 …………………………………………………………………………...………………………………………105
1 INTRODUCTION ……………………………………………………………...……………………………………107
2 OBJECTIVES …………………………………………………………...……………………………………………108
3 MATERIALS AND METHODS …………………………………………………………...……………….…..109
3.1 ZEBRAFISH MAINTENANCE ……………………………………………………………………………………109
3.2 OPTIC NERVE CRUSH MODEL ……………………………………………………………….………………..109
3.3 VISUALISATION OF THE MITOCHONDRIAL DISTRUBUTION IN THE
RETINOTECTAL SYSTEM OF MITOEGFP ZEBRAFISH SUBJECTED TO ONC ……………...………109
3.4 QUANTIFICATION OF MITOCHONDRIAL DISTRUBUTION AND SIZE IN THE
RETINA OF MITOEGFP ZEBRAFISH SUBJECTED TO ONC ……………………..……………..…………111
3.5.IMMUNOFLUORESCENT STAININGS ……………………………………………………………………….115
3.6 WESTERN BLOTTING ……………………………………………………………………………………………115
3.7 RETINAL MTOR INHIBITION …………………………………………………………………………………..116
3.8 TRACING AND QUANTIFICATION OF TECTAL (RE)INNERVATION IN ZEBRAFISH
WITH DISTURBED MITOCHONDRIAL DYNAMICS …………………………………………………………116
3.9 STATISTICAL ANALYSIS …………………………………………………………………………………………118
4 RESULTS ……………………………………...…………………...………………………………………………….119
4.1 CHARACTERIZATION OF MITOCHONDRIAL DISTRIBUTION/SIZE IN THE
RETINOTECTAL SYSTEM OF MITOEGFP FISH SUBJECTED TO ONC ………………………..……...119
4.2 CHARACTERIZATION OF MITOCHONDRIAL DYNAMICS IN THE RETINA AFTER ONC .130
4.3 MITOCHONDRIAL DISTRUBUTION AND AVERAGE SIZE IN MITOEGFP ZEBRAFISH
AFTER MTOR INHIBITON …………………………………………………………………………………………….135
4.4 OPTIC TECTUM (RE)INNERVATION IN ZEBRAFISH WITH DISTURBED
MITOCHONDRIAL DYNAMICS …………….………………………………………………………………………...137
5 DISCUSSION …………………………………………………………...…………………………………………….140
6 CONCLUSION ………………………………………………………………………………………………………..154
7 REFERENCES ……….…………………………………………………………...………………………………….155

Mitochondrial dynamics | 107
1 INTRODUCTION
Neurite outgrowth during development, as well as regrowth after injury, requires a
massive amount of energy in the form of adenosine triphosphate (ATP), largely produced by
mitochondria, which accumulate in active growth cones1,2. After axonal injury, however,
mitochondria are depolarized, resulting in dysfunction and less ATP production at the axonal
stump3–5. Therefore, a translocation of healthy mitochondria towards the growth cone would
be the ideal strategy to overcome this energy shortage and promote axonal regeneration. In
fact, in spontaneously regenerating animal models and in the peripheral nervous system, the
axonal mitochondrial transport rate indeed increases after injury5–8. Mitochondria become
mostly stationary in mature mammalian neurons in the central nervous system (CNS)9–12, and
axon regrowth does not occur spontaneously, unless experimentally induced by a
regenerative treatment. For some of these axonal growth-inducing strategies, increased
mitochondrial transport was identified as underlying the beneficial effect for regeneration13–
18. Taken together, these data indicate that increased axonal mitochondrial transport is critical
for regeneration.
One important aspect of this finding, which is not studied in detail, is where these
mitochondria should come from. New functional mitochondria should indeed be delivered to
the axonal compartment to initiate axonal outgrowth after injury, and can derive from
different resources or mitochondrial dynamic processes. A first way to increase the number
of these energy-producing organelles inside injured axons is transport of healthy mitochondria
residing in the dendrites or soma. In this view, dendritic retraction after axonal injury could be
important as it is known that reduced synaptic input increases mitochondrial motility19. Next,
mitochondrial fission in the soma-dendrite compartment could produce another
mitochondrial pool as this results in more and smaller mitochondria, which move more easily
in axons20. Indeed, increased fission after injury was already reported in mouse motor neurons
and strikingly, inhibiting fission in this model resulted in axonal degeneration and neuronal
death21. Thirdly, mitochondrial biogenesis, a process that is known to be critical for axonal
growth during development, could also supply new mitochondria22. Lastly, mitophagy could
be upregulated; either in the axons, where it might serve to remove damaged mitochondria
and provide building blocks for mitochondrial biogenesis, or in the dendrites, where it is
known to be an underlying factor of dendrite retraction in certain degeneration models19,23,24.

108 | Chapter 4
Either way, a pool of healthy mitochondria should be produced/collected, that could be
transported towards the axons enabling axonal outgrowth, and later on relocated to the
dendrites in order to support dendritic restoration and the repair of their postsynaptic
connections.
2 OBJECTIVES
In chapter 3 of this thesis, we reported pioneering indications that dendritic shrinkage
is an important driver of axonal regrowth in damaged vertebrate neurons, and suggested that
an intraneuronal dendrite-axon-dendrite mitochondrial channeling might underlie the
spontaneous regeneration and functional recovery in the zebrafish CNS. Based on the
hypothesis that differential mitochondrial dynamics in the neuronal compartments underlie
this ‘dendrites for regeneration’ paradigm, I first aim to characterize the mitochondrial
distribution in the retinofugal system of the spontaneously-regenerating zebrafish after ONC.
For this, we will use the Tg(isl2b:mitoEGFP-2A-TagRFPCAAX) zebrafish line, in which a subset
of RGCs contains green-fluorescent mitochondria. To strengthen our hypothesis, one of the
major interests is to determine whether axon regrowth is indeed preceded by the removal of
mitochondria from the RGC dendrites, and if mitochondria re-appear in the inner plexiform
layer (IPL) when dendrites start to regrow. Moreover, we will investigate if mitochondrial
dynamics (biogenesis, fission and fusion) in the retina are altered during the course of
axon/dendrite repair. In chapter 3, we unraveled that inhibiting the mechanistic target of
rapamycin (mTOR) pathway prevents dendrite collapse and subsequently slackens axon
regrowth. Here, we will study if this effect is linked to abnormal mitochondrial dynamics by
injecting rapamycin in the mitochondrial reporter fish and quantify mitochondrial distribution
in the retina. Lastly, we will use three mutant fish lines with disturbed mitochondrial dynamics,
i.e. defective anterograde transport due to syntabulin deficiency and inadequate fission due
to over- or dominant-negative expression of the fission mediator dynamin-related protein 1
(Drp1), to study the effect on optic tectum reinnervation after RGC axonal injury.

Mitochondrial dynamics | 109
3 MATERIALS AND METHODS
3.1 ZEBRAFISH MAINTENANCE
Zebrafish (Danio rerio) were housed under standard laboratory conditions at 28°C on a
14h light/10h dark cycle. Fish were fed twice daily with a combination of dry food and brine
shrimp. All experiments were performed on equally sized, 5-month-old adult zebrafish of
either sex and were approved by the KU Leuven Animal Ethics Committee and executed in
strict accordance with the European Communities Council Directive of 20 October 2010
(2010/63/EU). The zebrafish used in this chapter are from the AB wild-type (WT) line or the
following transgenic lines: Tg(isl2b:mitoEGFP-2A-TagRFPCAAX) (visualisation of
mitochondria), sybu-/-;isl2b:TagRFP (deficient for syntabulin), Tg(isl2b:TagBFP-Drp1-pA) (Drp1
overexpression) and Tg(isl2b:TagBFP-dnDrp1(K38A)-pA) (dominant-negative Drp1
overexpression). The transgenic lines all have the WT background.
3.2 OPTIC NERVE CRUSH MODEL
To perform an ONC, zebrafish were anesthetized in a buffered 0.03% solution of tricaine
(MS-222, Sigma Aldrich) and put under a dissecting microscope (Leica) on moist tissue paper,
left side facing upward. After removal of the surrounding connective tissue, the eyeball was
lifted out of its orbit, thereby exposing the optic nerve and ophthalmic artery. Sterile forceps
were carefully placed around the left optic nerve, which was crushed for 10 s at 0.5 mm
distance of the optic nerve head, thereby avoiding damage to the ophthalmic artery. A
successful ONC was indicated by the appearance of a clear gap inside the translucent nerve
sheath. Fish were returned to system water in separate tanks to recover.
3.3. VISUALISATION OF THE MITOCHONDRIAL DISTRUBUTION IN THE
RETINOTECTAL SYSTEM OF MITOEGFP ZEBRAFISH SUBJECTED TO ONC
Mitochondrial distribution was quantified using Tg(isl2b:mitoEGFP-2A-TagRFPCAAX)
zebrafish, hereafter referred to as MitoEGFP fish. In these fish, two different proteins are
fluorescently labelled: (1) a mitochondrial targeting sequence of the zebrafish cytochrome c
oxidase subunit 8A (cox8a), by fusion to enhanced green fluorescent protein (EGFP), and (2) a
membrane localization motif (CAAX), via coupling to red fluorescent protein (RFP)2,25.
Consequently, mitochondria are labelled in green, while plasma membranes are visualised in
red. The expression of both proteins is under the control of the isl2b promotor, which is

110 | Chapter 4
important for RGC development and was previously used to drive RGC-specific expression in
zebrafish larvae2,26–29. Of note, the 2A motif triggers protein separation during translation via
a ribosomal-skip mechanism and thus allows expression of multiple proteins from a single
open reading frame30. These MitoEGFP zebrafish line was a generous gift from Dr. Tine Verreet
and Dr. Fabienne Poullain (University of South Carolina, United States)2.
First of all, the mitochondrial distribution was visualized using this reporter fish in the
retina (whole mounts and cryosections) and in the optic tectum (vibratome sections) at
baseline and numerous time points after injury (0, 1, 3, 6, 10, 14, 21 days post-injury (dpi)).
We also used total visual systems containing the eyes, optic nerves/chiasm/tracts and brains,
which is cumbersome but the only method to completely preserve the retinofugal fiber tracts.
Up till now we characterized mitochondrial distribution in the optic nerve/chiasm/tract using
these visual systems in naive animals or three days after injury. In general, fish were first
euthanized by submersion in buffered 0.1% tricaine and transcardially perfused with
phosphate buffered saline (PBS, 0.01M, pH 7.4) and 4% paraformaldehyde (PFA) in PBS. Eyes
and brains of adult fish were dissected at various days post-injury, or, in another set of fish,
total visual systems containing the eyes, optic nerves/chiasm/tracts and brains were
harvested. After dissection, the eyes and visual system tissues were fixed for 1h in 4% PFA in
PBS and submersed in 30% sucrose in PBS overnight. After embedding (1,25% agarose, 30%
sucrose in PBS) the visual systems and eyes were cut using a Cryostar NX70 cryostat (Thermo
Fisher Scientific, MA, USA) in 10 µm sagittal and horizontal sections, respectively. In addition
to the use of cryosections, the mitochondrial distribution in the retina was monitored using
whole mounts. For this, the retina was dissected from the fixated eye, and four cuts were used
to turn the cup-shaped retina into a flat tissue. Furthermore, the fixated brains were
embedded in 4% agarose and cut into 50 µm thick coronal sections with a Micron H650
vibratome (Thermo Fischer Scientific, MA, USA). In a last step, the retinal/visual system
cryosections, retinal whole mounts and vibratome brain sections were stained with 4’,6’-
diamono-2-phenylindole (DAPI) for 30’ at room temperature, to visualize nuclei, after which
images were taken with an Olympus FV1000 confocal microscope at 20x (visual system) or 60x
(retina and brain) magnification. For the retinal whole mounts, a z-stack picture was taken
through the retinal ganglion cell layer (RGCL) and IPL, whereafter separate projection images
were made for these two retinal layers. To analyze spatial/temporal differences in fluorescent

Mitochondrial dynamics | 111
signal intensity on sections in an unbiased way, intensities were always compared on at least
five central sections per animal, and at least four animals were used per condition.
3.4 QUANTIFICATION OF MITOCHONDRIAL DISTRUBUTION AND SIZE IN THE
RETINA OF MITOEGFP ZEBRAFISH SUBJECTED TO ONC
We further quantified the MitoEGFP+ area and mitochondrial sizes using a Python script,
in-house developed by PhD-student L. Masin. In brief, the percentage of MitoEGFP+ area and
the average mitochondrial size is determined throughout the inner retina (nerve fiber layer
(NFL), RGCL and IPL) and a profile of these data is plotted in function of the retinal
position/layer. A more detailed description is provided below:
Confocal image acquisition
First of all, high resolution z-stack images covering the NFL, RGCL and IPL were taken with an
Olympus FV1000 confocal microscope at 60x magnification with a dimension of 2048x2048
pixels and 50 nm pixel size, taken with 0.29 µm in between each confocal plane (Fig. 4.1A).
Per retinal whole mount, four of these z-stack images (one per retinal quadrant) were
obtained close to the optic nerve head.
Compensation for retinal skewness in z-direction
Before quantifying the percentage of MitoEGFP+ area or mitochondrial sizes in these pictures,
steps need to be taken in order to compensate for the skewness of the whole mount as, in
here, the retinal layers are never perfectly aligned in the z-direction. Therefore, the z-stack
pictures are divided into 16 cuboids in which the distortion of the retinal layers is less
pronounced. For simplification, only four cuboids are used for explanation/visualization of the
script (Fig. 4.1B). For every cuboid, the DAPI intensity is measured for each confocal plane,
and a single profile is made with the DAPI intensity in function of the position per retinal
cuboid, indicated in Fig. 4.1B by the four colours. In the profiles, two DAPI peaks are visible,
corresponding with the nuclei of the RGCL and INL, respectively. Using the DAPI intensity
profiles, a correction for the skewness of the retina can be made by aligning the DAPI peak of
the RGCL for the different retinal cuboids (Fig. 4.1B). The established coordinates are then
saved to be reused in the next steps.

112 | Chapter 4
MitoEGFP+ area and mitochondrial size measurements on a single confocal picture
Next, the script divides the green channel (MitoEGFP) in the same number of cuboids as the
blue channel (DAPI). Using automatic Otsu thresholding, the script defines an intensity
threshold to distinguish between mitochondria and background (Fig. 4.1C). Two parameters
can be measured per cuboid and in every confocal plane of the z-stack image: (1) the
percentage of MitoEGFP+ area, i.e. the surface with a GFP intensity above the defined
threshold, compared to the total surface, and (2) the average mitochondrial size. In Fig. 4.1C,
only the MitoEGFP+ area measurement is shown for simplification. Using the same
compensation coordinates obtained in the previous step (Fig. 4.1B), the MitoEGFP+ area and
mitochondrial size profiles throughout the retina can subsequently be aligned in order to
correct for retinal layer skewness. Hereafter, an average for the 16 cuboids is made by using
the 95% confidence interval, showing a single MitoEGFP+ area and mitochondrial size profile
for one z-stack image, representative for one retinal quadrant of a retinal whole mount.
Determination of MitoEGFP+ area and mitochondrial sizes per condition
To create a global overview of the two measured parameters per condition, the previous steps
are first repeated for the four z-stack images of one retinal whole mount, and by averaging
the data, one MitoGFP+ area or size profile is made per whole mount, representing the
mitochondrial distribution and size throughout the retina of one zebrafish. Per condition
(naive, 1, 3, 6, 10, 14, 21, or 42 dpi), we used 4-7 animals, and an average of all values per
condition is made by alignment of the RGCL DAPI peak and normalization of the retinal
thickness, based on the IPL thickness31. Normalization of the retinal thickness is necessary as
this parameter can slightly differ between animals due to biological variation, the whole
mount preparation procedure and injury-induced IPL thinning caused by dendritic shrinkage
(cfr. chapter 3).
Determination of MitoEGFP+ area and mitochondrial sizes per condition within the
various inner retinal (sub)layers
After creating the MitoEGFP+ area and average size profiles, we defined the different retinal
layers, based on the DAPI peaks, as well as on retinal whole mount staining for choline
acetyltransferase (Chat), the enzyme responsible for the biosynthesis of the neurotransmitter
acetylcholine. This Chat staining is often used in rodent retinal research to subdivide the broad
IPL in five different layers: two CHAT+ layers and three CHAT- layers (on top, in the middle and

Mitochondrial dynamics | 113
beneath the CHAT-positive layers)32–35. Thereto, we stained retinal whole mounts with anti-
Chat (1:250, Millipore), and performed visualization using an Alexa-647 conjugated secondary
antibody, which enabled us to define four IPL sublayers (S1-S4) in the adult zebrafish retina.
Lastly, to determine statistical differences, bar graphs were made from the profiles to
represent the MitoEGFP+ area for the different retinal (sub)layers, obtained by calculating the
area under the curve for the defined layer on the MitoEGFP+ area profile. The naive values per
retinal layer are set to 100%, and the other conditions are put relative to this reference value.
To obtain bar graphs for the average mitochondrial sizes, we did not use the area under the
curve, but averaged the mitochondrial sizes obtained throughout that layer.

114 | Chapter 4
Fig. 4.1 Overview of the steps necessary to quantify the MitoEGFP+ area and average mitochondrial size
throughout the inner retina, using an in-house developed Python script.
A Four confocal z-images were taken (one per retinal quadrant) covering the NFL, RGCL and IPL, in which the
confocal plane distance was set at 0.29 µm. B Next, the z-stack pictures were divided into cuboids, in which the
DAPI intensity was measured in every confocal plane. To compensate for the retinal skewness, the DAPI peak at
the level of the RGCL was used to align the profiles for every cuboid. Four cuboids are depicted for every z-stack
picture. C The MitoEGFP+ area is hereafter measured in the confocal planes of the cuboids by the use of an
automatic tresholding step. Lastly, the compensation factors obtained during the previous step is used to align
the MitoEGFP+ profiles of the cuboids, and by using the 95% confidence interval, one representative profile for
one retinal z-stack image is obtained. This is then combined with the other three images of one retina to obtain
one profile per zebrafish (not shown).
INL, inner nuclear layer; IPL, inner plexiform layer; MitoEGFP, mitochondrial targeting sequence fused to
enhanced GFP; NFL; nerve fiber layer; RGCL; retinal ganglion cell layer.

Mitochondrial dynamics | 115
3.5 IMMUNOFLUORESCENT STAININGS
In order to investigate mitochondrial dynamic processes after ONC, fluorescent stainings
using antibodies against proliferator-activated receptor gamma coactivator 1 α (Pgc-1α,
mitochondrial biogenesis), phosphorylated (serine 616) Drp1 (p-Drp1 (616), mitochondrial
fission) and optic atrophy 1 protein (Opa1, mitochondrial fusion) were performed on retinal
cryosections of WT zebrafish, harvested at baseline and 1, 3, 6, 10, 14 and 21 days post-ONC.
For this, sections were first made as previously described (section 3.3) and subsequently
immunostained using the primary mouse anti-Pgc-1α antibody (1:100, Santa Cruz), rabbit anti-
p-Drp1 (1:350, Cell signaling), or mouse anti-Opa1 (1:1000, BD Biosciences) and visualization
with Alexa-conjugated secondary antibodies (Dako). Finally, sections were stained for DAPI,
mounted and visualized with an Olympus FV1000 confocal microscope at 60x magnification.
To analyze spatial/temporal differences in fluorescent signal intensity on retinal sections in an
unbiased way, intensities were always compared on at least five central sections per animal,
and at least four animals were used per condition. Representative pictures were always taken
in the central retina.
3.6 WESTERN BLOTTING
In order to obtain a more quantitative measure of mitochondrial biogenesis, fission and
fusion after ONC, we performed western blotting (WB) for Pgc-1α, p-Drp1 (616) and Opa1, the
respective markers for these different processes36–38. For this, fish were sacrificed in buffered
0.1% tricaine, after which retinas were dissected at baseline (naive), 1, 3, 6, 10, 14 or 21 dpi
and homogenized in lysis buffer (10 mM Tris-HCl pH 8, 1% Triton X-100, 150 mM NaCl, 0.1%
SDS, 0.5% sodium deoxycholate, 0.2% sodium azide), supplemented with
protease/phosphatase inhibitors (Roche). Homogenates were loaded at 10 µg onto 4-12% Bis-
Tris gels (Biorad) and transferred onto a nitrocellulose membrane (Biorad). Overnight
incubation with mouse anti-Pgc-1α (1:1000, Santa Cruz), rabbit anti-p-Drp1 (1:1000, Cell
signaling), mouse anti-Drp1 (1:1000, BD Biosciences) or mouse anti-Opa1 (1:2000, BD
Biosciences) was followed by 45’ incubation with donkey anti-mouse or -rabbit HRP-
conjugated antibody (Dako). Protein bands were visualized using a luminol-based enhanced
chemiluminescent kit (Thermo Scientific) by means of an imaging system (Biorad, ChemiDoc
MP imaging system), and semi-quantitatively evaluated by densitometry (Image Lab 4.1,
Biorad). To reduce the risk for bias, protein bands were automatically detected and evaluated

116 | Chapter 4
by the software. Swift membrane total protein staining (G-Biosciences) of the nitrocellulose
membrane served as loading control and was used for normalization of protein values. Data
were plotted as a relative percentage and statistically compared to the baseline (naive)
condition, which was set as 100%.
3.7 RETINAL MTOR INHIBITION
To evaluate a possible role for mTOR in RGC mitochondrial dynamics upon optic nerve
damage, mTOR was inhibited in MitoEGFP zebrafish using intravitreal injections with 300 nl of
20 µM rapamycin (LC Laboratories) at 0 and 1 dpi using a micro-injector (UMP3, World
Precision Instruments). Fish were sacrificed at baseline, 1 and 3 dpi to analyze important
mitochondrial parameters in retinal whole mounts, all as described in 3.3. In brief, using an in-
house developed Python script, MitoEGFP+ area and average mitochondrial sizes were
quantified in the NFL, RGCL and IPL on high resolution confocal images.
3.8 TRACING AND QUANTIFICATION OF TECTAL (RE)INNERVATION IN
ZEBRAFISH WITH DISTURBED MITOCHONDRIAL DYNAMICS
To gain more insight into the role of mitochondrial dynamics for axonal repair in adult
zebrafish subjected to optic nerve damage, tectal (re)innervation was quantified at baseline
and at six days after ONC in three different zebrafish lines with altered mitochondrial
dynamics, and compared to WT animals. Thereto, we used sybu-/-; isl2b:TagRFP mutant fish
(sybu-/-, in short), lacking functional syntabulin (Sybu), due to deletion of 8 base pairs at exon
8 of the sybu gene, which encodes an adaptor molecule linking mitochondria with the
anterograde motor protein kinesin-1. In addition, TagRFP expression is driven by the isl2b
promotor, thus visualizing the RGCs in which this promotor is active. These animals were
kindly provided by Dr. M. Hibi (Nagoya University, Japan). We also investigated the role of
fission in axon regeneration by using Tg(isl2b:TagBFP-Drp1-pA) and Tg(isl2b:TagBFP-
dnDrp1(K38A)) zebrafish, in which fission is altered in RGCs due to is2b-driven overexpression
of Drp1 or expression of a dominant negative Drp1 protein, respectively. In the
Tg(isl2b:TagBFP-Drp1), or in short, Drp1-overexpression zebrafish, increased fission is
expected in RGCs, while in the Tg(isl2b:TagBFP-dnDrp1(K38A)-pA) line, or Dn-Drp1 zebrafish,
mitochondrial fission is reduced, because the expressed dominant negative (dn) Drp1 is not
capable of hydrolyzing guanosine triphosphate (GTP) due to a mutation transforming lysine to

Mitochondrial dynamics | 117
alanine. The transgenes were inserted in the zebrafish genome using the Tol2 transposon
system, and fish were used in heterozygous state, so only one copy of the insertion was
present. Of note, in the latter two lines, the Drp1 protein was fused to blue fluorescent protein
(BFP). These fish were generated by Dr. T. Verreet in the lab of Dr. F. Poullain (University of
South Carolina, United States) and kindly gifted to the host lab.
Axonal regrowth of these mutant fish was compared to that of WT fish at six days after
ONC, by means of retrograde biocytin tracing. In addition, also naive fish of all lines were
included, to detect possible differences in tectal innervation in baseline conditions. For this,
fish were anesthetized (0.03% tricaine), after which the optic nerve was transected between
the eye and the crush site and a piece of gelfoam soaked in biocytin (Sigma Aldrich) was placed
on the nerve stump. The eye was placed back and fish were revived. After 3h, when the tracer
was anterogradely transported to the optic tectum, fish were euthanized (0.1% tricaine) and
transcardially perfused with 4% PFA in PBS. Brains were then dissected and overnight fixated
(4% PFA). After rinsing, the brains were embedded and cut in 50 µm coronal sections. Biocytin
was visualized by means of a Vectastain ABC kit (Vector laboratories), using diaminobenzidine
as chromogen. Sections were dried on gelatin-coated slides and counterstained with neutral
red solution to allow for brain nuclei identification. Brain sections through the central optic
tecti were identified based on the presence of specific nuclei and histological photographs
were acquired with a microscope Zeiss imager Z1 at 10x magnification. Tectal (re)innervation
was quantified via an in-house developed Image J script, in which the biocytin-labeled area
was measured using manual thresholding. Next, axonal density was defined as the ratio of the
biocytin+ area to the area of reinnervation, being the stratum opticum (SO) and stratum
fibrosum et griseum superficiale (SFGS) of the optic tectum. Per fish, tectal innervation at
baseline was analyzed on at least five sections containing the central optic tectum, using 4-6
fish per condition, while we used 6-8 animals per zebrafish line to quantify tectal reinnervation
at 6 dpi. Of note, in all experiments, tectal innervation of naive WT fish was set as a 100%
reference value, and other values were put relative to this reference control.

118 | Chapter 4
3.9 STATISTICAL ANALYSIS
All data are represented as mean ± SEM, except for the mitochondrial area and average
size profiles, which are shown as mean ± 95% confidence intervals. The value of n represents
the number of animals used per condition. All statistical tests were performed using Graphpad
Prism 7.03. In all cases, raw data were tested for normal distribution using the Kolmogorov-
Smirnov normality test and variance between groups was checked via the Brown-Forsythe’s
test for equality of variances. To compare three or more independent groups, a one-way
Analysis Of Variance (ANOVA) was performed if the data showed a normal distribution and
variances between groups were homogeneous. To analyze differences in mitochondrial
distribution in the mTOR inhibition experiment, a two-way ANOVA was used as multiple
conditions (untreated, vehicle, rapamycin) and time points (1 and 3 dpi) were included. A
Dunnet or Tukey post-hoc test was performed. A p-value < 0.05 was considered statistically
significant.

Mitochondrial dynamics | 119
4 RESULTS
4.1 CHARACTERIZATION OF MITOCHONDRIAL DISTRIBUTION/SIZE IN THE
RETINOTECTAL SYSTEM OF MITOEGFP FISH SUBJECTED TO ONC
To gain insight in mitochondrial dynamics during spontaneous regeneration after optic
nerve damage in adult zebrafish, mitochondrial distribution and shape was studied in the
retina, optic nerve/tract and optic tectum using the MitoEGFP zebrafish line. In these reporter
fish, a mitochondrial targeting sequence fused to enhanced GFP is expressed under control of
the isl2b promotor, important for RGC development2,26–29.
4.1.1 Spatial differences in mitochondrial RGC labeling in the retina of
MitoEGFP zebrafish
A first unexpected finding observed at the start of this study was that mitochondrial RGC
labeling is not homogeneous throughout the naive adult retina, as not all RGCs seemed to
contain green fluorescent mitochondria. Indeed, as shown in the first panel of Fig. 4.2, GFP
fluorescence was mainly detected close to the optic nerve head, while it was almost absent in
the peripheral retinal areas. This is further confirmed by comparing the zoomed-in views of
both regions (Fig. 4.2) in which numerous cells were brightly labeled in the center of the retina,
while only a few vaguely fluorescent cells were visible in the retinal periphery. Due to this
labeling discrepancy in the different regions of the MitoEGFP retina, we decided to focus in
this chapter on characterizing mitochondrial distribution changes within the central retina
area only.
Fig. 4.2 Mitochondrial labeling differences in the naive retina of MitoEGFP zebrafish.
In the center of retinas harvested from naive adult MitoEGFP zebrafish, numerous RGCs were labeled with bright
fluorescent mitochondria. In the periphery, in contrast, only a few RGCs were detected that contain vaguely
green mitochondria. Scale bar panel 1 = 500 µm, scale bars panel 2-3 = 25 µm.
GFP, green fluorescent protein; MitoEGFP, mitochondrial targeting sequence fused to enhanced GFP; RGCs,
retinal ganglion cell.

120 | Chapter 4
4.1.2 Visualization of mitochondrial distribution in the retina of
MitoEGFP zebrafish subjected to ONC
To have a first overview of the mitochondrial distribution in the central retina after optic
nerve damage, sagittal cryosections were made of MitoEGFP eyes harvested at baseline or
various days post-ONC (1, 3, 6, 10, 14 and 21 dpi). Representative images are shown in Fig.
4.3. As mitochondrial distribution will be quantified in detail further in this chapter (4.1.3),
only the general and obvious findings will be discussed here. In naive conditions, GFP+
mitochondria were visible in the NFL, in RGC somas, and in the total region of the IPL. In the
somas of naive RGCs, mitochondria were often located more to the side of the IPL, than to the
NFL. One day after optic nerve injury, a small increase in MitoEGFP+ mitochondria could be
observed in the IPL, while two days later the number of mitochondria in the IPL was reduced,
and reached minimal levels at 6 dpi. Strikingly, at the latter time points, mitochondrial
clustering in the inner IPL close to the RGCL was occasionally observed in lines, and these
MitoEGFP+ stripes seemingly sprout from the RGCs, possibly visualizing their primary
dendrites. Ten days after ONC, the number of mitochondria in the IPL remained low, although
a notable increase was detected in the outer IPL, adjacent to the INL. At 14 dpi, more
mitochondria were visible in the complete IPL, and the basal situation was more or less re-
approached three weeks after injury (Fig. 4.3).

Mitochondrial dynamics | 121
Fig. 4.4 shows a detailed representative image of the mitochondrial clustering
arrangement observed at 3 and 6 dpi, here inside a retina harvested three days post-ONC,
together with the RFP tag, which labels all RGC membranes, and thus also dendrites. A clear
correlation between the GFP+ mitochondria and the red membrane tag was visible, hinting
that these mitochondria redistribute from random IPL positions towards the primary dendrite
after ONC.
Fig. 4.4 A zoomed-in representative image of mitochondrial clustering in the IPL of MitoEGFP zebrafish,
together with the membrane tag, three days after ONC.
The association between GFP+ mitochondria (panel A) and the red plasma membrane tag (panel B), likely labeling
the primary dendrite, is obvious (panel C), and clearly suggests that these mitochondria redistribute from random
in the IPL towards the RGC primary dendrite.
GFP, green fluorescent protein; IPL, inner plexiform layer; MitoEGFP, mitochondrial targeting sequence fused to
enhanced GFP; RGCL, retina ganglion cell layer; RFP, red fluorescent protein.
< Fig. 4.3 Retinal mitochondrial distribution visualized using cryosections of MitoEGFP eyes, harvested at
baseline or after optic nerve damage.
First of all, GFP+ mitochondria were present in the NFL, in the RGCL, often close to the IPL, and in the complete
IPL. One day after performing the ONC, more mitochondria appeared in the retina of MitoEGFP zebrafish. Later
on, a reduction of energy-producing organelles was visible in the IPL, between 3-6 dpi, as well as mitochondrial
line-clustering in the inner IPL close to the RGCL, possibly labeling clustered mitochondria in their primary
dendrites (indicated by white arrows). An increase of mitochondria was visible at 10 dpi, specifically in a region
adjacent to the INL, while this restoration of mitochondrial levels was visible throughout the complete plexiform
layer at later time points. Three weeks post-injury, the mitochondrial distribution was roughly similar to the naive
condition. Scale bar = 25 µm.
Dpi, days post-injury; GFP, green fluorescent protein; MitoEGFP, mitochondrial targeting sequence fused to
enhanced GFP; INL, inner nuclear layer; IPL, inner plexiform layer; NFL, nerve fiber layer; RGCL, retinal ganglion
cell layer.

122 | Chapter 4
Next, mitochondrial distribution was also visualized using retinal whole mounts, harvested at the same time points after injury (Fig. 4.5). In
the RGCL, a strong increase in mitochondria was observed at 3 dpi, as well as a more scattered pattern of mitochondrial distribution, compared
to naive. This spread-out mitochondrial arrangement remained detected in the RGCL until ±14 dpi, while the mitochondrial numbers in this layer
decreased during this time period. Three weeks after injury, the mitochondrial pattern in the RGCL was comparable to that of naive MitoEGFP
retinas (Fig. 4.5). Similar as in Fig. 4.3, slightly more mitochondria were visible at 1 dpi in the IPL, which was followed by decreased mitochondrial
numbers from 3-10 dpi. Thereafter, mitochondrial levels were restored in the IPL and reached baseline levels (Fig. 4.5). Together these data show
a transient in-decrease of mitochondria in, respectively, the RGCL and IPL after optic nerve injury in adult zebrafish.
Fig. 4.5 Mitochondrial distribution in the RGCL and IPL visualized using MitoEGFP retinal whole mounts, harvested at baseline or after optic nerve damage.
First of all, three days after optic nerve damage a rise of MitoEGFP+ mitochondria was detected in the RGCL (upper panels), which appeared more in a scattered pattern. Both
the increase and the spread-out distribution of mitochondria was resolved in the following days, resulting in similar distribution and number of the energy-producing
organelles three weeks post-ONC. In the IPL, in contrast, the number of GFP+ mitochondria slightly increased one day after injury, followed by a decrease from 3 dpi onwards,
which resulted in minimal mitochondrial levels at 6-10 dpi. Hereafter, mitochondrial numbers returned to baseline levels. Scale bar = 25 µm.
Dpi, days post-injury; GFP, green fluorescent protein; MitoEGFP, mitochondrial targeting sequence fused to enhanced GFP; IPL, inner plexiform layer; NFL, nerve fiber layer;
RGCL, retinal ganglion cell layer.

Mitochondrial dynamics | 123
4.1.3 Quantification of mitochondrial distribution and sizes in the retina
of MitoEGFP zebrafish via an in-house developed Python script
To further strengthen our results concerning mitochondrial distribution in the inner
retina in adult zebrafish after ONC, we quantified the MitoEGFP+ area and average
mitochondrial size at different time points after ONC using an in-house developed Python
script. First, we divided the inner retina in strict layers, based on the DAPI intensity and the
Chat+ area profile detected in retinal whole mounts (Fig. 4.6). First of all, we were able to
distinguish two DAPI peaks (of which the INL peak is only partly shown in the figure) and with
this, the NFL, RGCL and IPL were determined. The IPL was further divided using the Chat
staining into two Chat+ regions, each consisting of multiple Chat-bands, and two Chat- regions
(above each of the two Chat+ regions), thereby partitioning the IPL in four regions, which we
named sublamina 1 to 4 (S1-S4) (Fig. 4.6).
Fig. 4.6 illustrates, in addition to DAPI and Chat, also the MitoEGFP+ area throughout the
inner retina quantified for the naive condition. Importantly, here it can be noticed that the
mitochondria in the RGCL show a bias towards a localization close to the IPL as the majority
of the perinuclear mitochondria were observed underneath the responding DAPI nucleus.
Fig. 4.6 Overview of retinal layer separation, based on the DAPI intensity and Chat+ fluorescent area profiles.
To distinguish different layers in the retina of MitoEGFP zebrafish, the DAPI intensity and Chat+ area profiles were
used. The DAPI peaks representing the nuclei in the RGCL and INL, as well as the two Chat+ regions in the IPL were
used to define, in total, six inner retinal (sub)layers. More specifically, besides the NFL and RCGL, we identified
four IPL regions, two with and two without Chat+ staining, which were named S1-S4. Interestingly, this figure also
shows that the majority of the mitochondria in the RGC soma are located towards the IPL. Scale bar = 25 µm.
Chat, choline acetyltransferase; green fluorescent protein; MitoEGFP, mitochondrial targeting sequence fused to
enhanced GFP; IPL, inner plexiform layer; NFL, nerve fiber layer; RGCL, retinal ganglion cell layer.

124 | Chapter 4
After defining the different inner retinal layers, we quantified the MitoEGFP+ area profile
throughout the NFL, RGCL, and IPL sublaminae of retinas harvested at different time points
after ONC injury (Fig. 4.7). To reduce complexity, and because the results for the IPL
sublaminae S2, S3 and S4 were found to be quite similar, as shown in the profiles and graphs,
we decided to combine the results for these IPL sublayers, as depicted in the last panel of Fig.
4.7 (IPL S2-S4). In these S2-S4 IPL strata, a small increase in MitoEGFP+ area was detected one
day after injury (not significant, but comparable with the data of Fig. 4.3 and 4.5), after which
the mitochondrial positive area drastically declined, to reach minimal levels at 6 and 10 dpi.
Two weeks after injury, the percentage of GFP positive labeling was marginally raised, and re-
approached baseline levels from three weeks onwards. Of note, in IPL sublamina S4, the
increase in MitoEGFP+ area was already detected from 10 dpi onwards, which matches with
the presence of numerous mitochondria close to the INL in Fig. 4.3. Next, in the IPL sublamina
S1, a transient enlargement of MitoEGFP+ surface was clearly detected at 3 and 6 dpi (Fig. 4.7),
plausibly due to the mitochondrial clustering in the primary dendrites observed at these time
points (Fig. 4.4). Furthermore, more mitochondrial mass was present in the RGCL three days
after injury, whereafter baselines levels were restored. Lastly, in the NFL, the variation of the
measurements within conditions was substantially larger than in the other layers, and
therefore the ANOVA analysis did not reveal significant results (Fig. 4.7). Thus, no strong
conclusions can be drawn concerning the temporal mitochondrial distribution within the NFL.
In addition to the MitoEGFP+ area, the average mitochondrial size was measured across
the inner retina in function of time after injury (Fig. 4.8). Again, similar trends were observed
in outer IPL (S2-S4), so we combined these results in one graph. In general, a transient increase
in average mitochondrial size was detected at 3 and 6 dpi in both the S1 and the combined
S2-S4 sublaminae of the IPL (IPL S1-S4). Likewise in the RGCL, a transient enlargement of
mitochondria was observed three days after optic nerve damage. Again, the measurements
in the nerve fibers were too variable to draw any firm conclusions (Fig. 4.8).
All in all, these data indicate that ONC in adult zebrafish triggers a transient in- or
decrease of mitochondrial area in the RGCL and IPL, respectively, as well as short-term
enlargement of the average mitochondrial size early after injury in these two layers.

Mitochondrial dynamics | 125
Fig. 4.7 Inner retinal MitoEGFP+ area profile measured using an in-house developed Python script, combined with bar graphs representing the results per retinal layer.
In the IPL sublaminae S2-S4, the % of mitochondrial area decreased after injury and reached minimal levels around 6-10 dpi. An increase in mitochondria was observed at 10
dpi (S4) or 14 dpi (S2-3) and baseline mitochondrial levels were re-reached from three weeks onwards. In the most inner IPL region (S1), a transient raise of MitoEGFP+ area
was observed three and six days post-ONC. A similar effect was detected in the RGCL, although only at 3 dpi. Due to the large variances between measurements in the NFL
within one time point, it was not possible to draw conclusions concerning mitochondrial area after ONC in this layer. Data represent mean ± 95% confidence intervals. N = 5-
7, except 10 dpi (N = 4), One-way ANOVA with Tukey post-hoc test, values marked with different letters differ significantly with a p-value < 0.05.
Dpi, days post-injury; green fluorescent protein; MitoEGFP, mitochondrial targeting sequence fused to enhanced GFP; IPL, inner plexiform layer; NFL, nerve fiber layer; ONC,
optic nerve crush; RGCL, retinal ganglion cell layer.

126 | Chapter 4
Fig. 4.8 Inner retinal average mitochondrial size profile measured using an in-house developed Python script, combined with bar graphs representing the results per layer.
In both sublamina S1 and sublaminae S2-S4 of the IPL, a general increase in average mitochondrial size was observed at 3 and 6 days post-ONC, which was hereafter resolved.
Three days after optic nerve damage, mitochondria appeared larger in the RGCL, as well. Again, the measurements within the NFL were too variable to give trustable results.
Data represent mean ± 95% confidence intervals. N = 5-7, except 10 dpi (N = 4), One-way ANOVA with Tukey post-hoc test, values marked with different letters differ
significantly with a p-value < 0.05.
Dpi, days post-injury; green fluorescent protein; MitoEGFP, mitochondrial targeting sequence fused to enhanced GFP; IPL, inner plexiform layer; NFL, nerve fiber layer; ONC,
optic nerve crush; RGCL, retinal ganglion cell layer.

Mitochondrial dynamics | 127
4.1.4 Visualization of mitochondrial distribution in the optic
nerve/tracts of MitoEGFP zebrafish subjected to ONC
The mitochondrial distribution/morphology was also investigated in the optic nerve,
optic chiasm and optic tract, although not into much detail yet. Some preliminary findings are
shown in Fig. 4.9, in which parts of visual system cryosections of naive MitoEGFP zebrafish and
fish at three days after ONC are depicted. The two general mitochondrial distribution patterns
observed in both naive and injured optic nerves are visualized in the panels A’ and A’’: GFP+
mitochondria spread over the entire optic nerve (A’), or a strong concentration of
mitochondria in one bundle, which was observed in some sections of each fish (A’’). A specific
finding detected in about half of the crushed optic nerves at three days after ONC, but never
in naive optic nerves, was a strong clustering of mitochondria near the optic nerve head
(depicted with the white arrow in panel B). Panel C’’ reveals the optic chiasm of a crushed
zebrafish at 3 dpi (panel C’ indicates image localization and crush site), but here no obvious
differences were observed between the uninjured fibers (right optic nerve, left optic tract) or
the crushed fibers (left optic nerve, right optic tract). To conclude, these preliminary data did
not reveal major differences between mitochondrial distribution in the nerve fibers in naive
or crushed zebrafish, except for mitochondrial clustering near the optic nerve head after
injury.

128 | Chapter 4
4.1.5 Visualization of mitochondrial distribution in the optic tectum of
MitoEGFP zebrafish subjected to ONC
Lastly, the mitochondrial distribution in the optic tectum was characterized after optic
nerve injury in MitoEGFP zebrafish using coronal vibratome sections of the brain. Panel A of
Fig. 4.10 discloses the MitoEGFP reporter signal in a central part of the optic tectum, together
with the RFP+ membrane tag (CAAX membrane motif), which labels RGC axons and can
therefore be used to link mitochondrial distribution with RGC axonal de- and regeneration. As
these signals are only visible in the SFGS and SO, i.e. the main RGC innervation area of the
optic tectum, only these areas are depicted in panel B of Fig. 4.10. In baseline levels, MitoEGFP
was clearly located inside the RFP+ axons, and one day after optic nerve damage, this remained
unchanged. However, three days post-ONC, the mitochondrial signal was drastically
decreased, as well as the RFP fluorescence, plausibly indicating axonal degeneration. Both
MitoEGFP and TagRFPCAAX were found to slightly re-appear at 6 dpi, and fully restored to
baseline levels from 10 dpi on, known to be the time point when axon reinnervation is
completed (cfr. chapter 3). To sum up, while axonal degeneration goes hand in hand with the
removal of mitochondria in the innervation area, axonal reinnervation is strongly linked with
the return of these energy-producing organelles.
< Fig. 4.9 Representative visual system sections show preliminary observations concerning mitochondrial
distribution in the optic nerve, chiasm and optic tract of naive and crushed MitoEGFP zebrafish at 3 dpi.
A’ and A” In general, fluorescent mitochondria were found to be distributed all over the uninjured or injured
optic nerves (A’), but within every fish, some sections showed significantly more GFP labeling in one optic nerve
bundle (panel A’’). B In the damaged optic nerve of zebrafish at 3 dpi, mitochondria were occasionally found to
be concentrated near the optic nerve head. C’ and C” At the optic chiasm, of which the localization together with
the crush site (white arrow) is depicted in C’, mitochondrial distribution was similar in both naive or injured nerve
fibers, as shown in C’’. Scale bar = 200 µm.
Dpi, days post-injury; GFP, green fluorescent protein; MitoEGFP, mitochondrial targeting sequence fused to
enhanced GFP; ON, optic nerve; Otr, optic tract.

Mitochondrial dynamics | 129
Fig. 4.10 Representative pictures of tectal sections of MitoEGFP zebrafish harvested at baseline or at various
time points after ONC injury.
A MitoEGFP mitochondria were present in the RGC axons, which were visualized in red using the membrane tag
and were located in the SO and SFGS of the zebrafish optic tectum. B While one day after ONC the bright overlap
of labeled mitochondria and axons was still present in the optic tectum, similar as to the naive situation, both
fluorescent signals were almost absent at 3 dpi. The GFP-labeled mitochondria re-appeared to some extent at 6
dpi, together with the axons, and baseline axonal/mitochondrial levels were restored from 10 dpi onwards. Scale
bar = 25 µm.
Dpi, days post-injury; GFP, green fluorescent protein; MitoEGFP, mitochondrial targeting sequence fused to
enhanced GFP; ONC, optic nerve crush; RFP, red fluorescent protein; SGC, stratum griseum centrale; SFGS,
stratum fibrosum et griseum superficiale; SO, stratum opticum; S/S, zone between album centrale (SAC) and
stratum periventriculare (SPV); TagRFP, membrane tag fused to RFP.

130 | Chapter 4
4.2 CHARACTERIZATION OF MITOCHONDRIAL DYNAMICS IN THE RETINA
AFTER ONC
4.2.1 Characterization of mitochondrial biogenesis in the retina after
ONC
Besides characterizing the mitochondrial distribution/morphology using the MitoEGFP
zebrafish line, we also started to look into mitochondrial dynamic processes, including
biogenesis, fission and fusion. Mitochondrial biogenesis was evaluated using immunostainings
for Pgc-1α, a key regulator and well-known marker of this process, on retinal cryosections of
WT zebrafish at different time points after ONC. In retinas of naive fish some RGCs were found
positive for Pgc-1α, while increased mitochondrial biogenesis could be clearly detected at two
defined time points post-injury, namely at 1 dpi and at 6-10 dpi (Fig. 4.11A). A similar trend
and thus a biphasic upregulation of Pgc-1α at 1 and 6-10 dpi was detected using WB on whole
retinal samples, although only Pgc-1α protein levels at 10 dpi were significantly different from
the naive value (Fig. 4.11B).
4.2.2 Characterization of mitochondrial fission in the retina after ONC
To study mitochondrial fission, we performed an immunostaining for p-Drp1 (Ser616), a
widely used pro-fission marker, and this revealed a strong increase of p-Drp1-positivity in RGC
somata at 3-10 dpi, peaking six days after optic nerve damage. Hereafter, p-Drp1
immunoreactivity re-approached baseline levels again (Fig. 4.12A). Using WB for p-Drp1
(Ser616), however, only a general trend of marginally elevated expression after ONC could be
detected, which was not significant (Fig. 4.12B). An additional WB quantification which is often
performed when studying phosphorylated proteins, is determining the ratio of
phosphorylated to total protein expression, and using this method a significant increase of the
ratio of p-Drp1 (Ser616)/total Drp1 was observed at one day after optic nerve injury. The total
Drp1 protein expression did not alter significantly (Fig. 4.12B).

Mitochondrial dynamics | 131
Fig. 4.11 Characterization of mitochondrial biogenesis in the
retina using an immunofluorescent staining and WB for Pgc-1α.
A Representative images of retinal cryosections at various time
points after ONC stained for Pgc-1α, show more cells labeled with
the biogenesis marker one day post optic nerve damage, as well as
at 6-10 dpi. Scale bar = 25 µm. B WB for Pgc-1α (90 kDa) using
retinal lysates, showed a similar trend for this biphasic upregulation
at 1 and 6-10 dpi. Data represent mean ± SEM. N = 5-7. One-Way
ANOVA, Dunnet post-hoc test, * p < 0.05.
Dpi, days post-injury; IPL, inner plexiform layer; NFL, nerve fiber
layer; ONC, optic nerve crush; RGCL, retinal ganglion cell layer; Pgc-
1α, proliferator-activated receptor gamma co-activator 1; WB,
western blotting.

132 | Chapter 4
Fig. 4.12 Characterization of mitochondrial fission in the
retina using an immunofluorescent staining and WB for
p-Drp1 (Ser616).
A Representative images of retinal cryosections at various
time points after ONC immunostained for p-Drp1 (Ser616),
show only faint fluorescence in the RGCL cells of naive
retinas. However, a strong increase was detected between
3-10 dpi, with maximal p-Drp1 staining at six days post-
ONC. Three weeks after injury, p-Drp1 seemingly returned
to baseline levels. Scale bar = 25 µm. B WB for p-Drp1
showed no significant difference in the expression after
ONC, although a slight trend for a raised p-Drp1 expression
was visible. The ratio of p-Drp1/total Drp1 was
significantly upregulated at 1 dpi. No significant
differences for total Drp1 were detected. Data represent
mean ± SEM. N = 4-5. One-Way ANOVA, Dunnet post-hoc
test, *** p < 0.001.
Dpi, days post-injury; IPL, inner plexiform layer; NFL, nerve
fiber layer; ONC, optic nerve crush; Drp1, dynamin-related
protein 1.
Mitochondrial dynamics | 133
4.4.2 Characterization of mitochondrial fusion in the retina after ONC
Next, Opa1 was used as fusion marker, but a staining for this protein did not reveal major
spatiotemporal changes in the retina of adult zebrafish after ONC. Indeed, a similar
distribution and expression after ONC as compared to the naive condition was observed,
although a marginal increase in positivity for Opa1 in the IPL and RGC somata was visible from
1-10 dpi. In addition, occasional dendrite-like patterns in the IPL, close to the RGCL, were seen,
mainly between 6 and 14 dpi (Fig. 4.13A). WB for this fusion marker on retinal lysates did also
not indicate significant differences over time, although a similar trend of increased expression
was seen from 3-10 dpi (Fig. 4.13B). From these data, no firm conclusions can be drawn but
they suggest that mitochondrial fusion is not massively induced after optic nerve damage in
the retina of adult zebrafish.
All in all, we observed in adult zebrafish subjected ONC that (1) mitochondrial biogenesis
is upregulated in two phases (1 and 6-10 dpi), that (2) fission is enhanced from ±1-10 dpi and
that (3) mitochondrial fusion is not substantially induced.

134 | Chapter 4
Fig. 4.13 Characterization of mitochondrial fusion in the retina using an immunofluorescent
staining and WB for Opa1.
A Representative images of retinal cryosections at various time points after ONC stained for
Opa1, do not show major differences. However, a marginal increase in Opa1-fluorescence
was observed in the IPL from 1-10 dpi, as well as sporadic stripe like patterns close to the
RGCL (arrows). Scale bar = 25 µm. B WB for Opa1 did not reveal significant differences. Data
represent mean ± SEM. N = 4-5. One-Way ANOVA.
Dpi, days post-injury; INL; inner plexiform layer; IPL, inner plexiform layer; NFL, nerve fiber
layer; ONC, optic nerve crush; Opa1, optic atrophy 1.

Mitochondrial dynamics | 135
4.3 MITOCHONDRIAL DISTRUBUTION AND AVERAGE SIZE IN MITOEGFP
ZEBRAFISH AFTER MTOR INHIBITON
In chapter 3 of this thesis, retinal mTOR inhibition using rapamycin injections was shown
to inhibit dendritic shrinkage and subsequently delay axonal regeneration. To investigate if
this effect is linked to disturbed injury-induced mitochondrial redistribution/reshaping, the
MitoEGFP+ area and mitochondrial sizes were calculated using the Python script in untreated,
vehicle-treated or mTOR-inhibited MitoEGFP zebrafish at 1 and 3 dpi. As these are preliminary
data, with only three fish per condition, and no detected significant differences, we only show
the MitoEGFP+ area and average mitochondrial size profiles, and no bar graphs. Moreover, all
profiles at the 1 dpi time point were found similar (untreated, vehicle and rapamycin), so we
will only discuss and show the 3 dpi data. The most important trend at this time point can be
observed in the first panel of Fig. 4.14, where, as expected, the MitoEGFP+ area is enlarged in
the RGCL and IPL S1 in the two control conditions (Fig. 4.7A), but this increase was much less
pronounced after mTOR inhibition. In addition, the rise in average mitochondrial size (panel
B) in the RGCL and IPL S1 after injury was lower in the rapamycin condition, as compared to
the two control groups. These preliminary data thus suggest that mTOR inhibition could have
an effect on the spontaneous mitochondrial dynamics occurring in the adult zebrafish retina
after ONC.

136 | Chapter 4
Fig. 4.14 MitoEGFP+ area and average mitochondrial size profiles quantified using a Python script in naive or
untreated, vehicle-treated or mTOR-inhibited retinas, harvested three days after ONC.
A In the RGCL and IPL S1, a trend could be observed towards a more substantial injury-induced increase of the
MitoEGFP+ area in untreated or vehicle-treated retinas (see also Fig. 4.7) as compared to rapamycin-treated fish
at 3 dpi. B The enlargement of mitochondria observed after injury in the control conditions was again less
pronounced after mTOR inhibition. Data represent mean ± 95% confidence intervals. N = 3.
Dpi, days post-injury; GFP, green fluorescent protein; INL; inner nuclear layer; IPL; inner plexiform layer;
MitoEGFP, mitochondrial targeting sequence fused to enhanced GFP; NFL; nerve fiber layer; optic nerve crush;
Rap, rapamycin; RGCL, retinal ganglion cell layer.

Mitochondrial dynamics | 137
4.4 OPTIC TECTUM (RE)INNERVATION IN ZEBRAFISH WITH DISTURBED
MITOCHONDRIAL DYNAMICS
4.4.1 Optic tectum (re)innervation in sybu-/- mutant zebrafish
To gain further insight into the role of mitochondrial transport and fission in CNS
regeneration, retrograde biocytin tracing was used to quantify axon regrowth after ONC in
three different mutant zebrafish lines with disturbed mitochondrial dynamics and compared
with that of WT fish. First of all, we used sybu-/- mutants, that lack functional syntabulin, a
linker between mitochondria and the anterograde transport transporter kinesin-1. Both
baseline tectal innervation in naive fish and tectal reinnervation in crushed zebrafish at 6 dpi,
was quantified and compared to values in WT fish (Fig. 4.15). Tectal innervation in baseline
levels was similar in the sybu-/- mutants and WT fish, as was axonal regrowth after injury. Thus,
our data indicate that syntabulin deficiency does not affect axon (re)innervation.
Fig. 4.15 Quantification of tectal (re)innervation in
WT zebrafish and sybu-/- mutants at baseline levels
and six days post-ONC.
Representative images and semi-quantitative
analysis of the area covered by RGC axons did not
reveal a significant difference in baseline tectal
innervation or axon growth after optic nerve
damage between syntabulin mutants or WT
zebrafish. Scale bar = 200 µm. Data represent mean
± SEM. N (naive) = 4-6, N (6 dpi) = 7-8. Two-Way
ANOVA.
Dpi, days post-injury; ONC, optic nerve crush; Sybu,
syntabulin; WT, wild type.

138 | Chapter 4
4.4.2 Optic tectum (re)innervation in Drp1-overexpression zebrafish
Next, we used Drp1-overexpression zebrafish, in which mitochondrial fission is likely
enhanced. Naive tectal innervation was found similar in the WT and Drp-1 overexpression
zebrafish line (Fig. 4.16). In contrast and to our surprise, a significant reduction in axonal
regrowth was detected in the Drp1-overexpression group, as compared to WT fish at six days
after ONC, hinting that enhanced mitochondrial fission is detrimental for axon repair (Fig.
4.16).
Fig. 4.16 Quantification of tectal (re)innervation in WT
and Drp1-overexpression zebrafish at baseline levels and
six days post-ONC.
Representative images and semi-quantitative analysis of
the area covered by RGC axons show, first of all, no
difference between the two zebrafish lines. Six days after
optic nerve damage, however, tectal reinnervation was
significantly reduced in the Drp1-overexpression
condition, compared to the control group (WT fish). Scale
bar = 200 µm. Data represent mean ± SEM. N = 4-5, Two-
Way ANOVA, *** p < 0.001.
Dpi, days post-injury; Drp1, dynamin-related protein 1;
ONC, optic nerve crush; WT, wild type.

Mitochondrial dynamics | 139
4.4.3 Optic tectum (re)innervation in dominant-negative-Drp1
zebrafish
In contrast to Drp1-overexpression zebrafish, mitochondrial fission is (partly) blocked in
Dn-Drp1-zebrafish, due to the presence of dominant-negative Drp1 proteins. Again, the area
covered by RGC axons in naive WT and Dn-Drp1 zebrafish was similar, but here, strikingly,
tectal reinnervation was increased in the dominant-negative animals, as compared to WT fish
(Fig. 4.17). This finding again suggests that enhanced fission inhibits axon regrowth, and is in
line with the previous result obtained with the Drp1-overexpression zebrafish.
To conclude, syntabulin deficiency did not affect axonal regeneration after ONC, while
expression of WT Drp-1 or a dominant-negative Drp1, respectively diminished and enhanced
CNS axon repair.
Fig. 4.17 Quantification of tectal (re)innervation in WT
and Dn-Drp1 zebrafish at baseline levels and six days
post-ONC.
Representative images and semi-quantitative analysis of
the area covered by RGC axons showed no difference in
naive tectal innervation between the two zebrafish lines.
Six days after optic nerve damage, the tectal
reinnervated area in the Dn-Drp1 zebrafish was more,
compared to that of WT zebrafish. Scale bar = 200 µm.
Data represent mean ± SEM. N (naive) = 4-6, N (6 dpi) =
6-8. Two-Way ANOVA, * p < 0.05.
Dn, dominant-negative; Dpi, days post-injury; Drp1,
dynamin-related protein 1; ONC, optic nerve crush; WT,
wild type.

140 | Chapter 4
5 DISCUSSION
Axonal regrowth after injury requires enormous amounts of ATP to enable growth cone
formation and actin dynamics underlying growth cone motility39–44. Unfortunately, axonal
injury triggers mitochondrial depolarization at the damaged site, so the resident pool of
mitochondria is incapable of inducing axon repair5,45,46. Enhanced axonal mitochondrial
transport has been increasingly linked with more efficient axonal regeneration, and this
highlights the importance of providing healthy mitochondria to the axonal stump after
injury6,7,8,5. In addition, different mitochondrial dynamic processes could aid in the local
production/delivery of these energy-producing organelles21,47–49. Thus, a combination of
mitochondrial transport/dynamics is likely essential for successful axon regrowth after injury,
and as zebrafish are true neuroregeneration wonders, they form the ideal model organism to
decipher these complex mitochondrial transport/dynamics interactions during spontaneous
axonal regeneration.
In a first attempt to investigate if mitochondrial transport is necessary to induce axonal
regeneration, we used sybu-/- zebrafish, lacking functional syntabulin, a linker protein between
mitochondria and the anterograde transporter kinesin-1. After ONC, these fish showed normal
levels of tectal reinnervation, compared to wild-type animals (Fig. 4.15). If our hypothesis that
mitochondria need to move anterogradely to boost axonal regeneration holds true, these data
indicate that syntabulin is not the major linker protein mediating this transport. Indeed, other
mitochondrial linker proteins important for anterograde transport are known to exist,
including the Miro/Trak complex50, which could compensate for the syntabulin loss, or form
the most prominently used linker complex in the zebrafish retinotectal system in general.
Further research is needed to elucidate the functional distribution of syntabulin and other
mitochondrial linker proteins in anterograde transport of mitochondria in the adult zebrafish.
Next, we also detected enhanced fission early after ONC in RGC somata using the p-Drp
(Ser616) fission marker in both immunostainings and WB, suggesting that fission-dependent
mitochondrial downsizing could play a role in axonal regeneration. To test this possibility, we
used zebrafish in which Drp1 is overexpressed or that contain a dominant-negative form of
this fission protein, and showed, respectively, decreased and increased tectal reinnervation at
six days after ONC, as compared to WT fish (Fig. 4.16-17). Although the role of fission in neurite
outgrowth during development or after injury remains controversial, (see chapter 2), these

Mitochondrial dynamics | 141
results were unexpected for several reasons. First of all, we showed that in the spontaneously
regenerating zebrafish, fission is naturally increased in the RGCs from 1-10 days after ONC,
data that hint that this process is beneficial for axonal regrowth. Moreover, it is known that
fission can increase mitochondrial motility49,51, which could aid in the transport of
mitochondria from the somato-dendritic compartment. In mouse cortical neurons and
rat/ground squirrel hippocampal neurons, it is has been additionally shown that mitochondria
are long and interconnected in the dendrites and short in the axons, and if this is also the case
in RGCs, mitochondrial fission could definitely be of aid to improve dendritic mitochondrial
transport31,52. Furthermore, Lewis et al. (2018) focused on the role of fission in axonal entry
by studying the role of Mitochondrial fission factor (MFF), which is a receptor for Drp1 present
on the outer mitochondrial membrane31. Knockdown of this protein in vivo or in vitro in
cortical mouse neurons resulted in increased mitochondrial lengths in the axon. Moreover, in
the cultured MFF-deficient neurons, the number of mitochondria entering the axon from the
cell body per hour was found to be drastically reduced with 50%, indicating that fission has a
beneficial effect for translocating mitochondria from the cell body to the axon. In addition,
these data suggest that the axonal mitochondrial length is regulated before entry, possibly
based on a size-dependent filter, which was already described in cultured rat hippocampal
neurons. Indeed, Song et al. (2009) showed the existence of such a selective size filter based
on the actin cytoskeleton at the axon initial segment (AIS), i.e. the 20-60 µm long domain
located at the proximal axon/soma interface where axon potentials are initiated53. It is thus
likely that fission is necessary to reduce the mitochondrial size in order to pass this filter at the
proximal soma/axon interface and to obtain an axonal pool of healthy mitochondria to induce
axon repair after injury. As the proposed function of the AIS is intriguing, but unstudied in the
CZS of adult zebrafish, we aim to investigate whether the AIS, which can be immunostained
by the marker ankyrin-G, is also present in the zebrafish retinotectal system, as well as the
correlation with mitochondrial size. A last beneficial effect of fission is that it can aid in the
removal of depolarized/dysfunctional mitochondria as a preparatory step for mitophagy and
to re-use in the production of more efficient energy-producing mitochondria.
Besides these beneficial roles of mitochondrial fission, several studies stated the
opposite, which could underlie our findings that fission actually hampers axonal regrowth in
adult zebrafish after ONC. Different studies indeed reported that fission is an important factor

142 | Chapter 4
in stress-induced apoptosis as pharmacological or genetic gain- or loss of Drp1 function
approaches led to the respective in- or decrease of cellular death in various systems including
human cells treated with apoptotic stimuli, in a genetic C. elegans muscle degeneration
model, after in vivo or in vitro bisphenol A (component of plastic packaging materials)
treatment in rats or in a mouse brain ischemia model54–60. More specifically, fission was linked
to the translocation of B-cell lymphoma 2 (Bcl2) associated X protein (Bax) to the outer
mitochondrial membrane and cytochrome c release in the cytosol, both triggering the
apoptotic pathway49,56,58. Although ONC in adult zebrafish normally does not trigger RGC
death, it is possible that in zebrafish with Drp1 overexpression some RGCs do die, which could
explain the reduced levels of tectal reinnervation in these mutant fish. Future experiments
should then also focus on this apoptotic pathway e.g. by the use of an immunostaining for
activated caspase-3 or a terminal deocynucleotidyl transferase dUTP nick end labeling (TUNEL)
assay. Next, fission is also linked to axonal degeneration61–63, as e.g. axons are rescued after
Drp1 inhibition in a mouse model of glaucoma64. In adult zebrafish (and also in rodents) it is
not known whether the damaged axons before the crush site (1) degenerate/retract to some
extent or completely degenerate up to the cell body, or (2) do not degenerate at all. It thus
remains elusive whether axon regrowth is initiated from the RGC cell body, or whether the
axons before the injury site are preserved and axon outgrowth starts from here. If the first
option is true, it is possible that reduced fission in the dominant-negative Drp1 fish results in
diminished axonal degeneration, which then gives a head start for axon regrowth, while the
opposite could hold true in zebrafish with enhanced mitochondrial fission. Thirdly, inhibiting
fission could prevent or slow down mitochondrial depolarization after injury, as shown in mice
after intradermal injections of capsaicin, an active component of chili peppers65. Indeed, this
treatment normally results in axonal degeneration and mitochondrial depolarization, but
overexpression of a mutant Drp1 protein retained mitochondrial membrane potentials and
prevented axonal loss, indicating that preventing fission can boost mitochondrial robustness
and axon survival. The fact that mitochondria are not depolarized and thus remain functional
after injury in fission-deficient animals, could be one of the underlying mechanisms for the
observed axon-promoting effect in the dominant-negative Drp1 zebrafish. A last interesting
paper to mention is the one of Li et al. (2004), that stated that overexpression of a dominant-
negative Drp1 in cultured rat hippocampal cells, results in reduced mitochondrial numbers in
the dendrites, while overexpression of Drp1 triggers the opposite effect66. It is possible that

Mitochondrial dynamics | 143
the loss of fission due to dominant-negative Drp1 hinders the entry/maintenance of enlarged
mitochondria in the dendrites, and that increased fission enhances dendritic mitochondrial
density as these smaller mitochondria might translocate more easily to the dendrites49,51.
Unfortunately, within this paper, the consequences of these fission manipulations on axonal
mitochondrial density was not investigated. Extrapolating these findings to our zebrafish ONC
model, namely that expression of a dominant-negative Drp1 specifically hinders the
mitochondria to enter/reside in the dendrites, would hypothetically enlarge the axonal
mitochondrial pool and thus could underlie the beneficial effect on axon repair, and vice versa
for overexpression of Drp1. However, this implicates that fission is controlled differently in the
axons and dendrites, which, to our believe, is indeed very important for successful axonal
regeneration. Due to the various effects of fission on cellular function/energy metabolism, it
is of critical importance to enhance/reduce fission to the correct level in a timed and spatial
way, in order to profit from all the beneficial roles of fission (increased numbers of
mitochondria, more mobile organelles, quality control step), and simultaneously prevent
harmful effects (apoptosis, axon degeneration, mitochondrial depolarization). To further test
this idea, we should be able to specifically manipulate fission in the dendrites or axons and
evaluate regenerative outcome, which is challenging in an in vivo situation as successful
neuronal compartment-specific gene/protein manipulation remains undocumented. Instead,
altering fission responses specifically in dendrites or axons in a timed way, is more feasible in
an in vitro set-up, as discussed in chapter 6.
Besides investigating the contribution of syntabulin-mediated mitochondrial transport
and fission in the axonal regenerative process, a major goal of this research chapter was to
characterize the normal injury-induced mitochondrial distribution/size after ONC injury as this
can lead to important preliminary insights as to whether mitochondria play a role in the
spontaneous axonal regeneration process in the adult zebrafish retinotectal system. For this
we used MitoEGFP zebrafish, in which this fluorescent protein is expressed under the control
of the isl2b promotor, previously used to drive RGC-specific expression in zebrafish larvae2,26–
29. Strikingly, in adult zebrafish, this promotor results in heterogeneous mitochondrial labeling
in the RGCs of the MitoEGFP fish (Fig. 4.2). This is possibly linked with the spatial organization
during retinal development/growth (Fig. 4.18). Indeed, the numerous brightly labeled RGCs
close to the optic nerve head likely correspond to the oldest cells within the retina, produced

144 | Chapter 4
during development, while the vaguely GFP+ RGCs in the periphery are more recently added
cells, originating from the ciliary marginal zone (CMZ) and underlying the continuous
expansion of the zebrafish retina throughout life (Fig. 4.18)67.
The isl2b protein is a LIM/homeodomain-type transcription factor, characterized by a
specific metal-binding domain, and expressed in specific subsets of neurons in vertebrates.
LIM/homedomain transcription factors are important for correct neuronal development due
to their role in regulating target gene transcription68,69. It is specifically shown in zebrafish
larvae that isl2b messenger ribonucleic acid (mRNA) is initially ubiquitously expressed in the
first hours post fertilization (hpf), but that it then becomes gradually restricted to the optic
vesicles/tectal region between 20-24 hpf, and later on to the RGCs68,69. Expression of a
dominant-negative form of this protein resulted in the lack of optic vesicles in zebrafish
larvae69. As far as we know, no publications report the spatial expression of this protein in the
retina of adult zebrafish, but our data indicate that it is not equally expressed in the complete
set of RGCs generated over time, shown by the heterogeneous mitochondrial labeling in adult
MitoEGFP animals. As GFP only has a half-life of 26h70–72, the bright fluorescence in the center
of the retina likely represents strong real-time expression of the isl2b promotor, and not
fluorescence remaining from development. In situ hybridization using isl2b RNA probes could
be employed to confirm this spatial differentiation in gene expression in the adult
retina<sup>73</sup><sup>56</sup><sup>56</sup>. The underlying regulating mechanisms
for this expression pattern in the adult retina could be found in (1) different levels (in central
versus peripheral cells) of transcription activators/repressors that promote/prevent isl2b
transcription or (2) epigenetic regulation at the isl2b deoxyribonucleic acid (DNA)74, including
DNA methylation or histone modification, which can affect transcription factor binding and
thus isl2b expression or (3) microRNAs that can regulate gene expression post-
Fig. 4.18 Overview of the ratio of the embryonic
and CMZ-derived retina in adult fish.
In adult fish, the central retina contains the oldest
cells, generated during development, while the
peripheral retinal cells are added by the CMZ
throughout life.
Figure adapted from Moshiri et al. (2004).
CMZ, ciliary marginal zone.

Mitochondrial dynamics | 145
transcriptionally75–77. The biological function/effect of the high isl2b expression in the central
retina compared to the periphery remains puzzling. It is however, not assumed that the two
populations, based on high or low isl2b expression, represent two different RGC subtypes. In
mouse for example, RGCs can be subdivided into more than 40 subtypes, which differ
morphologically or in the visual signals they transmit to the brain (e.g. contrast sensitivity,
movement perception and color vision). These murine subpopulations cover the entire retina
in a uniform manner, as this is required for proper retinal functioning78–80. A recent paper of
Zhou et al. (2020) indeed shows that the Isl2b-expressing RGCs in zebrafish represent
numerous RGC subtypes. Here, the Isl2b promotor was used to express GCaMP, a calcium
indicator, to record neuronal activity in response to different light impulses in zebrafish
larvae81. In the same paper, another zebrafish reporter line containing the identical promotor
to drive a photoactivatable protein was used, and after photoactivation of singular RGCs, their
dendrite morphology was mapped. The results of the two experiments indicated that the Isl2b
expressing RGCs represent both functional (e.g. responsive for different colors, On- or OFF
type cells) and morphological subsets (different dendritic stratification patterns in the IPL).
This thus strengthens the idea that the Isl2b expression differences observed in our adult
zebrafish depend on the origin of the RGC, i.e. embryonically or differentiating from
progenitor cells in the CMZ, and not on a functional or morphological feature. Of note,
chromatin immunoprecipitation assays, in which the interaction of proteins, e.g. transcription
factors, with DNA can be evaluated, might be useful here82. Indeed, this technique would
enable to determine for which genes transcription is regulated by the transcription factor
isl2b, and this might help to solve the spatial distribution of RGCs with high and low isl2b
expression. Importantly, due to this spatial organization, we only focused on the central retina
in this research chapter. As we know that all zebrafish RGCs can regenerate and our first aim
is to find the shared underlying mechanisms for successful axonal regeneration in zebrafish
RGCs, without making a distinguish between RGC subtypes, we do not expect that the focus
on the central retina has a major effect on our results.
In the retina of these MitoEGFP zebrafish, three distinct mitochondrial populations could
be detected: mostly punctuated small mitochondria in the axons and dendrites, as well as a
highly dense mitochondrial network near the nucleus. As analyzed with our Python script, the
mitochondrial size around the nuclear region, was significantly higher, compared to that in the

146 | Chapter 4
axons or dendrites, suggesting a tight association or even a large interconnected
mitochondrial population in the cell soma (Fig. 4.8). The same dense packaging of
mitochondria near the nucleus is visible in numerous other cell types and neurons83–86.
However, similar as described by others, it is difficult to distinguish in this perinuclear
mitochondrial net whether the organelles are truly interconnected, touching or just very close
to each other, as we are limited by confocal microscopy resolution87. The use of electron
microscopy, however, could help to distinguish the nature of this dense mitochondrial
network. An additional general finding was that often more perinuclear mitochondria were
observed to the IPL side of the RGC nucleus, as compared to the direction of the axons (Fig.
4.3 and 4.6). This arrangement could be linked to the spatial organization of the nucleus and
surrounding soma. Indeed, if zebrafish RGCs would be characterized by a polarized nucleus,
meaning that the nucleus is not exactly located in the center of the cell body, it is a logical
consequence that the mitochondria residing in the soma are not evenly distributed in
comparison to the nucleus88. Although never studied into detail, numerous pictures
throughout this work suggest an off-center nuclear organization in the zebrafish RGC soma.
Furthermore, nuclear positioning, as well as the mitochondrial network are physically
dependent on the organization of the cytoskeleton88,89 , which possibly plays a role here. This
idea could be investigated by means of immunostainings for the different
filaments/microtubules in order to visualize the exact cytoskeleton arrangement and
subsequently compare it to the mitochondrial perinuclear network.
Quantification of the mitochondrial distribution and sizes in the different subcellular
layers after ONC, unraveled intriguing findings, and although the exact underlying
mechanisms are not proven, educated hypotheses can be outlined based on our data and the
available literature. In this way, increased dendrite-to-soma/axon transport could explain
both the decrease of MitoEGFP+ area observed in the outer IPL (sublaminae S2-4), as well as
the mitochondrial clustering in primary dendrites and increase of mitochondrial area in IPL S1
at earlier time points post-ONC (Fig. 4.3-4, 4.7). These data thus fit with the hypothesis that
dendrite shrinkage after ONC goes hand in hand with increased mitochondrial motility, due to
reduced neuronal activity19,66, whereafter dendritic mitochondria can travel towards the
axons in order to boost axon regrowth. Moreover, as mitochondria become mostly stationary
after development, and smaller mitochondria are more mobile49,51, also fission could play a

Mitochondrial dynamics | 147
role here to improve mitochondrial transport. In our model, enhanced fission was indeed
detected early after ONC using the p-Drp (Ser616) fission marker in both immunostainings and
WB, suggesting that mitochondrial transport is ensured by fission-dependent mitochondrial
downsizing. A second explanation for the observed decrease in MitoEGFP+ area in the outer
IPL could be found in excessive mitochondrial removal via mitophagy. Data concerning
mitophagy in the zebrafish retinotectal system are still lacking, as we were not able to optimize
a protocol to study this process yet. Indeed, we are currently working on an immunostaining
for microtubule-associated proteins 1A/1B light chain 3B (LC3), an important initiator for
autophagy, on sections of MitoEGFP zebrafish, as overlapping LC3 and mitochondrial signals
are an indication of mitophagy36,37,90–92. Interestingly, different studies indicated a link
between increased mitophagy and dendritic shrinkage23,24. In our model it is thus also possible
that the observed immediate dendrite retraction after nerve injury is the result of increased
mitophagy and thus the lack of supporting energy to preserve dendrites. Lastly, if injury results
in the partial removal of dendrites in the IPL, a possible logic effect would be that also less
mitochondria are present and this potentially underlies the decreased MitoEGFP+ area in the
outer IPL. However, we assume that this is not the only underlying mechanism as only a 20%
reduction in dendritic/synaptic markers was measured after ONC in adult zebrafish (cfr.
chapter 3), while the MitoEGFP+ area at minimum levels is almost halved (Fig. 4.7).
The transient decrease in MitoEGFP+ area in the outer IPL is hereafter partly resolved,
as more mitochondria are again detected from ten days onwards in the S4 sublamina of the
IPL, and from two weeks onwards in strata S2-3. In chapter 3 of this thesis, we showed that
synaptic and dendritic restoration started from 10 dpi onwards in the IPL of adult zebrafish
subjected to ONC93, which nicely matches the start of the mitochondrial re-appearance in IPL
sublayer S4. Furthermore, Li et al. showed that in cultured rat hippocampal cells,
reducing/increasing mitochondrial numbers in dendrites leads to the respective loss or
augmented formation of synapses66. These data thus suggest that mitochondria are of major
importance to form/maintain synapses, which is further supported by our data revealing that
dendritic/synaptic restoration is accompanied by the return of mitochondria in the IPL.
Restoration of synapses/dendrites is finalized ± two weeks after injury (cfr. chapter 3), and
mitochondrial levels at this time point also returned to baseline levels in all IPL sublayers.
Concerning the source of the returning mitochondria in the outer IPL, different ideas pop up.

148 | Chapter 4
Again, it could be the logical consequence of dendritic restoration, but also other
mitochondrial dynamics could play a role herein. Indeed, six and ten days post-ONC,
mitochondrial biogenesis was significantly enhanced, in the RGC soma, which could result in
more mitochondria inside the IPL to restore synapses and dendrites. A crucial role of
mitochondrial biogenesis for development of dendrites and their synapses has already been
reported in literature, as knockdown or overexpression of PGC-1α in rodent cortical and
hippocampal neurons resulted in reduced/enhanced synaptic and dendritic growth,
respectively94,48,95. Moreover, we previously hypothesized that optic nerve damage would
result in the mitochondrial translocation from the dendrites to the axons, and that a large part
of these organelles would then return to boost dendrite regrowth, once synaptic connections
in the brain were repaired. While we did not observe major changes in the number of optic
tectum mitochondria after target contact restoration in the brain (Fig. 4.10), we cannot
exclude that some mitochondria returned from the brain to the retina again, but that this shift
was not detected due to the fact that not all RGCs reinnervate the optic tectum or repair
dendrites in exactly the same time window.
Regarding the average mitochondrial sizes in the IPL (S1-S4), we observed a transient
enlargement of the mitochondria, compared to the baseline situation. First of all, the detected
(minimal) increase in Opa1 expression in the IPL could be responsible for the average increase
in mitochondrial size (Fig. 4.13). Of note, Li et al. (2004) reported that the balance between
fission/fusion in dendrites of mouse hippocampal neurons in vitro, was controlled by synaptic
activity. Indeed, while blocking action potentials by tetrodotoxin application elevated
mitochondrial fusion, increased mitochondrial fission was seen when neurons were
depolarized after KCl treatment66. In this regard, it is thus possible that a reduced neuronal
activity after ONC, evokes a mitochondrial fusion response inside dendrites. Next, the
mitochondrial size increase in the IPL could be a consequence of the translocation of the,
natural or fission-induced, smaller and thus more mobile mitochondria, which would result in
a larger average mitochondrial size in the remaining pool of IPL mitochondria. These bigger
organelles, which are more resistant to stress and efficient in ATP production96,97, could be
important to ensure basal functioning of some remaining synapses/dendrites, as ONC in adult
zebrafish triggers only a partial loss of synapses/dendrites (cfr. chapter 3).

Mitochondrial dynamics | 149
Next, the significant raise in MitoEGFP+ area observed in the RGCL three days after ONC
injury, could again be explained by mitochondrial transport from the dendrites to the soma
(Fig. 4.7), or by mitochondrial biogenesis which was found to be raised one day after injury
(Fig. 4.11). Furthermore, also fission was observed to be upregulated three days after damage,
potentially underlying the more scattered mitochondrial pattern observed in the RGCL at this
time point (Fig. 4.5 and 4.12). Simultaneously with a raised MitoEGFP+ area, the average
mitochondrial size was also increased at this time point in the RGCL. In basal conditions, there
seems to be already a dense mitochondrial net close to the nucleus, but it is possible that this
network is even more enlarged after injury, possibly due to increased fusion (Fig. 4.13).
Another option is that the addition of extra mitochondria makes it even more difficult to
distinguish a single mitochondrion, and that multiple organelles are merged into one due to
physical resolution limitations.
Lastly, using the Python script, the MitoEGFP+ area and mitochondrial sizes in the NFL
were also quantified, but here no firm conclusion could be drawn due to the high variability
within conditions. To investigate mitochondrial redistribution after injury inside the RGC
axons, it would be better to visualize them within the optic nerve, chiasm and tract. We only
briefly touched upon this matter, by the use of horizontal visual system cryosections of naive
and 3 dpi crushed MitoEGFP fish. Within every fish, one bundle of axons inside the optic nerve
always contained more extensively labeled mitochondria, likely the axons of the bright RGCs
located in the central retina, of which we believe that they represent the RGCs generated
during embryonic development, thus not originating from the CMZ (Fig. 4.9). It is well known
that RGC axons in fish run in bundles determined on age, and thus also on location within the
retina. While we observed a brightly-labeled bundle inside the optic nerve of MitoEGFP
zebrafish, that plausibly represents the axons of the central, oldest RGCs, Diekmann et al.
(2015) reported in naive Tg(Gap43:GFP) fish a single fluorescently-labeled bundle in the optic
nerve, which contained the axons of the youngest RGCs, recently added by the CMZ and still
showing high expression of the growth-associated protein98.
Further looking into the retinotectal system in fish harvested at three days post-ONC,
we expected a mitochondrial clustering in the injured optic fibers at the optic chiasm, or
beginning of the optic tract, where the axonal growth cones should be located at this time
point. No such mitochondrial enrichment in the growth cones was observed in our adult fish,

150 | Chapter 4
although it is frequently reported e.g. in outgrowing axons in zebrafish larvae2. We did detect
an accumulation of mitochondria in the injured nerve close to the optic nerve head, which
most of the regenerating axons already passed at 3 dpi (Fig. 4.9). Although further
experiments are clearly needed, this intriguing finding could possibly be explained by the
process of transcellular mitochondrial degradation inside astrocytes. Indeed, it has been
shown in mice, both in intact axons as well as in degenerating axons of glaucomatous animals,
that degradation of mitochondria originating from axons largely occurs at the optic nerve head
by/in phagocytic astrocytes, a process called transmitophagy. For this, astrocytes take up the
mitochondria and subsequently degrade them in their lysosomes99. As it is known that axonal
injury triggers mitochondrial depolarization/dysfunction3,5,46, it is reasonable to think that in
our ONC model these unusable organelles also need to be degraded, possibly by transcellular
astrocytic mitophagy. Notably, the zebrafish CNS lacks stellate astrocytes100,101, but one CNS
tissue might form the exception, namely the optic nerve. Indeed, Koke et al. (2010) suggested
the presence of astrocytes, based on morphology and cytokeratin expression, in the optic
nerve of adult zebrafish102. Anyway, it is clear that more in depth research is needed to
investigate (1) if depolarized mitochondria in zebrafish are removed via mitophagy, and (2)
the mechanisms of mitochondrial trafficking/dynamics in the adult zebrafish optic nerve.
Finally, in the optic tectum we showed that three days after ONC, the mitochondria are
almost completely absent, as well as the axons, indicating axon degeneration (Fig. 4.10).
Strikingly, the energy-producing organelles start to return from the moment that the first
axons re-appear in the optic tectum. When tectal reinnervation is finalized, the mitochondrial
levels become seemingly restored to those of the baseline condition (Fig. 4.10). These data
thus suggest that mitochondria are closely involved in axon regrowth, and possibly position
themselves in the axonal growth cone to provide the pushing force for elongation. This has
already been observed in zebrafish larvae, were it was shown that mitochondria accumulate
in the growth cone of outgrowing RGC axons and that there is a strong correlation with the
number of arriving mitochondria at this compartment and the distance the axon traverses2.
To conclude, our mitochondrial characterization study revealed that in naive zebrafish,
mitochondria are located in the axons, dendrites and in a dense perinuclear mitochondrial
network (Fig. 4.19A). Following optic nerve injury, rapid synaptic and dendritic degeneration
is triggered (1-3 dpi), and likely also mitochondrial depolarization near the injury site3,5,46.

Mitochondrial dynamics | 151
These dysfunctional mitochondria might then possibly undergo mitophagy near the optic
nerve head via transcellular mitophagy in astrocytes99. Simultaneously, in the optic tectum,
the mitochondria that are left in the degenerating axons are also removed. In this time
window, a reduction of mitochondria in the RGC dendrites is also detected, possibly linked to
anterograde dendritic mitochondrial transport towards the soma/axons (Fig. 4.19B). The
observed fission response in the RGC soma could then also be beneficial to increase this
mitochondrial trafficking, as smaller mitochondria are more mobile49,51,103 (Fig. 4.19B).
However, the tectal reinnervation data of the two zebrafish lines with disturbed mitochondrial
fission contradicts this idea, as fish with increased mitochondrial fission showed accelerated
axonal regeneration and vice versa, thus more research is necessary to unravel the exact role
of fission in axonal regeneration. Next, the detected increase in average mitochondrial size in
the RGC dendrites can be the result of transport of the smaller mitochondria towards the
soma/axons, or due to increased fusion, for which we have preliminary indications, which
could be helpful to sustain the remaining synapses/dendrites (Fig. 4.19B). Lastly, also
mitochondrial biogenesis in the RGC soma early after ONC (1 dpi) might be helpful at this time
to enlarge the pool of mitochondria that support axon repair later on (Fig. 4.19B). During
axonal initiation and elongation (3-6 dpi), mitochondria might accumulate in the axonal
growth cone, although not detected yet, as a consequence of the (fission-mediated) transport
of somato-dendritic mitochondria (Fig. 4.19C). Again, the increase in mitochondrial size in the
IPL might be a result of fusion of some remaining mitochondria, or the disappearance of small
energy-producing organelles. When the axons ultimately reach the optic tectum (6-10 dpi),
the mitochondria are also again detected here (Fig. 4.19D). Upon synaptic restoration in the
brain, RGC dendrite regrowth is triggered (10-14 dpi), which also depends on mitochondrial
energy, as suggested by the concurrent mitochondrial reappearance in the IPL at the start of
synaptic/dendrite restoration (Fig. 4.19D). Mitochondrial biogenesis observed just before
dendrite regrowth, as well as mitochondrial transport from axons/soma towards the
dendrites, might aid in the delivery of the necessary energy-producing organelles for the
dendritic/synaptic restoration process (Fig. 4.19D). All in all, our data indicate a
compartmentalized and timed multi-step mitochondrial response underlying axonal and
dendritic regrowth.

152 | Chapter 4

Mitochondrial dynamics | 153
< Fig. 4.19 Overview of the observed and hypothesized mitochondrial dynamic changes in RGCs of adult
zebrafish subjected to ONC.
A In the normal naive situation, mitochondria are present in the RGC axons and dendrites, as well as in a dense
mitochondrial perinuclear network. B ONC is followed by synaptic/dendritic degeneration (1-3 dpi), and possibly
also triggers mitochondrial depolarization near the crush site. Mitophagy might be beneficial to remove these
damaged organelles, possibly visualized by the mitochondrial accumulation near the optic nerve head, which
suggests transcellular mitophagy in astrocytes. As the mitochondrial content in the RGC dendrites starts to
decrease early after injury, this then indicates mitochondrial transport towards the axons/soma. In addition,
mitochondrial fission in the cell soma is increased early after ONC. Removal of the (natural or fission-induced)
small mitochondria in the RGC dendrites, can explain the increase in average mitochondrial size in the IPL, or,
can additionally also occur via fusion, for which we still have limited proof. Furthermore, mitochondrial
biogenesis early after ONC can potentially enlarge the pool for axonal transport. C During the period of axonal
regrowth and elongation (3-6 dpi), the mitochondrial numbers in the RGC dendrites further decrease to reach
minimal levels, again supporting the idea of dendrite/soma-to-axon transport, possibly with the help of the
continued mitochondrial fission response. Fusion of the remaining mitochondria might be helpful to sustain the
few preserved dendrites and their synapses. D When axons finally reinnervate the optic tectum, this coincides
with the return of mitochondria here. Upon synaptic recovery in the brain, dendrites are boosted to regrow,
which simultaneously initiates the re-appearance of mitochondria in the retina, likely via induced transport from
soma or axons. The second phase of increased mitochondrial biogenesis at this point, could aid in the restoration
of these dendrites and their synapses.
Of note, mitochondrial adaptations/dynamics which are solely based on literature or for which only indirect
indications were found, but no proof, are indicated with a question mark.
Dpi, days post-injury; ONC, optic nerve crush; RGC, retinal ganglion cell.
In chapter 3 of this thesis, we showed that intravitreal injections of rapamycin, an mTOR
inhibitor, prevented injury-induced dendrite shrinkage and subsequently hindered axonal
regrowth in the adult zebrafish. As a last goal of this chapter, we wanted to elucidate if there
was a correlation with disturbed mitochondrial dynamics, and therefore we quantified the
MitoEGFP+ area and average mitochondrial sizes in retinal whole mounts of crushed zebrafish
after mTOR inhibition. No significant results were obtained yet, probably due to the low
number of used fish per condition (n = 3). However, we observed a trend towards a reduced
number of mitochondria in the RGCL after rapamycin treatment at 3 dpi, compared to the
vehicle or untreated crushed fish (Fig. 4.14). As this forms an interesting finding, extra
experiments are needed, first of all to increase the number of animals, and secondly, to
investigate the underlying mechanism for this trend, e.g. disturbed mitochondrial transport,
biogenesis, fission or even mitophagy.

154 | Chapter 4
6 CONCLUSION
All in all, we unraveled that ONC in adult zebrafish results in a reduction of mitochondria
in the RGC dendrites, corresponding to the time frame of dendrite retraction, and that these
energy-producing organelles return at the moment of major synaptic/dendritic restoration.
These data are thus in line with our hypothesis that dendritic shrinkage is necessary to release
mitochondria in the dendrites in order for their translocation to the growth cone to boost
axon repair. It also supports our idea that subsequent dendrite regrowth is aided by an
increase in mitochondria, although the mechanisms behind this presumed dendrite-axon-
dendrite mitochondrial trafficking still needs to be elucidated. In any case, mitochondrial
dynamics are clearly involved in the observed inta-neuronal energy channeling. Indeed,
mitochondrial biogenesis was found to be highly upregulated in the two time windows of axon
and dendrite outgrowth initiation, thus indicating that this process is playing a prominent role
during neurite regrowth. Also fission, which was found to be spontaneously upregulated
during successful axon repair, is seemingly involved. Here, the exact mechanism remains
elusive as we showed that inhibiting this process improved tectal reinnervation, while
enhanced fission had the opposite effect. As mitochondrial fission can have various beneficial
and detrimental effects on cellular functioning and bioenergetics, it is of critical importance
that fission is regulated in a timed and spatial (neuronal compartment-specific) manner.

Mitochondrial dynamics | 155
7 REFERENCES
1. Pak, C. W., Flynn, K. C. & Bamburg, J. R. Actin-binding proteins take the reins in growth cones. Nature Reviews Neuroscience 9, 136–147 (2008).
2. Verreet, T., Weaver, C. J., Hino, H., Hibi, M. & Poulain, F. E. Syntaphilin-mediated docking of mitochondria at the growth cone is dispensable for axon elongation in vivo. eNeuro 6, (2019).
3. Cavallucci, V. et al. Acute focal brain damage alters mitochondrial dynamics and autophagy in axotomized neurons. Cell Death Dis. 5, e1545–e1545 (2014).
4. Bradke, F., Fawcett, J. W. & Spira, M. E. Assembly of a new growth cone after axotomy: The precursor to axon regeneration. Nature Reviews Neuroscience 13, 183–193 (2012).
5. Zhou, B. et al. Facilitation of axon regeneration by enhancing mitochondrial transport and rescuing energy deficits. J. Cell Biol. 214, 103–119 (2016).
6. Han, S. M., Baig, H. S. & Hammarlund, M. Mitochondria Localize to Injured Axons to Support Regeneration. Neuron 92, 1308–1323 (2016).
7. Xu, Y., Chen, M., Hu, B., Huang, R. & Hu, B. In vivo imaging of mitochondrial transport in single-axon regeneration of zebrafish mauthner cells. Front. Cell. Neurosci. 11, (2017).
8. Mar, F. M. et al. CNS axons globally increase axonal transport after peripheral conditioning. J. Neurosci. 34, 5965–5970 (2014).
9. Lewis, T. L., Turi, G. F., Kwon, S. K., Losonczy, A. & Polleux, F. Progressive Decrease of Mitochondrial Motility during Maturation of Cortical Axons In Vitro and In Vivo. Curr. Biol. 26, 2602–2608 (2016).
10. Niescier, R. F., Hong, K., Park, D. & Min, K. T. MCU interacts with miro1 to modulate mitochondrial functions in neurons. Journal of Neuroscience 38, 4666–4677 (2018).
11. Loss, O. & Stephenson, F. A. Developmental changes in trak-mediated mitochondrial transport in neurons. Mol. Cell. Neurosci. 80, 134–147 (2017).
12. Misgeld, T. & Schwarz, T. L. Mitostasis in Neurons: Maintaining Mitochondria in an Extended Cellular Architecture. Neuron 96, 651–666 (2017).
13. Cartoni, R., Pekkurnaz, G., Wang, C., Schwarz, T. L. & He, Z. A high mitochondrial transport rate characterizes CNS neurons with high axonal regeneration capacity. PLoS One 12, (2017).
14. Cartoni, R. et al. The Mammalian-Specific Protein Armcx1 Regulates Mitochondrial Transport during Axon Regeneration. Neuron 92, 1294–1307 (2016).
15. Matsuo, R., Yamagishi, M., Wakiya, K., Tanaka, Y. & Ito, E. Target innervation is necessary for neuronal polyploidization in the terrestrial slug Limax. Dev. Neurobiol. 73, 609–620 (2013).
16. Puttagunta, R. & Di Giovanni, S. Retinoic acid signaling in axonal regeneration. Front. Mol. Neurosci. (2012).
17. Trigo, D., Goncalves, M. B. & Corcoran, J. P. T. The regulation of mitochondrial dynamics in neurite outgrowth by retinoic acid receptor β signaling. FASEB J. 33, 7225–7235 (2019).
18. Han, Q. et al. Restoring Cellular Energetics Promotes Axonal Regeneration and Functional Recovery after Spinal Cord Injury. Cell Metab. 31, 623-641.e8 (2020).
19. Cai, Q. & Sheng, Z. H. Mitochondrial transport and docking in axons. Experimental Neurology 218, 257–267 (2009).
20. Eisner, V., Picard, M. & Hajnóczky, G. Mitochondrial dynamics in adaptive and maladaptive cellular stress responses. Nat. Cell Biol. 20, 755–765 (2018).
21. Kiryu-Seo, S. et al. Mitochondrial fission is an acute and adaptive response in injured motor neurons. Sci. Rep. 6, (2016).
22. Vaarmann, A. et al. Mitochondrial biogenesis is required for axonal growth. Dev. 143, 1981–1992 (2016).
23. Yang, Y., Coleman, M., Zhang, L., Zheng, X. & Yue, Z. Autophagy in axonal and dendritic degeneration. Trends in Neurosciences 36, 418–428 (2013).
24. Chakrabarti, L., Eng, J., Ivanov, N. & Garden, G. A. Autophagy activation and enhanced mitophagy characterize the Purkinje cells of pcd mice prior to neuronal death. Mol. Brain 2,

156 | Chapter 4
(2009). 25. Moriyoshi, K., Richards, L. J., Akazawa, C., O’Leary, D. D. M. & Nakanishi, S. Labeling neural cells
using adenoviral gene transfer of membrane-targeted GFP. Neuron 16, 255–260 (1996). 26. Pittman, A. J., Law, M. Y. & Chien, C. Bin. Pathfinding in a large vertebrate axon tract: Isotypic
interactions guide retinotectal axons at multiple choice points. Development 135, 2865–2871 (2008).
27. Fuller-Carter, P. I. et al. Integrated analyses of zebrafish miRNA and mRNA expression profiles identify miR-29b and miR-223 as potential regulators of optic nerve regeneration. BMC Genomics 16, (2015).
28. Dell, A. L., Fried-Cassorla, E., Xu, H. & Raper, J. A. cAMP-induced expression of Neuropilin1 promotes retinal axon crossing in the zebrafish optic chiasm. J. Neurosci. 33, 11076–11088 (2013).
29. Di Donato, V. et al. An Attractive Reelin Gradient Establishes Synaptic Lamination in the Vertebrate Visual System. Neuron 97, 1049-1062.e6 (2018).
30. Provost, E., Rhee, J. & Leach, S. D. Viral 2A peptides allow expression of multiple proteins from a single ORF in transgenic zebrafish embryos. Genesis 45, 625–629 (2007).
31. Lewis, T. L., Kwon, S. K., Lee, A., Shaw, R. & Polleux, F. MFF-dependent mitochondrial fission regulates presynaptic release and axon branching by limiting axonal mitochondria size. Nat. Commun. 9, 276691 (2018).
32. Tran, N. M. et al. Single-Cell Profiles of Retinal Ganglion Cells Differing in Resilience to Injury Reveal Neuroprotective Genes. Neuron 104, 1039-1055.e12 (2019).
33. Landi, S., Cenni, M. C., Maffei, L. & Berardi, N. Environmental enrichment effects on development of retinal ganglion cell dendritic stratification require retinal BDNF. PLoS One 2, (2007).
34. Lefebvre, J. L., Zhang, Y., Meister, M., Wang, X. & Sanes, J. R. γ-Protocadherins regulate neuronal survival but are dispensable for circuit formation in retina. Development 135, 4141–4151 (2008).
35. Yamagata, M. & Sanes, J. R. Expanding the Ig superfamily code for laminar specificity in retina: Expression and role of contactins. J. Neurosci. 32, 14402–14414 (2012).
36. Mathai, B., Meijer, A. & Simonsen, A. Studying Autophagy in Zebrafish. Cells 6, 21 (2017). 37. He, C. & Klionsky, D. J. Analyzing autophagy in zebrafish. Autophagy 6, 642–644 (2010). 38. Varga, M. et al. Autophagy is required for zebrafish caudal fin regeneration. Cell Death Differ.
21, 547–556 (2014). 39. Letourneau, P. C. Cytoskeleton in Axon Growth. in eLS 1–10 (2016). 40. Smith, S. J. Neuronal cytomechanics: The actin-based motility of growth cones. Science (80-. ).
242, 708–715 (1988). 41. Gungabissoon, R. A. & Bamburg, J. R. Regulation of growth cone actin dynamics by ADF/cofilin.
in Journal of Histochemistry and Cytochemistry 51, 411–420 (2003). 42. Tamariz, E. & Varela-Echavarría, A. The discovery of the growth cone and its influence on the
study of axon guidance. Frontiers in Neuroanatomy 9, (2015). 43. Gomez, T. M. & Letourneau, P. C. Actin dynamics in growth cone motility and navigation.
Journal of Neurochemistry 129, 221–234 (2014). 44. Smith, G. M. & Gallo, G. The role of mitochondria in axon development and regeneration.
Developmental Neurobiology 78, 221–237 (2018). 45. Cavallucci, V. et al. Acute focal brain damage alters mitochondrial dynamics and autophagy in
axotomized neurons. Cell Death Dis. 5, (2014). 46. Patrón, L. A. & Zinsmaier, K. E. Mitochondria on the Road to Power Axonal Regeneration.
Neuron 92, 1152–1154 (2016). 47. Steketee, M. B. et al. Mitochondrial dynamics regulate growth cone motility, guidance, and
neurite growth rate in perinatal retinal ganglion cells in vitro. Investig. Ophthalmol. Vis. Sci. 53, 7402–7411 (2012).
48. Cheng, A. et al. Involvement of PGC-1α in the formation and maintenance of neuronal dendritic

Mitochondrial dynamics | 157
spines. Nat. Commun. 3, (2012). 49. Ito, Y. A. & Di Polo, A. Mitochondrial dynamics, transport, and quality control: A bottleneck for
retinal ganglion cell viability in optic neuropathies. Mitochondrion 36, 186–192 (2017). 50. Zinsmaier, K. E., Babic, M. & Russo, G. J. Mitochondrial transport dynamics in axons and
dendrites. Results Probl. Cell Differ. 48, 107–139 (2009). 51. Misgeld, T., Kerschensteiner, M., Bareyre, F. M., Burgess, R. W. & Lichtman, J. W. Imaging axonal
transport of mitochondria in vivo. Nat. Methods 4, 559–561 (2007). 52. Popov, V., Medvedev, N. I., Davies, H. A. & Stewart, M. G. Mitochondria form a filamentous
reticular network in hippocampal dendrites but are present as discrete bodies in axons: A three-dimensional ultrastructural study. J. Comp. Neurol. 492, 50–65 (2005).
53. Song, A. hong et al. A Selective Filter for Cytoplasmic Transport at the Axon Initial Segment. Cell 136, 1148–1160 (2009).
54. Scholtes, C. et al. DRP-1-mediated apoptosis induces muscle degeneration in dystrophin mutants. Sci. Rep. 8, (2018).
55. Hu, C., Huang, Y. & Li, L. Drp1-dependent mitochondrial fission plays critical roles in physiological and pathological progresses in mammals. International Journal of Molecular Sciences 18, (2017).
56. Lee, Y. J., Jeong, S. Y., Karbowski, M., Smith, C. L. & Youle, R. J. Roles of the mammalian mitochondrial fission and fusion mediators Fis1, Drp1, Opa1 in apoptosis. Mol. Biol. Cell 15, 5001–5011 (2004).
57. Frank, S. et al. The Role of Dynamin-Related Protein 1, a Mediator of Mitochondrial Fission, in Apoptosis. Dev. Cell 1, 515–525 (2001).
58. Breckenridge, D. G., Stojanovic, M., Marcellus, R. C. & Shore, G. C. Caspase cleavage product of BAP31 induces mitochondrial fission through endoplasmic reticulum calcium signals, enhancing cytochrome c release to the cytosol. J. Cell Biol. 160, 1115–1127 (2003).
59. Agarwal, S. et al. Dynamin-related protein 1 inhibition mitigates bisphenol A-mediated alterations in mitochondrial dynamics and neural stem cell proliferation and differentiation. J. Biol. Chem. 291, 15923–15939 (2016).
60. Grohm, J. et al. Inhibition of Drp1 provides neuroprotection in vitro and in vivo. Cell Death Differ. 19, 1446–1458 (2012).
61. Lassus, B. et al. Alterations of mitochondrial dynamics allow retrograde propagation of locally initiated axonal insults. Sci. Rep. 6, 1–12 (2016).
62. Knott, A. B., Perkins, G., Schwarzenbacher, R. & Bossy-Wetzel, E. Mitochondrial fragmentation in neurodegeneration. Nature Reviews Neuroscience 9, 505–518 (2008).
63. Arrázola, M. S. et al. Axonal degeneration is mediated by necroptosis activation. J. Neurosci. 39, 3832–3844 (2019).
64. Kim, K. Y. et al. DRP1 inhibition rescues retinal ganglion cells and their axons by preserving mitochondrial integrity in a mouse model of glaucoma. Cell Death Dis. 6, (2015).
65. Chiang, H. et al. Mitochondrial fission augments capsaicin-induced axonal degeneration. Acta Neuropathol. 129, 81–96 (2015).
66. Li, Z., Okamoto, K. I., Hayashi, Y. & Sheng, M. The importance of dendritic mitochondria in the morphogenesis and plasticity of spines and synapses. Cell 119, 873–887 (2004).
67. Moshiri, A., Close, J. & Reh, T. A. Retinal stem cells and regeneration. International Journal of Developmental Biology 48, 1003–1014 (2004).
68. Tokumoto, M. et al. Molecular Heterogeneity among Primary Motoneurons and within Myotomes Revealed by the Differential mRNA Expression of Novel Islet-1 Homologs in Embryonic Zebrafish. Dev. Biol. 171, 578–589 (1995).
69. Kikuchi, Y. et al. Ocular and cerebellar defects in zebrafish induced by overexpression of the LIM domains of the Islet-3 LIM/homeodomain protein. Neuron 18, 369–382 (1997).
70. Kitsera, N., Khobta, A. & Epe, B. Destabilized green fluorescent protein detects rapid removal of transcription blocks after genotoxic exposure. Biotechniques 43, 222–227 (2007).
71. Corish, P. & Tyler-Smith, C. Attenuation of green fluorescent protein half-life in mammalian

158 | Chapter 4
cells. Protein Eng. 12, 1035–1040 (1999). 72. Leveau, J. H. J. & Lindow, S. E. Predictive and interpretive simulation of green fluorescent
protein expression in reporter bacteria. J. Bacteriol. 183, 6752–6762 (2001). 73. Kühn, E. & Köster, R. W. Analysis of gene expression by in situ hybridization on adult zebrafish
brain sections. Cold Spring Harb. Protoc. 5, (2010). 74. Seritrakul, P. & Gross, J. M. Genetic and epigenetic control of retinal development in zebrafish.
Current Opinion in Neurobiology 59, 120–127 (2019). 75. Filipowicz, W., Bhattacharyya, S. N. & Sonenberg, N. Mechanisms of post-transcriptional
regulation by microRNAs: Are the answers in sight? Nature Reviews Genetics 9, 102–114 (2008). 76. Hawkins, L. J., Al-attar, R. & Storey, K. B. Transcriptional regulation of metabolism in disease:
From transcription factors to epigenetics. PeerJ 2018, (2018). 77. Lee, T. I. & Young, R. A. Transcriptional regulation and its misregulation in disease. Cell 152,
1237–1251 (2013). 78. Laboissonniere, L. A. et al. Molecular signatures of retinal ganglion cells revealed through single
cell profiling. Sci. Rep. 9, (2019). 79. Sanes, J. R. & Masland, R. H. The Types of Retinal Ganglion Cells: Current Status and Implications
for Neuronal Classification. Annu. Rev. Neurosci. 38, 221–246 (2015). 80. Krieger, B., Qiao, M., Rousso, D. L., Sanes, J. R. & Meister, M. Four alpha ganglion cell types in
mouse retina: Function, structure, and molecular signatures. PLoS One 12, (2017). 81. Zhou, M. et al. What the Zebrafish’s Eye Tells the Zebrafish’s Brain: Retinal Ganglion Cells for
Prey Capture and Colour Vision. SSRN Electron. J. (2020). 82. Das, P. M., Ramachandran, K., VanWert, J. & Singal, R. Chromatin immunoprecipitation assay.
BioTechniques 37, 961–969 (2004). 83. Nguyen, M. G. et al. LKB1-regulated adaptive mechanisms are essential for neuronal survival
following mitochondrial dysfunction. Hum. Mol. Genet. 22, 952–962 (2013). 84. Huang, S. et al. Drp1-mediated mitochondrial abnormalities link to synaptic injury in diabetes
model. Diabetes 64, 1728–1742 (2015). 85. Kim, H. T. et al. Mitochondrial Protection by Exogenous Otx2 in Mouse Retinal Neurons. Cell
Rep. 13, 990–1002 (2015). 86. Di Maio, R. et al. α-synuclein binds to TOM20 and inhibits mitochondrial protein import in
Parkinson’s disease. Science Translational Medicine 8, (2016). 87. Collins, T. J., Berridge, M. J., Lipp, P. & Bootman, M. D. Mitochondria are morphologically and
functionally heterogeneous within cells. EMBO J. 21, 1616–1627 (2002). 88. Villanueva, J. et al. The position of mitochondria and ER in relation to that of the secretory sites
in chromaffin cells. J. Cell Sci. 127, 5105–5114 (2014). 89. Sukhorukov, V. M. & Meyer-Hermann, M. Structural Heterogeneity of Mitochondria Induced by
the Microtubule Cytoskeleton. Sci. Rep. 5, (2015). 90. Siddiqui, A. et al. Mitochondrial quality control via the PGC1α-TFEB signaling pathway is
compromised by parkin Q311X mutation but independently restored by rapamycin. J. Neurosci. 35, 12833–12844 (2015).
91. Gargini, R., García-Escudero, V. & Izquierdo, M. Therapy mediated by mitophagy abrogates tumor progression. Autophagy 7, 466–476 (2011).
92. Korolenko, T. A. et al. Autophagy and neurodegeneration. Neurodegenerative Diseases: Overview, Perspectives and Emerging Treatments 1–34 (2017).
93. Beckers, A. et al. An Antagonistic Axon-Dendrite Interplay Enables Efficient Neuronal Repair in the Adult Zebrafish Central Nervous System. Mol. Neurobiol. 56, 3175–3192 (2019).
94. Vaarmann, A. et al. Mitochondrial biogenesis is required for axonal growth. Dev. 143, 1981–1992 (2016).
95. Bedse, G., Di Domenico, F., Serviddio, G. & Cassano, T. Aberrant insulin signaling in Alzheimer’s disease: Current knowledge. Front. Neurosci. 9, (2015).
96. Hoitzing, H., Johnston, I. G. & Jones, N. S. What is the function of mitochondrial networks? A theoretical assessment of hypotheses and proposal for future research. BioEssays 37, 687–700

Mitochondrial dynamics | 159
(2015). 97. Dickey, A. S. & Strack, S. PKA/AKAP1 AND PP2A/Bβ2 regulate neuronal morphogenesis via Drp1
phosphorylation and mitochondrial bioenergetics. J. Neurosci. 31, 15716–15726 (2011). 98. Diekmann, H., Kalbhen, P. & Fischer, D. Characterization of optic nerve regeneration using
transgenic zebrafish. Front. Cell. Neurosci. 9, (2015). 99. Davis, C. H. O. et al. Transcellular degradation of axonal mitochondria. Proc. Natl. Acad. Sci. U.
S. A. 111, 9633–9638 (2014). 100. Lyons, D. A. & Talbot, W. S. Glial cell development and function in zebrafish. Cold Spring Harb.
Perspect. Biol. 7, (2015). 101. Than-Trong, E. & Bally-Cuif, L. Radial glia and neural progenitors in the adult zebrafish central
nervous system. Glia 63, 1406–1428 (2015). 102. Koke, J. R., Mosier, A. L. & García, D. M. Intermediate filaments of zebrafish retinal and optic
nerve astrocytes and Müller glia: Differential distribution of cytokeratin and GFAP. BMC Res. Notes 3, (2010).
103. Youle, R. J. & Van Der Bliek, A. M. Mitochondrial fission, fusion, and stress. Science 337, 1062–1065 (2012).

160 | Chapter 4

CHAPTER 5
THE ROLE OF AUTOPHAGY IN AXONAL REGENERATION AFTER
ONC IN ADULT ZEBRAFISH

162 | Chapter 5
CHAPTER 5 …………………………………………………………………………………………………………………...161
1 INTRODUCTION …………………………………………………………………………………………………...163
2 OBJECTIVES …………………………………………………………………………………………………………163
3 MATERIALS AND METHODS ….……………………………………………………………………………..165
3.1 ZEBRAFISH MAINTENANCE ……………………………………………………………………………………165
3.2 OPTIC NERVE CRUSH MODEL …………………………………………………………………………………165
3.3 VISUALISATION OF THE AUTOPHAGIC RESPONSE IN THE RETINOTECTAL
SYSTEM USING A ZEBRAFISH AUTOPHAGY REPORTER LINE ………………………………………..165
3.4 WESTERN BLOTTING ……………………………………………………………………………………………..166
3.5 IMMUNOFLUORESCENT STAININGS ……………………………………………………………………….167
3.6 SYSTEMIC AUTOPHAGY INHIBITION ………………………………………………………………………168
3.7 RETINAL MTOR INHIBITION ..…………………………………………………………………………………168
3.8 TRACING AND QUANTIFICATION OF TECTAL (RE)INNERVATION AFTER ONC AND
SYSTEMIC AUTOPHAGY INHIBITION ……………………………………………………………………………168
3.9 STATISTICAL ANALYSIS …………………………………………………………………………………………169
4 RESULTS ………………………………………………………………………………………………………………170
4.1 CHARACTERIZATION OF THE AUTOPHAGIC RESPONSE AFTER OPTIC NERVE
CRUSH IN THE RETINOTECTAL SYSTEM ………………………………………………………………………170
4.2 THE EFFECT OF AUTOPHAGY INHIBITION ON AXONAL REGENERATION
AFTER OPTIC NERVE INJURY IN ADULT ZEBRAFISH …………...………………………………………..178
4.3 THE EFFECT OF MTOR INHIBITION USING RAPAMYCIN ON AUTOPHAGY
INDUCTION …………………………………………………………………………………………………………………182
5 DISCUSSION …………………………………………………………………………………………………………183
6 CONCLUSION ………………………………………………………………………………………………………..190
7 REFERENCES ………………………………………………………………………………………………………..191

Autophagy | 163
1 INTRODUCTION
Autophagy is the natural, strictly regulated and critical process to ensure the health of
cells as it is responsible for the degradation of unnecessary/dysfunctional proteins or
organelles. Besides basal autophagic levels, with a general refreshing and housekeeping
function, autophagy can be strongly induced in major risk-situations like nutrient shortage,
cellular/tissue damage or the invasion of pathogens1–4. Using different rodent models, it has
been reported that optic nerve injury triggers a cellular recycling response in retinal ganglion
cell (RGC) axons, somas and dendrites, to which both beneficial and detrimental effects have
been assigned5–8. First of all, autophagy appears to be an early stress response to prevent
cellular apoptosis, as different studies indicate that hampering or increasing this process led
to the respective in- or decrease of neuronal death8–10. In addition, most investigations report
that axonal growth is supported by autophagy, and He et al. (2016) provided preliminary
indications that autophagy-mediated degradation of a microtubule-destabilizing factor inside
growth cones could be the underlying promoting mechanism11–15. Of note, two papers
describe reduced axonal growth upon autophagy induction, which does not fit with the idea
of a positive role of the cellular recycling response in neurite growth16,17. Lastly, autophagy is
also known to affect neurite retraction/degeneration after injury, and more specifically,
excessive removal of mitochondria was shown to be linked with shrinkage of dendrites,
probably due to the lack of supporting energy necessary for preservation of dendritic
morphology/functionality5,18,19.
2 OBJECTIVES
Fascinated by the link between dendrite shrinkage and autophagy, we wanted to
investigate whether a similar connection is true for optic nerve crush (ONC)-induced dendrite
remodeling observed in adult zebrafish. If dendrite shortening would be orchestrated by
autophagy in this model, we can hypothesize that inhibiting this recycling response indeed
prevents dendrite retraction, thereby possibly hindering axonal regeneration due to the
absence of extra autophagy-derived building blocks. To study this, we will use the well-known
autophagy reporter zebrafish line Tg(CMV:GFP-Lc3), in which first the spontaneous autophagy
response after ONC will be spatiotemporally characterized in the retina, optic nerve/tract and
optic tectum. Furthermore, the intracellular recycling mechanism will be inhibited to study

164 | Chapter 5
the effect on axonal regrowth and dendrite remodeling. Of note, even if autophagy inside RGC
dendrites should not be detected, this inhibition experiment will still be valuable, as it can give
an indication regarding the general importance of autophagy for the re-establishment of
functional axons after optic nerve damage in adult zebrafish. Lastly, the widely used
autophagy inducer rapamycin, which was also used in chapter 3, will be intravitreally injected
in the autophagy reporter fish in order to investigate if this indeed increases the cellular
recycling response in adult zebrafish.
Autophagy | 165
3 MATERIALS AND METHODS
3.1 ZEBRAFISH MAINTENANCE
Zebrafish (Danio rerio) were maintained under standard laboratory conditions at 28°C
on a 14h light/10h dark cycle. Fish were fed twice daily with a combination of dry food and
brine shrimp. All experiments were performed on equally sized, 5-month-old adult zebrafish,
either AB wild types or animals from the autophagy reporter line Tg(CMV:GFP-Lc3).
Experiments were approved by the KU Leuven Animal Ethics Committee and executed in strict
accordance with the European Communities Council Directive of 20 October 2010
(2010/63/EU).
3.2 OPTIC NERVE CRUSH MODEL
To perform an ONC, zebrafish were anesthetized in a buffered 0.03% solution of tricaine
(MS-222, Sigma Aldrich) and put under a dissecting microscope (Leica) on moist tissue paper,
left side facing upward. After removal of the surrounding connective tissue, the eyeball was
lifted out of its orbit, thereby exposing the optic nerve and ophthalmic artery. Sterile forceps
were carefully placed around the left optic nerve, which was crushed for 10 s at 0.5 mm
distance of the optic nerve head, thereby avoiding damage to the ophthalmic artery. A
successful ONC was indicated by the appearance of a clear gap inside the translucent nerve
sheath. Fish were returned to system water in separate tanks to recover.
3.3 VISUALISATION OF THE AUTOPHAGIC RESPONSE IN THE RETINOTECTAL
SYSTEM USING A ZEBRAFISH AUTOPHAGY REPORTER LINE
To monitor autophagy induction at various time points after optic nerve injury, we used
the Tg(CMV:GFP-Lc3) reporter line, expressing a green fluorescent protein (GFP) fused to
microtubule-associated protein 1A/1B-light chain 3 (Lc3), under the control of the constitutive
cytomegalovirus (CMV) promotor. Because Lc3 is an important initiator of autophagy, this
transgenic fish line has been widely used to monitor the cellular recycling response20–22. Using
this fish line, we first characterized the autophagic response in the retina (retinal whole
mounts and sagittal cryosections), in the optic nerve (horizontal visual system cryosections)
and in the optic tectum (coronal vibratome sections) at baseline, 1, 3, 6, 10, 14 and 21 days
post-injury (dpi). Thereto, fish were first euthanized by submersion in buffered 0.1% tricaine
and transcardially perfused with phosphate buffered saline (PBS, 0.01M, pH 7.4) and 4%

166 | Chapter 5
paraformaldehyde (PFA) in PBS. Eyes and brains of adult fish were dissected at various days
post-injury, or, in another set of fish, total visual systems containing the eyes, optic
nerves/chiasm/tracts and brains were harvested. After dissection, the eye or visual system
tissues were fixed for 1h in 4% PFA in PBS and then submersed in 30% sucrose in PBS
overnight. After embedding (1,25% agarose, 30% sucrose in PBS) the visual systems and eyes
were cut using a Cryostar NX70 cryostat (Thermo Fisher Scientific, MA, USA) in 10 µm
horizontal and saggital sections, respectively. In addition to the use of cryosections, retinal
autophagy was also studied using whole mounts. For this, the retina was removed from the
fixated eye, and four cuts were used to turn the cup-shaped retina into a flat tissue.
Furthermore, the fixated brains were embedded in 4% agarose and cut in 50 µm thick coronal
sections using a Micron H650 vibratome (Thermo Fischer Scientific, MA, USA). In a last step,
the retinal/visual system cryosections, retinal whole mounts and vibratome brain sections
were stained for 30’ on room temperature with 4’,6’-diamono-2-phenylindole (DAPI) to
visualize nuclei, after which images were taken with an Olympus FV1000 confocal microscope
at 20x (visual system) or 60x magnification (retina and brain). For the retinal whole mounts, a
z-stack picture was taken through the nerve fiber layer (NFL) and retinal ganglion cell layer
(RGCL), after which separate projection images were made for these two retinal layers. In the
figures showing visual system sections only the relevant structures, being the left eye, left
optic nerve, right optic tract and the brain, will be visualized, while the other structures (right
eye/optic nerve and left optic tract) are removed using the Adobe software program
Photoshop in order to obtain a more clear visualization and easier interpretation. To analyze
spatial/temporal differences in signal intensity on retinal/brain sections in an unbiased way,
intensities were always compared on at least five sections per animal and on 3-4 animals.
Moreover, representative pictures were always taken in the central area of the retina and
optic tectum.
3.4 WESTERN BLOTTING
In an attempt to quantify the autophagic response in the retina after ONC, we
performed western blotting (WB) for autophagy related 5 (Atg5, 47 kDa), which is important
for autophagosome formation20–22. For this, fish were sacrificed in buffered 0.1% tricaine,
after which retinas were dissected at baseline (naive), 6 hours post-injury (hpi), 1, 3, 6, 10 or
14 dpi after ONC and homogenized in lysis buffer (10 mM Tris-HCl pH 8, 1% Triton X-100, 150

Autophagy | 167
mM NaCl, 0.1% SDS, 0.5% sodium deoxycholate, 0.2% sodium azide), supplemented with
protease inhibitors (Roche). Homogenates were loaded at 10 µg onto 4-12% Bis-Tris gels
(Biorad) and transferred onto a nitrocellulose membrane (Biorad). Overnight incubation with
a rabbit anti-Atg5 antibody (1:1000, Nobus Biologicals), was followed by 45’ incubation with
donkey anti-rabbit HRP-conjugated antibody (Dako). Protein bands were visualized using a
luminol-based enhanced chemiluminescent kit (Thermo Scientific) by means of an imaging
system (Biorad, ChemiDoc MP imaging system), and semi-quantitatively evaluated by
densitometry (Image Lab 4.1, Biorad). To reduce the risk for bias during analysis, protein bands
were automatically detected and evaluated by the software. Swift membrane total protein
staining (G-Biosciences) of the nitrocellulose membrane served as loading control and was
used for normalization of protein values. Data were plotted as a relative percentage to and
statistically compared to the baseline (naive) condition, which was set as 100%.
3.5 IMMUNOFLUORESCENT STAININGS
In order to investigate if autophagy is located inside the regrowing axons, a fluorescent
staining using an antibody against growth-associated protein 43 (Gap-43) was performed on
visual system cryosections and vibratome brain sections of Tg(CMV:GFP-Lc3) fish at,
respectively, three and six days after optic nerve damage. In addition, an immunostaining for
glial fibrillary acid protein (Gfap) was used to detect Müller glia in retinal cryosections, while
HuC/D (Hu proteins) and L-Plastin were used to detect neurons and leukocytes, respectively,
on brain cryosections. For these immunofluorescent stainings, sections were first made as
previously described (3.3) and subsequently stained using the primary mouse anti-Gap-43
antibody (1:300, Santa Cruz), rabbit anti-Gfap (1:500, Dako), mouse anti-HuC/D (1:200,
Invitrogen), and rabbit anti-L-plastin (1:200, Bio-connect), and detected with Alexa-
conjugated secondary antibodies or horseradish peroxidase (HRP)-labeled antibodies (Dako),
using the Tyramide Signal Amplification (TSA) Cyanine 3 (Cy3) System (PerkinElmer). Finally,
sections were stained for DAPI and visualized with an Olympus FV1000 confocal microscope
at 60x magnification. Representative pictures were always taken on central sections of the
retina and optic tectum.

168 | Chapter 5
3.6 SYSTEMIC AUTOPHAGY INHIBITION
To study the possible role of autophagy in axonal regeneration and dendrite
retraction/regrowth, this response was prevented by systemic treatment of the widely used
late-stage autophagy inhibitor bafilomycin A1 in Tg(CMV:GFP-Lc3) zebrafish. Bafilomycin A1
prevents merging of the autophagosome with the lysosome and further inhibits V-ATPase-
dependent acidification of the lysosome, thereby preventing autophagosome-lysosome
fusion and lysosomal protein degradation23. This systemic autophagy inhibition protocol is
based on published data20–22. Bafilomycin A1 was first diluted in dimethylsulfoxide (DMSO) or
methanol to create a 100 µM stock solution, which was diluted in the tank water at a final
concentration of 10 nM. In these experiments, a control group was taken along that
underwent systemic treatment with an equal amount of DMSO or methanol, in order to detect
potential side effects of the vehicle. Tank water was refreshed daily in all experiments.
3.7 RETINAL MTOR INHIBITION
To investigate if rapamycin, an inhibitor of the mechanistic target of rapamycin (mTOR)
pathway and widely used as autophagy inducer, upregulates autophagy in the retina/brain of
adult zebrafish, we intravitreally injected 300 nl of 20 µM rapamycin (LC Laboratories) or
vehicle (DMSO) using a micro-injector (UMP3, World Precision Instruments) in naive
Tg(CMV:GFP-Lc3) zebrafish and sacrificed them 8 or 24 hours later. Moreover, also crushed
zebrafish were used and injected with rapamycin or the vehicle at the time of crush and one
day later. These fish were sacrificed at 1 or 3 days post-ONC. Hereafter, autophagy was
investigated in retinal whole mounts and brain vibratome sections, as described in 3.3.
3.8 TRACING AND QUANTIFICATION OF TECTAL (RE)INNERVATION AFTER
ONC AND SYSTEMIC AUTOPHAGY INHIBITION
Regenerating axons from the retina towards the optic tectum were visualized by means
of biocytin tracing at six days after ONC. Fish were first anesthetized (0.03% tricaine), after
which the optic nerve was transected between the eye and the crush site and a piece of
gelfoam soaked in biocytin (Sigma Aldrich) was placed on the nerve stump. The eye was placed
back and fish were revived. After 3h, when the tracer was anterogradely transported to the
optic tectum, fish were euthanized (0.1% tricaine) and transcardially perfused with 4% PFA in
PBS. Brains were then dissected and overnight fixated (4% PFA). After rinsing, the brains were

Autophagy | 169
embedded and cut in 50 µm coronal sections. Biocytin was visualized by means of a Vectastain
ABC kit (Vector laboratories), using diaminobenzidine as chromogen. Sections were dried on
gelatin-coated slides and counterstained with neutral red solution to allow for brain nuclei
identification. Brain sections through the central optic tecti were identified based on the
presence of specific nuclei and histological photographs were acquired with a microscope
Zeiss imager Z1 at 10x magnification. Tectal (re)innervation was quantified via an in house
developed Image J script, in which the biocytin-labeled area was measured using manual
thresholding. Next, axonal density was defined as the ratio of the biocytin+ area to the area of
reinnervation, being the stratum opticum (SO) and stratum fibrosum et griseum superficiale
(SFGS) of the optic tectum24. Per fish, tectal reinnervation was analyzed on at least five
sections containing the central optic tectum, and 4-7 fish were used per condition. Of note, in
all experiments, naive fish were included, in which tectal innervation was analyzed and set as
a 100% reference value. Reinnervation values for the injury conditions were expressed in %,
relative to this reference control.
3.9 STATISTICAL ANALYSIS
All statistical tests were performed using Graphpad Prism 7.03. In all cases, raw data
were tested for normal distribution using the Kolmogorov-Smirnov normality test and
variance between groups was checked via the Brown-Forsythe’s test for equality of variances.
To compare three or more independent groups, a one-way ANalysis Of Variance (ANOVA) was
performed if the data showed a normal distribution and variances between groups were
homogeneous, followed by a Dunnet or Tukey post-hoc test. All data are represented as mean
± SEM. The value of n represents the number of animals used per condition. A p-value < 0.05
was considered statistically significant.
170 | Chapter 5
4 RESULTS
4.1 CHARACTERIZATION OF THE AUTOPHAGIC RESPONSE AFTER OPTIC
NERVE CRUSH IN THE RETINOTECTAL SYSTEM
4.2.1 Characterization of the autophagic response after optic nerve
injury in the retina using Lc3-GFP fish
To characterize the occurrence of autophagy after ONC in adult zebrafish, Tg(CMV:GFP-
Lc3) reporter fish were used, in which enhanced autophagy has been detected in other
zebrafish studies by a general increase in Lc3-GFP fluorescence or more Lc3-GFP+ punctae,
visualizing autophagosomes20–22. In the NFL, the GFP fluorescence intensity was strongly
augmented from 1-10 dpi, compared to baseline levels, with a peak expression at 3 dpi (Fig.
5.1). Two weeks after injury, Lc3-GFP fluorescence returned to baseline levels. The same
pattern was observed in the RGCL, in which the intensity of the Lc3-GFP reporter was markedly
enhanced from 1 dpi onwards and reached its maximum three days after optic nerve damage.
Again, two weeks after ONC the induction of the recycling response was resolved (Fig. 5.1).
Importantly, no clear autophagic response was observed in the inner plexiform layer (IPL),
where the RGC dendrites reside (data not shown).
In order to further exclude with certainty that autophagy is not upregulated inside the
IPL after ONC, horizontal cryosections of Tg(CMV:GFP-Lc3) reporter fish were used as these
give a more easy view on the IPL. A first thing to notice in Fig. 5.2 is that autophagy was
significantly induced early after ONC in RGC somas and in the NFL, similar to what was
detected using retinal whole mounts (Fig. 5.1). Strikingly however, Lc3-GFP fluorescence
intensity was now also found to be enhanced inside the IPL from 1-6 dpi, visualizing an
autophagic response also within this retinal layer. Indeed, GFP positive fibers were visible
throughout this layer after ONC, which is the most clear at 3 dpi, a time point at which also
somas inside the INL showed a marked increase of the autophagy reporter (Fig. 5.2).

Autophagy | 171
Fig. 5.1 Visualization of the autophagic response in the NFL and RGCL at different time points after ONC using retinal whole mounts of Tg(CMV:GFP-Lc3) reporter fish.
Both in the NFL and RGCL, Lc3-GFP fluorescence intensity was significantly increased from one day post-injury onwards and reached its maximum value at 3 dpi. Hereafter,
both in the RGC axons and somas reduced reporter expression was observed, and baseline levels were again reached two weeks after injury. Scale bar = 25 µm.
Dpi, days post-injury; GFP, green fluorescent protein; Lc3, microtubule-associated protein 1A/1B-light chain 3; NFL, nerve fiber layer; RGCL, retinal ganglion cell layer.

172 | Chapter 5
Fig. 5.2 Autophagy visualization at early time points after optic nerve injury using retinal cryosections of
Tg(CMV:GFP-Lc3) autophagy reporter fish.
The intensity of the Lc3-GFP signal was increased in the NFL and RGCL, early after ONC, and peaked at 3 dpi.
Moreover, autophagy was likewise observed in the IPL, in the form of Lc3-GFP+ fibers running through this layer,
which was the most pronounced at 3 dpi. In addition, Lc3-GFP+ somas inside the INL were also visible at this time
point. Scale bar = 25 µm.
Dpi, days post-injury; GFP, green fluorescent protein; INL, inner nuclear layer; IPL, inner plexiform layer; Lc3,
microtubule-associated protein 1A/1B-light chain 3; NFL, nerve fiber layer; RGCL, retinal ganglion cell layer.
The GFP+ fibers in the IPL resemble processes of Müller glia, which are supporting cells
in the retina that have their cell bodies located in the INL, but span the entire retina with glial
fibers ending in end feet, located in and on top of the NFL25,26. In order to determine if the
observed Lc3-GFP+ processes are RGC dendrites or Müller glia processes, a staining for Gfap
was performed on cryosections of 3 dpi Lc3-GFP zebrafish. The results in Fig. 5.3 clearly
indicate a co-localization of Gfap and Lc3 in the IPL, as well as in the NFL, where the end feet
of the Müller cells are localized.
Fig. 5.3 Immunostaining for Gfap on retinal cryosections of (CMV:GFP-Lc3) autophagy reporter fish, three days
after ONC.
A clear overlap was visible between the green Lc3 and red Gfap signal in the IPL fibers, as well as in the NFL,
where the end feet of the Müller glia are situated. Scale bar = 25 µm.
Dpi, days post-injury; GFP, green fluorescent protein; INL, inner nuclear layer; IPL, inner plexiform layer; Gfap,
glial fibrillary acidic protein; Lc3, microtubule-associated protein 1A/1B-light chain 3; NFL, nerve fiber layer; RGCL,
retinal ganglion cell layer.
To conclude, all these data show that an enhanced cellular recycling response is
triggered after ONC in RGC axons and somas, as well as in Müller glia cells.

Autophagy | 173
4.2.2 Characterization of the autophagic response after optic nerve
injury in the optic nerve/tract using Lc3-GFP fish
Next, the autophagy response was further mapped using cryosections of visual systems
of Tg(CMV:GFP-Lc3) zebrafish, obtained at different time points after optic nerve damage (Fig.
5.4). In contrast to the naive condition, a small increase in Lc3-GFP intensity was detected one
day after ONC, mostly close to the crush site. However, two days later, a strong upregulation
of autophagy was clearly visible throughout the optic nerve, but most pronounced before and
at the site of impact. While this autophagy reporter signal was evenly spread inside the optic
fiber tract between the eye and the brain at 6 dpi, it was more localized towards the brain at
10 dpi. Two weeks post-ONC, baselines levels of Lc3 expression were re-approached. To
conclude, a strong upregulation of the autophagic response was visible in the RGC axons after
optic nerve injury, which relocated during the axonal regeneration phase from close to the
optic nerve head, towards approaching the optic tectum at later stages.
Fig. 5.4 Autophagy visualization in the RGC axons using horizontal visual system sections of Tg(CMV:GFP-Lc3)
reporter fish, at different time points after optic nerve injury.
The Lc3-GFP signal intensity was only marginally increased one day after optic nerve damage inside RGC axons,
but was massively enhanced two days later, mainly before and near the crush site. Next, Lc3-GFP fluorescence
was evenly spread throughout the RGC axons, while it was predominantly located close to the brain at 10 dpi.
The autophagy response inside the axons was almost completely resolved two weeks after ONC. Scale bar = 200
µm. The white line indicates the crush site.
Dpi, days post-injury; GFP, green fluorescent protein; Lc3, microtubule-associated protein 1A/1B-light chain 3;
NFL, nerve fiber layer; ON, optic nerve/chiasm/tract; ONC, optic nerve crush; RGCL, retinal ganglion cell layer.

174 | Chapter 5
4.2.3 Characterization of the autophagic response after optic nerve injury in the optic tectum using Lc3-GFP fish
Finally, using coronal vibratome brain sections of Tg(CMV:GFP-Lc3) fish, we were able to show autophagy induction in the optic tectum
after optic nerve damage as well (Fig. 5.5). At 1 dpi, a striped Lc3-GFP+ pattern was observed in the total innervation area of the optic tectum
(SFGS and SO), but this changed into a dotted structure that overlapped with DAPI stained nuclei, two days later. At 6 dpi, in addition to GFP
positive somas, the Lc3 reporter signal could also be detected in the outer regions of the optic tectum, resembling the pattern of axonal optic
tectum reinnervation in the SFGS and SO after ONC visualized in previous experiments using retrograde biocytin tracing. The Lc3-GFP+ area was
further enlarged at 10 dpi, again seemingly matching with the expected expanded reinnervated area at this time point. Again, the autophagic
response inside the optic tectum returned to baseline levels three weeks post optic nerve damage.

Autophagy | 175
To unravel the identity of the cells with Lc3+ somata observed in the SO and SFGS of the
optic tectum after optic nerve damage, an immunostaining for HuC/D, which labels neurons,
was performed on coronal brain sections of fish three days after ONC. As observed in Fig. 5.6,
Lc3 and HuC/D did not overlap, which enables us to exclude neurons as the autophagy positive
cells in this region.
In addition, using a staining for L-plastin, a pan-leukocyte marker, no co-expression of
this protein with Lc3 was detected, excluding microglia or infiltrating immune cells as the
observed Lc3+ cells (Fig. 5.7).
< Fig. 5.5 Characterization of autophagy induction in the optic tectum using vibratome sections of
Tg(CMV:GFP-Lc3) fish, at different time points after optic nerve damage.
In contrast to the naive condition showing low levels of Lc3-GFP fluorescence, a bright striped pattern was visible
in the SO and SFGS of the optic tectum one day after performing the ONC. Thereafter, Lc3-GFP+ somas were
visible at 3, 6 and 10 dpi, with the latter two time points also showing more fluorescent areas similar to where
axons would reinnervate after ONC (SFGS and SO). Three weeks after injury, the autophagic response was finally
resolved. Scale bar = 200 µm (top panels) or 25 µm (bottom panels).
Dpi, days post-injury; GFP, green fluorescent protein; post-injury; Lc3, microtubule-associated protein 1A/1B-
light chain 3; SFGS, stratum fibrosum et griseum superficiale; stratum opticum (SO).
Fig. 5.6 Immunostaining for HuC/D, a
neuronal marker, on a brain cryosection
of Lc3-GFP zebrafish, three days after
ONC.
Representative image showing the
innervation area of the optic tectum
depicts that the green Lc3 signal (arrows)
and red HuC/D marker (arrow heads) do
not overlap. Scale bar = 25 µm.
GFP, green fluorescent protein; Lc3,
microtubule-associated protein 1A/1B-
light chain 3; ONC, optic nerve crush;
SFGS, stratum fibrosum et griseum
superficiale; SO, stratum opticum.

176 | Chapter 5
As neurons and leukocytes can be excluded, we can assume that the observed
autophagy positives cells in the superficial innervation area of the optic tectum (SO and SFGS)
after injury, are macroglia, another cell population in the zebrafish brain (see discussion).
Next, because our data in the optic tectum and optic nerve/tract suggested that
autophagy is located in or is closely associated with the regrowing RGC axons, a staining for
Gap-43, a marker for (re)growing neurites, was performed on sections of the visual system
and the brain. In both tissues, extensive overlap of Gap-43 and Lc3 was detected, which was
most pronounced in the optic tectum. This thus confirms the idea that autophagy is also
inside/closely associated with the regrowing RGC axons (Fig. 5.8).
Fig. 5.7 Immunostaining for L-plastin,
a pan-leukocyte marker, on a brain
cryosection of Lc3-GFP zebrafish, three
days after ONC.
Representative image indicates that
the green Lc3 signal (arrows) and red L-
plastin marker (arrow heads) do not
overlap. Scale bar = 25 µm.
GFP, green fluorescent protein; Lc3,
microtubule-associated protein 1A/1B-
light chain 3; ONC, optic nerve crush.
SFGS, stratum fibrosum et griseum
superficiale; stratum opticum (SO).

Autophagy | 177
Fig. 5.8 Immunostaining for Gap-43 on visual system and brain sections of Lc3-GFP zebrafish at, respectively 3
and 6 dpi.
In both the optic nerve (panel A) and the brain (panel B), the red (Gap-43) and green (Lc3) fluorescent signals
were largely overlapping, indicated by the orange color in the merged pictures. Scale bar panel A (optic nerve) =
75 µm. Scale bars panel B = 200 µM (DAPI overview) and 30 µm (zoom).
Dpi, days post-injury; GFP; green fluorescent protein; Gap-43, growth-associated protein 43; Lc3, microtubule-
associated protein 1A/1B-light chain 3.
To sum up, after optic nerve crush, autophagy was visible in the optic tectum in the
regrowing RGC axons, as well as in cell bodies of additional cells, of which we showed that
they are not neurons nor leukocytes.
4.2.4 Characterization of the autophagic response after optic nerve
injury in the retina using WB
Besides mapping the cellular recycling process induced by ONC using the autophagy
reporter zebrafish, we further envisioned to semi-quantify this process using WB for Atg5, an
important mediator of autophagy, on retinal samples harvested at different time points after
ONC. However, no significant upregulation of Atg5 protein expression was detected, although
a trend was observed with a small Atg5 increase from six hours to six days after injury (Fig.
5.9).

178 | Chapter 5
4.2 THE EFFECT OF AUTOPHAGY INHIBITION ON AXONAL REGENERATION
AFTER OPTIC NERVE INJURY IN ADULT ZEBRAFISH
As an autophagy response was induced inside RGC axons and somas upon optic nerve
injury in adult zebrafish, a next step was to manipulate this cellular recycling response to
investigate the potential consequence on axonal regeneration. Therefore, bafilomycin A1 was
used to optimize a protocol for prolonged autophagy inhibition after ONC in adult zebrafish.
A successful bafilomycin A1-mediated autophagy suppression prevents autophagosome-
lysosome function and is thus observed by increased Lc3-GFP fluorescence because the
formed autophagosomes fail to fuse with lysosomes and thus, are not recycled but instead
accumulate over time. Fig. 5.10 shows the expected injury-induced Lc3-GFP+ fluorescence
increase in the untreated and vehicle-treated conditions at 3 dpi in the NFL and RGCL of
Tg(CMV:GFP-Lc3) zebrafish, which is in line with the previous results (Fig. 5.1 and 5.2). These
data then also reveal that the vehicle has no effect on the autophagy response. In the
bafilomycin condition, the Lc3-GFP signal intensity was way more intense, certainly in the NFL,
indicative for the accumulation of autophagosomes over time.
Fig. 5.9 Bar graph showing Atg5 expression levels
quantified via western blotting using retinal
samples collected at different time points after
ONC.
No significant difference between Atg5 (47 kDa)
levels over time could be detected, although a
small trend was visible in which autophagy was
upregulated between 6 hpi and 6 dpi. Data
represent mean ± SEM. N = 4-6, One-way ANOVA.
Autophagy related gene 5; Dpi, days post-injury;
hpi, hours post-injury; ONC, optic nerve crush.
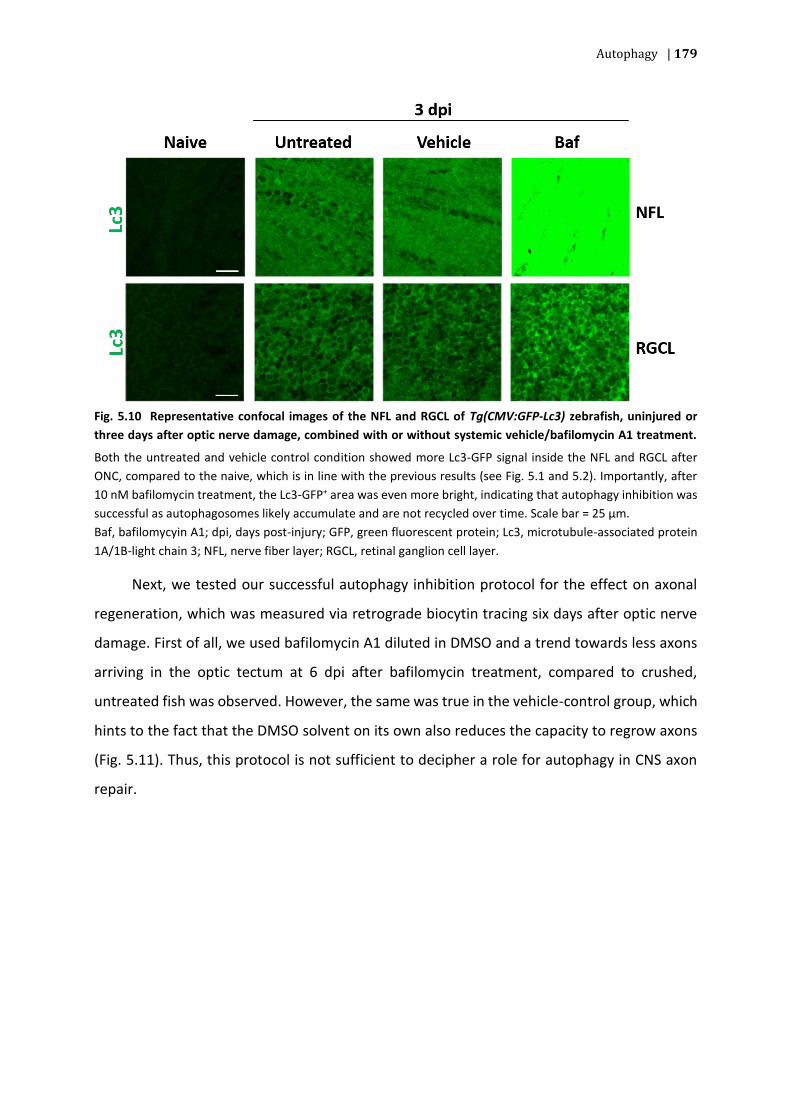
Autophagy | 179
Fig. 5.10 Representative confocal images of the NFL and RGCL of Tg(CMV:GFP-Lc3) zebrafish, uninjured or
three days after optic nerve damage, combined with or without systemic vehicle/bafilomycin A1 treatment.
Both the untreated and vehicle control condition showed more Lc3-GFP signal inside the NFL and RGCL after
ONC, compared to the naive, which is in line with the previous results (see Fig. 5.1 and 5.2). Importantly, after
10 nM bafilomycin treatment, the Lc3-GFP+ area was even more bright, indicating that autophagy inhibition was
successful as autophagosomes likely accumulate and are not recycled over time. Scale bar = 25 µm.
Baf, bafilomycyin A1; dpi, days post-injury; GFP, green fluorescent protein; Lc3, microtubule-associated protein
1A/1B-light chain 3; NFL, nerve fiber layer; RGCL, retinal ganglion cell layer.
Next, we tested our successful autophagy inhibition protocol for the effect on axonal
regeneration, which was measured via retrograde biocytin tracing six days after optic nerve
damage. First of all, we used bafilomycin A1 diluted in DMSO and a trend towards less axons
arriving in the optic tectum at 6 dpi after bafilomycin treatment, compared to crushed,
untreated fish was observed. However, the same was true in the vehicle-control group, which
hints to the fact that the DMSO solvent on its own also reduces the capacity to regrow axons
(Fig. 5.11). Thus, this protocol is not sufficient to decipher a role for autophagy in CNS axon
repair.

180 | Chapter 5
Pharmacological agents for systemic treatment are also often dissolved in methanol in
the host lab27, so next this solvent was used to dilute bafilomycin. Again, no signs of
illness/distress were detected upon bafilomycin A1 application. Furthermore, quantification
of the reinnervated area in the optic tectum excluded a possible effect of methanol, as the
level of axonal regrowth after ONC in untreated or vehicle-treated fish was similar (Fig. 5.12).
Strikingly however, bafilomycin A1 enhanced axon repair, in comparison to the two control
groups, and six days after injury, tectal reinnervation was seemingly finalized in this condition.
In conclusion, these data thus indicate that autophagy inhibition using 10 nM bafilomycin A1
dissolved in methanol, can promote/accelerate axonal regrowth.
Fig. 5.11 Quantification of tectal reinnervation via
retrograde biocytin tracing after autophagy inhibition
using 10 nM bafilomycin A1, diluted in DMSO.
Representative images and semi-quantitative analysis
of the area covered by RGC axons show a trend that
vehicle (DMSO) or 10 nM bafilomycin A1 treatment,
both have a detrimental effect on axonal regrowth,
although no significant difference could be detected
between untreated crushed fish, or after
vehicle/bafilomycin A1 systemic delivery. Based on
these data, a negative effect of DMSO on axonal
reinnervation is thus plausible. Scale bar = 200 µm. Data
represent mean ± SEM. N = 4, except naive (3), One-Way
ANOVA with Tukey post-hoc test, * p < 0.05.
Baf, bafilomycin A1; DMSO, dimethylsulfoxide; dpi, days
post-injury.

Autophagy | 181
Fig. 5.12 Quantification of tectal reinnervation
using retrograde biocytin tracing after autophagy
inhibition using 10 nM bafilomycin A1, diluted in
methanol.
Representative images and semi-quantitative
analysis of the area covered by RGC axons show that
bafilomycin A1 has a positive effect on axonal
regeneration as more axons re-entered the optic
tectum after autophagy-inhibition, compared to
untreated or vehicle-control fish. Furthermore, as
the area covered by RGC axons in the latter two
control groups was similar, an effect of methanol on
axon regrowth could be excluded. Scale bar = 200
µm. Data represent mean ± SEM. N = 6-7, except
naive (3), One-Way ANOVA with Tukey post-hoc test,
* p < 0.05, ** p < 0.01.
Baf, bafilomycin A1; dpi, days post-injury; MeOH,
methanol.

182 | Chapter 5
4.3 THE EFFECT OF MTOR INHIBITION USING RAPAMYCIN ON AUTOPHAGY
INDUCTION
As the autophagic response is negatively regulated by mTOR, rapamycin, an inhibitor of
this protein, is widely used as an autophagy inducer. To test if rapamycin triggers a similar
autophagic increase in the visual system of adult zebrafish, we intravitreally injected this
compound in naive Tg(CMV:GFP-Lc3) zebrafish and sacrificiced them eight hours/one day
post-injection. No increase in Lc3-fluorescence was observed in the retina or optic tectum
after vehicle or rapamycin injection, compared to uninjected animals. Next, rapamycin was
injected in animals subjected to ONC, at the moment of crush and one day later, but also in
these mTOR-inhibited animals harvested at 1 and 3 dpi, only a normal level of autophagy
induction was observed in the retina, which was found comparable to that of untreated or
vehicle-treated crushed zebrafish. Hence, we did not detect Lc3-GFP changes in our reporter
fish in the retina or optic tectum after rapamycin treatment, compared to the control
conditions.

Autophagy | 183
4 DISCUSSION
Autophagy is the cellular quality control mechanism that removes unwanted/damaged
organelles or proteins, necessary for normal growth and ageing, as well as to cope with
potential risk factors, including tissue damage, nutrient deprivation or pathogen invasion. In
this chapter, we clearly indicated that autophagy was induced in the spontaneously-
regenerating adult zebrafish subjected to optic nerve damage in different cell types of the
retina and brain. First of all, the recycling response was induced in the RGC somas and axons,
similarly as observed in different rodent models of optic nerve damage5–7. Moreover, the
spatiotemporal increase in autophagic expression in the RGC axons clearly follows the pattern
of axonal regrowth in zebrafish, i.e. at every time point after injury the complete length of the
regrowing axons is also Lc3-GFP+. In the optic nerve, for example, a massive increase of Lc3-
GFP+ area was observed spreading from the optic nerve head to just behind the crush site (Fig.
5.4) at three days post-ONC, which coincides with the distance that the axons have covered
at that time point, as observed in published results by the host lab28. At 6 dpi, autophagy was
detected in the entire optic nerve, thus also in the axons within the optic tract up to where
they reach their target neurons in the optic tectum, matching with the fact that already 70%
of the axons were found to reinnervate the tectum at this time point. Four days later, at 10
dpi, tectal reinnvervation is known to be completed, and autophagy is also only visible in the
distal region of the optic tract. Detailed observations in the brain confirm the idea that
autophagy is upregulated in regrowing RGC axons, as the Lc3 positive area is present at 6 and
10 dpi in the SFGS and SO, the outer areas of the optic tectum, innervated by RGC axons (Fig.
5.5). Notably, this area is clearly enlarged at 10 dpi, as compared to 6 dpi, which coincidences
with increased tectal reinnervation over time. Lastly, the overlapping Gap-43 immunostaining
with the Lc3 autophagy marker strengthens the hypothesis of autophagy induction in
elongating axons (Fig. 5.8). This observed intra-axonal autophagy could be necessary for
stabilization of the microtubules and remodeling of the growth cone structure, as suggested
by He et al. (2016). Indeed, they showed that autophagy induction in the axons enhanced
axonal regrowth and functional recovery in mice after spinal cord injury, due to the
degradation of a microtubule-destabilizing protein29–31.
Besides being augmented in the injured RGCs, the cellular recycling response was also
significantly upregulated in the retinal Müller glia at three days post optic nerve damage, as

184 | Chapter 5
indicated by the overlap in Gfap staining with Lc3-GFP+ fibers in the IPL (Fig. 5.3). Strikingly,
Kang et al. (2019) also reported autophagy induction in Müller glia after ONC in rats7. Besides
providing structural and metabolic support for neurons, these cells have been shown to
phagocytize cellular debris under physiological, pathological or experimental conditions. For
example, Müller glia have been shown to phagocytose apoptotic cell bodies during
development of the visual system in diverse models, and remove foreign molecules after
intravitreal injection32,33. Moreover, after light-induced retinal damage, they have been shown
to be the predominant cells engulfing cone outer segments and apoptotic photoreceptor cell
bodies in zebrafish32,33. Phagocytosis normally does not make use of Lc3 molecules to form a
membrane around the cargo, as substrates are directly engulfed by the cellular membrane.
However, another unconventional clearing mechanism used by phagocytic cells is called LC3-
associated phagocytosis (LAP), in which Lc3 is translocated on the phagosomal membrane
after cargo uptake, thereby facilitating phagosome maturation and enhancing phagosome-
lysosome fusion34–37. As we showed in chapter 3 that ONC in adult zebrafish triggers
synaptic/dendritic deterioration, it is thus possible that the Lc3+ Müller glia are responsible to
remove synaptic/dendritic debris in the inner retina. Of note, as these Lc3+ fibers in the IPL all
are overlapping with Gfap, our data suggest that autophagy is not present in the RGC dendrites
within the retina of fish subjected to ONC.
Importantly, Lc3+ autophagic cells bodies were also detected in the superficial layers (SO
and SFGS) of the optic tectum of adult zebrafish after injury, for which we could exclude a
neuronal or leukocyte cell-type identity (Fig. 5.5-7). It is thus plausible to assume that these
cells are macroglia, which include in the CNS (1) ependymal cells, (2) radial glia, (3) astrocytes
and (4) oligodendrocytes. As ependymal cells line the ventricular system of the brain38,39, and
the somata of the radial glia are situated in a deeper layer of the optic tectum, namely in the
nuclear periventricular gray zone (PGZ)40–42, we can eliminate both cell types as being the Lc3-
GFP cells in the SO and SFGS, because the cell bodies of these cell populations are not situated
here in zebrafish. Furthermore, the zebrafish CNS lacks stellate astrocytes, except for the optic
nerve42–44, so these Lc3+ cells are most likely also no astrocytes, unless they migrated from the
optic nerve to the superficial layers of the optic tectum. This could be studied using a staining
for cytokeratin 18, the proposed marker for astrocytes in the zebrafish optic nerve45. The Lc3+
cells in the superficial tectal layers might thus be oligodendrocytes or oligodendrocyte

Autophagy | 185
precursors, which can indeed be found in the SO and SFGS46,47. Interestingly, two papers
suggest a positive role of autophagy in the myelination capacity of oligodendrocytes/Schwann
cells. Augmenting autophagy in rats for two months via a fasting diet, resulted in a larger
proportion of myelinated axons and thicker myelin sheaths, both in control fasted rats, as well
as in long-Evans shaker rats, which contain a mutation in myelin basic protein, resulting in
severe CNS demyelination48. Moreover, in dorsal root ganglia (DRG) explants of two genetic
peripheral nervous system (PNS) demyelinating neuropathy mouse models, rapamycin
treatment, which triggered autophagy induction in Schwann cells, improved myelination. As
knockdown of Atg5, a key protein for autophagosome formation, abolished this pro-
myelination effect in these models, it suggests that autophagy is here a crucial underlying
player49. All in all, it is thus plausible to hypothesize that these Lc3+ cells in the SO and SFGS of
zebrafish after ONC are oligodendrocytes or oligodendrocyte precursors that need to
remyelinate the newly grown RGC axons in adult fish after injury and use autophagy
throughout this process. More research is, however, definitely necessary to proof this idea,
e.g. via an immunostaining for e.g. oligodendrocyte transcription factor 2 (Olig2) or myelin-
associated glycoprotein (Mag)50,51, as we did not investigate this yet due to time limits. In
addition, immunostainings for radial glia (Gfap, brain lipid-binding protein (Blpb) will be
further optimized, as I tried these on brain cryosections of zebrafish, which were not
successful yet. These stainings would be of added value for two reasons: (1) to exclude with
certainty that the cell bodies in the SFGS and SO are not radial glia and (2) to investigate if
radial glia, situated in the nuclear PGZ zone, but with their glial fibers extending into the
superficial optic tectum layers, also upregulate autophagy in their cell bodies/fibers. It is for
example possible that the striped Lc3 pattern observed in the SO/SFGS one day after injury
(Fig. 5.5), are fibers of these radial glia, and that these cells are also contributing to the removal
of degenerating axons using Lc3. All in all, we are not able yet to pinpoint the exact cell type
identity of the autophagy positive cells in the SO/SFGS of the zebrafish optic tectum after
injury. More immunostainings are necessary to investigate this, as well as to determine if
radial glia also employ autophagy in their response after injury.
Although the induction of an autophagic response after ONC in adult zebrafish is now
for the first time mapped using the Tg(CMV:GFP-Lc3) autophagy reporter line, we were not
able to quantify this using WB, as no significant increase of Atg5 protein expression was

186 | Chapter 5
detected in retinal samples harvested at various time points after injury (Fig. 5.9). Using the
same technique, the protein levels of other autophagy markers could be quantified, but one
thing to keep in mind is that the standard samples to detect retinal proteins used here are
total retinas. The use of complete retinal tissues is unavoidably associated with a dilution
effect as the RGCs, the cells of main interest, only form a small percentage of the total retinal
cell population52. The same problem would hold for quantifying mRNA expression levels with
real-time polymerase chain reaction (RT-QPCR) in total retinal lysates. Up to now, one of the
most used and accurate techniques to visualize and quantify autophagy is electron microscopy
(EM), which would certainly add value to this research as it would enable to distinguish the
individual autophagosomes and potentially even shed light on the engulfed substrates (e.g.
mitochondria)20,21,53.
Using EM imaging, complemented with autophagy protein/mRNA expression
quantification and the use of Tg(CMV:GFP-Lc3) reporter fish, different research groups have
shown that autophagy is induced in zebrafish shortly after injury of the heart, amputation of
the caudal fin and removal of extraocular muscles, indicating that autophagy upregulation is
a general response after injury in adult zebrafish22,54. Noteworthy, to our knowledge, we are
the first to report injury-induced autophagy in adult zebrafish after CNS damage.
In order to test if autophagy could affect successful regeneration in adult zebrafish, the
authors of the previously mentioned zebrafish studies manipulated the intracellular recycling
mechanism. First of all, increasing mTOR-dependent autophagy using two-daily
intraperitoneal injections of rapamycin in zebrafish subjected to heart injury, caused impaired
cardiac repair and thus suggests that prolonged autophagy is detrimental for the regenerative
outcome55. This is contradicted by the other two zebrafish papers in which regeneration was
abolished after fin amputation or extraocular muscle removal when autophagy was prevented
using chloroquine, bafilomycin A1 or knockdown of atg5 using antisense morpholinos22,54.
Here, we used a similar strategy to investigate the effect of autophagy on axonal
regrowth using bafilomycin A1 as autophagy inhibitors, for which we showed that it efficiently
blocks autophagy after ONC in adult zebrafish (Fig. 5.10). When using bafilomycin A1
treatment, we noticed another failure as here the vehicle DMSO control had an unwanted
negative effect on axonal regeneration (Fig. 5.11). As other papers also indicated that DMSO
can cause cellular toxicity, potentially leading to neuronal damage22,56,57, we decided to

Autophagy | 187
replace the diluent for bafilomycin A1 by methanol58–60. This solvent was shown to be
tolerated by zebrafish larvae up to 2% without any adverse effects61, and also in this thesis no
effect on general fish health or axonal regrowth was detected. Strikingly, an enhancement of
tectal reinnervation was measured upon bafilomycin A1-mediated autophagy suppression
(Fig. 5.12). As most of the available literature supports a beneficial effect of autophagy on
axonal regeneration, the observed pro-regenerative result of autophagy inhibition in our
study was unexpected. Moreover, we showed that during the process of spontaneous and
efficient axonal regeneration in adult zebrafish after ONC, a timed and balanced autophagic
response is induced, suggesting that this process is beneficial, or at least not detrimental, for
the repair of axons in this model (Fig. 5.1-5.4). However, two papers report a similar axon
growth promoting effect upon autophagy impairment, supporting our finding16,17. Indeed, in
an in vitro set-up with rat cortical neurons, autophagy was inhibited using knockdown of ATG7
or 3-MA treatment and this enhanced axonal elongation, comparable to the result of our
study16. Increasing the recycling response using rapamycin resulted in the opposite effect,
namely axonal growth suppression. Preliminary indications for the underlying mechanism of
the pro-regenerative effect upon autophagy inhibition were found in the Ras homolog gene
family member A (RhoA), rho-associated protein kinase (ROCK) pathway, an important
suppressor of axonal growth. Indeed, RhoA expression levels were decreased in cortical cells
upon autophagy failure, clearing the path for axons to grow. In addition, when autophagy-
inhibited cells were transfected with a constitutive active form of RhoA, axonal elongation was
not promoted any longer, indicating that this pathway is indeed important for establishment
of axons in this model. To conclude, autophagy thus negatively affected axon outgrowth in
these cultured cortical rat neurons, via activation of the suppressive RhoA-ROCK signaling
cascade. A second paper stating that autophagy is detrimental for generating axons used rat
PC12 cells, immortalized cells derived from adrenal medulla and used as neuronal cell model.
In this report, treating these cells with bafilomycin A1 increased neurite outgrowth, but no
potential underlying mechanism was studied/suggested17.
Importantly, the observed beneficial effect of autophagy inhibition on axonal regrowth,
matches with the results reported in chapter 3, namely that injection of rapamycin, widely
used to stimulate autophagy, hampers tectal innervation in adult zebrafish. Although mTOR
was shown to be involved in a wide range of important cellular processes, e.g. protein

188 | Chapter 5
translation, cell survival and regulation of dendrite structure, the reduction in axon regrowth
after inhibition of this protein in adult zebrafish might thus be partly explained by an effect on
the cellular recycling response. Moreover, in zebrafish subjected to heart injury,
intraperitoneal rapamycin injections slowed down cardiac repair, and here increased cellular
apoptosis and an altered inflammatory response (more neutrophils, less macrophages) were
detected as changed parameters upon mTOR inhibition. Unfortunately, we were not able to
confirm that this widely used autophagy inducer triggers autophagy upregulation in the visual
system of zebrafish, as no Lc3 fluorescence increase in the retina or optic tectum was observed
after rapamycin injection in naive or crushed animals, compared to the vehicle condition.
Different reasons could underlie the absence of Lc3-GFP increase after rapamycin treatment.
Firstly, it might be that rapamycin does not induce autophagy in the retina of adult zebrafish
after intravitreal injection. However, Espin et al. (2016) did show an increased autophagic
response in the complete body of naive zebrafish larvae after 72 hours of systemic rapamycin
treatment, detected via WB and Lc3-GFP increase in reporter fish62. Also, an enhanced
autophagic response, measured via WB, was observed 28 days post partial heart amputation
in adult zebrafish after repeated intraperitoneal injections with rapamycin, compared to
injured control fish55. In a study by Schiebler et al. (2015), however, zebrafish larvae were
incubated in a rapamycin-suspension for one day and here no significant raise in phagosome
number was detected, similar as in our study63. It is thus possible that in our set-up, the used
time points to check an autophagic increase were too early to observe a significant effect
(eight hours and one day after intravitreal injection in naive animals and one and three days
after the first injection in crushed animals). A second option is that rapamycin injection only
marginally raised autophagic levels, and that the use of autophagy reporter zebrafish is not
sensitive enough to visualize this, but that it could be detected by e.g. EM. Thirdly, as it is
known that inhibiting mTOR can enhance autophagy via increasing, among other things,
lysosome biogenesis, rapamycin treatment could accelerate autophagosome clearance via
lysosomes, resulting in steady-state Lc3 fluorescence levels64–68. Of note, in order to proof that
rapamycin injection induces autophagy in our model, this treatment should be combined with
the late-stage autophagy inhibitor bafilomycin A1, which prevents autophagosome-lysosome
fusion. In this way, autophagosome formation after rapamycin or vehicle treatment can be
easily quantified, as formed vesicles will simply accumulate over time because turn-over is
stopped69.
Autophagy | 189
To further decipher the underlying mechanism for the seemingly counteracting role of
autophagy in axonal regeneration, we could start by investigating the role of the RhoA-ROCK
pathway as autophagy was shown to activate this suppressive axon regrowth signaling
cascade16. Moreover, improved axonal regrowth upon autophagy inhibition should be
confirmed using another pharmacological or gene knockdown method, with the latter being
the preferred choice as different autophagy inhibitors used in vitro, showed neurotoxic effects
in vivo, similar to what we observed using chloroquine (data not shown). However, the use of
mutant fish with stable knockdown/knockout of important autophagy mediators, e.g. created
using clustered regularly interspaced short palindromic repeats (CRISPR)/CRISPR-associated
protein 9 (CAS9) or TAL effector nucleases (TALENs), is also not optimal as autophagy
deficiency or impairment is established from the day of birth, probably leading to early
developmental defects. For example, CRISPR/Cas9-mediated knockdown of spinster homolog
1 (spns1), functioning in a late stage of autophagy, led to cellular senescence throughout the
body, detected via a senescence-associated β-galactosidase activity assay, in zebrafish
larvae20,70. Gene expression should thus preferably be reduced/prevented in an inducible way,
and different approaches are possible: 1) heat-shock combined with heat-shock-inducible
promotors71,72, (2) the tamoxifen-inducible estrogen-receptor controlled (ER) Cre/lox
system73,74 (3) the tamoxifen-inducible GAL4-ER/UAS method75,76, (4) the tetracycline (Tet)- or
doxycycline-inducible Tet-On/Off system77,78, or (5) the mifepristone-inducible LexPR
approach73,79,80. Secondly, morpholino-modified antisense oligonucleotides could be used to
introduce gene knockdown, however, in order to obtain efficient delivery to the retinal cells
of adult zebrafish, intravitreal injection of positively-charged lissamine-tagged morpholinos
need to be combined with electroporation81. Morpholinos, when used with the proper control
conditions to exclude off-target effects, have indeed been shown to be a valuable tool for
zebrafish research, also in relation to autophagy. For example, Varga et al. (2014) reported
that fin regeneration after partial amputation was hampered upon depletion of Atg5, using an
antisense morpholino oligonucleotide targeting atg5 injected in the dorsal half of the fin,
compared to fish injected with the control morpholino. A similar morpholino-based strategy
to induce autophagy inhibition could aid in our goal to unravel the role of the cellular recycling
response in axonal regeneration after ONC in adult zebrafish.

190 | Chapter 5
5 CONCLUSION
Overall, increased autophagy was shown in adult zebrafish after ONC and found inside
RGC somas and axons, as well as in Müller glia cells in the retina, and presumably also in
oligodendrocytes residing in the superficial layers of the optic tectum, although this still needs
to be confirmed. Importantly, the spatiotemporal pattern of autophagy inside the axons,
clearly follows that of axonal regrowth. Furthermore, bafilomycin A1-mediated autophagy
suppression enhanced axonal regeneration, as compared to injured control fish, hinting that
autophagy can hinder the regenerative response. Although this finding needs to be confirmed
with other autophagy inhibition experiments, it matches with the results described in chapter
3 in which rapamycin injection was found to hamper axon regrowth. Unfortunately, we were
not able yet to visualize increased autophagy induction upon rapamycin treatment in our
fluorescent reporter zebrafish.
Autophagy | 191
6 REFERENCES
1. Nixon, R. A. The role of autophagy in neurodegenerative disease. Nature Medicine 19, 983–997 (2013).
2. Glick, D., Barth, S. & Macleod, K. F. Autophagy: Cellular and molecular mechanisms. Journal of Pathology 221, 3–12 (2010).
3. Scrivo, A., Bourdenx, M., Pampliega, O. & Cuervo, A. M. Selective autophagy as a potential therapeutic target for neurodegenerative disorders. The Lancet Neurology 17, 802–815 (2018).
4. Mizushima, N. & Komatsu, M. Autophagy: Renovation of cells and tissues. Cell 147, 728–741 (2011).
5. Knöferle, J. et al. Mechanisms of acute axonal degeneration in the optic nerve in vivo. Proc. Natl. Acad. Sci. U. S. A. 107, 6064–6069 (2010).
6. Rodríguez-Muela, N., Germain, F., Marĩo, G., Fitze, P. S. & Boya, P. Autophagy promotes survival of retinal ganglion cells after optic nerve axotomy in mice. Cell Death Differ. 19, 162–169 (2012).
7. Kang, L. H., Zhang, S., Jiang, S. & Hu, N. Activation of autophagy in the retina after optic nerve crush injury in rats. Int. J. Ophthalmol. 12, 1395–1401 (2019).
8. Park, H. Y. L., Kim, J. H. & Park, C. K. Activation of autophagy induces retinal ganglion cell death in a chronic hypertensive glaucoma model. Cell Death Dis. 3, (2012).
9. Anwar, T. et al. ER-Targeted Beclin 1 Supports Autophagosome Biogenesis in the Absence of ULK1 and ULK2 Kinases. Cells 8, 475 (2019).
10. Li, X. G., Du, J. H., Lu, Y. & Lin, X. J. Neuroprotective effects of rapamycin on spinal cord injury in rats by increasing autophagy and Akt signaling. Neural Regen. Res. 14, 721–727 (2019).
11. Romeo-Guitart, D., Leiva-Rodriguez, T., Forés, J. & Casas, C. Improved Motor Nerve Regeneration by SIRT1/Hif1a-Mediated Autophagy. Cells 8, 1354 (2019).
12. Huang, H. cheng et al. Autophagy Promotes Peripheral Nerve Regeneration and Motor Recovery Following Sciatic Nerve Crush Injury in Rats. J. Mol. Neurosci. 58, 416–423 (2016).
13. Liu, L., Tian, D., Liu, C., Yu, K. & Bai, J. Metformin enhances functional recovery of peripheral nerve in rats with sciatic nerve crush injury. Med. Sci. Monit. 25, 10067–10076 (2019).
14. Leiva-Rodríguez, T. et al. ATG5 overexpression is neuroprotective and attenuates cytoskeletal and vesicle-Trafficking alterations in axotomized motoneurons article. Cell Death Dis. 9, (2018).
15. He, M. et al. Autophagy induction stabilizes microtubules and promotes axon regeneration after spinal cord injury. Proc. Natl. Acad. Sci. U. S. A. 113, 11324–11329 (2016).
16. Ban, B.-K. et al. Autophagy Negatively Regulates Early Axon Growth in Cortical Neurons. Mol. Cell. Biol. 33, 3907–3919 (2013).
17. Tamura, H. omi & Ohkuma, S. Induction of neurite outgrowth of PC12 cells by an inhibitor of vacuolar H+-ATPase, bafilomycin A1. FEBS Lett. 294, 51–55 (1991).
18. Chakrabarti, L., Eng, J., Ivanov, N. & Garden, G. A. Autophagy activation and enhanced mitophagy characterize the Purkinje cells of pcd mice prior to neuronal death. Mol. Brain 2, (2009).
19. Wang, Q. J. et al. Induction of autophagy in axonal dystrophy and degeneration. J. Neurosci. 26, 8057–8068 (2006).
20. Mathai, B., Meijer, A. & Simonsen, A. Studying Autophagy in Zebrafish. Cells 6, 21 (2017). 21. He, C. & Klionsky, D. J. Analyzing autophagy in zebrafish. Autophagy 6, 642–644 (2010). 22. Varga, M. et al. Autophagy is required for zebrafish caudal fin regeneration. Cell Death Differ.
21, 547–556 (2014). 23. Mauvezin, C. & Neufeld, T. P. Bafilomycin A1 disrupts autophagic flux by inhibiting both V-
ATPase-dependent acidification and Ca-P60A/SERCA-dependent autophagosome-lysosome fusion. Autophagy 11, 1437–1438 (2015).
24. Beckers, A. et al. An Antagonistic Axon-Dendrite Interplay Enables Efficient Neuronal Repair in the Adult Zebrafish Central Nervous System. Mol. Neurobiol. 56, 3175–3192 (2019).
25. L., T., C., E., M., J. & Dharmaraj, S. Reactive Muller Glia as Potential Retinal Progenitors. in Neural
192 | Chapter 5
Stem Cells - New Perspectives (2013). 26. Vecino, E., Rodriguez, F. D., Ruzafa, N., Pereiro, X. & Sharma, S. C. Glia-neuron interactions in
the mammalian retina. Progress in Retinal and Eye Research 51, 1–40 (2016). 27. Bollaerts, I., Van Houcke, J., Andries, L., De Groef, L. & Moons, L. Neuroinflammation as Fuel for
Axonal Regeneration in the Injured Vertebrate Central Nervous System. Mediators of Inflammation 2017, (2017).
28. Van houcke, J. et al. Successful optic nerve regeneration in the senescent zebrafish despite age-related decline of cell intrinsic and extrinsic response processes. Neurobiol. Aging 60, 1–10 (2017).
29. He, M. et al. Autophagy induction stabilizes microtubules and promotes axon regeneration after spinal cord injury. Proc. Natl. Acad. Sci. U. S. A. 113, 11324–11329 (2016).
30. Fuentes, J. M. Toxicity and autophagy in neurodegenerative disorders. Toxicity and Autophagy in Neurodegenerative Disorders (2015).
31. Hollenbeck, P. J. Products of endocytosis and autophagy are retrieved from axons by regulated retrograde organelle transport. J. Cell Biol. 121, 305–315 (1993).
32. Bejarano-Escobar, R., Sánchez-Calderón, H., Otero-Arenas, J., Martín-Partido, G. & Francisco-Morcillo, J. Müller glia and phagocytosis of cell debris in retinal tissue. Journal of Anatomy 231, 471–483 (2017).
33. Sakami, S., Imanishi, Y. & Palczewski, K. Müller glia phagocytose dead photoreceptor cells in a mouse model of retinal degenerative disease. FASEB J. 33, 3680–3692 (2019).
34. Heckmann, B. L., Boada-Romero, E., Cunha, L. D., Magne, J. & Green, D. R. LC3-Associated Phagocytosis and Inflammation. Journal of Molecular Biology 429, 3561–3576 (2017).
35. Germic, N., Frangez, Z., Yousefi, S. & Simon, H. U. Regulation of the innate immune system by autophagy: monocytes, macrophages, dendritic cells and antigen presentation. Cell Death and Differentiation 26, 715–727 (2019).
36. Plaza-Zabala, A., Sierra-Torre, V. & Sierra, A. Autophagy and microglia: Novel partners in neurodegeneration and aging. International Journal of Molecular Sciences 18, (2017).
37. Upadhyay, S. & Philips, J. A. LC3-associated phagocytosis: host defense and microbial response. Current Opinion in Immunology 60, 81–90 (2019).
38. Olstad, E. W. et al. Ciliary Beating Compartmentalizes Cerebrospinal Fluid Flow in the Brain and Regulates Ventricular Development. Curr. Biol. 29, 229-241.e6 (2019).
39. Lust, K. & Tanaka, E. M. A Comparative Perspective on Brain Regeneration in Amphibians and Teleost Fish. Developmental Neurobiology 79, 424–436 (2019).
40. Ito, Y., Tanaka, H., Okamoto, H. & Ohshima, T. Characterization of neural stem cells and their progeny in the adult zebrafish optic tectum. Dev. Biol. 342, 26–38 (2010).
41. Lindsey, B. W. et al. Midbrain tectal stem cells display diverse regenerative capacities in zebrafish. Sci. Rep. 9, (2019).
42. Than-Trong, E. & Bally-Cuif, L. Radial glia and neural progenitors in the adult zebrafish central nervous system. Glia 63, 1406–1428 (2015).
43. Lyons, D. A. & Talbot, W. S. Glial cell development and function in zebrafish. Cold Spring Harb. Perspect. Biol. 7, (2015).
44. Grupp, L., Wolburg, H. & Mack, A. F. Astroglial structures in the zebrafish brain. J. Comp. Neurol. 518, 4277–4287 (2010).
45. Koke, J. R., Mosier, A. L. & García, D. M. Intermediate filaments of zebrafish retinal and optic nerve astrocytes and Müller glia: Differential distribution of cytokeratin and GFAP. BMC Res. Notes 3, (2010).
46. de Oliveira-Carlos, V., Ganz, J., Hans, S., Kaslin, J. & Brand, M. Notch Receptor Expression in Neurogenic Regions of the Adult Zebrafish Brain. PLoS One 8, (2013).
47. Bai, Q., Parris, R. S. & Burton, E. A. Different mechanisms regulate expression of zebrafish myelin protein zero (P0) in myelinating oligodendrocytes and its induction following axonal injury. J. Biol. Chem. 289, 24114–24128 (2014).
48. Smith, C. M., Mayer, J. A. & Duncan, I. D. Autophagy promotes oligodendrocyte survival and

Autophagy | 193
function following dysmyelination in a long-lived myelin mutant. J. Neurosci. 33, 8088–8100 (2013).
49. Rangaraju, S. et al. Rapamycin activates autophagy and improves myelination in explant cultures from neuropathic mice. J. Neurosci. 30, 11388–11397 (2010).
50. Ackerman, S. D. & Monk, K. R. The scales and tales of myelination: using zebrafish and mouse to study myelinating glia. Brain Research 1641, 79–91 (2016).
51. März, M., Schmidt, R., Rastegar, S. & Strähle, U. Expression of the transcription factor Olig2 in proliferating cells in the adult zebrafish telencephalon. Dev. Dyn. 239, 3336–3349 (2010).
52. Rheaume, B. A. et al. Single cell transcriptome profiling of retinal ganglion cells identifies cellular subtypes. Nat. Commun. 9, (2018).
53. Ylä-Anttila, P., Vihinen, H., Jokitalo, E. & Eskelinen, E. L. Chapter 10 Monitoring Autophagy by Electron Microscopy in Mammalian Cells. Methods in Enzymology 451, 143–164 (2009).
54. Saera-Vila, A. et al. Extraocular muscle regeneration in zebrafish requires late signals from Insulin-like growth factors. PLoS One 13, (2018).
55. Chávez, M. N. et al. Autophagy Activation in Zebrafish Heart Regeneration. Sci. Rep. 10, (2020). 56. Guh, Y. J., Tseng, Y. C., Yang, C. Y. & Hwang, P. P. Endothelin-1 regulates hh +-atpase-dependent
transepithelial hh + secretion in zebrafish. Endocrinology 155, 1728–1737 (2014). 57. Boisen, A. M. Z., Amstrup, J., Novak, I. & Grosell, M. Sodium and chloride transport in soft water
and hard water acclimated zebrafish (Danio rerio). in Biochimica et Biophysica Acta - Biomembranes 1618, 207–218 (2003).
58. Galvao, J. et al. Unexpected low-dose toxicity of the universal solvent DMSO. FASEB J. 28, 1317–1330 (2014).
59. Zhang, C. et al. Effects of dimethyl sulfoxide on the morphology and viability of primary cultured neurons and astrocytes. Brain Res. Bull. 128, 34–39 (2017).
60. Bollaerts, I. et al. Complementary research models and methods to study axonal regeneration in the vertebrate retinofugal system. Brain Structure and Function 223, 545–567 (2018).
61. Maes, J. et al. Evaluation of 14 Organic Solvents and Carriers for Screening Applications in Zebrafish Embryos and Larvae. PLoS One 7, (2012).
62. Espín-Palazón, R. et al. TNFα Impairs Rhabdoviral Clearance by Inhibiting the Host Autophagic Antiviral Response. PLoS Pathog. 12, (2016).
63. Schiebler, M. et al. Functional drug screening reveals anticonvulsants as enhancers of mTOR‐independent autophagic killing of Mycobacterium tuberculosis through inositol depletion . EMBO Mol. Med. 7, 127–139 (2015).
64. Paquette, M., El-Houjeiri, L. & Pause, A. mTOR pathways in cancer and autophagy. Cancers 10, (2018).
65. Jung, C. H., Ro, S. H., Cao, J., Otto, N. M. & Kim, D. H. MTOR regulation of autophagy. FEBS Letters 584, 1287–1295 (2010).
66. Holczer, M. et al. A double negative feedback loop between MTORC1 and AMPK kinases guarantees precise autophagy induction upon cellular stress. Int. J. Mol. Sci. 20, (2019).
67. Dossou, A. S. & Basu, A. The emerging roles of mTORC1 in macromanaging autophagy. Cancers 11, (2019).
68. Kim, Y. C. & Guan, K. L. MTOR: A pharmacologic target for autophagy regulation. Journal of Clinical Investigation 125, 25–32 (2015).
69. Alayev, A., Berger, S. M., Kramer, M. Y., Schwartz, N. S. & Holz, M. K. The Combination of Rapamycin and Resveratrol Blocks Autophagy and Induces Apoptosis in Breast Cancer Cells. J. Cell. Biochem. 116, 450–457 (2015).
70. Sasaki, T. et al. Autolysosome biogenesis and developmental senescence are regulated by both Spns1 and v-ATPase. Autophagy 13, 386–403 (2017).
71. Shoji, W. & Sato-Maeda, M. Application of heat shock promoter in transgenic zebrafish. Development Growth and Differentiation 50, 401–406 (2008).
72. Airaksinen, S., Jokilehto, T., Råbergh, C. M. I. & Nikinmaa, M. Heat- and cold-inducible regulation of HSP70 expression in zebrafish ZF4 cells. Comp. Biochem. Physiol. - B Biochem. Mol. Biol. 136,

194 | Chapter 5
275–282 (2003). 73. Hans, S., Kaslin, J., Freudenreich, D. & Brand, M. Temporally-controlled site-specific
recombination in zebrafish. PLoS One 4, (2009). 74. Pinzon-Olejua, A. et al. Cre-inducible site-specific recombination in zebrafish oligodendrocytes.
Dev. Dyn. 246, 41–49 (2017). 75. Gerety, S. S. et al. An inducible transgene expression system for zebrafish and chick. Dev. 140,
2235–2243 (2013). 76. Akerberg, A. A., Stewart, S. & Stankunas, K. Spatial and temporal control of transgene
expression in zebrafish. PLoS One 9, (2014). 77. Campbell, L. J., Willoughby, J. J. & Jensen, A. M. Two Types of Tet-On Transgenic Lines for
Doxycycline-Inducible Gene Expression in Zebrafish Rod Photoreceptors and a Gateway-Based Tet-On Toolkit. PLoS One 7, (2012).
78. Wehner, D., Jahn, C. & Weidinger, G. Use of the TetOn system to study molecular mechanisms of zebrafish regeneration. J. Vis. Exp. 2015, (2015).
79. Emelyanov, A. & Parinov, S. Mifepristone-inducible LexPR system to drive and control gene expression in transgenic zebrafish. Dev. Biol. 320, 113–121 (2008).
80. Kenyon, A. et al. Generation of a double binary transgenic zebrafish model to study myeloid gene regulation in response to oncogene activation in melanocytes. DMM Dis. Model. Mech. 11, (2018).
81. Thummel, R., Bailey, T. J. & Hyde, D. R. In vivo electroporation of morpholinos into the adult zebrafish retina. J. Vis. Exp. (2011).

CHAPTER 6
GENERAL DISCUSSION AND FUTURE PERSPECTIVES

196 | Chapter 6
CHAPTER 6 …...………………………………………………………………………………........................................195
1 REFLECTIONS ON THE SAMPLES USED IN THIS THESIS: PROBLEMATIC
DILUTION EFFECT IN TOTAL RETINAL TISSUES …………………………………………………..198
2 DENDRITE SHRINKAGE AFTER INJURY: A CELLULAR KILLER OR A NECESSITY
FOR AXONAL REGENERATION? ……………………………………………………………………………200
3 MITOTHERAPY AS A PROMISING THEURAPEUTIC STRATEGY FOR CNS INJURIES:
REFLECTIONS BASED UPON OBTAINED RESULTS IN ADULT ZEBRAFISH
SUBJECTED TO ONC ……………………………………………………………………………………………..207
4 SIMULTANEOUS MTOR ACTIVITION AND AUTOPHAGY INCREASE: CONFLICTING
RESULT POINTING TO MTOR-INDEPENDENT AUTOPHAGY REGULATION IN
ADULT ZEBRAFISH AFTER ONC ……………………………………………………………………………211
5 MTOR STIMULATING ENERGY METABOLISM AS ULTIMATE UNDERLYING
FACTOR FOR SUCCESFUL AXONAL REGENERATION IN ADULT ZEBRAFISH? …..……214
6 KEY MITOCHONDRIAL DYNAMIC ADAPTATIONS UNDERLYING SUCCESFUL
AXONAL REGENERATION: A PROPOSED WORKING MECHANISM …………………………216
7 GENERAL CONCLUSION ………………………………………………………………………………………..219
8 REFERENCES ………………………………………………………………………………………………………..220

General discussion and future perspectives | 197
Dendrites form an essential component of the neuronal circuit but have been largely
overlooked in regenerative research. Nevertheless, subtle changes in the dendritic arbors of
neurons are one of the first hallmarks of various neurodegenerative diseases, leading to
dysfunctional neuronal networks and ultimately cellular death. Moreover, a possible link
between axonal regrowth and dendrite remodeling is largely undocumented. In this thesis,
we therefore used the zebrafish, a versatile animal model with robust regenerative capacity
and unraveled that dendritic retraction is evoked prior to axonal regrowth after optic nerve
injury. Strikingly, inhibiting dendritic pruning upon damage perturbed axonal regeneration.
Two potential mechanisms underlying the constraining effect on axonal regrowth were
investigated in this thesis: (1) an intraneuronal energy restriction or trade-off, in the form of
ATP produced by mitochondria or (2) a restriction of building blocks, as provided by the
intracellular autophagic recycling mechanism.
In short, we unraveled that dendrite shrinkage after optic nerve injury in adult zebrafish
goes along with a reduction of mitochondria in the retinal ganglion cell (RGC) dendrites, as
well as in the optic tectum, of which the latter is due to axonal degeneration in this
compartment. The energy-producing organelles re-appear in the optic tectum first, in the time
window of tectal reinnervation, and later on, also return in the retina, at the moment of major
synaptic/dendritic restoration in the inner plexiform layer (IPL). Moreover, both fission and
mitochondrial biogenesis were spontaneously upregulated early after axonal injury in the RGC
soma. When studying autophagy, we detected enhanced autophagy after optic nerve damage
inside RGC soma and axons, in retinal Müller glia, and presumably in tectal macroglia, of which
the exact identity is not determined yet. Importantly, inhibiting autophagy accelerated axonal
regrowth.
In the following general discussion, we will reflect on the obtained results and link
them to available literature knowledge, as well as discuss some future perspectives related to
some technical, as well as scientific aspects of this thesis. In the end, a hypothesis will be
postulated outlining the presumable mandatory mitochondrial adaptations, based on our data
and literature, for successful axonal regeneration in RGCs.

198 | Chapter 6
1 REFLECTIONS ON THE SAMPLES USED IN THIS THESIS:
PROBLEMATIC DILUTION EFFECT IN TOTAL RETINAL TISSUES
In order to semi-quantify protein expression levels at different time points after injury,
western blotting (WB) using total retinal lysates was frequently used throughout this PhD
thesis. Although many interesting results were obtained using this technique, often only
(promising) trends were visible that were statistically not significant, which forced us to make
careful assumptions and to refrain from drawing firm conclusions. Next to inter-assay
variability originating from WB, due to recognized sources inherent to the technique e.g. gel
loading errors, transfer efficiency differences1–5, the failure to obtain statistically significant
differences can also be ascribed to the samples used in this thesis. Indeed, as we damage the
retinal ganglion cell RGC axons during an optic nerve crush (ONC), we expect that the main
biological effects of this injury model occur at the level of these inner retinal cells. However,
complete retinal lysates were the standard samples used for WB, in which RGCs only form a
small percentage of the total cell population6. As it is plausible to assume that the majority of
the cells in the samples will, most likely, not be affected by RGC axon damage, the biological
effect is unavoidably diluted and, hence, difficult to detect. In addition to WB, total retinal
samples were also used in the proteomics set-up (chapter 3) and here it was striking that less
than 50 differentially-expressed proteins were detected, while in the optic nerve this was
almost six times more, again hinting towards the inefficient use of total retinal samples to
detect specific ONC-induced protein changes.
The message is thus clear: a method to acquire RGC-enriched samples is necessary to
obtain significant data in the future for WB and proteomics, but also for quantitative
polymerase chain reaction (qPCR) and ribonucleic acid (RNA) sequencing experiments, and
different possibilities could be considered and tested. A first method could make use of
unfixed thick retinal cryosections (100 µm) on glass slides, in which the non-interesting retinal
layers could be manually removed using a scalpel under a stereo microscope, while the
remaining RGC-related tissues namely the IPL, retinal ganglion cell layer (RGCL) and nerve fiber
layer (NFL) should be collected in an Eppendorf tube. I personally tried this but faced some
problems with this approach. Indeed, making thick retinal cryosections of unfixed eyes is
rather difficult as the retinal morphology is often disturbed. Using formalin fixation is,
however, not compatible with, e.g. standard WB or proteomic approaches7–9. Moreover, this

General discussion and future perspectives | 199
sampling method was extremely time-consuming and the yield was very low due to transfer
inefficiency of the small tissue pieces to the tube. To give an idea, WB lysis of one adult fish
retina yields ±45 µg of proteins, roughly 1/4th of it originating from the IPL, RGCL and NFL, but
only ± 3.5 µg of proteins derived from the IPL, RGCL and NFL was collected using this manual
scraping technique on sections.
A second option to obtain more appropriate RGC-enriched or even pure RGC-containing
samples is laser capture microdissection, in which a section is placed under a specifically
designed microscope and the region/cells of interest is/are cut out using a laser beam10,11.
Unfortunately, laser capture microdissection is an expensive tool, which is not available in the
host lab and again, fixated tissues are an issue, as well as the labor/time-intensive character
of this technique.
A more recently developed and nowadays widely used technique is fluorescence-
activated cell sorting (FACS), which enables to isolate a population of cells based on
fluorescent labeling12–15 and could offer potential for our research. Cell sorting often makes
use of cell-specific fluorophore-conjugated antibodies or cell-specific reporter lines. As, to our
knowledge, no antibodies or RGC-reporter lines that specifically label all RGCs in adult
zebrafish are available, the best or preferred option is the use of the Tg(fGap-43:GFP) line,
reporter zebrafish that have already been used to sort RGCs via FACS followed by RNA
sequencing on the isolated cells16. Within this line, the RGCs are marked with high GFP
fluorescence after ONC, as Gap-43 is present in soma and axons of (re)growing neurons. It
was, however, shown by Dhara et al. (2019) that RGCs can also be sorted starting from naive
retinas, as low levels of GFP are expressed in the naive RGCs, possibly indicating continuous
synaptic shifting and/or axon/dendrite growth in adult fish16,17. An important disadvantage of
this technique is that axons and dendrites are lost during single-cell suspension preparation
or cell sorting so no information concerning the neurites can be gathered. However, this
technique was shown to be efficient for isolating RGC cell bodies from rodents and zebrafish,
and thus would be advantageous to decipher RGC-specific protein/RNA changes in adult
zebrafish after ONC injury via WB, qPCR or even single-cell RNA sequencing, which has not yet
been performed on zebrafish RGCs after ONC. Single-cell RNA sequencing would offer more
potential to discover molecules/pathways driving axon/dendrite repair than in bulk RNA
sequencing, as it circumvents the fact that not all RGCs will be in a similar growth modus at a
certain time and possibly even respond differently to injury, as was shown for mouse RGCs18.

200 | Chapter 6
We are currently optimizing RGC isolation from adult Tg(fGap-43:GFP) zebrafish using FACS,
and preliminary data indicate that the sorting yield is around 5000 RGCs per retina. For single
cell RNA sequencing this should be sufficient, although it would be better to pool two retinas
in one sample to reduce biological variability. For WB, proteomics and qPCR, we realize that
these RGC-enriched samples will contain much less RNA/proteins as compared to whole
lysates, and thus multiple retinas definitely need to be pooled, but based on literature and
own data, this would be still in a feasible range, e.g. for WB, we would need to pool cells of
four retinas to do two WB runs. Overall, FACS-sorting of RGCs from adult zebrafish is an
important technique to set-up in our research team as this will aid to provide more conclusive
data concerning the essential players for central nervous system (CNS) axon/dendrite repair.
2 DENDRITE SHRINKAGE AFTER INJURY: A CELLULAR KILLER OR A
NECESSITY FOR AXONAL REGENERATION?
In chapter 3 of this dissertation, we longitudinally characterized the axon-dendrite
growth response after ONC in adult zebrafish using spatiotemporal analysis of dendritic,
synaptic and axonal markers. Thereby, we revealed that dendrite shrinkage is evoked before
axon repair, and that tectal reinnervation is followed by dendrite re-establishment. Although
these data are published in a peer-reviewed article19, we realize that some concerns should
be addressed in the future. Indeed, Map2 has been extensively used as a reliable dendritic
marker, based on its tight association with the microtubules in the dendrites20–29, but Kim et
al. (2020) recently elucidated a role of Map2 in synaptic plasticity, more specifically in synaptic
strengthening during long-term potentiation via spine enlargement and surface delivery of
glutamate receptors, in cultured rat hippocampal neurons20. As also the widely-used synaptic
markers in our research could be linked to synaptic plasticity30,31, there is a possibility that the
decrease in synaptic/dendritic markers in the zebrafish retina after ONC is linked to this
process, and not to larger structural changes of synapses and dendrites. Although synaptic
plasticity changes would also be interesting, we still believe that optic nerve injury in our
zebrafish model does elicit (moderate) dendritic tree adaptations, based on literature and our
data. As previously mentioned, while one recent paper links Map2 to synaptic plasticity, this
marker was used in numerous other articles to study neuronal morphology in vitro and in vivo.
In some in vitro studies, dendritic retraction suggested by the loss of Map2 immunopositivity
and protein levels was confirmed via intracellular dye injection or bright field live cell imaging,

General discussion and future perspectives | 201
indicating that, at least in these cases, Map2 loss can be interpreted as dendritic tree
disintegration. Moreover, the measured 20% reduction in IPL thickness, the retinal layer
containing the RGC dendrites, cannot be explained if ONC would only trigger a reduction in
synaptic strength or synaptic spine removal in adult zebrafish. Importantly, the thickness of
retinal layers, measured via optical coherence tomography (OCT), represents a key clinical
readout/diagnostic parameter in several ocular diseases as it provides valuable information
on cell losses and neuronal process disintegration/shortening32,33. For example, in glaucoma,
IPL thickness, in addition to the NFL and GCL, is significantly reduced in the early disease stages
and this IPL thinning becomes more pronounced over disease progression34–36. The glaucoma-
induced IPL thinning is here also linked with RGC dendritic retraction and loss of synapses,
which are known to manifest early after disease onset, as observed in primate, cat and rodent
glaucoma models, as well as in human glaucomatous retinas37–39. Another indication to
believe that ONC triggers dendritic abnormalities in adult zebrafish is that in cat and rodent
studies in which the optic nerve was physically damaged (ONC, ONT), RGCs undergo rapid
dendritic shrinkage and synapse loss, as well. These dendritic/synaptic changes precede
neuronal death and axonal loss in these models40–42. Altogether, this makes us fairly convinced
that optic nerve injury disturbs the dendritic tree of zebrafish RGCs, although we want to
stress that we do not claim it to be a drastic effect, e.g. a complete or extensive removal of
dendrites/synapses, as our data only suggest moderate changes (20% reduction in IPL
thickness and protein levels of dendritic/synaptic markers). Of note, dendritic pathologies
after optic nerve injury in cats and rodents are likewise not characterized by an all-or-nothing
character, e.g. in mice subjected to ONC total RGC dendritic length was reduced with 23 and
37% three and nine days after injury, compared to baseline levels38.
Another hiatus in this research is that we currently only gathered in-bulk data regarding
dendritic remodeling processes after ONC, which should be confirmed on single-RGC level.
This would be of added value as not all RGCs will probably go through the regeneration phases
in a similar time window and possibly different RGC subtypes do not respond in an exact same
way43. Both issues (use of combined synaptic/dendritic markers and in-bulk data) would be
solved via a more direct visualization method of the dendritic tree on single-cell resolution,
and this could finally proof with 100% certainty that optic nerve injury results in
dendrite/synaptic degradation in adult zebrafish.
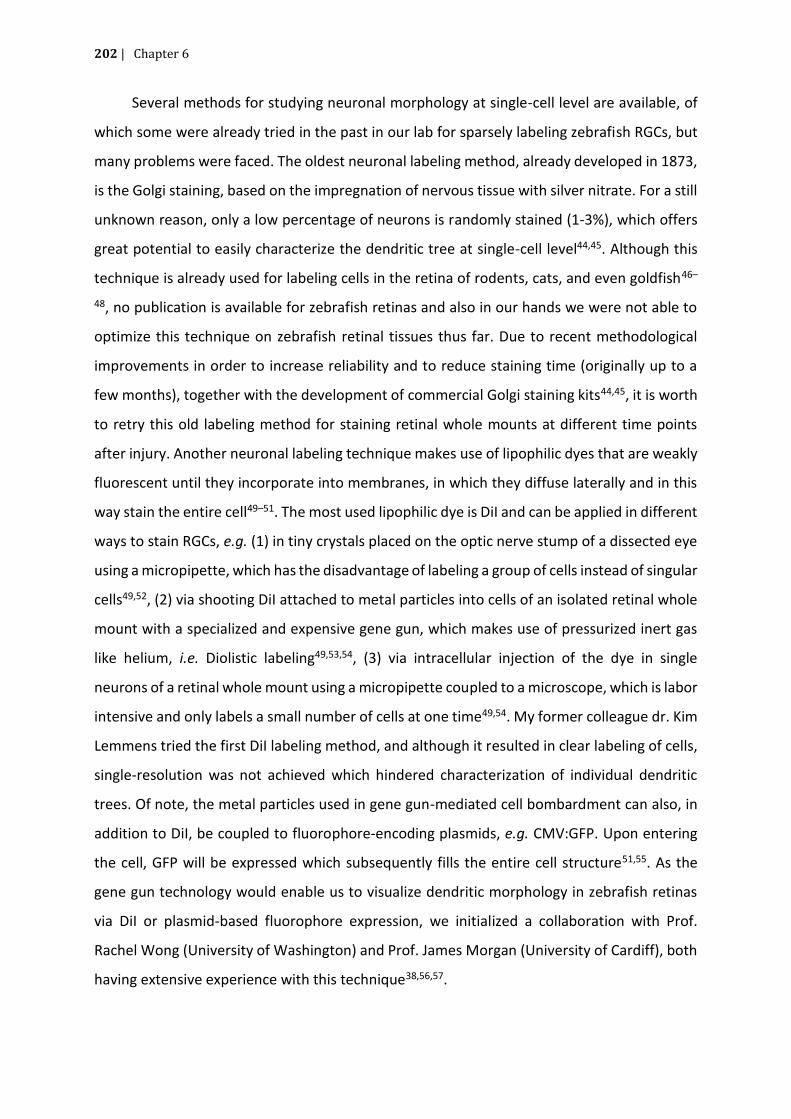
202 | Chapter 6
Several methods for studying neuronal morphology at single-cell level are available, of
which some were already tried in the past in our lab for sparsely labeling zebrafish RGCs, but
many problems were faced. The oldest neuronal labeling method, already developed in 1873,
is the Golgi staining, based on the impregnation of nervous tissue with silver nitrate. For a still
unknown reason, only a low percentage of neurons is randomly stained (1-3%), which offers
great potential to easily characterize the dendritic tree at single-cell level44,45. Although this
technique is already used for labeling cells in the retina of rodents, cats, and even goldfish46–
48, no publication is available for zebrafish retinas and also in our hands we were not able to
optimize this technique on zebrafish retinal tissues thus far. Due to recent methodological
improvements in order to increase reliability and to reduce staining time (originally up to a
few months), together with the development of commercial Golgi staining kits44,45, it is worth
to retry this old labeling method for staining retinal whole mounts at different time points
after injury. Another neuronal labeling technique makes use of lipophilic dyes that are weakly
fluorescent until they incorporate into membranes, in which they diffuse laterally and in this
way stain the entire cell49–51. The most used lipophilic dye is DiI and can be applied in different
ways to stain RGCs, e.g. (1) in tiny crystals placed on the optic nerve stump of a dissected eye
using a micropipette, which has the disadvantage of labeling a group of cells instead of singular
cells49,52, (2) via shooting DiI attached to metal particles into cells of an isolated retinal whole
mount with a specialized and expensive gene gun, which makes use of pressurized inert gas
like helium, i.e. Diolistic labeling49,53,54, (3) via intracellular injection of the dye in single
neurons of a retinal whole mount using a micropipette coupled to a microscope, which is labor
intensive and only labels a small number of cells at one time49,54. My former colleague dr. Kim
Lemmens tried the first DiI labeling method, and although it resulted in clear labeling of cells,
single-resolution was not achieved which hindered characterization of individual dendritic
trees. Of note, the metal particles used in gene gun-mediated cell bombardment can also, in
addition to DiI, be coupled to fluorophore-encoding plasmids, e.g. CMV:GFP. Upon entering
the cell, GFP will be expressed which subsequently fills the entire cell structure51,55. As the
gene gun technology would enable us to visualize dendritic morphology in zebrafish retinas
via DiI or plasmid-based fluorophore expression, we initialized a collaboration with Prof.
Rachel Wong (University of Washington) and Prof. James Morgan (University of Cardiff), both
having extensive experience with this technique38,56,57.

General discussion and future perspectives | 203
Lastly, in rodent research, single cell labeling is often obtained via the use of viral
vectors, which do not work in adult zebrafish, or using transgenic animals in which (1) all
neurons are marked in a variety of colors so that focusing on a single color results in a sparse-
labeling pattern or (2) in which only a small percentage of neurons is labeled. The first option
with transgenic animals refers to the Brainbow method in which a cre/lox construct is
introduced to generate the expression of random combinations of green, red, and blue
fluorescent proteins. The presence of multiple copies of this transgene results in a large pallet
of colors enabling discrimination of single cells from their neighbors58–60. Although this
concept seemed promising, up till now it is not often used to study mouse or zebrafish
neuronal morphology, probably due to the fact that the first Brainbow animals had only faint
fluorescence intensity and not all axonal and dendritic processes were completely filled. These
limitations have been addressed over the years for rodents, but still more researchers use
sparsely-labeled transgenic animals and not Brainbow animals to map neuronal structure58,59.
Unfortunately, to our knowledge, no zebrafish RGC reporter line contains such single-RGC
labeling in an adult stage. The Tg(Brnc3c:GAL4,UAS:mGFP) zebrafish line is for example
successfully used in a larval stage to study single RGCs61, but upon investigating the retina of
adult animals, we personally discovered that indeed not all RGCs are labeled, but that the set
of positive cells were located in one single region of the retina and that the resulting dense
labeling of cell groups prohibited studying the dendritic tree of a single RGC. Therefore, in
addition to the optimization of a Golgi staining and gene-gun mediated labeling, a future
perspective is to generate pioneering sparsely-labeled RGC reporter fish to confirm the
opposite axon-dendrite growth progression over time. Indeed, using sparsely-labeled RGC
fish, we could provide a clear ordered timeline of both dendritic retraction/regrowth and
axonal regeneration at single-cell level.
One method to achieve sparse RGC-labeling would be to take advantage of the leaky
expression of the tetracycline (Tet) response element (TRE) promotor, which is already used
to induce sparse-labeling in mice62,63. Tet-controlled transcriptional activation is a widely used
method to induce conditional gene expression and is based on the mechanism of Tet antibiotic
resistance in some bacteria62,63,64. In the Tet-on system, expression of a particular gene is
under the control of a TRE promotor, for which the activation is triggered by Tet addition.
However, this TRE promotor is apparently leaky, meaning that it is sometimes active in cells,

204 | Chapter 6
without the presence of Tet62,63. To obtain sparse-RGC labeling, two zebrafish lines need to be
used. One transgenic line that needs to be generated is the Tg(TRE:Cre; isl2b:FLExGal4) line,
which has a low level of the cre recombinase enzyme due to the leaky promotor, and this
enzyme will flip the sequence for a Gal4 transcription factor as it is flanked by lox sites in
opposite directions, resulting in Gal4 expression in a limited number of RGCs. These animals
have to be crossed with Tg(UAS:GFP) fish, which are available at the Zebrafish International
Research Center (ZIRC) and contain an insert for green fluorescent protein (GFP) behind the
upstream activator sequence (UAS). In the offspring, UAS is recognized and activated by Gal4
and this will drive GFP expression, resulting in sparse-labeling of RGCs. Using these fish,
dendrite complexity at different time points post-injury can be analyzed in retinal whole
mounts via the commonly used Sholl-analysis, measuring number of branches, branch
geometry, and overall dendritic branching patterns. This will be evaluated side by side to
axonal regrowth and tectal innervation, and together it will enable us to confirm the axon-
dendrite opposite growth responses after ONC in adult zebrafish on single-RGC level.
Besides spatiotemporal characterization of axonal regeneration and dendritic
remodeling after optic nerve injury, we gathered in chapter 3 data hinting that dendrite
shrinkage is possibly necessary for successful axonal regeneration, as two methods that
prevented dendritic deterioration were accompanied by reduced tectal reinnervation.
However, while we provided good first indications for this antagonistic interplay, clear
evidence is still lacking and thus only a correlation between axon regrowth and dendrite
shrinkage could be concluded, but no causality. Conclusive in vivo validation/demonstration
of the hypothesis will be challenging, and potentially even impossible, as molecules and
pathways regulating axonal morphogenesis are often equally important for dendritic
morphogenesis and vice versa. For example, leukemia-inhibitory factor causes major dendrite
retraction of rat sympathetic neurons in vitro21,65, but is also known to drive axon repair in
adult zebrafish after ONC65. Moreover, to our knowledge, successful neuronal compartment-
specific gene/protein manipulation in vivo remains undocumented, and thus preventing
dendrite shrinkage without affecting axons predicts to be a difficult task to fulfill in vivo for
now. Instead, interfering with dendritic retraction of adult injured regeneration-competent
neurons after axotomy in vitro and analyzing the effect on axonal regrowth, might present a
more achievable approach towards first conclusive results. Thereto, the host lab is creating a

General discussion and future perspectives | 205
home-made in vitro microfluidic device in which retinal neurons, derived from adult zebrafish,
will be seeded in the two separate retinal chambers (RC), so that these neuron populations
can grow to each other and make synaptic contacts (Fig. 6.1). Axonal injury of the retinal
neurons in RC2 can be performed by vacuum aspiration of the fluid in the aspiration chamber
(AC). Proving that dendritic retraction is required to stimulate the regrowth of injured CNS
axons will be more feasible in this device as one could specifically interfere with the dendrites
via a perfusion channel located at the synapto-dendritic compartment (Fig. 6.1). Diffusion of
the perfusate further into the microgrooves is hindered due to their narrow size, and thus
preventing dendritic shrinkage without axonal interference could be done via the perfusion
channel, e.g. by adding taxol, a stabilizer of microtubules in the cytoskeleton.
Fig. 6.1 Design of the home-made multi-compartment microfluidic neuronal culturing device.
Retinal neurons of adult zebrafish will be seeded in the two retinal compartments (RC1-2), in which the cells will
grow towards each other and make synaptic contacts in the synaptodendritic compartment. Axotomy is
performed by vacuum aspiration of the fluid in the aspiration chamber (AC). Compound treatment specifically to
synapto-dendritic compartment can be performed via the perfusion channel (PC).
Moreover, it would be interesting to evaluate if the hypothesis also holds in rodent
models, implicating that the inhibitory action of dendrites on axonal regrowth is a general
effect across regeneration-competent and -incompetent neurons. It is well known that RGC
dendrites shrink immediately after optic nerve crush in rodents18,42, however, whether this
dendritic shrinkage is associated with attempts for axonal growth remains largely elusive. Two
papers do report that promoting axonal regeneration in mice optic nerve injury models, via
intravitreal administration of ciliary neurotrophic factor (CNTF) or deletion of phosphatase
and tensin homolog (PTEN), is accompanied by a more severe reduction in dendritic arbor

206 | Chapter 6
length/complexity compared to injury alone19,66,67. Moreover, preliminary data from the host
lab in which inflammatory stimulation, known to promote axon regrowth, was induced in an
ONC mouse model, likewise triggered increased dendrite collapse upon ONC, as compared to
injured untreated animals. These data thus hint that dendrite shrinkage boosting axonal
regeneration might be a uniform concept in spontaneous and experimentally-induced axon
regeneration.
In case future studies confirm that dendrite retraction is beneficial for axonal regrowth,
it has two clear implications for the development of therapeutic strategies. First of all, today,
as dendrite pathologies are an early event after neuronal injury, the dogma in the regenerative
world is that dendritic preservation is an important first step to protect neurons from
apoptotic cell death. However, if dendrites indeed hinder axon repair, dendritic protection is
not the way to go for achieving the ultimate goal: restoring a functional neuronal circuitry.
Secondly, the timing of intervention to repair axons will be of critical importance as it can
potentially improve the outcome68. Indeed, postponing a therapeutic treatment until
sufficient dendrite collapse has taken place, can possibly put a neuron in a better position to
regrow axons induced by a regenerative treatment. To conclude, certifying that dendrite
shrinkage is necessary to induce CNS repair, could provide an important step forward in the
search for an efficient therapy for mammalian CNS restoration.
Complete functional circuit repair will also depend on the induction of dendrite
regrowth, as dendrite pruning is an early event after axonal injury or in neurodegenerative
diseases. However, if and how neurons are capable to regrow dendrites after damage remains
largely elusive, as research concerning dendrite regeneration is still in its infancy, with only
two papers in the mammalian field. In a first study, dendrite regeneration was induced after
stereotaxic prick-injury in the adult cerebral cortex of mice, by reducing the glial scar. A second
study reported that restoring mechanistic target of rapamycin (mTOR) activity using
intravitreal insulin injection resulted in a prominent dendrite-regenerating effect after
axotomy-induced dendrite retraction in mouse RGCs38. In addition, dendrite regeneration has
been occasionally reported to occur spontaneously after damage in invertebrate species, i.e.
in C. elegans and Drosophila69,70. In this work, we showed that dendrite retraction, triggered
by axonal injury, is spontaneously reversed in adult zebrafish. This remarkable dendrite-
regenerative capacity in adult zebrafish RGCs, has already been described for other retinal

General discussion and future perspectives | 207
cells within this teleost, namely for bipolar cells. Indeed, after intravitreal injection of ouabain,
a cytotoxin known to destroy the inner retina, bipolar cells were shown able to repair synaptic
connections and dendrite morphology71. Zebrafish retinal neurons thus have the intrinsic
ability to regenerate both axons and dendrites, and form the ideal model organism to decipher
the underlying molecules/pathways for successful neurite regeneration, which could be
unraveled e.g. by the use of a single-cell RNA sequencing approach, as discussed in 6.1.
Furthermore, more research in regenerative-incompetent vertebrates, including rodents, is
crucial to find a dendrite-regenerative treatment, which has not been a major goal of the
regenerative research world for decades. Nevertheless, to end with a positive remark: one
extrinsic cue and one intrinsic pathway seem to regulate both axon and dendrite regeneration
in the mammalian CNS, being the glial scar and the mTOR signaling cascade, respectively,
which paves the way for a combined therapeutic strategy covering both axon and dendrite
regrowth in the mammalian CNS.
3 MITOTHERAPY AS A PROMISING THEURAPEUTIC STRATEGY FOR
CNS INJURIES: REFLECTIONS BASED UPON OBTAINED RESULTS IN
ADULT ZEBRAFISH SUBJECTED TO ONC
We hypothesized that the underlying mechanism for this antagonistic axon-dendrite
interplay could possibly find its roots in an intracellular energy-restriction, in which a neuron
cannot maintain functional dendrites and repair axons simultaneously. Intraneuronal energy
shuffling, possibly via mitochondrial translocation and going together with dendritic
shrinkage, could therefore be a key parameter for axon regeneration. Therefore, in chapter 4
of this PhD thesis, we focused on the characterization of spontaneous injury-induced
mitochondrial redistribution in different cellular compartments of adult zebrafish RGCs, at
different time points after ONC. Additionally, we broadened our vision on the proposed
hypothesis and also investigated alterations in mitochondrial dynamic processes, as these
could be equally important to deliver sufficient ATP for axon repair. Firstly, our results
provided indications that dendritic retraction is indeed accompanied by a release of
mitochondria in the RGC dendrites/somas, and that the mitochondria only re-reappear when
dendrite regrowth and synaptic restoration in the inner retina is fully ongoing. Together, these
data strengthen the idea that dendritic preservation would form an inefficient therapeutic
step to induce full functional network repair after CNS injury (cfr. 6.2). Of note, as our data are

208 | Chapter 6
only suggestive for a dendrite-to-axon-to-dendrite intraneuronal mitochondrial reshuffling
upon injury, we realize they should be confirmed by e.g. manipulating the transport of these
energy-producing organelles from dendrites/somas to axons and test the effect on axonal
regeneration in order to proof that these somato-dendritic mitochondria are essential for the
axonal regenerative process. In this regard, trafficking kinesin proteins (TRAKs) would form a
suitable target, as these are a family of mitochondrial adaptors that bind to motor proteins,
as well as to the outer mitochondrial membrane, and in this way drive microtubule-based
mitochondrial transport. In rat hippocampal neurons it was shown for TRAK2 that it
predominately localizes to dendrites, that it binds to dynein, important for retrograde
transport, and that it steers mitochondria inside dendrites72. If the same principle holds for
zebrafish RGCs, as a future perspective, overexpression of this protein in RGCs would stimulate
dendritic mitochondrial targeting, hence potentially diminishing mitochondrial supply
towards RGC axons. If the dendritic mitochondria are indeed crucial for axon repair, decreased
axonal regeneration would be the expected outcome of this manipulation. Another option to
alter transport of mitochondria is the use of a dominant negative form of Kif5A, a member of
the kinesin-1 family, which transports various cargo including mitochondria, lysosomes and
vesicle proteins into axons73,74. In zebrafish embryos lacking Kif5Aa, it was shown that
peripheral sensory axons almost completely lack mitochondria and therefore degenerate.
Strikingly, no difference was observed in the number of synaptic vesicles or lysosomes in the
axons, which suggests that the kif5Aa mutation specifically disrupts the localization of axonal
mitochondria73. Unfortunately, the effect on dendrite morphology and dendrite
mitochondrial density was not studied here. In another mouse study using cultured
hippocampal neurons, expression of a dominant-negative form of Kif5B, related to Kif5A,
drastically altered the distribution of axonal vs. dendritic mitochondria. Disruption of Kif5B
functioning resulted in a shift in mitochondrial distribution towards the dendrites. These
studies highlight the potential of manipulating family members of kinesin-1, e.g. by
conditional expression of a dominant-negative protein, to specifically maintain/translocate
mitochondria in the dendrites in our adult zebrafish ONC model, and thus to proof that
translocation of dendritic mitochondria towards axons is necessary for axonal regeneration.
Of note, different experimental approaches described in literature to reduce/increase
mitochondrial transport, e.g. by manipulation of the mitochondrial motor/adaptor protein
Miro and/or the mitochondrial anchoring protein Syntaphilin75,76, could also be of use in our

General discussion and future perspectives | 209
research, but solely to show that mitochondrial transport is crucial for axonal regrowth,
without providing information on the source/position of the mitochondria. All these
experimental approaches could also be applied in our in vitro microfluidic set-up, which would
provide the advantage of easy mitochondrial tracking, in all cellular compartments over time
after axonal damage. Moreover, here the use of calcium-free medium or calcium chelating
agents to the different axon/dendrite compartments could be applied to test the idea that
calcium-influx upon neuronal activity decreases mitochondrial mobility. Different papers have
indeed shown that calcium renders mitochondria immobilized as it provokes a conformational
change inside Miro that disrupts the connection between Miro, the motor proteins and/or the
microtubules, so that mitochondrial transport is blocked. On a last side note, characterization
of the spontaneous injury-induced mitochondrial distribution/dynamics could also be
investigated in the microfluidic devices seeded with adult neurons of our MitoEGFP fish line,
to confirm our zebrafish in vivo mitochondrial data.
Another intriguing finding of chapter 4 was the biphasic upregulation of mitochondrial
biogenesis before the start of both axonal and dendritic regrowth, hinting that biogenesis is
important to initiate these repair phases. Besides many papers describing a role of
mitochondrial biogenesis in neurite outgrowth during development77–79, one article hints
towards a beneficial effect of biogenesis for neurite regrowth after injury80. Herein, the
neuroprotective and regenerative drug Rosuvastatin was delivered to cultured mouse cortical
neurons deprived from oxygen, as an in vitro model for ischemic injury80. Rosuvastatin
triggered increased mitochondrial biogenesis, as well as improved neurite outgrowth, again
hinting that augmented biogenesis can underlie the neurite regenerative potential. As
mitochondrial dysfunction is associated with numerous diseases, including primary
mitochondrial disorders, type II diabetes mellitus, myocardial infarction, stroke and chronic
kidney disease, efficiently stimulating mitochondrial biogenesis is a very broad therapeutic
goal to promote cellular functioning or tissue repair81. In animal models for diseases
characterized by mitochondrial disturbances, numerous agents were already identified that
trigger mitochondrial biogenesis, including natural agents (e.g. curcumin and cacao),
transcription factor activators and kinase modulators. A few agents are currently being tested
in clinical trials in human patients with mitochondrial diseases or type II diabetes mellitus, for
their possible beneficial effect on mitochondrial biogenesis and amelioration of disease

210 | Chapter 6
symptoms. All in all, although mitochondrial biogenesis seems promising to upscale energy
production in various diseases characterized by defects in mitochondrial metabolism, up till
now, no effective biogenesis-stimulating drug is approved. As our data, as well as literature,
suggest that mitochondrial biogenesis is important for CNS axon/dendrite (re)growth, more
animal and clinical research should be conducted to further decipher if improving
mitochondrial biogenesis can also be designated to boost neurite repair in the CNS.
A last observation made in chapter 4 was the apparent counteracting role of
mitochondrial fission on axonal regeneration, as expression of wild-type dynamin-related
protein 1 (Drp1) or dominant-negative Drp1, respectively decreased/enhanced axonal
regeneration in adult zebrafish after ONC. As fission was spontaneously upregulated during
successful CNS repair in our zebrafish ONC model, these results were quite surprising but
underline the complex effect of mitochondrial fission/fusion in mitochondrial mobility,
mitochondrial quality control, cellular survival and neurite de/regeneration. To our believe,
fission can definitely be advantageous for inducing axon repair, but needs to be very
accurately controlled in a spatial (compartmentalized) and timed manner.
Based on literature and our preliminary data, a critical parameter to induce axonal
regeneration is to provide sufficient mitochondria inside axons to establish growth cone
initiation and axon elongation. In this regard, mitochondrial transplantation is an emerging
and very promising therapeutic strategy that could be of benefit to repair CNS tissue after
neurodegenerative diseases or brain trauma82–86. Moreover, it would also be of use to tackle
mitochondrial disorders or prevent ischemia, the condition in which mitochondrial
transplantation was first tested, or to improve the outcome after such an ischemic event82–87.
The concept is simple: delivery of healthy and viable mitochondria in damaged tissues that
subsequently need to enter the injured cells to restore normal functioning or induce cellular
repair. Strikingly, supply of extracellular healthy mitochondria is indeed often followed by
cellular actin-dependent endocytosis resulting in mitochondrial internalization, after which
the mitochondria perform their normal energy-producing function in the entered cells.
Numerous studies, almost all published in the last five years, have indicated the success of
mitochondrial transplantation in animal models. This methodology indeed protected the heart
from ischemia-reperfusion injury in rabbits88, but also reduced behavioral symptoms in a
mouse Parkinson’s disease model89, maintained cellular respiration after spinal cord injury in

General discussion and future perspectives | 211
rats90, and improved neurite regeneration of rat hippocampal cells in vitro91. Very recently,
dos-Santos et al. (2020) showed that intravitreal injection of active mitochondria, purified
from rat liver, in rats subjected to ONC improved tissue bioenergetics and electroretinographic
responses, and also increased RGC-survival and axonal regrowth92.
Although mitochondrial transplantation is promising, up till now only a few clinical trials
are registered to decipher the applicability of this technique in patients, likely due to its
recently developed character. These first clinical trials aimed e.g. to improve cardiac muscle
functioning after ischemia-reperfusion–associated injury following cardiac surgical
procedure93 or to treat infertility by mitochondrial injection into oocytes before in vitro
fertilization. Both showed very promising preliminary results.
Notably, different parameters are of critical importance to increase the success rate of
mitochondrial transplantation. Firstly, mitochondria should be isolated from an uninjured area
from the patient’s own body, this to prevent an immune reaction or transplant rejection.
Moreover, mitochondria can only be stored for 1h after isolation, as hereafter mitochondrial
functioning drastically declines, therefore transplantation should follow rapidly after isolation.
Thirdly, several delivery methods should be evaluated, e.g. direct injection in the region of
interest or intravenous mitochondrial injection. Although the latter method was not used in
clinical trials yet and is potentially less efficient due to reduced concentration at the injured
site, it was shown to improve locomotor function in a mouse Parkinson’s disease model89. To
sum up, mitochondrial transplantation is a very promising technique, which is still in its
infancy, and thus further (pre-)clinical research is necessary to optimize this method to induce
cellular/tissue repair.
4 SIMULTANEOUS MTOR ACTIVITION AND AUTOPHAGY INCREASE:
CONFLICTING RESULT POINTING TO MTOR-INDEPENDENT
AUTOPHAGY REGULATION IN ADULT ZEBRAFISH AFTER ONC
Comparing the results from chapters 3 and 5, exposes a clashing result that goes against
countless reports found in literature: a concurrent activation of mTOR and upregulation of
autophagy, both peaking around two to three days post-ONC in adult zebrafish RGCs. Indeed,
evidence has been gathered throughout the years that mTOR is a key homeostatic regulator
and is necessary to maintain the correct balance between cellular anabolism and catabolism,
dependent on nutritional status, growth factors and stress signals. Active mTOR thus prevents

212 | Chapter 6
autophagy and does this via phosphorylation of proteins of the autophagy machinery, their
regulators or transcription factors regulating autophagy/lysosome-related gene expression94–
98, which reduces autophagosome formation/maturation, lysosome biogenesis and
degradation of autolysosomes (lysosomes fused with autophagosomes). The simultaneous
rise in mTOR activation and autophagy observed in our model is therefore conflicting.
However, a few mTOR-independent molecules/pathways regulating autophagy are known, of
which the level of intracellular Ca2+, is one, wherein a rise in cytosolic calcium prevents
autophagy99–102. Although cellular calcium levels are regulated by numerous intraneuronal
stores and extracellular calcium influx103, we could speculate that in uninjured firing zebrafish
RGCs, autophagy is prevented due to high calcium ion levels. Indeed, three calcium-providing
processes in actively firing neurons are likely ongoing: (1) glutamate receptor channels are
Ca2+ permeable and postsynaptic activation thus causes calcium influx, (2) voltage-dependent
Ca2+ channels are opened during postsynaptic neuronal depolarization, and (3) synaptic
activation releases calcium ions from intracellular stores, e.g. endoplasmatic reticulum103–107.
After ONC injury however, early postsynaptic losses could result in a reduced intracellular Ca2+
concentration in RGCs as the aforementioned sources drop out. This then reverses the
inhibitory effect of Ca2+ on autophagy, with the observed autophagic enhancement as a
consequence. Evidence for this mTOR-independent autophagy activation via intracellular Ca2+
levels could be gathered via in vivo calcium imaging of the retina of crushed GCaMP
zebrafish108,109, expressing a genetically-encoded calcium indicator, but represents a
challenging task to fulfill. Currently, we are establishing a method to visualize fluorescent
signals in vivo in living adult zebrafish via spinning-disk confocal imaging, through a
collaboration with Dr. S. Munck (VIB BioImaging Core - Leuven), which would enable us to
monitor calcium levels in vivo. Nevertheless, as a first choice, in vitro calcium imaging would
be a more convenient way to evaluate a possible link between intracellular calcium and
autophagy induction, and additionally offers the possibility to deliver calcium chelators, widely
used to reduce intracellular calcium levels in an in vitro set-up, for further validation110,111.
As the enhanced autophagic response in adult zebrafish subjected to ONC is likely not
regulated via mTOR, the negative effect on axonal regeneration observed after mTOR
inhibition via intravitreal rapamycin injection (chapter 3), is most probably also not mediated
by an autophagic response. Indeed, while mTOR certainly plays a role in regulating autophagy,

General discussion and future perspectives | 213
other critical cellular processes are likewise under the control of this kinase, including cellular
growth/survival, protein translation and metabolism (see below, paragraph 6.5). Moreover,
we were not able to detect an autophagic increase in RGCs after rapamycin injection (chapter
5), which might possibly indicate that mTOR is not the major regulator of autophagic flux in
zebrafish RGCs. This assumption is, however, rather unrealistic. Indeed, others were able to
increase autophagy after rapamycin treatment in larval or adult zebrafish, although not in the
retina, but in the overall body, or in the heart, respectively 112,113. The absence of an Lc3
fluorescence increase in our model after intravitreal rapamycin injection, is more likely due to
more rapid turnover of Lc3+ autophagosomes or technical limitations to detect small
differences in Lc3-GFP levels.
As studying the autophagic flux is complex, our autophagy data obtained in adult
zebrafish subjected to ONC, should be confirmed by one, and ideally two additional
techniques: electron microscopy (EM) and semi-quantitative WB. While EM is a very powerful
tool that can reveal autophagosome formation and the engulfed cargo, due to its superior
resolution (in the range of nanometers)114,115, WB is more useful to study autophagic turnover.
We already used the latter technique in order to confirm autophagic upregulation (chapter 5),
but this was not successful yet, likely due to the dilution effect associated with total retinal
lysates (see paragraph 6.1). WB for autophagic markers could in the future be repeated using
RGC-enriched samples, e.g. FACS-sorted RGCs.
An extra caveat in both the autophagy and mitochondrial chapters 4 and 5, is the lack of
data concerning mitophagy. Up till now, we tried to monitor mitophagy by performing an
immunofluorescent staining for Lc3 on retinal cryosections of MitoEGFP zebrafish, as an
overlapping Lc3 and mitochondrial signal would indicate a mitochondrion internalized by an
autophagosome. However, this was not successful yet. Another possibility to study mitophagy
is by generating a mito-quality control (QC) zebrafish, with similar features as the mito-QC
mouse used to study mitophagy116. Key for this mitophagy reporter line is the insertion of a
sequence for a fusion protein containing GFP, mCherry and the outer mitochondrial
membrane localization sequence of mitochondrial fission 1 protein (Fis1). In normal cytosolic
conditions, mitochondria are then labeled both in green and red, but when a mitochondrion
is engulfed by a lysosome, GFP fluorescence is quenched due to the acidic lysosomal
environment, while the red mCherry signal is stable under these conditions. Generation of this

214 | Chapter 6
zebrafish line would help to elucidate if mitophagy is upregulated in adult zebrafish after ONC.
5 MTOR STIMULATING ENERGY METABOLISM AS ULTIMATE
UNDERLYING FACTOR FOR SUCCESFUL AXONAL REGENERATION IN
ADULT ZEBRAFISH?
Optic nerve damage in adult zebrafish triggers a transient but massive mTOR activation,
as reported in chapter 3, which is in sharp contrast to the injury-induced mTOR deactivation
observed in adult mammals. Strikingly, it has been shown in rodent RGCs, cortical and spinal
neurons that maintaining active mTOR levels at pre-injury levels boosts axonal growth after
injury42,117–119, underlining the importance of mTOR in this regenerative process. Although
successful axonal regeneration is likely complex, involving numerous pathways/molecules,
mTOR activation after injury could certainly be one of the underlying mechanisms of the
natural regeneration power of adult zebrafish, and is therefore of great scientific and possible
clinical interest. But, which consequence of mTOR activation is crucial for this enormous
regenerative effect?
mTOR is a master regulator of protein translation, and our proteomics experiment in
chapter 3, already revealed that the ribosomal component was the most enriched pathway
after injury in both the retina and optic nerve, at a time point when mTOR was highly active
in the injured RGCs. Remarkably, numerous articles report that mTOR can stimulate energy
metabolism by translation of mitochondrial proteins and mitochondrial dynamics-related
genes, as well as glycolytic enzymes/regulators120–124. In several mammalian non-neuronal cell
lines, as well as mouse skeletal muscle in vivo, it was demonstrated that mTOR inhibition
negatively affects mitochondrial metabolism, including lowering mitochondrial membrane
potential, oxygen consumption and adenosine triphosphate (ATP) production120–124. mTOR is
known to boost mitochondrial mass, via translation of mitochondrial ribosomal proteins,
components of the electron transport chain, ATP synthase and transcription factors promoting
mitochondrial DNA replication. Furthermore, mitochondrial biogenesis can specifically be
enhanced via mTOR activation, as this kinase can stimulate PPARγ coactivator 1 (PGC1-α)
mRNA translation, as well as activate this protein and an important interactor, resulting in
increased physical attraction. A last mitochondrial process linked to mTOR activation is
mitochondrial fission, as, again using cell lines, mTOR was found to stimulate mitochondrial
fission by increasing the expression of mitochondrial fission process protein 1 (MTFP1)125. One

General discussion and future perspectives | 215
important remark is that these effects were almost exclusively detected in non-neuronal
mammalian cell lines after mTOR inhibition, so more research is necessary to confirm this in
an in vivo neuronal environment. Nevertheless, as axonal regeneration after injury requires a
massive amount of ATP, discussed in depth in chapter 2, mTOR and its stimulating effect on
energy production can form the key element for CNS axon regrowth. Indeed, both the peak of
mTOR activity and the enormous increase in mitochondria in the RGC somas were detected
two to three days after ONC, which is thus likely not a mere coincidence. Additionally, the
activation of mitochondrial biogenesis/fission observed early after ONC in the adult zebrafish
retina, could be triggered via mTOR. The idea that mTOR activation after ONC in adult
zebrafish is crucial for axonal regeneration, via its effect on bioenergetics, is further supported
by the preliminary data shown in chapter 4, in which rapamycin injection resulted in a smaller
increase in mitochondrial numbers in the RGC soma, early after ONC. Repetition of this
experiment would be valuable as now only a limited number of animals were used. Also an in-
depth evaluation to further decipher the effect of mTOR inhibition on mitochondrial
biogenesis and fission is needed.
As discussed in chapter 2 of this dissertation, oxidative phosphorylation inside
mitochondria is the last step of cellular respiration, the process by which glucose molecules
are broken down to drive ATP synthesis. To recapitulate, during cellular respiration, sugar is
first converted into pyruvate via cytosolic glycolysis, which can feed the Krebs cycle, that, in
turn, produces nicotinamide adenine dinucleotide (NADH) and flavin adenine dinucleotide
(FADH2) to drive oxidative phosphorylation, the most energy-producing step of the cascade.
Strikingly, mTOR can also enhance the glycolytic capacity, which can have a general simulative
effect on cellular respiration and thus energy production as this will enlarge the available
substrates for the Krebs cycle, and thus, later on, oxidative phosphorylation. mTOR boosts this
via activating translation of hypoxia-inducible factor 1 α (HIF-1α), which is a transcription
factor that is known to induce transcription of important glucose transports (e.g. glycose
transporter 1) or key glycolytic enzymes (e.g. hexokinase and aldolase)126–129. Within our
proteomics data set, we already identified two glycolytic enzymes which were significantly
upregulated in the optic nerve at three days post-injury, plausibly due to increased translation
mediated via mTOR activation, and in order to increase energy production.

216 | Chapter 6
All in all, we can conclude that mTOR seems of uttermost importance to induce
successful axonal regrowth after injury, possibly by a multi-factorial effect on bioenergetics
(mitochondrial dynamics and cellular metabolism). However, before proposing mTOR as the
holy grail to develop a treatment for mammalian CNS regeneration, one important side note
should be made. mTOR is an important stimulant for cellular growth and division, which is
beneficial if tightly regulated, but in case of mTOR hyperactivation, due to genetic alterations,
it can promote tumor initiation and progression130,131. Indeed, more than 70% of cancers are
characterized by mTOR overactivation132,133, revealing a major risk in using mTOR stimulation
for tackling CNS axon regeneration after injury134. Further animal/preclinical research should
be conducted in order to evaluate the possible side-effects of an mTOR-inducing therapy and
to fine-tune a specific and timed delivery method, to prevent abnormal cell growth. In the
meanwhile, also the search for the underlying regenerative effects of mTOR activation in
relation to bioenergetics should be the subject of more in-depth studies.
6 KEY MITOCHONDRIAL DYNAMIC ADAPTATIONS UNDERLYING
SUCCESFUL AXONAL REGENERATION: A PROPOSED WORKING
MECHANISM
Within a last paragraph and largely based on all gathered data combined with a
thorough literature search, I wish to postulate a hypothesis illustrating the requirements for
altered mitochondrial dynamics in the different neuronal compartments to induce
axon/dendrite regrowth after CNS axon injury. The hypothesis is presented in Fig. 6.2. Panel
A depicts the normal physiological condition in RGCs, in which mitochondria are present in
dendrites and axons, and in a dense perinuclear mitochondrial network in the soma (Fig. 6.2A).
After axonal injury, which immediately triggers postsynaptic removal and dendritic retraction
(1-3 dpi), mitochondria become depolarized near the axonal injury site, and these
dysfunctional mitochondria are removed by mitophagy, possibly close to the RGC soma at the
optic nerve head, via transneuronal mitophagy inside astrocytes (Fig. 6.2B). Hereafter,
anterograde transport of (1) already available dendritic/somatic mitochondria or (2) new
biogenesis-derived organelles, instigated by activation of PGC-1α by mTOR, towards the
axonal stump is initiated (Fig. 6.2B). The necessary building blocks for mitochondrial
biogenesis could be produced via mitophagy in the dendritic compartment (Fig. 6.2B).
Moreover, mitochondrial mobility is stimulated by a (mTOR-mediated) fission response in the

General discussion and future perspectives | 217
somato-dendritic compartment (Fig. 6.2B). During axonal regrowth and elongation (3-6 dpi),
mitochondria accumulate in the growth cone, as a result of (fission-mediated) mitochondrial
transport from soma/dendrites to the axon (Fig. 6.2C). Eventually axons will reinnervate their
target areas again (6-10 dpi) (Fig. 6.2D). As large mitochondria are more robust and efficient
in ATP production, compared to smaller ones, fusion in the postsynaptic compartment in this
time frame could be beneficial to enable synaptic restoration/functioning (Fig. 6.2D).
Meanwhile, synaptic recovery is an important stimulus for dendritic restoration, ensured by
mitochondrial biogenesis in the soma compartment or mitochondrial axon/soma-to-dendrite
retrograde transport (Fig. 6.2D). Again, fission in the axons or in the soma can enhance
mitochondrial trafficking. Lastly, also fusion of mitochondria in the dendrites could be
important to enable dendritic/synaptic recovery and functioning (Fig. 6.2D).

218 | Chapter 6

General discussion and future perspectives | 219
< Fig. 6.2 An overview of the hypothetically required intraneuronal mitochondrial responses for a
successful RGC regeneration after axonal injury.
A In an uninjured, physiologically functional RGC, mitochondria are present in the axons and dendrites
and their respective pre- and postsynaptic compartments, as well as in a dense perinuclear
mitochondrial network. B During the time window of synaptic and dendritic degeneration after axonal
injury (1-3 dpi), mitochondria become depolarized near the injury site, and are subsequently removed
via mitophagy. At the same time, dendritic mitophagy can produce the building blocks for
mitochondrial biogenesis in the soma and for subsequent mitochondrial transport towards the axon.
Concurring mitochondrial fission can boost this mitochondrial motility from the somato-dendritic
compartment to the axon. C During axonal regrowth and elongation (3-6 dpi), mitochondria
accumulate in the growth cone, due to fission-mediated mitochondrial transport from the RGC soma
or dendrites. D Finally, axons will reinnervate the optic tectum, which is possibly followed by
mitochondrial fusion, to further enhance synaptic recovery and functioning. Upon axonal target
reconnection, dendrites will regrow, presumably supported by back-trafficking of mitochondria,
and/or new somal biogenesis-derived organelles. Fission in the axon and soma, will again help to
improve mitochondrial motility. A last step in the dendrite compartment might be mitochondrial
fusion, which can improve ATP production.
ATP, adenosine triphosphate; dpi; days post-injury, RGC, retinal ganglion cell.
7 GENERAL CONCLUSION
To conclude, this doctoral work revealed an antagonistic interplay between axonal
regeneration and dendritic remodeling in regeneration-competent neurons, in which
maintaining functional dendrites possibly hinders axon repair. As an energy-based intra-
neuronal restriction mechanism is the proposed underlying mechanism, we focused on
mitochondrial dynamics and gathered preliminary indications that dendrite/soma-to-axon
mitochondrial trafficking is triggered upon optic nerve injury. Subsequent dendrite regrowth
also relies on mitochondria, as mitochondrial levels in RGC dendrites start to increase again at
the start of this process. Furthermore, two mitochondrial dynamic processes are massively
induced after injury in adult zebrafish, namely biogenesis and fission, indicating that these
processes could also be majorly involved in axon/dendrite regrowth. In addition, autophagy,
the cellular recycling response, was investigated as this could provide the necessary building
blocks for axonal regrowth. Although this process was found to be spontaneously induced in
regrowing axons, as well as in other supporting glial cells, inhibiting autophagy enhanced
axonal regrowth, and more research is needed to elucidate the underlying mechanism for this
effect. As both the mitochondrial and the autophagy chapters produced intriguing results,
further elaboration on these topics is necessary, and could possibly identify important targets
for the development of novel regenerative strategies in the mammalian CNS.

220 | Chapter 6
8 REFERENCES
1. Pillai-Kastoori, L., Schutz-Geschwender, A. R. & Harford, J. A. A systematic approach to quantitative Western blot analysis. Analytical Biochemistry 593, (2020).
2. Mahmood, T. & Yang, P. C. Western blot: Technique, theory, and trouble shooting. N. Am. J. Med. Sci. 4, 429–434 (2012).
3. Bass, J. J. et al. An overview of technical considerations for Western blotting applications to physiological research. Scandinavian Journal of Medicine and Science in Sports 27, 4–25 (2017).
4. Eaton, S. L. et al. Total Protein Analysis as a Reliable Loading Control for Quantitative Fluorescent Western Blotting. PLoS One 8, (2013).
5. Ghosh, R., Gilda, J. E. & Gomes, A. V. The necessity of and strategies for improving confidence in the accuracy of western blots. Expert Review of Proteomics 11, 549–560 (2014).
6. Rheaume, B. A. et al. Single cell transcriptome profiling of retinal ganglion cells identifies cellular subtypes. Nat. Commun. 9, (2018).
7. Fowler, C. B., O’Leary, T. J. & Mason, J. T. Toward improving the proteomic analysis of formalin-fixed, paraffin-embedded tissue. Expert Review of Proteomics 10, 389–400 (2013).
8. Becker, K. F. et al. Quantitative protein analysis from formalin-fixed tissues: Implications for translational clinical research and nanoscale molecular diagnosis. J. Pathol. 211, 370–378 (2007).
9. Sadick, J. S., Boutin, M. E., Hoffman-Kim, D. & Darling, E. M. Protein characterization of intracellular target-sorted, formalin-fixed cell subpopulations. Sci. Rep. 6, (2016).
10. Zhu, Y. et al. Spatially resolved proteome mapping of laser capture microdissected tissue with automated sample transfer to nanodroplets. Mol. Cell. Proteomics 17, 1864–1874 (2018).
11. Curran, S., McKay, J. A., McLeod, H. L. & Murray, G. I. Laser capture microscopy. Journal of Clinical Pathology - Molecular Pathology 53, 64–68 (2000).
12. Cossarizza, A. et al. Guidelines for the use of flow cytometry and cell sorting in immunological studies. Eur. J. Immunol. 47, 1584–1797 (2017).
13. Rubio, F. J., Li, X., Liu, Q. R., Cimbro, R. & Hope, B. T. Fluorescence activated cell sorting (FACS) and gene expression analysis of fos-expressing neurons from fresh and frozen rat brain tissue. J. Vis. Exp. 2016, (2016).
14. Biesemann, C. et al. Proteomic screening of glutamatergic mouse brain synaptosomes isolated by fluorescence activated sorting. EMBO J. 33, 157–170 (2014).
15. Davies, D. Cell sorting by flow cytometry. in Flow Cytometry: Principles and Applications 257–276 (2007).
16. Dhara, S. P. et al. Cellular reprogramming for successful CNS axon regeneration is driven by a temporally changing cast of transcription factors. Sci. Rep. 9, 1–12 (2019).
17. Diekmann, H., Kalbhen, P. & Fischer, D. Characterization of optic nerve regeneration using transgenic zebrafish. Front. Cell. Neurosci. 9, 118 (2015).
18. Tran, N. M. et al. Single-Cell Profiles of Retinal Ganglion Cells Differing in Resilience to Injury Reveal Neuroprotective Genes. Neuron 104, 1039-1055.e12 (2019).
19. Beckers, A. et al. An Antagonistic Axon-Dendrite Interplay Enables Efficient Neuronal Repair in the Adult Zebrafish Central Nervous System. Mol. Neurobiol. 56, 3175–3192 (2019).
20. Kim, Y. et al. Microtubule-associated protein 2 mediates induction of long-term potentiation in hippocampal neurons. FASEB J. 34, 6965–6983 (2020).
21. Quo, X., Chandrasekaran, V., Lein, P., Kaplan, P. L. & Higgins, D. Leukemia inhibitory factor and ciliary neurotrophic factor cause dendritic retraction in cultured rat sympathetic neurons. J. Neurosci. 19, 2113–2121 (1999).
22. Bernhardt, R. & Matus, A. Light and electron microscopic studies of the distribution of microtubule‐associated protein 2 in rat brain: A difference between dendritic and axonal cytoskeletons. J. Comp. Neurol. 226, 203–221 (1984).
23. Kaech, S., Fischer, M., Doll, T. & Matus, A. Isoform specificity in the relationship of actin to dendritic spines. J. Neurosci. 17, 9565–9572 (1997).

General discussion and future perspectives | 221
24. Kaech, S., Parmar, H., Roelandse, M., Bornmann, C. & Matus, A. Cytoskeletal microdifferentiation: A mechanism for organizing morphological plasticity in dendrites. Proc. Natl. Acad. Sci. U. S. A. 98, 7086–7092 (2001).
25. Cho, T., Kashiwagi, Y. & Okabe, S. Temporal sequences of synapse disintegration triggered by afferent axon transection, time-lapse imaging study of presynaptic and postsynaptic molecules. eNeuro 6, (2019).
26. Hoskison, M. M. & Shuttleworth, C. W. Microtubule disruption, not calpain-dependent loss of MAP2, contributes to enduring NMDA-induced dendritic dysfunction in acute hippocampal slices. Exp. Neurol. (2006).
27. Zeng, X. et al. The expression of G protein-coupled receptor kinase 5 and its interaction with dendritic marker microtubule-associated protein-2 after status epilepticus. Epilepsy Res. (2017).
28. Christensen, K. R., Beach, T. G., Serrano, G. E. & Kanaan, N. M. Pathogenic tau modifications occur in axons before the somatodendritic compartment in mossy fiber and Schaffer collateral pathways. Acta Neuropathol. Commun. (2019).
29. Xiong, T. et al. Erythropoietin induces synaptogenesis and neurite repair after hypoxia ischemia-mediated brain injury in neonatal rats. Neuroreport (2019).
30. Kim, M. J. et al. Synaptic Accumulation of PSD-95 and Synaptic Function Regulated by Phosphorylation of Serine-295 of PSD-95. Neuron (2007).
31. Wan, Q. F. et al. SV2 Acts via Presynaptic Calcium to Regulate Neurotransmitter Release. Neuron (2010).
32. Aref, A. A., Sayyad, F. E., Mwanza, J. C., Feuer, W. J. & Budenz, D. L. Diagnostic specificities of retinal nerve fiber layer, optic nerve head, and macular ganglion cell-inner plexiform layer measurements in myopic eyes. J. Glaucoma (2014).
33. Greenberg, B. M. & Frohman, E. Optical coherence tomography as a potential readout in clinical trials. Therapeutic Advances in Neurological Disorders (2010).
34. Miki, A. et al. Rates of retinal nerve fiber layer thinning in glaucoma suspect eyes. Ophthalmology (2014).
35. Kim, E. K., Park, H. Y. L. & Park, C. K. Segmented inner plexiform layer thickness as a potential biomarker to evaluate open-angle glaucoma: Dendritic degeneration of retinal ganglion cell. PLoS One (2017).
36. Chua, J. et al. Diagnostic ability of individual macular layers by spectral-domain optical coherence tomography in different stages of glaucoma. Ophthalmol. Glaucoma (2020).
37. Frankfort, B. J. et al. Elevated intraocular pressure causes inner retinal dysfunction before cell loss in a mouse model of experimental glaucoma. Investig. Ophthalmol. Vis. Sci. 54, 762–770 (2013).
38. Agostinone, J. et al. Insulin signalling promotes dendrite and synapse regeneration and restores circuit function after axonal injury. Brain 141, 1963–1980 (2018).
39. El-Danaf, R. N. & Huberman, A. D. Characteristic patterns of dendritic remodeling in early-stage glaucoma: Evidence from genetically identified retinal ganglion cell types. J. Neurosci. (2015).
40. Weber, A. J. & Harman, C. D. BDNF preserves the dendritic morphology of α and β ganglion cells in the cat retina after optic nerve injury. Investig. Ophthalmol. Vis. Sci. (2008).
41. Kalesnykas, G. et al. Retinal ganglion cell morphology after optic nerve crush and experimental glaucoma. Investig. Ophthalmol. Vis. Sci. 53, 3847–3857 (2012).
42. Morquette, B. et al. REDD2-mediated inhibition of mTOR promotes dendrite retraction induced by axonal injury. Cell Death Differ. 22, 612–625 (2015).
43. Tran, N. M. et al. Single-Cell Profiles of Retinal Ganglion Cells Differing in Resilience to Injury Reveal Neuroprotective Genes. Neuron 104, 1039-1055.e12 (2019).
44. Zaqout, S. & Kaindl, A. M. Golgi-cox staining step by step. Front. Neuroanat. 10, (2016). 45. Kang, H. W. et al. Comprehensive Review of Golgi Staining Methods for Nervous Tissue. Appl.
Microsc. 47, 63–69 (2017). 46. Sherry, D. M. & Yazulla, S. Goldfish bipolar cells and axon terminal patterns: A Golgi study. J.

222 | Chapter 6
Comp. Neurol. (1993). 47. Kolb, H. Amacrine cells of the mammalian retina: Neurocircuitry and functional roles. Eye
(1997). 48. Farsaii, M. & Connaughton, V. P. AII Amacrine Cells. Webvision Organ. Retin. Vis. Syst. (2005). 49. Sun, W., Li, N. & He, S. Large-scale morophological survey of rat retinal ganglion cells. Vis.
Neurosci. (2002). 50. Park, J. S., Bateman, M. C. & Goldberg, M. P. Rapid alterations in dendrite morphology during
sublethal hypoxia or glutamate receptor activation. Neurobiol. Dis. 3, 215–227 (1996). 51. Gan, W. B., Grutzendler, J., Wong, W. T., Wong, R. O. L. & Lichtman, J. W. Multicolor ‘DiOlistic’
labeling of the nervous system using lipophilic dye combinations. Neuron (2000). 52. Mangrum, W. I., Dowling, J. E. & Cohen, E. D. A morphological classification of ganglion cells in
the zebrafish retina. Vis. Neurosci. 19, 767–779 (2002). 53. Connaughton, V. P., Graham, D. & Nelson, R. Identification and morphological classification of
horizontal, bipolar, and amacrine cells within the zebrafish retina. J. Comp. Neurol. (2004). 54. Loopuijt, L. D., da Silva Filho, M., Hirt, B., Vonthein, R. & Kremers, J. Dendritic thickness: A
morphometric parameter to classify mouse retinal ganglion cells. Brazilian J. Med. Biol. Res. (2007).
55. Santina, L. Della, Inman, D. M., Lupien, C. B., Horner, P. J. & Wong, R. O. L. Differential progression of structural and functional alterations in distinct retinal ganglion cell types in a mouse model of glaucoma. J. Neurosci. 33, 17444–17457 (2013).
56. Santina, L. Della, Inman, D. M., Lupien, C. B., Horner, P. J. & Wong, R. O. L. Differential progression of structural and functional alterations in distinct retinal ganglion cell types in a mouse model of glaucoma. J. Neurosci. 33, 17444–17457 (2013).
57. Morgan, J. L. & Kerschensteiner, D. Shooting DNA, dyes, or indicators into tissue slices using the gene gun. Cold Spring Harb. Protoc. (2011).
58. Cia, D., Cohen, K. B., Luo, T., Lichtman, J. W. & Sanes, J. R. New Tools for the brainbow toolbox. Nat. Methods (2013).
59. Sumbre, G. & de Polavieja, G. G. The world according to zebrafish: How neural circuits generate behavior. Frontiers in Neural Circuits (2014).
60. Pan, Y. A., Livet, J., Sanes, J. R., Lichtman, J. W. & Schier, A. F. Multicolor brainbow imaging in Zebrafish. Cold Spring Harb. Protoc. (2011).
61. Xiao, T. & Baier, H. Lamina-specific axonal projections in the zebrafish tectum require the type IV collagen Dragnet. Nat. Neurosci. 10, 1529–1537 (2007).
62. Luo, W. et al. Supernova: A Versatile Vector System for Single-Cell Labeling and Gene Function Studies in vivo. Sci. Rep. 6, 1–22 (2016).
63. Costello, A. et al. Leaky Expression of the TET-On System Hinders Control of Endogenous miRNA Abundance. Biotechnol. J. 14, (2019).
64. Hosoda, H., Miyao, T., Uchida, S., Sakai, S. & Kida, S. Development of a tightly-regulated tetracycline-dependent transcriptional activator and repressor co-expression system for the strong induction of transgene expression. Cytotechnology 63, 211–216 (2011).
65. Ogai, K. et al. Upregulation of Leukemia Inhibitory Factor (LIF) during the early stage of optic nerve regeneration in zebrafish. PLoS One 9, (2014).
66. Drummond, E. S. et al. Effects of intravitreal injection of a Rho-GTPase inhibitor (BA-210), or CNTF combined with an analogue of cAMP, on the dendritic morphology of regenerating retinal ganglion cells. Restor. Neurol. Neurosci. 32, 391–402 (2014).
67. Beckers, A. & Moons, L. Dendritic shrinkage after injury: A cellular killer or a necessity for axonal regeneration? Neural Regeneration Research 14, 1313–1316 (2019).
68. Peterson, S. L. & Benowitz, L. I. Mammalian dendritic regrowth: A new perspective on neural repair. Brain 141, 1891–1894 (2018).
69. Kravtsov, V., Oren-Suissa, M. & Podbilewicz, B. The fusogen AFF-1 can rejuvenate the regenerative potential of adult dendritic trees by self-fusion. Dev. 144, 2364–2374 (2017).
70. Stone, M. C., Albertson, R. M., Chen, L. & Rolls, M. M. Dendrite injury triggers DLK-independent

General discussion and future perspectives | 223
regeneration. Cell Rep. 6, 247–253 (2014). 71. McGinn, T. E. et al. Restoration of dendritic complexity, functional connectivity, and diversity
of regenerated retinal bipolar neurons in adult zebrafish. J. Neurosci. 38, 120–136 (2018). 72. van Spronsen, M. et al. TRAK/Milton Motor-Adaptor Proteins Steer Mitochondrial Trafficking
to Axons and Dendrites. Neuron 77, 485–502 (2013). 73. Campbell, P. D. et al. Unique function of Kinesin Kif5A in localization of mitochondria in axons.
J. Neurosci. (2014). 74. Lin, M. Y. & Sheng, Z. H. Regulation of mitochondrial transport in neurons. Experimental Cell
Research 334, 35–44 (2015). 75. Han, S. M., Baig, H. S. & Hammarlund, M. Mitochondria Localize to Injured Axons to Support
Regeneration. Neuron 92, 1308–1323 (2016). 76. Verreet, T., Weaver, C. J., Hino, H., Hibi, M. & Poulain, F. E. Syntaphilin-mediated docking of
mitochondria at the growth cone is dispensable for axon elongation in vivo. eNeuro 6, (2019). 77. Vaarmann, A. et al. Mitochondrial biogenesis is required for axonal growth. Dev. 143, 1981–
1992 (2016). 78. Bedse, G., Di Domenico, F., Serviddio, G. & Cassano, T. Aberrant insulin signaling in Alzheimer’s
disease: Current knowledge. Front. Neurosci. 9, (2015). 79. Cheng, A. et al. Involvement of PGC-1α in the formation and maintenance of neuronal dendritic
spines. Nat. Commun. 3, (2012). 80. He, W., Liu, Y. & Tian, X. Rosuvastatin improves neurite outgrowth of cortical neurons against
oxygen-glucose deprivation via notch1-mediated mitochondrial biogenesis and functional improvement. Front. Cell. Neurosci. 12, (2018).
81. Cameron, R. B., Beeson, C. C. & Schnellmann, R. G. Development of Therapeutics That Induce Mitochondrial Biogenesis for the Treatment of Acute and Chronic Degenerative Diseases. J. Med. Chem. 59, 10411–10434 (2016).
82. Chang, C. Y., Liang, M. Z. & Chen, L. Current progress of mitochondrial transplantation that promotes neuronal regeneration. Transl. Neurodegener. 8, (2019).
83. Hirano, M., Emmanuele, V. & Quinzii, C. M. Emerging therapies for mitochondrial diseases. Essays in Biochemistry 62, 467–481 (2018).
84. McCully, J. D., Levitsky, S., del Nido, P. J. & Cowan, D. B. Mitochondrial transplantation for therapeutic use. Clin. Transl. Med. 5, (2016).
85. McCully, J. D., Cowan, D. B., Emani, S. M. & del Nido, P. J. Mitochondrial transplantation: From animal models to clinical use in humans. Mitochondrion 34, 127–134 (2017).
86. Nakamura, Y., Park, J. H. & Hayakawa, K. Therapeutic use of extracellular mitochondria in CNS injury and disease. Experimental Neurology 324, (2020).
87. Babenko, V. A. et al. Improving the Post-Stroke Therapeutic Potency of Mesenchymal Multipotent Stromal Cells by Cocultivation With Cortical Neurons: The Role of Crosstalk Between Cells. Stem Cells Transl. Med. 4, 1011–1020 (2015).
88. Masuzawa, A. et al. Transplantation of autologously derived mitochondria protects the heart from ischemia-reperfusion injury. Am. J. Physiol. - Hear. Circ. Physiol. 304, (2013).
89. Shi, X., Zhao, M., Fu, C. & Fu, A. Intravenous administration of mitochondria for treating experimental Parkinson’s disease. Mitochondrion 34, 91–100 (2017).
90. Gollihue, J. L. et al. Effects of Mitochondrial Transplantation on Bioenergetics, Cellular Incorporation, and Functional Recovery after Spinal Cord Injury. J. Neurotrauma 35, 1800–1818 (2018).
91. Chien, L., Liang, M. Z., Chang, C. Y., Wang, C. & Chen, L. Mitochondrial therapy promotes regeneration of injured hippocampal neurons. Biochim. Biophys. Acta - Mol. Basis Dis. 1864, 3001–3012 (2018).
92. Nascimento-dos-Santos, G. et al. Neuroprotection from optic nerve injury and modulation of oxidative metabolism by transplantation of active mitochondria to the retina. Biochim. Biophys. Acta - Mol. Basis Dis. 1866, 165686 (2020).
93. Emani, S. M. & McCully, J. D. Mitochondrial transplantation: Applications for pediatric patients

224 | Chapter 6
with congenital heart disease. Translational Pediatrics 7, 169–175 (2018). 94. Paquette, M., El-Houjeiri, L. & Pause, A. mTOR pathways in cancer and autophagy. Cancers 10,
(2018). 95. Jung, C. H., Ro, S. H., Cao, J., Otto, N. M. & Kim, D. H. MTOR regulation of autophagy. FEBS
Letters 584, 1287–1295 (2010). 96. Holczer, M. et al. A double negative feedback loop between MTORC1 and AMPK kinases
guarantees precise autophagy induction upon cellular stress. Int. J. Mol. Sci. 20, (2019). 97. Dossou, A. S. & Basu, A. The emerging roles of mTORC1 in macromanaging autophagy. Cancers
11, (2019). 98. Kim, Y. C. & Guan, K. L. MTOR: A pharmacologic target for autophagy regulation. Journal of
Clinical Investigation 125, 25–32 (2015). 99. Sarkar, S., Ravikumar, B., Floto, R. A. & Rubinsztein, D. C. Rapamycin and mTOR-independent
autophagy inducers ameliorate toxicity of polyglutamine-expanded huntingtin and related proteinopathies. Cell Death and Differentiation 16, 46–56 (2009).
100. Sarkar, S. Regulation of autophagy by mTOR-dependent and mTOR-independent pathways: Autophagy dysfunction in neurodegenerative diseases and therapeutic application of autophagy enhancers. Biochem. Soc. Trans. 41, 1103–1130 (2013).
101. Sun, F., Xu, X., Wang, X. & Zhang, B. Regulation of autophagy by Ca2+. Tumor Biology 37, 15467–15476 (2016).
102. Williams, A. et al. Novel targets for Huntington’s disease in an mTOR-independent autophagy pathway. Nat. Chem. Biol. 4, 295–305 (2008).
103. Grienberger, C. & Konnerth, A. Imaging Calcium in Neurons. Neuron 73, 862–885 (2012). 104. Ahumada-Castro, U. et al. MTOR-independent autophagy induced by interrupted endoplasmic
reticulum-mitochondrial Ca2+ communication: a dead end in cancer cells. Autophagy 15, 358–361 (2019).
105. Ureshino, R. P. et al. The interplay between ca2+ signaling pathways and neurodegeneration. International Journal of Molecular Sciences 20, (2019).
106. Pozzo Miller, L. D., Petrozzino, J. J., Golarai, G. & Connor, J. A. Ca2+ release from intracellular stores induced by afferent stimulation of CA3 pyramidal neurons in hippocampal slices. J. Neurophysiol. 76, 554–562 (1996).
107. Bollmann, J. H., Helmchen, F., Gerard G Borst, J. & Sakmann, B. Postsynaptic Ca2+ influx mediated by three different pathways during synaptic transmission at a calyx-type synapse. J. Neurosci. 18, 10409–10419 (1998).
108. Muto, A. et al. Genetic visualization with an improved GCaMP calcium indicator reveals spatiotemporal activation of the spinal motor neurons in zebrafish. Proc. Natl. Acad. Sci. U. S. A. 108, 5425–5430 (2011).
109. Vendrell-Llopis, N. & Yaksi, E. Evolutionary conserved brainstem circuits encode category, concentration and mixtures of taste. Sci. Rep. 5, (2015).
110. Schwindt, P. C., Spain, W. J. & Crill, W. E. Effects of intracellular calcium chelation on voltage-dependent and calcium-dependent currents in cat neocortical neurons. Neuroscience 47, 571–578 (1992).
111. Kettunen, P. Calcium imaging in the zebrafish. Adv. Exp. Med. Biol. 740, 1039–1071 (2012). 112. Chávez, M. N. et al. Autophagy Activation in Zebrafish Heart Regeneration. Sci. Rep. 10, (2020). 113. Espín-Palazón, R. et al. TNFα Impairs Rhabdoviral Clearance by Inhibiting the Host Autophagic
Antiviral Response. PLoS Pathog. 12, (2016). 114. Eskelinen, E. L., Reggiori, F., Baba, M., Kovács, A. L. & Seglen, P. O. Seeing is believing: The
impact of electron microscopy on autophagy research. Autophagy 7, 935–956 (2011). 115. Ottolini, D., Calì, T. & Brini, M. Methods to measure intracellular Ca2+ fluxes with organelle-
targeted aequorin-based probes. Methods in Enzymology 543, (2014). 116. McWilliams, T. G. et al. Mito-QC illuminates mitophagy and mitochondrial architecture in vivo.
J. Cell Biol. 214, 333–345 (2016). 117. Sun, F. et al. Sustained axon regeneration induced by co-deletion of PTEN and SOCS3. Nature

General discussion and future perspectives | 225
480, 372–375 (2011). 118. Abe, N., Borson, S. H., Gambello, M. J., Wang, F. & Cavalli, V. Mammalian Target of Rapamycin
(mTOR) activation increases axonal growth capacity of injured peripheral nerves. J. Biol. Chem. 285, 28034–28043 (2010).
119. Park, K. K. et al. Promoting axon regeneration in the adult CNS by modulation of the PTEN/mTOR pathway. Science (80-. ). 322, 963–966 (2008).
120. Blattler, S. M. et al. Defective Mitochondrial Morphology and Bioenergetic Function in Mice Lacking the Transcription Factor Yin Yang 1 in Skeletal Muscle. Mol. Cell. Biol. 32, 3333–3346 (2012).
121. Cunningham, J. T. et al. mTOR controls mitochondrial oxidative function through a YY1-PGC-1α transcriptional complex. Nature 450, 736–740 (2007).
122. Haissaguerre, M., Saucisse, N. & Cota, D. Influence of mTOR in energy and metabolic homeostasis. Molecular and Cellular Endocrinology 397, 67–77 (2014).
123. Laplante, M. & Sabatini, D. M. mTOR signaling at a glance. J. Cell Sci. 122, 3589–3594 (2009). 124. Morita, M. et al. MTORC1 controls mitochondrial activity and biogenesis through 4E-BP-
dependent translational regulation. Cell Metab. 18, 698–711 (2013). 125. de la Cruz López, K. G., Toledo Guzmán, M. E., Sánchez, E. O. & García Carrancá, A. mTORC1 as
a Regulator of Mitochondrial Functions and a Therapeutic Target in Cancer. Frontiers in Oncology 9, (2019).
126. Dodd, K. M., Yang, J., Shen, M. H., Sampson, J. R. & Tee, A. R. mTORC1 drives HIF-1α and VEGF-A signalling via multiple mechanisms involving 4E-BP1, S6K1 and STAT3. Oncogene 34, 2239–2250 (2015).
127. Bhaskar, P. T. et al. mTORC1 Hyperactivity Inhibits Serum Deprivation-Induced Apoptosis via Increased Hexokinase II and GLUT1 Expression, Sustained Mcl-1 Expression, and Glycogen Synthase Kinase 3 Inhibition. Mol. Cell. Biol. 29, 5136–5147 (2009).
128. Düvel, K. et al. Activation of a metabolic gene regulatory network downstream of mTOR complex 1. Mol. Cell 39, 171–183 (2010).
129. Morita, M. et al. MTOR coordinates protein synthesis, mitochondrial activity. Cell Cycle 14, 473–480 (2015).
130. Cargnello, M., Tcherkezian, J. & Roux, P. P. The expanding role of mTOR in cancer cell growth and proliferation. Mutagenesis 30, 169–176 (2015).
131. Ryskalin, L. et al. mTOR-Dependent Cell Proliferation in the Brain. BioMed Research International 2017, (2017).
132. Tian, T., Li, X. & Zhang, J. mTOR signaling in cancer and mtor inhibitors in solid tumor targeting therapy. International Journal of Molecular Sciences 20, (2019).
133. Forbes, S. A. et al. COSMIC: Mining complete cancer genomes in the catalogue of somatic mutations in cancer. Nucleic Acids Res. 39, (2011).
134. Arachchige Don, A. S. et al. Targeting mTOR as a novel therapeutic strategy for traumatic CNS injuries. Drug Discovery Today 17, 861–868 (2012).


Summary | 227
SUMMARY
Neurodegeneration in the central nervous system (CNS), inflicted by disease or trauma,
is irreversible, as adult mammals lack the robust capacity to repair or replace these
injured/lost neurons. This regenerative failure has an enormous impact on the life quality of
patients, often even resulting in their death, and an efficient therapy to induce functional
recovery in the mammalian CNS is not available yet. Strikingly, over the past decades,
regenerative research has mainly focused on stimulating axonal regeneration, thereby
completely ignoring the dendrites. Nevertheless, dendrite pathologies, including dendritic
pruning and loss of synapses, are manifesting early in neurodegenerative disease or after brain
trauma. Unfortunately, it also remains largely elusive whether CNS dendrites can regrow in
the mammalian CNS, how this process could be stimulated, or what the role of dendrites is in
the axonal regeneration process. In this doctoral study, we have used spontaneously
regenerating adult zebrafish to study whether dendrites are also affected after axonal
damage, and to determine the crucial dendritic responses enabling successful axonal
regrowth. Zebrafish indeed possess enormous regenerative capacities, and since the
underlying signaling cascades appear conserved within vertebrates, these fish form the ideal
model organism for this project. More specifically, we used the visual system, a recognized
powerful model that lies at the root of the discovery/development of the main regeneration-
inducing strategies in the mammalian CNS.
The first aim of this PhD thesis was to characterize the time line of axonal and dendritic
growth responses in the adult zebrafish after optic nerve damage. Our data show that within
this injury model dendrites first shrink before axons start to regrow and that these dendrites
only restore when the outgrowing axons reconnect with their target neurons in the brain.
Interestingly, retinal inhibition of mechanistic target of rapamycin (mTOR) and of matrix
metalloproteinases, were found to prevent synaptic/dendritic degradation and subsequently
delay axonal regeneration. These data thus suggest an antagonistic interplay between axons
and dendrites, in which the latter counteract axonal regrowth. Two potentially underlying
mechanisms were investigated next: (1) an intraneuronal energy restriction or trade-off, or
(2) a restriction of building blocks. For the energy-based hypothesis, we focused on the role
of mitochondria, as an increasing amount of literature states a critical role for these organelles
in inducing axonal regrowth after injury. First, we characterized mitochondrial redistribution

228 | Summary
after optic nerve crush (ONC) in the different neuronal compartments of the retinal ganglion
cells (RGCs), being the dendrites, somas and axons. ONC was found to induce a strong
decrease of mitochondria at the level of the RGC dendrites, right at the moment of dendrite
shrinkage, as well as in the optic tectum, correlating with axonal degeneration. Mitochondria
then re-appeared in the optic tectum and retina, at the moment of axonal reinnervation and
dendritic repair, respectively. All in all, these data are nicely in line with the hypothesis that a
release of dendritic mitochondria is crucial for their translocation to the axonal growth cone
to boost axon regeneration, and that subsequent dendrite regrowth is aided by a return of
mitochondria to the retina. In a next set of experiments, we then further investigated
mitochondrial dynamics and revealed that biogenesis in the RGC soma is increased in two
distinct phases, just before the start of axonal regrowth and before reconstruction of
synapses/dendrites in the retina, again indicating a presumable prominent role of the newly-
formed mitochondria within these two processes. In addition, mitochondrial fission was
strongly increased during spontaneous regeneration, but the exact (beneficial/detrimental)
role of this fission response is still unclear.
Finally, in the last part of this work the possible role of autophagy in axon repair and/or
dendritic remodeling was studied in adult zebrafish subjected to ONC. Here, we revealed that
autophagy is indeed enhanced after injury in RGC somas and axons, as well as in the Müller
glia within the retina. Interestingly, the pattern of the autophagic response in the axons
exactly followed the spatiotemporal window of axon regrowth, which suggests that autophagy
is ongoing inside the growth cones. In a final experiment, inhibition of autophagy was found
to improve axonal regrowth, a surprising result that provokes further research.
To conclude, this work revealed the important concept of an antagonistic axon-dendrite
interaction during injury-induced neuronal repair, and provided essential insights and
knowledge concerning a possible role for mitochondrial dynamics and autophagy in the
regenerative process. As such, we are convinced that this research can contribute to the
search for innovative regenerative therapies to reverse neurodegeneration in the CNS.
Samenvatting | 229
SAMENVATTING
Neurodegeneratie in het centrale zenuwstelsel (CZS) na ziekte of trauma is
onomkeerbaar, aangezien volwassen zoogdieren slechts een beperkte capaciteit hebben om
deze beschadigde/verloren neuronen te herstellen of te vervangen. Dit heeft dan ook een
enorme impact op de levenskwaliteit van patiënten, vaak zelfs met de dood tot gevolg, en,
jammer genoeg is er nog geen efficiënte therapie beschikbaar om functioneel herstel in het
CZS van zoogdieren te induceren. Opvallend is dat regeneratie-gerelateerd onderzoek zich de
afgelopen decennia vooral heeft gericht op het stimuleren van axonale regeneratie, waarbij
de dendrieten volledig werden genegeerd. Toch manifesteren dendrietpathologieën,
waaronder dendritische inkrimping en het verlies van synapsen, zich al vroeg in een
neurodegeneratieve ziekte of na trauma. Helaas is het ook niet duidelijk of dendrieten in het
CZS van zoogdieren kunnen hergroeien, hoe dit proces kan worden gestimuleerd, of wat de
rol van dendrieten is in het axonale regeneratieproces. In deze doctoraatsstudie hebben we
spontaan regenererende volwassen zebravissen gebruikt om te onderzoeken of dendrieten
ook na axonale schade worden aangetast, en om de cruciale dendritische respons te bepalen
die een succesvolle axonale hergroei mogelijk maakt. Zebravissen hebben inderdaad een
enorme regeneratiecapaciteit en aangezien de onderliggende signaalwegen geconserveerd
lijken bij vertebraten, zijn deze vissen het ideale modelorganisme voor dit project. Meer
specifiek hebben we gebruik gemaakt van het visueel systeem, een erkend krachtig model dat
aan de basis ligt van de ontdekking/ontwikkeling van de belangrijkste regeneratie-
inducerende strategieën in het CZS van zoogdieren.
Het eerste doel van dit proefschrift was het karakteriseren van de tijdslijn van de axonale
en dendritische groeiresponsen bij de volwassen zebravis na beschadiging van de optische
zenuw. Onze resultaten tonen aan dat bij dit schademodel dendrieten eerst krimpen voordat
axonen opnieuw beginnen te groeien, en dat deze dendrieten slechts worden hersteld
wanneer de uitgroeiende axonen opnieuw verbinding maken met de neuronen in de
hersenen. Interessant was dat inhibitie van ‘mechanistic target of rapamycin’ (mTOR) en
matrix metalloproteïnases synaptische/dendritische degradatie verhinderden en vervolgens
axonale regeneratie vertraagden. Deze data suggereren dus een antagonistische
wisselwerking tussen axonen en dendrieten, waarbij deze laatsten axonale hergroei
tegenwerken. Vervolgens werden twee mogelijke onderliggende mechanismen onderzocht:
230 | Samenvatting
(1) een intraneuronale energiebeperking of wisselwerking, of (2) een beperking van de
bouwstenen.
Voor de energie-hypothese hebben we ons gericht op de rol van mitochondriën,
aangezien veel recente artikels rapporteren over een kritische functie van deze organellen in
het induceren van axonaal herstel. Eerst hebben we de mitochondriale herverdeling na ‘optic
nerve crush’ (ONC) in de verschillende neuronale compartimenten van de retinale
ganglioncellen (RGC's), zijnde de dendrieten, cellichamen en axonen, gekarakteriseerd. ONC
bleek een sterke daling in mitochondriën te induceren ter hoogte van de RGC-dendrieten, op
het moment van dendrietinkrimping, alsook in het optisch tectum, gelinkt met axonale
degeneratie. Mitochondriën kwamen vervolgens weer terug in het optisch tectum en de
retina, respectievelijk, op het moment van axonale reïnnervatie en dendritisch herstel.
Kortom, deze gegevens liggen in lijn met de hypothese dat het vrijkomen van dendritische
mitochondriën cruciaal is voor hun translocatie naar de axonale groeiconus om axonale
regeneratie te stimuleren, en dat het daaropvolgend herstel van de dendrieten wordt
bevorderd door een terugkeer van mitochondriën naar de retina. In een volgende reeks
experimenten hebben we mitochondriale dynamieken onderzocht, en hieruit bleek dat
biogenese in het cellichaam van de RGC’s wordt verhoogd in twee verschillende fasen, net
voor het begin van de axonale hergroei en voor de reconstructie van synapsen/dendrieten in
de retina, wat wederom op een potentiële prominente rol van de nieuw-gevormde
mitochondriën binnen deze twee processen kan wijzen. Bovendien kwam mitochondrial fissie
zeer sterk tot stand tijdens spontane regeneratie, maar de exacte (gunstige/schadelijke) rol
van deze fissiereactie is nog steeds onduidelijk.
Ten slotte werd in het laatste deel van dit werk de mogelijke rol van autofagie in axonaal
herstel en/of dendritische hermodellering bestudeerd bij volwassen zebravissen na ONC.
Hierbij werd vastgesteld dat de mate van autofagie na letsel inderdaad sterk stijgt in de
cellichamen en axonen van de RGCs, alsook in de Müller glia. Interessant is dat autofagie in de
axonen exact het spatiotemporele patroon van axonale hergroei volgde, wat suggereert dat
autofagie optreedt in de groeiconus. In een laatste experiment werd een versnelde axonale
hergroei vastgesteld na autofagie-inhibitie, een verrassend resultaat dat verder onderzoek
uitlokt.

Samenvatting | 231
Kortom, dit werk heeft het belangrijke concept van een antagonistische axon-dendriet
interactie tijdens het axonaal herstel aangetoond, en bood essentiële inzichten en kennis met
betrekking tot een mogelijke rol voor mitochondriale dynamieken en autofagie in het
regeneratieve proces. We zijn er dan ook van overtuigd dat dit onderzoek een bijdrage kan leveren
aan de ontwikkeling van nieuwe therapieën om neurodegeneratie om te keren in het CZS.

232 | List of publications
LIST OF PUBLICATIONS
PUBLICATIONS IN INTERNATIONAL ACADEMIC JOURNALS
Vanhunsel, S., Beckers, A., Moons, L. (2020). Designing neuroreparative strategies using aged animal
models, Ageing research reviews.
Houbrechts, A.M., Beckers, A., Vancamp, P., Sergeys, J., Gysemans, C., Mathieu, C., Darras, V.M.
(2019). Age-Dependent Changes in Glucose Homeostasis in Male Deiodinase Type 2 Knockout
Zebrafish. Endocrinology, 160 (11), 2759-2772.
Beckers, A., Van Dyck, A., Bollaerts, I., Van houcke, J., Lefevere, E., Andries, L., Agostinone, J., Van
Hove, I., Di Polo, A., Lemmens, K., Moons, L. (2019). An Antagonistic Axon-Dendrite Interplay Enables
Efficient Neuronal Repair in the Adult Zebrafish Central Nervous System. Molecular neurobiology, 56
(5), 3175-3192.
Beckers, A., Moons, L. with Moons, L. (2019). Dendritic shrinkage after injury: a cellular killer or a
necessity for axonal regeneration? Neural Regeneration Research, 14 (8), 1313-1316.
Van houcke, J., Geeraerts, E., Vanhunsel, S., Beckers, A., Noterdaeme, L., Christiaens, M., Bollaerts, I.,
De Groef, L., Moons, L. with Moons, L. (2019). Extensive growth is followed by neurodegenerative
pathology in the continuously expanding adult zebrafish retina. Biogerontology, 20 (1), 109-125.
Bollaerts, I., Van Houcke, J., Beckers, A., Lemmens, K., Vanhunsel, S., De Groef, L., Moons, L. (2019).
Prior Exposure to Immunosuppressors Sensitizes Retinal Microglia and Accelerates Optic Nerve
Regeneration in Zebrafish. Mediators of Inflammation, 2019.
Van Houcke, J., Bollaerts, I., Geeraerts, E., Davis, B., Beckers, A., Van Hove, I., Lemmens, K., De Groef,
L., Moons, L. with Van houcke, J. (2017). Successful optic nerve regeneration in the senescent zebrafish
despite age-related decline of cell intrinsic and extrinsic response processes. Neurobiology Of Aging,
60, 1-10.
COMMUNICATIONS ON INTERNATIONAL MEETINGS
Masin, L., Beckers, A., Van Dyck, A., Andries, L., Moons, L. (2019). Fueling axonal regeneration:
dendritic energy to the rescue? Presented at the Targeting Mitochondria 2019, Berlin, 29 Oct 2019 –
31 Oct 2019.
Van Dyck, A., Beckers, A., Masin, L., Andries, L., De Groef, L., Moons, L. (2019). Dendritic mitochondrial
energy channeling as driver of successful axonal regeneration. Presented at the EdinFishTech 2019,
Edinburgh, 28 Aug 2019-30 Aug 2019.
Bollaerts, I., Van houcke, J., Andries, L., Beckers, A., Vanhunsel, S., De Groef, L., Moons, L. (2018).
Myeloid-macroglial crosstalk as motor for optic nerve regeneration. Presented at the Neuroscience,
San Diego, US, 03 Nov 2018-07 Nov 2018.
Beckers, A., Van Dyck, A., Bollaerts, I., Van houcke, J., Lemmens, K., Moons, L. (2018). Dendritic
retraction is a prerequisite for efficient axonal regeneration of retinal ganglion cells. Presented at the
Targeting Mitochondria Congress, Berlin, Germany, 23 Oct 2018-25 Oct 2018.

List of publications | 233
Moons, L.K M., Beckers, A., Van Dyck, A., Andries, L., Agostinone, J., Van Houcke, J., Di Polo, A.,
Bollaerts, I., Lemmens, K. (2018). Dendritic retraction is a prerequisite for efficient axonal regeneration
of retinal ganglion cells. In: INVESTIGATIVE OPHTHALMOLOGY & VISUAL SCIENCE: vol. 59 (9).
Presented at the Annual Meeting of the Association-for-Research-in-Vision-and-Ophthalmology
(ARVO), Honolulu, HI, 29 Apr 2018-03 May 2018.
Vanhunsel, S., Van houcke, J., Beckers, A., Lemmens, K., Van houcke, J., Moons, G. (2018). The impact
of aging on optic nerve regeneration in an emerging animal model - Nothobranchius furzeri. Presented
at the 2018 Nothobranchius Symposium, Cologne, Germany, 07 Jun 2018-09 Jun 2018.
Moons, L., Beckers, A., Van Dyck, A., Andries, L., Bollaerts, I., Lemmens, K. (2018). Dendritic retraction
is a prerequisite for efficient axonal regeneration in the adult zebrafish retinotectal system. Presented
at the EZPM 2018 - The 5th European Zebrafish Principal Investigator Meeting, Trenta, Italy, 20 Mar
2018-23 Mar 2018.
Bollaerts, I., Van houcke, J., Beckers, A., Vanhunsel, S., Lemmens, K., De Groef, L., Moons, L. (2017).
Acute neuroinflammation to rebuild a brain: insights from zebrafish. Presented at the Glia Meeting,
Edinburgh, UK, 08 Jul 2017-11 Jul 2017.
Beckers, A., Bollaerts, I., Van houcke, J., Lemmens, K., Moons, L. (2017). Axon and dendrite regrowth
are temporarily correlated upon injury in the CNS of adult zebrafish. Presented at the European
zebraFish meeting, Budapest, 03 Jul 2017-07 Jul 2017.
Beckers, A., Van Dyck, A., Bollaerts, I., Van houcke, J., Lemmens, K., Moons, L. (2017). Dendritic
remodeling as fuel for axonal regeneration in the injured zebrafish retinotectal system. Presented at
the Optic Nerve Meeting, Obergürgl, Austria, 12 Dec 2017-14 Dec 2017.
Lemmens, K., Beckers, A., Van houcke, J., Bollaerts, I., Andries, L., Van Hove, I., Moons, L. (2016).
Dendritic remodeling as fuel for axonal regeneration in the injured zebrafish retinotectal system?
Primary insights from MMP inhibitory research. Presented at the Optic Nerve Meeting 2016: Boosting
Optic Nerve Function, Obergürgl, Austria, 13 Dec 2016-15 Dec 2016.
Moons, L., Beckers, A., Andries, L., Van houcke, J., Bollaerts, I., Van Hove, I., De Groef, L., Lemmens, K.
(2016). Dendrite versus axon regeneration in central nervous system repair: which way to grow?
Presented at the Neuroscience, San Diego, 12 Nov 2016-16 Nov 2016.
Beckers, A., Lemmens, K., Moons, L. (2016). The interplay between dendritic and axon regeneration
in central nervous system repair: : which way to grow? Presented at the European Association for
Vision and Eye Research, Nice, France, 04 Oct 2016-08 Oct 2016.
Lemmens, K., Beckers, A., Bollaerts, I., Van houcke, J., Van Hove, I., Moons, L. (2016). Matrix
metalloproteinases as modulators of retinal dendritic remodeling and axonal regeneration in the
injured zebrafish retinotectal system. Presented at the Metalloproteinases and their inhibitors:
beginning, past and future, Oxford, 04 Aug 2016-05 Aug 2016.
Beckers, A., Bollaerts, I., Van houcke, J., Lemmens, K., Moons, L. (2016). A temporal correlation
between axonal regeneration and dendritic remodeling in adult zebrafish? Presented at the ARVO,
Seattle, 01 May 2016-05 May 2016.
Van houcke, J., Bollaerts, I., Beckers, A., Sergeys, J., Lemmens, K., De Groef, L., Moons, L. (2016). The
impact of senescence on the zebrafish’s neuroregenerative capacities. In: Investigative
Ophthalmology & Visual Science: vol. 57. Presented at the ARVO, Seattle, 01 May 2016-05 May 2016.

234 | List of publications
Moons, L., Van houcke, J., Bollaerts, I., Beckers, A., Lemmens, K., De Groef, L. (2016). The aging
zebrafish: loss of neuroregenerative capacity. Presented at the 4th European zebrafish PI meeting,
Lisbon, 15 Mar 2016-19 Mar 2016.
Van houcke, J., Bollaerts, I., Beckers, A., Lemmens, K., De Groef, L., Moons, L. (2015). Fishing for
neuroregenerative strategies in an aging environment. Presented at the Optic Nerve Meeting,
Obergürgle, 08 Dec 2015-10 Dec 2015.
Moons, L., Bollaerts, I., Van houcke, J., Beckers, A., Lemmens, K., Van Hove, I., De Groef, L. (2015).
Microglial changes at the base of a diminished regenerative potential in the aged zebrafish retina.
Presented at the European Meeting on Glial Cells in Health and Disease, Bilbao, 15 Jul 2015-18 Jul
2015.
Van houcke, J., Bollaerts, I., Beckers, A., Lemmens, K., De Groef, L., Moons, L. (2015). Cellular
senescence affects neuroregenerative capacities in the aged zebrafish retinotectal system. Presented
at the European Zebrafish Meeting, Oslo, 28 Jun 2015-02 Jul 2015.
Bollaerts, I., Van houcke, J., Beckers, A., Lemmens, K., Van Hove, I., Moons, L. (2015). An acute
inflammatory response underlies axonal regeneration in the zebrafish retinotectal system. Presented
at the Eeuropean Zebrafish Meeting, Oslo, Norway, 28 Jun 2015-02 Jul 2015.
COMMUNICATIONS ON NATIONAL MEETINGS
Van Dyck, A., Beckers, A., Van houcke, J., Bollaerts, I., Lemmens, K., Moons, L. (2018). Dendritic
mitochondrial energy channeling as driver of successful axonal regeneration? Presented at the Nerf
retreat 2018, Leuven, 07 Dec 2018-07 Dec 2018.
Vanhunsel, S., Van houcke, J., Bollaerts, I., Beckers, A., Lemmens, K., De Groef, L., Moons, L. (2017).
Fish-ing for neuroregenerative strategies in senescent teleosts. Presented at the Congress of the
Belgian Society for Neuroscience, Ghent, Belgium, 22 May 2017-22 May 2017.
Bollaerts, I., Van houcke, J., Andries, L., Vanhunsel, S., Beckers, A., Lemmens, K., De Groef, L., Moons,
L. (2017). Modulation of acute inflammation to rebuild neural circuits: insights from the visual system.
Presented at the Microglia in Development and Disease (BSCDB Spring Meeting), Hasselt, Belgium, 04
May 2017-05 May 2017.
Beckers, A., Bollaerts, I., Van houcke, J., Lemmens, K., Moons, L. (2017). Axon and dendrite regrowth
are temporally correlated upon injury in the CNS of adult zebrafish. Presented at the National Congress
of the Belgian Society for Neuroscience, Ghent, Belgium, 22 May 2017-22 May 2017.
Van houcke, J., Bollaerts, I., Beckers, A., Lemmens, K., De Groef, L., Moons, L. (2016). Cellular
senescence and reduced regeneration potential in aged zebrafish. Presented at the Conference of
European Comparative Endocrinologistes, Leuven, Belgium, 21 Aug 2016-25 Aug 2016.
Van houcke, J., Bollaerts, I., Beckers, A., Lemmens, K., De Groef, L., Moons, L. (2015). The effect of
aging on neuroregenerative capacities: insights from the senescent zebrafish retina. Presented at the
Congress of the Belgian Society for Neuroscience, Mons, 22 May 2015-22 May 2015.
Bollaerts, I., Van houcke, J., Beckers, A., Lemmens, K., Van Hove, I., Moons, L. (2015). Acute
neuroinflammation mediates optic nerve regeneration in adult zebrafish. Presented at the Congress
of the Belgian Society for Neuroscience, Mons, Belgium, 22 May 2015-22 May 2015.

This work was financially supported by the Research Foundation Flanders (FWO), L’Oréal/UNESCO (For
Women in Science), by the Belgian Funds for Research in Opthalmology, and KU Leuven.