voltammetric technique for determination of arsenic residues ...
18
Malaysian Journal of Analytical Sciences, Vol 25 No 2 (2021): 268 - 285 268 VOLTAMMETRIC TECHNIQUE FOR DETERMINATION OF ARSENIC RESIDUES IN CALCIUM CARBIDE RIPENED CLIMACTERIC FRUITS (Teknik Voltammetrik bagi Penentuan Sisa Arsenik dalam Pematangan Buah Klimakterik Menggunakan Kalsium Karbida) Nurasmat Mohd Shukri 1 , Noor Zuhartini Md Muslim 1 *, Nur Fazeera Kamal 1 , Faizuan Abdullah 2 1 School of Health Sciences, Universiti Sains Malaysia, 16150 Kubang Kerian, Kelantan, Malaysia 2 Department of Chemistry, Faculty of Science, Universiti Teknologi Malaysia, 81310 Johor Bahru, Malaysia *Corresponding author: [email protected] Received: 13 December 2020; Accepted: 9 February 2021; Published: 25 April 2021 Abstract Calcium carbide (CaC2) often being used as one of the fruit ripening agents due to cheaper cost and readily available in the market. However, it is not recommended to use CaC2 in Malaysia, because the arsenic (As) residues which present as impurities in this fruit ripening agents can cause serious adverse effect to human consumption. Voltammetric measurement using a gold electrode in acidic medium (2 M HCl) was developed to determine the As residues in the fruit samples. This technique observed the electrochemical behaviour and quantitative analysis of the As(V) species at the gold electrode. It was found that As(V) undergone irreversible oxidation process at the gold electrode. The working parameters validated for differential pulse anodic stripping voltammetry (DPASV) were Ei = -0.20 V, Ef = +0.30 V, v = 0.02 V/s, Eacc1 = -1.10 V, tacc1 = 120 s, Eacc2 = +0.04V, tacc2 = 10 s and pulse amplitude = 0.05 V which produced peak potential at +0.10 V. The LOD and LOQ using statistical method were 1.3 ppb and 4 ppb, respectively. While by visual observation were 0.7 ppb and 2 ppb, respectively. The method successfully applied for the estimation of As residue in fruit ripening that was used CaC2 as a ripening agent and also As(V) in fruits bought from local market. Therefore, the developed voltammetry method can be a great potential instrument to measure As(V) in fruit sample. Keywords: differential pulse anodic stripping voltammetry, gold electrode, arsenic, calcium carbide, climacteric fruits Abstrak Kalsium karbida (CaC2) sering digunakan sebagai salah satu agen pematangan buah kerana harganya yang lebih murah dan mudah didapati di pasaran. Walau bagaimanapun, tidak digalakkan menggunakan CaC2 di Malaysia, kerana sisa arsenik (As) yang hadir sebagai kekotoran pada agen pematangan buah ini boleh menyebabkan kesan buruk yang serius terhadap penggunaan manusia. Pengukuran voltammetrik menggunakan elektrod emas dalam medium berasid (2 M HCl) dikembangkan untuk menentukan sisa As dalam sampel buah. Teknik ini memerhatikan tingkah laku elektrokimia analisis kuantitatif spesies As(V) pada elektrod emas. Didapati bahawa As(V) menjalani proses pengoksidaan yang tidak berbalik pada elektrod emas. Parameter kerja yang disahkan untuk voltammetri denyut pembeza pelucutan anodik (DPASV) adalah Ei = -0.20 V, Ef = +0.30 V, v = 0.02 V/s, Eacc1 = -1.10 V, tacc1 = 120 s, Eacc2 = +0.04V, tacc2 = 10 s dan nadi amplitud = 0.05 V yang menghasilkan potensi puncak pada +0.10 V. LOD dan
-
Upload
khangminh22 -
Category
Documents
-
view
0 -
download
0
Transcript of voltammetric technique for determination of arsenic residues ...

Malaysian Journal of Analytical Sciences, Vol 25 No 2 (2021): 268 - 285
268
VOLTAMMETRIC TECHNIQUE FOR DETERMINATION OF ARSENIC
RESIDUES IN CALCIUM CARBIDE RIPENED CLIMACTERIC FRUITS
(Teknik Voltammetrik bagi Penentuan Sisa Arsenik dalam Pematangan Buah Klimakterik
Menggunakan Kalsium Karbida)
Nurasmat Mohd Shukri1, Noor Zuhartini Md Muslim1*, Nur Fazeera Kamal1, Faizuan Abdullah2
1School of Health Sciences,
Universiti Sains Malaysia, 16150 Kubang Kerian, Kelantan, Malaysia 2Department of Chemistry, Faculty of Science,
Universiti Teknologi Malaysia, 81310 Johor Bahru, Malaysia
*Corresponding author: [email protected]
Received: 13 December 2020; Accepted: 9 February 2021; Published: 25 April 2021
Abstract
Calcium carbide (CaC2) often being used as one of the fruit ripening agents due to cheaper cost and readily available in the market.
However, it is not recommended to use CaC2 in Malaysia, because the arsenic (As) residues which present as impurities in this
fruit ripening agents can cause serious adverse effect to human consumption. Voltammetric measurement using a gold electrode
in acidic medium (2 M HCl) was developed to determine the As residues in the fruit samples. This technique observed the
electrochemical behaviour and quantitative analysis of the As(V) species at the gold electrode. It was found that As(V) undergone
irreversible oxidation process at the gold electrode. The working parameters validated for differential pulse anodic stripping
voltammetry (DPASV) were Ei = -0.20 V, Ef = +0.30 V, v = 0.02 V/s, Eacc1 = -1.10 V, tacc1 = 120 s, Eacc2 = +0.04V, tacc2 = 10 s and
pulse amplitude = 0.05 V which produced peak potential at +0.10 V. The LOD and LOQ using statistical method were 1.3 ppb and
4 ppb, respectively. While by visual observation were 0.7 ppb and 2 ppb, respectively. The method successfully applied for the
estimation of As residue in fruit ripening that was used CaC2 as a ripening agent and also As(V) in fruits bought from local market.
Therefore, the developed voltammetry method can be a great potential instrument to measure As(V) in fruit sample.
Keywords: differential pulse anodic stripping voltammetry, gold electrode, arsenic, calcium carbide, climacteric fruits
Abstrak
Kalsium karbida (CaC2) sering digunakan sebagai salah satu agen pematangan buah kerana harganya yang lebih murah dan mudah
didapati di pasaran. Walau bagaimanapun, tidak digalakkan menggunakan CaC2 di Malaysia, kerana sisa arsenik (As) yang hadir
sebagai kekotoran pada agen pematangan buah ini boleh menyebabkan kesan buruk yang serius terhadap penggunaan manusia.
Pengukuran voltammetrik menggunakan elektrod emas dalam medium berasid (2 M HCl) dikembangkan untuk menentukan sisa
As dalam sampel buah. Teknik ini memerhatikan tingkah laku elektrokimia analisis kuantitatif spesies As(V) pada elektrod emas.
Didapati bahawa As(V) menjalani proses pengoksidaan yang tidak berbalik pada elektrod emas. Parameter kerja yang disahkan
untuk voltammetri denyut pembeza pelucutan anodik (DPASV) adalah Ei = -0.20 V, Ef = +0.30 V, v = 0.02 V/s, Eacc1 = -1.10 V,
tacc1 = 120 s, Eacc2 = +0.04V, tacc2 = 10 s dan nadi amplitud = 0.05 V yang menghasilkan potensi puncak pada +0.10 V. LOD dan
Nurasmat et al: VOLTAMMETRIC TECHNIQUE FOR DETERMINATION OF ARSENIC RESIDUES IN
CALCIUM CARBIDE RIPENED CLIMACTERIC FRUITS
269
LOQ menggunakan kaedah statistik masing-masing adalah 1.3 ppb dan 4 ppb, sementara dengan pemerhatian visual masing-
masing 0.7 ppb dan 2 ppb. Kaedah ini berjaya digunakan untuk perkiraan sisa As dalam pematangan buah yang mengunakan CaC2
sebagai agen pematangan dan As(V) pada buah-buahan yang dibeli di pasar tempatan. Oleh itu, kaedah voltammetri yang
dikembangkan dapat menjadi instrumen berpotensi besar untuk mengukur As(V) dalam sampel buah.
Kata kunci: voltammetri denyut pembeza pelucutan anodik, elektrod emas, arsenik, kalsium karbida, buah klimaterik
Introduction
The ripening of fruits after storage has shown many
commercial advantages since it effectively lengthens the
season fruits may be kept without the need to undergo
canning processes [1]. Fruits generally store better if
they are picked before they are mature. The ripening
process will soften the cell wall substances and digest
the starch and other constituents of the fruit, making the
ripe fruit subject to bruising and effective medium for
fungal growth [2]. The transportation of the unripe fruit
can be handled easier as fruits that are green and firmer
so the injury can be reduced as compared to ripe fruits
[3].
According to Prasanna et al. [3], ripe fruit cannot be kept
as well as green fruits due to the digestion and chemical
transformation occurred at a high rate in ripe fruits.
Thus, unripe fruits are preferable to be stored as to
lengthen the period of availability and get to regulate the
supply in the market. Therefore, the use of artificial fruit
ripening agents has become prevalent mostly due to the
commercial purposes of unripen fruit. Artificial ripening
agent is used for fruits supply in the market to make it
available for the customer during off-season [1].
Nowadays, several artificial ripening agents are
available and used, such as calcium carbide, ethylene
gas, carbon monoxide, potassium sulphate, ethephon,
potassium dihydrogen orthophosphate, putrisein,
oxytocin and protoporphyrinogen [4]. They are used
during pre-harvest, post-harvest, transportation, capping
and storage [4]. They accelerate fruits for ripening and
inducing colour changes in unripe fruits. However,
artificial fruit ripening is considered as a matter of
concern because of various health-related issues [5].
There are direct and indirect health hazards associated
with artificial ripening agents and their impurities.
One of the artificial ripeners that are far more concerned
in this research is calcium carbide (CaC2). Calcium
carbide is a chemical compound which is used in the
production of acetylene and calcium cyanamide [6]. It is
also produced industrially in an electric arc furnace from
a mixture of lime and coke at an extreme temperature
which generally had around 80% of CaC2 by weight [7].
Calcium carbide has been used extensively in Asian
countries for fruits ripening [8]. The extensive use of
this chemical is due to its low price and availability [5].
In Malaysia, for example, it can easily purchase from
rural shops for RM5.50/kg [9]. The dose recommended
for CaC2 to be applied onto fruits is about 0.3-10 g for
each kilogram of yields [8]. However, not all farmers
obey to this recommended level because of the higher
amount of CaC2 is required to wholly ripened the fruits.
The CaC2 content of the product is assessed by
measuring the amount of acetylene produced during
hydrolysis. Calcium carbide not only changed the skin
colour of the fruits, but it also initiates the enzymatic
action that breaks down the glucose resulting in a quick
ripening of the fruits [10]. Use of CaC2 sometimes gives
ripening colour to raw fruit. It also increases the shelf
life and maintains the ripened colour [10].
Calcium carbide leave behind residues of heavy metals
like arsenic (As) and phosphorus on the fruit surface,
which are potentially carcinogenic. Arsine gas released
from CaC2 combines with oxygen and other elements to
form inorganic arsenic compounds [11]. As a rule,
inorganic arsenic exhibit more significant toxicity than
organic arsenicals. Intentional or unintentional ingestion
of As can lead to serious health issues or sometimes can
be vital. Since the commercial CaC2 contains As and
phosphorus as impurities, concurrently the detected As
residues in the ripened fruits can be used as a tool to
identify fruits ripened by using carbide gas. However, it

Malaysian Journal of Analytical Sciences, Vol 25 No 2 (2021): 268 - 285
270
is not recommended to used CaC2 in Malaysia as this
artificial ripening agent can cause severe adverse effect
to human consumption. Some of the imported artificial
ripened fruit went through the border of Malaysia and
sold to the local market. The information on the
detection and determination of As residue in CaC2
ripened fruit can therefore serve as an indicator for the
presence of CaC2 used in artificial fruit ripening in the
local market.
Thus, the present study is carried out to detect the As
residues from the CaC2 ripened fruits using voltammetry
of the electrochemical technique. The use of
electrochemical techniques is of considerable
importance in analytical techniques due to their high
degree of sensitivity, accuracy, precision, and selectivity
as well as large linear dynamic range, with relatively
low-cost instrumentation [12, 13]. The stripping
voltammetry technique involves two main steps. The
first step is a controlled potential electrolysis enough to
deposit the analyte on the electrode. The second step
consists of the application of a voltage scan to the
electrode that causes an electrolytic dissolution [14].
The observation from this study can be used as an
indicator that the local or imported fruit trader has
utilized the CaC2 for their fruits ripening. The result
from this study is compared with the limit of total
arsenic proposed by Food Regulations of 1985 and
FDA/WHO which is not more than one ppm.
Materials and Methods
Apparatus, materials and reagent
A VA 797 Computrace Metrohm Voltammetric
Analyser interfaced with multi-mode electrode stand
model 663 VA (Metrohm) was used for all voltammetric
measurements, composed of a stationary gold working
electrode, an Ag/AgCl (KCl 3 M) as a reference
electrode, platinum as the auxiliary electrode, a purge
tube for purging (nitrogen) and stirring the solution
during the deposition step. The software used to control
the whole system, and the acquisition and processing of
the data was VA Computrace software (Metrohm)
installed in a computer.
Reagents were of pro-analysis grade (Merck or R&M
chemicals) and deionized water (18.2 MΩ cm
resistivity) by Sartorius Atrium pro DI ultrapure water
system. All the glassware’s were cleaned by soaking in
10% nitric acid (HNO3) and rinsed thoroughly using
deionized water prior to use. 0.1 M of sodium hydroxide
(NaOH) solution was prepared by dissolving 40 mg of
NaOH pellet with deionized water. 0.5 M sulphuric acid
(H2SO4) was prepared from H2SO4 solution diluted with
deionized water. 3 mL of concentrated HCl (37% w/w)
added with deionized water into 10 mL of the volumetric
flask to get a total concentration of 2 M HCl.
The 1000 ppm As(V) stock solution was commercially
available and bought from Agilent technologies. The
solution was stored at room temperature. The required
working and standard solutions of 10 ppm, 1 ppm, and
50 ppb of As(V) were prepared daily by diluting the
stock solutions with deionized water.
Voltammetric techniques: Electrode pre-treatment
The electrode must be kept in 0.1 M NaOH when not in
used or at least 30 minutes for cleaning purposes. Then,
it was rinsed thoroughly with ethanol and deionized
water alternatively and electrochemically activated. The
gold electrode must be electrochemically conditioned in
order to obtain reproducible curves for each
determination. This step should be done every day
before starting the measurements and when the
background current varies enormously from
measurement to measurement.
The electrochemical activation of the electrode surface
carried out by cyclic voltammetry with 0.5 M H2SO4 as
supporting electrolyte. The electrode was polarized
between 0 to +1.5 V at 0.1 V/s by applying 10 cycles.
Linear potential sweep CV was performed daily to
monitor the electrode surface electrochemical
activation, and this conditioning must be performed
several times if the background was still not consistent
yet.
Electrochemical behaviour of As
The electrochemical behaviour of As was studied using
cyclic voltammetry experiment in an electrochemical
cell to ascertain the peak potential for As element in the
fruit sample. 0.4 mL of 1 ppm of As(V) standard
solution was spiked using micropipette into a
Nurasmat et al: VOLTAMMETRIC TECHNIQUE FOR DETERMINATION OF ARSENIC RESIDUES IN
CALCIUM CARBIDE RIPENED CLIMACTERIC FRUITS
271
voltammetric cell with supporting electrolyte, 2 M of
HCl. The resulting concentration of the stock solution in
the cell was 20 ppb of As(V) standard. The CV was
performed by scanning from anodic direction and then
switched to the cathodic direction. The instrument
parameters used for the analysis of arsenic were sweep
rate of 0.1 V/s with initial purge time of 200 s, start
potential and second vertex potential, +0.5 V, switch
potential or first vertex potential, -0.3 V at voltage step
of 0.018 V.
Determination of As(V) by differential pulse anodic
stripping voltammetry
All solutions (samples and standards) were prepared to
a final volume of 20 mL, starting the analysis with the
blank solution. The blank corresponded to 2 M HCl and
was purged for two minutes with nitrogen gas. The
determination was carried out in 10 mL of sample or
standards added with 3 mL of concentrated HCl dilute
to 10 mL total volume to obtain 2 M HCl in the solution.
In the validation of the chemical conditions, the standard
addition method was employed for the determination of
As(V). The aliquots of the reagents or known
concentration of standards were spiked manually to the
blank in the cell and purge of two minutes was used.
Each scan has undergone triplicate measurement to
ensure that the peak current was constant.
The DPASV procedure was employed by starting the
determination of As(V) standard with the purging of the
solution with purified nitrogen gas for 300 s to avoid
contamination with oxygen. The electrode was pre-
treated with cleaning potential of -1.10 V for 120 s and
deposition potential at +0.04 V for 10 s, with an
equilibration time of 5 s after stirring. The gold electrode
scanned in the anodic direction from -0.2 V to +0.3 V
with differential pulses at a speed rate of 0.02 V/s, a
potential step of 6 mV and an amplitude of 50 mV. The
working method parameters were adjusted from
recommended parameters given in the operating
instruction manual of the instrument or application
bulletin 226/2e [15].
Validation
In order to confirm if the method was suitable for this
analysis, a validation was required for observing the
overall performances of the developed method.
Different validation methods were employed to ensure
that the results obtained were accurate and reliable for
the intended use. The validation method involved
precision, linearity range response, the limit of detection
(LOD), the limit of quantification (LOQ) and the
accuracy [16].
The precision and sensitivity of the instrument responses
were evaluated from six independent measurements of
As(V) standard. 20 mL of 2 M HCl were analyzed
before and after five additions of 0.4 mL of 50 ppb
As(V) standard solution. The precision was calculated
as the relative standard deviation (RSD) of the total of
six measurements for each addition. The linear range of
response was examined based on calibration curves
exploring a range of As(V) concentrations between 1 to
5 ppb.
LOD and LOQ were determined for analyte
concentration giving a signal to the blank solution, yB,
plus three or ten standard deviations of the blank,
respectively [17]. In addition to the statistical methods
for accessing LOD and LOQ, another practical approach
on determining the LOD and LOQ of the ASV method
was through visual evaluation of the produced output.
This method involved by diluting 4 ppb initial
concentration of As(V) with 1.7 mL of 2 M HCl
(supporting electrolyte) until the minimum detectable
level. In contrast, LOQ is calculated as three times the
LOD value.
The recovery test to evaluate the accuracy of the method
was performed by using spiked sample added with
As(V) concentration of 10 ppb and 20 ppb. For each
spiked sample at different concentrations, the analyte
concentration was obtained in triplicate measurement to
calculate the mean concentration.

Malaysian Journal of Analytical Sciences, Vol 25 No 2 (2021): 268 - 285
272
Fruits samples analysis
Four uniforms, mature green but unripe mangoes were
randomly procured from the private compound around
Health Campus of Universiti Sains Malaysia and
brought to the analytical laboratory for experimentation.
Nine samples believed to be ripened mangoes also
procured from the local fruit market in Kota Bharu and
Kubang Kerian, Kelantan to compare and authenticate
the results for the presence of arsenic residues in
traditionally ripened fruits. Besides, for detection of As
residues in randomly chosen fruits, there were two sets
of fruits; local fruits and imported fruits were collected.
The origin of the fruits was known based on the seller
information or displayed on the price label.
Meanwhile, a hand of banana was bought from the local
market, and only one finger was used for each treatment.
Three sets of bananas were also purchased from two
different fruit markets where each group contained four
fingers of banana. Only two fingers of banana from each
batch were analyzed for As(V) detection. One set of
bananas was from a local orchard, and another two
bunches of bananas were imported from other countries.
The fruits that need to undergo treatment with CaC2
were washed with water to remove the latex and left
dried until no moisture was visible on the fruit surfaces.
The fruits were then packed into a container and kept at
room temperature for further treatment. Commercial
grade CaC2 was bought from an online store to be used
as the ripening agent.
Treatments of fruits using calcium carbide
The extent of residues of As present on the mango fruit
ripened by using CaC2 was determined on the fruit
surface only. For conducting these studies, the harvested
fruits were ripened by using commercial grade CaC2 in
the form of solution and powdered sachet. Calcium
carbide was crushed into small pieces and weighed
using analytical weighing balance. Each fruit was
subjected to three levels of CaC2 treatment as followed:
2% solution, 5 and 10 g CaC2 per average of 230 g fruit
to induce ripening. T1 being the controls (without CaC2)
as per following treatment schedule (Table 1).
These treatments of fruit using CaC2 were adapted from
a study done by Chandel et al. [11]. The fruit from each
treatment was labelled into eight respective samples,
where M1, M2, M3 and M4 referred to mangoes while
B1, B2, B3, and B4 were for bananas. Each of the fruit
was washed using distilled water, and the resultant wash
water was introduced into glass bottles, which then
appropriately labelled and preserved in a refrigerator at
15°C for other sample digestion process.
Sample preparation for wet digestion
For estimation of As(V) on the fruit surface, the fruit of
each treatment was washed in 0.5 L of deionized water
by allowing it to dip for one hour. The fruit surface then
washed thoroughly to collect all the adhering residues in
the wash water which later used for estimation of As
residues on the fruit surface.
Wet digestion method
The wet digestion method was modified from the
standard analytical method established by AOAC [18]
to meet the sample requirement. 10 mL of washed water
of the fruit was placed into the Erlenmeyer flask. 5 mL
of H2SO4 and 5 mL of HNO3 were added in the
Erlenmeyer flask and were allowed to digest the sample
fluid. The sample was then heated gently on a hot plate
at low temperature for the destruction of organic matter.
The Erlenmeyer flask was covered with a watch glass to
avoid massive loss due to evaporation of the solution.
Heating was continued until the liquid appear darkened
in color. Further, HNO3 was added in small proportions
and heated to fuming for 20 to 30 minutes until the
solution failed to dim. When the organic matters were
merely oxidized, the solution was allowed to cool. Then,
the solution was boiled gently to fuming after addition
of 10 mL of deionized water. Finally, the digest was
cooled at ambient temperature and made to a known
volume of 50 mL by using deionized water. The
digested sample was transferred into a capillary tube,
and aliquots of digest sample were taken for
determination of As residues by using voltammetric
analysis.
Voltammetric determination of washed water fruit
samples
Differential pulse anodic stripping voltammetry
(DPASV) was carried out by adding 10 mL of digested
Nurasmat et al: VOLTAMMETRIC TECHNIQUE FOR DETERMINATION OF ARSENIC RESIDUES IN
CALCIUM CARBIDE RIPENED CLIMACTERIC FRUITS
273
sample into an electrochemical cell containing 10 mL of
2 M HCl solution. The peak for As(V) was appeared
after adding 0.1 mL of 1 ppm As(V) standard solution
into the voltammetry cell.
The amounts of As residues in washed water were
calculated according to the obtained regression equation
derived from the calibration curve from the analysis of
the sample. The 10 mL sample introduced into the 20
mL of the volumetric cell only represented one part out
of 50 mL of total wash water of fruit samples. The total
concentration of As residues in the sample were
calculated as following Equation 1:
10 mL of fruit wash water contains arsenic = X ppb
50 mL of fruit wash water contain arsenic = X × 50 mL
10 mL = 5X ppb
(1)
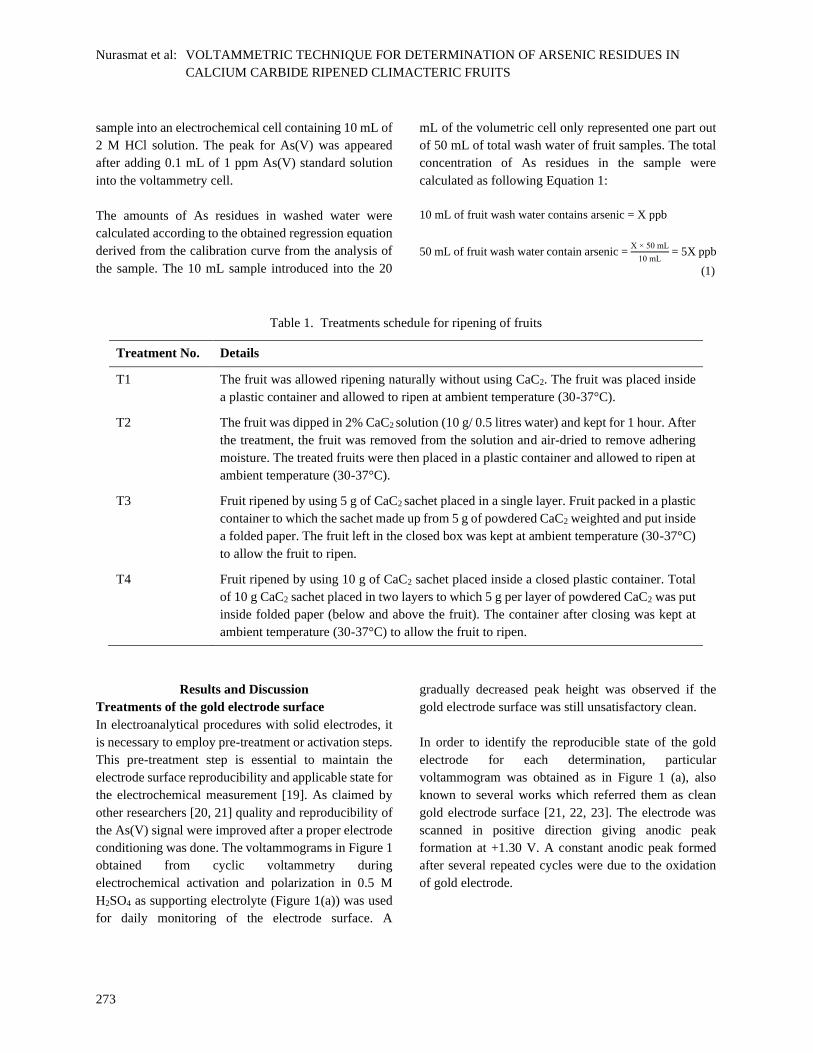
Table 1. Treatments schedule for ripening of fruits
Treatment No. Details
T1 The fruit was allowed ripening naturally without using CaC2. The fruit was placed inside
a plastic container and allowed to ripen at ambient temperature (30-37°C).
T2 The fruit was dipped in 2% CaC2 solution (10 g/ 0.5 litres water) and kept for 1 hour. After
the treatment, the fruit was removed from the solution and air-dried to remove adhering
moisture. The treated fruits were then placed in a plastic container and allowed to ripen at
ambient temperature (30-37°C).
T3 Fruit ripened by using 5 g of CaC2 sachet placed in a single layer. Fruit packed in a plastic
container to which the sachet made up from 5 g of powdered CaC2 weighted and put inside
a folded paper. The fruit left in the closed box was kept at ambient temperature (30-37°C)
to allow the fruit to ripen.
T4 Fruit ripened by using 10 g of CaC2 sachet placed inside a closed plastic container. Total
of 10 g CaC2 sachet placed in two layers to which 5 g per layer of powdered CaC2 was put
inside folded paper (below and above the fruit). The container after closing was kept at
ambient temperature (30-37°C) to allow the fruit to ripen.
Results and Discussion
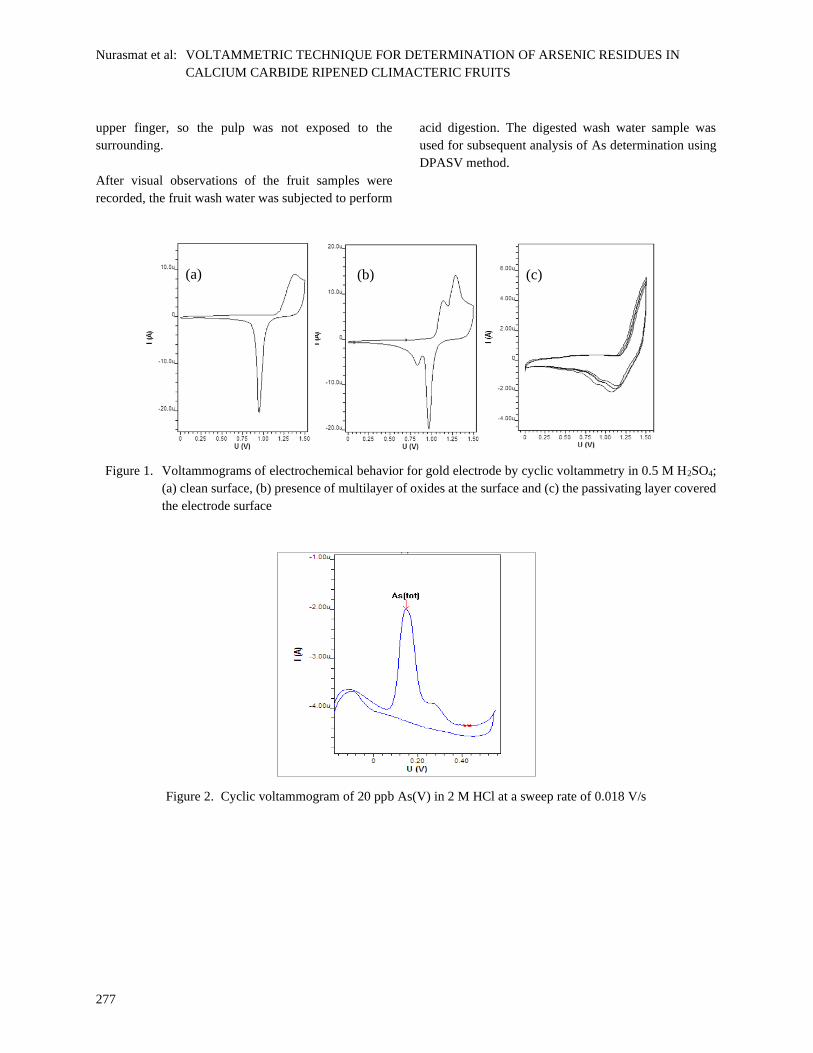
Treatments of the gold electrode surface
In electroanalytical procedures with solid electrodes, it
is necessary to employ pre-treatment or activation steps.
This pre-treatment step is essential to maintain the
electrode surface reproducibility and applicable state for
the electrochemical measurement [19]. As claimed by
other researchers [20, 21] quality and reproducibility of
the As(V) signal were improved after a proper electrode
conditioning was done. The voltammograms in Figure 1
obtained from cyclic voltammetry during
electrochemical activation and polarization in 0.5 M
H2SO4 as supporting electrolyte (Figure 1(a)) was used
for daily monitoring of the electrode surface. A
gradually decreased peak height was observed if the
gold electrode surface was still unsatisfactory clean.
In order to identify the reproducible state of the gold
electrode for each determination, particular
voltammogram was obtained as in Figure 1 (a), also
known to several works which referred them as clean
gold electrode surface [21, 22, 23]. The electrode was
scanned in positive direction giving anodic peak
formation at +1.30 V. A constant anodic peak formed
after several repeated cycles were due to the oxidation
of gold electrode.
Malaysian Journal of Analytical Sciences, Vol 25 No 2 (2021): 268 - 285
274
The nature of species that adhered on the gold surface
during oxidation is not known. However, some of the
authors suggested that the peak formation on the surface
is from the presence of monolayer of oxides or hydrated
oxides (Au2O3/Au couple) [22, 23]. A monolayer of
oxide was utterly formed at about +1.5 V corresponding
to this potential.
Figure 1 (b) shows the cyclic voltammogram when the
electrode was not cleaned adequately after several
analyses of samples were completed. The presence of
additional peaks; anodic peak at +1.15 V and cathodic
peak at +0.80 V probably due to the electrochemistry of
the gold electrode. Gold can exist in different oxidation
states (Au0, AuI and AuIII); thus, it could form into
multilayers of oxides which caused the formation of the
additional peak. According to Burke et al. [24], the
presence of these multilayer oxides could reduce the
electrode performance and might affect the As signal in
subsequent determination.
The electrode needs to be sufficiently soaked into 0.1 M
of NaOH for at least 30 minutes and alternately rinsed
with ethanol and water before chemically activated. It
was mentioned by Giacomino et al. [21] that the
sequence of cleaning processes has its function on
cleaning the deposited layer to improve the electrode
performance. The researchers believed that complete or
in part hydration layer of the gold surface might be
replaced by forming a layer of hydroxides with the
presence of NaOH. Ethanol was utilized to remove the
electrode's surface covered with hydroxides and
solubility of ethanol with water able to removes traces
of ethanol at the gold surfaces [21]. After proper
cleaning processes, cyclic voltammogram in Figure 1(a)
was able to be retrieved.
Figure 1(c) shows the development of cyclic
voltammogram that appeared to be relatively different
with the Figure 1(a) as there was no peak of oxidation
and decreased in the current charge for reduction peak
of the gold electrode. The electrode also started at a slow
sweep rate over the potential. Giacomino et al. [21]
claimed that the possibility of this outcome might come
from the formation of many layers of oxides
(passivating layer) on the electrode surface which causes
the electron transfer to be inefficient and reduce the
analyte deposition on the electrode. The gold electrode
should be polished with aluminum oxide if rinsing with
NaOH and ethanol as well, because electrochemically
conditioning has no longer provide satisfactory results
[15].
Determination of As(V) standard using voltammetry
To investigate the suitable parameters that supported the
instrument conditions, a few test runs were conducted.
The position of the purging tube for nitrogen flows
should be placed near the auxiliary electrode to
minimize the gas bubbles adhered to the auxiliary
electrode during determination. Deaeration with
nitrogen was necessary for the removal of the oxygen to
reduce the background due to oxygen reduction for
about 200 s or 300 s, working respectively with CV or
differential pulse (DP).
In the determination of As using a gold electrode,
supporting electrolyte serves as a medium used to
maintain the migration of ions in solution by electrons
transfer from the electrode to the analyte [25]. With
regard that As(V) characteristic has traditionally been
observed as poorly electroactive in alkaline, neutral or
acidic media, many studies have successfully
demonstrated the excellent ability of As(V) in reaction
with a high concentration of acid [15, 26]. HCl is the
most suitable and widely used supporting electrolyte in
which able to avoid the formation of hydrolyzed species
during stripping step of As [27]. The presence of
chloride acts as a bridge that reacts with arsenic to form
AsCl3, which can be indicated based on the positive shift
of peak potential and As signal was observed as the
digested sample added concurrently increased resistant
in migration of ions.
Although in the bulletin of Metrohm [15] has
recommended the usage of concentrated HCl as
supporting electrolyte, this study has proved 2 M HCl
was enough to provide well-defined As(V) signal in
ASV determination. This parameter was supported by
previous studies which employed 2 M of HCl in their
studies [28]. Thus, higher concentrations of HCl was not
necessarily in this study because it offered a similar
sensitivity to detect the signal of As metal and able to
Nurasmat et al: VOLTAMMETRIC TECHNIQUE FOR DETERMINATION OF ARSENIC RESIDUES IN
CALCIUM CARBIDE RIPENED CLIMACTERIC FRUITS
275
minimize the amount of acidic waste generated. This
phenomenon explained that at this concentration of acid,
it could provide good sensitivity and narrow arsenic
peaks which indicated the fast charge-transfer reaction
occurred in 2 M HCl supporting electrolyte.
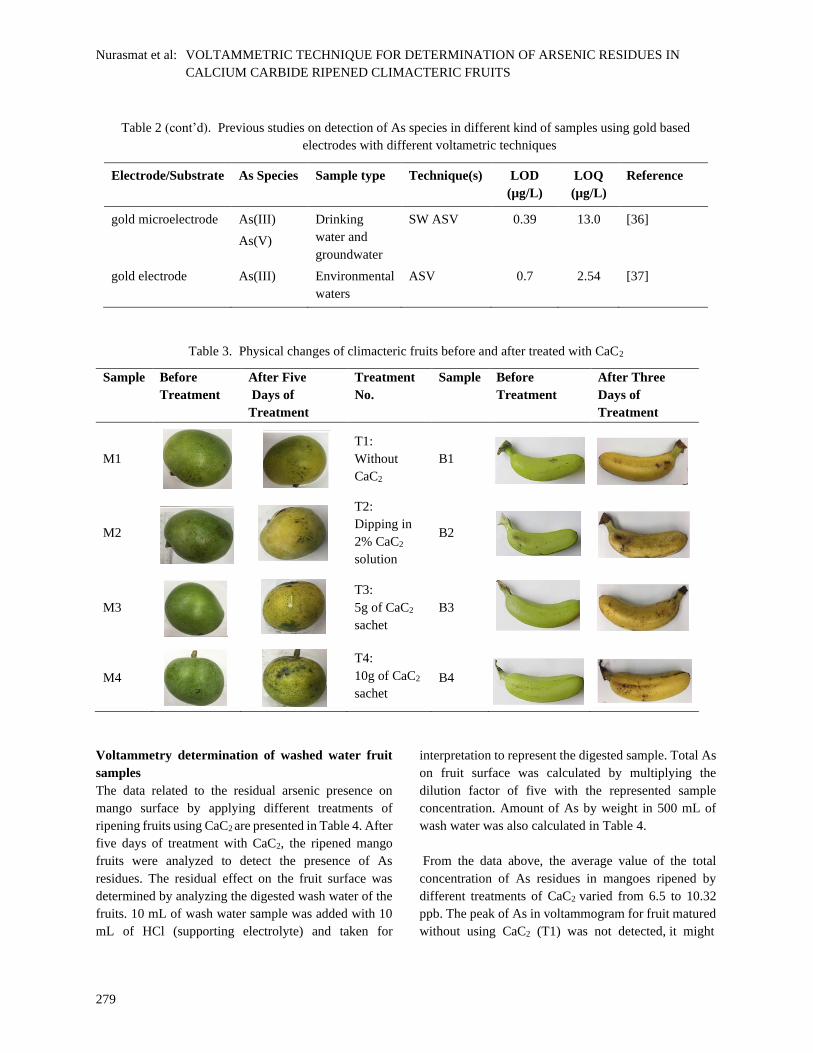
Cyclic voltammetry studies for As(V) standard
Cyclic voltammetry analysis usually employed to
acquire qualitative information about electrochemical
reactions. In this study, CV analysis of 20 ppb As(V)
standard at gold electrode offers a rapid location of
redox potentials of this species and convenient
evaluation of the effects of 2 M HCl as the supporting
electrolyte upon the redox process. Five cycles of
repetitive CV were carried out to obtain the information
of As(V) electrochemical behavior by scanning in
anodic direction and switch in cathodic order to measure
the current resulting from the applied potential.
In acidic medium, the redox process of As(V) possessed
one well-defined oxidation peak potential at +0.15 V, as
shown in Figure 2. There was also anodic current at a
positive potential more than +0.5 V and large cathodic
current at negative potentials than -0.1 V. According to
Wei and Somasundaran [29], the large cathodic current
at the negative potential was believed to cause by
hydrogen development or possibly arsine gas.
As(III) was easily oxidized to As(V) which is electro
inactive except in an extreme condition of high acid
concentration or at very negative potentials like -1.20 V
[30]. No cathodic peak for As(V) reduction was
observed, which suggested that it was irreversible at the
gold electrode. This result supported by Giacomino et
al. [21] finding where As(V) has not reduced back to
As(III) in the reverse scan.
From this information, the electrochemical behaviour of
As(V) at cyclic voltammetry was known and noted.
Subsequent analysis on As(V) determination using
DPASV was then employed. Any anodic peak presence
around the potential +0.15 V could be recognized as
peak potential for As(V) and needed to confirm by
addition of As(V) standard using DPASV.
Validation of the differential pulse anodic stripping
voltammetry method in As(V) analysis
The validation of the DPASV method for analysis of
As(V) was evaluated based on the precision, linearity,
LOD, LOQ and accuracy by recovery test [16].
Precision and linearity
Figure 3 shows the voltammogram for As(V) which
indicated that the measurements had good repeatability.
The six analyses for each concentration; 1, 2, 3, 4, and 5
ppb of As(V) standard obtained RSD values of 9.23%,
6.11%, 3.59%, 3.41% and 2.46%, respectively. The
RSD value of less than 10% believed to give good
precision, as mentioned by Taşdemir [31].
Dependence of peak current (in terms of peak height) on
the concentration of As(V) was studied using DPASV
method. Inset in Figure 3 illustrates the calibration curve
for the standard addition of As(V) using DPASV on
rotating gold electrode up to five standard addition. The
results showed that the anodic peak current has a linear
relationship with the concentration in the range of 1 to 5
ppb. The regression equation is: Ip (µA) =0.2225
[As(V)] + 0.0524 having the R2 value of 0.9983, which
close to 1 signified that the model fitted the data
obtained.
Limit of detection and limit of quantification
Based on the Miller and Miller [17] approach, the limit
of detection (LOD) and limit of quantification (LOQ)
were calculated to be 1.3 ppb and 4 ppb, respectively.
The LOD obtained was in good agreement with that
reported on validation for As(V) determination by
Garlaschelli et al. [16]. Another approach on the
determination of LOD by visual detection was taken to
confirm the lowest peak signal could be detected. Table
2 records the previous studies that focused on detecting
As(III) and As(V) in different types of samples by using
gold-based electrode which applied different
voltammetric techniques. The previous studies obtained
different LOD and LOQ values of 0.08 – 0.7 µg/L and
0.5- 0.93 µg/L, respectively [30, 32-37].
Malaysian Journal of Analytical Sciences, Vol 25 No 2 (2021): 268 - 285
276
In this study, by visually observed the voltammogram,
undetectable peak illustrated at 0.5 ppb. Having the
initial concentration of 4 ppb of As(V), 1.7 mL of
supporting electrolyte added for each dilution addition
giving the particular final concentration of As(V). The
LOD from visual determination showed significantly
lower LOD by the minimum detectable peak present at
0.7 ppb While; the LOQ was three times the LOD by
means; the LOQ was 2 ppb [16, 17, 38]. This data
indicated that by practical, the DPASV method using
gold as electrode could be considered one of the
sensitive methods for detecting As species in climacteric
fruit as the lower values of LOD and LOQ produced.
Accuracy
The accuracy of the determination was investigated
based on the recovery tests of the spiked sample on a
randomly selected sample at two different
concentrations (10 ppb and 20 ppb). The actual amount
of As(V) in the sample was calculated by using the
regression equation derived from the calibration curve
and was subtracted with the original amount in the
sample before spiked. The percentage recoveries for
As(V) spiked at a concentration of 10 ppb, and 20 ppb
were 101.43 ± 0.84% and 98.12 ± 0.24%, respectively.
The per cent showed high accuracy of recovery, and
these values fall within an acceptable range of the
standard per cent recovery between 70 to 120% [39].
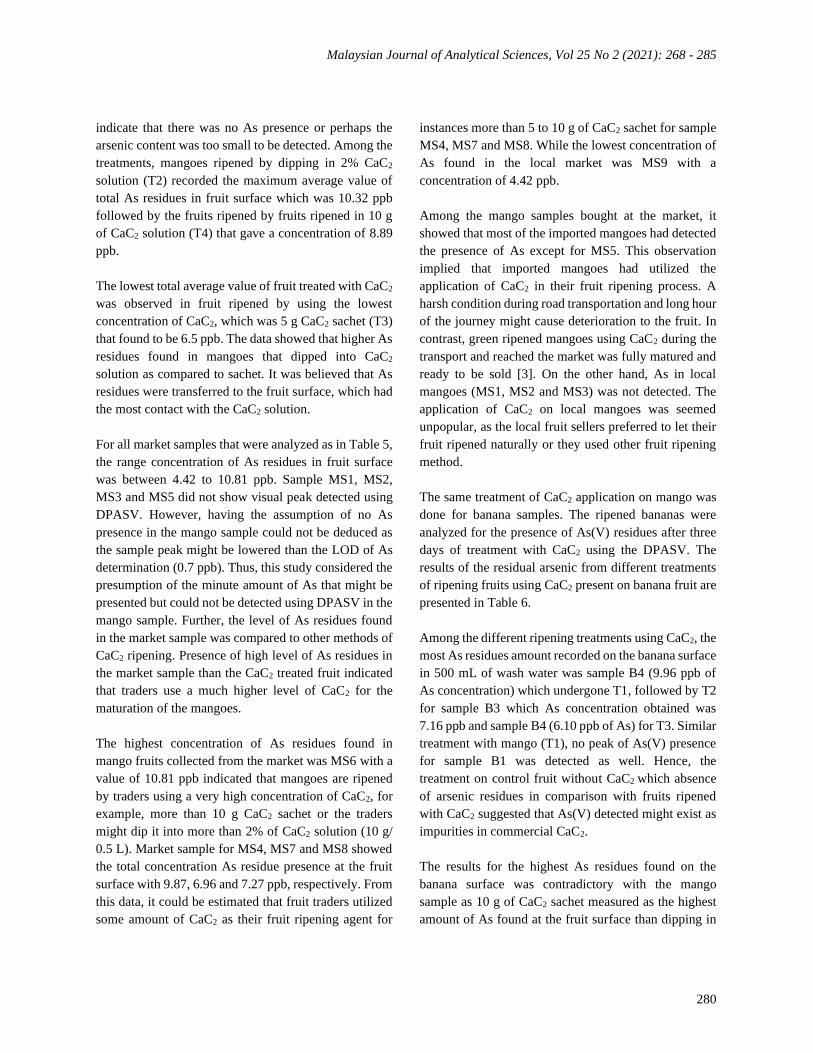
Fruit samples analysis: Physical characteristic of
fruit treated using calcium carbide
Fruit naturally ripens on trees and fruit harvested when
green (let to ripe) has quite different physicochemical
changes between them. From the previous study,
artificial ripening agent (CaC2) could affect the ripening
process [40]. Physical changes of fruit ripened with
different treatment of CaC2 are recorded in Table 3 for
mango (M1-M4) and banana (B1-B4) samples.
In brief, a total of four mangoes of the same type (apple
mango) and banana (Rastali) were treated using
different amounts of CaC2 which were kept to ripe for
five and three days, respectively. Color development is
a vital maturity index of many fruits and associated with
ripening [41]. By day five, all the mangoes were ripened
shown by color changes from green to yellow.
Sample M1 was let to be naturally ripened without any
CaC2 added in the closed container. Observation of
sample labelled as M1 showed that there were slight
changes in surface color, but the green color was still
prominent. Hence, the pulp of M1 was still raw. This
observation indicated that for naturally ripened mango,
a longer time (more than five days) was needed for the
fruit to be fully matured.
Calcium carbide, when mixed with water, will produce
acetylene gas and generates heat which fastened the
ripening process. The uniformity of surface color was
distinguishable for CaC2 sachet and CaC2 dip treatment.
For instances, M2 showed uniform yellow color
distribution on the surface as compared to M3 and M4,
where there was a part of the fruit surface did not turn
color to yellow. The reasons behind this phenomenon
might happen because the heat from CaC2 solution was
able to cover the total surface area of the fruit when
dipped. Meanwhile, for sample M3 and M4, the
convection of hot gas spreading upwards; thus, the upper
position of fruits was observed to be ripened faster than
the bottom part.
For banana samples, all the samples changed color from
green to yellow within three days. There was not much
difference of ripening time for banana either it was
naturally ripened or treated with CaC2. It was also
difficult to differentiate between uniformity of color
changes for all the samples. Somehow, CaC2 ripened
banana was subjected to bruising and darker patches and
black spots and eventually presence on the surface of
banana as seen in Table 3.
In addition to the color changes, it was observed that the
application of CaC2 to the fruit accelerates senescence
of the fruit and the fruit become rotten faster. Moisture
from the product of CaC2 reacted with water to promote
the formation of fungi or black molds on the fruit
surface. Thus, the CaC2 ripened fruit ripened faster but
did not have a longer shelf life as compared to naturally
ripened fruit. It is worth mentioning that it is essential to
choose healthy fruit and the proper cutting technique of
the fruit for the sake of this experiment. For example, to
avoid fungus formed on the fruit before the experiment,
banana needs to cut right at the stalk away from the
Nurasmat et al: VOLTAMMETRIC TECHNIQUE FOR DETERMINATION OF ARSENIC RESIDUES IN
CALCIUM CARBIDE RIPENED CLIMACTERIC FRUITS
277
upper finger, so the pulp was not exposed to the
surrounding.
After visual observations of the fruit samples were
recorded, the fruit wash water was subjected to perform
acid digestion. The digested wash water sample was
used for subsequent analysis of As determination using
DPASV method.
Figure 1. Voltammograms of electrochemical behavior for gold electrode by cyclic voltammetry in 0.5 M H2SO4;
(a) clean surface, (b) presence of multilayer of oxides at the surface and (c) the passivating layer covered
the electrode surface
Figure 2. Cyclic voltammogram of 20 ppb As(V) in 2 M HCl at a sweep rate of 0.018 V/s
(a) (b) (c)

Malaysian Journal of Analytical Sciences, Vol 25 No 2 (2021): 268 - 285
278
Figure 3. DPASV voltammogram and linear curve of Ip against concentration of As(V) standard additions: 0.4 mL
of As(V) 50 ppb in 2 M HCl at 1: first addition, 2: second addition, 3: third addition, 4: fourth addition and
5: fifth addition (n = 6)
Table 2. Previous studies on detection of As species in different kind of samples using gold based electrodes with
different voltametric techniques
Electrode/Substrate As Species Sample type Technique(s) LOD
(µg/L)
LOQ
(µg/L)
Reference
gold-disk electrode As(III) Natural waters
and
biomaterials
DPASV,
Linear sweep
anodic
stripping
voltammetry
(LS ASV)
0.15 0.5 [32]
gold microelectrode As(III)
As(V)
Sea water Square wave
anodic
stripping
voltammetry
(SW ASV)
0.3 1.0 [30]
gold nanowires As(III)
As(V)
River water ASV 0.08 0.24 [33]
GC, modified gold-
Pt nanoparticles
As(III) Natural waters LS ASV 0.20 0.93 [34]
GC, modified with
gold film
As(III)
As(V)
Drinking
water and
Natural water
ASV 0.55 1.7 [35]
-2.00E-07
0.00E+00
2.00E-07
4.00E-07
6.00E-07
8.00E-07
1.00E-06
1.20E-06
-0.08 -0.03 0.02 0.07 0.12 0.17 0.22 0.27
pea
k h
eig
ht,
Ip
(A
)
potential, E (V)
1
2
3
4
5 y = 0.2225x + 0.0524
R² = 0.9983
0.000
0.500
1.000
1.500
-1 1 3 5pea
k h
eig
ht,
Ip
(µ
A)
concentration of As(V) (ppb)
Nurasmat et al: VOLTAMMETRIC TECHNIQUE FOR DETERMINATION OF ARSENIC RESIDUES IN
CALCIUM CARBIDE RIPENED CLIMACTERIC FRUITS
279
Table 2 (cont’d). Previous studies on detection of As species in different kind of samples using gold based
electrodes with different voltametric techniques
Electrode/Substrate As Species Sample type Technique(s) LOD
(µg/L)
LOQ
(µg/L)
Reference
gold microelectrode As(III)
As(V)
Drinking
water and
groundwater
SW ASV 0.39 13.0 [36]
gold electrode As(III) Environmental
waters
ASV 0.7 2.54 [37]
Table 3. Physical changes of climacteric fruits before and after treated with CaC2
Sample Before
Treatment
After Five
Days of
Treatment
Treatment
No.
Sample Before
Treatment
After Three
Days of
Treatment
M1
T1:
Without
CaC2
B1
M2
T2:
Dipping in
2% CaC2
solution
B2
M3
T3:
5g of CaC2
sachet
B3
M4
T4:
10g of CaC2
sachet
B4
Voltammetry determination of washed water fruit
samples
The data related to the residual arsenic presence on
mango surface by applying different treatments of
ripening fruits using CaC2 are presented in Table 4. After
five days of treatment with CaC2, the ripened mango
fruits were analyzed to detect the presence of As
residues. The residual effect on the fruit surface was
determined by analyzing the digested wash water of the
fruits. 10 mL of wash water sample was added with 10
mL of HCl (supporting electrolyte) and taken for
interpretation to represent the digested sample. Total As
on fruit surface was calculated by multiplying the
dilution factor of five with the represented sample
concentration. Amount of As by weight in 500 mL of
wash water was also calculated in Table 4.
From the data above, the average value of the total
concentration of As residues in mangoes ripened by
different treatments of CaC2 varied from 6.5 to 10.32
ppb. The peak of As in voltammogram for fruit matured
without using CaC2 (T1) was not detected, it might
Malaysian Journal of Analytical Sciences, Vol 25 No 2 (2021): 268 - 285
280
indicate that there was no As presence or perhaps the
arsenic content was too small to be detected. Among the
treatments, mangoes ripened by dipping in 2% CaC2
solution (T2) recorded the maximum average value of
total As residues in fruit surface which was 10.32 ppb
followed by the fruits ripened by fruits ripened in 10 g
of CaC2 solution (T4) that gave a concentration of 8.89
ppb.
The lowest total average value of fruit treated with CaC2
was observed in fruit ripened by using the lowest
concentration of CaC2, which was 5 g CaC2 sachet (T3)
that found to be 6.5 ppb. The data showed that higher As
residues found in mangoes that dipped into CaC2
solution as compared to sachet. It was believed that As
residues were transferred to the fruit surface, which had
the most contact with the CaC2 solution.
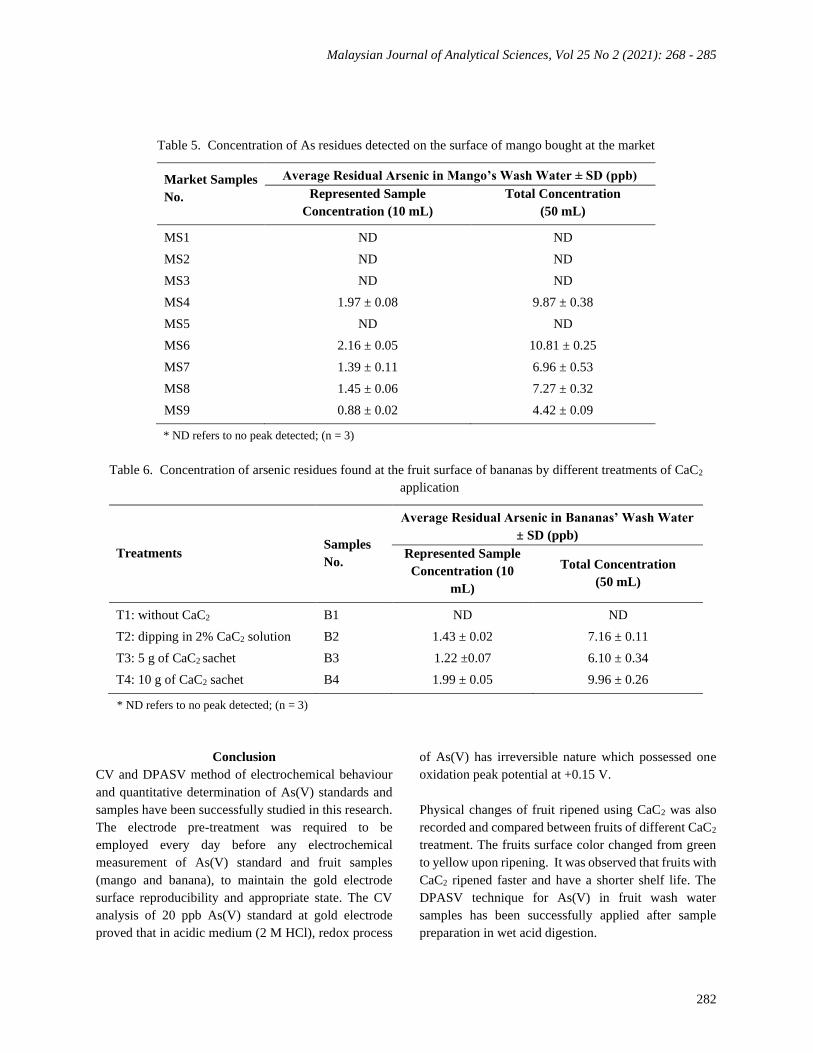
For all market samples that were analyzed as in Table 5,
the range concentration of As residues in fruit surface
was between 4.42 to 10.81 ppb. Sample MS1, MS2,
MS3 and MS5 did not show visual peak detected using
DPASV. However, having the assumption of no As
presence in the mango sample could not be deduced as
the sample peak might be lowered than the LOD of As
determination (0.7 ppb). Thus, this study considered the
presumption of the minute amount of As that might be
presented but could not be detected using DPASV in the
mango sample. Further, the level of As residues found
in the market sample was compared to other methods of
CaC2 ripening. Presence of high level of As residues in
the market sample than the CaC2 treated fruit indicated
that traders use a much higher level of CaC2 for the
maturation of the mangoes.
The highest concentration of As residues found in
mango fruits collected from the market was MS6 with a
value of 10.81 ppb indicated that mangoes are ripened
by traders using a very high concentration of CaC2, for
example, more than 10 g CaC2 sachet or the traders
might dip it into more than 2% of CaC2 solution (10 g/
0.5 L). Market sample for MS4, MS7 and MS8 showed
the total concentration As residue presence at the fruit
surface with 9.87, 6.96 and 7.27 ppb, respectively. From
this data, it could be estimated that fruit traders utilized
some amount of CaC2 as their fruit ripening agent for
instances more than 5 to 10 g of CaC2 sachet for sample
MS4, MS7 and MS8. While the lowest concentration of
As found in the local market was MS9 with a
concentration of 4.42 ppb.
Among the mango samples bought at the market, it
showed that most of the imported mangoes had detected
the presence of As except for MS5. This observation
implied that imported mangoes had utilized the
application of CaC2 in their fruit ripening process. A
harsh condition during road transportation and long hour
of the journey might cause deterioration to the fruit. In
contrast, green ripened mangoes using CaC2 during the
transport and reached the market was fully matured and
ready to be sold [3]. On the other hand, As in local
mangoes (MS1, MS2 and MS3) was not detected. The
application of CaC2 on local mangoes was seemed
unpopular, as the local fruit sellers preferred to let their
fruit ripened naturally or they used other fruit ripening
method.
The same treatment of CaC2 application on mango was
done for banana samples. The ripened bananas were
analyzed for the presence of As(V) residues after three
days of treatment with CaC2 using the DPASV. The
results of the residual arsenic from different treatments
of ripening fruits using CaC2 present on banana fruit are
presented in Table 6.
Among the different ripening treatments using CaC2, the
most As residues amount recorded on the banana surface
in 500 mL of wash water was sample B4 (9.96 ppb of
As concentration) which undergone T1, followed by T2
for sample B3 which As concentration obtained was
7.16 ppb and sample B4 (6.10 ppb of As) for T3. Similar
treatment with mango (T1), no peak of As(V) presence
for sample B1 was detected as well. Hence, the
treatment on control fruit without CaC2 which absence
of arsenic residues in comparison with fruits ripened
with CaC2 suggested that As(V) detected might exist as
impurities in commercial CaC2.
The results for the highest As residues found on the
banana surface was contradictory with the mango
sample as 10 g of CaC2 sachet measured as the highest
amount of As found at the fruit surface than dipping in
Nurasmat et al: VOLTAMMETRIC TECHNIQUE FOR DETERMINATION OF ARSENIC RESIDUES IN
CALCIUM CARBIDE RIPENED CLIMACTERIC FRUITS
281
CaC2 solution. Chandel et al. [11] believed that the As
present in CaC2 solution settles down at the bottom
because of the properties of As which has a molecular
weight (74.92 g/mol) heavier than water (18 g/mol) [11].
Besides, the size of container used to dip the fruit might
correspond to this result, as the larger surface area of the
box which spread the As at the bottom of the container
and caused the lesser surface area of the fruit in contact
with the As. Hence, the fruit dipped in CaC2 solution has
less transfer of As on to the surface of the banana.
Furthermore, as mentioned in the literature, arsine gas
released when the CaC2 reacts with water and combined
with oxygen to form inorganic arsenic [11]. With the
molecular weight of arsine gas (77.95 g/mol) higher than
average dry air (28.97 g/mol), the As released from the
sachet settles at the bottom layer of air in the container
and kept covered to the fullest of fruit surface area for
five days treatment, unlike when dipped in the CaC2
solution, where the probability of contact reduces when
the banana was only treated for one hour before being
removed and kept in the container. Plus, during the
mixture with water, most of the arsine gas had
evaporated thus lesser As residues in fruits ripened by
using CaC2 solution.
For all banana samples bought from the market, there
was no peak could be detected using DPASV. The
inference of these results probably due to the
concentration of As residues were smaller than the LOD
concentration, or there might be no CaC2 used by the
trader to ripen the banana. Perhaps, the traders used
another method of ripening such as smoke in the
ethylene gas chamber, methyl jasmonate or ethephon,
which proven by another study not to contain arsenic
residues [4].
It is worth noting that, voltammetry analysis on different
fruit parts such as peel and pulp of the fruit were not
successfully being measured as there was broad peak
interfered which masked the arsenic peak so it cannot be
detected. This phenomenon happened due to
voltammetry determination is sensitive towards the
organic matter. The matrix effect from the organic
matter has interfered the deposition of the analyte of
interest at the gold electrode.
Table 4. Concentration of As residues found on the surface of mangoes by different treatments of CaC2 application
Treatments Samples
No.
Average As Residues in Mango’s Wash Water
± SD (ppb)
Represented Sample
Concentration, X
(10 mL)
Total Concentration,
5X
(50 mL)
T1: without CaC2 M1 ND ND
T2: dipping in 2% CaC2 solution M2 2.06 ± 0.12 10.32 ± 0.62
T3: 5 g of CaC2 sachet M3 1.30 ± 0.08 6.50 ± 0.25
T4: 10 g of CaC2 sachet M4 1.78 ± 0.05 8.89 ± 0.38
* ND refers to no peak detected; (n = 3)
Malaysian Journal of Analytical Sciences, Vol 25 No 2 (2021): 268 - 285
282
Table 5. Concentration of As residues detected on the surface of mango bought at the market
Market Samples
No.
Average Residual Arsenic in Mango’s Wash Water ± SD (ppb)
Represented Sample
Concentration (10 mL)
Total Concentration
(50 mL)
MS1 ND ND
MS2 ND ND
MS3 ND ND
MS4 1.97 ± 0.08 9.87 ± 0.38
MS5 ND ND
MS6 2.16 ± 0.05 10.81 ± 0.25
MS7 1.39 ± 0.11 6.96 ± 0.53
MS8 1.45 ± 0.06 7.27 ± 0.32
MS9 0.88 ± 0.02 4.42 ± 0.09
* ND refers to no peak detected; (n = 3)
Table 6. Concentration of arsenic residues found at the fruit surface of bananas by different treatments of CaC2
application
Treatments Samples
No.
Average Residual Arsenic in Bananas’ Wash Water
± SD (ppb)
Represented Sample
Concentration (10
mL)
Total Concentration
(50 mL)
T1: without CaC2 B1 ND ND
T2: dipping in 2% CaC2 solution B2 1.43 ± 0.02 7.16 ± 0.11
T3: 5 g of CaC2 sachet B3 1.22 ±0.07 6.10 ± 0.34
T4: 10 g of CaC2 sachet B4 1.99 ± 0.05 9.96 ± 0.26
* ND refers to no peak detected; (n = 3)
Conclusion
CV and DPASV method of electrochemical behaviour
and quantitative determination of As(V) standards and
samples have been successfully studied in this research.
The electrode pre-treatment was required to be
employed every day before any electrochemical
measurement of As(V) standard and fruit samples
(mango and banana), to maintain the gold electrode
surface reproducibility and appropriate state. The CV
analysis of 20 ppb As(V) standard at gold electrode
proved that in acidic medium (2 M HCl), redox process
of As(V) has irreversible nature which possessed one
oxidation peak potential at +0.15 V.
Physical changes of fruit ripened using CaC2 was also
recorded and compared between fruits of different CaC2
treatment. The fruits surface color changed from green
to yellow upon ripening. It was observed that fruits with
CaC2 ripened faster and have a shorter shelf life. The
DPASV technique for As(V) in fruit wash water
samples has been successfully applied after sample
preparation in wet acid digestion.
Nurasmat et al: VOLTAMMETRIC TECHNIQUE FOR DETERMINATION OF ARSENIC RESIDUES IN
CALCIUM CARBIDE RIPENED CLIMACTERIC FRUITS
283
Based on the observation of determination of As(V) on
different treatments of CaC2 using DPASV, the presence
of As(V) in the samples could be used as an indicator for
application of CaC2 in fruit ripening. The concentration
of As in fruit for different treatments of CaC2 could be
used to estimate the amount of CaC2 applied on the
sample bought from the market. The concentration of
As(V) found in fruit purchased from the market (range
between 4.42 to 10.81 ppb) below the maximum limit of
As level in Food Act 1983 and FDA/WHO which is 1
ppm.
Acknowledgement
The authors greatly appreciate the instrumental and
financial supports received from School of Health
Sciences, Universiti Sains Malaysia (USM).
References
1. Islam, Md. N., Imtiaz, M. Y., Alam, S. S.,
Nowshad, F., Shadman, S. A. and Khan, M. S.
(2018). Artificial ripening on banana (Musa Spp.)
samples: Analyzing ripening agents and change in
nutritional parameters Yildizlez, F., (Ed.). Cogent
Food & Agriculture, 4: 1–16.
2. Bouzayen, M., Latché, A., Nath, P. and Pech, J.C.
(2010). Mechanism of fruit ripening. In: Pua, E.C.
And Davey, M.R., (Eds.) Plant developmental
biology - biotechnological perspectives. Springer
Berlin Heidelberg. Berlin, Heidelberg: pp. 319-339.
3. Prasanna, V., Prabha, T. N. and Tharanathan, R. N.
(2007). Fruit ripening phenomena–an overview.
Critical Reviews in Food Science and Nutrition, 47:
1-19.
4. Dhembare, A.J. (2013). Bitter truth about fruit with
reference to artificial ripener. Archives of Applied
Science Research, 5: 45-54.
5. Siddiqui, W. and Dhua, R. S. (2010). Eating
artificially ripened fruits is harmful. Current
Science, 99: 1664-1668.
6. Mondal, P., Balo Majumder, C. and Mohanty, B.
(2007). Removal of trivalent arsenic (As(III)) from
contaminated water by calcium chloride (CaCl2)-
impregnated rice husk carbon. Industrial &
Engineering Chemistry Research, 46: 2550-2557.
7. Kjuus, H., Andersen, A. and Langard, S. (1986).
Incidence of cancer among workers producing
calcium carbide. Occupational and Environmental
Medicine, 43: 237-242.
8. Rohani, M., (1999). Proses pemasakan dan
penyahhijauan. In: pengendalian lepas tuai buah-
buahan dan sayur-sayuran tropika. Institut
Penyelidikan dan Kemajuan Pertanian Malaysia
(Mardi): pp. 70-76.
9. Consumers Association of Penang (2011). Ban the
Use of Carbide Gas to Ripen Fruits. Access from
http://www.consumer.org.my/index.php/food/safet
y/502-ban-the-use-of-carbide-gas-to-ripen-fruits.
10. Ur-Rahman, A., Chowdhury, F. R. and Alam, M. B.
(2008). Artificial ripening: What we are eating.
Journal of Medicine, 9(1): 42-44.
11. Chandel, R., Sharma, P. C. and Gupta, A. (2018).
Method for detection and removal of arsenic
residues in calcium carbide ripened mangoes.
Journal of Food Processing and Preservation, 42:
1-6.
12. Benhadria, N., Attar, T. and Messaoudi, B. (2020).
Understanding the link between the detection limit
and the energy stability of two quercetin–antimony
complexes by means of conceptual DFT. South
African Journal of Chemical, 73: 120-124.
13. Behadria, N., Messaoudi, B. and Attar, T. (2020).
The study of the correlation between the detection
limit and the energy stability of two antimony
complexes by means of conceptual DFT. Malaysian
Journal of Chemistry, 22: 111-120.
14. Attar, T., Messaoudi, B. and Benhadria, N. (2020).
DFT theoretical study of some thiosemicarbazide
derivatives with copper. Chemistry & Chemical
Technology, 14: 20-25.
15. Metrohm, (2019). Determination of arsenic by
stripping voltammetry at the rotating gold
electrode. https://www.metrohm.com/sv-
se/applications/ab-226 [Accessed online 16 April
2019].
16. Miller, J. N. and Miller, J. C. (2000). Statistics and
chemometrics for analytical chemistry. 4th Edition,
Pearson Education.
Malaysian Journal of Analytical Sciences, Vol 25 No 2 (2021): 268 - 285
284
17. Garlaschelli, F., Alberti, G., Fiol, N. and
Villaescusa, I. (2017) Application of anodic
stripping voltammetry to assess sorption
performance of an industrial waste entrapped in
alginate beads to remove As(V). Arabian Journal of
Chemistry, 10: 1014-1021.
18. Association of Official Analytical Chemists (1990).
AOAC: Official Methods of Analysis (Volume 1).
In: Official Methods of Analysis of The Association
Of Official Analytical Chemists. Association of
Official Analytical Chemists, Inc, Virginia, USA:
pp. 1-771.
19. Izumi, T., Yokohama, Y. and Watanabe, I. (1991).
Activation of a gold electrode by electrochemical
oxidation-reduction pretreatment in hydrochloric
acid. Journal of Electroanalytical Chemistry and
Interfacial Electrochemistry, 303: 151-160.
20. Fischer, L. M., Tenje, M., Heiskanen, A., Masuda,
N., Castillo, J., Bentien, J., Emneus, J., Jakobsen M.
H. and Boisen, A. (2009). Gold cleaning methods
for electrochemical detection applications.
Microelectronic Engineering, 86: 1282-1285.
21. Giacomino, A., Abollino, A., Lazzara M.,
Malandrino, M. and Mentasti, E. (2011).
Determination of As(III) by anodic stripping
voltammetry using a lateral gold electrode:
Experimental conditions, electron transfer and
monitoring of electrode surface. Talanta, 83: 1428-
1435.
22. Susteric, M. G., Almeida, N. V., Von
Mengershausen, A. E. and Esquenoni, S. M. (2012).
Hydrogen oxidation on gold electrode in sulphuric
acid solution. International Journal of Hydrogen
Energy, 37: 14747-14752.
23. Zhang, W., Bas, A.D., Ghali, E. and Choi, Y.,
(2015). Passive behavior of gold in sulfuric acid
medium. Transactions of Nonferrous Metals
Society of China, 25: 2037-2046.
24. Burke, L. D., Moran, J. M. and Nugent, P. F. (2003).
Cyclic voltammetry responses of metastable gold
electrodes in aqueous media. Journal of Solid State
Electrochemistry, 7: 529-538.
25. Elgrishi, N., Rountree, K. J., McCharty, B. D.,
Rountree, Eisenhart, T. S. and Dempsey, J. R.
(2018). A practical beginner’s guide to cyclic
voltammetry. Journal of Chemical Education, 95:
197-206.
26. Yilmaz, S., Baba, B., Baba, A., Yagmur, S. and
Citak, M. (2009). Direct quantitative determination
of total arsenic in natural hotwaters by anodic
stripping voltammetry at the rotating lateral gold
electrode. Current Analytical Chemistry, 5: 29-34.
27. Cavicchioli, A., La-Scalea, M. A. and Gutz, I. G. R.
(2004). Analysis and speciation of traces of arsenic
in environmental, food and industrial samples by
voltammetry: A review. Electroanalysis, 16: 697-
711.
28. United State Environmental Protection Agency
(1996). Arsenic in aqueous samples and extracts by
anodic stripping voltammetry: pp. 1-9.
29. Wei, Z. and Somasundaran, P. (2004). Cyclic
voltammetric study of arsenic reduction and
oxidation in hydrochloric acid using a Pt RDE.
Journal of Applied Electrochemistry, 34: 241-244.
30. Salaün, P., Planer-Friedrich, B. and Van Den Berg,
C. M. G. (2007). Inorganic arsenic speciation in
water and seawater by anodic stripping
voltammetry with a gold microelectrode. Analytica
Chimica Acta, 585: 312-322.
31. Taşdemir, İ. H. (2014). Electrochemistry and
determination of cefdinir by voltammetric and
computational approaches. Journal of Food and
Drug Analysis, 22: 527-536.
32. Kopanica, M. and Novotný, L. (1998).
Determination of traces of arsenic(III) by anodic
stripping voltammetry in solutions, natural waters
and biological material. Analytica Chimica Acta,
368(3): 211-218.
33. Mardegan, A., Scopece, P., Ugo, P. and Moretto, L.
M. (2015). Ensembles of gold nanowires for the
anodic stripping voltammetric determination of
inorganic arsenic. Journal of Nanoscience and
Nanotechnology, 15(5): 3417–3422.
34. Bu, L., Liu, J., Xie, Q. and Yao, S. (2015). Anodic
stripping voltammetric analysis of trace arsenic(III)
enhanced by mild hydrogen-evolution at a
bimetallic Au-Pt nanoparticle modified glassy
carbon electrode. Electrochemistry
Communications, 59: 28-31.
Nurasmat et al: VOLTAMMETRIC TECHNIQUE FOR DETERMINATION OF ARSENIC RESIDUES IN
CALCIUM CARBIDE RIPENED CLIMACTERIC FRUITS
285
35. Jedryczko, D., Pohl, P. and Welna, M. (2016).
Inorganic arsenic speciation in natural mineral
drinking waters by flow-through anodic stripping
chronopotentiometry. Talanta, 150: 265-271.
36. Zhou, C., Yang, M., Li, S. S., Jiang, T. J., Liu, J. H.,
Huang, X. J. and Chen, X. (2017).
Electrochemically etched gold wire microelectrode
for the determination of inorganic arsenic.
Electrochimica Acta, 231: 238-246.
37. Tupiti, W., Chandra, S. and Prasad, S. (2018).
Sensitive inorganic arsenic speciation on a
voltammetric platform in environmental water
samples. Microchemical Journal, 139: 301-305.
38. Caseiro, A. Bauer, H., Schmidl, C., Pio, C. A. and
Puxbaum, H. (2009). Wood burning impact on
PM10 in three Austrian regions. Atmospheric
Environment, 43: 2186-2195.
39. Unsworth, J. (2010). Guidance on residue analytical
methods. Access from
http://agrochemicals.iupac.org/.
40. Noor Shaeda, I., Irniza, R., Sarva, M. P. and Emilia,
Z.A. (2018). Calcium carbide (CaC2) exposure
from fruit ripening process and health effects
among fruit farmers: A research review.
International Journal of Public Health and Clinical
Sciences, 5: 91-101.
41. Asif, M. (2012). Physico-chemical properties and
toxic effect of fruit-ripening agent calcium carbide.
Annals of Tropical Medicine and Public Health, 5:
150-156.