Studies of Organochlorine Pesticide Residues in Some ...
107
STUDIES OF ORGANOCHLORINE PESTICIDE RESIDUES IN SOME FRESHWATER AND ESTUARINE FISH IN KENYA JOSEPH CHEGE MUGACI IIA, B. V. M Department of Public Health, Pharmacology and Toxicology, Faculty of Veterinary Medicine, College of Agriculture and Veterinary Sciences, University of Nairobi. 1990 UNIVERSITY op NAIROBI1 JUilRAliy
-
Upload
khangminh22 -
Category
Documents
-
view
2 -
download
0
Transcript of Studies of Organochlorine Pesticide Residues in Some ...

STUDIES OF ORGANOCHLORINE PESTICIDE RESIDUES IN SOME FRESHWATER AND ESTUARINE
FISH IN KENYA
JOSEPH CHEGE MUGACI IIA, B. V. M
Department of Public Health, Pharmacology and
Toxicology, Faculty of Veterinary Medicine, College of
Agriculture and Veterinary Sciences, University of
Nairobi.
1990
UNIVERSITY op NAIROBI1 JUilRAliy

-11 -
DECLARATION
This thesis is my original work and has not been presented
for a degree in any other University.
J. C. Mugachia
This thesis has been submitted for examination with our
approval as University supervisors.
......... .*?.£ .......................................
DR. T. E. MAITHO, B. V. M., M. Sc.. Ph. D.
DR. L. W. KANJA, BSc., M. Sc.. Ph. D.

- Ill -
to my wife mwikali
and sons
mugachia and malonza

- iv -
TABLE O F CONTENTS
I’ago
LIST OF TABLES viii
LIST OF FIGURES ix
LIST OF APPENDICES x
ACKNOWLEDGEMENTS xi
ABSTRACT xii
CHAPTER ONE- INTRODUCTION 1
CHAPTER TWO- LITERATURE REVIEW 5
2.1 Introduction 5
2.2 Organochlorine pesticides 7
2.2.1 DDT group 7
2.2.2 Cyclodiene group g
2.2.3 Hexachlorocyclohexane (HCH) group 9
2.3 Absorption of organochlorine pesticides by fish 10
2.4 Metabolism and excretion of organochlorine
pesticides by fish 13
2.4.1 Metabolism 13
2.4.2 Excretion 14
2.5 Toxic effects 15
2.5.1 Acute toxicity 1 15
2.5.2 Chronic toxicity 16
2.6 Effects of organochlorine pesticides in other
aquatic organisms 17
2.7 Review of organochlorine pesticide residues
studies in fish reported from different regions of the world 19

- V -
PAGE
2.7.1 United States of America 19
2.7.2 Canada 2i
2.7.3 Europe 21
2.7.4 Other regions 23
2.8 Review of organochlorine pesticide residues
studies in Kenya 2.3
2.9 Review of published methods for analysis of
organochlorine pesticide residues in fish 25
2.10 Polychlorinated biphenyls and hexachlorobenzene 27
CHAPTER THREE- MATERIALS AND METHODS 28
3.1 Sampling 28
3.1.1 Area of study 28
3.1.2 Sampling procedure 29
3.1.3 Species of fish collected 31
3.2 Materials 32
3.2.1 Glassware 32
3.2.2 Equipment 33
3.2.3 Chemicals • 33
3.3 Cleaning of glassware 35
3.4 Solvent preparation 35
3.4.1 Distillation 35
3.4.2 Purity test 35

PAGE
3.4.3 Washing of sulphuric acid with hexane 36
3.5 Preparation of pesticide standards 36
3.6 Gas liquid chromatograph (GLC) 38
3.6.1 Operating conditions 38
3.6.2 Resolution and linearity of the ECD 38
3.6.3 Detection limits 39
3.7 Pesticide residues 39
3.7.1 Identification 39
3.7.2 Quantitation 39
3.7.3 Confirmation 40
3.8 Analytical quality assuarance (AQA) 41
3.8.1 Preparation and handling of AQA samples 41
3.8.2 Analysis 41
3.8.3 Extraction 42
3.8.4 Clean-up 43
3.8.5 Injection of sample extracts intb the GLC 44
3.9 Results 44
3.9.1 Pesticide recoveries from spiked samples 44
3.9.2 Resolution 44
3.9.3 Linearity 44
CHAPTER FOUR- ANALYSIS OF FISH SAMPLES 51
4.1 Materials and methods 31
4.1.1 Laboratory analysis 31
4.1.2 Statistical analysis 31
- vi -i

4.1.3 Maximum residue limits and acceptable daily intake 52
4.2 Results 52
4.2.1 Summary of results 52
4.2.2 Pesticide residue levels in estuarine fish
from Malindi 53
4.2.3 Pesticide residue levels in freshwater fish from
Masinga Dam 61
4.2.4 Pesticide residue levels in freshwater fish from Carson,
Tarasaa and Lake Naivasha 62
4.2.5 Polychlorinated biphenyls (PCBs) and
hexachlorobenzene (HCB) 63
4.3 Discussion 65
4.3.1 Locational differences 65
4.3.2 Interspecies variation 66
4.3.3 Toxicological significance of the results 67
4.3.4 Comparison of results with other studies in Kenya 68
4.3.5 Comparison of results with other studies from various parts
of the world 1 69
CHAPTER FIVE- CONCLUSIONS . 72
REFERENCES ' 74
APPENDICES 85

- viii -
Page
Table 2.1 Some published methods for analysis of
organochlorine pesticide residues in fish 27
Table 3.1 Pesticide levels attained after spiking 42
Table 3.2 Pesticide recoveries from spiked samples 45
Table 4.1 Pesticide residue levels in four species of fish
obtained from the five areas studied 54
Table 4.2 Pesticide residue levels of DDT compounds in
sharks from Malindi 57
Table 4.3 Pesticide residue levels of DDT compounds in catfish
and breams from Malindi 5?
Table 4.4 Pesticide residue levels of DDT compounds in Malindi
herrings, soles and monodactylus species from Malindi 5'
Table 4.5 Pesticide residue levels of a- HCH, P- I1CII and
heptachlor in fish from Malindi 6
Table 4.6 Pesticide residue levels in fish from Masinga Dam f
Table 4.7 MRL and ADI for DDT, a- HCH, p- HCH, lindane
and heptachlor (
LIST OF TABLES
- ix -
•
Page
Figure 3.1 Map of Kenya showing the locations of
the areas studied 30
Figure 3.2 Chromatograms of CPM standard and a positive
fillet sample 47
Figure 3.3 Linearity of the BCD for lindane, « - 1ICI1, (5- IICI I,
aldrin and dieldrin 48
Figure 3.4 Linearity of the ECD for heptachlor epoxide,
heptachlor, endrin and o,p' DDT 49
Figure 3.5 Linearity of the ECD for o,p' DDD, p,p' DDD,
p,p' DDE and p,p' DDT 50
LIST OF FIGURFS

Page
Appendix 1 Form used to enter details during sample
collection 86
Appendix 2 Pesticide residue levels in livers of male sharks
from Malindi 87
Appendix 3 Pesticide residue levels in livers of female sharks
from Malindi 88
Appendix 4 Pesticide residue levels in livers of female catfish
from Malindi 89
Appendix 5 Pesticide residue levels in catfish eggs from
Malindi 90
Appendix 6 Pesticide residue levels in livers of male breams
from Malindi 91
Appendix 7 Pesticide residue levels in fillet of common carps
from Masinga Dam 92
Appendix 8 Pesticide residue levels in liver and fillet of catfish
from Masinga Dam 93
Appendix 9 Weight of fish, p,p' DDT and sum DDT levels in the
samples 94
Appendix 10 Fat percentage in fish samples positive for
pesticide residues 95
- X -
LIST OF APPENDICES

Acknowledgements
I am grateful to my supervisors Drs. T. E. Maitho and L. Kanja
for their assistance and positive criticism. I also thank Drs. E. S.
Mitema and J. K. Gikunju of Department of Public Health,
Pharmacology and Toxicology, University of Nairobi for their useful
suggestions. I cannot forget those colleagues whose suggestions were
helpful at the time of writing.
Many thanks go to the staff of the Fisheries Department at the
various sampling sites and particularly to Miss Kagao and Mr. Kioko
of the Malindi Fisheries Office who assisted in sample collection at
Malindi and lower Tana River.
Mr. F. K. Gitau is acknowledged for his technical assistance in
analysis of the samples throughout the period of the study.
Profound thanks to Mr. C. N. Matere of Department of Public
Health, Pharmacology and Toxicology, University of Nairobi, for his
assistance in statistical analysis of the data.
I sincerely thank my wife for her understanding, patience and
continued encouragement throughout the entire course of my
study.
I am extremely thankful to Prof. J. M. Gathuma, Chairman of
the Department of Public Health, Pharmacology and Toxicology for
allowing me to carry out the research in the department.
I feel greatly indebted to the Norwegian Agency for
International Development (NORAD) for the financial support and
research fund, without which this study would not have been
possible.
- xi -
XII
Abstract
Organochlorine pesticides persist in the environment and
accumulate in aquatic organisms. Although the chemicals have
been used in Kenya since the 1940's, information on the occurrence
of their residues in fish is still scanty. The main objective of the
present study was to identify and quantify organochlorine residues
in freshwater and estuarine fish from selected areas in Kenya and
evaluate the toxicological implications of the findings.
A total of 275 fish samples were collected from five locations
in Kenya between October, 1988 and October, 1989. The samples
were obtained from Tana River at Masinga Dam, Garsen and
Tarasaa, the estuary of Athi (Sabaki) River at Malindi and Lake
Naivasha in the Great Rift Valley. The fish were caught with gill
nets, line and hook or fishing baskets. The liver, eggs and fillet
(muscle) from each fish were analysed separately using a Packard
gas liquid chromatograph, fitted with a 63jsjj electron capture
detector. Nine organochlorine pesticide residues were detected in
22.5% of the samples in the following order of frequency: p,p’ DDE
(20.4%), p,p' DDT (12.7%), Lindane (4.7%), o,p' DDT (4%), p,p' DDD
(3.6%), P-HCH (2.5%), a-HCH (1.8%), heptachlor (0.7%) and o,p'
DDD (0.4%). Polychlorinated biphenyls (PCB's) and
hexachlorobenzene (HCB) were not detected in the fish.
The residues with the highest levels were p,p'DDE and
p,p'DDT with ranges of 0.027 to 1.241 and 0.011 to 2.674mg/kg on
wet weight basis respectively. Sum DDT levels ranged from 0.03 to
3.148mg/kg. The range for residue levels of lindane and o,p' DDT
were 0.004 to 0.295 and 0.031 to 0.133mg/kg respectively.

The results showed locational differences in the occurrence of
the pesticide residues in the fish but no significant difference
(p> 0.1) in the means of the residue levels. Out of the 67 samples
from Malindi and 40 samples from Masinga Dam, 72.7% and 39.5%
respectively had one or more of the 9 pesticide residues detected.
Only one out of the 65 samples from Garsen had p,p' DDE at a low
level of 0.033mg/kg. No residues were detected in the 65 samples
from Tarasaa and 40 samples from Lake Naivasha.
There was a difference in the distribution of organochlorine
pesticide residues in the fish body. Common carps obtained from
Masinga Dam had lindane, p,p' DDE and p,p' DDT in fillet while
fish from Malindi rarely had the pesticide residues in fillet. Lindane
was only detected in fish from Masinga Dam and was more
common than DDT and its metabolites in the fish. p,p' DDT was
more frequent than p,p' DDE and other DDT metabolites in the
fillet of common carps. This indicated a recent exposure of the fish
to p,p' DDT or a slow degradation rate of the compound in this
species. Common carps had significantly higher residue levels of
lindane (p= 0.008) than catfish in Masinga Dam.
There was a positive correlation (r= 0.74) of sum DDT to
weight in the seven species of fish with detectable levels, of the
residue. Sharks had significantly higher mean level of sum DDT
(p< 0.0001) than catfish, common carps and breams. No difference
was observed between males and females of various fish species
and betwen different organs in the levels of the various pesticide
residues detected in the fish. Nonetheless, the residues were most
common in the liver and eggs (ovaries).
The residue levels found in the present study are generally
below the maximum residue limits (MRL), for the respective
- XIII -

XIV
organochlorine pesticide residues, set by the National Food
Administration (NFA) of Sweden. This indicates that the pesticide
residues do not pose a health risk to the consumers of fish from the
areas studied.

- 1 -
CHAPTER ONE
IntroductionIn his pursuit for control and possibly eradication of pests, man has
experimented and used a wide range of compounds both natural and
synthetic in forestry, agriculture, veterinary and public health
programmes. Prior to the advent of organochlorine compounds,
pesticides were either inorganic compounds such as arsenicals and
fluorides or natural plant products such as rotenone and pyrethrum
extract (Matsumura, 1975).
Organochlorine pesticides were introduced in the market during the
Second World War to boost food production and control vector- borne
diseases. This led to extensive use and abuse of the pesticides, a practice
that continued up to the early 60's, oblivious of the potential hazards of
the pesticides to the environment. By then, organochlorine pesticide use
had been extended to control of forest pests owing to the apparently
low mammalian toxicity of the compounds.
Due to their persistence in nature and prolonged use organochlorine
pesticides have led to environmental disturbances like establishment of
resistant populations of arthropod pests and decline in populations of
non-target organisms. Minor pests have in some cases become major
pests due to elimination of their natural predators (McEwen and
Stephenson, 1979).
Research done in many parts of the world has led to knowledge
about the presence, amount and distribution of organochlorine
pesticides in the environment in general. The aquatic environment is
the ultimate sink for pesticides used in agriculture, forestry and both

- 2 -
human and animal disease vector control (Mason et al, 1986). Pesticides
reach the aquatic environment through rainfall run-off from
agricultural fields (Tangatz et al, 1976), atmospheric deposition, ground
water contamination, discharge of effluents into waterways, cattle clips
or cleaning of spraying equipment in rivers. The persistent nature of the
pesticides and their long range in the environment greatly contributes
to their concentration in water bodies.
Once in the aquatic system, the pesticides are absorbed by aquatic
organisms and concentrated in the trophic chain, thus endangering the
life of fish and other organisms. Fish are an integral link in the aquatic
food chain and have been reported to accumulate organochlorines up
to 800 times the concentration in water (Chau and Afghan, 1982).
Holden in 1962 found that fish exposed to low organochlorine pesticide
concentration in water over a long period of time accumulated the
pesticide in their body up to 300 times the concentration in the gills
(Muirhead-Thomson, 1971).
Mortality of fish has been reported following massive application of
chlorinated hydrocarbon pesticides (Someren, 1946; McEwen and
Stephenson, 1979; Murty, 1986). Chronic exposure of fish to sublethal
concentrations of organochlorine pesticides causes decline in fish
populations due to poor reproduction success and early fry mortality
(McEwen and Stephenson, 1979).
In Norway, heavy use of DDT on fruit orchards resulted in high
DDT levels in biota (Bjerk, 1973). Cod sampled in 1970 had 90 to
135mg/kg DDT in liver tissue on wet weight basis. The highest residue
concentration recorded was 576mg/kg (Bjerk, 1973). Consequent to the
banning of DDT in 1970, residue levels in cod showed a downward
trend during the period 1972-82 (Skaare et al, 1985).

- 3 -
Lower levels of organochlorine pesticides in fish have been reported
from Lake Tanganyika (Deelstra, 1976), Sudan (Zorgani, 1980), Canada
and countries surrounding the Baltic (Murty, 1986). Murly (1986) has
thoroughly reviewed reports of organochlorine pesticide residues in
fish from various regions of the world. The residue data on fish
reported reflects the intensity of pesticides use and the general
awareness of environmental pollution in the reporting countries.
Continued use of organochlorine pesticides in Kenya implies that the
aquatic systems continue being polluted by the compounds. Prior to
this study, the accumulation of DDT and other chlorinated pesticides in
Kenyan rivers was not yet known. Although some work has been done
in Kenya concerning organochlorine pesticide residues in aquatic
systems, this has mainly been focused on the Rift Valley lakes and Lake
Victoria (Koeman et al, 1972; Frank et al, 1977; Lincer et al, 1981; Mitema
and Gitau, 1990). There was therefore a need to evaluate the extent of
pollution of the Kenyan aquatic environment by persistent
organochlorine pesticides by determining the levels of the compounds
in fish tissues. Tana River was selected for this study because of its
present and future significance in fish production. The estuary of the
Athi (Sabaki) River and Lake Naivasha were also included in the study
to compare the findings with those of Tana River.
The main objectives of the study were:
•To establish a method for analysis of organochlorine pesticide
residues in fish in the laboratory.
• To identify and quantify organochlorine residues in fish from Tana
River so as to assess the extent of pollution of the river by residues of
the compounds and evaluate the toxicological implications of the
findings.

- 4 -
• To assess the natural distribution of the pesticide residues in fish
liver, muscle and ovaries.
• To generate reliable data on the levels of contamination of
organochlorine pesticide residues in Kenyan fish from Tana River.

- 5 -
CHAPTER TWO
Literature Review2.1 Introduction
The use of organochlorine compounds in pest control dates
back to 1939 when the insecticidal properties of DDT were discovered
by Muller, in his search for a control for clothes' moths (Matsumura,
1975; McEwen and Stephenson, 1979). DDT had been synthesised in
1874 by Zeidler (Stetter, 1977) but its insecticidal properties had
remained unknown. The broad-spectrum arthropodicidal activity of
DDT led to its widespread use against insect vectors of important
world diseases such as plague, yellow fever and most importantly
malaria (McEwen and Stephenson, 1979). During the 1950's heavy
use of DDT was extended from public health to forestry and
agriculture leading to outstanding increases in food production. This
massive use of DDT was favoured by the low cost of the chemical
and its spectacular insect control. However, the possible effects of the
compound on non-target populations was ignored due to its
apparently low toxicity to avian and mammalian species.
DDT synthesis was soon followed in the 1940's by development
of many other structurally related compounds in rapid succession
mainly to provide a solution to soil pests. DDT had only been used
for a few years when it was discovered that its marked stability and
lipophilic nature led to environmental persistence and
accumulation in tissues of non-target organisms. The chemical was
also found to be excreted in eggs and milk thereby jeopardizing the
consumers' health.
The discovery of these aspects of DDT led to investigation of

- 6 -
other organochlorine pesticides most of which were found to be
bioaccumulative. Tests of acute toxicity of organochlorine pesticides
in fish also proved that the compounds were highly lethal to the
species (Muirhead-Thomson R. C., 1971). In some cases, high fish
mortality was reported following aerial application of
organochlorine pesticides for mosquito control (Van Someren, 1946;
McEwen and Stephenson, 1979).
To date, the aftermath of these findings has been strict
restriction on the use of bioaccumulative organochlorine pesticides
in some cases while some countries have banned their use
altogether (McEwen and Stephenson, 1979; F.PA, 1985).
Kenya banned or restricted the use of environmentally
persistent organochlorine pesticides in 1986 (Pest Control Products
Board records, 1986; Kimani, 1990). The mixture of HCH isomers was
banned for all uses. Lindane (y - HCH) was restricted for use ns a
seed dressing only. However, the compound is still used as an
insecticide in the control of insect pests of cotton. 17 metric tons of
the pesticide were imported in 1989. Endrin and heptachlor were
banned while aldrin and dieldrin were restricted for use in termite
control in the building industry. 30 metric tons of aldrin and 10 of
dieldrin were imported in 1989.
DDT was banned for use in agriculture and its use restricted to
public health only in control of mosquitoes. Nonetheless, DDT may
still be introduced into the aquatic environment through its
impurities in dicofol (a close relative of DDT). Dicofol is accepted for
agricultural use in Kenya and is recommended as a miticide in
cotton farming. 20,000 litres of the compound were imported in
1989. The maximum recommended level of DDT impurities in
dicofol is 0.1%. Endosulfan (Thiodan®) is accepted for use in Kenya
- 7 -
and is highly recommended for control of cotton pests.
2.2 Organochlorine pesticides
Organochlorine pesticides are divided into three groups
depending on their chemical structure. The compounds have been
put into different uses especially in agriculture and public health
programmes.
2.2.1 DDT group:
p, p' DDT is the most important insecticide in this group.
Commercial DDT also contains o,p' DDT. The DDT group also
includes p,p' DDE and p,p' DDD, both of which are p,p' DDT
metabolites. p,p' DDE, which is as persistent as p, p' DDT but has no
insecticidal activity, is the major metabolite of p, p' DDT. In
contrast, p,p' DDD has insecticidal properties and is commercially
available as an insecticide. There are other compounds that are
chemically and structurally related to DDT such as dicofol.
Common name4: DDT
Chemical name: 1,1,1- trichloro- 2,2- di- ( p- chlorophenyl) ethane.
Uses*: Control of vectorborne diseases such as malaria, yellow
fever and trypanosomiasis.
Control of such ectoparasites as mites and lice
Control of agricultural and forestry pests such as the
spruce bud worm.
Common name: DDD ( TDE)
Chemical name: 1,1,- dichloro- 2,2- di- (p- chlorophenyl) ethane

- 8 -
Uses: Same as for DDT
Control of different forms of adrenal hyperproduction of
corticoids especially in dogs and man.
Common name: DDE
Chemical name: 1,1- dichloro- 2,2-di- (p- chlorophenyl) ethylene
Uses: None at present
2.2.2 Cyclodiene group
The main members of this group are aldrin, dieldrin,
heptachlor, and isodrin. These are highly insecticidal cyclic
hydrocarbons formed by the Diel's- Alder reaction (Chau and
Afghan, 1982). Some of the chemicals can be epoxidized both in vivo
and in vitro to give analogues that are also insecticidal. The
epoxides of aldrin, isodrin and heptachlor are dieldrin, endrin and
heptachlor epoxide respectively.
Common name: Aldrin
Chemical name: 1, 2, 3, 4 ,10,10 - hexachloro-1, 4, 4a, 5, 8, 8a-
hexahydro-l,4-endo, exo-5, 8 - dimethanonaphthalene.
Uses: Control of ectoparasites such as bedbags
Seed dressing
Mixed with fertilizer for the control of soil pests
Control of foliar, vegetable and fruit pests
Common name: Dieldrin
Chemical name: 1,2,3,4,10,10- hexachloro-6,7- epoxy- 1,4,4a,6,7,8,8a-
octahydro- 1,4- endo, exo,5,8- dimethanonaphthalene
Control of ectoparasites such as lice,and ticksUses:

- 9 -
Control of vector-borne diseases such as trypanosomiasis,
yellow fever and malaria
Control of soil pests
Common name: Endrin
Chemical name: 1,2,3,4,10,10- hexachloro- 6,7- epoxy- 1,4,4a,5,6,7,8,8a-
octahydro,l,4- endo, endo-5,8 dimethanonaphthalene
Uses: Control of crop pests
Common name: Heptachlor
Chemical name: 1,4,5,6,7,8,8- heptachlor- 3a,4,7,7a-tetrahydro-4,7-
methanoindene
Uses: Control of soil and cotton pests
Control of grasshoppers
Common name: Heptachlor epoxide
Chemical name: 1,4,5,6,7,8,8-heptachloro- 2,3- epoxy- 3a,4,7,7a-
tetrahydro- 4,7 - methanoindene
Uses: None at present
2.2.3 Hexachlorocyclohexane ( HCH ) group
HCH can exist as eight different isomers but the technical
product has only five of them (2 optical alpha isomers, beta, gamma
and delta isomers) with alpha, beta and gamma isomers being the
most common. A specific steric configuration is necessary for
activity since only the gamma isomer (lindane) is a powerful
insecticide.
Common name: Lindane

- 10-
Chemical name: gamma- 1,2,3,4,5,6- hexachlorocyclohexane
Uses: Control of ectoparasites such as fleas and mites
Control of soil and crop pests and wire worms
Control of grasshoppers
Common name: alpha- HCH ( BHC )
Chemical name: alpha- 1,2,3,4,5,6- hexachlorocyclohexane
Common name: Beta- HCH ( BHC )
Chemical name: beta- 1,2„3,4,5,6- hexachlorohexane
* Information on the names and uses of organochlorine pesticides
was obtained from Matsumura (1975); Soulsby (1978) and Chau and
Afghan (1982)
2.3 Absorption and accumulation of organochlorine
pesticides in fish
Fish absorb and accumulate xenobiotics particularly those with
poor water solubility and high lipophilicity, from water and food.
The uptake from water occurs because of the very intimate contact
with the medium that carries the chemicals in solution or
suspension and also because fish have to extract oxygen from the
medium by passing enormous volumes of water over the gills
(Murty, 1986).
The process of organochlorine pesticide absorption by fish
either through food or from water, is influenced by many factors
such as the chemistry of the molecule, physical condition of the
medium and the fish itself: its lipid content, size, stage of

-11 -
development and physiological activity (Murty, 1986). Absorption
and accumulation factors of organochlorine pesticide residues in
different fish species are proportional to the lipid content and age of
the fish (Katsura et al, 1979). Using whole body autoradiography,
Katsura et al (1979) showed that organochlorine pesticide residues
are accumulated in fatty tissues including the liver, peritoneal fat,
spinal cord and the brain.
Whether fish absorb organochlorine pesticides primarily
through food or directly from the water through the gills is not yet
clear. Some investigators have found that higher pesticide residue
levels in fish tissues are achieved by direct uptake through the gills
while others report that higher levels are obtained with intestinal
absorption following ingestion of the pesticides in food. Holden
(1962) reported that brown trout exposed to 14C-labeled DDT rapidly
removed the toxicant from water, absorption principally being
through the gills, and most of the DDT was taken up and stored in
body lipid. Fathead minows exposed to endrin in water absorbed and
accumulated more amount of residues than those exposed through
food with the highest concentration factor from water and food
being 13,000 and 0.8 respectively (Jarvinen and Toyo, 1978). The
uptake of toxicants through gills is substantial and rapid. Lockhart et
al (1977) demonstrated that methoxychlor was rapidly absorbed by
fish exposed to the chemical through water only.
Crawford and Guarino (1976) showed that DDT was absorbed
from the intestine of killifish, Fundulus heterochlictus, into muscle
and then redistributed to the liver, ovaries and testes and
accumulated in body lipids.

- 12 -
Uptake of DDT
Due to its high lipid solubility, DDT is taken up quickly from
food and -water, metabolized slowly and stored for an extended
period in fatty tissues. Studies with bluegills and goldfish showed
that these fish species took up DDT rapidly after a single exposure of
a few hours (Murty, 1986).Uptake of DDT by fish is enhanced by high
temperatures (Murphy and Murphy, 1971).
The distribution pattern of absorbed DDT is independent of the
dosage. The brain, liver and other fatty tissues have the highest
levels while muscle shows the lowest (Crawford and Guarino, 1976;
Katsura et al, 1979). In the tissues, DDT is stored as the parent
compound and the metabolites DDD and DDE. However, an
additional DDT metabolite, DDA, was reported by Crawford and
Guarino (1976) in killifish exposed to DDT in water.
Uptake of other organochlorine pesticides
Generally, other organochlorine pesticides are less rapidly
absorbed from water by fish than DDT. Dieldrin is absorbed faster
than HCH. Dieldrin is slowly absorbed from the intestines and fish
exposed to lower concentrations in water tend to absorb a higher
percentage of the chemical than those exposed to higher
concentrations (Murty, 1986).The uptake of endrin by channel catfish
was demonstrated to be low and the compound was completely
eliminated upon transfer to an endrin-free diet (Jackson, 1976).
Schimmel et al (1976) found that heptachlor-exposed spot reached
equilibrium levels within 72 hours, but eliminated the compound
slowly in uncontaminated water.

- 1 4 -
pcriods in the body due to their low polarity (Addison and Willis,
1978). Intestinal micro-organisms in fish are, however, known to
convert DDT to DDD rather than DDE (Wedemayer, 1968).
Aldrin in fish is epoxidized to dieldrin which is more toxic to
the species (Janice and James, 1976). Fish MFO system is highly
potent in this process of lethal synthesis. Endosulfan is poorly
metabolized by fish and is mainly converted to endosulfan sulphate
(Murty, 1986). Mirex and heptachlor are also poorly metabolized and
more than 80% of the parent compound still remained in goldfish
10 days post exposure (Iwie et al , 1974; Feroz and Khan, ll>79).
Endrin is metabolized by hydroxylation followed by conjugation in
the liver (Murty, 1986).
2.4.2 Excretion of residues by fish
The hepatobiliary path is the main route of excretion of
organochlorine pesticide residues in fish. However, excretion
through the gills and renal pathway also plays an important role as
shown by Moore et al (1977). Compounds with higher polarity are
eliminated faster than those with lower polarity. Katsura et al (1979)
showed that lindane was excreted more rapidly than a and (J-HCH.
Lindane is eliminated faster than dieldrin which in turn, is
eliminated more rapidly than DDT (Murty, 1986).
The reproductive route also serves as an excretion pathway for
organochlorine pesticide residues in fish. Crawford and Guarino
(1976) found that a large proportion of DDT absorbed by killifish was
deposited in the ovaries and testes. This was then incorporated in
the eggs in females and a significant amount shed during spawning.
Males were found to shed more of their DDT burden in milt
(semen) than did females in eggs.

-15-
2.5 Toxic effects in fish
Organochlorine pesticides exhibit both acute and chronic
toxicity tcf fish and are generally more toxic than organophosphorus
compounds. However, some of the latter are as toxic as some of the
highly toxic organochlorine compounds (Murty, 1986). Toxicity of
organochlorine pesticides to fish was noticed soon after the
introduction of DDT when high fish mortality was observed
following spraying programmes for control of agricultural pests or
for malaria control (Someren, 1946; McEwen and Stephenson, 1979).
Chronic toxicity of organochlorine pesticides is the main
concern of conservationists since the long-term effects of the
compounds may either pass unnoticed or be recognized when it is
already too late to save the situation.
2.5.1 Acute toxicity
Among the organochlorine pesticides, endrin and other
cyclodienes are highly toxic to fish. Standard 96-hour toxicity tests
with endrin yield LC50 of l[ig/l or less in bluegills, rainbow trout,
coho salmon, chinook salmon, fathead minnows, brook trout and
cut-throat trout (Grant, 1978). This is an extremely low LC50 and for
this reason, the maximum amount of endrin recommended in
water if aquatic organisms are to be protected is 2 parts per trillion
(ppt). Grant also reported that younger fish were more susceptible to
endrin toxicity than older ones and that higher temperature tended
to enhance endrin toxicity.
Another cyclodiene, endosulfan, is also highly toxic to fish. Its
toxicity to several species of freshwater fish species ranges from 0.2 to
8*1 Hg/1 and 0.3 to 2.9pg/l to saltwater fish (Ananda et al, 1981).
Heptachlor has a 96^hour LC50 range of 1 to 4|ig/l for several species

- 16 -
of estuarine fish (Schimmel et al, 1976).
DDT has a low acute toxicity to fish when compared to many
other orgahochlorine pesticides. o,p' DDT is about one third as toxic
to fish as p,p' DDT while methoxychlor is less toxic than DDT. The
96-hour LC50 for DDT to Gatnbusia is 0.32mg/l as opposed to lmg/1
for methoxychlor (Murty, 1986).The reported 96-hour LC50 of
lindane and technical hexachlorocyclohexane (HCH) to several
species of estuarine fish ranges from 30 to 104pg/l (Murty, 1986).
2.5.2 Chronic toxicity and sublethal exposure
Nowadays, mass mortality of fish due to pesticide exposure is
rare and results only from accidents or direct spraying into water
masses. Fish are nonetheless commonly subjected to long term
stress from exposure to sublethal pesticide concentrations. With
time, such exposure may prove to be even more hazardous than
lethal challenge because the small prolonged effects on the fish may
alter their behaviour, feeding habits or reproductive success, thereby
resulting in a slow but sure death of the population.
Exposure of a predatory fish, Therapon jarbua to 2gg/l of DDT
for 15 days resulted in darkening of the skin, formation of a brown
spot on the forehead, swelling of the eyes and erosion of the fin
margins (Murty, 1986). When chinook and coho salmon were fed
DDT, they developed severe hyperplasia of the nose which
progressed until one eye was lost (Buhler et al, 1969). DDT lowers the
learning ability of fish. Brook trout fed DDT orally lost a reaction
they had learnt; to avoid their preferred light or dark sides of the
aquarium (Anderson and Peterson, 1969).
Aberrant swimming, gathering in unusual parts of the water
column and unusual species association was observed in Canada

- 1 7 -
when pools containing trout and salmon were accidentally
contaminated with endrin (Murty, 1986). Chronic exposure of
endrin to" rainbow trout and goldfish is reported to cause
hypersensitivity and growth inhibition (Grant, 1978).
DDT and other organochlorine pesticides have been shown to
cause a decrease in reproduction and an increase in fry mortality.
Crawford and Guarino (1976) demonstrated that Fundulus eggs
exposed to 0.1mg/l of DDT in water lagged two stages behind the
controls in early embryo development. The DDT treated eggs
'caught' up with the controls in the later stages of development and
hatching was normal. In another experiment, only 40% of the eggs
of a winter flounder exposed to 1.21ng dieldrin and 4.6ng DDT were
fertilized while those exposed to 1.74ng dieldrin failed to be fertilized
(Murty, 1986). Larvae of the eggs that hatched showed vertebral
deformities, their extent being dose dependent. In 1955, 346,000 fry
hatched from eggs of Lake George trout failed to survive and the
tragedy was traced to high concentration of DDT in the eggs. All the
lots of eggs with a concentration higher than 2.95mg DDT per kg
died (Murty, 1986).
Exposure of goldfish to endrin via food at 143 to 430pg/kg
showed decreased gametogenesis and smaller size of testes in
experimental than in control fish (Murty, 1986).
2.6 Effects of organochlorine pesticides in other aquatic
organisms
Contamination of the aquatic environment with
organochlorine pesticides also threatens the life of other aquatic
organisms. Some of the organisms for instance algae, daphnids,

- 1 8 -
oysters and planktons are important fish foods and their survival
and productivity indirectly influence the survival of those fish
relying on fhem for food. It has been shown that most of the aquatic
flora and fauna have a high ability of absorbing and concentrating
organochlorine pesticides in their tissues (Murty, 1986).
Vance and Drummond (1969) demonstrated that algae
concentrate endrin in water many fold and are less susceptible to its
toxicity than other organisms above them in the food chain. Four
species of algae exposed to endrin in water at concentrations ranging
from 0.02 to lppm for 7 days accumulated the compound by factors
ranging from 140 to 222 fold. High resistance to organochlorine
pesticide toxicity by fish food organisms is detrimental to to the fish
because they may consume lethal doses of the compounds from the
fish food organisms. Buttler (1966) reported that fish fed on oysters
which had earlier accumulated high levels of DDT from ambient
water died within two days.
Oysters demonstrate a high ability to concentrate dieldrin and
endrin. Mason and Rowe (1976) reported concentration factors of
1670 and 2780 for a 168-hour exposure of the eastern oyster to endrin
at a concentration of 0.1pg/l and 50pg/l in water. A similar duration
of exposure for dieldrin at a concentration of 0.5 and 9|ig/l Showed
concentration factors of 2880 and 2070 respectively.
Blue crabs absorb and concentrate DDT in their body lipid. This
has been shown to cause toxicity in these organisms during winter
when they mobilize their fat depots for energy provision (Koenig et
al, 1976).
In conclusion, the available data indicate that pollution of the
hydrosphere with organochlorine pesticides could result in altered
community structure due to the differences in the response of

-19-
various organisms to the pollutants. Heckman (1981) described the
changes in the aquatic communities associated with the orchard
ditches near Humburg that occurred as a result of 25 years of intense
pesticide use. He reported that certain species ,especiallly predators,
had completely disappeared, hence stimulating the growth of other
species.
2.7 Review of organochlorine pesticide residue studies in fish from different regions of the world
Since the recognition of the hazardous effects of
organochlorine pesticides to the environment , their persistence,
accumulation in the food chain and detrimental effects on non
target organisms, most industrialized nations have thoroughly
investigated and accumulated massive data on the residue status in
their environment , especially the hydrosphere. Most of this work
has been done in North America and Europe.
2.7.1 United States of America (U. S. A.)
In the U. S. A., studies done on museum fish specimens
collected from Lake Michigan between 1929 and 1966 and preserved
in ethanol, indicated that DDT and its metabolites appeared in fish
samples for the first time in 1949 (Murty, 1986). This was only four
years after commencement of environmental application of DDT.
Dieldrin on the other hand appeared for the first time in 1955
(Neiddermyer and Hickey, 1976). Studies of organochlorine pesticide
residues in fish from various aquatic systems, done from the early
1960's to 1985, showed sum DDT levels ranging from undetectable to
92.2mg/kg on wet weight basis (Murty, 1986). Other organochlorine

- 2 0 -
pesticides including HCH isomers, heptachlor, heptachlor epoxide,
aldrin and dieldrin had far much lower concentrations than DDT.
In a fhree-year study conducted in Massachusetts from 1965 to
1967, sum DDT in individual fish varied from undetectable levels to
49.1mg/kg on dry weight basis (Murty, 1986). Total DDT of channel
catfish collected from 18 sites in the watersheds of Nebraska in 1964
was 2.2 to 92.2mg/kg and that of dieldrin 0.1 to 6.7mg/kg (Stocky,
1970). Endrin was detected in largemouth bass from the Lost River
system (California) at concentrations of 97 and 107pg/kg in 1967 and
1968 respectively (Godsil and Johnson, 1968). In 1967 and 1968, DDT
and its metabolites were detected in 584 out of 590 composite
samples of 62 fish species collected from all over the U. S. A. The
DDT levels ranged from undetectable to 45gg/kg on wet weight
basis. Dieldrin was detected up to 2mg/kg in 75% of the samples
(Murty, 1986).
Lindane, heptachlor, heptachlor epoxide, dieldrin, DDT, DDE,
DDD and toxaphene were recorded in 1968 to 1969 in Lake Poinsett
in South Dakota. DDT and its metabolites were detected in all the
147 samples collected in 1969. In 1970, DDT was found in all the
catfish samples obtained from 54 commercial fish farms sampled in
Arkansas. Dieldrin, endrin and toxaphene were detected in 89, 76
and 95% of the samples (Crockett el ai, 1975). Various studies
showed that between 1970 and 1974, the mean DDT levels in fish
declined but high levels were still recorded in areas of intense use of
the pesticide; dieldrin and endrin levels remained unchanged
(Schimmitt el al., 1981).
Studies of organochlorine pesticide residues reported in fish
from the Great Lakes of America in 1970, showed that fish from
Lake Michigan had two to seven times the residue load of fish from

-21 -
the other Great Lakes. The coho salmon from Lake Michigan was
found to be highly contaminated and unfit for human consumption
(Murty, 1986).
Following the ban on use of environmentally persistent
organochlorine pesticides in the U. S. A. in the early 1970's, the
levels of these compounds in fish have continued to show a
declining trend (Murty, 1986).
2.7.2 C an ad a
Reports from various organochlorine pesticide studies in
Canadian fish indicate low levels of the compounds in fish. Fredeen
el al. (1971) detected DDT, DDD and DDE at levels of 0.01, 0.015 and
0.01 to 0.06 mg/kg in nine species of fish from the Saskatchewan
River where DDT had been used for 20 years (1948 to 1967) for
control of the blackfly larvae. Zitko (1971) reported low levels of
DDT, DDE and pp' DDD in marine and freshwater fish in New
Brunswick and Nova Scotia. A downward trend in total DDT
content was recorded in Lake Simcoe fish in central Ontario during
the period 1970 to 1976 (Murty, 1986). Dieldrin showed declining
trend while chlordane and heptachlor epoxide were recorded for the
first time in 1975 and 1976.
2.7.3 Europe
Countries around the Baltic Sea have made substantial
contribution to the environmental monitoring of the pesticide
residues in fish in Europe. In Norway, cod sampled in 1969 from
Dalsfjorden had total DDT content of 0.57 to 2.15mg/kg where as
those caught from an intensive fruit growing area had a residue
level of 1.98 to 33mg/kg on wet weight basis (Stenersen and
- 2 2 -
K valvag, 1972). Bjerk (1973) sampled cod in 1971 and detected DDT at
concentrations of 90 to 135mg/kg on wet weight basis in the liver.
The highest residue level on fat weight basis was 576mg/kg. In 1976,
cod collected from 16 localities in Norway had total DDT of 0.1 to
1.9 m g /k g with a single wayward value of 14.5mg/kg on wet weight
basis (Brevik, 1978). Kveseth (1981) detected high DDT (14mg/kg)
levels in 1975 to 1976 in southern Norway in a lake near a plant
nursery school.
Following the ban of DDT use in Norway, the level of
contamination of fish with this compound has shown a declining
trend. Skare et al (1985) reported a declining trend of
organochlorine pesticide residues in fish during the period 1972 to
1982. This indicated the effectiveness of the ban of DDT use in
Norway in 1970. The highest mean level of sum DDT in 1982 was
1.237mg/kg on wet weight basis, with a range of 0.191 to 3.845mg/kg,
about a third of the corresponding 1972 level, y- and a-HCH were
also detected at low levels.
Levels of organochlorine pesticide residues in fish in Sweden
and Finland were found to be generally lower than those in fish
from Norway in various studies done from the mid 60's to the 70's
(Murty, 1986). A steadily declining trend in organochlorine .residues
in fish was observed following the ban of use of the compounds in
agriculture.
A study conducted in Ireland in 1966 showed residues of
lindane, aldrin and dieldrin that ranged from 0.01 to 0.6mg/kg and
o,p' DDT ranged from 0.03 to 0.7mg/kg in salmon trout (Murty,
1986). In 1974 to 1976, low levels of sum DDT in fish were reported
from Finland and German Democratic Republic (Murty, 1986).
- 2 3 -
2.7.4 Other reBionsReports of organochlorine pesticide residue levels lower than
those in ’ fish from North America and the Baltic have been
published from Iran, Jordan, Sudan, Lake Nubia, Lake Tanganyika
and South Africa (Murty, 1986). In a survey conducted in 1974 in fish
from two rivers in Iran, the sum DDT on fat weight basis, in barbus
species was 60.6mg/kg and 196mg/kg. Organochlorine residues in
fish from lakes and reservoirs were generally less than 25mg/kg.
Sum DDT values of 0.7 to 0.38mg/kg were reported in three
species of fish caught from Lake Tanganyika in 1971 (Deestra et (il.r
1976). Dieldrin and DDT at levels of 0.25 and 0.75mg/kg respectively
were recorded in fish from two man- made lakes in South Africa in
1977 (Greichus et al, 1977). Zorgani et al. (1976) and Zorgani (1980)
reported sum DDT of 0.0022 to 0.184mg/kg in Lake Nubia fish an d
0.3 to 2.9mg/kg in different species of fish from elsewhere in th e
Sudan. In Jordan, in 1971, the sum DDT in three species of fish
ranged from 0.37 to 3.34mg/kg (Murty, 1986).
Mexico, Australia and New Zealand have reported very 1 <>vv
levels of organochlorine contamination in fish tissues (Rosales r*n d
Escalona, 1983; Murty, 1986).
2.8 Review of organochlorine pesticide residue studies in K en^yan
fish
The use of organochlorine pesticides in Kenya dates back*< to
1946 when DDT was used in aerial spraying for controM of
mosquitoes in the Lake Victoria region. Despite the national and^ the
international outcry over the environmental hazards linked to * the
use and abuse of persistent organochlorine pesticides, it was not
A
- 2 4 -
until 1986 that Kenya restricted the use of some organochlorine
pesticides. Investigations on the residue levels of the pesticides in
fish in Kenya also appears to have been ignored and data is still scanty.
Sonaeren (1946) reported massive fish deaths in Lake Victoria
following aerial spraying of DDT to control mosquitoes. During tM
time, there were no available facilities to quantify organochlorine
pesticides in biological material.
Koeman et al (1972) reported extremely low levels of dieldrin-
pp' DDE and DDT in fish from Lake Nakuru. The levels reported f°r
the three compounds were all below 0.007mg/kg on wet wcigl'*
basis. Greichus et al (1978) studied the contamination of Lake
Nakuru by organochlorine pesticides and found their residue levels
very low in Tilapia grahami. Lincer et al (1981) reported undetectable to very low levels of DDE in fish from Lake Naivas
in a study conducted to investigate organochlorine pesticide residue
levels in Kenya's Rift Valley Lakes. A predatory fish from
Baringo showed the highest level (2.13mg/kg) of DDE in the studyKanja (1989), as part of her study to investigate levels aI,d
sources of organochlorine pesticide residues in Kenyan motl'ers
milk, analysed fish samples from Rusinga Island in Lake Vid°r'a
The fish samples were analysed in four categories as fresh, ^ .
smoked or cooked. Pesticide residues were detected in all the f°ur J
categories except cooked fish. The overall sum DDT levelsra" ^ I
from 0.031 to 0.367mg/kg. Smoked fish showed the highest
(0.l49mg/kg) of sum DDT. The DDT compounds detected
study were pp' DDT, p,p' DDE, o,p' DDT and p,p' DDD wifl1 $
being most prevalent. Other organochlorine pestici^erV
found in this study were a-HCH, lindane and dieldrif1.
- 2 5 -
were, however, low and ranged from 0.0013 to 0.123mg/kg for all
the detected compounds.
An investigation on the pesticide residue levels in fillet and fat
of nile perch from Lake Victoria, done in 1988, revealed low levels
of the compounds in the tissues (Mitema and Gitau, 1990). The
mean sum DDT was 0.45 and 0.099mg/kg in fillet and fat
respectively. The highest sum DDT level was 4.51mg/kg, detected in
a fat sample. Four compounds of the DDT group namely p,p' DDT,
o,p' DDT, p,p' DDD and p,p' DDE were detected, oc-, (1- and y- 11CH,
dieldrin and aldrin were also detected at low levels ranging from
0.003 to 0.22 and 0.005 to 0.26mg/kg in fat and fillet respectively.
The findings of the studies reviewed indicate that the Kenyan
aquatic system has been exposed to organochlorine pesticides. There
is therefore a need for more data due to the continued use of the
chemicals in recent years.
2.9 Review of methods for analysis of organochlorine
pesticide residues in fish
The analysis of organochlorine pesticide residues in samples is
divided into three parts: extraction, clean-up and quantitation At
residue levels the analytical method is required to be of high
sensitivity and accuracy to enable legistrative bodies to arrive at
valid decisions with regard to residue limits in commodities within
their jurisdiction.
Extraction entails removal of the pesticide residue from the
sample matrix. Extraction systems that have been employed for
organochlorine pesticide residues in fish include liquid-liquid
partitioning, ethanol/water extraction (Noren et al, 1968), blending

-26 -
with anhydrous sodium sulphate followed by extraction with
acetonitrile (Hesselberg and Johnson, 1972), column extraction using
diethylethef (Bjerk and Sundby, 1970) and soxhlet extraction
(Koeman et al , 1972).In most extraction procedures, the residue is
removed with a host of co-extractives which may interfere with the
final quantitation of the residue.
The clean-up procedure eliminates the interfering co
extractives. Some of the documented clean-up procedures for
pesticide residues in fish are column chromatography using
alumina, liquid-liquid partitioning and acid/base treatment.
Quantitation is the step at which the amount of pesticide
residue in the sample is determined. Gas-liquid chromatography,
introduced in 1952 by James and Martin, is presently the most widely
used quatitation technique for organochlorine pesticide residues
(Chau and Afghan, 1981). The electron capture detector used in gas
liquid chromatography is selectively responsive to compounds with
high electronegativity (Holden, 1981). Thin layer chromatography
(TLC) is a qualitative and semi-quantitative technique for analysis of
organochlorine pesticide residues in fish. However, its use has long
been superseded by gas liquid chromatography owing to its low
sensitivity especially at low (nanogramme) residue levels.
The choice of the method to be used for organochlorine
pesticide residue analysis is commonly dependent on availability of
reagents and equipment, applicability of the method to multiresidue
analysis, precision of the method, speed and cost of analysis. Table
2.1 shows some of the published methods for analysis of
organochlorine pesticide residues in fish samples.
- 2 7 -
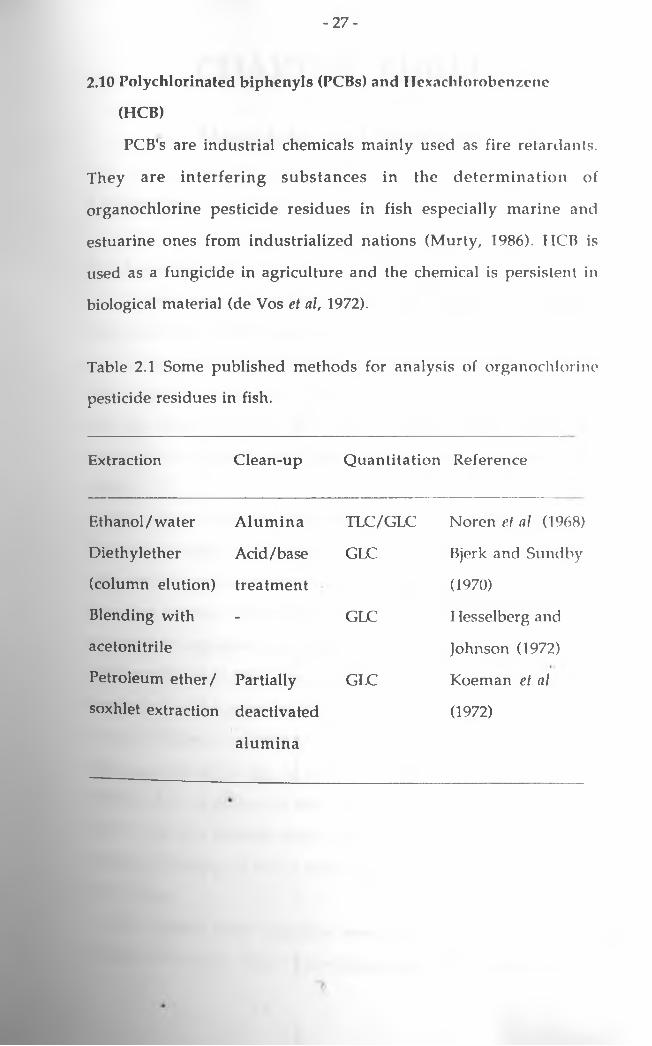
2.10 Polychlorinated biphenyls (PCBs) and Hexachlorobenzene
(HCB)
PCB's are industrial chemicals mainly used as fire retardants.
They are interfering substances in the determination of
organochlorine pesticide residues in fish especially marine and
estuarine ones from industrialized nations (Murty, 1986). HCB is
used as a fungicide in agriculture and the chemical is persistent in
biological material (de Vos et al, 1972).
Table 2.1 Some published methods for analysis of organochlorine
pesticide residues in fish.
Extraction Clean-up Quantitation Reference
Ethanol/water Alumina TLC/GLC Noren et al (1968)
Diethylether Acid/base GLC Bjerk and Sundby
(column elution) treatment (1970)
Blending with - GLC Hesselberg and
acetonitrile Johnson (1972)
Petroleum ether/ Partially GLC Koeman et al
soxhlet extraction deactivated (1972)
alumina

28 -
CHAPTER THREE
- Materials and Methods3.1 Sampling
3.1.1 Area of study
The main area of study comprised upper Tana River (Masinga
Dam) and the Tana Delta sampled at Garsen and Tarasaa. The lower
part of the Tana Delta (Kipini) was not sampled due to floods
following heavy downpour at the time of sampling. Lake Naivasha
and the estuary of the Athi (Sabaki) River were studied for
comparison of results with those obtained from the Tana River
study.
Tana River originates from Mount Kenya and the Nyandarua
(Aberdare) ridges and meanders through areas with different
agricultural activities. It first flows through Nyeri, Muranga and
Kirinyaga Districts, where organochlorine pesticides have been used
in control of vegetable pests, before traversing Embu and Tana River
Districts. The river has along its course several irrigation schemes.
Cotton is mainly grown in the giant Bura Irrigation Scheme, Hola
Irrigation Scheme and the Galole Pilot Project while horticultural
farming is done in the recently established Masinga Irrigation
Scheme. Rice is grown in the Mwea Rice Irrigation Scheme and
water from the scheme drains into the Tana through the Thiba
tributary. Majority of rivers from Embu and Meru also drain into
Tana River.
thi (Sabaki) River originates from the Ngong Hills and flows
through Machakos, Kitui, Taita-Taveta and Kilifi Districts before

29
emptying into the Indian Ocean at Malindi. Rainfall run-off from
Nairobi is emptied into the river through the Nairobi River. Some
horticultural farming is done under irrigation at various points
along the course of Athi River.
Lake Naivasha is a fresh water lake situated in the southern
region of the Great Rift Valley. Malewa River which originates
from the Nyandarua Ridges flows through Kipipiri, North
Kinangop and Ol Kalau and empties into the lake.
Fig. 3.1 shows the locations of the various sampling sites of the
study area.
3.1.2 Sampling procedure
Fish were randomly obtained from the study areas by gill nets,
fishing baskets or line and hook. Fish from Naivasha and Masinga
Dam were caught and transported to the laboratory at Kabete the
same day. To avoid putrifaction, the fish were transported in
coolboxes packed with ice or freezer packs (dry ice). In the laboratory,
samples of the lateral muscle, liver and ovaries were obtained by
dissection, wrapped separately in aluminium foil, then labeled
appropriately and each set of samples from one fish were packed
together in plastic paper bags. The samples were thereafter stored in
a freezer at -20°C until the time of analysis.
Fish from Malindi and lower Tana River were first transported to
the laboratories of the Fisheries Department at Malindi where fillet,
liver and ovary samples were obtained and stored in a freezer at -
20°C. The samples were later transported to Kabete and stored as
described above.

- 31 -
3.1.3 Species of fish collected
Various species of fish with different feeding habits were caught
from the ffve sampling sites.
Sharks (Carcharinus spyraena): These are highly migratory
carnivorous marine fish which predate on the smaller estuarine fish
such as catfish and Malindi herrings. Their average length was
55cm.
Catfish (Clarius species): This species was caught in Malindi,
Masinga Dam, Garsen and Tarasaa. The fish is carnivorous and feeds
on smaller fish and their fry, insects and their larvae.
Breams (Motaxis grandocuris ): These are fairly large marine and
estuarine fish weighing up to 5kg and feed on detritus. They are
mainly localized at the estuary of Athi River.
Soles (Solea solea ) and monodactylus species: These are flat marine
and estuarine fish which feed on the bottom sediments of planktons
and algae.
Malindi herring: This is a small marine and estuarine bottom
feeding fish.
Tilapia: Three species of tilapia were caught from four of the five
sites. Tilapia zilli and leucostictus were caught in Lake Naivasha
while Tilapia mossambicus was caught in Masinga Dam, Garsen
ar>d Tarasaa.Tilapia is a herbivorous open water feeder.

- 3 2 -
Lungfish (Protopterus amphibius ): This is a herbivorous fresh water
fish and was only caught at Garsen.
Black bass (Micropterus salmoides ): This is a carnivorous fish that
feeds on frogs, clayfish and smaller fish such as tilapia. It was only
caught in Lake Naivasha.
Common carps (Cyprinus carpio ): This species was only caught at
Masinga. It is a fresh water bottom feeder surviving on planktons
and algae.
3.2 Materials
3.2.1 Glassware
Item
Beakers
Volumetric flasks
Description/Supplier
150,100, 50ml
10ml
Conical flasks 500ml
Chromatographic columns 2m by 4mm ID and 1.8m
by 4mm ID, all glass, Supelco
S. A., Gland, Switzerland.
50ml, 15ml, Duran®
Duran®
Centrifuge tubes
Voltex flasks
Carlsberg's pipettes
Pasteur pipettes
Blow-out pipettes
Screw cap vials
50,100, 500(il
140ml
1, 2, 5 ,10ml
7.4ml, Supelco S. A., Gland,
Switzerland
33
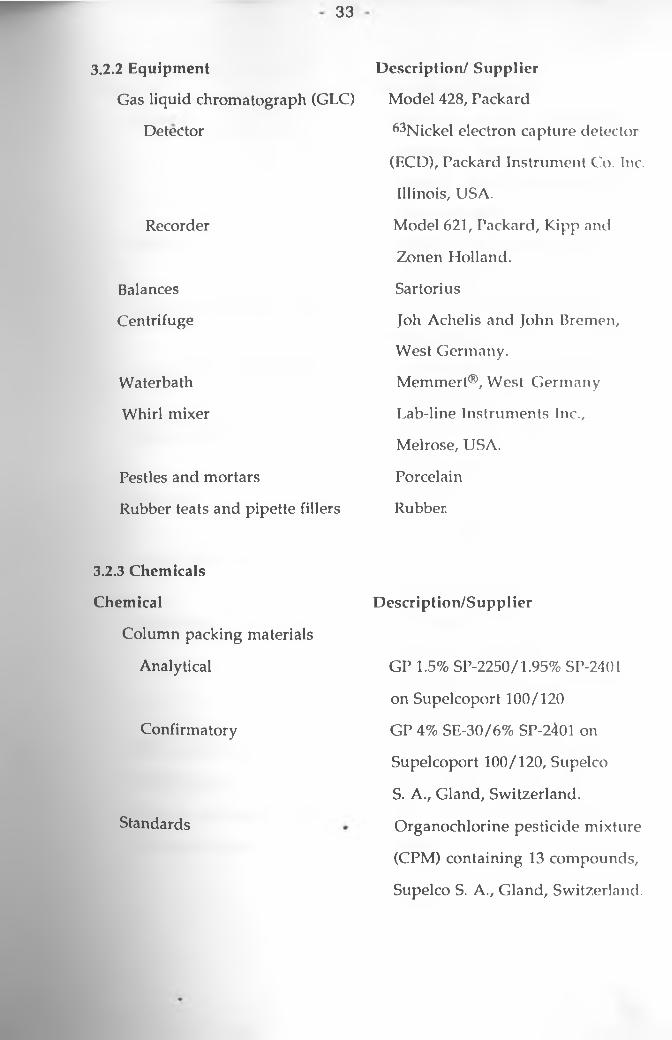
3 .2 .2 E q u ip m e n t
Gas liquid chromatograph (GLC)
Detector
Recorder
Balances
Centrifuge
Waterbath
Whirl mixer
Pestles and mortars
Rubber teats and pipette fillers
3.2 .3 C h e m ica ls
C h em ical
Column packing materials
Analytical
Confirmatory
Standards
D e sc rip tio n / S u p p lie r
Model 428, Packard
63Nickel electron capture detector
(ECD), Packard Instrument Co. Inc.
Illinois, USA.
Model 621, Packard, Kipp and
Zonen Holland.
Sartorius
Joh Achelis and John Bremen,
West Germany.
Memmerl®, West Germany
Lab-line Instruments Inc.,
Melrose, USA.
Porcelain
Rubber,
D e s c rip tio n /S u p p lie r
GP 1.5% SP-2250/1.95% SP-2401
on Supelcoport 100/120
GP 4% SE-30/6% SP-2401 on
Supelcoport 100/120, Supelco
S. A., Gland, Switzerland.
Organochlorine pesticide mixture
(CPM) containing 13 compounds,
Supelco S. A., Gland, Switzerland.

3 4 -
Chemical Description/Supplier
n-Hexane Laboratory grade: May k^
Dageham, England or
Analar®: BDH Chemicals
Poole, England.
Acetone Analar® BDII Chemicals^
Poole, England.
Anhydrous sodium sulphate Analar® BDII Chemicals|n
Poole, England.
Sodium hydroxide pellets Analar® BDH Chemicals^i 7
Poole, England.
Sodium chloride Analar® BDII Chemicals^
Poole, England.
Methanol Analar® BDH Chemicals^
Poole, England.
Concentrated sulphuric acid East Anglia Chemicals,
Hadleigh, England.
Diethylether Laboratory grade: May
Dageham, England or
Analar® BDH Chemicals^ 1
Poole,England.
Acid washed sea sand May & Baker, Dageham,L|j
Distilled water Was prepared in the latotyj
Nitrogen gas (purified 99% and East African Oxygen, Na'robi,l
ordinary nitrogen) Kenya.

3 5 -
3.3 C le a n in g of g lassw are :
The glassware was first rinsed with tap water and then scrubbed
with a brush and warm water containing a liquid detergent. This
was followed by a rinse in tap water, distilled water and finally
acetone before drying in an oven at 150°C overnight. Each piece was
rinsed with redistilled hexane before use.
3.4 S o lv e n t p re p a ra tio n
3.4.1 D istilla tio n :
Redistillation of solvents in pesticide residue analysis is an
important step as it removes impurities that may interfere with
identification and quantitation of pesticide residues.
Two and a half'litre volumes of hexane, acetone and methanol
were separately distilled once in an all-glass fractionating column
fitted with a water- cooled condenser. Glass beads were used in the
distillation flask to prevent superheating of the solvents. The
solvents were heated slowly to prevent co-distillation of impurities.
The first 200ml of the distillate and the last 400ml of the solvent in
the distillation flask was discarded in accordance with
recommendations by Maitho (1978).
3.4.2 Purity check
To check the purity of hexane, 10ml of the solvent was reduced to
lml by evaporation in a waterbath at 42°C over a gentle stream of
nitrogen. This was then injected into the GLC and the detector
response was observed for 20 minutes. The detector response was
observed for 20 minutes because this is the longest retention time
university Of hmMW

3 6 -
for the last compound (p,p' DDT) in the CPM standard under th e
GLC operating conditions used in the study. In some cases, minute
peaks were observed close to the solvent front but they did n o t
interfere with the analysis of a-H C H (the first peak in the CPM
standard).
The purity of the other solvents (acetone, methanol a n d
diethylether) was checked as follows. 10ml of the solvent in a
graduated centrifuge tube was evaporated to dryness in a walerbatli
at 42°C over a stream of nitrogen. The tube was then rinsed w ith
2ml of hexane which was then injected into the GLC. The detector
response was then observed for 20 minutes. No interfering peaks
were observed after a single distillation.
3.4.3 Washing of concentrated sulphuric acid with hexane
Hexane and concentrated sulphuric acid at a ratio of 1:2 (volume?
by volume) was put in a separatory funnel, shaken thoroughly a n d
then left to stand for 30 minutes. The acid layer was drained into a n
all-glass dispenser for storage while the hexane layer was discarded.
To check the purity of the sulphuric acid, 2 volumes of acid wertr*
washed with one volume of hexane. The hexane layer was d rain ed
into a graduated centrifuge tube, evaporated to 1ml in a waterbath a t
42°C and an aliquot was injected into the GLC. Detector response w as?
observed for 20 minutes. No interfering peaks were observed a n d
hence the hexane-washed acid was found suitable for use ix^
pesticide residue analysis.
3.5 Preparation of pesticide standards
A high quality organochlorine pesticide mixture (CPM 4-9151 )
containing 13 compounds dissolved in 1ml isooctane in s e a le d
3 7 -
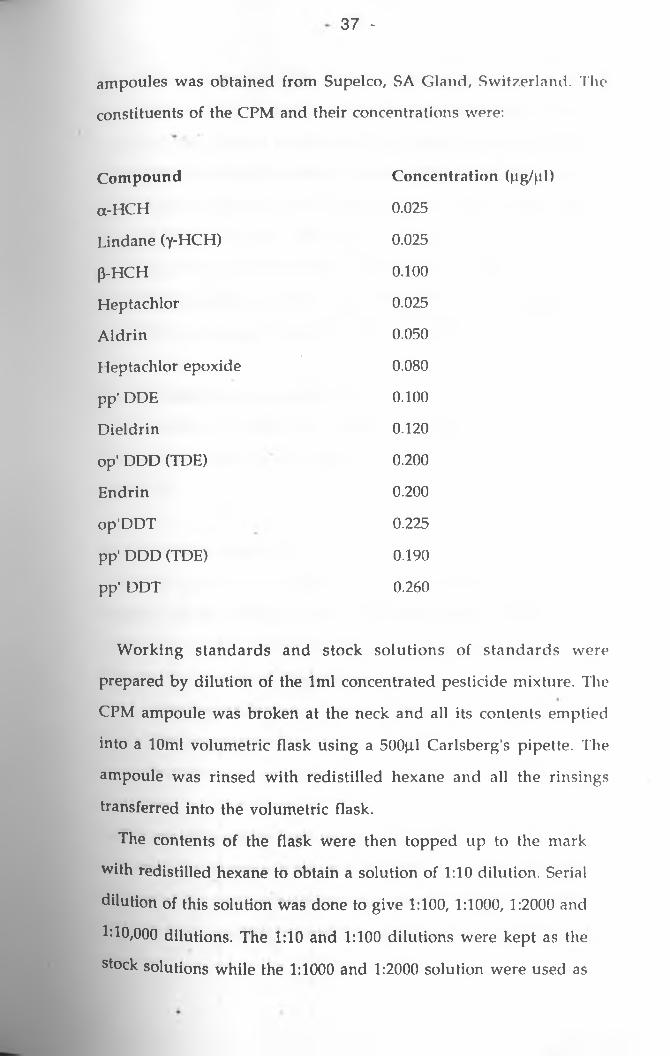
ampoules was obtained from Supelco, SA Gland, Switzerland. The
constituents of the CPM and their concentrations were:
C o m p o u n d Concentration (pg/pl)
a-HCH 0.025
Lindane (y-HCH) 0.025
(5-HCH 0.100
Heptachlor 0.025
Aldrin 0.050
Heptachlor epoxide 0.080
pp' DDE 0.100
Dieldrin 0.120
op' DDD (TDE) 0.200
Endrin 0.200
op'DDT 0.225
pp’ DDD (TDE) 0.190
pp’ DDT 0.260
Working standards and stock solutions of standards were
prepared by dilution of the 1ml concentrated pesticide mixture. The
CPM ampoule was broken at the neck and all its contents emptied
into a 10ml volumetric flask using a 500|il Carlsberg's pipette. The
ampoule was rinsed with redistilled hexane and all the rinsings
transferred into the volumetric flask.
The contents of the flask were then topped up to the mark
with redistilled hexane to obtain a solution of 1:10 dilution. Serial
dilution of this solution was done to give 1:100, 1:1000, 1:2000 and
1:10,000 dilutions. The 1:10 and 1:100 dilutions were kept as the
stock solutions while the 1:1000 and 1:2000 solution were used as

3 8 -
the working standards. The 1:10,000 dilution was used to test
detector sensitivity at very low pesticide concentrations. All the
dilutions were done at room temperature and the solutions were
stored in a deep freezer awaiting analysis. Redistilled hexane was
used as the the diluent since it was the final extraction solvent for
the pesticides residues. Hexane, isooctane and benzene are
suitable solvents for preparation and dilution of organochlorine
pesticides standard solutions (Chau, 1982). The use of benzene is ,
however, discouraged due to its toxicity especially carcinogenicity.
3.6 G as liq u id ch ro m a to g ra p h (G L C )
The instrument used was a Packard model 428 equiped with a
63Ni electron capture detector (ECD) and a Packard recorder,
model 621.
3.6.1 O p e ra tin g co n d itio n s
Carrier gas flow rate during the analysis was maintained
between 60 and 75ml/minute. The recorder was operated at
lOmV with a chart speed of lOmm/minute and attenuation of
128. The GLC operating temperatures were:
Injection block 230°C
Oven (column) 210°C
Detector 250°C
3.6.2 Resolution and linearity
Resolution of the column and linearity of the detector were
checked prior to the analysis of samples. To check resolution,
aliquots of the working standard were injected into the GLC and

- 39 -
the resulting elution patterns were compared with those supplied
by the CPM manufacturer.
Linearity was checked by injection of equal volumes of
dilutions of the CPM standard solution into the GLC followed by
plotting of calibration curves. The best curve of fit was
determined by the method of least squares using a computer.
3.6.3 Detection limits
The modern ECD has a detection limit of lpg for
organochlorine pesticides (Chau and Afghan, 1982). In the
present study the detection limit was about 0.001 mg /kg.
3.7 P esticid e resid u es
3.7.1 Id en tification
The retention times of the components in the sample
chromatogram were measured and compared with those of
corresponding components in the standard chromatogram ( Pig.
3.2)
3.7.2 Quantitation
This was achieved by comparing the peak heights of sample
components with those of corresponding components in
standards of known concentrations. The amount of each
compound in lg of wet sample was calculated by considering the
final volume of pesticide extract and correcting for any dilutions
done during analysis. Pesticide levels were expressed in mg/kg
without correcting for the percent recovery of the pesticides. The
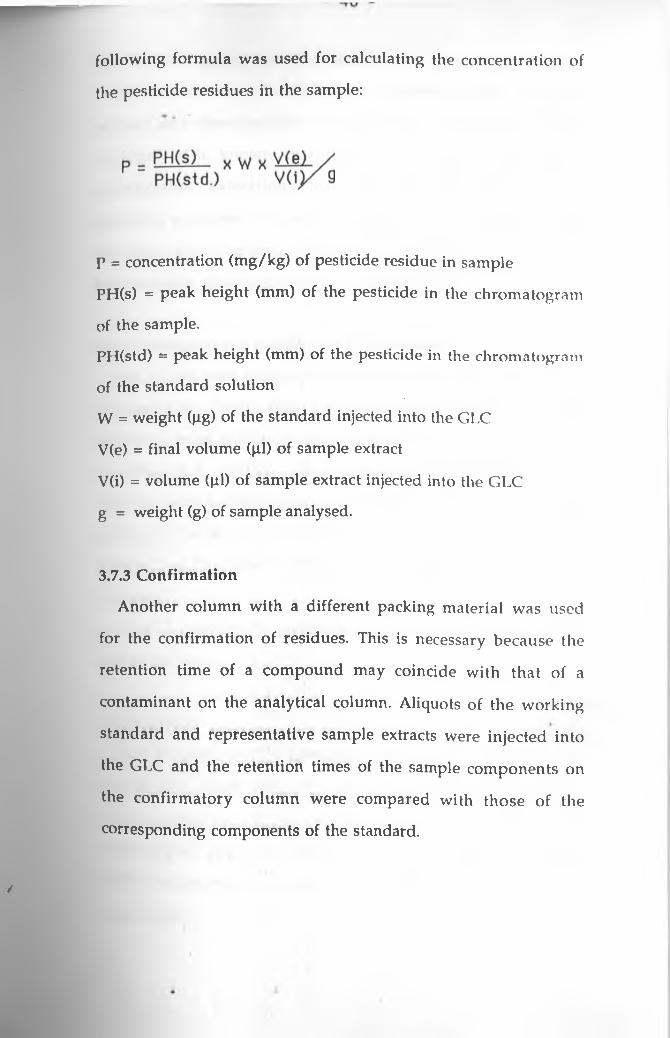
following formula was used for calculating the concentration of
the pesticide residues in the sample:
p = concentration (mg/kg) of pesticide residue in sample
PH(s) = peak height (mm) of the pesticide in the chromatogram
of the sample.
PH(std) ** peak height (mm) of the pesticide in the chromatogram
of the standard solution
W = weight (gg) of the standard injected into the GLC
V(e) = final volume (pi) of sample extract
V(i) = volume (pi) of sample extract injected into the GLC
g = weight (g) of sample analysed.
3 .7 .3 C o n firm a tio n
Another column with a different packing material was used
for the confirmation of residues. This is necessary because the
retention time of a compound may coincide with that of a
contaminant on the analytical column. Aliquots of the working
standard and representative sample extracts were injected into
the GLC and the retention times of the sample components on
the confirmatory column were compared with those of the
corresponding components of the standard.
/

- 41
3 .8 A n aly tica l q u a lity a ssu ra n ce (A Q A )
This was an internal check on the efficiency of the analytical
method arid reproducibility of the results. Fish samples were
fortified with known quantities of the pesticides under
investigation. Extraction, clean- up and quantitation of the
pesticides was done. The percent recoveries of the pesticides were
calculated and evaluated according to the UNEP/ WHO criteria
for evaluation of pesticide recovery results (1980).
3.8 .1 P re p a ra tio n an d h a n d lin g of A Q A sa m p le s
40g of fillet from the lateral muscle of a whole fish sample was
weighed into a voltex flask. The sample was homogenized with
an electric meat mincer. 3g of the homogenate were weighed into
a mortar in 6 parallels. 100 or 600|il of CPM standard (1:100
dilution) were added to each 3g of sample to give a low or high
spiking of the sample. Two blanks, one containing 3g of unspiked
sample and the other sodium sulphate and sand only, were
prepared.
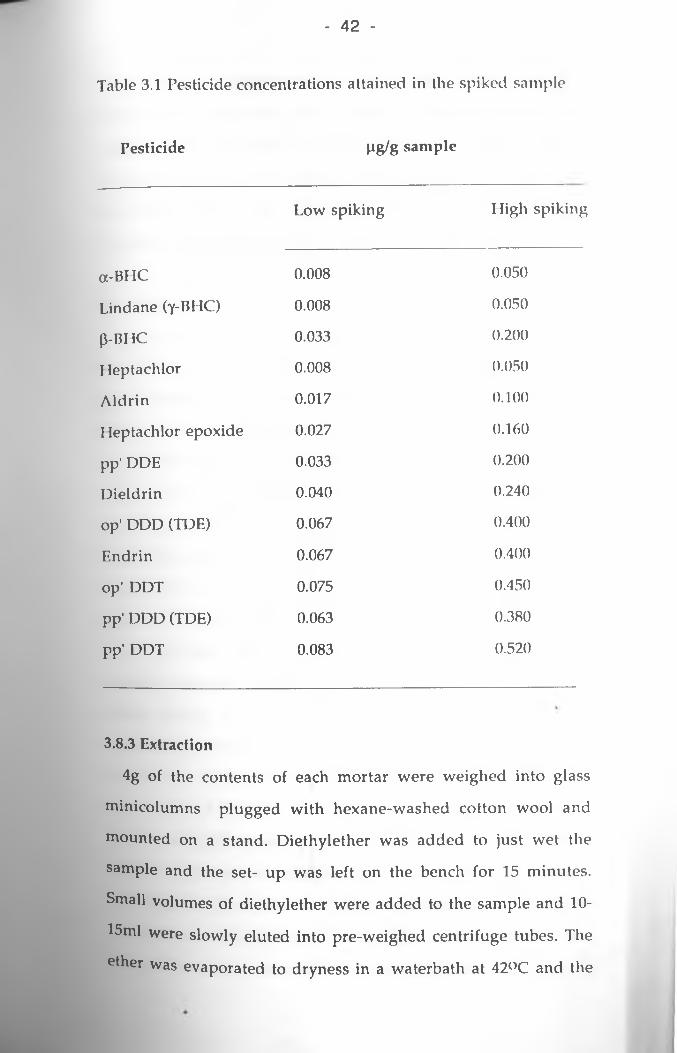
Table 3.1 shows the pesticide concentrations attained in the
spiked sample.
3=8.2 Analysis
This process involved extraction, clean-up, GLC injection and
quantitation of the pesticides in the spiked samples. The method
used in extraction and clean-up of pesticide residues in this study
was adapted from a method developed by Bjerk and Sundby
(1970) for analysis of organochlorine pesticide residues in aquatic
o rg an ism s.
- 4 2 -
Table 3.1 Pesticide concentrations attained in the spiked sample
P esticid e p g /g sa m p le
Low spiking High spiking
a-BHC 0.008 0.050
Lindane (y-BHC) 0.008 0.050
p-BHC 0.033 0.200
Heptachlor 0.008 0.050
Aldrin 0.017 0.100
Heptachlor epoxide 0.027 0.160
pp' DDE 0.033 0.200
Dieldrin 0.040 0.240
op' DDD (TDE) 0.067 0.400
Endrin 0.067 0.400
op’ DDT 0.075 0.450
pp’ DDD (TDE) 0.063 0.380
pp' DDT 0.083 0.520
3.8.3 Extraction
4g of the contents of each mortar were weighed into glass
minicolumns plugged with hexane-washed cotton wool and
mounted on a stand. Diethylether was added to just wet the
sample and the set- up was left on the bench for 15 minutes.
Small volumes of diethylether were added to the sample and 10-
15ml were slowly eluted into pre-weighed centrifuge tubes. The
ether was evaporated to dryness in a waterbath at 42°C and the

- 4 3 -
tubes were re-weighed after cooling to room temperature.The
difference between the initial weight of the tubes and their
weight after evaporation of the ether eluate gave the weight of
the fat extracted from the sample. This fat was contained in Ig of
wet sample. The fat was redissolved in 4ml of redistilled hexane
to give a maximum fat concentration of not more than 0.05g/ml.
3.8 .4 C le a n -u p
The clean-up procedure involved acid and base treatment.Two
lml aliquots of the hexane fat solution were withdrawn using
lml blow-out pipettes and transferred into different centrifuge
tubes. 1.5ml of the hexane-washed concentrated sulphuric acid
was added to one of the aliquots and thoroughly mixed with a
whirl mixer. The mixture was left on the bench for one hour,
after which it was spun with a centrifuge for 2 minutes at 3000
revolutions per minute (r.p.m.). The clear hexane layer was
transferred into extract vials with teflon caps using pasteur
pipettes and was ready for injection into the GLC.
For the base clean-up, the other lml aliquot of hexane fat
solution was evaporated to dryness in a waterbath at 42°C over a
gentle stream of nitrogen. 1.5ml of 15% methanolic sodium
hydroxide was added and thoroughly mixed with a whirl mixer.
The mixture was left overnight in a waterbath at 42°C. The tubes
were removed from the waterbath the following morning and
lml of redistilled hexane and 3ml of 2% aqueous sodium
chloride solution was added. The mixture was spun with a
centrifuge at 3000 r.p.m. for 2 minutes and the hexane layer was
removed as with the acid clean-up. The pesticide extract was
always stored in a freezer at -20°C when not in use.

- 4 4 -
3.8.5 In je c tio n o f sa m p le e x tra c ts in to th e GLC
The pesticide extracts were removed from the freezer and left
to warm to room temperature. Between 1 and 5pl of the extract
was injected into the GLC using 1 Oj.il graduated glass syringes.
The detector response was observed for 20 minutes.
3.9 Results
3.9.1 Resolution
The elution pattern and resolution of the peaks for all the 13
components of the CPM standard were found to conform with
the chromatogram supplied by the CPM manufacturer (Fig. 3.2n).
The retention times were, however, different from those given
by the CPM manufacturer. This was attributed to the use of GLC
operating conditions different from those used by the CPM
manufacturer.
3.9.2 Linearity
The detector showed a linear response over a wide range of
pesticide concentrations (figs. 3.3 - 3.5). Pesticide residue analysis
in the samples was carried out within this linear range of detector
response.
3.9.3 Pesticide recoveries from spiked samples
The recoveries obtained in the low and high spiking levels for
the 13 pesticides ranged from 79 to 102 %. This was found to be
within the acceptable range for pesticide residue analysis
according to the UNEP/WHO Criteria for evaluation of pesticide

- 4 5 -
recovery results (1980). Table 3.1 shows the pesticide recoveries
from spiked samples and their evaluation.
Table 3.2 Percent pesticide recoveries from spiked samples
Recovery (%)
Pesticide Low
spiking
± A Evaluation High
spiking
+ A Evaluation
oi-HCH 81 -19 G 88 -12 G
Lindane 84 -16 G 97 -3 E
P-HCH 83 -17 G 96 -4 E
Heptachlor 88 -12 G 91 -9 E
Aldrin 79 -21 A 90 -10 E
Heptachlor
epoxide 81 -19 G 91 -11 C.
p,p' DDE 98 -2 E 102 +2 E
Dieldrin 87 -13 G 99 -1 E
o,p' DDD 88 -12 G 91 -9 E
Endrin 82 -18 G 95 -5 E
o,p' DDT 87 -13 G 89 -11 G
p.p' DDD 90 -10 E 96 -4 E
p,p’ DDT 98 -2 E 101 +1 E
The recoveries are given as means of 6 parallels ± percent deviation (±A) from
the added amount.
A = 100 x recovered pesticide(ug) -100 spiked pesticide (pg)
E = Excellent (±10% of spiked amount)

G = Good (±20%)
A= Acceptable
P= Poor
(±30%)
(±40%)
U= Unacceptable (±50%)

47
1 ci-llCH
2. l indane
3. P - IICI1
4 llcptachlor
5. Aldrin
6. llcptachlor epoxide
7. p,p* non8. Dicldrin
9. o.p DDD
10. Hndrin11. o.p* DDT
12. p.p1 DDD
13. p.p DDT
Fig. 3.2 Chromatograms of CPM standard (a) and a positive fillet sample (b) on the analytical column.Conditions: column, 2.0m x 4mni ID, all glass, packing GP 1.5% SP- 2250/ 1.95% SP- 2401 on 100/120 Supelcoport. Temperature: column 210°C, detector 250°C, injector 230°C. Carrier gas: N2, flow rate 70ml / min.
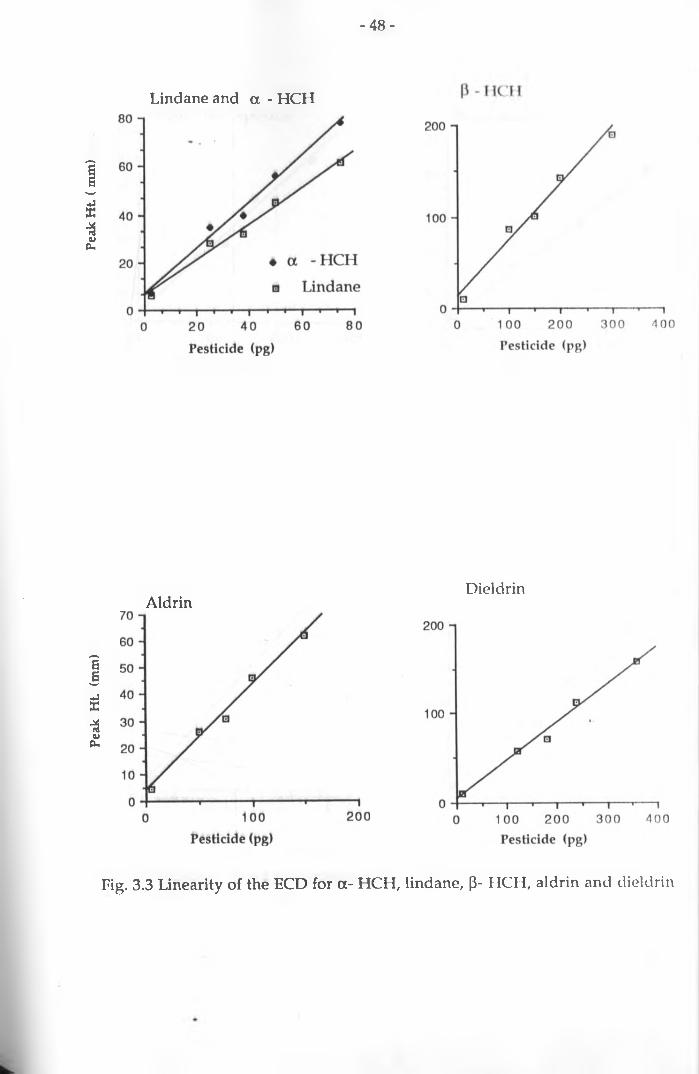
Peak
Ht
(mm
) Pe
ak H
t ( m
m)
- 4 8 -
Lindane and a - HCH
AldrinDieldrin
Fig. 3.3 Linearity of the ECD for a- HCH, lindane, (3- HCH, aldrin and dieldrin
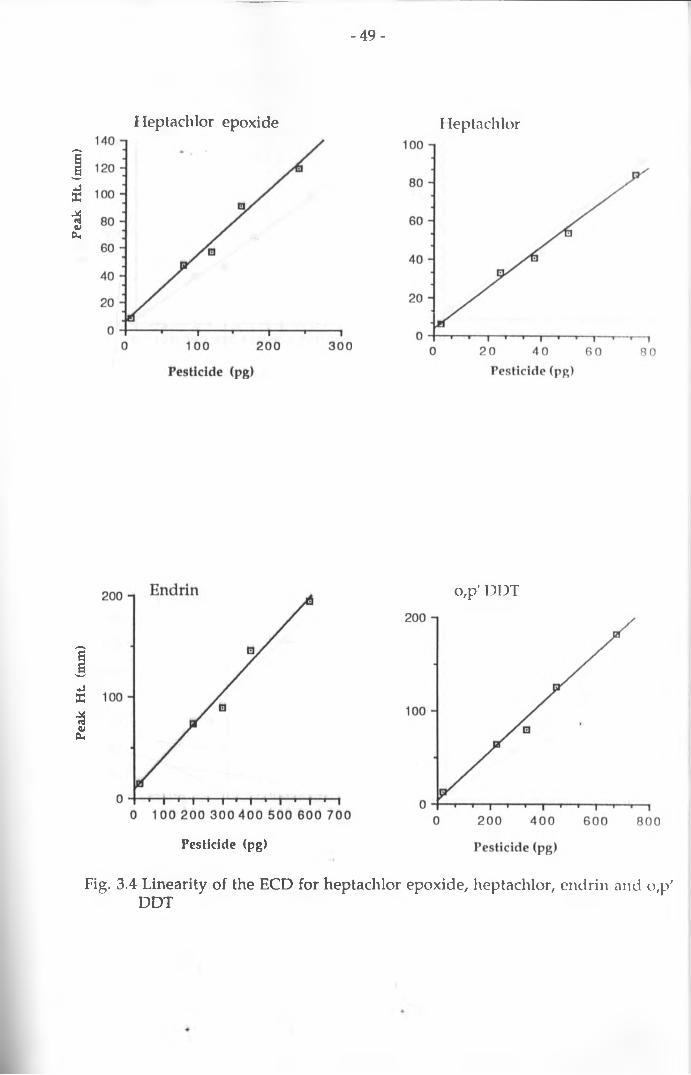
Peak
Ht
(mm
) Pe
ak H
t* (m
m>
- 4 9 -
Heptachlor epoxide Heptachlor
o,p' DDT
Pesticide (pg)
Fig. 3.4 Linearity of the ECD for heptachlor epoxide, heptachlor, endrin and o,p' DDT

Peak
Ht
(mm
) Pe
ak H
t (m
m)
- 5 0 -
o,p’ DDD
Pesticide (pg)
p,p' DDE
Pesticide (pg)
p,p' DDD
p,p’ DDT
Pesticide (pg)
Fig. 3.5 Linearity of the ECD for o,p' DDD, p,p' DDD, p,p' DDE and p,p' Dl)T

- 51 -
CHAPTER FOUR
Analysis of fish samples4.1 Materials and methods
4.1.1 Chemical analysis of fish samples
The fish samples were analysed as described in Chapter 3 page
41 to 44.
4.1.2 Statistical analysis
Statistical analysis of data was mainly done by analysis of
variance (ANOVA) using an IBM computer with a PANACEA
statistical programme. Linear regression and correlation
relationships were used to determine the variation of pesticide
residues with the weight of the fish. Turkey's highest significant
difference (HSD) test (Wayne, 1983) was used to determine if there
was a significant difference in the means of residue levels in the
various fish species. The equation used in this case was:
MSE
where: a = chosen level of significance
k = number of means in the experiment
N= total number of observations in the experiment
MSE = mean square error from the ANOVA table
q = obtained by entering a HSD statistic table

n*j = the smallest of the two sample sizes associated with
the two sample means that are to be compared
4 .1 .3 M axim u m re sid u e lim its (M R L ) an d acceptable daily intake
(A D I)
The two terms are used in evaluation of the toxicological
significance of pesticide residue data in food.
The MRL used in the present study is the maximum
concentration of a pesticide residue that is recognized by the
National Food Administration (NFA) of Sweden, as permissible in
fish for human consumption (Andersson et al, 1984). It is expressed
in mg/kg. The NFA is a collaborating centre for the Joint
FAO/WHO Food and Animal Feed Contamination Monitoring
Programme (Codex Alimentarious Commission, 1986).
ADI refers to the daily intake of a pesticide which during an
entire lifetime appears to be without appreciable risk to the
consumer's health on the basis of all the known facts at the time of
evaluation of the chemical by the FAO/WHO meeting on pesticide
residues. It is given in mg/kg body weight (Codex Alimentarius
Commission, 1986).
4.2 R e su lts
4 .2 .1 S u m m a ry o f re su lts
A total of 275 fish samples were analysed from the five
sampling sites and 9 organochlorine pesticide residues were
detected in 22.5% of the samples. p,p' DDT and its metabolite, p,p'
DDE were the most frequently observed compounds occurring in
12.7% and 20.4% of the samples respectively. The other residues
detected in order of decreasing frequency of occurrence were

- 5 3 -
lindane (4.4%), o,p’ DDT (4%), p,p' DDD (3.6%), p- HCH (2.5%), «-
HCH (1.8%), o,p' DDD (0.4%) and heptachlor (0.4%).
Statistical analysis of the data revealed some general findings
with regard to all the fish species analysed for organochlorine
pesticide residues. The levels of p,p' DDT and sum DDT were
positively correlated (r= 0.74) to weight of the fish.
Mean levels of sum DDT in catfish, breams, common carps
and sharks were significantly different (p< 0.0001) and their values
in order of magnitude were, 0.144, 0.213, 0.234 and 0.702mg/kg
respectively. There was no significant difference (p> 0.05) in the
mean levels of the various DDT group residues between male and
female fish and between different organs. Mean residue levels of
DDT group compounds were not significantly different (p> 0.05) in
fish from Masinga and Malindi.
Table 4.1 shows the mean and standard deviation of the
pesticide residue levels found in four species of fish from the five
sampling sites.
4.2.2 Pesticide residue levels in estuarine fish from Malindi
Sixty seven samples were analysed from this site and 71.6%
had detectable levels of one or more of the 8 organochlorine
pesticide residues detected. Tables 4.2 to 4.5 show the mean,
standard deviation and range of residue levels of the DDT, HCH
and cyclodiene groups of pesticides detected in the samples.

Table 4.1 Mean and standard deviation (SD) of pesticideresidue levels in four species of fish obtained from the five areas of the study.
Pesticide residue (mg/kg)
•Samples p,p' DDE p,p' DDD o,p' DDD o,p' DDT p,p' DDT sum DDT a-HCH P-HCH Lindane Heptachlor
Fishspecies
total positive Mean±SD(Range)
MeaniSD(Range)
MeaniSD(Range)
MeaniSD(Range)
MeaniSD(Range)
MeaniSD(Range)
MeaniSD(Range)
MeaniSD(Range)
MeaniSD(Range)
MeaniSD(Range)
Shark 31 24 0.39710.277(0.053-1.257)
0.04610.018(0.026-0.078)
0.039* 0.07110.041(0.031-0.133)
0.28110.574(0.011-2.674)
0.70210.646(0.082-3.148)
0.003* 0.07510.022(0.042-0.095)
Catfish 90 19 0.12410.071(0.027-0.294)
0.039* 0.045* 0.06510.037(0.036-0.108)
0.14510.091(0.031-0.417)
0.10410.026(0.009-0.29)
0.025* 0.00910.003(0.004-0.013)
0.033**(0.024-0.042)
Breams 7 6 0.154+0.157(0.028-0.422)
0.127**(0.108-0.146)
0.21310.2170.031-0.614)
0.158*
Commoncarps
19 9 0.0310.02(0.015-0.054)
0.23310.34(0.085-1.125)
0.23410.358(0.085-1.185)
0.15210.086(0.033-0.295)
Residue levels a*e given on wet weight basis Mean was calculated for positive samples ‘Detected in only one sample “ Detected in two samples (-) Below the detectable limit
-t/£

- 5 5 -
DDT group
Five residues of this group of pesticides were detected in the
fish samples analysed.
p,p' DDE : The residue was detected in 73% of the samples and
mainly occurred in the liver and egg samples. Only two fillet
samples from a female shark and female soles showed detectable
levels of p,p' DDE. Sharks had the highest mean level of p,p' DDE
(0.397mg/kg) followed by breams (0.154mg/kg) and catfish
(0.117mg/kg). The only liver sample from Monodactylus species
contained 0.703mg/kg of p,p' DDE. The highest level of the residue
recorded was 1.27mg/kg in a liver sample from a male shark.
Sharks had significantly higher mean p,p' DDE level than catfish
and breams (p=0.05). However, there was no significant difference
in the mean levels of the residue in breams and catfish (p=0.3).
p,p' DDD : The residue occurred at low levels and mainly in the
liver of sharks. The highest level recorded was 0.078mg/kg in the
liver of a female shark (Appendix 3).
p,p' DDT : The compound was detected in 39% of the samples, from
Malindi and occurred mainly in the liver of sharks. No residues of
the chemical were detected in egg samples. The highest level
recorded was 2.674mg/kg in a liver sample from a female shark
(Appendix 3).
o,p' DDT : The compound was detected at low levels in 16% of the
samples and only occurred in liver samples.

- 56 -
o,p' DDD : This o,p' DDT metabolite was only detected in one liver
sample of a male shark. It occurred at a concentration of
0.039mg/kg.
Sum DDT : Sharks had the highest mean level (0.702 mg/kg) of
sum DDT. The mean total DDT levels in catfish and breams were
0.145 and 0.213mg/kg respectively. There was a significant
difference (p=0.02) between the mean sum DDT levels in sharks,
breams and catfish. The difference between the means of sum DDT
in catfish and breams was, however, not significant (p= 0.07). The
highest sum DDT level recorded was 3.148mg/kg in a liver sample
from a female shark. The only liver sample from a fish of
Monodactylus species had a sum DDT level of 1.077mg/kg.
H C H g ro u p :
Low levels of a- and (5- HCH were detected in liver samples
only, a- HCH occurred in only 3% and p- HCH in 10% of the
samples (Table 4.5). The highest recorded levels of these residues
were 0.29 and 0.158mg/kg for a- and p- HCH respectively.
C y clo d ie n e g r o u p :
Heptachlor was the only compound detected in this group of
pesticides. The residue was detected in low levels (0.024 and
0.042mg/kg) in a liver and eggs sample from a catfish (Table 4.5).
This represented only 1% of the samples an
The residue levels for individual shown on
appendices 2- 6.

Table 4.2 Mean and standard deviation (SD) of residue levels of DDT compounds in sharks from Malindi
Pesticide residue (mg/kg)
• p,p' DDE p,p’ DDD o,p' DDT o,p' DDD p,p' DDT Sum DDT
spedes/sex/organ
No. of samples
mean±SDrange
meaniSDrange
mean* SD range
meaniSDrange
meaniSDrange
meaniSDrange
Male Sharks Liver 13 0.522±0.375
0.118-1.257(ID
0.044*0.0180.031-0.065(3)
0.056*0.0390.031-0.124(5)
0.039
(1)
0.154*0.1140.011-0.331(10)
0522*0.3750.118-1.257
Fillet 13 - - - - - -
Female Sharks Liver 18 0.395±0.193
0.128-0.668(12)
0.047+0.020.026-0.078(5)
0.089*0.0430.031-0.133(4)
- 0.411*0.8040.057-2.674(10)
0.821*0.8350.146-3.148
Fillet 18 0.074(1)
- - - - 0.082
Residue levels are given on wet weight basis Figures in parentheses represent the number of positive samples for each residueMean was calculated for the positive samples (-) Below the detectable limit

r
Table 4.3 Mean and standard deviation (SD) of residue levels of DDT compounds in catfish and breams from Malindi
Pesticide residue (mg/kg)
pp' DDE pp’ DDD op DDT op' DDD pp' DDT Sum DDT
spedes/sex/ No. of mean±SD meanlSD meant SD meanlSD meanlSD mean! SDorgan samples range range range range range range
Male CatfishLiver 2 0.119 (1) - - - - 0.132Fillet 2 - 0.036 (1) 0.036
Female CatfishLiver 18 0.09±0.075
0.069-0.294(15)
0.039
(1)
0.045
(1)
0.108100.108(2)
0.14110.1110.03-0.417
Fillet 18 _ _ - -
Eggs 16 0.141±0.0690.069-0.294(16)
-0.15610.0770.076-0.326
Male BreamsLiver 5 0.17910.162
0.028-0.422(5)
0.12710.0270.108-0.146(2)
0.2510.2210.031-0.614
Fillet 5 - - - * " ~
Female BreamsLiver 2 0.028
(1)- - 0.031
Fillet 2 - - - - - -Eggs 2 - ‘ _ *
Residue levels are given on wet weight basis Figures in parentheses represent the number of positive samples for each residue Mean was calculated for the positive samples (-) Below the detectable limit

Table 4.4 Mean and standard deviation (SD) of residue levels of DDT compounds in Malindi herrings, soles and Monodactylus spp from Malindi
Pesticide residue (mg/kg)
pp’ DDE pp' DDD op DDT op' DDD pp' DDT Sum DDT
spedes/sex/ No. of mean±SD mean±SD meant SD meantSD meantSD meant SDorgan samples range range range range range range
Male Malindi Herrings
Fillet 6 - - - - - -
Female Malindi Herrings
Fillet 1 _ . _ _ - -
Female SolesFillet 1 0.011 - - - - 0.012
(1)
Monodactylus sppLiver 1 0.703 0.039 0.056 0.191 1.077
(1) (1) (1) (1)
Residue levels are given on wet weight basis Figures in parentheses represent the number of positive samples for each residueMean was calculated for the positive samples (-) Below the detectable limit

residue levels of a-HCH, (3-HCH and Heptachlor in fish from Malindi.
Table 4.5 Mean and standard deviation (SD) of pesticide
Pesticide residue (mg/kg)
a-HCH P-HCH Heptachlor
Spedes/sex/organ
No. of samples Mean ± SD Range
Mean ± SD Range
Mean±SDRange
Male SharksLiver 13 0.075±0.018
0.062-0.088(2)
Fillet 13 * •
Female SharksLiver 18 0.003
(1)
0.075±0.0290.042-0.095(3)
Fillet 18 ** “
Female CatfishLiver 18 0.29
(1)0.025(1)
0.024(1)
Eggs 16 " 0.042(1)
Fillet 18 - -
Male BreamsLiver 5 “ 0.158
(1)~
Fillet 5 ~ ~
Residue levels are given on wet weight basis
Mean was calculated for positive samples
Figures in parentheses represent the number of positive samples for each residue (-) Below the detectable limit

-61 -
4.2.3 Pesticide residue levels in fresh water fish from Masinga Dam
A total of 38 fish samples were analysed from the dam and
36.8% of the samples had detectable levels of one or more of the
four organochlorine pesticide residues found in fish from the area.
Table 4.6 shows the mean and standard deviation of residue
levels of the pesticides detected.
DDT group:
Only p,p' DDT and p,p' DDE were detected in the fish samples
from Masinga Dam.
p,p' DDT : The residue occurred in 26% of the samples analysed
and was mainly detected in the fillet (muscle) of common carps.
The mean residue levels for the three species of fish ranged from
0.052 to 0.223mg/kg. Liver samples from common carps were not
obtained as the organ had putrified by the time the fish were
eviscerated. The mean residue level of p,p’ DDT in fillet of
common carp was 0.223mg/kg and the highest level was
1.125mg/kg. A liver and fillet sample from the same catfish had
0.052mg/kg of p,p’ DDT each.
p,p' DDE : Low p,p’ DDE levels were detected in 18% of the samples
and the residue occurred mainly in the liver of catfish and .fillet of
common carps. The mean levels of the residue ranged from 0.03 to
0.138mg/kg. The highest residue level recorded was 0.22mg/kg.
Only one catfish fillet sample showed detectable levels (0.102mg/kg)
of p,p' DDE. The residue also occurred in the only sample of eggs
from tilapia.
Sum DDT : Common carps had mean sum DDT level of
0.234mg/kg while catfish had 0.138mg/kg. The difference between

- 6 2 -
the two mean levels was significant (p= 0.018). The highest sum
DDT level (1.185mg/kg) was recorded in a fillet sample from a
common carp.
HCH group :
Lindane (y- HCH) : This was the most frequently occurring residue
in fish samples from Masinga Dam and the mean levels ranged
from 0.003 to 0.295mg/kg. It was detected in 34% of the samples
analysed. The mean residue level in common carps (0.14mg/kg)
was significantly higher than that in catfish (O.Olmg/kg) (p= 0.008).
The highest level of lindane (0.295mg/kg) was detected in fillet
from a common carp.
a- HCH : Low levels of the residue, ranging from 0.009 to
0.021mg/kg, were detected in a liver and fillet sample from the
same catfish and the only available egg sample from a tilapia.
Appendices 7 and 8 show the residue levels for individual
samples from Masinga Dam.
4 .2 .4 P esticid e re sid u e le v e ls in fre sh w a te r fish from G a rse n , T a ra sa a
an d L ak e N a iv a sh a
Garsen : Out of the 65 samples analysed, only one liver sample from
a lungfish showed detectable levels of pesticide residues. This
contained 0.033mg/kg p,p' DDE equivalent to 0.037mg/kg sum
DDT.
Tarasaa : A total of 65 samples were analysed but none showed
detectable residue levels of organochlorine pesticides.
- 6 3 -
Lake Naivasha : Of the 40 fish samples analysed, no individual
sample had detectable levels of pesticide residues. A composite fillet
sample of 10 fish, however, had a- HCH at a concentration of
0.014mg/kg.
4 .2 .5 P o ly ch lo rin a te d b ip h e n y ls (P C B 's) an d h e x a ch lo ro b e n z e n e
(H C B )
The method used could detect these chemicals but none was
found in the samples analysed.
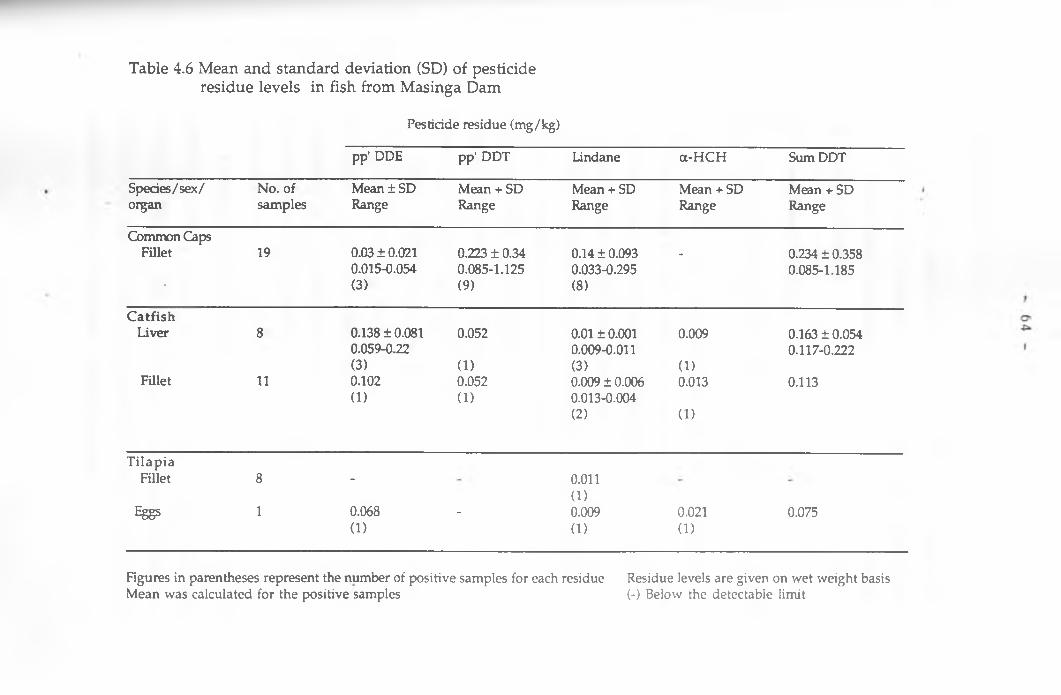
Table 4.6 Mean and standard deviation (SD) of pesticide residue levels in fish from Masinga Dam
Pesticide residue (mg/kg)
pp' DDE pp' DDT Lindane a-HCH Sum DDT
Species/sex/ No. of Mean ± SD Mean + SD Mean + SD Mean + SD Mean + SDorgan samples Range Range Range Range Range
Common CapsFillet 19 0.03 ± 0.021 0.223 ± 0.34 0.14 ± 0.093 - 0.234 ± 0.358
0.015-0.054 0.085-1.125 0.033-0.295 0.085-1.185' * (3) (9) (8)
CatfishLiver 8 0.138 ± 0.081 0.052 0.01 ±0.001 0.009 0.163 ± 0.054
0.059-0.22 0.009-0.011 0.117-0.222(3) (1) (3) (1)
Fillet 11 0.102 0.052 0.009 ± 0.006 0.013 0.113(1) (1) 0.013-0.004
(2) (1)
TilapiaFillet 8 _ 0.011
Eggs 1 0.068 _
(1)0.009 0.021 0.075
(1) (1) (1)
Figures in parentheses represent the number of positive samples for each residue Residue levels are given on wet weight basis Mean was calculated for the positive samples (-) Below the detectable limit
- 6 5 -
4.3 D iscu ssio n
The results obtained showed differences in the residue levels
in fish from the five sampling sites and between the various species
of fish. There were also variations in the frequency of occurrence ol
the different residues.
4.3 .1 L o catio n al d ifferen ces
Fish from Masinga Dam and Malindi evidently had detectable
levels of organochlorine residues while hardly any residue was
detected in fish from Lake Naivasha and lower Tana River. The
difference could be attributed to a number of factors. Silt deposition
in Masinga Dam and the estuary of Athi River could lead to build
up of pesticide levels in fish food (algae, planktons and detritus)
resulting in increased intake of the chemicals by fish. At Garsen and
Tarasaa, siltation occurs at a very low rale as the water is always in
continuous flow. Organochlorine pesticides in water are adsorbed
by particulate matter and sedimented to the bottom of such water
bodies as dams and lakes (Murty, 1986).
Heavy fishing at Garsen and Tarasaa may also be a
contributory factor as fish are removed from the water before they
accumulate a lot of the residues in the tissues. Low levels of
organochlorine pesticide residues were reported in fish from Lake
Naivasha (Lincer et al, 1981). The low levels were attributed to low
usage of the chemicals in the catchment areas of the lake.
Lindane was only detected in fish from Masinga Dam. The
pesticide could possibly be in use in the recently established
Masinga Irrigation Scheme which drains its water into the Dam.
Attempts to find out, from the Tana Development Authority, the
pesticides used in the scheme were unsuccessful.

4.3.2 Interspecies differences
Sum DDT and p,p' DDE residues exhibited bioamplification.
Sharks, the highest species in the food chain, had the highest mean
levels of the two residues (0.397 and 0.702 mg/kg respectively) and
the widest range of residues as well (Table 4.1). The migratory
behaviour of this species, however, makes it difficult to say whether
all the residues could have been obtained from the same location.
Bottom feeding fish (breams, common carps and
m onodactylus had higher levels of sum DDT than the
intermediate carnivore (catfish). The bottom feeders are likely to
have higher residue deposits than the catfish as they are liable to
consume high residue amounts in their diet of algae, planktons and
detritus. Algae and planktons have been shown to accumulate
organochlorine pesticides many fold (Holden, 1962) while detritus
adsorbs the pesticides.
Frequent occurrence of lindane, p,p' DDE and p,p' DDT jn the
fillet of common carps and rarely in that of the other species vvas
consistent with the higher percentage of fat observed in the fillet of
this species. The mean fat percentage for the species was 2.6.
Appendix 10 shows the percentage of fat in the fish samples
positive for organochlorine pesticide residues. Common carp fillet
mainly had p,p' DDT instead of p,p' DDE and other DDT
metabolites. This indicated a recent exposure of the fish to p,p' DDT
or a very slow DDT breakdown rate in the species. Some fish species
are known to eliminate DDT at a slower rate than others. Sk aare et
al (1985) found that the cod and haddock eliminated sum DDT ff°m
their liver at a slower rate than did the sea scorpion and e a t^ s
species of fish.

- 6 7 -
4.3.3 Toxicological significance of the results
In order to assess the toxicological significance of the results
with regard to human health, the residue levels were evaluated
against the maximum residue levels (MRL) in fish, set by the
National Food Administration (NFA) of Sweden and the
FAO/WHO acceptable daily intake (ADI) for the compounds in
carcass meat. Two fillet samples of common carp from Masinga
Dam had residues of lindane above the NFA maximum residue
level (Appendix 7).
Table 4.7 shows the MRL and ADI for the pesticide residues
detected. *
Table 4.7 MRL and ADI of sum DDT*, a- HCH, (I- HCH,
lindane (y- HCH) and heptachlor
Compound MRL (mg/kg) ADI (mg/kg)
Sum (total) DDT 5 0.02
a-HCH 0.2 not available
P- HCH 0.2 not available
Lindane 0.2 0.01
Heptachlor not availablei
0.0005
*Sum DDT was calculated as p,p' DDT + o,p' DDT + l.ll(p,p' DDD +
p,p' DDE). 1.11 is a correcting factor for lower molecular weights of
the DDT metabolites (Skaare et a l, 1985).
- 6 8 -
The residues considered for ADI evaluation were those that
occurred in the fillet since it is the edible part of the fish analysed.
An adult man weighing 60kg and consuming 1kg of fish per day
was chosen as the yardstick. The mean sum DDT level in common
carps and catfish from Masinga was below the ADI of 0.02mg/kg
body weight but the highest level (1.185mg/kg) in common carps
was just equal to the ADI. It is nonetheless, unlikely that fish is
consumed at this rate in the country and the chances of someone
consuming sum DDT in excess of the ADI are thus low. Levels of
lindane and heptachlor were below the ADI. The concentration of
pesticide residues in cooked fish may also be lower than that in the
raw fish. De Vos et al (1972) and Ritchey el al (1972) showed that
cooking reduced the concentration of p,p' DDT, lindane and
heptachlor epoxide in poultry tissue.
The residue levels found are low and therefore do not pose an
ecological, environmental or health hazard at present. Since the
country is in the process of phasing out the use of persistent
organochlorine pesticides, the residue levels in the aquatic systems
are expected to decline with time.
In comparison with the high organochlorine pesticide residue
levels in the United States and Britain that resulted in decline in
populations of fish and fish- eating birds (McEwen and Stephenson,
1979), the levels in the present study may not have detrimental
effects on the organisms.
4 .3 .4 C o m p a riso n o f th e re su lts w ith o th e rs in K en y a
Few workers have investigated organochlorine residues in
Kenyan fish from other aquatic systems and generally reported very
low levels of the compounds (Chapter 2, p23 to 25). DDT and its

- 6 9 -
metabolites especially p,p' DDE composed the largest proportion of
organochlorine residues in the fish samples analysed. This is
consistent with findings reported by other workers (Skaare et a\,
1985; Murty, 1986). Aldrin and dieldrin which were reported by
most of the other investigators were not detected in the present
study. However, heptachlor was reported in Kenyan fish for the
first time.
The residue levels are generally higher than those reported in
the other studies (Chapter 2, p23 to 25) but compare fairly well with
the findings of Mitema and Gitau (1990). In the present study, the
mean sum DDT level in shark was 0.702mg/kg and the highest
value was 3.148mg/kg. Mitema and Gitau (1990) reported mean
sum DDT of 0.45mg/kg and the highest level recorded was
4.51mg/kg in fresh nile perch fat and fillet from Take Victoria. The
nile perch, like the shark, is carnivorous and is at the top of the
food chain in Lake Victoria. Residue levels of the HCH group
ranged from 0.003 to 0.295mg/kg while Mitema and Gitau reported
a range of 0.001 to O.llmg/kg in the nile perch.
From the results obtained in the present study, it is difficult to
determine whether there has been an increase in the pesticide
residues in the fish since the previous studies reported were
concentrated on Lake Victoria and Rift Valley lakes.
4 .3 .5 C o m p a riso n o f re su lts w ith o th e rs re p o rte d from d iffe re n t
p a rts o f th e w o rld
The results compare well with those reported from other
developing countries but the levels are lower than those reported
from the industrialized countries such as Norway and the United
States of America.

- 7 0 -
The range of sum DDT was 0.012 lo 3.148mg/kg on wet weight
basis in the present study. In Jordan, in 1971, the sum DDT in three
species of fish ranged from 0.37 to 3.34mg/kg (Murty, 1986). El
Zorgani et al (1979) and Zorgani (1980) reported sum DDT of 0.0022
to 0.184mg/kg in Lake Nubia fish and 0.3 to 2.9mg/kg in different
species of fish from other areas in the Sudan. Sum DDT values of
0.07 to 0.38mg/kg were reported in three species of fish from Lake
Tanganyika (Deelstra et al, 1976). While dieldrin, aldrin and endrin
were reported in some of the studies, none was detected in the
present investigation. This could be due to differences in use of the
chemicals in different countries. Sum DDT levels ranging from
undetectable to 92mg/kg and 90 to 135mg/kg on wet weight basis
have been reported in fish from the United States of America and
Norway respectively (Murty, 1986). The levels of lindane and
heptachlor reported in the United States were also higher than
those reported in the present study.
The difference in residue levels between industrialized and
developing countries is attributed to intensive use of the pesticides
in the industrialized countries. Intensive farming and mechanised
pesticide application is practised in the industrialized countries,
while it is rarely done in developing ones. For instance, in the
United States, the period after the Second World War was marked
by heavy use of organochlorines through aerial application using
aircrafts (McEwen and Stephenson, 1979).
The results obtained from the present study show that, like in
other countries, organochlorine pesticides used in agriculture and
public health programmes in Kenya have resulted in
contamination of the aquatic systems.
- 71 -
In view of the above findings, attempts should be made to use
less persistent pesticides for public health programmes, agricultural
and other purposes in order to minimize environmental
contamination.

- 7 2 -
CHAPTER FIVE
Conclusions
The following conclusions were made from the present study.
1. The method used in the study was found suitable for analysis of
organochlorine pesticide residues in fish since the recoveries (71)-
102%) obtained after spiking were within the acceptable range for
pesticide residue analysis.
2. There was variation in the pesticide residue levels in the different
species of fish. Sharks from Malindi had the highest mean levels
of sum DDT and the widest range of pesticide residues.
3. Nine organochlorine pesticide residues were detected in 62 (22.5%)
of the 275 fish samples analyzed.
4. The aquatic systems of the Tana and Athi Rivers are contaminated
with organochlorine residues but the levels do not pose a health
or environmental hazard at present.
5. DDT and its metabolites, especially p,p' DDE were the major
organochlorine residues found in the fish studied and sum DDT
levels were positively correlated to weight of the fish.
6. Organochlorine pesticide residues occurred more frequently in the
liver and eggs of the species of fish studied. Fish from Malindi is
not a major source of organochlorine pesticides in humans since
the liver and eggs of the fish are not normally consumed.

7. Common carps from Masinga Dam may contribute to the dietary
intake of organochlorine pesticides by humans since the residues
occurred in the fillet of the species.
8. Fish is a suitable indicator for biological monitoring of pollution
in aquatic systems contaminated with organochlorine pesticides .
REFERENCES
ADDISON, R. F. and WILLIS, D. E. (1978). The metabolism by
rainbow trout (Salmo gairdneri) of p,p' 14C-DDT and
some of its possible degradation products labeled
with 14C. Toxicol. Appl. Pharmacol., 4 3 , 303.
ANANDA SWAMP P., MOHANA RAO, D. and MURTY, A. S.
(1981). Toxicity of endosulfan to the fresh wafer
fish CirrhlniLS m rigala . Bull. Environ. Contain.
Toxicol, 27, 850.
ANDERSON, J. M. and PETERSON, M. R. (1969.). DDT:
sublethal effects on brook trout nervous system.
Science 1 6 4 , 440.
ANDERSON, R. L. and DE FOE, D. L. (1980). Toxicity and
bioaccumulation of endrin and methoxyclor. in
aquatic invertebrates and fish. Environ. Pollut. 2 2 ,
1 11 .
ANDERSSON OSTEN, CARL- ERIC LINDER and REGGIE VAZ
(1984). Levels of organochlorine pesticides and
certain other organohalogen compounds in fishery
products in Sweden, 1976- 1982. Var Foda, 36,
1984, 5.
BJERK, J . E. (1973). Residues of DDT in cod from two
Norwegian Qords. Bull. Environ. Contain. Toxicol., 9,

- 7 5 -
BJERK. J. E. and SUNDBY, R (1970). Residues of
organochlorine insecticides and PCBs in terrestrial
and aquatic organisms. Norwegian part of OECD
programme 1967/68. Nosk Vet. 1'idskr., 8 2 , 241.
BOGAN. J. A. and NEWTON I. (1983). The effects of
organochlorine compounds on British birds of prey.
Veterinary Research Communications. 7. 119.
BREVIK, E. M.; BJERK, J. E. and KVESETF1, N. J. (1978).
Organoehlorines in codfish from harbours along I lie
Norwegian coast. Bull. Environ. Contain. Toxicol 20.
715.
BUHLER, D. R.; RUSMUSSON. M. E. and SHANKS W. E.
(1969). Chronic oral DDT toxicity in juvenile coho
and chinook salmon. Toxicol. Appl. Pharnacol. 1 4 ,
535.
BUTLER, P. A. (1966). Pesticides in the marine environment.
J. Appl. Ecol., 3 , 253.
CHAU, S. Y. ALFRED and B. K. AFGHAN (1982). Analysis of
pesticides in water, Volume 1, CRC Press, Florida
p 2, 3 and 12
CHAU, S. Y. ALFRED and B. K. AFGHAN (1982). Analysis of
pesticides in water, Volume 2, CRC Press, Florida
p 4- 8
CHRISTOPHER C., KOEING, ROBERT, J. LIVINGSTONE and
CLAUDE R. CRIPE (1976). Blue crab mortality:
- 7 6 -
interaction of temperature and DDT. Bull. Env.
contain. Toxicol. 4, 119.
CRAWFORD. R. B. and GUARINO, A. M. (1976). Effects of DDT
In F u n d u l u s : Studies on toxicity, fate and
reproduction. Arch. Environ. Contain. Toxicol. 4 ,
334.
CROCKETIT, A. B.; WIERSMA, G. B.; TAI, H. and MITCHELL W.
(1975) . Pesticide and mercury residues in
commercially grown catfish. Pestic. Monit. J . 8. 235.
DE VOS. R. H., BOWMAN. J. and ENGEL. A. B. (1972).
Residues of organochlorine pesticides in broilers
fed feed fortified with known levels of these
compounds. Pest. Sci., 3 , 421
DEELSTRA, H; J. L. POWER and C. T. KENNER
(1976) .Chlorinated hydrocarbon pesticide residues
in fish from Lake Tanganyika. Bull. Environ. Contain.
Toxicol, 15 , 689.
DVORCHICK, B. H. and MAREN, T. H. (1972). The fate of p.p'
DDT (2, 2-Bis (p-chlorophenyl) 1, 1, 1,
Trichloroethene) in the dogfish, Squalus acanthias.
Comp. Biochem. Physiol. 4 2 , 205.
EL ZORGAN, G. A., ABDULLA, A. M. and ALI, M. E. T. (1979).
Residues of organochlorine insecticides in fishes in
Lake Nubia. Bull. Environ. Contain. Toxicol, 22, 44.

- 7 7 -
EPA (1985). Status of cancelled pesticides. Vet. Hum.
Toxicol. 2 7 , 7 .
FAO/WHO CODEX ALIMENTARIUS COMMISSION (1986).
Codex maximum limits fo r pesticide residues, 2nd
Ed., p 21-iv, 33-iv, 43-iv and 48-iv.
FEROZ, M. and KHAN. N. A. Q. (1979). Metabolism of 14C
heptachlor in goldfish (Carassius auratus). Arch.
Environ. Contam. Toxicol. 8 , 519.
FRANK G. LAWRENCE, RODNEY M. JACKSON. JOHN E.COOPER and M. C. FRENCH (1977). A survey of
chlorinated hydrocarbon residues in Kenyan birds of
prey. E. Afri. Wildl. J ., 15, 295.
FREDREEN, F.J.H.; SALIA J. G. and ROYER L. M. (1971).
Residues of DDT. DDE and DDD in fish in the
Saskatchewan River after using DDT as a blackfly
larvicide for twenty years, J. Fish. Res. Board Can.
2 8 , 105.
GODSIL, P. J. and JOHNSON, W. C. (1968). Pesticide
monitoring of the aquatic biota at the Lake Tule
National Wildlife Refuge. Pestic. Monit, J . 1, 21.
GRANT, F. BLAKE (1978). Endrin toxicity and distribution in
fresh water: A review. Bull. Environ. Contam.
Toxicol., 15, 283.

- 7 8 -
GREER, G. L. and PAIM U (1968). Degradation of DDT In
Atlantic salmon (Salmo salar). J . Fish. Res. Board
Can. 25, 2321.
GREICHUS, Y. A., GREICHUS, A.. AMMAN. B. D.. CALL. D. J..
HAMMAN, D. C. D. and POTT, R. M. (1977).
Insecticides, PCBs and metals in African lake
ecosystems- I. Harbeestpoort Dam, Transvaal and
Voelvi Dam, Cape Province, Republic of South Africa.
Arch. Environ. Contam. Toxicol, 6. 371.
GREICHUS, Y. A.; GREICHUS. A.; AMMAN, B. I), and
HOPCRAFT, A. (1978). Insecticides, polychlorinated
biphenyls and metals in African lake ecosystems.
Lake Nakuru, Kenya. Bull. Environ. Contam Toxicol,
19, 454.
HECKMAN, C. W, (1981). Longterm effects of the intensive
pesticide application on the aquatic community in
orchard drainage ditches near Hamburg. Germany.
Arch. Environ, contam. Toxicol. 10 , 393.
HESSELBERG, R. J and Johnson. J. L. (1972). Column
extraction of pesticides from fish, fish food and
mud. Bull. Environ. Contam. Toxicol, 7, 115.
HOLDEN, A. V. (1962). A study of the absorption of R e
labeled DDT from water by fish. Ann. Appl. Biol, 50.
467, 1962.
- 7 9 -
HOLDEN, A. V. (1981). Organchlorines- an overview. Mar.
Pollut. Bull., 12. 110.
IWIE, G. W; GIBSON. J. R.; BRYANT; H. E. BERNETT. J. J. R.
and DOROUGH, H. W. (1974.). Accumlation.
distribution and excretion of mirex 14C in animals
exposed for long periods to the insecticide in diet.
J. Agric. Food Chem. 2 2 , 646.
JACKSON, G. A. (1976). Biological half-life of endrin in
channel catfish tissues. Bull. Environ. Contain.
Toxicol. 16 , 505.
JANICE, E. CHAMBERS and JAMES D. YARBOROUGH (1976).
Xenobiotic biotransformation systems in fishes.
Comp. Biochem. Physiol. 5 5 c , 77, .
JARVINER, A. W. and TYO, R. M. (1978). Toxicity to fathead
minnows of endrin in food and water. Arch. Environ,
contam. Toxicol, 7 , 409.
KANJA, L. W. (1989). Organochlorine pesticides in Kenyan
mother's milk: Levels and sources. Phd. thesis.
University o f Nairobi, p 173 and 174.
KATSURA SUGUIRA, TOHORU WASHINO, MITSUO HATORI,
EIJI SATO and MIKI GOTO (1979). Accumulation of
organochlorine pesticides in fishes: Difference of
accumulation factors by fishes. Chemosphere, 8,
3 5 9 .

- 8 0 -
KIMANI, V. W. (1990). Officer, Pest Control Products Board.
Ministry of Agriculture, Government of Kenya.
Personal communication.
KOEMAN, J. H., PENNINGS, J. H.. DE GOEIJ. J. J. M., TJIOE
P. S.. OLINDO, P. M. and HOPCRAFT. J. (1972). A
preliminary survey of the possible contamination of
Lake Nakuru in Kenya with some metals and
chlorinated hydrocarbon pesticides. J. Appl. Ecol. 9,
411.
KOENIG C. CHRISTOPHER. ROBERT G. LIVINGSTONE and
CLAUDE R. CRIPE (1976). Blue crab mortality:
Interaction of temperature and DDT residues. Bull.
Environ. Contam. Toxicol. 4, 119.
KVESETH, N. J. (1981). Residues of DDT in a contaminated
Norwegian lake ecosystem. Bull. Environ. Contain.
Toxicol, 27, 397.
LINCER.J. L.; ZALKIND, D.; BROWN. L. H. and UPCRAFT, J,
(1981). Organochlorine residues in Kenyan Rift
Valley lakes. J. Appl. Ecol. 18. 157.
LOCKHART, W. L.; METNER, D. A. and SOLOMON J. (1977).
Methoxychlor residue studies in caged and wild fish
from the Athabasca River, Alberta, following a single
application of black fly larvicide. J. Fish. Res. Board
can. 3 4 , 626.

-81 -
MAITHO, T. E. (1978). Pesticide residues In animal products
in Kenya: Organochlorlne and organophosphorous
insecticides in milk and body fat. MSc. thesis.
University o f Nairobi, p 134.
MASON. C. F., FORD. T. C. and LAST N. I. (1986).
Organochlorlne residues in British otters. Bull.
Environ. Contam. Toxicol.,3 6 , 656.
MASON. J. W. and ROWE. D. R. (1976). The accumulation and
loss of dieldrin and endrin in the eastern oyster.
Bull. Env. Contam. Toxicol, 4 , 349-360.
MATSUMURA, F. (1975). Toxicology of insecticides. Plenum
Press, London, p 48.
McEWEN, F. L. and STEPHENSON, G. R. (1979). The use and
significance of pesticides in the environment. John
Wiley and Sons, New York, p 2.3, 20-30
MITEMA, E. S. and F. K. GITAU (1990). Organochlorine
residues in fish from Lake Victoria in Kenya. A fr.'J.
Ecol. 2 8 . 234-239.
MOORE, R.; TORO, E.; STANTON, M. and KHAN, M.A.Q.
(1977). Absorption and elimination of 14C alpha and
gamma chlordane by a fresh water alga, daphnid and
goldfish. Arch. Environ. Contam. Toxicol., 6, 411.
MUIRHEAD-THOMSON, R. C. (1971). Pesticides and
freshw ater fauna. Academic Press, London, p 18-63.
-82-
MURPHY, P. G. and MURPHY, J. V. (1971). Correlation
between respiration and direct uptake of DDT in
the mosquito fish (G am busia affinis). Bull, environ.
Contam . Toxicol. 6, 581.
MURTY, A. S. (1986). Toxicity o f p esticid es to f is h Vol. II,
CRC Press, New York, p41-47.
NEIDERMYER, W. J. and HICKEY, J. J. (1976). Chronology of
organochlorine compounds in Lake Michigan fish. 1929-
1966, Pestic. Monit. ]. 10, 92.
NOREN, K. and WESTOO, G. (1968). Determination of some
chlorinated pesticides in vegetable oils, margarine,
butter, milk, eggs and fish by gas liquid
chromatography and thin layer chromatography.
Acta Chem . S ca n d ., 2 2 , 2289.
PEST CONTROL PRODUCTS BOARD RECORDS (1986).
Pesticides banned and restricted for use in Kenya.
RITCHEY, S. J.. YOUNG, R. W. and ESSARY, E. O. (9172).
Effects of heating and cooking method on
chlorinated hydrocarbon pesticide residues In
chicken tissues. J. Agric. Food C hem ., 2 0 , 291.
ROSALES, M. T. L. and ESCALONA, R. L. (1983).
Organochlorine residues in organisms of two
different lagoons of Northwest Mexico. B u l l .
Environ. Contam Toxicol, 3 0 , 456.

- 8 3 -
SCHIMMEL, S. C., PATRICK, J. M. Jr. and FORESTER, J.
(1976). Heptachlor: Uptake, retention and
metabolism by spot (Lepom is X a n th u ru s). J . Toxicol
Env. Health. 2, 169.
SCHIMMEL, S. C.; PATRICK, J. M. Jr. and FORESTER J.
(1976). Heptachlor: Toxicity to and uptake by
several estuarine organisms. J. Toxicol. Environ.
H ealth, 1, 955.
SCHMITT, C. J., LUDKE, J. L. and WALSH, D. F. (1981).
Organochlorine residues in fish: National pesticide
monitoring programme, 1970-74. Pestic Monii. J .
14. 136.
SIEBER S. M. and R. H. ADAMSON (1976). The metabolism of
xenobiotics by fish; drug metabolism: from microbe
to Man. P roceedings o f the international sym posium
233-235 Ed. Parke, D. V.
SKAARE UNTNE JANNECHE, JORGEN STENERSEN. NILS
KVESETH and ANUSCHKA POLDER (1985). Time
trends of organochlorine chemical residues in seven
sedentary marine fish species from a Norwegian
fjord during the period 1972-1982. A rch . Environ.
Contam .Toxicol, 14,33.
SOMEREN VAN VERNON DONALD (1946). Report on the
effect o f aerial spraying o f DDT fo r m alaria control
on the fis h e r ie s round K isum u, Victoria N yanza,
Government Printer, Nairobi, p2-18.

- 8 4 -
SOULSBY.E. J. L. (1978). Helminths. arthroprxls and protozoa
of domesticated animals, 6th ed. pp 376- 522.
Bailllere Tindall and Cassell Ltd., London.
STERNSEN, J. and KVALVAG, J. (1972). Residues of DDT
and Its degradation products In cod liver from two
Norwegian fjords. Bull. Environ. Contain. Toxicol. 8.
120.
STETTER, J. (1977). Insecticidal chlorohydrocarbons in
Chemistry of Pesticides ed. K. H. Buchel, John Wiley
and Sons, New York, p25.
STUCKY, N. P. (1970). Pesticide residues in channel catfish
from Nebraska. Pestic Monit. J. 4 . 62.
SUGUIRA, K.; WASHINO, T.; HATTORI, M.; SATO. E. and
GATO, M. (1979). Accumulation of organochlorine
compound in fishes. Difference of accumulation
factors by fishes. Chemsphere, 7, 359.
TANGATZ, M. E., BORTHWICK. P. W., IVEY, J. M. and
KNIGHT, J. (1976). Effects of leached mirex on
experimental communities of estuarine animals.
Bull. Environ. Contam. Toxicol. 4 , 435.
VANCE and DRUMMOND (1969). Cited by Grant (1978) in
Endrin toxicity and distribution in freshwater: A
review. Bull. Environ. Contam. Toxicol., 15 , 283.

- 8 5 -
WAYNE W. DANIEL (1983). Biostatistic: A foundation fo r
analysis in the health sciences, 3rd ed., John Wiley
and Sons Inc., New York, p 224-230.
WEDEMAYER, G. (1968). Role of intestine microflora in the
degradation of DDT In lake trout (salvelinus
namaycush) and coho salmon (salmon gairdneri).
Life Science, 7 , 219.
ZITKO, V. (1971). Organochlorine pesticides in some
freshwater and marine fishes. Bull. Environ, contain.
Toxicol. 6, 464.
ZORGANI, G. A. (1976). Residues of organochlorine
insecticides in some fishes and birds in the Gezira
in Sudan. Pesticide Set., 7 , 150.
ZORGANI, G. A. El. (1980). Residues of organochlorine
pesticides in fishes in the Sudan. J. Environ. Sci.
Health, 15, 1091.
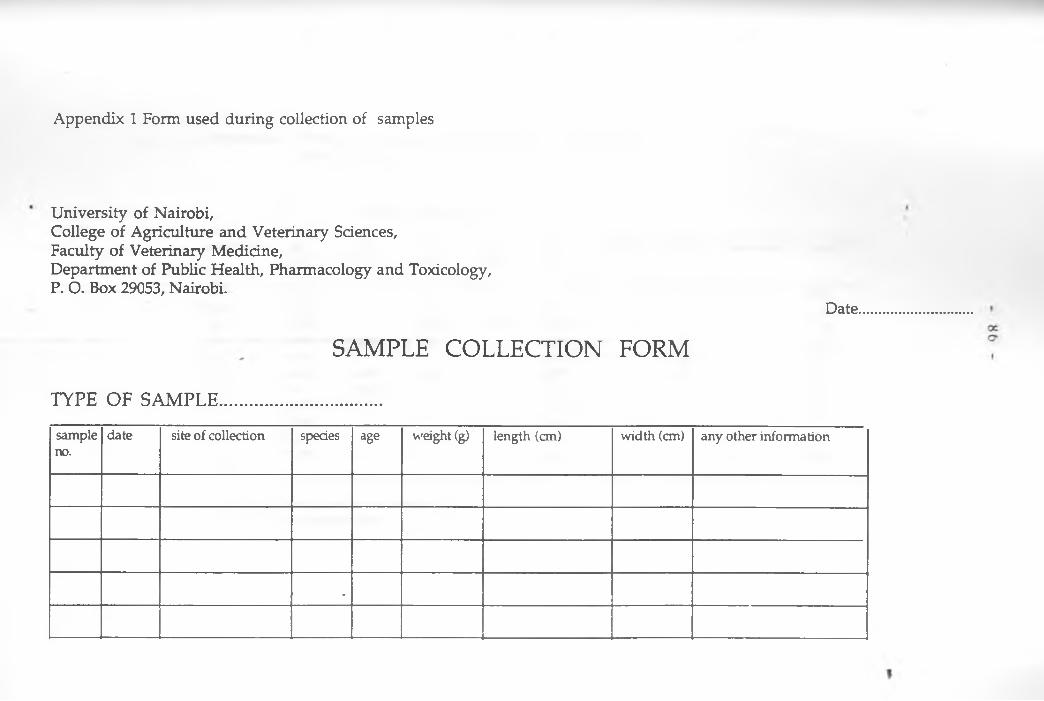
A p p en d ix 1 F o rm u sed d u rin g collection of sam ples
U n iv e rsity o f N airo b i,C ollege o f A g ricu ltu re an d V eterin ary Sciences,F a cu lty o f V eterin ary M ed icin e,D ep artm en t of Public H ealth , P h arm aco lo g y an d T oxicology ,P. O. B ox 290 5 3 , N airobi.
D ate
SAMPLE COLLECTION FORMTYPE OF SAMPLE
sampleno.
date site of collection spedes age weight (g) length (cm) width (cm) any other information
r

Appendix 2 Pesticide residue levels in livers of male sharksfrom Malindi
Residue levels (mg/kg)
sample no. p,p'DDE
p,p'DDD
o,p'DDT
o,p'DDD
p,p'DDT
a-HCH 3-HCH Heptachlor Sum DDT
L85 0.314 - - - - - - - 0349L28 1.241 - 0.124 - 0.331 - - - 1346L40 0.041 - 0.043 0.039 0.178 - - - 0.736L45 0.496 0.031 0.05 - 0.194 - - - 0.834L80 0.101 - - - 0.053 - 0.062 - 0.165L36 0.602 0.037 0.031 - 0.257 - 0.088 - 0.966L50 0.8 0.065 - - 0.297 - - - 1257L32 0.053 - - - 0.059 - - - 0.118L41 0.098 - - - 0.045 - - - 0.154L39 0.3 - 0.033 - 0.111 - - - 0.481L33 0.291 “ - - 0.011 “ - - 0334
Residue levels are given on wet weight basis (-) Below the detectable limit
f

Appendix 3 Pesticide residue levels in livers of female sharks from Malindi
Residue level (mg/kg)
Sample No. p,p' DDE p,p' DDD o,p' DDT o,p' DDD p,p' DDT a-HCH 3-HCH Heptachlor sum DDT
L48 0.281 - - - - - - - 0.312L54 0.422 0.078 - - 0.311 - - - 1.342L51 0.624 0.041 0.091 - 0.414 - - - 1.253L86 0.668 0.026 - - 0.158 - - - 0.928L48 0.257 0.035 - - 0.143 0.003 - - 0.467L30 0.195 - 0.031 - 0.097 - 0.095 - 0.348L29 0.171 - - - 0.057 - 0.042 - 0.247L83 0.590 - - - - - - - 0.655122 0.590 0.055 - - 0.085 - 0.089 - 0.146127 0.128 - - - 0.074 - - - 0.216L81 0.491 - 0.133 - 0.093 - - - 0.786L26 0.327 - 0.1 - 2.674 - * - - 3.148
Residue levels are given on wet weight basis (-) Below the detectable limit

Appendix 4 Pesticide residue levels in livers of female catfish from Malindi
Residue level (mg/kg)
Sample no. p,p'DDE
p,p’DDD
o,p'DDT
o,p’DDD
p,p’DDT
a-HCH
P-HCH
Heptachlor sum DDT
L63 0.227 - - - - — — - 0.252L70 0.184 - - - - - - - 0.204LI 0.262 - - - - — - - 0.292L6 0.078 - - - - - - - 0.087L97 0.029 - - - - — 0.025 - 0.032L87 0.194 0.039 0.045 - 0.108 - - - 0.417L99 0.027 - - - - 0.29 - - 0.030LI 2 0.079 - - - - - - 0.024 0.08L2 0.059 - - - - - - - 0.065L95 0.056 - - - - - - - 0.062L96 0.065 - - - - - - - 0.180L64 0.06 - - - - — - - 0.067L62 0.056 - - - - - - - 0.062L65 0.151 - - - - - - - 0.168L4 0.105 - - - - — - - 0.117
Residue levels are given on wet weight basis ( - ) B e lo w the d e te c ta b le lim it

Appendix 5 Pesticide residue levels in eggs of catfish from Malindi
Residue level (mg/kg)
Sample no. p,p’ DDE p,p' DDD o.p'DDT o,p' DDD p,p' DDT a-HCH (J-HCH Heptachlor sum DDT
LI 0.294 - - - - - - - 0.326L6 0.152 - - - - - - - 0.169192 0.152 - - - - - - - 0.164L97 0.076 - - - - - - - 0.084199 0.133 - - - - - - 0.042 0.149L12 0.069 - - - - - - - 0.076L95 0.083 - - - - - - - 0.092L98 0.102 - - - - - - - 0.113L96 0.205 - - - - - - - 0228L62 0.07 - - - - - - - 0.228L65 0.14 - - - - - - - 0.140L4 0217 - - - - - - - 0.239
Residue levels are given on wet weight basis (-) Below the detectable limit

Appendix 6 Pesticide residue levels in livers of male breams from Malindi
Residue level (mg/kg)
Sample no. p,p'DDE p,p'DDD o,p'DDT o,p' DDD p,p' DDT a-HCH (3-HCH Heptachlor sum DDT
L54 0.422 - - - 0.146 — - - 0.614L92 0.028 - - - - - 0.158 - 0.031L91 0.048 - - - 0.108 - - - 0.161L56 0.249 - - - - - - - 0.276L57 0.150 - - - - - - - 0.167
Residue levels are given on wet weight basis (-) Below the detectable limit
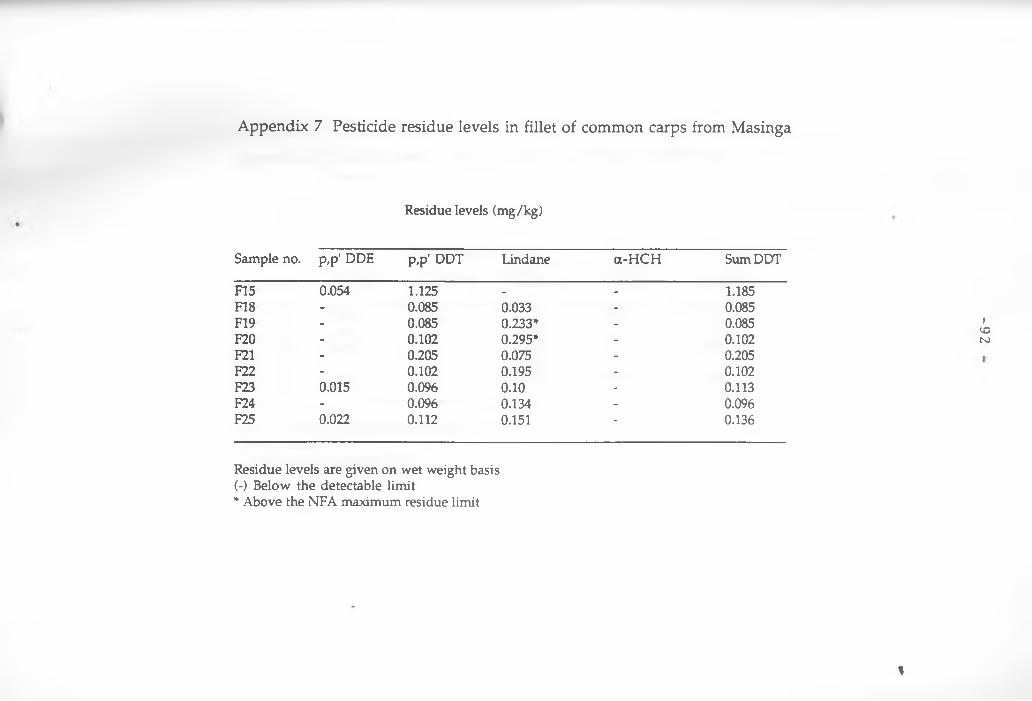
Appendix 7 Pesticide residue levels in fillet of common carps from Masinga
Residue levels (mg/kg)
Sample no. p,p' DDE p,p' DDT Lindane a-HCH Sum DDT
F15 0.054 1.125 - - 1.185F18 - 0.085 0.033 - 0.085F19 - 0.085 0.233* * - 0.085F20 - 0.102 0.295* - 0.102F21 - 0.205 0.075 - 0.205F22 - 0.102 0.195 - 0.102F23 0.015 0.096 0.10 - 0.113F24 - 0.096 0.134 - 0.096F25 0.022 0.112 0.151 - 0.136
Residue levels are given on wet weight basis (-) Below the detectable limit* Above the NFA maximum residue limit
1
-92

A p p e n d ix 8 P esticid e residue levels in liver an d fillet of catfish from M asin g a
Residue levels (mg/kg) *
Sample no. p,p’ DDE p,p' DDT Lindane a-HCH Sum DDT
27.7 0.059 0.052 0.011 0.009 0.11727.13 0.135 - 0.009 - 0.15027 2 0.220 - 0.009 - 0.22227.1 - - 0.013 - -
27.6 0.102 - 0.004 0.013 0.113
0 4
1
Residue levels are given on wet weight basis* Fillet sample(-) Below the detectable limit

-94
Appendix 9 Weight of fish, p,p' DDT and sum DDT levels in the samples
Sample No. Weight (kg) p,p' DDT (mg/kg) Sum DDT mg/kg)
148 2.45 - 0.312154 1.5 0.311 0.866151 2.0 0.414 1.253L86 0.5 0.158 0.928149 2.75 0.143 0.467150 2.8 .097 0.348L29 2.65 0.057 0.247L83 1.4 - 0.655122 1.4 0.085 0.801L27 2.85 0.74 0.216L81 2.9 0.093 0.786L26 2.55 2.674 3.148F43 2.75 - 0.082L85 1.95 - 0.349128 2.0 0331 1.346L40 1.8 0.178 0.736L45 1.75 0.194 0.834L80 1.9 0.053 0.165156 2.0 0.257 0.966150 1.75 0.297 1.257L32 2.775 0.059 0.118L41 1.7 0.045 0.154159 2.7 0.111 0.481153 2.5 0.011 0.334L63 1.25 - 0.252LTD 0.3 - 0.204LI 1.5 - 029216 1.5 - 0.087157 0.925 - 0.032157 1.19 0.108 0.417159 1.0 - 0.03L12 1.0 - 0.0812 1.5 - 0.065155 0.65 - 0.062156 0.8 - 0.180L64 0.7 - 0.067L62 1.25 - 0.062L67 0.925 - 0.1681.0 1.0 - 0.117L65 .925 - 0.132F93 0.7 0.036 0.036LI 1.5 - 0.32616 1.5 . 0.169152 2.25 - 0.164157 0.925 - 0.084159 1.0 - 0.149L12 1.0 . 0.076155 0.65 - 0.092158 0.9 - 0.113156 0.8 - 0.228162 1.25 . 0.078165 0.925 . 0.15514 1.0 . 0241154 1.5 0.146 0.614152 2.25 - 0.031151 2.45 0.108 0.1611565 4.25 - 0.276157 2.8 - 0.167158 2.45 - 0,031•F75 0.6 0.191 1.077*F16 0.4 - 0.012*F15 1 . 0 1.125 1.185*F18 0.615 0.085 0.085♦ F19 0.409 0.085 0.085*F20 0.575 0.102 0.102*F21 0.371 0.205 0.205•F22 0.744 0.102 0.102•F23 0.556 0.096 0.113*F24 0.610 0.096 0.096•F25 0.48 0.112 0.136•L5 . . 0.075*L2 - . 0.113♦ 15 0.7 - 0.222*F3 0.446 0.052 0.117♦ FI 0.442 - 0.15
Samples from Masinga Dam
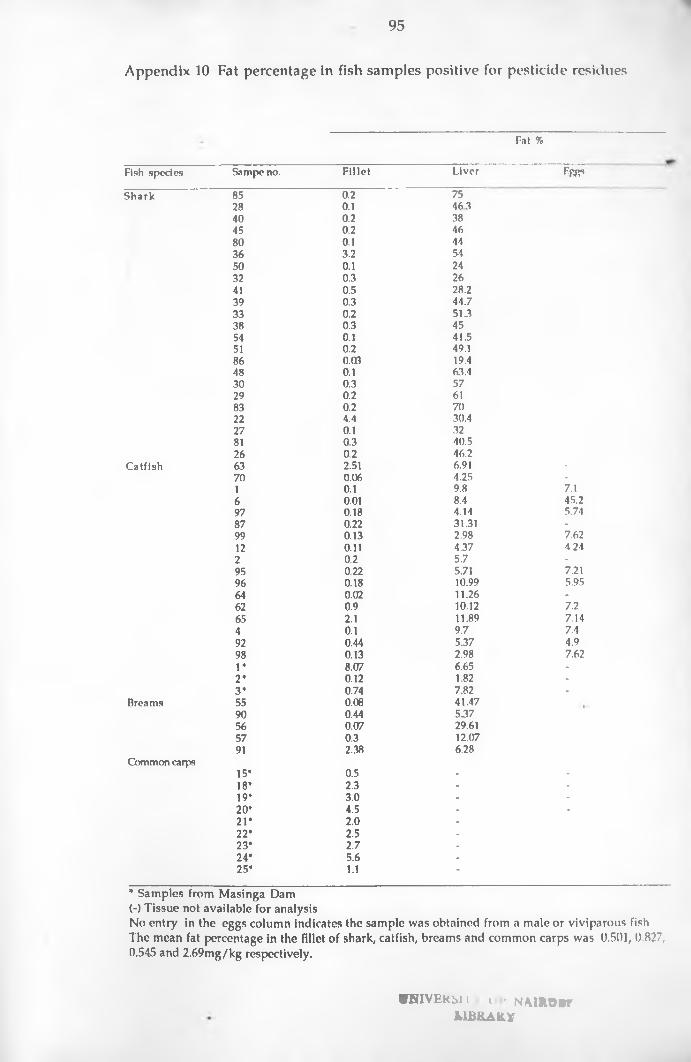
95
Appendix 10 Fat percentage in fish samples positive for pesticide residues
Fat %
Fish species Sampeno. Fillet Liver Era?Shark 85 0.2 75
28 0.1 46340 0.2 3845 0.2 4680 0.1 4436 3.2 5450 0.1 2432 0.3 2641 0.5 28.239 0.3 44.733 0.2 51.338 0.3 4554 0.1 41.551 0.2 49.186 0.03 19.448 0.1 63.430 0.3 5729 0.2 6183 0.2 7022 4.4 30.427 0.1 3281 0.3 40.526 0.2 46.2
Catfish 63 2.51 6.91 -70 0.06 4.25 -
1 0.1 9.8 7.16 0.01 8.4 45.297 0.18 4.14 5.7487 0.22 31.31 -
99 0.13 2.98 7.6212 0.11 4.37 4.242 0.2 5.7 -
95 0.22 5.71 7.2196 0.18 10.99 5.9564 0.02 11.26 -
62 0.9 10.12 7.265 2.1 11.89 7.144 0.1 9.7 7.492 0.44 5.37 4.998 0.13 2.98 7.621* 8.07 6.65 -
2* 0.12 1.82 -
3* 0.74 7.82 -
Breams 55 0.08 41.4790 0.44 5.3756 0.07 29.6157 0.3 12.0791 2.38 6.28
Common carps15* 0.5 - -
18* 2.3 - -
19* 3.0 - -
20’ 4.5 - -
21* 2.0 -
22* 2.5 -
23* 2.7 -
24* 5.6 -
25* 1.1 -
* Samples from Masinga Dam (-) Tissue not available for analysisNo entry in the eggs column indicates the sample was obtained from a male or viviparous fish The mean fat percentage in the fillet of shark, catfish, breams and common carps was 0.501, 0.827, 0.545 and 2.69mg/kg respectively.
WHIVEKm : i >. NMfctJ&rU fi&A&Y