PCB and organochlorine pesticide burden in eels in the lower Thames river (UK)
9
PCB and organochlorine pesticide burden in eels in the lower Thames River (UK) Monika D. Jürgens a,⇑ , Chakra Chaemfa b,c , David Hughes b , Andrew C. Johnson a , Kevin C. Jones b a CEH Wallingford, Benson Lane, OX10 8BB, United Kingdom b Lancaster Environment Centre, Lancaster University, LA1 4YQ, United Kingdom c Guangzhou Institute of Geochemistry, Chinese Academy of Sciences, 511 Kehua Street, Wushan, Tianhe District, Guangzhou, GD 510640, China highlights 35 Eels, caught in the Thames near London in 2007, were analysed for some POPs. Pesticide and PCB contamination was relatively low compared to previous studies. No EU food or environmental standards (EQS) were exceeded. However, dioxin-like PCBs and total DDT exceeded a Canadian EQS. Tidal eels had more lipid and fewer A. crassus infections than upstream ones. graphical abstract article info Article history: Received 2 April 2014 Received in revised form 24 June 2014 Accepted 28 June 2014 Handling Editor: J. de Boer Keywords: Eel Pesticides DDT HCB PCBs UK abstract Thirty-five European eels (Anguilla anguilla), caught in 2007 in the river Thames upstream and downstream of both London and the tidal limit, were analysed for PCBs and organochlorine pesticides. Most chemicals were detectable in every fish, although they have been banned or severely restricted for many years. In general, the tidal eels were more contaminated than upstream ones, which was related to their higher lipid contents. The ICES7 indicator PCB concentrations ranged overall from 4.2 to 124 lg kg 1 fresh weight with averages of 33 and 56 lg kg 1 for the upstream and tidal eels; 3.5–104 lg kg 1 , average 26 and 48 lg kg 1 of that were ICES6 PCBs. Total DDT was on average 16 lg kg 1 (1.7–38 lg kg 1 ) upstream and 18 lg kg 1 (8.6– 35 lg kg 1 ) downstream with about half of that provided by pp 0 DDE. Lindane (c-HCH) was found at up to 2.8 lg kg 1 (averages 0.58 and 1.1 lg kg 1 upstream and downstream) and hexachlorobenzene (HCB) was on average 1.9 and 2.5 lg kg 1 in the two groups with a maximum of 6.4 lg kg 1 in each. Therefore all indi- viduals passed the European Environmental Quality Standard (EQS) of 10 lg kg 1 for HCB. PCB contamina- tion was fairly typical for recent UK eel data, whilst DDE and lindane concentrations were lower than most previous UK eel studies, perhaps reflecting a downward trend. Although not as highly contaminated as some eels from previous UK and European studies, the presence of so many of these chemicals, with their known health effects may represent a stress for the fish or higher pre- dators, such as birds. Ó 2014 Elsevier Ltd. All rights reserved. http://dx.doi.org/10.1016/j.chemosphere.2014.06.088 0045-6535/Ó 2014 Elsevier Ltd. All rights reserved. Abbreviations: EQS, environmental quality standard; EQI, eel quality index; TEF, toxic equivalency factor; TEQ, toxic equivalent concentration TEQ = TEF 1 ⁄ conc 1 + TEF 2 ⁄ conc 2 + ...; NGR, National Grid Reference. ⇑ Corresponding author. Tel.: +44 1491 838800. E-mail address: [email protected] (M.D. Jürgens). Chemosphere 118 (2015) 103–111 Contents lists available at ScienceDirect Chemosphere journal homepage: www.elsevier.com/locate/chemosphere
Transcript of PCB and organochlorine pesticide burden in eels in the lower Thames river (UK)
Chemosphere 118 (2015) 103–111
Contents lists available at ScienceDirect
Chemosphere
journal homepage: www.elsevier .com/locate /chemosphere
PCB and organochlorine pesticide burden in eels in the lower ThamesRiver (UK)
http://dx.doi.org/10.1016/j.chemosphere.2014.06.0880045-6535/� 2014 Elsevier Ltd. All rights reserved.
Abbreviations: EQS, environmental quality standard; EQI, eel quality index; TEF, toxic equivalency factor; TEQ, toxic equivalent concentration TEQ = TEF1
TEF2 ⁄ conc2 + . . .; NGR, National Grid Reference.⇑ Corresponding author. Tel.: +44 1491 838800.
E-mail address: [email protected] (M.D. Jürgens).
Monika D. Jürgens a,⇑, Chakra Chaemfa b,c, David Hughes b, Andrew C. Johnson a, Kevin C. Jones b
a CEH Wallingford, Benson Lane, OX10 8BB, United Kingdomb Lancaster Environment Centre, Lancaster University, LA1 4YQ, United Kingdomc Guangzhou Institute of Geochemistry, Chinese Academy of Sciences, 511 Kehua Street, Wushan, Tianhe District, Guangzhou, GD 510640, China
h i g h l i g h t s
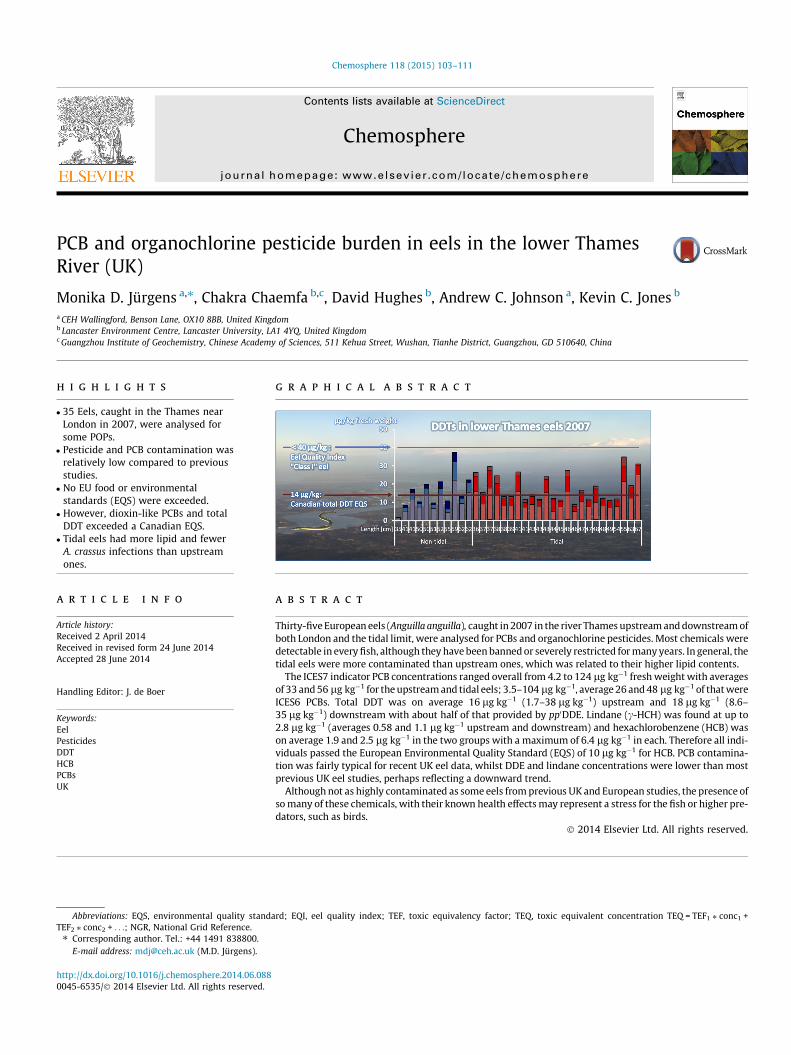
� 35 Eels, caught in the Thames nearLondon in 2007, were analysed forsome POPs.� Pesticide and PCB contamination was
relatively low compared to previousstudies.� No EU food or environmental
standards (EQS) were exceeded.� However, dioxin-like PCBs and total
DDT exceeded a Canadian EQS.� Tidal eels had more lipid and fewer
A. crassus infections than upstreamones.
g r a p h i c a l a b s t r a c t
a r t i c l e i n f o
Article history:Received 2 April 2014Received in revised form 24 June 2014Accepted 28 June 2014
Handling Editor: J. de Boer
Keywords:EelPesticidesDDTHCBPCBsUK
a b s t r a c t
Thirty-five European eels (Anguilla anguilla), caught in 2007 in the river Thames upstream and downstream ofboth London and the tidal limit, were analysed for PCBs and organochlorine pesticides. Most chemicals weredetectable in every fish, although they have been banned or severely restricted for many years. In general, thetidal eels were more contaminated than upstream ones, which was related to their higher lipid contents.
The ICES7 indicator PCB concentrations ranged overall from 4.2 to 124 lg kg�1 fresh weight with averagesof 33 and 56 lg kg�1 for the upstream and tidal eels; 3.5–104 lg kg�1, average 26 and 48 lg kg�1 of that wereICES6 PCBs. Total DDT was on average 16 lg kg�1 (1.7–38 lg kg�1) upstream and 18 lg kg�1 (8.6–35 lg kg�1) downstream with about half of that provided by pp0DDE. Lindane (c-HCH) was found at up to2.8 lg kg�1 (averages 0.58 and 1.1 lg kg�1 upstream and downstream) and hexachlorobenzene (HCB) wason average 1.9 and 2.5 lg kg�1 in the two groups with a maximum of 6.4 lg kg�1 in each. Therefore all indi-viduals passed the European Environmental Quality Standard (EQS) of 10 lg kg�1 for HCB. PCB contamina-tion was fairly typical for recent UK eel data, whilst DDE and lindane concentrations were lower than mostprevious UK eel studies, perhaps reflecting a downward trend.
Although not as highly contaminated as some eels from previous UK and European studies, the presence ofso many of these chemicals, with their known health effects may represent a stress for the fish or higher pre-dators, such as birds.
� 2014 Elsevier Ltd. All rights reserved.
⁄ conc1 +
104 M.D. Jürgens et al. / Chemosphere 118 (2015) 103–111
1. Introduction
1.1. Concern over eel numbers
The European Eel (Anguilla anguilla) is an important species forcommercial fisheries. There is, however, much concern over shar-ply declining numbers from about 1980 onwards (ICES, 2011).The European eel is now on the IUCN Red List classified as a ‘‘crit-ically endangered species’’ (Freyhof and Kottelat, 2010). All Euro-pean Union countries where eels occur, have to produce eelmanagement plans, with the long term aim of ensuring silver(mature) eel escapement to the sea recovers to at least 40% of whatit would be if there were no anthropogenic influences (EuropeanUnion, 2007). Successful recovery plans are however hindered bya lack of certainty about the main cause(s) of the decline. Climatechange leading to reduced ocean productivity (Bonhommeau et al.,2008), and to variations in ocean currents (Baltazar-Soares et al.,2014), overfishing and loss of habitat perhaps particularly incoastal areas relatively near to the Sargasso Sea (Kettle et al.,2011), infections-especially with the nematode Anguillicola crassus(Palstra et al., 2007), barriers to migration (Chadwick et al., 2007),and pollution (Robinet and Feunteun, 2002) have all beenimplicated.
1.2. The eels’ life cycle in relation to pollution
Since eels are benthic carnivores with a high fat content andlong life span, they tend to accumulate higher amounts of persis-tent chemicals from water, food, and sediment than other species(Belpaire and Goemans, 2007; Jürgens et al., 2013). In other fishspecies the females, and to a lesser extent males, offload lipidsand with them part of their contaminant burden annually duringspawning, but because eels only spawn once at the end of theirlives they do not have that opportunity. These characteristics,along with the fact, that during their yellow (growth) phase mosteels are highly sedentary, make them ideal for monitoring chemi-cal pollution in the water systems where they reside. However,these features may also quite literally store up problems for theirown future or present a problem to their predators. During the longspawning migration, sexual maturation occurs and they do notfeed but rely instead entirely on their fat reserves. Thus chemicalsthat were incorporated into the fat can either be remobilized, caus-ing potential problems to the eels during this important stage ofsexual maturation, or are concentrated further in the remainingfat, much of which is later incorporated into the eggs. Palstraet al. (2006) claimed to have found a link between environmentaldioxin-like contamination of eels and early death during the larvaldevelopment of their offspring. Developmental failure in the off-spring of contaminated females has been observed in other fishspecies: for example Burdick et al. (1964) reported the completeloss of lake trout fry at a particular stage in development due toDDT contamination passed on to the eggs. For a detailed reviewof effects of chemicals on eels see Geeraerts and Belpaire (2010).
1.3. Chemicals studied
PCBs were widely used in the 50s and 60s as cooling fluids intransformers and many other uses. Their release into the environ-ment peaked in the 1960s before concerns over human and envi-ronmental health effects led to severe restrictions from the 1970sonwards (the dates chemicals were banned are given in Table 1).PCBs have been linked to thyroid hormone disruption (Brar et al.,2010) and reduced reproductive success (Daouk et al., 2011) infish.
Organochlorine pesticides were hailed as part of the agricul-tural revolution after the war, but concerns about their bio-accu-mulating properties led to a ban or severe restriction for most ofthese compounds since about the 1980s. In this study the insecti-cides DDT, chlordane, lindane (c-HCH) and endosulfan and thefungicide hexachlorobenzene (HCB) as well as some of their degra-dation- or by-products were selected for study. Apart from endo-sulfan, which could be used in EU agriculture until 2007(European Commission, 2005a), they were all banned or veryseverely restricted from 1981.
DDT is probably the most widely studied pesticide. Its acutetoxicity to fish at high concentrations was noted early on when fishkills were observed in sprayed areas (e.g., Surber, 1946). In the 50sit was observed that the offspring from DDT contaminated femalelake trout did not survive past the stage where the yolk sac isabsorbed, which was explained by maternal transfer of DDT tothe eggs (Burdick et al., 1964) and by the 70s effects on osmoreg-ulation of different fish species, including eels, became known (e.g.,Janicki and Kinter, 1971). Technical DDT consists of about 85%pp0DDT, the active insecticidal ingredient, and 15% op0DDT withminor contributions of pp0 and op0 DDEs and DDDs (ATSDR, 2002).
The minor component op0DDT along with its degradation prod-ucts op0DDE and op0DDD is estrogenic and pp0DDE, the compoundmost commonly found in the environment, is an anti-androgen.These effects were initially noticed in humans and mammals buthave also been shown for fish both in vitro and in vivo (Baatrupand Junge, 2001; Bayley et al., 2002; Okoumassoun et al., 2002;Uchida et al., 2010). DDT was also related to effects on thyroidfunction in fish (Brar et al., 2010).
The other pesticides in this study, while less intensely studiedthan DDT, are also all known or suspected endocrine disruptorsin fish. For example, chlordane was linked to thyroid problems inwild fish (Brar et al., 2010), Lindane (c-HCH) caused reduction insex steroid hormones along with other effects on the reproductiveaxis of both sexes of catfish (Singh and Canario, 2004), endosulfanwas shown in vitro to stimulate medaka estrogen receptor a(Chakraborty et al., 2011) and HCB exposure increased estradiolin females and reduced 11-keto-testosterone in males of cruciancarp (Zhan et al., 2000).
1.4. Study area and aims
The river Thames is the longest river entirely in England (about255 km from the source to the tidal limit west of London). Eel fish-eries in its lower reaches have been reported as far back as theDomesday Book of 1086, but eel recruitment all but disappeareddue to heavy pollution around London from the industrial revolu-tion of the 19th century until sewage treatment improved waterquality from the 1960s (DEFRA, 2010). Today, there is a relativelysmall commercial eel fishery in the lower reaches of the Thames,which reported catches of 7 t of yellow eels and 0.5 t silver eel in2007 (the year of this study). Slightly smaller numbers wereremoved more recently (3.8 t yellow and 0.3 t silver eels in 2013).
Apart from two individual eels caught in 1995 (Yamaguchiet al., 2003) and one composite sample from the estuary (Santilloet al., 2005), we are not aware of any previous studies of persistentorganic pollutants in river Thames eels. The aims of this study weretherefore to examine what recent level of contamination with PCBsand organochlorine pesticides occurred in eels from the lowerThames and to review this with respect to previous UK and Euro-pean studies and environmental quality standards.
Recognizing the usefulness of eels for monitoring long-termwater quality as well as the consideration, that spawner qualityis likely to be as important as quantity for successful eel reproduc-tion, an eel quality database has recently been set up (Belpaire
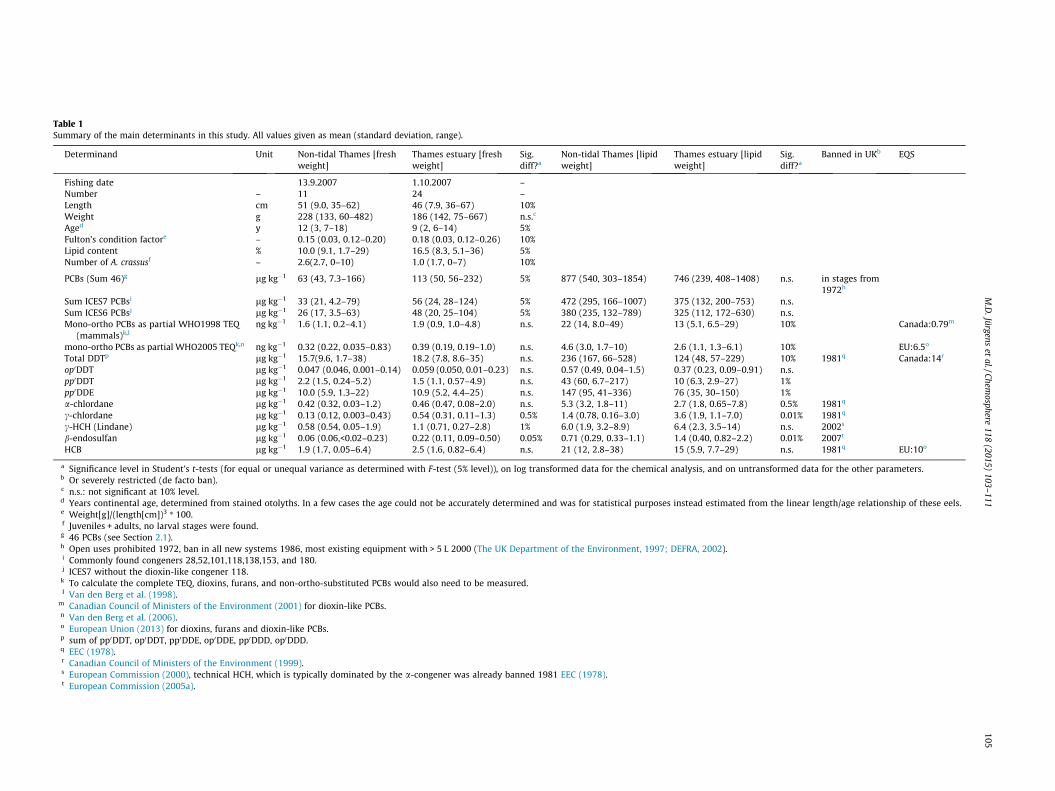
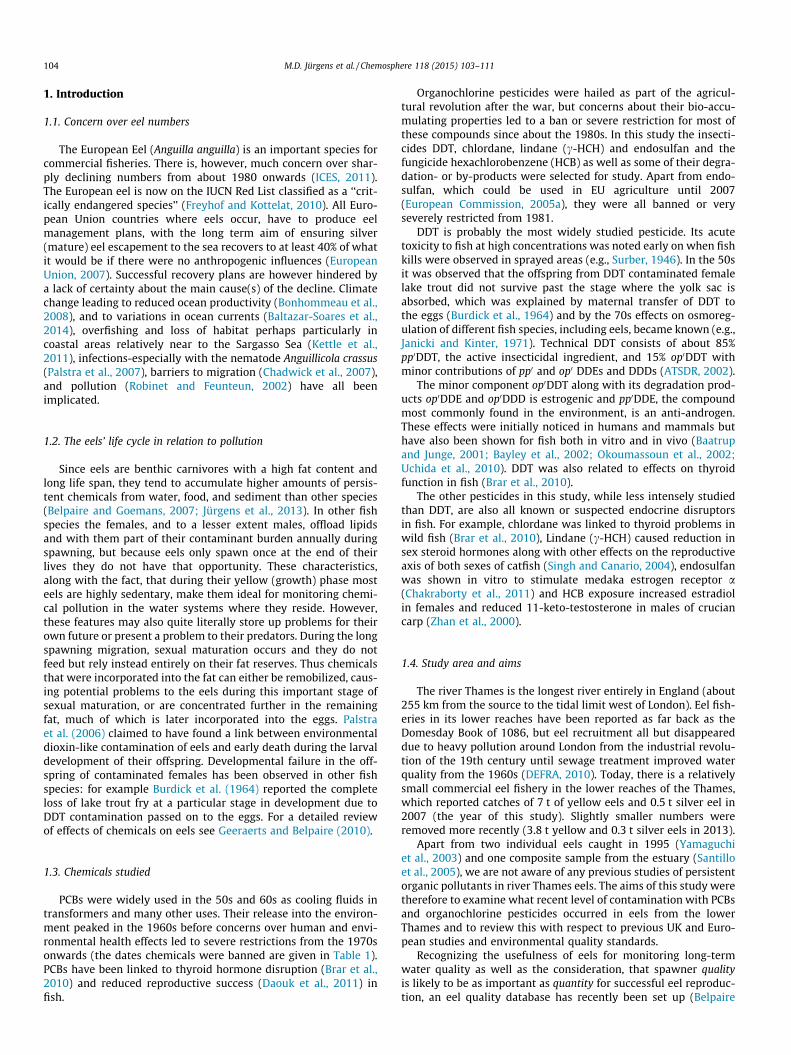
Table 1Summary of the main determinants in this study. All values given as mean (standard deviation, range).
Determinand Unit Non-tidal Thames [freshweight]
Thames estuary [freshweight]
Sig.diff?a
Non-tidal Thames [lipidweight]
Thames estuary [lipidweight]
Sig.diff?a
Banned in UKb EQS
Fishing date 13.9.2007 1.10.2007 –Number – 11 24 –Length cm 51 (9.0, 35–62) 46 (7.9, 36–67) 10%Weight g 228 (133, 60–482) 186 (142, 75–667) n.s.c
Aged y 12 (3, 7–18) 9 (2, 6–14) 5%Fulton’s condition factore – 0.15 (0.03, 0.12–0.20) 0.18 (0.03, 0.12–0.26) 10%Lipid content % 10.0 (9.1, 1.7–29) 16.5 (8.3, 5.1–36) 5%Number of A. crassusf – 2.6(2.7, 0–10) 1.0 (1.7, 0–7) 10%
PCBs (Sum 46)g lg kg�1 63 (43, 7.3–166) 113 (50, 56–232) 5% 877 (540, 303–1854) 746 (239, 408–1408) n.s. in stages from1972h
Sum ICES7 PCBsi lg kg�1 33 (21, 4.2–79) 56 (24, 28–124) 5% 472 (295, 166–1007) 375 (132, 200–753) n.s.Sum ICES6 PCBsj lg kg�1 26 (17, 3.5–63) 48 (20, 25–104) 5% 380 (235, 132–789) 325 (112, 172–630) n.s.Mono-ortho PCBs as partial WHO1998 TEQ
(mammals)k,lng kg�1 1.6 (1.1, 0.2–4.1) 1.9 (0.9, 1.0–4.8) n.s. 22 (14, 8.0–49) 13 (5.1, 6.5–29) 10% Canada:0.79m
mono-ortho PCBs as partial WHO2005 TEQk,n ng kg�1 0.32 (0.22, 0.035–0.83) 0.39 (0.19, 0.19–1.0) n.s. 4.6 (3.0, 1.7–10) 2.6 (1.1, 1.3–6.1) 10% EU:6.5o
Total DDTp lg kg�1 15.7(9.6, 1.7–38) 18.2 (7.8, 8.6–35) n.s. 236 (167, 66–528) 124 (48, 57–229) 10% 1981q Canada:14r
op0DDT lg kg�1 0.047 (0.046, 0.001–0.14) 0.059 (0.050, 0.01–0.23) n.s. 0.57 (0.49, 0.04–1.5) 0.37 (0.23, 0.09–0.91) n.s.pp0DDT lg kg�1 2.2 (1.5, 0.24–5.2) 1.5 (1.1, 0.57–4.9) n.s. 43 (60, 6.7–217) 10 (6.3, 2.9–27) 1%pp0DDE lg kg�1 10.0 (5.9, 1.3–22) 10.9 (5.2, 4.4–25) n.s. 147 (95, 41–336) 76 (35, 30–150) 1%a-chlordane lg kg�1 0.42 (0.32, 0.03–1.2) 0.46 (0.47, 0.08–2.0) n.s. 5.3 (3.2, 1.8–11) 2.7 (1.8, 0.65–7.8) 0.5% 1981q
c-chlordane lg kg�1 0.13 (0.12, 0.003–0.43) 0.54 (0.31, 0.11–1.3) 0.5% 1.4 (0.78, 0.16–3.0) 3.6 (1.9, 1.1–7.0) 0.01% 1981q
c-HCH (Lindane) lg kg�1 0.58 (0.54, 0.05–1.9) 1.1 (0.71, 0.27–2.8) 1% 6.0 (1.9, 3.2–8.9) 6.4 (2.3, 3.5–14) n.s. 2002s
b-endosulfan lg kg�1 0.06 (0.06,<0.02–0.23) 0.22 (0.11, 0.09–0.50) 0.05% 0.71 (0.29, 0.33–1.1) 1.4 (0.40, 0.82–2.2) 0.01% 2007t
HCB lg kg�1 1.9 (1.7, 0.05–6.4) 2.5 (1.6, 0.82–6.4) n.s. 21 (12, 2.8–38) 15 (5.9, 7.7–29) n.s. 1981q EU:10o
a Significance level in Student’s t-tests (for equal or unequal variance as determined with F-test (5% level)), on log transformed data for the chemical analysis, and on untransformed data for the other parameters.b Or severely restricted (de facto ban).c n.s.: not significant at 10% level.d Years continental age, determined from stained otolyths. In a few cases the age could not be accurately determined and was for statistical purposes instead estimated from the linear length/age relationship of these eels.e Weight[g]/(length[cm])3 * 100.f Juveniles + adults, no larval stages were found.g 46 PCBs (see Section 2.1).h Open uses prohibited 1972, ban in all new systems 1986, most existing equipment with > 5 L 2000 (The UK Department of the Environment, 1997; DEFRA, 2002).i Commonly found congeners 28,52,101,118,138,153, and 180.j ICES7 without the dioxin-like congener 118.k To calculate the complete TEQ, dioxins, furans, and non-ortho-substituted PCBs would also need to be measured.l Van den Berg et al. (1998).
m Canadian Council of Ministers of the Environment (2001) for dioxin-like PCBs.n Van den Berg et al. (2006).o European Union (2013) for dioxins, furans and dioxin-like PCBs.p sum of pp0DDT, op0DDT, pp0DDE, op0DDE, pp0DDD, op0DDD.q EEC (1978).r Canadian Council of Ministers of the Environment (1999).s European Commission (2000), technical HCH, which is typically dominated by the a-congener was already banned 1981 EEC (1978).t European Commission (2005a).
M.D
.Jürgenset
al./Chemosphere
118(2015)
103–111
105
106 M.D. Jürgens et al. / Chemosphere 118 (2015) 103–111
et al., 2011a). This study can help to address the relative lack ofrecent UK data in that database.
2. Material and methods
2.1. Sampling sites and eel collection
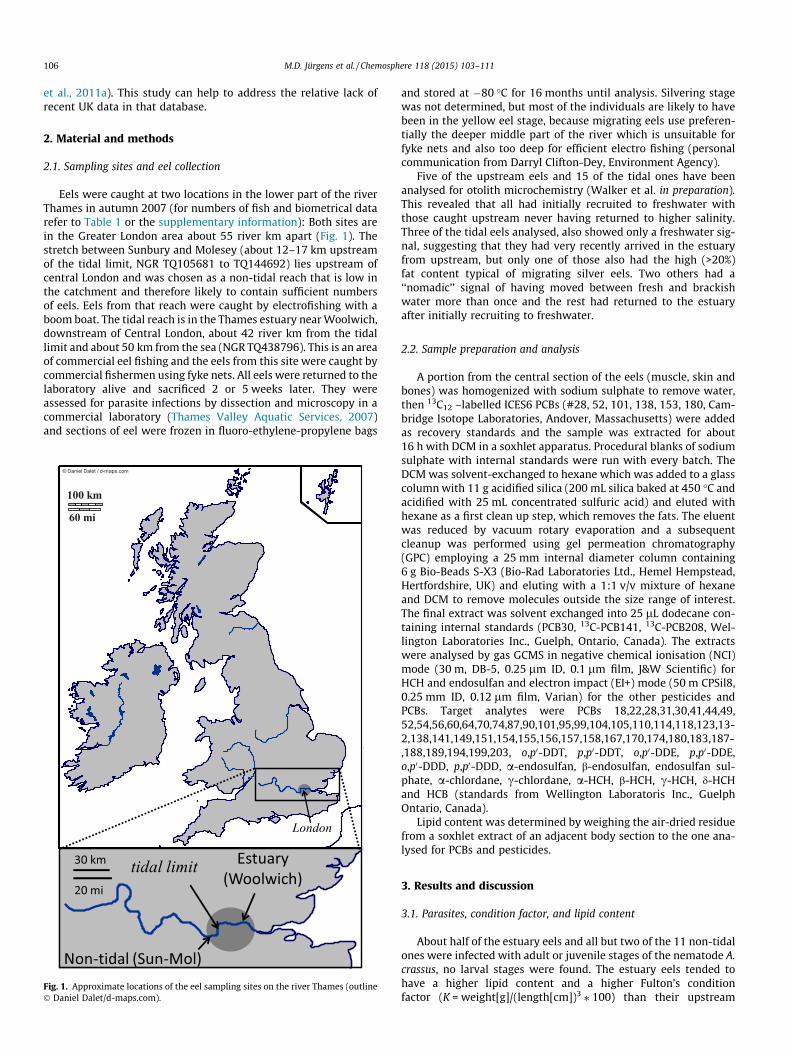
Eels were caught at two locations in the lower part of the riverThames in autumn 2007 (for numbers of fish and biometrical datarefer to Table 1 or the supplementary information): Both sites arein the Greater London area about 55 river km apart (Fig. 1). Thestretch between Sunbury and Molesey (about 12–17 km upstreamof the tidal limit, NGR TQ105681 to TQ144692) lies upstream ofcentral London and was chosen as a non-tidal reach that is low inthe catchment and therefore likely to contain sufficient numbersof eels. Eels from that reach were caught by electrofishing with aboom boat. The tidal reach is in the Thames estuary near Woolwich,downstream of Central London, about 42 river km from the tidallimit and about 50 km from the sea (NGR TQ438796). This is an areaof commercial eel fishing and the eels from this site were caught bycommercial fishermen using fyke nets. All eels were returned to thelaboratory alive and sacrificed 2 or 5 weeks later. They wereassessed for parasite infections by dissection and microscopy in acommercial laboratory (Thames Valley Aquatic Services, 2007)and sections of eel were frozen in fluoro-ethylene-propylene bags
Fig. 1. Approximate locations of the eel sampling sites on the river Thames (outline� Daniel Dalet/d-maps.com).
and stored at �80 �C for 16 months until analysis. Silvering stagewas not determined, but most of the individuals are likely to havebeen in the yellow eel stage, because migrating eels use preferen-tially the deeper middle part of the river which is unsuitable forfyke nets and also too deep for efficient electro fishing (personalcommunication from Darryl Clifton-Dey, Environment Agency).
Five of the upstream eels and 15 of the tidal ones have beenanalysed for otolith microchemistry (Walker et al. in preparation).This revealed that all had initially recruited to freshwater withthose caught upstream never having returned to higher salinity.Three of the tidal eels analysed, also showed only a freshwater sig-nal, suggesting that they had very recently arrived in the estuaryfrom upstream, but only one of those also had the high (>20%)fat content typical of migrating silver eels. Two others had a‘‘nomadic’’ signal of having moved between fresh and brackishwater more than once and the rest had returned to the estuaryafter initially recruiting to freshwater.
2.2. Sample preparation and analysis
A portion from the central section of the eels (muscle, skin andbones) was homogenized with sodium sulphate to remove water,then 13C12 –labelled ICES6 PCBs (#28, 52, 101, 138, 153, 180, Cam-bridge Isotope Laboratories, Andover, Massachusetts) were addedas recovery standards and the sample was extracted for about16 h with DCM in a soxhlet apparatus. Procedural blanks of sodiumsulphate with internal standards were run with every batch. TheDCM was solvent-exchanged to hexane which was added to a glasscolumn with 11 g acidified silica (200 mL silica baked at 450 �C andacidified with 25 mL concentrated sulfuric acid) and eluted withhexane as a first clean up step, which removes the fats. The eluentwas reduced by vacuum rotary evaporation and a subsequentcleanup was performed using gel permeation chromatography(GPC) employing a 25 mm internal diameter column containing6 g Bio-Beads S-X3 (Bio-Rad Laboratories Ltd., Hemel Hempstead,Hertfordshire, UK) and eluting with a 1:1 v/v mixture of hexaneand DCM to remove molecules outside the size range of interest.The final extract was solvent exchanged into 25 lL dodecane con-taining internal standards (PCB30, 13C-PCB141, 13C-PCB208, Wel-lington Laboratories Inc., Guelph, Ontario, Canada). The extractswere analysed by gas GCMS in negative chemical ionisation (NCI)mode (30 m, DB-5, 0.25 lm ID, 0.1 lm film, J&W Scientific) forHCH and endosulfan and electron impact (EI+) mode (50 m CPSil8,0.25 mm ID, 0.12 lm film, Varian) for the other pesticides andPCBs. Target analytes were PCBs 18,22,28,31,30,41,44,49,52,54,56,60,64,70,74,87,90,101,95,99,104,105,110,114,118,123,13-2,138,141,149,151,154,155,156,157,158,167,170,174,180,183,187-,188,189,194,199,203, o,p0-DDT, p,p0-DDT, o,p0-DDE, p,p0-DDE,o,p0-DDD, p,p0-DDD, a-endosulfan, b-endosulfan, endosulfan sul-phate, a-chlordane, c-chlordane, a-HCH, b-HCH, c-HCH, d-HCHand HCB (standards from Wellington Laboratoris Inc., GuelphOntario, Canada).
Lipid content was determined by weighing the air-dried residuefrom a soxhlet extract of an adjacent body section to the one ana-lysed for PCBs and pesticides.
3. Results and discussion
3.1. Parasites, condition factor, and lipid content
About half of the estuary eels and all but two of the 11 non-tidalones were infected with adult or juvenile stages of the nematode A.crassus, no larval stages were found. The estuary eels tended tohave a higher lipid content and a higher Fulton’s conditionfactor (K = weight[g]/(length[cm])3 ⁄ 100) than their upstream
M.D. Jürgens et al. / Chemosphere 118 (2015) 103–111 107
counterparts, which could not simply be explained by different sizeranges (Table 1). These parasite and lipid results confirm findingsof a German study (Marohn et al., 2013), which found higher fatcontent and lower A. crassus infections in eels from coastal or estu-arine regions than in those from freshwater. Fat contents aboveabout 20% of body weight appear to be necessary for successfulmigration and spawning (e.g., Belpaire et al., 2009). This makesthe tidal Thames eels possibly better candidates for successfulspawning, despite the fact that due to their higher lipid contentthey were slightly more contaminated. All chemicals measuredwere strongly related to lipid content of the individuals, while cor-relations to length or weight were much weaker. Both fresh weightand lipid-normalised data are given in Table 1 and the supplemen-tary material available online, but we focus the discussion on freshweight concentrations because regulatory values are framed thatway.
3.2. PCBs
Most of the PCBs, including all seven indicator PCBs (ICES7),were detectable in every one of the eel samples from 2007, despitethem having been banned from use in open systems in the UKsince the early 70s and in closed systems since 1981. Total PCB lev-els (46 congeners) ranged from 7 to 232 lg kg�1, fresh weight withthe ICES7 indicator PCBs providing about half of that (Table 1).These values are towards the lower end of recent European mea-surements and fairly typical for recent UK data (see Table 2).Although the high PCB values reported in some UK sites in the1990s (Table 2) were not repeated in this and other recent studies,there is insufficient data to show a clear trend over time for the UK.More extensive data exists for Belgium, where there is evidencethat PCB contamination has decreased recently at a rate whichwould take about 14 years to reduce by an order of magnitude(Maes et al., 2008).
A number of PCBs have structural features that are similar to2,3,7,8-tetra-chloro-dibenzo-dioxin (TCDD). These ‘‘dioxin-like’’PCBs are the non-ortho and mono-ortho substituted PCBs and havebeen assigned toxicity equivalency factors (TEF) by the WorldHealth Organization (Van den Berg et al., 1998,2006). There areindications that contamination with dioxin-like PCBs has adverseeffects on eels: For example Sures and Knopf (2004) found thatthe most potent dioxin-like PCB126 (not analysed here) completelysuppressed the immune response of eels experimentally infectedwith the nematode A. crassus, making them much more susceptibleto this disease.
The European Union (European Union, 2013) recently agreed ona biota EQS to protect wildlife and humans from dioxin-like toxic-ity of 6.5 ng kg�1 for the sum of dioxins, furans and dioxin-likePCBs expressed as WHO 2005 TEQ, which is the same as the EUfood standard for fish other than eel (European Commission,2011). Of the dioxin-like substances only the mono-ortho PCBswere measured here and on their own contribute a maximum of1 ng kg�1 (average 0.37) WHO 2005 TEQ. Canada has a more strin-gent tissue residue guideline of 0.79 ng kg�1 (WHO 1998 TEQ formammals and humans) for the protection of wildlife consumersfrom PCBs in their prey (Canadian Council of Ministers of theEnvironment, 2001). This is based on studies with mink andincludes a safety factor of 10 in case other mammalian predatorsare more sensitive. All but two of the eels analysed here (both fromthe non-tidal reach) exceeded this Canadian threshold even just forthe mono-ortho substituted PCBs alone. The difference betweenpassing the EU standards (at least for the measured part of thedioxin-like toxicity) and failing the Canadian ones is due both tothe difference in EQS (6.5 ng kg�1 vs 0.79 ng kg�1) and to the Cana-dian use of the older WHO 1998 assessment factors (Van den Berget al., 1998), which assigned higher toxicity relative to 2,3,7,8
TCDD to the mono-ortho substituted PCBs, than the updated2005 factors (Van den Berg et al., 2006). None of the lower Thameseels exceeded the food standards (European Commission, 2011) foreel for non-dioxin-like PCBs (300 lg kg�1, sum of 6 ICES congeners)or dioxin-like toxicity (10 ng kg�1, WHO 2005 TEQ), but as above,not all of the chemicals contributing to the TEQ were measured.
3.3. Organochlorine pesticides
All of the organochlorine pesticides and most of their by-prod-ucts or degradation products were detected in the eel tissuedespite having been banned or severely restricted decades ago(Table 1 and supporting information). The largest contribution tothe pesticide burden is from the main DDT degradation productpp0DDE, which contributes on average 49% (SD 9%) to the total pes-ticides measured, with pp0DDD contributing a further 21% (SD 5%)(Table 1). The concentrations of pp0DDE ranged from 1.3 to22 lg kg�1 fresh weight (average 10.0) in the upstream eels andfrom 4.4 to 25 lg kg�1 (average 10.9) in the tidal ones, with totalDDT 1.7–38 (average 15.7) and 8.6–35 lg kg�1 (average 18.2)respectively. There is currently no EQS for DDT in the EU, but theCanadian tissue residue guidelines can give an idea as to whethercontamination with that pesticide may be problematic to preda-tors. The limit is 14 lg kg�1 for total DDT, which is based on themost sensitive endpoint (eggshell thinning in birds) with a safetyfactor of 10, to account for species differences, and the precaution-ary assumption that all members of the DDT family are as toxic asthe most commonly studied pp0DDT (Canadian Council of Ministersof the Environment, 1999). At both sites more than half of the eelsexceeded this value, suggesting that there may be some concernfrom the pesticide burden in particular to avian predators. It ishowever unclear, whether this level of pesticide contaminationhas an effect on the eels themselves.
The next-highest pesticide contribution was from HCB, whichwas on average 1.9 lg kg�1 fresh weight in the upstream eelsand 2.5 lg kg�1 in the tidal ones (maximum 6.4 lg kg�1 for bothgroups). An EQS of 10 lg kg�1 fresh weight exists for HCB(European Union, 2013), which is not exceeded in any of the stud-ied individuals. Lindane concentrations were on average 0.58(0.05–1.9) and 1.1 (0.27–2.8) lg kg�1 in the two groups and a-Chlordane averaged 0.42 (0.03–1.2) lg kg�1 in the upstream eelsand 0.46 (0.08–2.0) lg kg�1 in the tidal ones with c-chlordane add-ing an average of 0.13 (0.003–0.43) and 0.54 (0.11–1.3) lg kg�1.The b-endosulfan concentrations were never more than0.5 lg kg�1, with averages of 0.06 (<0.02–0.23) and 0.22 (0.09–0.50) lg kg�1 for the upstream and tidal groups. Of the pesticidesmeasured, only the DDT family exceed the EU default limit for pes-ticide residues in food of 10 lg kg�1, but for total DDT the muchhigher limit of 1000 lg kg�1 applies. The food limits for the otherpesticides in this study are between 20 and 200 lg kg�1
(European Commission, 2005b).The contamination of eels with DDE in this study was lower
than much of the previously published UK and recent Europeaneel data summarized in Table 2. Lindane was comparable to somestudies from France and Italy but lower than in previous UK andrecent studies from Germany and the Benelux countries. The lowervalues of those chemicals compared to older UK studies may reflectthe expected declining trend following a ban. However, since thesites, sizes and methods vary between studies, such conclusionsare only tentative. HCB was not measured in older UK studiesand was in a similar range as most recent European studies thatmeasured this chemical. Temporal downwards trends for some ofthese chemicals have been observed more clearly in other coun-tries, for example in Belgium, where large numbers of eels wereanalysed over 11 years: Lindane concentrations fell by almosttwo orders of magnitude during that time, whereas the reduction
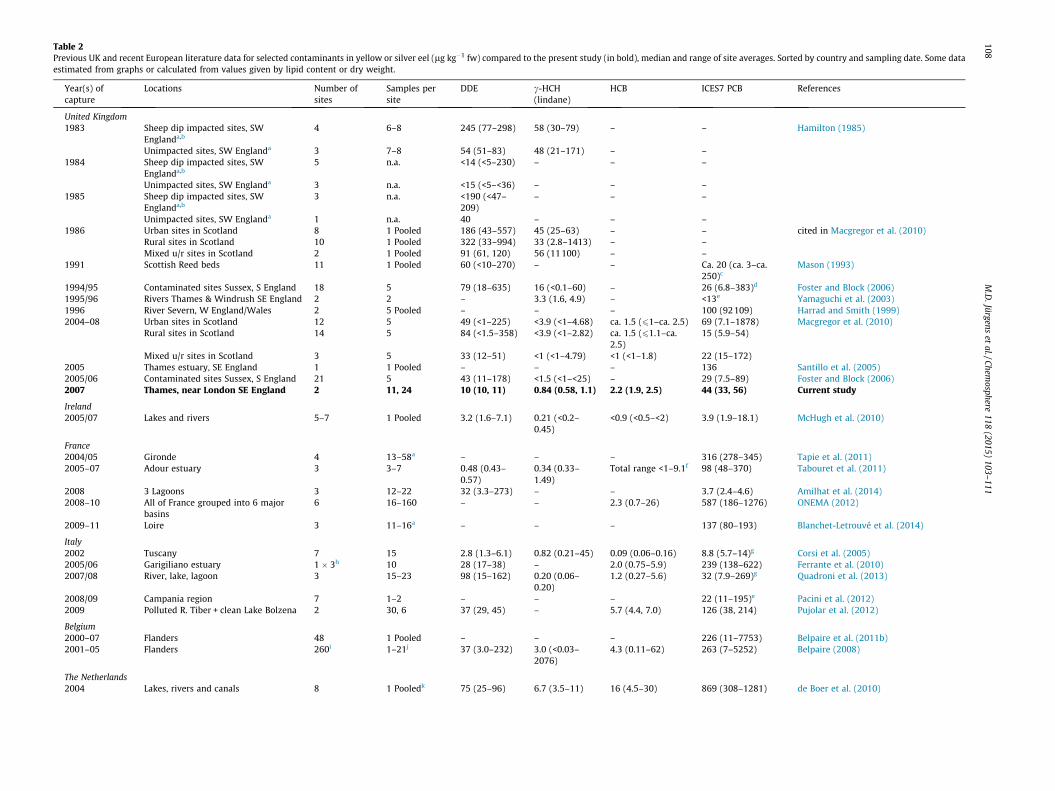
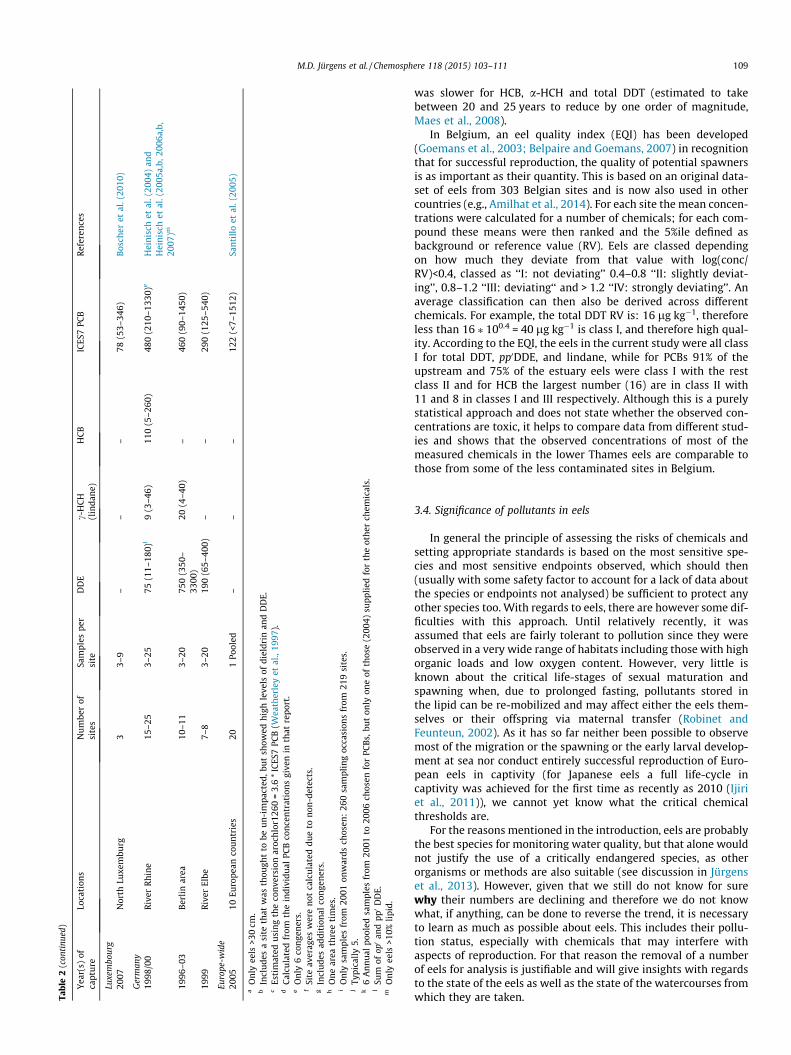
Table 2Previous UK and recent European literature data for selected contaminants in yellow or silver eel (lg kg�1 fw) compared to the present study (in bold), median and range of site averages. Sorted by country and sampling date. Some dataestimated from graphs or calculated from values given by lipid content or dry weight.
Year(s) ofcapture
Locations Number ofsites
Samples persite
DDE c-HCH(lindane)
HCB ICES7 PCB References
United Kingdom1983 Sheep dip impacted sites, SW
Englanda,b4 6–8 245 (77–298) 58 (30–79) – – Hamilton (1985)
Unimpacted sites, SW Englanda 3 7–8 54 (51–83) 48 (21–171) – –1984 Sheep dip impacted sites, SW
Englanda,b5 n.a. <14 (<5–230) – – –
Unimpacted sites, SW Englanda 3 n.a. <15 (<5–<36) – – –1985 Sheep dip impacted sites, SW
Englanda,b3 n.a. <190 (<47–
209)– – –
Unimpacted sites, SW Englanda 1 n.a. 40 – – –1986 Urban sites in Scotland 8 1 Pooled 186 (43–557) 45 (25–63) – – cited in Macgregor et al. (2010)
Rural sites in Scotland 10 1 Pooled 322 (33–994) 33 (2.8–1413) – –Mixed u/r sites in Scotland 2 1 Pooled 91 (61, 120) 56 (11100) – –
1991 Scottish Reed beds 11 1 Pooled 60 (<10–270) – – Ca. 20 (ca. 3–ca.250)c
Mason (1993)
1994/95 Contaminated sites Sussex, S England 18 5 79 (18–635) 16 (<0.1–60) – 26 (6.8–383)d Foster and Block (2006)1995/96 Rivers Thames & Windrush SE England 2 2 – 3.3 (1.6, 4.9) – <13e Yamaguchi et al. (2003)1996 River Severn, W England/Wales 2 5 Pooled – – – 100 (92109) Harrad and Smith (1999)2004–08 Urban sites in Scotland 12 5 49 (<1–225) <3.9 (<1–4.68) ca. 1.5 (61–ca. 2.5) 69 (7.1–1878) Macgregor et al. (2010)
Rural sites in Scotland 14 5 84 (<1.5–358) <3.9 (<1–2.82) ca. 1.5 (61.1–ca.2.5)
15 (5.9–54)
Mixed u/r sites in Scotland 3 5 33 (12–51) <1 (<1–4.79) <1 (<1–1.8) 22 (15–172)2005 Thames estuary, SE England 1 1 Pooled – – – 136 Santillo et al. (2005)2005/06 Contaminated sites Sussex, S England 21 5 43 (11–178) <1.5 (<1–<25) – 29 (7.5–89) Foster and Block (2006)2007 Thames, near London SE England 2 11, 24 10 (10, 11) 0.84 (0.58, 1.1) 2.2 (1.9, 2.5) 44 (33, 56) Current study
Ireland2005/07 Lakes and rivers 5–7 1 Pooled 3.2 (1.6–7.1) 0.21 (<0.2–
0.45)<0.9 (<0.5–<2) 3.9 (1.9–18.1) McHugh et al. (2010)
France2004/05 Gironde 4 13–58a – – – 316 (278–345) Tapie et al. (2011)2005–07 Adour estuary 3 3–7 0.48 (0.43–
0.57)0.34 (0.33–1.49)
Total range <1–9.1f 98 (48–370) Tabouret et al. (2011)
2008 3 Lagoons 3 12–22 32 (3.3–273) – – 3.7 (2.4–4.6) Amilhat et al. (2014)2008–10 All of France grouped into 6 major
basins6 16–160 – – 2.3 (0.7–26) 587 (186–1276) ONEMA (2012)
2009–11 Loire 3 11–16a – – – 137 (80–193) Blanchet-Letrouvé et al. (2014)
Italy2002 Tuscany 7 15 2.8 (1.3–6.1) 0.82 (0.21–45) 0.09 (0.06–0.16) 8.8 (5.7–14)g Corsi et al. (2005)2005/06 Garigiliano estuary 1 � 3h 10 28 (17–38) – 2.0 (0.75–5.9) 239 (138–622) Ferrante et al. (2010)2007/08 River, lake, lagoon 3 15–23 98 (15–162) 0.20 (0.06–
0.20)1.2 (0.27–5.6) 32 (7.9–269)g Quadroni et al. (2013)
2008/09 Campania region 7 1–2 – – – 22 (11–195)e Pacini et al. (2012)2009 Polluted R. Tiber + clean Lake Bolzena 2 30, 6 37 (29, 45) – 5.7 (4.4, 7.0) 126 (38, 214) Pujolar et al. (2012)
Belgium2000–07 Flanders 48 1 Pooled – – – 226 (11–7753) Belpaire et al. (2011b)2001–05 Flanders 260i 1–21j 37 (3.0–232) 3.0 (<0.03–
2076)4.3 (0.11–62) 263 (7–5252) Belpaire (2008)
The Netherlands2004 Lakes, rivers and canals 8 1 Pooledk 75 (25–96) 6.7 (3.5–11) 16 (4.5–30) 869 (308–1281) de Boer et al. (2010)
108M
.D.Jürgens
etal./Chem
osphere118
(2015)103–
111
Tabl
e2
(con
tinu
ed)
Yea
r(s)
ofca
ptu
reLo
cati
ons
Nu
mbe
rof
site
sSa
mpl
espe
rsi
teD
DE
c-H
CH
(lin
dan
e)H
CB
ICES
7PC
BR
efer
ence
s
Luxe
mbo
urg
2007
Nor
thLu
xem
burg
33–
9–
––
78(5
3–34
6)B
osch
eret
al.(
2010
)
Ger
man
y19
98/0
0R
iver
Rh
ine
15–2
53–
2575
(11–
180)
l9
(3–4
6)11
0(5
–260
)48
0(2
10–1
330)
eH
ein
isch
etal
.(20
04)
and
Hei
nis
chet
al.(
2005
a,b,
2006
a,b,
2007
)m
1996
–03
Ber
lin
area
10–1
13–
2075
0(3
50–
3300
)20
(4–4
0)–
460
(90–
1450
)
1999
Riv
erEl
be7–
83–
2019
0(6
5–40
0)–
–29
0(1
25–5
40)
Euro
pe-w
ide
2005
10Eu
rope
anco
un
trie
s20
1Po
oled
––
–12
2(<
7–15
12)
San
till
oet
al.(
2005
)
aO
nly
eels
>30
cm.
bIn
clu
des
asi
teth
atw
asth
ough
tto
beu
n-i
mpa
cted
,bu
tsh
owed
hig
hle
vels
ofdi
eldr
inan
dD
DE.
cEs
tim
ated
usi
ng
the
con
vers
ion
aroc
hlo
r126
0=
3.6
*IC
ES7
PCB
(Wea
ther
ley
etal
.,19
97).
dC
alcu
late
dfr
omth
ein
divi
dual
PCB
con
cen
trat
ion
sgi
ven
inth
atre
port
.e
On
ly6
con
gen
ers.
fSi
teav
erag
esw
ere
not
calc
ula
ted
due
ton
on-d
etec
ts.
gIn
clu
des
addi
tion
alco
nge
ner
s.h
On
ear
eath
ree
tim
es.
iO
nly
sam
ples
from
2001
onw
ards
chos
en:
260
sam
plin
goc
casi
ons
from
219
site
s.j
Typi
call
y5.
k6
An
nu
alpo
oled
sam
ples
from
2001
to20
06ch
osen
for
PCB
s,bu
ton
lyon
eof
thos
e(2
004)
supp
lied
for
the
oth
erch
emic
als.
lSu
mof
op0
and
pp0
DD
E.m
On
lyee
ls>1
0%li
pid.
M.D. Jürgens et al. / Chemosphere 118 (2015) 103–111 109
was slower for HCB, a-HCH and total DDT (estimated to takebetween 20 and 25 years to reduce by one order of magnitude,Maes et al., 2008).
In Belgium, an eel quality index (EQI) has been developed(Goemans et al., 2003; Belpaire and Goemans, 2007) in recognitionthat for successful reproduction, the quality of potential spawnersis as important as their quantity. This is based on an original data-set of eels from 303 Belgian sites and is now also used in othercountries (e.g., Amilhat et al., 2014). For each site the mean concen-trations were calculated for a number of chemicals; for each com-pound these means were then ranked and the 5%ile defined asbackground or reference value (RV). Eels are classed dependingon how much they deviate from that value with log(conc/RV)<0.4, classed as ‘‘I: not deviating’’ 0.4–0.8 ‘‘II: slightly deviat-ing’’, 0.8–1.2 ‘‘III: deviating‘‘ and > 1.2 ‘‘IV: strongly deviating’’. Anaverage classification can then also be derived across differentchemicals. For example, the total DDT RV is: 16 lg kg�1, thereforeless than 16 ⁄ 100.4 = 40 lg kg�1 is class I, and therefore high qual-ity. According to the EQI, the eels in the current study were all classI for total DDT, pp0DDE, and lindane, while for PCBs 91% of theupstream and 75% of the estuary eels were class I with the restclass II and for HCB the largest number (16) are in class II with11 and 8 in classes I and III respectively. Although this is a purelystatistical approach and does not state whether the observed con-centrations are toxic, it helps to compare data from different stud-ies and shows that the observed concentrations of most of themeasured chemicals in the lower Thames eels are comparable tothose from some of the less contaminated sites in Belgium.
3.4. Significance of pollutants in eels
In general the principle of assessing the risks of chemicals andsetting appropriate standards is based on the most sensitive spe-cies and most sensitive endpoints observed, which should then(usually with some safety factor to account for a lack of data aboutthe species or endpoints not analysed) be sufficient to protect anyother species too. With regards to eels, there are however some dif-ficulties with this approach. Until relatively recently, it wasassumed that eels are fairly tolerant to pollution since they wereobserved in a very wide range of habitats including those with highorganic loads and low oxygen content. However, very little isknown about the critical life-stages of sexual maturation andspawning when, due to prolonged fasting, pollutants stored inthe lipid can be re-mobilized and may affect either the eels them-selves or their offspring via maternal transfer (Robinet andFeunteun, 2002). As it has so far neither been possible to observemost of the migration or the spawning or the early larval develop-ment at sea nor conduct entirely successful reproduction of Euro-pean eels in captivity (for Japanese eels a full life-cycle incaptivity was achieved for the first time as recently as 2010 (Ijiriet al., 2011)), we cannot yet know what the critical chemicalthresholds are.
For the reasons mentioned in the introduction, eels are probablythe best species for monitoring water quality, but that alone wouldnot justify the use of a critically endangered species, as otherorganisms or methods are also suitable (see discussion in Jürgenset al., 2013). However, given that we still do not know for surewhy their numbers are declining and therefore we do not knowwhat, if anything, can be done to reverse the trend, it is necessaryto learn as much as possible about eels. This includes their pollu-tion status, especially with chemicals that may interfere withaspects of reproduction. For that reason the removal of a numberof eels for analysis is justifiable and will give insights with regardsto the state of the eels as well as the state of the watercourses fromwhich they are taken.
110 M.D. Jürgens et al. / Chemosphere 118 (2015) 103–111
While it is likely that the chemical pollution adds to the prob-lems eels are facing, this alone does not seem to explain the phe-nomenon of the sharply declining eel numbers, given that thedecline of eel recruitment corresponds to a period of generallyimproving water quality across Europe and reducing pollutant bur-dens in eels. However, as yet, chemicals cannot be completelyruled out, because due to the long generation times, effects onaspects of reproduction may only become apparent many yearsafter an exposure. Climate change, water pollution, overfishing(including predation by fish eating birds), obstacles such as locks,and diseases or parasites may all be contributing factors to thedecline (OSPAR Comission, 2010).
4. Conclusions
� The contamination of the 2007 Thames eels with PCBs and orga-nochlorine pesticides appears to be relatively low compared toother UK and European studies.� Eels from the estuary were slightly more contaminated than
those from the non-tidal reach, but they also had higher lipidcontents and condition factors and lower infection rates withA. crassus, making them possibly better spawning candidatesoverall.� While none of the measured chemicals exceeded European food
or environmental standards (although in the case of dioxin-liketoxicity, only a small proportion of the contributing chemicalshas been measured), over half the eels exceeded a Canadian tis-sue residue guideline to protect wildlife consumers from effectsof total DDT and all but two individuals exceeded the equivalentCanadian guideline for dioxin-like PCBs, even though not all thecongeners contributing to the standard were measured.� Although not as highly contaminated with persistent organic
pollutants as some of the eels from previous UK and Europeanstudies, the presence of so many of these harmful chemicalsin the 2007 lower Thames eels may be a matter of concern forthese fish, adding to other known or suspected problems eelsface, such as fishing, infection with parasites, barriers impedingboth upstream and downstream migration and climate change.Reducing the chemical burden alongside other measures shouldhelp towards the recovery of European eel populations.
Acknowledgements
The study was initiated and financed by Darryl Clifton-Dey ofthe Environment Agency for England and Wales who also providedthe eel samples together with information on their parasite loads;the CEH/NERC science budget also contributed to the funding. Nei-ther organisation influenced the writing of the report. Thanks goalso to John Crosse and the anonymous reviewers for many helpfulcomments to improve the manuscript.
Appendix A. Supplementary material
Supplementary data associated with this article can be found, inthe online version, at http://dx.doi.org/10.1016/j.chemosphere.2014.06.088.
References
Amilhat, E. et al., 2014. Silver European eels health in Mediterranean habitats. Ecol.Freshw. Fish 23, 49–64.
ATSDR, 2002. Toxicological profile for DDT, DDE, and DDD. Agency for ToxicSubstances and Disease Registry, Division of Toxicology/Toxicology InformationBranch, 1600 Clifton Road NE, E-29, Atlanta, Georgia 30333, USA.
Baatrup, E., Junge, M., 2001. Antiandrogenic pesticides disrupt sexual characteristicsin the adult male guppy (Poecilia reticulata). Environ. Health Persp. 109, 1063–1070.
Baltazar-Soares, M. et al., 2014. Recruitment collapse and population structure ofthe European eel shaped by local ocean current dynamics. Curr. Biol. 24, 104–108.
Bayley, M. et al., 2002. Exposure of juvenile guppies to three antiandrogens causesdemasculinization and a reduced sperm count in adult males. Aquat. Toxicol.56, 227–239.
Belpaire, C. et al., 2011a. The European eel quality database: towards a pan-European monitoring of eel quality. Environ. Monit. Assess. 183, 273–284.
Belpaire, C. et al., 2011b. What can we learn from monitoring PCBs in the Europeaneel? A Belgian experience. Environ. Int. 37, 354–364.
Belpaire, C., Goemans, G., 2007. The European eel Anguilla anguilla, a rapporteur ofthe chemical status for the water framework directive? Vie Et Milieu-LifeEnviron. 57, 235–252.
Belpaire, C.G.J., 2008. Pollution in eel – a reason for their decline? Instituut voorNatuur – en Bonsonderzoek – INBO. Catholic University of Leuven. pp. 459pages. III Annexes.
Belpaire, C.G.J. et al., 2009. Decreasing eel stocks: survival of the fattest? Ecol.Freshw. Fish 18, 197–214.
Blanchet-Letrouvé, I. et al., 2014. Dioxin-like, non-dioxin like PCB and PCDD/Fcontamination in European eel (Anguilla anguilla) from the Loire estuarinecontinuum: Spatial and biological variabilities. Sci. Total Environ. 472, 562–571.
Bonhommeau, S. et al., 2008. Impact of climate on eel populations of the NorthernHemisphere. Mar. Ecol. – Prog. Ser. 373, 71–80.
Boscher, A. et al., 2010. Chemical contaminants in fish species from rivers in theNorth of Luxembourg: potential impact on the Eurasian otter (Lutra lutra).Chemosphere 78, 785–792.
Brar, N.K. et al., 2010. Evidence for thyroid endocrine disruption in wild fish in SanFrancisco Bay, California, USA. Relationships to contaminant exposures. Aquat.Toxicol. 96, 203–215.
Burdick, G.E. et al., 1964. The accumulation of DDT in lake trout and the effect onreproduction. Trans. Am. Fish. Soc. 93, 127–136.
Canadian Council of Ministers of the Environment, 1999. Canadian tissue residueguidelines for the protection of wildlife consumers of aquatic biota: DDT.
Canadian Council of Ministers of the Environment, 2001. Canadian tissue residueguidelines for the protection of wildlife consumers of aquatic biota:Polychlorinated biphenyls (PCBs). Updated. Canadian environmental qualityguidelines, 1999, Winnipeg.
Chadwick, S. et al., 2007. A long-term study of population characteristics anddownstream migrations of the European eel Anguilla anguilla (L.) and the effectsof a migration barrier in the Girnock Burn, north-east Scotland. J. Fish Biol. 70,1535–1553.
Chakraborty, T. et al., 2011. Estrogen receptors in medaka (Oryzias latipes) andestrogenic environmental contaminants: An in vitro-in vivo correlation. J.Steroid Biochem. Mol. Biol. 123, 115–121.
Corsi, I. et al., 2005. Contamination and sub-lethal toxicological effects of persistentorganic pollutants in the European eel (Anguilla anguilla) in the Orbetellolagoon (Tuscany, Italy). Hydrobiologia 550, 237–249.
Daouk, T. et al., 2011. Long-term food-exposure of zebrafish to PCB mixturesmimicking some environmental situations induces ovary pathology and impairsreproduction ability. Aquat. Toxicol. 105, 270–278.
de Boer, J. et al., 2010. Thirty year monitoring of PCBs, organochlorine pesticides andtetrabromodiphenylether in eel from The Netherlands. Environ. Pollut. 158,1228–1236.
DEFRA, 2002. Dioxins and dioxin-like PCBs in the UK environment –Consultationdocument.
DEFRA, 2010. Eel management plans for the United Kingdom – Thames River basindistrict.
EEC, 1978. Council Directive 79/117/EEC.European Commission, 2000. 2000/801/EC.European Commission, 2005a. 2005/864/EC.European Commission, 2005b. Regulation (EC) 396/2005 – last amended 16. Dec
2013.European Commission, 2011. 1259/2011 (EC).European Union, 2007. EC 1100/2007.European Commission, 2013. Directive 2013/39/EU.Ferrante, M.C. et al., 2010. Polychlorinated biphenyls and organochlorine pesticides
in European eel (Anguilla anguilla) from the Garigliano River (Campania region,Italy). Chemosphere 78, 709–716.
Foster, J., Block, D., 2006. The Sussex Eel Project. Environment Agency, Sussex AreaEcological Appraisal Team.
Freyhof, J., Kottelat, M., 2010. Anguilla Anguilla. IUCN Red List of ThreatenedSpecies. Version 2012.2. <www.iucnredlist.org>. 22.05.13.
Geeraerts, C., Belpaire, C., 2010. The effects of contaminants in European eel: areview. Ecotoxicology 19, 239–266.
Goemans, G., et al., 2003. Het vlaamse palingpolluentenmeetnet, 1994–2001:gehalten aan polychloorbifenylen, organochloorpesticiden en zware metalen inpaling. instituut voor bosbouw en wildbeheer – sectie visserij, Instituut voorBosbouw en Wildbeheer. Hoeilaart.
Hamilton, R.M., 1985. Discharges of pesticides to the rivers Mole and Taw, theiraccumulation in fish flesh and possible effects on fish stocks. J. Fish Biol. 27,139–149.
Harrad, S., Smith, D., 1999. Eel consumption as a pathway of human exposure toPCBs. Int. J. Environ. Health Res. 9, 31–37.
M.D. Jürgens et al. / Chemosphere 118 (2015) 103–111 111
Heinisch, E. et al., 2004. Persistent chlorinated hydrocarbons (PCHC), source-oriented monitoring in aquatic media. 1. Methods of data processing andevaluation. Fresenius Environ. Bull. 13, 1461–1473.
Heinisch, E. et al., 2005a. Persistent chlorinated hydrocarbons (PCHC), source-oriented monitoring in aquatic media. 2. The insecticide DDT, constituents,metabolites. Fresenius Environ. Bull. 14, 69–85.
Heinisch, E. et al., 2005b. Persistent chlorinated hydrocarbons (PCHC), source-oriented monitoring in aquatic media. 3. The isomers ofhexachlorocyclohexane. Fresenius Environ. Bull. 14, 444–462.
Heinisch, E. et al., 2006a. Persistent chlorinated hydrocarbons (PCHC), source-oriented monitoring in aquatic media. 4. The chlorobenzenes. FreseniusEnviron. Bull. 15, 148–169.
Heinisch, E. et al., 2006b. Persistent chlorinated hydrocarbons (PCHC), source-oriented monitoring in aquatic media. 5. Polychlorinated biphenyls (PCBs).Fresenius Environ. Bull. 15, 1344–1362.
Heinisch, E. et al., 2007. Persistent chlorinated hydrocarbons (PCHCs), source-oriented monitoring in aquatic media. 6. Strikingly high contaminated sites.Fresenius Environ. Bull. 16, 1248–1273.
ICES, 2011. Official catch statistics 1950–2010. Copenhagen, Denmark.Ijiri, S. et al., 2011. Controlled reproduction in the Japanese eel (Anguilla japonica),
past and present. Aquaculture Eur. 36, 13–17.Janicki, R.H., Kinter, W.B., 1971. DDT: disrupted osmoregulatory events in the
intestine of the eel Anguilla rostrata adapted to seawater. Science 173, 1146.Jürgens, M.D. et al., 2013. The presence of EU priority substances mercury,
hexachlorobenzene, hexachlorobutadiene and PBDEs in wild fish from fourEnglish rivers. Sci. Total Environ. 461–462, 441–452.
Kettle, A.J. et al., 2011. Where once the eel and the elephant were together: declineof the European eel because of changing hydrology in southwest Europe andnorthwest Africa? Fish Fisheries 12, 380–411.
Macgregor, K. et al., 2010. Persistent organic pollutants (PCB, DDT, HCH, HCB & BDE)in eels (Anguilla anguilla) in Scotland: Current levels and temporal trends.Environ. Pollut. 158, 2402–2411.
Maes, J. et al., 2008. Spatial variations and temporal trends between 1994 and 2005in polychlorinated biphenyls, organochlorine pesticides and heavy metals inEuropean eel (Anguilla anguilla L.) in Flanders, Belgium. Environ. Pollut. 153,223–237.
Marohn, L. et al., 2013. Implications of facultative catadromy in Anguilla anguilla.Does individual migratory behaviour influence eel spawner quality? J. Sea Res.77, 100–106.
Mason, C.F., 1993. Organochlorine pesticide-residues and PCBs in eels (anguilla-anguilla) from some British fresh-water reedbeds. Chemosphere 26, 2289–2292.
McHugh, B. et al., 2010. The occurrence of persistent chlorinated and brominatedorganic contaminants in the European eel (Anguilla anguilla) in Irish waters.Chemosphere 79, 305–313.
Okoumassoun, L.E. et al., 2002. Assessing the estrogenic potential of organochlorinepesticides in primary cultures of male rainbow trout (Oncorhynchus mykiss)hepatocytes using vitellogenin as a biomarker. Toxicology 178, 193–207.
ONEMA, 2012. Les données du plan national d’action PCB. <http://www.pollutions.eaufrance.fr/pcb/resultats-xls.html>.
OSPAR Comission, 2010. Background Document for European eel Anguilla anguilla.Pacini, N. et al., 2012. Polychlorinated dibenzodioxins, dibenzofurans, and biphenyls
in fresh water fish from Campania Region, southern Italy. Chemosphere 90, 80–88.
Palstra, A.P. et al., 2007. Swimming performance of silver eels is severely impairedby the swim-bladder parasite Anguillicola crassus. J. Exp. Mar. Biol. Ecol. 352,244–256.
Palstra, A.P. et al., 2006. Are dioxin-like contaminants responsible for the eel(Anguilla anguilla) drama? Naturwissenschaften 93, 145–148.
Pujolar, J.M., et al., 2012. Surviving in a toxic world: transcriptomics and geneexpression profiling in response to environmental pollution in the criticallyendangered European eel. Bmc Genomics 13.
Quadroni, S. et al., 2013. Contamination, parasitism and condition of Anguillaanguilla in three Italian stocks. Ecotoxicology 22, 94–108.
Robinet, T.T., Feunteun, E.E., 2002. Sublethal effects of exposure to chemicalcompounds: A cause for the decline in Atlantic eels? Ecotoxicology 11, 265–277.
Santillo, D., et al., 2005. Swimming in Chemicals – Widespread presence ofbrominated flame retardants and PCBs in eels (Anguilla anguilla) from riversand lakes in 10 European countries. Greenpeace Int.
Singh, P.B., Canario, A.V.M., 2004. Reproductive endocrine disruption in thefreshwater catfish, Heteropneustes fossilis, in response to the pesticidegamma-hexachlorocyclohexane. Ecotoxicol. Environ. Saf. 58, 77–83.
Surber, E.W., 1946. Effects of DDT on Fish. J. Wildl. Manag. 10, 183–191.Sures, B., Knopf, K., 2004. Individual and combined effects of cadmium and
3,30 ,4,40 ,5-pentachlorobiphenyl (PCB 126) on the humoral immune response inEuropean eel (Anguilla anguilla) experimentally infected with larvae ofAnguillicola crassus (Nematoda). Parasitology 128, 445.
Tabouret, H. et al., 2011. Heavy metals and organochlorinated compounds in theEuropean eel (Anguilla anguilla) from the Adour estuary and associatedwetlands (France). J. Environ. Monit. 13, 1446–1456.
Tapie, N. et al., 2011. PBDE and PCB contamination of eels from the Gironde estuary:From glass eels to silver eels. Chemosphere 83, 175–185.
Thames Valley Aquatic Services, 2007. Fish health examination reports 7403 and7404.
The UK Department of the Environment, 1997. United Kingdom action plan for thephasing out and destruction of polychlorinated biphenyls (PCBs) and dangerousPCB substitutes.
Uchida, M. et al., 2010. Estrogenic effects of o,p0-DDT exposure in Japanese medaka(Oryzias latipes). J. Toxicol. Sci. 35, 605–608.
Van den Berg, M. et al., 1998. Toxic equivalency factors (TEFs) for PCBs, PCDDs,PCDFs for humans and wildlife. Environ. Health Perspect. 106, 775.
Van den Berg, M. et al., 2006. The 2005 world health organization reevaluation ofhuman and mammalian toxic equivalency factors for dioxins and dioxin-likecompounds. Toxicol. Sci. 93, 223–241.
Weatherley, N.S. et al., 1997. Polychlorinated biphenyls and organochlorinepesticides in eels (Anguilla anguilla L) from Welsh rivers. Environ. Pollut. 95,127–134.
Yamaguchi, N. et al., 2003. Concentrations and hazard assessment of PCBs,organochlorine pesticides and mercury in fish species from the upperThames: River pollution and its potential effects on top predators.Chemosphere 50, 265–273.
Zhan, W. et al., 2000. Endocrine disruption by hexachlorobenzene in Crucian carp(Carassius auratus gibelio). Bull. Environ. Contam. Toxicol. 65, 560–566.