Constraints on the active tectonics of the Friuli/NW Slovenia area from CGPS measurements and...
12
Constraints on the active tectonics of the Friuli/NW Slovenia area from CGPS measurements and three-dimensional kinematic modeling M. Bechtold, 1,2 M. Battaglia, 3 D. C. Tanner, 1,4 and D. Zuliani 5 Received 17 February 2008; revised 5 November 2008; accepted 7 January 2009; published 26 March 2009. [1] We use site velocities from continuous GPS (CGPS) observations and kinematic modeling to investigate the active tectonics of the Friuli/NW Slovenia area. Data from 42 CGPS stations around the Adriatic indicate an oblique collision, with southern Friuli moving NNW toward northern Friuli at the relative speed of 1.6 to 2.2 mm/a. We investigate the active tectonics using 3DMove, a three-dimensional kinematic model tool. The model consists of one indenter-shaped fault plane that approximates the Adriatic plate boundary. Using the ‘‘fault-parallel flow’’ deformation algorithm, we move the hanging wall along the fault plane in the direction indicated by the GPS velocities. The resulting strain field is used for structural interpretation. We identify a pattern of coincident strain maxima and high vorticity that correlates well with groups of hypocenters of major earthquakes (including their aftershocks) and indicates the orientation of secondary, active faults. The pattern reveals structures both parallel and perpendicular to the strike of the primary fault. In the eastern sector, which shows more complex tectonics, these two sets of faults probably form an interacting strike-slip system. Citation: Bechtold, M., M. Battaglia, D. C. Tanner, and D. Zuliani (2009), Constraints on the active tectonics of the Friuli/NW Slovenia area from CGPS measurements and three-dimensional kinematic modeling, J. Geophys. Res., 114, B03408, doi:10.1029/2008JB005638. 1. Introduction [2] The eastern southern Alps region is one of the most seismically active regions of Italy. Because of the high population density and the density of industrial settlements, the region is highly vulnerable to earthquakes. Infrequent M > 6 earthquakes, together with frequent smaller earth- quakes, characterize the seismic hazard in the Friuli/NW Slovenia area [Bressan et al., 2003]. The reason for these ground motions, emphasized by the 1976 Friuli seismic sequence, is the independent anticlockwise rotation of the Adriatic microplate within the Africa-Eurasia collision zone [e.g., Anderson and Jackson, 1987; Battaglia et al., 2004]. Results of the recently performed seismic TRANSALP profile in the Eastern Alps are consistent with deep under- thrusting and wedge indentation of the Adriatic lithosphere under the southern margin of the Eastern Alps thrust-and- fold belt [Castellarin et al., 2006]. The ongoing N–S to NW – SE compression [e.g., Bressan et al., 1998; D’Agostino et al., 2005], with faulting mainly along NE – SW to NW – SE trending thrusts and the deformation of the Quaternary deposits of the Friulian Plain [Galadini et al., 2005] indicate that the eastern southern Alps can be presently described as a south verging, foreland-propagating thrust system. According to D’Agostino et al. [2005], the motion of Adria is entirely absorbed in the southern Alps through thrusting and crustal thickening, with very little or no motion trans- ferred to the north. [3] Knowledge of the related seismogenic sources is sparse [e.g., Bressan et al., 1998, 2003; Slejko et al., 1999; Poli et al., 2002; Poli and Renner, 2004; Galadini et al., 2005; DISS Working Group, Database of Individual Seismogenic Sources (DISS), version 3: A compilation of potential sources for earthquakes larger than M 5.5 in Italy and surrounding areas, 2006, available at http://www. ingv.it/DISS/, hereinafter referred to as DISS Working Group, database, 2006] (see Figure 1). The recent tectonic activity is suspected to be related to motion on blind thrusts, some of them covered by the Quaternary deposits of the Friulian Plain. A major controlling factor is ascribed to the complex paleofault system of the area. Several Cenozoic compressional tectonic phases related to the Alpine Orogeny caused SW–NE trending faults in the western, E–W trending faults in the central, and SE–NW trending faults in the eastern sector [Bressan et al., 1998, 2003; Galadini JOURNAL OF GEOPHYSICAL RESEARCH, VOL. 114, B03408, doi:10.1029/2008JB005638, 2009 Click Here for Full Articl e 1 Department of Structural Geology and Geodynamics, Geoscience Center, Go ¨ttingen, Germany. 2 Institute of Chemistry and Dynamics of the Geosphere, Institute Agrosphere, Research Centre Juelich, Juelich, Germany. 3 Department of Earth Sciences, University of Rome I ‘‘La Sapienza,’’ Rome, Italy. 4 Now at the Leibniz Institute for Applied Geosciences, Hannover, Germany. 5 Centro Ricerche Sismologiche, Udine, Italy. Copyright 2009 by the American Geophysical Union. 0148-0227/09/2008JB005638$09.00 B03408 1 of 12
-
Upload
independent -
Category
Documents
-
view
1 -
download
0
Transcript of Constraints on the active tectonics of the Friuli/NW Slovenia area from CGPS measurements and...
Constraints on the active tectonics of the Friuli/NW
Slovenia area from CGPS measurements
and three-dimensional kinematic modeling
M. Bechtold,1,2 M. Battaglia,3 D. C. Tanner,1,4 and D. Zuliani5
Received 17 February 2008; revised 5 November 2008; accepted 7 January 2009; published 26 March 2009.
[1] We use site velocities from continuous GPS (CGPS) observations and kinematicmodeling to investigate the active tectonics of the Friuli/NW Slovenia area. Data from 42CGPS stations around the Adriatic indicate an oblique collision, with southern Friulimoving NNW toward northern Friuli at the relative speed of 1.6 to 2.2 mm/a. Weinvestigate the active tectonics using 3DMove, a three-dimensional kinematic model tool.The model consists of one indenter-shaped fault plane that approximates the Adriaticplate boundary. Using the ‘‘fault-parallel flow’’ deformation algorithm, we move thehanging wall along the fault plane in the direction indicated by the GPS velocities. Theresulting strain field is used for structural interpretation. We identify a pattern ofcoincident strain maxima and high vorticity that correlates well with groups ofhypocenters of major earthquakes (including their aftershocks) and indicates theorientation of secondary, active faults. The pattern reveals structures both parallel andperpendicular to the strike of the primary fault. In the eastern sector, which shows morecomplex tectonics, these two sets of faults probably form an interacting strike-slipsystem.
Citation: Bechtold, M., M. Battaglia, D. C. Tanner, and D. Zuliani (2009), Constraints on the active tectonics of the Friuli/NW
Slovenia area from CGPS measurements and three-dimensional kinematic modeling, J. Geophys. Res., 114, B03408,
doi:10.1029/2008JB005638.
1. Introduction
[2] The eastern southern Alps region is one of the mostseismically active regions of Italy. Because of the highpopulation density and the density of industrial settlements,the region is highly vulnerable to earthquakes. InfrequentM > 6 earthquakes, together with frequent smaller earth-quakes, characterize the seismic hazard in the Friuli/NWSlovenia area [Bressan et al., 2003]. The reason for theseground motions, emphasized by the 1976 Friuli seismicsequence, is the independent anticlockwise rotation of theAdriatic microplate within the Africa-Eurasia collision zone[e.g., Anderson and Jackson, 1987; Battaglia et al., 2004].Results of the recently performed seismic TRANSALPprofile in the Eastern Alps are consistent with deep under-thrusting and wedge indentation of the Adriatic lithosphereunder the southern margin of the Eastern Alps thrust-and-
fold belt [Castellarin et al., 2006]. The ongoing N–S toNW–SE compression [e.g., Bressan et al., 1998;D’Agostinoet al., 2005], with faulting mainly along NE–SW to NW–SEtrending thrusts and the deformation of the Quaternarydeposits of the Friulian Plain [Galadini et al., 2005] indicatethat the eastern southern Alps can be presently described asa south verging, foreland-propagating thrust system.According to D’Agostino et al. [2005], the motion of Adriais entirely absorbed in the southern Alps through thrustingand crustal thickening, with very little or no motion trans-ferred to the north.[3] Knowledge of the related seismogenic sources is
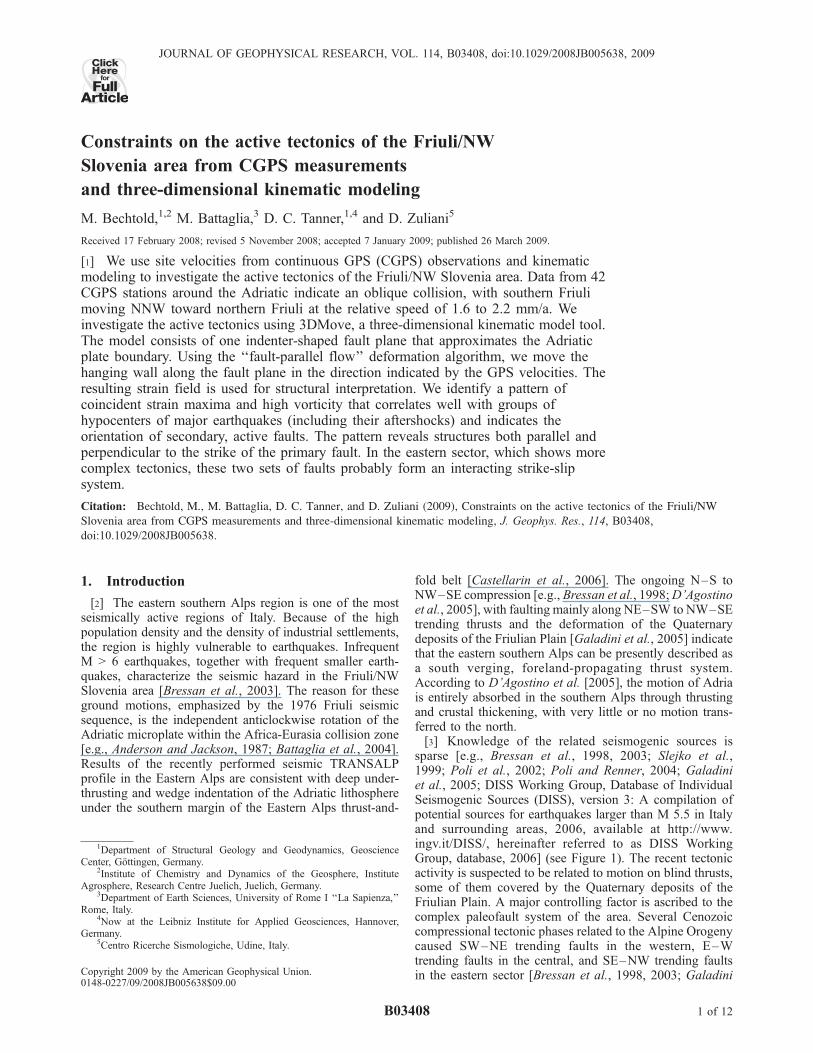
sparse [e.g., Bressan et al., 1998, 2003; Slejko et al.,1999; Poli et al., 2002; Poli and Renner, 2004; Galadiniet al., 2005; DISS Working Group, Database of IndividualSeismogenic Sources (DISS), version 3: A compilation ofpotential sources for earthquakes larger than M 5.5 in Italyand surrounding areas, 2006, available at http://www.ingv.it/DISS/, hereinafter referred to as DISS WorkingGroup, database, 2006] (see Figure 1). The recent tectonicactivity is suspected to be related to motion on blind thrusts,some of them covered by the Quaternary deposits of theFriulian Plain. A major controlling factor is ascribed to thecomplex paleofault system of the area. Several Cenozoiccompressional tectonic phases related to the Alpine Orogenycaused SW–NE trending faults in the western, E–Wtrending faults in the central, and SE–NW trending faultsin the eastern sector [Bressan et al., 1998, 2003; Galadini
JOURNAL OF GEOPHYSICAL RESEARCH, VOL. 114, B03408, doi:10.1029/2008JB005638, 2009ClickHere
for
FullArticle
1Department of Structural Geology and Geodynamics, GeoscienceCenter, Gottingen, Germany.
2Institute of Chemistry and Dynamics of the Geosphere, InstituteAgrosphere, Research Centre Juelich, Juelich, Germany.
3Department of Earth Sciences, University of Rome I ‘‘La Sapienza,’’Rome, Italy.
4Now at the Leibniz Institute for Applied Geosciences, Hannover,Germany.
5Centro Ricerche Sismologiche, Udine, Italy.
Copyright 2009 by the American Geophysical Union.0148-0227/09/2008JB005638$09.00
B03408 1 of 12

et al., 2005]. The seismicity distribution observed since1977 cannot only be related to one active thrust front(Figure 1). Beside the proposed active faults, the area isprobably characterized by other, as yet not recognized,active structures.[4] We address the complex active tectonics of the Friuli
(Italy)/NW Slovenia area with an approach that combinesGPS site velocities and kinematic modeling. In the first part,we present our GPS processing procedure and the resultingvelocity field. In the second part, we present the modelingtool 3DMove and the data basis of our model. To supportour data basis, we discuss the sensitivity of the resultingstrain field to movement direction and fault plane selection.Finally, we discuss the results and compare them withobserved seismicity.
2. Friuli GPS Velocity Field
[5] Since 2002, high-precision geodesy, i.e., the FriuliRegional Deformation Network (FReDNet) consisting ofeight continuously operating GPS receivers, monitors themovements of the crust in the Friuli area and provides animportant tool for characterizing crustal deformation pro-cesses [Battaglia et al., 2004; D’Agostino et al., 2005]. Inour work, we update and improve upon earlier results byD’Agostino et al. [2005]. In particular, we include all theeight stations of the FReDNet network, and we use acomplete different approach to process the CGPS data andestimate the velocities uncertainties. This allows us toproduce a set of solutions completely independent fromearlier results. Furthermore, thanks to the increasing numberof CGPS sites existing in the public domain, we included in
our solution twice the number of sites used by D’Agostinoet al. [2005]. To determine the crustal velocity field of thisarea, we consistently analyzed data from 42 GPS stationsaround the Adriatic region. All data used in this analysis arein the public domain (http://www.crs.inogs.it/frednet). TheGPS data were processed applying a three-step approach,e.g., the method of Feigl et al. [1993], using the GAMIT/GLOBK GPS analysis package (http://www-gpsg.mit.edu/�simon/gtgk/index.htm).[6] To aid orbit determination and to strengthen the
reference frame for the velocity solution, we includedadditional sites from the international GPS Service andEUREF networks as loosely constrained solutions providedby the Scripps Orbit and Permanent Array Center (SOPAC)[McClusky et al., 2000; Herring, 2003a]. Ten stations,present both in our regional analysis and in the globalanalysis by SOPAC, provide a link between the twosolutions. In the end, our solution includes data spanning4.5 years from 250 stations. All eight continuous operatingGPS stations of FReDNet present at least 2.5 years of data(Table 1), the minimum time span to reliably determinecrustal velocities [Blewitt and Lavallee, 2002].[7] Since the expected velocities of the GPS stations in
the Friuli area are in the range of few millimeters per year, itwas very important to properly determine the uncertaintiesof the velocity estimates. We performed an error estimationthat accounts for both white and random walk noise [e.g.,McClusky et al., 2000]. The combination of daily quasi-observations into weekly, monthly or annual averages is amethod to account for white noise [McClusky et al., 2000;R. W. King and T. A. Herring, personal communication,2006]. R. W. King and T. A. Herring propose that monthly
Figure 1. Seismicity distribution in Friuli. Gray polygons represent proposed seismogenic sources afterDISS Working Group (database, 2006). Seismicity distribution is shown as dots scaled to magnitude andcolored by depth. The structural map of Galadini et al. [2005] (with permission) is also shown. The redline represents the trace of the modeled thrust fault. Inset shows the position of the study area in Italy.
B03408 BECHTOLD ET AL.: ACTIVE TECTONICS OF FRIULI/NW SLOVENIA
2 of 12
B03408

combinations provide sufficient observations for a goodstatistics on the residuals about the linear trends. Whitenoise was estimated by manually adjusting the scaling onthe quasi-observations (h files) such that the prefit c2 isclose to 1. A prefit c2 that is close to 1 results in one-s datauncertainties that are equal to the average scatter of the dataresiduals about the solution [McClusky et al., 2000]. Thedata scatter provides an unbiased estimate of the uncertain-ties if the error spectrum is white and the data are spatiallyand temporally sampled homogeneously. The random walkcomponent was estimated separately for each station usingthe ‘‘realistic sigma’’ algorithm of Herring [2003b] [e.g.,Reilinger et al., 2006]. The average of all estimated randomwalk components is 0.8 mm/
ffiffiffi
ap
in the horizontal and 6 mm/ffiffiffi
ap
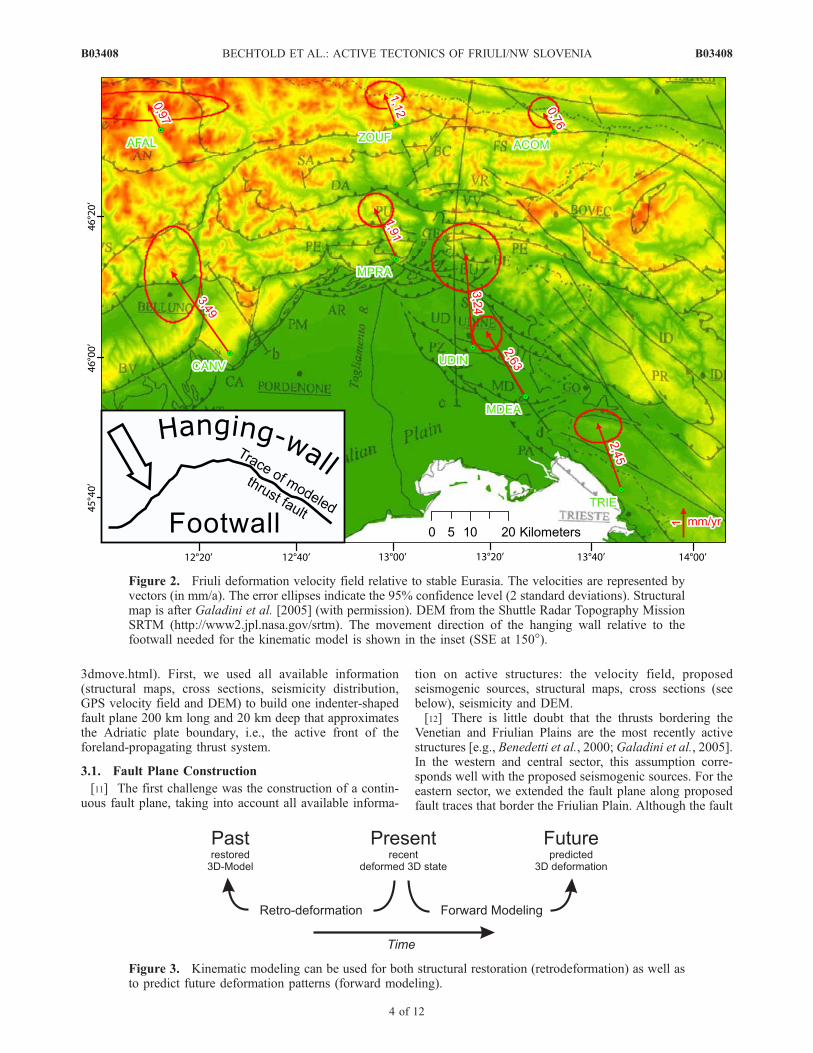
in the vertical (Table 2). The stable Eurasian plate byAltamimi et al. [2002] provides the reference frame for thevelocity estimation. All details on the complete GPS pro-cessing procedure are documented by Bechtold [2007].[8] The Friuli crustal velocity field illustrates the specific
tectonic position of the Friuli area situated between the‘‘stable’’ sites of the Alps and the NNW moving sites ofnorthern Adria (Figure 2 and Table 1). The results indicatethat the FReDNet GPS sites can be divided into threegroups: (1) AFAL, ACOM, and ZOUF (northern Friuli)moving north to NNW with 0.8 to 1.1 mm/a; (2) CANV,MDEA, TRIE, and UDIN (southern Friuli) moving north toNNW with 2.5 to 3.5 mm/a; and (3) MPRA moving NNWwith 1.9 mm/a, representing an intermediate position. Theangle of collision of southern Friuli with respect to northernFriuli can be inferred from a solution stabilized for northernFriuli. This suggests a NNW movement of about 330�. Thevelocity field indicates shortening within the Friuli area ofabout 1.6 to 2.2 mm/a. This value can be compared withthat determined by D’Agostino et al. [2005] of 2.0 ± 0.2 mm.The shortening rate is consistent with geomorphologicstudies along the Montello Thrust, which indicate a NWdirected shortening at a rate of �2 mm/a [Benedetti et al.,2000]. The uncertainties in the vertical component are toolarge for reliable conclusions (Table 1). The velocity field isconsistent with previously published GPS site velocities[D’Agostino et al., 2005] but presents more details in thespecific study area. In the last years several GPS velocityfields of the Adriatic region have been published [e.g.,Battaglia et al., 2004; Serpelloni et al., 2007]. In thepublished results the movement direction and velocity ofnorthern Adria relative to stable Eurasia ranges from NNWto NNE at 2.5 mm/a to 4.5 mm/a. Variations are mainlycaused by different lengths of time series and by using
different sites as reference for stable Eurasia. Grenerczy etal. [2005] observed a 2–3 mm/a of N–S Adria-Eurasiaconvergence that is taken up by contradiction across anarrow (70 km) zone in the Eastern Alps resulting in anet 30 ppb/a contractional strain rate. A shortening of 2–3 mm/a was also proposed by D’Agostino et al. [2005] andCaporali et al. [2008]. Most GPS studies have not includedFReDNet stations (besides TRIE) and the closest stationswere UPAD, MEDI, BOZI, and MALJ. One exception is thework of D’Agostino et al. [2005], who presented the firstGPS site velocities of the stations TRIE, MDEA, UDIN,MPRA and ZOUF. Using 1–1.5 years longer time seriesand more stations our GPS processing results refine previ-ous Friuli GPS velocity fields by giving a better spatialresolution and reduction of the uncertainties, and by pro-viding the first complete processing of FReDNet.
3. Kinematic Model
[9] We use the information obtained from the velocityfield of the GPS processing to constrain a three-dimensional,kinematic model. Kinematic modeling is a well-establishedtool for structural restoration and is applied in the oil and gas,mining, and nuclear waste industries to validate and analyze3-D models (Figure 3). The indenter tectonics and the NNWoriented, oblique collision are three-dimensional interac-tions and therefore, the application of a 3-D model spaceis necessary. The philosophy of our modeling approach is toinfer unknown structures due to the movement alongprimary, known structures (Figure 3).[10] The kinematic modeling was performed using the
software package 3DMove (http://www.mve.com/3DMove/
Table 2. Site-Specific Random Walk Componentsa
Random Walk Components (mm/ffiffiffi
ap
)
N E U
ACOM 0.11 0.11 3.93AFAL 0.08 4.18 4.74CANV 1.05 0.33 5.54MDEA 0.17 0.10 4.22MPRA 0.17 0.20 4.78TRIE 0.16 0.36 3.84UDIN 0.83 0.87 7.89ZOUF 0.12 0.28 4.63Average 0.34 0.80 4.95
aSite-specific random walk components are estimated by the ‘‘realisticsigma’’ algorithm [Herring, 2003b]; random walk for each component(N, E, and U) of the FReDNet stations are given.
Table 1. Site Velocities and Standard Deviations of the N, E, and U Components of the FReDNet Stations in the European Reference
Framea
ID Station Longitude Latitude Time Span (years)
Site Velocities
N E U
ACOM Monte Acomizza 13.515 46.548 3.3 0.66 ± 0.22 �0.37 ± 0.22 �0.48 ± 1.23AFAL Alpe Faloria 12.175 46.527 3.4 0.87 ± 0.21 �0.44 ± 1.15 0.55 ± 1.36CANV Caneva 12.435 46.008 2.5 2.83 ± 0.69 �2.04 ± 0.41 �0.41 ± 1.73MDEA Colle di Medea 13.436 45.924 3.8 2.25 ± 0.25 �1.37 ± 0.21 �2.26 ± 1.18MPRA Mont di Prat 12.988 46.241 4.2 1.76 ± 0.24 �0.74 ± 0.25 �1.04 ± 1.18UDIN Udine 13.253 46.037 3.9 3.23 ± 0.49 �0.24 ± 0.50 �7.95 ± 1.55TRIE Trieste 13.764 45.710 3.7 2.30 ± 0.24 �0.84 ± 0.34 2.17 ± 1.12ZOUF Zouf Plan 12.974 46.557 4.4 1.05 ± 0.20 �0.39 ± 0.28 �2.49 ± 1.13
aSite velocities are in mm/a. For the European reference frame, see Altamimi et al. [2002].
B03408 BECHTOLD ET AL.: ACTIVE TECTONICS OF FRIULI/NW SLOVENIA
3 of 12
B03408
3dmove.html). First, we used all available information(structural maps, cross sections, seismicity distribution,GPS velocity field and DEM) to build one indenter-shapedfault plane 200 km long and 20 km deep that approximatesthe Adriatic plate boundary, i.e., the active front of theforeland-propagating thrust system.
3.1. Fault Plane Construction
[11] The first challenge was the construction of a contin-uous fault plane, taking into account all available informa-
tion on active structures: the velocity field, proposedseismogenic sources, structural maps, cross sections (seebelow), seismicity and DEM.[12] There is little doubt that the thrusts bordering the
Venetian and Friulian Plains are the most recently activestructures [e.g., Benedetti et al., 2000; Galadini et al., 2005].In the western and central sector, this assumption corre-sponds well with the proposed seismogenic sources. For theeastern sector, we extended the fault plane along proposedfault traces that border the Friulian Plain. Although the fault
Figure 3. Kinematic modeling can be used for both structural restoration (retrodeformation) as well asto predict future deformation patterns (forward modeling).
Figure 2. Friuli deformation velocity field relative to stable Eurasia. The velocities are represented byvectors (in mm/a). The error ellipses indicate the 95% confidence level (2 standard deviations). Structuralmap is after Galadini et al. [2005] (with permission). DEM from the Shuttle Radar Topography MissionSRTM (http://www2.jpl.nasa.gov/srtm). The movement direction of the hanging wall relative to thefootwall needed for the kinematic model is shown in the inset (SSE at 150�).
B03408 BECHTOLD ET AL.: ACTIVE TECTONICS OF FRIULI/NW SLOVENIA
4 of 12
B03408
traces used for this sector are not related to proposedseismogenic sources, they fulfill two important criteria: theyhave location (1) south of the seismicity belt and (2) north ofthe velocity solutions of UDIN, MDEA and TRIE stations(all with velocities appropriate to the Adriatic microplate).[13] For the digitalization of the superficial fault traces,
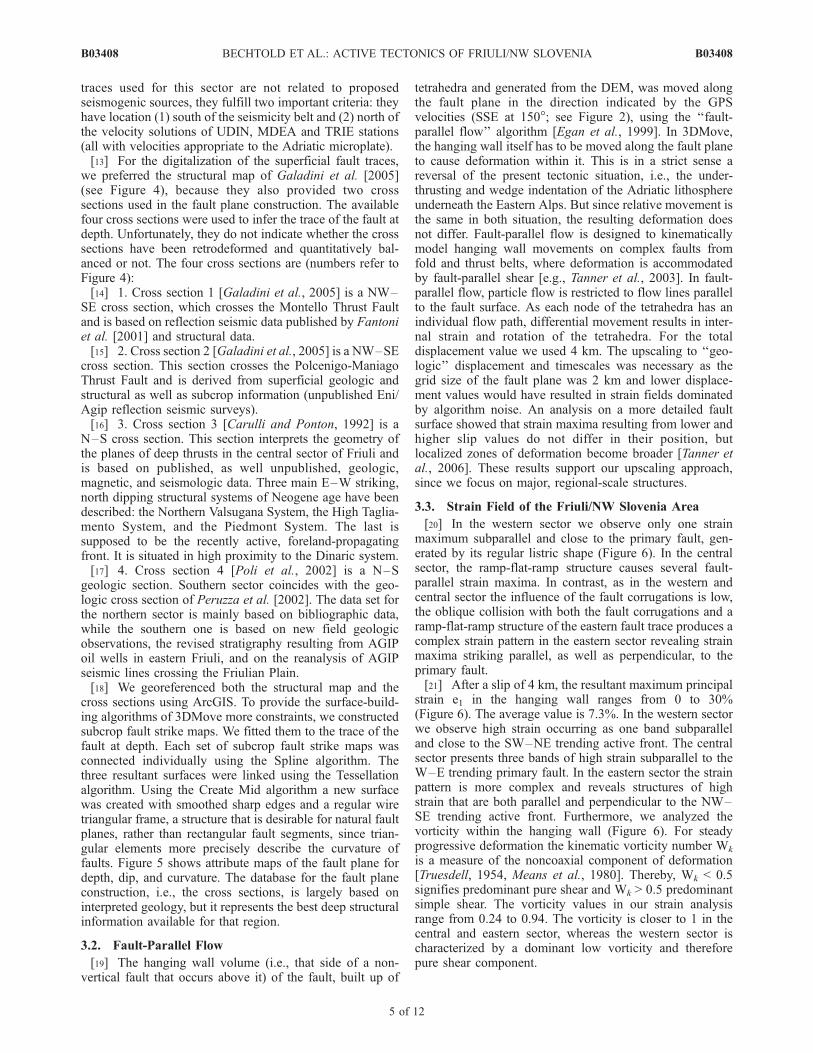
we preferred the structural map of Galadini et al. [2005](see Figure 4), because they also provided two crosssections used in the fault plane construction. The availablefour cross sections were used to infer the trace of the fault atdepth. Unfortunately, they do not indicate whether the crosssections have been retrodeformed and quantitatively bal-anced or not. The four cross sections are (numbers refer toFigure 4):[14] 1. Cross section 1 [Galadini et al., 2005] is a NW–
SE cross section, which crosses the Montello Thrust Faultand is based on reflection seismic data published by Fantoniet al. [2001] and structural data.[15] 2. Cross section 2 [Galadini et al., 2005] is a NW–SE
cross section. This section crosses the Polcenigo-ManiagoThrust Fault and is derived from superficial geologic andstructural as well as subcrop information (unpublished Eni/Agip reflection seismic surveys).[16] 3. Cross section 3 [Carulli and Ponton, 1992] is a
N–S cross section. This section interprets the geometry ofthe planes of deep thrusts in the central sector of Friuli andis based on published, as well unpublished, geologic,magnetic, and seismologic data. Three main E–W striking,north dipping structural systems of Neogene age have beendescribed: the Northern Valsugana System, the High Taglia-mento System, and the Piedmont System. The last issupposed to be the recently active, foreland-propagatingfront. It is situated in high proximity to the Dinaric system.[17] 4. Cross section 4 [Poli et al., 2002] is a N–S
geologic section. Southern sector coincides with the geo-logic cross section of Peruzza et al. [2002]. The data set forthe northern sector is mainly based on bibliographic data,while the southern one is based on new field geologicobservations, the revised stratigraphy resulting from AGIPoil wells in eastern Friuli, and on the reanalysis of AGIPseismic lines crossing the Friulian Plain.[18] We georeferenced both the structural map and the
cross sections using ArcGIS. To provide the surface-build-ing algorithms of 3DMove more constraints, we constructedsubcrop fault strike maps. We fitted them to the trace of thefault at depth. Each set of subcrop fault strike maps wasconnected individually using the Spline algorithm. Thethree resultant surfaces were linked using the Tessellationalgorithm. Using the Create Mid algorithm a new surfacewas created with smoothed sharp edges and a regular wiretriangular frame, a structure that is desirable for natural faultplanes, rather than rectangular fault segments, since trian-gular elements more precisely describe the curvature offaults. Figure 5 shows attribute maps of the fault plane fordepth, dip, and curvature. The database for the fault planeconstruction, i.e., the cross sections, is largely based oninterpreted geology, but it represents the best deep structuralinformation available for that region.
3.2. Fault-Parallel Flow
[19] The hanging wall volume (i.e., that side of a non-vertical fault that occurs above it) of the fault, built up of
tetrahedra and generated from the DEM, was moved alongthe fault plane in the direction indicated by the GPSvelocities (SSE at 150�; see Figure 2), using the ‘‘fault-parallel flow’’ algorithm [Egan et al., 1999]. In 3DMove,the hanging wall itself has to be moved along the fault planeto cause deformation within it. This is in a strict sense areversal of the present tectonic situation, i.e., the under-thrusting and wedge indentation of the Adriatic lithosphereunderneath the Eastern Alps. But since relative movement isthe same in both situation, the resulting deformation doesnot differ. Fault-parallel flow is designed to kinematicallymodel hanging wall movements on complex faults fromfold and thrust belts, where deformation is accommodatedby fault-parallel shear [e.g., Tanner et al., 2003]. In fault-parallel flow, particle flow is restricted to flow lines parallelto the fault surface. As each node of the tetrahedra has anindividual flow path, differential movement results in inter-nal strain and rotation of the tetrahedra. For the totaldisplacement value we used 4 km. The upscaling to ‘‘geo-logic’’ displacement and timescales was necessary as thegrid size of the fault plane was 2 km and lower displace-ment values would have resulted in strain fields dominatedby algorithm noise. An analysis on a more detailed faultsurface showed that strain maxima resulting from lower andhigher slip values do not differ in their position, butlocalized zones of deformation become broader [Tanner etal., 2006]. These results support our upscaling approach,since we focus on major, regional-scale structures.
3.3. Strain Field of the Friuli/NW Slovenia Area
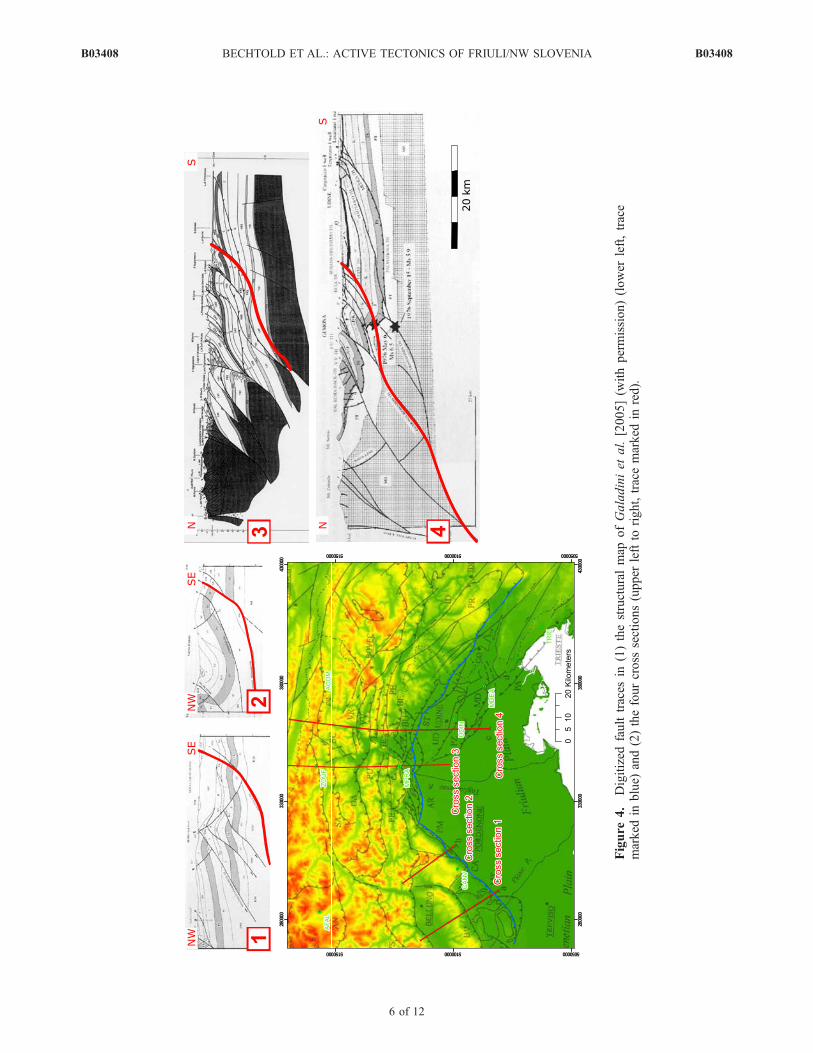
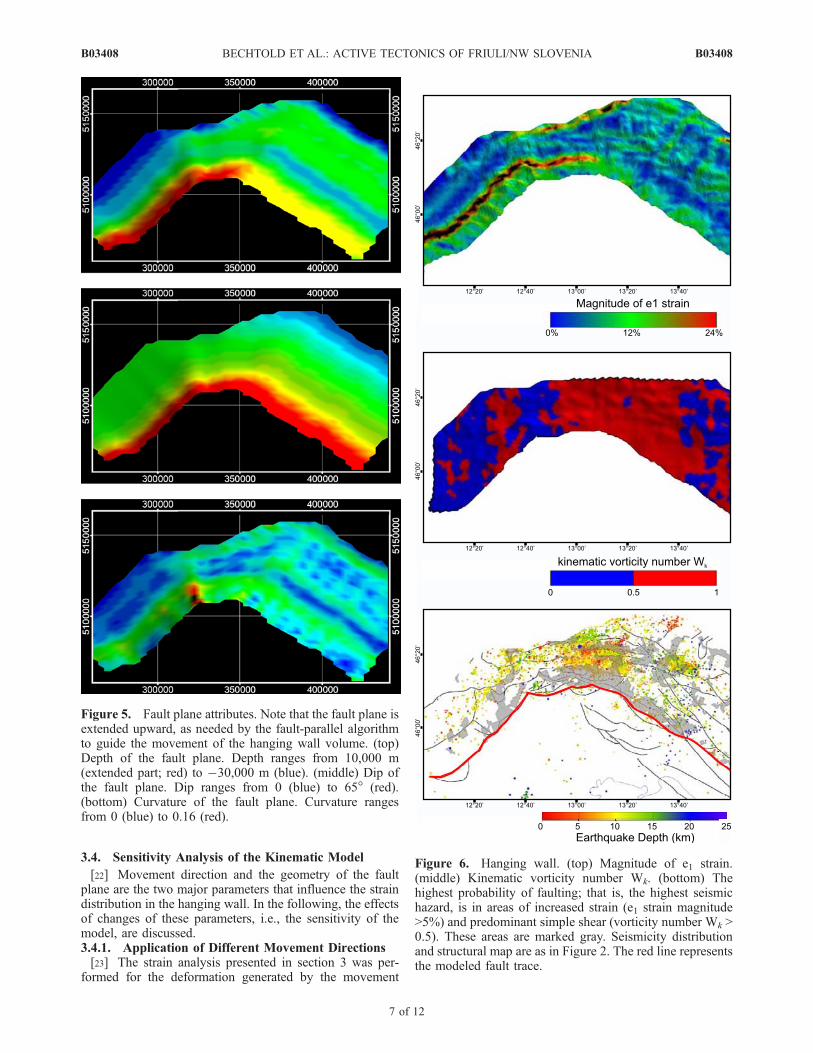
[20] In the western sector we observe only one strainmaximum subparallel and close to the primary fault, gen-erated by its regular listric shape (Figure 6). In the centralsector, the ramp-flat-ramp structure causes several fault-parallel strain maxima. In contrast, as in the western andcentral sector the influence of the fault corrugations is low,the oblique collision with both the fault corrugations and aramp-flat-ramp structure of the eastern fault trace produces acomplex strain pattern in the eastern sector revealing strainmaxima striking parallel, as well as perpendicular, to theprimary fault.[21] After a slip of 4 km, the resultant maximum principal
strain e1 in the hanging wall ranges from 0 to 30%(Figure 6). The average value is 7.3%. In the western sectorwe observe high strain occurring as one band subparalleland close to the SW–NE trending active front. The centralsector presents three bands of high strain subparallel to theW–E trending primary fault. In the eastern sector the strainpattern is more complex and reveals structures of highstrain that are both parallel and perpendicular to the NW–SE trending active front. Furthermore, we analyzed thevorticity within the hanging wall (Figure 6). For steadyprogressive deformation the kinematic vorticity number Wk
is a measure of the noncoaxial component of deformation[Truesdell, 1954, Means et al., 1980]. Thereby, Wk < 0.5signifies predominant pure shear and Wk > 0.5 predominantsimple shear. The vorticity values in our strain analysisrange from 0.24 to 0.94. The vorticity is closer to 1 in thecentral and eastern sector, whereas the western sector ischaracterized by a dominant low vorticity and thereforepure shear component.
B03408 BECHTOLD ET AL.: ACTIVE TECTONICS OF FRIULI/NW SLOVENIA
5 of 12
B03408
Figure
4.
Digitized
faulttraces
in(1)thestructuralmap
ofGaladiniet
al.[2005](w
ithpermission)(lower
left,trace
marked
inblue)
and(2)thefourcross
sections(upper
leftto
right,tracemarked
inred).
B03408 BECHTOLD ET AL.: ACTIVE TECTONICS OF FRIULI/NW SLOVENIA
6 of 12
B03408
3.4. Sensitivity Analysis of the Kinematic Model
[22] Movement direction and the geometry of the faultplane are the two major parameters that influence the straindistribution in the hanging wall. In the following, the effectsof changes of these parameters, i.e., the sensitivity of themodel, are discussed.3.4.1. Application of Different Movement Directions[23] The strain analysis presented in section 3 was per-
formed for the deformation generated by the movement
Figure 5. Fault plane attributes. Note that the fault plane isextended upward, as needed by the fault-parallel algorithmto guide the movement of the hanging wall volume. (top)Depth of the fault plane. Depth ranges from 10,000 m(extended part; red) to �30,000 m (blue). (middle) Dip ofthe fault plane. Dip ranges from 0 (blue) to 65� (red).(bottom) Curvature of the fault plane. Curvature rangesfrom 0 (blue) to 0.16 (red).
Figure 6. Hanging wall. (top) Magnitude of e1 strain.(middle) Kinematic vorticity number Wk. (bottom) Thehighest probability of faulting; that is, the highest seismichazard, is in areas of increased strain (e1 strain magnitude>5%) and predominant simple shear (vorticity number Wk >0.5). These areas are marked gray. Seismicity distributionand structural map are as in Figure 2. The red line representsthe modeled fault trace.
B03408 BECHTOLD ET AL.: ACTIVE TECTONICS OF FRIULI/NW SLOVENIA
7 of 12
B03408

indicated by the GPS velocity field. The angle of collision(SSE at 150�) of southern Friuli (footwall) with respect tonorthern Friuli (hanging wall) was inferred from the solu-tion stabilized for northern Friuli.[24] The error ellipses of the GPS velocity vectors (see
Figure 2) indicate that the actual angle of collision couldvary by 10� to 20�. To test the effects of different movementdirections, we moved the hanging wall along the fault planewith several different directions (from SE (135�) to SW(215�)). Figure 7 demonstrates the variation of the distribu-tion of the e1 strain magnitude.[25] The strain magnitude of the western band of high
strain continuously decreases from Figure 7a to 7h, i.e.,from a frontal collision with the western fault trace to anoblique one. Furthermore, the band of high strain graduallyloses its coherence and begins to be disrupted by areas ofintermediate strain. The opposite occurs close to the easternfault trace. An initially discontinuous band of alternatinglow and intermediate strain values turns into a coherentband of increased intermediate strain. In the central sectorthe bands of intermediate and high strain present theirhighest magnitude for a north directed collision. Another
important change of the strain distribution occurs in thehinterland of the eastern sector, which presents the mostcomplex strain distribution. From Figures 7a to 7h thestructures of moderate strain oriented perpendicular to thestrike of the fault gradually disappear, and are replaced byboth fault-parallel and E–W striking structures.[26] The detailed strain analysis applied in this study
(SSE at 150�) lies between Figure 7b and 7c. The straindistributions of Figures 7a to 7d indicates that differencesproduced by variations of 10� to 20� with respect to thedirection of this study are only minor. In this range thedeformation observation is almost unchanged and the strainmagnitude only differs slightly.3.4.2. Alternative Fault Planes[27] The fault plane used for the kinematic model of this
study was built with information of the velocity field,proposed seismogenic sources, structural maps, cross sec-tions, seismicity and DEM. The aim was to estimate thegeometry of the recently active front of the foreland-propagating thrust system.[28] Whereas in the western sector, the active front is
clearly defined (see section 3.1.), the central and eastern
Figure 7. Magnitude of e1 as color map as response to different movement directions (from SE (135�)to SW (215�)). Color map is as in Figure 6.
B03408 BECHTOLD ET AL.: ACTIVE TECTONICS OF FRIULI/NW SLOVENIA
8 of 12
B03408

sector present various faults and it is currently not knownwhich of them represents the recently active front. Toevaluate the effects of the application of alternative faultplanes on the strain distribution, we created two two-dimensional models for the central and eastern sectors(Figure 8). We imported all fault traces that representpossible active structures (G. Bressan, personal communi-cation, 2006) of the cross sections 3 and 4 (see section 3.1)into 3DMove to form two separate two-dimensional mod-els. In each model, we moved along the three and four,respectively, southernmost faults (see Figure 8), applyingthe same parameters as before.[29] The two-dimensional models show that the resultant
strain moves northward when using more northerly faultplanes. But the resultant strain patterns are very similar.The models 2b, 2c and 2d all have two major strainmaxima produced by the ramp-flat-ramp structure the threefaults have in common. The surface fault trace applied inmodel 2a is located south of all FReDNet GPS stations.Therefore, there is no kinematic evidence that this faultrepresents a possible, recently active structure. The straindistribution of the models 1a, 1b and 1c are also compa-rable. One major strain maxima is located close to the faultand followed by a rather distributed strain field with severalminor maxima.[30] With the criteria presented in section 3.1, the fault
plane of this study represented the best alternative to estimatethe recently active thrust front. The two-dimensional modelsshow that even if we chose an alternative fault trace, no
major changes in the strain pattern would be expected, butonly a northward shift of the whole strain field.
4. Discussion
4.1. Interpretation of Friulian CGPS Velocities
[31] The resultant GPS velocity field constrains the areain which the horizontal shortening of approximately 2 mm/atakes place (Figure 2). The southern border is defined by thestations UDIN, MDEA and TRIE, which present crustalvelocities that are in the range of those estimated for Adria[e.g., D’Agostino et al., 2005]. The stations ACOM, ZOUFand AFAL define the northern border of the shorteningsector. These stations are north of the active seismicity anddemonstrate only a residual northward movement of about1 mm/a with respect to stable Eurasia. As AFAL, ZOUF,ACOM and MPRA, also CANV is situated north of theactive thrust front. Thus, the long-term geologic (block)velocity at CANV should be significantly lower than theone of the Adriatic microplate. But the geodetically deter-mined velocity of CANV shows the opposite. CANV doesnot move slower, but with an even slightly higher velocitythan Adria. Whether this anomalous high velocity of CANVis really based on crustal kinematics, may be related to itsvicinity to the SE verging, active Polcenigo-Maniago Thrust(PMT) (1873 (M > 6) earthquake) [Galadini et al., 2005], oraffected by monument instabilities is not discussed in detailhere. A prolonged time series that significantly exceeds theminimum time span of 2.5 years is needed and will providea better basis for interpreting a single anomalous sitevelocity.
4.2. Interpretation of the Kinematically ModeledStrain Field
[32] The software package 3DMove is able to movethree-dimensional objects over faults, using appropriatekinematic algorithms. The algorithms bind the deformationof the faulted objects to the fault morphology, while main-taining a structural continuum. Since this a kinematicgeometric modeling program, it is not possible to addrheological information to the various geological bodies.In addition, objects can only be moved upon one fault at onetime. 3DMove is based on the pure geometric approachnormally used to retrodeform geologic models, while main-taining structural continuity, bed length and volume, etc asconstrains. In its simplest form, this involves two-dimen-sional models with downdip movement. In our study, weuse the same techniques, but for a three-dimensional modelwith a curved and regionally convolute fault morphology,and move the hanging wall obliquely (according to the GPSdata). In essence, the models produced by 3DMove can thusdemonstrate the far-field effect of fault movement, ascaused by the kinematic movement of the geologic objectsover the fault morphology.[33] Our kinematic model show the effects of the indent-
er-shaped active fault front on the development of second-ary fault systems. Because of sparse information on theactive front, the proposed fault plane is a simplified ap-proximation of the real plate boundary between the Adriaticmicroplate and Europe. But on the basis of a sensitivityanalysis (testing of alternative fault planes, application ofdifferent movement directions that lie in the range of the
Figure 8. Two two-dimensional models with alternativefault planes. (a to c) Central sector. (d-g) Eastern sector. Ineach model the slip value was 4000 m and the applieddirection SSE at 150�. The color map is as in Figure 6. Ineach plot, the fault used is marked red. Figures 8a and 8dare the fault traces used to build the recently active thrustfront of this study.
B03408 BECHTOLD ET AL.: ACTIVE TECTONICS OF FRIULI/NW SLOVENIA
9 of 12
B03408
estimated error, application of different slip values; seesection 3.4), we find that the principal strain results, i.e.,the pattern of zones of the highest probability of faulting, donot change significantly. The modeled strain field is of purekinematic origin, produced by the movement along thefault. The three-dimensional geologic restoration algorithmsand tools of 3DMove are based on the pure geometricalapproach. Thus, the deformation of the hanging wall is onlycontrolled by the interaction of the movement direction, thetotal slip and the fault geometry. In general, higher strain isconcentrated at zones of high fault curvature. The modeledfault plane of this study presents three types of curvature:(1) change of fault dip, obtained from the cross sections; (2)fault corrugations (generated by curvature of the surfacefault trace), and (3) the general indenter-shaped geometry,i.e., the related segment linkages between the western,central and eastern sector.[34] The orientation of the movement direction determines
whether the effect of one curvature type on the straindistribution is strong or weak. The oblique collision of Adriawith eastern southern Alps causes a predominant frontal,perpendicular collision with the active front in the westernand central sector, whereas in the eastern sector the move-ment direction forms a relatively acute angle (30�) with thefault front. As a consequence each sector has its individualstrain field (Figure 6). In the western sector, the single band ofhigh strain is generated by the regular listric shape of theprimary fault. In the central sector, the primary fault presentsa ramp-flat-ramp structure and causes several fault-parallelstrain maxima. In contrast, in the western and central sectorthe influence of the fault corrugations is low, the obliquecollision with both the fault corrugations and a ramp-flat-ramp structure of the eastern fault trace produces a complexstrain pattern in the eastern sector revealing strain maximastriking parallel, as well as perpendicular, to the primary fault.[35] We consider the absolute strain magnitude to be the
main factor controlling whether a rupture occurs or not.Deformation nucleates at strain maxima. Therefore, forexample, the strain distribution around faults can be directlycorrelated to the density of fractures [Okubo and Schultz,2005]. On a regional scale, the fault slip induced, secondarystructures will be faults. It is along these structures thatregional elastic distortions are minimized by displacement(earthquakes). Another important factor is the amount ofvorticity. It determines whether a rupture occurs in a certainarea or the energy is transferred to the neighborhood. Thehigher vorticity values in the central and northern part of theeastern sector (Figure 6) are mainly caused by the shape ofthe indenter fault. The hanging wall bodies try to flowaround the apex of the indenter and thereby obtain arotational component.[36] When trying to correlate modeling results from the
Friuli area with the seismicity distribution monitored since1977, one should bear in mind that in this area the typicalrecurrence intervals of earthquakes M > 6 are 1 order ofmagnitude longer than the 30 year long history of seismicmonitoring. The stress redistribution caused by the 1976sequence possibly produced a maximum seismic activity inthe central sector. But it cannot be assured that to the eastand west the seismic activity reaches the same level withinthe next 100 or 200 years. Therefore, it is probablymisleading to tune model parameters in order to obtain
the best fit with the seismic energy recently released from1977 until today, as for example done by Rossi et al. [2005].Rather modeling results should help to predict activestructures that have been inactive, i.e., accumulating strain,during the last three decades.[37] We defined the concurrence of high strain (e1 strain
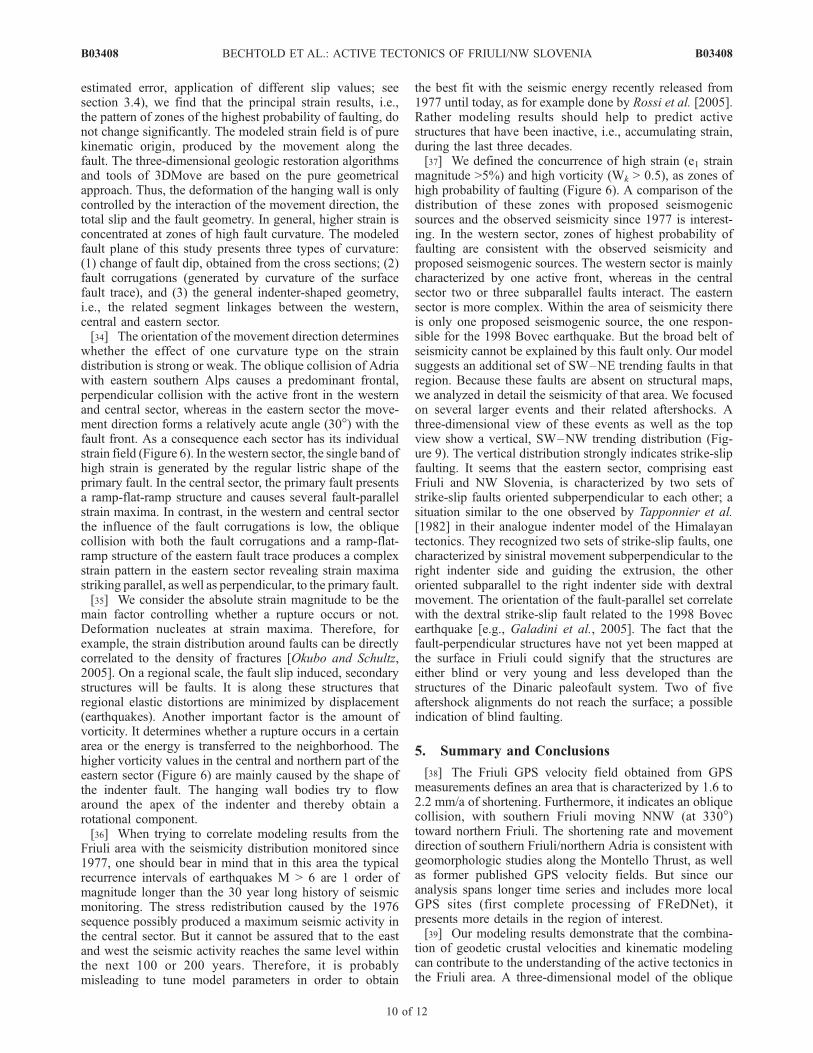
magnitude >5%) and high vorticity (Wk > 0.5), as zones ofhigh probability of faulting (Figure 6). A comparison of thedistribution of these zones with proposed seismogenicsources and the observed seismicity since 1977 is interest-ing. In the western sector, zones of highest probability offaulting are consistent with the observed seismicity andproposed seismogenic sources. The western sector is mainlycharacterized by one active front, whereas in the centralsector two or three subparallel faults interact. The easternsector is more complex. Within the area of seismicity thereis only one proposed seismogenic source, the one respon-sible for the 1998 Bovec earthquake. But the broad belt ofseismicity cannot be explained by this fault only. Our modelsuggests an additional set of SW–NE trending faults in thatregion. Because these faults are absent on structural maps,we analyzed in detail the seismicity of that area. We focusedon several larger events and their related aftershocks. Athree-dimensional view of these events as well as the topview show a vertical, SW–NW trending distribution (Fig-ure 9). The vertical distribution strongly indicates strike-slipfaulting. It seems that the eastern sector, comprising eastFriuli and NW Slovenia, is characterized by two sets ofstrike-slip faults oriented subperpendicular to each other; asituation similar to the one observed by Tapponnier et al.[1982] in their analogue indenter model of the Himalayantectonics. They recognized two sets of strike-slip faults, onecharacterized by sinistral movement subperpendicular to theright indenter side and guiding the extrusion, the otheroriented subparallel to the right indenter side with dextralmovement. The orientation of the fault-parallel set correlatewith the dextral strike-slip fault related to the 1998 Bovecearthquake [e.g., Galadini et al., 2005]. The fact that thefault-perpendicular structures have not yet been mapped atthe surface in Friuli could signify that the structures areeither blind or very young and less developed than thestructures of the Dinaric paleofault system. Two of fiveaftershock alignments do not reach the surface; a possibleindication of blind faulting.
5. Summary and Conclusions
[38] The Friuli GPS velocity field obtained from GPSmeasurements defines an area that is characterized by 1.6 to2.2 mm/a of shortening. Furthermore, it indicates an obliquecollision, with southern Friuli moving NNW (at 330�)toward northern Friuli. The shortening rate and movementdirection of southern Friuli/northern Adria is consistent withgeomorphologic studies along the Montello Thrust, as wellas former published GPS velocity fields. But since ouranalysis spans longer time series and includes more localGPS sites (first complete processing of FReDNet), itpresents more details in the region of interest.[39] Our modeling results demonstrate that the combina-
tion of geodetic crustal velocities and kinematic modelingcan contribute to the understanding of the active tectonics inthe Friuli area. A three-dimensional model of the oblique
B03408 BECHTOLD ET AL.: ACTIVE TECTONICS OF FRIULI/NW SLOVENIA
10 of 12
B03408
collision of the Adriatic microplate with the eastern south-ern Alps, guided by the indenter-shaped fault plane, isconsistent with the current knowledge on seismogenicsources, but also indicates fault systems that may have notbeen recognized yet. The strain field induced by moving onthe recently active front of the foreland-propagating thrustsystem indicates active, secondary structures in the hangingwall. Thereby, the concurrence of a high strain magnitudeand a high vorticity number signifies a high probability offaulting. In the western sector, zones of the highest proba-bility of faulting are scarce and mainly show one, discon-tinuous, fault-parallel structure. The central sector, i.e., thearea of Tagliamento River, presents three fault-parallelstructures that are consistent with the interaction of threeactive thrusts proposed by Galadini et al. [2005]. The strainfield of the eastern sector indicates intense secondaryfaulting in the hinterland. Two sets of faults orientedsubperpendicular to each other interact in this sector. Theorientation of the fault-parallel set correlate with the dextralstrike-slip fault related to the 1998 Bovec earthquake. Thefault-perpendicular structures are absent in structural maps,but can be correlated with selected seismic events andrelated aftershocks and indicate sinistral strike-slip faulting.The situation of two interacting strike-slip faults is similar tothe one analyzed by Tapponnier et al. [1982] in theiranalogue indenter model of the Himalayan tectonics.
[40] Acknowledgments. D. I. Nikolayev wrote the code used to com-pute the vorticity. B.King (MIT) and T.A. Herring (MIT) provided a number ofhelpful suggestions for the GPS data processing. Thanks also to G. Bressan forproviding geological cross sections and E. Serpelloni for discussing our GPSand modeling approach at the beginning. Comments by R. Bennett and ananonymous reviewer greatly helped to improve the manuscript.
ReferencesAltamimi, Z., P. Sillard, and C. Boucher (2002), ITRF2000: A new releaseof the International Terrestrial Reference Frame for earth science applica-tions, J. Geophys. Res., 107(B10), 2214, doi:10.1029/2001JB000561.
Anderson, H. A., and J. A. Jackson (1987), Active tectonics of the Adriaticregion, Geophys. J. R. Astron. Soc., 91, 937–983.
Battaglia, M., M. H. Murray, E. Serpelloni, and R. Burgmann (2004), TheAdriatic region: An independent microplate within the Africa-Eurasiacollision zone, Geophys. Res. Lett., 31, L09605, doi:10.1029/2004GL019723.
Bechtold, M. (2007), Earthquake Potential in the Italian southern Alps,M.S. thesis, 138 pp., Univ. of Gottingen, Gottingen, Germany.
Benedetti, L., P. Tapponnier, G. C. P. King, B. Meyer, and I. Manighetti(2000), Growth folding and active thrusting in the Montello region, Ve-neto, northern Italy, J. Geophys. Res., 105(B1), 739–766.
Blewitt, G., and D. Lavallee (2002), Effect of annual signals on geodeticvelocity, J. Geophys. Res., 107(B7), 2145, doi:10.1029/2001JB000570.
Bressan, G., A. Snidarcig, and C. Venturini (1998), Present state of tectonicstress of the Friuli area (eastern southern Alps), Tectonophysics, 292,211–227, doi:10.1016/S0040-1951(98)00065-1.
Bressan, G., P. L. Bragato, and C. Venturini (2003), Stress and strain tensorsbased on focal mechanisms in the seismotectonic framework of the Friuli-Venezia Giulia region (northeastern Italy), Bull. Seismol. Soc. Am., 93(3),1280–1297, doi:10.1785/0120020058.
Caporali, A., et al. (2008), Geokinematics of central Europe: New insightsfrom the CERGOP-2/Environment Project, J. Geodyn., 45, 246–256,doi:10.1016/j.jog.2008.01.004.
Carulli, G. B., and M. Ponton (1992), Interpretazione strutturale profondadel settore centrale carnico-friulano, Studi Geol. Camerti, vol. spec. 2,275–284.
Castellarin, A., R. Nicolich, R. Fantoni, L. Cantelli, M. Sella, and L. Selli(2006), Structure of the lithosphere beneath the Eastern Alps (southernsector of the TRANSALP transect), Tectonophysics, 414, 259–282,doi:10.1016/j.tecto.2005.10.013.
D’Agostino, N., D. Cheloni, S. Mantenuto, G. Selvaggi, A. Michelini, andD. Zuliani (2005), Strain accumulation in the southern Alps (NE Italy)and deformation at the northeastern boundary of Adria observed byCGPS measurements, Geophys. Res. Lett., 32, L19306, doi:10.1029/2005GL024266.
Egan, S. S., S. Kane, T. S. Buddin, G. D. Williams, and D. Hodgetts (1999),Computer modelling and visualisation of the structural deformationcaused by movement along geological faults, Comput. Geosci., 25,doi:10.1016/S0098-3004(98)00125-3.
Fantoni, R., C. Barbieri, D. Catellani, D. Castellarin, A. Di Giulio, andC. Pessina (2001), The record of south-Alpine events in the Venetianforeland and foredeep, Geol. Palaontol. Mitt. Innsbruck, 25, 79–81.
Feigl, K. L., et al. (1993), Space geodetic measurement of crustal deforma-tion in central and southern California, 1984–1992, J. Geophys. Res.,98(B12), 21,677–21,712.
Galadini, F., M. E. Poli, and A. Zanferrari (2005), Seismogenic sourcespotentially responsible for earthquakes with M > 6 in the eastern southern
Figure 9. Three-dimensional view, perpendicular to the eastern fault trace. View from NE. Gray, faultplane; blue, DEM. The events that present a SW–NE trending alignment are shown. Each aftershocksequence is represented by one color. Inset shows the top view; view direction is indicated.
B03408 BECHTOLD ET AL.: ACTIVE TECTONICS OF FRIULI/NW SLOVENIA
11 of 12
B03408

Alps (Thiene-Udine sector, NE Italy), Geophys. J. Int., 161(3), 739–762,doi:10.1111/j.1365-246X.2005.02571.x.
Grenerczy, G., G. Sella, S. Stein, and A. Kenyeres (2005), Tectonic im-plications of the GPS velocity field in the northern Adriatic region, Geo-phys. Res. Lett., 32, L16311, doi:10.1029/2005GL022947.
Herring, T. A. (2003a), GLOBK: Global Kalman filter VLBI and GPSanalysis program, version 10.1, 91 pp., Mass. Inst. of Technol., Cam-bridge.
Herring, T. A. (2003b), MATLAB Tools for viewing GPS velocities andtime series, GPS Solutions, 7(3), 194–199.
McClusky, S., et al. (2000), Global Positioning System constraints on platekinematics and dynamics in the eastern Mediterranean and Caucasus,J. Geophys. Res., 105(B3), 5695–5720.
Means, W. D., B. E. Hobbs, G. S. Lister, and P. F. Williams (1980),Vorticity and non-coaxiality in progressive deformations, J. Struct. Geol.,2(3), 371–378.
Okubo, C. H., and R. A. Schultz (2005), Evolution of damage zonegeometry and intensity in porous sandstone: Insight gained from strainenergy density, J. Geol. Soc., 162(6), 939–949, doi:10.1144/0016-764904-148.
Peruzza, L., M. E. Poli, A. Rebez, G. Renner, S. Rogledi, D. Slejko, andA. Zanferrari (2002), The 1976–1977 seismic sequence in Friuli: Newseismotectonic aspects, Mem. Soc. Geol. Ital., 57, 391–400.
Pfiffner, O. A., and J. G. Ramsay (1982), Constraints on geological strainrates: Arguments from finite strain states of naturally deformed rocks,J. Geophys. Res., 87(B1), 311–321.
Poli, M. E., and G. Renner (2004), Normal focal mechanisms in the JulianAlps and Prealps: seismotectonic implications for the Italian-Slovenianborder region, Boll. Geofis. Teorica Appl., 45(1–2), 51–69.
Poli, M. E., L. Peruzza, A. Rebez, G. Renner, D. Slejko, and A. Zanferrari(2002), New seismotectonic evidence from the analysis of the 1976–1977 and 1977–1999 seismicity in Friuli (NE Italy), Boll. Geofis. Teor-ica Appl., 43, 53–78.
Reilinger, R., et al. (2006), GPS constraints on continental deformation inthe Africa-Arabia-Eurasia continental collision zone and implications forthe dynamics of plate interactions, J. Geophys. Res., 111, B05411,doi:10.1029/2005JB004051.
Rossi, G., C. Ebblin, and M. Zadro (2005), 3D finite-elements kinematicmodel of the Adria northern region: Stress analysis, Boll. Geofis. TeoricaAppl., 46(1), 23–46.
Serpelloni, E., G. Vannucci, S. Pondrelli, A. Argnani, G. Casula, M. Anzidei,P. Baldi, and P. Gasperini (2007), Kinematics of the western Africa-Eurasia plate boundary from focal mechanisms and GPS data, Geophys.J. Int., 169(3), 1180–1200, doi:10.1111/j.1365-246X.2007.03367.x.
Slejko, D., G. Neri, I. Orozova, G. Renner, and M. Wyss (1999), Stress fieldin Friuli (NE Italy) from fault plane solutions of activity following the1976 main shock, Bull. Seismol. Soc. Am., 89(4), 1037–1052.
Tanner, D. C., J. H. Behrmann, and H. Dresmann (2003), Three-dimen-sional retro-deformation of the Lechtal Nappe, northern Calcareous Alps,J. Struct. Geol., 25, 737–748, doi:10.1016/S0191-8141(02)00057-3.
Tanner, D. C., T. Lohr, C. M. Krawczyk, O. Oncken, H. Endres, R. Samiee,H. Trappe, and P. Kukla (2006), Multi-scale structures around faults—Comparison of natural and 3D kinematic retrodeformation modelling datafrom Permian strata in the NW German Basin, paper presented at GVInternational Conference, Geol. Ver., Potsdam, Germany, 25–29 Sept.
Tapponnier, P., G. Peltzer, A. Y. Le Dain, R. Armijo, and P. Cobbold(1982), Propagating extrusion tectonics in Asia: New insights from sim-ple experiments with plasticine, Geology, 10, 611–616.
Truesdell, C. (1954), The Kinematics of Vorticity, 232 pp., Indiana Univ.Press, Bloomington.
�����������������������M. Battaglia, Department of Earth Sciences, University of Rome I ‘‘La
Sapienza,’’ Piazzale Aldo Moro 5, I-00185 Roma, Italy.M. Bechtold, Institute of Chemistry and Dynamics of the Geosphere,
Institute Agrosphere, Research Centre Julich, D-52425 Julich, Germany.([email protected])D. C. Tanner, Leibniz Institute for Applied Geosciences, Stilleweg 2,
D-30655 Hannover, Germany.D. Zuliani, Centro Ricerche Sismologiche, Via Treviso 55, I-33100
Udine, Italy.
B03408 BECHTOLD ET AL.: ACTIVE TECTONICS OF FRIULI/NW SLOVENIA
12 of 12
B03408