The landscape geometry and active tectonics of northwest Greece
26
The landscape geometry and active tectonics of northwest Greece GEOFFREY KING Institut de Physique du Globe de Strasbourg, 5 rue René Descartes, Strasbourg, Cedex, France DEREK STURDY Institute of Prehistoric Sciences and Archaeology, University of Liverpool, England JOHN WHITNEY U.S. Geological Survey, Box 25046, M.S. 913, Denver Federal Center, Denver, Colorado 80225 ABSTRACT When a region is tectonically deformed, its geometry changes. Some of these changes pro- duce easily identified and often readily datable morphological features such as regions of rapid uplift and subsidence, sediment ponds, or river terraces. These features are usually secondary to the main active structures and consequently do not provide information about them di- rectly. We show, however, that simple models using boundary-element methods can be adapted to relate the evolution of these minor features to motion on m^jor structures. This adds substantially to the information available to determine motion on such features. In this paper, we apply the technique to northwest Greece. We show that, in addition to the long- recognized compressional component of mo- tion in Epirus, a substantial left-lateral strike- slip component of motion must be present. The modeling allows us to identify a regional slip vector of N275°E. This slip vector suggests that the plate con- figuration assumed by previous workers must be modified. A new configuration is proposed that remains consistent with the data used for earlier interpretations and our new data. It is proposed that the Medina Wrench is a signif- icant active structure and that a period of qui- escence explains the low seismic activity at present. The plate configuration and angular rotation rates that we suggest require that the Gulf of Arta is associated with a triple junction. Using the slip vectors we have defined for the plates meeting at this junction, we model the regions of uplift and subsidence in the region. The abil- ity of this model to explain many features as- sociated with the Gulf provides assurance that our overall tectonic model is correct. INTRODUCTION In this paper, we build on the work of Bil- ham and King (1989a, 1989b), Hackman and others (1989), and Shedlock and others (1990). They show that a knowledge of the plate motions and configuration of major faults can be used to predict the location of secondary faults and localized regions of ac- tive uplift and subsidence. In this paper, we show that the reverse is also true; a knowl- edge of the configuration of major faults and the nature of secondary features can be used to predict plate motions. This provides an additional technique to examine the active deformation of continental crust on a regional scale. The area that we examined was extensively studied by Aubouin (1965) and by the authors of Institut Greque des Recherches Sous-Sol- Institut Français de Pétrole (IGRSS/IFP) (1966), who regarded it as a region where overall contraction was occurring perpendic- ular to the trend of the mountain fronts and associated fold axes. We argue that, in order to explain secondary features such as local- ized areas of uplift and subsidence, we need to invoke substantial strike-slip motion as well, and we use boundary-element modeling to quantify it and hence determine the direc- tion of relative displacement between one side of the region and the other. Armed with this direction, we modify earlier views of Le Pichon and Angelier (1979) and Jongsma and others (1987) to produce a system of plates and poles of rotation for the central Mediter- ranean which are consistent with a wide range of observations. Our new view supports the existence of Jongsma's Ionian plate, but we now suggest that it has a southern boundary extending from the southern end of the Malta- Sicily escarpment to the Strabo trench, with a pole of rotation relative to Africa that lies in northern Macedonia. In addition to providing a satisfactory explanation, both for our new data and earlier data, the slip system sug- gested by the model explains the morphology of the Gulf of Arta. We recognize that recent data concerning deformation of the Southern Aegean (for example, Lyon-Caen and others, 1988; Taymaz, 1990) could modify the system of poles that we propose, and we discuss this below. The plate-tectonic framework pro- posed by Le Pichon and Angelier (1979), however, has the virtue of simplicity and re- mains a good starting point for a discussion of the kinematics of the region. Extracting information about slip direc- tions from the morphology uses a technique developed by Bilham and King (1989a, 1989b) and extended to subsurface features by Shedlock and others (1990). Despite the fact that the crust is multiply faulted over a wide range of scales (see, for example, King, 1983) and is bound to have properties that cannot be simple in detail, they show that boundary- element models (Crouch and Starfield, 1983) correctly predict areas of known uplift and subsidence associated with faulting. In their Californian examples, motion on the San An- dreas fault is shown to create recent topo- graphic features such as Middle Mountain and the Cholame Valley near Parkfield, or the Salton Sea in the Coachella Valley. For input they used reasonable slip rates on the known faults and the plate-displacement rates at a distance. The modeling assumes that the brit- tle crust can be treated as a thin plate and that, except for motion on the faults, deformation obeys, to an adequate approximation, the laws of either linear elasticity or linear duc- tility. Uplift and subsidence are associated with regions where the model predicts reduc- tion and increase of area, respectively. These can be loosely thought of as an effect of Pois- son's ratio. The ratio is a measure of how much the crust thickens in the vertical direc- tion as a consequence of reduction in area in the horizontal. In practice this includes ef- fects due to fracture and flow rather than elas- ticity alone. We model using a Poisson's ratio of 0.25 but accept that the choice is somewhat arbitrary. The modeling makes no allowance for the erosion or deposition of sediment or for the isostatic effect of erosion or deposition of sed- Data Repository item 9311 contains additional material related to this article. Geological Society of America Bulletin, v. 105, p. 137-161, 19 figs., 8 tables, February 1993. 137 on September 15, 2015 gsabulletin.gsapubs.org Downloaded from
-
Upload
independent -
Category
Documents
-
view
3 -
download
0
Transcript of The landscape geometry and active tectonics of northwest Greece
The landscape geometry and active tectonics of northwest Greece
GEOFFREY KING Institut de Physique du Globe de Strasbourg, 5 rue René Descartes, Strasbourg, Cedex, France DEREK STURDY Institute of Prehistoric Sciences and Archaeology, University of Liverpool, England JOHN WHITNEY U.S. Geological Survey, Box 25046, M.S. 913, Denver Federal Center, Denver, Colorado 80225
ABSTRACT
When a region is tectonically deformed, its geometry changes. Some of these changes pro-duce easily identified and often readily datable morphological features such as regions of rapid uplift and subsidence, sediment ponds, or river terraces. These features are usually secondary to the main active structures and consequently do not provide information about them di-rectly. We show, however, that simple models using boundary-element methods can be adapted to relate the evolution of these minor features to motion on m^jor structures. This adds substantially to the information available to determine motion on such features. In this paper, we apply the technique to northwest Greece. We show that, in addition to the long-recognized compressional component of mo-tion in Epirus, a substantial left-lateral strike-slip component of motion must be present. The modeling allows us to identify a regional slip vector of N275°E.
This slip vector suggests that the plate con-figuration assumed by previous workers must be modified. A new configuration is proposed that remains consistent with the data used for earlier interpretations and our new data. It is proposed that the Medina Wrench is a signif-icant active structure and that a period of qui-escence explains the low seismic activity at present.
The plate configuration and angular rotation rates that we suggest require that the Gulf of Arta is associated with a triple junction. Using the slip vectors we have defined for the plates meeting at this junction, we model the regions of uplift and subsidence in the region. The abil-ity of this model to explain many features as-sociated with the Gulf provides assurance that our overall tectonic model is correct.
INTRODUCTION
In this paper, we build on the work of Bil-ham and King (1989a, 1989b), Hackman and
others (1989), and Shedlock and others (1990). They show that a knowledge of the plate motions and configuration of major faults can be used to predict the location of secondary faults and localized regions of ac-tive uplift and subsidence. In this paper, we show that the reverse is also true; a knowl-edge of the configuration of major faults and the nature of secondary features can be used to predict plate motions. This provides an additional technique to examine the active deformation of continental crust on a regional scale.
The area that we examined was extensively studied by Aubouin (1965) and by the authors of Institut Greque des Recherches Sous-Sol-Institut Français de Pétrole (IGRSS/IFP) (1966), who regarded it as a region where overall contraction was occurring perpendic-ular to the trend of the mountain fronts and associated fold axes. We argue that, in order to explain secondary features such as local-ized areas of uplift and subsidence, we need to invoke substantial strike-slip motion as well, and we use boundary-element modeling to quantify it and hence determine the direc-tion of relative displacement between one side of the region and the other. Armed with this direction, we modify earlier views of Le Pichon and Angelier (1979) and Jongsma and others (1987) to produce a system of plates and poles of rotation for the central Mediter-ranean which are consistent with a wide range of observations. Our new view supports the existence of Jongsma's Ionian plate, but we now suggest that it has a southern boundary extending from the southern end of the Malta-Sicily escarpment to the Strabo trench, with a pole of rotation relative to Africa that lies in northern Macedonia. In addition to providing a satisfactory explanation, both for our new data and earlier data, the slip system sug-gested by the model explains the morphology of the Gulf of Arta. We recognize that recent data concerning deformation of the Southern Aegean (for example, Lyon-Caen and others,
1988; Taymaz, 1990) could modify the system of poles that we propose, and we discuss this below. The plate-tectonic framework pro-posed by Le Pichon and Angelier (1979), however, has the virtue of simplicity and re-mains a good starting point for a discussion of the kinematics of the region.
Extracting information about slip direc-tions from the morphology uses a technique developed by Bilham and King (1989a, 1989b) and extended to subsurface features by Shedlock and others (1990). Despite the fact that the crust is multiply faulted over a wide range of scales (see, for example, King, 1983) and is bound to have properties that cannot be simple in detail, they show that boundary-element models (Crouch and Starfield, 1983) correctly predict areas of known uplift and subsidence associated with faulting. In their Californian examples, motion on the San An-dreas fault is shown to create recent topo-graphic features such as Middle Mountain and the Cholame Valley near Parkfield, or the Salton Sea in the Coachella Valley. For input they used reasonable slip rates on the known faults and the plate-displacement rates at a distance. The modeling assumes that the brit-tle crust can be treated as a thin plate and that, except for motion on the faults, deformation obeys, to an adequate approximation, the laws of either linear elasticity or linear duc-tility. Uplift and subsidence are associated with regions where the model predicts reduc-tion and increase of area, respectively. These can be loosely thought of as an effect of Pois-son's ratio. The ratio is a measure of how much the crust thickens in the vertical direc-tion as a consequence of reduction in area in the horizontal. In practice this includes ef-fects due to fracture and flow rather than elas-ticity alone. We model using a Poisson's ratio of 0.25 but accept that the choice is somewhat arbitrary.
The modeling makes no allowance for the erosion or deposition of sediment or for the isostatic effect of erosion or deposition of sed-
Data Repository item 9311 contains additional material related to this article.
Geological Society of America Bulletin, v. 105, p. 137-161, 19 figs., 8 tables, February 1993.
137
on September 15, 2015gsabulletin.gsapubs.orgDownloaded from
KING AND OTHERS
Albania
iment. Both can be significant (King and oth-ers, 1988; Stein and others, 1988). The models therefore indicate only where uplift and sub-sidence are occurring, and relatively little about the rates or total amounts. Despite this apparent limitation, the modeling proves to be robust. A knowledge of fault-slip vectors and distant boundary conditions allows local areas of uplift and subsidence to be predicted. The reverse is also true; a small amount of
uplift and subsidence data, together with the observed fault locations, can place close lim-its on the directions and relative magnitudes of fault slips and on the deformation boundary conditions applied to a region.
In the Californian examples, what is meant by a fault is generally clear; faults can be approximated by lines of zero width. The Epi-rus and Acharnanian regions of northwest Greece have greater compressional and ex-
tensional components than in California, giv-ing rise to wider features. For the purposes of modeling, these "structures," which can be 5 km wide, are regarded in the same way as faults, except that opening or closing dis-placements are permitted. The vertical mo-tions directly associated with these features are not modeled, only the deformation result-ing from geometrical incompatibility between them. The need to choose between the ver-tical motions modeled and those that are not modeled is not in practice a great problem. Geometrical incompatibilities predict defor-mation on scales (tens of kilometers) and in places (downcutting or valleys filling with sediment) that are clearly distinguishable from the main features, and the models are sufficiently well constrained by a few features that areas of ambiguity can simply be ignored.
In Greece, more is known about the rele-vant active morphology than for most other parts of the planet. The extensive information about recent landscape evolution in north-west Greece arises, in part, from the long span of human occupation in the area. Land-form changes can be identified that have af-fected human behavior as far back as the pa-leolithic. Indeed, the field work for this paper arose as a result of a project to study the geography of early human occupation in Epi-rus (King and Bailey, 1985; Sturdy and Web-ley, 1988; Bailey and others, 1986a, 1986b).
THE GEOGRAPHY, GEOLOGY, AND MAJOR STRUCTURAL FEATURES OF NORTHWEST GREECE
The main features of the topography of Epi-rus and Acharnania can be seen in Figure 1. The boundaries of Epirus to the north (in Al-bania) and to the east are formed by the Pin-dus Mountains, a long chain with a north-northwest strike and elevations considerably in excess of2,000 m; these mountains extend from Yugoslavia to the Gulf of Corinth. The southern boundary of Epirus is the Gulf of Arta and its associated depression, about 35 km in diameter. Acharnania lies between the Gulf of Arta to the north, the peninsula of Levkas to the west, the Pindus Mountains to the east, and the Gulf of Corinth to the south.
Within Epirus, a series of ridges, striking ~N25°W, separate the land between the coast and the Pindus Mountains into four dis-tinct regions, each with characteristic eleva-tion, relief, and bedrock. These ridges are composed of Mesozoic carbonates, can reach elevations of more than 2,000 m (although 1,200-1,700 m is the typical range), and are narrow (frequently less than 5 km wide for an
138 Geological Society of America Bulletin, February 1993
on September 15, 2015gsabulletin.gsapubs.orgDownloaded from
LANDSCAPE GEOMETRY AND ACTIVE TECTONICS, GREECE
Epirus & Acharnania Simplified Geology & Geomorphology
D - Douskon K - Koulsokranon P - Pagonaton S - Stavros Z - Zalongon R - Ronkia
High Low Relief Relief
EÜZ3 Igneous Limestone
Flysch Alluvia, Lake Marls, Fans
0 kilometers 20 1 i I
Ionian Sea
Albania
Figure 2. Simplified geology and geomorphology of Epirus and Acharnania.
elevation difference of more than 1,000 m) and often symmetrical. Although the region is traditionally regarded as composed of a series of nappes, the asymmetric vergence that is so obvious in classic regions such as the Alps is
absent both in the topography (Fig. 1) and in geological sections IGRSS/IFP (1966). The region is traversed by four major rivers (named in Fig. 2). The most northerly two rivers, the Kalamas and the Acheron, pass
through the ridges in narrow defiles and reach the Ionian Sea, but the Louros and Arakthos run parallel to the topographic trend and drain into the Gulf of Arta.
Figure 2 illustrates, in a simplified form, the
Geological Society of America Bulletin, February 1993 139
on September 15, 2015gsabulletin.gsapubs.orgDownloaded from

KING AND OTHERS
a. Simple compression and asymmetrical anticline formation.
b. Simple extension and asymmetrical graben formation.
^ Typical 10 km scale
horizontal only
c. Strike-slip with compression forming a symmetric structure: 'transpression'. d. Strike-slip with extension forming a symmetric
structure: 'transtension'.
y X / y
© ? © 0 ? e e. Compression with separate strike-slip feature f .Compression with separate strike-slip feature
identifiable. partly identifiable.
0 * ©
g. The representation of the main structures by later modelling
slip vector in the horizontal plane
r Figure 3. Schematic cross sections of structures. The processes suggested to occur at depth are
speculative. For the modeling in this paper, we take the center of the topographic feature to represent the structure in some cases, but in others we separate compression and strike slip. Where relevant, discussion in the text reveals which course we have adopted in each case. Tomoras West and the Thesprotika anticline appear to be examples of a. No unequivocal examples of b are seen in the region, but such features are common elsewhere in Greece (the Gulf of Corinth, for example). Feature d that combines extension and strike slip is found south of the Gulf of Arta; the Amvracia and Aetolia systems are examples. Feature c is the general form of the Kasidiares, Kourenton, Pente Dendra, and Paramythian systems. A good example of e may be found in the northern part of the Kourenton system; of f, in the south and central part of the Kasidiares structure. The locations referred to above can be found in Figure 4. The main features are modeled in following figures as if they had the form shown in g.
principal features of the four regions into which the north-northwest-striking ridges di-vide Epirus. The western region is a carbon-ate platform of low to moderate relief, low to moderate elevation (rarely higher than 600 m
and usually less than 400 m), with substantial amounts of Holocene fill in the Acheron and Kalamas Valleys near the coast. The central region is a ' 'flysch'' basin, containing Tertiary detrital rocks, including turbidites, of Eocene
to Miocene age. Although elevations are low (150-600 m), the local relief is rough because the flysch is heavily eroded. The eastern re-gion is another carbonate platform, of eleva-tion mainly between 400 and 800 m, with low relief. Two basins here contain Pliocene-Qua-ternary basin fills: the Ioannina Basin, which contains a lake whose history extends back into the Pliocene; and the Doliana Basin, which no longer contains a lake but contains lacustrine deposits. Finally, between this eastern plateau region and the high Pindus, a second flysch basin lies, higher in elevation (500-1,000 m) in the north than in the south (100-600 m) and displaying the same heavily gullied relief typical of the central flysch basin.
The region of the Gulf of Arta is a depres-sion where both Neogene and late Quater-nary sediments are found. The landscape of alternating carbonate platforms and flysch basins, separated by high narrow ridges, which is characteristic of Epirus, disappears abruptly along the line marked with features Z, S, and R in Figure 2. Most of the depres-sion that is not presently below sea level is covered with several meters of Holocene fill, post-Classical in age (Vita-Finzi, 1969). The underlying Neogene sediments can attain thicknesses in excess of 1,500 m (IGRSS/IFP 1966, p. 175). South of the Gulf of Arta in Acharnania, the carbonate/flysch alternation reappears with more subdued relief.
The surface geology of Epirus has been carefully studied (IGRSS/IFP, 1966), and de-tailed maps and cross sections are available in that publication. The Mesozoic carbonates are predominantly limestone with smaller amounts of dolomite and were deposited in the shallow seas of the Neo-Tethys. The de-trital rocks and turbidites (the "flysch") are associated with the continental emergence accompanying the closure of the Tethys and in this region are of early Tertiary to mid-Tertiary age. Whereas Aubouin and his co-workers, typified by the IGRSS/IFP report (1966), emphasized folding, producing both synclines and anticlines, as the major defor-mation process, we would emphasize fault-ing. Both interpretations require crustal shortening across the region of Epirus, which continues to the present. Active seismicity is revealed by both instrumental data and the historical record (Comninakis and Papaza-chos, 1982; Papazachos and Comninakis, 1982; Papazachos and others, 1982; King and others, 1983). Focal mechanisms for the re-gion indicate reverse faulting, but because of the poor distribution of seismograph stations in Africa, the amount of strike-slip motion is poorly constrained and has been assumed to
140 Geological Society of America Bulletin, February 1993
on September 15, 2015gsabulletin.gsapubs.orgDownloaded from
LANDSCAPE GEOMETRY AND ACTIVE TECTONICS, GREECE
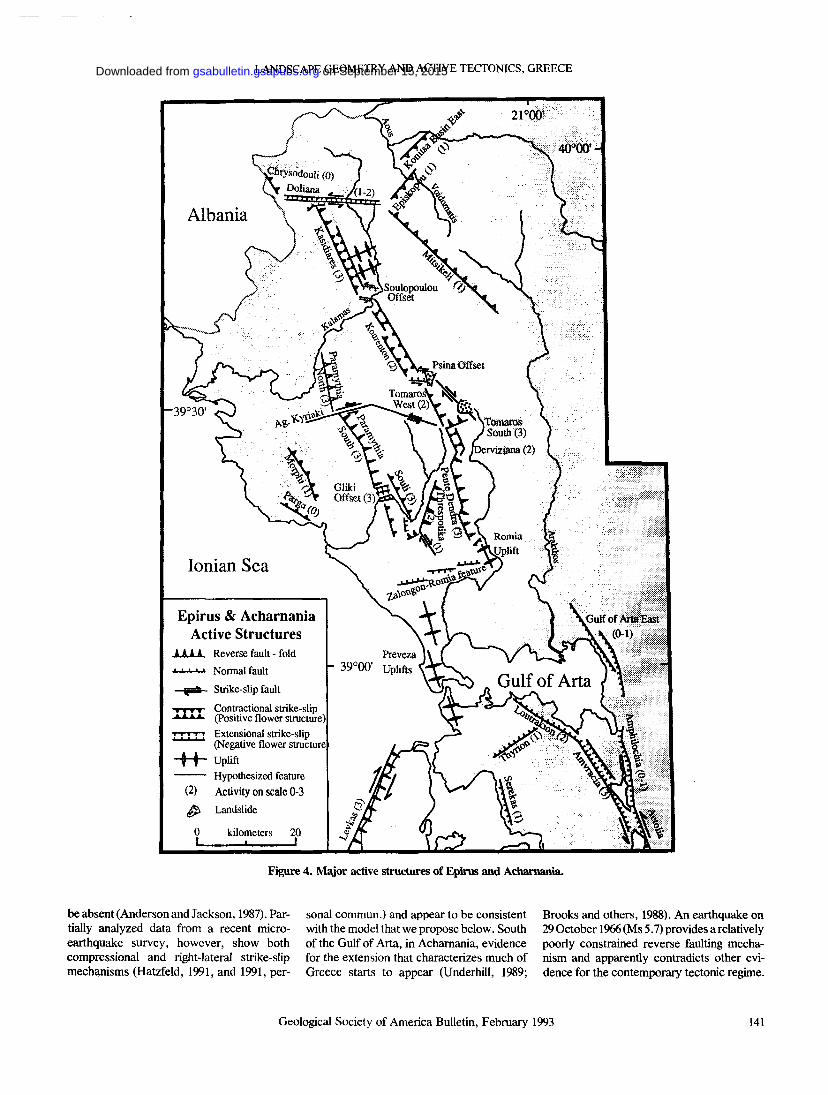
Figure 4. Major active structures of Epirus and Acharnania.
be absent (Anderson and Jackson, 1987). Par-tially analyzed data from a recent micro-earthquake survey, however, show both compressional and right-lateral strike-slip mechanisms (Hatzfeld, 1991, and 1991, per-
sonal commun.) and appear to be consistent with the model that we propose below. South of the Gulf of Arta, in Acharnania, evidence for the extension that characterizes much of Greece starts to appear (Underhill, 1989;
Brooks and others, 1988). An earthquake on 29 October 1966 (Ms 5.7) provides a relatively poorly constrained reverse faulting mecha-nism and apparently contradicts other evi-dence for the contemporary tectonic regime.
Geological Society of America Bulletin, February 1993 141
on September 15, 2015gsabulletin.gsapubs.orgDownloaded from
KING AND OTHERS
The Ionian coast of Levkas is very active, with evidence for both strike-slip and reverse faulting associated with the northern end of the Aegean subduction system (Underhill, 1989; Brooks and others, 1988). Rapid uplift of soft sediments, even within historical time, accounts for the modern constriction at the mouth of the Gulf of Arta. The sea battle of Actium, that marked the fall of Anthony and Cleopatra, was probably partly fought over what is now dry land as a result of rising anticlines.
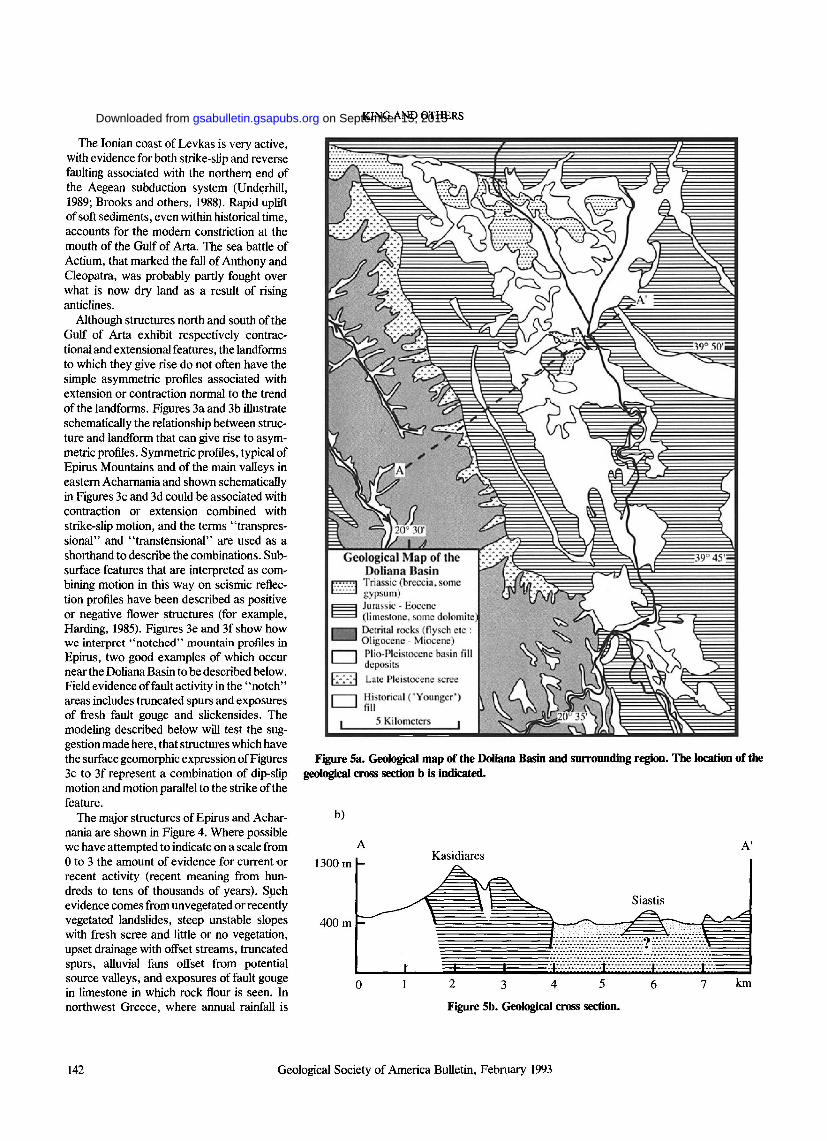
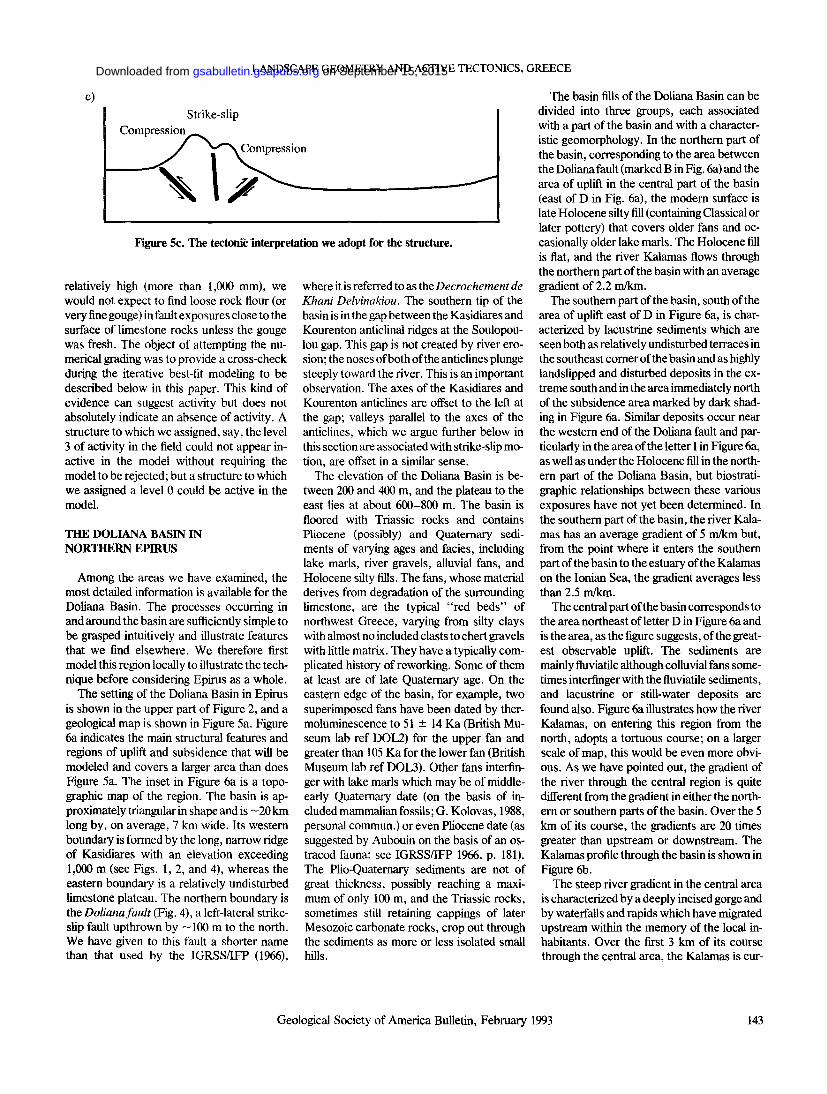
Although structures north and south of the Gulf of Arta exhibit respectively contrac-tional and extensional features, the landforms to which they give rise do not often have the simple asymmetric profiles associated with extension or contraction normal to the trend of the landforms. Figures 3a and 3b illustrate schematically the relationship between struc-ture and landform that can give rise to asym-metric profiles. Symmetric profiles, typical of Epirus Mountains and of the main valleys in eastern Acharnania and shown schematically in Figures 3c and 3d could be associated with contraction or extension combined with strike-slip motion, and the terms "transpres-sional" and "transtensional" are used as a shorthand to describe the combinations. Sub-surface features that are interpreted as com-bining motion in this way on seismic reflec-tion profiles have been described as positive or negative flower structures (for example, Harding, 1985). Figures 3e and 3f show how we interpret "notched" mountain profiles in Epirus, two good examples of which occur near the Doliana Basin to be described below. Field evidence of fault activity in the "notch" areas includes truncated spurs and exposures of fresh fault gouge and slickensides. The modeling described below will test the sug-gestion made here, that structures which have the surface geomorphic expression of Figures Figure 5a. Geological map of the Doliana Basin and surrounding region. The location of the 3c to 3f represent a combination of dip-slip geological cross section b is indicated, motion and motion parallel to the strike of the feature.
The major structures of Epirus and Achar- b) nania are shown in Figure 4. Where possible we have attempted to indicate on a scale from 0 to 3 the amount of evidence for current or 1300 m recent activity (recent meaning from hun-dreds to tens of thousands of years). Such evidence comes from un vegetated or recently vegetated landslides, steep unstable slopes 400 m with fresh scree and little or no vegetation, upset drainage with offset streams, truncated spurs, alluvial fans offset from potential source valleys, and exposures of fault gouge in limestone in which rock flour is seen. In northwest Greece, where annual rainfall is
Geological Map of the Doliana ltasin
(•••1 Triassic (brecc ta, some ' ' gypsum)
= 1 Jurassic - Eocene (limestone, some dolomite)
j r n Delrilal rocks (flysch etc : Oligocene- Miocene)
I I Plio-Pleistocene basin fill ' deposits
X i Late Pleistocene scree
i Historical ("Younger") 1 fill
5 Kilometers
Kasidiares
Siastis
2 3 4 5 6
Figure 5b. Geological cross section.
142 Geological Society of America Bulletin, February 1993
on September 15, 2015gsabulletin.gsapubs.orgDownloaded from
LANDSCAPE GEOMETRY AND ACTIVE TECTONICS, GREECE
relatively high (more than 1,000 mm), we would not expect to find loose rock flour (or very fine gouge) in fault exposures close to the surface of limestone rocks unless the gouge was fresh. The object of attempting the nu-merical grading was to provide a cross-check during the iterative best-fit modeling to be described below in this paper. This kind of evidence can suggest activity but does not absolutely indicate an absence of activity. A structure to which we assigned, say, the level 3 of activity in the field could not appear in-active in the model without requiring the model to be rejected; but a structure to which we assigned a level 0 could be active in the model.
THE DOLIANA BASIN IN NORTHERN EPIRUS
Among the areas we have examined, the most detailed information is available for the Doliana Basin. The processes occurring in and around the basin are sufficiently simple to be grasped intuitively and illustrate features that we find elsewhere. We therefore first model this region locally to illustrate the tech-nique before considering Epirus as a whole.
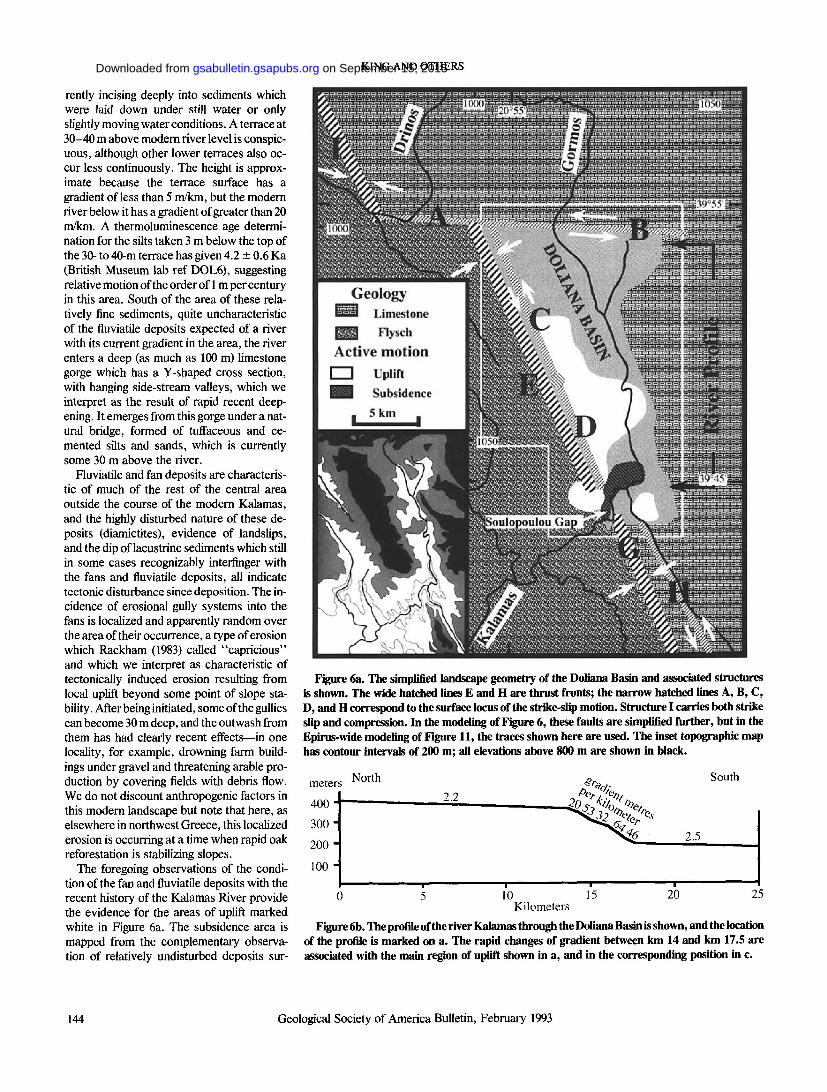
The setting of the Doliana Basin in Epirus is shown in the upper part of Figure 2, and a geological map is shown in Figure 5a. Figure 6a indicates the main structural features and regions of uplift and subsidence that will be modeled and covers a larger area than does Figure 5a. The inset in Figure 6a is a topo-graphic map of the region. The basin is ap-proximately triangular in shape and is ~20 km long by, on average, 7 km wide. Its western boundary is formed by the long, narrow ridge of Kasidiares with an elevation exceeding 1,000 m (see Figs. 1, 2, and 4), whereas the eastern boundary is a relatively undisturbed limestone plateau. The northern boundary is the Doliana fault (Fig. 4), a left-lateral strike-slip fault upthrown by -100 m to the north. We have given to this fault a shorter name than that used by the IGRSS/IFP (1966),
where it is referred to as the Decrochement de Khani Delvinakiou. The southern tip of the basin is in the gap between the Kasidiares and Kourenton anticlinal ridges at the Soulopou-lou gap. This gap is not created by river ero-sion; the noses of both of the anticlines plunge steeply toward the river. This is an important observation. The axes of the Kasidiares and Kourenton anticlines are offset to the left at the gap; valleys parallel to the axes of the anticlines, which we argue further below in this section are associated with strike-slip mo-tion, are offset in a similar sense.
The elevation of the Doliana Basin is be-tween 200 and 400 m, and the plateau to the east lies at about 600-800 m. The basin is floored with Triassic rocks and contains Pliocene (possibly) and Quaternary sedi-ments of varying ages and facies, including lake marls, river gravels, alluvial fans, and Holocene silty fills. The fans, whose material derives from degradation of the surrounding limestone, are the typical "red beds" of northwest Greece, varying from silty clays with almost no included clasts to chert gravels with little matrix. They have a typically com-plicated history of reworking. Some of them at least are of late Quaternary age. On the eastern edge of the basin, for example, two superimposed fans have been dated by ther-moluminescence to 51 ± 14 Ka (British Mu-seum lab ref DOL2) for the upper fan and greater than 105 Ka for the lower fan (British Museum lab ref DOL3). Other fans interfin-ger with lake marls which may be of middle-early Quaternary date (on the basis of in-cluded mammalian fossils; G. Kolovas, 1988, personal commun.) or even Pliocene date (as suggested by Aubouin on the basis of an os-tracod fauna: see IGRSS/IFP 1966, p. 181). The Plio-Quaternary sediments are not of great thickness, possibly reaching a maxi-mum of only 100 m, and the Triassic rocks, sometimes still retaining cappings of later Mesozoic carbonate rocks, crop out through the sediments as more or less isolated small hills.
The basin fills of the Doliana Basin can be divided into three groups, each associated with a part of the basin and with a character-istic geomorphology. In the northern part of the basin, corresponding to the area between the Doliana fault (marked B in Fig. 6a) and the area of uplift in the central part of the basin (east of D in Fig. 6a), the modern surface is late Holocene silty fill (containing Classical or later pottery) that covers older fans and oc-casionally older lake marls. The Holocene fill is flat, and the river Kalamas flows through the northern part of the basin with an average gradient of 2.2 m/km.
The southern part of the basin, south of the area of uplift east of D in Figure 6a, is char-acterized by lacustrine sediments which are seen both as relatively undisturbed terraces in the southeast corner of the basin and as highly landslipped and disturbed deposits in the ex-treme south and in the area immediately north of the subsidence area marked by dark shad-ing in Figure 6a. Similar deposits occur near the western end of the Doliana fault and par-ticularly in the area of the letter I in Figure 6a, as well as under the Holocene fill in the north-ern part of the Doliana Basin, but biostrati-graphic relationships between these various exposures have not yet been determined. In the southern part of the basin, the river Kala-mas has an average gradient of 5 m/km but, from the point where it enters the southern part of the basin to the estuary of the Kalamas on the Ionian Sea, the gradient averages less than 2.5 m/km.
The central part of the basin corresponds to the area northeast of letter D in Figure 6a and is the area, as the figure suggests, of the great-est observable uplift. The sediments are mainly fluviatile although colluvial fans some-times interfinger with the fluviatile sediments, and lacustrine or still-water deposits are found also. Figure 6a illustrates how the river Kalamas, on entering this region from the north, adopts a tortuous course; on a larger scale of map, this would be even more obvi-ous. As we have pointed out, the gradient of the river through the central region is quite different from the gradient in either the north-ern or southern parts of the basin. Over the 5 km of its course, the gradients are 20 times greater than upstream or downstream. The Kalamas profile through the basin is shown in Figure 6b.
The steep river gradient in the central area is characterized by a deeply incised gorge and by waterfalls and rapids which have migrated upstream within the memory of the local in-habitants. Over the first 3 km of its course through the central area, the Kalamas is cur-
Geological Society of America Bulletin, February 1993 143
on September 15, 2015gsabulletin.gsapubs.orgDownloaded from
KING AND OTHERS
rently incising deeply into sediments which were laid down under still water or only slightly moving water conditions. A terrace at 30-40 m above modern river level is conspic-uous, although other lower terraces also oc-cur less continuously. The height is approx-imate because the terrace surface has a gradient of less than 5 m/km, but the modern river below it has a gradient of greater than 20 m/km. A thermoluminescence age determi-nation for the silts taken 3 m below the top of the 30- to 40-m terrace has given 4.2 ± 0.6 Ka (British Museum lab ref DOL6), suggesting relative motion of the order of 1 m per century in this area. South of the area of these rela-tively fine sediments, quite uncharacteristic of the fluviatile deposits expected of a river with its current gradient in the area, the river enters a deep (as much as 100 m) limestone gorge which has a Y-shaped cross section, with hanging side-stream valleys, which we interpret as the result of rapid recent deep-ening. It emerges from this gorge under a nat-ural bridge, formed of tuffaceous and ce-mented silts and sands, which is currently some 30 m above the river.
Fluviatile and fan deposits are characteris-tic of much of the rest of the central area outside the course of the modern Kalamas, and the highly disturbed nature of these de-posits (diamictites), evidence of landslips, and the dip of lacustrine sediments which still in some cases recognizably interfinger with the fans and fluviatile deposits, all indicate tectonic disturbance since deposition. The in-cidence of erosional gully systems into the fans is localized and apparently random over the area of their occurrence, a type of erosion which Rackham (1983) called "capricious" and which we interpret as characteristic of tectonicaUy induced erosion resulting from local uplift beyond some point of slope sta-bility. After being initiated, some of the gullies can become 30 m deep, and the outwash from them has had clearly recent effects—in one locality, for example, drowning farm build-ings under gravel and threatening arable pro-duction by covering fields with debris flow. We do not discount anthropogenic factors in this modern landscape but note that here, as elsewhere in northwest Greece, this localized erosion is occurring at a time when rapid oak reforestation is stabilizing slopes.
The foregoing observations of the condi-tion of the fan and fluviatile deposits with the recent history of the Kalamas River provide the evidence for the areas of uplift marked white in Figure 6a. The subsidence area is mapped from the complementary observa-tion of relatively undisturbed deposits sur-
Figure 6a. The simplified landscape geometry of the Doliana Basin and associated structures is shown. The wide hatched lines E and H are thrust fronts; the narrow hatched lines A, B, C, D, and H correspond to the surface locus of the strike-slip motion. Structure I carries both strike slip and compression. In the modeling of Figure 6, these faults are simplified further, but in the Epirus-wide modeling of Figure 11, the traces shown here are used. The inset topographic map has contour intervals of 200 m; all elevations above 800 m are shown in black.
Figure 6b. The profile of the river Kalamas through the Doliana Basin is shown, and the location of the profile is marked on a. The rapid changes of gradient between km 14 and km 17.5 are associated with the main region of uplift shown in a, and in the corresponding position in c.
>/. v V 1 * , * y v * v V \ * " * V*^ < E S ! . * < W<'n '̂V'''\ ' ' S î ï S i  * *
Geology h r J Limestone
M Flysch
Active motion
U p l i f t
S u b s i d e n c e
jSoulopoulou Gai
144 Geological Society of America Bulletin, February 1993
on September 15, 2015gsabulletin.gsapubs.orgDownloaded from
LANDSCAPE GEOMETRY AND ACTIVE TECTONICS, GREECE
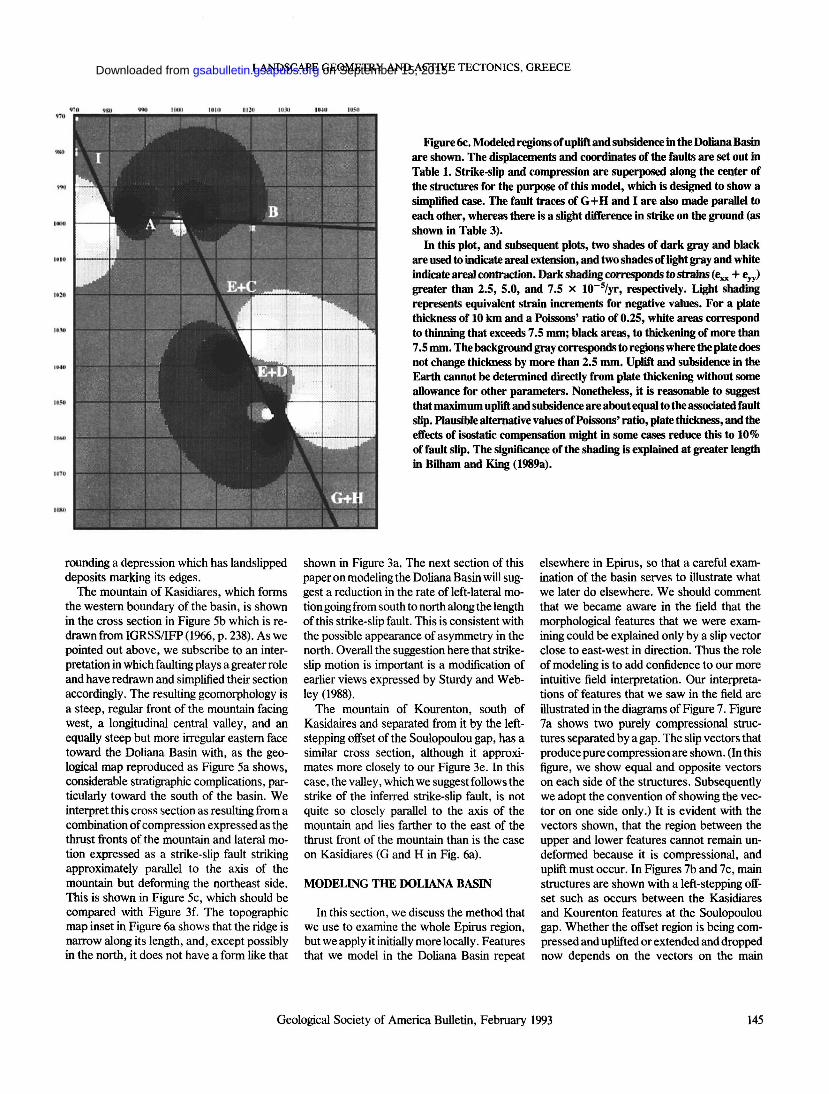
Figure 6c. Modeled regions of uplift and subsidence in the Doliana Basin are shown. The displacements and coordinates of the faults are set out in Table 1. Strike-slip and compression are superposed along the center of the structures for the purpose of this model, which is designed to show a simplified case. The fault traces of G+H and I are also made parallel to each other, whereas there is a slight difference in strike on the ground (as shown in Table 3).
In this plot, and subsequent plots, two shades of dark gray and black are used to indicate areal extension, and two shades of light gray and white indicate areal contraction. Dark shading corresponds to strains (eM + evv) greater than 2.5, 5.0, and 7.5 x 10⁻⁵/yr, respectively. Light shading represents equivalent strain increments for negative values. For a plate thickness of 10 km and a Poissons' ratio of 0.25, white areas correspond to thinning that exceeds 7.5 mm; black areas, to thickening of more than 7.5 mm. The background gray corresponds to regions where the plate does not change thickness by more than 2.5 nun. Uplift and subsidence in the Earth cannot be determined directly from plate thickening without some allowance for other parameters. Nonetheless, it is reasonable to suggest that maximum uplift and subsidence are about equal to the associated fault slip. Plausible alternative values of Poissons' ratio, plate thickness, and the effects of isostatic compensation might in some cases reduce this to 10% of fault slip. The significance of the shading is explained at greater length in Bilham and King (1989a).
rounding a depression which has landslipped deposits marking its edges.
The mountain of Kasidiares, which forms the western boundary of the basin, is shown in the cross section in Figure 5b which is re-drawn from IGRSS/IFP (1966, p. 238). As we pointed out above, we subscribe to an inter-pretation in which faulting plays a greater role and have redrawn and simplified their section accordingly. The resulting geomorphology is a steep, regular front of the mountain facing west, a longitudinal central valley, and an equally steep but more irregular eastern face toward the Doliana Basin with, as the geo-logical map reproduced as Figure 5a shows, considerable stratigraphic complications, par-ticularly toward the south of the basin. We interpret this cross section as resulting from a combination of compression expressed as the thrust fronts of the mountain and lateral mo-tion expressed as a strike-slip fault striking approximately parallel to the axis of the mountain but deforming the northeast side. This is shown in Figure 5c, which should be compared with Figure 3f. The topographic map inset in Figure 6a shows that the ridge is narrow along its length, and, except possibly in the north, it does not have a form like that
shown in Figure 3a. The next section of this paper on modeling the Doliana Basin will sug-gest a reduction in the rate of left-lateral mo-tion going from south to north along the length of this strike-slip fault. This is consistent with the possible appearance of asymmetry in the north. Overall the suggestion here that strike-slip motion is important is a modification of earlier views expressed by Sturdy and Web-ley (1988).
The mountain of Kourenton, south of Kasidaires and separated from it by the left-stepping offset of the Soulopoulou gap, has a similar cross section, although it approxi-mates more closely to our Figure 3e. In this case, the valley, which we suggest follows the strike of the inferred strike-slip fault, is not quite so closely parallel to the axis of the mountain and lies farther to the east of the thrust front of the mountain than is the case on Kasidiares (G and H in Fig. 6a).
MODELING THE DOLIANA BASIN
In this section, we discuss the method that we use to examine the whole Epirus region, but we apply it initially more locally. Features that we model in the Doliana Basin repeat
elsewhere in Epirus, so that a careful exam-ination of the basin serves to illustrate what we later do elsewhere. We should comment that we became aware in the field that the morphological features that we were exam-ining could be explained only by a slip vector close to east-west in direction. Thus the role of modeling is to add confidence to our more intuitive field interpretation. Our interpreta-tions of features that we saw in the field are illustrated in the diagrams of Figure 7. Figure 7a shows two purely compressional struc-tures separated by a gap. The slip vectors that produce pure compression are shown. (In this figure, we show equal and opposite vectors on each side of the structures. Subsequently we adopt the convention of showing the vec-tor on one side only.) It is evident with the vectors shown, that the region between the upper and lower features cannot remain un-deformed because it is compressional, and uplift must occur. In Figures 7b and 7c, main structures are shown with a left-stepping off-set such as occurs between the Kasidiares and Kourenton features at the Soulopoulou gap. Whether the offset region is being com-pressed and uplifted or extended and dropped now depends on the vectors on the main
Geological Society of America Bulletin, February 1993 145
on September 15, 2015gsabulletin.gsapubs.orgDownloaded from
KING AND OTHERS
o uplift subsidence Q uplift
subsidence uplift
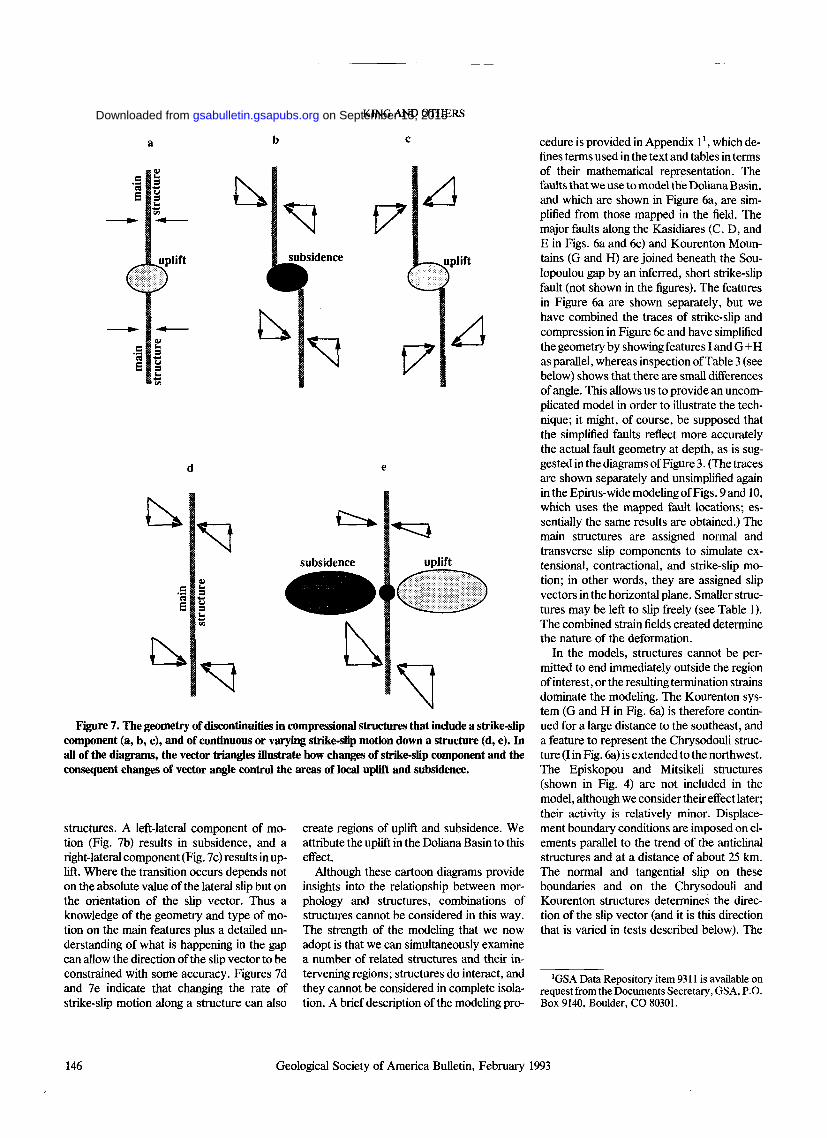
Figure 7. The geometry of discontinuities in compressional structures that include a strike-slip component (a, b, c), and of continuous or varying strike-slip motion down a structure (d, e). In all of the diagrams, the vector triangles illustrate how changes of strike-slip component and the consequent changes of vector angle control the areas of local uplift and subsidence.
structures. A left-lateral component of mo-tion (Fig. 7b) results in subsidence, and a right-lateral component (Fig. 7c) results in up-lift. Where the transition occurs depends not on the absolute value of the lateral slip but on the orientation of the slip vector. Thus a knowledge of the geometry and type of mo-tion on the main features plus a detailed un-derstanding of what is happening in the gap can allow the direction of the slip vector to be constrained with some accuracy. Figures 7d and 7e indicate that changing the rate of strike-slip motion along a structure can also
create regions of uplift and subsidence. We attribute the uplift in the Doliana Basin to this effect.
Although these cartoon diagrams provide insights into the relationship between mor-phology and structures, combinations of structures cannot be considered in this way. The strength of the modeling that we now adopt is that we can simultaneously examine a number of related structures and their in-tervening regions; structures do interact, and they cannot be considered in complete isola-tion. A brief description of the modeling pro-
cedure is provided in Appendix 11, which de-fines terms used in the text arid tables in terms of their mathematical representation. The faults that we use to model the Doliana Basin, and which are shown in Figure 6a, are sim-plified from those mapped in the field. The major faults along the Kasidiares (C, D, and E in Figs. 6a and 6c) and Kourenton Moun-tains (G and H) are joined beneath the Sou-lopoulou gap by an inferred, short strike-slip fault (not shown in the figures). The features in Figure 6a are shown separately, but we have combined the traces of strike-slip and compression in Figure 6c and have simplified the geometry by showing features I and G + H as parallel, whereas inspection of Table 3 (see below) shows that there are small differences of angle. This allows us to provide an uncom-plicated model in order to illustrate the tech-nique; it might, of course, be supposed that the simplified faults reflect more accurately the actual fault geometry at depth, as is sug-gested in the diagrams of Figure 3. (The traces are shown separately and unsimplified again in the Epirus-wide modeling of Figs. 9 and 10, which uses the mapped fault locations; es-sentially the same results are obtained.) The main structures are assigned normal and transverse slip components to simulate ex-tensional, contractional, and strike-slip mo-tion; in other words, they are assigned slip vectors in the horizontal plane. Smaller struc-tures may be left to slip freely (see Table 1). The combined strain fields created determine the nature of the deformation.
In the models, structures cannot be per-mitted to end immediately outside the region of interest, or the resulting termination strains dominate the modeling. The Kourenton sys-tem (G and H in Fig. 6a) is therefore contin-ued for a large distance to the southeast, and a feature to represent the Chrysodouli struc-ture (I in Fig. 6a) is extended to the northwest. The Episkopou and Mitsikeli structures (shown in Fig. 4) are not included in the model, although we consider their effect later; their activity is relatively minor. Displace-ment boundary conditions are imposed on el-ements parallel to the trend of the anticlinal structures and at a distance of about 25 km. The normal and tangential slip on these boundaries and on the Chrysodouli and Kourenton structures determines the direc-tion of the slip vector (and it is this direction that is varied in tests described below). The
'GSA Data Repository item 9311 is available on request from the Documents Secretary, GSA, P.O. Box 9140, Boulder, CO 80301.
146 Geological Society of America Bulletin, February 1993
on September 15, 2015gsabulletin.gsapubs.orgDownloaded from
LANDSCAPE GEOMETRY AND ACTIVE TECTONICS, GREECE
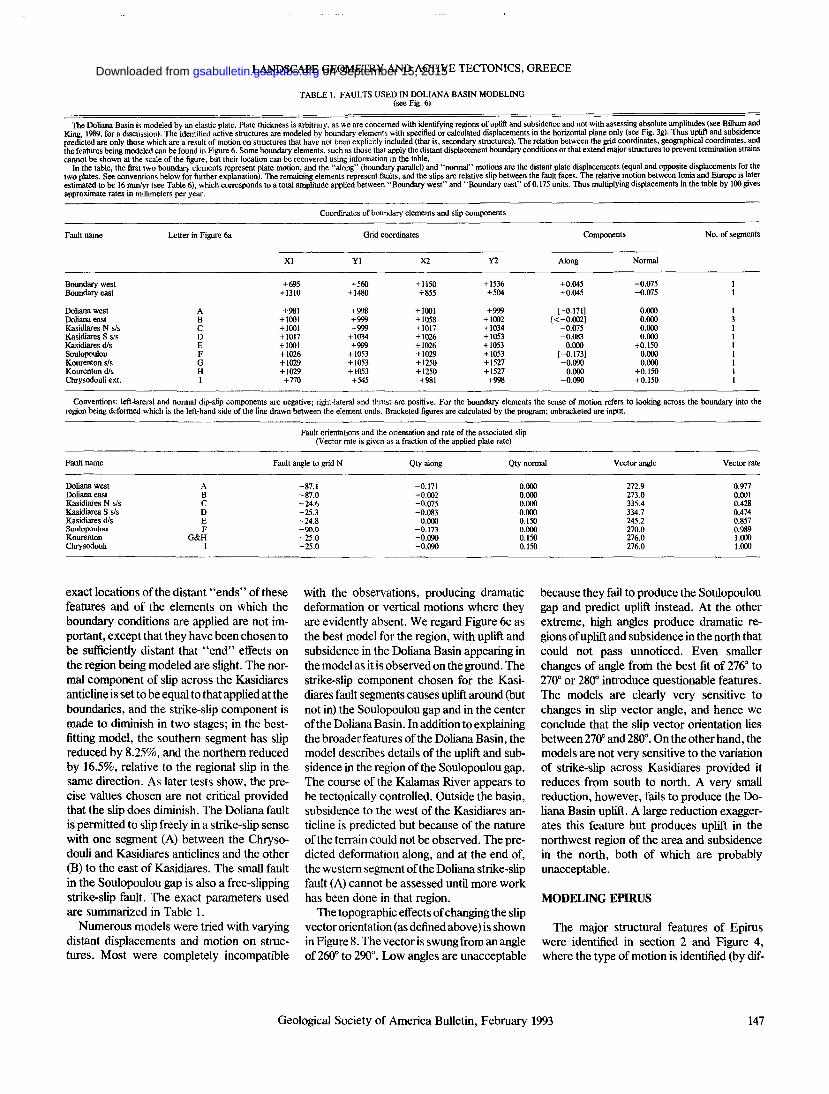
TABLE 1. FAULTS USED IN DOLIANA BASIN MODELING (see Fig. 6)
The Doliana Basin is modeled by an elastic plate. Plate thickness is arbitrary, as we are concerned with identifying regions of uplift and subsidence and not with assessing absolute amplitudes (see Bilham and King, 1989, for a discussion). The identified active structures are modeled by boundary elements with specified or calculated displacements in the horizontal plane only (see Fig. 3g). Thus uplift and subsidence predicted are only those which are a result of motion on structures that have not been explicitly included (that is, secondary structures). The relation between the grid coordinates, geographical coordinates, and the features being modeled can be found in Figure 6. Some boundary elements, such as those that apply the distant displacement boundary conditions or that extend major structures to prevent termination strains cannot be shown at the scale of the figure, but their location can be recovered using information in the table.
In the table, the first two boundary elements represent plate motion, and the "along" (boundary parallel) and "normal" motions are the distant plate displacements (equal and opposite displacements for the two plates. See conventions below for further explanation). The remaining elements represent faults, and the slips are relative slip between the fault faces. The relative motion between Ionia and Europe is later estimated to be 16min/yr (see Table 6), which corresponds to a total amplitude applied between "Boundary west" and "Boundary east" of 0.175 units. Thus multiplying displacements in the table by 100 gives approximate rates in millimeters per year.
Coordinates of boundary elements and slip components
Fault name Letter in Figure 6a Grid coordinates Components No. of segments
XI Y1 X2 Y2 Along Normal
Boundary west +695 +560 + 1150 + 1536 +0.045 -0.075 1 Boundary east + 1310 + 1480 +855 +504 +0.045 -0.075 1
Doliana west A +981 +998 + 1001 +999 [-0.171] 0.000 1 Doliana east B + 1001 +999 + 1058 + 1002 [<-0.002] 0.000 3 Kasidiares N s/s C + 1001 +999 + 1017 + 1034 -0.075 0.000 1 Kasidiares S s/s D + 1017 + 1034 + 1026 + 1053 -0.083 0.000 1 Kasidiares d/s E + 1001 +999 + 1026 + 1053 0.000 +0.150 1 Soulopoulou F + 1026 + 1053 + 1029 + 1053 [-0.173] 0.000 1 Kourenton s/s G + 1029 + 1053 + 1250 + 1527 -0.090 0.000 1 Kourenton d/s H + 1029 + 1053 + 1250 + 1527 0.000 +0.150 1 Chrysodouli ext. I +770 +545 +981 +998 -0.090 +0.150 1
Conventions: left-lateral and normal dip-slip components are negative; right-lateral and thrust are positive. For the boundary elements the sense of motion refers to looking across the boundary into the region being deformed which is the left-hand side of the line drawn between the element ends. Bracketed figures are calculated by the program; unbracketed are input.
Fault orientations and the orientation and rate of the associated slip (Vector rate is given as a fraction of the applied plate rate)
Fault name Fault angle to grid N Qty along Qty normal Vector angle Vector rate
Doliana west A -87.1 -0.171 0.000 272.9 0.977 Doliana east B -87.0 -0.002 0.000 273.0 0.001 Kasidiares N s/s C -24.6 -0.075 0.000 335.4 0.428 Kasidiares S s/s D -25.3 -0.083 0.000 334.7 0.474 Kasidiares d/s E -24.8 0.000 0.150 245.2 0.857 Soulopoulou F -90.0 -0.173 0.000 270.0 0.989 Kourenton G&H -25.0 -0.090 0.150 276.0 1.000 Chrysodouli I -25.0 -0.090 0.150 276.0 1.000
exact locations of the distant "ends" of these features and of the elements on which the boundary conditions are applied are not im-portant, except that they have been chosen to be sufficiently distant that "end" effects on the region being modeled are slight. The nor-mal component of slip across the Kasidiares anticline is set to be equal to that applied at the boundaries, and the strike-slip component is made to diminish in two stages; in the best-fitting model, the southern segment has slip reduced by 8.25%, and the northern reduced by 16.5%, relative to the regional slip in the same direction. As later tests show, the pre-cise values chosen are not critical provided that the slip does diminish. The Doliana fault is permitted to slip freely in a strike-slip sense with one segment (A) between the Chryso-douli and Kasidiares anticlines and the other (B) to the east of Kasidiares. The small fault in the Soulopoulou gap is also a free-slipping strike-slip fault. The exact parameters used are summarized in Table 1.
Numerous models were tried with varying distant displacements and motion on struc-tures. Most were completely incompatible
with the observations, producing dramatic deformation or vertical motions where they are evidently absent. We regard Figure 6c as the best model for the region, with uplift and subsidence in the Doliana Basin appearing in the model as it is observed on the ground. The strike-slip component chosen for the Kasi-diares fault segments causes uplift around (but not in) the Soulopoulou gap and in the center of the Doliana Basin. In addition to explaining the broader features of the Doliana Basin, the model describes details of the uplift and sub-sidence in the region of the Soulopoulou gap. The course of the Kalamas River appears to be tectonically controlled. Outside the basin, subsidence to the west of the Kasidiares an-ticline is predicted but because of the nature of the terrain could not be observed. The pre-dicted deformation along, and at the end of, the western segment of the Doliana strike-slip fault (A) cannot be assessed until more work has been done in that region.
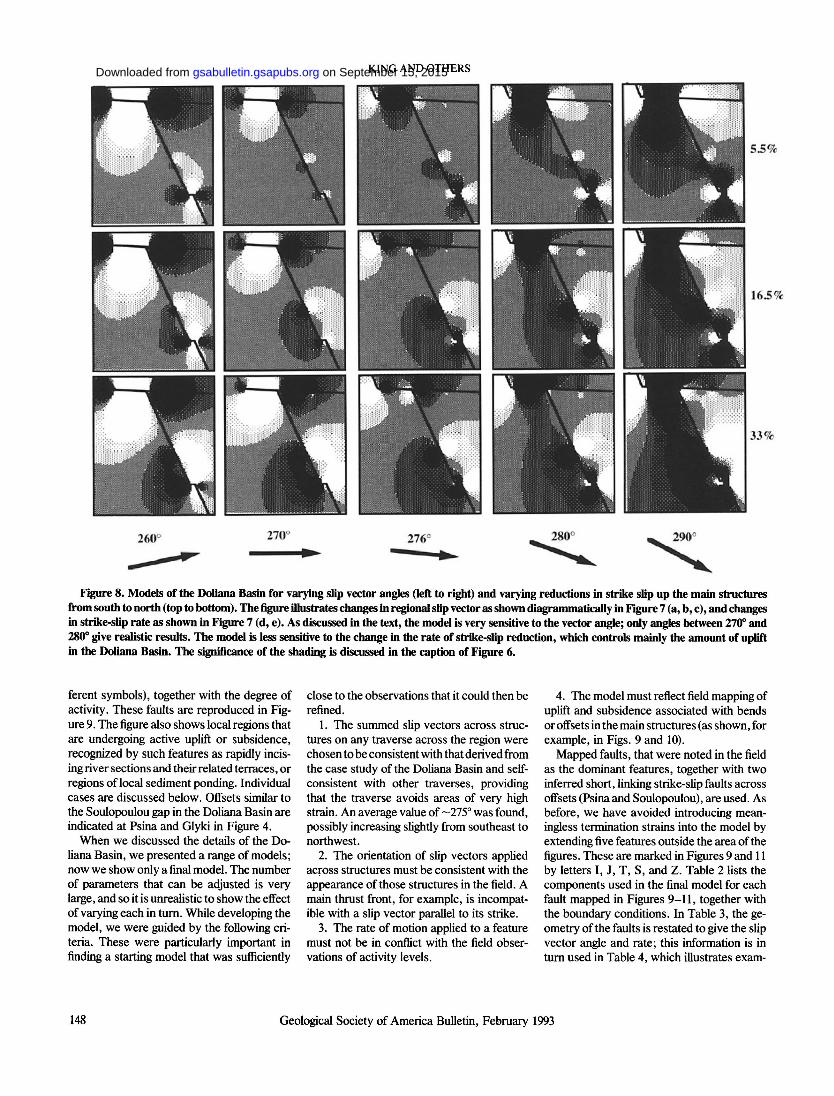
The topographic effects of changing the slip vector orientation (as defined above) is shown in Figure 8. The vector is swung from an angle of 260° to 290°. Low angles are unacceptable
because they fail to produce the Soulopoulou gap and predict uplift instead. At the other extreme, high angles produce dramatic re-gions of uplift and subsidence in the north that could not pass unnoticed. Even smaller changes of angle from the best fit of 276° to 270° or 280° introduce questionable features. The models are clearly very sensitive to changes in slip vector angle, and hence we conclude that the slip vector orientation lies between 270° and 280°. On the other hand, the models are not very sensitive to the variation of strike-slip across Kasidiares provided it reduces from south to north. A very small reduction, however, fails to produce the Do-liana Basin uplift. A large reduction exagger-ates this feature but produces uplift in the northwest region of the area and subsidence in the north, both of which are probably unacceptable.
MODELING EPIRUS
The major structural features of Epirus were identified in section 2 and Figure 4, where the type of motion is identified (by dif-
Geological Society of America Bulletin, February 1993 147
on September 15, 2015gsabulletin.gsapubs.orgDownloaded from
KING AND OTHERS
Figure 8. Models of the Doliana Basin for varying slip vector angles (left to right) and varying reductions in strike slip up the main structures from south to north (top to bottom). The figure illustrates changes in regional slip vector as shown diagrammatically in Figure 7 (a, b, c), and changes in strike-slip rate as shown in Figure 7 (d, e). As discussed in the text, the model is very sensitive to the vector angle; only angles between 270° and 280° give realistic results. The model is less sensitive to the change in the rate of strike-slip reduction, which controls mainly the amount of uplift in the Doliana Basin. The significance of the shading is discussed in the caption of Figure 6.
ferent symbols), together with the degree of activity. These faults are reproduced in Fig-ure 9. The figure also shows local regions that are undergoing active uplift or subsidence, recognized by such features as rapidly incis-ing river sections and their related terraces, or regions of local sediment ponding. Individual cases are discussed below. Offsets similar to the Soulopoulou gap in the Doliana Basin are indicated at Psina and Glyki in Figure 4.
When we discussed the details of the Do-liana Basin, we presented a range of models; now we show only a final model. The number of parameters that can be adjusted is very large, and so it is unrealistic to show the effect of varying each in turn. While developing the model, we were guided by the following cri-teria. These were particularly important in finding a starting model that was sufficiently
close to the observations that it could then be refined.
1. The summed slip vectors across struc-tures on any traverse across the region were chosen to be consistent with that derived from the case study of the Doliana Basin and self-consistent with other traverses, providing that the traverse avoids areas of very high strain. An average value of—275° was found, possibly increasing slightly from southeast to northwest.
2. The orientation of slip vectors applied across structures must be consistent with the appearance of those structures in the field. A main thrust front, for example, is incompat-ible with a slip vector parallel to its strike.
3. The rate of motion applied to a feature must not be in conflict with the field obser-vations of activity levels.
4. The model must reflect field mapping of uplift and subsidence associated with bends or offsets in the main structures (as shown, for example, in Figs. 9 and 10).
Mapped faults, that were noted in the field as the dominant features, together with two inferred short, linking strike-slip faults across offsets (Psina and Soulopoulou), are used. As before, we have avoided introducing mean-ingless termination strains into the model by extending five features outside the area of the figures. These are marked in Figures 9 and 11 by letters I, J, T, S, and Z. Table 2 lists the components used in the fined model for each fault mapped in Figures 9-11, together with the boundary conditions. In Table 3, the ge-ometry of the faults is restated to give the slip vector angle and rate; this information is in turn used in Table 4, which illustrates exam-
148 Geological Society of America Bulletin, February 1993
on September 15, 2015gsabulletin.gsapubs.orgDownloaded from
LANDSCAPE GEOMETRY AND ACTIVE TECTONICS, GREECE
Outline of mode!
S u b s i d e n c e
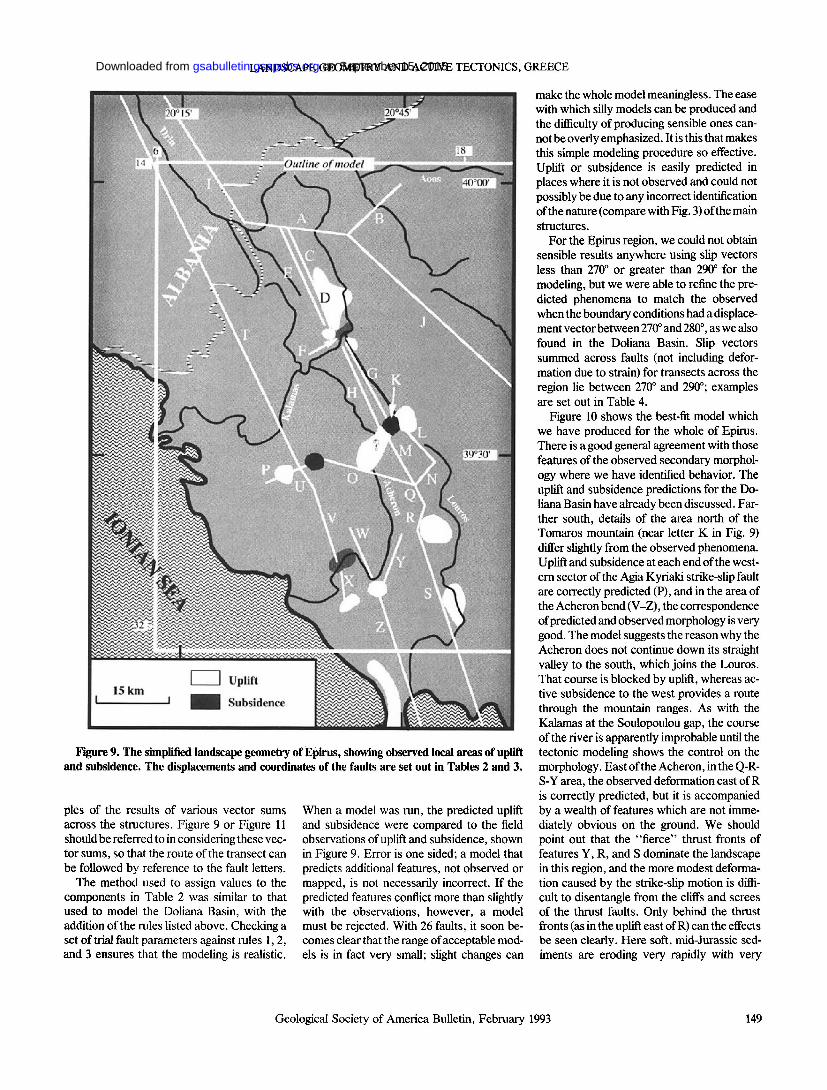
Figure 9. The simplified landscape geometry of Epirus, showing observed local areas of uplift and subsidence. The displacements and coordinates of the faults are set out in Tables 2 and 3.
pies of the results of various vector sums across the structures. Figure 9 or Figure 11 should be referred to in considering these vec-tor sums, so that the route of the transect can be followed by reference to the fault letters.
The method used to assign values to the components in Table 2 was similar to that used to model the Doliana Basin, with the addition of the rules listed above. Checking a set of trial fault parameters against rules 1, 2, and 3 ensures that the modeling is realistic.
When a model was run, the predicted uplift and subsidence were compared to the field observations of uplift and subsidence, shown in Figure 9. Error is one sided; a model that predicts additional features, not observed or mapped, is not necessarily incorrect. If the predicted features conflict more than slightly with the observations, however, a model must be rejected. With 26 faults, it soon be-comes clear that the range of acceptable mod-els is in fact very small; slight changes can
make the whole model meaningless. The ease with which silly models can be produced and the difficulty of producing sensible ones can-not be overly emphasized. It is this that makes this simple modeling procedure so effective. Uplift or subsidence is easily predicted in places where it is not observed and could not possibly be due to any incorrect identification of the nature (compare with Fig. 3) of the main structures.
For the Epirus region, we could not obtain sensible results anywhere using slip vectors less than 270° or greater than 290° for the modeling, but we were able to refine the pre-dicted phenomena to match the observed when the boundary conditions had a displace-ment vector between 270° and 280°, as we also found in the Doliana Basin. Slip vectors summed across faults (not including defor-mation due to strain) for transects across the region lie between 270° and 290°; examples are set out in Table 4.
Figure 10 shows the best-fit model which we have produced for the whole of Epirus. There is a good general agreement with those features of the observed secondary morphol-ogy where we have identified behavior. The uplift and subsidence predictions for the Do-liana Basin have already been discussed. Far-ther south, details of the area north of the Tomaros mountain (near letter K in Fig. 9) differ slightly from the observed phenomena. Uplift and subsidence at each end of the west-ern sector of the Agia Kyriaki strike-slip fault are correctly predicted (P), and in the area of the Acheron bend (V-Z), the correspondence of predicted and observed morphology is very good. The model suggests the reason why the Acheron does not continue down its straight valley to the south, which joins the Louros. That course is blocked by uplift, whereas ac-tive subsidence to the west provides a route through the mountain ranges. As with the Kalamas at the Soulopoulou gap, the course of the river is apparently improbable until the tectonic modeling shows the control on the morphology. East of the Acheron, in the Q-R-S-Y area, the observed deformation east of R is correctly predicted, but it is accompanied by a wealth of features which are not imme-diately obvious on the ground. We should point out that the "fierce" thrust fronts of features Y, R, and S dominate the landscape in this region, and the more modest deforma-tion caused by the strike-slip motion is diffi-cult to disentangle from the cliffs and screes of the thrust faults. Only behind the thrust fronts (as in the uplift east of R) can the effects be seen clearly. Here soft, mid-Jurassic sed-iments are eroding very rapidly with very
Geological Society of America Bulletin, February 1993 149
on September 15, 2015gsabulletin.gsapubs.orgDownloaded from
M) 11
KING AND OTHERS
If, IN 20
1(t
211
îfi
1 "; m ?
ili J 1 «¡I
Siiutopolou éw m
Ts * *
U M ài M 4M*
na Gap
| | JlllfulWr * à 1
Gtild Gap
- mrmm • s & y
1 « H
H I #
m
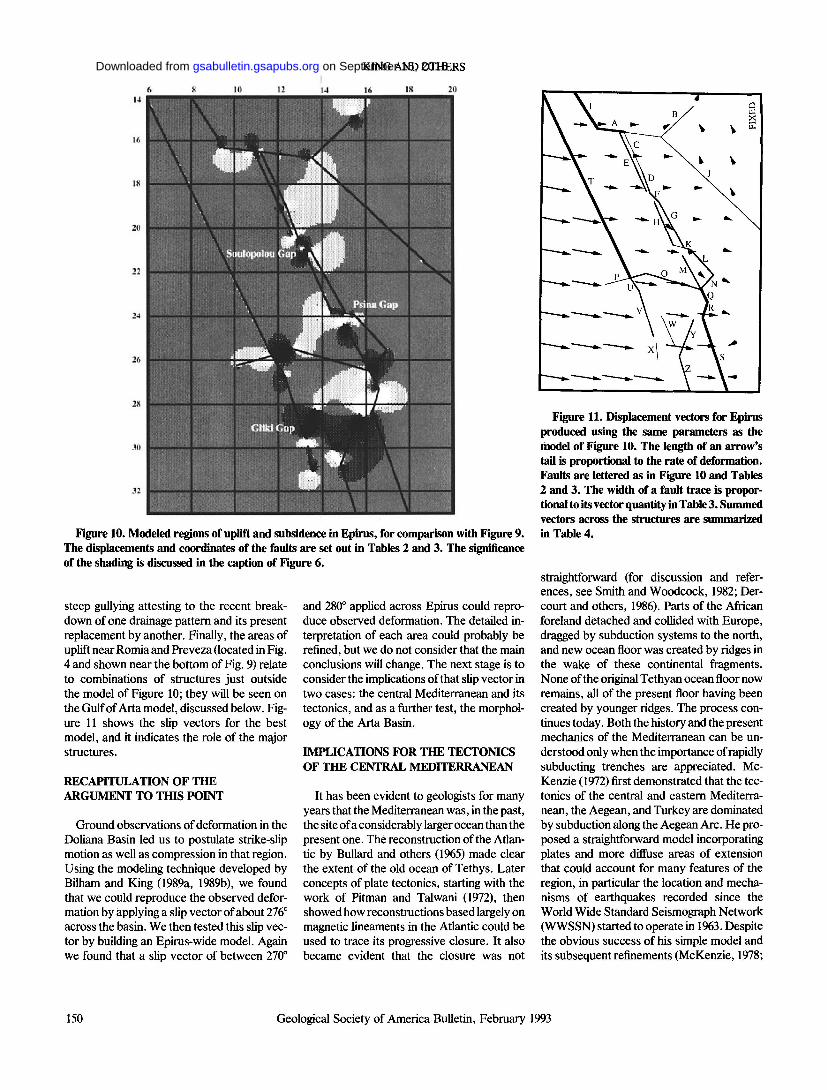
Figure 10. Modeled regions of uplift and subsidence in Epirus, for comparison with Figure 9. The displacements and coordinates of the faults are set out in Tables 2 and 3. The significance of the shading is discussed in the caption of Figure 6.
steep gullying attesting to the recent break-down of one drainage pattern and its present replacement by another. Finally, the areas of uplift near Romia and Preveza (located in Fig. 4 and shown near the bottom of Fig. 9) relate to combinations of structures just outside the model of Figure 10; they will be seen on the Gulf of Arta model, discussed below. Fig-ure 11 shows the slip vectors for the best model, and it indicates the role of the major structures.
RECAPITULATION OF THE ARGUMENT TO THIS POINT
Ground observations of deformation in the Doliana Basin led us to postulate strike-slip motion as well as compression in that region. Using the modeling technique developed by Bilham and King (1989a, 1989b), we found that we could reproduce the observed defor-mation by applying a slip vector of about 276° across the basin. We then tested this slip vec-tor by building an Epirus-wide model. Again we found that a slip vector of between 270°
and 280° applied across Epirus could repro-duce observed deformation. The detailed in-terpretation of each area could probably be refined, but we do not consider that the main conclusions will change. The next stage is to consider the implications of that slip vector in two cases: the central Mediterranean and its tectonics, and as a further test, the morphol-ogy of the Arta Basin.
IMPLICATIONS FOR THE TECTONICS OF THE CENTRAL MEDITERRANEAN
It has been evident to geologists for many years that the Mediterranean was, in the past, the site of a considerably larger ocean than the present one. The reconstruction of the Atlan-tic by Bullard and others (1965) made clear the extent of the old ocean of Tethys. Later concepts of plate tectonics, starting with the work of Pitman and Talwani (1972), then showed how reconstructions based largely on magnetic lineaments in the Atlantic could be used to trace its progressive closure. It also became evident that the closure was not
Figure 11. Displacement vectors for Epirus produced using the same parameters as the model of Figure 10. The length of an arrow's tail is proportional to the rate of deformation. Faults are lettered as in Figure 10 and Tables 2 and 3. The width of a fault trace is propor-tional to its vector quantity in Table 3. Summed vectors across the structures are summarized in Table 4.
straightforward (for discussion and refer-ences, see Smith and Woodcock, 1982; Der-court and others, 1986). Parts of the African foreland detached and collided with Europe, dragged by subduction systems to the north, and new ocean floor was created by ridges in the wake of these continental fragments. None of the original Tethyan ocean floor now remains, all of the present floor having been created by younger ridges. The process con-tinues today. Both the history and the present mechanics of the Mediterranean can be un-derstood only when the importance of rapidly subducting trenches are appreciated. Mc-Kenzie (1972) first demonstrated that the tec-tonics of the central and eastern Mediterra-nean, the Aegean, and Turkey are dominated by subduction along the Aegean Arc. He pro-posed a straightforward model incorporating plates and more diffuse areas of extension that could account for many features of the region, in particular the location and mecha-nisms of earthquakes recorded since the World Wide Standard Seismograph Network (WWSSN) started to operate in 1963. Despite the obvious success of his simple model and its subsequent refinements (McKenzie, 1978;
150 Geological Society of America Bulletin, February 1993
on September 15, 2015gsabulletin.gsapubs.orgDownloaded from

TABLE 2. FAULTS USED IN EPIRUS-WIDE MODELING (see Figs. 4 and 11)
The Epirus is modeled by an elastic plate. Plate thickness is arbitrary, as we are concerned with identifying regions of uplift and subsidence and not with assessing absolute amplitudes (see Bilham and King, 1989, for a discussion). The identified active structures are modeled by boundary elements with specified or calculated displacements in the horizontal plane only (see Fig. 3g). Thus uplift and subsidence predicted are only those which are a result of motion on structures that have not been explicitly included (that is, secondary strictures). The relation between the grid coordinates, geographical coordinates, and the features being modeled can be found in Figure 9. Some boundary elements, such as those that apply the distant displacement boundary conditions or that extend major structures to prevent termination strains, cannot be shown at the scale of the figure, but their location can be recovered using information in the table.
In the table, the first two boundary elements represent plate motion, and the "along" (boundary parallel) and "normal" motions are the distant plate displacements (the eastern plate is fixed). The remaining elements represent faults, and the slips are relative slip between the fault faces. The relative motion between Ionia and Europe is later estimated to be 16 mm/yr (see Table 6) which corresponds to a total amplitude applied between "Boundary west" and "Boundary east" of 0.2 units. Thus multiplying displacements in the table by 80 gives approximate rates in millimeters per year.
Fault name Letter in Figure 9 Grid coordinates Components No. of segments
XI Y1 X2 Y2 Along Normal
Boundary west -20.00 -15.00 +29.00 +68.00 +0.122 -0.158 Boundary east +51.00 +58.00 +2.00 -25.00 0.000 0.000
Doüana A +9.50 + 16.35 + 13.55 + 16.80 [-0.072] 0.000 [-0.014) 0.000 [-0.010] 0.000
Episkopou B + 13.55 + 16.80 + 15.60 + 14.85 +0.025 +0.015 Kasidiares NE C + 11.20 + 16.55 + 12.35 + 19.00 -0.020 0.000 Kasidiares SE D + 12.35 + 19.00 + 12.90 +20.40 -0.040 0.000 Kasidiares W E +10.90 +16.50 + 12.65 +20.30 0.000 +0.040 Soulopoulou F + 12.90 +20.40 + 13.50 +21.00 [-0.051 +0.040] Kourenton E G + 13.50 +21.00 + 15.10 +23.90 -0.060 0.000 Kourenton W H + 13.20 +21.00 + 14.40 +23.75 0.000 +0.040 Chrysodouli I -0.15 + 1.45 +9.50 + 16.35 -0.055 +0.070 Mitsikeli J + 13.55 + 16.80 + 18.70 +21.50 -0.030 +0.010 Psina K + 14.40 +23.75 + 15.50 +24.00 [-0.027 +0.047]
[-0.067 -0.015] Tomaros E L + 15.50 +24.00 + 17.00 +25.60 -0.060 0.000 Tomaros W M + 15.00 +24.40 + 16.20 +26.50 0.000 +0.060 Tomaros S N + 16.20 +26.50 + 17.00 +25.60 0.000 +0.060 Ag. Kyriaki E 0 + 12.70 +25.50 + 16.20 +26.50 -0.060 0.000 Ag. Kyriaki W P + 10.10 +26.25 + 12.70 +25.50 [-0.006] 0.000 Ag. Kyriaki W
[-0.050] 0.000 Derviziana N Q + 16.20 +26.50 + 16.60 +27.30 -0.050 +0.120 Derviziana S R + 16.60 +27.30 + 16.30 +28.30 0.000 +0.100 Penté Dendra ext. S + 16.30 +28.30 +23.96 +50.00 -0.056 +0.121 Paramythia N ext. T -0.15 + 1.45 + 11.70 +25.80 -0.066 +0.075 Paramythia SI U + 11.70 +25.80 + 12.25 +26.65 -0.010 +0.035 Paramythia S2 V + 12.25 +26.65 + 13.20 +29.50 -0.020 +0.040 Souli W + 13.70 +28.20 + 14.55 +30.10 -0.020 +0.020 Tourli X + 13.35 +29.90 + 13.50 +31.00 -0.010 +0.020 Thesprotika N Y + 15.70 +28.45 + 14.85 +30.75 0.000 +0.050 Thesprotika S ext. Z + 14.85 +30.75 +20.74 +50.00 -0.027 +0.061
Conventions: left-lateral and normal dip-slip components are negative; right-lateral and thrust are positive. For the boundary elements, the sense of motion refers to looking across the boundary into the region being deformed, which is the left-hand side of the line drawn between the element ends. Bracketed figures are calculated by the program; unbracketed are input. Where an element is shown to have more than one segment, it is split into the indicated number of separate boundary elements on a straight line between the assigned coordinates. The values of slip calculated for the elements are provided; the uppermost correspond to the (XI, Yl) end and the lowermost to the (X2, Y2) end.
TABLE 3. FAULT SLIP VECTORS USED IN EPIRUS-WIDE MODELING
Fault orientations and the orientation and rate of associated slip
Fault ñame Fault a .ngle to grid N Qty along Qty normal Vector angle Vector rate
Boundary west -30.6 +0.122 -0.158 277.1 0.200 Doliana Al -84.0 [-0.072] 0.000 276.0 0.072
A2 [-0.014] 0.000 276.0 0.014 A3 [-0.010] 0.000 276.0 0.010
Episkopou B +46.0 +0.025 0.015 257.0 0.029 kasidiares NE C -25.0 -0.020 0.000 335.0 0.020 Kasidiares SE D -21.0 -0.040 0.000 339.0 0.040 Kasidiares W E -25.0 0.000 0.040 245.0 0.040 Soulopoulou F -45.0 [-0.051 +0.040] 276.9 0.065 Kourenton E G -29.0 -0.060 0.000 331.0 0.060 Kourenton W H -24.0 0.000 0.040 246.0 0.040 Chrysodouli I -33.0 -0.055 0.070 275.2 0.089 Mitsikeli J -48.0 -0.030 0.010 293.6 0.032 Psina Kl -77.0 [-0.027 +0.047] 222.9 0.054
K2 [-0.067 -0.015] 295.6 0.069 Tomaros E L -43.0 -0.060 0.000 317.0 0.060 Tomaros W M -30.0 0.000 0.060 240.0 0.060 Tomaros S N +42.0 0.000 0.060 318.0 0.060 Ag. Kyriaki E 0 -74.0 -0.060 0.000 286.0 0.060 Ag. Kyriaki W PI +74.0 [-0.006] 0.000 256.0 0.006
P2 [-0.050] 0.000 256.0 0.050 Derviziana N Q -27.0 -0.050 0.120 265.6 0.130 Derviziana S R + 17.0 0.000 0.100 287.0 0.100 Pente Dendra extn S -19.0 -0.056 0.121 275.8 0.133 Paramythia N extn T -26.0 -0.066 0.075 285.3 0.100 Paramythia SI U -33.0 -0.010 0.035 252.9 0.036 Paramythia S2 V -18.0 -0.020 0.040 278.6 0.045 Souli W -24.0 -0.020 0.020 291.0 0.028 Tourli x -8 .0 -0.010 0.020 288.6 0.022 Thesprotika N Y +20.0 0.000 0.050 290.0 0.050 Thesprotika S extn Z -17.0 -0.027 0.061 276.9 0.067
Conventions; vector angle is expressed in degrees relative to grid north. Left-lateral and normal dip-slip components are negative; right-lateral and thrust are positive. For the boundary elements, the sense of motion refers to looking across the boundary into the region being studied. Rates are expressed in displacement per unit time. Multiplying the figures listed by 80 gives the approximate rates for Epirus in mm/yr. Bracketed figures are calculated by the program; unbracketed are input.
Geological Society of America Bulletin, February 1993 151
on September 15, 2015gsabulletin.gsapubs.orgDownloaded from

KING AND OTHERS
Anderson and Jackson, 1987), a number of geologists have pointed out limitations and proposed modifications based on observa-tions of land geology that could not be sup-ported by seismic data (for example, Dewey and others, 1973; Dewey and §engor, 1979; Underhill, 1989; §engor and others, 1985).
This has led to a debate. Do the structures proposed by the geologists represent dead features, whereas the seismicity represents the only important present boundaries? Or can boundaries exist that move only by creep or are undergoing a long period of seismic quiescence? Ambraseys has repeatedly pointed out that seismicity rates appear to change significantly over periods of centuries or even millennia (Ambraseys and Melville,
Figure 12. Plate configurations in the central Mediterranean, redrawn from Jongsma and others (1987). In this paper, we modify the location of the Ionian-African and Ionian-European poles, because they do not fit the Epirus observations. The map is a conformal, stereographic projection, centered on 20°E and 42°N. To observe the effect of a small change in the projection pole, compare the grid and coastlines on this figure to those on Figure 17. In this and subsequent figures, the angular rate of the poles of rotation is in units of 10~8 radians per year. Plate boundaries shown incidentally in the figures are shaded gray rather than the black of the boundaries discussed in the text.
TABLE 4. VECTORS SUMMED FOR TRANSECTS ACROSS EPIRUS (using data from Table 3)
No. Transect Summed vector
Angle Rate
1 Paramythia NX [T]-Chrysodouii [I]-Episkopou [B] 277.5 0.215 2 Paramythia NX [T]-Kasidiares [C, E]-Mitsikeli [J] 283.3 0.175 3 Paramythia NX [T]-Kasidiares [C, E]-DoIiana [A2] 280.6 0.158 4 Paramythia NX [T]-Kasidiares [D, E}-Doliana [A3] 287.0 0.164 5 Paramythia NX [T]-Kourenton [G, H] 291.3 0.174 6 Paramythia SI [U]-Ag. Kyriaki [0]-Tomaros [L, M] 276.1 0.186 7 Paramythia S2 [V)-Ag. Kyriaki [0}-Mitsikeli [K2, J] 288.5 0.205 8 Paramythia S2 [V}-Derviziana N [Q] 270.0 0.174 9 Paramythia S2 [V]-Souli [W]-Pente Dendra [S] 278.5 0.205 10 Tourli [XKThesprotika N [Y]-Pente Dendra [S] 280.6 0.204 11 Thesprotika SX [Z]-Pente Dendra SX [S] 276.2 0.200
Conventions: vector angle is expressed relative to grid north. Rates are expressed in displacement per unit time: for order of magnitude, multiplying the figures listed by —80 would give mm/yr.
152 Geological Society of America Bulletin, February 1993
on September 15, 2015gsabulletin.gsapubs.orgDownloaded from
LANDSCAPE GEOMETRY AND ACTIVE TECTONICS, GREECE
Data Sources 1 - Marine Reflection data (Jongsma et al.J 2 - Paleomagnetic data 3 - Seismic data (Le Pichon et al.) 4 - Modeling morphological features (This
paper).
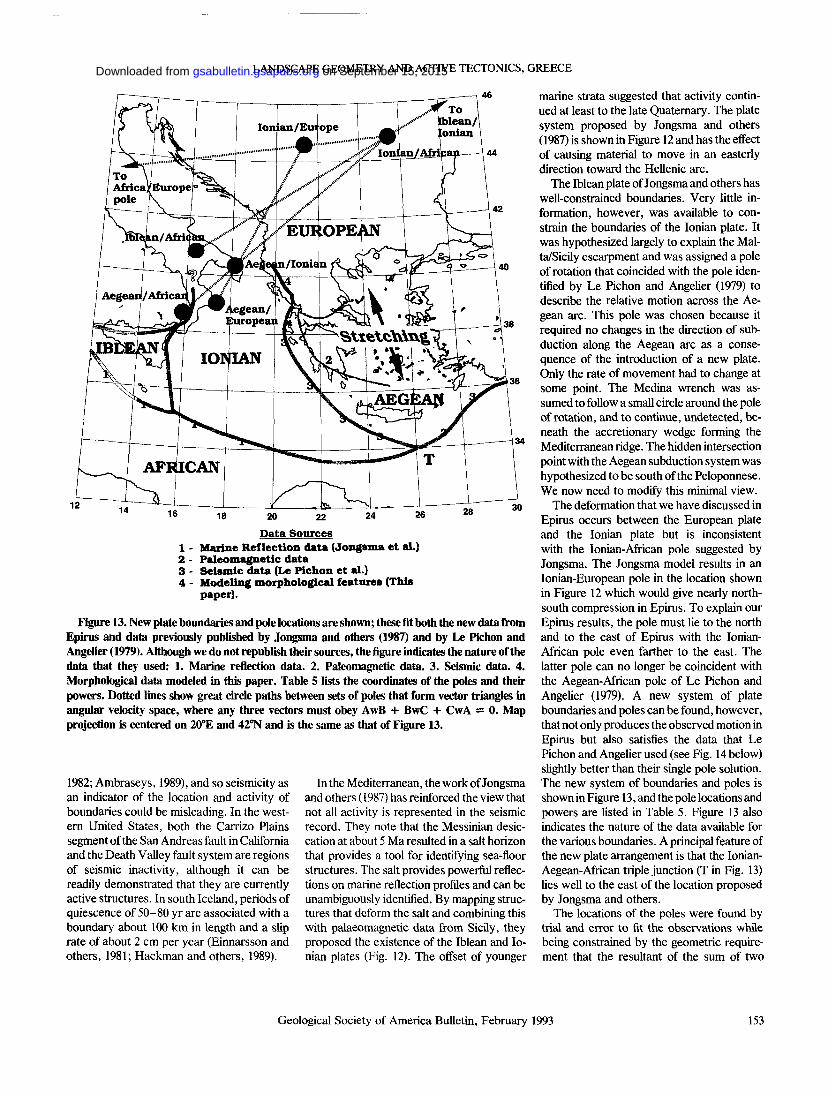
Figure 13. New plate boundaries and pole locations are shown; these fit both the new data from Epirus and data previously published by Jongsma and others (1987) and by Le Pichon and Angelier (1979). Although we do not republish their sources, the figure indicates the nature of the data that they used: 1. Marine reflection data. 2. Paleomagnetic data. 3. Seismic data. 4. Morphological data modeled in this paper. Table 5 lists the coordinates of the poles and then-powers. Dotted lines show great circle paths between sets of poles that form vector triangles in angular velocity space, where any three vectors must obey AwB + BwC + CwA = 0. Map projection is centered on 20°E and 42°N and is the same as that of Figure 13.
1982; Ambraseys, 1989), and so seismicity as an indicator of the location and activity of boundaries could be misleading. In the west-ern United States, both the Carrizo Plains segment of the San Andreas fault in California and the Death Valley fault system are regions of seismic inactivity, although it can be readily demonstrated that they are currently active structures. In south Iceland, periods of quiescence of 50-80 yr are associated with a boundary about 100 km in length and a slip rate of about 2 cm per year (Einnarsson and others, 1981; Hackman and others, 1989).
In the Mediterranean, the work of Jongsma and others (1987) has reinforced the view that not all activity is represented in the seismic record. They note that the Messinian desic-cation at about 5 Ma resulted in a salt horizon that provides a tool for identifying sea-floor structures. The salt provides powerful reflec-tions on marine reflection profiles and can be unambiguously identified. By mapping struc-tures that deform the salt and combining this with palaeomagnetic data from Sicily, they proposed the existence of the Iblean and Io-nian plates (Fig. 12). The offset of younger
marine strata suggested that activity contin-ued at least to the late Quaternary. The plate system proposed by Jongsma and others (1987) is shown in Figure 12 and has the effect of causing material to move in an easterly direction toward the Hellenic arc.
The Iblean plate of Jongsma and others has well-constrained boundaries. Very little in-formation, however, was available to con-strain the boundaries of the Ionian plate. It was hypothesized largely to explain the Mal-ta/Sicily escarpment and was assigned a pole of rotation that coincided with the pole iden-tified by Le Pichon and Angelier (1979) to describe the relative motion across the Ae-gean arc. This pole was chosen because it required no changes in the direction of sub-duction along the Aegean arc as a conse-quence of the introduction of a new plate. Only the rate of movement had to change at some point. The Medina wrench was as-sumed to follow a small circle around the pole of rotation, and to continue, undetected, be-neath the accretionary wedge forming the Mediterranean ridge. The hidden intersection point with the Aegean subduction system was hypothesized to be south of the Peloponnese. We now need to modify this minimal view.
The deformation that we have discussed in Epirus occurs between the European plate and the Ionian plate but is inconsistent with the Ionian-African pole suggested by Jongsma. The Jongsma model results in an Ionian-European pole in the location shown in Figure 12 which would give nearly north-south compression in Epirus. To explain our Epirus results, the pole must lie to the north and to the east of Epirus with the Ionian-African pole even farther to the east. The latter pole can no longer be coincident with the Aegean-African pole of Le Pichon and Angelier (1979). A new system of plate boundaries and poles can be found, however, that not only produces the observed motion in Epirus but also satisfies the data that Le Pichon and Angelier used (see Fig. 14 below) slightly better than their single pole solution. The new system of boundaries and poles is shown in Figure 13, and the pole locations and powers are listed in Table 5. Figure 13 also indicates the nature of the data available for the various boundaries. A principal feature of the new plate arrangement is that the Ionian-Aegean-African triple junction (T in Fig. 13) lies well to the east of the location proposed by Jongsma and others.
The locations of the poles were found by trial and error to fit the observations while being constrained by the geometric require-ment that the resultant of the sum of two
Geological Society of America Bulletin, February 1993 153
on September 15, 2015gsabulletin.gsapubs.orgDownloaded from

KING AND OTHERS
Le Pichón Pole
Figure 14. The Aegean-African plate boundary as defined by Le Pichon and Angelier (1979). The data that they summarize are indicated by thick heavy arrows; the fit provided by their pole, by thin arrows. Note that east of T the predicted vectors deviate to the west of the observations, and to the west of T, they deviate to the east. Map projection is centered on 20°E and 42°N and is the same as that of Figure 13.
rotation vectors lies in the same plane (that is, great circle) as the summed vectors. The rel-evant great-circle lines and the individual poles and the sections of plate boundary that they concern are shown in Figure 13. The Ionian-European pole shown in Figure 15a satisfies the slip direction found in Epirus. When combined with the Europe-Africa pole which lies off the coast of Morocco (Le Pichon and Angelier, 1979), it produces the
TABLE 5. POLES OF ROTATION AND THEIR ANGULAR VELOCITY
Pole Lat. Long. Power (rad/yr)
Iblean/African 40-40' 16°20' 3.3 10~8
Aegean/African 38°40' I6°00' 9.8 10"8
Ionian/African 44°50' 25°20' 3.0 10"8
Ionian/European 44°30' 21°20' 2.83 10"8
Ionian/Aegean 40°12' 18°12' 13.0 10"8
Aegean/European 39°00' 17° 15' 10.2 10~8
Ionian-African pole shown in Figure 15b. This pole is consistent with an extended Me-dina Wrench that extends beneath the accre-tionary wedge to join the Aegean subduction system near to the Strabo Trench. Some com-pression must occur at the eastern end of the wrench, possibly giving rise to the reverse faulting earthquake shown in the figure and discussed below. The section of the Aegean subduction system west of the Strabo Trench (and T in Fig. 13) is now interpreted as the Aegean-Ionian plate interaction with a pole close (Fig. 15c) to the original Le Pichon pole. This pole now permits the location of two additional poles. First, the Aegean-African pole is found by summing the Ionian-African and the Aegean-Ionian, and it explains mo-tions in the Strabo Trench and to the north-east (Fig. 15d); second, the Aegean-European pole is found by summing the Ionian-Euro-
pean and the Ionian-Aegean (Fig. 15e). This allows the rate of extension for the Aegean to be calculated (Table 6 gives the value at the Gulf of Arta). The relative rotation rate is also consistent with estimates of Aegean exten-sion farther to the east (see Papazachos and Kiratzi, 1992, for recent references). The po-sitions of the poles are relatively tightly con-strained if the nature of the boundaries are correctly assigned. In particular, it is pre-sumed that no substantial compression oc-curs across the Medina Wrench, so that the Ionian-African pole, and hence the Ionian-European pole, cannot lie farther to the east; nor can they be moved to the west and still satisfy the conditions in Epirus (see Fig. 13). They can be moved a little south and perhaps three or four degrees to the north with com-pensating changes of their rotation rates with-out violating any requirements of the data. Table 6 shows rates of motion for selected parts of the boundaries. These are all uncon-troversial with the exception of the Medina Wrench at 36 mm/yr, which for much of its length shows very little current seismicity (Fig. 16). As we pointed out above, both the Jongsma model and this description require that active boundaries can be quiescent within the time window of instrumental seis-micity. The boundary is nearly 1,000 km in length, however, and thus a quiescence of 250 yr or more is possible if purely elastic behav-ior prevails. If creep is occurring, it is possible that the level of seismicity associated with it is too low to be reported, as the station cov-erage is inadequate to reliably report events less than Mb = 4.0.
MODELING THE GULF OF ARTA
A feature of the foregoing plate description for the central Mediterranean is that it both identifies the Gulf of Arta as being associated with the Aegean-Ionian-European triple junc-tion and predicts the directions and rates of slip of the boundaries in the region. The boundaries can be identified as active struc-tures in the field, and the rates of motion pro-vide the boundary conditions for modeling the behavior of smaller scale features of the region. Figure 17 illustrates the geometry. In the north, the Pente Dendra and Souli-Thes-protika faults are together considered to form the Ionian-European plate boundary. The Levkas West fault and offshore structures are considered to represent the Ionian-Aegean boundary; the Aetolia fault, to represent the European-Aegean boundary. Figure 17 shows these major faults, for which we spec-ify motions derived from the plate motions
154 Geological Society of America Bulletin, February 1993
on September 15, 2015gsabulletin.gsapubs.orgDownloaded from

Ionian-Europe Pole
Figure 15. New poles for active motion in the central Mediterranean, indicating the regions of plate boundary to which they correspond. In each figure, the boundary that is described by the relevant pole is indicated by heavy shading; where appropriate, the data are shown by dark, wide arrows. The directions of motion predicted by the pole are indicated by narrow arrows. Map projection is centered on 20°E and 42°N and is the same as that of Figure 13.
Ionian-Africa Pole
a. The Ionian-European pole correctly predicts the motion in Epirus. b. The Ionian-African pole is consistent with the extended Medina Wrench of Jongsma
and others (1987), although much of the boundary is predicted to be hidden by the accretionary wedge sediments of the Mediterranean ridge. The focal mechanism shown is discussed in the text.
on September 15, 2015gsabulletin.gsapubs.orgDownloaded from
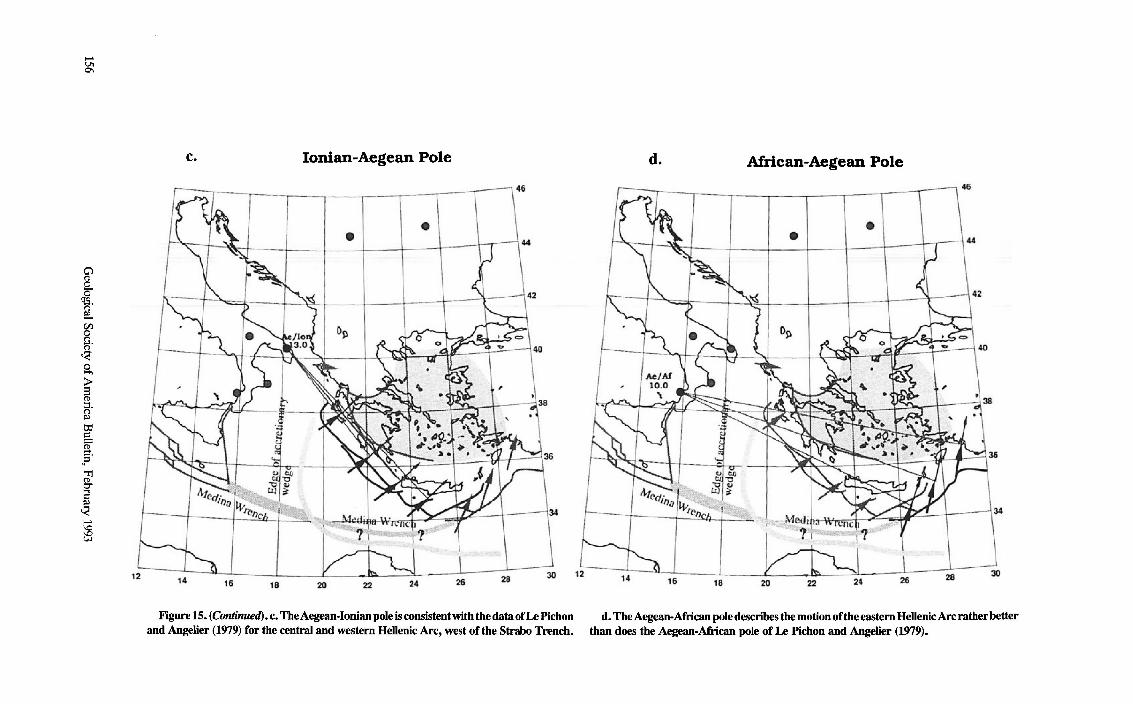
Figure 15. (Continued), c. The Aegean-Ionian pole is consistent with the data of Le Pichon d. The Aegean-African pole describes the motion of the eastern Hellenic Arc rather better and Angelier (1979) for the central and western Hellenic Arc, west of the Strabo Trench, than does the Aegean-African pole of Le Pichon and Angelier (1979).
Ionian-Aegean Pole
on September 15, 2015gsabulletin.gsapubs.orgDownloaded from
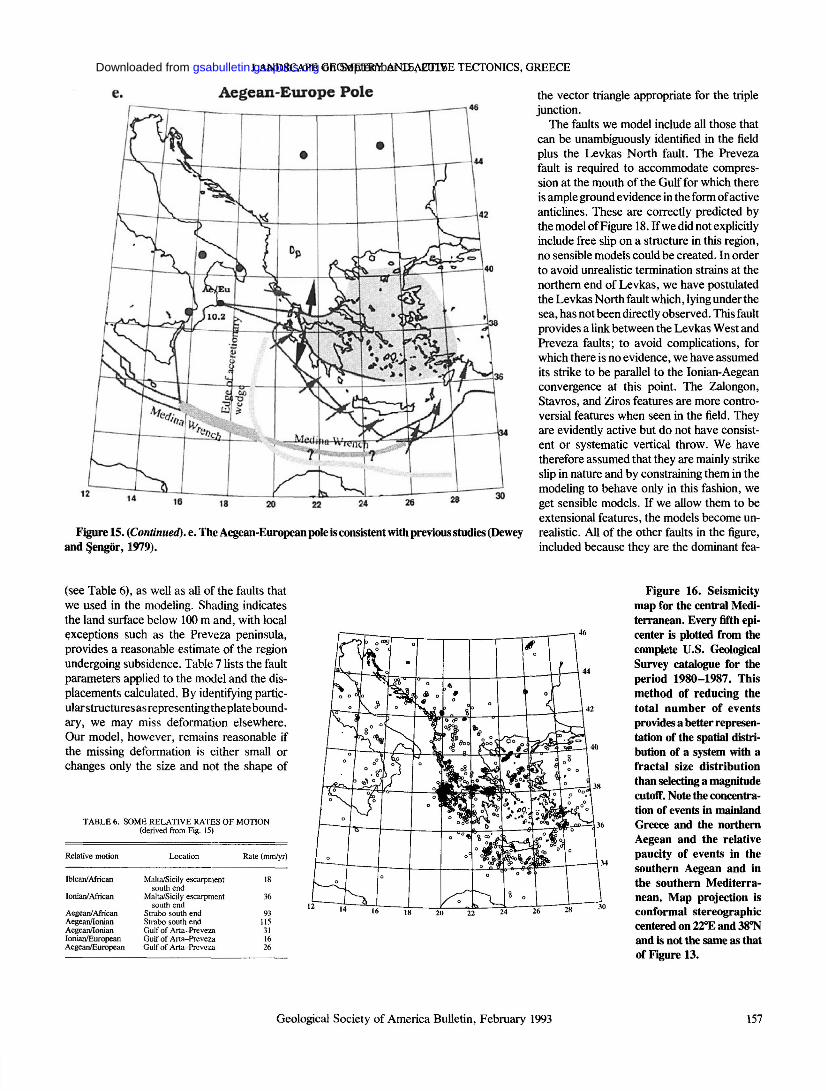
LANDSCAPE GEOMETRY AND ACTIVE TECTONICS, GREECE
the vector triangle appropriate for the triple junction.
The faults we model include all those that can be unambiguously identified in the field plus the Levkas North fault. The Preveza fault is required to accommodate compres-sion at the mouth of the Gulf for which there is ample ground evidence in the form of active anticlines. These are correctly predicted by the model of Figure 18. If we did not explicitly include free slip on a structure in this region, no sensible models could be created. In order to avoid unrealistic termination strains at the northern end of Levkas, we have postulated the Levkas North fault which, lying under the sea, has not been directly observed. This fault provides a link between the Levkas West and Preveza faults; to avoid complications, for which there is no evidence, we have assumed its strike to be parallel to the Ionian-Aegean convergence at this point. The Zalongon, Stavros, and Ziros features are more contro-versial features when seen in the field. They are evidently active but do not have consist-ent or systematic vertical throw. We have therefore assumed that they are mainly strike slip in nature and by constraining them in the modeling to behave only in this fashion, we get sensible models. If we allow them to be extensional features, the models become un-realistic. All of the other faults in the figure, included because they are the dominant fea-
e. Aegean-Europe Pole
Figure 15. (Continued). e. The Aegean-European pole is consistent with previous studies (Dewey and §engor, 1979).
(see Table 6), as well as all of the faults that we used in the modeling. Shading indicates the land surface below 100 m and, with local exceptions such as the Preveza peninsula, provides a reasonable estimate of the region undergoing subsidence. Table 7 lists the fault parameters applied to the model and the dis-placements calculated. By identifying partic-ular structures asrepresentingthe plate bound-ary, we may miss deformation elsewhere. Our model, however, remains reasonable if the missing deformation is either small or changes only the size and not the shape of
TABLE 6. SOME RELATIVE RATES OF MOTION (derived from Fig. 15)
Relative motion Location Rate (mm/yr)
Iblean/African Malta/Sicily escarpment 18 south end
Ionian/ African Malta/Sicily escarpment 36 south end
Aegean/African Strabo south end 93 Aegean/Ionian Strabo south end 115 Aegean/Ionian Gulf of Arta-Preveza 31 Ionian/European Gulf of Arta-Preveza 16 Aegean/European Gulf of Arta-Preveza 26
Figure 16. Seismicity map for the central Medi-terranean. Every fifth epi-center is plotted from the complete U.S. Geological Survey catalogue for the period 1980-1987. This method of reducing the total number of events provides a better represen-tation of the spatial distri-bution of a system with a fractal size distribution than selecting a magnitude cutoff. Note the concentra-tion of events in mainland Greece and the northern Aegean and the relative paucity of events in the southern Aegean and in the southern Mediterra-nean. Map projection is conformal stereographic centered on 22°E and 38°N and is not the same as that of Figure 13.
Geological Society of America Bulletin, February 1993 157
on September 15, 2015gsabulletin.gsapubs.orgDownloaded from
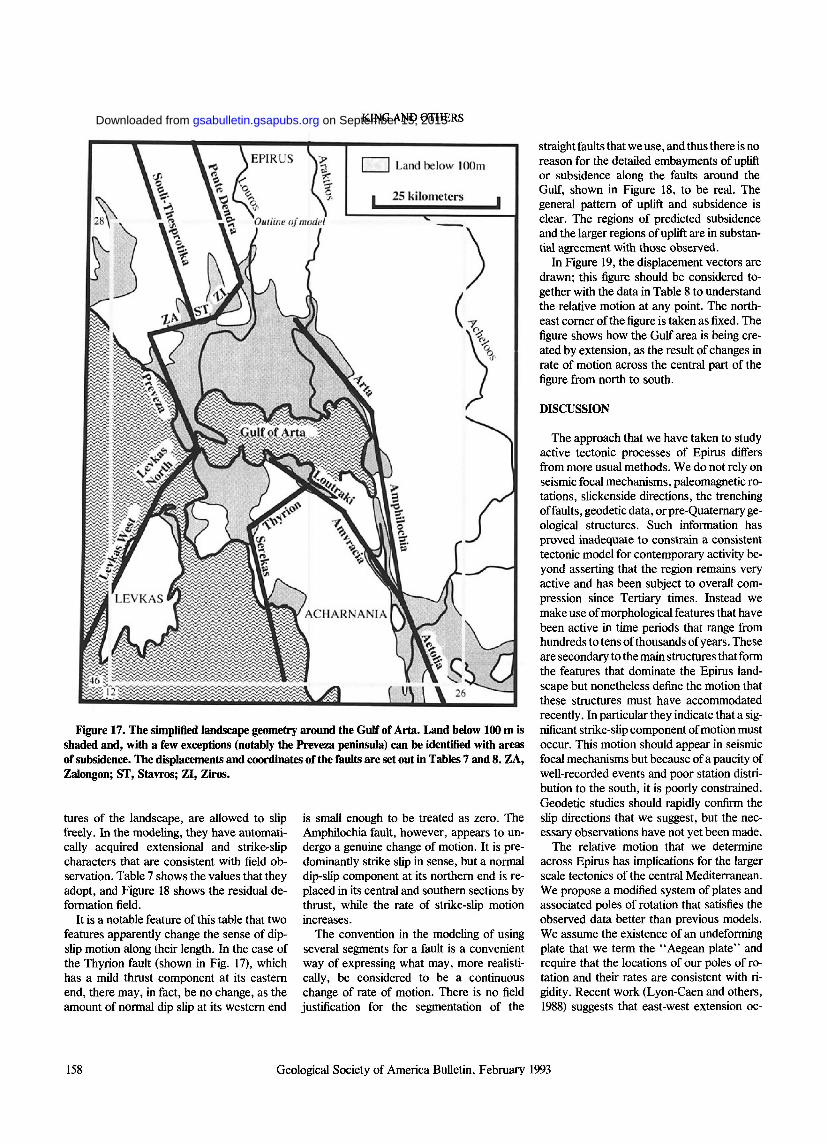
KING AND OTHERS
E P I R U S
Outline of model
LEVKAS A C M A R N A N I A
I I L a n d b e l o w l ( K ) m
• 2 5 k i l o m e t e r s
Figure 17. The simplified landscape geometry around the Gulf of Arta. Land below 100 m is shaded and, with a few exceptions (notably the Preveza peninsula) can be identified with areas of subsidence. The displacements and coordinates of the faults are set out in Tables 7 and 8. ZA, Zalongon; ST, Stavros; ZI, Ziros.
tures of the landscape, are allowed to slip freely. In the modeling, they have automati-cally acquired extensional and strike-slip characters that are consistent with field ob-servation. Table 7 shows the values that they adopt, and Figure 18 shows the residual de-formation field.
It is a notable feature of this table that two features apparently change the sense of dip-slip motion along their length. In the case of the Thyrion fault (shown in Fig. 17), which has a mild thrust component at its eastern end, there may, in fact, be no change, as the amount of normal dip slip at its western end
is small enough to be treated as zero. The Amphilochia fault, however, appears to un-dergo a genuine change of motion. It is pre-dominantly strike slip in sense, but a normal dip-slip component at its northern end is re-placed in its central and southern sections by thrust, while the rate of strike-slip motion increases.
The convention in the modeling of using several segments for a fault is a convenient way of expressing what may, more realisti-cally, be considered to be a continuous change of rate of motion. There is no field justification for the segmentation of the
straight faults that we use, and thus there is no reason for the detailed embayments of uplift or subsidence along the faults around the Gulf, shown in Figure 18, to be real. The general pattern of uplift and subsidence is clear. The regions of predicted subsidence and the larger regions of uplift are in substan-tial agreement with those observed.
In Figure 19, the displacement vectors are drawn; this figure should be considered to-gether with the data in Table 8 to understand the relative motion at any point. The north-east corner of the figure is taken as fixed. The figure shows how the Gulf area is being cre-ated by extension, as the result of changes in rate of motion across the central part of the figure from north to south.
DISCUSSION
The approach that we have taken to study active tectonic processes of Epirus differs from more usual methods. We do not rely on seismic focal mechanisms, paleomagnetic ro-tations, slickenside directions, the trenching of faults, geodetic data, or pre-Quaternary ge-ological structures. Such information has proved inadequate to constrain a consistent tectonic model for contemporary activity be-yond asserting that the region remains very active and has been subject to overall com-pression since Tertiary times. Instead we make use of morphological features that have been active in time periods that range from hundreds to tens of thousands of years. These are secondary to the main structures that form the features that dominate the Epirus land-scape but nonetheless define the motion that these structures must have accommodated recently. In particular they indicate that a sig-nificant strike-slip component of motion must occur. This motion should appear in seismic focal mechanisms but because of a paucity of well-recorded events and poor station distri-bution to the south, it is poorly constrained. Geodetic studies should rapidly confirm the slip directions that we suggest, but the nec-essary observations have not yet been made.
The relative motion that we determine across Epirus has implications for the larger scale tectonics of the central Mediterranean. We propose a modified system of plates and associated poles of rotation that satisfies the observed data better than previous models. We assume the existence of an undeforming plate that we term the "Aegean plate" and require that the locations of our poles of ro-tation and their rates are consistent with ri-gidity. Recent work (Lyon-Caen and others, 1988) suggests that east-west extension oc-
158 Geological Society of America Bulletin, February 1993
on September 15, 2015gsabulletin.gsapubs.orgDownloaded from
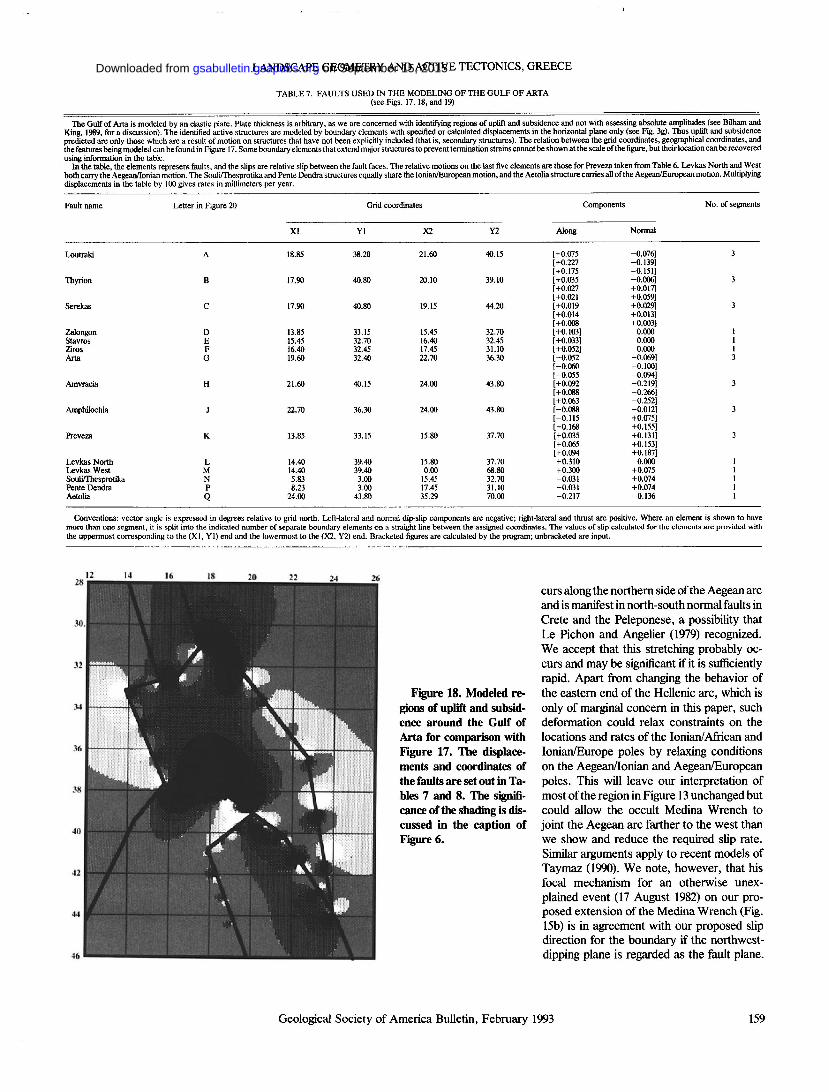
I
LANDSCAPE GEOMETRY AND ACTIVE TECTONICS, GREECE
TABLE 7. FAULTS USED IN THE MODELING OF THE GULF OF ARTA (see Figs. 17,18, and 19)
The Gulf of Arta is modeled by an elastic plate. Plate thickness is arbitrary, as we are concerned with identifying regions of uplift and subsidence and not with assessing absolute amplitudes (see Bilham and King, 1989, for a discussion). The identified active structures are modeled by boundary elements with specified or calculated displacements in the horizontal plane only (see Fig. 3g). Thus uplift and subsidence predicted are only those which are a result of motion on structures that have not been explicitly included (that is, secondary structures). The relation between the grid coordinates, geographical coordinates, and the features being modeled can be found in Figure 17. Some boundary elements that extend major structures to prevent termination strains cannot be shown at the scale of the figure, but their location can be recovered using information in the table.
In the table, the elements represent faults, and the slips are relative slip between the fault faces. The relative motions on the last five elements are those for Preveza taken from Table 6. Levkas North and West both cany the Aegean/Ionian motion. The Soul i/Thesprotika and Pente Dendra structures equally share the Ionian/European motion, and the Aetolia structure carries all of the Aegean/European motion. Multiplying displacements in the table by 100 gives rates in millimeters per year.
Fault name Letter in Figure 20 Grid coordinates Components No. of segments
XI Yl X2 Y2 Along Normal
Loutraki A 18.85 38.20 21.60 40.15 [+0.075 -0.076] 3 [+0.227 -0.139] [+0.175 -0.151]
Thyrion B 17.90 40.80 20.10 39.10 [+0.035 -0.006] 3 Thyrion [+0.027 +0.017] [+0.021 +0.059]
Serekas C 17.90 40.80 19.15 44.20 [+0.019 +0.029] 3 [+0.014 +0.013] [+0.008 +0.003]
Zalongon D 13.85 33.15 15.45 32.70 [+0.103] 0.000 1 Stavros E 15.45 32.70 16.40 32.45 [+0.033] 0.000 I Ziros F 16.40 32.45 17.45 31.10 [+0.052] 0.000 1 Arta G 19.60 32.40 22.70 36.30 [-0.052 -0.069] 3
[-0.060 -0.100] [-0.055 -0.094]
Amvracia H 21.60 40.15 24.00 43.80 [+0.092 -0.219] 3 [+0.088 -0.266] [+0.063 -0.252]
Amphilochia J 22.70 36.30 24.00 43.80 [-0.088 -0.012] 3 [-0.115 +0.075] [-0.168 +0.155]
Preveza K 13.85 33.15 15.80 37.70 [+0.035 +0.131] 3 [+0.065 +0.153] [+0.094 +0.187]
Levkas North L 14.40 39.40 15.80 37.70 +0.310 0.000 1 Levkas West M 14.40 39.40 0.00 68.80 +0.300 +0.075 1 Souli/Thesprotika N 5.83 3.00 15.45 32.70 -0.031 +0.074 1 Pente Dendra P 8.23 3.00 17.45 31.10 -0.031 +0.074 1 Aetolia Q 24.00 43.80 35.29 70.00 -0.217 -0.136 1
Conventions: vector angle is expressed in degrees relative to grid north. Left-lateral and normal dip-slip components are negative; right-lateral and thrust are positive. Where an element is shown to have more than one segment, it is split into the indicated number of separate boundary elements on a straight line between the assigned coordinates. The values of slip calculated for the elements are provided with the uppermost corresponding to the (XI, Yl) end and the lowermost to the (X2, Y2) end. Bracketed figures are calculated by the program; unbracketed are input.
» I
•MM
.12
12 16
.vt
. « t .
A m
42
Figure 18. Modeled re-gions of uplift and subsid-ence around the Gulf of Arta for comparison with Figure 17. The displace-ments and coordinates of the faults are set out in Ta-bles 7 and 8. The signifi-cance of the shading is dis-cussed in the caption of Figure 6.
curs along the northern side of the Aegean arc and is manifest in north-south normal faults in Crete and the Peleponese, a possibility that Le Pichon and Angelier (1979) recognized. We accept that this stretching probably oc-curs and may be significant if it is sufficiently rapid. Apart from changing the behavior of the eastern end of the Hellenic arc, which is only of marginal concern in this paper, such deformation could relax constraints on the locations and rates of the Ionian/African and Ionian/Europe poles by relaxing conditions on the Aegean/Ionian and Aegean/European poles. This will leave our interpretation of most of the region in Figure 13 unchanged but could allow the occult Medina Wrench to joint the Aegean arc farther to the west than we show and reduce the required slip rate. Similar arguments apply to recent models of Taymaz (1990). We note, however, that his focal mechanism for an otherwise unex-plained event (17 August 1982) on our pro-posed extension of the Medina Wrench (Fig. 15b) is in agreement with our proposed slip direction for the boundary if the northwest-dipping plane is regarded as the fault plane.
Geological Society of America Bulletin, February 1993 159
on September 15, 2015gsabulletin.gsapubs.orgDownloaded from
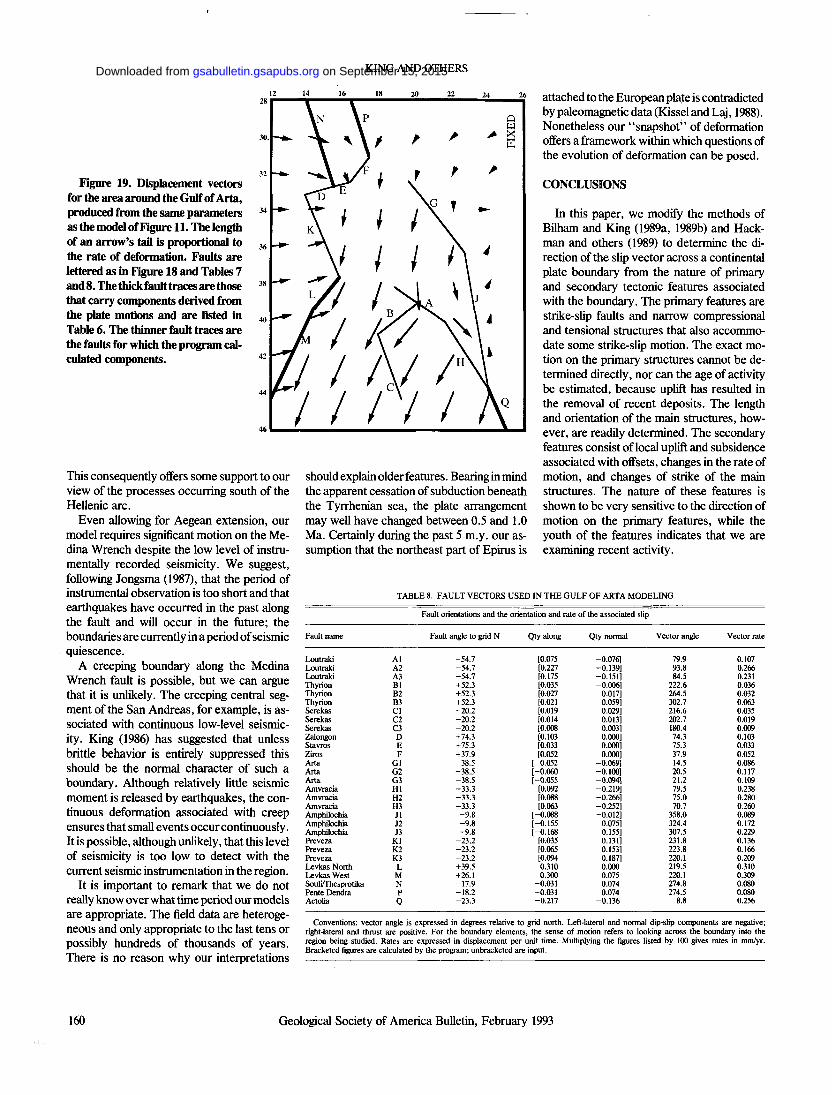
KING AND OTHERS
12 28
30.
32
Figure 19. Displacement vectors for the area around the Gulf of Arta, produced from the same parameters 34
as the model of Figure 11. The length of an arrow's tail is proportional to 36
the rate of deformation. Faults are lettered as in Figure 18 and Tables 7 and 8. The thick fault traces are those 38
that carry components derived from the plate motions and are listed in 40
Table 6. The thinner fault traces are the faults for which the program cal-culated components. 42
44
46
This consequently offers some support to our view of the processes occurring south of the Hellenic arc.
Even allowing for Aegean extension, our model requires significant motion on the Me-dina Wrench despite the low level of instru-mentally recorded seismicity. We suggest, following Jongsma (1987), that the period of instrumental observation is too short and that earthquakes have occurred in the past along the fault and will occur in the future; the boundaries are currently in a period of seismic quiescence.
A creeping boundary along the Medina Wrench fault is possible, but we can argue that it is unlikely. The creeping central seg-ment of the San Andreas, for example, is as-sociated with continuous low-level seismic-ity. King (1986) has suggested that unless brittle behavior is entirely suppressed this should be the normal character of such a boundary. Although relatively little seismic moment is released by earthquakes, the con-tinuous deformation associated with creep ensures that small events occur continuously. It is possible, although unlikely, that this level of seismicity is too low to detect with the current seismic instrumentation in the region.
It is important to remark that we do not really know over what time period our models are appropriate. The field data are heteroge-neous and only appropriate to the last tens or possibly hundreds of thousands of years. There is no reason why our interpretations
16 18 20 22 24 26
should explain older features. Bearing in mind the apparent cessation of subduction beneath the Tyrrhenian sea, the plate arrangement may well have changed between 0.5 and 1.0 Ma. Certainly during the past 5 m.y. our as-sumption that the northeast part of Epirus is
attached to the European plate is contradicted by paleomagnetic data (Kissel and Laj, 1988). Nonetheless our "snapshot" of deformation offers a framework within which questions of the evolution of deformation can be posed.
CONCLUSIONS
In this paper, we modify the methods of Bilham and King (1989a, 1989b) and Hack-man and others (1989) to determine the di-rection of the slip vector across a continental plate boundary from the nature of primary and secondary tectonic features associated with the boundary. The primary features are strike-slip faults and narrow compressional and tensional structures that also accommo-date some strike-slip motion. The exact mo-tion on the primary structures cannot be de-termined directly, nor can the age of activity be estimated, because uplift has resulted in the removal of recent deposits. The length and orientation of the main structures, how-ever, are readily determined. The secondary features consist of local uplift and subsidence associated with offsets, changes in the rate of motion, and changes of strike of the main structures. The nature of these features is shown to be very sensitive to the direction of motion on the primary features, while the youth of the features indicates that we are examining recent activity.
TABLE 8. FAULT VECTORS USED IN THE GULF OF ARTA MODELING
Fault orientations and the orientation and rate of the associated slip
Fault name Fault angle to grid N Qty along Qty normal Vector angle Vector rate
Loutraki Al -54.7 [0.075 -0.076] 79.9 0.107 Loutraki A2 -54.7 [0.227 -0.139] 93.8 0.266 Loutraki A3 -54.7 [0.175 -0.151] 84.5 0.231 Thyrion B1 +52.3 [0.035 -0.006] 222.6 0.036 Thyrion B2 +52.3 [0.027 0.017] 264.5 0.032 Thyrion B3 +52.3 [0.021 0.059] 302.7 0.063 Serekas CI -20.2 [0.019 0.029] 216.6 0.035 Serekas C2 -20.2 [0.014 0.013] 202.7 0.019 Serekas C3 -20.2 [0.008 0.003] 180.4 0.009 Zalongon D +74.3 [0.103 0.000] 74.3 0.103 Stavros E +75.3 [0.033 0.000] 75.3 0.033 Ziros F +37.9 [0.052 0.000] 37.9 0.052 Aita Gl -38.5 [-0.052 -0.069] 14.5 0.086 Aita G2 -38.5 [-0.060 -0.100] 20.5 0.117 Arta G3 -38.5 [-0.055 -0.094] 21.2 0.109 Amvracia Hl -33.3 [0.092 -0.219] 79.5 0.238 Amvracia H2 -33.3 [0.088 -0.266] 75.0 0.280 Amvracia H3 -33.3 [0.063 -0.252] 70.7 0.260 Amphilochia J1 -9 .8 [-0.088 -0.012] 358.0 0.089 Amphilochia J2 -9 .8 [-0.155 0.075] 324.4 0.172 Amphilochia J3 -9 .8 [-0.168 0.155] 307.5 0.229 Preveza Kl -23.2 [0.035 0.131] 231.8 0.136 Preveza K2 -23.2 [0.065 0.153] 223.8 0.166 Preveza K3 -23.2 [0.094 0.187] 220.1 0.209 Levkas North L +39.5 0.310 0.000 219.5 0.310 Levkas West M +26.1 0.300 0.075 220.1 0.309 Souli/Thesprotika N -17.9 -0.031 0.074 274.8 0.080 Pente Dendra P -18.2 -0.031 0.074 274.5 0.080 Aetolia Q -23.3 -0.217 -0.136 8.8 0.256
Conventions: vector angle is expressed in degrees relative to grid north. Left-lateral and normal dip-slip components are negative; right-lateral and thrust are positive. For the boundary elements, the sense of motion refers to looking across the boundary into the region being studied. Rates are expressed in displacement per unit time. Multiplying the figures listed by 100 gives rates in mm/yr. Bracketed figures are calculated by the program; unbracketed are input.
160 Geological Society of America Bulletin, February 1993
on September 15, 2015gsabulletin.gsapubs.orgDownloaded from
LANDSCAPE GEOMETRY AND ACTIVE TECTONICS, GREECE
Boundary element modeling of the uplift and subsidence of the secondary features for Epirus defines the direction of motion on the main structures, and hence we show that the azimuth of the slip vector between the Ionian plate to the west and the European plate to the east lies at N275°E. This slip vector, together with information from Le Pichon and Ange-lier (1979) and Jongsma and others (1987), permits the pole of rotation of the Ionian plate, and consequently of other plates in the region, to be determined more accurately than before.
The new plate configuration is shown to have predictive value. The Gulf of Arta is identified as a triple junction between the Io-nian, Aegean, and European plates, the rel-ative motions of which can now be estimated. Together with the known positions of the ma-jor faults, this allows us to produce a model that reproduces the morphology of the Gulf and predicts motions for the associated faults.
ACKNOWLEDGMENTS
Field work for this project was carried out as part of the Klithi Archaeological project coordinated by Dr. G. N. Bailey of the De-partment of Archaeology of Cambridge Uni-versity. Funding has been provided by the British Academy, the British School at Ath-ens, the Society of Antiquaries, the National Geographic Society, and the Directorate General XII of the Commission of the Euro-pean Communities. We also acknowledge the Institute of Geological and Mineralogical Re-search (IGME) Athens for the issue of field-work permits. The U.S. Geological Survey in Golden, Colorado, also permitted facilities to be used during the preparation of this paper. Helpful reviews have been provided by Geoffrey Bailey, Michael Ellis, Christine Hackman, Gillian Foulger, Robert Anderson, Ernie Anderson, Paul Bodin, and an anony-mous reviewer. We are particularly grateful to Nick Debenham and the British Museum Research Laboratory for age dates.
REFERENCES CITED
Ambraseys, N. N., 1989, Temporary seismic quiescence: SE Tur-key: Royal Astronomical Society Geophysical Journal, v. 96, p. 311-331.
Ambraseys, N. N„ and Melville, C. P., 1982, A history of Persian earthquakes: Cambridge, England, Cambridge University Press, 398 p.
Anderson, H., and Jackson, J., 1987, Active tectonics of the Adriatic region: Royal Astronomical Society Geophysical Journal, v. 91, p. 937-983.
Aubouin, J., 1965, Geosynclines: Amsterdam, Netherlands, Elsevier, 335 p.
Bailey, G. N., Gamble, C. S., Higgs, H. P., Roubet, C., Webley, D. P., Gowlett, J. A. J., Sturdy, D. A., and Turner, C., 1986a, Dating results from palaeolithic sites and palaeoenvironments in Epirus (northwest Greece), in Gowlett, J.A.J., and Hedges, R.E.M., eds., Archaeological results from accelerator dating: Oxford, England, Oxford Committee for Archaeology, p. 99-107.
Bailey, G. N., Gamble, C. S., Higgs, H. P., Roubet, C., Sturdy, D. A., and Webley, D. P., 198®, Palaeolithic investigations at Klithi: Preliminary results of the 1984-1985 field seasons: Annua] of the British School of Archaeology at Athens, v. 81, p. 7-35.
Bilham, R. G., and King, G.C.P., 1989a, The morphology of strike slip faults; examples from the San Andreas, California: Jour-nal of Geophysical Research, v. 94, B8, p. 10204-10216.
Bilham, R. G„ and King.G.C.P., 1989b, Slip distribution on oblique segments of the San Andreas fault, California; observations and theory: U.S. Geological Survey Open-File Report.
Brooks, M„ Clews, J. E., Melis, N. S., and Underhill, J. R., 1988, Structural development of Neogene basins in western Greece: Basin Research, v. 1, p. 129-138.
Bullard, E. C., Everett, J. E., and Smith, A. G„ 1965, Fit of the continents around the Atlantic, in Blackett, P.M.S., Bullard, E. C., and Runcorn, S. K., eds., A symposium on continental drift: Royal Society of London Philosophical Transactions, ser. A, v. 258, p. 14-75.
Comninakis, P. E., and Papazachos, B. C., 1982, A catalogue of historical earthquakes in Greece and the surrounding area 497 B.C.-1900 A.D.: University of Thessaloniki Geophysical Laboratory, Publication No. 5, 24 p.
Crouch, S. L., and Starfield, A. M., 1983, Boundary element meth-ods in solid mechanics: London, England, Allen Unwin, 298 p.
Dercourt, J., and others, 1986, Geological evolution of the Tethys belt from the Atlantic to the Pamirs since the Lias, in Aubouin, J., Le Pichon, X., and Monin, A. S., eds.. Evolution of the Tethys: Tectonophysics, v. 123, p. 241-315.
Dewey, J. F., and Çengor, A.M.C., 1979, Aegean and surrounding regions: Complex multiplate and continuum mechanics in a convergent zone: Geological Society of America Bulletin, Part I, v. 90, p. 84-92.
Dewey, J. F „ Pitman, W. C., and Ryan, W.B.F., 1973, Plate tec-tonics and the evolution of the Alpine system: Geological Society of America Bulletin, v. 84, p. 3137-3180.
Einnarsson, P., Bjomsson, S., Foulger, G., Stefansson, R., and Skaftadottir, T., 1981, Seismicity patterns in the South Iceland Seismic Zone, in Simpson, D. W., and Richards, P. G., eds., Earthquake prediction: An International Review, Maurice Ewing Series, Volume 4: Washington, D.C., American Geo-physical Union, p. 141-151.
Hackman. C., King, G.C.P., and Bilham, R. G„ 1990, The me-chanics of the South Iceland Seismic Zone: Journal of Geo-physical Research, v. 95, Bl l , p. 17339-17351.
Harding, T. P., 1985, Seismic characteristics and identification of negative flower structures, and positive structural inversion: American Association of Petroleum Geologists Bulletin, v. 69, p. 582-600.
Hatzfeld, D., 1991, Geodynamics of the Aegean: A micro-seismo-tectonics approach. International School of Solid Earth Geo-physics, 7th Course: Modes of Crustal Deformation: from the Brittle Upper Crust through Detachments to the Ductile Lower Crust: Roma, Istituto Nationale di Geofisica, Abstracts.
Institut Greque des Recherches Sous-Sol-Institut Français de Pé-trole, 1966, Etude geoiogique de l'epire: Paris, France, Edi-tions Technip, 2 volumes, 356 p., 9 maps.
Jongsma, D., Woodside, J., King, G.C.P., and van Hinte, J. E., 1987, The Medina Wrench: A key to the kinematics of the central and eastern Mediterranean over the past 5 Ma: Earth and Planetary Science Letters, v. 82, p. 87-106.
King, G.C.P., 1983, The accommodation of strain in the upper lith-osphère of the Earth by self-similar fault systems; the geo-metrical origin of b-value: Pure and Applied Geophysics, v. 121, p. 761-815.
King, G.C.P., 1986, Speculations on the geometry of the initiation and termination of earthquake rupture and the evolution of morphology and geological structures: Pure and Applied Geo-physics, v. 124, p. 567-585.
King, G.C.P., and Bailey, G. N., 1985, The palaeoenvironment of some archaeological sites in Greece: The influence of accu-mulated uplift in a seismically active region: Proceedings of the Prehistoric Society, v. 51, p. 273-282.
King, G.C.P., Tselentis, A., Gomberg, J., Molnar, P., Roecker, S. W„ Sinvhal, H„ Soufleris, C„ and Stock, J. M., 1983, Microeaithquake seismicity and active tectonics of north-western Greece: Earth and Planetary Science Letters, v. 66, p. 279-288.
King, G.C.P., Stein, R., and Rundle, J., 1988, The growth of geo-logical structures by repeated earthquakes: 1. Conceptual framework: Journal of Geophysical Research, v. 93, Bl l , p. 13307-13318.
Kissel, C., and Laj, C., 1988, The Tertiary geodynamical evolution of the Aegean arc: A paleomagnetic reconstruction, in Wezel, F.-C., ed., The origin and evolution of arcs: Tectonophysics, v. 146, p. 183-201.
Le Pichon, X., and Angelier, J., 1979, The Hellenic arc and trench system: A key to the neotectonic evolution of the eastern Mediterranean area: Tectonophysics, v. 60, p. 1-42.
Lyon-Caen, H., Arrnijo. R., Drakopoulos, J., Baskoutas, J., Deli-bassis, N., Gaulon, R., Kouskouna, V., Latoussakis, J., Mak-ropoulos, K., Papadimitriou, P., Papanastassiou, D., and Pe-dotti, G., 1988, The 1986 Kalamata (s. Peloponessos) earthquake: Detailed study of a normal fault, evidence for east-west extension in the Hellenic Arc: Journal of Geophys-ical Research, v. 93, p. 14,967-15,000.
McKenzie, D. P., 1972, Active tectonics of the Mediterranean re-gion: Royal Astronomical Society Geophysical Journal, v. 30, p. 109-185.
McKenzie, D. P., 1978, Active tectonics of the Alpine-Himalayan belt: The Aegean sea and surrounding regions: Royal Astro-nomical Society Geophysical Journal, v. 55, p. 217-254.
Minster, J. B., and Jordan, T. H., 1978, Present day plate motions: Journal of Geophysical Research, v. 83, p. 5331-5354.
Papazachos, B. C., and Comninakis, P. M., 1982, A catalogue of earthquakes inGreeceandthe surrounding area for the period 1901-1980: Thessaloniki, Greece, University of Thessaloniki, Geophysical Laboratory Publication No. 5, 145 p.
Papazachos, B. C., and Kiratsi, A. A., 1992, A formulation for reliable estimation of active crustal deformation and its ap-plication to centra] Greece: Geophysical Journal International (in press).
Papazachos, B. C., Comninakis, P. E., Hatzidimitriou, P. M., Kir-iakidis, E. G., Kyratzi, A. A., Panagiotopoulos, D. G., Pa-padimitriou, E. E., Papaioannou, Ch. A., Pavlideas, S. B., and Tzanis, E. P., 1982, Atlas of isoseismal maps for earth-quakes in Greece 1902-1981: Thessaloniki, Greece, Univer-sity of Thessaloniki, Geophysical Laboratory.
Rackham, O., 1983, Observations on the historical ecology of Boeo-tia: Annual of the British School at Athens, v. 81, p. 291-351.
Rundle, J. B., 1988, A physical model for earthquakes: 1. Fluctu-ations and interactions: Journal of Geophysical Research, v. 93, p. 6237-6254.
Sengor, A.M.C., Gorur, N., and Saroglu, F., 1985, Strike-slip fault-ing and related basin formation in zones of tectonic escape: Turkey as a case study: Tulsa, Oklahoma, Society of Eco-nomic Paleontologists and Mineralogists, Special Publication 37, p. 227-264.
Shedlock, K. M„ Brocher, T. M„ and Harding, S. T„ 1990, Shallow structure and deformation along the San Andreas fault in Cholame Valley, California: Journal of Geophysical Re-search, v. 95, B4, p. 5003-5020.
Smith, A. G„ and Woodcock, N. H., 1982, Tectonic synthesis of the Alpine-Mediterranean region: A review. Alpine Mediterra-nean geodynamics: Washington, D.C., American Geophysi-cal Union Geodynamics Series, Volume 7, p. 15-38.
Stein, R., King, G.C.P., and Rundle, J., 1988, The growth of geo-logical structures by repeated earthquakes: 2. Field examples of continental dip-slip faults: Journal of Geophysical Re-search, v. 93, B l l , p. 13319-13331.
Sturdy, D. A., and Webley, D. P., 1988, Palaeolithic geography: Or where are the deer?: World Archaeology, v. 19, p. 262-280.
Taymaz, T., 1990, Earthquake source parameters in the eastern Mediterranean region {Ph.D. thesis]: Cambridge, England, Cambridge University.
Underhill, J. R., 1989, Late Cenozoic deformation of the Hellenide foreland, western Greece: Geological Society of America Bul-letin, v. 101, p. 613-634.
MANUSCRIPT RECEIVED BY THE SOCIETY AUGUST 2 1 , 1 9 9 1
REVISED MANUSCRIPT RECEIVED APRIL 2 1 , 1992
MANUSCRIPT ACCEPTED M A Y 2 2 , 1 9 9 2
Printed in U.S.A.
Geological Society of America Bulletin, February 1993 161
on September 15, 2015gsabulletin.gsapubs.orgDownloaded from
Geological Society of America Bulletin
doi: 10.1130/0016-7606(1993)105<0137:TLGAAT>2.3.CO;2 1993;105, no. 2;137-161Geological Society of America Bulletin
GEOFFREY KING, DEREK STURDY and JOHN WHITNEY The landscape geometry and active tectonics of northwest Greece
Email alerting servicescite this article
to receive free e-mail alerts when new articleswww.gsapubs.org/cgi/alertsclick
SubscribeAmerica Bulletin
to subscribe to Geological Society ofwww.gsapubs.org/subscriptions/click
Permission request to contact GSAhttp://www.geosociety.org/pubs/copyrt.htm#gsaclick
Opinions presented in this publication do not reflect official positions of the Society.positions by scientists worldwide, regardless of their race, citizenship, gender, religion, or political viewpoint.article's full citation. GSA provides this and other forums for the presentation of diverse opinions and articles on their own or their organization's Web site providing the posting includes a reference to thescience. This file may not be posted to any Web site, but authors may post the abstracts only of their unlimited copies of items in GSA's journals for noncommercial use in classrooms to further education anduse a single figure, a single table, and/or a brief paragraph of text in subsequent works and to make
toemployment. Individual scientists are hereby granted permission, without fees or further requests to GSA, Copyright not claimed on content prepared wholly by U.S. government employees within scope of their
Notes
Geological Society of America
on September 15, 2015gsabulletin.gsapubs.orgDownloaded from