
On connection, linearization and duplication coefficients of ...
Journal of Structural Geology 29 (2007) 117e128www.elsevier.com/locate/jsg
Constraints on friction coefficients by an inverse analysis ofsand box thrust dips
Bertrand Maillot a,*, Christophe Barnes a, Jean-Marie Mengus b, Jean-Marc Daniel b
a Department des Sciences de la Terre et de l’environment, CNRS-UMR 7072, Universite de Cergy-Pontoise,5, mail Gay Lussac, Neuville-sur-Oise, 95031 Cergy-Pontoise, France
b Division Geologie-Geochimie, Institut Francais du Petrole, Reuil-Malmaison, France
Received 19 December 2005; received in revised form 13 July 2006; accepted 14 July 2006
Available online 22 September 2006
Abstract
We measured the dips of thrusts forming in a uniform sand layer under horizontal shortening by a rigid emerging ramp in conditions of fullerosion. Various ramp dips and four types of ramp material were used throughout the 12 experiments. In three experiments, the ramp was short-cut by a less steep thrust forming a spontaneous ramp in the sand. The forward modelling proposed to predict these observations involves(i) computing the total dissipation in the structure by using global force equilibrium and a parameterised kinematic framework including thepossibility of shortcut development, and (ii) minimising the total dissipation of mechanical work with respect to the kinematic parameters(i.e., the thrust dips), for which two analytic solutions are found. The inverse problem involves computing probability densities over the para-metric space of friction coefficients, including the internal friction angle of the sand, and friction angles of the four materials used on the rigidramps. Practically, this involves computing a misfit (using the L2 norm) between the observed and predicted thrust dips for every possible valueof the friction angles. The resulting probability density provides all the quantitative information that can be retrieved from the experiments in thelight of our forward modelling. Ramp friction angles exhibit sharp probability changes at values that trigger the occurrence of shortcuts, thusyielding non-trivial bounds on the ramp friction values that are directly related to the observations of ramp and back thrust geometry. Also, theprobability distribution of the internal sand friction, and those of the ramp frictions, is in good agreement with independent measurements.This approach is designed to be applicable to field studies of brittle deformation where geometries are observed and rheological parametersare sought.� 2006 Elsevier Ltd. All rights reserved.
Keywords: Analogue modelling; Friction coefficient; Thrust dip; Inverse problem; Fault-bend fold
1. Introduction
Fold-and-thrust belts are classically characterized by theshortening of sedimentary layers above horizontal decollementlayers that lie at decreasing depths towards the exterior of theorogenic belt (Rich, 1934). These various decollements join byreverse faulting across more competent layers, forming a seriesof ramps. Generic kinematic models of this flaterampeflatgeometry (e.g., Suppe, 1983) have proven useful in the
* Corresponding author. Tel.: þ33 134257359; fax: þ33 134257350.
E-mail address: [email protected] (B. Maillot).
0191-8141/$ - see front matter � 2006 Elsevier Ltd. All rights reserved.
doi:10.1016/j.jsg.2006.07.013
construction of balanced cross-sections, and in the interpreta-tion of microstructures formed due to large scale folding asso-ciated with thrust ramps (e.g., Grelaud et al., 2000). However,these models are less helpful in relating field observations torheological parameters because they make no reference toforce balance. The use of analogue models with well knownrheological parameters gives some insight into these problems(e.g., Merle and Abidi, 1995; Bonini et al., 2000; Persson,2001); although conclusions often remain qualitative becauseforces are not measured or modelled. Numerical simulations,which solve the full boundary valued problem, offer comple-mentary insights (e.g., Erickson and Jamison, 1995; Ericksonet al., 2001), although they often face problems related to
118 B. Maillot et al. / Journal of Structural Geology 29 (2007) 117e128
strain localisation or the effects of sharp boundary conditions.This makes it difficult to perform detailed comparisons of theiroutputs with analogue models (e.g., see Buiter et al., 2006;Schreurs et al., 2006, and references therein). Thus, analogueand numerical models are experimental tools used to help usbetter understand the deformation mechanisms and tectonicstructures. Ideally, each should be tested against analyticalsolutions when possible. This allows analogue experimentsto get closer to a full quantitative analysis, while numericalsolutions can be tested for convergence. The present paper isour third contribution in this line of research.
Using a kinematic model of fault-bend folding (Suppe,1983) as a starting point and inspired by Merchant’s (1944)approach of the mechanics of metal cutting, Maillot and Leroy(2003) have proposed a model that optimizes the dissipation ofmechanical work with respect to the dip of the transition zonebetween the hanging walls of the lower flat and ramp, whichmay appear as a reverse fault or as a ductile hinge. Theyshowed in particular that the dip is less than that which is usu-ally assumed in kinematic models, leading to a thickening ofthe hanging wall above the ramp. This prediction has been ver-ified using sand box experiments (Maillot and Koyi, 2006). Inthe present paper we apply our theoretical approach to the hor-izontal shortening of a single sand layer over a rigid ramp ina steady-state regime involving full erosion of any built-upsurface relief. This setup is analogous to the shortening of sed-imentary layers cut by pre-existing normal faults due to anolder extensional phase. Numerous examples can be foundin the literature (e.g., Roure and Colletta, 1996), most notablyin the Colombian and Venezuelan Andes, and the French sub-alpine massifs (e.g., see Colletta, 2005). Here, we presenta new analytical solution which generalises Anderson’s pre-diction of dips of conjugate reverse faults for the case of faultswith different friction angles. In an attempt to illustrate howsuch theoretical predictions can be used to analyze field dataof thrust dips, we treat our sand box experiments as if theywere field observations: thrusts can be identified and theirdips can be measured, but their rheological parameters remainunknown. We propose to use the inverse problem theory(Tarantola, 1987) to gain quantitative information on theseparameters.
The contents of the paper are as follows. In Section 2, wepresent a series of 12 experiments in which a uniform sandlayer is compressed horizontally over a rigid ramp with condi-tions of full erosion. Six ramp dips (from 19� to 66�) and fourtypes of frictional surfaces were used. The sand responds byforming a series of thrusts that allow it to slide upward overthe imposed ramp. In three experiments, the imposed rampwas shortcut by a less steep spontaneous ramp in the sand.For most experiments the thrust dips follow a Gaussian distri-bution, as indicated by a c2 test. The direct problem is pre-sented in Section 3. Assuming a purely frictional behaviourfor the sand, a forward model is developed in which (i) the to-tal dissipation in the structure is computed by combining theknown kinematics, parameterised using the ramp and thrustdips, with a global force equilibrium of rigid blocks, and (ii)the total dissipation is minimised with respect to the thrust
dips (Maillot and Leroy, 2003). Finally, the inverse problempresented in Section 4 involves computing probability densi-ties over the parametric space of the friction coefficients (afive dimensional space defined by the internal friction angleof the sand, and the friction angles of the four materialsused on the rigid ramps). Practically, this involves computinga misfit (using the L2 norm, in accordance with the Gaussiancharacter of the data) between the observed and predictedthrust dips for every possible value of the friction angles.The resulting probability distributions show for each frictionangle the range of values compatible with the experiments.They prove to be in agreement with independent friction mea-surements. The results reproduce very clearly the phenomenonof shortcuts as well as the dependency between ramp andthrust friction values and provide probabilistic upper or lowerbounds on the friction coefficients of the various ramps.
2. Description of the experiments
2.1. Experimental setup
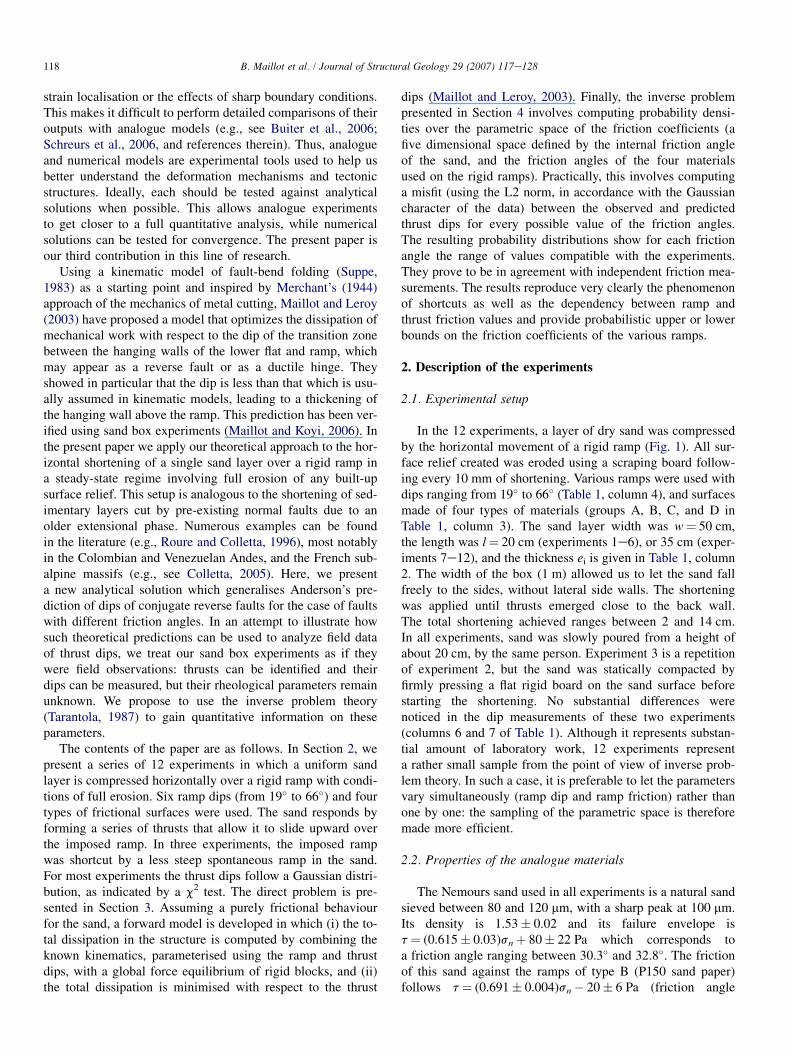
In the 12 experiments, a layer of dry sand was compressedby the horizontal movement of a rigid ramp (Fig. 1). All sur-face relief created was eroded using a scraping board follow-ing every 10 mm of shortening. Various ramps were used withdips ranging from 19� to 66� (Table 1, column 4), and surfacesmade of four types of materials (groups A, B, C, and D inTable 1, column 3). The sand layer width was w¼ 50 cm,the length was l¼ 20 cm (experiments 1e6), or 35 cm (exper-iments 7e12), and the thickness ei is given in Table 1, column2. The width of the box (1 m) allowed us to let the sand fallfreely to the sides, without lateral side walls. The shorteningwas applied until thrusts emerged close to the back wall.The total shortening achieved ranges between 2 and 14 cm.In all experiments, sand was slowly poured from a height ofabout 20 cm, by the same person. Experiment 3 is a repetitionof experiment 2, but the sand was statically compacted byfirmly pressing a flat rigid board on the sand surface beforestarting the shortening. No substantial differences werenoticed in the dip measurements of these two experiments(columns 6 and 7 of Table 1). Although it represents substan-tial amount of laboratory work, 12 experiments representa rather small sample from the point of view of inverse prob-lem theory. In such a case, it is preferable to let the parametersvary simultaneously (ramp dip and ramp friction) rather thanone by one: the sampling of the parametric space is thereforemade more efficient.
2.2. Properties of the analogue materials
The Nemours sand used in all experiments is a natural sandsieved between 80 and 120 mm, with a sharp peak at 100 mm.Its density is 1.53� 0.02 and its failure envelope ist¼ (0.615� 0.03)snþ 80� 22 Pa which corresponds toa friction angle ranging between 30.3� and 32.8�. The frictionof this sand against the ramps of type B (P150 sand paper)follows t¼ (0.691� 0.004)sn� 20� 6 Pa (friction angle
119B. Maillot et al. / Journal of Structural Geology 29 (2007) 117e128
ei
mov
ing
rigid
ram
p
incipi
ent
thrus
t
side wall
(away from sand)
back
wall
w
l
appliedshortening
Fig. 1. Schematic diagram of the sand box. Note that the side walls are not in contact with the sand, which spreads freely in the box (w¼ 50 cm, and the box is 1 m
wide). The side walls serve only to guide the scraping board when eroding any relief above the height ei of the rigid ramp.
between 34.5� and 34.8�). For ramps of type D (fiber glasssheet), t¼ (0.426� 0.005)snþ 51� 11 Pa (friction angle be-tween 22.8� and 23.3�). All these frictional properties weredetermined previously by Maillot and Koyi (2006). Frictionvalues of the sand against the ramp materials used in groupsA and C have not been measured. However, the PVC and var-nished wood surface used in group A is smooth and hard and isexpected to have a low friction value, while the plaster coatedand sanded raw wood used in group C should have a frictionvalue lying between those of groups B (sand paper) and D(smooth and soft fiber glass sheet). Thus the ramp frictionvalues may be reliably placed in increasing order: A<D(m¼ 0.426� 0.005)<C< B (m¼ 0.691� 0.004). The bot-tom of the box was covered with a fiber glass sheet with thesame friction as ramps of type D given above.
2.3. Measurement and statistical description of theexperimental results
The dips of the ramp (4) and thrusts (q) were measured byhand picking the active faults from scanner images. Scannercross-sections were taken ever 3 cm along strike at the endof each experiment with a definition of about 1 mm. Activefaults were determined by the offset they produce in the sur-face topography since the last erosion event (i.e., last 10 mmof horizontal shortening). Curved faults were sampled usingshort straight segments, with each segment constituting one in-dependent measurement. These raw data were then weightedproportionally to segment length in order to give more impor-tance to a planar thrust crossing all the sand layers comparedto a small segment. In general, along dip and along strike
Table 1
List of experiments. Columns 2e4 give the thickness of the sand layer (ei, column 2) that was shortened by an imposed right ramp dipping at 40 (column 4) and
made of material A, B, C, or D (column 3, see Section 2 for an explanation)
Experiment
number
Thickness
ei (mm)
Ramp
material
Ramp
dip 40 (�)
Kinematic
case
4� s4 (�) q� sq (�) Number of
samples
Q (c2)
(%)
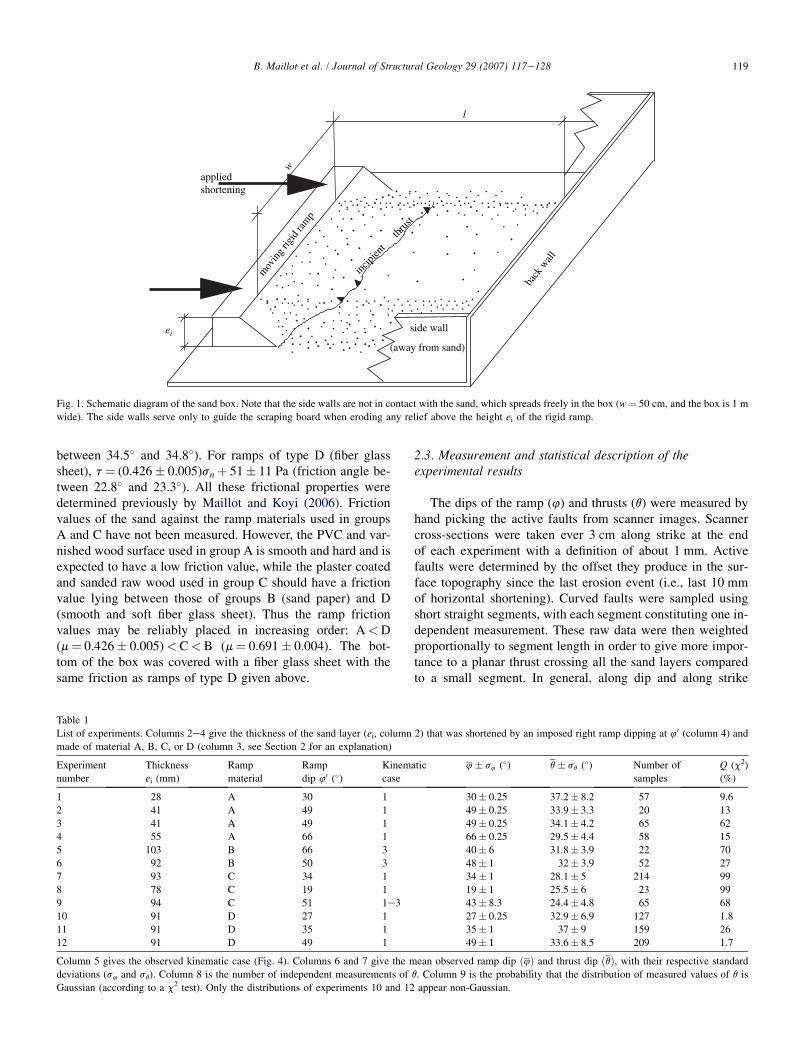
1 28 A 30 1 30� 0.25 37.2� 8.2 57 9.6
2 41 A 49 1 49� 0.25 33.9� 3.3 20 13
3 41 A 49 1 49� 0.25 34.1� 4.2 65 62
4 55 A 66 1 66� 0.25 29.5� 4.4 58 15
5 103 B 66 3 40� 6 31.8� 3.9 22 70
6 92 B 50 3 48� 1 32� 3.9 52 27
7 93 C 34 1 34� 1 28.1� 5 214 99
8 78 C 19 1 19� 1 25.5� 6 23 99
9 94 C 51 1e3 43� 8.3 24.4� 4.8 65 68
10 91 D 27 1 27� 0.25 32.9� 6.9 127 1.8
11 91 D 35 1 35� 1 37� 9 159 26
12 91 D 49 1 49� 1 33.6� 8.5 209 1.7
Column 5 gives the observed kinematic case (Fig. 4). Columns 6 and 7 give the mean observed ramp dip ð4Þ and thrust dip ðqÞ, with their respective standard
deviations (s4 and sq). Column 8 is the number of independent measurements of q. Column 9 is the probability that the distribution of measured values of q is
Gaussian (according to a c2 test). Only the distributions of experiments 10 and 12 appear non-Gaussian.
120 B. Maillot et al. / Journal of Structural Geology 29 (2007) 117e128
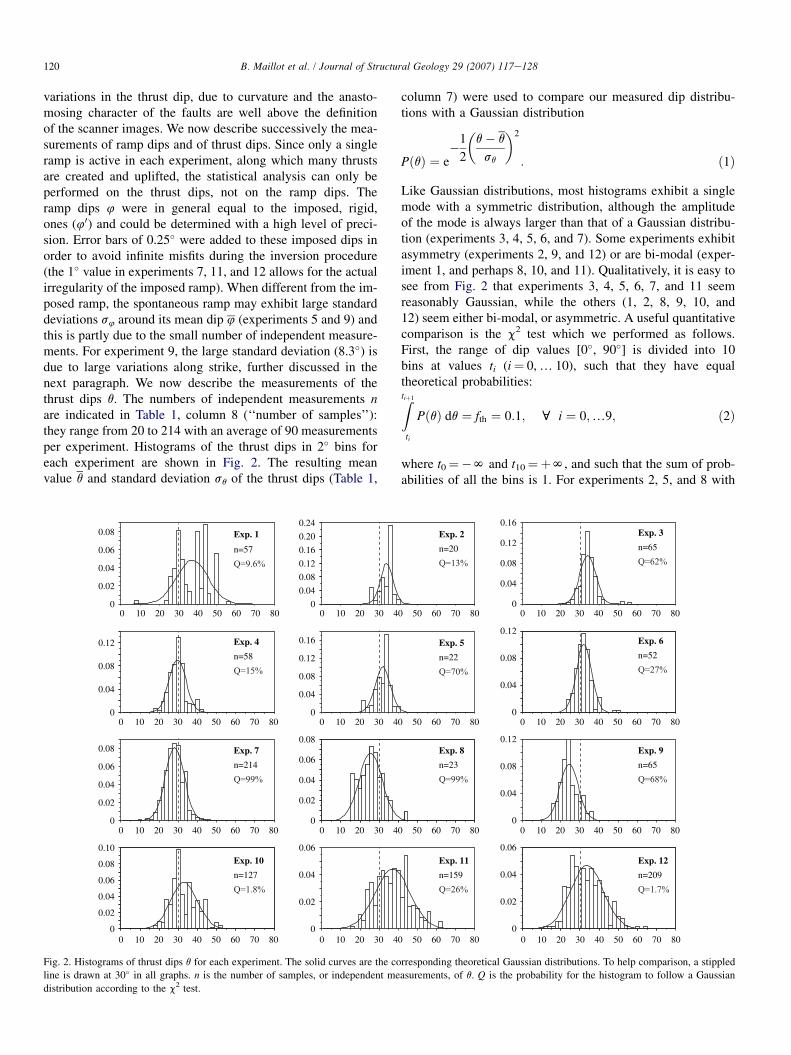
variations in the thrust dip, due to curvature and the anasto-mosing character of the faults are well above the definitionof the scanner images. We now describe successively the mea-surements of ramp dips and of thrust dips. Since only a singleramp is active in each experiment, along which many thrustsare created and uplifted, the statistical analysis can only beperformed on the thrust dips, not on the ramp dips. Theramp dips 4 were in general equal to the imposed, rigid,ones (40) and could be determined with a high level of preci-sion. Error bars of 0.25� were added to these imposed dips inorder to avoid infinite misfits during the inversion procedure(the 1� value in experiments 7, 11, and 12 allows for the actualirregularity of the imposed ramp). When different from the im-posed ramp, the spontaneous ramp may exhibit large standarddeviations s4 around its mean dip 4 (experiments 5 and 9) andthis is partly due to the small number of independent measure-ments. For experiment 9, the large standard deviation (8.3�) isdue to large variations along strike, further discussed in thenext paragraph. We now describe the measurements of thethrust dips q. The numbers of independent measurements nare indicated in Table 1, column 8 (‘‘number of samples’’):they range from 20 to 214 with an average of 90 measurementsper experiment. Histograms of the thrust dips in 2� bins foreach experiment are shown in Fig. 2. The resulting meanvalue q and standard deviation sq of the thrust dips (Table 1,
column 7) were used to compare our measured dip distribu-tions with a Gaussian distribution
PðqÞ ¼ e�1
2
�q� q
sq
�2
: ð1Þ
Like Gaussian distributions, most histograms exhibit a singlemode with a symmetric distribution, although the amplitudeof the mode is always larger than that of a Gaussian distribu-tion (experiments 3, 4, 5, 6, and 7). Some experiments exhibitasymmetry (experiments 2, 9, and 12) or are bi-modal (exper-iment 1, and perhaps 8, 10, and 11). Qualitatively, it is easy tosee from Fig. 2 that experiments 3, 4, 5, 6, 7, and 11 seemreasonably Gaussian, while the others (1, 2, 8, 9, 10, and12) seem either bi-modal, or asymmetric. A useful quantitativecomparison is the c2 test which we performed as follows.First, the range of dip values [0�, 90�] is divided into 10bins at values ti (i¼ 0, . 10), such that they have equaltheoretical probabilities:Ztiþ1
ti
PðqÞ dq ¼ fth ¼ 0:1; c i ¼ 0;.9; ð2Þ
where t0¼�N and t10¼þN, and such that the sum of prob-abilities of all the bins is 1. For experiments 2, 5, and 8 with
Exp. 9Exp. 7
Exp. 10 Exp. 11
Exp. 3
n=57 n=20
Exp. 2Exp. 1n=65
Exp. 4
n=58 n=22
Exp. 5n=52
Exp. 6
Exp. 8
n=214 n=23 n=65
Exp. 12
n=209n=159n=127
0
0.02
0.04
0.06
0.08
0
0.04
0.08
0.12
0.16
0.20
0.24
0
0.04
0.08
0.12
0.16
0
0.04
0
0.04
0.08
0.12
0.16
0
0.04
0.08
0.12
0
0.02
0.04
0.06
0.08
0.02
0.04
0.06
0.08
0.04
0.08
0.12
0
0.02
0.04
0.06
0.08
0.10
0
0.02
0.04
0.06
0
0.02
0.04
0.06
0 10 20 30 40 50 60 70 80
0 10 20 30 40 50 60 70 80
0 10 20 30 40 50 60 70 80
0 10 20 30 40 50 60 70 80 0 10 20 30 40 50 60 70 80 0 10 20 30 40 50 60 70 80
0 10 20 30 40 50 60 70 80 0 10 20 30 40 50 60 70 80
0 10 20 30 40 50 60 70 80 0 10 20 30 40 50 60 70 80
0 10 20 30 40 50 60 70 80 0 10 20 30 40 50 60 70 80
0 0
0.12
0.08
Fig. 2. Histograms of thrust dips q for each experiment. The solid curves are the corresponding theoretical Gaussian distributions. To help comparison, a stippled
line is drawn at 30� in all graphs. n is the number of samples, or independent measurements, of q. Q is the probability for the histogram to follow a Gaussian
distribution according to the c2 test.
121B. Maillot et al. / Journal of Structural Geology 29 (2007) 117e128
less than 50 measurements, five bins were used instead of 10(in which case, fth¼ 0.2, and i¼ 0, . 4 in Eq. (2)). Observedfrequencies of measurements fobs(i)¼ n(i)/n were than calcu-lated from the tenth (or fifth) ti (n(i) is the number of dipsmeasured between ti�1 and ti). Then, we use c2 as an indicatorof dispersion of the observed frequencies with respect to thetheoretical ones:
c2 ¼ nX9
i¼1
�fobsðiÞ � fth
fth
�2
: ð3Þ
Finally, the probability that the observed distribution isa Gaussian distribution is given by the integral from c2 toþN of the c2 distribution function, that is noted Q(c2) andgiven in percent in Table 1, column 9. For a perfect Gaussiandistribution, c2¼ 0 and Q¼ 100%. Typically, a value of Qbelow 3% or 5% indicates a distribution that cannot be consid-ered to be Gaussian. Surprisingly, experiment 1 gives a bettertest than experiment 12. Also, experiments 10 and 12 fail thetest whilst experiment 8 succeeds almost perfectly! The reasonis that the test depends strongly on the total number n of inde-pendent measurements used in Eq. (3). With small amounts ofdata, the test suggests a Gaussian distribution even though thehistogram does not look Gaussian. In contrast, the distribution
can look reasonably Gaussian and have a negative test (exper-iment 10) because there are a lot of data available so that eachdeparture from a Gaussian distribution is very informative andconstraining. We conclude that the Gaussian statistical modelis acceptable for our data, given the available amounts ofindependent measurements. The choice of a Gaussian modelfor the data allows us to choose with confidence the L2norm in the definition of the misfit (19) during the inversionprocedure.
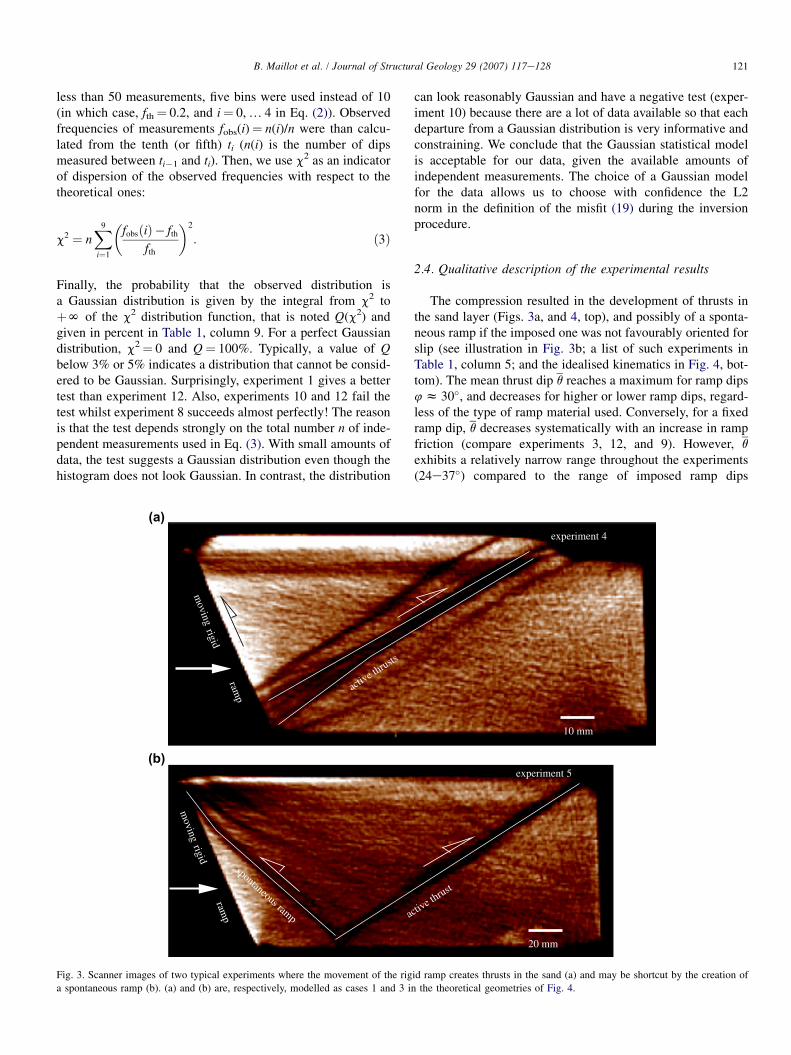
2.4. Qualitative description of the experimental results
The compression resulted in the development of thrusts inthe sand layer (Figs. 3a, and 4, top), and possibly of a sponta-neous ramp if the imposed one was not favourably oriented forslip (see illustration in Fig. 3b; a list of such experiments inTable 1, column 5; and the idealised kinematics in Fig. 4, bot-tom). The mean thrust dip q reaches a maximum for ramp dips4 z 30�, and decreases for higher or lower ramp dips, regard-less of the type of ramp material used. Conversely, for a fixedramp dip, q decreases systematically with an increase in rampfriction (compare experiments 3, 12, and 9). However, q
exhibits a relatively narrow range throughout the experiments(24e37�) compared to the range of imposed ramp dips
(a)
ramp
rigid
moving
spontaneous ramp active th
rust
20 mm
experiment 5
ramp
rigid
moving
active th
rusts
10 mm
experiment 4
(b)
Fig. 3. Scanner images of two typical experiments where the movement of the rigid ramp creates thrusts in the sand (a) and may be shortcut by the creation of
a spontaneous ramp (b). (a) and (b) are, respectively, modelled as cases 1 and 3 in the theoretical geometries of Fig. 4.
122 B. Maillot et al. / Journal of Structural Geology 29 (2007) 117e128
(19e66�) thus suggesting that the thrust dip is relatively insen-sitive to the dip of the imposed ramp. More interesting is theoccurrence (experiments 5, 6, and 9), or absence, of shortcuts.This qualitatively different behaviour, and the very fact that itdid not occur in nine experiments despite the wide range oframp dips tested, brings a strong constraint on the friction pa-rameters of the sand relative to those of the ramps that will behighlighted and quantified by the inversion process. Finally,the sand layer thickness (Table 1, column 2) has apparentlyno substantial effect on the experimental results, and is givenhere for completeness of information. Also, because of the fullerosion, a steady state is reached very quickly and the totalamount of shortening applied has very little effect on the thrust
.k i
j
eivi
eivi
vo
vo
eivi
vo
A
D
E
FBB’
spontaneous ramp
A
rigid ramp
D
E
PABC
FAB FBC
αRαB
αBαB
αF
C
B
rigid ramp
C
B’ B
A’
rigid ramp
D
E
PABC
FBC
A
FAB
C
B
erosion surface
CASE 1 ( = ’)
CASE 2 ( > ’)
CASE 3 ( < ’)
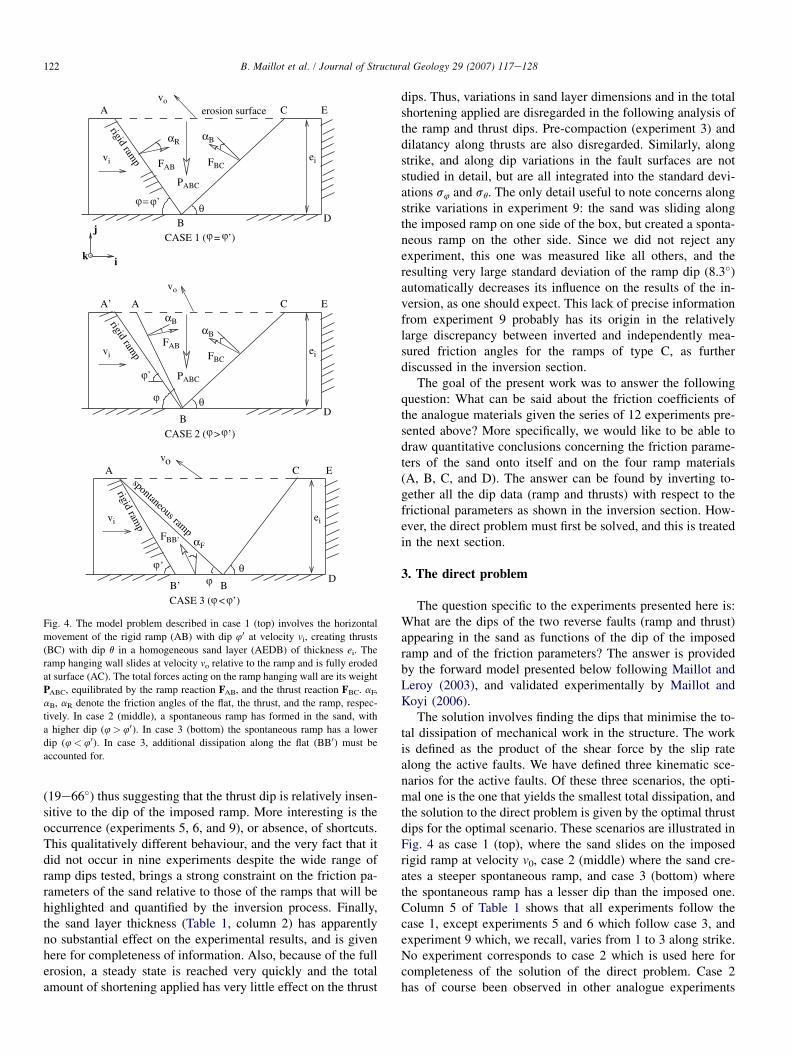
Fig. 4. The model problem described in case 1 (top) involves the horizontal
movement of the rigid ramp (AB) with dip 40 at velocity vi, creating thrusts
(BC) with dip q in a homogeneous sand layer (AEDB) of thickness ei. The
ramp hanging wall slides at velocity vo relative to the ramp and is fully eroded
at surface (AC). The total forces acting on the ramp hanging wall are its weight
PABC, equilibrated by the ramp reaction FAB, and the thrust reaction FBC. aF,
aB, aR denote the friction angles of the flat, the thrust, and the ramp, respec-
tively. In case 2 (middle), a spontaneous ramp has formed in the sand, with
a higher dip (4> 40). In case 3 (bottom) the spontaneous ramp has a lower
dip (4< 40). In case 3, additional dissipation along the flat (BB0) must be
accounted for.
dips. Thus, variations in sand layer dimensions and in the totalshortening applied are disregarded in the following analysis ofthe ramp and thrust dips. Pre-compaction (experiment 3) anddilatancy along thrusts are also disregarded. Similarly, alongstrike, and along dip variations in the fault surfaces are notstudied in detail, but are all integrated into the standard devi-ations s4 and sq. The only detail useful to note concerns alongstrike variations in experiment 9: the sand was sliding alongthe imposed ramp on one side of the box, but created a sponta-neous ramp on the other side. Since we did not reject anyexperiment, this one was measured like all others, and theresulting very large standard deviation of the ramp dip (8.3�)automatically decreases its influence on the results of the in-version, as one should expect. This lack of precise informationfrom experiment 9 probably has its origin in the relativelylarge discrepancy between inverted and independently mea-sured friction angles for the ramps of type C, as furtherdiscussed in the inversion section.
The goal of the present work was to answer the followingquestion: What can be said about the friction coefficients ofthe analogue materials given the series of 12 experiments pre-sented above? More specifically, we would like to be able todraw quantitative conclusions concerning the friction parame-ters of the sand onto itself and on the four ramp materials(A, B, C, and D). The answer can be found by inverting to-gether all the dip data (ramp and thrusts) with respect to thefrictional parameters as shown in the inversion section. How-ever, the direct problem must first be solved, and this is treatedin the next section.
3. The direct problem
The question specific to the experiments presented here is:What are the dips of the two reverse faults (ramp and thrust)appearing in the sand as functions of the dip of the imposedramp and of the friction parameters? The answer is providedby the forward model presented below following Maillot andLeroy (2003), and validated experimentally by Maillot andKoyi (2006).
The solution involves finding the dips that minimise the to-tal dissipation of mechanical work in the structure. The workis defined as the product of the shear force by the slip ratealong the active faults. We have defined three kinematic sce-narios for the active faults. Of these three scenarios, the opti-mal one is the one that yields the smallest total dissipation, andthe solution to the direct problem is given by the optimal thrustdips for the optimal scenario. These scenarios are illustrated inFig. 4 as case 1 (top), where the sand slides on the imposedrigid ramp at velocity v0, case 2 (middle) where the sand cre-ates a steeper spontaneous ramp, and case 3 (bottom) wherethe spontaneous ramp has a lesser dip than the imposed one.Column 5 of Table 1 shows that all experiments follow thecase 1, except experiments 5 and 6 which follow case 3, andexperiment 9 which, we recall, varies from 1 to 3 along strike.No experiment corresponds to case 2 which is used here forcompleteness of the solution of the direct problem. Case 2has of course been observed in other analogue experiments
123B. Maillot et al. / Journal of Structural Geology 29 (2007) 117e128
with very low ramp dips (e.g., Persson, 2001). In all cases weassume that the dissipation of energy occurs only by frictionalong the active ramp (AB) and the thrust (BC), and neglectthe dissipation due to diffuse deformation in the sand. Notethat case 3 implies additional dissipation by friction alongthe flat segment (BB0). Let us now develop the theory foreach case.
3.1. Case 1
We assume that the flow of sand is stationary and isochoric,hence
vosinðqþ4Þ ¼ vi sin q; ð4Þ
obtained by stating that entry (vi) and exit (vo) velocities musthave the same component perpendicular to the thrust. Thischoice of simple kinematics implies that we neglect dilatancy.q is the dip of the thrust (BC), and 4 is the dip of the thrust(AB) which for case 1 coincides with the imposed ramp dip40 ¼ 4. As the material flux through the thrust (BC) is constant(viei¼ voeo), it provides the following thickening or thinningrelation
eo ¼ ei
sinðqþ4Þsin q
: ð5Þ
The dissipation along each thrust is defined as the productof the velocity jump across the thrust by the shear force it sus-tains. Thus the dissipations along the ramp (AB) and the thrust(BC) are, respectively,
DAB ¼ TABvi
sin q
sinðqþ4Þ
DBC ¼ TBCvisin 4
sinðqþ 4Þ; ð6Þ
where
TAB ¼ tan aRNAB
TBC ¼ tan aBNBC ð7Þ
are the mean shear forces acting, respectively, on the ramp(AB) and thrust (BC), NAB and NBC are the mean forces nor-mal to these thrusts, and aR and aB, the respective friction an-gles. By adopting these MohreCoulomb relations we considera purely frictional behaviour of our sand and neglect the smallamounts of cohesion, strain-softening and again, dilatancy,that are likely to be present (e.g. Lohrmann et al., 2003).The forces TAB and TBC are determined by invoking the globalequilibrium of the hanging wall (ABC):
FAB þFBC þPABC ¼ 0: ð8Þ
The weight PABC is easily determined from Fig. 4:
PABC ¼�1
2rge2
i
sinðqþ4Þsin q sin 4
j: ð9Þ
Projecting the equilibrium Eq. (8) along axes (i, j) (Fig. 4) andwriting the mean forces FAB and FBC in terms only of theirshear components with the help of Eq. (7) yields two equationswith solutions
TAB ¼1
2rge2
i
sinðqþ4Þ sinðqþ aBÞ sin aR
sinðqþ4þ aRþ aBÞ sin q sin 4
TBC ¼1
2rge2
i
sinðqþ4Þ sinðqþaRÞ sin aB
sinðqþ4þaR þaBÞ sin qsin 4: ð10Þ
Eqs. (10) and (6) complete the calculation of the totaldissipation
DT ¼ DABþDBC: ð11Þ
The optimal thrust dip qopt with respect to the total dissipationverifies
vDT
vq¼ sin2 qopt � sin
�2qoptþ4þ aR þ aB
�sin aB
sin aR
sin 4¼ 0:
ð12Þ
The solution is
qopt ¼ arctg
A cos bþ
ffiffiffiffiffiffiffiffiffiffiffiffiffiffiffiffiffiffiffiffiffiffiffiffiA2þA sin bp
1þA sin b
!; ð13Þ
A¼ sin aB
sin aR
sin 4; and b¼ 4þ aR þ aB: ð14Þ
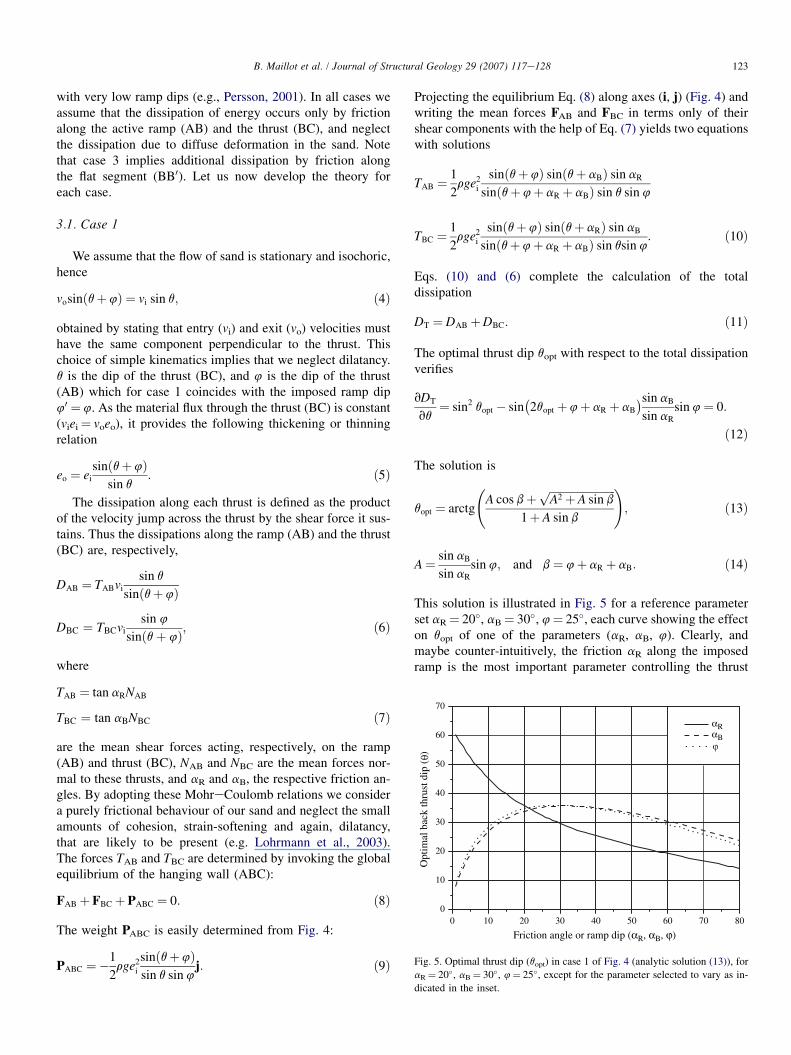
This solution is illustrated in Fig. 5 for a reference parameterset aR¼ 20�, aB¼ 30�, 4¼ 25�, each curve showing the effecton qopt of one of the parameters (aR, aB, 4). Clearly, andmaybe counter-intuitively, the friction aR along the imposedramp is the most important parameter controlling the thrust
αRαB
Opt
imal
bac
k th
rust
dip
( )
8010 20 30 40 50 60 7000
10
20
30
40
50
60
70
Friction angle or ramp dip (αR, αB, ϕ)
Fig. 5. Optimal thrust dip (qopt) in case 1 of Fig. 4 (analytic solution (13)), for
aR¼ 20�, aB¼ 30�, 4¼ 25�, except for the parameter selected to vary as in-
dicated in the inset.
124 B. Maillot et al. / Journal of Structural Geology 29 (2007) 117e128
dip qopt. It is in particular more important than the friction aB
on the thrust itself.
3.2. Case 2
In case 2 (Fig. 4, middle), all the dissipation occurs againalong the spontaneous ramp (AB) and thrust (BC). No addi-tional dissipation is considered in the spontaneous foot wall(ABA0) since the imposed ramp (A0B) is not active. Wemust now optimise the total dissipation (11) with respect toboth thrust dips qopt and 4opt by solving Eq. (12) together with
vDT
v4¼ sin2 4opt � sin
�qoptþ 24opt þ aRþ aB
�sin aR
sin aB
sin qopt
¼ 0;
ð15Þ
and setting aR¼ aB since both thrusts occur within the sand.The solution is
qopt ¼ 4opt ¼p
4� aB
2; ð16Þ
with the additional condition that 4opt> 40, the dip of theimposed ramp (A0B). If 4opt< 40, case 3 must be considered.
The solution (16) deserves some comments, because itcoincides with the dips of conjugate reverse faults that wouldbe obtained both from a Mohr circle construction, and byAnderson’s theory of faulting (e.g., Turcotte and Schubert,1982, p. 354). Anderson’s prediction is similar to the one pre-sented here in that it is the result of a minimisation. The dif-ference is that Anderson assumes a known stress distributionwhereas we start from a known kinematic framework, whichis directly linked to field observables and from which wecan then deduce mean forces by invoking global equilibrium.In fact, from the mechanical point of view of limit analysis,these approaches to the solution (16) are complementary. An-derson’s approach yields a lower bound to the tectonic forcenecessary to create conjugate faults, because the calculationsare done in a medium that is not yet fractured. Our kinematicapproach, in contrast, yields an upper bound, because the tec-tonic force is calculated in a medium where the fractures arealready active. The coincidence of the two bounds provesthat Eq. (16) is the exact solution to the problem of case 2.
3.3. Case 3
There are three sources of dissipation in the case 3 of Fig. 4(bottom): the spontaneous ramp (AB), the thrust (BC) andthe flat thrust (B0B). Dissipations along (AB) and (BC) arecalculated as in case 2. Dissipation along (B0B)
DB0B ¼ TB0Bvi ð17Þ
requires us to calculate the equilibrium of the block (ABB0) todetermine the mean shear force TB0B, again related to themean normal force NB0B by the MohreCoulomb relationTB0B¼ tan aFNB0B. Since there is no slip along the rigid
ramp AB0, we have 0< TAB0 < tan aRNAB0. We have setTAB0 ¼ 0.9 tan aRNAB0, and checked that NAB0 > 0, i.e., theblock ABB0 is not lifted upward. No analytic solution wasfound, and the optimal thrust dips must therefore be deter-mined numerically by finding the minimum of the totaldissipation
DT ¼ DABþDBCþDB0B ð18Þ
with respect to the thrust dips q and 4.
4. Inversion of dip data
The inverse problem is as follows: What are the values ofthe friction coefficients compatible with the observed dips ofour 12 experiments? There are only three friction coefficientsat stake: the friction angle of the sand on the imposed ramp aR,and on the flat aF, and the internal friction angle of the sandaB. The friction on the flat aF appears only in case 3(Fig. 4) and has a very small effect on the optimal thrustdips (Maillot and Leroy, 2003). We therefore eliminate itfrom the inversion and set aF¼ 23� in all the calculations,which corresponds to the material of the bottom of the box(fiber glass sheet). The parametric space of the inversion isthus reduced to two coefficients, aR and aB, and can be fullyexplored by numerical means.
Since four types of ramp materials were used (groups, A, B,C, and D in Table 1), the inversion must be carried out inde-pendently for each type to yield a friction coefficient aR foreach material. Also, since the same sand was used in all exper-iments, a single internal friction coefficient aB is sought. Theinversion consists in calculating a misfit between the observedand the theoretical thrust dips for every possible value of aR
and aB. Since the experimental data follow a Gaussian distri-bution, we define the misfit with the L2 norm:
MXðaR;aBÞ ¼XnX
i¼1
�4ðiÞ �4optðaR;aBÞ
s4ðiÞ
�2
þ�
qðiÞ � qoptðaR;aBÞsqðiÞ
�2
ð19Þ
where X stands for the type of ramp material (A, B, C, or D),and nX is the number of experiments with ramp material X.The probability, or likelihood, of the couple (aR, aB),
PXðaR;aBÞfe�12MXðaR ;aBÞ; ð20Þ
is shown in Fig. 6. For each type of ramp material, abscissaerepresent aR, and ordinates aB. For groups A, C, and D, thedistributions exhibit the same important features: zero proba-bilities in the half-space aR> aB, and nearly constant proba-bilities in the direction aRþ aB¼ constant. The former isdue to the absence of shortcuts (kinematic case 1) in groupsA, C, and D (except for experiment number 9). It is, however,precisely because our forward modelling integrated the possi-bility of shortcuts that their actual absence is significant andleads to this very sharp drop of probability along the line
125B. Maillot et al. / Journal of Structural Geology 29 (2007) 117e128
α BBα B
0
1009080706050403020100100908070605040302010000
10 20 30 40 50 60 70 80 90 1000 10 20 30 40 50 60 70 80 90 1000
100
90
80
70
60
50
40
30
20
10
0
10
20
30
40
50
60
70
80
90
100
100
90
80
70
60
50
40
30
20
1010
20
30
40
50
60
70
80
90
100
Inte
rnal
san
d fr
ictio
n an
gle
(αB
)
Friction angle αR (ramp A) αR (ramp B)
αR (ramp D)αR (ramp C)
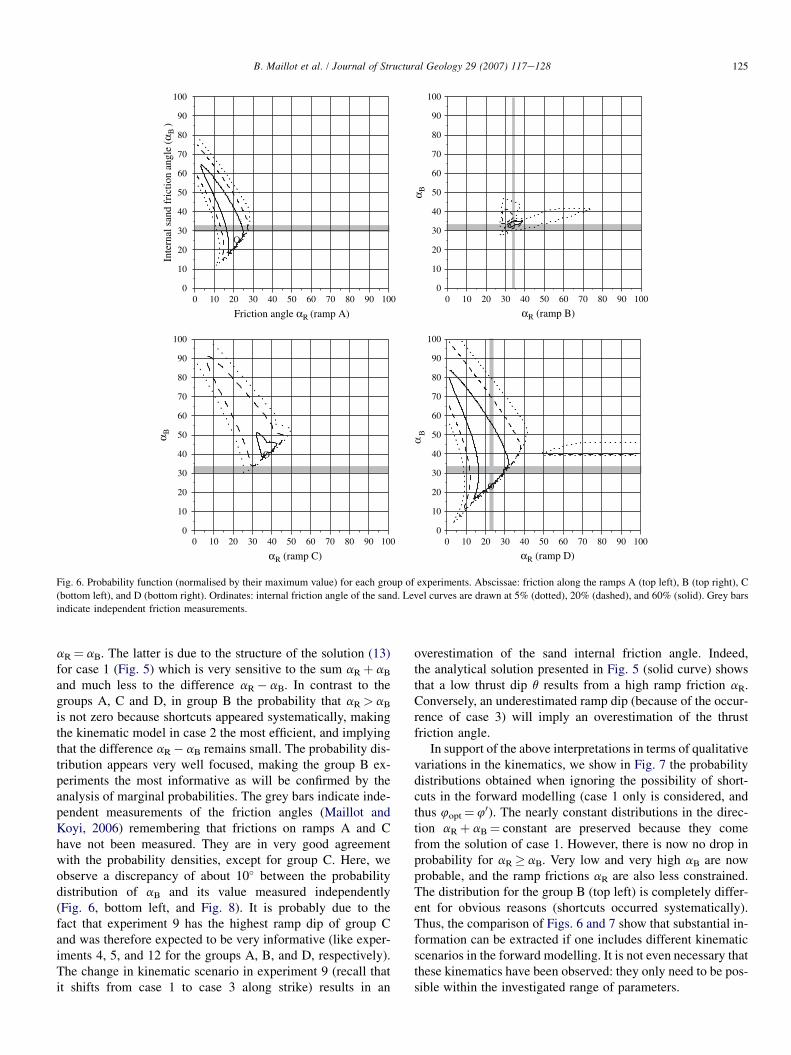
Fig. 6. Probability function (normalised by their maximum value) for each group of experiments. Abscissae: friction along the ramps A (top left), B (top right), C
(bottom left), and D (bottom right). Ordinates: internal friction angle of the sand. Level curves are drawn at 5% (dotted), 20% (dashed), and 60% (solid). Grey bars
indicate independent friction measurements.
aR¼ aB. The latter is due to the structure of the solution (13)for case 1 (Fig. 5) which is very sensitive to the sum aRþ aB
and much less to the difference aR� aB. In contrast to thegroups A, C and D, in group B the probability that aR> aB
is not zero because shortcuts appeared systematically, makingthe kinematic model in case 2 the most efficient, and implyingthat the difference aR� aB remains small. The probability dis-tribution appears very well focused, making the group B ex-periments the most informative as will be confirmed by theanalysis of marginal probabilities. The grey bars indicate inde-pendent measurements of the friction angles (Maillot andKoyi, 2006) remembering that frictions on ramps A and Chave not been measured. They are in very good agreementwith the probability densities, except for group C. Here, weobserve a discrepancy of about 10� between the probabilitydistribution of aB and its value measured independently(Fig. 6, bottom left, and Fig. 8). It is probably due to thefact that experiment 9 has the highest ramp dip of group Cand was therefore expected to be very informative (like exper-iments 4, 5, and 12 for the groups A, B, and D, respectively).The change in kinematic scenario in experiment 9 (recall thatit shifts from case 1 to case 3 along strike) results in an
overestimation of the sand internal friction angle. Indeed,the analytical solution presented in Fig. 5 (solid curve) showsthat a low thrust dip q results from a high ramp friction aR.Conversely, an underestimated ramp dip (because of the occur-rence of case 3) will imply an overestimation of the thrustfriction angle.
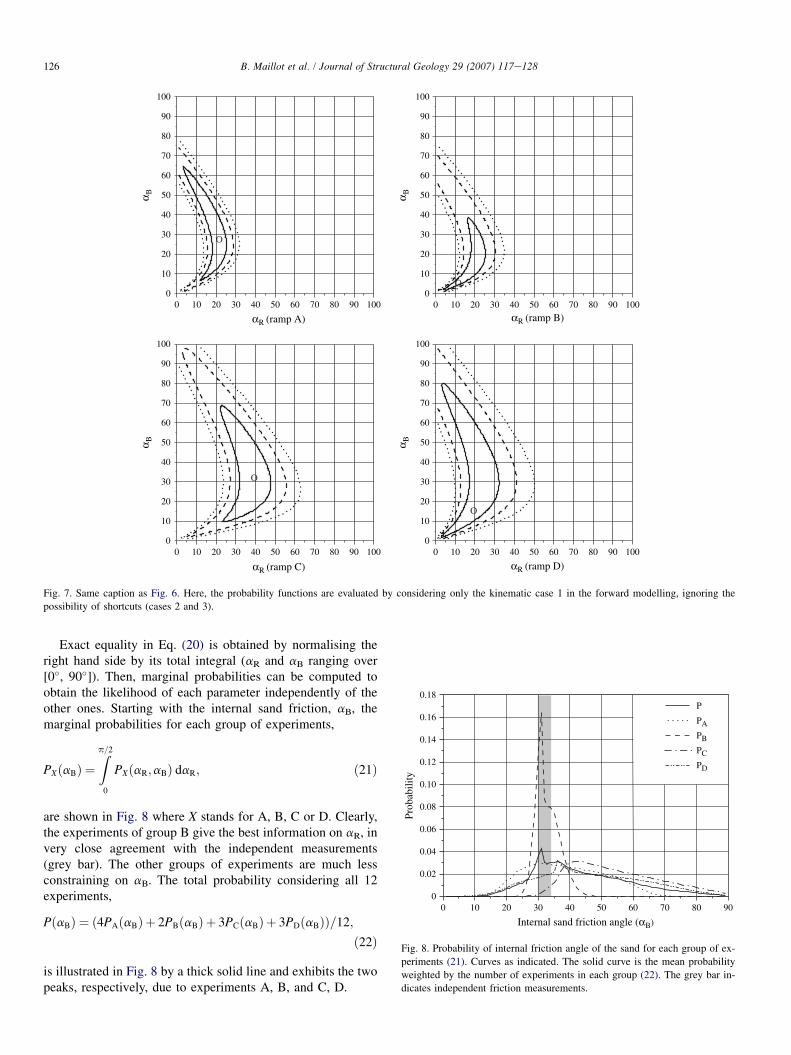
In support of the above interpretations in terms of qualitativevariations in the kinematics, we show in Fig. 7 the probabilitydistributions obtained when ignoring the possibility of short-cuts in the forward modelling (case 1 only is considered, andthus 4opt¼ 40). The nearly constant distributions in the direc-tion aRþ aB¼ constant are preserved because they comefrom the solution of case 1. However, there is now no drop inprobability for aR� aB. Very low and very high aB are nowprobable, and the ramp frictions aR are also less constrained.The distribution for the group B (top left) is completely differ-ent for obvious reasons (shortcuts occurred systematically).Thus, the comparison of Figs. 6 and 7 show that substantial in-formation can be extracted if one includes different kinematicscenarios in the forward modelling. It is not even necessary thatthese kinematics have been observed: they only need to be pos-sible within the investigated range of parameters.
126 B. Maillot et al. / Journal of Structural Geology 29 (2007) 117e128
αR (ramp B)
αR (ramp D)αR (ramp C)
αR (ramp A)
α B α B
α B α B
0 10 20 30 40 50 60 70 80 90 100
0 10 20 30 40 50 60 70 80 90 100 0 10 20 30 40 50 60 70 80 90 100
0 10 20 30 40 50 60 70 80 90 100
10
20
30
40
50
60
70
80
90
0
100
10
20
30
40
50
60
70
80
90
0
100
10
20
30
40
50
60
70
80
90
0
100
10
20
30
40
50
60
70
80
90
0
100
Fig. 7. Same caption as Fig. 6. Here, the probability functions are evaluated by considering only the kinematic case 1 in the forward modelling, ignoring the
possibility of shortcuts (cases 2 and 3).
Exact equality in Eq. (20) is obtained by normalising theright hand side by its total integral (aR and aB ranging over[0�, 90�]). Then, marginal probabilities can be computed toobtain the likelihood of each parameter independently of theother ones. Starting with the internal sand friction, aB, themarginal probabilities for each group of experiments,
PXðaBÞ ¼Zp=2
0
PXðaR;aBÞ daR; ð21Þ
are shown in Fig. 8 where X stands for A, B, C or D. Clearly,the experiments of group B give the best information on aR, invery close agreement with the independent measurements(grey bar). The other groups of experiments are much lessconstraining on aB. The total probability considering all 12experiments,
PðaBÞ ¼ ð4PAðaBÞ þ 2PBðaBÞ þ 3PCðaBÞ þ 3PDðaBÞÞ=12;
ð22Þ
is illustrated in Fig. 8 by a thick solid line and exhibits the twopeaks, respectively, due to experiments A, B, and C, D.
Internal sand friction angle (αB)
Prob
abili
ty
80 90704030201000
0.02
0.04
0.06
0.08
0.10
0.12
0.14
0.16
0.18
50 60
PB
PC
PD
P
PA
Fig. 8. Probability of internal friction angle of the sand for each group of ex-
periments (21). Curves as indicated. The solid curve is the mean probability
weighted by the number of experiments in each group (22). The grey bar in-
dicates independent friction measurements.
127B. Maillot et al. / Journal of Structural Geology 29 (2007) 117e128
Nor
m. p
roba
bilit
y
Nor
m. p
roba
bilit
yN
orm
. pro
babi
lity
Nor
m. p
roba
bilit
y
90807060504030201000
0.2
0.4
0.6
1.0
0.8
1.0
0.8
0.6
0.4
0.2
0
9080706050403020100
9080706050403020100
0
0.2
0.4
90807060504030201000
0.2
0.4
1.0
0.8
0.6
1.0
0.8
0.6
Friction angle αRA
Friction angle αRC Friction angle αRD
Friction angle αRB
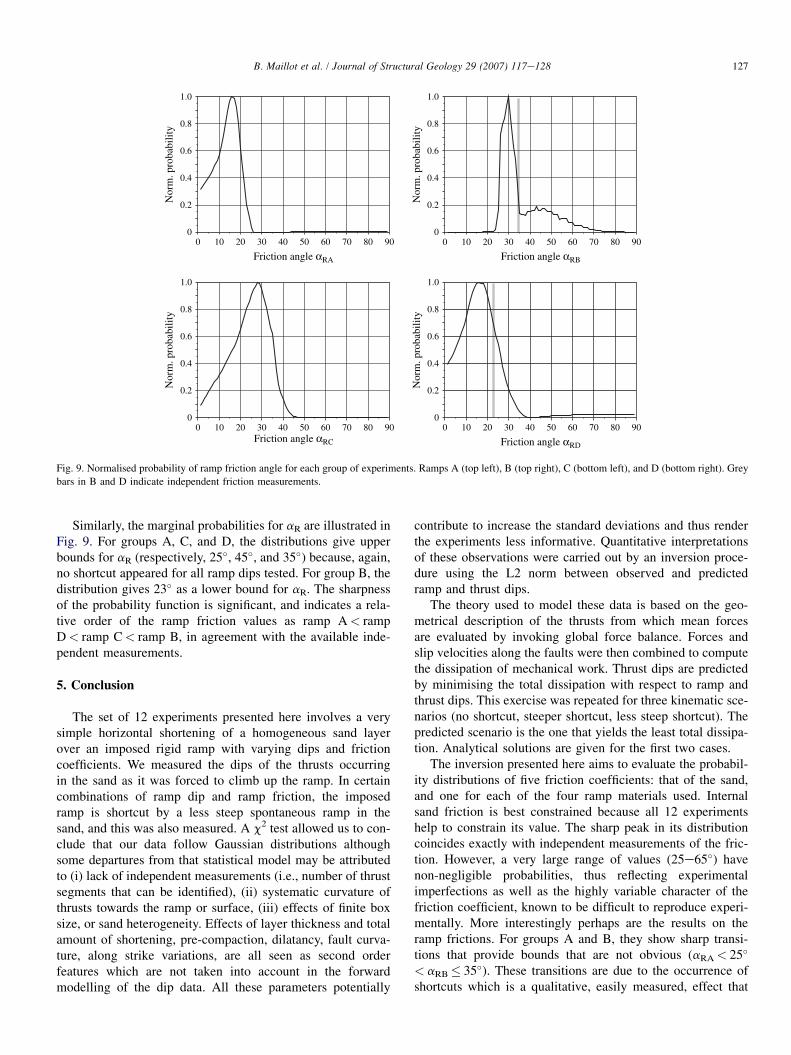
Fig. 9. Normalised probability of ramp friction angle for each group of experiments. Ramps A (top left), B (top right), C (bottom left), and D (bottom right). Grey
bars in B and D indicate independent friction measurements.
Similarly, the marginal probabilities for aR are illustrated inFig. 9. For groups A, C, and D, the distributions give upperbounds for aR (respectively, 25�, 45�, and 35�) because, again,no shortcut appeared for all ramp dips tested. For group B, thedistribution gives 23� as a lower bound for aR. The sharpnessof the probability function is significant, and indicates a rela-tive order of the ramp friction values as ramp A< rampD< ramp C< ramp B, in agreement with the available inde-pendent measurements.
5. Conclusion
The set of 12 experiments presented here involves a verysimple horizontal shortening of a homogeneous sand layerover an imposed rigid ramp with varying dips and frictioncoefficients. We measured the dips of the thrusts occurringin the sand as it was forced to climb up the ramp. In certaincombinations of ramp dip and ramp friction, the imposedramp is shortcut by a less steep spontaneous ramp in thesand, and this was also measured. A c2 test allowed us to con-clude that our data follow Gaussian distributions althoughsome departures from that statistical model may be attributedto (i) lack of independent measurements (i.e., number of thrustsegments that can be identified), (ii) systematic curvature ofthrusts towards the ramp or surface, (iii) effects of finite boxsize, or sand heterogeneity. Effects of layer thickness and totalamount of shortening, pre-compaction, dilatancy, fault curva-ture, along strike variations, are all seen as second orderfeatures which are not taken into account in the forwardmodelling of the dip data. All these parameters potentially
contribute to increase the standard deviations and thus renderthe experiments less informative. Quantitative interpretationsof these observations were carried out by an inversion proce-dure using the L2 norm between observed and predictedramp and thrust dips.
The theory used to model these data is based on the geo-metrical description of the thrusts from which mean forcesare evaluated by invoking global force balance. Forces andslip velocities along the faults were then combined to computethe dissipation of mechanical work. Thrust dips are predictedby minimising the total dissipation with respect to ramp andthrust dips. This exercise was repeated for three kinematic sce-narios (no shortcut, steeper shortcut, less steep shortcut). Thepredicted scenario is the one that yields the least total dissipa-tion. Analytical solutions are given for the first two cases.
The inversion presented here aims to evaluate the probabil-ity distributions of five friction coefficients: that of the sand,and one for each of the four ramp materials used. Internalsand friction is best constrained because all 12 experimentshelp to constrain its value. The sharp peak in its distributioncoincides exactly with independent measurements of the fric-tion. However, a very large range of values (25e65�) havenon-negligible probabilities, thus reflecting experimentalimperfections as well as the highly variable character of thefriction coefficient, known to be difficult to reproduce experi-mentally. More interestingly perhaps are the results on theramp frictions. For groups A and B, they show sharp transi-tions that provide bounds that are not obvious (aRA< 25�
< aRB� 35�). These transitions are due to the occurrence ofshortcuts which is a qualitative, easily measured, effect that
128 B. Maillot et al. / Journal of Structural Geology 29 (2007) 117e128
is the result of small changes in continuous variables such asthe friction coefficient. Thus, because the dips are very smoothfunctions of the ramp friction coefficients, their sole measure-ment does not constrain the friction parameters very well. Onemust additionally study global changes in the geometry (dips)of the thrusts: it is the very fact that a geometry is possible, ornot possible, that is very informative.
Acknowledgements
We thank Susanne Buiter for her detailed review andJournal Editor Bob Holdswoth for his improvements to theEnglish, which both helped improve this manuscript.
References
Bonini, M., Sokoutis, D., Mulugeta, G., Katrivanos, E., 2000. Modelling hang-
ing wall accommodation above rigid thrust ramps. Journal of Structural
Geology 22, 1165e1179.
Buiter, S.J.H., Babeyko, A.Y., Ellis, S., Gerya, T.V., Kaus, B.J.P., Kellner, A.,
Schreurs, G., Yamada, Y., 2006. The numerical sandbox: comparison of
model results for a shortening and an extension experiment. In: Bui-
ter, S.J.H., Schreurs, G. (Eds.), Analogue and Numerical Modelling of
Crustal-Scale Processes. Geological Society, London, Special Publications,
vol. 253, pp. 29e64.
Colletta, B., 2005. Passive and active inherited faults in fold and thrust belts.
In: Keynote Abstract in Thrust Belts and Foreland Basins International
Meeting, Reuil-Malmaison, France.
Erickson, J.P., Jamison, W.R., 1995. Viscous-plastic finite element models of
fault-bend folds. Journal of Structural Geology 17 (4), 561e573.
Erickson, J.P., Strayer, L.M., Suppe, J., 2001. Initiation and reactivation of
faults during movement over a thrust-fault ramp: numerical mechanical
models. Journal of Structural Geology 23, 11e23.
Grelaud, S., Buil, D., Hardy, S., Frizon de Lamotte, D., 2000. Trishear kine-
matic model of fault-propagation folding and sequential development of
minor structures: the Oupia anticline (NE Pyrenees, France) case study.
Bulletin de la Societe Geologique de France 171, 441e449.
Lohrmann, J., Kukowski, N., Adam, J., Oncken, O., 2003. The impact of
analogue material properties on the geometry, kinematics, and
dynamics of convergent sand wedges. Journal of Structural Geology
25, 1691e1711.
Maillot, B., Leroy, Y.M., 2003. Optimal dip based on dissipation of back
thrusts and hinges in fold-and-thrust belts. Journal of Geophysical Re-
search 108 (B6), 2320e2339.
Maillot, B., Koyi, H., 2006. Thrust dip and thrust refraction in fault-bend-
folds: analogue models and theoretical predictions. Journal of Structural
Geology 28, 36e49.
Merchant, E., 1944. Basic mechanics of the metal cutting process. Journal of
Applied Mechanics, 168e175.
Merle, O., Abidi, N., 1995. Approche experimentale du fonctionnement des
rampes emergentes. Bulletin de la Societe Geologique de France 166
(5), 439e450.
Persson, K.S., 2001. Effective indenters and the development of double-ver-
gent orogens: insights from analogue sand models. In: Koyi, H.A.,
Mancktelow, N.S. (Eds.), Tectonic Modelling: A Volume in Honor of
Hans Ramberg. Geological Society of America Memoir 193, 191e206.
Rich, J.L., 1934. Mechanics of low-angle overthrust faulting as illustrated
by Cumberland thrust block, Virginia, Kentucky, and Tennessee. Bulle-
tin of the American Association of Petroleum Geologists 18 (12),
1584e1596.
Roure, F., Colletta, B., 1996. Cenozoic inversion structures in the foreland of
the Pyrenees and Alps. In: Ziegler, P.A., Horvath, F. (Eds.), Peri-Tethys
Memoir 2: Structure and Prospects of Alpine Basins and Forelands. Mem-
oires du Museum National d’Histoire Naturelle 170, 173e209.
Schreurs, G., Buiter, S.J.H., Boutelier, D., Corti, G., Costa, E., Cruden, A.,
Daniel, J.-M., Hoth, S., Koyi, H., Kukowski, N., Lohrmann, J.,
Ravaglia, A., Schlische, R.W., Withjack, M.O., Yamada, Y., Cavozzi, C.,
DelVentisette, C., Elder Brady, J., Hoffmann-Rothe, A., Mengus, J.-M.,
Montanari, D., Nilforoushan, F., 2006. Analogue benchmarks of shortening
and extension experiments. In: Buiter, S.J.H., Schreurs, G. (Eds.), Ana-
logue and Numerical Modelling of Crustal-Scale Processes. Geological
Society, London, Special Publications vol. 253, pp. 1e27.
Suppe, J., 1983. Geometry and kinematics of fault-bend folding. American
Journal of Science 283 (7), 684e721.
Tarantola, A., 1987. Inverse Problem Theory. Elsevier, Amsterdam.
Turcotte, D.L., Schubert, G., 1982. Geodynamics, Applications of Continuum
Physics to Geological Problems. John Wiley and Sons, New York.
Copyright © 2022 FDOKUMEN