Constraints on a shallow offshore gas environment determined by a multidisciplinary geophysical...
19
RESEARCH ARTICLE 10.1002/2013GC005108 Constraints on a shallow offshore gas environment determined by a multidisciplinary geophysical approach: The Malin Sea, NW Ireland Xavier Garcia 1,2 , Xavier Monteys 3 , Rob L. Evans 4 , and Michal Szpak 5 1 Barcelona Center for Subsurface Imaging, Institute of Marine Sciences, CSIC, Barcelona, Spain, 2 Formerly at Geophysics Section, School of Cosmic Physics, Dublin Institute for Advanced Studies, Dublin, Ireland, 3 Geological Survey of Ireland, Dublin, Ireland, 4 Department of Geology and Geophysics, Woods Hole Oceanographic Institution, Woods Hole, Massachu- setts, USA, 5 School of Chemical Sciences, Dublin City University, Dublin, Ireland Abstract During the Irish National Seabed Survey (INSS) in 2003, a gas related pockmark field was dis- covered and extensively mapped in the Malin Shelf region (NW Ireland). In summer 2006, additional com- plementary data involving core sample analysis, multibeam and single-beam backscatter classification, and a marine controlled-source electromagnetic survey were obtained in specific locations.This multidisciplinary approach allowed us to map the upper 20 m of the seabed in an unprecedented way and to correlate the main geophysical parameters with the geological properties of the seabed. The EM data provide us with information about sediment conductivity, which can be used as a proxy for porosity and also to identify the presence of fluid and fluid migration pathways. We conclude that, as a whole, the central part of the Malin basin is characterized by higher conductivities, which we interpret as a lithological change. Within the basin several areas are characterized by conductive anomalies associated with fluid flow processes and potentially the presence of microbial activity, as suggested by previous work. Pockmark structures show a characteristic electrical signature, with high-conductivity anomalies on the edges and less conductive, homogeneous inte- riors with several high-conductivity anomalies, potentially associated with gas-driven microbial activity. 1. Introduction Gas-escape craters or pockmarks are common seabed features observed on continental margins and gener- ally are associated with gas and fluid seepage. Pockmarks are known to be widely distributed in many basins around the World’s oceans from coastal to deep water environments. Pockmarks have been observed in the North Sea [Hovland, 1984; Hovland and Judd, 1988], the Irish Sea [Taylor, 1992; Yuan et al., 1992], the Scotian Shelf [King and MacLean, 1970], and in many other areas [Josenhans et al., 1978; Judd and Hovland, 2007]. Studies of gas seeps are interesting from several perspectives including providing a better understanding of global methane budgets [Judd and Hovland, 2007], evaluating geohazards, investigating relationships between fluid flow processes and specific microenvironments created in the seafloor, often characterized by specialized microbiological activity, mineral precipitation, benthic fauna associations, as well as for their effects on water column dynamics. Traditionally, pockmarks and shallow gas in marine sediments have been mapped using a range of acoustic tools (e.g., sidescan sonar, MBES, and subbottom profilers), optical devices (Underwater video, remotely operated vehicle (ROV)), and a range of seabed sampling techniques. This paper documents the pathways and presence of gas by using a combination of shallow EM data, high-frequency acoustics, and short sedi- ment cores in a known shallow gas-bearing area. The combination of these various methods has allowed us to correlate the main geophysical signatures and some geological properties of the seabed, providing a unique approach for geohazard identification, multibeam seabed characterization, fluid migration paths, and sediment porosity. There are very few EM surveys of areas affected by pockmarks [e.g., M€ uller et al., 2011; Minshull et al., 2012; Hsu et al., 2014], but some of the conclusions drawn from these works are that shallow EM profiling can significantly improve understanding of sediment distribution and vertical zonation of seepage processes. Key Points: Use of a multidisciplinary approach EM methods help distinguishing between gas and microbial activity (no gas) We identify an area affected by gas release Supporting Information: Figure S1–S6 Correspondence to: X. Garcia, [email protected] Citation: Garcia X., X. Monteys, R. L. Evans, M. Szpak (2014), Constraints on a shallow offshore gas environment determined by a multidisciplinary geophysical approach: The Malin Sea, NW Ireland, Geochem. Geophys. Geosyst., 15, 867– 885, doi:10.1002/2013GC005108 Received 22 OCT 2013 Accepted 20 JAN 2014 Accepted article online 27 JAN 2014 Published online 2 APR 2014 GARCIA ET AL. V C 2014. American Geophysical Union. All Rights Reserved. 867 Geochemistry, Geophysics, Geosystems PUBLICATIONS
-
Upload
independent -
Category
Documents
-
view
1 -
download
0
Transcript of Constraints on a shallow offshore gas environment determined by a multidisciplinary geophysical...
RESEARCH ARTICLE1010022013GC005108
Constraints on a shallow offshore gas environment determinedby a multidisciplinary geophysical approach The Malin SeaNW IrelandXavier Garcia12 Xavier Monteys3 Rob L Evans4 and Michal Szpak5
1Barcelona Center for Subsurface Imaging Institute of Marine Sciences CSIC Barcelona Spain 2Formerly at GeophysicsSection School of Cosmic Physics Dublin Institute for Advanced Studies Dublin Ireland 3Geological Survey of IrelandDublin Ireland 4Department of Geology and Geophysics Woods Hole Oceanographic Institution Woods Hole Massachu-setts USA 5School of Chemical Sciences Dublin City University Dublin Ireland
Abstract During the Irish National Seabed Survey (INSS) in 2003 a gas related pockmark field was dis-covered and extensively mapped in the Malin Shelf region (NW Ireland) In summer 2006 additional com-plementary data involving core sample analysis multibeam and single-beam backscatter classification anda marine controlled-source electromagnetic survey were obtained in specific locationsThis multidisciplinaryapproach allowed us to map the upper 20 m of the seabed in an unprecedented way and to correlate themain geophysical parameters with the geological properties of the seabed The EM data provide us withinformation about sediment conductivity which can be used as a proxy for porosity and also to identify thepresence of fluid and fluid migration pathways We conclude that as a whole the central part of the Malinbasin is characterized by higher conductivities which we interpret as a lithological change Within the basinseveral areas are characterized by conductive anomalies associated with fluid flow processes and potentiallythe presence of microbial activity as suggested by previous work Pockmark structures show a characteristicelectrical signature with high-conductivity anomalies on the edges and less conductive homogeneous inte-riors with several high-conductivity anomalies potentially associated with gas-driven microbial activity
1 Introduction
Gas-escape craters or pockmarks are common seabed features observed on continental margins and gener-ally are associated with gas and fluid seepage Pockmarks are known to be widely distributed in manybasins around the Worldrsquos oceans from coastal to deep water environments Pockmarks have beenobserved in the North Sea [Hovland 1984 Hovland and Judd 1988] the Irish Sea [Taylor 1992 Yuan et al1992] the Scotian Shelf [King and MacLean 1970] and in many other areas [Josenhans et al 1978 Judd andHovland 2007] Studies of gas seeps are interesting from several perspectives including providing a betterunderstanding of global methane budgets [Judd and Hovland 2007] evaluating geohazards investigatingrelationships between fluid flow processes and specific microenvironments created in the seafloor oftencharacterized by specialized microbiological activity mineral precipitation benthic fauna associations aswell as for their effects on water column dynamics
Traditionally pockmarks and shallow gas in marine sediments have been mapped using a range of acoustictools (eg sidescan sonar MBES and subbottom profilers) optical devices (Underwater video remotelyoperated vehicle (ROV)) and a range of seabed sampling techniques This paper documents the pathwaysand presence of gas by using a combination of shallow EM data high-frequency acoustics and short sedi-ment cores in a known shallow gas-bearing area The combination of these various methods has allowed usto correlate the main geophysical signatures and some geological properties of the seabed providing aunique approach for geohazard identification multibeam seabed characterization fluid migration pathsand sediment porosity
There are very few EM surveys of areas affected by pockmarks [eg Meurouller et al 2011 Minshull et al 2012Hsu et al 2014] but some of the conclusions drawn from these works are that shallow EM profiling cansignificantly improve understanding of sediment distribution and vertical zonation of seepage processes
Key Points Use of a multidisciplinary approach EM methods help distinguishing
between gas and microbial activity(no gas) We identify an area affected by gas
release
Supporting Information Figure S1ndashS6
Correspondence toX Garciaxgarciaicmcsices
CitationGarcia X X Monteys R L Evans MSzpak (2014) Constraints on a shallowoffshore gas environment determinedby a multidisciplinary geophysicalapproach The Malin Sea NW IrelandGeochem Geophys Geosyst 15 867ndash885 doi1010022013GC005108
Received 22 OCT 2013
Accepted 20 JAN 2014
Accepted article online 27 JAN 2014
Published online 2 APR 2014
GARCIA ET AL VC 2014 American Geophysical Union All Rights Reserved 867
Geochemistry Geophysics Geosystems
PUBLICATIONS
It has been postulated that the walls of pockmarks act as pathways for gas flow [Newman et al 2008] andthat sediments are disturbed within the pockmark as a consequence of the violent gas release mechanism[Judd and Hovland 2007] Additionally some studies show that bacterial activity feeding on gas in sedi-ments can cause conductivity anomalies [Atekwana et al 2004 Abdel Aal et al 2010] The present study isused to test whether EM methods can clearly detect pockmark signatures the presence of gas within sedi-ments fluid release pathways and presence of bacterial activity
2 Geological Setting of the Study Area
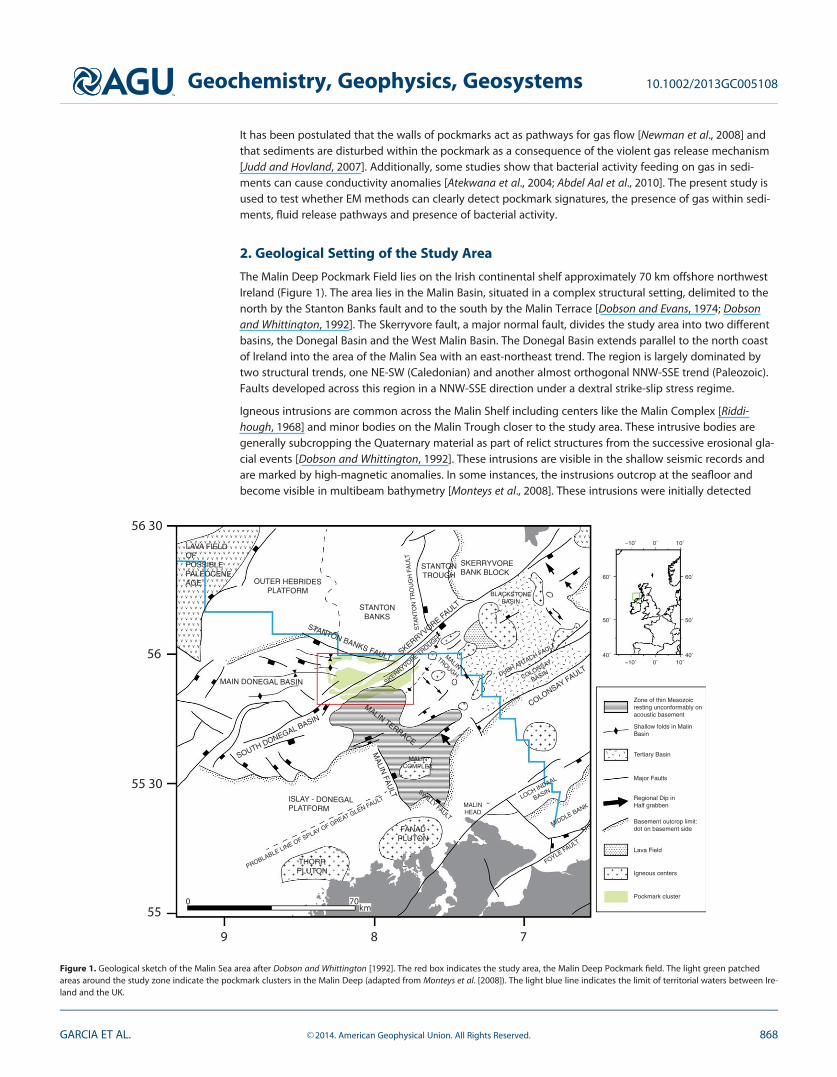
The Malin Deep Pockmark Field lies on the Irish continental shelf approximately 70 km offshore northwestIreland (Figure 1) The area lies in the Malin Basin situated in a complex structural setting delimited to thenorth by the Stanton Banks fault and to the south by the Malin Terrace [Dobson and Evans 1974 Dobsonand Whittington 1992] The Skerryvore fault a major normal fault divides the study area into two differentbasins the Donegal Basin and the West Malin Basin The Donegal Basin extends parallel to the north coastof Ireland into the area of the Malin Sea with an east-northeast trend The region is largely dominated bytwo structural trends one NE-SW (Caledonian) and another almost orthogonal NNW-SSE trend (Paleozoic)Faults developed across this region in a NNW-SSE direction under a dextral strike-slip stress regime
Igneous intrusions are common across the Malin Shelf including centers like the Malin Complex [Riddi-hough 1968] and minor bodies on the Malin Trough closer to the study area These intrusive bodies aregenerally subcropping the Quaternary material as part of relict structures from the successive erosional gla-cial events [Dobson and Whittington 1992] These intrusions are visible in the shallow seismic records andare marked by high-magnetic anomalies In some instances the instrusions outcrop at the seafloor andbecome visible in multibeam bathymetry [Monteys et al 2008] These intrusions were initially detected
0 70km55
55 30
56 30
56
9 8 7
SKERRYVORE FAULT
STANTON BANKS FAULT
STANTON BANKS
OUTER HEBRIDES PLATFORM
MAIN DONEGAL BASIN
SOUTH DONEGAL BASIN
MALIN TERRACE
MA
LIN FA
ULT
SKERRYVORE TROUGH
MALIN COMPLEX
ISLAY - DONEGAL PLATFORM
COLONSAY FAULT
STA
NT
ON
TR
OU
GH
FA
ULT
STANTON TROUGH
LAVA FIELD OFPOSSIBLE PALEOCENE AGE
SKERRYVORE BANK BLOCK
MALIN
TROUGH
BLACKSTONE BASIN
COLONSAY
BASIN
FANAD PLUTON
THORR PLUTON
LOCH INDAAL
BASINSWILLY FAULT
PROBLABLE LINE OF SPLAY OF GREAT GLEN FAULT
MIDDLE BANK
FOYLE FAULT
MALIN HEAD
DUBH ARTACH FAULT
Zone of thin Mesozoic resting unconformably on acoustic basement
Shallow folds in Malin Basin
Tertiary Basin
Major Faults
Regional Dip in Half grabben
Basement outcrop limit dot on basement side
Lava Field
Igneous centers
Pockmark cluster
minus10˚
minus10˚
0˚
0˚
10˚
10˚
˚04˚04
˚05˚05
˚06˚06
Figure 1 Geological sketch of the Malin Sea area after Dobson and Whittington [1992] The red box indicates the study area the Malin Deep Pockmark field The light green patchedareas around the study zone indicate the pockmark clusters in the Malin Deep (adapted from Monteys et al [2008]) The light blue line indicates the limit of territorial waters between Ire-land and the UK
Geochemistry Geophysics Geosystems 1010022013GC005108
GARCIA ET AL VC 2014 American Geophysical Union All Rights Reserved 868
using magnetic surveys [Riddihough 1968] and later dated by Dobson and Whittington [1992] as of Paleo-gene age features
Quaternary sediments are recorded throughout the Malin Sea area with thicknesses varying from north tosouth from 175 to 125 m [Evans et al 1985] The upper strata in the Malin Shelf is composed of marine gla-cial diposits and glacial landforms with bed forms alternating between sand patches and coarser sedimentsranging in size from pebbles to boulders to soft-layered Holocene silty muds in the study area [Evans et al1985 Dunlop et al 2010] The basin floor around the pockmark field is characterized by soft fine-grainedsediment facies comprising more than 220 gas related pockmarks distributed in clusters around the mainstructural lineaments [Monteys et al 2008] (see also light green patched areas in Figure 1)
Hydrocarbons have been encountered in several of the northwest offshore basins particularly those withthicker Permo-Triassic sequences Hydrocarbon prospects rely on the existence of Carboniferous sourcerocks however Jurassic to Cretaceous source rocks have also been documented in the region Paleogenereactivation of fractures may have allowed the leakage of reservoir hydrocarbons to the upper subsurface[Parnell 1992]
3 Gas in Marine Sediments
Gas in marine sediments can have biogenic or thermogenic origin [Floodgate and Judd 1992] Biogenic gasis produced by the degradation of organic matter by bacterial activity at low temperatures whereas ther-mogenic gas is produced by chemical reactions within the sediment in which time high temperatures andburial depth are important controlling factors [Rice and Claypool 1981]
Free gas has an important effect on the acoustic properties of the seabed Bubbles even in small quantitiescan cause markedly reduced compressional wave speeds increased compressional wave attenuation andincreased sound scattering [Anderson and Hampton 1980 Wilkens and Richardson 1998 Fonseca et al2002] Free gas is also known to significantly alter sedimentary geotechnical characteristics primarily byincreasing seabed compressibility and reducing its undrained shear strength [Sills and Wheeler 1992] In theenvironmental sciences gassy sediments are becoming increasingly important in global studies of climatechange and methane budget [Fleischer et al 2001] It has been suggested that methane fluxes associatedwith marine seepages have been greatly underestimated in the methane and carbon cycles [Kvenvoldenand Rogers 2005 Milkov 2000]
Resistivity provides a first-order measure of seafloor porosity in sedimentary settings allowing facies mapsto be constructed or changes in lithology to be identified In unconsolidated sediments and to some extentin hard rock porosity is a key parameter to understanding pore fluid and fluid transport (ie ionic concen-tration and mobility) The presence of gas (effectively an electrical insulator) will decrease the conductivityof the rock matrix because it may block or isolate the conductive water in the pores [Ren et al 2010]Hydrates like gas are a resistive phase and therefore their effect on EM data is similar Yuan and Edwards[2000] and Schwalenberg et al [2005] report values of seafloor conductivity of 06ndash1 Sm in the absence ofhydrates and low anomalous conductivities (lt02 Sm) in the presence of hydrates
There is little information in the literature on the effects on conductivity of free or dissolved gas in sedi-ments Free gas would be expected to reduce effective porosity in a one-one basis as it effectively adds tothe amount of resistive matrix There is the possibility that gas could preferentially block key fluid connec-tion pathways and therefore be more effective at reducing conductivity Dissolved gas would change theseawater conductivity Beuroorner et al [2013] report a decrease of conductivity as a result of dissolved CO2 insand saturated with saline water although they also account for an increase of the conductivity caused byadditional charges provided by the gas However this experiment was carried out at supercritical conditionsand in the context of CO2 sequestration
However the resistivity is affected to a much lesser extent than are acoustic properties [Cheesman et al1993] which can suffer wipeouts in the presence of trace amounts of gas Schubel [1974] demonstrated thatonly as little as 01 (vv) of gas present in the sediment could reduce the speed of sound by a third More-over gas acoustic signatures can vary greatly depending on factors such as wavelength of acoustic pulseapplied distribution of gas in the lithofacies and bubble size [Judd and Hovland 2007] Because of thisextreme sensitivity acoustic methods can detect gas but do not place constraints on gas volumes
Geochemistry Geophysics Geosystems 1010022013GC005108
GARCIA ET AL VC 2014 American Geophysical Union All Rights Reserved 869
Therefore the combination of different geophysical techniques particularly seismic and electromagneticmethods provides means of quantifying gas in situ For more detailed information on relationship of con-ductivity velocity and gas see eg Wilt and Alumbaugh [1998]
4 Material and Methods
41 Electromagnetic DataThe towed-electromagnetic (EM) system discussed in this paper consists of three main components thedeck electronics a transmitter and the receiver string The seafloor components of the system (transmitterand receivers) form a 40 m long array which is towed in contact with the seafloor at speeds of 1ndash2 knots
The EM transmitter a horizontal magnetic dipole generates harmonic magnetic fields over a range of fre-quencies (200ndash200 kHz) and the three receivers tuned to measure the magnetic fields propagatingthrough the ambient seawater and seafloor are towed at fixed distances behind (4 126 and 40 m) At agiven frequency the strength of magnetic fields decays away from the transmitter as a function of the con-ductivity of the seafloor (ie according to the skin depth) decaying more rapidly in more conductive mediaThe sensitivity of the magnetic dipole-dipole system along with the physics of the propagation of the fieldsthrough the seafloor was presented in Cheesman [1989] Further details of the system sensitivity data proc-essing and inversion are given in Evans [2007] and details on resolution can be found in Evans [2001] Thenoise level of the system has been estimated to be on the order of 1 in terms of apparent porosity [Evanset al 1999] As a first-order approximation [Evans et al 1999] the depth of penetration of a receiver isabout one-half of the receiver-transmitter separation (ie the 40 m receiver is sensitive to the electricalproperties of the top 20 mbsf) Since the 4 m receiver failed to collect any data we will refer below to the40 m receiver as the deeper receiver and to the 13 m receiver as the shallow receiver
Because the system maintains a fixed distance between source and receiver it can be regarded as a map-ping tool In order to build up a map of subseafloor structure only relatively spatial sparse coverage isneeded [Evans et al 1999] Archiersquos law [Archie 1942] can be used to obtain estimated porosities for a sim-ple two-phase system that contains a conductive pore fluid In fully water-saturated rocks Archiersquos law canbe expressed [Evans 2007]
5a1=m (1)
where is the porosity m is the cementation factor and a is the conductivity contrast defined as the ratiobetween grain matrix conductivity and pore fluid conductivity The cementation factor can be obtainedfrom laboratory analysis and varies between 15 and 3 [Jackson et al 1978 1998] A more complete form ofArchiersquos law than equation (1) in which gas saturation is taking into account
rsediment5meth12SgTHORNnrwater (2)
where r indicates electrical conductivity porosity m the cementation factor and n the saturation expo-nent The saturation exponent models the effect of the presence of nonconductive fluids (usually hydrocar-bons) The effect of the saturation term in Archiersquos law is a drop in conductivity but without any preciseknowledge of the gas saturation can be misinterpreted as a change in porosity
The resulting maps provide superior spatial coverage than conventional coring techniques and porositiesobtained from conductivities using equation (1) in regions where coring techniques fail to recover samplesbut more importantly provide a means of interpolating between discrete core locations Finally the com-bined methodology provides estimates of physical properties where seismic reflection profiles are contami-nated by strong bottom multiples or signal starvation due to the presence of methane gas [Cheesman et al1993] The system is however perfectly complementary to seismic methods and is best used in concertwith high-resolution seismic reflection techniques which define the stratal geometry and from multichan-nel seismics velocities and therefore densities while the EM data define the electrical properties and fromthose porosities [Evans and Lizarralde 2003] Szpak et al [2012] have reported the application of this systemin the Malin Deep
Geochemistry Geophysics Geosystems 1010022013GC005108
GARCIA ET AL VC 2014 American Geophysical Union All Rights Reserved 870
42 BathymetryBathymetry data were collected in 2003 as part of the Irish National Seabed Survey a 7 year multidiscipli-nary baseline-mapping program [Dorschel et al 2011] Data were acquired on board the RV Celtic Explorerusing a Kongsberg-Simrad EM1002 multibeam echo sounder with an operational frequency of 93ndash98 kHzand pulse length of 07 s Additional EM1002 S multibeam data used in this research were collected in 2006coinciding with the EM survey on board the RV Celtic Voyager These multibeam lines were acquired at ashorter pulse length (02 s) at very low survey speed (2ndash3 knots) and were primarily used for multibeamecho sounder (MBES) backscatter-EM analysis [Garcia et al 2007]
43 Subbottom ProfilerSubbottom profile (SBP) data were acquired using a heave-corrected SES Probe 5000 35 kHz transceiver inconjunction with a hull-mounted 434 transducer array Acquisition parameters data logging and inter-pretation were carried out using the CODA Geokit suite Both Raw Navigation string and Heave Compensa-tion string were fed into the Coda DA200 system (from the Seapath 200) An average estimated acousticvelocity of 1650 ms was used to calculate the thickness of the sedimentary units Acoustic penetration insome areas was on the order of 60 m below the seabed with approximately 04 m resolution Full acquisi-tion parameters are detailed as follow Trigger (variable up to 350 ms) sweep time (variable up to 349 ms)Delay (variable up to 100 ms) frequency (35 kHz) TVF lsquolsquoBand Passrsquorsquo (Low 5 2000 Hz High 5 5000 Hz)
44 Shallow Sediment CoresA number of shallow cores were made available for this study In 2008 on board the RV Celtic Explorertwo 6 m long cores were obtained using a vibrocorer in the vicinity of pockmark 2 core CE08_044 waslocated outside the pockmark and core CE08_045 was taken inside the pockmark (Tables 1 and 2 and Fig-ure 2) The cores were cut into 1 m sections and kept in cold storage on board The cores presented ahydrogen sulfide gas odor during the cutting and two sections from CE08_044 showed the presence ofbubbles during the sealing (sections 4 and 6 in Figure 3) These two cores were scanned at 1 cm intervals(as whole core and split) for physical properties using a Multiscanning Core Logger (MSCL) MSCL scanner
Table 1 Mean and Median of Particle Size Analysis of CE08_044 Core (Outside Pockmark)
Sample Name Clay (lt2 lm) Silt (2ndash63 lm) Sand (63ndash2000 lm) Mean Grain Size Sorting Skewness
5 375 8806 820 2889 158 02020 394 8986 620 2602 154 01640 365 8831 804 2921 156 02660 355 8839 806 2875 157 02380 374 8834 792 2790 159 018100 334 8423 1243 3550 166 024120 326 8752 922 2123 157 030140 365 8536 1098 3103 162 029160 224 7704 2072 4408 160 068180 169 7016 2815 5270 154 096200 166 7175 2660 5114 153 094220 172 7087 2741 5203 153 100240 139 6998 2863 5450 143 118260 148 7348 2503 5052 144 107280 278 8648 1074 3337 154 076300 337 8972 691 2726 151 034320 754 8437 809 2784 204 130340 301 8623 1076 3218 157 041360 628 8573 799 2932 185 120380 971 8284 745 2589 214 117400 1386 8276 339 1833 222 104420 1371 8010 619 2127 234 091440 1412 8049 539 2029 234 097460 1236 8045 719 2414 232 089480 1359 7973 668 4663 252 041500 1319 8290 391 1961 222 093520 1634 7951 415 1889 189 020540 1681 7922 397 1938 191 017560 1865 7872 263 1529 182 010Mean 705 8181 1114 180Median 374 8284 804 160Std dev 563 607 820 033
Geochemistry Geophysics Geosystems 1010022013GC005108
GARCIA ET AL VC 2014 American Geophysical Union All Rights Reserved 871
(Geotek) in Boscorf (Southampton National Oceanographical Center) The MSCL scanner calculates a seriesof physical parameters like magnetic susceptibility X-ray fluorescence (XRF) density electrical conductivityand P velocity from cores Particle size analysis at 20 cm intervals was performed using a MalvernMastersizer-S bench top laser granulometer Pore waters were analyzed at the chemistry laboratory in Dub-lin City and the results were presented in detail in Szpak et al [2012] Physical analysis results are summar-ized in Tables 1 and 2 and Figures 3a and 3b In 2006 five gravity cores (3 m long) were obtained on thesame cruise as the marine EM data described in this work (some of the triangles in Figure 2) and other grav-ity cores were obtained during later cruises Sediment cores were described and particle size analysis per-formed at specific intervals These additional cores are all located outside the pockmark area and were usedqualitatively to characterize the uppermost sediments [Szpak et al 2012]
5 Results
51 Sediment Core ResultsThe results from the two 6 m sediment cores taken in 2008 are presented in Tables 1 and 2 and Figures 3and 4 Cores CE08_44 and CE08_45 present similar characteristics in their composition and overall physicalproperties allowing characterization of the upper most 6 m as soft homogenous fine-grained sedimentsfrom very fine sands to silts However both cores show significant differences in stratigraphic structureInside the pockmark (Table 1) core CE08_45 has a generally homogeneous appearance and a lack of clearlydefined structure or sedimentary units with only minor fluctuations in siltclay ratio Physical properties logsand grain size analysis reflect the homogeneity with fairly constant measurements narrow variations and noclearly visible primary trends (upward increasing or decreasing trends) Grain size profiles in the upper 37 mindicate a structureless sedimentary sequence while in the lower part sediment grain size patterns containdistinct gradients (Figure 4) This is not the case for the core outside the pockmark (CE08_44 Table 2 andFigure 3) Here the uppermost 6 m of sediments show clear internal structure and the physical properties
Table 2 Mean and Median of Particle Size Analysis of CE08_045 Core (Inside Pockmark)
Sample Name Clay (lt2 lm) Silt (2ndash63 lm) Sand (63ndash2000 lm) Mean Grain Size Sorting Skewness
5 463 8636 901 2889 170 202520 1377 8390 233 1546 218 11040 1200 8276 524 3323 232 06060 204 5996 3800 8846 203 03080 1349 7816 835 6635 270 015105 1321 8178 502 2402 235 089120 1370 8089 541 2236 237 089140 1455 8009 535 3717 249 053160 466 8992 542 2348 157 2022180 1314 8016 670 5546 258 026200 1542 7786 673 6944 278 006205 1394 8343 263 1570 222 111220 1009 8699 292 1752 198 100240 1305 8177 518 2521 236 081260 529 9130 341 1807 147 2019280 1256 8293 451 2176 225 093300 1030 8504 467 2116 211 096320 553 9375 072 1339 129 2013340 812 8913 275 1761 176 083360 458 9380 162 1525 133 2016380 1510 8251 239 1712 232 107400 1554 8171 276 1558 233 109420 1391 8204 405 1883 231 103440 1366 8327 307 1636 224 112460 1493 8282 225 1671 228 104480 1405 8012 583 2251 241 093500 1366 8419 215 1550 214 110520 1859 7950 191 1417 240 102540 1838 7919 244 1514 239 094560 1724 8028 248 1624 241 099575 1700 8107 193 1433 233 106Mean 1213 8280 507 217Median 1366 8251 341 231Std Dev 442 598 643 037
Geochemistry Geophysics Geosystems 1010022013GC005108
GARCIA ET AL VC 2014 American Geophysical Union All Rights Reserved 872
and grain size confirm the presence of primary trends and a gradual transition within the units which are alsoclearly visible in the subbottom profiles It is also noticeable a distinctive layer between 15 and 3 m below theseafloor (shaded area in Figure 4) which is dominated by fine sand with an almost total absence of clay(lt2) Physical analyses show an increase of density P wave velocity and resistivity and a decrease of thefractional porosity corresponding to this layer Focusing on the first meter of the core values the mean grainsize within the pockmark is 465 lm while outside the pockmark is 294 lm (Tables 1 and 2)
52 Geophysical DataThe EM survey consisted of six lines maximizing coverage of the area and passes over gas charged seafloorand particularly large composite pockmarks (Figure 2) The data are presented in Figures 5ndash10 as apparentconductivities from half-space inversions of the apparent resistivity data from each receiver The final errorsin fits of the model to the observations were below 2 except a few locations where errors were around3 The apparent conductivities were visually inspected for anomalous data points like spikes or areas inwhich there was no alignment between transmitter and receiver and those sections were removed
Line 1 crosses the basin following an approximate EW transect and is coincident with a 35 kHz pinger sub-bottom profile (Figure 5) line 2 is located on the southwestern slope of the basin line B runs in SE-NWdirection across the basin and lines 3 A and C in NS direction In all cases the bathymetry in included as avisual reference to some of the features or to indicate the situation of the profiles within the basin
In earlier surveys using this EM system the apparent conductivities were converted to apparent porosities[eg Evans et al 1999 Evans and Lizarralde 2003] using Archiersquos law (equation (1)) using an assumed valueof the cementation factor based on complementary data Our study area is affected by changes in faciesand also gas and so to do a proper estimation of the porosity extensive coverage by ground sampleswould be required We therefore we present results as apparent conductivities
An existing seismic line and three subbottom profiles have also been used in the present work These datawere processed following standard procedures discussed earlier
Figure 2 Bathymetric map with EM lines (black) subbottom profiler data (white) and seismic reflection data (red) The location of vibro-cores (red dots) and samples and gravity cores(white triangles) is also indicated The inset plot on the top left side of the figure is a zoom to the area marked by presence of Pockmark 2 (white box) where the activities of this studywere mostly concentrated Dashed lines indicated main faults and tectonic units
Geochemistry Geophysics Geosystems 1010022013GC005108
GARCIA ET AL VC 2014 American Geophysical Union All Rights Reserved 873
521 Line 1At 19 km line 1 (Figure 5) is the longest profile in our survey The line starts on the Eastern side of the basinon the northernmost edge of the Malin Terrace and finishes on the western part of the Malin basin towardthe Donegal basin Apparent conductivities along the profile vary between 09 and 12 Sm On the easternend (region E) differences in apparent conductivities of up to 14 between the two receivers suggest anoverall downward coarsening of the lithological units This is followed by a positive conductivity trend(region D) in both receivers indicating finer sediments as the instrument moved to the central part of thebasin At about 5 km from the beginning of the profile (region C) conductivities decrease and becomemore irregular reflecting greater lateral structure in the subsurface
One of the most interesting features in line 1 is located 75 km from the beginning of the profile (region C)The overall conductivities of the upper 20 m (sensed by the deeper receiver) are higher than the conductiv-ities of the top 6 m (as sensed by shallower receiver) of seafloor The data in this area are poorly describedby a half space indicative of laterally heterogeneous media under the receiver This region has a significantacoustic signature in the subbottom profiler (Figure 5 bottom) and is also coincident with a magneticanomaly (data not shown) that has been interpreted as an intrusive body located at some 18 mbsf As thesystem crossed the area affected by this igneous intrusion the conductivity on the 40 m receiver rapidlyincreased showing larger values than the shallower receiver Additionally the acoustic records showed anincrease of the thickness of Unit 1 and acoustic blanking (AB labels on Figure 5 bottom plot) As the systemmoved west conductivity values decreased
Pockmark 2 (P2 in Figure 5) is imaged clearly by both receivers although with an opposite behavior Con-ductivities recorded by the deeper receiver decrease while those on the shallower receiver increase Anom-alous spikes in conductivity are seen at the edges of the pockmark that we discuss later
P-wave (ms) Density (gcm3) Fractional PorosityResistivity (Ωmiddotm)
0
100
200
300
400
500
Dep
th (c
m)
No data available No data available No data available No data available
04 06 0803 05 07 1350 1400 1450 1500 1550 1600 16 201817 19 21 0807060504
Sand Clay
SiltMean [microm]
0 20 40 60 80 1000 10 20 30 40
Figure 3 Core results from CE08_044 Image PSA and physical properties of core outside pockmark P2
Geochemistry Geophysics Geosystems 1010022013GC005108
GARCIA ET AL VC 2014 American Geophysical Union All Rights Reserved 874
Detailed examination of the conductivity profile in region C (Figure 5) shows a complex structure as the sys-tem enters a small pockmark (labeled SP) Within the pockmark the two receivers show opposite behavior(increase for shallow receiver and decrease for deeper receiver) suggesting a steeper conductivity gradientwithin the pockmark itself Past this pockmark toward the West the conductivities regain the regional trendand increase in magnitude Szpak et al [2012] have described in detail the EM properties of the seafloorwithin this composite pockmark (P2)
Toward the western part of the line (region B) conductivity decreases gradually punctuated by severalsharp decreases with both profiles finally converging to the same values suggesting a thick and homogene-ous unit (region A Figure 5) clearly seen in the subbottom profiler data
On the eastern side of the basin regions D and E show a decrease in conductivity Within region D the con-ductivity profiles on both receivers show similar trends similar to those in region B although the shallowseismic unit 1 is thicker in region D and there is an obvious difference in conductivity values caused by thedifference in stratigraphy Responses in region E are more influenced by the thinning of units 2 and 3 (seeshallow seismics in bottom plot)
Subbottom profiler line 182 (Figure 5 bottom plot) shows a regional topmost unit (unit 1) which is gener-ally well and closely stratified with parallel reflectors from horizontal to gently inclined This unit has a thick-ness ranging from a few meters at the basin edge to over 40 m in the central part of the basin The unit islocally disturbed under pockmarks or adjacent to near-surface subcrops The bottom part shows beddingplanes that are in places gently folded or inclined and some accommodation structures Unit 1 lies semicon-formably above Unit 2
Both Units 1 and 2 correspond to the Jura and Barra formation [Dobson and Whittington 1992] which canbe traced beneath the upper unit on most records In general unit 2 exhibits a structureless and
SiltMean [microm] P-wave (ms) Density (gcm3) Fractional PorosityResistivity (Ωmiddotm)
0
100
200
300
400
500
Dep
th (c
m)
Sand Clay
0 10 20 30 40 04 06 08 10 1400 1450 1500 1550 16 1817 0706050 20 40 60 80 100
Figure 4 Core data CE08_045 Image PSA and physical properties of core inside pockmark P2
Geochemistry Geophysics Geosystems 1010022013GC005108
GARCIA ET AL VC 2014 American Geophysical Union All Rights Reserved 875
semitransparent acoustic character throughout the entire basin with minimal internal reflectors and lowbackscatter response Thickness is relatively uniform throughout the basin averaging 5ndash15 m thinning tothe edges (Figure 5) Some infrequent internal reflectors appear as enhanced isolated reflectors and in otherplaces like vertical plume-like structures (possibly fluid migration paths labeled VM dashed blue lines)
Unit 3 underlies this unit with a pronounced erosional surface This unit appears discontinuously in thepinger records because it is located in the limit of the acoustic penetration In contrast to unit 2 unit 3appears well and closely stratified with inclined or folded parallel reflections
Gas anomalies in the basin have been reported in Monteys et al [2008] and Szpak et al [2012] Acoustic data(Figures 5 (bottom plot) and 11) reveal that there is widespread evidence of shallow gas-disturbed sedi-ments particularly within the unit 1 Features such as reflector blanking and amplitude enhancement com-monly referenced as indicators of shallow gas can be observed throughout the area and are not limited tocooccurrence with pockmarks Fluid migration pathways are present in the records and are most commonlyobserved within the unit 1 sections They appear as vertical hyperbolic anomalies across strata (meter scale)suggesting vertical migration or parallel-to-strata signal enhancements indicative of lateral fluid flow(extending up to hundreds of meters) On close inspection in the vicinity of the largest pockmarks verticalfluid migration pathways resembling chimneys can be observed immediately below the pockmark unitswith a width of approximately 50 m Acoustic turbidity facies and disrupted strata can be observed belowthe largest pockmark (P2) indicating a correlation between the acoustic gas facies and the seabed depres-sions (Figures 5 and 11) Similarly disturbed strata are evidence of recent migration of gas through theseabed Finally hydroacoustic evidence of gas seeping or gas plumes has not been observed in the pock-mark area thus it is unclear whether these features are only periodically active or are completely inactive
260
240
220
200
TW
T (
ms)
280
543 544 545 546 547 548 549 550 551 552 553 554 555 556 557 558 559 560 561
Easting (km)
09
10
11
12
13
Con
duct
ivity
(S
m)
VC044 VC045
Igneousintrusion
A B C D E
SP P2
W E
BP
Unit 1
Unit 2
Unit 3
Unit 3
Unit 3
Unit 2
Unit 1
AT
AB
AB
VMVM
VMVM
VP
DS
Unit 1
Unit 2
Rock
Rock
Figure 5 (top) EM line 1 showing conductivities colored according to receiver sensitivity depth (red 6 mbsf blue 20 mbsf) (bottom) Sub-bottom profiler (35 KHz) seismic line 182 aligned with the EM line Lines blue and red on bottom plot indicate 6 and 20 mbsf depths tomatch depth of sensitivity of EM receivers P2 Pockmark 2 SP Small pockmark BP Buried pockmarks AT Acoustic turbulence AB Acous-tic blanking DS Distorted sediments VM vertical migration pathways also vertical dark blue dashed lines
Geochemistry Geophysics Geosystems 1010022013GC005108
GARCIA ET AL VC 2014 American Geophysical Union All Rights Reserved 876
Locally depressions within the unit 1 strata (Figure 5 feature BP) resembling the ones on the seabed havebeen observed across the basin Some of these features are coincident with conductivity signatures typicalof gas-disturbed sediments that we observed at other locations in the study region raised edges andreduced conductivity suggesting that these features are likely a series of buried pockmarks Feature BP alsoresults in measured conductivities that are larger on the deeper receiver than on the shallower one
Gas related anomalies around Pockmark 2 appear to be concentrated in the vicinity of a series of igneousintrusions These Paleogene intrusions appear to have facilitated gas migration to the seabed providingnear-vertical planes through several units disrupting the parallel strata (Figure 5 region C)
522 Line 2Line 2 (Figure 6) runs along the southwestern side of the basin and is the only line that does not cross thebasin itself For the first 15 km the conductivities of both receivers are similar suggesting that there is athinning of the uppermost unit After this point both receivers show very different behavior with the shal-lower receiver showing smoothly varying conductivities that are about 1 Sm considered the normal valuefor unconsolidated sediments [Yuan and Edwards 2000] The deeper receiver measures large variations thatare related to changes in the second unit and thus caused by structural (lithological and porosity) changeswith areas related to larger conductivity values corresponding to areas of the thicker upper unit
523 Line 3As a whole line 3 (Figure 7) shows similar responses to those on the other lines collected The line startsoutside the basin where conductivities are relatively low As the instrument moved into the deepest part ofthe basin conductivities started to rise and 2 km from the beginning of the profile when crossing overpockmark 2 conductivities plateau within a very homogeneous area (2 km long) at about 125 Sm Thisarea is coincident with region C as noted in Figure 5 After this area conductivities decrease graduallytoward the north with the exception of a dome-like pattern of ca 3 km (feature X in Figure 7) althoughtoward the northern edge of the basin there is an area where conductivity anomalies decrease and displayhigher amplitude variations for the shallow receiver This section coincides with an area affected by gasescape features in the acoustic records (see pockmark cluster locations in Figure 1) The fairly parallel
160
170
Dep
th (
m)
LINE 2
08
09
10
Con
duct
ivity
(S
m)
0 1 2 3 4 5 6 7 8
Distance (km)
NW SE
Figure 6 EM line 2 showing conductivities colored according to receiver sensitivity depth (red 6 mbsf blue 20 mbsf) (top) Bathymetrymeasured from CTD sensor in EM system
Geochemistry Geophysics Geosystems 1010022013GC005108
GARCIA ET AL VC 2014 American Geophysical Union All Rights Reserved 877
distribution of conductivities measured by both receivers indicate that both are imaging similar geologicalfacies (composed of a number of layers) with downward decrease of porosity by sediment compaction
Unfortunately there was no shallow seismic data coincident with this profile but there is a reflection seis-mic line (DBS99_218) along an adjacent parallel track to the EM line The bottom plot of Figure 7 shows azoom in image of the first 350 ms of this seismic line DBS99_218 The plot shows the shallow stratigraphyof the study area down to some 70 mbsf (almost 200 mbsl) The top section of the basin shows a very dis-tinctive parallel layering in the unconsolidated sediments in the top 60 m section There is a channel-likefeature 80 m below the pockmark 2 area and coincident with the splay of the Skerryvore Fault This intervallargely correlates with area C generally characterized by high-conductivity values and low anomalies Inter-estingly two coincident negative conductivity anomalies are seen in both profiles in this area (from 6198 to6199 km) which correspond to the channel-like feature and that we interpret as possible gas migrationpathways (11) Perhaps one important observation is that the shallow stratigraphy remains near horizontaland parallel toward the North of the profile where the EM data show more variability This disparitybetween data sets as we will discuss later is likely caused by the presence of gas in sediments Unfortu-nately the conventional seismic data (Figure 7) do not have sufficient resolution in the shallower sections toshow any changes
524 Line ALine A (Figure 8) is the shortest profile of our survey It roughly follows a NS line across the basin about 15km west of line 3 and pockmark P2 (Figure 2) The conductivity profile along line A in the area where itcrosses line 1 shows an anomalous area located at about 15 km from the beginning of the profile which isalso seen along line 1 likely caused by the presence of the igneous intrusion According to the shallow EMreceiver (upper 6 m) this area is characterized by a sharp decrease in the conductivity (between 18 and 3in profile) which we interpret as a very large but shallow pockmark (about 1 km long by some 2 m depthexpression in bathymetry) which has been eroded and partially infilled by sediments The deeper EM
200
300TT
W (
ms)
250
350
6189 6190 6191 6192 6193 6194 6195 6196 6197 6198 6199 6200 6201 6202 6203
Northing (km)
09
10
11
12
Con
duct
ivity
(S
m)
6189 6190 6191 6192 6193 6194 6195 6196 6197 6198 6199 6200 6201 6202 6203
Northing (km)
P2PC
S N
X
Figure 7 (top) EM line 3 showing conductivities colored according to receiver sensitivity depth (red 6 mbsf blue 20 mbsf) (bottom) Top 350 ms from 2-D multichannel seismic reflec-tion profile DBS99_128 blue line indicates 40 ms TWT below the seafloor corresponding to some 20 mbsf depth Seismic data sampling rate of 1 ms The data were processed using pre-stack time migration and normalized stack Posteriorly it was band-pass filtered with low cut at 35 Hz and high cut at 309 Hz
Geochemistry Geophysics Geosystems 1010022013GC005108
GARCIA ET AL VC 2014 American Geophysical Union All Rights Reserved 878
170
180
190
Dep
th (
m)
LINE A
10
11
12
Con
duct
ivity
(S
m)
543210
Distance (km)
S NC
Figure 8 EM line A showing conductivities colored according to receiver sensitivity depth (red 6 mbsf blue 20 mbsf) (top) Bathymetrymeasured from CTD sensor in EM system
160
170
180
190
Dep
th (
m)
LINE B
09
10
11
12
Con
duct
ivity
(S
m)
0 1 2 3 4 5 6 7 8
Distance (km)
NW SE
P2
C
Figure 9 EM line B showing conductivities colored according to receiver sensitivity depth (red 6 mbsf blue 20 mbsf) (top) Bathymetrymeasured from CTD sensor in EM system
Geochemistry Geophysics Geosystems 1010022013GC005108
GARCIA ET AL VC 2014 American Geophysical Union All Rights Reserved 879
sensor shows a response similar to the one previously observed in lines crossing the large pockmark P2line 1 (Figure 5) although not as extensive (500 m wide between 27 and 32 km in profile) This area islocated immediately adjacent to the igneous anomaly described previously suggesting that the edges ofthe intrusion have been used as a path for fluid expulsion crossing sediment layers
We also identify the central area in the profile (22ndash31 km in profile) as corresponding to region C Here theconductivity data also show a complex structure and a drop of conductivity
525 Line BLine B (Figure 9) starts in the deepest part of the basin and follows a NW-SE direction reaching the MalinTerrace on the SE of the study area The conductivity profile along line B is typical of the Malin shelf Con-ductivities are high in the deepest part of the basin and decreases toward the basin edge The data suggesta well-preserved layering of the sediments except within the anomalous area associated with the magmaticintrusion and pockmark 2 Toward the end of the profile both conductivity curves separate indicating achange in facies as the instrument leaves the basin
As in previous profiles we can also identify region C in this profile (approximately from 2 to 4 km in the pro-file) with the same characteristics complex structure and a drop in conductivity from the surroundingvalues
526 Line CLine C (Figure 10) crosses the eastern side of the basin The conductivities recorded by both receivers startat around 09 Sm and follow a similar parallel trend This line displays an increasing trend of the conductiv-ity as the instrument moved northeastward into the basin corresponding to a decrease of the grain size(larger amounts of silt) in the sediments within the basin Toward the end of the profile the instrumentcrossed a large pockmark (feature P1 in Figures 2 and 10) Here the responses from both receivers show adrop in conductivity The bathymetry (Figure 10 top plot) indicates that along the crossing line pockmark 1(P1 in Figure 2) is composed of at least two fluid escape features this also corresponds to the two minimathat are observed on the shallow receiver
160
170
180 Dep
th (
m)
LINE C
09
10
11
12
13
Con
duct
ivity
(S
m)
0 1 2 3 4 5 6 7
Distance (km)
S N
P1
E D C
Figure 10 EM line C showing conductivities colored according to receiver sensitivity depth (red 6 mbsf blue 20 mbsf) (top) Bathymetrymeasured from CTD sensor in EM system
Geochemistry Geophysics Geosystems 1010022013GC005108
GARCIA ET AL VC 2014 American Geophysical Union All Rights Reserved 880
In this profile regions E D and C as they were defined in line 1 can also be seen In particular providing anextension to the NE of region C
53 Characterization of the Inner BasinBased on the conductivity sections extracted from the EM profiles we can define an inner basin within theMalin basin itself coincident with the area containing the majority of the large pockmarks associated withthe Skerryvore Fault (Figure 2) This region has been defined using primarily line 1 data but also lines 3 AB and C This inner basin is an elongated feature running from the SW to the NE with a width of 2ndash4 kmOur data are unable to constrain its length but it is likely at least several kilometers long (Figure 11) Thisinner basin is marked by a gentle increase of conductivities around the edges The interior of this innerbasin is marked by a drop in conductivities displaying homogeneous values disrupted only by anomaliesmarking the presence of edges of pockmarks or subsurface gas accumulation (Figures 5 and 7ndash10) This fea-ture was termed the Malin Deep micro basin in Szpak et al [2012] but since in the present work we canmap its extension to a few kilometers we prefer to call it the inner basin
The above mentioned drop in conductivity values within the pockmark is confirmed by sediment core anal-ysis results (Tables 1 and 2 and Figures 3 and 4) The main difference observed between both cores is thatcore CE08_044 (outside the pockmark) shows according to physical properties logs distinct stratigraphicunits whilst core CE08_045 (inside the pockmark) shows no layering and very homogeneous physical prop-erties Furthermore the analysis shows that outside the pockmark (core CE08_044 Table 1) the mean grainsize is on average coarser than within the pockmark (core CE08_045 Table 2) by 36 clay content is lower(3 versus 13) and there is a lower degree of sorting (15 versus 23)
The inner basin region (region C Figures 5 and 7ndash10) has been defined from EM conductivity valuesalthough analyses of the cores confirm changes in the homogeneity of sediments This inner basin includes
10
11
12
Conductivity (S
m)550 551 552 553 554 555 556
Easting (km)
G
G
G
P
SP P2
16 m
16 m
16 mL181
L182
L183
BR
W E
1000 m
L181
L183
L182
Figure 11 Gas anomalies in the central part of the basin as observed in the EM (line 1) and 3 parallel shallow seismic lines (181 182 and 183) The enhanced reflectors interpreted asgas accumulation facies (G) are present in the three parallel lines and coincide with the edges of the EM gassy region (C) SP is a small pockmark see also Figure 5 BR refers to a brightreflector interpreted as a magmatic intrusion
Geochemistry Geophysics Geosystems 1010022013GC005108
GARCIA ET AL VC 2014 American Geophysical Union All Rights Reserved 881
the area affected by pockmarks but the changes are not inherent to the pockmark area but are presentthroughout The inner basin is also the area more affected by pockmarks [Monteys et al 2008] and can beassociated with the Skerryvore Fault The largest geophysical differentiation in this inner basin is found inthe superficial part as the shallow EM receiver is more affected than the deeper one In general this area ischaracterized by reduced and more irregular conductivity values
Figure 11 shows SBP (subbottom profiler) lines 181 182 and 183 together with EM Line 1 (see also Figure 2for geographical location) The most striking feature on these plots is the area with gas accumulation coin-cident with the inner basin anomalous conductivity response (region C) This feature runs in a WSW-ENEdirection and correlates well with the inferred position of the Skerryvore Fault (Figure 2) The seismic reflec-tion line DBS99_128 (Figure 7) delineates the North-South extend of region C marked by the presence of achannel-like feature which is limited to the central part of the basin and is not a regional feature
6 Discussion
The EM data show an increase in conductivity toward the center of the Malin basin that suggests higherporosities within sediments We interpret this as the regional trend within the Malin basin Across the basinthe EM data show numerous anomalies that are associated with the presence of gas or freshwater alsoseen in the shallow seismic records (see Figure 11) Core sample analysis confirms differences in sedimentcomposition inside and outside of the pockmark The central part of the basin is characterized by a NE-SWelongated conductive anomaly which is defined by a sharp decrease in the conductivity with respect to theadjacent areas of the basin This anomalous conductivity region correlates well with the NE-SW surfaceexpression of the Skerryvore Fault and fluid escape features observed in the acoustic records
Local high-conductivity anomalies in the vicinity of the pockmarks could have been caused by gas-fueledincrease in microbial activity [Szpak et al 2012] as it has been shown that such activity can affect geo-electrical properties of sediments [Atekwana et al 2004 Abdel Aal et al 2010] (see for example in Figure 5the area located under pockmark 2) Szpak et al [2012] show geochemical signatures of microbial activityfrom analysis of the cores also used in this work Similar local anomalies have been observed in several ofthe EM lines and are confirmed by crossovers Although the geochemical evidence points toward microbialactivity some of these anomalies could also be caused by changes in sediment permeability resulting fromfluid flow
In particular 1 km West of pockmark 2 (Figure 5) there is an area of enhanced reflectivity that we interpretas presence of gas in the strata which corresponds to an increase of conductivities in the 40 m (deeper)receiver As mentioned earlier the expected response of the EM system to the presence of gas is the oppo-site Geochemical analysis of the core in this area [Szpak et al 2012] shows evidence of microbial activitywhich can affect the conductivity of sediments as mentioned above
According to Judd and Hovland [2007] while the initial pockmark formation has a blowout like characteris-tic later fluid migration is likely to use already existing pathways More recent studies [Hovland et al 2010]suggest that fluids escape gradually while the reservoir is charging Once the gas in the reservoir is suffi-cient overpressured it will push through the geological seal The acoustic data in Figure 5 show areas ofblanking or interruption of the layering from the surrounding areas under the pockmark this has beeninterpreted as the result of sediment mixing and of pockmark formation The meaning of this vertical acous-tic blanking is still poorly understood and widely debated [Judd and Hovland 2007] This is also observed inthe core analysis (Tables 1 and 2 and Figures 3 and 4) where the core taken from within the pockmarkshows a more homogeneous layering in comparison to the core from outside the pockmark where a dis-tinct layering is observed
Core data analysis from outside the pockmark (core CE08_044 Figure 3 and Table 1) shows a well-preservedlayering with a sand-rich unit between 15 and 3 mbsf The conductivity in this region (see Figure 5) as meas-ured by the shallow EM receiver is low compared to values obtained elsewhere within the basin The core insidethe pockmark (core CE08_045 Figure 4 and Table 2) shows nonlayered sedimentary structure with no apparentsediment grain size gradients typical of reworked material and the EM data show a regional trend in conductiv-ity (Figures 5 7 and 9) Apparent conductivities are larger than outside the pockmark Szpak et al [2012] haveassociated the increase in conductivity within the pockmark with bacterial activity These observations suggest
Geochemistry Geophysics Geosystems 1010022013GC005108
GARCIA ET AL VC 2014 American Geophysical Union All Rights Reserved 882
that there is a large amount of gas in the sediments of the basin but within the pockmarks (1) gas has escapedand sediments have been disturbed thus increasing the porosity and (2) there is a higher level of bacterialactivity Both of these phenomena can explain the difference in conductivity between the pockmark and thebasin Additionally shallow structures in the SBP data (Figures 5 and 11) are more disturbed than the deeperparts possibly indicating that gas has accumulated in the upper strata
The edges of the pockmark are associated with narrow positive conductive anomalies Newman et al [2008]have pointed out that methane venting from a large pockmark in the Atlantic coast of the United Statesoccurs along the upper parts of the pockmark walls and is not occurring through the floor of the pockmarkChatterjee et al [2011] report that increased fluid flux and deep source methane input result in enhancedconcentrations of hydrate and free gas that accumulate on areas of larger porosity With the help of allthese observations we can interpret the conductivity anomalies observed across pockmarks The internalpart of the pockmark has a decrease of conductivity because of the presence of gas and the more heteroge-neous structure of the sediments As sedimentation is responsible for deposition of organic material vent-ing provides chemical energy in areas of active seeping microbial communities thrive [Jrgensen andBoetius 2007] While the walls of the pockmark constitute pathways for fluid release and hence likely havehigher permeability and porosity from disturbed sediments and therefore higher conductivity we believethat this location is also where most microbial activity concentrates Following the results of Atekwana et al[2004] there is probably an added increase of the conductivity associated with this microbial activityalthough a detailed ground-truthing study would be required to assess this At the same time around thesewalls there is an accumulation of free gas that causes a conductivity decrease
Not all the conductivity anomalies caused by presence of gas are the same Large pockmarks appear assharp conductivity anomalies (positive in the walls and negative in the center) and gas charged areas dis-play a large regional trend This is clearly observed in line C (Figure 10) as the instrument enters the basinboth measurements of conductivity rise until the instruments entered a pockmark Sediments charged withgas should generally show a decrease in their conductivity as has been seen elsewhere [Hsu et al 2014]The results shown in Figure 10 can be interpreted as a (1) change in sediment facies with coarser sands out-side the basin and finer muddy sediments in the interior [Monteys et al 2008] (2) in certain locations thepresence of microbial activity that is known to increase the conductivity of sediments [Atekwana et al2004] and (3) caused by the water influx as gas has been released refilling sediment pores [Sultan et al2011] which will cause an increase of conductivity as the resistive phase (gas) is removed from sedimentsIn the case of a change in facies we need to consider that gas will be very well distributed in sand withinthe matrix decreasing the effective conductivity of sediments but in the case of mud with higher perme-ability gas is trapped in layers and is not as effective at decreasing the overall conductivity
The upper section (top meter) combined results of the grain size and physical properties descriptors on thetwo cores suggest that part or most of the surface material within the pockmark has been reworked possi-bly as a consequence of pockmark formation [Judd and Hovland 2007] Commonly during formation pock-marks are left with so-called lag deposit which is usually coarser than surrounding seabed This is due to thefines being suspended in the water column during ventingblowout and carried away from the site by cur-rents while coarse particulates with lower sedimentation rates are deposited [Judd and Hovland 2007] Asecond plausible mechanism topographic depressions can act as sediment traps retaining the coarser frac-tion while fine grains remain suspended in the water column Both of these mechanisms are not exclusivesand can act at times simultaneously
While the general electrical properties of the basin are controlled by grain size region C (the inner basin inMalin) has a very distinct electrical signature which from the evidence in the conductivity anomalies theSBP profiles and ground truthing is marked by the presence of fluids most likely gas and water released bysediment compaction
The EM line 3 which crosses the entire basin from South to North shows the largest conductivity variations(Figure 7) The Northern part (feature X) has large conductivity anomalies that correlate with presence ofgas enhanced reflectors and a high density of pockmarks in coarser sediments indicating fluid escape Fol-lowing the results we have observed in other areas of the Malin Sea it seems that microbial activity is thecause of this enhanced conductivity Without a more thorough ground truthing we cannot ascertain theextent of possible microbial activity
Geochemistry Geophysics Geosystems 1010022013GC005108
GARCIA ET AL VC 2014 American Geophysical Union All Rights Reserved 883
7 Conclusions
The general trend of the EM survey across the basin shows a gradual increase of conductivity toward thecentral and deepest part of the basin Shallow seismic profiles and MBES observations also reflect sedimen-tary changes across the basin in a fairly homogenous sediment stratum
Electromagnetic surveys across the Malin Basin show a number of conductivity anomalies associated withthe presence of gas charged sediments in the upper strata These anomalies consist in a general increase inconductivity over the areas with a higher density of gas reflectors and with local sharp increments (peaks)This correlates well with gas related echo facies as observed in the sub bottom records
Although the observation of higher conductivities with highest volumes of gas seems counter intuitive thegeophysical signatures correspond to changes in sediment grain size ranging from fairly homogeneoussands to clays indicating changes in porosity control the conductivity rather that gas
There are EM signatures that appear as positive anomaly changes in conductivity compared to the sur-rounding trend These have been observed both as local peaks and also as kilometer long high-conductivity anomalies We interpret these anomalies as fluid accumulation parallel to the strata which arewell correlated to enhanced amplitude reflectors in the subbottom profiler records
There are some local anomalies characterized by short intervals of lower conductivity which could eitherbe caused by gas associated with vertical migration pathways or local disruption of the shallow strata pro-duced by fluid disturbance While the former shows the expected conductivity response decrease causedby the presence of free gas in sediments the latter would be related to a decrease due to the layer disconti-nuity as observed in the shallow seismic records
The areas corresponding to the pockmark depression are characterized in general by high-conductivitypeaks at the edges while inside the unit the conductivity drops and is fairly homogeneous as well as in thevicinity of the pockmark The lower conductivity values across the pockmark depression are found insidethe unit pockmarks Sediment core data suggests that within the two pockmark units studied certain stratashow evidence of increased microbial activity [Szpak et al 2012] which in turn can increase bulk electricalconductivities as pointed out by Atekwana et al [2004]
ReferencesAbdel Aal G Z E A Atekwana and E A Atekwana (2010) Effect of bioclogging in porous media on complex conductivity signatures
J Geophys Res 115 G00G07 doi1010292009JG001159Anderson A L and L D Hampton (1980) Acoustics of gasndashbearing sediments I Background J Acoust Soc Am 67(6) 1865ndash1889 doi
1011211384453Archie G E (1942) The electrical resistivity log as an aid in determining some reservoir characteristics Trans Am Inst Min Metal Eng
146 54ndash67Atekwana E A D D J Werkema J W Duris S Rossbach E A Atekwana W A Sauck D P Cassidy J Means and F D Legall (2004) In-
situ apparent conductivity measurements and microbial population distribution at a hydrocarbon-contaminated site Geophysics 69(1)56ndash63 doi10119011649375
Beuroorner J H V Herdegen J-U Repke and K Spitzer (2013) The impact of CO2 on the electrical properties of water bearing porous mediaLaboratory experiments with respect to carbon capture and storage Geophys Prospect 61(s1) 446ndash460 doi101111j1365-2478201201129x
Chatterjee S G Gu W G Chapman G J Hirasaki G Bhatnagar B Dugan and G R Dickens (2011) Effects of heterogeneous lithologyand focused fluidflow on gas hydrate distribution in marine sediments paper presented at 7th International Conference on GasHydrates (ICGH 2011) Scotland U K
Cheesman S J (1989) A Short Baseline Transient Electromagnetic Method for Use on the Sea Floor edited by S J Cheesman Univ ofToronto Dep of Phys Geophys Lab Toronto Ontario
Cheesman S J L K Law and B St Louis (1993) A porosity mapping survey in Hecate Strait using a seafloor electro-magnetic profilingsystem Mar Geol 110(3ndash4) 245ndash256 doi1010160025-3227(93)90087-C
Dobson M R and D Evans (1974) Geological structure of the Malin Sea J Geol Soc London 130(5) 475ndash478 doi101144gsjgs13050475Dobson M R and R J Whittington (1992) Aspects of the geology of the Malin Sea area Geol Soc Spec Publ 62(1) 291ndash311 doi101144
GSLSP19920620123Dorschel B A Wheeler X Monteys and K Verbrugge (2011) Atlas of the Deep-Water Seabed Ireland Springer LondonDunlop P R Shannon M McCabe and R Quinn (2010) Marine geophysical evidence for ice sheet extension and recession on the Malin
Shelf New evidence for the western limits of the British Irish Ice Sheet Mar Geol 276(1ndash4) 86ndash99 doi101016jmargeo201007010Evans D R J Whittington and M R Dobson (1985) Tiree Solid Geology 1250000 Scale (map) (Institute of Geological Sciences) British
Geological Survey Nottingham (UK)Evans R L (2001) Measuring the shallow porosity structure of sediments on the continental shelf A comparison of an electromagnetic
approach with cores and acoustic backscatter J Geophys Res 106(C11) 27047ndash27060 doi1010292000JC000487Evans R L (2007) Using CSEM techniques to map the shallow section of seafloor From the coastline to the edges of the continental slope
Geophysics 72(2) WA105 doi10119012434798
AcknowledgmentsWe wished to thank the GeologicalSurvey of Ireland the IntegratedMapping for the Sustainable Develop-ment of Irelandrsquos Marine Resources(INFOMAR) program the PetroleumAffairs Division (PAD) and the DublinInstitute for Advanced Studies forfunding this study Thanks to PAD forgranting access to the multichannelseismic line DBS99_128 Jim Brodafrom the Woods Hole OceanographicInstitution kindly provided the gravitycorer We would also like to thankBrian Kelleher and DCU for access tothe geochemistry lab Some plots havebeen realized using the GMT package[Wessel and Smith 1991] Commentsby Editor Cyn-Ty Lee and reviewersMads Huuse and Katryn Schwalenbergare greatly appreciated This work isalso supported by a research grantfrom the Spanish Ministry of Scienceand Innovation (CTM2011-30400-C02-02)
Geochemistry Geophysics Geosystems 1010022013GC005108
GARCIA ET AL VC 2014 American Geophysical Union All Rights Reserved 884
Evans R L and D Lizarralde (2003) Geophysical evidence for karst formation associated with offshore groundwater transport An exam-ple from North Carolina Geochem Geophys Geosyst 4(8) 1069 doi1010292003GC000510
Evans R L L K Law B St Louis S J Cheesman and K Sananikone (1999) The shallow porosity structure of the Eel shelf northern Califor-nia Results of a towed electromagnetic survey Mar Geol 154(1ndash4) 211ndash226 doi101016S0025-3227(98)00114-5
Fleischer P T Orsi M Richardson and A Anderson (2001) Distribution of free gas in marine sediments A global overview Geo Mar Lett21 103ndash122 doi101007s003670100072
Floodgate G and A Judd (1992) The origins of shallow gas Cont Shelf Res 12(10) 1145ndash1156 doi1010160278-4343(92)90075-UFonseca L L Mayer D Orange and N W Driscoll (2002) The high-frequency backscattering angular response of gassy sediments Model
data comparison from the Eel River Margin California J Acoust Soc Am 111(6) 2621ndash2631 doi10112111471911Garcia X X Monteys R L Evans and B Kelleher (2007) Geohazard identification and early reconnaissance for hydrocarbon potential
using marine electromagnetic and high frequency acoustic methods Geophys Res Abstr 9 09524 16ndash20 SRef-ID 1607-7962graEGU2007-A-09524
Hovland M (1984) Gas-induced erosion features in the north sea Earth Surf Processes Landforms 9 209ndash228Hovland M and A Judd (1988) Seabed Pockmark and Seepages Impact on Geology Biology and the Marine Environment 293 pp Graham
and Trotman LondonHovland M R Heggland M De Vries and T Tjelta (2010) Unit-pockmarks and their potential significance for predicting fluid flow Mar
Pet Geol 27(6) 1190ndash1199 doi101016jmarpetgeo201002005Hsu S K C-W Chiang R L Evans C-S Chen S-D Chiu Y-F Ma S-C Chen C-H Tsai S-S Lin and Y Wang (2014) Marine controlled
source EM method used for the gas-hydrate investigation in the area off SW Taiwan J Asian Earth Sci doi101016jjseaes201312001in press httpwwwsciencedirectcomsciencearticlepiiS1367912013006202
Jackson P D D T Smith and P N Stanford (1978) Resistivityndashporosityndashparticle shape relationships for marine sands Geophysics 43(6)1250ndash1268 doi10119011440891
Jackson P D R C Flint and K B Briggs (1998) Two- and three-dimensional heterogeneity in carbonate sediments using resistivity imag-ing J Acoust Soc Am 104(3) 1812ndash1812 doi1011211423422
Jrgensen B B and A Boetius (2007) Feast and faminemdashMicrobial life in the deep-sea bed Nat Rev Microbiol 5(10) 770ndash781 doi101038nrmicro1745
Josenhans H W L H King and G B Fader (1978) A side-scan sonar mosaic of pockmarks on the Scotian shelf Can J Earth Sci 15(5)831ndash840 doi101139e78-088
Judd A and M Hovland (2007) Seabed Fluid Flow The Impact on Geology Biology and the Marine Environment 492 pp Cambridge UnivPress Cambridge UK
King L H and B MacLean (1970) Pockmarks on the Scotian Shelf Geol Soc Am Bull 81(10) 3141 doi1011300016-7606(1970)81[3141POTSS]20CO2
Kvenvolden K A and B W Rogers (2005) Gaiarsquos breathmdashGlobal methane exhalations Mar Pet Geol 22(4) 579ndash590 doi101016jmarpetgeo200408004
Milkov A V (2000) Worldwide distribution of submarine mud volcanoes and associated gas hydrates Mar Geol 167(1ndash2) 29ndash42 doi101016S0025ndash3227(00)00022-0
Minshull T A G K Westbrook K A Weitemeyer M C Sinha B K Goswami and B Marsset (2012) Leaking Methane Reservoirs OffshoreSvalbard Eos Trans AGU 93(42) 413ndash414 doi101029eost2012EO42
Monteys X D Hardy E Doyle and S Garcia-Gil (2008) Distribution morphology and acoustic characterisation of a gas pockmark field onthe Malin Shelf NW Ireland paper presented at OSP-01 General Contributions to Marine Geoscience and Paleoceanography Sympo-sium Int Geol Congr Oslo
Meurouller H T von Dobeneck W Nehmiz and K Hamer (2011) Near-Surface EM rock-magnetic and geochemical fingerprinting of submar-ine freshwater seepage at Eckernfeuroorde bay Geo Mar Lett 31(2) 123ndash140 doi101007s00367-010-0220-0
Newman K R et al (2008) Active methane venting observed at giant pockmarks along the US mid-Atlantic shelf break Earth Planet SciLett 267(1ndash2) 341ndash352 doi101016jepsl200711053
Parnell J (1992) Burial histories and hydrocarbon source rocks on the North West Seaboard Geol Soc Spec Publ 62(1) 3ndash16 doi101144GSLSP19920620102
Ren S R Y Liu Y Liu and W Zhang (2010) Acoustic velocity and electrical resistance of hydrate bearing sediments J Pet Sci Eng 70(1ndash2) 52ndash56 doi101016jpetrol200909001
Rice D D and G E Claypool (1981) Generation accumulation and resource potential of biogenic gas AAPG Bull 65(1) 5ndash25Riddihough R (1968) Magnetic surveys off the north coast of ireland Proc R Irish Acad 66 27ndash41Schubel J R (1974) Effects of tropical storm agnes on the suspended solids of the northern chesapeake bay in Suspended Solids in Water
Mar Sci vol 4 edited by R Gibbs pp 113ndash132 Springer US doi101007978-1-4684ndash8529-5_8Schwalenberg K E Willoughby R Mir and R N Edwards (2005) Marine gas hydrate electromagnetic signatures in Cascadia and their cor-
relation with seismic blank zones First Break 23 57ndash63Sills G C and S J Wheeler (1992) The significance of gas for offshore operations Cont Shelf Res 12(10) 1239ndash1250 doi1010160278-
4343(92)90083-VSultan N et al (2011) Dynamics of fault-fluid-hydrate system around a shale-cored anticline in deepwater Nigeria J Geophys Res 115
B08101 doi1010292011JB008218Szpak M T X Monteys S OrsquoReilly A J Simpson X Garcia R L Evans C C R Allen D J McNally D Courtier-Murias and B P Kelleher
(2012) Geophysical and geochemical survey of a large marine pockmark on the Malin Shelf Ireland Geochem Geophys Geosyst 13Q01011 doi1010292011GC003787
Taylor D (1992) Nearshore shallow gas around the UK coast Cont Shelf Res 12(10) 1135ndash1144 doi1010160278-4343(92)90074-TWessel P and W H F Smith (1991) Free software helps map and display data Eos Trans AGU 72 441ndash446Wilkens R and M Richardson (1998) The influence of gas bubbles on sediment acoustic properties In situ laboratory and theoretical
results from Eckernfeuroorde bay Germany Cont Shelf Res 18 1859ndash1892Wilt M and D Alumbaugh (1998) Electromagnetic methods for development and production State of the art Leading Edge 17(4) 487ndash
487Yuan F J D Bennell and A M Davis (1992) Acoustic and physical characteristics of gassy sediments in the western Irish Sea Cont Shelf
Res 12(10) 1121ndash1134 doi1010160278ndash4343(92)90073-SYuan J and R N Edwards (2000) The assessment of marine gas hydrates through electrical remote sounding Hydrate without a BSR
Geophys Res Lett 27(16) 2397ndash2400 doi1010292000GL011585
Geochemistry Geophysics Geosystems 1010022013GC005108
GARCIA ET AL VC 2014 American Geophysical Union All Rights Reserved 885
It has been postulated that the walls of pockmarks act as pathways for gas flow [Newman et al 2008] andthat sediments are disturbed within the pockmark as a consequence of the violent gas release mechanism[Judd and Hovland 2007] Additionally some studies show that bacterial activity feeding on gas in sedi-ments can cause conductivity anomalies [Atekwana et al 2004 Abdel Aal et al 2010] The present study isused to test whether EM methods can clearly detect pockmark signatures the presence of gas within sedi-ments fluid release pathways and presence of bacterial activity
2 Geological Setting of the Study Area
The Malin Deep Pockmark Field lies on the Irish continental shelf approximately 70 km offshore northwestIreland (Figure 1) The area lies in the Malin Basin situated in a complex structural setting delimited to thenorth by the Stanton Banks fault and to the south by the Malin Terrace [Dobson and Evans 1974 Dobsonand Whittington 1992] The Skerryvore fault a major normal fault divides the study area into two differentbasins the Donegal Basin and the West Malin Basin The Donegal Basin extends parallel to the north coastof Ireland into the area of the Malin Sea with an east-northeast trend The region is largely dominated bytwo structural trends one NE-SW (Caledonian) and another almost orthogonal NNW-SSE trend (Paleozoic)Faults developed across this region in a NNW-SSE direction under a dextral strike-slip stress regime
Igneous intrusions are common across the Malin Shelf including centers like the Malin Complex [Riddi-hough 1968] and minor bodies on the Malin Trough closer to the study area These intrusive bodies aregenerally subcropping the Quaternary material as part of relict structures from the successive erosional gla-cial events [Dobson and Whittington 1992] These intrusions are visible in the shallow seismic records andare marked by high-magnetic anomalies In some instances the instrusions outcrop at the seafloor andbecome visible in multibeam bathymetry [Monteys et al 2008] These intrusions were initially detected
0 70km55
55 30
56 30
56
9 8 7
SKERRYVORE FAULT
STANTON BANKS FAULT
STANTON BANKS
OUTER HEBRIDES PLATFORM
MAIN DONEGAL BASIN
SOUTH DONEGAL BASIN
MALIN TERRACE
MA
LIN FA
ULT
SKERRYVORE TROUGH
MALIN COMPLEX
ISLAY - DONEGAL PLATFORM
COLONSAY FAULT
STA
NT
ON
TR
OU
GH
FA
ULT
STANTON TROUGH
LAVA FIELD OFPOSSIBLE PALEOCENE AGE
SKERRYVORE BANK BLOCK
MALIN
TROUGH
BLACKSTONE BASIN
COLONSAY
BASIN
FANAD PLUTON
THORR PLUTON
LOCH INDAAL
BASINSWILLY FAULT
PROBLABLE LINE OF SPLAY OF GREAT GLEN FAULT
MIDDLE BANK
FOYLE FAULT
MALIN HEAD
DUBH ARTACH FAULT
Zone of thin Mesozoic resting unconformably on acoustic basement
Shallow folds in Malin Basin
Tertiary Basin
Major Faults
Regional Dip in Half grabben
Basement outcrop limit dot on basement side
Lava Field
Igneous centers
Pockmark cluster
minus10˚
minus10˚
0˚
0˚
10˚
10˚
˚04˚04
˚05˚05
˚06˚06
Figure 1 Geological sketch of the Malin Sea area after Dobson and Whittington [1992] The red box indicates the study area the Malin Deep Pockmark field The light green patchedareas around the study zone indicate the pockmark clusters in the Malin Deep (adapted from Monteys et al [2008]) The light blue line indicates the limit of territorial waters between Ire-land and the UK
Geochemistry Geophysics Geosystems 1010022013GC005108
GARCIA ET AL VC 2014 American Geophysical Union All Rights Reserved 868
using magnetic surveys [Riddihough 1968] and later dated by Dobson and Whittington [1992] as of Paleo-gene age features
Quaternary sediments are recorded throughout the Malin Sea area with thicknesses varying from north tosouth from 175 to 125 m [Evans et al 1985] The upper strata in the Malin Shelf is composed of marine gla-cial diposits and glacial landforms with bed forms alternating between sand patches and coarser sedimentsranging in size from pebbles to boulders to soft-layered Holocene silty muds in the study area [Evans et al1985 Dunlop et al 2010] The basin floor around the pockmark field is characterized by soft fine-grainedsediment facies comprising more than 220 gas related pockmarks distributed in clusters around the mainstructural lineaments [Monteys et al 2008] (see also light green patched areas in Figure 1)
Hydrocarbons have been encountered in several of the northwest offshore basins particularly those withthicker Permo-Triassic sequences Hydrocarbon prospects rely on the existence of Carboniferous sourcerocks however Jurassic to Cretaceous source rocks have also been documented in the region Paleogenereactivation of fractures may have allowed the leakage of reservoir hydrocarbons to the upper subsurface[Parnell 1992]
3 Gas in Marine Sediments
Gas in marine sediments can have biogenic or thermogenic origin [Floodgate and Judd 1992] Biogenic gasis produced by the degradation of organic matter by bacterial activity at low temperatures whereas ther-mogenic gas is produced by chemical reactions within the sediment in which time high temperatures andburial depth are important controlling factors [Rice and Claypool 1981]
Free gas has an important effect on the acoustic properties of the seabed Bubbles even in small quantitiescan cause markedly reduced compressional wave speeds increased compressional wave attenuation andincreased sound scattering [Anderson and Hampton 1980 Wilkens and Richardson 1998 Fonseca et al2002] Free gas is also known to significantly alter sedimentary geotechnical characteristics primarily byincreasing seabed compressibility and reducing its undrained shear strength [Sills and Wheeler 1992] In theenvironmental sciences gassy sediments are becoming increasingly important in global studies of climatechange and methane budget [Fleischer et al 2001] It has been suggested that methane fluxes associatedwith marine seepages have been greatly underestimated in the methane and carbon cycles [Kvenvoldenand Rogers 2005 Milkov 2000]
Resistivity provides a first-order measure of seafloor porosity in sedimentary settings allowing facies mapsto be constructed or changes in lithology to be identified In unconsolidated sediments and to some extentin hard rock porosity is a key parameter to understanding pore fluid and fluid transport (ie ionic concen-tration and mobility) The presence of gas (effectively an electrical insulator) will decrease the conductivityof the rock matrix because it may block or isolate the conductive water in the pores [Ren et al 2010]Hydrates like gas are a resistive phase and therefore their effect on EM data is similar Yuan and Edwards[2000] and Schwalenberg et al [2005] report values of seafloor conductivity of 06ndash1 Sm in the absence ofhydrates and low anomalous conductivities (lt02 Sm) in the presence of hydrates
There is little information in the literature on the effects on conductivity of free or dissolved gas in sedi-ments Free gas would be expected to reduce effective porosity in a one-one basis as it effectively adds tothe amount of resistive matrix There is the possibility that gas could preferentially block key fluid connec-tion pathways and therefore be more effective at reducing conductivity Dissolved gas would change theseawater conductivity Beuroorner et al [2013] report a decrease of conductivity as a result of dissolved CO2 insand saturated with saline water although they also account for an increase of the conductivity caused byadditional charges provided by the gas However this experiment was carried out at supercritical conditionsand in the context of CO2 sequestration
However the resistivity is affected to a much lesser extent than are acoustic properties [Cheesman et al1993] which can suffer wipeouts in the presence of trace amounts of gas Schubel [1974] demonstrated thatonly as little as 01 (vv) of gas present in the sediment could reduce the speed of sound by a third More-over gas acoustic signatures can vary greatly depending on factors such as wavelength of acoustic pulseapplied distribution of gas in the lithofacies and bubble size [Judd and Hovland 2007] Because of thisextreme sensitivity acoustic methods can detect gas but do not place constraints on gas volumes
Geochemistry Geophysics Geosystems 1010022013GC005108
GARCIA ET AL VC 2014 American Geophysical Union All Rights Reserved 869
Therefore the combination of different geophysical techniques particularly seismic and electromagneticmethods provides means of quantifying gas in situ For more detailed information on relationship of con-ductivity velocity and gas see eg Wilt and Alumbaugh [1998]
4 Material and Methods
41 Electromagnetic DataThe towed-electromagnetic (EM) system discussed in this paper consists of three main components thedeck electronics a transmitter and the receiver string The seafloor components of the system (transmitterand receivers) form a 40 m long array which is towed in contact with the seafloor at speeds of 1ndash2 knots
The EM transmitter a horizontal magnetic dipole generates harmonic magnetic fields over a range of fre-quencies (200ndash200 kHz) and the three receivers tuned to measure the magnetic fields propagatingthrough the ambient seawater and seafloor are towed at fixed distances behind (4 126 and 40 m) At agiven frequency the strength of magnetic fields decays away from the transmitter as a function of the con-ductivity of the seafloor (ie according to the skin depth) decaying more rapidly in more conductive mediaThe sensitivity of the magnetic dipole-dipole system along with the physics of the propagation of the fieldsthrough the seafloor was presented in Cheesman [1989] Further details of the system sensitivity data proc-essing and inversion are given in Evans [2007] and details on resolution can be found in Evans [2001] Thenoise level of the system has been estimated to be on the order of 1 in terms of apparent porosity [Evanset al 1999] As a first-order approximation [Evans et al 1999] the depth of penetration of a receiver isabout one-half of the receiver-transmitter separation (ie the 40 m receiver is sensitive to the electricalproperties of the top 20 mbsf) Since the 4 m receiver failed to collect any data we will refer below to the40 m receiver as the deeper receiver and to the 13 m receiver as the shallow receiver
Because the system maintains a fixed distance between source and receiver it can be regarded as a map-ping tool In order to build up a map of subseafloor structure only relatively spatial sparse coverage isneeded [Evans et al 1999] Archiersquos law [Archie 1942] can be used to obtain estimated porosities for a sim-ple two-phase system that contains a conductive pore fluid In fully water-saturated rocks Archiersquos law canbe expressed [Evans 2007]
5a1=m (1)
where is the porosity m is the cementation factor and a is the conductivity contrast defined as the ratiobetween grain matrix conductivity and pore fluid conductivity The cementation factor can be obtainedfrom laboratory analysis and varies between 15 and 3 [Jackson et al 1978 1998] A more complete form ofArchiersquos law than equation (1) in which gas saturation is taking into account
rsediment5meth12SgTHORNnrwater (2)
where r indicates electrical conductivity porosity m the cementation factor and n the saturation expo-nent The saturation exponent models the effect of the presence of nonconductive fluids (usually hydrocar-bons) The effect of the saturation term in Archiersquos law is a drop in conductivity but without any preciseknowledge of the gas saturation can be misinterpreted as a change in porosity
The resulting maps provide superior spatial coverage than conventional coring techniques and porositiesobtained from conductivities using equation (1) in regions where coring techniques fail to recover samplesbut more importantly provide a means of interpolating between discrete core locations Finally the com-bined methodology provides estimates of physical properties where seismic reflection profiles are contami-nated by strong bottom multiples or signal starvation due to the presence of methane gas [Cheesman et al1993] The system is however perfectly complementary to seismic methods and is best used in concertwith high-resolution seismic reflection techniques which define the stratal geometry and from multichan-nel seismics velocities and therefore densities while the EM data define the electrical properties and fromthose porosities [Evans and Lizarralde 2003] Szpak et al [2012] have reported the application of this systemin the Malin Deep
Geochemistry Geophysics Geosystems 1010022013GC005108
GARCIA ET AL VC 2014 American Geophysical Union All Rights Reserved 870
42 BathymetryBathymetry data were collected in 2003 as part of the Irish National Seabed Survey a 7 year multidiscipli-nary baseline-mapping program [Dorschel et al 2011] Data were acquired on board the RV Celtic Explorerusing a Kongsberg-Simrad EM1002 multibeam echo sounder with an operational frequency of 93ndash98 kHzand pulse length of 07 s Additional EM1002 S multibeam data used in this research were collected in 2006coinciding with the EM survey on board the RV Celtic Voyager These multibeam lines were acquired at ashorter pulse length (02 s) at very low survey speed (2ndash3 knots) and were primarily used for multibeamecho sounder (MBES) backscatter-EM analysis [Garcia et al 2007]
43 Subbottom ProfilerSubbottom profile (SBP) data were acquired using a heave-corrected SES Probe 5000 35 kHz transceiver inconjunction with a hull-mounted 434 transducer array Acquisition parameters data logging and inter-pretation were carried out using the CODA Geokit suite Both Raw Navigation string and Heave Compensa-tion string were fed into the Coda DA200 system (from the Seapath 200) An average estimated acousticvelocity of 1650 ms was used to calculate the thickness of the sedimentary units Acoustic penetration insome areas was on the order of 60 m below the seabed with approximately 04 m resolution Full acquisi-tion parameters are detailed as follow Trigger (variable up to 350 ms) sweep time (variable up to 349 ms)Delay (variable up to 100 ms) frequency (35 kHz) TVF lsquolsquoBand Passrsquorsquo (Low 5 2000 Hz High 5 5000 Hz)
44 Shallow Sediment CoresA number of shallow cores were made available for this study In 2008 on board the RV Celtic Explorertwo 6 m long cores were obtained using a vibrocorer in the vicinity of pockmark 2 core CE08_044 waslocated outside the pockmark and core CE08_045 was taken inside the pockmark (Tables 1 and 2 and Fig-ure 2) The cores were cut into 1 m sections and kept in cold storage on board The cores presented ahydrogen sulfide gas odor during the cutting and two sections from CE08_044 showed the presence ofbubbles during the sealing (sections 4 and 6 in Figure 3) These two cores were scanned at 1 cm intervals(as whole core and split) for physical properties using a Multiscanning Core Logger (MSCL) MSCL scanner
Table 1 Mean and Median of Particle Size Analysis of CE08_044 Core (Outside Pockmark)
Sample Name Clay (lt2 lm) Silt (2ndash63 lm) Sand (63ndash2000 lm) Mean Grain Size Sorting Skewness
5 375 8806 820 2889 158 02020 394 8986 620 2602 154 01640 365 8831 804 2921 156 02660 355 8839 806 2875 157 02380 374 8834 792 2790 159 018100 334 8423 1243 3550 166 024120 326 8752 922 2123 157 030140 365 8536 1098 3103 162 029160 224 7704 2072 4408 160 068180 169 7016 2815 5270 154 096200 166 7175 2660 5114 153 094220 172 7087 2741 5203 153 100240 139 6998 2863 5450 143 118260 148 7348 2503 5052 144 107280 278 8648 1074 3337 154 076300 337 8972 691 2726 151 034320 754 8437 809 2784 204 130340 301 8623 1076 3218 157 041360 628 8573 799 2932 185 120380 971 8284 745 2589 214 117400 1386 8276 339 1833 222 104420 1371 8010 619 2127 234 091440 1412 8049 539 2029 234 097460 1236 8045 719 2414 232 089480 1359 7973 668 4663 252 041500 1319 8290 391 1961 222 093520 1634 7951 415 1889 189 020540 1681 7922 397 1938 191 017560 1865 7872 263 1529 182 010Mean 705 8181 1114 180Median 374 8284 804 160Std dev 563 607 820 033
Geochemistry Geophysics Geosystems 1010022013GC005108
GARCIA ET AL VC 2014 American Geophysical Union All Rights Reserved 871
(Geotek) in Boscorf (Southampton National Oceanographical Center) The MSCL scanner calculates a seriesof physical parameters like magnetic susceptibility X-ray fluorescence (XRF) density electrical conductivityand P velocity from cores Particle size analysis at 20 cm intervals was performed using a MalvernMastersizer-S bench top laser granulometer Pore waters were analyzed at the chemistry laboratory in Dub-lin City and the results were presented in detail in Szpak et al [2012] Physical analysis results are summar-ized in Tables 1 and 2 and Figures 3a and 3b In 2006 five gravity cores (3 m long) were obtained on thesame cruise as the marine EM data described in this work (some of the triangles in Figure 2) and other grav-ity cores were obtained during later cruises Sediment cores were described and particle size analysis per-formed at specific intervals These additional cores are all located outside the pockmark area and were usedqualitatively to characterize the uppermost sediments [Szpak et al 2012]
5 Results
51 Sediment Core ResultsThe results from the two 6 m sediment cores taken in 2008 are presented in Tables 1 and 2 and Figures 3and 4 Cores CE08_44 and CE08_45 present similar characteristics in their composition and overall physicalproperties allowing characterization of the upper most 6 m as soft homogenous fine-grained sedimentsfrom very fine sands to silts However both cores show significant differences in stratigraphic structureInside the pockmark (Table 1) core CE08_45 has a generally homogeneous appearance and a lack of clearlydefined structure or sedimentary units with only minor fluctuations in siltclay ratio Physical properties logsand grain size analysis reflect the homogeneity with fairly constant measurements narrow variations and noclearly visible primary trends (upward increasing or decreasing trends) Grain size profiles in the upper 37 mindicate a structureless sedimentary sequence while in the lower part sediment grain size patterns containdistinct gradients (Figure 4) This is not the case for the core outside the pockmark (CE08_44 Table 2 andFigure 3) Here the uppermost 6 m of sediments show clear internal structure and the physical properties
Table 2 Mean and Median of Particle Size Analysis of CE08_045 Core (Inside Pockmark)
Sample Name Clay (lt2 lm) Silt (2ndash63 lm) Sand (63ndash2000 lm) Mean Grain Size Sorting Skewness
5 463 8636 901 2889 170 202520 1377 8390 233 1546 218 11040 1200 8276 524 3323 232 06060 204 5996 3800 8846 203 03080 1349 7816 835 6635 270 015105 1321 8178 502 2402 235 089120 1370 8089 541 2236 237 089140 1455 8009 535 3717 249 053160 466 8992 542 2348 157 2022180 1314 8016 670 5546 258 026200 1542 7786 673 6944 278 006205 1394 8343 263 1570 222 111220 1009 8699 292 1752 198 100240 1305 8177 518 2521 236 081260 529 9130 341 1807 147 2019280 1256 8293 451 2176 225 093300 1030 8504 467 2116 211 096320 553 9375 072 1339 129 2013340 812 8913 275 1761 176 083360 458 9380 162 1525 133 2016380 1510 8251 239 1712 232 107400 1554 8171 276 1558 233 109420 1391 8204 405 1883 231 103440 1366 8327 307 1636 224 112460 1493 8282 225 1671 228 104480 1405 8012 583 2251 241 093500 1366 8419 215 1550 214 110520 1859 7950 191 1417 240 102540 1838 7919 244 1514 239 094560 1724 8028 248 1624 241 099575 1700 8107 193 1433 233 106Mean 1213 8280 507 217Median 1366 8251 341 231Std Dev 442 598 643 037
Geochemistry Geophysics Geosystems 1010022013GC005108
GARCIA ET AL VC 2014 American Geophysical Union All Rights Reserved 872
and grain size confirm the presence of primary trends and a gradual transition within the units which are alsoclearly visible in the subbottom profiles It is also noticeable a distinctive layer between 15 and 3 m below theseafloor (shaded area in Figure 4) which is dominated by fine sand with an almost total absence of clay(lt2) Physical analyses show an increase of density P wave velocity and resistivity and a decrease of thefractional porosity corresponding to this layer Focusing on the first meter of the core values the mean grainsize within the pockmark is 465 lm while outside the pockmark is 294 lm (Tables 1 and 2)
52 Geophysical DataThe EM survey consisted of six lines maximizing coverage of the area and passes over gas charged seafloorand particularly large composite pockmarks (Figure 2) The data are presented in Figures 5ndash10 as apparentconductivities from half-space inversions of the apparent resistivity data from each receiver The final errorsin fits of the model to the observations were below 2 except a few locations where errors were around3 The apparent conductivities were visually inspected for anomalous data points like spikes or areas inwhich there was no alignment between transmitter and receiver and those sections were removed
Line 1 crosses the basin following an approximate EW transect and is coincident with a 35 kHz pinger sub-bottom profile (Figure 5) line 2 is located on the southwestern slope of the basin line B runs in SE-NWdirection across the basin and lines 3 A and C in NS direction In all cases the bathymetry in included as avisual reference to some of the features or to indicate the situation of the profiles within the basin
In earlier surveys using this EM system the apparent conductivities were converted to apparent porosities[eg Evans et al 1999 Evans and Lizarralde 2003] using Archiersquos law (equation (1)) using an assumed valueof the cementation factor based on complementary data Our study area is affected by changes in faciesand also gas and so to do a proper estimation of the porosity extensive coverage by ground sampleswould be required We therefore we present results as apparent conductivities
An existing seismic line and three subbottom profiles have also been used in the present work These datawere processed following standard procedures discussed earlier
Figure 2 Bathymetric map with EM lines (black) subbottom profiler data (white) and seismic reflection data (red) The location of vibro-cores (red dots) and samples and gravity cores(white triangles) is also indicated The inset plot on the top left side of the figure is a zoom to the area marked by presence of Pockmark 2 (white box) where the activities of this studywere mostly concentrated Dashed lines indicated main faults and tectonic units
Geochemistry Geophysics Geosystems 1010022013GC005108
GARCIA ET AL VC 2014 American Geophysical Union All Rights Reserved 873
521 Line 1At 19 km line 1 (Figure 5) is the longest profile in our survey The line starts on the Eastern side of the basinon the northernmost edge of the Malin Terrace and finishes on the western part of the Malin basin towardthe Donegal basin Apparent conductivities along the profile vary between 09 and 12 Sm On the easternend (region E) differences in apparent conductivities of up to 14 between the two receivers suggest anoverall downward coarsening of the lithological units This is followed by a positive conductivity trend(region D) in both receivers indicating finer sediments as the instrument moved to the central part of thebasin At about 5 km from the beginning of the profile (region C) conductivities decrease and becomemore irregular reflecting greater lateral structure in the subsurface
One of the most interesting features in line 1 is located 75 km from the beginning of the profile (region C)The overall conductivities of the upper 20 m (sensed by the deeper receiver) are higher than the conductiv-ities of the top 6 m (as sensed by shallower receiver) of seafloor The data in this area are poorly describedby a half space indicative of laterally heterogeneous media under the receiver This region has a significantacoustic signature in the subbottom profiler (Figure 5 bottom) and is also coincident with a magneticanomaly (data not shown) that has been interpreted as an intrusive body located at some 18 mbsf As thesystem crossed the area affected by this igneous intrusion the conductivity on the 40 m receiver rapidlyincreased showing larger values than the shallower receiver Additionally the acoustic records showed anincrease of the thickness of Unit 1 and acoustic blanking (AB labels on Figure 5 bottom plot) As the systemmoved west conductivity values decreased
Pockmark 2 (P2 in Figure 5) is imaged clearly by both receivers although with an opposite behavior Con-ductivities recorded by the deeper receiver decrease while those on the shallower receiver increase Anom-alous spikes in conductivity are seen at the edges of the pockmark that we discuss later
P-wave (ms) Density (gcm3) Fractional PorosityResistivity (Ωmiddotm)
0
100
200
300
400
500
Dep
th (c
m)
No data available No data available No data available No data available
04 06 0803 05 07 1350 1400 1450 1500 1550 1600 16 201817 19 21 0807060504
Sand Clay
SiltMean [microm]
0 20 40 60 80 1000 10 20 30 40
Figure 3 Core results from CE08_044 Image PSA and physical properties of core outside pockmark P2
Geochemistry Geophysics Geosystems 1010022013GC005108
GARCIA ET AL VC 2014 American Geophysical Union All Rights Reserved 874
Detailed examination of the conductivity profile in region C (Figure 5) shows a complex structure as the sys-tem enters a small pockmark (labeled SP) Within the pockmark the two receivers show opposite behavior(increase for shallow receiver and decrease for deeper receiver) suggesting a steeper conductivity gradientwithin the pockmark itself Past this pockmark toward the West the conductivities regain the regional trendand increase in magnitude Szpak et al [2012] have described in detail the EM properties of the seafloorwithin this composite pockmark (P2)
Toward the western part of the line (region B) conductivity decreases gradually punctuated by severalsharp decreases with both profiles finally converging to the same values suggesting a thick and homogene-ous unit (region A Figure 5) clearly seen in the subbottom profiler data
On the eastern side of the basin regions D and E show a decrease in conductivity Within region D the con-ductivity profiles on both receivers show similar trends similar to those in region B although the shallowseismic unit 1 is thicker in region D and there is an obvious difference in conductivity values caused by thedifference in stratigraphy Responses in region E are more influenced by the thinning of units 2 and 3 (seeshallow seismics in bottom plot)
Subbottom profiler line 182 (Figure 5 bottom plot) shows a regional topmost unit (unit 1) which is gener-ally well and closely stratified with parallel reflectors from horizontal to gently inclined This unit has a thick-ness ranging from a few meters at the basin edge to over 40 m in the central part of the basin The unit islocally disturbed under pockmarks or adjacent to near-surface subcrops The bottom part shows beddingplanes that are in places gently folded or inclined and some accommodation structures Unit 1 lies semicon-formably above Unit 2
Both Units 1 and 2 correspond to the Jura and Barra formation [Dobson and Whittington 1992] which canbe traced beneath the upper unit on most records In general unit 2 exhibits a structureless and
SiltMean [microm] P-wave (ms) Density (gcm3) Fractional PorosityResistivity (Ωmiddotm)
0
100
200
300
400
500
Dep
th (c
m)
Sand Clay
0 10 20 30 40 04 06 08 10 1400 1450 1500 1550 16 1817 0706050 20 40 60 80 100
Figure 4 Core data CE08_045 Image PSA and physical properties of core inside pockmark P2
Geochemistry Geophysics Geosystems 1010022013GC005108
GARCIA ET AL VC 2014 American Geophysical Union All Rights Reserved 875
semitransparent acoustic character throughout the entire basin with minimal internal reflectors and lowbackscatter response Thickness is relatively uniform throughout the basin averaging 5ndash15 m thinning tothe edges (Figure 5) Some infrequent internal reflectors appear as enhanced isolated reflectors and in otherplaces like vertical plume-like structures (possibly fluid migration paths labeled VM dashed blue lines)
Unit 3 underlies this unit with a pronounced erosional surface This unit appears discontinuously in thepinger records because it is located in the limit of the acoustic penetration In contrast to unit 2 unit 3appears well and closely stratified with inclined or folded parallel reflections
Gas anomalies in the basin have been reported in Monteys et al [2008] and Szpak et al [2012] Acoustic data(Figures 5 (bottom plot) and 11) reveal that there is widespread evidence of shallow gas-disturbed sedi-ments particularly within the unit 1 Features such as reflector blanking and amplitude enhancement com-monly referenced as indicators of shallow gas can be observed throughout the area and are not limited tocooccurrence with pockmarks Fluid migration pathways are present in the records and are most commonlyobserved within the unit 1 sections They appear as vertical hyperbolic anomalies across strata (meter scale)suggesting vertical migration or parallel-to-strata signal enhancements indicative of lateral fluid flow(extending up to hundreds of meters) On close inspection in the vicinity of the largest pockmarks verticalfluid migration pathways resembling chimneys can be observed immediately below the pockmark unitswith a width of approximately 50 m Acoustic turbidity facies and disrupted strata can be observed belowthe largest pockmark (P2) indicating a correlation between the acoustic gas facies and the seabed depres-sions (Figures 5 and 11) Similarly disturbed strata are evidence of recent migration of gas through theseabed Finally hydroacoustic evidence of gas seeping or gas plumes has not been observed in the pock-mark area thus it is unclear whether these features are only periodically active or are completely inactive
260
240
220
200
TW
T (
ms)
280
543 544 545 546 547 548 549 550 551 552 553 554 555 556 557 558 559 560 561
Easting (km)
09
10
11
12
13
Con
duct
ivity
(S
m)
VC044 VC045
Igneousintrusion
A B C D E
SP P2
W E
BP
Unit 1
Unit 2
Unit 3
Unit 3
Unit 3
Unit 2
Unit 1
AT
AB
AB
VMVM
VMVM
VP
DS
Unit 1
Unit 2
Rock
Rock
Figure 5 (top) EM line 1 showing conductivities colored according to receiver sensitivity depth (red 6 mbsf blue 20 mbsf) (bottom) Sub-bottom profiler (35 KHz) seismic line 182 aligned with the EM line Lines blue and red on bottom plot indicate 6 and 20 mbsf depths tomatch depth of sensitivity of EM receivers P2 Pockmark 2 SP Small pockmark BP Buried pockmarks AT Acoustic turbulence AB Acous-tic blanking DS Distorted sediments VM vertical migration pathways also vertical dark blue dashed lines
Geochemistry Geophysics Geosystems 1010022013GC005108
GARCIA ET AL VC 2014 American Geophysical Union All Rights Reserved 876
Locally depressions within the unit 1 strata (Figure 5 feature BP) resembling the ones on the seabed havebeen observed across the basin Some of these features are coincident with conductivity signatures typicalof gas-disturbed sediments that we observed at other locations in the study region raised edges andreduced conductivity suggesting that these features are likely a series of buried pockmarks Feature BP alsoresults in measured conductivities that are larger on the deeper receiver than on the shallower one
Gas related anomalies around Pockmark 2 appear to be concentrated in the vicinity of a series of igneousintrusions These Paleogene intrusions appear to have facilitated gas migration to the seabed providingnear-vertical planes through several units disrupting the parallel strata (Figure 5 region C)
522 Line 2Line 2 (Figure 6) runs along the southwestern side of the basin and is the only line that does not cross thebasin itself For the first 15 km the conductivities of both receivers are similar suggesting that there is athinning of the uppermost unit After this point both receivers show very different behavior with the shal-lower receiver showing smoothly varying conductivities that are about 1 Sm considered the normal valuefor unconsolidated sediments [Yuan and Edwards 2000] The deeper receiver measures large variations thatare related to changes in the second unit and thus caused by structural (lithological and porosity) changeswith areas related to larger conductivity values corresponding to areas of the thicker upper unit
523 Line 3As a whole line 3 (Figure 7) shows similar responses to those on the other lines collected The line startsoutside the basin where conductivities are relatively low As the instrument moved into the deepest part ofthe basin conductivities started to rise and 2 km from the beginning of the profile when crossing overpockmark 2 conductivities plateau within a very homogeneous area (2 km long) at about 125 Sm Thisarea is coincident with region C as noted in Figure 5 After this area conductivities decrease graduallytoward the north with the exception of a dome-like pattern of ca 3 km (feature X in Figure 7) althoughtoward the northern edge of the basin there is an area where conductivity anomalies decrease and displayhigher amplitude variations for the shallow receiver This section coincides with an area affected by gasescape features in the acoustic records (see pockmark cluster locations in Figure 1) The fairly parallel
160
170
Dep
th (
m)
LINE 2
08
09
10
Con
duct
ivity
(S
m)
0 1 2 3 4 5 6 7 8
Distance (km)
NW SE
Figure 6 EM line 2 showing conductivities colored according to receiver sensitivity depth (red 6 mbsf blue 20 mbsf) (top) Bathymetrymeasured from CTD sensor in EM system
Geochemistry Geophysics Geosystems 1010022013GC005108
GARCIA ET AL VC 2014 American Geophysical Union All Rights Reserved 877
distribution of conductivities measured by both receivers indicate that both are imaging similar geologicalfacies (composed of a number of layers) with downward decrease of porosity by sediment compaction
Unfortunately there was no shallow seismic data coincident with this profile but there is a reflection seis-mic line (DBS99_218) along an adjacent parallel track to the EM line The bottom plot of Figure 7 shows azoom in image of the first 350 ms of this seismic line DBS99_218 The plot shows the shallow stratigraphyof the study area down to some 70 mbsf (almost 200 mbsl) The top section of the basin shows a very dis-tinctive parallel layering in the unconsolidated sediments in the top 60 m section There is a channel-likefeature 80 m below the pockmark 2 area and coincident with the splay of the Skerryvore Fault This intervallargely correlates with area C generally characterized by high-conductivity values and low anomalies Inter-estingly two coincident negative conductivity anomalies are seen in both profiles in this area (from 6198 to6199 km) which correspond to the channel-like feature and that we interpret as possible gas migrationpathways (11) Perhaps one important observation is that the shallow stratigraphy remains near horizontaland parallel toward the North of the profile where the EM data show more variability This disparitybetween data sets as we will discuss later is likely caused by the presence of gas in sediments Unfortu-nately the conventional seismic data (Figure 7) do not have sufficient resolution in the shallower sections toshow any changes
524 Line ALine A (Figure 8) is the shortest profile of our survey It roughly follows a NS line across the basin about 15km west of line 3 and pockmark P2 (Figure 2) The conductivity profile along line A in the area where itcrosses line 1 shows an anomalous area located at about 15 km from the beginning of the profile which isalso seen along line 1 likely caused by the presence of the igneous intrusion According to the shallow EMreceiver (upper 6 m) this area is characterized by a sharp decrease in the conductivity (between 18 and 3in profile) which we interpret as a very large but shallow pockmark (about 1 km long by some 2 m depthexpression in bathymetry) which has been eroded and partially infilled by sediments The deeper EM
200
300TT
W (
ms)
250
350
6189 6190 6191 6192 6193 6194 6195 6196 6197 6198 6199 6200 6201 6202 6203
Northing (km)
09
10
11
12
Con
duct
ivity
(S
m)
6189 6190 6191 6192 6193 6194 6195 6196 6197 6198 6199 6200 6201 6202 6203
Northing (km)
P2PC
S N
X
Figure 7 (top) EM line 3 showing conductivities colored according to receiver sensitivity depth (red 6 mbsf blue 20 mbsf) (bottom) Top 350 ms from 2-D multichannel seismic reflec-tion profile DBS99_128 blue line indicates 40 ms TWT below the seafloor corresponding to some 20 mbsf depth Seismic data sampling rate of 1 ms The data were processed using pre-stack time migration and normalized stack Posteriorly it was band-pass filtered with low cut at 35 Hz and high cut at 309 Hz
Geochemistry Geophysics Geosystems 1010022013GC005108
GARCIA ET AL VC 2014 American Geophysical Union All Rights Reserved 878
170
180
190
Dep
th (
m)
LINE A
10
11
12
Con
duct
ivity
(S
m)
543210
Distance (km)
S NC
Figure 8 EM line A showing conductivities colored according to receiver sensitivity depth (red 6 mbsf blue 20 mbsf) (top) Bathymetrymeasured from CTD sensor in EM system
160
170
180
190
Dep
th (
m)
LINE B
09
10
11
12
Con
duct
ivity
(S
m)
0 1 2 3 4 5 6 7 8
Distance (km)
NW SE
P2
C
Figure 9 EM line B showing conductivities colored according to receiver sensitivity depth (red 6 mbsf blue 20 mbsf) (top) Bathymetrymeasured from CTD sensor in EM system
Geochemistry Geophysics Geosystems 1010022013GC005108
GARCIA ET AL VC 2014 American Geophysical Union All Rights Reserved 879
sensor shows a response similar to the one previously observed in lines crossing the large pockmark P2line 1 (Figure 5) although not as extensive (500 m wide between 27 and 32 km in profile) This area islocated immediately adjacent to the igneous anomaly described previously suggesting that the edges ofthe intrusion have been used as a path for fluid expulsion crossing sediment layers
We also identify the central area in the profile (22ndash31 km in profile) as corresponding to region C Here theconductivity data also show a complex structure and a drop of conductivity
525 Line BLine B (Figure 9) starts in the deepest part of the basin and follows a NW-SE direction reaching the MalinTerrace on the SE of the study area The conductivity profile along line B is typical of the Malin shelf Con-ductivities are high in the deepest part of the basin and decreases toward the basin edge The data suggesta well-preserved layering of the sediments except within the anomalous area associated with the magmaticintrusion and pockmark 2 Toward the end of the profile both conductivity curves separate indicating achange in facies as the instrument leaves the basin
As in previous profiles we can also identify region C in this profile (approximately from 2 to 4 km in the pro-file) with the same characteristics complex structure and a drop in conductivity from the surroundingvalues
526 Line CLine C (Figure 10) crosses the eastern side of the basin The conductivities recorded by both receivers startat around 09 Sm and follow a similar parallel trend This line displays an increasing trend of the conductiv-ity as the instrument moved northeastward into the basin corresponding to a decrease of the grain size(larger amounts of silt) in the sediments within the basin Toward the end of the profile the instrumentcrossed a large pockmark (feature P1 in Figures 2 and 10) Here the responses from both receivers show adrop in conductivity The bathymetry (Figure 10 top plot) indicates that along the crossing line pockmark 1(P1 in Figure 2) is composed of at least two fluid escape features this also corresponds to the two minimathat are observed on the shallow receiver
160
170
180 Dep
th (
m)
LINE C
09
10
11
12
13
Con
duct
ivity
(S
m)
0 1 2 3 4 5 6 7
Distance (km)
S N
P1
E D C
Figure 10 EM line C showing conductivities colored according to receiver sensitivity depth (red 6 mbsf blue 20 mbsf) (top) Bathymetrymeasured from CTD sensor in EM system
Geochemistry Geophysics Geosystems 1010022013GC005108
GARCIA ET AL VC 2014 American Geophysical Union All Rights Reserved 880
In this profile regions E D and C as they were defined in line 1 can also be seen In particular providing anextension to the NE of region C
53 Characterization of the Inner BasinBased on the conductivity sections extracted from the EM profiles we can define an inner basin within theMalin basin itself coincident with the area containing the majority of the large pockmarks associated withthe Skerryvore Fault (Figure 2) This region has been defined using primarily line 1 data but also lines 3 AB and C This inner basin is an elongated feature running from the SW to the NE with a width of 2ndash4 kmOur data are unable to constrain its length but it is likely at least several kilometers long (Figure 11) Thisinner basin is marked by a gentle increase of conductivities around the edges The interior of this innerbasin is marked by a drop in conductivities displaying homogeneous values disrupted only by anomaliesmarking the presence of edges of pockmarks or subsurface gas accumulation (Figures 5 and 7ndash10) This fea-ture was termed the Malin Deep micro basin in Szpak et al [2012] but since in the present work we canmap its extension to a few kilometers we prefer to call it the inner basin
The above mentioned drop in conductivity values within the pockmark is confirmed by sediment core anal-ysis results (Tables 1 and 2 and Figures 3 and 4) The main difference observed between both cores is thatcore CE08_044 (outside the pockmark) shows according to physical properties logs distinct stratigraphicunits whilst core CE08_045 (inside the pockmark) shows no layering and very homogeneous physical prop-erties Furthermore the analysis shows that outside the pockmark (core CE08_044 Table 1) the mean grainsize is on average coarser than within the pockmark (core CE08_045 Table 2) by 36 clay content is lower(3 versus 13) and there is a lower degree of sorting (15 versus 23)
The inner basin region (region C Figures 5 and 7ndash10) has been defined from EM conductivity valuesalthough analyses of the cores confirm changes in the homogeneity of sediments This inner basin includes
10
11
12
Conductivity (S
m)550 551 552 553 554 555 556
Easting (km)
G
G
G
P
SP P2
16 m
16 m
16 mL181
L182
L183
BR
W E
1000 m
L181
L183
L182
Figure 11 Gas anomalies in the central part of the basin as observed in the EM (line 1) and 3 parallel shallow seismic lines (181 182 and 183) The enhanced reflectors interpreted asgas accumulation facies (G) are present in the three parallel lines and coincide with the edges of the EM gassy region (C) SP is a small pockmark see also Figure 5 BR refers to a brightreflector interpreted as a magmatic intrusion
Geochemistry Geophysics Geosystems 1010022013GC005108
GARCIA ET AL VC 2014 American Geophysical Union All Rights Reserved 881
the area affected by pockmarks but the changes are not inherent to the pockmark area but are presentthroughout The inner basin is also the area more affected by pockmarks [Monteys et al 2008] and can beassociated with the Skerryvore Fault The largest geophysical differentiation in this inner basin is found inthe superficial part as the shallow EM receiver is more affected than the deeper one In general this area ischaracterized by reduced and more irregular conductivity values
Figure 11 shows SBP (subbottom profiler) lines 181 182 and 183 together with EM Line 1 (see also Figure 2for geographical location) The most striking feature on these plots is the area with gas accumulation coin-cident with the inner basin anomalous conductivity response (region C) This feature runs in a WSW-ENEdirection and correlates well with the inferred position of the Skerryvore Fault (Figure 2) The seismic reflec-tion line DBS99_128 (Figure 7) delineates the North-South extend of region C marked by the presence of achannel-like feature which is limited to the central part of the basin and is not a regional feature
6 Discussion
The EM data show an increase in conductivity toward the center of the Malin basin that suggests higherporosities within sediments We interpret this as the regional trend within the Malin basin Across the basinthe EM data show numerous anomalies that are associated with the presence of gas or freshwater alsoseen in the shallow seismic records (see Figure 11) Core sample analysis confirms differences in sedimentcomposition inside and outside of the pockmark The central part of the basin is characterized by a NE-SWelongated conductive anomaly which is defined by a sharp decrease in the conductivity with respect to theadjacent areas of the basin This anomalous conductivity region correlates well with the NE-SW surfaceexpression of the Skerryvore Fault and fluid escape features observed in the acoustic records
Local high-conductivity anomalies in the vicinity of the pockmarks could have been caused by gas-fueledincrease in microbial activity [Szpak et al 2012] as it has been shown that such activity can affect geo-electrical properties of sediments [Atekwana et al 2004 Abdel Aal et al 2010] (see for example in Figure 5the area located under pockmark 2) Szpak et al [2012] show geochemical signatures of microbial activityfrom analysis of the cores also used in this work Similar local anomalies have been observed in several ofthe EM lines and are confirmed by crossovers Although the geochemical evidence points toward microbialactivity some of these anomalies could also be caused by changes in sediment permeability resulting fromfluid flow
In particular 1 km West of pockmark 2 (Figure 5) there is an area of enhanced reflectivity that we interpretas presence of gas in the strata which corresponds to an increase of conductivities in the 40 m (deeper)receiver As mentioned earlier the expected response of the EM system to the presence of gas is the oppo-site Geochemical analysis of the core in this area [Szpak et al 2012] shows evidence of microbial activitywhich can affect the conductivity of sediments as mentioned above
According to Judd and Hovland [2007] while the initial pockmark formation has a blowout like characteris-tic later fluid migration is likely to use already existing pathways More recent studies [Hovland et al 2010]suggest that fluids escape gradually while the reservoir is charging Once the gas in the reservoir is suffi-cient overpressured it will push through the geological seal The acoustic data in Figure 5 show areas ofblanking or interruption of the layering from the surrounding areas under the pockmark this has beeninterpreted as the result of sediment mixing and of pockmark formation The meaning of this vertical acous-tic blanking is still poorly understood and widely debated [Judd and Hovland 2007] This is also observed inthe core analysis (Tables 1 and 2 and Figures 3 and 4) where the core taken from within the pockmarkshows a more homogeneous layering in comparison to the core from outside the pockmark where a dis-tinct layering is observed
Core data analysis from outside the pockmark (core CE08_044 Figure 3 and Table 1) shows a well-preservedlayering with a sand-rich unit between 15 and 3 mbsf The conductivity in this region (see Figure 5) as meas-ured by the shallow EM receiver is low compared to values obtained elsewhere within the basin The core insidethe pockmark (core CE08_045 Figure 4 and Table 2) shows nonlayered sedimentary structure with no apparentsediment grain size gradients typical of reworked material and the EM data show a regional trend in conductiv-ity (Figures 5 7 and 9) Apparent conductivities are larger than outside the pockmark Szpak et al [2012] haveassociated the increase in conductivity within the pockmark with bacterial activity These observations suggest
Geochemistry Geophysics Geosystems 1010022013GC005108
GARCIA ET AL VC 2014 American Geophysical Union All Rights Reserved 882
that there is a large amount of gas in the sediments of the basin but within the pockmarks (1) gas has escapedand sediments have been disturbed thus increasing the porosity and (2) there is a higher level of bacterialactivity Both of these phenomena can explain the difference in conductivity between the pockmark and thebasin Additionally shallow structures in the SBP data (Figures 5 and 11) are more disturbed than the deeperparts possibly indicating that gas has accumulated in the upper strata
The edges of the pockmark are associated with narrow positive conductive anomalies Newman et al [2008]have pointed out that methane venting from a large pockmark in the Atlantic coast of the United Statesoccurs along the upper parts of the pockmark walls and is not occurring through the floor of the pockmarkChatterjee et al [2011] report that increased fluid flux and deep source methane input result in enhancedconcentrations of hydrate and free gas that accumulate on areas of larger porosity With the help of allthese observations we can interpret the conductivity anomalies observed across pockmarks The internalpart of the pockmark has a decrease of conductivity because of the presence of gas and the more heteroge-neous structure of the sediments As sedimentation is responsible for deposition of organic material vent-ing provides chemical energy in areas of active seeping microbial communities thrive [Jrgensen andBoetius 2007] While the walls of the pockmark constitute pathways for fluid release and hence likely havehigher permeability and porosity from disturbed sediments and therefore higher conductivity we believethat this location is also where most microbial activity concentrates Following the results of Atekwana et al[2004] there is probably an added increase of the conductivity associated with this microbial activityalthough a detailed ground-truthing study would be required to assess this At the same time around thesewalls there is an accumulation of free gas that causes a conductivity decrease
Not all the conductivity anomalies caused by presence of gas are the same Large pockmarks appear assharp conductivity anomalies (positive in the walls and negative in the center) and gas charged areas dis-play a large regional trend This is clearly observed in line C (Figure 10) as the instrument enters the basinboth measurements of conductivity rise until the instruments entered a pockmark Sediments charged withgas should generally show a decrease in their conductivity as has been seen elsewhere [Hsu et al 2014]The results shown in Figure 10 can be interpreted as a (1) change in sediment facies with coarser sands out-side the basin and finer muddy sediments in the interior [Monteys et al 2008] (2) in certain locations thepresence of microbial activity that is known to increase the conductivity of sediments [Atekwana et al2004] and (3) caused by the water influx as gas has been released refilling sediment pores [Sultan et al2011] which will cause an increase of conductivity as the resistive phase (gas) is removed from sedimentsIn the case of a change in facies we need to consider that gas will be very well distributed in sand withinthe matrix decreasing the effective conductivity of sediments but in the case of mud with higher perme-ability gas is trapped in layers and is not as effective at decreasing the overall conductivity
The upper section (top meter) combined results of the grain size and physical properties descriptors on thetwo cores suggest that part or most of the surface material within the pockmark has been reworked possi-bly as a consequence of pockmark formation [Judd and Hovland 2007] Commonly during formation pock-marks are left with so-called lag deposit which is usually coarser than surrounding seabed This is due to thefines being suspended in the water column during ventingblowout and carried away from the site by cur-rents while coarse particulates with lower sedimentation rates are deposited [Judd and Hovland 2007] Asecond plausible mechanism topographic depressions can act as sediment traps retaining the coarser frac-tion while fine grains remain suspended in the water column Both of these mechanisms are not exclusivesand can act at times simultaneously
While the general electrical properties of the basin are controlled by grain size region C (the inner basin inMalin) has a very distinct electrical signature which from the evidence in the conductivity anomalies theSBP profiles and ground truthing is marked by the presence of fluids most likely gas and water released bysediment compaction
The EM line 3 which crosses the entire basin from South to North shows the largest conductivity variations(Figure 7) The Northern part (feature X) has large conductivity anomalies that correlate with presence ofgas enhanced reflectors and a high density of pockmarks in coarser sediments indicating fluid escape Fol-lowing the results we have observed in other areas of the Malin Sea it seems that microbial activity is thecause of this enhanced conductivity Without a more thorough ground truthing we cannot ascertain theextent of possible microbial activity
Geochemistry Geophysics Geosystems 1010022013GC005108
GARCIA ET AL VC 2014 American Geophysical Union All Rights Reserved 883
7 Conclusions
The general trend of the EM survey across the basin shows a gradual increase of conductivity toward thecentral and deepest part of the basin Shallow seismic profiles and MBES observations also reflect sedimen-tary changes across the basin in a fairly homogenous sediment stratum
Electromagnetic surveys across the Malin Basin show a number of conductivity anomalies associated withthe presence of gas charged sediments in the upper strata These anomalies consist in a general increase inconductivity over the areas with a higher density of gas reflectors and with local sharp increments (peaks)This correlates well with gas related echo facies as observed in the sub bottom records
Although the observation of higher conductivities with highest volumes of gas seems counter intuitive thegeophysical signatures correspond to changes in sediment grain size ranging from fairly homogeneoussands to clays indicating changes in porosity control the conductivity rather that gas
There are EM signatures that appear as positive anomaly changes in conductivity compared to the sur-rounding trend These have been observed both as local peaks and also as kilometer long high-conductivity anomalies We interpret these anomalies as fluid accumulation parallel to the strata which arewell correlated to enhanced amplitude reflectors in the subbottom profiler records
There are some local anomalies characterized by short intervals of lower conductivity which could eitherbe caused by gas associated with vertical migration pathways or local disruption of the shallow strata pro-duced by fluid disturbance While the former shows the expected conductivity response decrease causedby the presence of free gas in sediments the latter would be related to a decrease due to the layer disconti-nuity as observed in the shallow seismic records
The areas corresponding to the pockmark depression are characterized in general by high-conductivitypeaks at the edges while inside the unit the conductivity drops and is fairly homogeneous as well as in thevicinity of the pockmark The lower conductivity values across the pockmark depression are found insidethe unit pockmarks Sediment core data suggests that within the two pockmark units studied certain stratashow evidence of increased microbial activity [Szpak et al 2012] which in turn can increase bulk electricalconductivities as pointed out by Atekwana et al [2004]
ReferencesAbdel Aal G Z E A Atekwana and E A Atekwana (2010) Effect of bioclogging in porous media on complex conductivity signatures
J Geophys Res 115 G00G07 doi1010292009JG001159Anderson A L and L D Hampton (1980) Acoustics of gasndashbearing sediments I Background J Acoust Soc Am 67(6) 1865ndash1889 doi
1011211384453Archie G E (1942) The electrical resistivity log as an aid in determining some reservoir characteristics Trans Am Inst Min Metal Eng
146 54ndash67Atekwana E A D D J Werkema J W Duris S Rossbach E A Atekwana W A Sauck D P Cassidy J Means and F D Legall (2004) In-
situ apparent conductivity measurements and microbial population distribution at a hydrocarbon-contaminated site Geophysics 69(1)56ndash63 doi10119011649375
Beuroorner J H V Herdegen J-U Repke and K Spitzer (2013) The impact of CO2 on the electrical properties of water bearing porous mediaLaboratory experiments with respect to carbon capture and storage Geophys Prospect 61(s1) 446ndash460 doi101111j1365-2478201201129x
Chatterjee S G Gu W G Chapman G J Hirasaki G Bhatnagar B Dugan and G R Dickens (2011) Effects of heterogeneous lithologyand focused fluidflow on gas hydrate distribution in marine sediments paper presented at 7th International Conference on GasHydrates (ICGH 2011) Scotland U K
Cheesman S J (1989) A Short Baseline Transient Electromagnetic Method for Use on the Sea Floor edited by S J Cheesman Univ ofToronto Dep of Phys Geophys Lab Toronto Ontario
Cheesman S J L K Law and B St Louis (1993) A porosity mapping survey in Hecate Strait using a seafloor electro-magnetic profilingsystem Mar Geol 110(3ndash4) 245ndash256 doi1010160025-3227(93)90087-C
Dobson M R and D Evans (1974) Geological structure of the Malin Sea J Geol Soc London 130(5) 475ndash478 doi101144gsjgs13050475Dobson M R and R J Whittington (1992) Aspects of the geology of the Malin Sea area Geol Soc Spec Publ 62(1) 291ndash311 doi101144
GSLSP19920620123Dorschel B A Wheeler X Monteys and K Verbrugge (2011) Atlas of the Deep-Water Seabed Ireland Springer LondonDunlop P R Shannon M McCabe and R Quinn (2010) Marine geophysical evidence for ice sheet extension and recession on the Malin
Shelf New evidence for the western limits of the British Irish Ice Sheet Mar Geol 276(1ndash4) 86ndash99 doi101016jmargeo201007010Evans D R J Whittington and M R Dobson (1985) Tiree Solid Geology 1250000 Scale (map) (Institute of Geological Sciences) British
Geological Survey Nottingham (UK)Evans R L (2001) Measuring the shallow porosity structure of sediments on the continental shelf A comparison of an electromagnetic
approach with cores and acoustic backscatter J Geophys Res 106(C11) 27047ndash27060 doi1010292000JC000487Evans R L (2007) Using CSEM techniques to map the shallow section of seafloor From the coastline to the edges of the continental slope
Geophysics 72(2) WA105 doi10119012434798
AcknowledgmentsWe wished to thank the GeologicalSurvey of Ireland the IntegratedMapping for the Sustainable Develop-ment of Irelandrsquos Marine Resources(INFOMAR) program the PetroleumAffairs Division (PAD) and the DublinInstitute for Advanced Studies forfunding this study Thanks to PAD forgranting access to the multichannelseismic line DBS99_128 Jim Brodafrom the Woods Hole OceanographicInstitution kindly provided the gravitycorer We would also like to thankBrian Kelleher and DCU for access tothe geochemistry lab Some plots havebeen realized using the GMT package[Wessel and Smith 1991] Commentsby Editor Cyn-Ty Lee and reviewersMads Huuse and Katryn Schwalenbergare greatly appreciated This work isalso supported by a research grantfrom the Spanish Ministry of Scienceand Innovation (CTM2011-30400-C02-02)
Geochemistry Geophysics Geosystems 1010022013GC005108
GARCIA ET AL VC 2014 American Geophysical Union All Rights Reserved 884
Evans R L and D Lizarralde (2003) Geophysical evidence for karst formation associated with offshore groundwater transport An exam-ple from North Carolina Geochem Geophys Geosyst 4(8) 1069 doi1010292003GC000510
Evans R L L K Law B St Louis S J Cheesman and K Sananikone (1999) The shallow porosity structure of the Eel shelf northern Califor-nia Results of a towed electromagnetic survey Mar Geol 154(1ndash4) 211ndash226 doi101016S0025-3227(98)00114-5
Fleischer P T Orsi M Richardson and A Anderson (2001) Distribution of free gas in marine sediments A global overview Geo Mar Lett21 103ndash122 doi101007s003670100072
Floodgate G and A Judd (1992) The origins of shallow gas Cont Shelf Res 12(10) 1145ndash1156 doi1010160278-4343(92)90075-UFonseca L L Mayer D Orange and N W Driscoll (2002) The high-frequency backscattering angular response of gassy sediments Model
data comparison from the Eel River Margin California J Acoust Soc Am 111(6) 2621ndash2631 doi10112111471911Garcia X X Monteys R L Evans and B Kelleher (2007) Geohazard identification and early reconnaissance for hydrocarbon potential
using marine electromagnetic and high frequency acoustic methods Geophys Res Abstr 9 09524 16ndash20 SRef-ID 1607-7962graEGU2007-A-09524
Hovland M (1984) Gas-induced erosion features in the north sea Earth Surf Processes Landforms 9 209ndash228Hovland M and A Judd (1988) Seabed Pockmark and Seepages Impact on Geology Biology and the Marine Environment 293 pp Graham
and Trotman LondonHovland M R Heggland M De Vries and T Tjelta (2010) Unit-pockmarks and their potential significance for predicting fluid flow Mar
Pet Geol 27(6) 1190ndash1199 doi101016jmarpetgeo201002005Hsu S K C-W Chiang R L Evans C-S Chen S-D Chiu Y-F Ma S-C Chen C-H Tsai S-S Lin and Y Wang (2014) Marine controlled
source EM method used for the gas-hydrate investigation in the area off SW Taiwan J Asian Earth Sci doi101016jjseaes201312001in press httpwwwsciencedirectcomsciencearticlepiiS1367912013006202
Jackson P D D T Smith and P N Stanford (1978) Resistivityndashporosityndashparticle shape relationships for marine sands Geophysics 43(6)1250ndash1268 doi10119011440891
Jackson P D R C Flint and K B Briggs (1998) Two- and three-dimensional heterogeneity in carbonate sediments using resistivity imag-ing J Acoust Soc Am 104(3) 1812ndash1812 doi1011211423422
Jrgensen B B and A Boetius (2007) Feast and faminemdashMicrobial life in the deep-sea bed Nat Rev Microbiol 5(10) 770ndash781 doi101038nrmicro1745
Josenhans H W L H King and G B Fader (1978) A side-scan sonar mosaic of pockmarks on the Scotian shelf Can J Earth Sci 15(5)831ndash840 doi101139e78-088
Judd A and M Hovland (2007) Seabed Fluid Flow The Impact on Geology Biology and the Marine Environment 492 pp Cambridge UnivPress Cambridge UK
King L H and B MacLean (1970) Pockmarks on the Scotian Shelf Geol Soc Am Bull 81(10) 3141 doi1011300016-7606(1970)81[3141POTSS]20CO2
Kvenvolden K A and B W Rogers (2005) Gaiarsquos breathmdashGlobal methane exhalations Mar Pet Geol 22(4) 579ndash590 doi101016jmarpetgeo200408004
Milkov A V (2000) Worldwide distribution of submarine mud volcanoes and associated gas hydrates Mar Geol 167(1ndash2) 29ndash42 doi101016S0025ndash3227(00)00022-0
Minshull T A G K Westbrook K A Weitemeyer M C Sinha B K Goswami and B Marsset (2012) Leaking Methane Reservoirs OffshoreSvalbard Eos Trans AGU 93(42) 413ndash414 doi101029eost2012EO42
Monteys X D Hardy E Doyle and S Garcia-Gil (2008) Distribution morphology and acoustic characterisation of a gas pockmark field onthe Malin Shelf NW Ireland paper presented at OSP-01 General Contributions to Marine Geoscience and Paleoceanography Sympo-sium Int Geol Congr Oslo
Meurouller H T von Dobeneck W Nehmiz and K Hamer (2011) Near-Surface EM rock-magnetic and geochemical fingerprinting of submar-ine freshwater seepage at Eckernfeuroorde bay Geo Mar Lett 31(2) 123ndash140 doi101007s00367-010-0220-0
Newman K R et al (2008) Active methane venting observed at giant pockmarks along the US mid-Atlantic shelf break Earth Planet SciLett 267(1ndash2) 341ndash352 doi101016jepsl200711053
Parnell J (1992) Burial histories and hydrocarbon source rocks on the North West Seaboard Geol Soc Spec Publ 62(1) 3ndash16 doi101144GSLSP19920620102
Ren S R Y Liu Y Liu and W Zhang (2010) Acoustic velocity and electrical resistance of hydrate bearing sediments J Pet Sci Eng 70(1ndash2) 52ndash56 doi101016jpetrol200909001
Rice D D and G E Claypool (1981) Generation accumulation and resource potential of biogenic gas AAPG Bull 65(1) 5ndash25Riddihough R (1968) Magnetic surveys off the north coast of ireland Proc R Irish Acad 66 27ndash41Schubel J R (1974) Effects of tropical storm agnes on the suspended solids of the northern chesapeake bay in Suspended Solids in Water
Mar Sci vol 4 edited by R Gibbs pp 113ndash132 Springer US doi101007978-1-4684ndash8529-5_8Schwalenberg K E Willoughby R Mir and R N Edwards (2005) Marine gas hydrate electromagnetic signatures in Cascadia and their cor-
relation with seismic blank zones First Break 23 57ndash63Sills G C and S J Wheeler (1992) The significance of gas for offshore operations Cont Shelf Res 12(10) 1239ndash1250 doi1010160278-
4343(92)90083-VSultan N et al (2011) Dynamics of fault-fluid-hydrate system around a shale-cored anticline in deepwater Nigeria J Geophys Res 115
B08101 doi1010292011JB008218Szpak M T X Monteys S OrsquoReilly A J Simpson X Garcia R L Evans C C R Allen D J McNally D Courtier-Murias and B P Kelleher
(2012) Geophysical and geochemical survey of a large marine pockmark on the Malin Shelf Ireland Geochem Geophys Geosyst 13Q01011 doi1010292011GC003787
Taylor D (1992) Nearshore shallow gas around the UK coast Cont Shelf Res 12(10) 1135ndash1144 doi1010160278-4343(92)90074-TWessel P and W H F Smith (1991) Free software helps map and display data Eos Trans AGU 72 441ndash446Wilkens R and M Richardson (1998) The influence of gas bubbles on sediment acoustic properties In situ laboratory and theoretical
results from Eckernfeuroorde bay Germany Cont Shelf Res 18 1859ndash1892Wilt M and D Alumbaugh (1998) Electromagnetic methods for development and production State of the art Leading Edge 17(4) 487ndash
487Yuan F J D Bennell and A M Davis (1992) Acoustic and physical characteristics of gassy sediments in the western Irish Sea Cont Shelf
Res 12(10) 1121ndash1134 doi1010160278ndash4343(92)90073-SYuan J and R N Edwards (2000) The assessment of marine gas hydrates through electrical remote sounding Hydrate without a BSR
Geophys Res Lett 27(16) 2397ndash2400 doi1010292000GL011585
Geochemistry Geophysics Geosystems 1010022013GC005108
GARCIA ET AL VC 2014 American Geophysical Union All Rights Reserved 885
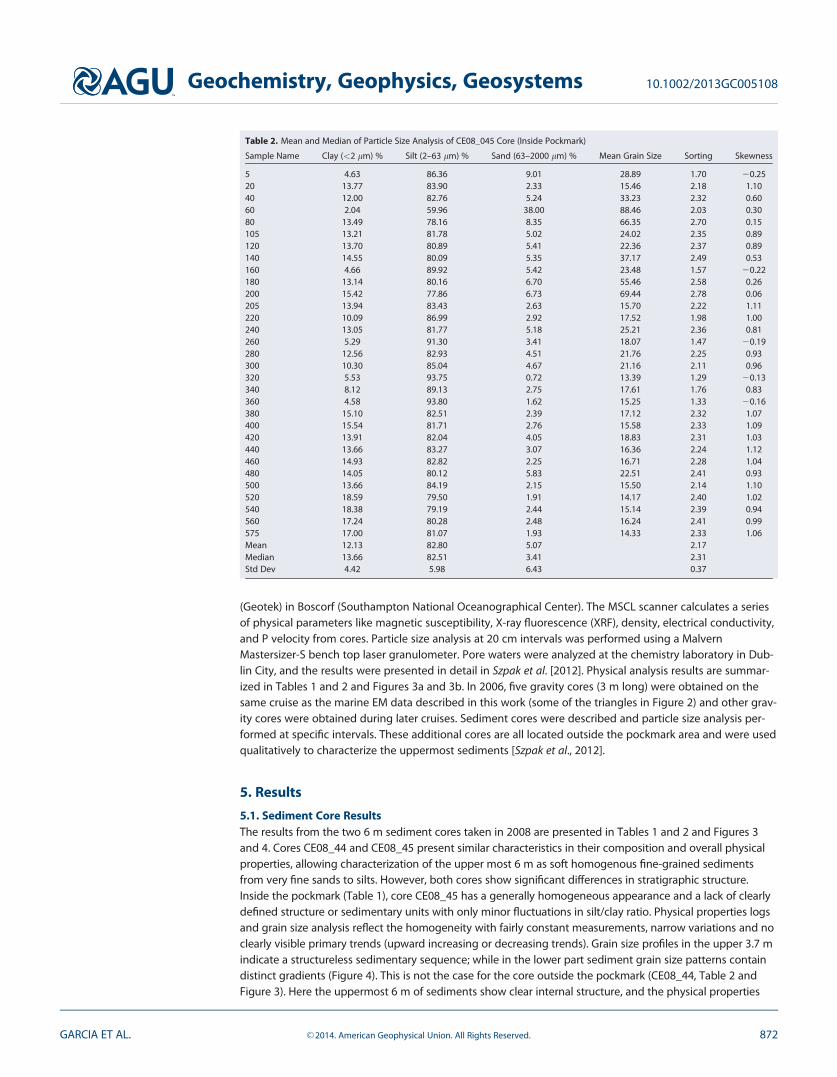
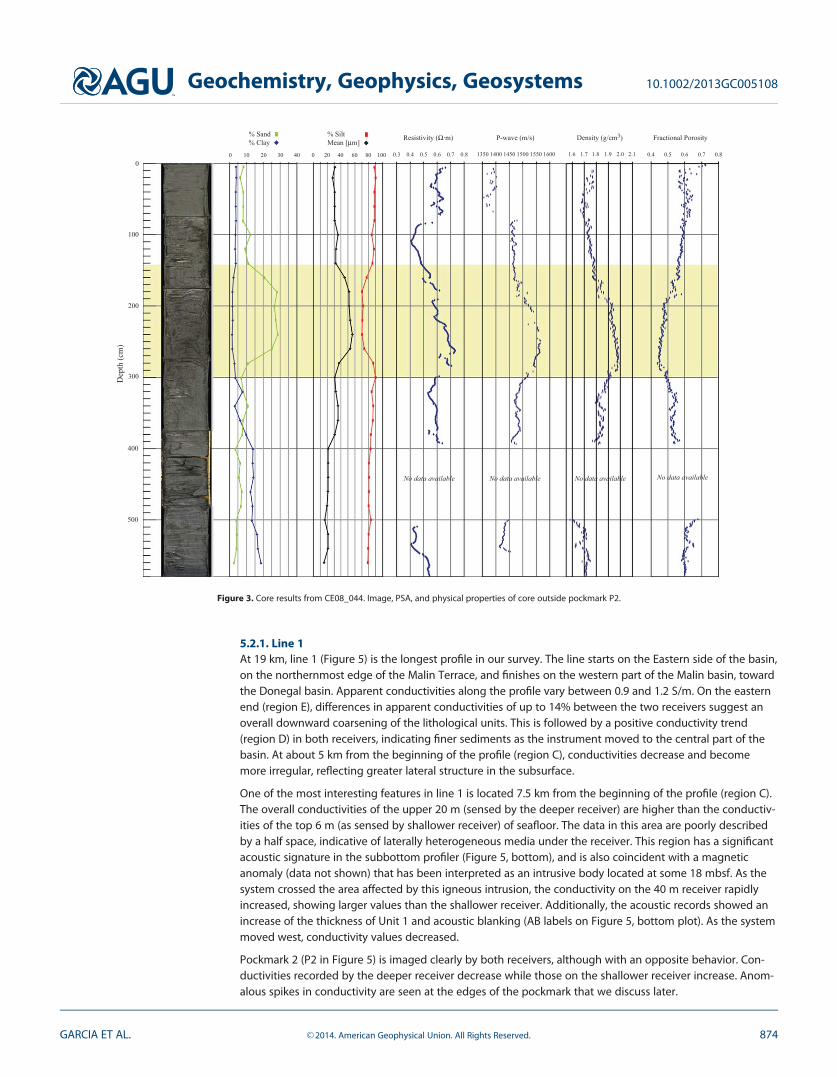
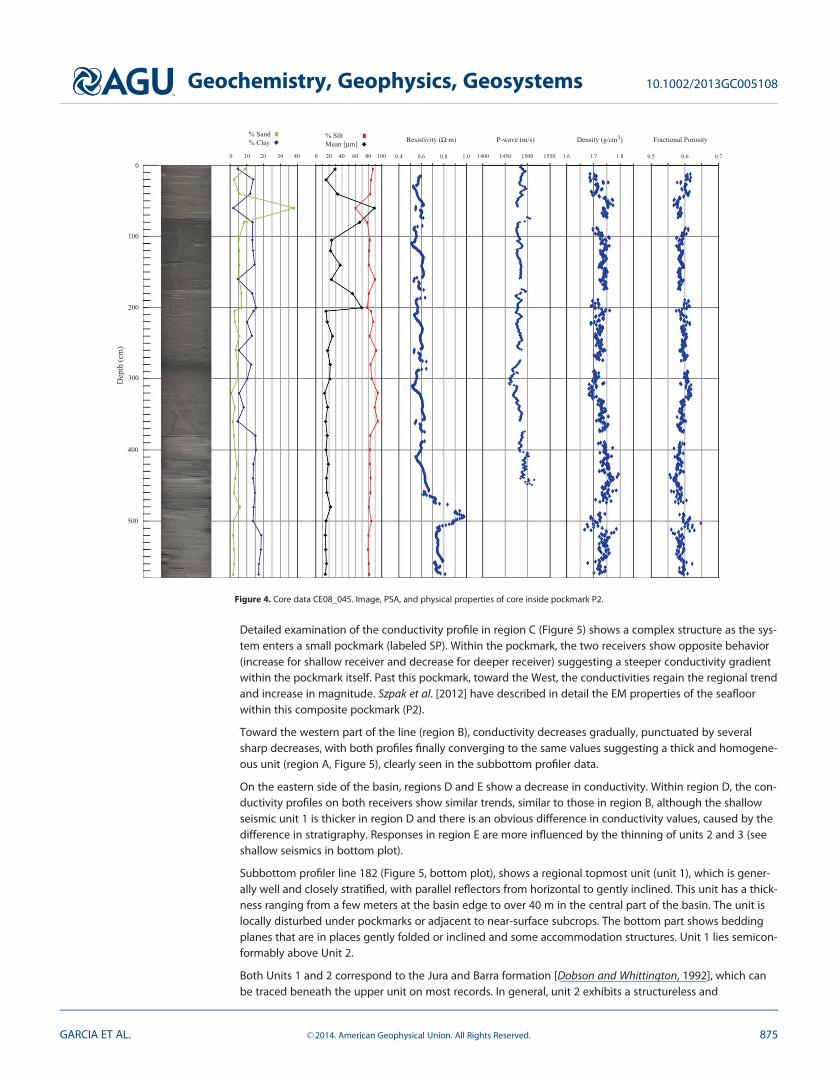
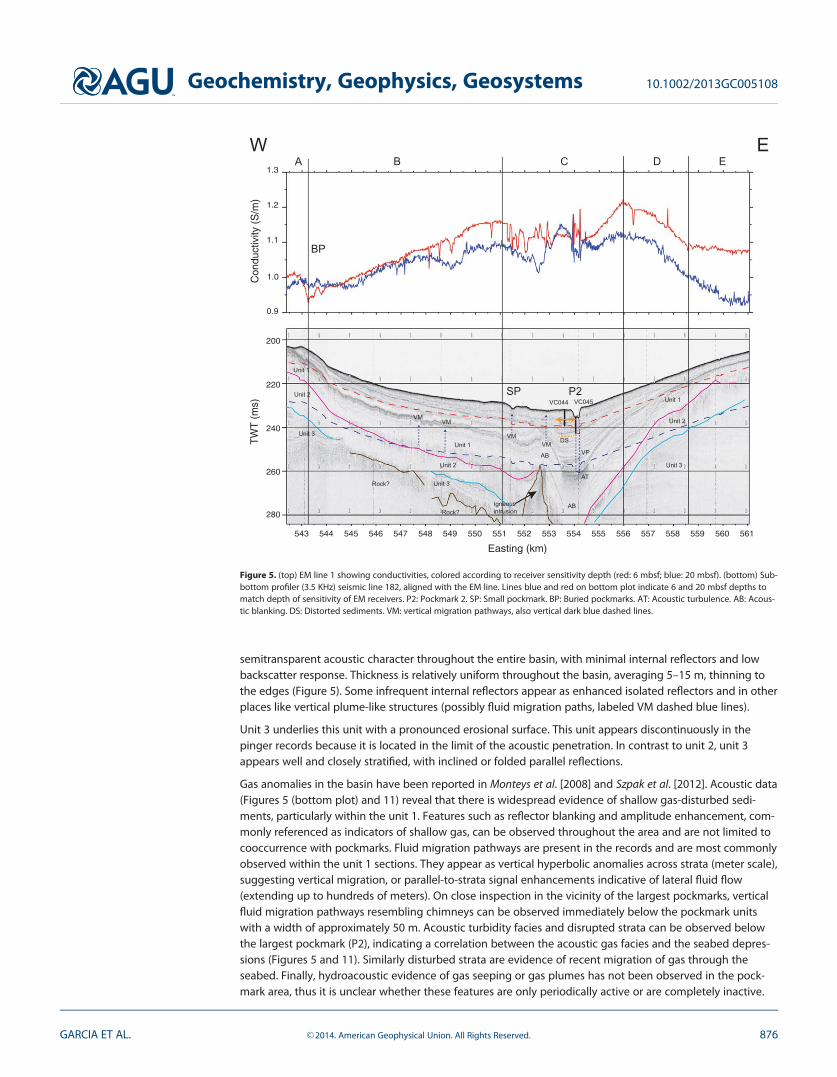
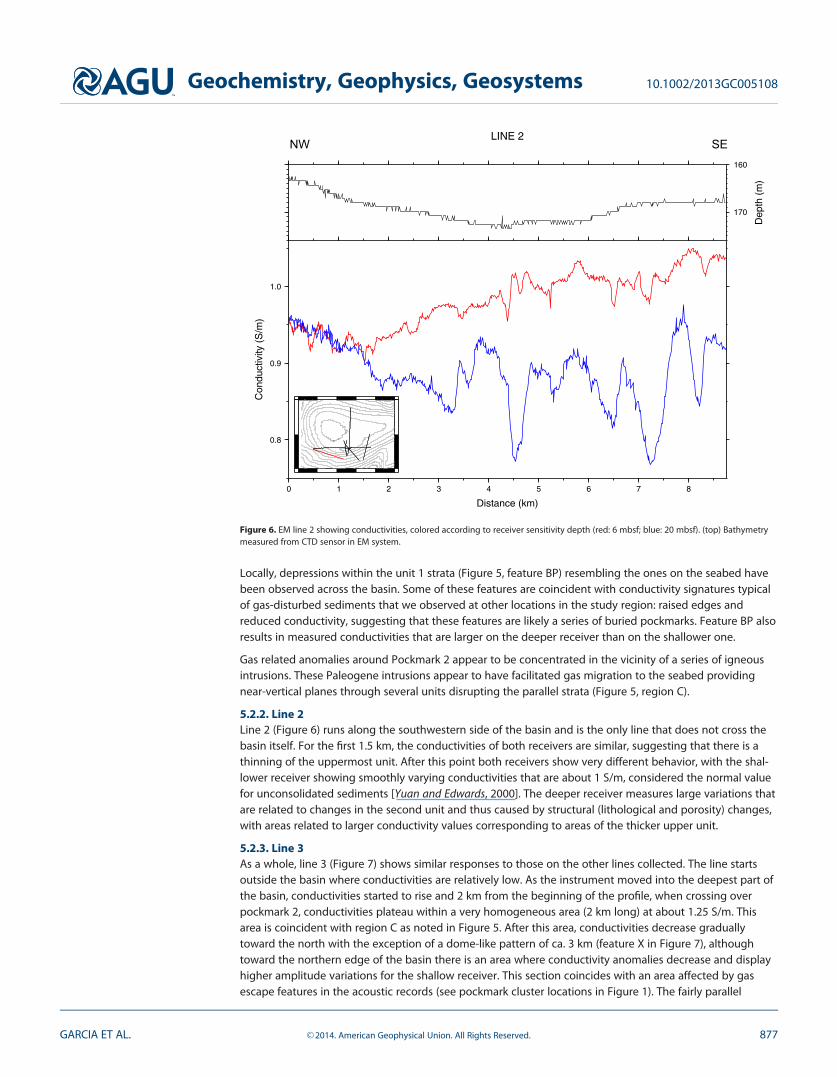
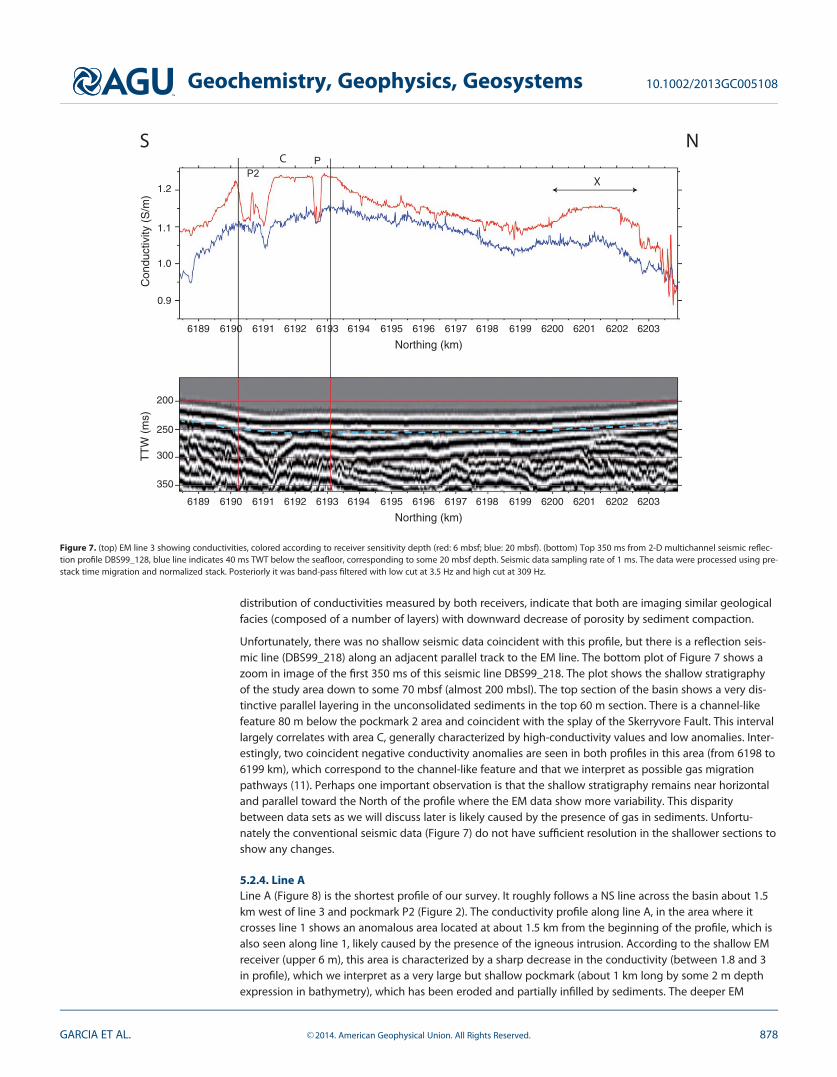
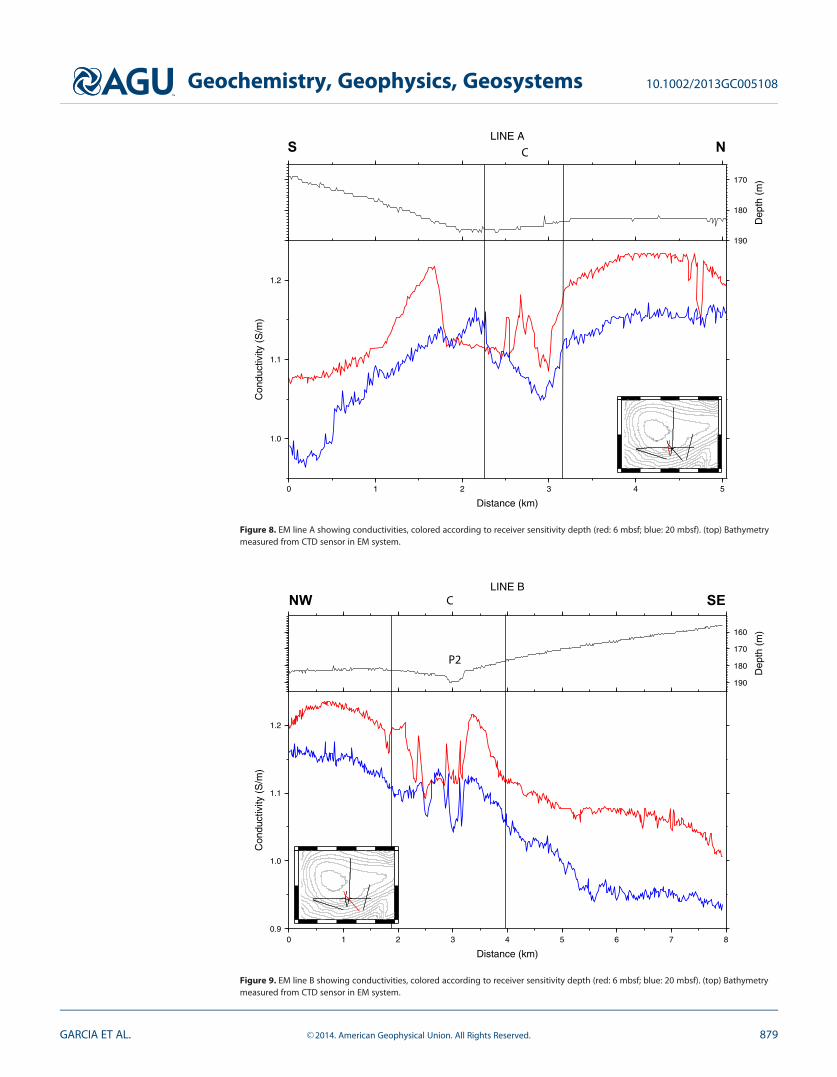
170
180
190
Dep
th (
m)
LINE A
10
11
12
Con
duct
ivity
(S
m)
543210
Distance (km)
S NC
Figure 8 EM line A showing conductivities colored according to receiver sensitivity depth (red 6 mbsf blue 20 mbsf) (top) Bathymetrymeasured from CTD sensor in EM system
160
170
180
190
Dep
th (
m)
LINE B
09
10
11
12
Con
duct
ivity
(S
m)
0 1 2 3 4 5 6 7 8
Distance (km)
NW SE
P2
C
Figure 9 EM line B showing conductivities colored according to receiver sensitivity depth (red 6 mbsf blue 20 mbsf) (top) Bathymetrymeasured from CTD sensor in EM system
Geochemistry Geophysics Geosystems 1010022013GC005108
GARCIA ET AL VC 2014 American Geophysical Union All Rights Reserved 879
sensor shows a response similar to the one previously observed in lines crossing the large pockmark P2line 1 (Figure 5) although not as extensive (500 m wide between 27 and 32 km in profile) This area islocated immediately adjacent to the igneous anomaly described previously suggesting that the edges ofthe intrusion have been used as a path for fluid expulsion crossing sediment layers
We also identify the central area in the profile (22ndash31 km in profile) as corresponding to region C Here theconductivity data also show a complex structure and a drop of conductivity
525 Line BLine B (Figure 9) starts in the deepest part of the basin and follows a NW-SE direction reaching the MalinTerrace on the SE of the study area The conductivity profile along line B is typical of the Malin shelf Con-ductivities are high in the deepest part of the basin and decreases toward the basin edge The data suggesta well-preserved layering of the sediments except within the anomalous area associated with the magmaticintrusion and pockmark 2 Toward the end of the profile both conductivity curves separate indicating achange in facies as the instrument leaves the basin
As in previous profiles we can also identify region C in this profile (approximately from 2 to 4 km in the pro-file) with the same characteristics complex structure and a drop in conductivity from the surroundingvalues
526 Line CLine C (Figure 10) crosses the eastern side of the basin The conductivities recorded by both receivers startat around 09 Sm and follow a similar parallel trend This line displays an increasing trend of the conductiv-ity as the instrument moved northeastward into the basin corresponding to a decrease of the grain size(larger amounts of silt) in the sediments within the basin Toward the end of the profile the instrumentcrossed a large pockmark (feature P1 in Figures 2 and 10) Here the responses from both receivers show adrop in conductivity The bathymetry (Figure 10 top plot) indicates that along the crossing line pockmark 1(P1 in Figure 2) is composed of at least two fluid escape features this also corresponds to the two minimathat are observed on the shallow receiver
160
170
180 Dep
th (
m)
LINE C
09
10
11
12
13
Con
duct
ivity
(S
m)
0 1 2 3 4 5 6 7
Distance (km)
S N
P1
E D C
Figure 10 EM line C showing conductivities colored according to receiver sensitivity depth (red 6 mbsf blue 20 mbsf) (top) Bathymetrymeasured from CTD sensor in EM system
Geochemistry Geophysics Geosystems 1010022013GC005108
GARCIA ET AL VC 2014 American Geophysical Union All Rights Reserved 880
In this profile regions E D and C as they were defined in line 1 can also be seen In particular providing anextension to the NE of region C
53 Characterization of the Inner BasinBased on the conductivity sections extracted from the EM profiles we can define an inner basin within theMalin basin itself coincident with the area containing the majority of the large pockmarks associated withthe Skerryvore Fault (Figure 2) This region has been defined using primarily line 1 data but also lines 3 AB and C This inner basin is an elongated feature running from the SW to the NE with a width of 2ndash4 kmOur data are unable to constrain its length but it is likely at least several kilometers long (Figure 11) Thisinner basin is marked by a gentle increase of conductivities around the edges The interior of this innerbasin is marked by a drop in conductivities displaying homogeneous values disrupted only by anomaliesmarking the presence of edges of pockmarks or subsurface gas accumulation (Figures 5 and 7ndash10) This fea-ture was termed the Malin Deep micro basin in Szpak et al [2012] but since in the present work we canmap its extension to a few kilometers we prefer to call it the inner basin
The above mentioned drop in conductivity values within the pockmark is confirmed by sediment core anal-ysis results (Tables 1 and 2 and Figures 3 and 4) The main difference observed between both cores is thatcore CE08_044 (outside the pockmark) shows according to physical properties logs distinct stratigraphicunits whilst core CE08_045 (inside the pockmark) shows no layering and very homogeneous physical prop-erties Furthermore the analysis shows that outside the pockmark (core CE08_044 Table 1) the mean grainsize is on average coarser than within the pockmark (core CE08_045 Table 2) by 36 clay content is lower(3 versus 13) and there is a lower degree of sorting (15 versus 23)
The inner basin region (region C Figures 5 and 7ndash10) has been defined from EM conductivity valuesalthough analyses of the cores confirm changes in the homogeneity of sediments This inner basin includes
10
11
12
Conductivity (S
m)550 551 552 553 554 555 556
Easting (km)
G
G
G
P
SP P2
16 m
16 m
16 mL181
L182
L183
BR
W E
1000 m
L181
L183
L182
Figure 11 Gas anomalies in the central part of the basin as observed in the EM (line 1) and 3 parallel shallow seismic lines (181 182 and 183) The enhanced reflectors interpreted asgas accumulation facies (G) are present in the three parallel lines and coincide with the edges of the EM gassy region (C) SP is a small pockmark see also Figure 5 BR refers to a brightreflector interpreted as a magmatic intrusion
Geochemistry Geophysics Geosystems 1010022013GC005108
GARCIA ET AL VC 2014 American Geophysical Union All Rights Reserved 881
the area affected by pockmarks but the changes are not inherent to the pockmark area but are presentthroughout The inner basin is also the area more affected by pockmarks [Monteys et al 2008] and can beassociated with the Skerryvore Fault The largest geophysical differentiation in this inner basin is found inthe superficial part as the shallow EM receiver is more affected than the deeper one In general this area ischaracterized by reduced and more irregular conductivity values
Figure 11 shows SBP (subbottom profiler) lines 181 182 and 183 together with EM Line 1 (see also Figure 2for geographical location) The most striking feature on these plots is the area with gas accumulation coin-cident with the inner basin anomalous conductivity response (region C) This feature runs in a WSW-ENEdirection and correlates well with the inferred position of the Skerryvore Fault (Figure 2) The seismic reflec-tion line DBS99_128 (Figure 7) delineates the North-South extend of region C marked by the presence of achannel-like feature which is limited to the central part of the basin and is not a regional feature
6 Discussion
The EM data show an increase in conductivity toward the center of the Malin basin that suggests higherporosities within sediments We interpret this as the regional trend within the Malin basin Across the basinthe EM data show numerous anomalies that are associated with the presence of gas or freshwater alsoseen in the shallow seismic records (see Figure 11) Core sample analysis confirms differences in sedimentcomposition inside and outside of the pockmark The central part of the basin is characterized by a NE-SWelongated conductive anomaly which is defined by a sharp decrease in the conductivity with respect to theadjacent areas of the basin This anomalous conductivity region correlates well with the NE-SW surfaceexpression of the Skerryvore Fault and fluid escape features observed in the acoustic records
Local high-conductivity anomalies in the vicinity of the pockmarks could have been caused by gas-fueledincrease in microbial activity [Szpak et al 2012] as it has been shown that such activity can affect geo-electrical properties of sediments [Atekwana et al 2004 Abdel Aal et al 2010] (see for example in Figure 5the area located under pockmark 2) Szpak et al [2012] show geochemical signatures of microbial activityfrom analysis of the cores also used in this work Similar local anomalies have been observed in several ofthe EM lines and are confirmed by crossovers Although the geochemical evidence points toward microbialactivity some of these anomalies could also be caused by changes in sediment permeability resulting fromfluid flow
In particular 1 km West of pockmark 2 (Figure 5) there is an area of enhanced reflectivity that we interpretas presence of gas in the strata which corresponds to an increase of conductivities in the 40 m (deeper)receiver As mentioned earlier the expected response of the EM system to the presence of gas is the oppo-site Geochemical analysis of the core in this area [Szpak et al 2012] shows evidence of microbial activitywhich can affect the conductivity of sediments as mentioned above
According to Judd and Hovland [2007] while the initial pockmark formation has a blowout like characteris-tic later fluid migration is likely to use already existing pathways More recent studies [Hovland et al 2010]suggest that fluids escape gradually while the reservoir is charging Once the gas in the reservoir is suffi-cient overpressured it will push through the geological seal The acoustic data in Figure 5 show areas ofblanking or interruption of the layering from the surrounding areas under the pockmark this has beeninterpreted as the result of sediment mixing and of pockmark formation The meaning of this vertical acous-tic blanking is still poorly understood and widely debated [Judd and Hovland 2007] This is also observed inthe core analysis (Tables 1 and 2 and Figures 3 and 4) where the core taken from within the pockmarkshows a more homogeneous layering in comparison to the core from outside the pockmark where a dis-tinct layering is observed
Core data analysis from outside the pockmark (core CE08_044 Figure 3 and Table 1) shows a well-preservedlayering with a sand-rich unit between 15 and 3 mbsf The conductivity in this region (see Figure 5) as meas-ured by the shallow EM receiver is low compared to values obtained elsewhere within the basin The core insidethe pockmark (core CE08_045 Figure 4 and Table 2) shows nonlayered sedimentary structure with no apparentsediment grain size gradients typical of reworked material and the EM data show a regional trend in conductiv-ity (Figures 5 7 and 9) Apparent conductivities are larger than outside the pockmark Szpak et al [2012] haveassociated the increase in conductivity within the pockmark with bacterial activity These observations suggest
Geochemistry Geophysics Geosystems 1010022013GC005108
GARCIA ET AL VC 2014 American Geophysical Union All Rights Reserved 882
that there is a large amount of gas in the sediments of the basin but within the pockmarks (1) gas has escapedand sediments have been disturbed thus increasing the porosity and (2) there is a higher level of bacterialactivity Both of these phenomena can explain the difference in conductivity between the pockmark and thebasin Additionally shallow structures in the SBP data (Figures 5 and 11) are more disturbed than the deeperparts possibly indicating that gas has accumulated in the upper strata
The edges of the pockmark are associated with narrow positive conductive anomalies Newman et al [2008]have pointed out that methane venting from a large pockmark in the Atlantic coast of the United Statesoccurs along the upper parts of the pockmark walls and is not occurring through the floor of the pockmarkChatterjee et al [2011] report that increased fluid flux and deep source methane input result in enhancedconcentrations of hydrate and free gas that accumulate on areas of larger porosity With the help of allthese observations we can interpret the conductivity anomalies observed across pockmarks The internalpart of the pockmark has a decrease of conductivity because of the presence of gas and the more heteroge-neous structure of the sediments As sedimentation is responsible for deposition of organic material vent-ing provides chemical energy in areas of active seeping microbial communities thrive [Jrgensen andBoetius 2007] While the walls of the pockmark constitute pathways for fluid release and hence likely havehigher permeability and porosity from disturbed sediments and therefore higher conductivity we believethat this location is also where most microbial activity concentrates Following the results of Atekwana et al[2004] there is probably an added increase of the conductivity associated with this microbial activityalthough a detailed ground-truthing study would be required to assess this At the same time around thesewalls there is an accumulation of free gas that causes a conductivity decrease
Not all the conductivity anomalies caused by presence of gas are the same Large pockmarks appear assharp conductivity anomalies (positive in the walls and negative in the center) and gas charged areas dis-play a large regional trend This is clearly observed in line C (Figure 10) as the instrument enters the basinboth measurements of conductivity rise until the instruments entered a pockmark Sediments charged withgas should generally show a decrease in their conductivity as has been seen elsewhere [Hsu et al 2014]The results shown in Figure 10 can be interpreted as a (1) change in sediment facies with coarser sands out-side the basin and finer muddy sediments in the interior [Monteys et al 2008] (2) in certain locations thepresence of microbial activity that is known to increase the conductivity of sediments [Atekwana et al2004] and (3) caused by the water influx as gas has been released refilling sediment pores [Sultan et al2011] which will cause an increase of conductivity as the resistive phase (gas) is removed from sedimentsIn the case of a change in facies we need to consider that gas will be very well distributed in sand withinthe matrix decreasing the effective conductivity of sediments but in the case of mud with higher perme-ability gas is trapped in layers and is not as effective at decreasing the overall conductivity
The upper section (top meter) combined results of the grain size and physical properties descriptors on thetwo cores suggest that part or most of the surface material within the pockmark has been reworked possi-bly as a consequence of pockmark formation [Judd and Hovland 2007] Commonly during formation pock-marks are left with so-called lag deposit which is usually coarser than surrounding seabed This is due to thefines being suspended in the water column during ventingblowout and carried away from the site by cur-rents while coarse particulates with lower sedimentation rates are deposited [Judd and Hovland 2007] Asecond plausible mechanism topographic depressions can act as sediment traps retaining the coarser frac-tion while fine grains remain suspended in the water column Both of these mechanisms are not exclusivesand can act at times simultaneously
While the general electrical properties of the basin are controlled by grain size region C (the inner basin inMalin) has a very distinct electrical signature which from the evidence in the conductivity anomalies theSBP profiles and ground truthing is marked by the presence of fluids most likely gas and water released bysediment compaction
The EM line 3 which crosses the entire basin from South to North shows the largest conductivity variations(Figure 7) The Northern part (feature X) has large conductivity anomalies that correlate with presence ofgas enhanced reflectors and a high density of pockmarks in coarser sediments indicating fluid escape Fol-lowing the results we have observed in other areas of the Malin Sea it seems that microbial activity is thecause of this enhanced conductivity Without a more thorough ground truthing we cannot ascertain theextent of possible microbial activity
Geochemistry Geophysics Geosystems 1010022013GC005108
GARCIA ET AL VC 2014 American Geophysical Union All Rights Reserved 883
7 Conclusions
The general trend of the EM survey across the basin shows a gradual increase of conductivity toward thecentral and deepest part of the basin Shallow seismic profiles and MBES observations also reflect sedimen-tary changes across the basin in a fairly homogenous sediment stratum
Electromagnetic surveys across the Malin Basin show a number of conductivity anomalies associated withthe presence of gas charged sediments in the upper strata These anomalies consist in a general increase inconductivity over the areas with a higher density of gas reflectors and with local sharp increments (peaks)This correlates well with gas related echo facies as observed in the sub bottom records
Although the observation of higher conductivities with highest volumes of gas seems counter intuitive thegeophysical signatures correspond to changes in sediment grain size ranging from fairly homogeneoussands to clays indicating changes in porosity control the conductivity rather that gas
There are EM signatures that appear as positive anomaly changes in conductivity compared to the sur-rounding trend These have been observed both as local peaks and also as kilometer long high-conductivity anomalies We interpret these anomalies as fluid accumulation parallel to the strata which arewell correlated to enhanced amplitude reflectors in the subbottom profiler records
There are some local anomalies characterized by short intervals of lower conductivity which could eitherbe caused by gas associated with vertical migration pathways or local disruption of the shallow strata pro-duced by fluid disturbance While the former shows the expected conductivity response decrease causedby the presence of free gas in sediments the latter would be related to a decrease due to the layer disconti-nuity as observed in the shallow seismic records
The areas corresponding to the pockmark depression are characterized in general by high-conductivitypeaks at the edges while inside the unit the conductivity drops and is fairly homogeneous as well as in thevicinity of the pockmark The lower conductivity values across the pockmark depression are found insidethe unit pockmarks Sediment core data suggests that within the two pockmark units studied certain stratashow evidence of increased microbial activity [Szpak et al 2012] which in turn can increase bulk electricalconductivities as pointed out by Atekwana et al [2004]
ReferencesAbdel Aal G Z E A Atekwana and E A Atekwana (2010) Effect of bioclogging in porous media on complex conductivity signatures
J Geophys Res 115 G00G07 doi1010292009JG001159Anderson A L and L D Hampton (1980) Acoustics of gasndashbearing sediments I Background J Acoust Soc Am 67(6) 1865ndash1889 doi
1011211384453Archie G E (1942) The electrical resistivity log as an aid in determining some reservoir characteristics Trans Am Inst Min Metal Eng
146 54ndash67Atekwana E A D D J Werkema J W Duris S Rossbach E A Atekwana W A Sauck D P Cassidy J Means and F D Legall (2004) In-
situ apparent conductivity measurements and microbial population distribution at a hydrocarbon-contaminated site Geophysics 69(1)56ndash63 doi10119011649375
Beuroorner J H V Herdegen J-U Repke and K Spitzer (2013) The impact of CO2 on the electrical properties of water bearing porous mediaLaboratory experiments with respect to carbon capture and storage Geophys Prospect 61(s1) 446ndash460 doi101111j1365-2478201201129x
Chatterjee S G Gu W G Chapman G J Hirasaki G Bhatnagar B Dugan and G R Dickens (2011) Effects of heterogeneous lithologyand focused fluidflow on gas hydrate distribution in marine sediments paper presented at 7th International Conference on GasHydrates (ICGH 2011) Scotland U K
Cheesman S J (1989) A Short Baseline Transient Electromagnetic Method for Use on the Sea Floor edited by S J Cheesman Univ ofToronto Dep of Phys Geophys Lab Toronto Ontario
Cheesman S J L K Law and B St Louis (1993) A porosity mapping survey in Hecate Strait using a seafloor electro-magnetic profilingsystem Mar Geol 110(3ndash4) 245ndash256 doi1010160025-3227(93)90087-C
Dobson M R and D Evans (1974) Geological structure of the Malin Sea J Geol Soc London 130(5) 475ndash478 doi101144gsjgs13050475Dobson M R and R J Whittington (1992) Aspects of the geology of the Malin Sea area Geol Soc Spec Publ 62(1) 291ndash311 doi101144
GSLSP19920620123Dorschel B A Wheeler X Monteys and K Verbrugge (2011) Atlas of the Deep-Water Seabed Ireland Springer LondonDunlop P R Shannon M McCabe and R Quinn (2010) Marine geophysical evidence for ice sheet extension and recession on the Malin
Shelf New evidence for the western limits of the British Irish Ice Sheet Mar Geol 276(1ndash4) 86ndash99 doi101016jmargeo201007010Evans D R J Whittington and M R Dobson (1985) Tiree Solid Geology 1250000 Scale (map) (Institute of Geological Sciences) British
Geological Survey Nottingham (UK)Evans R L (2001) Measuring the shallow porosity structure of sediments on the continental shelf A comparison of an electromagnetic
approach with cores and acoustic backscatter J Geophys Res 106(C11) 27047ndash27060 doi1010292000JC000487Evans R L (2007) Using CSEM techniques to map the shallow section of seafloor From the coastline to the edges of the continental slope
Geophysics 72(2) WA105 doi10119012434798
AcknowledgmentsWe wished to thank the GeologicalSurvey of Ireland the IntegratedMapping for the Sustainable Develop-ment of Irelandrsquos Marine Resources(INFOMAR) program the PetroleumAffairs Division (PAD) and the DublinInstitute for Advanced Studies forfunding this study Thanks to PAD forgranting access to the multichannelseismic line DBS99_128 Jim Brodafrom the Woods Hole OceanographicInstitution kindly provided the gravitycorer We would also like to thankBrian Kelleher and DCU for access tothe geochemistry lab Some plots havebeen realized using the GMT package[Wessel and Smith 1991] Commentsby Editor Cyn-Ty Lee and reviewersMads Huuse and Katryn Schwalenbergare greatly appreciated This work isalso supported by a research grantfrom the Spanish Ministry of Scienceand Innovation (CTM2011-30400-C02-02)
Geochemistry Geophysics Geosystems 1010022013GC005108
GARCIA ET AL VC 2014 American Geophysical Union All Rights Reserved 884
Evans R L and D Lizarralde (2003) Geophysical evidence for karst formation associated with offshore groundwater transport An exam-ple from North Carolina Geochem Geophys Geosyst 4(8) 1069 doi1010292003GC000510
Evans R L L K Law B St Louis S J Cheesman and K Sananikone (1999) The shallow porosity structure of the Eel shelf northern Califor-nia Results of a towed electromagnetic survey Mar Geol 154(1ndash4) 211ndash226 doi101016S0025-3227(98)00114-5
Fleischer P T Orsi M Richardson and A Anderson (2001) Distribution of free gas in marine sediments A global overview Geo Mar Lett21 103ndash122 doi101007s003670100072
Floodgate G and A Judd (1992) The origins of shallow gas Cont Shelf Res 12(10) 1145ndash1156 doi1010160278-4343(92)90075-UFonseca L L Mayer D Orange and N W Driscoll (2002) The high-frequency backscattering angular response of gassy sediments Model
data comparison from the Eel River Margin California J Acoust Soc Am 111(6) 2621ndash2631 doi10112111471911Garcia X X Monteys R L Evans and B Kelleher (2007) Geohazard identification and early reconnaissance for hydrocarbon potential
using marine electromagnetic and high frequency acoustic methods Geophys Res Abstr 9 09524 16ndash20 SRef-ID 1607-7962graEGU2007-A-09524
Hovland M (1984) Gas-induced erosion features in the north sea Earth Surf Processes Landforms 9 209ndash228Hovland M and A Judd (1988) Seabed Pockmark and Seepages Impact on Geology Biology and the Marine Environment 293 pp Graham
and Trotman LondonHovland M R Heggland M De Vries and T Tjelta (2010) Unit-pockmarks and their potential significance for predicting fluid flow Mar
Pet Geol 27(6) 1190ndash1199 doi101016jmarpetgeo201002005Hsu S K C-W Chiang R L Evans C-S Chen S-D Chiu Y-F Ma S-C Chen C-H Tsai S-S Lin and Y Wang (2014) Marine controlled
source EM method used for the gas-hydrate investigation in the area off SW Taiwan J Asian Earth Sci doi101016jjseaes201312001in press httpwwwsciencedirectcomsciencearticlepiiS1367912013006202
Jackson P D D T Smith and P N Stanford (1978) Resistivityndashporosityndashparticle shape relationships for marine sands Geophysics 43(6)1250ndash1268 doi10119011440891
Jackson P D R C Flint and K B Briggs (1998) Two- and three-dimensional heterogeneity in carbonate sediments using resistivity imag-ing J Acoust Soc Am 104(3) 1812ndash1812 doi1011211423422
Jrgensen B B and A Boetius (2007) Feast and faminemdashMicrobial life in the deep-sea bed Nat Rev Microbiol 5(10) 770ndash781 doi101038nrmicro1745
Josenhans H W L H King and G B Fader (1978) A side-scan sonar mosaic of pockmarks on the Scotian shelf Can J Earth Sci 15(5)831ndash840 doi101139e78-088
Judd A and M Hovland (2007) Seabed Fluid Flow The Impact on Geology Biology and the Marine Environment 492 pp Cambridge UnivPress Cambridge UK
King L H and B MacLean (1970) Pockmarks on the Scotian Shelf Geol Soc Am Bull 81(10) 3141 doi1011300016-7606(1970)81[3141POTSS]20CO2
Kvenvolden K A and B W Rogers (2005) Gaiarsquos breathmdashGlobal methane exhalations Mar Pet Geol 22(4) 579ndash590 doi101016jmarpetgeo200408004
Milkov A V (2000) Worldwide distribution of submarine mud volcanoes and associated gas hydrates Mar Geol 167(1ndash2) 29ndash42 doi101016S0025ndash3227(00)00022-0
Minshull T A G K Westbrook K A Weitemeyer M C Sinha B K Goswami and B Marsset (2012) Leaking Methane Reservoirs OffshoreSvalbard Eos Trans AGU 93(42) 413ndash414 doi101029eost2012EO42
Monteys X D Hardy E Doyle and S Garcia-Gil (2008) Distribution morphology and acoustic characterisation of a gas pockmark field onthe Malin Shelf NW Ireland paper presented at OSP-01 General Contributions to Marine Geoscience and Paleoceanography Sympo-sium Int Geol Congr Oslo
Meurouller H T von Dobeneck W Nehmiz and K Hamer (2011) Near-Surface EM rock-magnetic and geochemical fingerprinting of submar-ine freshwater seepage at Eckernfeuroorde bay Geo Mar Lett 31(2) 123ndash140 doi101007s00367-010-0220-0
Newman K R et al (2008) Active methane venting observed at giant pockmarks along the US mid-Atlantic shelf break Earth Planet SciLett 267(1ndash2) 341ndash352 doi101016jepsl200711053
Parnell J (1992) Burial histories and hydrocarbon source rocks on the North West Seaboard Geol Soc Spec Publ 62(1) 3ndash16 doi101144GSLSP19920620102
Ren S R Y Liu Y Liu and W Zhang (2010) Acoustic velocity and electrical resistance of hydrate bearing sediments J Pet Sci Eng 70(1ndash2) 52ndash56 doi101016jpetrol200909001
Rice D D and G E Claypool (1981) Generation accumulation and resource potential of biogenic gas AAPG Bull 65(1) 5ndash25Riddihough R (1968) Magnetic surveys off the north coast of ireland Proc R Irish Acad 66 27ndash41Schubel J R (1974) Effects of tropical storm agnes on the suspended solids of the northern chesapeake bay in Suspended Solids in Water
Mar Sci vol 4 edited by R Gibbs pp 113ndash132 Springer US doi101007978-1-4684ndash8529-5_8Schwalenberg K E Willoughby R Mir and R N Edwards (2005) Marine gas hydrate electromagnetic signatures in Cascadia and their cor-
relation with seismic blank zones First Break 23 57ndash63Sills G C and S J Wheeler (1992) The significance of gas for offshore operations Cont Shelf Res 12(10) 1239ndash1250 doi1010160278-
4343(92)90083-VSultan N et al (2011) Dynamics of fault-fluid-hydrate system around a shale-cored anticline in deepwater Nigeria J Geophys Res 115
B08101 doi1010292011JB008218Szpak M T X Monteys S OrsquoReilly A J Simpson X Garcia R L Evans C C R Allen D J McNally D Courtier-Murias and B P Kelleher
(2012) Geophysical and geochemical survey of a large marine pockmark on the Malin Shelf Ireland Geochem Geophys Geosyst 13Q01011 doi1010292011GC003787
Taylor D (1992) Nearshore shallow gas around the UK coast Cont Shelf Res 12(10) 1135ndash1144 doi1010160278-4343(92)90074-TWessel P and W H F Smith (1991) Free software helps map and display data Eos Trans AGU 72 441ndash446Wilkens R and M Richardson (1998) The influence of gas bubbles on sediment acoustic properties In situ laboratory and theoretical
results from Eckernfeuroorde bay Germany Cont Shelf Res 18 1859ndash1892Wilt M and D Alumbaugh (1998) Electromagnetic methods for development and production State of the art Leading Edge 17(4) 487ndash
487Yuan F J D Bennell and A M Davis (1992) Acoustic and physical characteristics of gassy sediments in the western Irish Sea Cont Shelf
Res 12(10) 1121ndash1134 doi1010160278ndash4343(92)90073-SYuan J and R N Edwards (2000) The assessment of marine gas hydrates through electrical remote sounding Hydrate without a BSR
Geophys Res Lett 27(16) 2397ndash2400 doi1010292000GL011585
Geochemistry Geophysics Geosystems 1010022013GC005108
GARCIA ET AL VC 2014 American Geophysical Union All Rights Reserved 885
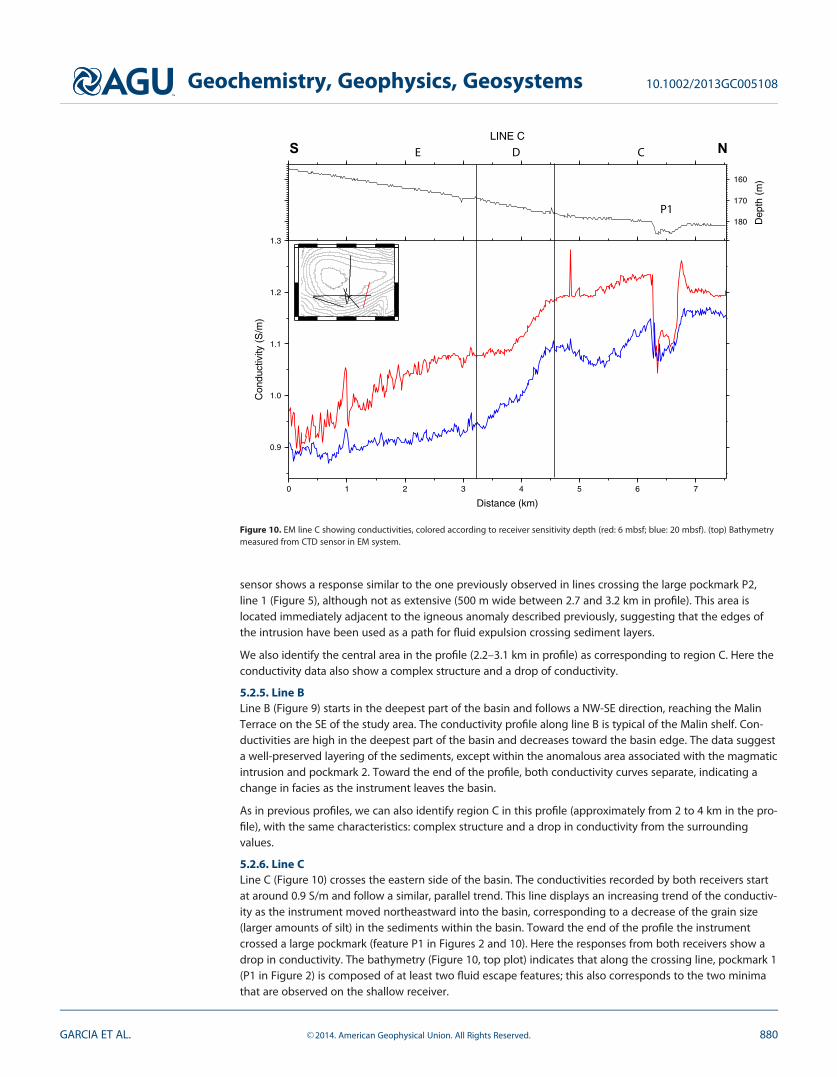
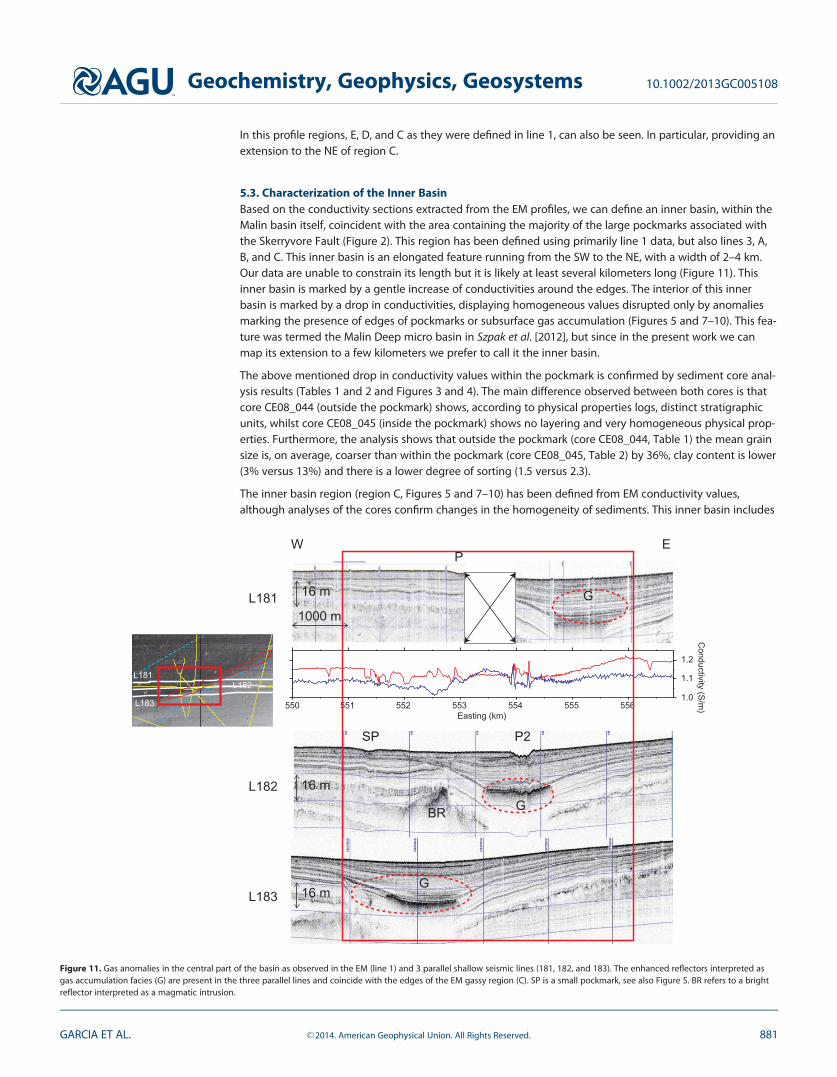