Slip activities in polycrystals determined by coupling DIC ...
43
HAL Id: hal-01303523 https://hal.archives-ouvertes.fr/hal-01303523 Submitted on 21 Apr 2016 HAL is a multi-disciplinary open access archive for the deposit and dissemination of sci- entific research documents, whether they are pub- lished or not. The documents may come from teaching and research institutions in France or abroad, or from public or private research centers. L’archive ouverte pluridisciplinaire HAL, est destinée au dépôt et à la diffusion de documents scientifiques de niveau recherche, publiés ou non, émanant des établissements d’enseignement et de recherche français ou étrangers, des laboratoires publics ou privés. Slip activities in polycrystals determined by coupling DIC measurements with crystal plasticity calculations Adrien Guery, François Hild, Félix Latourte, Stéphane Roux To cite this version: Adrien Guery, François Hild, Félix Latourte, Stéphane Roux. Slip activities in polycrystals determined by coupling DIC measurements with crystal plasticity calculations. International Journal of Plasticity, Elsevier, 2016, 81, pp.249-266. 10.1016/j.ijplas.2016.01.008. hal-01303523
-
Upload
khangminh22 -
Category
Documents
-
view
0 -
download
0
Transcript of Slip activities in polycrystals determined by coupling DIC ...
HAL Id: hal-01303523https://hal.archives-ouvertes.fr/hal-01303523
Submitted on 21 Apr 2016
HAL is a multi-disciplinary open accessarchive for the deposit and dissemination of sci-entific research documents, whether they are pub-lished or not. The documents may come fromteaching and research institutions in France orabroad, or from public or private research centers.
L’archive ouverte pluridisciplinaire HAL, estdestinée au dépôt et à la diffusion de documentsscientifiques de niveau recherche, publiés ou non,émanant des établissements d’enseignement et derecherche français ou étrangers, des laboratoirespublics ou privés.
Slip activities in polycrystals determined by couplingDIC measurements with crystal plasticity calculations
Adrien Guery, François Hild, Félix Latourte, Stéphane Roux
To cite this version:Adrien Guery, François Hild, Félix Latourte, Stéphane Roux. Slip activities in polycrystals determinedby coupling DIC measurements with crystal plasticity calculations. International Journal of Plasticity,Elsevier, 2016, 81, pp.249-266. �10.1016/j.ijplas.2016.01.008�. �hal-01303523�

Slip activities in polycrystals determined by couplingDIC measurements with crystal plasticity calculations
Adrien Guerya,b, Francois Hilda, Felix Latourteb, Stephane Rouxa
aLMT-Cachan (ENS Cachan/CNRS/University Paris-Saclay)61 avenue du President Wilson, F-94235 Cachan (FRANCE)
bEDF R&D, Site des Renardieres, avenue des Renardieres - Ecuelles, F-77818 Moret-sur-Loing (FRANCE)
Abstract
The role of crystallographic grain size and microstructure of an austenitic stainless steel (A316LN)
is studied via in-situ mechanical testing in an SEM and digital image correlation to measure dis-
placement and strain fields. The latter ones are directly measured on a mesh supported by the
grain boundaries as imaged by EBSD. This experimental analysis is applied to five microstruc-
tures of the same cast material but subjected to different heat treatments. Differences in the strain
distributions that can be attributed to the grain size are observed. The full-field measurements
allow in turn for a direct, local and quantitative comparison with crystal plasticity finite element
simulations of the same experiments based on the same mesh. A weak correlation between the
plastic strain and the Schmid’s factors, which are computed with macroscopic or even local stress
evaluations, emphasizes the role of inter-grain strain incompatibilities or grain boundaries. How-
ever, a good agreement in the major slip system evaluation between experimental observation and
computations is observed.
Keywords: Crystal plasticity, Digital Image Correlation, Grain size effect, Slip activity
1. Introduction
In several industrial fields, multiscale mechanical models have been developed to better un-
derstand and predict the performance of materials and to improve the links between microstruc-
tural and mechanical properties. The present study focuses on a face-centered cubic 316LN
austenitic stainless steel, which is widely used for high temperature structural components in
power plants such as Pressurized Water Reactors (PWRs) because of its corrosion resistance,
Preprint submitted to International Journal of Plasticity January 25, 2016

fracture toughness and creep performance [1].
If mean-field homogenization techniques are often sufficient to derive macroscopic proper-
ties from microscopic ones, they are unable to provide the local mechanical fields that are needed
to study degradation mechanisms occurring at the microstructural scale (e.g., stress corrosion
cracking [2–4] or intergranular fracture [5–8]). Such fields can, for example, be computed us-
ing full-field methods based upon fast-Fourier transforms [9–12] now available for finite strain
calculations [13], or finite element methods as reviewed by Roters et al. [14].
In this context, the behavior of the grain or twin boundaries is not yet fully understood and
remains a challenging research area. For instance, the interactions of dislocations with the in-
terfaces in polycrystals depend on the interface structure itself [15, 16], which is affecting the
stress levels. The experimentally observed lattice curvature at grain boundaries [16–18] is suc-
cessfully accounted for in strain gradient plasticity models [19–22] or higher-order continua
models [23–26], which are motivated by the need for describing Geometrically Necessary Dis-
locations (GNDs) [27]. Among possible applications of such models, the study of plasticity in
the vicinity of crack tips [18], Hall-Petch effects [23, 28–33] or even grain size effects on plastic
strain localization patterns [34] can be cited. The latter phenomena are observed at scales of
about one micrometer, consistent with the predictions of several numerical works [30, 35–38].
In this study, it is first proposed to explore the grain size effects at a mesoscopic scale using
Digital Image Correlation (DIC) from images acquired during in-situ tensile tests in a Scanning
Electron Microscope (SEM). DIC provides spatially dense experimental information in poly-
crystals [39], more particularly for studying grain boundary effects [40, 41]. Several studies
have shown the possibility of performing kinematic measurements at the microstructural scale,
for instance, using an Atomic Force Microscope (AFM) [42] or SEM [43, 44]. These imag-
ing means allow for the mapping of strain fields at the surface of polycrystals with high spatial
resolutions [43, 44]. In particular, strain localizations have been shown to be related to grain ori-
entations [45, 46]. These studies lead, for instance, to a correlation between these localizations
and the Schmid’s factors. Such kinematic measurements also provide a way to analyze the slip
system activity (whose slip traces are directly observed on the surface) and more specifically the
slip transmission across grain boundaries [47, 48]. Other applications of DIC at microstructural
2

scales deal with features in the vicinity of the crack tip [49, 50], to determine global fracture
mechanics parameters [51], or to assess the cumulated plastic strain close to a growing fatigue
crack [52]. Recent advances in crystal plasticity modeling have shown the opportunities of con-
fronting these experimental investigations with simulations in terms of textures [9], of relating
fields to the microstructure [40, 41, 53, 54], of validating models [55–57], or even parameter
identification [39].
In the present case and contrary to all the previous studies, the displacement field is based
on a mesh taking as support the grain boundaries of the observed surface. This is made possible
by using Electron Back-Scattered Diffraction (EBSD) data, which give access to the crystallo-
graphic orientations, and requires a change of coordinate system. While in similar studies such
transformation is achieved using micro-indentations [39, 52], a registration method using DIC is
chosen herein.
Traditionally, experimental slip system activities are compared with those predicted by the
Schmid’s factors based on a far field stress projection [58]. Using this approach, a lack of correla-
tion in the polycrystalline case is attributed to grain neighboring and localization effects [59]. In
addition, subsurface grains have a known influence of the kinematic surface response of polycrys-
tals [60, 61], and this challenge has been recently mostly tackled by studying oligocrystals [56–
58], bicrystals [41], or directionally solidified polycrystals [62]. However, such experimental
conditions are not possible in the present case of an industrial material for which the grain size
dimension is small as compared to the sample thickness.
Displacement fields are measured on meshes built at the free surfaces of five different tensile
polycrystalline specimens of grade 316LN stainless steel. The slip activities are then explored
by resorting to full-field finite element simulations of the experiments, considering a local stress
projector outperforming far field projectors as employed in Ref. [58]. Using these techniques,
correlations between model and experiments are finally discussed.
3

2. Material and experimental facilities
2.1. Material
The material of the present study is a 316LN austenitic stainless steel of face centered cubic
(FCC) crystal lattice. The tensile specimens are machined from a 60-mm thick rolled plate
also utilized within the AFGRAP project [63, 64], which was subjected to a solution treatment at
1050-1150 °C followed by water quenching. Preliminary optical microscopy and EBSD analyses
have revealed the presence of less than 0.1 vol. % of δ-ferrite in the plate core and no texture was
observed. To avoid the ferritic phase, the sampling is conducted in the plate skins where the
material is fully austenitic. After solution treatment, a typical microstructure with heterogeneous
grain sizes is observed, namely, the average size is of the order of 70 µm while a small fraction
of small grains down to 5 µm in size coexists with some larger grains up to 200 µm. The grain
shapes are equiaxed and large sized grains are sometimes divided into twins. The chemical
composition of the material is given in Table 1.
Table 1: Chemical composition of the studied 316LN stainless steel plate in weight %
Fe Cr Ni Mo Mn Si N Co
bal. 17.5 12.5 2.47 1.7 0.37 0.072 0.04
C P Cu Ti Nb Ta B S
0.027 0.024 0.01 0.005 0.005 0.003 0.0005 0.0002
In this study, five different specimens, denoted A70, B10, C10, D50 and E1000+, machined from
this 316LN plate are considered. They have different average grain sizes (indicated by their
designation subscript) determined by EBSD in a chosen Region Of Interest (ROI) detailed in the
next section, due to different treatments:
• sample A70 is machined from the plate in its as-received state. The mean grain size is of
the order of 70 µm,
• samples B10 and C10 are taken from the plate after 60 % cold-rolling followed by 1-hour
heat treatment at 900 °C. The resulting mean grain size is about 10 µm,
4

• sample D50 is machined from the plate after 60 % cold-rolling followed by 1-hour heat-
treatment at 1100 °C. The resulting mean grain size is about 50 µm,
• sample E1000+ is taken from the plate after 264-hour heat treatment at 1200 °C. The result-
ing microstructure shows millimetric grains.
2.2. Microstructure characterization and in-situ tensile tests
In this study, a Zeiss Supra 55 SEM is used with a TSL OIM analysis software for EBSD
measurements. An FEI Quanta FEG 600 SEM is used for imaging purposes. A miniaturized
tensile testing device is introduced in the SEM chamber so that in-situ tensile tests can be imaged
all along the loading history. EBSD measurements are performed with an acceleration voltage of
25 kV and a working distance of 14 mm. For imaging, both Secondary Electron (SE) Everhart-
Thornley detector and Backscattered Electron (BSE) detector in Z-contrast are used, with an
acceleration voltage of 10 kV and a working distance of 14 mm. An image definition of 2048 ×
1887 pixels and a dynamic range of 16 bits are chosen.
The imaged gray level speckle marking evolved upon straining due to surface variations,
namely, the deformation of the crystalline lattice and/or the accumulation of slip bands on the
observed surface, which is related to the electromagnetic imaging environment. As these contrast
variations appear more significantly with the SE mode than the BSE mode, the latter is chosen for
imaging purposes during any in-situ tensile test to make DIC calculations easier. The SE mode
is used to actually observe these surface variations at the end of tensile tests (see Section 5.3).
For each tensile test, imaging conditions are the same but with three different magnifications.
Table 2 summarizes the measurement conditions. For samples A70 and B10 the same ROI size is
selected, even though the grain size is different. Conversely, samples B10 and C10 have the same
grain size but different ROI sizes are chosen. Last, samples D50 and E1000+ are analyzed with
the same ROI size. It is worth noting that the ROI covers only few twins in one single grain for
sample E1000+.
Figure 1 shows the grain size distributions in the ROI of each specimen (except E1000+). These
distributions are obtained from the grain partition based on the EBSD measurements. One may
note that the distributions of samples B10 and C10 are similar. Conversely, the distributions of
5

Table 2: DIC measurements conditions for the five different specimens
Specimen Pixel size ROI size Mean grain size Mean grain size Number of grains
(nm) (µm2) (µm) (pixel) in the ROI
A70 150 200 × 200 70 470 14
B10 160 200 × 200 10 60 551
C10 80 100 × 100 10 120 117
D50 280 400 × 400 50 180 59
E1000+ 270 400 × 400 >1000 >3700 1
samples A70 and D50 are more irregular, which may be due to the lower number of grains in their
ROIs.
0 20 40 60 80 100 120 140 160 1800
0.02
0.04
0.06
0.08
0.1
Grain size (micrometers)
Den
sity
B10
C10
D50
A70
Figure 1: Grain size distributions in the ROI of the studied specimens
3. Microstructure-based mesh for DIC measurements
3.1. Kinematic measurements based on SEM images
Kinematic measurements by digital image correlation require a gray level speckled pattern
with local contrasts as high as possible. In the present case, the raw image of the material does not
provide such contrast. It is chosen to print an artificial speckle provided by a computer-generated
6

random pattern using a microphotolithographic technique [65]. The lithography process is con-
ducted in a specific area on the surface of an in-situ specimen. The resulting pattern is made
of gold speckles whose thickness is of the order of 20 nm. Because the speckle is designed for
DIC analyses, the physical size of the spots lies in the range of 6 to 20 pixels (i.e., between 0.5
and 2.8 µm) for a center to center distance in the range of 30 to 50 pixels (i.e., between 2.7 and
10 µm). To allow for EBSD measurements over the region of interest, the surface is initially
polished with cloths and diamond solutions down to 1 µm, and finished with a 50-nm colloidal
silica suspension.
From a sequence of SEM images acquired during an in-situ tensile test, displacement fields
are measured with a continuous Galerkin-based DIC procedure [66, 67]. The image registra-
tion is based on the conservation of the gray levels between two consecutive images, namely a
first one in the reference configuration, f , and a second one in the deformed configuration, g,
expressed as
f (x) = g(x + u(x)) (1)
where x is the vector coordinate of pixels in the reference configuration, and u the sought
displacement field. The minimization of the quadratic norm of the difference of gray levels
ρ2c = ‖ f (x) − g(x + u(x))‖2ROI is performed successively where, at iteration n, the displacement
field is corrected by incremental displacement amplitudes {δu(n)}, which are the solution to linear
systems
[M ] {δu(n)} = {b(n)} (2)
where {δu} is the vector gathering the corrections of the displacement amplitudes uk associated
with the basis of displacement fields ψk providing the discretized displacement field u(x)
u(x) =∑
k
ukψk(x) (3)
The DIC matrix [M ] and vector {b(n)} are expressed as
7

Mkl =∑ROI
(ψk ·∇ f )(x)(ψl ·∇ f )(x) (4)
and
bk =∑ROI
( f − g(n))(x)(ψk ·∇ f )(x) (5)
where g(n) is the deformed image corrected by the current estimate of the displacement field.
Several choices are possible for the kinematic basis ψk. For instance, finite element shape
functions [66, 68] may be considered or enriched bases to account for localized phenomena [69,
70]. In this study, it is chosen to take advantage of the crystallographic information that is
available on the surface of the analyzed specimen. The aim is to build a finite element mesh
taking as support the microstructure (i.e., grain and twin boundaries) and to overlay it on the first
image of a sequence of SEM acquisitions during in situ tensile tests in order to perform DIC
measurements thereafter.
The noise of SEM imaging estimated by correlating two pictures with no motion applied
between two acquisitions is relatively high (i.e., greater than 2 % of the dynamic range). In
addition, the discretization of the displacement field has to be fine enough to capture plastic strain
localizations. For those reasons, mechanical regularization appears to be beneficial to assist DIC
calculations. For that purpose, in the spirit of Tikhonov regularization of ill-posed problems [71],
it is proposed to include an additional cost function to the DIC gray levels functional [72]. It
consists of introducing the equilibrium gap Φ2m penalizing deviations from a solution to a linear
elastic homogeneous problem [K] {u} = {0} expressed as
Φ2m = {u}t [K]t [K] {u} (6)
where [K] is the stiffness matrix associated with inner nodes. An additional term is to be in-
troduced to specifically deal with boundary nodes [67]. These gaps introduce two regularization
lengths (i.e., one for the inner nodes and another one for the boundary nodes) weighting the equi-
librium gaps against the image registration, which are both chosen to be equal to four times the
characteristic length of the mesh, which corresponds to the mean length of the element edges, in
8

this study. This regularization is a low-pass mechanical filter, where the regularization lengths
are acting as cut-off wavelengths. It is not intended to be representative of the actual material be-
havior. Table 3 gives the standard measurement resolutions, in terms of displacement and strain,
obtained with the presented DIC procedure for each specimen by registering two pictures with
no applied load between the two acquisitions. The root mean square value of the measured dis-
placement and strain fields due to SEM noise leads to the corresponding standard measurement
uncertainties. It can be noted that their levels are quite similar for the different specimens.
Table 3: DIC standard measurement uncertainties for the five studied microstructures with the chosen correlation
parameters
Specimen Displacement uncertainty Strain uncertainty
A70 4.3 nm / 2.9 × 10−2 pixel 1.1 × 10⁻³
B10 5.9 nm / 3.7 × 10−2 pixel 1.5 × 10⁻³
C10 2.2 nm / 2.8 × 10−2 pixel 1.2 × 10⁻³
D50 7.1 nm / 2.5 × 10−2 pixel 1.1 × 10⁻³
E1000+ 4.4 nm / 1.8 × 10−2 pixel 9.6 × 10⁻⁴
3.2. Change of coordinate system and unstructured mesh
This part is devoted to the presentation of the method to build an unstructured mesh consistent
with microstructural interfaces focusing on the case of specimen E1000+ for illustration purposes.
EBSD measurements provide a map of the microstructure boundaries for the region of interest
of the analyzed specimen. A misorientation greater than 15°, respectively about 60°, is chosen to
define a grain boundary or a twin boundary, respectively. Figure 2(a) shows the boundaries of the
microstructure, which consists of a single grain with a few embedded twins of sharp polygonal
shape. This map is used as a support for building an unstructured mesh. Therefore, it is essential
that the mesh, which is first expressed in the EBSD frame, be accurately transported in the SEM
images frame. For that purpose, the Image Quality (IQ) map is used. For EBSD measurements
using the OIM analysis software, the IQ factor estimates the quality of the diffraction pattern,
9
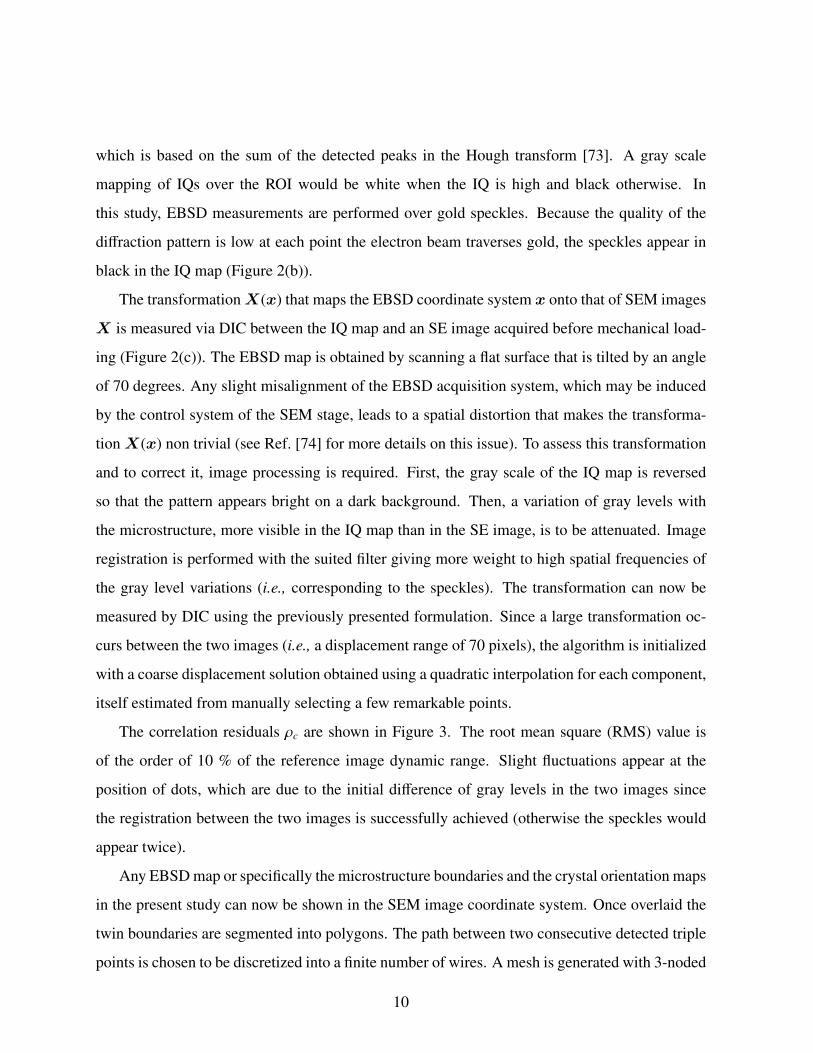
which is based on the sum of the detected peaks in the Hough transform [73]. A gray scale
mapping of IQs over the ROI would be white when the IQ is high and black otherwise. In
this study, EBSD measurements are performed over gold speckles. Because the quality of the
diffraction pattern is low at each point the electron beam traverses gold, the speckles appear in
black in the IQ map (Figure 2(b)).
The transformationX(x) that maps the EBSD coordinate system x onto that of SEM images
X is measured via DIC between the IQ map and an SE image acquired before mechanical load-
ing (Figure 2(c)). The EBSD map is obtained by scanning a flat surface that is tilted by an angle
of 70 degrees. Any slight misalignment of the EBSD acquisition system, which may be induced
by the control system of the SEM stage, leads to a spatial distortion that makes the transforma-
tionX(x) non trivial (see Ref. [74] for more details on this issue). To assess this transformation
and to correct it, image processing is required. First, the gray scale of the IQ map is reversed
so that the pattern appears bright on a dark background. Then, a variation of gray levels with
the microstructure, more visible in the IQ map than in the SE image, is to be attenuated. Image
registration is performed with the suited filter giving more weight to high spatial frequencies of
the gray level variations (i.e., corresponding to the speckles). The transformation can now be
measured by DIC using the previously presented formulation. Since a large transformation oc-
curs between the two images (i.e., a displacement range of 70 pixels), the algorithm is initialized
with a coarse displacement solution obtained using a quadratic interpolation for each component,
itself estimated from manually selecting a few remarkable points.
The correlation residuals ρc are shown in Figure 3. The root mean square (RMS) value is
of the order of 10 % of the reference image dynamic range. Slight fluctuations appear at the
position of dots, which are due to the initial difference of gray levels in the two images since
the registration between the two images is successfully achieved (otherwise the speckles would
appear twice).
Any EBSD map or specifically the microstructure boundaries and the crystal orientation maps
in the present study can now be shown in the SEM image coordinate system. Once overlaid the
twin boundaries are segmented into polygons. The path between two consecutive detected triple
points is chosen to be discretized into a finite number of wires. A mesh is generated with 3-noded
10

(a) (b) (c)
Figure 2: Twin boundaries (a) and gray scale IQ map (b) of the region of interest obtained by EBSD of specimen
E1000+. SEM imaging of the same region of interest with SE detector (c). The scale bar is 100 µm long
0 100 200 300 400
0
100
200
300
400
0
0.5
1
1.5
2
2.5
x 104
Figure 3: Absolute value of the correlation residuals expressed in gray levels corresponding to the DIC measurement
between the IQ map (Figure 2(b)) and the SE image (Figure 2(c)). The dynamic range of the registered images is
16 bits. The axes are expressed in micrometers
triangular elements taking as support these polygons. The resulting mesh made of about 20-pixel
(or 5-µm) long elements is shown in Figure 4. Since the mesh is created as conforming to the
microstructure boundaries the local crystal orientation can be selected for each element.
11

Figure 4: Unstructured mesh compatible with the underlying microstructure overlaid on the BSE image of the region
of interest. The scale bar is 200 µm long
4. Results of DIC measurements in polycrystals and grain size effects
The series of images acquired during the tensile tests are now processed with the previously
presented DIC algorithm (see Equation (2)). Even though the BSE mode is used for imaging
purposes, gray level changes occur with topographic variations. As a consequence, DIC mea-
surements are performed in two steps. First, an updated scheme is applied. At the end of each
calculation, an incremental displacement field is computed, the deformed image becomes the
reference image for the next calculation and the total displacement is the sum of all increments.
The mesh is updated too by moving the node positions with the measured nodal displacement
at the end of each calculation. Second, the measured displacement fields are used to initialize a
non-updated scheme (i.e., the reference image and the mesh are kept unchanged for the calcula-
tions with all deformed images). This second step allows the measurement uncertainties not to
be cumulated since at each step the total displacement field is directly computed.
DIC measurements are performed for the five specimens. In each case a gold pattern is de-
posited and an unstructured mesh taking as support the microstructure boundaries is built. For all
used magnifications, the characteristic length of the mesh is about 20 pixels (i.e., between 1.6 and
5.6 µm) and the cut-off length associated with the elastic regularization is 80 pixels (i.e., between
12

6.4 and 22 µm). It is worth noting that the present regularization length is short compared to the
mean grain size, and hence conclusions based on features of the displacement field pertaining to
larger scale than the regularization length, i.e., not influenced by the mechanical regularization,
result from the sample imaging only and are considered trustworthy.
Strains are evaluated for each finite element of the mesh by differentiation of the shape func-
tions and computing the nominal components. Figure 5 shows the longitudinal component of
the Green–Lagrange strain field for each microstructure, for a mean tensile strain up to 5 %. For
each experiment, strain bands occur early on during the tensile test while only their magnitude
increase thereafter. These strain localizations occur in the vicinity of grain boundaries as well as
within the grains.
The statistical distribution of strain magnitude does not reveal a very significant difference
that could be attributed to the grain size. In contrast, the image resolution (i.e., physical size of
one pixel) has a visible impact. Thus it seems that the localized nature of the strain fields is such
that it cannot be captured in an objective way with the present approach. In addition, a large
number of grains is needed to establish firm conclusions and this is in conflict with exploring a
large interval of grain sizes.
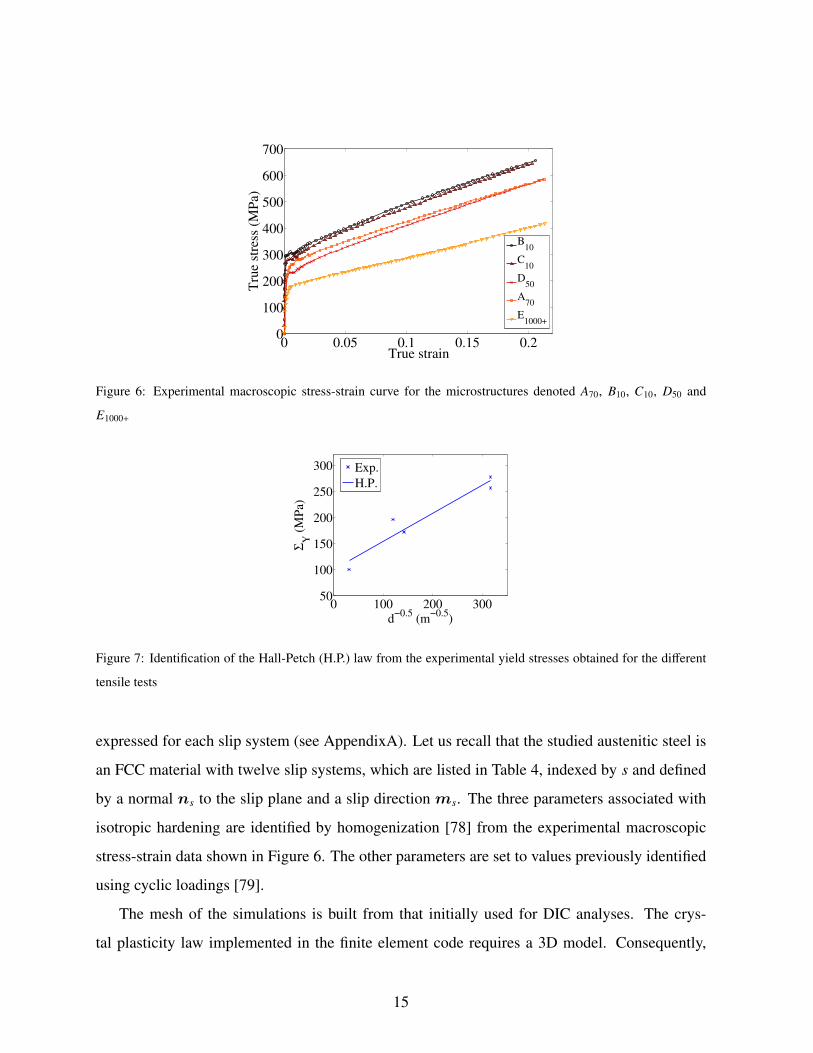
Since different microstructures are tested, the effect of the grain size on the macroscopic load
is first considered. In Figure 6, the macroscopic stress-strain curve of the five tensile tests are
compared. The Hall-Petch effect [75] applies and is reproducible, namely, the yield stress is
observed to increase linearly with the inverse of the square root of the grain size, together with
an increase of hardening (Figure 7). A linear interpolation of coefficient 0.96 demonstrates the
good correlation between experimental data and the Hall-Petch relationship.
These experimental results are now to be compared with numerical simulations using a crystal
plasticity model. In the following, only microstructure A70 will be considered.
5. Using crystal plasticity to interpret the experiments
Simulations corresponding to the experimental tensile test are performed using the finite
element software Code Aster [76]. The crystal plasticity law chosen in this study has been
proposed by Meric et al. [77]. It implies plastic flow, isotropic and kinematic hardening laws
13

<ε> = 5.2 %
50 100 150 200
50
100
150 2.0
4.0
6.0
8.0
10.0
12.0
(a)
<ε> = 5.0 %
50 100 150 200
50
100
150 2.0
4.0
6.0
8.0
10.0
(b)
<ε> = 4.9 %
20 40 60 80
20
40
60
80 2.0
4.0
6.0
8.0
10.0
12.0
14.0
(c)
<ε> = 5.0 %
100 200 300 400
100
200
300 2.0
4.0
6.0
8.0
10.0
12.0
(d)
<ε> = 5.2 %
100 200 300
100
200
300
0.0
5.0
10.0
15.0
(e)
Figure 5: Strain field along the horizontal (tensile) direction calculated from DIC measurements for a mean tensile
strain 〈ε〉 up to 5 %, for the microstructures denoted A70 (a), B10 (b), C10 (c), D50 (d) and E1000+ (e). The axes are
expressed in micrometers. The microstructure boundaries are shown as black lines on these fields. An animated
figure is displayed in the on-line version only
14
0 0.05 0.1 0.15 0.20
100
200
300
400
500
600
700
True strain
Tru
e s
tress
(M
Pa)
B10
C10
D50
A70
E1000+
Figure 6: Experimental macroscopic stress-strain curve for the microstructures denoted A70, B10, C10, D50 and
E1000+
0 100 200 30050
100
150
200
250
300
ΣY
(M
Pa)
d−0.5
(m−0.5
)
Exp.
H.P.
Figure 7: Identification of the Hall-Petch (H.P.) law from the experimental yield stresses obtained for the different
tensile tests
expressed for each slip system (see AppendixA). Let us recall that the studied austenitic steel is
an FCC material with twelve slip systems, which are listed in Table 4, indexed by s and defined
by a normal ns to the slip plane and a slip direction ms. The three parameters associated with
isotropic hardening are identified by homogenization [78] from the experimental macroscopic
stress-strain data shown in Figure 6. The other parameters are set to values previously identified
using cyclic loadings [79].
The mesh of the simulations is built from that initially used for DIC analyses. The crys-
tal plasticity law implemented in the finite element code requires a 3D model. Consequently,
15

Table 4: Adopted notation for FCC slip systems
Normal vector ns (111) (111) (111) (111)
Slip directionms [101] [011] [110] [101] [011] [110] [011] [110] [101] [110] [101] [011]
System index s 1 2 3 4 5 6 7 8 9 10 11 12
because the microstructure under the surface is unknown, the initial 2D mesh is extruded perpen-
dicular to the observed surface. This choice appeared the least arbitrary and the more realistic
solution for simulating the experimental microstructure unknown in the volume compared to
other methods using for instance Voronoi tessellations [60]. Since the mesh thickness in that
direction appears to have a minor influence on the pattern of strain localization [39], the mesh
chosen for the simulations is extruded to a distance equal to its characteristic length. The trian-
gular prisms are then cut into 4-noded tetrahedra so that the final 3D mesh (usually referred to
as “quasi-2D mesh”) has one element through the thickness. Its thickness corresponds to about
20 pixels (i.e., between 1.6 and 5.6 µm), which is small compared to the specimen thickness
(1 mm) and the mean grain size.
Conversely, experimental boundary conditions are necessary for a valid description of the
substrate effects and do have a significant influence on the strain pattern [39, 80]. Such condi-
tions are more realistic than homogeneous boundary conditions. It is worth noting that DIC is
only capable of measuring in-plane displacements while the simulation may predict an out-of-
plane component. This has no consequence on the comparison performed in this work between
simulations and measurements. The out-of-plane displacements appeared to have negligible con-
sequences in the present case for macroscopic strain levels less than 5 % or even for macroscopic
strains close to 9 % in similar experimental conditions [42].
The direct link between DIC and simulations via the common surface mesh allows the exper-
imentally measured displacements to be prescribed with their time history as Dirichlet boundary
conditions on the nodes of the edges of the ROI without any additional interpolation since both
meshes are identical. The boundary conditions on the edges are not only prescribed on the sur-
16

face nodes but uniformly in the thickness. In addition, zero displacements along the normal of
the surface are prescribed on the back face. The simulations are performed up to a mean tensile
strain of 4 %, and with the assumption of small strain levels. Initial experimental orientations
obtained by EBSD are prescribed. In this study, averaged experimental orientations per grain are
considered since no lattice curvature are observed inside the grains on the EBSD inverse pole
figures for any of the studied samples. Let us stress however that the simulation allows the lattice
orientation to be updated.
5.1. Schmid’s factors
All theoretical descriptions of polycrystal plasticity require the resolved shear stress to be as-
sessed on each slip system. These microstructural factors are of importance to the study of dam-
age accumulation in polycrystals under fatigue conditions. For instance, persistent slip bands,
which induce fatigue crack initiation, are shown to appear where the highest Schmid’s factors are
reached [81, 82]. Since the Schmid’s factors are linked with mechanical heterogeneities under
cyclic loading conditions, the relevance of correlating such microstructural factors with strain
heterogeneities is investigated. For a given microstructure, the crystallographic orientations give
precious information about slip system incompatibilities and thus the potential strain pattern for
a considered loading condition. It is proposed to assess the slip activity from the Schmid’s fac-
tors. For that purpose, the resolved shear stress on each slip system s from a material standpoint
is given by
τs = σ : µs (7)
where the Schmid’s tensor µs of each slip system s is expressed with the local crystal orientation
as
µs =12
(m∗s ⊗ n
∗s + n∗s ⊗m
∗s) (8)
with
m∗s = Rms, n∗s = Rns (9)
17

where R is the rotation matrix built with the local crystal orientation. The simplest approach
assumes a uniform stress σ0 in the loading direction eL
σ = σ0eL ⊗ eL (10)
which allows the resolved shear stress to be expressed as a function of the Schmid’s factors fs
τs = σ0 fs (11)
with
fs = (eL ⊗ eL) : µs = (m∗s · eL)(n∗s · eL) (12)
However, this result relies on the strong assumption that the crystal orientation has no influence
on local stresses, namely, it ignores orientation incompatibilities that lead to local heterogenous
stress fields [14, 83]. Thus, a second approach is to assess the local stress tensor to estimate
the ‘local’ Schmid’s factors f ls . The local stress tensor σ at each time step of the finite element
simulation is considered. To keep a similar expression of the resolved shear stress (11), Von
Mises’ equivalent stress at each material point σeq is used
τs = σeq f ls (13)
with
f ls =
1σeq
(σ · n∗s) ·m∗s (14)
On the edges of the ROI, because experimental displacements are applied as boundary con-
ditions, the simulated stress field is corrupted by measurement uncertainties, and f ls as well. For
both approaches, the experimental orientations averaged over each grain have been considered.
In Figure 8, the ‘macroscopic’ Schmid’s factors fs are compared with the ‘local’ counterparts,
considering slip system s = 10 for illustration purposes. This comparison can be performed for
different levels of loading, but the ‘local’ Schmid’s factors appeared to notably change only in
18

the transitional regime (i.e., for the macroscopic tensile strain ranging from 0 to 1 %). It can be
noted that highlighted grains in which the slip system under consideration is mainly activated
according to the ‘local’ factor are quite different from those mainly activated according to the
‘macroscopic’ factor and the difference is significant for each considered time step. The same
analyses can be carried out for each slip system.
50 100 150 200
50
100
150
0
0.1
0.2
0.3
0.4
0.5
(a)
<ε> = 1.0 %
50 100 150 200
50
100
150
0
0.1
0.2
0.3
0.4
0.5
(b)
Figure 8: Schmid’s factor for slip system s = 10 computed by assuming a uniform tensile stress along the horizontal
direction (a), and from the local simulated stress fields for a mean tensile strain 〈ε〉 up to 1 % (b). The spatial axes
are expressed in micrometers. The microstructure boundaries are shown as black lines on these fields. An animated
figure (b) is displayed in the on-line version only
This result is to be expected since the ‘macroscopic’ factors do not consider local stress
heterogeneities due to orientation incompatibilities nor stress changes over time. The field of the
system index sI of the highest ‘local’ Schmid’s factor is shown in Figure 9(b) for a mean tensile
strain of 1 %. It can be directly compared to that obtained using the ‘macroscopic’ Schmid’s
factors (Figure 9(a)) or even to that obtained from the main shear strain predicted by the finite
element simulation (Figure 9(c)). If similarities can be observed with the latter the ‘macroscopic’
Schmid’s factors approach offers the poorest information without intragranular variation and the
field obtained from the ‘local’ Schmid’s factors appears much more scattered. The latter can be
explained by the fact that the full stress tensor is used to compute the Schmid’s factors, each of
its component may fluctuate locally, and because it corresponds to an instantaneous assessment
19

while the shear strain approach considers the loading history. This poor agreement shows that the
influence of neighboring grains on local slip activity, which is not incorporated in the approach
using global Schmid’s factors, should be taken into account for reaching a presumably more
accurate description.
50 100 150 200
50
100
1502
4
6
8
10
12
(a)
50 100 150 200
50
100
1502
4
6
8
10
12
(b)
50 100 150 200
50
100
1502
4
6
8
10
12
(c)
Figure 9: Field of index sI of the highest ‘macroscopic’ Schmid’s factor (a). Fields of index sI of the highest ‘local’
Schmid’s factor (b), and of the highest shear strain (c) for a mean tensile strain of 1 %. The spatial axes are expressed
in micrometers. The microstructure boundaries are shown as black lines on these fields
5.2. Plastic glide along slip systems
It is now proposed to look at plastic glide along slip systems from the DIC measurements in a
similar way as in a previous study on BCC materials [84]. The viscoplastic strain rate is assumed
to be only due to plastic glide along slip systems, which is written as
εp =
12∑s=1
γsµs (15)
where γs denotes the shear strain rate on slip system s. From this relationship, knowing the
in-plane displacement gradients from displacement measurements, an experimental assessment
of plastic glide is sought. Therefore, some hypotheses need to be made. First, the experimental
total strain rate ε is considered to be only composed of a viscoplastic part εp since the elastic
part appeared negligible (or comparable to the DIC resolution in the experiments, see Table 3),
so that
ε = εe + εp ≈ εp (16)
20

Since small perturbations are considered (in particular, small rotations), Equation (15) is inte-
grated over time
εp =
12∑s=1
γsµs (17)
Further, DIC measurements yield only 2D (i.e., in-plane) displacement gradients, while 3D com-
ponents are required in Equation (17). The assumptions of material incompressibility and that the
normal axis to the image plane z is an eigen direction are made, leading to only one component
of the strain tensor along z expressed as
εzz ≈ −εxx − εyy (18)
The system expressed in Equation (17) cannot be inverted because it involves twelve unknowns
γs for only nine equations. However, only few slip systems over the twelve candidates are gen-
erally activated [47]. To illustrate this point, Figure 10(a) shows the twelve shear strains at one
material point of the simulation during the entire loading history. In this example, only four slip
systems have been locally activated.
Let us consider the four main activated slip systems, which are denoted as sI , sII , sIII and sIV ,
and are identified by simulation at each material point and at each time step (i.e., for each SEM
image acquisition), such that
{sI , sII , sIII , sIV} ∈ [1, 12] | |γsI | ≥ |γsII | ≥ |γsIII | ≥ |γsIV | ≥ |γs j,{I,II,III,IV} | (19)
and the function η(γs), which is representative of each slip system activity relative to the total
plastic activity, is defined as
η(γs) =|γs|
12∑i=1
|γi|
(20)
The distribution of η(γs) calculated for the four main shear strains over all the Gauss points for a
mean tensile strain of 4 % is shown in Figure 10(b) as cumulative distribution functions. These
results show that the four main slip systems account, on average, for 95 % of the plastic activity.
21

Figure 10(c) shows the change over time of the mean value and corresponding standard deviation
of these distributions. It can be noted that the slip system activity fluctuates at the beginning of
the tensile test (i.e., for a macroscopic tensile strain less than 2 %) before stabilizing. The fourth
main shear strain appears not to exceed on average 10 % of the total slip activity.
As a consequence, it is assumed that the slip activity is restricted to only the four main
activated systems, which allows the system expressed in Equation (17) to be inverted. The change
over time of the field of the first main system index sI identified by simulations is shown in
Figure 11(a). It is interesting to note that two or three different systems are generally active at the
same time for each grain. At each material point, the corresponding four main shear strains are
now determined from the experimentally estimated strain tensor. The first ‘experimental’ main
shear strain field γesI
is compared to the simulated one γcsI
in Figure 11. Both simulation and
experiment lead to very similar patterns of strain localization over time. The small difference
lies in a higher scatter of γsI in the experimental case, which can be explained by the fact that
only the first four activated systems are combined to build the experimental strain tensor or
by the Schmid’s tensors µs being unchanged over time for the experimental approach. This
almost perfect agreement tends to validate the simulation of the experiments with the chosen
crystal plasticity law. In the following, results showing a more debatable agreement between
experimental observation and computations are presented.
22

0 0.01 0.02 0.03 0.040
0.005
0.01
0.015
0.02
0.025
0.03
0.035
Strain
γ
γ5
γ6
γ9
γ2
γ1
γ7
γ8
γ10
γ12
γ4
γ11
γ3
(a)
0 0.2 0.4 0.6 0.8 10
0.2
0.4
0.6
0.8
1
η
Cum
ula
tive
pro
bab
ilit
y
γI
γII
γIII
γIV
(b)
0 0.01 0.02 0.03 0.04
0
0.2
0.4
0.6
0.8
Strain
<η>
γI
γII
γIII
γIV
(c)
Figure 10: Change of the simulated absolute value of the twelve shear strains γs at one material point (a). Cumulative
distribution functions for the field η of the four main shear strains for a mean tensile strain of 4 % (b). Change of the
mean simulated value of these distributions (c). The vertical bars indicate the standard deviations of the distributions
23

<ε> = 4.0 %
50 100 150 200
50
100
1502
4
6
8
10
12
(a)
Simulated
50 100 150 200
50
100
150
Experimental
<ε> = 4.0 %
50 100 150 200
50
100
150 −0.1
−0.05
0
0.05
0.1
(b)
Figure 11: Field of indices of the main system sI for a mean tensile strain 〈ε〉 in the range of 0.1 % to about 4 % (a).
Simulated shear strain field γcsI
and experimental shear strain field γesI
for a mean tensile strain 〈ε〉 up to 4 % (b). The
spatial axes are expressed in micrometers. The microstructure boundaries are shown as black lines on these fields.
An animated figure is displayed in the on-line version only
24

5.3. Slip traces on the surface
During the in-situ tensile tests, the initially polished surfaces are progressively marked by slip
bands resulting from activated slip systems that intercept the external surface. These bands are
easily observed in SE mode, which is the reason why the BSE mode is chosen for DIC analyses.
It is proposed to simulate the intensity and orientation of these bands. From the simulation
of the experimental tests, only the two most activated slip systems contributing to out-of-plane
extrusions are selected
{sI , sII} ∈ [1, 12] | |pnsI| ≥ |pn
sII| ≥ |pn
s j,{I,II,III}| (21)
where ps is the cumulative shear strain magnitude of slip system s, and pns its projection consid-
ering the sample surface normal
ps =
∫|γs|dt (22)
with
pns = psez ·ms (23)
The intersection of the first slip system sI of normal nsI with the external surface, which is
assumed to be planar over time of normal ez, is the vector tsI expressed as
tsI = nsI × ez (24)
where the operator × is the vector product. Vector tsII is obtained in a similar manner. In Fig-
ure 12(a), these two vectors tsI and tsII are drawn as segments of length proportional to the value
of pnsI
, respectively pnsII
, for a mean tensile strain of 4 %. One SE image of the ROI has only been
acquired at the end of test, for a mean tensile strain of 22 %. By extrapolating the results shown
in Figure 10(c), the slip activity is assumed not to change notably when the mean tensile strain
varies from 4 % to 22 %. The image g(x) has been corrected by the displacement measured by
DIC, leading to g(x + u(x)), which is shown in Figure 12(b) for a Lagrangian comparison with
25
the previous numerical approach (i.e., the orientation of the slip traces are represented in the un-
deformed coordinate system). Some enlarged areas are detailed in Figures 12(c) to 12(j), which
focus on experimentally observed single or double slip, close to or far from grain boundaries.
No clear correlation can be made between numerical and experimental observations (e.g.,
location or the nature of slip). For example, single slip observed in Figure 12(d) is correctly
predicted by the simulations (Figure 12(c)), whereas for the similar situation of Figure 12(j),
the double slip suggested by the simulation is not observed experimentally. Thus, even if the
primary slip system is well predicted (Figure 11) the simulation differs in some places to the
observed slip traces. Similar results were obtained by monitoring the slip traces using atomic
force microscopy [85] with a relatively similar modeling approach. Yet the comparisons were
not presented for individual slip systems but only for the different slip families of a hexagonal
titanium and for a small number of grains. The differences between the simulation and the
experiment may not only be due to the lack of knowledge of the underlying microstructure in the
bulk but also to a constitutive model error. The fact that the SE image corresponds to a much
more advanced state of loading than the simulation can explain the differences too even if the slip
system activity seems not to fluctuate beyond a macroscopic tensile strain of 2 % (Figure 10(c)).
6. Conclusion and perspectives
In this paper, the effect of grain size on the plastic behavior of 316LN austenitic stainless
steel is studied via in-situ mechanical test within an SEM. The displacement fields are measured
via digital image correlation based on a finite-element mesh that is itself tailored to the specimen
microstructure as observed via EBSD. The mean grain size has a marked effect on the macro-
scopic yield stress and hardening. In addition, the strain fields are markedly heterogeneous with
numerous shear bands either aligned with or interrupted by grain boundaries.
To relate the plastic strain to the grain crystallographic orientation, the Schmid’s factors are
locally computed based on two different prescriptions for the local stress. Although a local eval-
uation of the stress provides a better correlation between the Schmid’s factors and plastic strains,
the agreement remains rather poor. Thus when polycrystalline structural effects are not accounted
26

0 50 100 150 200
0
20
40
60
80
100
120
140
160
(a) (b)
50 60 70
10
15
20
25
30
(c) (d)
35 40 45 50 55
45
50
55
60
65
(e) (f)
110 120 130
80
85
90
95
100
(g) (h)
170 180 190
115
120
125
130
135
(i) (j)
Figure 12: Intersection of the first (in red) and second (in blue) slip systems with the image plane z = 0 drawn for
a mean tensile strain of 4 % (a). The length of the segments is proportional to the corresponding cumulative shear
strain. The spatial axes are expressed in micrometers. The microstructure boundaries are shown as black lines on
these fields. SE image of the region of interest acquired at the end of the tensile test and corrected with the measured
displacement field (b). Four enlarged views of both figures are shown (c-j)
27

for, a local evaluation of the stress is not sufficient to predict the local deformation. For instance,
plastic strain is also triggered by strain accommodation conditions and slip transmission condi-
tions at grain boundaries. In the context of simplified, fast and efficient calculation techniques,
the results reported in this paper also suggest that mean-field homogenization models based on
individual grains (e.g., self-consistent schemes) may overlook an important contribution to the
macroscopic manifestation of plasticity and should be considered carefully. Most of the recent
improvements in homogenization procedures have been made possible by the use of second-
order moment estimates either in composite materials [86] or in polycrystals [87], which are
providing a more accurate effective response for complex loading paths without accounting for
grain-to-grain interaction. Another way of improving the homogenization models is to consider
intergranular kinematic incompatibilities [88] that may reveal mandatory to obtain satisfactory
correlations with experiments at the grain scale.
The correlation between plastic strain and grain orientation is studied by assessing plastic
glide along slip systems. It is shown that a few slip systems are simultaneously activated in each
grain. A comparison between the experimental strain measurements and the results of a numeri-
cal simulation based on crystal plasticity with the same (surface) grain morphology and measured
boundary conditions shows an excellent agreement for the major slip system and amplitude in
each grain. However, some specific regions close to grain boundaries display sometimes signif-
icant differences and the slip traces are not well predicted in some grains or in the vicinity of
some grain boundaries or triple junctions. This may either question the constitutive law used in
the crystal plasticity modeling or result from the three-dimensional bulk morphology [60, 61, 80]
that remains inaccessible by resorting to SEM imaging without post-mortem (and tedious) 3D-
EBSD reconstructions based on serial sectioning [89]. An alternative method to obtain the 3D
microstructure is diffraction contrast tomography [90] but it is currently limited by its resolution
(minimum voxel dimension) by the maximum number of grains in the specimen and suffers in
presence of lattice curvature among other issues. Although it is now possible to conduct stud-
ies with having access to the 3D microstructure, this is not yet possible for every material and
several applications may consider only using a 2D information when possible and relevant. As
previously observed [58] the correlations obtained with a macroscopic Schmid’s factor are not
28

satisfactory at the surface of general polycrystals but significant improvements are observed in
this work when a more local approach is adopted.
Last, in this study the description of grain boundaries is simply defined as geometrical sur-
faces associated with a misorientation between grains and with no strain gradient dependence in
the plasticity law accounting for GNDs as explored in several works [34, 37, 91]. A mechanical
description in polycrystals using strain gradient plasticity together with specific constitutive laws
for grain boundaries may be investigated in future studies.
Acknowledgements
The authors acknowledge the financial support of EDF within R&D LOCO and PERFORM60
(www.perform60.net) projects. Michel Mahe, Nicolas Brynaert and the Electronic Microscopy
Laboratory of Les Renardieres are thanked for their help in preparing and conducting the SEM
acquisitions. Francois Curtit, Ghiath Monnet, Nicolas Rupin and Charles Toulemonde are thanked
for fruitful discussions.
29

AppendixA. Constitutive equations of the chosen crystal plasticity law and parameters
The crystal plasticity model chosen in this study has been proposed by Meric et al. [77]. Its
relationships are expressed for each of the 12 octahedral slip systems s as
γs = psτs − cαs
| τs − cαs |(A.1)
ps =
⟨| τs − cαs | −Rs(ps)
k
⟩n
+
(A.2)
Rs = R0 + q
12∑r=1
hsr
(1 − e−bpr
) (A.3)
αs = γs − dαs ps (A.4)
where c, k, n, R0, q, b, d are constitutive parameters, and hsr the coefficients of the interaction
matrix between slip systems detailed in Table A.5. The brackets 〈.〉+ are the positive part of
their argument. The values of the material-dependent parameters used in the simulations for the
microstructure A70 are given in Table A.6.
30

Table A.5: Interaction matrix between slip systems. The nomenclature of slip systems is given in Table 4
1 2 3 4 5 6 7 8 9 10 11 12
1 h1 h2 h2 h4 h5 h5 h5 h6 h3 h5 h3 h6
2 h1 h2 h5 h3 h6 h4 h5 h5 h5 h6 h3
3 h1 h5 h6 h3 h5 h3 h6 h4 h5 h5
4 h1 h2 h2 h6 h5 h3 h6 h3 h5
5 h1 h2 h3 h5 h6 h5 h5 h4
6 h1 h5 h4 h5 h3 h6 h5
7 h1 h2 h2 h6 h5 h3
8 h1 h2 h3 h5 h6
9 h1 h5 h4 h5
10 h1 h2 h2
11 h1 h2
12 h1
Table A.6: Values of the parameters of the crystal plasticity law [77] used in the study
n k R0 q b c d h1 h2 h3 h4 h5 h6
11 12 MPa.s−n 52 MPa 220 MPa 1.0 40 GPa 1.5 GPa 1.0 1.0 0.6 12.3 1.6 1.8
31
References
[1] T. Jayakumar, M.D. Mathew, and K. Laha. High Temperature Materials for Nuclear Fast
Fission and Fusion Reactors and Advanced Fossil Power Plants. Procedia Engineering,
55:259–270, 2013.
[2] M. Kamaya, and M. Itakura. Simulation for intergranular stress corrosion cracking based on
a three-dimensional polycrystalline model. Engineering Fracture Mechanics, 76:386–401,
2009.
[3] M.D. McMurtrey, G.S. Was, L. Patrick, and D. Farkas. Relationship between localized
strain and irradiation assisted stress corrosion cracking in an austenitic alloy. Materials
Science and Engineering, 528:3730–3740, 2011.
[4] T. Couvant, L. Legras, T. Ghys, P. Gambier, N. Huin, and G. Ilevbare. Strain path effect
on IGSCC initiation and oxidation of alloy 182 exposed to PWR primary water. in 15th
International Conference on Environmental Degradation of Materials in Nuclear Power
Systems-Water Reactors, Colorado Springs: TMS, 2011.
[5] O. Diard, S. Leclercq, G. Rousselier, and G. Cailletaud. Evaluation of finite element based
analysis of 3D multicrystalline aggregates plasticity: Application to crystal plasticity model
identification and the study of stress and strain fields near grain boundaries. International
Journal of Plasticity, 21:691–722, 2005.
[6] A. Musienko, and G. Cailletaud. Simulation of inter- and transgranular crack propagation
in polycrystalline aggregates due to stress corrosion cracking. Acta Materialia, 57:3840–
3855, 2009.
[7] T.R. Bieler, P. Eisenlohr, F. Roters, D. Kumar, D.E. Mason, M.A. Crimp, and D. Raabe.
The role of heterogeneous deformation on damage nucleation at grain boundaries in single
phase metals. International Journal of Plasticity, 25:1655–1683, 2009.
[8] I. Simonovski, and L. Cizelj. Cohesive element approach to grain level modelling of inter-
granular cracking. Engineering Fracture Mechanics, 110:364–377, 2013.
32

[9] R.A. Lebensohn, R. Brenner, O. Castelnau, and A.D. Rollett. Orientation image-based
micromechanical modelling of subgrain texture evolution in polycrystalline copper. Acta
Materialia 56:3914-3926, 2008.
[10] R.A. Lebensohn, A.K. Kanjarla, and P. Eisenlohr. An elasto-viscoplastic formulation based
on fast Fourier transforms for the prediction of micromechanical fields in polycrystalline
materials. International Journal of Plasticity 32-33:59–69, 2012.
[11] A.K. Kanjarla, R.A. Lebensohn, L. Balogh, and C.N. Tome. Study of internal lattice strain
distributions in stainless steel using a full-field elasto-viscoplastic formulation based on fast
Fourier transforms. Acta Materialia, 60:3094–3106, 2012.
[12] R. Brenner, and P. Suquet. Overall response of viscoelastic composites and polycrystals:
exact asymptotic relations and approximate estimates. International Journal of Solids and
Structures, 50:1824–1838, 2013.
[13] P. Eisenlohr, M. Diehl, R.A. Lebensohn, and F. Roters. A spectral method solution to crystal
elasto-viscoplasticity at finite strains. International Journal of Plasticity 46:37–53, 2013.
[14] F. Roters, P. Eisenlohr, L. Hantcherli, D.D. Tjahjanto, T.R. Bieler, and D. Raabe. Overview
of constitutive laws, kinematics, homogenization and multiscale methods in crystal plastic-
ity finite-element modeling: Theory, experiments, applications. Acta Materialia, 58:1152–
1211, 2010.
[15] L. Priester. ”Dislocation-interface” interaction – stress accommodation processes at inter-
faces. Materials Science and Engineering: A, 309–310:430–439, 2001.
[16] J. Jiang, T.B. Britton, and A.J. Wilkinson. Measurement of geometrically necessary dis-
location density with high resolution electron backscatter diffraction: Effects of detector
binning and step size. Ultramicroscopy, 125:1–9, 2013.
[17] T. Ohashi, R.I. Barabash, J.W.L. Pang, G.E. Ice, and O.M. Barabash. X-ray microdiffraction
and strain gradient crystal plasticity studies of geometrically necessary dislocations near a
Ni bicrystal grain boundary. International Journal of Plasticity 25:920–941, 2009.
33

[18] C. Perrin, S. Berbenni, H. Vehoff, and M. Berveiller. Role of discrete intragranular slip
on lattice rotations in polycrystalline Ni: Experimental and micromechanical studies. Acta
Materialia, 58:4639–4649, 2010.
[19] N.A. Fleck, and J.W. Hutchinson. A phenomenological theory for strain gradient effects in
plasticity. Journal of the Mechanics and Physics of Solids, 41:1825–1857, 1993.
[20] H. Gao, Y. Huang, W.D. Nix, and J.W. Hutchinson. Mechanism-based strain gradient
plasticity – I. Theory. Journal of the Mechanics and Physics of Solids, 47:1239–1263,
1999.
[21] Z. Xue, Y. Huang, and M. Li. Particle size effect in metallic materials: a study by the theory
of mechanism-based strain gradient plasticity. Acta Materialia, 50:149–160, 2002.
[22] M.E. Gurtin. A gradient theory of single-crystal viscoplasticity that accounts for geomet-
rically necessary dislocations. Journal of the Mechanics and Physics of Solids, 50:5–32,
2002.
[23] S. Forest, F. Barbe, and G. Cailletaud. Cosserat modelling of size effects in the mechanical
behaviour of polycrystals and multi-phase materials. International Journal of Solids and
Structures, 37:7105–7126, 2000.
[24] P. Neff. A finite-strain elastic-plastic Cosserat theory for polycrystals with grain rotations.
International Journal of Engineering Science, 44:574–594, 2006.
[25] B. Klusemann, and T. Yalcinkaya. Plastic deformation induced microstructure evolution
through gradient enhanced crystal plasticity based on a non-convex Helmholtz energy. In-
ternational Journal of Plasticity 48:168–188, 2013.
[26] J.R. Mayeur, and D.L. McDowell. A comparison of Gurtin type and micropolar theories of
generalized single crystal plasticity. International Journal of Plasticity 57:29–51, 2014.
[27] M.F. Ashby. The deformation of plastically non-homogeneous alloys. Philosophical Mag-
azine, 21:399–424, 1970.
34

[28] A. Acharya, and A.J. Beaudoin. Grain-size effect in viscoplastic polycrystals at moderate
strains. Journal of the Mechanics and Physics of Solids, 48:2213-2230, 2000.
[29] A.J. Beaudoin, A. Acharya, S.R. Chen, D.A. Korzekwa, and M.G. Stout. Consideration
of grain-size effect and kinetics in the plastic deformation of metal polycrystals. Acta
Materialia, 48:3409–3423, 2000.
[30] M.G.D. Geers, W.A.M. Brekelmans, and P.J.M. Janssen. Size effects in miniaturized poly-
crystalline {FCC} samples: Strengthening versus weakening. International Journal of
Solids and Structures, 43:7304–7321, 2006.
[31] A.G. Evans, and J.W. Hutchinson. A critical assessment of theories of strain gradient plas-
ticity. Acta Materialia, 57:1675–1688, 2009.
[32] C. Keller, E. Hug, A.M. Habraken, and L. Duchene. Finite element analysis of the free
surface effects on the mechanical behavior of thin nickel polycrystals. International Journal
of Plasticity, 29:155–172, 2012.
[33] B.W. Baker, T.R. McNelley and, L.N. Brewer. Grain size and particle dispersion effects
on the tensile behavior of friction stir welded {MA956} oxide dispersion strengthened steel
from low to elevated temperatures. Materials Science and Engineering: A, 589:217–227,
2014.
[34] N.M. Cordero, S. Forest, E.P. Busso, S. Berbenni, and M. Cherkaoui. Grain size effects
on plastic strain and dislocation density tensor fields in metal polycrystals. Computational
Materials Science, 52:7–13, 2012.
[35] K.S. Cheong, E.P. Busso, and A. Arsenlis. A study of microstructural length scale effects on
the behaviour of {FCC} polycrystals using strain gradient concepts. International Journal
of Plasticity, 21:1797–1814, 2005.
[36] V. Taupin, S. Berbenni, C. Fressengeas, and O. Bouaziz. On particle size effects: An
internal length mean field appraoch using field dislocation mechanics. Acta Materialia,
58:5532–5544, 2010.
35

[37] V. Taupin, S. Berbenni, and C. Fressengeas. Size effects on the hardening of channel-type
microstructures: A field dislocation mechanics-based approach. Acta Materialia, 60:664–
673, 2012.
[38] H.-J. Chang, A. Gaubert, M. Fivel, S. Berbenni, O. Bouaziz, and M. Cherkaoui. Analysis
of particle induced dislocation structures using three-dimensional dislocation dynamics and
strain gradient plasticity. Computational Materials Science, 52:33–39, 2012.
[39] E. Heripre, M. Dexet, J. Crepin, L. Gelebart, A. Roos, M. Bornert, and D. Caldemai-
son. Coupling between experimental measurements and polycrystal finite element calcula-
tions for micromechanical study of metallic materials. International Journal of Plasticity,
23:1512–1539, 2007.
[40] A. Ma, F. Roters, and D. Raabe. On the consideration of interactions between dislocations
and grain boundaries in crystal plasticity finite element modeling - Theory, experiments,
and simulations. Acta Materialia, 54:2181–2194, 2006.
[41] A. Ma, F. Roters, and D. Raabe. Studying the effect of grain boundaries in dislocation
density based crystal-plasticity finite element simulations. International Journal of Solids
and Structures, 43:7287–7303, 2006.
[42] E. Soppa, P. Doumalin, P. Binkele, T. Wiesendanger, M. Bornert, and S. Schmauder. Ex-
perimental and numerical characterisation of in-plane deformation in two-phase materials.
Computational Materials Science, 21:261-275, 2001.
[43] M.A. Sutton, N. Li, D.C. Joy, A.P. Reynolds, and X. Li. Scanning electron microscopy for
quantitative small and large deformation measurements part i: Sem imaging at magnifica-
tions from 200 to 10.000. Experimental Mechanics, 47:775–787, 2007.
[44] M.A. Sutton, N. Li, D. Garcia, N. Cornille, J.-J. Orteu, S.R. McNeill, H.W. Schreier, X. Li,
and A.P. Reynolds. Scanning electron microscopy for quantitative small and large deforma-
tion measurements part ii: Experimental validation for magnifications from 200 to 10.000.
Experimental Mechanics, 47:789–804, 2007.
36

[45] M.A. Tschopp, B.B. Bartha, W.J. Porter, P.T. Murray, and S.B. Fairchild. Microstructure-
dependent local strain behavior in polycrystals through in situ scanning electron microscope
tensile experiments. Metallurgical Transactions A, 40:2363–2368, 2009.
[46] A.D. Kammers, and S. Daly. Digital Image Correlation under Scanning Electron Mi-
croscopy: Methodology and Validation. Experimental Mechanics, 53:1746–1761, 2013.
[47] W.Z. Abuzaid, M.D. Sangid, J.D. Carroll, H. Sehitoglu, and J. Lambros. Slip transfer
and plastic strain accumulation across grain boundaries in Hastelloy X. Journal of the
Mechanics and Physics of Solids, 60:1201–1220, 2012.
[48] J.L.W. Carter, M.W. Kuper, M.D. Uchic, and M.J. Mills. Characterization of localized de-
formation near grain boundaries of superalloy Rene-104 at elevated temperature. Materials
Science and Engineering: A, 605:127–136, 2014.
[49] H. Jin, W.-Y. Lu, and J. Korellis. Micro-scale deformation measurement using the digital
image correlation technique and scanning electron microscope imaging. Journal of Strain
Analysis for Engineering Design, 43:719-728, 2008.
[50] H. Jin, W.-Y. Lu, S. Haldar, and H.A. Bruck. Microscale characterization of granular de-
formation near a crack tip. Journal of Materials Science, 46:6596–6602, 2011.
[51] S.R. McNeill, W.H. Peters, and M.A. Sutton. Estimation of stress intensity factor by digital
image correlation. Engineering Fracture Mechanics, 28:101–112, 1987.
[52] J.D. Carroll, W. Abuzaid, J. Lambros, and H. Sehitoglu. High resolution digital image
correlation measurements of strain accumulation in fatigue crack growth. International
Journal of Fatigue, 57:140–150, 2013.
[53] C.C. Tasan, M. Diehl, D. Yan, C. Zambaldi, P. Shanthraj, F. Roters, and D. Raabe. In-
tegrated experimental-simulation analysis of stress and strain partitioning in multiphase
alloys. Acta Materialia, 81:386–400, 2014.
37

[54] G. Martin, C.W. Sinclair, and R.A. Lebensohn. Microscale plastic strain heterogeneity in
slip dominated deformation of magnesium alloy containing rare earth. Materials Science
and Engineering: A, 603:37–51, 2014.
[55] C.C. Tasan, J.P.M., Hoefnagels, M. Diehl, D. Yan, F. Roters, and D. Raabe. Strain local-
ization and damage in dual phase steels investigated by coupled in-situ deformation exper-
iments and crystal plasticity simulations. International Journal of Plasticity, 63:198–210,
2014.
[56] H. Lim, J.D. Carroll, C.C. Battaile, T.E. Buchheit, B.L. Boyce, and C.R. Weinberger. Grain-
scale experimental validation of crystal plasticity finite element simulations of tantalum
oligocrystals. International Journal of Plasticity, 60:1–18, 2014.
[57] H. Lim, J.D. Carroll, C.C. Battaile, B.L. Boyce, and C.R. Weinberger. Quantitative compar-
ison between experimental measurements and CP-FEM predictions of plastic deformation
in a tantalum oligocrystal. International Journal of Plasticity, 92:98–108, 2015.
[58] J.D. Carroll, B.G. Clark, T.E. Buchheit, B.L. Boyce, and C.R. Weinberger. An experimental
statistical analysis of stress projection factors in BCC tantalum. Materials Science and
Engineering: A, 581:108–118, 2013.
[59] H. Li, D.E. Mason, T.R. Bieler, C.J. Boehlert, and M.A.Crimp. Methodology for estimating
the critical resolved shear stress ratios of α-phase Ti using EBSD-based trace analysis. Acta
Materialia, 61:7555–7567, 2013.
[60] A. Zeghadi, F. N’Guyen, S. Forest, A.-F. Gourgues, and O. Bouaziz. Ensemble averaging
stress-strain fields in polycrystalline aggregates with a constrained surface microstructure -
Part 1: Anisotropic elastic behaviour. Philosophical Magazine, 87:1401–1424, 2007.
[61] A. Zeghadi, S. Forest, A.-F. Gourgues, and O. Bouaziz. Ensemble averaging stress-strain
fields in polycrystalline aggregates with a constrained surface microstructure - Part 2: crys-
tal plasticity. Philosophical Magazine, 87:1425–1446, 2007.
38

[62] M. Montagnat, O. Castelnau, P.D. Bons, S.H. Faria, O. Gagliardini, F. Gillet-Chaulet,
F. Grennerat, A. Griera, R.A Lebensohn, H. Moulinec, J. Roessiger, and P. Suquet. Mul-
tiscale modeling of ice deformation behavior. Journal of Structural Geology, 61:78–108,
2014.
[63] J. Schwartz, O. Fandeur, and C. Rey. Fatigue crack initiation modeling of 316LN steel
based on non local plasticity theory. Procedia Engineering, 2:1353–1362, 2010.
[64] G.V. Prasad Reddy, C. Robertson, C. Depres, and M. Fivel. Effect of grain disorientation
on stage I fatigue crack retardation in FCC poly-crystals: a three dimensional dislocation
dynamics investigation. Acta Materialia, 61:5300–5310, 2013.
[65] A. Guery, F. Latourte, F. Hild, and S. Roux. Characterization of SEM speckle pattern
marking and imaging distortion by digital image correlation. Measurement Science and
Technology, 25:12pp, 2014.
[66] H. Leclerc, J.N. Perie, S. Roux, and F. Hild. Integrated digital image correlation for the
identification of mechanical properties. MIRAGE 2009, LNCS, 5496:161–171, 2009.
[67] Z. Tomicevic, F. Hild, and S. Roux. Mechanics-aided digital image correlation. Journal of
Strain Anal. Eng. Des., 48:330–343, 2013.
[68] G. Besnard, F. Hild, and S. Roux. “Finite-Element” displacement fields analysis from digi-
tal images: Application to Portevin-Le Chatelier bands. Experimental Mechanics, 46:789–
803, 2006.
[69] J. Rethore, F. Hild, and S. Roux. Shear-band capturing using a multiscale extended digital
image correlation technique. Computer Methods in Applied Mechanics and Engineering,
196:5016–5030, 2007.
[70] J. Rethore, G. Besnard, G. Vivier, F. Hild, and S. Roux. Solutions of ill-posed problems.
Philosophical Magazine, 88:3339–3355, 2008.
39

[71] A.N. Tikhonov, and V.Y. Arsenin. Solutions of ill-posed problems. J. Wiley, New York
(USA), 1977.
[72] S. Roux, F. Hild, and H. Leclerc. Mechanical Assistance to DIC. Procedia IUTAM, 4:159–
168, 2012.
[73] K. Kunze, S.I. Wright, B.L. Adams, and D.J. Dingley. Advances in automatic EBSP single
orientation measurements. Textures and Microstructures, 20:41–54, 1993.
[74] G. Nolze. Image distortions in SEM and their influences on EBSD measurements. Ultra-
microscopy, 107:172–183, 2007.
[75] N.J. Petch. The cleavage strength of polycrystals. Journal of the Iron and Steel Institute,
174:25–28, 1953.
[76] http://www.code-aster.org/.
[77] L. Meric, P. Poubanne, and G. Cailletaud. Single crystal modeling for structural calcu-
lations: Part 1 - Model Presentation. Journal of Engineering Materials and Technology,
113:162–170, 1991.
[78] M. Berveiller, and A. Zaoui. An extension of the self-consistent scheme to plastically
flowing polycrystal. Journal of the Mechanics and Physics of Solids, 26:325–344, 1979.
[79] Y. Guilhem, S. Basseville, F. Curtit, J.-M. Stephan, and G. Cailletaud. Investigation of the
effect of grain clusters on fatigue crack initiation in polycrystals. International Journal of
Fatigue, 32:1748–1763, 2010.
[80] C. Zhang, H. Li, P. Eisenlohr, W. Liu, C.J. Boehlert, M.A. Crimp, and T.R. Bieler. Effect
of realistic 3D microstructure in crystal plasticity finite element analysis of polycrystalline
Ti-5Al-2.5Sn. International Journal of Plasticity, 69:21–35, 2015.
[81] P. Villechaise, L. Sabatier, and J.C. Girard. On slip band features and crack initiation in
fatigued 316L austenitic stainless steel: Part 1: Analysis by electron back-scattered diffrac-
40
tion and atomic force microscopy. Materials Science and Engineering: A, 323:377–385,
2002.
[82] J. Miao, T.M. Pollock, and J.W. Jones. Crystallographic fatigue crack initiation in nickel-
based superalloy Rene 88DT at elevated temperature. Acta Materialia, 57:5964–5974,
2009.
[83] B. Klusemann, B. Svendsen, and H. Vehoff. Modeling and simulation of deformation be-
havior, orientation gradient development and heterogeneous hardening in thin sheets with
coarse texture. International Journal of Plasticity, 50:109–126, 2013.
[84] F. Latourte, N. Rupin, M. He, A. Parrot, and S. Leclercq. Full field measurements used for
assessing industrial issues - two examples. Procedia IUTAM, 4:92–105, 2012.
[85] Y. Yang, L. Wang, T.R. Bieler, P. Eisenlohr, and M.A. Crimp. Quantitative AFM char-
acterization and crystal plasticity finite element modeling of heterogeneous deformation
in commercial purity titanium. Metallurgical and Materials Transactions A, 42:636–644,
2011.
[86] N. Lahellec, and P. Suquet. Effective response and field statistics in elasto-plastic and
elasto-viscoplastic composites under radial and non-radial loadings. International Journal
of Plasticity, 42:1–30, 2013.
[87] Y. Liu, and P.P. Castaneda. Second-order theory for the effective behavior and field fluctua-
tions in viscoplastic polycrystals. Journal of the Mechanics and Physics of Solids, 52:467–
495, 2004.
[88] D.D. Tjahjanto, P. Eisenlohr, and F. Roters. A novel grain cluster-based homogenization
scheme. Modelling and Simulation in Materials Science and Engineering, 52:21pp, 2010.
[89] J. Schwartz, O. Fandeur, and C. Rey. Numerical approach of cyclic behaviour of 316LN
stainless steel based on a polycrystal modelling including strain gradients. International
Journal of Fatigue, 55:202–212, 2013.
41

[90] A. King, G. Johnson, D. Engelberg, W. Ludwig, and J. Marrow. Observations of inter-
granular stress corrosion cracking in a grain-mapped polycrystal. Science, 321:382–385,
2008.
[91] T. Mayama, T. Ohashi, and R. Kondou. Geometrically necessary dislocation structure orga-
nization in FCC bicrystal subjected to cyclic plasticity. International Journal of Plasticity,
25:2122–2140, 2009.
42