Low-temperature synthesis of FeTe0.5Se0.5 polycrystals with a high transport critical current...
12
Low-temperature Synthesis of FeTe 0.5 Se 0.5 Polycrystals with a High Transport Critical Current Density Qing-Ping Ding 1,2 , Shyam Mohan 1 , Yuji Tsuchiya 1 , Toshihiro Taen 1 , Yasuyuki Nakajima 1,2 and Tsuyoshi Tamegai 1,2 1 Department of Applied Physics, The University of Tokyo, 7-3-1 Hongo, Bunkyo-ku, Tokyo 113-8656, Japan 2 JST, Transformative Research-Project on Iron Pnictides (TRIP), 7-3-1 Hongo, Bunkyo-ku, Tokyo 113-8656, Japan PACS: 74.70.Xa, 74.25.F-, 74.25.Ha, 74.25.Sv, 74.62.Bf Abstract. We have prepared high-quality polycrystalline FeTe 0.5 Se 0.5 at temperature as low as 550°C. The transport critical current density evaluated by the current-voltage characteristics is over 700 A/cm 2 at 4.2 K under zero field, which is several times larger than FeTe 0.5 Se 0.5 superconducting wires. The critical current density estimated from magneto-optical images of flux penetration is also similar to this value. The upper critical field of the polycrystalline FeTe 0.5 Se 0.5 at T = 0 K estimated by Werthamer-Helfand-Hohenberg theory is 585 kOe, which is comparable to that of single crystals. This study gives some insight into how to improve the performance of FeTe 0.5 Se 0.5 superconducting wires. Motivated by the discovery of superconductivity in oxypnictide LaFeAsO 1-x F x with a critical temperature T c ~ 26 K, a series of iron-based superconductors have been synthesized in a short time [1-8]. Among these compounds, FeSe and FeTe 1-x Se x (11 system) attracted much attention because of its simpler planar crystal structure than layered iron-pnictides. Therefore, they are better candidates to investigate the underlying mechanism of superconductivity in the iron-based system. The lower toxicity and less sensitivity to atmosphere of starting materials also make 11 system more promising compared with iron-pnictide superconductors. Although the transition temperature, T c , is not very high in this 11 system, it can be enhanced to as high as 37 K by applying pressure [9, 10]. Recently, by introducing alkali metal K (Cs, Rb) into this 11 system to form a ternary compound, T c is increased up to 30 K [11-13]. In addition to the very simple crystal structure, the very high values of upper critical field make this system a potential candidate for practical applications [14-18]. Also critical current density, J c , in a high-quality single crystal is reported to be over 1×10 5 A/cm 2 [18-20]. Superconducting wires made from FeTe 0.5 Se 0.5 have been reported, but the transport critical current density is restricted to ~ 230 A/cm 2 at 4.2 K even under zero field [21-23]. Polycrystalline samples of iron-based superconductors in general have the problem of weak links. In order to improve the performance of FeTe 1-x Se x wires, it is essential to investigate the performance of FeTe 1-x Se x polycrystals and how to reduce the weak-link features. We have reported FeTe 1-x Se x polycrystals prepared at higher temperatures, 600°C ~ 680°C, with less impurities [24]. Since the grain sizes prepared at higher temperatures are too large, weak links between grains are particularly obvious. Here we report the low-temperature synthesis and characterization of high quality FeTe 1-x Se x polycrystalline sample. The characterization through X-ray diffraction, magnetization, resistivity, transport critical current density, and magneto-optical measurements are discussed. FeTe 0.5 Se 0.5 polycrystalline samples were synthesized by solid-state reaction method. Stoichiometric amounts of Fe powder (Kojundo Chemical Laboratory, 99.9%), Te grains (same as above, 99.9999%), and Se grains (same as above, 99.9%) were weighed, mixed and ground with an agate mortar and pestle. The mixing and grinding processes were carried out
-
Upload
independent -
Category
Documents
-
view
4 -
download
0
Transcript of Low-temperature synthesis of FeTe0.5Se0.5 polycrystals with a high transport critical current...

Low-temperature Synthesis of FeTe0.5Se0.5 Polycrystals
with a High Transport Critical Current Density
Qing-Ping Ding
1,2, Shyam Mohan
1, Yuji Tsuchiya
1, Toshihiro Taen
1,
Yasuyuki Nakajima1,2
and Tsuyoshi Tamegai1,2
1Department of Applied Physics, The University of Tokyo, 7-3-1 Hongo, Bunkyo-ku,
Tokyo 113-8656, Japan 2JST, Transformative Research-Project on Iron Pnictides (TRIP), 7-3-1 Hongo,
Bunkyo-ku, Tokyo 113-8656, Japan
PACS: 74.70.Xa, 74.25.F-, 74.25.Ha, 74.25.Sv, 74.62.Bf
Abstract. We have prepared high-quality polycrystalline FeTe0.5Se0.5 at temperature
as low as 550°C. The transport critical current density evaluated by the current-voltage
characteristics is over 700 A/cm2 at 4.2 K under zero field, which is several times larger
than FeTe0.5Se0.5 superconducting wires. The critical current density estimated from
magneto-optical images of flux penetration is also similar to this value. The upper
critical field of the polycrystalline FeTe0.5Se0.5 at T = 0 K estimated by
Werthamer-Helfand-Hohenberg theory is 585 kOe, which is comparable to that of
single crystals. This study gives some insight into how to improve the performance of
FeTe0.5Se0.5 superconducting wires.
Motivated by the discovery of superconductivity in oxypnictide LaFeAsO1-xFx with a critical
temperature Tc ~ 26 K, a series of iron-based superconductors have been synthesized in a
short time [1-8]. Among these compounds, FeSe and FeTe1-xSex (11 system) attracted much
attention because of its simpler planar crystal structure than layered iron-pnictides. Therefore,
they are better candidates to investigate the underlying mechanism of superconductivity in the
iron-based system. The lower toxicity and less sensitivity to atmosphere of starting materials
also make 11 system more promising compared with iron-pnictide superconductors. Although
the transition temperature, Tc, is not very high in this 11 system, it can be enhanced to as high
as 37 K by applying pressure [9, 10]. Recently, by introducing alkali metal K (Cs, Rb) into
this 11 system to form a ternary compound, Tc is increased up to 30 K [11-13]. In addition to
the very simple crystal structure, the very high values of upper critical field make this system
a potential candidate for practical applications [14-18]. Also critical current density, Jc, in a
high-quality single crystal is reported to be over 1×10⁵ A/cm
2 [18-20]. Superconducting
wires made from FeTe0.5Se0.5 have been reported, but the transport critical current density is
restricted to ~ 230 A/cm2 at 4.2 K even under zero field [21-23]. Polycrystalline samples of
iron-based superconductors in general have the problem of weak links. In order to improve
the performance of FeTe1-xSex wires, it is essential to investigate the performance of
FeTe1-xSex polycrystals and how to reduce the weak-link features. We have reported
FeTe1-xSex polycrystals prepared at higher temperatures, 600°C ~ 680°C, with less impurities
[24]. Since the grain sizes prepared at higher temperatures are too large, weak links between
grains are particularly obvious. Here we report the low-temperature synthesis and
characterization of high quality FeTe1-xSex polycrystalline sample. The characterization
through X-ray diffraction, magnetization, resistivity, transport critical current density, and
magneto-optical measurements are discussed.
FeTe0.5Se0.5 polycrystalline samples were synthesized by solid-state reaction method.
Stoichiometric amounts of Fe powder (Kojundo Chemical Laboratory, 99.9%), Te grains
(same as above, 99.9999%), and Se grains (same as above, 99.9%) were weighed, mixed and
ground with an agate mortar and pestle. The mixing and grinding processes were carried out

in nitrogen-filled glove box. The ground powder was cold-pressed into pellets with 600
kg/cm2 uniaxial pressure. The pellets were sealed in an evacuated quartz tube, and slowly
ramped to 550°C in 5 hours from room temperature, and kept for 24 hours. After cooling to
room temperature naturally, the reacted pellets were reground, pressed (1800 kg/cm2 uniaxial
pressure), sealed in a quartz tube, sintered again at 550°C for 24 h, and finally annealed at
400°C for 24 h, followed by quenching. When the sintering temperature is lower than 500°C
and higher than 400°C, although 11 phase can be formed, there are more impurities, and the
superconducting volume fraction is very small.
The phase identification of the sample was carried out by means of powder X-ray diffraction
(M18XHF, MAC Science) with Cu-Kα radiation generated at 40kV and 200 mA. Bulk
magnetization is measured by a superconducting quantum interference device SQUID
magnetometer (MPMS-5XL, Quantum Design). The microstructures were characterized by
Scanning Electron Microscopy (SEM, Hitachi S-4300) operated at 15 kV. Resistivity and
current-voltage (I-V) measurements were performed by four-probe method with silver paste
for contact. Resistivity measurements were performed within the sample chamber of a
SQUID magnetometer. I-V measurements were performed in a bath type cryostat
(Spectromag, Oxford Instruments). For local magnetic characterization, we applied
magneto-optical (MO) imaging. For this purpose, the sample was cut using a wire saw, and
the surface was polished with a lapping film. A Bi-substituted iron-garnet indicator film is
placed in direct contact with the sample, and the whole assembly is attached to the cold finger
of a He-flow cryostat (Microstat-HR, Oxford Instruments) and cooled down to 5 K. MO
images are acquired by using a cooled CCD camera with 12-bit resolution (ORCA-ER,
Hamamatsu). To enhance the visibility of the local magnetic induction and eliminate the
signals from the impurity phases, a differential imaging technique is employed [25, 26].
Figure 1(a) shows the X-ray diffraction pattern of as-prepared polycrystalline sample. All the
peaks were well indexed using a space group of P4/nmm except for small peaks as an
impurity phase marked by asterisks. The compound crystallizes in a tetragonal structure and
the impurity phase is identified as hexagonal Fe7Se8. The calculated lattice constants are a =
0.3799 nm, and c = 0.5980 nm, which are slightly smaller than the samples prepared at higher
temperatures (a = 0.3800 nm, and c = 0.6011 nm) and single crystals [19, 27]. Figure 1(b) is
the SEM image of this sample. From this image, a typical grain size is ~ 10 μm or less
although with a broad size distribution. The grains are sheet-like with the ratio of width (w) to
thickness (t) may be larger than 10. Although the amount of impurities of this sample is
higher than the sample prepared at commonly used higher temperature at 600-680°C [24], the
average grain size has been reduced from 50 ~ 100 μm to less than 10 μm. Temperature
dependences of zero-field-cooled (ZFC) and field-cooled (FC) magnetization at 5 Oe of the
FeTe1-xSex polycrystalline sample are shown in Fig. 1(c). The sample shows an onset of
diamagnetism at around 12.5 K. The feature of two transitions, which is due to weak links
between grain boundaries and appeared in many FeTe1-xSex polycrystalline samples prepared
at higher temperatures [22, 24], is suppressed in our present sample. So we think the
reduction of grain size is beneficial to the grain boundaries.
Figure 2(a) shows temperature dependence of the resistivity of the sample. The room
temperature resistivity is 690 μΩ cm. The resistivity shows semiconducting behavior above
150 K, and shows metallic behavior in the normal state below 150 K. A sharp drop in
resistivity was observed at about 14.3 K, which indicates the onset of superconductivity. The
zero resistance occurs at 12.5 K and the transition width is 1.8 K. The residual resistivity ratio
ρ(300 K)/ρ(Tconset
) is 2.06. Similar temperature dependence of resistivity is reported for
samples with compositions close to FeTe0.5Se0.5 [19, 22, 27-31]. This behavior has been
attributed to weak charge-carrier localization due to a large amount of excess Fe in
Fe1+yTe1-xSex system [27]. The value of resistivity in our polycrystalline sample is larger than
Ref [27], but similar to Ref [19], and lower than that reported in Refs [22, 28, 29]. The
intrinsic microscopic inhomogeneities of polycrystalline sample and impurity phase may be
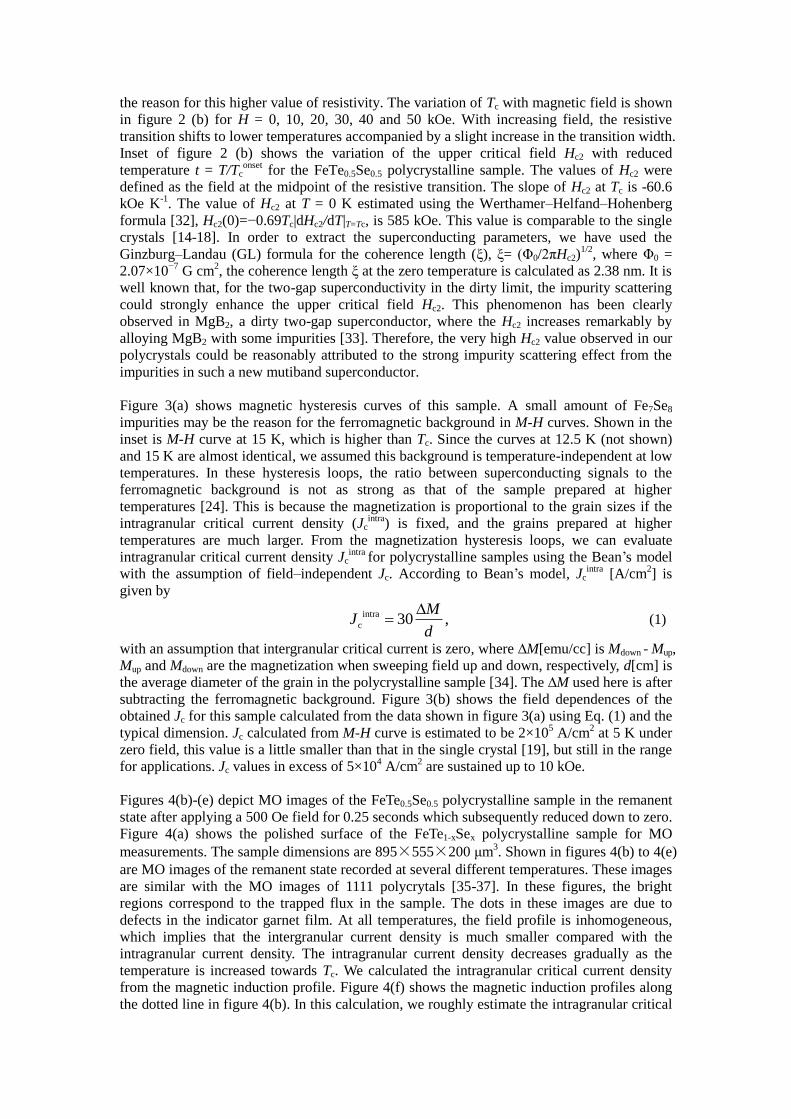
the reason for this higher value of resistivity. The variation of Tc with magnetic field is shown
in figure 2 (b) for H = 0, 10, 20, 30, 40 and 50 kOe. With increasing field, the resistive
transition shifts to lower temperatures accompanied by a slight increase in the transition width.
Inset of figure 2 (b) shows the variation of the upper critical field Hc2 with reduced
temperature t = T/Tconset
for the FeTe0.5Se0.5 polycrystalline sample. The values of Hc2 were
defined as the field at the midpoint of the resistive transition. The slope of Hc2 at Tc is -60.6
kOe K-1
. The value of Hc2 at T = 0 K estimated using the Werthamer–Helfand–Hohenberg
formula [32], Hc2(0)=−0.69Tc|dHc2/dT|T=Tc, is 585 kOe. This value is comparable to the single
crystals [14-18]. In order to extract the superconducting parameters, we have used the
Ginzburg–Landau (GL) formula for the coherence length (ξ), ξ= (Φ0/2πHc2)1/2
, where Φ0 =
2.07×10⁻⁷
G cm2, the coherence length ξ at the zero temperature is calculated as 2.38 nm. It is
well known that, for the two-gap superconductivity in the dirty limit, the impurity scattering
could strongly enhance the upper critical field Hc2. This phenomenon has been clearly
observed in MgB2, a dirty two-gap superconductor, where the Hc2 increases remarkably by
alloying MgB2 with some impurities [33]. Therefore, the very high Hc2 value observed in our
polycrystals could be reasonably attributed to the strong impurity scattering effect from the
impurities in such a new mutiband superconductor.
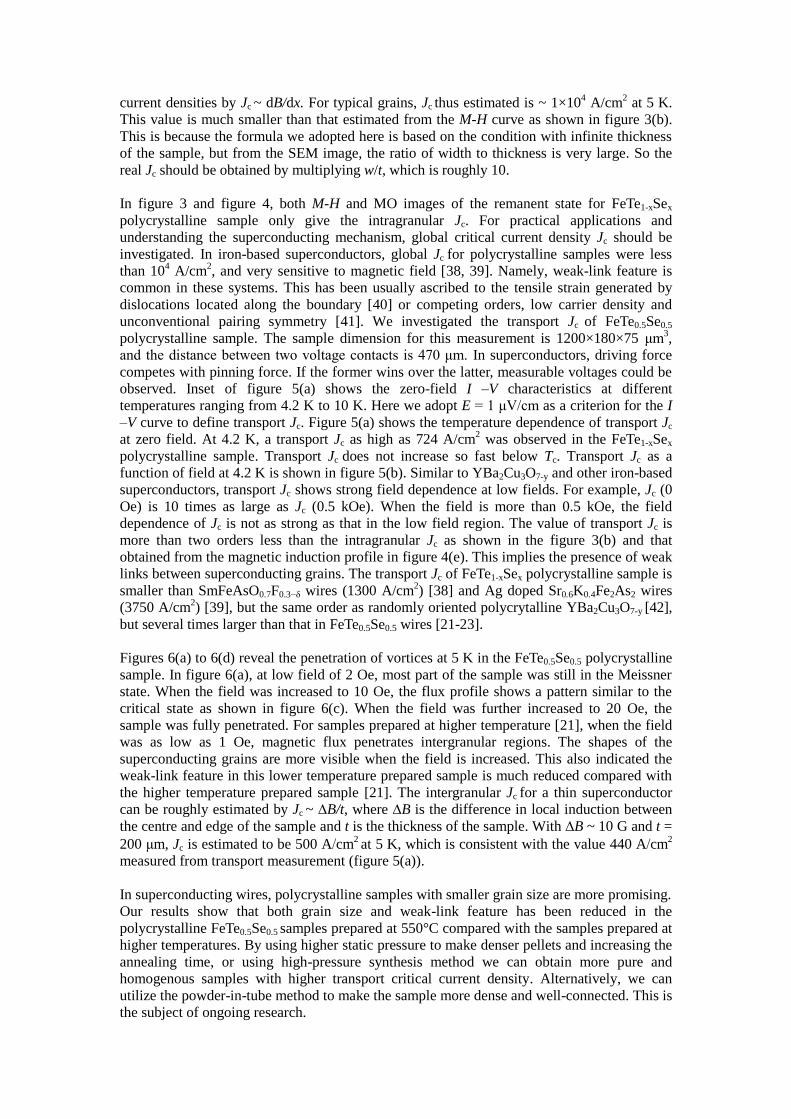
Figure 3(a) shows magnetic hysteresis curves of this sample. A small amount of Fe7Se8
impurities may be the reason for the ferromagnetic background in M-H curves. Shown in the
inset is M-H curve at 15 K, which is higher than Tc. Since the curves at 12.5 K (not shown)
and 15 K are almost identical, we assumed this background is temperature-independent at low
temperatures. In these hysteresis loops, the ratio between superconducting signals to the
ferromagnetic background is not as strong as that of the sample prepared at higher
temperatures [24]. This is because the magnetization is proportional to the grain sizes if the
intragranular critical current density (Jcintra
) is fixed, and the grains prepared at higher
temperatures are much larger. From the magnetization hysteresis loops, we can evaluate
intragranular critical current density Jcintra
for polycrystalline samples using the Bean’s model
with the assumption of field–independent Jc. According to Bean’s model, Jcintra
[A/cm2] is
given by
intra
c 30 ,M
Jd
(1)
with an assumption that intergranular critical current is zero, where ∆M[emu/cc] is Mdown - Mup,
Mup and Mdown are the magnetization when sweeping field up and down, respectively, d[cm] is
the average diameter of the grain in the polycrystalline sample [34]. The ∆M used here is after
subtracting the ferromagnetic background. Figure 3(b) shows the field dependences of the
obtained Jc for this sample calculated from the data shown in figure 3(a) using Eq. (1) and the
typical dimension. Jc calculated from M-H curve is estimated to be 2×10⁵ A/cm
2 at 5 K under
zero field, this value is a little smaller than that in the single crystal [19], but still in the range
for applications. Jc values in excess of 5×10⁴ A/cm
2 are sustained up to 10 kOe.
Figures 4(b)-(e) depict MO images of the FeTe0.5Se0.5 polycrystalline sample in the remanent
state after applying a 500 Oe field for 0.25 seconds which subsequently reduced down to zero.
Figure 4(a) shows the polished surface of the FeTe1-xSex polycrystalline sample for MO
measurements. The sample dimensions are 895×555×200 μm3. Shown in figures 4(b) to 4(e)
are MO images of the remanent state recorded at several different temperatures. These images
are similar with the MO images of 1111 polycrytals [35-37]. In these figures, the bright
regions correspond to the trapped flux in the sample. The dots in these images are due to
defects in the indicator garnet film. At all temperatures, the field profile is inhomogeneous,
which implies that the intergranular current density is much smaller compared with the
intragranular current density. The intragranular current density decreases gradually as the
temperature is increased towards Tc. We calculated the intragranular critical current density
from the magnetic induction profile. Figure 4(f) shows the magnetic induction profiles along
the dotted line in figure 4(b). In this calculation, we roughly estimate the intragranular critical
current densities by Jc ~ dB/dx. For typical grains, Jc thus estimated is ~ 1×10⁴ A/cm
2 at 5 K.
This value is much smaller than that estimated from the M-H curve as shown in figure 3(b).
This is because the formula we adopted here is based on the condition with infinite thickness
of the sample, but from the SEM image, the ratio of width to thickness is very large. So the
real Jc should be obtained by multiplying w/t, which is roughly 10.
In figure 3 and figure 4, both M-H and MO images of the remanent state for FeTe1-xSex
polycrystalline sample only give the intragranular Jc. For practical applications and
understanding the superconducting mechanism, global critical current density Jc should be
investigated. In iron-based superconductors, global Jc for polycrystalline samples were less
than 104 A/cm
2, and very sensitive to magnetic field [38, 39]. Namely, weak-link feature is
common in these systems. This has been usually ascribed to the tensile strain generated by
dislocations located along the boundary [40] or competing orders, low carrier density and
unconventional pairing symmetry [41]. We investigated the transport Jc of FeTe0.5Se0.5
polycrystalline sample. The sample dimension for this measurement is 1200×180×75 μm3,
and the distance between two voltage contacts is 470 μm. In superconductors, driving force
competes with pinning force. If the former wins over the latter, measurable voltages could be
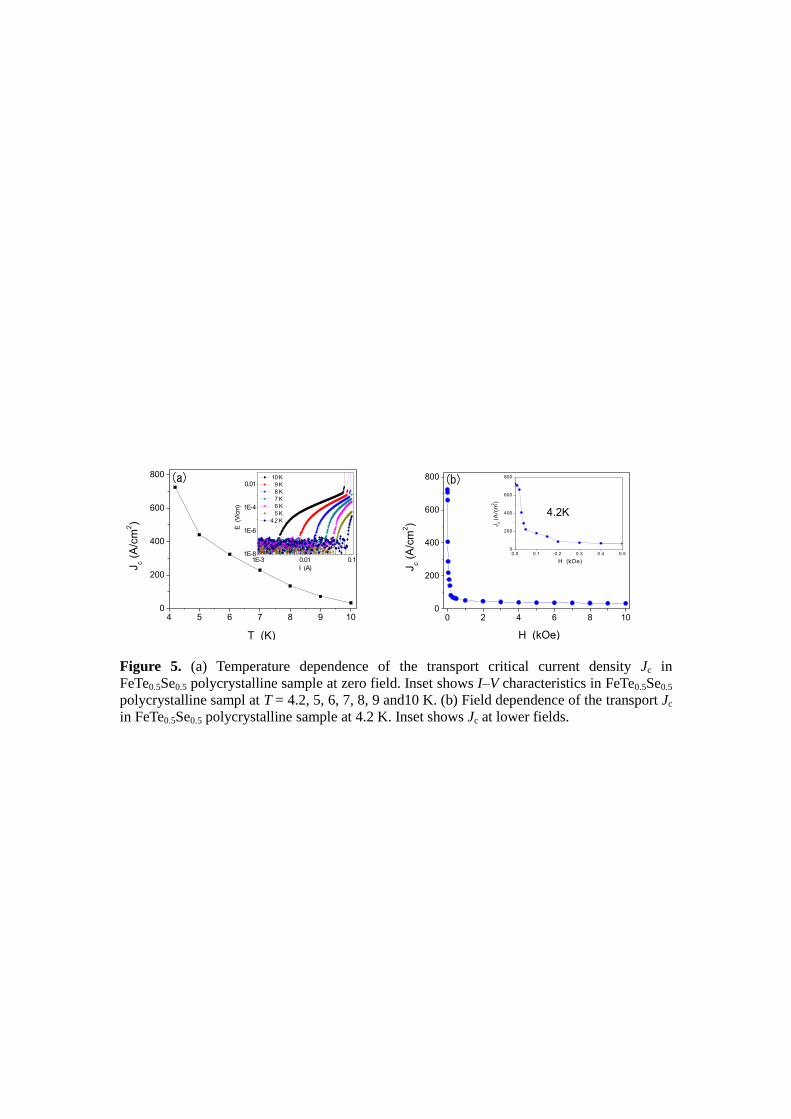
observed. Inset of figure 5(a) shows the zero-field I –V characteristics at different
temperatures ranging from 4.2 K to 10 K. Here we adopt E = 1 μV/cm as a criterion for the I
–V curve to define transport Jc. Figure 5(a) shows the temperature dependence of transport Jc
at zero field. At 4.2 K, a transport Jc as high as 724 A/cm2 was observed in the FeTe1-xSex
polycrystalline sample. Transport Jc does not increase so fast below Tc. Transport Jc as a
function of field at 4.2 K is shown in figure 5(b). Similar to YBa2Cu3O7-y and other iron-based
superconductors, transport Jc shows strong field dependence at low fields. For example, Jc (0
Oe) is 10 times as large as Jc (0.5 kOe). When the field is more than 0.5 kOe, the field
dependence of Jc is not as strong as that in the low field region. The value of transport Jc is
more than two orders less than the intragranular Jc as shown in the figure 3(b) and that
obtained from the magnetic induction profile in figure 4(e). This implies the presence of weak
links between superconducting grains. The transport Jc of FeTe1-xSex polycrystalline sample is
smaller than SmFeAsO0.7F0.3−δ wires (1300 A/cm2) [38] and Ag doped Sr0.6K0.4Fe2As2 wires
(3750 A/cm2) [39], but the same order as randomly oriented polycrytalline YBa2Cu3O7-y [42],
but several times larger than that in FeTe0.5Se0.5 wires [21-23].
Figures 6(a) to 6(d) reveal the penetration of vortices at 5 K in the FeTe0.5Se0.5 polycrystalline
sample. In figure 6(a), at low field of 2 Oe, most part of the sample was still in the Meissner
state. When the field was increased to 10 Oe, the flux profile shows a pattern similar to the
critical state as shown in figure 6(c). When the field was further increased to 20 Oe, the
sample was fully penetrated. For samples prepared at higher temperature [21], when the field
was as low as 1 Oe, magnetic flux penetrates intergranular regions. The shapes of the
superconducting grains are more visible when the field is increased. This also indicated the
weak-link feature in this lower temperature prepared sample is much reduced compared with
the higher temperature prepared sample [21]. The intergranular Jc for a thin superconductor
can be roughly estimated by Jc ~ ∆B/t, where ∆B is the difference in local induction between
the centre and edge of the sample and t is the thickness of the sample. With ∆B ~ 10 G and t =
200 μm, Jc is estimated to be 500 Acm2 at 5 K, which is consistent with the value 440 Acm
2
measured from transport measurement (figure 5(a)).
In superconducting wires, polycrystalline samples with smaller grain size are more promising.
Our results show that both grain size and weak-link feature has been reduced in the
polycrystalline FeTe0.5Se0.5 samples prepared at 550°C compared with the samples prepared at
higher temperatures. By using higher static pressure to make denser pellets and increasing the
annealing time, or using high-pressure synthesis method we can obtain more pure and
homogenous samples with higher transport critical current density. Alternatively, we can
utilize the powder-in-tube method to make the sample more dense and well-connected. This is
the subject of ongoing research.
In conclusion, X-ray diffraction, magnetization, resistivity, transport critical current density
and magneto-optical measurements were performed on high quality polycrystalline
FeTe0.5Se0.5 prepared at 550°C. The transport critical current density over 700 A/cm2 at 4.2 K
under zero field is obtained. This value is several times larger than that of FeTe0.5Se0.5
superconducting wires, although it is more than two orders less than the intragranular critical
current density. Jc estimated from magneto-optical (MO) images of flux penetration is also
similar to this value. The upper critical field Hc2 of the polycrystalline FeTe0.5Se0.5 is 585 kOe,
which is comparable to that of single crystals. Our low-temperature synthesis is promising to
the development of practical FeTe1-xSex system, with potential higher transport critical current
density, for applications especially for superconducting wires.
References
______________________ [1] Kamihara Y, Watanabe T, Hirano M and Hosono H 2008 J. Am. Chem. Soc. 130 3296
[2] Chen G F, Li Z, Wu D, Dong J, Li G, Hu W Z, Zheng P, Luo J L and Wang NL 2008
Phys. Rev. Lett. 100 247002
[3] Cheng P, Fang L, Yang H, Zhu X Y, Mu G, Luo H Q, Wang Z S and Wen H H 2008 Sci.
China Ser. G 51 719
[4] Ren Z A, Che G C, Dong X L, Yang J, Lu W, Yi W, Shen X L, Li Z C, Sun L L, Zhou F
and Zhao Z X Europhys. Lett. 2008 83 17002
[5] Rotter M, Tegel M and Johrendt D 2008 Phys. Rev. Lett. 101 107006
[6] Wang X C, Liu Q Q, Lv Y X, Gao W B, Yang L X, Yu R C, Li F Y and Jin C Q 2008 Solid
State Commun. 148 538
[7] Hsu F C, Luo J Y, Yeh K W, Chen T K, Huang T W, Wu P M, Lee Y C, Huang Y L, Chu Y
Y, Yan D C and Wu M K 2008 Proc. Natl. Acad. Sci. 105 14262
[8] Ogino H, Katsura Y, Horii S, Kishio K and Shimoyama J 2009 Supercond. Sci. Technol.
22 085001
[9] Medvedev S, McQueen T M, Troyan I A, Palasyuk T, Eremets M I, Cava R J, Naghavi1 S,
Casper1 F, Ksenofontov1 V, Wortmann G and Felser C 2009 Nat. Mater. 8 630
[10] Millican J N, Phelan D, Thomas E L, Leão J B and Carpenter E 2009 Solid State
Commun. 149 707
[11] Guo J G, Jin S F, Wang G, Wang S C, Zhu K X, Zhou T T, He M and Chen X L 2010
Phys. Rev. B 82 10520(R)
[12] Krzton-Maziopa A, Shermadini Z, Pomjakushina E, Pomjakushin V, Bendele M, Amato
A, Khasanov R, Luetkens H, Conder K 2010 arXiv:1012.3637
[13] Wang A F, Ying J J, Yan Y J, Liu R H, Luo X G, Li Z Y, Wang X F, Zhang M, Ye G J,
Cheng P, Xiang Z J and Chen X H 2010 arXiv:1012.5525
[14] Yeh K W, Ke C T, Huang T W, Chen T K, Huang Y L, Wu P M and Wu M K 2009
Crystal Grwoth & Design. 9 4847
[15] Yadav C S and Paulose P L 2009 New J. Phys. 11 103046
[16] Kida T, Matsunaga T, Hagiwara M, Mizuguchi Y, Takano Y and Kindo K 2009 J. Phys.
Soc. Jpn. 78 113701
[17] Braithwate D, Lapertot G, Knafo W and Sheikin I 2010 J. Phys. Soc. Jpn. 79 053703
[18] Taen T, Nakajima Y and Tamegai T 2010 Physica C 470 S391
[19] Taen T, Tsuchiya Y, Nakajima Y and Tamegai T 2009 Phys. Rev. B 80 092502
[20] Taen T, Nakajima Y and Tamegai T 2010 Physica C 470 1106
[21] Mizuguchi Y, Deguchi K, Tsuda S, Yamaguchi T, Takeya H, Kumakura H and Takano Y
2009 Appl. Phys. Express 2 083004
[22] Ozaki T, Deguchi K, Mizuguchi Y, Kumakura H and Takano Y 2010 arXiv:1008.1447
[23] Ozaki T, Deguchi K, Mizuguchi Y, Kawasaki Y, Tanaka T, Yamaguchi T, Tsuda S,
Kumakura H and Takano Y 2011 arXiv:1103.0402
[24] Ding Q, Taen T, Mohan S, Nakajima Y and Tamegai T 2011 Physica C accepted [25] Soibel A, Zeldov E, Rappaport M, Myasoedov Y, Tamegai T, Ooi O, Konczykowski M and

Geshkenbein V B 2000 Nature 406 282
[26] Yasugaki M, Itaka K, Tokunaga M, Kameda N, Tamegai T 2002 Phys. Rev. B 65 212502
[27] Sales B C, Sefat A S, McGuire M A, Jin R Y and Mandrus D 2009 Phys. Rev. B 79
094521
[28] Yeh K W, Huang T W, Huang Y L, Chen T K, Hsu F C, Wu P M, Lee Y C, Chu Y Y,
Chen C L, Luo J Y, Yan D C and Wu M K 208 Europhys. Lett. 84 37002
[29] Mizuguchi Y, Tomioka F, Tsuda S, Yamaguchi T and Takano Y 2009 J. Phys. Soc. Jpn.
78 074712
[30] Awana S, Pal A, Vajpayee A, Mudgel M, Kishan H, Husain M, Zeng R, Yu S, Guo Y F,
Shi Y G, Yamaura K, Takayama-Muromachi E 2010 J. Appl. Phys. 107 09E128
[31`] Liu T J, Ke X, Qian B, Hu J, Fobes D, Vehstedt E K, Pham H, Yang J H, Fang M H,
Spinu L, Schiffer P, Liu Y and Mao Z Q 2009 Phys. Rev. B, 80 174509
[32] Werthamer N R, Helfand E and Hohenberg P C 1966 Phys. Rev. 147 295
[33] Gurevich A, Patnaik S, Braccini V, Kim K H, Mielke C, Song X, Cooley L D, Bu S D,
Kim D M, Choi J H,Belenky L J, Giencke J, Lee M K, Tian W, Pan X Q, Siri A,
Hellstrom E E, Eom C B and. Larbalestier D C 2004 Supercond. Sci. Technol. 17 278
[34] Bean C P 1964 Rev. Mod. Phys. 36 31
[35] Tamegai T, Nakajima Y, Tsuchiya Y, Iyo A, Miyazawa K, Shirage M P, Kito H and Eisaki
H 2008 J. Phys. Soc. Jpn. Suppl. C 77 54
[36] Tamegai T, Nakajima Y, Tsuchiya Y, Iyo A, Miyazawa K, Shirage M P, Kito H and Eisaki
H 2008 Physicsa C 469 915
[37] Nakajima Y, Maruoka T, Tamegai T, Kamihara Y, Hirano M and Hosono H Physica C
470 S406
[38] Wang L, Qi Y P, Wang D L, Gao Z S, Zhang X P, Zhang Z Y, Wang C L and Ma Y W
2010 Supercond. Sci. Technol. 23 075005
[39] Qi Y P, Wang L, Wang D L, Zhang Z Y, Gao Z S, Zhang X P and Ma Y 2010 Supercond.
Sci. Technol. 23 055009
[40] Deutscher G 2010 Appl. Phys. Lett. 96 122502
[41] Lee S, Jiang J, Weiss J D, Folkman C M, Bark C W, Tarantini T, Xu A, Abraimov D,
Polyanskii A, Nelson C T, Zhang Y, Baek S H, Jang H W, Yamamoto A, Kametani F, Pan
X Q, Hellstrom E E, Gurevich A, Eom C B and Larbalestier D C 2009 Appl. Phys. Lett.
95 212505
[42] Li S, Fistl M, Deak J, Mtecalf P and McElfresh M 1995 Phys. Rev. B 52 R747

10 20 30 40 50 60 70
**
* Fe7Se
8
2(degree)
Inte
nsity (
a. u
.)
(a)
0 2 4 6 8 10 12 14 16 18 20-16
-12
-8
-4
0
4M
(G
)
T (K)
H = 5 Oe
(c)
Figure1. (a) Powder X-ray diffraction pattern of as-prepared FeTe0.5Se0.5 polycrystalline
sample. (b) SEM image of the FeTe0.5Se0.5 polycrystalline sample. (c) Temperature
dependence of magnetic susceptibility of FeTe0.5Se0.5 polycrystalline sample measured at 5
Oe.

0 50 100 150 200 250 3000
200
400
600
800
0 5 10 15 200
100
200
300
400
Tc
zero=12.5K
T (K)
cm
Tc
onset=14.3K
(a)
cm
T (K)
2 4 6 8 10 12 14 16 18 200
50
100
150
200
250
300
350
400
0.92 0.96 1.000
10
20
30
40
50
Hc2 (
kO
e)
t = T /Tc
0 kOe
10 kOe
20 kOe
30 kOe
40 kOe
50 kOe
T (K)
cm
(b)
Figure 2. (a) Temperature dependence of the resistivity of FeTe0.5Se0.5 polycrystalline sample.
Inset shows the resistivity around Tc. (b) Field dependence of the resistivity of FeTe0.5Se0.5
polycrystalline sample around Tc. Inset shows the upper critical field Hc2 versus temperature
determined by the midpoint of the resistive transition.

-10 -5 0 5 10
-150
-100
-50
0
50
100
150
-10 -5 0 5 10
-150
-100
-50
0
50
100
150
15K
4M
(G
)
H (kOe)
2K
5K
4M
(G
)
H (kOe)
(a)
0 2 4 6 8 1010
4
105
106
2K
5K
H (kOe)
Jc (
A/c
m2)
(b)
Figure 3. (a) Magnetic field dependence of magnetization at different temperatures for
FeTe0.5Se0.5 polycrystalline sample. Inset shows M-H curves at 15 K. (b) Magnetic field
dependence of critical current densities calculated from the data in (a).

200 400 600 800 10004
8
12
16
20 5K
7.5K
10K
12.5K
15K•••••
B (
G)
X m)
(f)
Figure 4. (a) Optical images of the FeTe0.5Se0.5 polycrystalline sample used for MO imaging.
Differential MO images in the remanent state of the FeTe0.5Se0.5 polycrystalline sample at (b)
5 K, (c) 7.5 K, (d) 10 K, and (e) 12.5 K after cycling the field up to 500 Oe for 0.25 seconds,
(f) the local magnetic induction profiles at different temperatures taken along the dotted lines
in (b).
4 5 6 7 8 9 100
200
400
600
800
1E-3 0.01 0.11E-8
1E-6
1E-4
0.01 10 K
9 K
8 K
7 K
6 K
5 K
4.2 K
E (V
/cm
)
I (A)
(a)
T (K)
Jc (
A/c
m2)
0 2 4 6 8 100
200
400
600
800
0.0 0.1 0.2 0.3 0.4 0.50
200
400
600
800
Jc (
A/c
m2)
H (kOe)
Jc (
A/c
m2)
H (kOe)
4.2K
(b)
Figure 5. (a) Temperature dependence of the transport critical current density Jc in
FeTe0.5Se0.5 polycrystalline sample at zero field. Inset shows I–V characteristics in FeTe0.5Se0.5
polycrystalline sampl at T = 4.2, 5, 6, 7, 8, 9 and10 K. (b) Field dependence of the transport Jc
in FeTe0.5Se0.5 polycrystalline sample at 4.2 K. Inset shows Jc at lower fields.
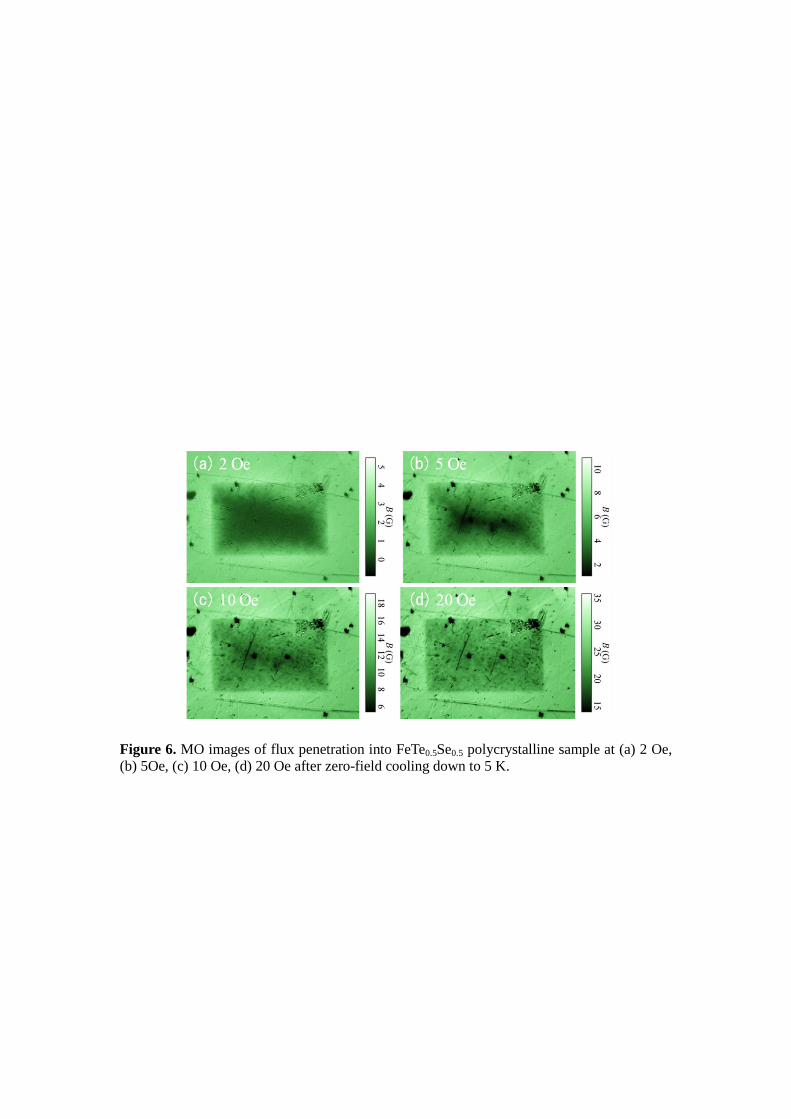
Figure 6. MO images of flux penetration into FeTe0.5Se0.5 polycrystalline sample at (a) 2 Oe,
(b) 5Oe, (c) 10 Oe, (d) 20 Oe after zero-field cooling down to 5 K.