A density functional study on dielectric properties of acrylic acid grafted polypropylene
Upload
khangminh22Category
view
1download
0
Southern Illinois University CarbondaleOpenSIUC
Dissertations Theses and Dissertations
12-2009
FIRST-PRINCIPLES DENSITY FUNCTIONALTHEORY STUDIES OF REACTIVITIES OFHETEROGENEOUS CATALYSTSDETERMINED BY STRUCTURE ANDSUBSTRATELei ChengSouthern Illinois University Carbondale, [email protected]
Follow this and additional works at: http://opensiuc.lib.siu.edu/dissertations
This Open Access Dissertation is brought to you for free and open access by the Theses and Dissertations at OpenSIUC. It has been accepted forinclusion in Dissertations by an authorized administrator of OpenSIUC. For more information, please contact [email protected].
Recommended CitationCheng, Lei, "FIRST-PRINCIPLES DENSITY FUNCTIONAL THEORY STUDIES OF REACTIVITIES OF HETEROGENEOUSCATALYSTS DETERMINED BY STRUCTURE AND SUBSTRATE" (2009). Dissertations. Paper 99.
FIRST-PRINCIPLES DENSITY FUNCTIONAL THEORY STUDIES OF
REACTIVITIES OF HETEROGENEOUS CATALYSTS DETERMINED BY
STRUCTURE AND SUBSTRATE
by
Lei Cheng
B.S., Qingdao University, China, 2003
A Dissertation Submitted in Partial Fulfillment of the Requirements for the
Doctor of Philosophy
Department of Chemistry and Biochemistry in the Graduate School
Southern Illinois University Carbondale December, 2009

Copyright by Lei Cheng, 2009 All Rights Reserved
DISSERTATION APPROVAL
FIRST-PRINCIPLES DENSITY FUNCTIONAL THEORY STUDIES OF REACTIVITIES OF HETEROGENEOUS CATALYSTS DETERMINED BY
STRUCTURE AND SUBSTRATE
By
Lei Cheng
A Dissertation Submitted in Partial
Fulfillment of the Requirements
for the Degree of
Doctor of Philosophy
in the field of Chemistry
Approved by:
Qingfeng Ge, Chair
Boyd Goodson
Brian Lee
Punit Kohli
Leo Silbert
Graduate School Southern Illinois University Carbondale
June 24th, 2009
i
AN ABSTRACT OF THE DISSERTATION OF
LEI CHENG, for the Doctor of Philosophy degree in Physical Chemistry, presented on June, 2009, at Southern Illinois University Carbondale. TITLE: FIRST-PRINCIPLES DENSITY FUNCTIONAL THEORY STUDIES OF
REACTIVITIES OF HETEROGENEOUS CATALYSTS DETERMINED BY
STRUCTURE AND SUBSTRATE
MAJOR PROFESSOR: Dr. Qingfeng Ge
In this dissertation, density functional theory (DFT) calculations were used to
investigate (1) NO2 adsorption on BaO in NOx Storage Reduction (NSR) catalyst affected
by the morphology of BaO and the γ-Al 2O3 support, (2) energy barrier of H2 dissociative
adsorption over Mg clusters affected by its electronic structure, and (3) comparison of the
activities of CeO2 clusters affected by two different supports—monoclinic ZrO2 and non-
spinel γ-Al 2O3. Our results showed that the electronic effect caused by the non-
stoichiometry of the bare BaO clusters and surfaces improves their reactivities toward
NO2 adsorption greatly, whereas the geometric structure of the catalyst has only minor
effect on the activity; we also found that the γ-Al 2O3 substrate improves the reactivities of
the supported BaO clusters and at the same time the interface between BaO and γ-Al 2O3
provided a unique and highly reactive environment for NO2 adsorption. Hydrogen
dissociation barrier over pure Mg clusters is greatly affected by the electronic structure of
the clusters—closed shell clusters such as Mg10 and Mg92- have higher energy barrier
toward H2 dissociation; however, H2 dissociation over clusters that are two electrons shy
from the closed electronic shell are relatively easier. As substrates, neither ZrO2(111) nor

ii
γ-Al 2O3(100) affects the reactivity of the supported Ce2O4 toward CO2 adsorption and
CO physisorption significantly; whereas the reactivity of Ce2O4 toward CO reactive
adsorption were found to be affected by the two substrates very differently.
iii
DEDICATION
To my family:
Father, Shaozhong Cheng
Mother, Yumin Shi
FOR THEIR LOVE, ENCOURAGEMENT AND BELIEVEING…
iv
ACKNOWLEDGMENTS
I would like to give my appreciation to my research advisors, Dr. Qingfeng Ge for
giving me the freedom to explore on my own, and at the same time providing patient
guidance, encouragement and support. He has inspired me by his great research
capabilities and desire to accomplish great goals. These are lessons that will benefit me
for a lifetime. Thanks for all of the advice and motivation.
Thanks to Dr. Lichang Wang for always being there to listen and advise. I am
grateful for her regard and help both on my research and on my life through my graduate
study.
Special thanks to Dr. Donghai Mei at Pacific Northwest National Laboratory for
mentoring me during my stay at PNNL and being a good friend.
I would like to extend my gratitude to my committee members Dr. Boyd
Goodson, Dr. Brian Lee, Dr. Punit Kohli, Dr. Leo Silbert, Dr. Andrei Kolmakov and Dr.
Ling Zang (now at University of Utah) for their time, constructive suggestions in my
research and help throughout my graduate studies.
I would like to thank Jianjun Liu, Yunxiang Pan, Jiamei Yu, George Hudson,
Tiffany Pawluk, Jenifer Yukna, Li Xiao and You Han, for the successful collaborations
and wonderful discussions on my research. Special thanks to all the members of our big
theoretical chemistry family for your help during the last few years.
Thanks all of my friends in the Chemistry Department: Lijuan Peng, Ping He, Lin
Wang, Chasity Love, Panayiotis Nikolaou, Chuansong Duanmu, Xuelian Li, Xuegang
Jia, Tao Lin, XiaoXia Li, Nicholas Whiting, Mark Sadek for the great times during my
graduate study. Without them, life wouldn’t have been this fun.

v
Finally, I wish to acknowledge my parents, who always support me and have been
always proud of me. THANKS!
vi
PREFACE
Partial content in Chapter 3 of this dissertation was previously published as Surf. Sci.
601, L65-L68 in 2007 (copyright 2007 Elsevier) and J. Phys. Chem. C 112, 16924-16931
in 2008 (copyright 2008 American Chemical Society). Content of Chapter 5 was
previously published as J. Phys. Chem. C 113, 18296 in 2009 (copyright 2009 American
Chemical Society). The author of Elsevier retains the right to include the journal article, in
full or in part, in a thesis or dissertation. ACS extends blanket permission to students to
include in their theses and dissertations their own articles, or portions thereof, that have
been published in ACS journals or submitted to ACS journals for publication. ACS
copyright credit line is noted on the appropriate pages in this dissertation.
vii
TABLE OF CONTENTS CHAPTER PAGE ABSTRACT .................................................................................................................... i
DEDICATION .............................................................................................................. iii
ACKNOWLEDGMENTS ............................................................................................ iv
PREFACE ...................................................................................................................... vi
LIST OF TABLES ........................................................................................................ xi
LIST OF FIGURES ..................................................................................................... xii
LIST OF EQUATIONS ............................................................................................... xv
LIST OF SCHEMES ................................................................................................. xvii
CHAPTERS
CHAPTER 1: General Introduction and Outline ........................................................... 1
CHAPTER 2: Computational Methods ......................................................................... 4
2.1 A Brief History of Quantum Mechanics .......................................................... 4
2.2 Density Functional Theory .............................................................................. 6
2.2.1 Thomas-Fermi Theory ........................................................................ 7
2.2.2 Hohenberg-Kohn Theory .................................................................... 9
2.2.3 Kohn-Sham Equations ...................................................................... 10
2.2.4 The Functional Effect ........................................................................ 12
2.2.5 Overview of the Theory ..................................................................... 14
2.2.5.1 Major Contributions of Theory ................................................. 14
2.2.5.2 Applications .............................................................................. 16
2.3 Locating Transition States ............................................................................. 18
2.4 Computational Codes ..................................................................................... 20

viii
2.4.1 VASP ................................................................................................. 21
2.4.2 Gaussian 03 ........................................................................................ 27
2.5 Computational Facilities ................................................................................ 28
CHAPTER 3: Effect of Morphology, Stoichiometry and Support on Reactivity of
Catalysts: NO2 Interaction with Unsupported and γ-Al 2O3
Supported BaO ................................................................................... 30
3.1 Introduction .................................................................................................... 30
3.2 Methodology .................................................................................................. 34
3.2.1 General Method ................................................................................. 34
3.2.2 Modeling of Bare BaO Clusters, (100) and (310) Surfaces ............... 34
3.2.3 Modeling of γ-Al 2O3 Supported BaO Clusters .................................. 35
3.3 Results and Discussion .................................................................................. 37
3.3.1 NO2 Interaction with BaO(100) Surfaces .......................................... 37
3.3.2 NO2 Interaction with Stoichiometric BaO Clusters and Stepped
Surface ............................................................................................... 39
a. Stoichiometric Clusters .................................................................. 39
b. Stoichiometric Stepped Surface ..................................................... 43
3.3.3 NO2 Interaction with Non-stoichiometric BaO Surfaces and
Clusters .............................................................................................. 46
a. Non-stoichiometric Clusters........................................................... 46
b. Non-stoichiometric Surface ........................................................... 49
3.3.4 NO2 Interaction with γ-Al 2O3 Supported BaO Clusters .................... 51
a. γ-Al 2O3 Supported BaO Clusters ................................................... 51
ix
b. NO2 Adsorption on γ-Al 2O3 Supported BaO Clusters ................... 54
c. NO2 Adsorption on γ-Al 2O3 Supported BaO Clusters with Bigger
Unit Cell ........................................................................................ 58
3.4 Conclusion ..................................................................................................... 63
CHAPTER 4: Electronic Shell Effect on Reactivity of Small Metal Cluster—
Examples of H2 Desorption on Magnesium Clusters ......................... 65
4.1 Introduction .................................................................................................... 65
4.2 Methodology .................................................................................................. 66
4.3 Results and Discussion .................................................................................. 68
4.3.1 Structures of Mg9, Mg92+, Mg9
2-, Mg10 and Mg102+ Clusters ............. 68
4.3.2 H2 Dissociation over Mg9, Mg92+, Mg9
2-, Mg10 and Mg102+ Clusters 71
4.3.3 Comparison of H2 Dissociation over Mg Clusters and Surfaces ....... 78
4.4 Conclusion ..................................................................................................... 79
CHAPTER 5: Origin of Support Effects on the Reactivity of Ceria Cluster ............... 81
5.1 Introduction .................................................................................................... 81
5.2 Methodology .................................................................................................. 84
5.3 Results and Discussion .................................................................................. 86
5.3.1 Adsorption of CO and CO2 on the ZrO2(111) and γ-Al 2O3(100)
Surfaces .............................................................................................. 86
a. CO Adsorption ............................................................................... 86
b. CO2 Adsorption .............................................................................. 88
5.3.2 Ce2O4 Cluster on the ZrO2(111) and γ-Al 2O3(100) Supports ............ 89
5.3.3 CO2 Adsorption on the Supported Ce2O4 Clusters ............................ 91
x
5.3.4 CO Adsorption on Ce Sites of the Supported Ce2O4 Clusters ........... 93
5.3.5 The Reactivity of the ZrO2(111) and γ-Al 2O3(100) Supported
Ce2O4 Clusters .................................................................................. 94
5.4 Conclusion ................................................................................................... 104
CHAPTER 6: Summary ............................................................................................. 105
BIBLIOGRAPHY ....................................................................................................... 106
APPENDICIES
Appendix I: VASP Input Files ................................................................................... 119
Appendix II: Gaussian Input Files .............................................................................. 124
VITA ......................................................................................................................... 125
xi
LIST OF TABLES
TABLE PAGE
Table 3.1 Atomic Barder Charges in BaO-Only and Synergestic Configurations ..... 62
Table 4.1 H2 dissociation energy barrier (eV) over Mg clusters calculated using
Gaussian with both B3LYP and PBE functional, as well as using VASP with
PBE functional. ........................................................................................... 72
Table 4.2 H2 dissociation adsorption activation energies (eV) decomposed to H-H
splitting energy cost and pure adsorption energies. Imaginary frequencies (cm-
1) of H-H splitting were also reported. All results are PBE calculations. ... 75
Table 4.3 Band gaps (eV) of magnesium clusters and their corresponding transition
states. ........................................................................................................... 76
Table 5.1 Calculated reactive adsorption energies (eV) of CO on the unsupported Ce2O4
cluster (Eads), an on the ZrO2(111) and γ-Al 2O3(100) supported Ce2O4 cluster
(Eadss); the binding energies of Ce2O4 cluster (Ebind) and (Ce2O2)
2+CO32- (Eint)
on the ZrO2(111) and the γ-Al 2O3(100) substrates ..................................... 98
xii
LIST OF FIGURES
FIGURE PAGE
Figure 2.1 A contour plot of potential energy surface for a three-atom system ......... 19
Figure 2.2 Bulk CeO2 structure ................................................................................... 22
Figure 2.3 Examples of unit cells of bulk CeO2 structure, a single CO2 molecule,
and CeO2(111) surface ............................................................................. 25
Figure 3.1 Mechanism of NOx storage reduction catalysis......................................... 31
Figure 3.2 The supercells of non-stoichiometric spinel Al18O24 and stoichiometric
defective spinel Al16O24 after removing two Al atoms ............................ 36
Figure 3.3 Side view of γ-Al 2O3(111) surface ............................................................ 37
Figure 3.4 Top view of the adsorption geometries and energies of NO2 on the
BaO(100) surface ..................................................................................... 39
Figure 3.5 The adsorption geometries and energies of NO2 over the stoichiometric
BaO clusters ............................................................................................. 41
Figure 3.6 BaO(310) surface and NO2 adsorption on the surface .............................. 45
Figure 3.7 NO2 adsorption on the non-stoichiometric clusters ................................... 47
Figure 3.8 Top view of NO2 adsorption on defective BaO(100) ................................ 49
Figure 3.9 (BaO)2 supported on γ-Al 2O3(111) with BaO cluster square plane
parallel and normal to the support surface ............................................... 53
Figure 3.10 Most stable structures of γ-Al 2O3(111) supported (BaO)1 and (BaO)4 ..... 54
Figure 3.11 NO2 adsorption over γ-Al 2O3(111) supported (BaO)1 O site and Ba site . 55
Figure 3.12 Synergistic adsorption of NO2 on γ-Al 2O3(111) supported (BaO)2 and
(BaO)4 ...................................................................................................... 56
xiii
Figure 3.13 Decomposition of NO2 synergistic adsorption on γ-Al 2O3(111)
supported (BaO)2 ....................................................................................58
Figure 3.14 Top view of NO2 adsorption over the γ-Al 2O3 supported (BaO)2 in small
and big unit cells ...................................................................................... 59
Figure 3.15 PDOS of Al and O atoms in NO2 adsorption on supported (BaO)2 .......... 60
Figure 4.1 Energy diagram of H2 dissociative adsorption over Mg9, Mg92+, Mg9
2-,
Mg10 and Mg102+ clusters ......................................................................... 69
Figure 4.2 Activation energy vs. band gap difference between the transition state and the
corresponding reactant cluster/surface ..................................................... 77
Figure 4.3 Transition states of hydrogen dissociation over the Mg(100) and (110)
surfaces .................................................................................................... 78
Figure 5.1 Top and side views of ZrO2(111) and γ-Al 2O3(100) surface slabs ........... 85
Figure 5.2 Optimized structures of Ce2O4 cluster supported on the ZrO2(111) and γ-
Al 2O3(100) surfaces, and optimized structure of the unsupported Ce2O4
cluster ....................................................................................................... 90
Figure 5.3 CO2 adsorption on ZrO2(111) supported and γ-Al 2O3(100) supported
Ce2O4 cluster ............................................................................................ 91
Figure 5.4 CO adsorption on Ce atom of ZrO2(111) supported and γ-Al 2O3(100)
supported Ce2O4 cluster ........................................................................... 93
Figure 5.5 Carbonate-like structure formed on ZrO2(111) supported and γ-
Al 2O3(100) supported Ce2O4 cluster upon reactive adsorption of CO .... 95
Figure 5.6 PDOS of the Ce atoms in the supported Ce2O4 before and after CO
reactive adsorption ................................................................................... 99

xiv
Figure 5.7 Potential energy profiles of CO oxidation on unsupported, ZrO2(111) and
γ-Al 2O3(100) supported Ce2O4 cluster, and CeO2(100) surface ........... 102
xv
LIST OF EQUATIONS
EQUATION PAGE
Equation 2.1 Planck’s Description of Discrete Energies .............................................. 5
Equation 2.2 Wavelength of Particles ........................................................................... 5
Equation 2.3 Time-dependent Schrödinger Equation .................................................. 6
Equation 2.4 Time-independent Schrödinger Equation ............................................... 6
Equation 2.5 Electronic Density Equation ................................................................... 8
Equation 2.6 Effective Potential in Homogeneous Gas ............................................... 8
Equation 2.7 Thomas-Fermi’s Energy Equation ......................................................... 8
Equation 2.8 Hohenberg-Kohn Ground State Energy Equation ................................ 10
Equation 2.9 Hohenberg-Kohn Theory Kinetic Energy Equation ............................. 10
Equation 2.10 Hohenberg-Kohn Theory Coulumb Energy Equation .......................... 10
Equation 2.11 Kohn-Sham Energy Equation ............................................................... 10
Equation 2.12 Definition of Electron Density in Kohn-Sham Equation ..................... 11
Equation 2.13 Kinetic Energy in terms of Wavefunction ............................................ 11
Equation 2.14 Orthonormality ..................................................................................... 11
Equation 2.15 Schrödinger’s Equation of Non-interacting Particles ........................... 11
Equation 2.16 Effective Energy in Equation 2.15 ....................................................... 11
Equation 2.17 Exchange-correlation Potential ............................................................ 11
Equation 2.18 Kohn-Sham Energy Equation in terms of Single Particle
Wavefunction ........................................................................................ 13
Equation 2.19 LDA Exchange-Correlation Energy ..................................................... 13
Equation 2.20 LDA Exchange Energy......................................................................... 13
Equation 2.21 LDA Correlation Energy ...................................................................... 13
xvi
Equation 2.22 GGA Exchange-Correlation Energy ..................................................... 13
Equation 2.23 B3LYP Functional ................................................................................ 14
Equation 2.24 Time-Dependent Hamiltonian .............................................................. 16
Equation 2.25 Time-Independent Hamiltonian............................................................ 16
Equation 2.26 Coumlomb Integral ............................................................................... 16
Equation 2.27 Exchange Integral ................................................................................. 16
Equation 2.28 Arrhennius Equation ............................................................................. 18
Equation 2.29 Eyring Equation .................................................................................... 18
Equation 3.1 Calculation of Adsorption Energy ........................................................ 37
Equation 3.2 Calculation of Binding Energy ............................................................. 53
Equation 4.1 Calculation of Activation Energy ......................................................... 71
Equation 5.1 Calculation of Binding Energy ............................................................. 89
Equation 5.2 Calculation of Adsorption Energy on Supported Cluster ..................... 95
Equation 5.3 Calculation of Adsorption Energy on Unsupported Cluster................. 96
Equation 5.4 Calculation of Interaction Energy ........................................................ 97
Equation 5.5 Relationship between Adsorption Energies and Interaction Energy .... 97

xvii
LIST OF SCHEMES
SCHEME PAGE
Scheme 5.1 Thermodynamic cycle of CO reactive adsorption on the supported
Ce2O4 cluster ............................................................................................ 96
1
CHAPTER 1
GENERAL INTRODUCTION AND OUTLINE
Heterogeneous catalysis plays a vital role in many industrial operations and many
other processes. These processes include oil refining1, production of fertilizers, as well as
eliminating the pollution from chemical and petroleum processes, and vehicular
emissions.2 The advancement of fuel-cell technologies also rely on the development of
more efficient catalysts at both electrodes3. Heterogeneous catalysis is a type of catalysis
process where the catalyst is in a different phase from the reactant. Normally the catalyst
is a solid and the reactants are gas or liquid. The catalytic process usually proceeds by the
chemsorption of the reactants to the catalyst surfaces, and the strength and characteristic
of the chemsorption determine the performance of the catalyst. Therefore, gaining the
knowledge of the catalyst performance as a function of the chemical composition and
molecular structure of the catalyst surface or nanocluster is the science foundation for
heterogeneous catalysis.
The state-of-the-art modern experimental approaches provided useful tools for the
study of this field. For example, low energy electron diffraction (LEED) is widely used to
characterize the structure of the surfaces4-6. The yet more powerful scanning tunneling
microscopy (STM)7-9 and atomic force microscopy (AFM)10,11 allow the viewing the
surface at the atomic level. Vibrational frequencies from high resolution electron energy
loss spectroscopy (HREELS) or reflection adsorption infrared spectroscopy (RAIRS) are
used to characterize the adsorbed reactive molecules on the surfaces. The measurement
adsorption and reactivity from temperature programmed desorption (TPD) and
temperature programmed reaction (TPR) experiments provides quantitative information
2
on the elementary adsorption and reaction steps that occur on these model surfaces. In
addition, the technique of synthesizing metal clusters on well-defined thin oxide films12-18
enables the more controlled preparation of catalysts. With these carefully prepared
samples, some atomic details of the catalysts were revealed and conditions affecting the
performance of catalysts were well understood.
Despite the valuable information we can obtain from the experiments, there are also
phenomenon and insights into the system hitherto unobservable using pure experimental
approaches. For example, some experimental approaches merely reveal the average
behavior of a system, while the contribution of distinct localized domains/structures
cannot be measured. Furthermore, some experimental data are hard to be interpreted due
to the complexity of the system and the coupling of multiple interactions. For example,
the information of molecular bonding and orbital and electronic charge distributions
cannot be obtained from experiments. The strength of interactions and the relative
stabilities between different structures cannot be predicted by experiments. The
information of a complete reaction pathway cannot be described by any experimental
approach. Therefore, an approach beyond experiment is needed to predict the
unobservable properties and improve the interpretation of the experimental data.
Quantum mechanics methods can be used to solve some of the problems that
experimental approaches failed. By applying different theoretical methods, most of the
molecular behavior can be predicted. For example, the structures and the relative energies
of a molecule or solid can be calculated to obtain the knowledge of stable atomic
structures of a system. The frequency calculations of each individual mode can be used to
assign the peaks from experimentally obtained spectrum. Some methods based on
3
transition state theory can discover the complete reaction pathways, calculating the
transition state structures and also determine which of the pathways is more favorable for
the reaction. Depending on the quantum theory being used, there are several types of
computational methods: ab initio method, semi-empirical/empirical method, molecular
mechanics and molecular dynamics. Here we consider the density functional theory
(DFT) belong to ab initio category since the molecular Hamiltonian needs to be solved
although some of the functionals employ parameters derived from empirical data.
In this dissertation, a brief review of the DFT and its implementation in
computational packages are present in Chapter 2. The transition state theory applied in
my work is also briefly discussed in this chapter. Chapter 3−5 presents my study of the
properties that influence the activities of catalysts: geometric and electronic structures of
a catalyst, defect and substrate effect. Chapter 3 presents how the morphologies of BaO
surfaces and clusters, as well as the existence of defects and support substrate, affect the
BaO-NO2 interaction. Chapter 4 reports the influence of the electronic structures of
magnesium clusters on the energy barriers of magnesium-catalyzed H2 dissociation. The
effect of the nature of the support substrate on the reactivities of the supported metal
oxide was studied in Chapter 5. The reactivities of monoclinic ZrO2(111) and non-spinel
γ-Al 2O3(100) supported Ce2O4 clusters toward CO and CO2 adsorption were compared to
reveal the different support effects.
4
CHAPTER 2
COMPUTATIONAL METHOD
2.1. A Brief History of Quantum Mechanics
Toward the end of the nineteenth century, thanks to the work of the great physicists,
most important principles of the classical physics have been discovered and brought to a
high degree of sophistication19. The turn of 20th century is a heady era of great success for
a more profound discoveries and revolution that impact the science field of physics,
chemistry and biology, as well as engineer and technologies. This revolution starts with
the birth of the theory of relativity and quantum mechanics and these two constitute what
now is called modern physics. Modern physics completely altered our way to look at the
world. Quantum mechanics was initially developed to provide a better explanation of the
behavior of systems at atomic length scales and smaller, especially the spectra of light
emitted by different atomic species. After several decades of development, quantum
mechanics nowadays not only plays a very important role in the field of physics, but also
has its many applications in chemistry.
In early 1838, Michael Faraday discovered the “cathode rays” when passing current
through a rarefied air filled glass tube. These cathode rays are actually steams of
electrons. In 1897, the British physicist Joseph John Thomson performed an early version
of the famous oil drop experiment of Millikan and calculated the charge and mass of the
electron. Although his calculations of charge and mass were in error by 50%, the
experiment did show that there exists a subatomic particle much lighter than the lightest
atom. After Gustav Kirchhoff’s study of the black body radiation problem in 1859,
Ludwig Boltzmann suggested in 1877 that the energy states of a physical system could be
5
discrete. Finally in 1900, Germany physicist Max Planck successful proposed a
mathematical formula for the discrete energies of the black body:
� � ���, (2.1)
where � is an integer, � is a constant and � is the frequency. However, Planck’s theory
was too revolutionary to be accepted by most physicists at the time. A few years later, in
1905, Einstein explained the photoelectric effect using the very same idea of Plank’s and
obtained a value of � in close agreement with Planck’s value. In 1907, he further proved
that the mechanical vibrations of the atoms in crystals are also quantized. Ever since then,
the idea of quantization condition became provocative. In effort of explaining the line
spectrum of hydrogen, Niels Bohr formulated a model of hydrogen atom that was in good
accordance with the spectrum. However, Bohr’s theory could not be successfully
extended to explain some phenomenas such as the spectrum arising under a magnetic
field. The stage for the next advance was set by de Broglie, who, in 1923, postulated that
electrons and other particles have waves associated with them and the wavelength is
given by
� � �/, (2.2)
where p is the momentum of the particle. Combining this wave nature of particles with
Bohr’s theory, the quantization of Bohr orbitals can be explained by whether the wave is
in phase of the orbital. In 1926, the electron was experimentally shown to act like wave
for the first time by George Paget Thomson, J. J. Thomason’s son. Following the
discovery of both particle-like and wave-like properties of atomic and subatomic
particles, Schrödinger found a wave equation that governs the behavior of those particles
in 192620.
6
The Schrödinger’s equation is a very fundamental equation in quantum mechanics.
The solution of this equation is called wavefunction. It is the most complete description
of any system. The general equation for one particle can be written as:
� �
� ��, �� � ����, �� =� ��
������, �� � ������, ��, (2.3)
where ��, �� is the wavefunction, r is the position in three-dimensional space, �� is the
Hamiltonian operator, m is the mass and ���� is the potential at point r. The time-
independent Schrödinger’s equation can be written as:
����� =� ��
�������� � ��������, (2.4)
which formulated the Schrödinger’s equation as an eigenvalue problem.
Shortly after Schrödinger’s equation for the electronic wavefunction was validated for
simple small systems like H2 and many-electron atom He, there was a saying that
chemistry had come to an end because all the chemistry can be entirely contained in the
powerful equation. However, in most of the cases, the quantum mechanical equation is
way too complicated to be solved exactly, so finding proper approximation to
Schrödinger’s equation became an intuitive and straightforward solution. As matter of
fact, during the decades after Schrodinger’s equation, the entire field of computational
chemistry is built around approximate solutions. Some of these solutions are very crude
and others are expected to be more accurate than any experiment that has yet been
conducted. The knowledge of each approximation and how accurate the results are
expected to be the key to the choice of method. Extremely powerful computers,
sometimes supercomputers, are needed for obtaining very accurate results. Generally, the
larger the system is (containing more particles), the more expensive the computation is.
2.2. Density Functional Theory
7
Density Functional Theory (DFT) method uses the electron density of a system to
provide us the properties of the ground states. It was first introduced in 1960s by
Hohenberg-Kohn21 and Kohn-Sham in two of the seminar papers21,22. Later, the theory
has attracted a lot of research interest in improving the adaption of the method for
practical computational use. The last few decades have witnessed the prevailing
applications of DFT method—especially after 90s, the usage of the method has increased
exponentially. It is so far the most successful and most promising approach to compute
the electronic structure of the matter. It also calculates a large variety of molecular
properties such as molecular structures and energies, vibrational frequencies, electric and
magnetic properties and reaction pathways, etc. It is among the most popular methods
available in condensed matter physics, computational physics, and computational
chemistry… Nowadays, it is often referred to as “theory of the moment”. In 1998, Walter
Kohn was awarded with the Nobel Prize in Chemistry for his contributions to the
“development of the density functional theory”, symbolizing the recognition of the
contribution of the theory to physics and chemistry science societies.
There are three important benchmark works in DFT development history: First, the
rudimentary but inspirational form of DFT that was discussed in 1927 by Thomas and
Fermi, known as Thomas-Fermi theory. In 1964 and 1965, the Thomas-Fermi theory was
put forward in two seminar papers, known as Hohenberg-Kohn theory and Kohn-Sham
equation. These three benchmarks will be introduced below:
2.2.1. Thomas-Fermi Theory
The Thomas-Fermi theory first introduced electron density instead of wavefunction as
the variable to quantum equations. The theory considered interacting electrons moving in
8
an external potential field and it has a very crude description of electronic energy in terms
of the electron density distribution ����:
n�r� � γ�µ � ν$%%�r��&/�, (2.5)
where
ν$%%�r� � ν�r� � '(�),�
|)+ ),|dr.. (2.6)
µ in Equation (2.5) is the coordinate-independent chemical potential and r is a constant.
Equation (2.6) calculates the difference between external potential (the first term) and the
electrostatic energy that is generated by the electron density distribution ���� (the second
term). The number of electrons within a small enough distance element dr is
homogeneous and can be expressed as ����/�. So the energy of the system can be
calculated by:
�012����3 � '&
45�37��
�8 ����
98/� +' ν�r�n�r�dr � 4
�'
(�)�(�),�
|)+ ),|drdr., (2.7)
where the first term is the electronic kinetic energy calculated by integrating the kinetic
energy density of homogeneous electron gas.
One big breakthrough of the Thomas-Fermi theory is it provided a crude form of
expressing the solution of the many-electron Schrodinger’s equation in terms of electron
density ���� instead of in terms of wavefunction ψ, so we can characterize the electronic
structure of the system by knowing the electron density ����. However, Equation (2.5)
was based on the expression of a uniform electron gas distribution under the external
potential, so the theory suffers many deficiencies. First, the gradients of ν$%%�r� were
obviously ignored. Therefore, the theory only applies for systems with slowly varying
density. Second, the description of kinetic energy is very crude. While the kinetic energy
represents a substantial portion of the total energy of a system so the small error of
9
kinetic energy description for each point can lead to disastrous results. So it is only good
in describing the qualitative trends of energies. Third, the electron-electron interaction is
over-simplified. These interactions were treated classically so a lot of the quantum
phenomenon was not taken account of. The theory totally fails to calculate chemical
bonding23,24. Although later on, the gradient, exchange and correlation were made to
improve the method, it was generally considered too rough to be useful for the
applications of electoral structure calculation.
2.2.2. Hohenberg-Kohn Theory
Uniqueness: The first important lemma of the Hohenberg-Kohn theory is the proof
of “the ground state density ���� of a bound system of interacting electrons in some
external potential ν�r� determines this potential uniquely”. The proof of this lemma was
simply assuming an electron density ����, corresponds to two non-degenerate ground
state potentials ν4�r� and ν��r� with ground sate wavefunction of ψ4 and ψ�. However,
the ground state energy E1 and E2 calculated from the two different potential and
wavefunction but the same electron density yielded E1 + E2 < E1 + E2, contradicting
with the assumption that two states are non-degenerate.21 Therefore, the ground state can
be uniquely determined by the ground state electron density �5���.
Variational Theory: The variational theory, which is very useful to a lot of quantum
method, stated that the expectation value of the Hamiltonian for a trial wavefunction must
be greater than or equal to the actual ground state energy. Based on the uniqueness
theorem, the ground state energy can be solved if the groundstate electron density �5���
is known. So adding the Variational Theory on top of it, the ground state energy can be
solved by minimizing the energy in terms of electron density ����. The energy can be
10
written as a summation of kinetic energy, electrostatic energy and the energy of non-
interacting electron moving under external potential:
E2(�)�3 � T2(�)�3 � U2(�)�3 � ' V�r?�n�r?�d&r, (2.8)
where the first two terms are independent of external potential V�r� and can be expressed
using a universal functional of the electron density n(r):
T � '&
45237�����3
�8n�r�dr (2.9)
U � 4
�'
(�),�
|)+ ),|dr.dr (2.10)
So, the Hohenberg-Kohn Theory provided a form of calculating energy in terms of
electron density. But the method is not accurate due to the inadequate representation of
the kinetic energy T.
2.2.3. Kohn-Sham Equations
Following the Hohenberg-Kohn theorem, the Kohn-Shawn theorem stated that if we
can find the true ground state electron density, we find the lowest energy of the system
and thus the ground state of the system. Furthermore, the theorem provided a way of
finding the ground state density. Kohn and Sham proposed the ground state energy can be
written as a functional of the charge density:
E2(�)�3 � T2(�)�3 � E$@A2(�)�3 � 1/2 '(�)�(�),�
|)+ ),|� D@E2(�)�3, (2.11)
where the first term is the kinetics energy and the second term is the interaction between
electron and the external potential. The third and fourth terms are electron-electron
electrostatic interaction and the non-classical exchange-correlation energy, respectively.
The last two terms combined describe the electron-electron interaction. Inspired by the
self-consistent single particle equations for the approximation of the electronic structure
11
by Hartree25,26 where every electron was regarded as moving in an effective single
particle potential, Kohn and Sham then reintroduced the single particle wavefunctions:
���� � ∑ �GH����G���I
GJ4 . (2.12)
The kinetic energy can be written in terms of wavefunctions by:
K2����3 � � ��
��∑ L �G|��|�G MI
GJ4 . (2.13)
Equation
' �GH����N���/� � OG,N (2.14)
guarantees the orthonormality of the wavefunctions. These wavefunctions are the
solutions to the Schrödinger’s equation of non-interacting particles moving in an
effective potential DPQQ���:
� ��
�����G��� � DPQQ����G��� � �G�G���, (2.15)
where
DPQQ��� � DPR ��� � DRS��� � 4
�'
(�),�
|)+ ),|dr.. (2.16)
The exchange-correlation potential is given by:
DRS��� �TUVW2X�Y�3
TI�Z�. (2.17)
So the energy of the system can be written as:
E2(3 � ∑ ε\(\J4 � 1/2 '
n�r,�|r� r]|
� E@E2(�)�3 � 'TUVW2X�Y�3
TI�Z�n�r�dr, (2.18)
where ̂ \s are the eigenvalues of non-interacting single-particle equation which is
supposed to be an “exact” term.
Now the attention turned into the exact form of the exchange-correlation functional.
Actually, this term is so important that the practical use of the ground state DFT entirely
12
depends on the accuracy of this approximation term. The discussion of the exchange-
correlation term will be presented in the following section.
2.2.4. Functional Effect
This exchange-correlation term is, in my opinion, the beauty of DFT because we do
not need to deal with the electron exchange and correlation term explicitly any more. In
Hartree-Fock method, the electron correlation energy was ignored and the electron
exchange term has to be treated by solving the mixed wavefunction terms of different
electrons. Sometimes these crossing terms from the electron exchange can be really
“nasty” and solving them cost a lot of computational effort. While in DFT, not only was
the electron correlation calculated, it was treated along with the exchange term which
makes the calculation a lot easier. The idea of treating electron exchange and correlation
together is great, however, the exact form of this term is unknown. Therefore, like lots of
the other quantum theories, approximations were made to express this term.
As discussed above, finding a good approximation of the exchange-correlation
functional is critical for the proper application of DFT. As a matter of fact, after the
appearance of the Kohn-Sham equation, a lot of research effort has been focused on
developing an accurate approximation functional which, at the same time, sufficiently
simple to be solved. There are three categories of exchange-correlation functional—the
local density approximation (LDA), general gradient approximation (GGA) and hybrid
functional.
The LDA functional is the simplest approximation for the E$@�(�. The exchange-
correlation term can be approximated to the energies of a homogeneous electron gas of
the same local density:
13
E$@�(� � ' e@E`n�r�an�r� dr (2.19)
where the e@E�n� is the exchange-correlation energy of a uniform electron gas of density
n. The exchange part is given by
e@�n� � � 5.cde
)f , (2.20)
where rg is the radius of a sphere containing one electron. The correlation part was first
estimated by Wingner27:
eE�n� � � 5.cc
)fhi.e , (2.21)
reflecting the combined effect of the Pauli principle and the electron-electron interaction.
The accuracy of the exchange energy for the LDA form is typically within 10%,
while the correlation energy, which is normally much smaller, is generally overstimated
by up to a factor 2. Fortunately, the two errors typically cancel each other partially. Thus,
the LDA gives ionization energies of atoms, dissociation energies of molecules and
cohesive energies with a fair accuracy of typically 10-20%, while the bond lengths of
molecules and solids are typically decent with an accuracy of 2%. However, the LDA
calculations are insufficient for most applications in chemistry, especially when it comes
to systems like heavy fermions, where the electron-electron interaction effect dominates.
The GGA is an improved form based on the LDA functional by including the gradient
expansion term:
E$@�(� � ' e@E�n�r�, | ∂n�r�|�n�r� dr. (2.22)
Furthermore, some of the GGA methods that were developed in recent years often have
been empirically calibrated to optimize the accuracy of the atomization energies of
standard sets of molecules and have really successfully produced the structural and
14
energetic properties of various systems. Major contributors include A.D. Becke, D.C.
Langreth, M. Levy, R.G. Parr, J.P. Perdew, C. Lee and W. Yang.28 Examples of
commonly used GGAs are PW91 and PBE.
Another successful functional was introduced is the hybrid method which
incorporates linear combination of exact exchange from Hartree-Fock theory with
exchange-correlation from other sources. The idea was first introduced by Axel Becke in
1993.29 For example, the famous B3LYP30,31 functional is written as:
E@Ek&lmn � E@E
lop � α5�E@rs � E@
lop� � α@�E@ttp � E@
lop� � αE�EEttp � EE
lop�,
(2.23)
where the values of the three parameters α5, α@ and αE are determined by fitting the
predicted values to a set of experimental data such as atomization energies and ionization
energies etc.
GGA's and hybrid approximations have reduced the LDA errors of atomization
energies of standard set of small molecules by a factor 3-5. This improved accuracy has
made DFT nowadays a very important and popular computational method of quantum
chemistry. The hybrid functional can even deal with some problems that cannot be
achieved by the LDAs and GGAs such as the highly localized f electrons in transition
metals.
2.2.5. Overview of Theory
2.2.5.1. Major Contributions of Theory
Fundamental Understanding (DFT v.s. Hartree-Fock): Following Schrödinger’s
equation, traditionally, we consider a system as Hilbert space of single particle orbitals
and the wavefunctions are the most important variables for a system. While the DFT
15
provided a complimentary perspective by focusing on quantities in real coordinate space
n(r), so this is conceptually a totally different point of view. In addition, the exchange-
correlation energies were included in DFT and they were cleverly written together using
and approximated functional.
Practical: Another success of the DFT is it is actually a very practical method for the
study of quantum system. In quantum computations, Hartree-Fock method is a basic
method that provides a “reasonable” physical description of the interactions such as
attractions, repulsions and electron exchanges between nucleus and electrons of a system.
However, the method has its limitation: by increasing the complexity of the basis set in
the calculation, the convergence eventually reaches to the “exact” solution of the Hartree-
Fock calculation and this is called Hartree-Fock limit. Unfortunately, the limit is still far
from the exact description of many electronic structures and properties simply due to the
ignorance of the electron correlation term. For example, Hartree-Fock calculations yield
poor results for the dissociation energies and even worse results for the reaction energies.
DFT, along with others such as perturbation theory (MP2, MP3 and MP4 calculations),
configuration interaction method and coupled-cluster method are considered “beyond
Hartree-Fock” approaches. These “beyond Hartree-Fock” methods provide more accurate
computational results by including the correlation energies. However, except the DFT, all
the other “beyond Hartree-Fock” methods all suffer a big drawback: if we use
tranditional wavefunction methods, when the system size increases, at certain point, we
encounter a so called “exponential wall”—as the particle number increases, the
computational effort increases exponentially. While the computational effort of DFT is
significantly lowered, thus the computation of large systems became achievable. The
16
“practical” success can be explained by showing the difficulties of solving traditional
Hartree-Fock in terms of wavefunction below:
The original Hamiltonian is written as:
�� � � ��
��∑ ��(
\J4 � ��
��u∑ ��v
wJ4 � ∑ ∑ xu
Zyu
�zJ4
IGJ4 � ∑ ∑ 4
Zy{
IN|4
IGJ4 � ∑ ∑ xux}
~u}
��|z
�GzJ4
(2.24)
After the first “famous” approximation, that is, Born-Oppenheimer approximation,
the electronic Hamiltonian can be written as:
��P�PS � � ��
��∑ ��(
\J4 � ∑ ∑ xu
Zyu
�zJ4
IGJ4 � ∑ ∑ 4
Zy{
IN|4
IGJ4 , (2.25)
where there are only three terms left—the electron kinetics, the nuclei-electron attractions
and the electron-electron repulsions. The first and second terms in Equation 2.25 are
usually very straightforward and easy to deal with, but the electron-electron interaction is
often cumbersome. The Hartree-Fock method describe the electron-electron interaction
using ∑ J\�+(\,�J4 K\�where
�GN � ' ' �G��4���?� �GH��4���?� 4
Z���N�������?��N
H�������?�/�4���?/������? (2.26)
�GN � ' ' �GH��4���?��N��4���?� 4
Z���G�������?��N
H�������?�/�4���?/������?. (2.27)
Jij is Coumlomb integrals, and Kij is exchange integrals which covers the electron
exchange energy. It was the last exchange term of the Hartree-Fock model that made the
Hartree-Fock equation not “separable” for each electron, and furthermore, solving
equations with this mixed term can be really “painful”. One of the reasons why DFT
method is so efficient compared with the Hartree-Fock method is it avoids dealing with
this term. Instead, only the Schrödinger’s equations of single particles need to be solved.
2.2.5.2 Applications
17
DFT has been successfully applied to calculate various ground state properties of a
lot of different systems. Theoretically, any property that can be derived by solving
Schrödinger’s equation can be calculated by the DFT. Those properties typically include:
mechanical properties (elasticity and plasticity), phonons and thermodynamics,
theoretical crystallography and mineralogy. It can also deal with some chemical
processes such as heterogeneous catalysis (oxidation and hydrogenation),
hydrodesulferization and isomerization cracking, as well as electrochemistry and
electrocatalysis. Furthermore, the time-dependent density functional theory (TD-DFT)32
is the extension of DFT method and can be used to calculate the excited state properties
such as excitation energy and photoadsorption spectrum. The DFT method can also be
conveniently implemented into ab initio Car-Parronello molecular dynamics
simulations33 wherein the electronic degree of freedom is included.
Other techniques to improve the applications of DFT include: using high-performance
code (MPI-based code, for example), good choice of basis set (planewave for extended
system, Pseudopotentials rather than full-electron methods) and tight-binding techniques
(semi-empirical).
DFT still have unsolved issues of dealing with certain systems and properties.
Because the DFT calculations are very sensitive to the electron density and thus it fails
for systems where electron density is not a slowly varying function such as Van der
Waals energies between non-overlapping subsystems and electronic tails evanescing into
the vacuum near the surfaces of bounded electronic systems and electronic Wigner
crystal. The poorly calculated properties also include long range polarization energies,
regions of evanescent electron densities, partially filled electron shells and reaction
18
barriers. Only through proper special approximations, these problems can be successfully
treated.
2.3. Locating Transition States
Before the development of transition state theory (TST), the empiricism-based
Arrhennius equation
� � ��+� ~0⁄ (2.28)
is generally accepted34. However, the equation is based the experimental observation and
does not have theoretical or mechanism base. The detailed consideration of the pre-factor
� and the activation energy � was not dealt with until 1935 when the TST was discussed
by Henry Eyring and by Gwynne Evans and Michael Polanyi simultaneously.35-37 The
Eyring equation, also known as the Eyring-Polanyi equation
� � ��0
��+�t‡ ~0⁄ (2.29)
successfully addressed the two factors (pre-factor and activation energy) in the Arrhenius
equation. The fundamental assumption is that there exists a hypersurface in phase space
which divides space into a reactant region and a product region, and once the trajectory
passes through this dividing surface to the product direction it will never recross the
hypersurface again. Thus, the reaction rate can be calculated by focusing attention on the
activated complex which lies at the saddle point of the potential energy surface and the
details before the transition state is reached is not important. A more refined version of
transition state theory is the variational transition state theory (VTST)38,39. It is
distinguished from the conventional TST by varying the definition of the dividing
surface. The dividing surface does not only intersect the saddle point, it is also
perpendicular to the reaction coordinate in all reaction coordinate dimensions. Thus, the
19
dividing surface between reactant and product regions is variationally optimized to
minimize the reaction rate. Some recent development of the original TST include RRKM
theory40-42 and quasi-equilibrium theory (QET)43 etc.
In my study, the Nudged Elastic Band (NEB) method44,45 was used to seek the
minimum energy pathway (MEP) and locate the saddle point of the MEP. The NEB
method was developed by Hannes Jonsson et al. The method is a very efficient approach
for finding MEP between given initial and final state even for systems with very complex
potential energy surfaces. In the NEB method, first a set of images (replicas) of the
system are constructed between initial and final states. Then a spring interaction is added
to between adjacent replicas so that the images on the path are continuous. The spring
force limits any irrational movement of the images that would not end up with the
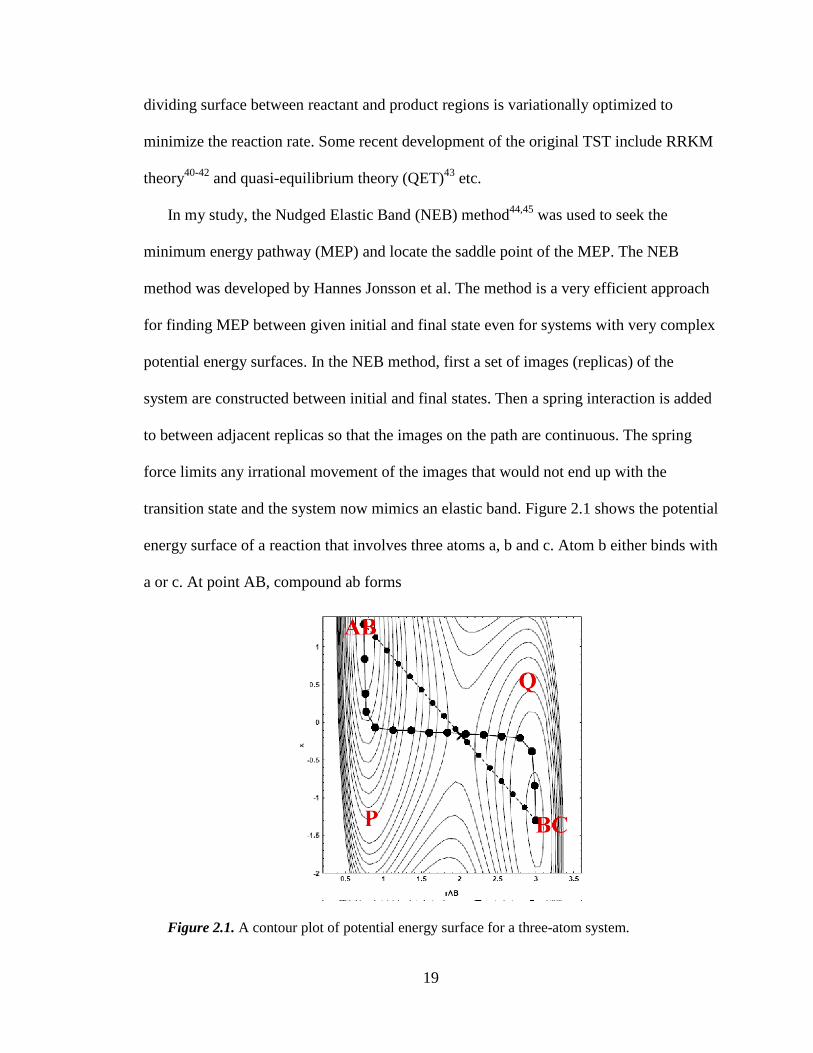
transition state and the system now mimics an elastic band. Figure 2.1 shows the potential
energy surface of a reaction that involves three atoms a, b and c. Atom b either binds with
a or c. At point AB, compound ab forms
Figure 2.1. A contour plot of potential energy surface for a three-atom system.
20
and at point BC compound bc forms and these two points are both energy minimum on
the plot. The points at the straight line with small dots which connect to initial and final
state AB and BC represent the set of images constructed at the beginning of a NEB
calculation. If the spring force didn’t exist between the images, optimizing the images at
the straight line would lead to the images on the right hand side of the system falling into
region Q and those on the left into P at the end, which obviously would not lead to a
transition state. However, minimizing the force acting on the images with the spring
force, we end up with the MEP which is indicated by the line with large dots. To be more
specific, the tangent to the path at each image during the minimization was calculated so
that both spring force and true force can be decomposed into components parallel or
perpendicular to the path. Only the parallel spring force and the perpendicular real force
should be included in minimization. This ensures that the spring forces only controls the
spacing between the images along the band but do not interfere with the convergence of
the elastic band to the MEP (the perpendicular spring force prevent the band from
following a curved pathway causing “corner-cutting”); at the same time, the true force
pushes the images into the MEP but does not affect the distribution of images along the
band (the parallel true force causes the images to slide away from the high energy regions
towards the minima, reducing the density of images where they are needed most).
The NEB has been conveniently adapted for conjunction use with the DFT
calculation code VASP. In my study, I used the Perl code developed by Henkelman et
al.45
2.4. Computational Codes
21
The density functional theory has been implemented in various computational codes.
Two simulation codes were used in my study—the VASP and GAUSSIAN. Both codes
are very well commercialized and widely used.
2.4.1. VASP. The Vienna Ab-initio Simulation Package (VASP) performs ab-initio
density functional theory calculations. It is by far one of the most popular computational
codes for calculations of infinite systems such as solid states and condensed matters.
VASP uses plane wave basis set rather than localized basis set. The PAW method or
ultra-soft pseudopotentials are used to describe the interaction between ion and non-
valence electron so that the size of the basis set can be reduced. The self-consistency
cycles and choices of numerical methods to calculate the electronic Kohn-Sham ground-
state in VASP are quite efficient and robust. Periodic boundary conditions are used to
treat infinite numbers of atoms. The package also includes the Monkhorst Pack to sample
the Brillouin zone. In the actual computation, only the atoms within one periodic cell was
optimized and computed with the consideration of their interactions with atoms in the
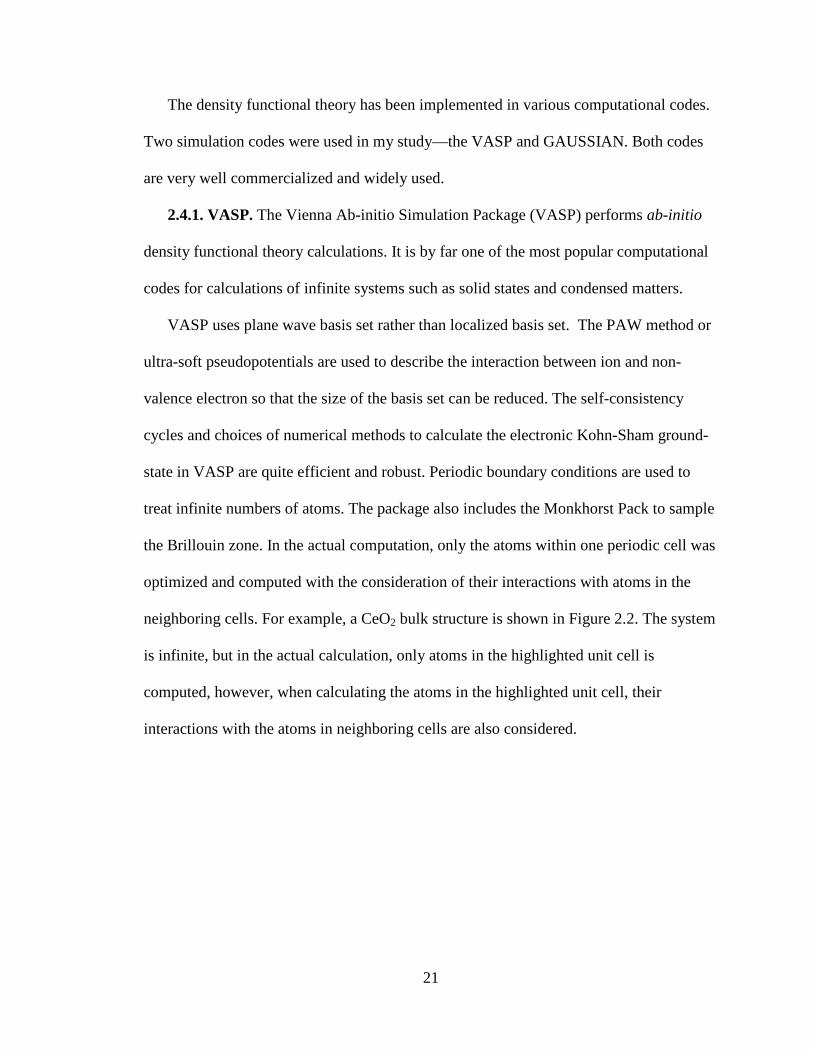
neighboring cells. For example, a CeO2 bulk structure is shown in Figure 2.2. The system
is infinite, but in the actual calculation, only atoms in the highlighted unit cell is
computed, however, when calculating the atoms in the highlighted unit cell, their
interactions with the atoms in neighboring cells are also considered.
22
Figure 2.2. Bulk CeO2 structure. Atoms in each box are repeated in other boxes.
The VASP offers support for a large variety of flatforms, such as Pentium, Athlon,
IBM, HP, Cray and SUN(-). High performance computation (paralleled computers) is
available. All these features make the package very suitable for computations of extended
large systems. In principle, in paralleled computing the more processors are used, the
faster the calculation is. However, for the computer clusters, depending on the processor
type, there is always a critical number of CPUs, larger than which the computation speed
does not increase linearly with the number of CPUs used—for example, computing on
four nodes might be two times faster than computing on two nodes, but computing on
eight nodes does not necessarily improve the efficiency by as much as four times.
A typical VASP calculation requires at least four basic input files—INCAR,
POTCAR, POSCAR and KPOINTS.
INCAR: The actual calculation control parameters are included in this file. It decides
what calculations need to be done and how they should be done. The basic parameters are
as following:
IBRION = 2 Ionic relaxation algorithm: 0-MD 1-quasi-New 2-Conjugated Gradient.
23
POTIM = 0.50 Time-step for ion-motion. The proper
value can speed up the calculation
ISIF = 2 What to relax. Typically 7- bulk, 2-cluster, and 3 or 2 for surface.
NSW = 100 Number of steps for ionic relaxation.
Stopping criteria before EDIFFG is reached.
EDIFF = .5E-04 Stopping-criterion for electronic self consistent loop.
EDIFFG = .5E-03 Stopping-criterion for ionic relaxation. Typically ten times of the value of EDIFF.
ISPIN = 1 Spin state.1-unpolarized 2-polarized.
Different setup will yield different energy value.
ENCUT = 450.0 Cut-off energy. Directly affects the accuracy of the calculation and the calculated absolute energy value.
The parameters listed above are the basic important parameters for an INCAR file.
One should try to keep all the parameters as consistent as possible within one system for
the comparison reason, i.e., all the calculations should have the same accuracy to be
compared with each other.
Additional parameters:
PREC = high Precision of the calculation. “High” will change cut-off energy.
LCHARG = T Whether to write CHGCAR.
LWAVE = T Whether to write WAVECAR. CHGCAR and WAVECAR take
a lot of disk space. Unless necessary, don’t write them out.
LORBIT = 12 Whether to write DOSCAR and in what format.
POTCAR: The VASP is supplied with a set of standard pseudopotentials of various
atoms. Before starting a calculation, one should have the pseudopotentials of each atom
involved in the system concatenated in POTCAR under the working directory.
24
POSCAR: This file contains the lattice geometry and the ionic positions. For MD
calculations, it also optionally contains the starting velocities. For VASP calculations, the
system of interest is always a “box”, so the shape and size of the box should be defined in
this file. The number of each type of atoms should be written in one line according to the
order the element appears in the POTCAR file. Then the coordinates of each atom should
be listed either in Direct or Cartesian coordinate. One can also conveniently specify
which dimension of which atom should be allowed to relax and what should be
confined/frozen. Vacuum space can be inserted between images in neighboring cells
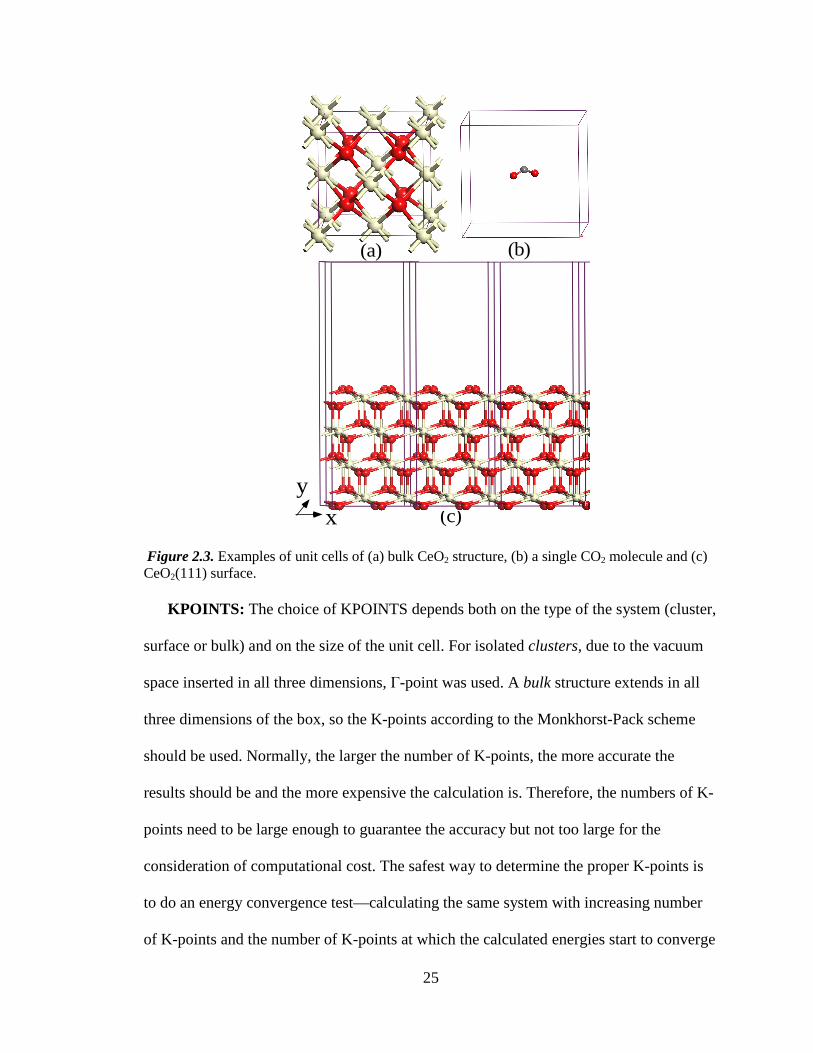
when the interactions between them need to be avoided. As shown in Figure 2.3a, for a
bulk structure calculation the system is periodically continuous, so the atoms should fill
up the unit cell in all three dimensions. For one single gas phase molecule, enough
vacuum space should be inserted in all three dimensions to avoid the interactions between
the molecule and its images in neighboring cells. The example of unit cell containing a
single CO2 molecule is shown in Figure 2.3b. A surface is normally simulated using a
slab. As shown in Figure 2.3c, the atoms in the two surface dimensions (x and y) should
be “continuous” (no vacuum space) and in the direction normal to the surface a vacuum
space should be added.
25
(a) (b)
(c)xy
Figure 2.3. Examples of unit cells of (a) bulk CeO2 structure, (b) a single CO2 molecule and (c) CeO2(111) surface.
KPOINTS: The choice of KPOINTS depends both on the type of the system (cluster,
surface or bulk) and on the size of the unit cell. For isolated clusters, due to the vacuum
space inserted in all three dimensions, Γ-point was used. A bulk structure extends in all
three dimensions of the box, so the K-points according to the Monkhorst-Pack scheme
should be used. Normally, the larger the number of K-points, the more accurate the
results should be and the more expensive the calculation is. Therefore, the numbers of K-
points need to be large enough to guarantee the accuracy but not too large for the
consideration of computational cost. The safest way to determine the proper K-points is
to do an energy convergence test—calculating the same system with increasing number
of K-points and the number of K-points at which the calculated energies start to converge
26
should be the choice of K-points. Fortunately, the convergence test is not always required.
Empirically, a division in reciprocal space of less than 0.05Å-1 has been shown to provide
converged structures and adsorption energies, so one can conveniently choose the values
of K-points accordingly. For example, if the size of a bulk unit cell is 4 × 5 × 2 Å, then
the K-points should be set up to 5 × 4 × 10. For surface calculations, the two dimensions
within the surface (x and y) are extended in neighboring cells while a vacuum space is
inserted along the dimension that is vertical to the surface (z). Thus, the choice of K-
points values for the dimensions in the surface should follow the same rule as for bulk,
i.e. a division in reciprocal space of less than 0.05Å-1. For the “discontinuous” z
dimension, 1 should be used.
Examples of INCAR, KPOINTS, POTCAR and POSCAR files are shown in
Appendix I.
If the input files are set up properly, after the calculation, the structure will be written
in a file called CONTCAR. If after the required ionic relaxation steps (NSW), the
calculation is still not converged yet, one can continue the calculation using the structure
optimized but not yet converged from the last run (cp CONTCAR POSCAR). Detailed
information of the calculation, including the energy of the system, will be written in the
file OUTCAR.
By setting LORBIT = 12 in the INCAR file, the phase projected density of state
(DOS) will be written in DOSCAR. This allows us to plot out the phase decomposed (s, p
or d) density of state graph to analyze the interactions between atoms.
27
Bader charge46 of the system can be analyzed by using the Perl code written by
Henkelman et al47. However, it is necessary to set LCHARG = T and LAECHG = T in
the INCAR file before starting the calculation.
Due to the variation of the systems studied in this work, additional descriptions of
computational parameters are presented in each individual chapter.
2.4.2. GAUSSIAN 03. Gaussian is very popular and widely used computational
software due to its user-friendly interface. A lot of the standard or default inputs are very
useful to amateurs while at the same time modifications of parameters are also available
for more sophisticated users. Unlike VASP, GAUSSIAN collected various quantum
mechanical methods, including the DFT method with different functional, and the
perturbation method such as MP2, MP3. Both Cartesian coordinates and Z-matrix are
accepted as the input coordinate. A variety of basis set are available in the program.
Besides optimizing structure and calculating energy of the system, it can also be used to
calculate frequencies, Raman and NMR spectrums, two or three layers of ONIOM
geometry optimizations, molecular dynamics simulations, and locate transition states.
The GAUSSIAN input consists of a series of lines:
• Link 0 Commands: Locate and name scratch files. The location of the
“Checkpoint” file should be specified in this line. The “Checkpoint” file is
machine-readable and it stores the calculation results (optimized structure and
orbital information). The checkpoint file is really handy when using the results of
one calculation as the starting point for a second calculation. This shall save
computational time. For example, when running a calculation that starts with the
structure stored in the checkpoint file, one should use keyword “geom = check

28
guess=read” so that the system will read the structure and basis set information
from the checkpoint file. However, if this line is not changed before running the
second calculation, the original checkpoint file will be overwritten.
• Route section (# lines): Specify desired calculation type and iop parameters. The
main information of job type (e.g. optimization, frequency, IRC, NMR, or
ADMP), computational method (e.g. ground state, TD-DFT, HF, DFT, CCSD, or
MP2) and basis set are specified in this line. The internal options can also be set
in this line to overwrite the system default parameters.
• Title section: Brief description of the calculation. Blank line is acceptable.
• Molecule specification: Specify molecular system to be studied. It is usually a line
of charge and spin state information followed by the atom types and coordinations
of each atom. Both Z-matrix and Cartesian coordinate are legal format.
• Optional additional sections: Additional input needed for specific job types.
Examples of GAUSSIAN 03 input were shown in Appendix II including calculations
for structure optimization, transition state optimization and IRC calculation.
2.5. Computational Facilities
The Guassian calculations in this work are performed on Dell WORKSTATION
PWS650 running on Windows XP with quad-core Xeon CPU 3.20 GHz and 3.50 GB of
RAM, as well as Dell Precision 380 running on Linux Redhat release 4 with Xeon CPU
2.27 GHz and 7.60 GB of RAM.
The VASP calculations were computed on high performance computer clusters
“Pluto”, “Sirius” and “Procyon” of Ge’s research group, as well as the molecular science
computing facility “Chinook” in Environmental Molecular Sciences Laboratory (EMSL)
29
located at Pacific Northwest National Laboratory. “Pluto" is composed of 25 slave nodes.
Each of these slave nodes has 1.4 GHz dual Athlon processors and 1 Gb of memory.
"Sirius" is composed of 24 slave nodes each with 1.8 GHz dual Opteron 244 processors
and 2 Gb of memory. “Procyon” is composed of 23 slave nodes and each node has quad-
core and 15.67 Gb memory. “Chinook” is sponsored by the US Department of Energy
Office of Biological & Environmental Research. It has 2,310 nodes each with HP/Linux
supercomputer two quad-core AMD Barcelona processors (2.2 GHz).
30
CHAPTER 3
EFFECT OF MORPHOLOGY, STOICHIOMETRY AND SUPPORT ON REACTIVITY OF CATALYSTS:
NO2 INTERACTION WITH UNSUPPORTED AND Г-Al 2O3 SUPPORTED BaO
3.1. Introduction
NOx (NO and NO2) species is one of the common pollutants for our environment.
One of the main manmade sources of NOx is produced by fuel combustion in motor
vehicles—diatomic nitrogen in combustion air is oxidized at high temperature.
Nowadays, most of the vehicles were equipped with emission control system called
catalysis convertor. The most conventional catalyst used in the catalysis convertor is the
three-way catalysts. The catalysts abate hydrocarbon, CO and NOx in the exhaust
simultaneously at the stoichiometric air-to-fuel ratio combustion condition. However, in
order to improve fuel efficiency, “lean-burn” technology was introduced to gasoline
internal combustion engines. The lean-burn engine operates at a higher air-to-fuel ratio
than the stoichiometric ratio so that the engine achieves a more complete combustion and
therefore, a better fuel economy. The relative oxidative environment resulted from the
high air-to-fuel ratio makes the reduction of NOx generated during combustion more
challenging, so the three-way catalysts are ineffective to eliminate NOx under lean burn
conditions.48 To meet the stringent NOx emission standards, alternative NOx control
technologies are needed. One of the new technologies is the NOx storage-reduction
(NSR) catalysts.48-51
The design of the NSR catalyst is based on the cyclic operation of the engine between
lean and rich modes, i.e. at high air-to-fuel ratio lean mode, the reduction of NOx is not
favored, so the catalysis system stores
switched to the rich mode,
being emitted into the air.
support, noble metals as active red
as NOx storage component
storage, BaO is the most effective toward
main NOx storage component in NSR
oxidation of NO to NO2 over
of this process is shown in Figure
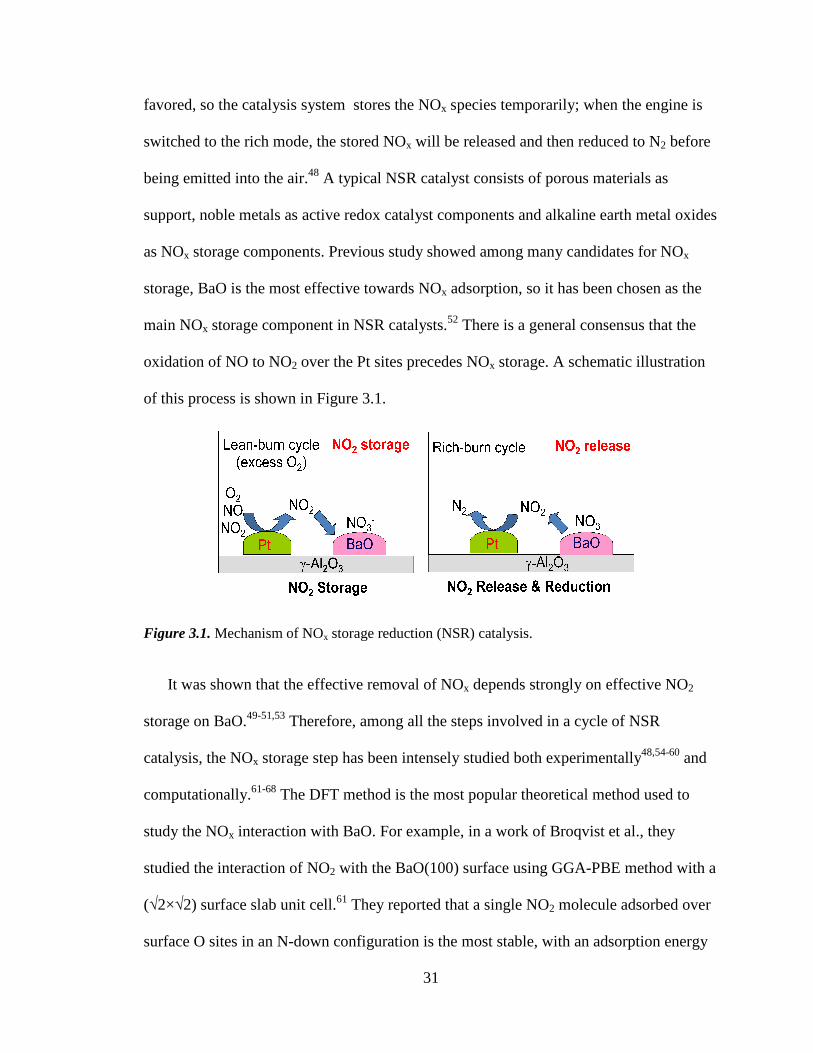
Figure 3.1. Mechanism of NO
It was shown that the
storage on BaO.49-51,53 Therefore, a
catalysis, the NOx storage step has
computationally.61-68 The D
study the NOx interaction with
studied the interaction of
(√2×√2) surface slab unit cell
surface O sites in an N-down configuration
31
so the catalysis system stores the NOx species temporarily; when the
mode, the stored NOx will be released and then reduced to N
being emitted into the air.48 A typical NSR catalyst consists of porous materials as
support, noble metals as active redox catalyst components and alkaline earth metal oxide
storage components. Previous study showed among many candidates for NO
effective towards NOx adsorption, so it has been chosen as the
storage component in NSR catalysts.52 There is a general consensus
over the Pt sites precedes NOx storage. A schematic illustration
is shown in Figure 3.1.
echanism of NOx storage reduction (NSR) catalysis.
effective removal of NOx depends strongly on effective NO
Therefore, among all the steps involved in a cycle of NSR
storage step has been intensely studied both experimentally
The DFT method is the most popular theoretical method used to
interaction with BaO. For example, in a work of Broqvist et al
the interaction of NO2 with the BaO(100) surface using GGA-PBE method with a
2) surface slab unit cell.61 They reported that a single NO2 molecule adsorbed
down configuration is the most stable, with an adsorption energy
; when the engine is
reduced to N2 before
porous materials as
alkaline earth metal oxides
many candidates for NOx
, so it has been chosen as the
general consensus that the
A schematic illustration
depends strongly on effective NO2
all the steps involved in a cycle of NSR
both experimentally48,54-60 and
FT method is the most popular theoretical method used to
Broqvist et al., they
PBE method with a
molecule adsorbed over
with an adsorption energy
32
of 0.8 ± 0.05 eV. In a later publication by the same group, they studied NO2 adsorption
over a (BaO)9 cluster.69 The low-coordinated cluster sites were found to have a stronger
affinity towards NO2 compared with the surface sites on a flat BaO(100) surface.
However, the reported values cannot be compared to the results in our study due to the
fact that the methods used in two studies were different. Branda et al. also showed that
the low-coordinated sites were much more active towards NO2 adsorption than the flat
surface sites using the DFT cluster model.64
Although the previous computational studies on NO2/BaO interactions provided us
valuable information and fundamental understanding of NO2 interaction with BaO, the
roles of other factors that can greatly impact the performance of the catalyst, such as
defects and support materials, were not properly accounted for. In a lot of heterogeneous
catalysis processes, the stability and activity of a catalyst can be greatly affected by the
defect and support material. Particularly for the NSR catalysts, the choice of support
materials has been illustrated to strongly influence the sorption property of BaO towards
NOx.55,60,70-75 Furthermore, the support material itself can also provide storage sites at
temperatures below 300°C.76 Therefore, the effect of defect and support cannot be
ignored and need to be studied.
The NO2 adsorption over defected clusters and surfaces was studied to illustrate the
defect effect. To be able to show the change of NO2/BaO interaction caused by the
defect, we have used the results of NO2 adsorption over BaO(100) as references.
Although the (100) surface were studied previously by many groups, we built and
calculated our own model of BaO(100) so that the results can be directly compared with
the rest of the work with consistent method treatment. The (100) surface results are
33
shown in Section 3.3.1. The NO2 adsorption over stoichiometric clusters is reported in the
first part of Section 3.3.2. This part of results show us the size effect of BaO clusters.
Stoichiometric step surface was studied as one type of defective surface and the results
are shown in the second half of Section 3.3.2. Non-stoichiometric clusters and non-
stoichiometric surfaces were both studied as the defects whose effect on NO2/BaO
interaction was not investigated before. The results are shown in Section 3.3.3.
Among many support materials, γ-Al 2O3 has been used as a support material for
NSR catalysts in many studies.49,50,59,77-81 It was shown to provide the highest NOx
storage capacity70, so γ-Al 2O3 surface is the choice of support in my study. The structure
of γ-Al 2O3 is by far still controversial. There are two schools of general models for γ-
Al 2O3 structure—non-spinel and defective spinel. In my worked I used the defective
spinel structure that was proposed by Pinto et al82. More detailed information about this
model will be given in the Methodology section. In addition to the choice of the support
material, a highly dispersed phase of BaO on the support surface is also critical to achieve
high NSR reactivity.71,80,83-85 For example, a flame-made Pt-Ba/Al2O3 catalyst was shown
to contain an active Ba-containing phase where Ba species were in intimate contact with
the support.77 It has also been observed that the decomposition of Ba(NO3)2 crystalline
supported on γ-Al 2O3 leads to nanosized BaO particles during a NSR cycle.80,86 As such,
a study of BaO clusters dispersed over the γ-Al 2O3 surface and their activities towards
NO2 adsorption would help to gain insights into the NSR catalysts. The results are
reported in Section 3.3.4.
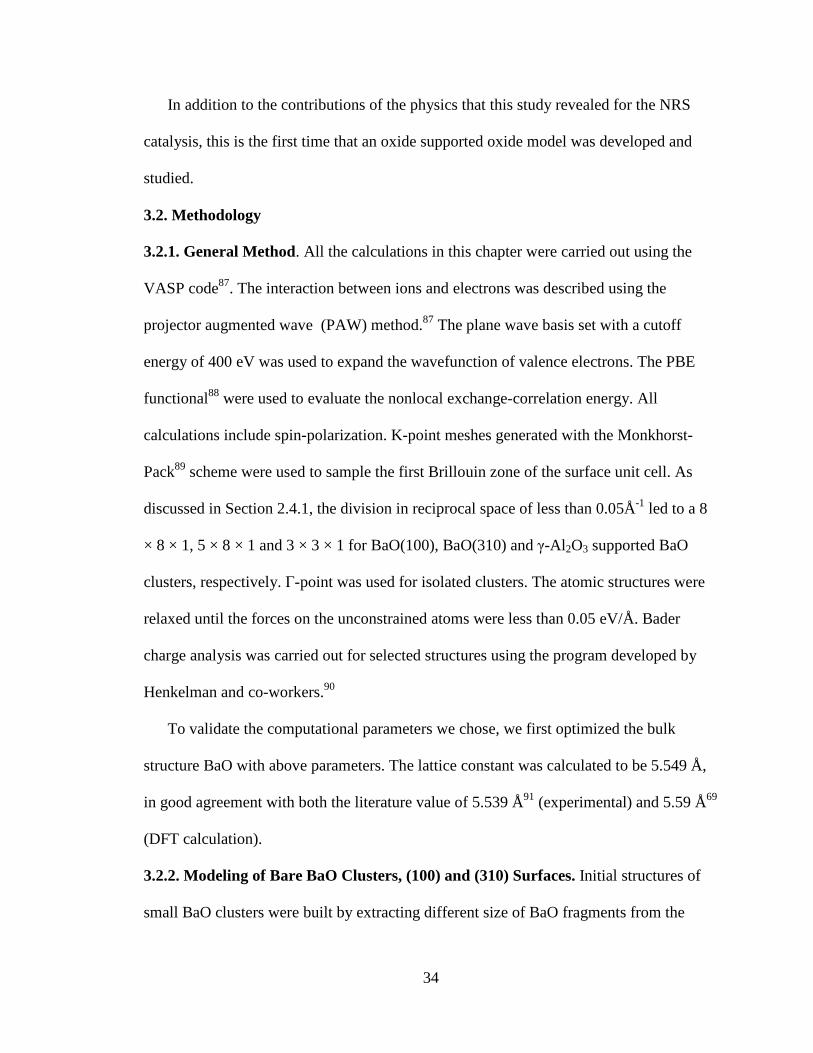
34
In addition to the contributions of the physics that this study revealed for the NRS
catalysis, this is the first time that an oxide supported oxide model was developed and
studied.
3.2. Methodology
3.2.1. General Method. All the calculations in this chapter were carried out using the
VASP code87. The interaction between ions and electrons was described using the
projector augmented wave (PAW) method.87 The plane wave basis set with a cutoff
energy of 400 eV was used to expand the wavefunction of valence electrons. The PBE
functional88 were used to evaluate the nonlocal exchange-correlation energy. All
calculations include spin-polarization. K-point meshes generated with the Monkhorst-
Pack89 scheme were used to sample the first Brillouin zone of the surface unit cell. As
discussed in Section 2.4.1, the division in reciprocal space of less than 0.05Å-1 led to a 8
× 8 × 1, 5 × 8 × 1 and 3 × 3 × 1 for BaO(100), BaO(310) and γ-Al 2O3 supported BaO
clusters, respectively. Γ-point was used for isolated clusters. The atomic structures were
relaxed until the forces on the unconstrained atoms were less than 0.05 eV/Å. Bader
charge analysis was carried out for selected structures using the program developed by
Henkelman and co-workers.90
To validate the computational parameters we chose, we first optimized the bulk
structure BaO with above parameters. The lattice constant was calculated to be 5.549 Å,
in good agreement with both the literature value of 5.539 Å91 (experimental) and 5.59 Å69
(DFT calculation).
3.2.2. Modeling of Bare BaO Clusters, (100) and (310) Surfaces. Initial structures of
small BaO clusters were built by extracting different size of BaO fragments from the
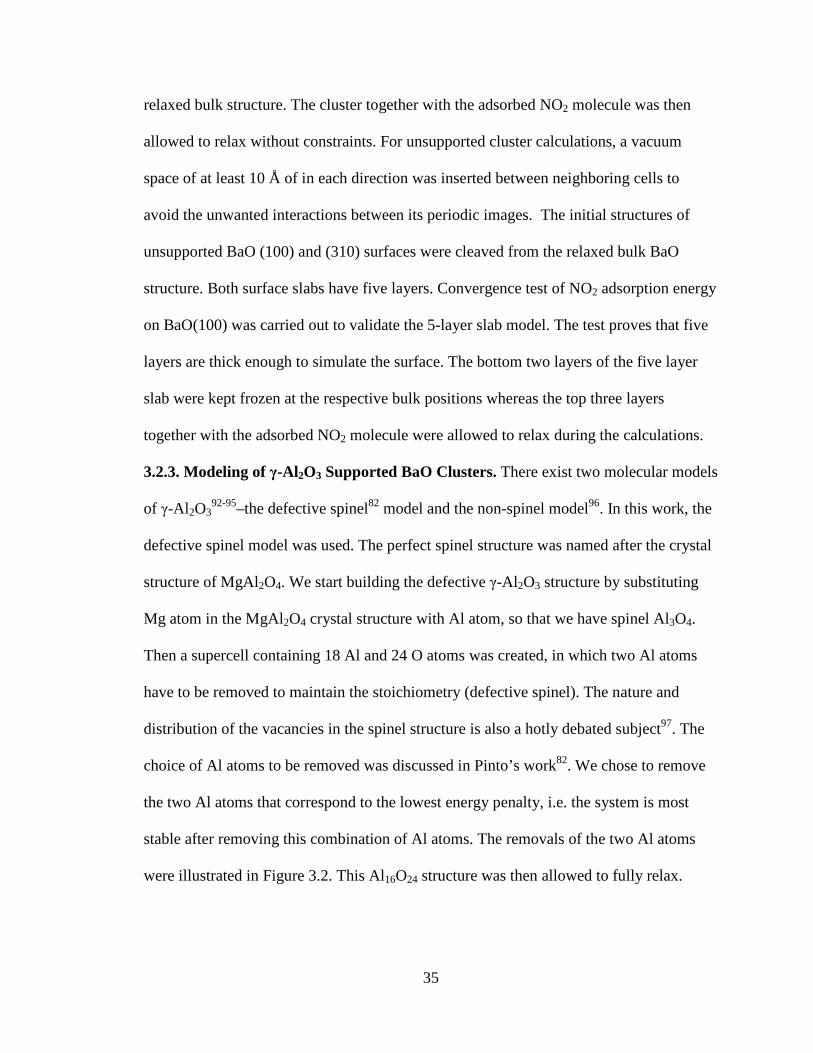
35
relaxed bulk structure. The cluster together with the adsorbed NO2 molecule was then
allowed to relax without constraints. For unsupported cluster calculations, a vacuum
space of at least 10 Å of in each direction was inserted between neighboring cells to
avoid the unwanted interactions between its periodic images. The initial structures of
unsupported BaO (100) and (310) surfaces were cleaved from the relaxed bulk BaO
structure. Both surface slabs have five layers. Convergence test of NO2 adsorption energy
on BaO(100) was carried out to validate the 5-layer slab model. The test proves that five
layers are thick enough to simulate the surface. The bottom two layers of the five layer
slab were kept frozen at the respective bulk positions whereas the top three layers
together with the adsorbed NO2 molecule were allowed to relax during the calculations.
3.2.3. Modeling of γ-Al2O3 Supported BaO Clusters. There exist two molecular models
of γ-Al 2O392-95–the defective spinel82 model and the non-spinel model96. In this work, the
defective spinel model was used. The perfect spinel structure was named after the crystal
structure of MgAl2O4. We start building the defective γ-Al 2O3 structure by substituting
Mg atom in the MgAl2O4 crystal structure with Al atom, so that we have spinel Al3O4.
Then a supercell containing 18 Al and 24 O atoms was created, in which two Al atoms
have to be removed to maintain the stoichiometry (defective spinel). The nature and
distribution of the vacancies in the spinel structure is also a hotly debated subject97. The
choice of Al atoms to be removed was discussed in Pinto’s work82. We chose to remove
the two Al atoms that correspond to the lowest energy penalty, i.e. the system is most
stable after removing this combination of Al atoms. The removals of the two Al atoms
were illustrated in Figure 3.2. This Al16O24 structure was then allowed to fully relax.
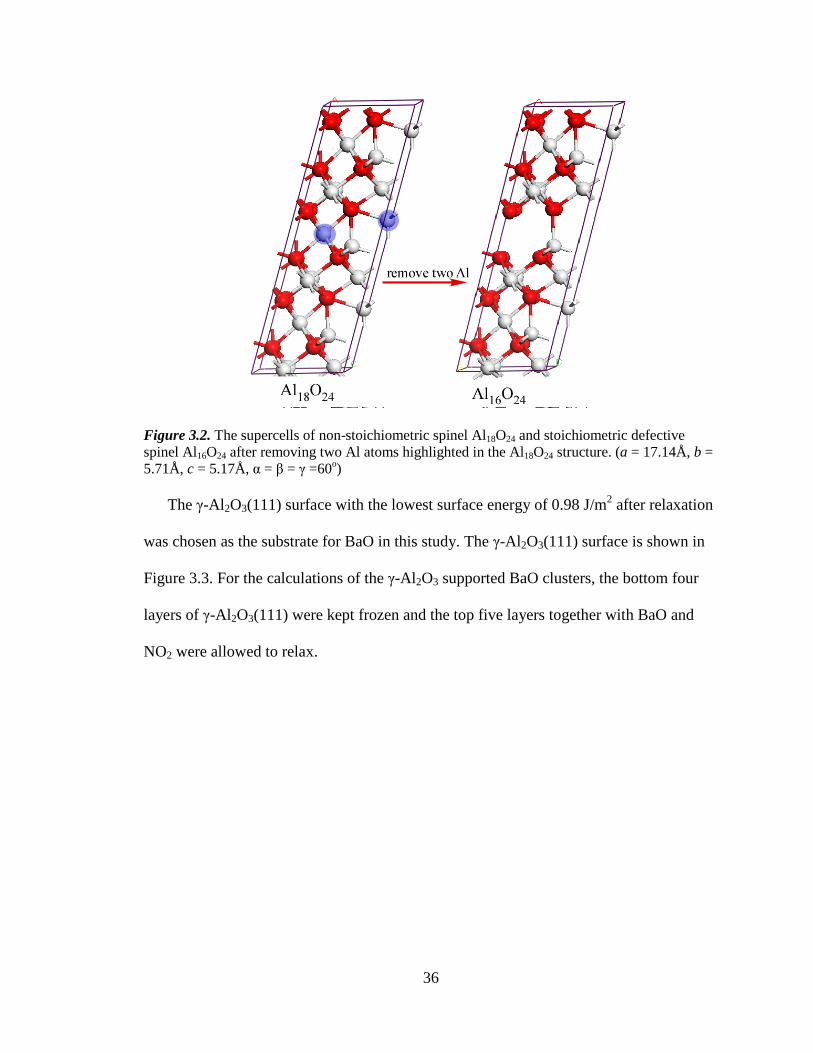
36
Figure 3.2. The supercells of non-stoichiometric spinel Al18O24 and stoichiometric defective spinel Al16O24 after removing two Al atoms highlighted in the Al18O24 structure. (a = 17.14Å, b = 5.71Å, c = 5.17Å, α = β = γ =60o)
The γ-Al 2O3(111) surface with the lowest surface energy of 0.98 J/m2 after relaxation
was chosen as the substrate for BaO in this study. The γ-Al 2O3(111) surface is shown in
Figure 3.3. For the calculations of the γ-Al 2O3 supported BaO clusters, the bottom four
layers of γ-Al 2O3(111) were kept frozen and the top five layers together with BaO and
NO2 were allowed to relax.
37
Figure 3.3. Side view of γ-Al 2O3(111) surface. The Al vacancy sites were labeled.
3.3. Results and Discussion
3.3.1. NO2 Interaction with BaO(100) Surface. We first calculated NO2 adsorption over
the perfect BaO(100) flat surface. This system has been a subject of many theoretical
studies61,63,66-68, and our results only serve as references for comparison with NO2
adsorption on other BaO substrates. Top views of three optimized NO2 adsorption
configurations on various surface sites are shown in Figure 3.4, along with the
corresponding adsorption energies. The adsorption energies were calculated using
�z�� � ����h��� � ����� � �����, (3.1)
where ���� and ���� are the energies of BaO substrate and gas phase NO2 molecule,
respectively. ����h��� is the energy of the structure where NO2 is adsorbed on the BaO
substrate. The most stable NO2 adsorption configuration is shown in Figure 3.4a. In this
structure, the N atom of the NO2 molecule sits on top of a surface O site and the two O
atoms of NO2 point to two surface Ba atoms. The plane of the adsorbed NO2 molecule is
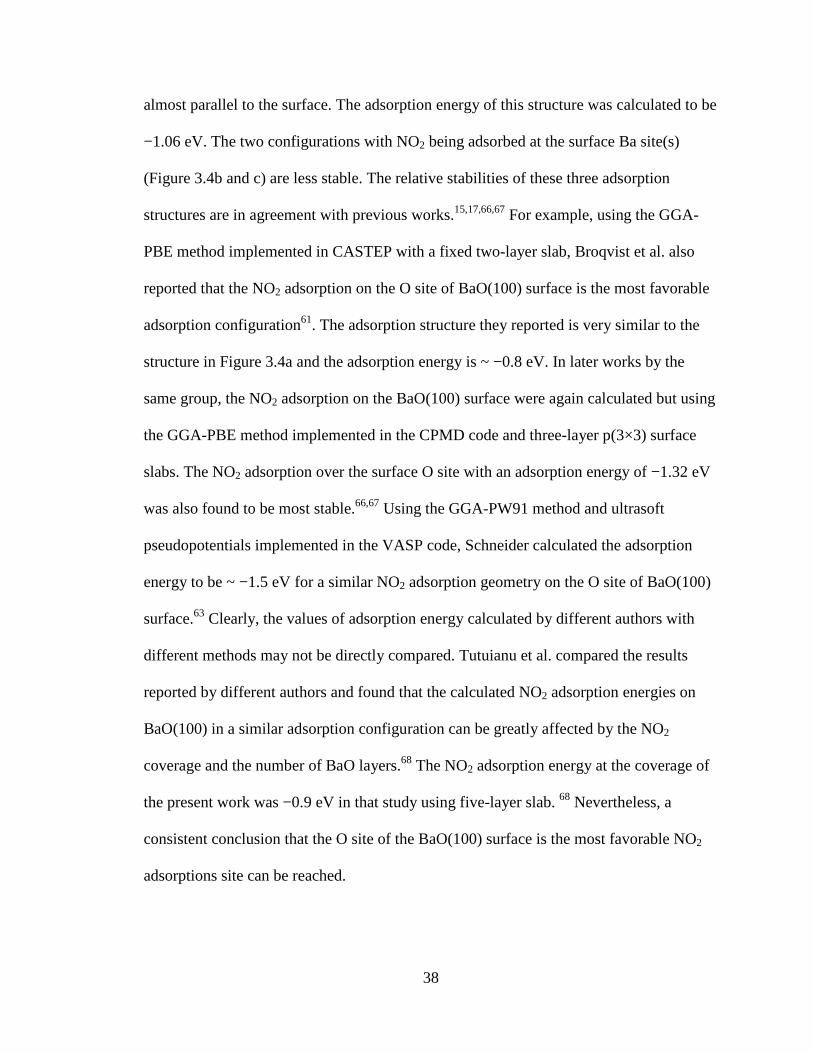
38
almost parallel to the surface. The adsorption energy of this structure was calculated to be
−1.06 eV. The two configurations with NO2 being adsorbed at the surface Ba site(s)
(Figure 3.4b and c) are less stable. The relative stabilities of these three adsorption
structures are in agreement with previous works.15,17,66,67 For example, using the GGA-
PBE method implemented in CASTEP with a fixed two-layer slab, Broqvist et al. also
reported that the NO2 adsorption on the O site of BaO(100) surface is the most favorable
adsorption configuration61. The adsorption structure they reported is very similar to the
structure in Figure 3.4a and the adsorption energy is ~ −0.8 eV. In later works by the
same group, the NO2 adsorption on the BaO(100) surface were again calculated but using
the GGA-PBE method implemented in the CPMD code and three-layer p(3×3) surface
slabs. The NO2 adsorption over the surface O site with an adsorption energy of −1.32 eV
was also found to be most stable.66,67 Using the GGA-PW91 method and ultrasoft
pseudopotentials implemented in the VASP code, Schneider calculated the adsorption
energy to be ~ −1.5 eV for a similar NO2 adsorption geometry on the O site of BaO(100)
surface.63 Clearly, the values of adsorption energy calculated by different authors with
different methods may not be directly compared. Tutuianu et al. compared the results
reported by different authors and found that the calculated NO2 adsorption energies on
BaO(100) in a similar adsorption configuration can be greatly affected by the NO2
coverage and the number of BaO layers.68 The NO2 adsorption energy at the coverage of
the present work was −0.9 eV in that study using five-layer slab. 68 Nevertheless, a
consistent conclusion that the O site of the BaO(100) surface is the most favorable NO2
adsorptions site can be reached.
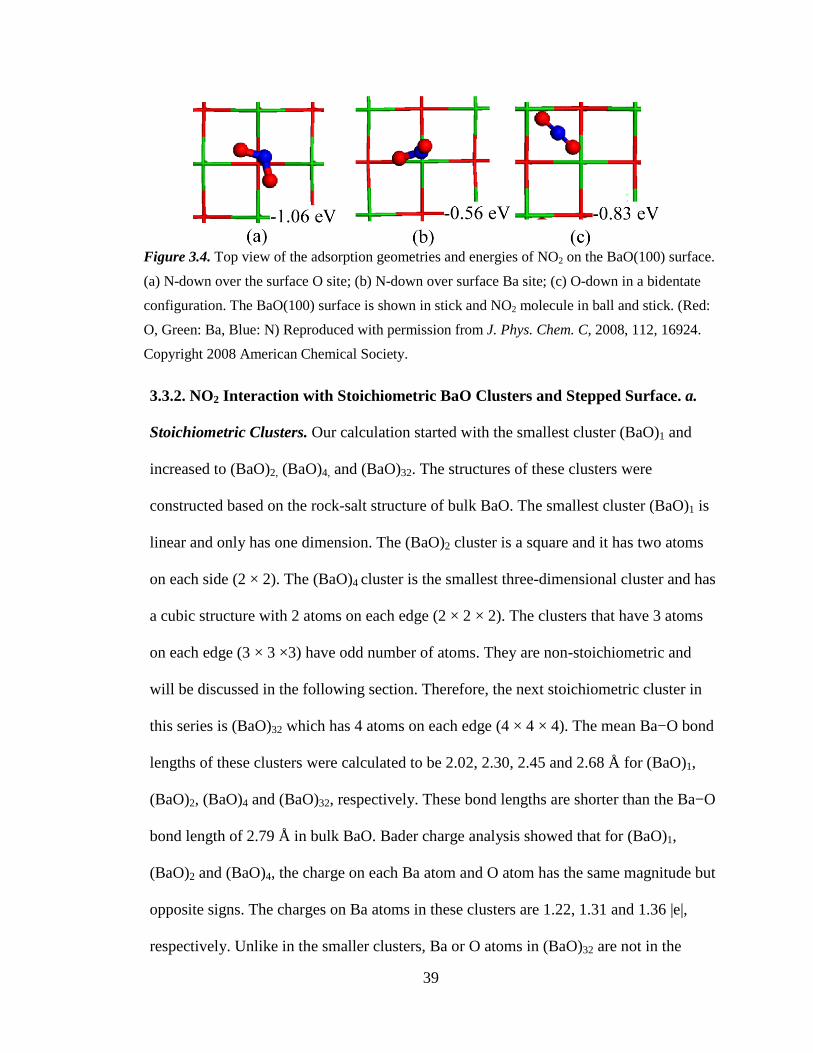
39
Figure 3.4. Top view of the adsorption geometries and energies of NO2 on the BaO(100) surface.
(a) N-down over the surface O site; (b) N-down over surface Ba site; (c) O-down in a bidentate
configuration. The BaO(100) surface is shown in stick and NO2 molecule in ball and stick. (Red:
O, Green: Ba, Blue: N) Reproduced with permission from J. Phys. Chem. C, 2008, 112, 16924.
Copyright 2008 American Chemical Society.
3.3.2. NO2 Interaction with Stoichiometric BaO Clusters and Stepped Surface. a.
Stoichiometric Clusters. Our calculation started with the smallest cluster (BaO)1 and
increased to (BaO)2, (BaO)4, and (BaO)32. The structures of these clusters were
constructed based on the rock-salt structure of bulk BaO. The smallest cluster (BaO)1 is
linear and only has one dimension. The (BaO)2 cluster is a square and it has two atoms
on each side (2 × 2). The (BaO)4 cluster is the smallest three-dimensional cluster and has
a cubic structure with 2 atoms on each edge (2 × 2 × 2). The clusters that have 3 atoms
on each edge (3 × 3 ×3) have odd number of atoms. They are non-stoichiometric and
will be discussed in the following section. Therefore, the next stoichiometric cluster in
this series is (BaO)32 which has 4 atoms on each edge (4 × 4 × 4). The mean Ba−O bond
lengths of these clusters were calculated to be 2.02, 2.30, 2.45 and 2.68 Å for (BaO)1,
(BaO)2, (BaO)4 and (BaO)32, respectively. These bond lengths are shorter than the Ba−O
bond length of 2.79 Å in bulk BaO. Bader charge analysis showed that for (BaO)1,
(BaO)2 and (BaO)4, the charge on each Ba atom and O atom has the same magnitude but
opposite signs. The charges on Ba atoms in these clusters are 1.22, 1.31 and 1.36 |e|,
respectively. Unlike in the smaller clusters, Ba or O atoms in (BaO)32 are not in the
40
equivalent positions. Consequently, the charges on Ba or O atom in (BaO)32 varies
according to the exact location of the atom in the cluster. The interior Ba and O atoms (4
each) have Bader charges of 1.33 and − 1.40 |e|, respectively. These values are close to
the Bader charge of the atoms in bulk BaO (1.36 |e|). The Bader charges of the surface
and edge Ba atoms span in the range of 1.42 ~ 1.45 |e|, whereas those of surface and
edge O atoms range from − 1.40 to − 1.45 |e|. Obviously, the charges on the surface and
edge atoms are bigger than those on the atoms in bulk BaO. In fact, similar charge
redistribution was observed in the BaO(100) surface layers—the surface atoms have
bigger charges than the bulk atoms. The larger charges on the surface Ba/O atoms are
related to the relaxation at the surface.
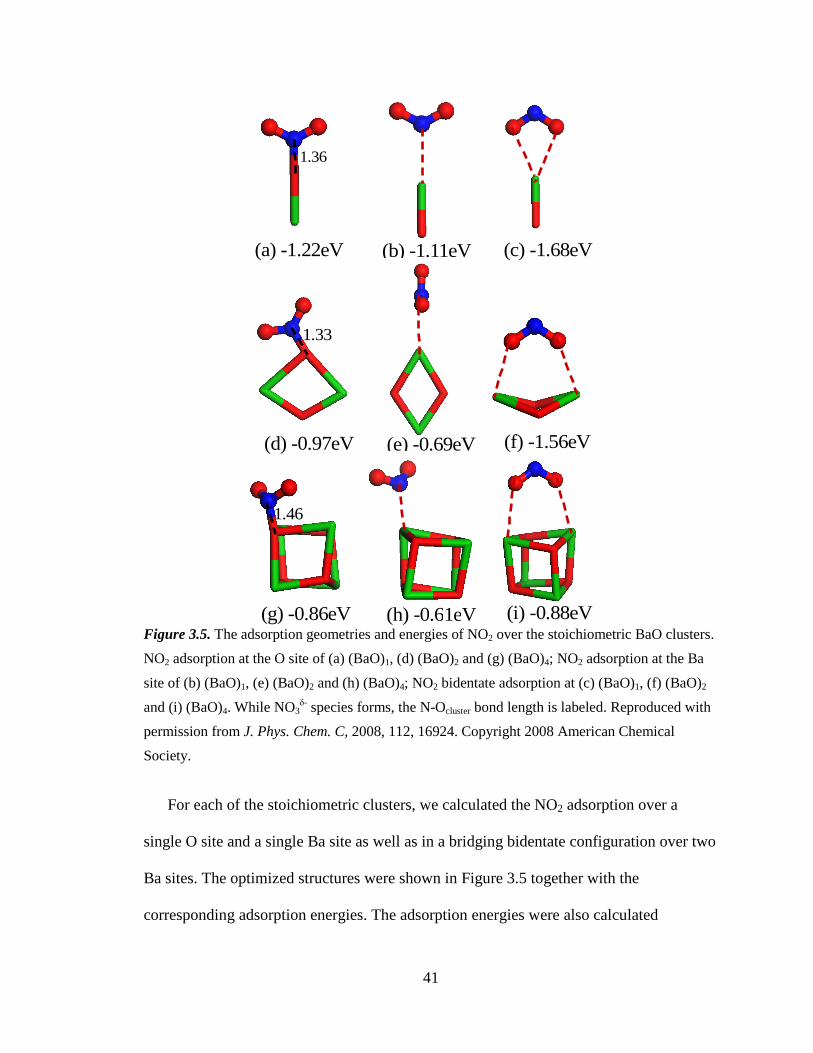
41
1.36
(a) -1.22eV (b) -1.11eV (c) -1.68eV
1.33
(d) -0.97eV (e) -0.69eV (f) -1.56eV
1.46
(g) -0.86eV (h) -0.61eV (i) -0.88eV Figure 3.5. The adsorption geometries and energies of NO2 over the stoichiometric BaO clusters.
NO2 adsorption at the O site of (a) (BaO)1, (d) (BaO)2 and (g) (BaO)4; NO2 adsorption at the Ba
site of (b) (BaO)1, (e) (BaO)2 and (h) (BaO)4; NO2 bidentate adsorption at (c) (BaO)1, (f) (BaO)2
and (i) (BaO)4. While NO3δ- species forms, the N-Ocluster bond length is labeled. Reproduced with
permission from J. Phys. Chem. C, 2008, 112, 16924. Copyright 2008 American Chemical
Society.
For each of the stoichiometric clusters, we calculated the NO2 adsorption over a
single O site and a single Ba site as well as in a bridging bidentate configuration over two
Ba sites. The optimized structures were shown in Figure 3.5 together with the
corresponding adsorption energies. The adsorption energies were also calculated
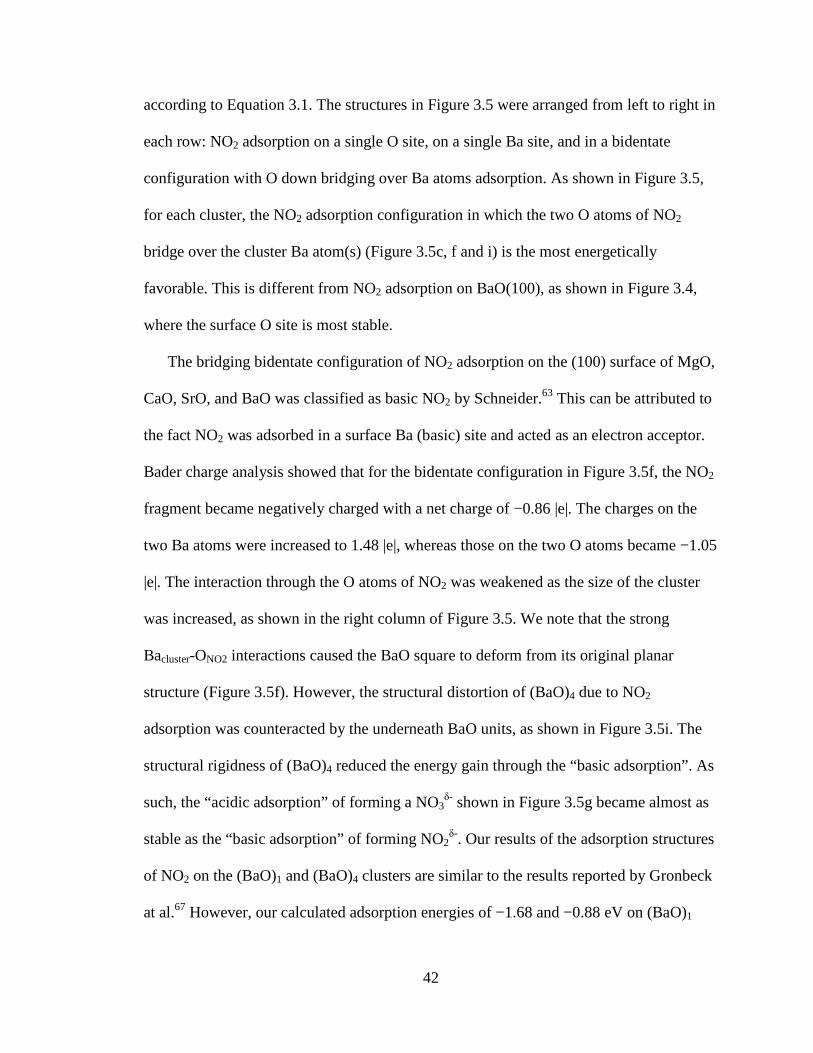
42
according to Equation 3.1. The structures in Figure 3.5 were arranged from left to right in
each row: NO2 adsorption on a single O site, on a single Ba site, and in a bidentate
configuration with O down bridging over Ba atoms adsorption. As shown in Figure 3.5,
for each cluster, the NO2 adsorption configuration in which the two O atoms of NO2
bridge over the cluster Ba atom(s) (Figure 3.5c, f and i) is the most energetically
favorable. This is different from NO2 adsorption on BaO(100), as shown in Figure 3.4,
where the surface O site is most stable.
The bridging bidentate configuration of NO2 adsorption on the (100) surface of MgO,
CaO, SrO, and BaO was classified as basic NO2 by Schneider.63 This can be attributed to
the fact NO2 was adsorbed in a surface Ba (basic) site and acted as an electron acceptor.
Bader charge analysis showed that for the bidentate configuration in Figure 3.5f, the NO2
fragment became negatively charged with a net charge of −0.86 |e|. The charges on the
two Ba atoms were increased to 1.48 |e|, whereas those on the two O atoms became −1.05
|e|. The interaction through the O atoms of NO2 was weakened as the size of the cluster
was increased, as shown in the right column of Figure 3.5. We note that the strong
Bacluster-ONO2 interactions caused the BaO square to deform from its original planar
structure (Figure 3.5f). However, the structural distortion of (BaO)4 due to NO2
adsorption was counteracted by the underneath BaO units, as shown in Figure 3.5i. The
structural rigidness of (BaO)4 reduced the energy gain through the “basic adsorption”. As
such, the “acidic adsorption” of forming a NO3δ- shown in Figure 3.5g became almost as
stable as the “basic adsorption” of forming NO2δ-. Our results of the adsorption structures
of NO2 on the (BaO)1 and (BaO)4 clusters are similar to the results reported by Gronbeck
at al.67 However, our calculated adsorption energies of −1.68 and −0.88 eV on (BaO)1
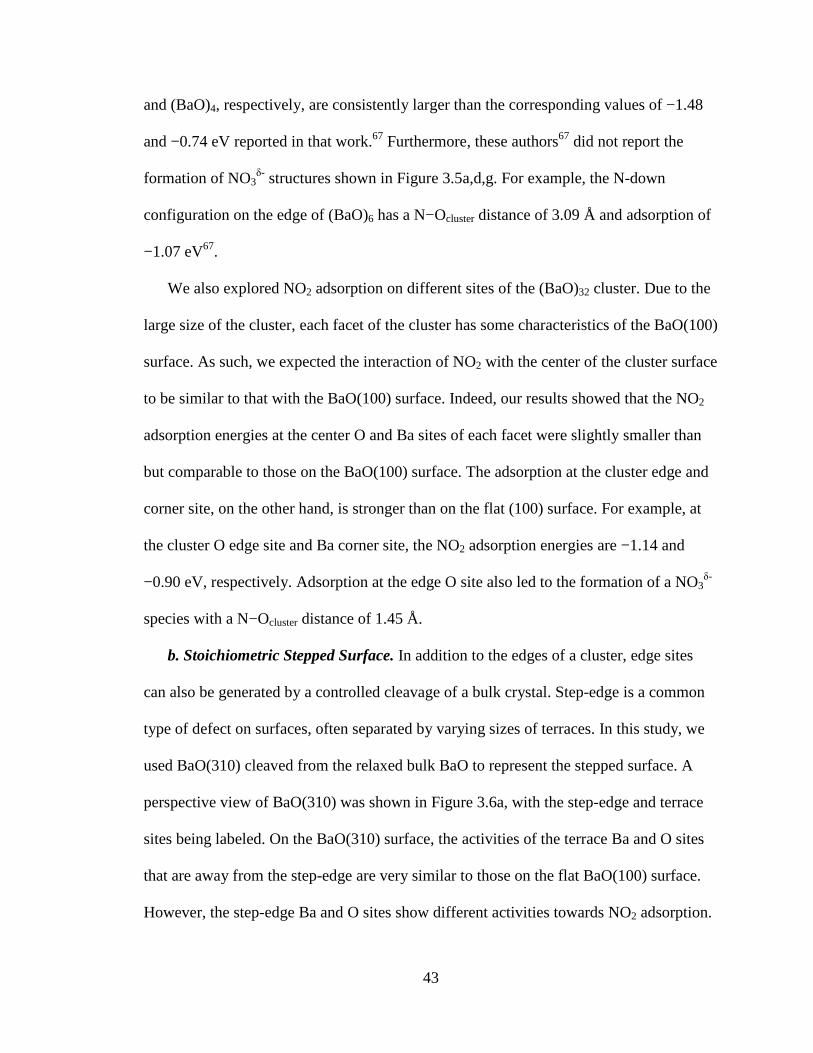
43
and (BaO)4, respectively, are consistently larger than the corresponding values of −1.48
and −0.74 eV reported in that work.67 Furthermore, these authors67 did not report the
formation of NO3δ- structures shown in Figure 3.5a,d,g. For example, the N-down
configuration on the edge of (BaO)6 has a N−Ocluster distance of 3.09 Å and adsorption of
−1.07 eV67.
We also explored NO2 adsorption on different sites of the (BaO)32 cluster. Due to the
large size of the cluster, each facet of the cluster has some characteristics of the BaO(100)
surface. As such, we expected the interaction of NO2 with the center of the cluster surface
to be similar to that with the BaO(100) surface. Indeed, our results showed that the NO2
adsorption energies at the center O and Ba sites of each facet were slightly smaller than
but comparable to those on the BaO(100) surface. The adsorption at the cluster edge and
corner site, on the other hand, is stronger than on the flat (100) surface. For example, at
the cluster O edge site and Ba corner site, the NO2 adsorption energies are −1.14 and
−0.90 eV, respectively. Adsorption at the edge O site also led to the formation of a NO3δ-
species with a N−Ocluster distance of 1.45 Å.
b. Stoichiometric Stepped Surface. In addition to the edges of a cluster, edge sites
can also be generated by a controlled cleavage of a bulk crystal. Step-edge is a common
type of defect on surfaces, often separated by varying sizes of terraces. In this study, we
used BaO(310) cleaved from the relaxed bulk BaO to represent the stepped surface. A
perspective view of BaO(310) was shown in Figure 3.6a, with the step-edge and terrace
sites being labeled. On the BaO(310) surface, the activities of the terrace Ba and O sites
that are away from the step-edge are very similar to those on the flat BaO(100) surface.
However, the step-edge Ba and O sites show different activities towards NO2 adsorption.
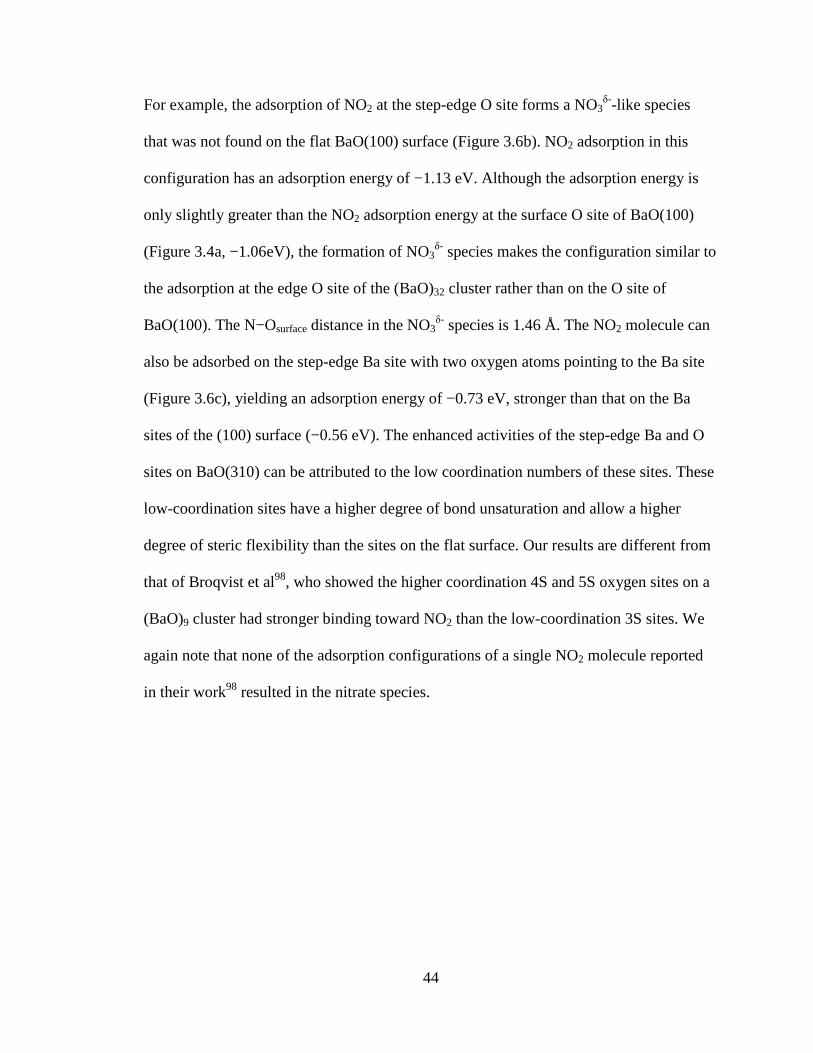
44
For example, the adsorption of NO2 at the step-edge O site forms a NO3δ--like species
that was not found on the flat BaO(100) surface (Figure 3.6b). NO2 adsorption in this
configuration has an adsorption energy of −1.13 eV. Although the adsorption energy is
only slightly greater than the NO2 adsorption energy at the surface O site of BaO(100)
(Figure 3.4a, −1.06eV), the formation of NO3δ- species makes the configuration similar to
the adsorption at the edge O site of the (BaO)32 cluster rather than on the O site of
BaO(100). The N−Osurface distance in the NO3δ- species is 1.46 Å. The NO2 molecule can
also be adsorbed on the step-edge Ba site with two oxygen atoms pointing to the Ba site
(Figure 3.6c), yielding an adsorption energy of −0.73 eV, stronger than that on the Ba
sites of the (100) surface (−0.56 eV). The enhanced activities of the step-edge Ba and O
sites on BaO(310) can be attributed to the low coordination numbers of these sites. These
low-coordination sites have a higher degree of bond unsaturation and allow a higher
degree of steric flexibility than the sites on the flat surface. Our results are different from
that of Broqvist et al98, who showed the higher coordination 4S and 5S oxygen sites on a
(BaO)9 cluster had stronger binding toward NO2 than the low-coordination 3S sites. We
again note that none of the adsorption configurations of a single NO2 molecule reported
in their work98 resulted in the nitrate species.
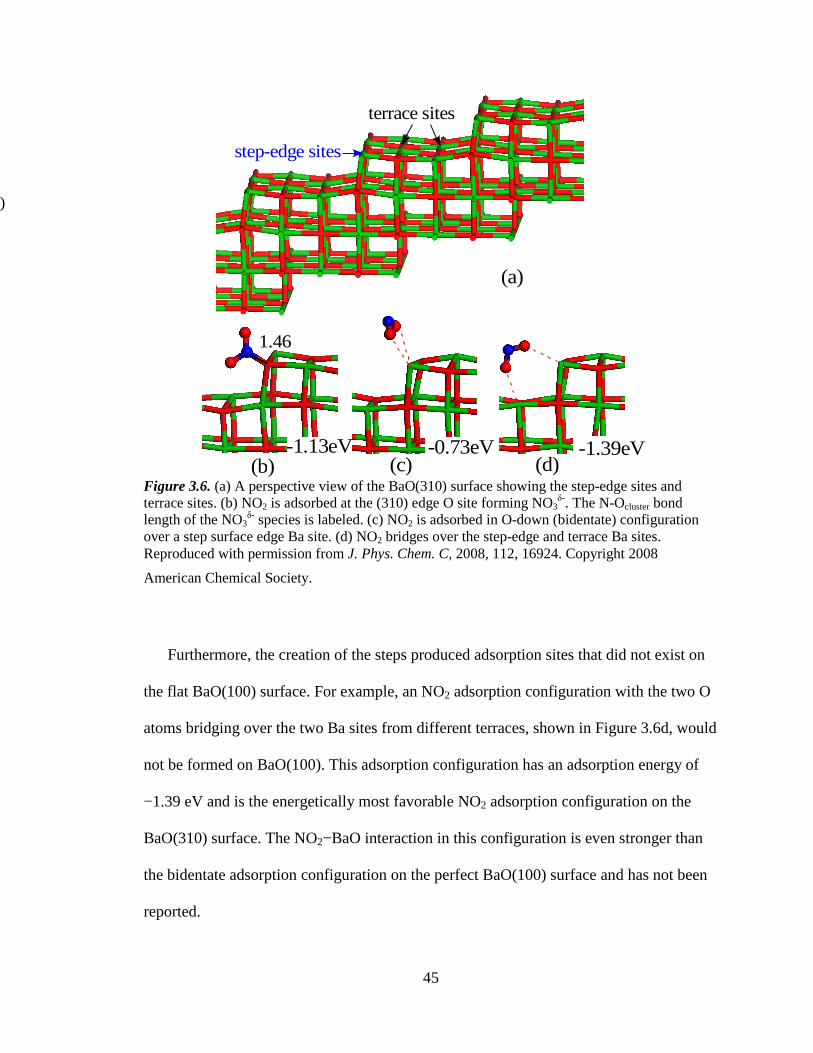
45
(d)(c)(b)
(a)
1.46
step-edge sites
terrace sites
-1.13eV -0.73eV -1.39eV
Figure 3.6. (a) A perspective view of the BaO(310) surface showing the step-edge sites and terrace sites. (b) NO2 is adsorbed at the (310) edge O site forming NO3
δ-. The N-Ocluster bond length of the NO3
δ- species is labeled. (c) NO2 is adsorbed in O-down (bidentate) configuration over a step surface edge Ba site. (d) NO2 bridges over the step-edge and terrace Ba sites. Reproduced with permission from J. Phys. Chem. C, 2008, 112, 16924. Copyright 2008
American Chemical Society.
Furthermore, the creation of the steps produced adsorption sites that did not exist on
the flat BaO(100) surface. For example, an NO2 adsorption configuration with the two O
atoms bridging over the two Ba sites from different terraces, shown in Figure 3.6d, would
not be formed on BaO(100). This adsorption configuration has an adsorption energy of
−1.39 eV and is the energetically most favorable NO2 adsorption configuration on the
BaO(310) surface. The NO2−BaO interaction in this configuration is even stronger than
the bidentate adsorption configuration on the perfect BaO(100) surface and has not been
reported.
(a)

46
Branda et al. also studied the effect of the steps on BaO-NO2 interaction by using an
embedded cluster model to simulate the stepped BaO surfaces.64 They concluded that the
adsorption energies of NO2 at the surface step sites were enhanced by ~ 100% and 35%
from those on the BaO(100) surface for N-down and O-down configurations,
respectively. Our results showed enhancements of step-edge sites towards NO2
adsorption but much less dramatic. Our calculated adsorption energies for N-down
configuration was increased by 0.07 eV (~6%). The adsorption energy in the new NO2
adsorption configuration formed across the step of BaO(310) (Figure 3.6d) was increased
by −0.56 eV over the O-down configuration on BaO(100). We would like to stress that
this new configuration cannot be formed on BaO(100).
3.3.3. NO2 Interaction with Non-stoichiometric BaO Surfaces and Clusters. a. Non-
stoichiometric Clusters. The study of stoichiometric clusters in previous section provided
a measure of the geometry of the substrate on its interaction with NO2. The study of the
non-stoichiometric clusters shown next will illustrate how the electronic characters of the
substrate affect the adsorption of NO2. The initial structures of the two non-
stoichiometric cubic clusters, Ba13O14 and Ba14O13, were also constructed on the basis of
the bulk structure. Apparently, Ba14O13 cluster has an extra Ba atom whereas the Ba13O14
has an extra O atom with respect to the 1:1 stoichiometric ratio. Bader charge analysis
was performed for both clusters. The averaged charges of Ba and O atoms are +1.44 |e|
and −1.34 |e| in Ba13O14 and +1.34 |e|, −1.44 |e| in Ba14O13, respectively. There are two
types of Ba atoms and two types of O atoms in each cluster, depending on position of
each atom. In Ba13O14, twelve Ba atoms are located at the center of each edge of the cube
(edge-center) and one is in the center of the cube (cube-center) (Figure 3.7a). The charge
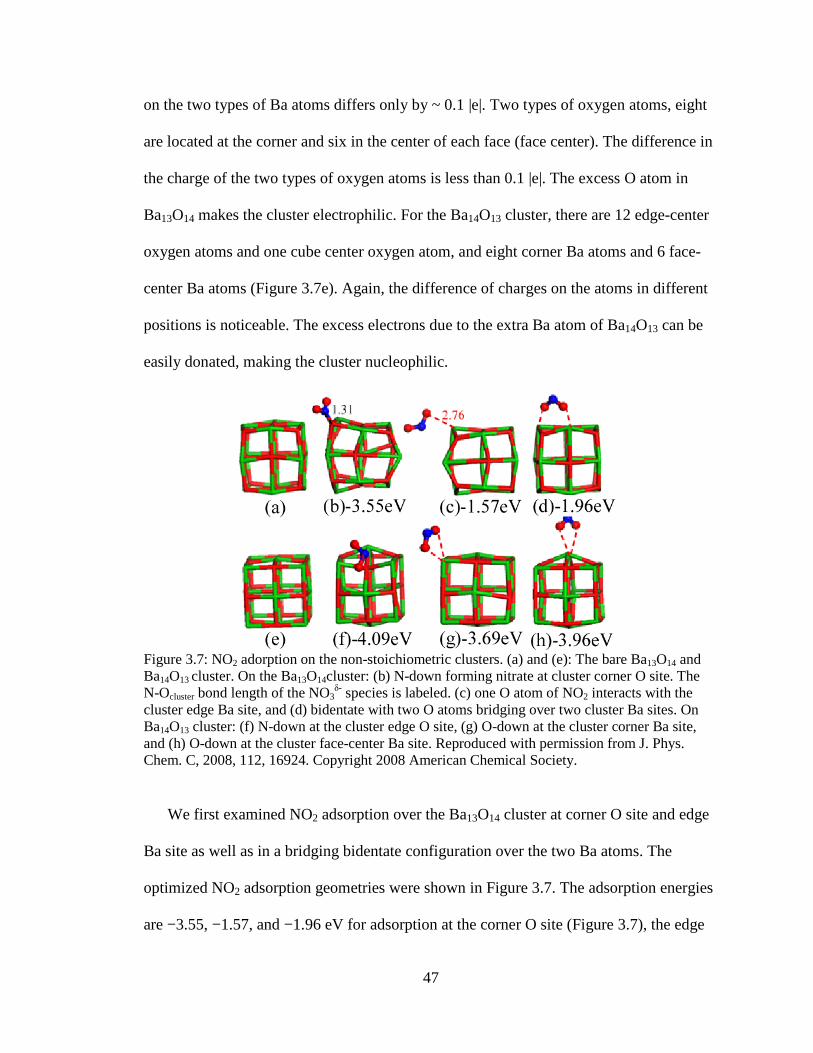
47
on the two types of Ba atoms differs only by ~ 0.1 |e|. Two types of oxygen atoms, eight
are located at the corner and six in the center of each face (face center). The difference in
the charge of the two types of oxygen atoms is less than 0.1 |e|. The excess O atom in
Ba13O14 makes the cluster electrophilic. For the Ba14O13 cluster, there are 12 edge-center
oxygen atoms and one cube center oxygen atom, and eight corner Ba atoms and 6 face-
center Ba atoms (Figure 3.7e). Again, the difference of charges on the atoms in different
positions is noticeable. The excess electrons due to the extra Ba atom of Ba14O13 can be
easily donated, making the cluster nucleophilic.
Figure 3.7: NO2 adorption on the non-stoichiometric clusters. (a) and (e): The bare Ba13O14 and Ba14O13 cluster. On the Ba13O14cluster: (b) N-down forming nitrate at cluster corner O site. The N-Ocluster bond length of the NO3
δ- species is labeled. (c) one O atom of NO2 interacts with the cluster edge Ba site, and (d) bidentate with two O atoms bridging over two cluster Ba sites. On Ba14O13 cluster: (f) N-down at the cluster edge O site, (g) O-down at the cluster corner Ba site, and (h) O-down at the cluster face-center Ba site. Reproduced with permission from J. Phys. Chem. C, 2008, 112, 16924. Copyright 2008 American Chemical Society.
We first examined NO2 adsorption over the Ba13O14 cluster at corner O site and edge
Ba site as well as in a bridging bidentate configuration over the two Ba atoms. The
optimized NO2 adsorption geometries were shown in Figure 3.7. The adsorption energies
are −3.55, −1.57, and −1.96 eV for adsorption at the corner O site (Figure 3.7), the edge
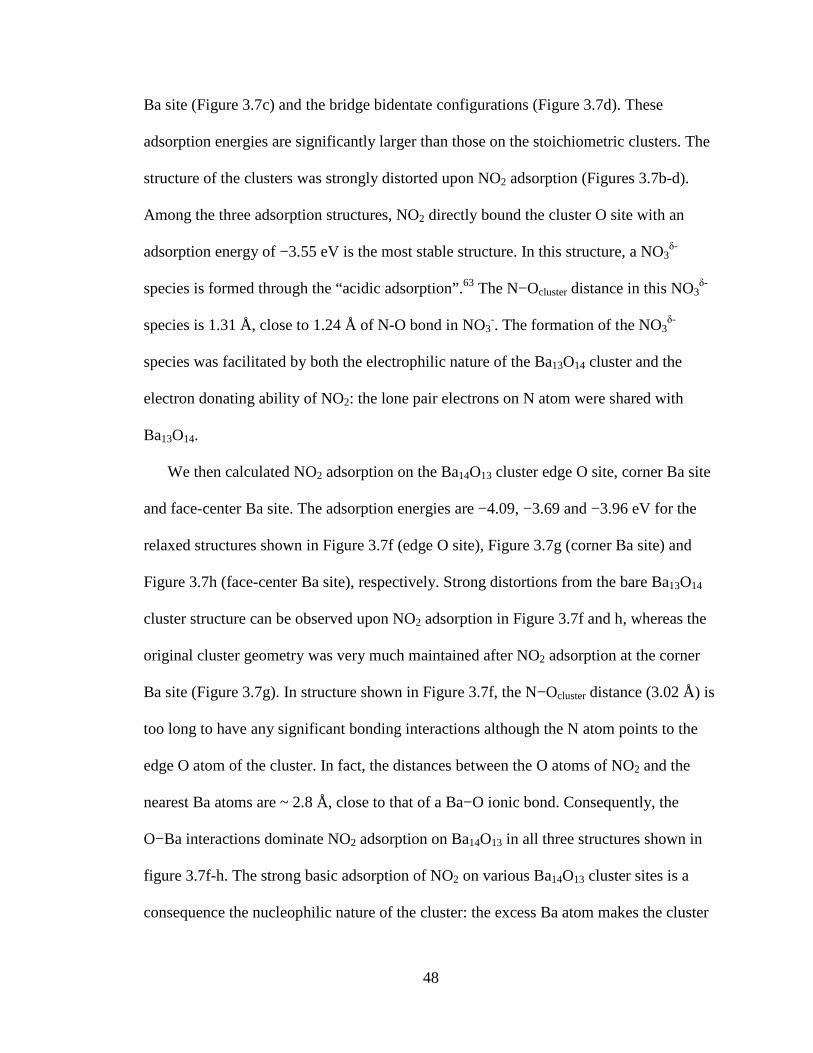
48
Ba site (Figure 3.7c) and the bridge bidentate configurations (Figure 3.7d). These
adsorption energies are significantly larger than those on the stoichiometric clusters. The
structure of the clusters was strongly distorted upon NO2 adsorption (Figures 3.7b-d).
Among the three adsorption structures, NO2 directly bound the cluster O site with an
adsorption energy of −3.55 eV is the most stable structure. In this structure, a NO3δ-
species is formed through the “acidic adsorption”.63 The N−Ocluster distance in this NO3δ-
species is 1.31 Å, close to 1.24 Å of N-O bond in NO3-. The formation of the NO3
δ-
species was facilitated by both the electrophilic nature of the Ba13O14 cluster and the
electron donating ability of NO2: the lone pair electrons on N atom were shared with
Ba13O14.
We then calculated NO2 adsorption on the Ba14O13 cluster edge O site, corner Ba site
and face-center Ba site. The adsorption energies are −4.09, −3.69 and −3.96 eV for the
relaxed structures shown in Figure 3.7f (edge O site), Figure 3.7g (corner Ba site) and
Figure 3.7h (face-center Ba site), respectively. Strong distortions from the bare Ba13O14
cluster structure can be observed upon NO2 adsorption in Figure 3.7f and h, whereas the
original cluster geometry was very much maintained after NO2 adsorption at the corner
Ba site (Figure 3.7g). In structure shown in Figure 3.7f, the N−Ocluster distance (3.02 Å) is
too long to have any significant bonding interactions although the N atom points to the
edge O atom of the cluster. In fact, the distances between the O atoms of NO2 and the
nearest Ba atoms are ~ 2.8 Å, close to that of a Ba−O ionic bond. Consequently, the
O−Ba interactions dominate NO2 adsorption on Ba14O13 in all three structures shown in
figure 3.7f-h. The strong basic adsorption of NO2 on various Ba14O13 cluster sites is a
consequence the nucleophilic nature of the cluster: the excess Ba atom makes the cluster
49
electron-rich. As a Lewis base, the nucleophilic Ba14O13 cluster can interact with NO2
strongly by donate its electrons to the molecule. As such, the “acidic adsorption” where
NO2 shares its lone pair electrons with the substrate and forming NO3δ- does not occur on
the Ba14O13 cluster.
b. Non-stoichiometric Surfaces. Surface vacancy is another type of defects that may
have great effects on the catalytic activity of metal oxides.14,64 The existence of vacancies
creates charged centers on the surface which may affect the relative stability between the
reactant and product states as well as the transition state. Herein, we studied the effect of
both Ba and O vacancies in the BaO(100) surface on NO2 adsorption. We used the same
surface unit cell as in our calculations for NO2 adsorption on the perfect BaO(100)
surface to eliminate the coverage effect for comparison. Although the vacancy density
simulated by such a unit cell may be too high to quantitatively compare with the surface
under operating conditions, we expect the model will provide some insights into the
effect of these defects on NO2 adsorption.
Figure 3.8: Top view of NO2 adsorption on defective BaO(100). (a) BaO(100) with oxygen vacancies. (b) NO2 adsorption at the surface O site. (c) NO2 adsorption at the surface Ba site. (d) BaO(100) with barium vacancies. (e) NO2 adsorption at the surface O site forming nitrate. The N-
50
Ocluster bond length of the NO3δ- species is labeled. (f) NO2 adsorption at the surface Ba site. The
surface is shown in stick and the adsorbed NO2 molecule is shown in ball and stick. Yellow and cyan diamonds represent the surface O and Ba vacancies, respectively. Reproduced with permission from J. Phys. Chem. C, 2008, 112, 16924. Copyright 2008 American Chemical Society.
The O vacancy on BaO(100) was created by eliminating a neutral O atom from the
surface layer of the slab, as shown by the yellow diamond in Figure 3.8a. By creating a
neutral O vacancy on the surface, the slab simulating the BaO surface became non-
stoichiometric with an extra Ba atom. Similar to Ba14O13, this extra Ba atom made the
electron transfer from the defective BaO surface to adsorbed NO2 favorable, resulting in a
strong adsorption of NO2 on both surface O site and Ba site. The optimized adsorption
structures on the O site and the Ba site were shown in Figure 3.8b and c with the
corresponding adsorption energies of −2.96 and −2.83 eV, respectively. In the adsorption
configuration of NO2 over the surface O site (Figure 3.8b), the NO2 molecular plane was
parallel to the surface with each O atom pointing to the corresponding surface Ba site.
The structure of NO2 adsorption on top of Ba site is very similar to that of perfect (100)
surface (Figure 3.4b) except for that one of the O atoms in the NO2 molecule now points
to the surface O vacancy site where the surface oxygen used to reside. Bader charge
analysis show that NO2 adsorbed at the Ba site of the defective surface gains 0.85 |e| from
the surface, significantly larger than the charge gained in similar adsorption geometry on
the perfect (100) surface. Similar to the Ba14O13 cluster, such nucleophilic substrate can
readily donate its electronic charge to the adsorbate. Therefore, the charge transfer from
the surface with O vacancies to NO2 molecule is significantly larger than that from the
perfect (100) surface. For the same reason, the “acidic adsorption” configuration where
NO2 shares its lone pair with the surface O site, forming a nitrate-like species, was not
found on the defective surface with oxygen vacancies.
51
In contrast, creating a surface Ba vacancy (shown in Figure 3.8d in cyan diamond)
makes the slab have an extra oxygen atom in the unit cell. Consequently, the slab holds
onto its electrons tight, making the slab electrophilic. As such, the “acidic adsorption”
that NO2 shares its lone pair electrons became favorable. The structure of NO2 adsorbed
over the surface O site forming a nitrate-like species (Figure 3.8e) has an adsorption
energy of −3.08 eV. On the other hand, the “basic adsorption” on the surface Ba site
(Figure 3.8f) yielded an adsorption energy of only −0.22 eV.
In summary, the non-stoichiometric clusters have multiple sites that are much more
active towards NO2 adsorption than the stoichiometric clusters. Many surface sites on the
defective BaO surfaces also became highly active towards NO2 adsorption. The NO2
molecule is amphiphilic and can act as either Lewis acid or base by interacting with the
surface through different parts of the molecule. When the barium oxide is electron-rich,
the excess electrons can be readily donated to the NO2 molecule through the “basic”
adsorption mode, i.e. the O atoms of the NO2 molecule approaching the surface sites. On
the other hand, if the defects make BaO electron-deficient, NO2 favors the “acidic”
adsorption mode by forming a nitrate-like species. In the latter case, N atom of the
molecule approaches a surface O site and shares its lone pair electrons with the surface O
atom. On both non-stoichiometric clusters and non-stoichiometric slabs, the “basic”
adsorption of NO2 occurs for both electron-rich and electron-deficient substrates although
the NO2-substrate interaction for the electron-rich substrate is much stronger. In contrast,
only “acidic” adsorption occurs at the O site of an electron-deficient adsorbate.
52
3.3.4. NO2 Interaction with γ-Al2O3 Supported BaO Clusters. a. γ-Al2O3 Supported
BaO Clusters. To study the support effect on NO2-BaO interaction, we used a c(2×1) unit
cell of the γ-Al 2O3(111) supported (BaO)1, (BaO)2 and (BaO)4 clusters as the
computational model. The c(2×1) unit cell of γ-Al 2O3 surface slab is consist of 32 Al and
48 O atoms.
The initial structures of the supported cluster models were built based on the
structurally optimized γ-Al 2O3(111) surface and BaO clusters. For example, to build γ-
Al 2O3 supported (BaO)2 structure, in a molecular modeling visualization software, the
optimized (BaO)2 square was placed on top of the optimized γ-Al 2O3 surface slab. The
BaO square can be placed with its plane either normal or parallel to the γ-Al 2O3(111) as
shown in Figure 3.9. By comparing the energies of these two structures, it was found the
“paralleled” BaO square is more stable, so the “parallel” model was selected for further
study of NO2 adsorption.
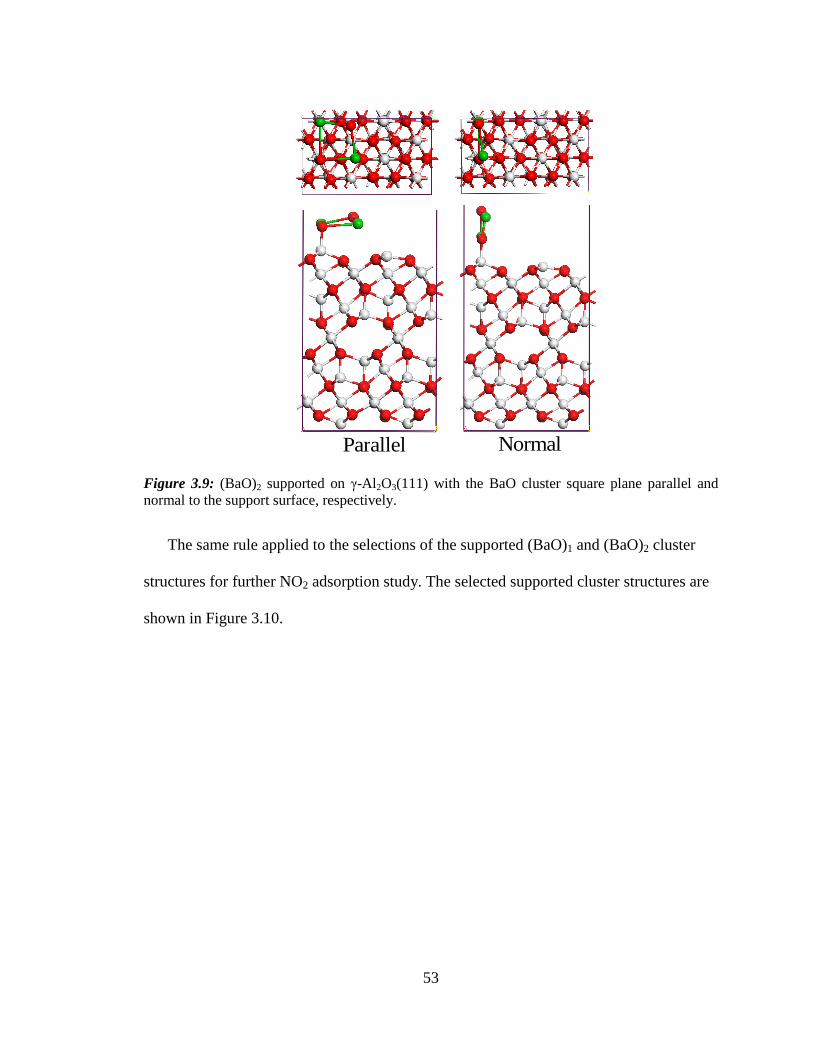
53
Parallel Normal
Figure 3.9: (BaO)2 supported on γ-Al 2O3(111) with the BaO cluster square plane parallel and normal to the support surface, respectively.
The same rule applied to the selections of the supported (BaO)1 and (BaO)2 cluster
structures for further NO2 adsorption study. The selected supported cluster structures are
shown in Figure 3.10.
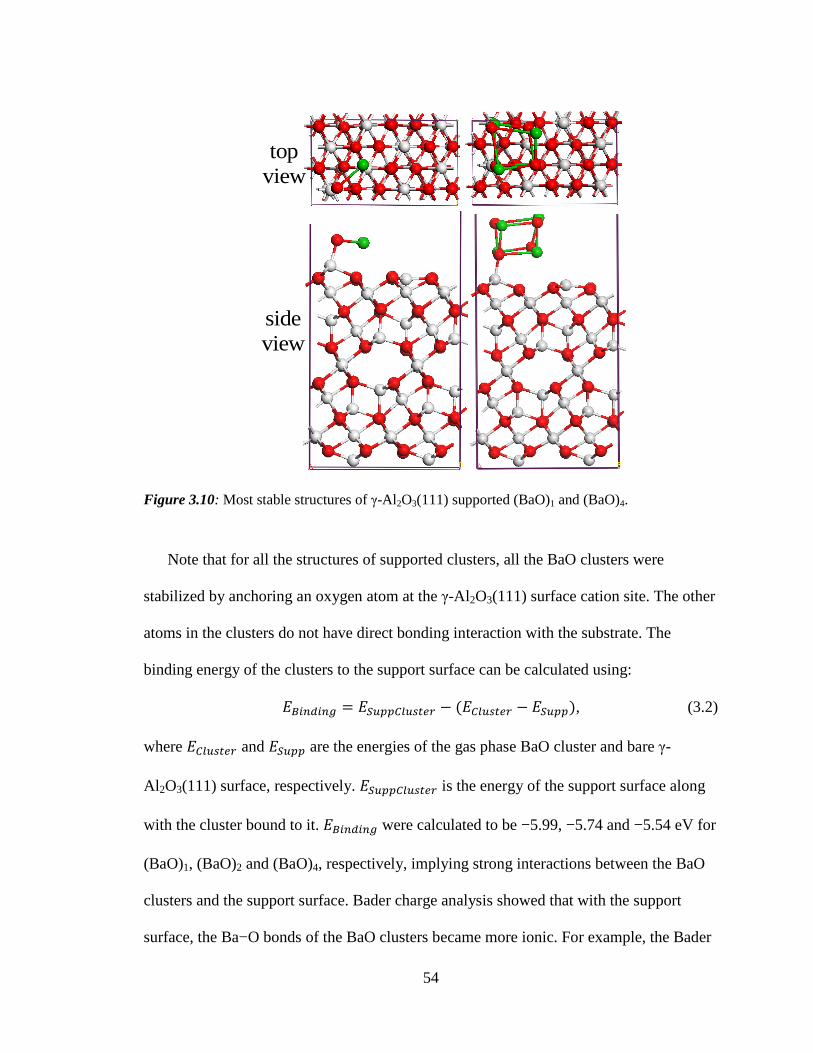
54
topview
sideview
Figure 3.10: Most stable structures of γ-Al 2O3(111) supported (BaO)1 and (BaO)4.
Note that for all the structures of supported clusters, all the BaO clusters were
stabilized by anchoring an oxygen atom at the γ-Al 2O3(111) surface cation site. The other
atoms in the clusters do not have direct bonding interaction with the substrate. The
binding energy of the clusters to the support surface can be calculated using:
��GI�GI� � ��������� PZ � ������ PZ � ������, (3.2)
where ����� PZ and ����� are the energies of the gas phase BaO cluster and bare γ-
Al 2O3(111) surface, respectively. ��������� PZ is the energy of the support surface along
with the cluster bound to it. ��GI�GI� were calculated to be −5.99, −5.74 and −5.54 eV for
(BaO)1, (BaO)2 and (BaO)4, respectively, implying strong interactions between the BaO
clusters and the support surface. Bader charge analysis showed that with the support
surface, the Ba−O bonds of the BaO clusters became more ionic. For example, the Bader

55
charges of two oxygen atoms in the supported (BaO)2 are −1.72 (anchoring) and −1.40
|e|, respective, larger than −1.31 |e| of the oxygen in the bare/unsupported (BaO)2 cluster.
b. NO2 Adsorption on γ-Al2O3 Supported BaO Clusters. For the supported (BaO)1
cluster, there are two sites available on the BaO for NO2 adsorption—the O site which is
also anchoring the cluster to the support surface and the Ba site. The adsorption energies
can be calculated using Equation 3.1 with the relaxed structure of γ-Al 2O3-supported
(BaO)1 as the substrate. The NO2 can be adsorbed on the (BaO)1 anchoring O site
forming a NO3δ- species (Figure 3.11a) with an adsorption energy of −0.85 eV. NO2
adsorption at the Ba site corresponds to an adsorption energy of −0.42 eV, less stable
than on the anchoring O site. This implies that although the O site is already binded to Al
and Ba atoms, it is still more active towards NO2 adsorption than the Ba site. This is in
contrast to the NO2 interaction with unsupported BaO monomer where Ba site was
favored.
(BaO)1 (BaO)1
(a) (b)-0.85 eV -0.42 eV
Figure 3.11 NO2 adsorption over γ-Al 2O3(111) supported (BaO)1 O site (a) and Ba site (b).
Based on the results of the supported BaO monomer calculations, the O site of the
cluster is more active towards NO2 adsorption, so for the calculations of NO2 interacting
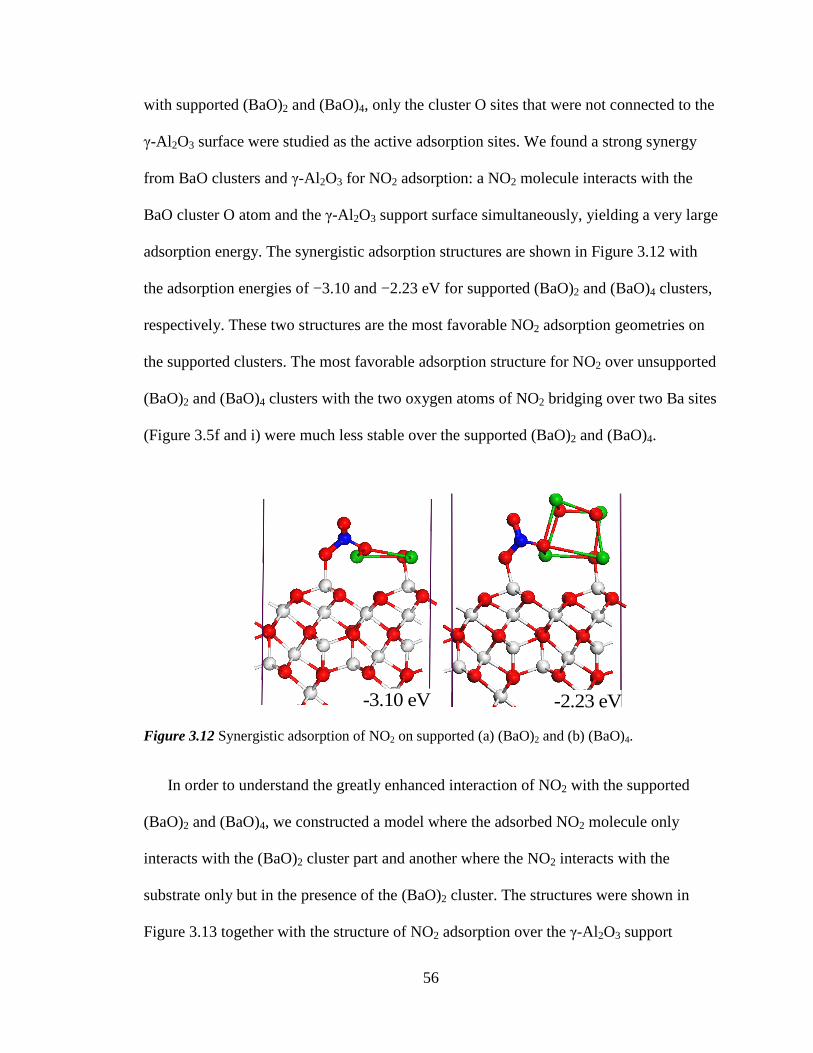
56
with supported (BaO)2 and (BaO)4, only the cluster O sites that were not connected to the
γ-Al 2O3 surface were studied as the active adsorption sites. We found a strong synergy
from BaO clusters and γ-Al 2O3 for NO2 adsorption: a NO2 molecule interacts with the
BaO cluster O atom and the γ-Al 2O3 support surface simultaneously, yielding a very large
adsorption energy. The synergistic adsorption structures are shown in Figure 3.12 with
the adsorption energies of −3.10 and −2.23 eV for supported (BaO)2 and (BaO)4 clusters,
respectively. These two structures are the most favorable NO2 adsorption geometries on
the supported clusters. The most favorable adsorption structure for NO2 over unsupported
(BaO)2 and (BaO)4 clusters with the two oxygen atoms of NO2 bridging over two Ba sites
(Figure 3.5f and i) were much less stable over the supported (BaO)2 and (BaO)4.
-3.10 eV -2.23eV
Figure 3.12 Synergistic adsorption of NO2 on supported (a) (BaO)2 and (b) (BaO)4.
In order to understand the greatly enhanced interaction of NO2 with the supported
(BaO)2 and (BaO)4, we constructed a model where the adsorbed NO2 molecule only
interacts with the (BaO)2 cluster part and another where the NO2 interacts with the
substrate only but in the presence of the (BaO)2 cluster. The structures were shown in
Figure 3.13 together with the structure of NO2 adsorption over the γ-Al 2O3 support
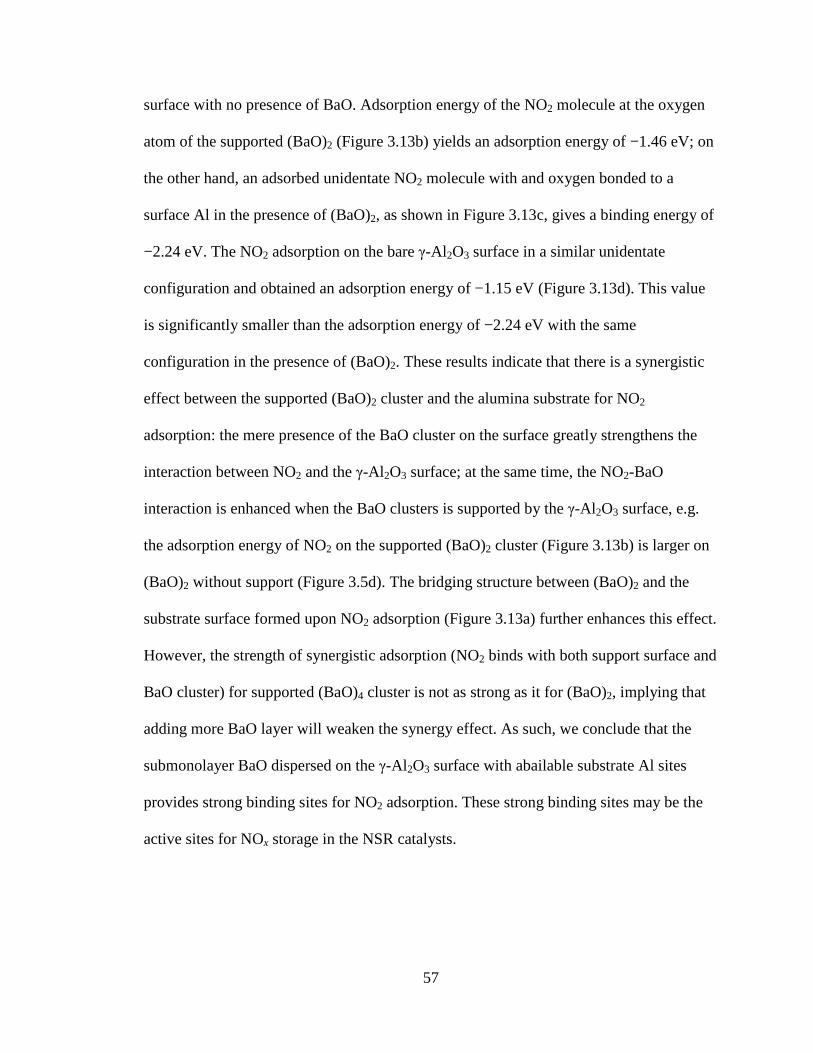
57
surface with no presence of BaO. Adsorption energy of the NO2 molecule at the oxygen
atom of the supported (BaO)2 (Figure 3.13b) yields an adsorption energy of −1.46 eV; on
the other hand, an adsorbed unidentate NO2 molecule with and oxygen bonded to a
surface Al in the presence of (BaO)2, as shown in Figure 3.13c, gives a binding energy of
−2.24 eV. The NO2 adsorption on the bare γ-Al 2O3 surface in a similar unidentate
configuration and obtained an adsorption energy of −1.15 eV (Figure 3.13d). This value
is significantly smaller than the adsorption energy of −2.24 eV with the same
configuration in the presence of (BaO)2. These results indicate that there is a synergistic
effect between the supported (BaO)2 cluster and the alumina substrate for NO2
adsorption: the mere presence of the BaO cluster on the surface greatly strengthens the
interaction between NO2 and the γ-Al 2O3 surface; at the same time, the NO2-BaO
interaction is enhanced when the BaO clusters is supported by the γ-Al 2O3 surface, e.g.
the adsorption energy of NO2 on the supported (BaO)2 cluster (Figure 3.13b) is larger on
(BaO)2 without support (Figure 3.5d). The bridging structure between (BaO)2 and the
substrate surface formed upon NO2 adsorption (Figure 3.13a) further enhances this effect.
However, the strength of synergistic adsorption (NO2 binds with both support surface and
BaO cluster) for supported (BaO)4 cluster is not as strong as it for (BaO)2, implying that
adding more BaO layer will weaken the synergy effect. As such, we conclude that the
submonolayer BaO dispersed on the γ-Al 2O3 surface with abailable substrate Al sites
provides strong binding sites for NO2 adsorption. These strong binding sites may be the
active sites for NOx storage in the NSR catalysts.
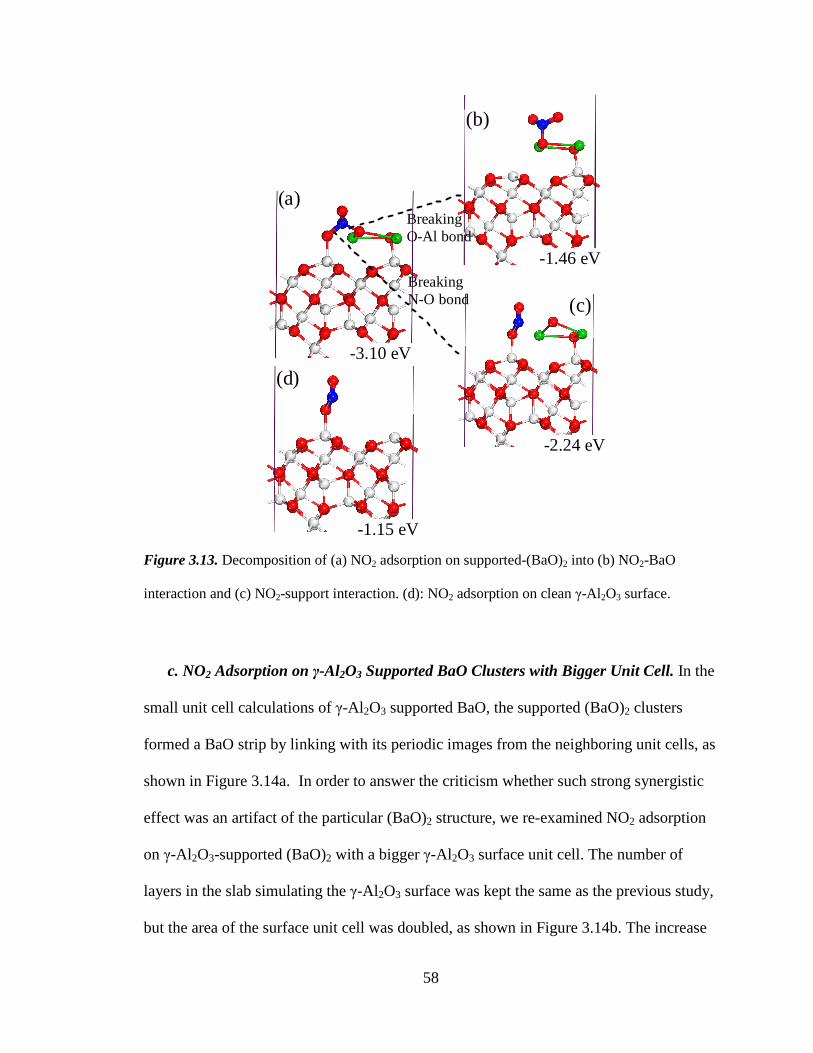
58
Figure 3.13. Decomposition of (a) NO2 adsorption on supported-(BaO)2 into (b) NO2-BaO
interaction and (c) NO2-support interaction. (d): NO2 adsorption on clean γ-Al 2O3 surface.
c. NO2 Adsorption on γ-Al2O3 Supported BaO Clusters with Bigger Unit Cell. In the
small unit cell calculations of γ-Al 2O3 supported BaO, the supported (BaO)2 clusters
formed a BaO strip by linking with its periodic images from the neighboring unit cells, as
shown in Figure 3.14a. In order to answer the criticism whether such strong synergistic
effect was an artifact of the particular (BaO)2 structure, we re-examined NO2 adsorption
on γ-Al 2O3-supported (BaO)2 with a bigger γ-Al 2O3 surface unit cell. The number of
layers in the slab simulating the γ-Al 2O3 surface was kept the same as the previous study,
but the area of the surface unit cell was doubled, as shown in Figure 3.14b. The increase
BreakingO-Al bond
BreakingN-O bond
(a)
(b)
(c)
(d)-3.10 eV
-1.46 eV
-2.24 eV
-1.15 eV
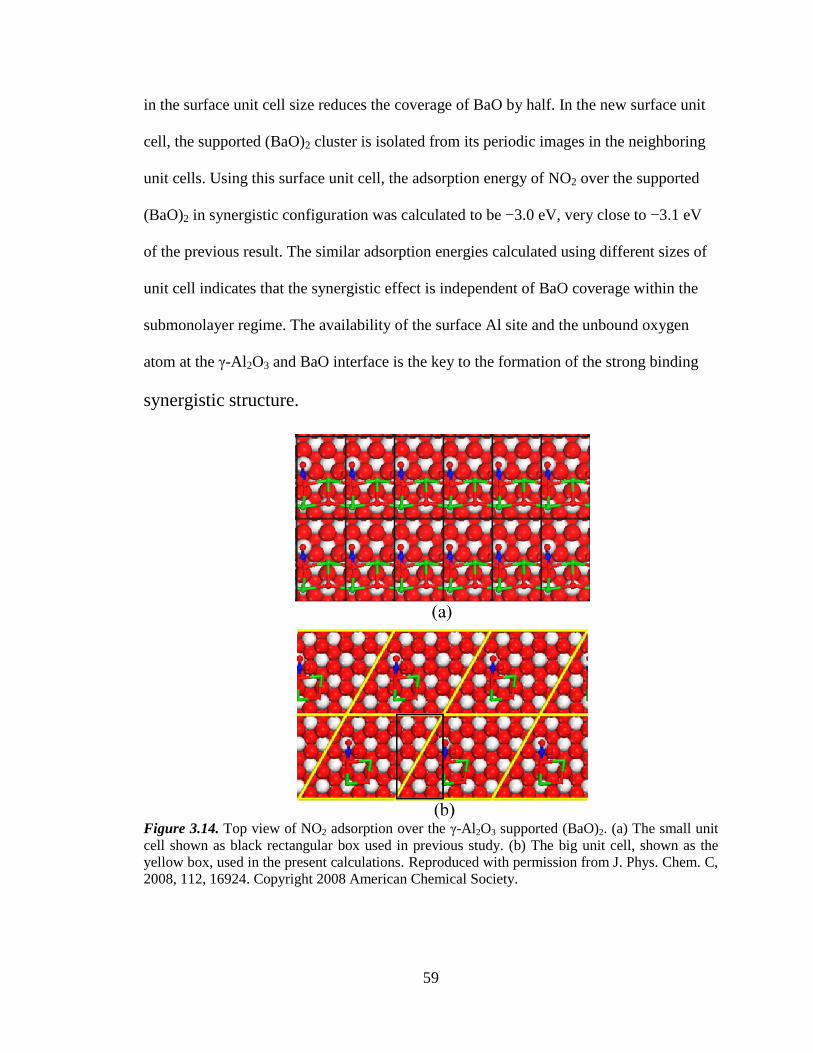
59
in the surface unit cell size reduces the coverage of BaO by half. In the new surface unit
cell, the supported (BaO)2 cluster is isolated from its periodic images in the neighboring
unit cells. Using this surface unit cell, the adsorption energy of NO2 over the supported
(BaO)2 in synergistic configuration was calculated to be −3.0 eV, very close to −3.1 eV
of the previous result. The similar adsorption energies calculated using different sizes of
unit cell indicates that the synergistic effect is independent of BaO coverage within the
submonolayer regime. The availability of the surface Al site and the unbound oxygen
atom at the γ-Al 2O3 and BaO interface is the key to the formation of the strong binding
synergistic structure.
Figure 3.14. Top view of NO2 adsorption over the γ-Al 2O3 supported (BaO)2. (a) The small unit cell shown as black rectangular box used in previous study. (b) The big unit cell, shown as the yellow box, used in the present calculations. Reproduced with permission from J. Phys. Chem. C, 2008, 112, 16924. Copyright 2008 American Chemical Society.
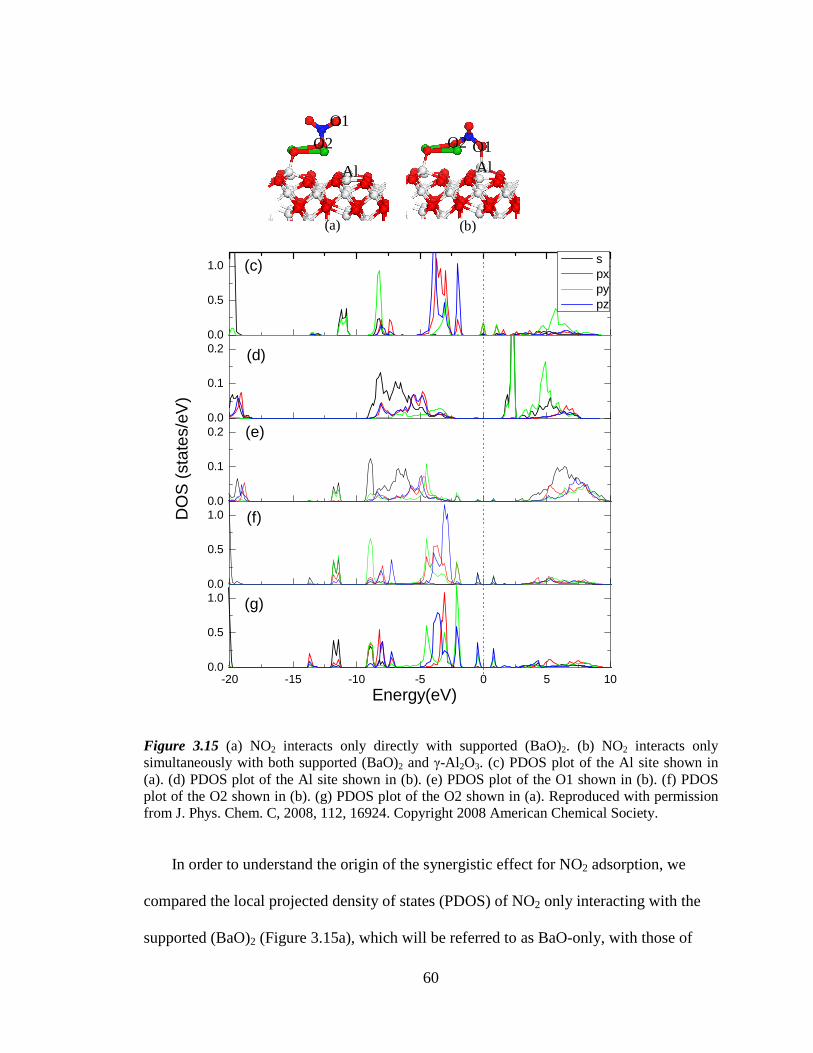
60
0.0
0.5
1.0
0.0
0.1
0.2
-20 -15 -10 -5 0 5 100.0
0.5
1.00.0
0.5
1.00.0
0.1
0.2
(c)
Energy(eV)
s px py pz
DO
S (
stat
es/e
V)
(d)
(g)
(f)
(e)
Figure 3.15 (a) NO2 interacts only directly with supported (BaO)2. (b) NO2 interacts only simultaneously with both supported (BaO)2 and γ-Al 2O3. (c) PDOS plot of the Al site shown in (a). (d) PDOS plot of the Al site shown in (b). (e) PDOS plot of the O1 shown in (b). (f) PDOS plot of the O2 shown in (b). (g) PDOS plot of the O2 shown in (a).
Reproduced with permission
from J. Phys. Chem. C, 2008, 112, 16924. Copyright 2008 American Chemical Society.
In order to understand the origin of the synergistic effect for NO2 adsorption, we
compared the local projected density of states (PDOS) of NO2 only interacting with the
supported (BaO)2 (Figure 3.15a), which will be referred to as BaO-only, with those of
O1
(a) (b)
O1
O2 O2
Al Al
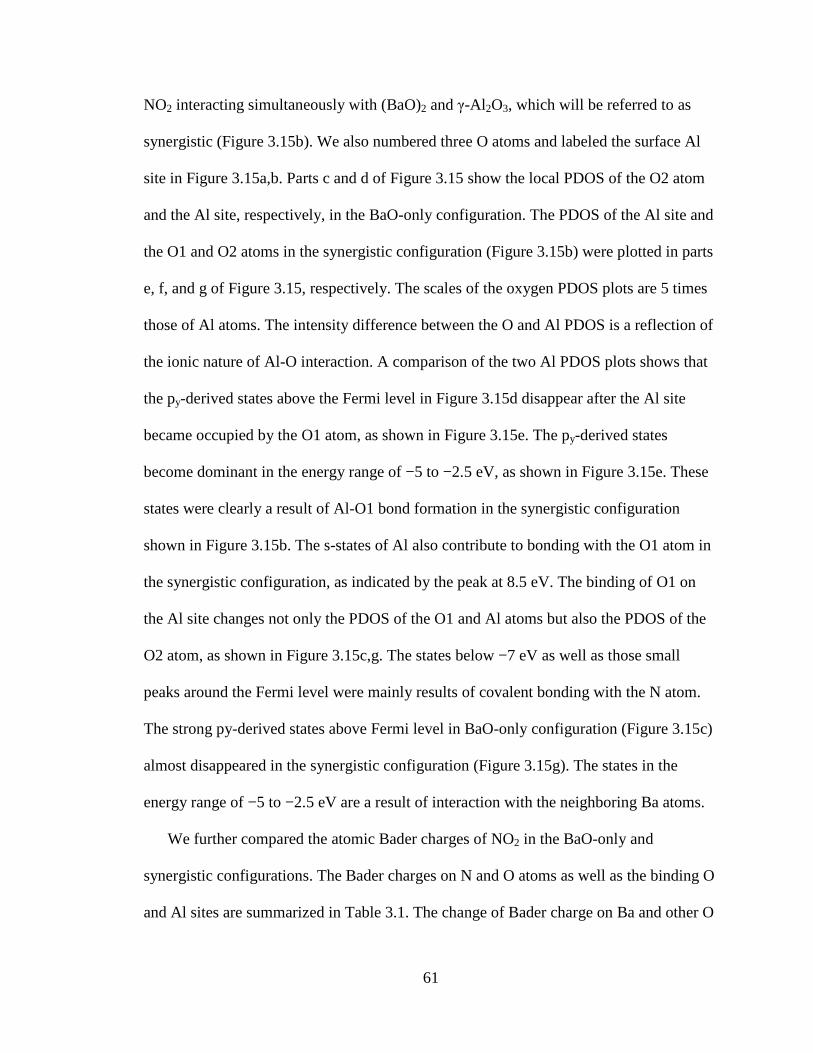
61
NO2 interacting simultaneously with (BaO)2 and γ-Al 2O3, which will be referred to as
synergistic (Figure 3.15b). We also numbered three O atoms and labeled the surface Al
site in Figure 3.15a,b. Parts c and d of Figure 3.15 show the local PDOS of the O2 atom
and the Al site, respectively, in the BaO-only configuration. The PDOS of the Al site and
the O1 and O2 atoms in the synergistic configuration (Figure 3.15b) were plotted in parts
e, f, and g of Figure 3.15, respectively. The scales of the oxygen PDOS plots are 5 times
those of Al atoms. The intensity difference between the O and Al PDOS is a reflection of
the ionic nature of Al-O interaction. A comparison of the two Al PDOS plots shows that
the py-derived states above the Fermi level in Figure 3.15d disappear after the Al site
became occupied by the O1 atom, as shown in Figure 3.15e. The py-derived states
become dominant in the energy range of −5 to −2.5 eV, as shown in Figure 3.15e. These
states were clearly a result of Al-O1 bond formation in the synergistic configuration
shown in Figure 3.15b. The s-states of Al also contribute to bonding with the O1 atom in
the synergistic configuration, as indicated by the peak at 8.5 eV. The binding of O1 on
the Al site changes not only the PDOS of the O1 and Al atoms but also the PDOS of the
O2 atom, as shown in Figure 3.15c,g. The states below −7 eV as well as those small
peaks around the Fermi level were mainly results of covalent bonding with the N atom.
The strong py-derived states above Fermi level in BaO-only configuration (Figure 3.15c)
almost disappeared in the synergistic configuration (Figure 3.15g). The states in the
energy range of −5 to −2.5 eV are a result of interaction with the neighboring Ba atoms.
We further compared the atomic Bader charges of NO2 in the BaO-only and
synergistic configurations. The Bader charges on N and O atoms as well as the binding O
and Al sites are summarized in Table 3.1. The change of Bader charge on Ba and other O
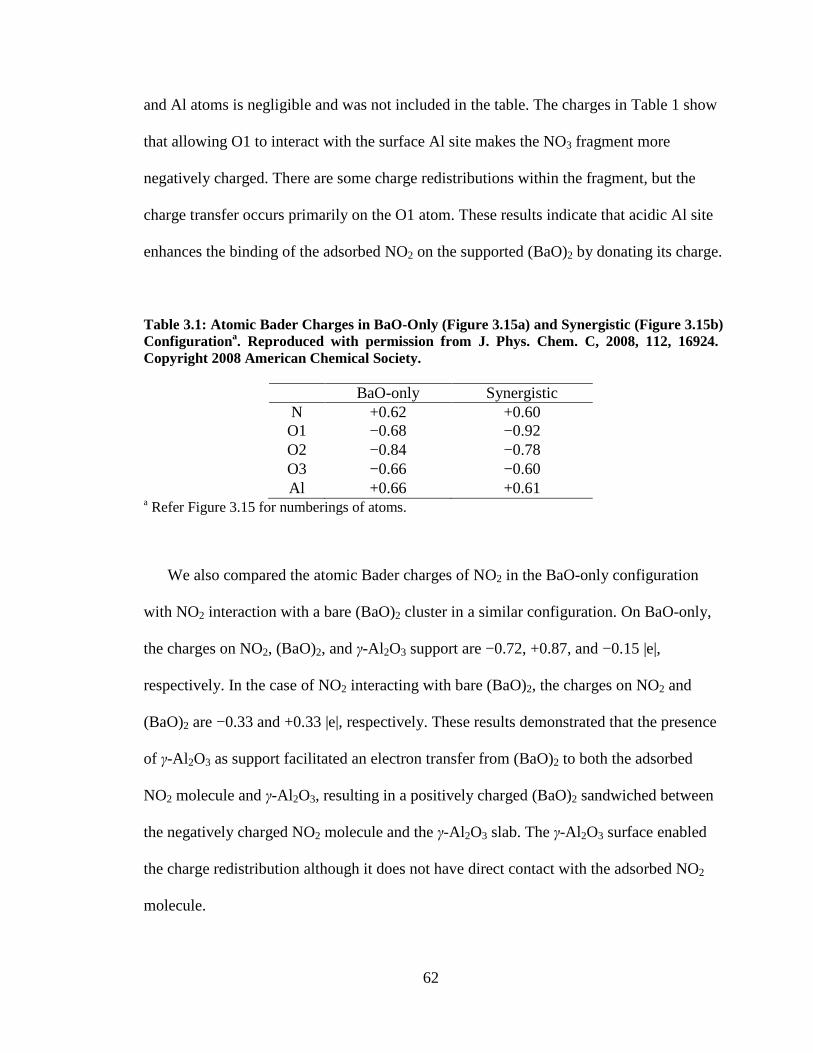
62
and Al atoms is negligible and was not included in the table. The charges in Table 1 show
that allowing O1 to interact with the surface Al site makes the NO3 fragment more
negatively charged. There are some charge redistributions within the fragment, but the
charge transfer occurs primarily on the O1 atom. These results indicate that acidic Al site
enhances the binding of the adsorbed NO2 on the supported (BaO)2 by donating its charge.
Table 3.1: Atomic Bader Charges in BaO-Only (Figure 3.15a) and Synergistic (Figure 3.15b) Configuration a.
Reproduced with permission from J. Phys. Chem. C, 2008, 112, 16924.
Copyright 2008 American Chemical Society.
BaO-only Synergistic N +0.62 +0.60 O1 −0.68 −0.92 O2 −0.84 −0.78 O3 −0.66 −0.60 Al +0.66 +0.61
a Refer Figure 3.15 for numberings of atoms.
We also compared the atomic Bader charges of NO2 in the BaO-only configuration
with NO2 interaction with a bare (BaO)2 cluster in a similar configuration. On BaO-only,
the charges on NO2, (BaO)2, and γ-Al 2O3 support are −0.72, +0.87, and −0.15 |e|,
respectively. In the case of NO2 interacting with bare (BaO)2, the charges on NO2 and
(BaO)2 are −0.33 and +0.33 |e|, respectively. These results demonstrated that the presence
of γ-Al 2O3 as support facilitated an electron transfer from (BaO)2 to both the adsorbed
NO2 molecule and γ-Al 2O3, resulting in a positively charged (BaO)2 sandwiched between
the negatively charged NO2 molecule and the γ-Al 2O3 slab. The γ-Al 2O3 surface enabled
the charge redistribution although it does not have direct contact with the adsorbed NO2
molecule.
63
We then analyzed the charge distribution for NO2 interacting with γ-Al 2O3 support in
the presence of the (BaO)2 cluster but not directly in contact with the cluster. Our results
showed that (BaO)2 lost 0.52 |e| upon NO2 adsorption although NO2 does not have direct
contact with (BaO)2. After (BaO)2 was replaced by a cubic (BaO)4, the overall charge
loss by (BaO)4 was reduced to 0.31 |e|. These results indicated that the supported BaO
clusters act as an electron donor, enhancing NO2 interaction with the γ-Al 2O3 support. In
other words, the supported BaO clusters enhance the electron donating ability of the γ-
Al 2O3 support and, therefore, the Lewis basicity of the support.
The present study addressed some important aspects of the NSR catalysis: the effect
of BaO morphology and γ-Al 2O3 support on NO2 adsorption. We showed that the
morphology of BaO as well as the interaction of BaO with the support will play
important roles in stabilizing the active species and modifying the interaction of other
gases with the surface. NSR catalysis also involves many other aspects such as the
existence of other gaseous species in the exhaust stream and operating conditions.
Competitive adsorption of different gases on BaO and other alkaline earth metal oxides
have been examined.68,99 Furthermore, the coupling between the redox sites and the
storage sites will be critical to the overall de-NOx efficiency. 78,100 All these issues need to
be addressed before a more complete understanding of the NSR catalysis can be
developed.
3.4. Conclusion
First principles density functional theory calculations have been used to characterize
NO2 adsorption on BaO surfaces, unsupported and γ-Al 2O3 supported BaO clusters. Our
results showed that the adsorption energy of NO2 depends strongly on the morphology of
64
BaO and the existence of defects. On the stoichiometric BaO, the low-coordinate sites are
more flexible for NO2 adsorption, resulting in stronger NO2 bindings. NO2 adsorption at
the edge O sites of the clusters and the stepped surface resulted in a NO3δ- species.
Furthermore, the electronic properties of the BaO substrates were found to have more
dramatic effect on NO2-BaO interaction. On the non-stoichiometric BaO clusters and
surfaces, the adsorption energy of NO2 is much greater than on the stoichiometric clusters
and surfaces, up to −4.09 eV for NO2/Ba14O13.
We also demonstrated that the γ-Al 2O3 support is critical for NOx storage. On one
hand, the support surface alters the electronic character of the supported BaO cluster, thus
affect the NO2 adsorption configuration and energy of the BaO. On the other hand, a BaO
cluster covered over the γ-Al 2O3 support modifies the acidity of the top layer cation (Al)
sites, therefore, the reactivities of the support surface sites are enhanced. The interface
where the adsorbed NO2 can interact with both BaO and γ-Al 2O3 provides the strongest
binding towards NO2. However, the synergistic effect of enhancing the adsorption of
NO2 was weakened by adding an extra BaO layer on the supported (BaO)2: the
adsorption energy of NO2 on the supported (BaO)4, of which the configuration is in the
form of two layers of (BaO)2, was reduced to −2.23 eV from −3.10 eV on the supported
(BaO)2. We therefore propose that a highly dispersed submonolayer BaO will be the most
effective for NOx storage in a NSR catalyst.
65
CHAPTER 4
ELECTRONIC SHELL EFFECT ON REACTIVITY OF SMALL METAL
CLUSTERS
—EXAMPLES OF H 2 DESORPTION ON MAGNESIUM CLUSTERS
4.1. Introduction
The study of H2 dissociation over Mg clusters reveals the effect of electronic
structures on the reactivities of the small metal clusters. The reaction was studied as an
important step in using magnesium as hydrogen storage material.
Although magnesium dihydride has for long been recognized as one of the most
attractive hydrogen storage materials candidate due to its low cost and high hydrogen
storage capacity (7.6 wt%), its actual onboard application is limited by the high
desorption temperature and the slow H2 adsorption and desorption kinetics. A DFT
calculation using PBE functional predicted an activation barrier of ~1.05 eV for H2
dissociation over the Mg (0001) surface101. This relatively high threshold energy is
responsible for the slow H2 adsorption kinetics over the bulk surface although the phase
transition between Mg and MgH2 can also be rate-limiting. As the research focus of
hydrogen storage swings from demonstrating possibilities to improving commercial
viability, lots of effort has been made to decrease the operation temperature and increase
the adsorption/desorption rates of Mg-based system. Alloying and doping magnesium
with other metals102-106 or metal oxide107-109 can actually improve the kinetics of and
increase the rate hydrogen sorption, however, this sacrifices hydrogen storage capacity
due to the added weight of the doped metal and oxide. So the intuitive ideal solution to
the problem would be modifying the thermodynamics and kinetics of H2 sorption over
Mg/MgH2 without the addition of extra component. Ball mining technique effectively
66
reduced Mg grain size and increased H2 sorption rates. However, the enhanced rate is
solely related to surface area enlargement and diffusion length decrease while the grain
size of particles obtained by this technology is still not small enough to change
thermodynamics of the system, the H2 desorption process still requires high temperature
(~300 ºC at 1 bar H2).110,111
Recently, it has been demonstrated that when the crystal grain size is down to about
1.3 nm, the hydrogen desorption energy decreases significantly, so that,
thermodynamically speaking, the hydrogen desorption on small size MgH2 can occur at
lower temperature, e.g. 200 ºC for 0.9 nm crystalline.112 In a work by Li et al.113, Mg
nanowires were demonstrated to have improved H2 sorption kinetics. For example, the
nanowires with diameter of 30-50nm can achieve 7.60 wt% uptake of hydrogen within 30
min at around 300 ºC. The accelerated sorption rates should be related to the low sorption
activation energy barriers. Therefore, in this chapter, we investigated the H2 dissociation
energy barriers over Mg clusters. The aim is to provide the insight into the difference
between H2 sorption kinetics over Mg surfaces and small clusters.
4.2. Methodology
The structure optimizations of the Mg9, Mg92+, Mg9
2-, Mg10 and Mg102+ clusters and
the reactions (H2 dissociation over the clusters) were carried out using the GAUSSIAN
03 package114. The DFT method with both the B3LYP and the PBE88,115,116 forms of
exchange/correlation energies were used. The choice of basis sets are 6-31+g(d,p). In the
discussions of the results, we refer to the GAUSSIAN calculation results with PBE
functional unless otherwise noted. The structures of clusters were optimized until the
energies were minimized to the GAUSSIAN default convergence criteria. The transition
67
states were located by minimizing the force of the structures to the saddle points. Then
frequency calculations of those optimized structures were performed to confirm that they
are indeed the transition states corresponding to H2 dissociation.
The calculations of the Mg9, Mg10 and Mg102+ clusters were also carried out using the
DFT implementation program package the VASP code117 for comparison and supporting
purpose. The VASP code was also used to calculate H2 dissociation over the Mg(100)
and (110) surfaces. In the VASP calculations, the exchange-correlation energy was
evaluated by the PBE88 functional. The interaction between ions and electrons was
described using the projector augmented wave method,87,118 and a plane wave basis set
with a cutoff energy of 450 eV was used to expand the wavefunction of valence
electrons. The atomic structures were relaxed using spin-polarized conjugate-gradient
algorithm until the forces on the unconstrained atoms were less than 0.005 eV/Å. The
transition states were located using nudged elastic band method and confirmed by
frequency calculations. In the calculations of Mg clusters, there were at least 20 Å
separations in all three directions (a, b and c) between clusters in neighboring unit cells to
avoid the interactions. The cluster structures were subjected to relaxation without
constraints. The Mg(100) and (110) surfaces were cleaved from the relaxed bulk Mg
structure and were simulated with six and four layers slabs, respectively. Separations of
at least 10 Å in c directions were inserted between neighboring cells to minimize the
interactions along these directions between periodic images. The bottom layers of the
surface slabs were kept frozen at the respective cleaved-from-bulk positions whereas the
top layers together with the two hydrogen atoms were allowed to relax. For the cluster
calculations, Γ-point was used for Brillouin zones. 6 × 3 × 1 and 4 × 4 × 1 K-point
68
meshes generated with the Monkhorst-Pack scheme were used to sample the Brillouin
zones for surface (100) and (110), respectively.
4.3. Results & Discussion:
4.3.1. Structures of Mg9, Mg92+, Mg9
2-, Mg10 and Mg102+ Clusters. The most stable
structure of Mg9 is a six-atom triangular prism core with three atoms attached to each
side square of the triangular prism (Figure 4.1a). The same structure was also reported
previously in a work by Lyalin et al.119 The structures of Mg92+ and Mg9
2- clusters were
calculated by relaxing the optimized Mg9 cluster with +2 and –2 charges, respectively.
These two structures were shown in Figure 4.1 b and c. Comparing these three 9-atom
clusters, we found that the more electron the cluster has, the more closely packed the
triangular prism is. For example, the average bond length of the triangles of the triangular
prism in the Mg92+ cluster is ~4.2 Å, much larger than that of the neutral Mg9 cluster (3.2
Å) and the Mg92- cluster (3.06 Å). The calculated HOMO-LUMO band gaps were 0.73,
0.90 and 0.81 eV for Mg9, Mg92+ and Mg9
2-, respectively. Adding one atom to the Mg9
triangle cap, we obtain the Mg10 structure shown in Figure 4.1d. The Mg102+ cluster was
calculated by relaxing the Mg10 cluster with two positive charges shown in Figure 4.1e.
The HOMO-LUMO band gaps for these two structures are 1.25 eV for Mg10 and 0.92 eV
for Mg102+.
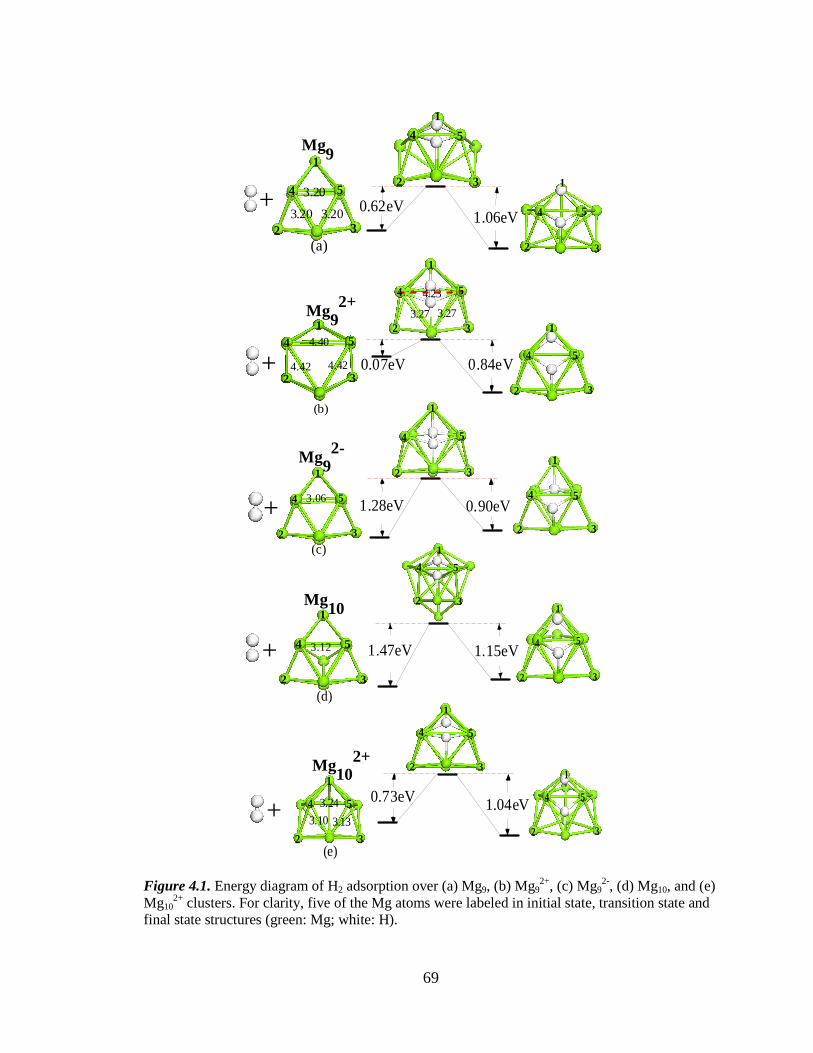
69
Figure 4.1. Energy diagram of H2 adsorption over (a) Mg9, (b) Mg9
2+, (c) Mg92-, (d) Mg10, and (e)
Mg102+ clusters. For clarity, five of the Mg atoms were labeled in initial state, transition state and
final state structures (green: Mg; white: H).
(b)
2
1
3
4.40
4.42 4.42
4 5
3.27 3.27
4.23
2
1
3
54
4 5
2 3
1
4 5
2 3
1
4 5
2 3
1
4 5
2 3
1
4 5
2 3
1
0.84eV0.07eV
1
2(a)
3.20 54
3.20 3.203
1
2 3
54
0.62eV1.06eV
1
2 3
4 5
1
2 3
(d)
3.124 5
1
2 3
(c)
3.064 5
1
2 3
4 5
1
2 3(e)
3.24
3.10 3.13
4 5
1
2 3
4 5
1.28eV 0.90eV
1.47eV 1.15eV
0.73eV 1.04eV
+
+
+
+
+
Mg92+
Mg9
Mg92-
Mg10
Mg102+
70
For small metal clusters consisting of less than hundred atoms, a mean field potential
can be introduced to calculate the energy level of the system where every atom and
electron counts. This is the base of the Jellium model, which has successfully explained
the unusual stabilities of the Na clusters with closed electronic shells120, i.e., Na clusters
consisting of 2, 8, 20, 40, …atoms have higher binding energies due to the successive
complete filling of electron shells. Such clusters were known as the magic clusters.
Experimental evidence of such concept is the observation of high peaks corresponding to
those magic clusters in mass spectrum.121 The stabilities of certain divalent and trivalent
clusters, where each atom contribute two and three electrons, respectively, can also be
explained from the electronic shell closure rules121,122. For example, in the work of
Doppner etc.121, the neutral Mg10 and doubly positive-charged Mg11 clusters both contain
20 electrons and have enhanced stabilities compared with their corresponding uncharged
and doubly charged neighbors. Applying the same rule, Mg92- has a closed-shell (9 Mg
atoms × 2 valence electron/atom + 2 e- = 20 e-) thus should have extra stability. Because
the binding energies of the three clusters, Mg9, Mg92+ and Mg9
2-, are not directly
comparable due to the fact that they are differently charged, we compare the HOMO-
LUMO gaps of the clusters instead of binding energies as indication of their relative
stabilities. We found that the band gap of the closed-shell Mg92- (0.81 eV) is larger than
that of Mg9 (0.73 eV) which is two electrons shy than the magic number. This obeys the
magic rules that the closed shell clusters are more stable thus having larger band gaps.
However, the Mg92+ cluster is an exception—the band gap of Mg9
2+ is 0.90 eV, larger
than the other two 9-atom clusters which cannot be explained by the magic rule. For the
two 10-atom clusters, our results also follow the magic rule that the Mg10 is the close-
71
shell cluster and its band gap of 1.25 eV is larger than that of the Mg102+ cluster (0.92
eV).
4.3.2. H2 Dissociation over Mg9, Mg92+, Mg9
2-, Mg10 and Mg102+ Clusters. To
calculate the transition states, we first used the nudged elastic band (NEB) method
implemented in VASP to calculate the transition states of H2 dissociation on the Mg9,
Mg10 and Mg102+ clusters. Those transition state structures were then used as the initial
input structures for the GAUSSIAN calculations and allowed to be optimized to the
saddle points. These three transition state structures also provided prior knowledge of the
transition state structures of such systems. Based on this information, the initial structures
of the transition states of H2 dissociation over the Mg92+ and Mg9
2- clusters were
constructed and subjected to optimize to their corresponding saddle points. For
comparison purpose, the H2 dissociation locations on all clusters were chosen to be very
similar, i.e. over the Mg4-Mg5 bridging bond (Figure 4.1). The activation energies were
calculated using:
��zS � �0� � ��S��� PZ � � ��, (4.1)
where �0�, �S��� PZ and � � are the energies of the transition state, the initial Mg cluster
and a gas phase H2 molecule, respectively. ��zS calculated using both GAUSSIAN and
VASP were reported in Table 4.1.
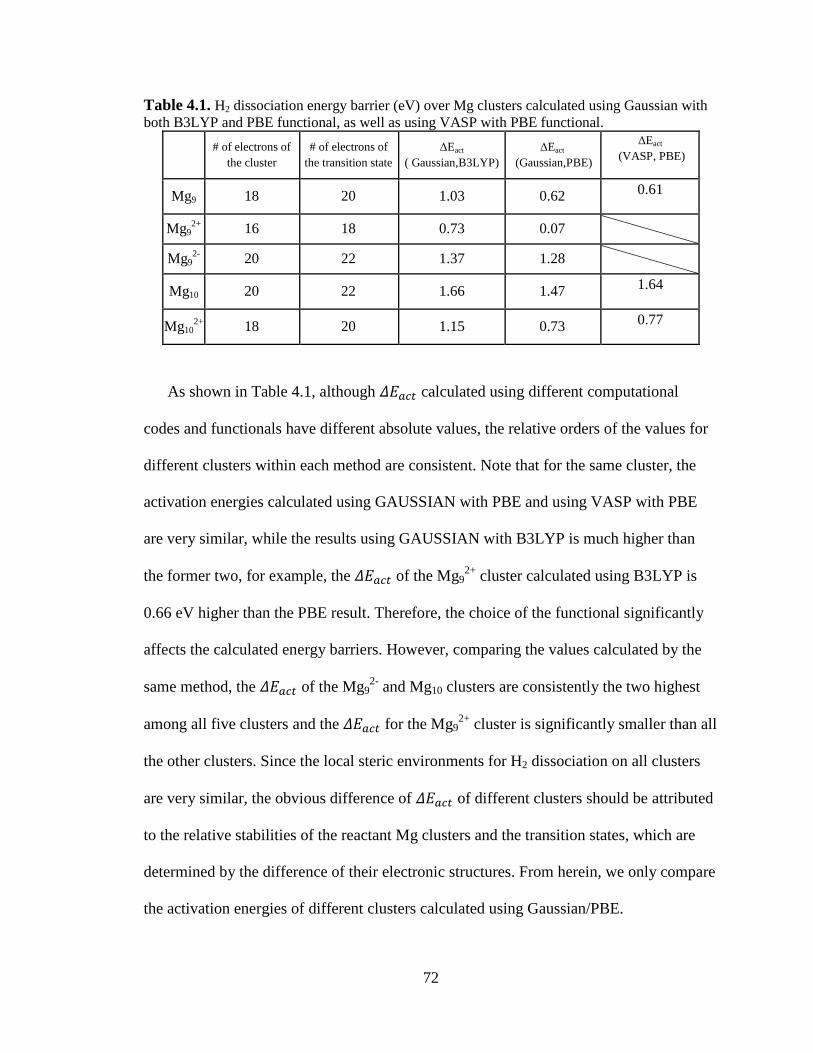
72
Table 4.1. H2 dissociation energy barrier (eV) over Mg clusters calculated using Gaussian with both B3LYP and PBE functional, as well as using VASP with PBE functional.
# of electrons of the cluster
# of electrons of the transition state
∆Eact ( Gaussian,B3LYP)
∆Eact
(Gaussian,PBE)
∆Eact
(VASP, PBE)
Mg9 18 20 1.03 0.62 0.61
Mg92+ 16 18 0.73 0.07
Mg9
2- 20 22 1.37 1.28
Mg10 20 22 1.66 1.47 1.64
Mg102+ 18 20 1.15 0.73 0.77
As shown in Table 4.1, although ��zS calculated using different computational
codes and functionals have different absolute values, the relative orders of the values for
different clusters within each method are consistent. Note that for the same cluster, the
activation energies calculated using GAUSSIAN with PBE and using VASP with PBE
are very similar, while the results using GAUSSIAN with B3LYP is much higher than
the former two, for example, the ��zS of the Mg92+ cluster calculated using B3LYP is
0.66 eV higher than the PBE result. Therefore, the choice of the functional significantly
affects the calculated energy barriers. However, comparing the values calculated by the
same method, the ��zS of the Mg92- and Mg10 clusters are consistently the two highest
among all five clusters and the ��zS for the Mg92+ cluster is significantly smaller than all
the other clusters. Since the local steric environments for H2 dissociation on all clusters
are very similar, the obvious difference of ��zS of different clusters should be attributed
to the relative stabilities of the reactant Mg clusters and the transition states, which are
determined by the difference of their electronic structures. From herein, we only compare
the activation energies of different clusters calculated using Gaussian/PBE.
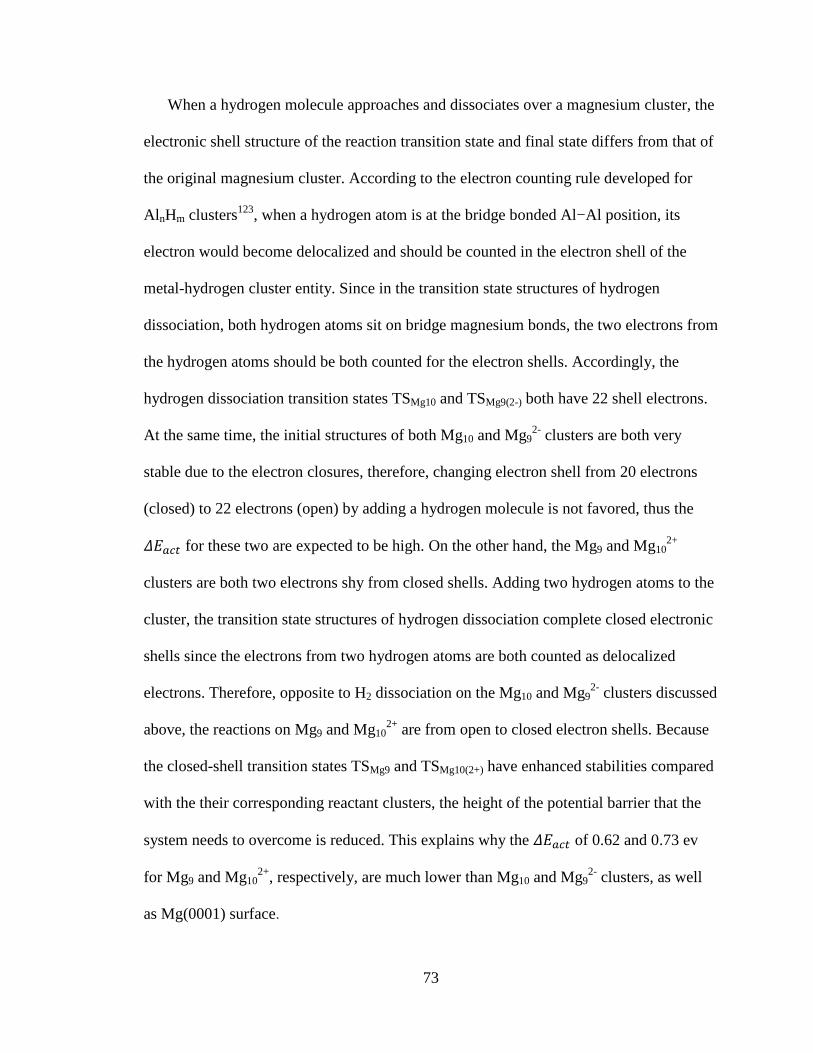
73
When a hydrogen molecule approaches and dissociates over a magnesium cluster, the
electronic shell structure of the reaction transition state and final state differs from that of
the original magnesium cluster. According to the electron counting rule developed for
Al nHm clusters123, when a hydrogen atom is at the bridge bonded Al−Al position, its
electron would become delocalized and should be counted in the electron shell of the
metal-hydrogen cluster entity. Since in the transition state structures of hydrogen
dissociation, both hydrogen atoms sit on bridge magnesium bonds, the two electrons from
the hydrogen atoms should be both counted for the electron shells. Accordingly, the
hydrogen dissociation transition states TSMg10 and TSMg9(2-) both have 22 shell electrons.
At the same time, the initial structures of both Mg10 and Mg92- clusters are both very
stable due to the electron closures, therefore, changing electron shell from 20 electrons
(closed) to 22 electrons (open) by adding a hydrogen molecule is not favored, thus the
��zS for these two are expected to be high. On the other hand, the Mg9 and Mg102+
clusters are both two electrons shy from closed shells. Adding two hydrogen atoms to the
cluster, the transition state structures of hydrogen dissociation complete closed electronic
shells since the electrons from two hydrogen atoms are both counted as delocalized
electrons. Therefore, opposite to H2 dissociation on the Mg10 and Mg92- clusters discussed
above, the reactions on Mg9 and Mg102+ are from open to closed electron shells. Because
the closed-shell transition states TSMg9 and TSMg10(2+) have enhanced stabilities compared
with the their corresponding reactant clusters, the height of the potential barrier that the
system needs to overcome is reduced. This explains why the ��zS of 0.62 and 0.73 ev
for Mg9 and Mg102+, respectively, are much lower than Mg10 and Mg9
2- clusters, as well
as Mg(0001) surface.
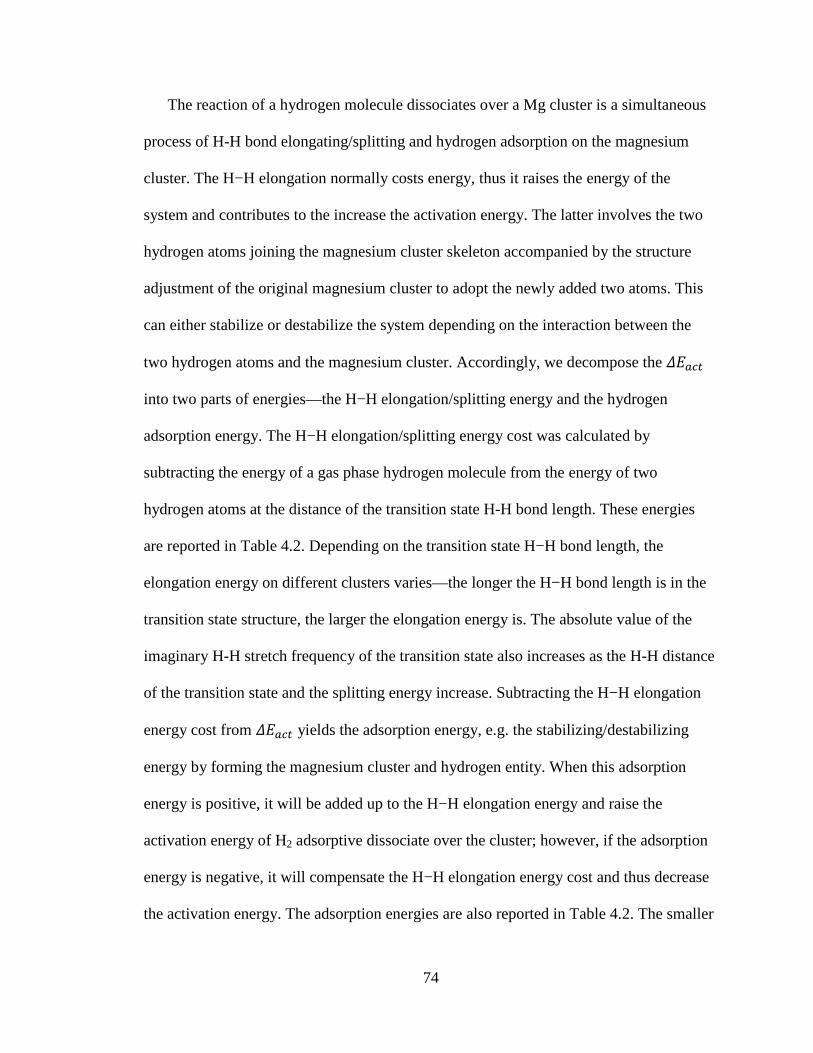
74
The reaction of a hydrogen molecule dissociates over a Mg cluster is a simultaneous
process of H-H bond elongating/splitting and hydrogen adsorption on the magnesium
cluster. The H−H elongation normally costs energy, thus it raises the energy of the
system and contributes to the increase the activation energy. The latter involves the two
hydrogen atoms joining the magnesium cluster skeleton accompanied by the structure
adjustment of the original magnesium cluster to adopt the newly added two atoms. This
can either stabilize or destabilize the system depending on the interaction between the
two hydrogen atoms and the magnesium cluster. Accordingly, we decompose the ��zS
into two parts of energies—the H−H elongation/splitting energy and the hydrogen
adsorption energy. The H−H elongation/splitting energy cost was calculated by
subtracting the energy of a gas phase hydrogen molecule from the energy of two
hydrogen atoms at the distance of the transition state H-H bond length. These energies
are reported in Table 4.2. Depending on the transition state H−H bond length, the
elongation energy on different clusters varies—the longer the H−H bond length is in the
transition state structure, the larger the elongation energy is. The absolute value of the
imaginary H-H stretch frequency of the transition state also increases as the H-H distance
of the transition state and the splitting energy increase. Subtracting the H−H elongation
energy cost from ��zS yields the adsorption energy, e.g. the stabilizing/destabilizing
energy by forming the magnesium cluster and hydrogen entity. When this adsorption
energy is positive, it will be added up to the H−H elongation energy and raise the
activation energy of H2 adsorptive dissociate over the cluster; however, if the adsorption
energy is negative, it will compensate the H−H elongation energy cost and thus decrease
the activation energy. The adsorption energies are also reported in Table 4.2. The smaller
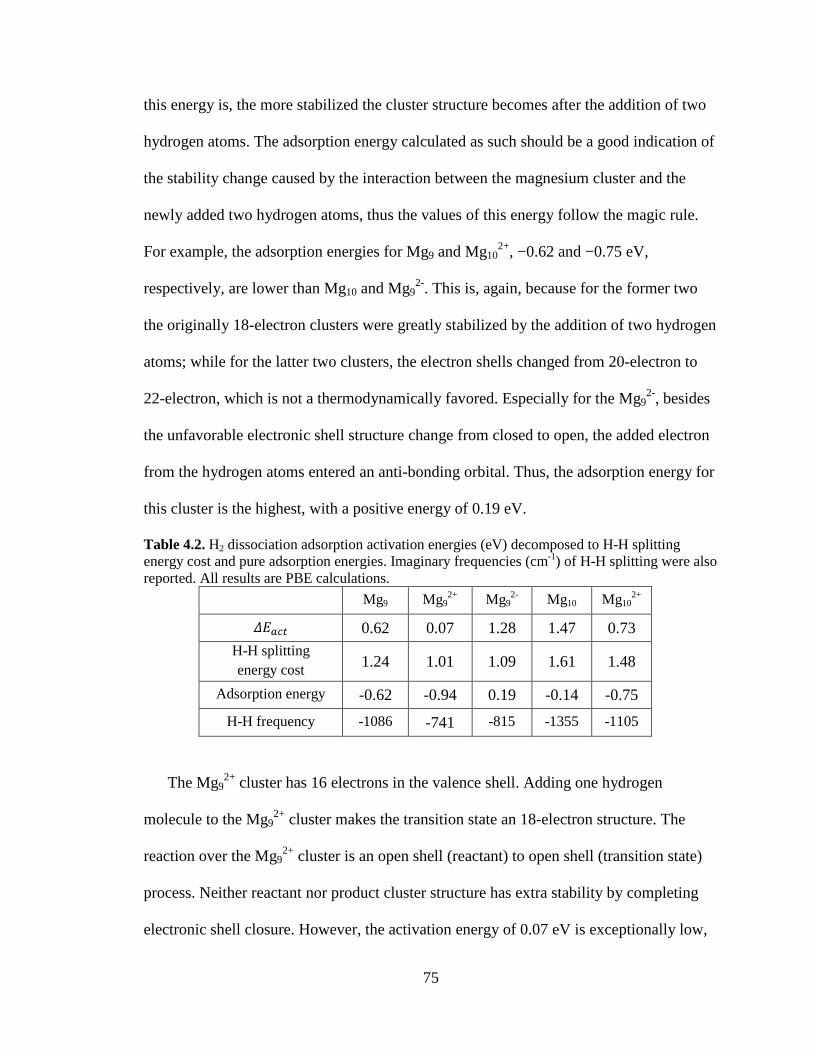
75
this energy is, the more stabilized the cluster structure becomes after the addition of two
hydrogen atoms. The adsorption energy calculated as such should be a good indication of
the stability change caused by the interaction between the magnesium cluster and the
newly added two hydrogen atoms, thus the values of this energy follow the magic rule.
For example, the adsorption energies for Mg9 and Mg102+, −0.62 and −0.75 eV,
respectively, are lower than Mg10 and Mg92-. This is, again, because for the former two
the originally 18-electron clusters were greatly stabilized by the addition of two hydrogen
atoms; while for the latter two clusters, the electron shells changed from 20-electron to
22-electron, which is not a thermodynamically favored. Especially for the Mg92-, besides
the unfavorable electronic shell structure change from closed to open, the added electron
from the hydrogen atoms entered an anti-bonding orbital. Thus, the adsorption energy for
this cluster is the highest, with a positive energy of 0.19 eV.
Table 4.2. H2 dissociation adsorption activation energies (eV) decomposed to H-H splitting energy cost and pure adsorption energies. Imaginary frequencies (cm-1) of H-H splitting were also reported. All results are PBE calculations.
Mg9 Mg92+ Mg9
2- Mg10 Mg102+
��zS 0.62 0.07 1.28 1.47 0.73 H-H splitting energy cost 1.24 1.01 1.09 1.61 1.48
Adsorption energy -0.62 -0.94 0.19 -0.14 -0.75
H-H frequency -1086 -741 -815 -1355 -1105
The Mg92+ cluster has 16 electrons in the valence shell. Adding one hydrogen
molecule to the Mg92+ cluster makes the transition state an 18-electron structure. The
reaction over the Mg92+ cluster is an open shell (reactant) to open shell (transition state)
process. Neither reactant nor product cluster structure has extra stability by completing
electronic shell closure. However, the activation energy of 0.07 eV is exceptionally low,
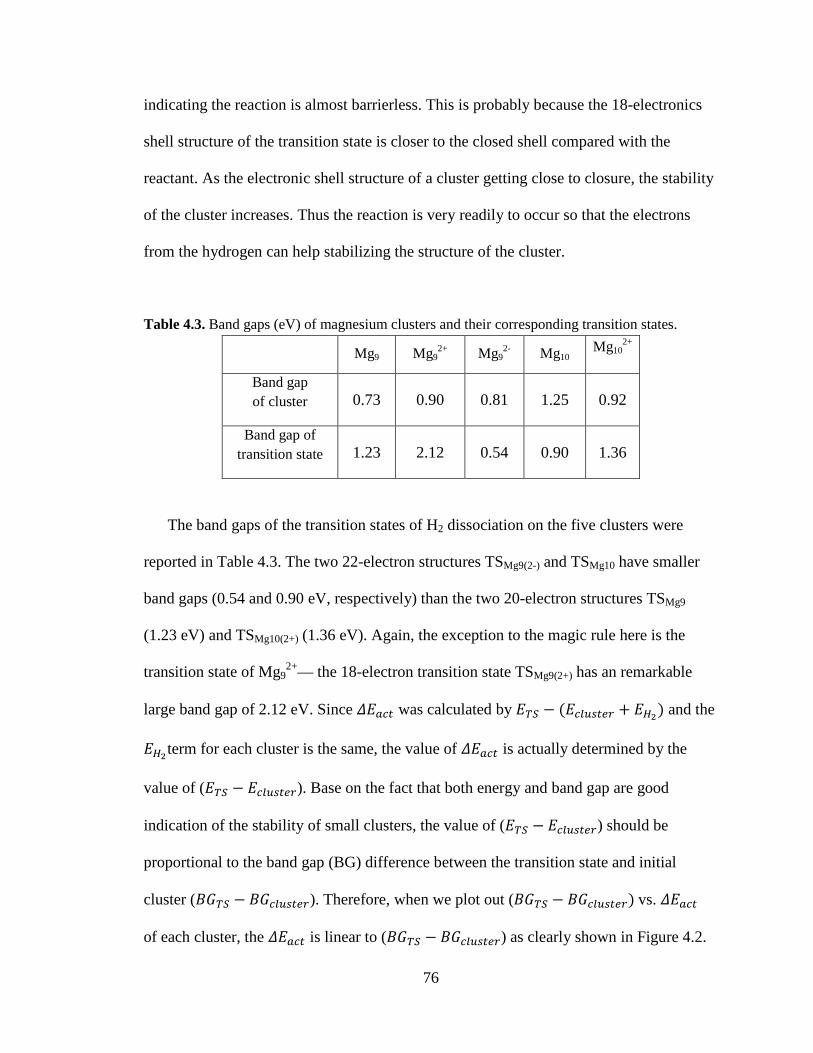
76
indicating the reaction is almost barrierless. This is probably because the 18-electronics
shell structure of the transition state is closer to the closed shell compared with the
reactant. As the electronic shell structure of a cluster getting close to closure, the stability
of the cluster increases. Thus the reaction is very readily to occur so that the electrons
from the hydrogen can help stabilizing the structure of the cluster.
Table 4.3. Band gaps (eV) of magnesium clusters and their corresponding transition states.
Mg9 Mg92+ Mg9
2- Mg10 Mg10
2+
Band gap of cluster 0.73 0.90 0.81 1.25 0.92
Band gap of transition state 1.23 2.12 0.54 0.90 1.36
The band gaps of the transition states of H2 dissociation on the five clusters were
reported in Table 4.3. The two 22-electron structures TSMg9(2-) and TSMg10 have smaller
band gaps (0.54 and 0.90 eV, respectively) than the two 20-electron structures TSMg9
(1.23 eV) and TSMg10(2+) (1.36 eV). Again, the exception to the magic rule here is the
transition state of Mg92+— the 18-electron transition state TSMg9(2+) has an remarkable
large band gap of 2.12 eV. Since ��zS was calculated by �0� � ��S��� PZ � � �� and the
� �term for each cluster is the same, the value of ��zS is actually determined by the
value of (�0� � �S��� PZ). Base on the fact that both energy and band gap are good
indication of the stability of small clusters, the value of (�0� � �S��� PZ) should be
proportional to the band gap (BG) difference between the transition state and initial
cluster (¡¢0� � ¡¢S��� PZ). Therefore, when we plot out (¡¢0� � ¡¢S��� PZ� vs. ��zS
of each cluster, the ��zS is linear to (¡¢0� � ¡¢S��� PZ) as clearly shown in Figure 4.2.
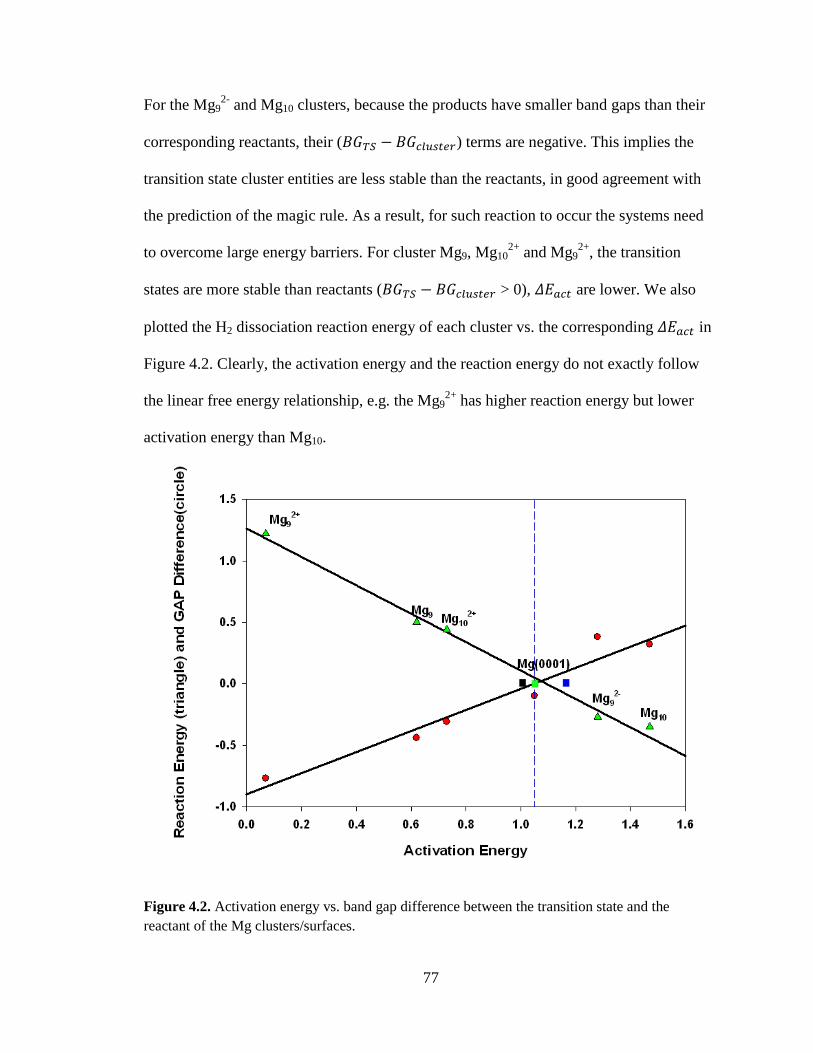
77
For the Mg92- and Mg10 clusters, because the products have smaller band gaps than their
corresponding reactants, their (¡¢0� � ¡¢S��� PZ) terms are negative. This implies the
transition state cluster entities are less stable than the reactants, in good agreement with
the prediction of the magic rule. As a result, for such reaction to occur the systems need
to overcome large energy barriers. For cluster Mg9, Mg102+ and Mg9
2+, the transition
states are more stable than reactants (¡¢0� � ¡¢S��� PZ > 0), ��zS are lower. We also
plotted the H2 dissociation reaction energy of each cluster vs. the corresponding ��zS in
Figure 4.2. Clearly, the activation energy and the reaction energy do not exactly follow
the linear free energy relationship, e.g. the Mg92+ has higher reaction energy but lower
activation energy than Mg10.
Figure 4.2. Activation energy vs. band gap difference between the transition state and the reactant of the Mg clusters/surfaces.
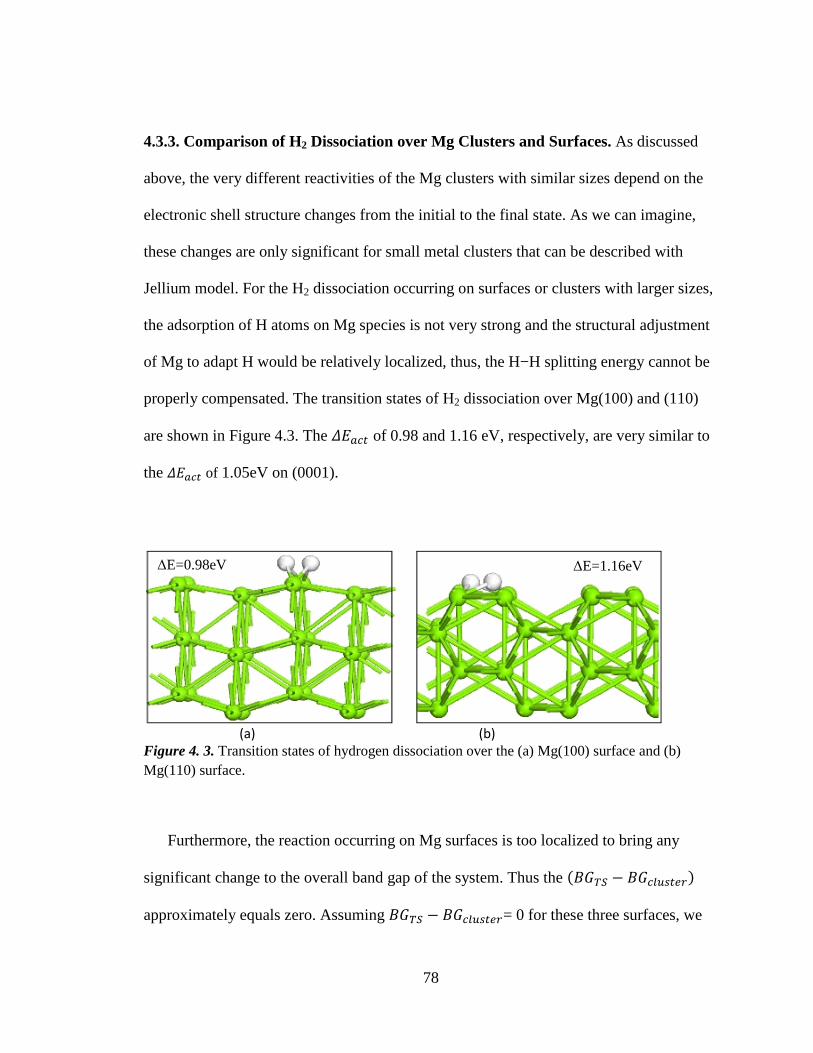
78
4.3.3. Comparison of H2 Dissociation over Mg Clusters and Surfaces. As discussed
above, the very different reactivities of the Mg clusters with similar sizes depend on the
electronic shell structure changes from the initial to the final state. As we can imagine,
these changes are only significant for small metal clusters that can be described with
Jellium model. For the H2 dissociation occurring on surfaces or clusters with larger sizes,
the adsorption of H atoms on Mg species is not very strong and the structural adjustment
of Mg to adapt H would be relatively localized, thus, the H−H splitting energy cannot be
properly compensated. The transition states of H2 dissociation over Mg(100) and (110)
are shown in Figure 4.3. The ��zS of 0.98 and 1.16 eV, respectively, are very similar to
the ��zS of 1.05eV on (0001).
(a) (b)
Figure 4. 3. Transition states of hydrogen dissociation over the (a) Mg(100) surface and (b) Mg(110) surface.
Furthermore, the reaction occurring on Mg surfaces is too localized to bring any
significant change to the overall band gap of the system. Thus the �¡¢0� � ¡¢S��� PZ�
approximately equals zero. Assuming ¡¢0� � ¡¢S��� PZ= 0 for these three surfaces, we
∆E=1.16eV ∆E=0.98eV
79
marked the data points in green (0001), black (100) and blue (110) squares, respectively,
in Figure 4.2. All three points are converged nearly on the linear data line at
approximately 1.0−1.1 eV. Furthermore, the interaction between the Mg surfaces and the
hydrogen atoms at the transition state is so weak, that the energy cost of the H-H
elongation/splitting cannot be compensated. Thus ��zS on the Mg surfaces are relatively
high comparing with some of the clusters where the adsorption energy of hydrogen on
Mg clusters lowers the activation energy.
Furthermore, our results demonstrated that the kinetics of H2 dissociation over small
Mg clusters, to which the magic rule applies, is very different from that of the surfaces.
4.4. Conclusions:
First principles density functional theory was used to study the H2 dissociation over
selected Mg clusters. We have demonstrated the reaction energy barrier of hydrogen
dissociation on these clusters highly depends on the electronic structure of the initial bare
cluster and the transition state cluster entity (magnesium with hydrogen attached). For
cluster Mg9 and Mg102+, the electronic structures change from open shell initial states to
closed shell transition states, so the activation energies are relatively lower than for
cluster Mg92- and Mg10, of which the electron shells change from closed (initial state) to
open (transition state). This follows the magic rule that the clusters with closed electronic
shell have extra stability than the open shell. However, the Mg92+ cluster is exceptionally
stable and the hydrogen dissociation barrier over the cluster is expectedly low, which is
not discussed in the magic rule. More importantly, we demonstrate that some of the
clusters, compared with surfaces, have very high reactivities and completely different

80
kinetic properties toward H2 dissociation, which might shed light on tailoring the
materials for better usage of hydrogen storage.
81
CHAPTER 5
ORIGIN OF SUPPORT EFFECTS ON THE REACTIVITY OF CERIA CLUSTER
5.1. Introduction
Metal oxides are commonly used as catalyst supports in a variety of commercial
heterogeneous catalytic processes, including the conversion of hydrocarbon and emission
control.124,125 Metal oxide also acts as active catalysts and/or promoters in many
reactions.14 Catalysts comprised of an active metal oxide dispersed on the surface of
another metal oxide support are used widely.14,126 In these catalysts, the supporting oxides
and the dispersed oxides may exhibit very different physical and chemical properties
from their corresponding bulk counterparts. The geometric structure and the variable
oxidation states of metal in the active oxide, as well as the local environment where the
reaction takes place, control the overall catalytic performance.127-131 In this regard, the
loading of active oxide, the nature of the supporting oxide, and the preparation method all
contribute to the activity of the catalyst. For example, it was well documented that the
turn-over frequency of the selective oxidation of methanol to formaldehyde on metal
oxide supported vanadia/molybdena can be greatly affected by the support51,132-139. In the
mean time, the loading of the dispersed active metal oxide determines the number of
active sites since the coverage of the dispersed phase is in the range of submonolayer (<
100%). Establishing a relationship between the reactivity of the dispersed metal oxide
catalysts on different oxide substrates by investigating the oxide cluster and overlayer on
the different support oxides is key to understand and design more efficient catalysts.
Unfortunately, unlike the very well studied metal clusters supported on metal oxide
82
systems12-17,140-148, the supported oxide catalysts are not as well understood as the
supported metal catalysts due to the challenges in manipulating the dispersion oxide
particles and characterizing the oxide overlayers.
Ceria-based catalysts have attracted enormous interest because of their various
applications in heterogeneous catalysis such as automobile exhaust treatments and
oxidative dehydrogenation of hydrocarbons.142,149-153 The unique capability of cerium that
it adapts its oxidation states under different environments, makes ceria not only a good
support for transition metals, but also an active component in many practical
catalysts.149,150,154 However, pure ceria is not suitable for the dual functionalities in those
catalysts because of the rapid sintering, poor thermal stability, and high reduction
temperature.2,155 A second metal oxide, such as ZrO2 or γ-Al 2O3, was generally added in
ceria-based catalysts.156-159 The addition of another metal oxide is expected to enhance
the dispersion and resist the sintering, as well as improve the redox property of
CeO2.2,155,160 Numerous experimental investigations have attempted to follow the
structural transformation and to elucidate stability of the oxygen vacancy in the mixed
oxides.132,153,156-159,161-166 However, to establish a structure-property relationship for the
complex mixed oxide systems on the molecular level is still prohibited.14
Experimentally, it has been demonstrated that the loading of the ceria species and the
nature of the support result in different reactivity of the catalyst. For example, the
dispersion of the CeO2 entities in an alumina-supported ceria catalyst was found to
depend upon the interaction between CeO2 and the underlying alumina support.158 In the
range of 1 ~ 39 wt% CeO2, two general types of CeO2 structures have been observed.158
At low CeO2 loadings, CeO2 particles are highly dispersed on the support as two-
83
dimensional (2D) patches. As the CeO2 content increases, three-dimensional (3D)
crystalline CeO2 particles form and grow at the expense of the 2D CeO2 patches. More
importantly, different redox properties were observed for the 2D and 3D CeO2. For
example, re-oxidizing the Ce sites of the reduced 2D CeO2 patches was found to be
difficult as observed by electron paramagnetic resonance (EPR).158 For CeO2-ZrO2
systems, most previous studies indicated that mixed CexZr1-xO2 solid solutions
form.155,159,163,166-168 The redox properties of CexZr1-xO2 are strongly dependent upon the
structure and composition of the active phase. Due to the limitations of current surface
science techniques, the activity of the catalyst is measured as an average over the entire
CeO2-ZrO2 sample. Consequently, the origin of the improved redox property by adding
ZrO2 to the system is not clear.166,168 It has been suggested that the enhanced redox
properties relates to the composition of the mixed CeO2-ZrO2 nanodomain.166,168 The
nanoscale heterogeneity derived from the local composition and structure may play an
important role in determining the support and promotion effects of ZrO2.166,168 Putna et
al. investigated CO oxidation on the CeO2 film supported by the polycrystalline ZrO2 and
α-Al 2O3 substrates.162 They reported that the CeO2 film over the ZrO2 substrate was
highly reducible and much more reactive towards CO oxidation than the α-Al 2O3
substrates. Furthermore, there was no evidence of forming a mixed CeO2-ZrO2 phase.
The observed enhancement in activity was rationalized by the improved reducibility of
CeO2 film since ZrO2 was buried under the CeO2 film at the reaction conditions.162 These
authors also suggested that the support effects of ZrO2 might simply be explained by
promoting the formation of small, incoherently dispersed CeO2 islands.162
84
To better understand of the origin of support effects on the CeO2 catalyst, CO
adsorption and oxidation over the oxide-on-oxide model catalyst, i.e. a stoichiometric
Ce2O4 cluster (as the active oxide phase) supported on the reducible ZrO2 and the
irreducible γ-Al 2O3 substrates was studied using first principles density functional theory
(DFT) method. We demonstrated the distinctive effects of the irreducible and reducible
supports on the reactivity of supported Ce2O4 clusters toward CO and CO2 and analyzed
the origin of the differences.
5.2 Methodology
All the calculations were carried out using the VASP code,87 a DFT program
package with plane wave as basis set. The interactions between ions and electrons was
described using the projector augmented wave method.87 The nonlocal exchange-
correlation energy was evaluated by the PBE functional. For systems involving Ce atoms,
the DFT+U method130,169-172 (U = 5 used in this work) was used to treat the highly
correlated f-electrons of Ce atoms. The plane wave basis set with a cutoff energy of 400
eV was used to expand the wave function of valence electrons. Spin-polarization was
included in all calculations. The atomic structures were relaxed until the forces on the
unconstrained atoms were less than 0.05 eV/Å.
The ZrO2 substrate was taken from the monoclinic ZrO2 bulk structure optimized
with the same set of parameters. The zirconium atoms in the bulk structure are all hepta-
coordinated whereas the oxygen atoms are either tri- or tetra- coordinated. The optimized
lattice parameters a, b, c and γ of ZrO2 bulk are 5.160, 5.236, 5.319 Å and 99.64º, in
good agreement with the experimental values of 5.151, 5.212, 5.317 Å and 99.23º.173
Since the (111) orientation of ZrO2 is the most stable surface, the ZrO2(111) surface was
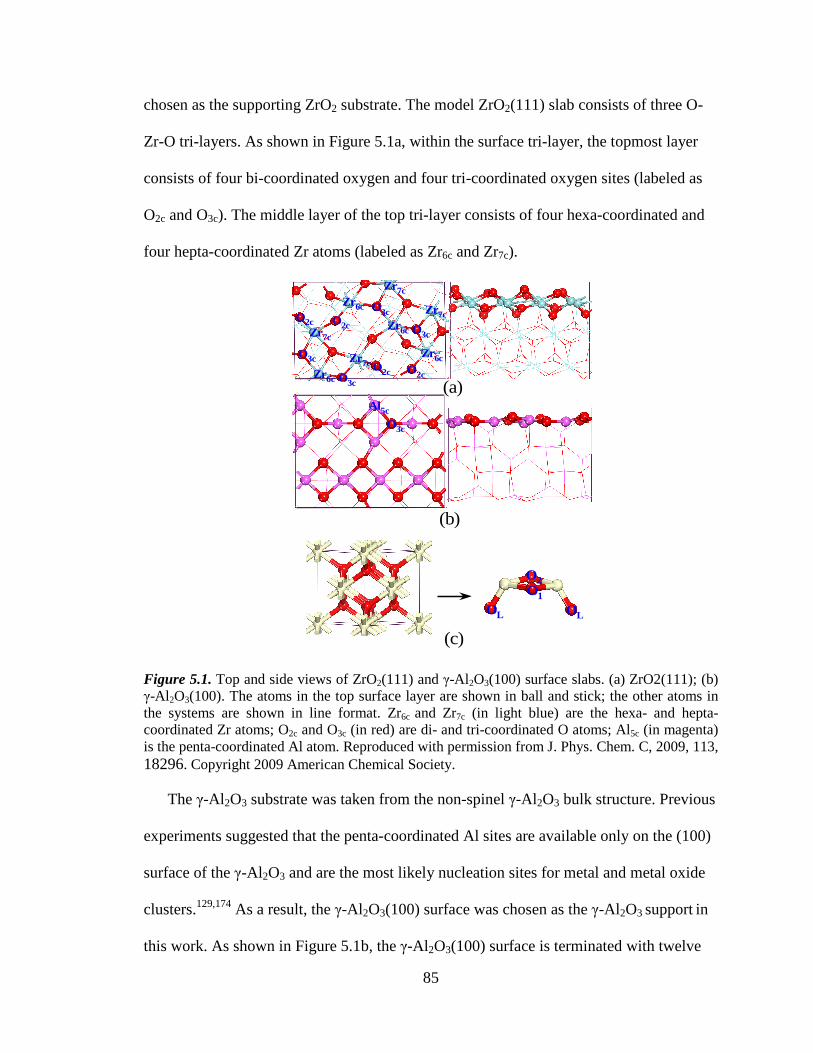
85
chosen as the supporting ZrO2 substrate. The model ZrO2(111) slab consists of three O-
Zr-O tri-layers. As shown in Figure 5.1a, within the surface tri-layer, the topmost layer
consists of four bi-coordinated oxygen and four tri-coordinated oxygen sites (labeled as
O2c and O3c). The middle layer of the top tri-layer consists of four hexa-coordinated and
four hepta-coordinated Zr atoms (labeled as Zr6c and Zr7c).
O2c
O2cO2c
O2c
(b)
(c)
OL OL
Zr 6c
Zr 6c
Zr 6c
Zr 6c
(a)
O2O1
Zr 7c
Zr 7c
Zr 7c
Zr 7c
O3c
Al5c
O3c
O3c
O3c
O3c
Figure 5.1. Top and side views of ZrO2(111) and γ-Al 2O3(100) surface slabs. (a) ZrO2(111); (b) γ-Al 2O3(100). The atoms in the top surface layer are shown in ball and stick; the other atoms in the systems are shown in line format. Zr6c and Zr7c (in light blue) are the hexa- and hepta-coordinated Zr atoms; O2c and O3c (in red) are di- and tri-coordinated O atoms; Al5c (in magenta) is the penta-coordinated Al atom.
Reproduced with permission from J. Phys. Chem. C, 2009, 113,
18296. Copyright 2009 American Chemical Society.
The γ-Al 2O3 substrate was taken from the non-spinel γ-Al 2O3 bulk structure. Previous
experiments suggested that the penta-coordinated Al sites are available only on the (100)
surface of the γ-Al 2O3 and are the most likely nucleation sites for metal and metal oxide
clusters.129,174 As a result, the γ-Al 2O3(100) surface was chosen as the γ-Al 2O3 support in
this work. As shown in Figure 5.1b, the γ-Al 2O3(100) surface is terminated with twelve
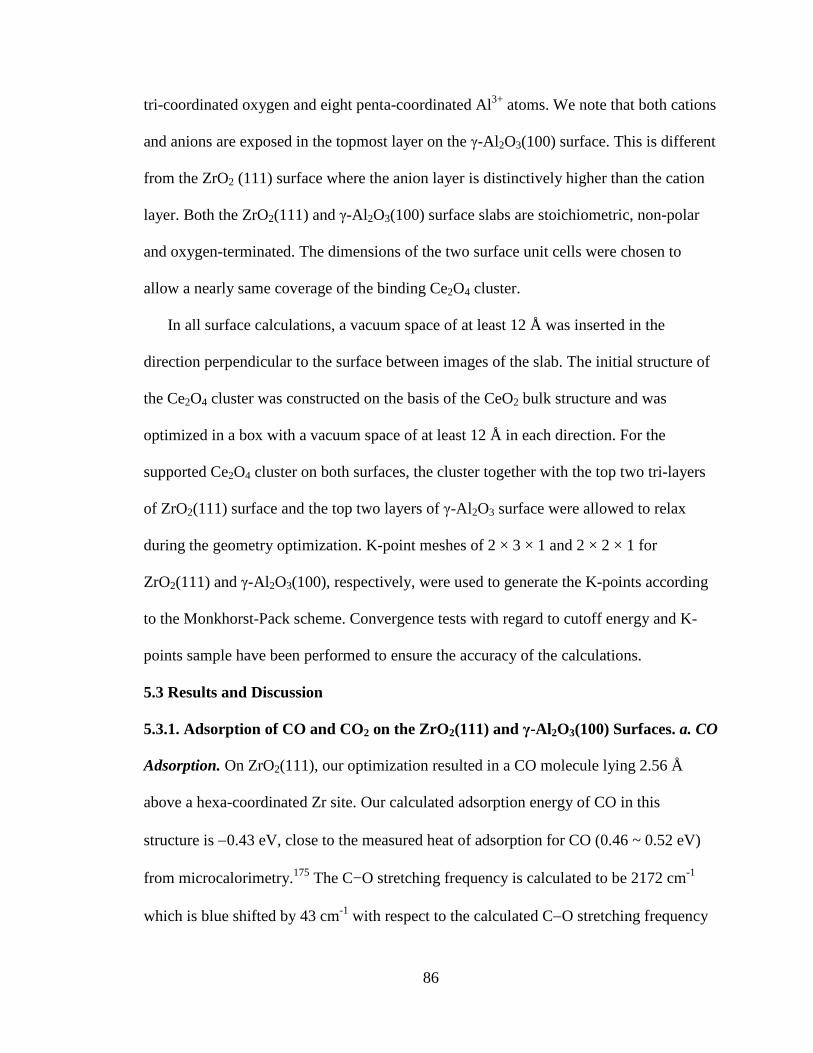
86
tri-coordinated oxygen and eight penta-coordinated Al3+ atoms. We note that both cations
and anions are exposed in the topmost layer on the γ-Al 2O3(100) surface. This is different
from the ZrO2 (111) surface where the anion layer is distinctively higher than the cation
layer. Both the ZrO2(111) and γ-Al 2O3(100) surface slabs are stoichiometric, non-polar
and oxygen-terminated. The dimensions of the two surface unit cells were chosen to
allow a nearly same coverage of the binding Ce2O4 cluster.
In all surface calculations, a vacuum space of at least 12 Å was inserted in the
direction perpendicular to the surface between images of the slab. The initial structure of
the Ce2O4 cluster was constructed on the basis of the CeO2 bulk structure and was
optimized in a box with a vacuum space of at least 12 Å in each direction. For the
supported Ce2O4 cluster on both surfaces, the cluster together with the top two tri-layers
of ZrO2(111) surface and the top two layers of γ-Al 2O3 surface were allowed to relax
during the geometry optimization. K-point meshes of 2 × 3 × 1 and 2 × 2 × 1 for
ZrO2(111) and γ-Al 2O3(100), respectively, were used to generate the K-points according
to the Monkhorst-Pack scheme. Convergence tests with regard to cutoff energy and K-
points sample have been performed to ensure the accuracy of the calculations.
5.3 Results and Discussion
5.3.1. Adsorption of CO and CO2 on the ZrO2(111) and γ-Al 2O3(100) Surfaces. a. CO
Adsorption. On ZrO2(111), our optimization resulted in a CO molecule lying 2.56 Å
above a hexa-coordinated Zr site. Our calculated adsorption energy of CO in this
structure is −0.43 eV, close to the measured heat of adsorption for CO (0.46 ~ 0.52 eV)
from microcalorimetry.175 The C−O stretching frequency is calculated to be 2172 cm-1
which is blue shifted by 43 cm-1 with respect to the calculated C−O stretching frequency
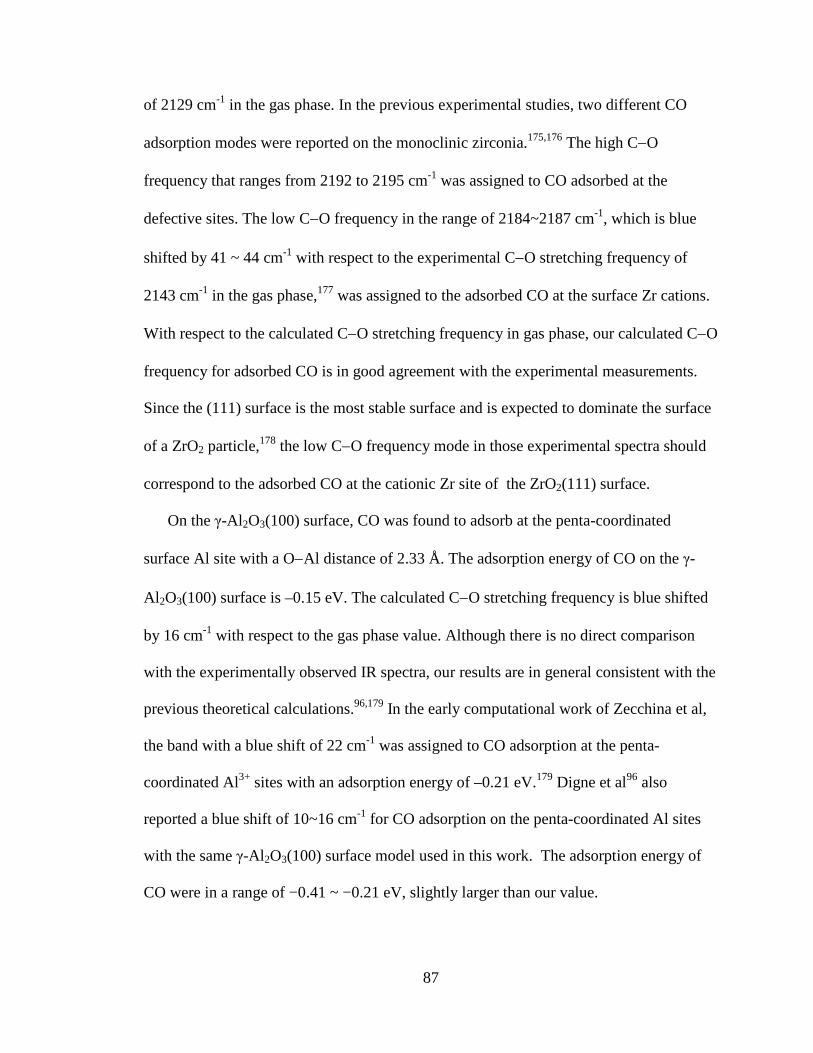
87
of 2129 cm-1 in the gas phase. In the previous experimental studies, two different CO
adsorption modes were reported on the monoclinic zirconia.175,176 The high C−O
frequency that ranges from 2192 to 2195 cm-1 was assigned to CO adsorbed at the
defective sites. The low C−O frequency in the range of 2184~2187 cm-1, which is blue
shifted by 41 ~ 44 cm-1 with respect to the experimental C−O stretching frequency of
2143 cm-1 in the gas phase,177 was assigned to the adsorbed CO at the surface Zr cations.
With respect to the calculated C−O stretching frequency in gas phase, our calculated C−O
frequency for adsorbed CO is in good agreement with the experimental measurements.
Since the (111) surface is the most stable surface and is expected to dominate the surface
of a ZrO2 particle,178 the low C−O frequency mode in those experimental spectra should
correspond to the adsorbed CO at the cationic Zr site of the ZrO2(111) surface.
On the γ-Al 2O3(100) surface, CO was found to adsorb at the penta-coordinated
surface Al site with a O−Al distance of 2.33 Å. The adsorption energy of CO on the γ-
Al 2O3(100) surface is –0.15 eV. The calculated C−O stretching frequency is blue shifted
by 16 cm-1 with respect to the gas phase value. Although there is no direct comparison
with the experimentally observed IR spectra, our results are in general consistent with the
previous theoretical calculations.96,179 In the early computational work of Zecchina et al,
the band with a blue shift of 22 cm-1 was assigned to CO adsorption at the penta-
coordinated Al3+ sites with an adsorption energy of –0.21 eV.179 Digne et al96 also
reported a blue shift of 10~16 cm-1 for CO adsorption on the penta-coordinated Al sites
with the same γ-Al 2O3(100) surface model used in this work. The adsorption energy of
CO were in a range of −0.41 ~ −0.21 eV, slightly larger than our value.
88
The vibrational properties of CO adsorbed on oxides have been used to elucidate the
nature of the cationic sites.179 On a non transition metal oxide surface, the interaction
between CO and cation site is predominantly electrostatic. The blue shift of CO
stretching frequency is a result of the polarized field of the cation, and the magnitude of
the shift is proportional to the strength of the field.179 We note, however, that Zr is a 4d
transition metal element and the contribution of d orbitals often reduces the electrostatic
effect. The fact that CO adsorbed on the ZrO2(111) surface has a larger blue shift in C−O
stretching frequency and a larger adsorption energy than CO adsorbed on γ-Al 2O3(100)
indicates that the local field induced by Zr4+ on the ZrO2(111) surface is stronger than
that by the Al3+ sites on γ-Al 2O3(100). Consequently, the Zr4+ site on the ZrO2(111)
surface is expected to be more acidic than the Al3+ sites on γ-Al 2O3(100).
b. CO2 Adsorption. The acidic CO2 molecule generally adsorbs on the basic sites of
oxide surface.180 Different strengths of surface basicity are expected to result in different
adsorption configurations.83,181,182 Typically, CO2 binds at a strong basic oxygen site in a
monodentate configuration via a C−Osurf bond, whereas at the weak basic sites, it binds in
bidentate or bridged configurations via both C−Osurf and O−Msurf bonds. On the
ZrO2(111) surface, we found that CO2 adsorbs in a bidentate configuration, forming a
carbonate like species. The C−O bond lengths of the carbonate species are 1.21, 1.28 and
1.51 Å, respectively. The adsorption energy was calculated to be +0.05 eV, indicating
that the adsorption is slightly endothermic. However, our vibrational frequency analysis
of the adsorption structure shows that the resulting carbonate is at a true minimum since
no imaginary frequency was found. The frequencies corresponding to the symmetric and
asymmetric stretching are 1850 and 1187 cm-1, respectively. These values are close to
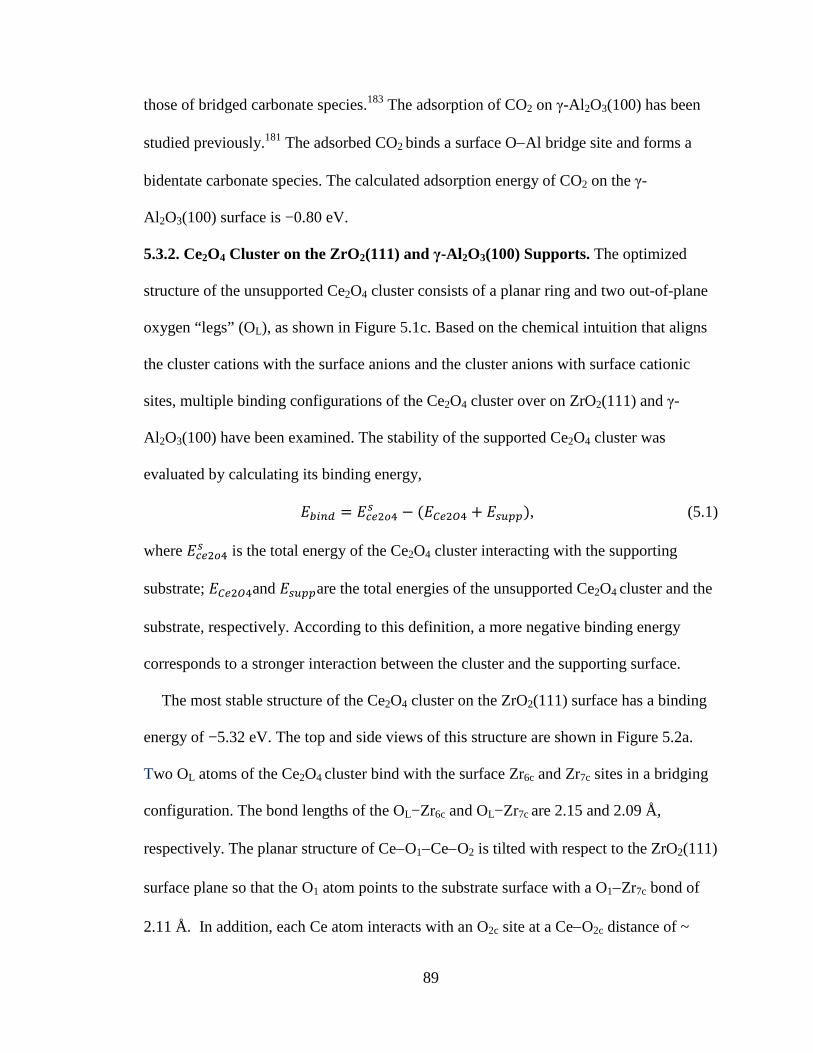
89
those of bridged carbonate species.183 The adsorption of CO2 on γ-Al 2O3(100) has been
studied previously.181 The adsorbed CO2 binds a surface O−Al bridge site and forms a
bidentate carbonate species. The calculated adsorption energy of CO2 on the γ-
Al 2O3(100) surface is −0.80 eV.
5.3.2. Ce2O4 Cluster on the ZrO2(111) and γ-Al 2O3(100) Supports. The optimized
structure of the unsupported Ce2O4 cluster consists of a planar ring and two out-of-plane
oxygen “legs” (OL), as shown in Figure 5.1c. Based on the chemical intuition that aligns
the cluster cations with the surface anions and the cluster anions with surface cationic
sites, multiple binding configurations of the Ce2O4 cluster over on ZrO2(111) and γ-
Al 2O3(100) have been examined. The stability of the supported Ce2O4 cluster was
evaluated by calculating its binding energy,
��GI� � �SP�£c� � ���P��c � ������, (5.1)
where �SP�£c� is the total energy of the Ce2O4 cluster interacting with the supporting
substrate; ��P��cand �����are the total energies of the unsupported Ce2O4 cluster and the
substrate, respectively. According to this definition, a more negative binding energy
corresponds to a stronger interaction between the cluster and the supporting surface.
The most stable structure of the Ce2O4 cluster on the ZrO2(111) surface has a binding
energy of −5.32 eV. The top and side views of this structure are shown in Figure 5.2a.
Two OL atoms of the Ce2O4 cluster bind with the surface Zr6c and Zr7c sites in a bridging
configuration. The bond lengths of the OL−Zr6c and OL−Zr7c are 2.15 and 2.09 Å,
respectively. The planar structure of Ce−O1−Ce−O2 is tilted with respect to the ZrO2(111)
surface plane so that the O1 atom points to the substrate surface with a O1−Zr7c bond of
2.11 Å. In addition, each Ce atom interacts with an O2c site at a Ce−O2c distance of ~
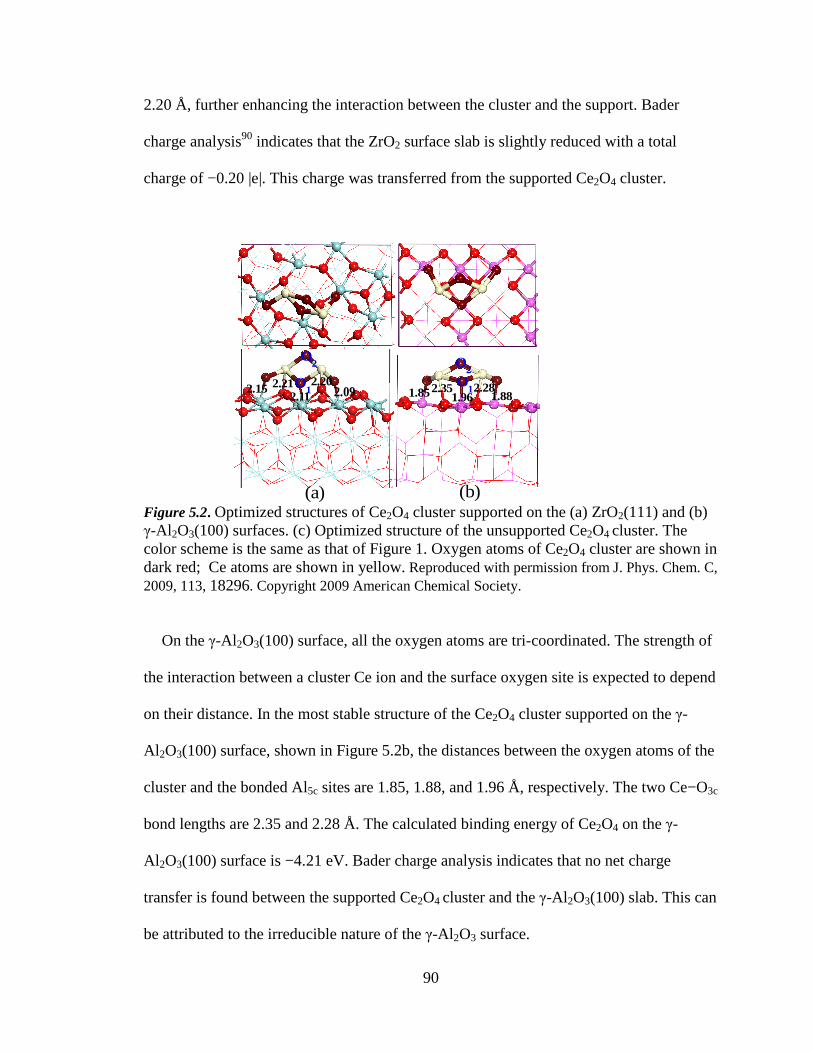
90
2.20 Å, further enhancing the interaction between the cluster and the support. Bader
charge analysis90 indicates that the ZrO2 surface slab is slightly reduced with a total
charge of −0.20 |e|. This charge was transferred from the supported Ce2O4 cluster.
2.09
O2 O
2O
1O
12.15 2.212.11
2.20
(a) (b)
1.852.351.96
2.281.88
Figure 5.2. Optimized structures of Ce2O4 cluster supported on the (a) ZrO2(111) and (b) γ-Al 2O3(100) surfaces. (c) Optimized structure of the unsupported Ce2O4 cluster. The color scheme is the same as that of Figure 1. Oxygen atoms of Ce2O4 cluster are shown in dark red; Ce atoms are shown in yellow. Reproduced with permission from J. Phys. Chem. C, 2009, 113, 18296. Copyright 2009 American Chemical Society.
On the γ-Al 2O3(100) surface, all the oxygen atoms are tri-coordinated. The strength of
the interaction between a cluster Ce ion and the surface oxygen site is expected to depend
on their distance. In the most stable structure of the Ce2O4 cluster supported on the γ-
Al 2O3(100) surface, shown in Figure 5.2b, the distances between the oxygen atoms of the
cluster and the bonded Al5c sites are 1.85, 1.88, and 1.96 Å, respectively. The two Ce−O3c
bond lengths are 2.35 and 2.28 Å. The calculated binding energy of Ce2O4 on the γ-
Al 2O3(100) surface is −4.21 eV. Bader charge analysis indicates that no net charge
transfer is found between the supported Ce2O4 cluster and the γ-Al 2O3(100) slab. This can
be attributed to the irreducible nature of the γ-Al 2O3 surface.
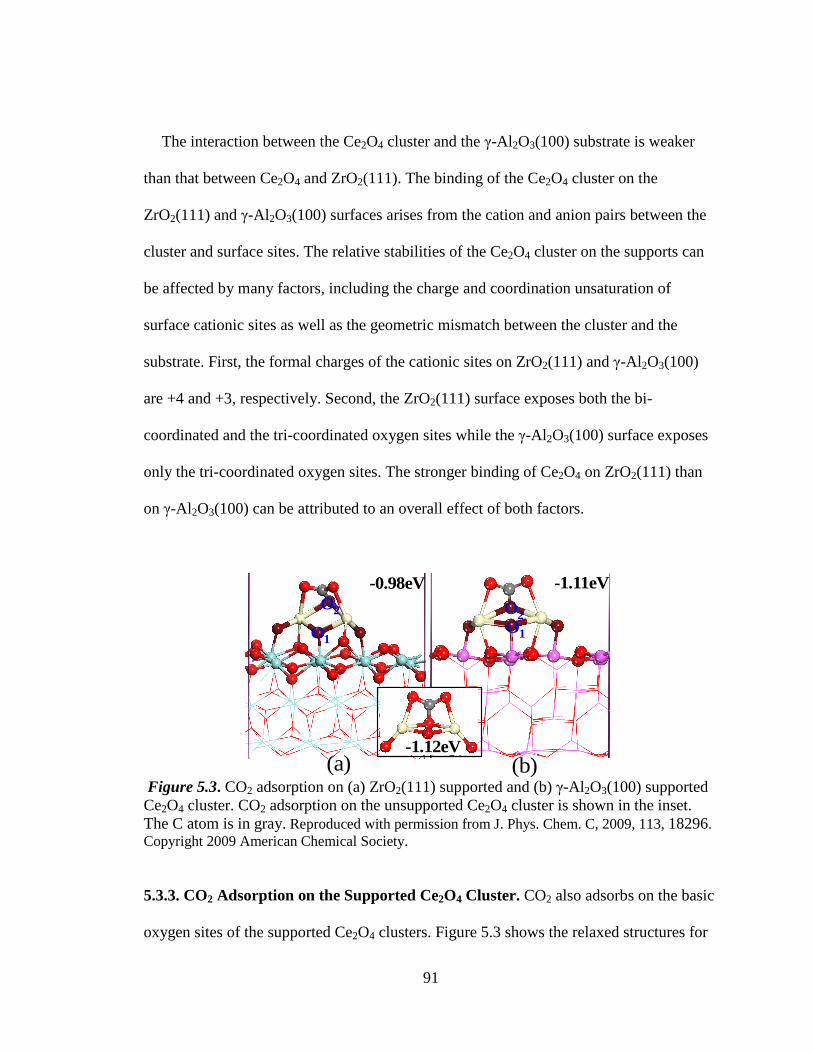
91
The interaction between the Ce2O4 cluster and the γ-Al 2O3(100) substrate is weaker
than that between Ce2O4 and ZrO2(111). The binding of the Ce2O4 cluster on the
ZrO2(111) and γ-Al 2O3(100) surfaces arises from the cation and anion pairs between the
cluster and surface sites. The relative stabilities of the Ce2O4 cluster on the supports can
be affected by many factors, including the charge and coordination unsaturation of
surface cationic sites as well as the geometric mismatch between the cluster and the
substrate. First, the formal charges of the cationic sites on ZrO2(111) and γ-Al 2O3(100)
are +4 and +3, respectively. Second, the ZrO2(111) surface exposes both the bi-
coordinated and the tri-coordinated oxygen sites while the γ-Al 2O3(100) surface exposes
only the tri-coordinated oxygen sites. The stronger binding of Ce2O4 on ZrO2(111) than
on γ-Al 2O3(100) can be attributed to an overall effect of both factors.
(a) (b)
-0.98eV -1.11eV
O1O1
O2 O2
-1.12eV
Figure 5.3. CO2 adsorption on (a) ZrO2(111) supported and (b) γ-Al 2O3(100) supported Ce2O4 cluster. CO2 adsorption on the unsupported Ce2O4 cluster is shown in the inset. The C atom is in gray. Reproduced with permission from J. Phys. Chem. C, 2009, 113, 18296. Copyright 2009 American Chemical Society.
5.3.3. CO2 Adsorption on the Supported Ce2O4 Cluster. CO2 also adsorbs on the basic
oxygen sites of the supported Ce2O4 clusters. Figure 5.3 shows the relaxed structures for
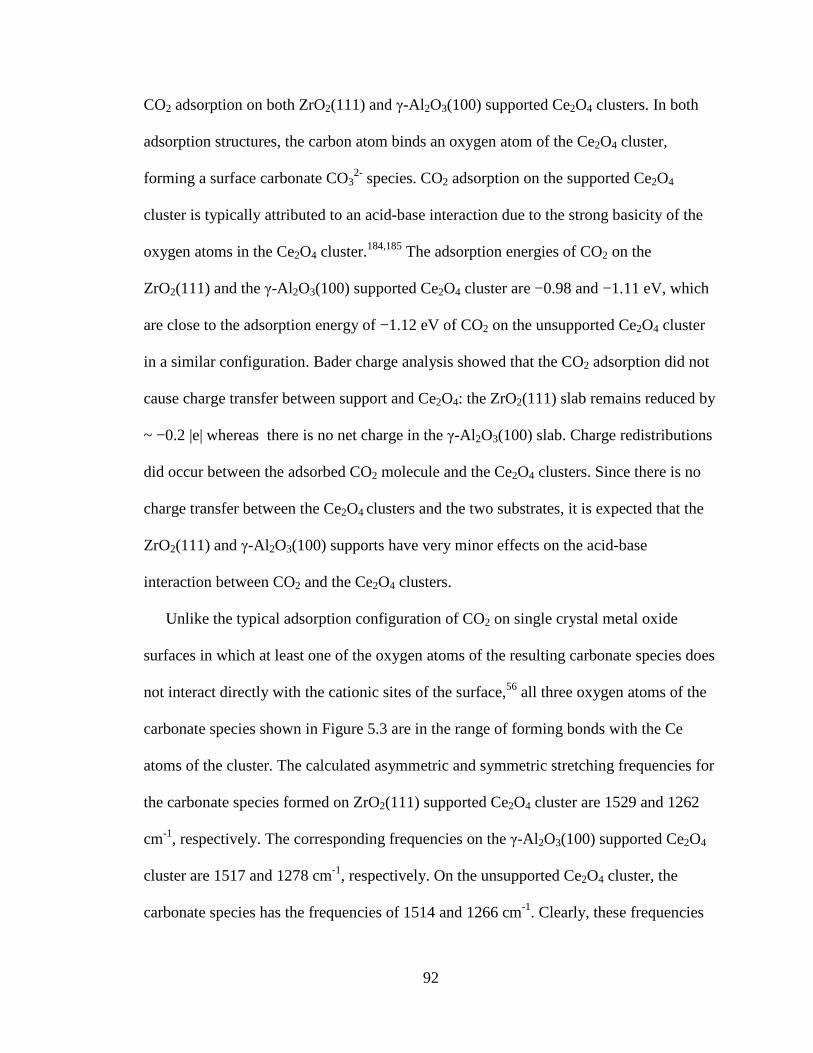
92
CO2 adsorption on both ZrO2(111) and γ-Al 2O3(100) supported Ce2O4 clusters. In both
adsorption structures, the carbon atom binds an oxygen atom of the Ce2O4 cluster,
forming a surface carbonate CO32- species. CO2 adsorption on the supported Ce2O4
cluster is typically attributed to an acid-base interaction due to the strong basicity of the
oxygen atoms in the Ce2O4 cluster.184,185 The adsorption energies of CO2 on the
ZrO2(111) and the γ-Al 2O3(100) supported Ce2O4 cluster are −0.98 and −1.11 eV, which
are close to the adsorption energy of −1.12 eV of CO2 on the unsupported Ce2O4 cluster
in a similar configuration. Bader charge analysis showed that the CO2 adsorption did not
cause charge transfer between support and Ce2O4: the ZrO2(111) slab remains reduced by
~ −0.2 |e| whereas there is no net charge in the γ-Al 2O3(100) slab. Charge redistributions
did occur between the adsorbed CO2 molecule and the Ce2O4 clusters. Since there is no
charge transfer between the Ce2O4 clusters and the two substrates, it is expected that the
ZrO2(111) and γ-Al 2O3(100) supports have very minor effects on the acid-base
interaction between CO2 and the Ce2O4 clusters.
Unlike the typical adsorption configuration of CO2 on single crystal metal oxide
surfaces in which at least one of the oxygen atoms of the resulting carbonate species does
not interact directly with the cationic sites of the surface,56 all three oxygen atoms of the
carbonate species shown in Figure 5.3 are in the range of forming bonds with the Ce
atoms of the cluster. The calculated asymmetric and symmetric stretching frequencies for
the carbonate species formed on ZrO2(111) supported Ce2O4 cluster are 1529 and 1262
cm-1, respectively. The corresponding frequencies on the γ-Al 2O3(100) supported Ce2O4
cluster are 1517 and 1278 cm-1, respectively. On the unsupported Ce2O4 cluster, the
carbonate species has the frequencies of 1514 and 1266 cm-1. Clearly, these frequencies
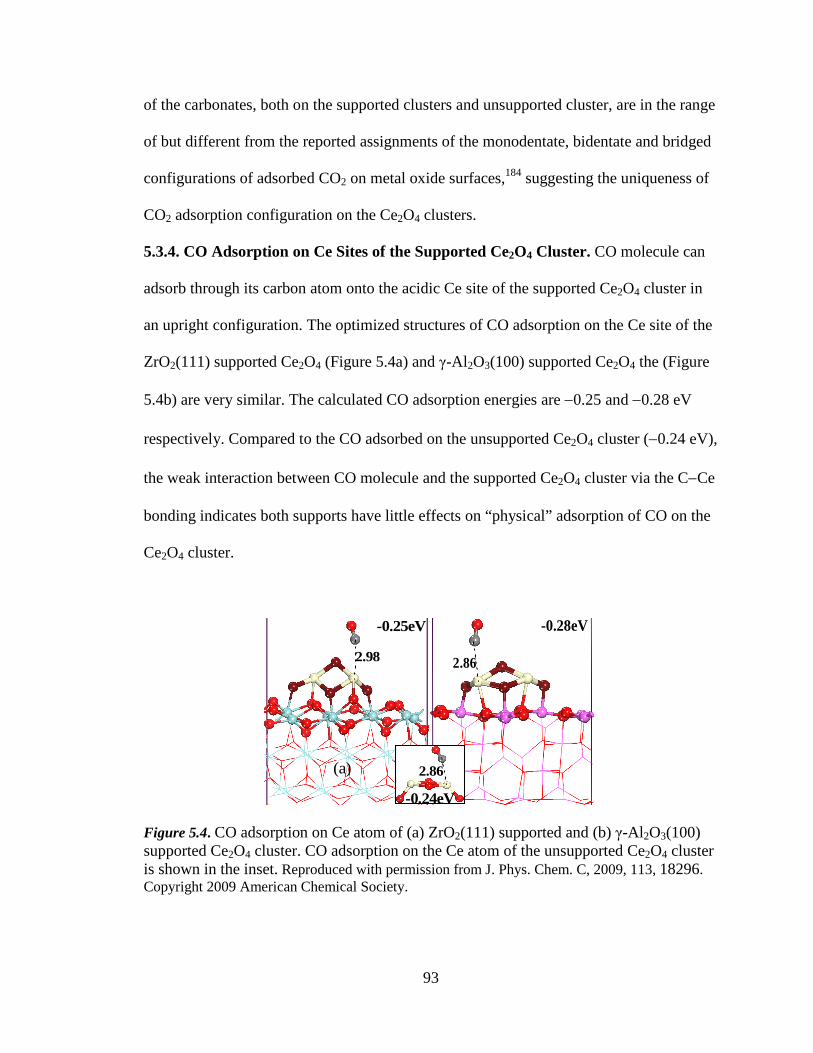
93
of the carbonates, both on the supported clusters and unsupported cluster, are in the range
of but different from the reported assignments of the monodentate, bidentate and bridged
configurations of adsorbed CO2 on metal oxide surfaces,184 suggesting the uniqueness of
CO2 adsorption configuration on the Ce2O4 clusters.
5.3.4. CO Adsorption on Ce Sites of the Supported Ce2O4 Cluster. CO molecule can
adsorb through its carbon atom onto the acidic Ce site of the supported Ce2O4 cluster in
an upright configuration. The optimized structures of CO adsorption on the Ce site of the
ZrO2(111) supported Ce2O4 (Figure 5.4a) and γ-Al 2O3(100) supported Ce2O4 the (Figure
5.4b) are very similar. The calculated CO adsorption energies are −0.25 and −0.28 eV
respectively. Compared to the CO adsorbed on the unsupported Ce2O4 cluster (−0.24 eV),
the weak interaction between CO molecule and the supported Ce2O4 cluster via the C−Ce
bonding indicates both supports have little effects on “physical” adsorption of CO on the
Ce2O4 cluster.
(b)
2.98
-0.25eV
(a)
2.86
-0.28eV
2.86
-0.24eV
Figure 5.4. CO adsorption on Ce atom of (a) ZrO2(111) supported and (b) γ-Al 2O3(100) supported Ce2O4 cluster. CO adsorption on the Ce atom of the unsupported Ce2O4 cluster is shown in the inset. Reproduced with permission from J. Phys. Chem. C, 2009, 113, 18296. Copyright 2009 American Chemical Society.
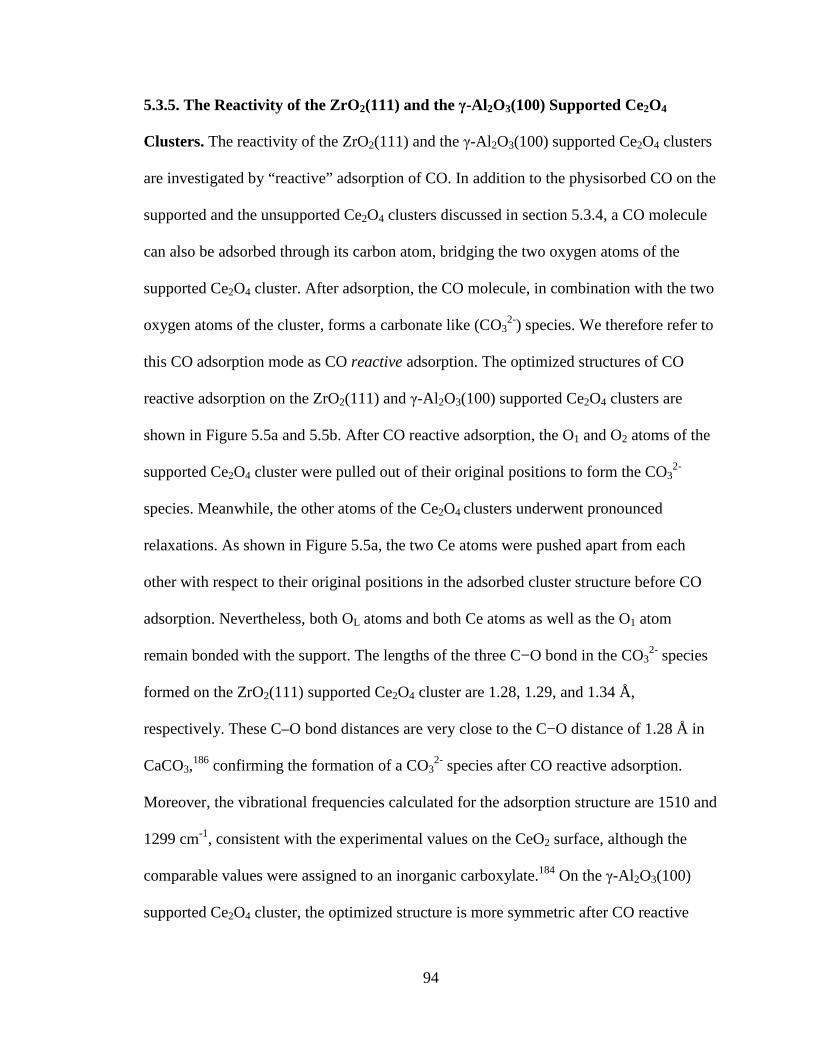
94
5.3.5. The Reactivity of the ZrO2(111) and the γ-Al 2O3(100) Supported Ce2O4
Clusters. The reactivity of the ZrO2(111) and the γ-Al 2O3(100) supported Ce2O4 clusters
are investigated by “reactive” adsorption of CO. In addition to the physisorbed CO on the
supported and the unsupported Ce2O4 clusters discussed in section 5.3.4, a CO molecule
can also be adsorbed through its carbon atom, bridging the two oxygen atoms of the
supported Ce2O4 cluster. After adsorption, the CO molecule, in combination with the two
oxygen atoms of the cluster, forms a carbonate like (CO32-) species. We therefore refer to
this CO adsorption mode as CO reactive adsorption. The optimized structures of CO
reactive adsorption on the ZrO2(111) and γ-Al 2O3(100) supported Ce2O4 clusters are
shown in Figure 5.5a and 5.5b. After CO reactive adsorption, the O1 and O2 atoms of the
supported Ce2O4 cluster were pulled out of their original positions to form the CO32-
species. Meanwhile, the other atoms of the Ce2O4 clusters underwent pronounced
relaxations. As shown in Figure 5.5a, the two Ce atoms were pushed apart from each
other with respect to their original positions in the adsorbed cluster structure before CO
adsorption. Nevertheless, both OL atoms and both Ce atoms as well as the O1 atom
remain bonded with the support. The lengths of the three C−O bond in the CO32- species
formed on the ZrO2(111) supported Ce2O4 cluster are 1.28, 1.29, and 1.34 Å,
respectively. These C–O bond distances are very close to the C−O distance of 1.28 Å in
CaCO3,186 confirming the formation of a CO3
2- species after CO reactive adsorption.
Moreover, the vibrational frequencies calculated for the adsorption structure are 1510 and
1299 cm-1, consistent with the experimental values on the CeO2 surface, although the
comparable values were assigned to an inorganic carboxylate.184 On the γ-Al 2O3(100)
supported Ce2O4 cluster, the optimized structure is more symmetric after CO reactive
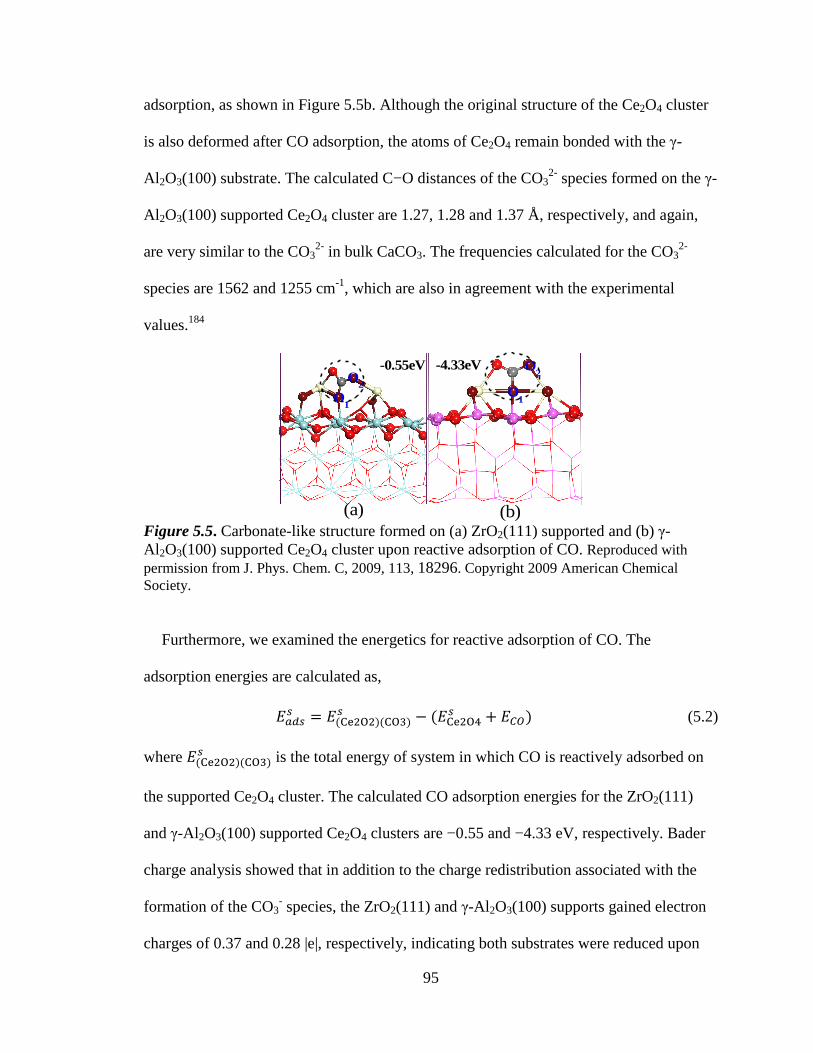
95
adsorption, as shown in Figure 5.5b. Although the original structure of the Ce2O4 cluster
is also deformed after CO adsorption, the atoms of Ce2O4 remain bonded with the γ-
Al 2O3(100) substrate. The calculated C−O distances of the CO32- species formed on the γ-
Al 2O3(100) supported Ce2O4 cluster are 1.27, 1.28 and 1.37 Å, respectively, and again,
are very similar to the CO32- in bulk CaCO3. The frequencies calculated for the CO3
2-
species are 1562 and 1255 cm-1, which are also in agreement with the experimental
values.184
(b)(a)
O1
O1
O2
O2
-4.33eV-0.55eV
Figure 5.5. Carbonate-like structure formed on (a) ZrO2(111) supported and (b) γ-Al 2O3(100) supported Ce2O4 cluster upon reactive adsorption of CO. Reproduced with permission from J. Phys. Chem. C, 2009, 113, 18296. Copyright 2009 American Chemical Society.
Furthermore, we examined the energetics for reactive adsorption of CO. The
adsorption energies are calculated as,
�z��� � ��¤$�¥���¤¥&�
� � ��¤$�¥c� � ���� (5.2)
where ��¤$�¥���¤¥&�� is the total energy of system in which CO is reactively adsorbed on
the supported Ce2O4 cluster. The calculated CO adsorption energies for the ZrO2(111)
and γ-Al 2O3(100) supported Ce2O4 clusters are −0.55 and −4.33 eV, respectively. Bader
charge analysis showed that in addition to the charge redistribution associated with the
formation of the CO3- species, the ZrO2(111) and γ-Al 2O3(100) supports gained electron
charges of 0.37 and 0.28 |e|, respectively, indicating both substrates were reduced upon
96
CO adsorption. In the case of ZrO2(111), CO adsorption makes the substrate further
reduced with respect to the substrate only supporting the Ce2O4 cluster. We expected the
contributions from the CO−Ce2O4 interaction to CO adsorption energies to be similar
since CO only interacts directly with the Ce2O4 clusters in both systems. Such a
significant difference in CO adsorption energies was, therefore, not anticipated. The
obvious difference between the two systems is the substrate: zirconia is reducible
whereas alumina is not. As a reference, we calculated the reactive adsorption of CO on
the unsupported Ce2O4 cluster. The optimized adsorption structure is similar to those of
the Ce2O4-CO fragments in Figure 5.5a and b. The adsorption energy is −2.60 eV
according to
�z�� � ��¤$�¥���¤¥&� � ���P��c � ���� (5.3)
where ��¤$�¥���¤¥&� is the total energy of reactively adsorbed CO on the unsupported
Ce2O4 cluster. If we use the adsorption energy on the unsupported Ce2O4 as a reference,
the two supports will have an opposite effect on the CO reactive adsorption: the
adsorption energy is decreased with ZrO2(111) being the support but increased with γ-
Al 2O3(100) as the support.
CO
CO
support supportEbind
Eads
Eadss
Eint
Scheme 5.1. Thermodynamic cycle of CO reactive adsorption on the supported Ce2O4 cluster. Reproduced with permission from J. Phys. Chem. C, 2009, 113, 18296. Copyright 2009 American Chemical Society.
To understand the origin of the dramatic difference between the ZrO2(111) and γ-
Al 2O3(100) supported Ce2O4 cluster towards CO reactive adsorption, we constructed a
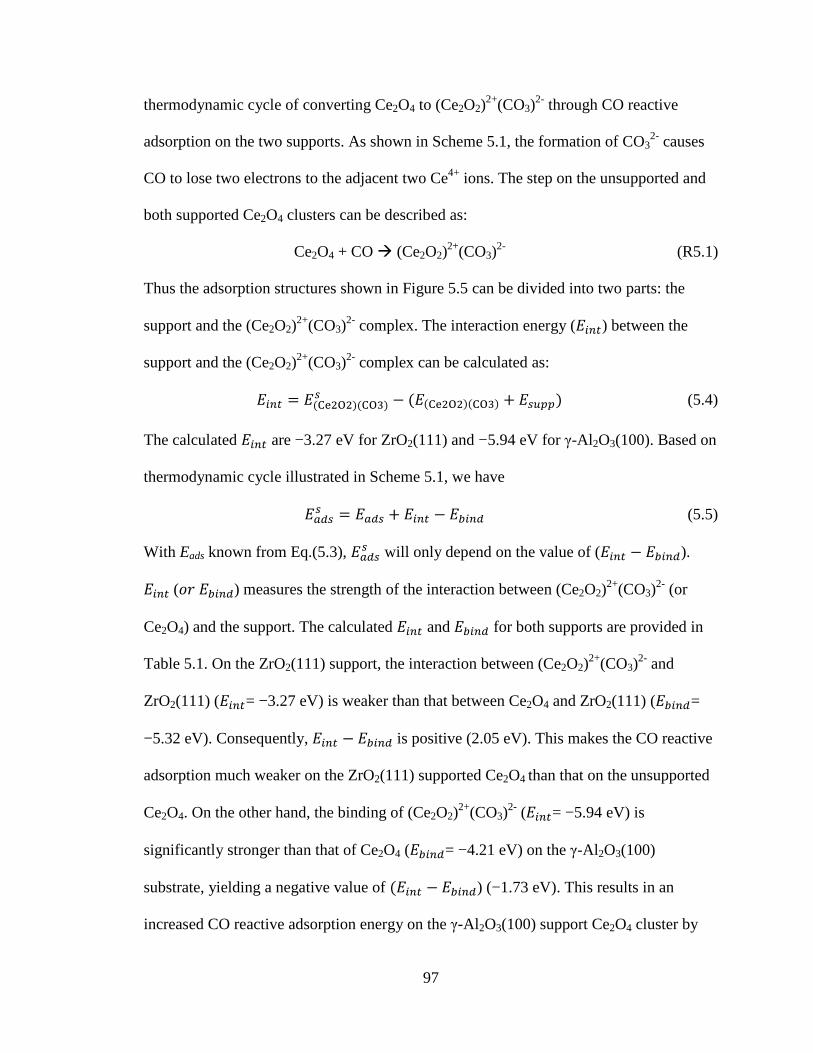
97
thermodynamic cycle of converting Ce2O4 to (Ce2O2)2+(CO3)
2- through CO reactive
adsorption on the two supports. As shown in Scheme 5.1, the formation of CO32- causes
CO to lose two electrons to the adjacent two Ce4+ ions. The step on the unsupported and
both supported Ce2O4 clusters can be described as:
Ce2O4 + CO � (Ce2O2)2+(CO3)
2- (R5.1)
Thus the adsorption structures shown in Figure 5.5 can be divided into two parts: the
support and the (Ce2O2)2+(CO3)
2- complex. The interaction energy (�GI ) between the
support and the (Ce2O2)2+(CO3)
2- complex can be calculated as:
�GI � ��¤$�¥���¤¥&�� � ���¤$�¥���¤¥&� � ������ (5.4)
The calculated �GI are −3.27 eV for ZrO2(111) and −5.94 eV for γ-Al 2O3(100). Based on
thermodynamic cycle illustrated in Scheme 5.1, we have
�z��� � �z�� � �GI � ��GI� (5.5)
With Eads known from Eq.(5.3), �z��� will only depend on the value of (�GI � ��GI�).
�GI (¦� ��GI�) measures the strength of the interaction between (Ce2O2)2+(CO3)
2- (or
Ce2O4) and the support. The calculated �GI and ��GI� for both supports are provided in
Table 5.1. On the ZrO2(111) support, the interaction between (Ce2O2)2+(CO3)
2- and
ZrO2(111) (�GI = −3.27 eV) is weaker than that between Ce2O4 and ZrO2(111) (��GI�=
−5.32 eV). Consequently, �GI � ��GI� is positive (2.05 eV). This makes the CO reactive
adsorption much weaker on the ZrO2(111) supported Ce2O4 than that on the unsupported
Ce2O4. On the other hand, the binding of (Ce2O2)2+(CO3)
2- (�GI = −5.94 eV) is
significantly stronger than that of Ce2O4 (��GI�= −4.21 eV) on the γ-Al 2O3(100)
substrate, yielding a negative value of ��GI � ��GI�) (−1.73 eV). This results in an
increased CO reactive adsorption energy on the γ-Al 2O3(100) support Ce2O4 cluster by
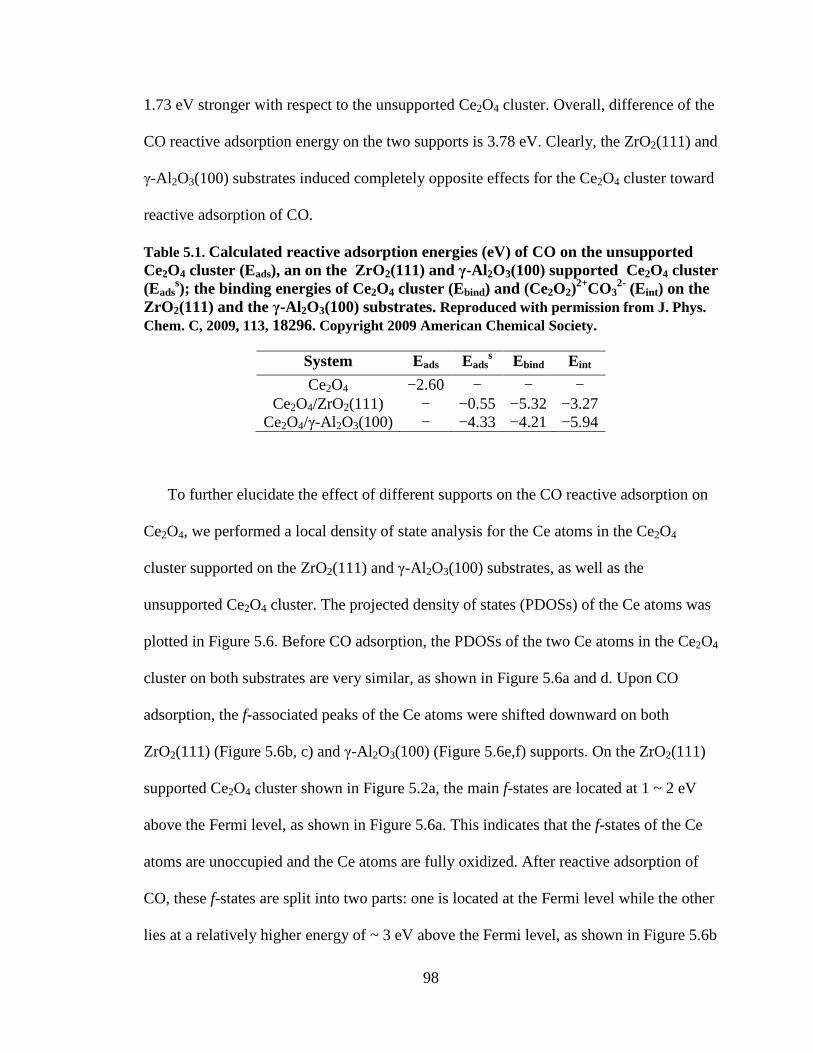
98
1.73 eV stronger with respect to the unsupported Ce2O4 cluster. Overall, difference of the
CO reactive adsorption energy on the two supports is 3.78 eV. Clearly, the ZrO2(111) and
γ-Al 2O3(100) substrates induced completely opposite effects for the Ce2O4 cluster toward
reactive adsorption of CO.
Table 5.1. Calculated reactive adsorption energies (eV) of CO on the unsupported Ce2O4 cluster (Eads), an on the ZrO2(111) and γ-Al 2O3(100) supported Ce2O4 cluster (Eads
s); the binding energies of Ce2O4 cluster (Ebind) and (Ce2O2)2+CO3
2- (Eint) on the ZrO 2(111) and the γ-Al 2O3(100) substrates. Reproduced with permission from J. Phys. Chem. C, 2009, 113, 18296. Copyright 2009 American Chemical Society.
System Eads Eadss Ebind Eint
Ce2O4 −2.60 − − − Ce2O4/ZrO2(111) − −0.55 −5.32 −3.27
Ce2O4/γ-Al 2O3(100) − −4.33 −4.21 −5.94
To further elucidate the effect of different supports on the CO reactive adsorption on
Ce2O4, we performed a local density of state analysis for the Ce atoms in the Ce2O4
cluster supported on the ZrO2(111) and γ-Al 2O3(100) substrates, as well as the
unsupported Ce2O4 cluster. The projected density of states (PDOSs) of the Ce atoms was
plotted in Figure 5.6. Before CO adsorption, the PDOSs of the two Ce atoms in the Ce2O4
cluster on both substrates are very similar, as shown in Figure 5.6a and d. Upon CO
adsorption, the f-associated peaks of the Ce atoms were shifted downward on both
ZrO2(111) (Figure 5.6b, c) and γ-Al 2O3(100) (Figure 5.6e,f) supports. On the ZrO2(111)
supported Ce2O4 cluster shown in Figure 5.2a, the main f-states are located at 1 ~ 2 eV
above the Fermi level, as shown in Figure 5.6a. This indicates that the f-states of the Ce
atoms are unoccupied and the Ce atoms are fully oxidized. After reactive adsorption of
CO, these f-states are split into two parts: one is located at the Fermi level while the other
lies at a relatively higher energy of ~ 3 eV above the Fermi level, as shown in Figure 5.6b
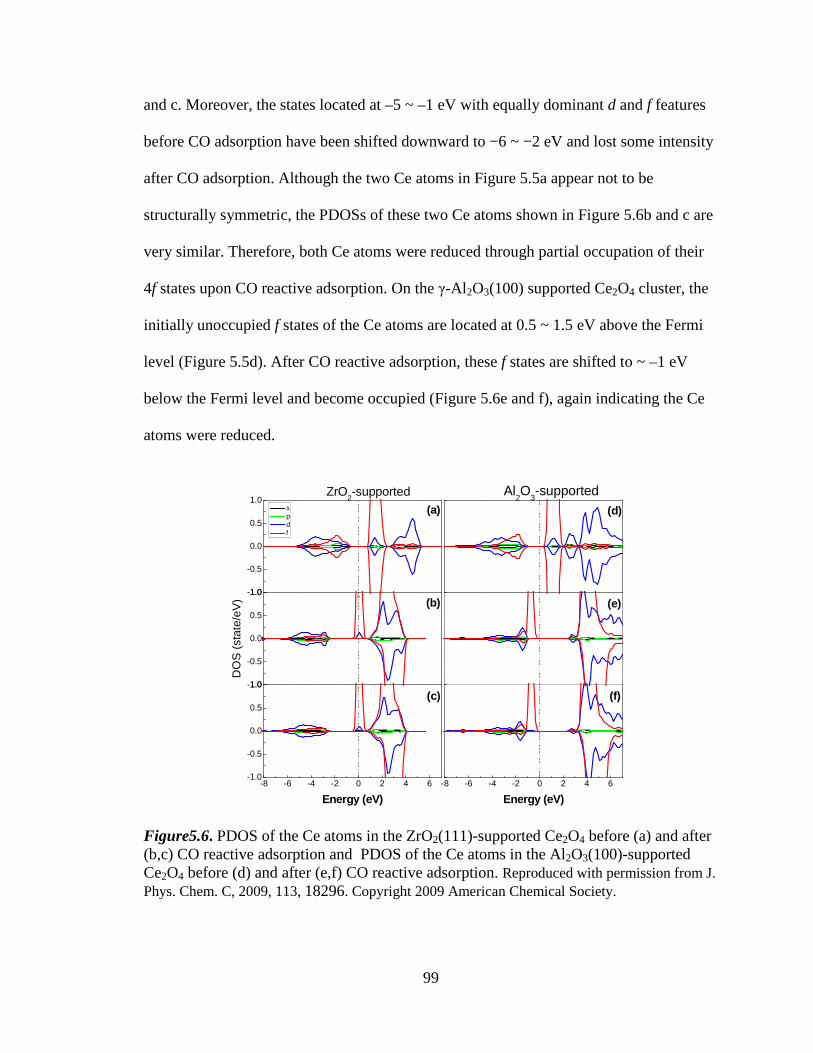
99
and c. Moreover, the states located at –5 ~ –1 eV with equally dominant d and f features
before CO adsorption have been shifted downward to −6 ~ −2 eV and lost some intensity
after CO adsorption. Although the two Ce atoms in Figure 5.5a appear not to be
structurally symmetric, the PDOSs of these two Ce atoms shown in Figure 5.6b and c are
very similar. Therefore, both Ce atoms were reduced through partial occupation of their
4f states upon CO reactive adsorption. On the γ-Al 2O3(100) supported Ce2O4 cluster, the
initially unoccupied f states of the Ce atoms are located at 0.5 ~ 1.5 eV above the Fermi
level (Figure 5.5d). After CO reactive adsorption, these f states are shifted to ~ –1 eV
below the Fermi level and become occupied (Figure 5.6e and f), again indicating the Ce
atoms were reduced.
-8 -6 -4 -2 0 2 4 6-8 -6 -4 -2 0 2 4 6-1.0
-0.5
0.0
0.5
1.0-1.0
-0.5
0.0
0.5
1.00
-1.0
-0.5
0.0
0.5
1.0
Energy (eV)
s p d f
Energy (eV)
Al2O
3-supported
DO
S (
stat
e/eV
)
ZrO2-supported
(a)
(b)
(c)
(d)
(e)
(f)
Figure5.6. PDOS of the Ce atoms in the ZrO2(111)-supported Ce2O4 before (a) and after (b,c) CO reactive adsorption and PDOS of the Ce atoms in the Al2O3(100)-supported Ce2O4 before (d) and after (e,f) CO reactive adsorption. Reproduced with permission from J. Phys. Chem. C, 2009, 113, 18296. Copyright 2009 American Chemical Society.
100
Figure 5.6 also shows the differences between the splits of states on the two supports.
On ZrO2(111), the occupied 4f states are located at the Fermi level and close to the
bottom of the conduction band. In contrast, these occupied states on γ-Al 2O3(100) are
located at the top of the occupied valance band and well-below the Fermi level. The
different characteristics of Ce 4f states on the two supporting oxides are likely results of
the different properties of the two oxides. The reducible ZrO2(111) destabilizes the
occupied Ce 4f states after reduction, and thereby, the (Ce2O2)2+(CO3)
2- intermediate, and
promotes the turnover of CO to CO2. On the other hand, the irreducible γ-Al 2O3(100)
stabilizes the occupied Ce 4f states, and consequently, the (Ce2O2)2+(CO3)
2- intermediate.
The high stability of the intermediate formed on γ-Al 2O3(100) makes the reaction
stagnate at the intermediate states and slows down the overall reaction.
The oxidation of CO has been frequently used as a probe reaction to investigate the
reactivity of ceria-based catalysts.153,156,157,165,187,188 It is believed that the lattice oxygen
acts as oxidant and the reaction occurs via the Mars-van Krevelen mechanism.149,150
Aneggi et al demonstrated that the reaction is surface structure sensitive.189 The
carbonate-like species have been proposed as likely intermediates during CO oxidation
over the ceria-based catalysts.189 In the following discussion, we demonstrate the support
effects on the reactivity of the Ce2O4 cluster for CO oxidation based on the formation of
the (Ce2O2)2+(CO3)
2- intermediate by analyzing the complete cycle on the ZrO2(111) and
γ-Al 2O3(100) supported, as well as the unsupported Ce2O4 clusters. The oxidation of CO
in these systems can be schematically decomposed into three steps, as shown in Figure
5.7a. In the first step, CO molecule adsorbs on the Ce2O4 cluster forming the carbonate-
like complex species. The first step is exothermic on Ce2O4 supported on both ZrO2(111)
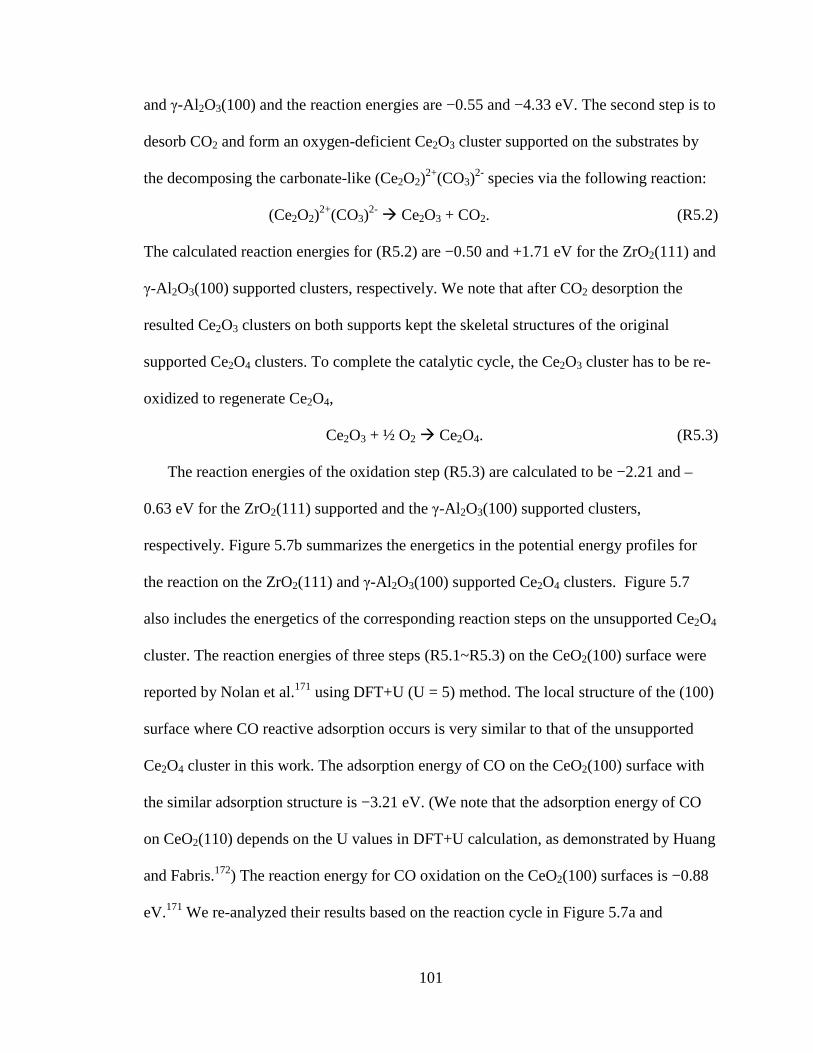
101
and γ-Al 2O3(100) and the reaction energies are −0.55 and −4.33 eV. The second step is to
desorb CO2 and form an oxygen-deficient Ce2O3 cluster supported on the substrates by
the decomposing the carbonate-like (Ce2O2)2+(CO3)
2- species via the following reaction:
(Ce2O2)2+(CO3)
2- � Ce2O3 + CO2. (R5.2)
The calculated reaction energies for (R5.2) are −0.50 and +1.71 eV for the ZrO2(111) and
γ-Al 2O3(100) supported clusters, respectively. We note that after CO2 desorption the
resulted Ce2O3 clusters on both supports kept the skeletal structures of the original
supported Ce2O4 clusters. To complete the catalytic cycle, the Ce2O3 cluster has to be re-
oxidized to regenerate Ce2O4,
Ce2O3 + ½ O2 � Ce2O4. (R5.3)
The reaction energies of the oxidation step (R5.3) are calculated to be −2.21 and –
0.63 eV for the ZrO2(111) supported and the γ-Al 2O3(100) supported clusters,
respectively. Figure 5.7b summarizes the energetics in the potential energy profiles for
the reaction on the ZrO2(111) and γ-Al 2O3(100) supported Ce2O4 clusters. Figure 5.7
also includes the energetics of the corresponding reaction steps on the unsupported Ce2O4
cluster. The reaction energies of three steps (R5.1~R5.3) on the CeO2(100) surface were
reported by Nolan et al.171 using DFT+U (U = 5) method. The local structure of the (100)
surface where CO reactive adsorption occurs is very similar to that of the unsupported
Ce2O4 cluster in this work. The adsorption energy of CO on the CeO2(100) surface with
the similar adsorption structure is −3.21 eV. (We note that the adsorption energy of CO
on CeO2(110) depends on the U values in DFT+U calculation, as demonstrated by Huang
and Fabris.172) The reaction energy for CO oxidation on the CeO2(100) surfaces is −0.88
eV.171 We re-analyzed their results based on the reaction cycle in Figure 5.7a and
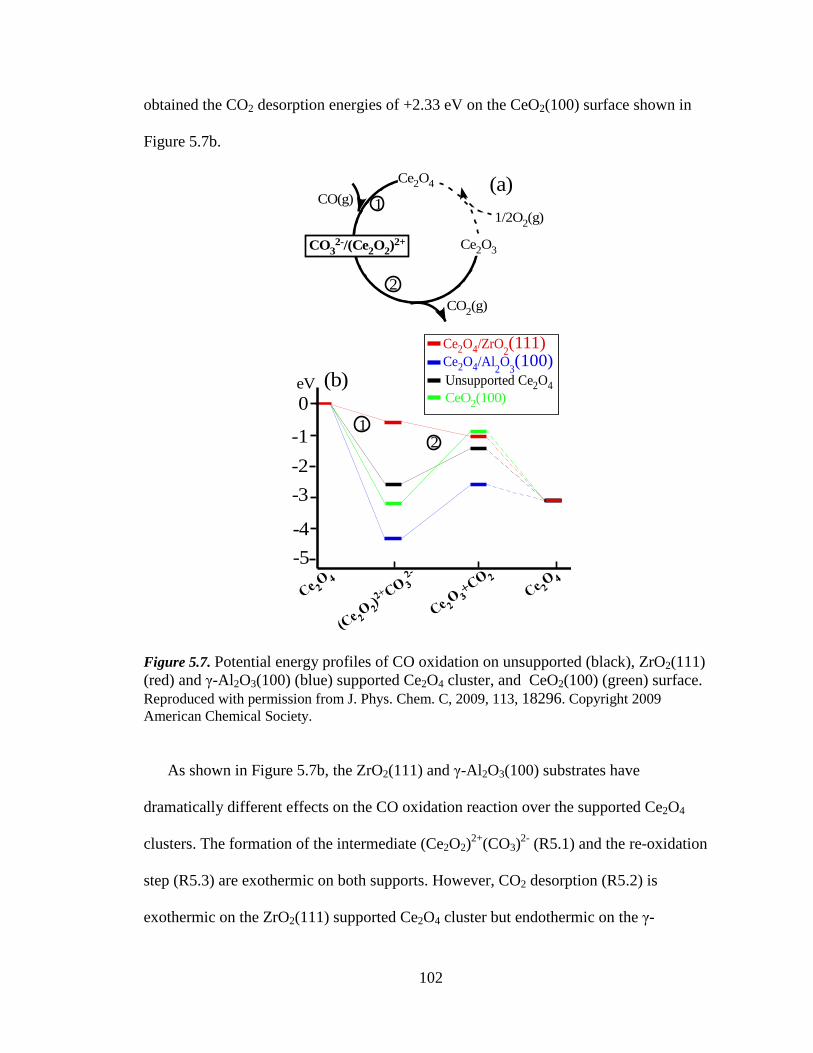
102
obtained the CO2 desorption energies of +2.33 eV on the CeO2(100) surface shown in
Figure 5.7b.
CO(g)1/2O2(g)
Unsupported Ce2O4
Ce2O4/ZrO2(111)
Ce2O4/Al2O
3(100)
0
-1
-2
-3
-4
-5
eV
(a)
(b)
1
2
12
CeO2(100)
Ce2O3
Ce2O4
CO32-/(Ce2O2)
2+
CO2(g)
Figure 5.7. Potential energy profiles of CO oxidation on unsupported (black), ZrO2(111) (red) and γ-Al 2O3(100) (blue) supported Ce2O4 cluster, and CeO2(100) (green) surface. Reproduced with permission from J. Phys. Chem. C, 2009, 113, 18296. Copyright 2009 American Chemical Society.
As shown in Figure 5.7b, the ZrO2(111) and γ-Al 2O3(100) substrates have
dramatically different effects on the CO oxidation reaction over the supported Ce2O4
clusters. The formation of the intermediate (Ce2O2)2+(CO3)
2- (R5.1) and the re-oxidation
step (R5.3) are exothermic on both supports. However, CO2 desorption (R5.2) is
exothermic on the ZrO2(111) supported Ce2O4 cluster but endothermic on the γ-
103
Al 2O3(100) supported Ce2O4 cluster. Although the reactive adsorption of CO is
energetically favorable over the γ-Al 2O3(100) supported Ce2O4, the extremely high
energy cost to desorb CO2 is expected to hinder the catalytic turnover. The CO2
desorption energy from the CeO2(100) surface is even higher. In fact, the formation of
carbonate-like species was observed experimentally after introducing CO into the system
and the CO conversion to CO2 is far less than 100%.165 This is concomitant to our results,
suggesting that CO2 desorption is the most likely rate-limiting step for CO oxidation in
ceria-based catalysts. Compared to the unsupported Ce2O4 cluster, our results predict a
negative effect of the γ-Al 2O3(100) support on CO oxidation. In contrast, all three steps
on the ZrO2(111) supported Ce2O4 cluster are exothermic. Therefore, we expect that the
ZrO2(111) substrate will promote the turnover of CO oxidation on the supported Ce2O4
cluster. These predictions are consistent with previous experimental observations. For
example, Aguila et al. studied the oxidation of CO on γ-Al 2O3, ZrO2 and SiO2 supported
CeO2 catalysts at low temparature.156 They reported a higher CO conversion on ZrO2
supported CeO2 catalyst than on the other two supports. Putna et al. investigated CO
oxidation on CeO2 thin films supported by α-Al 2O3 and polycrystalline ZrO2.162 They
found a significant fraction of CO was oxidized on the ZrO2 supported CeO2 thin film
whereas on the α-Al 2O3 supported CeO2 only very small fraction of CO was oxidized.
The lattice oxygen of the supported CeO2 islands was believed to be responsible for the
oxidation reaction.162 Although exact structures of the γ-Al 2O3, α-Al 2O3 and
polycrystalline ZrO2 supports used in those experiments are different from our model
Ce2O4/γ-Al 2O3(100) and Ce2O4/ZrO2(111), we believe that our models capture a key
aspect of those supported catalytic systems: the reducibility of the support. More
104
importantly, our results demonstrated the reactivity of the supported oxide clusters can be
manipulated by using different oxide substrates.
5.4 Conclusion
First-principles density functional theory calculations were used to examine the effect
of ZrO2(111) and γ-Al 2O3(100) as supports on the reactivity of the Ce2O4 clusters for CO
oxidation. Our results showed that the supports do not affect the acid-base interaction, as
manifested by the adsorption CO2 and CO in upright configuration. However, for the
reactive adsorption of CO, the two substrates were found to have very different impacts
on the reaction energies. The reactive adsorption of CO leads to a (Ce2O2)2+(CO3)
2-
species with adsorption energies of –0.55 eV and –4.33 eV, on ZrO2(111) and γ-
Al 2O3(100) supported Ce2O4, respectively. The results were analyzed in the context of
catalytic oxidation of CO by ceria. ZrO2 is expected to be a more active support due to
the relatively smooth potential energy profile. On the other hand, the γ-Al 2O3(100)-
supported ceria is likely to be less efficient due to the formation of the highly stable
(Ce2O2)2+(CO3)
2- intermediate. The results suggest that the catalytic properties can be
tailored by varying the supports.
105
CHAPTER 6
SUMMARY
As illustrated in the above three chapters, by choosing the proper model and
theoretical method, the performance of heterogeneous catalyst systems can be studied as
a function of chemical composition, molecular structure and electronic structure. Unlike
experimental measurements, where the data reveal only the average of a sample, the
theoretical modeling is proved to be able to pin down to the active site and yield
important structural, electronic and energetic information of the reaction. Furthermore, as
the metal-on-oxide systems have been intensely studied in the past decade, to our best
knowledge the modeling of an oxide-on-oxide system presented in this dissertation was
the first. We hope our work will shed light on even broader studies of similar highly
dispersed catalytic systems.
106
BIBLIOGRAPHY (1) Thomas, J. M.; Thomas, W. J. Principles and practice of heterogeneous
catalysis; Wiley-VCH, First Edition (1967), Second Edition (1997).
(2) Heck, R. M.; Farrauto, R. J.; Gulati, S. T. Catalytic air pollution control:
Commertial technology 3rd ed.; Wiley, 2009.
(3) Steele, B. C. H.; Heinzel, A. Nature 2001, 414, 345.
(4) Hove, M. A. V.; Weinberg, W. H.; Chan, C.-M. Low-energy diffraction;
Springer Verlag, 1986.
(5) Goodman, P. Fifty years of electron diffraction; D. Reidel Publishing,
1981.
(6) Pendry, J. B. Low energy electron diffraction; Academic Press, 1974.
(7) Binnig, G.; Rohrer, H.; Gerber, C.; Weibel, E. Phys. Rev. Lett. 1982, 49,
57.
(8) Tersoff, J.; Hamann, D. R. Phys. Rev. B 1985, 31, 805.
(9) Bining, G.; Rohrer, H.; Gerber, C.; Weibel, E. Appl. Phys. Lett. 1982, 40,
178.
(10) Humphris, A. D. L.; Miles, M. J.; Hobbs, J. K. Appl. Phys. Lett. 2005, 86.
(11) Roiter, Y.; Minko, S. J. Am. Chem. Soc. 2005, 127, 15688.
(12) Campbell, C. T. J. Chem. Soc. Faraday Trans. 1996, 92, 1435.
(13) Freund, H. J.; Kuhlenbeck, H.; Neumann, M. Adsorption on ordered
surfaces of ionic solids and thin films; Springer-Verlab: Berlin, 1993; Vol. 33.
(14) Henrich, V. E.; Cox, P. A. The surface science of metal oxides; Cambridge
University Press: Cambridge, U.K., 1994.
107
(15) Goodman, D. W. Chem. Rev. 1995, 95, 523.
(16) Campbell, C. T. Surf. Sci. Rep. 1997, 27, 1.
(17) Gunter, P. L. J.; Niemantsverdriet, J. W.; Ribeiro, F. H.; Somorjai, G. A.
Catal. Rev.-Sci. Eng. 1997, 39, 77.
(18) Freund, H. J.; Kuhlenbeck, H.; Staemmler, V. Rep. Prog. Phys. 1996, 59,
283.
(19) Segre, E. From falling bodies to radio waves: Classical physicists and
their discoveries; W. H. Freeman and Company, 1984.
(20) Schrodinger, E. Am. Physik 1926, 79, 361.
(21) Hohenberg, P.; Kohn, W. Phys. Rev. 1964, 136, B864
(22) Kohn, W.; Sham, L. J. Phys. Rev. 1965, 140, A1133.
(23) Teller, E. Rev. Mod. Phys. 1962, 34, 627.
(24) Balazs, N. Phys. Rev. 1967, 156, 42.
(25) Hartree, D. R. Proc. Camb. Phil. Soc 1930, 24, 89.
(26) Fock, F. Zs. f. Phys 1930, 61, 126.
(27) Wingner, E. P. Faraday Soc. 1938, 34, 678.
(28) Perdew, J. P.; Kurth, S. Density functionals: Theory and applications;
Springer: Berlin, 1998.
(29) Becke, A. D. J. Chem. Phys. 1993, 98, 1372.
(30) Kim, K.; Jordan, K. D. J. Phys. Chem. 1994, 98, 10089.
(31) Stephens, P. J.; Devlin, F. J.; Chabalowski, C. F.; Frisch, M. J. J. Phys.
Chem. 1994, 98, 11623.
(32) Runge, E.; Gross, E. K. U. Phys, Rev. Lett. 1984, 52, 997.

108
(33) Car, R.; Parrinello, M. Phys. Rev. Lett. 1985, 55, 2471.
(34) Arrhenius, S. J. Phys. Chem 1889, 4, 226.
(35) Eyring, H. J. Chem.Phys 1935, 3, 107.
(36) Eyring, H. Chem. Rev. 1935, 17, 65.
(37) Evans, M. G.; Polanyi, M. Trans. Faraday Soc. 1935, 31, 875.
(38) Wigner, E. J. Chem.Phys 1937, 5, 720.
(39) Keck, J. C. Adv. Chem. Phys. 1967, 13, 85.
(40) Marcus, R. A.; Rice, O. K. J. Phys. Chem. 1951, 55, 894.
(41) Marcus, R. A. J. Chem. Phys. 1952, 20, 359.
(42) Wieder, G. M.; Marcus, R. A. J. Chem. Phys. 1962, 37, 1835.
(43) Rosentock, H. M.; Wallenstein, M. B.; Wahrhaftig, A. L.; Eyring, H.
Proc. Natl. Acad. Sci 1952, 38, 667.
(44) Henkelman, G.; Jonsson, H. J. Chem. Phys. 2000, 113, 9978.
(45) Henkelman, G.; Uberuaga, B. P.; Jonsson, H. J. Chem. Phys. 2000, 113,
9901.
(46) Bader, R. F. W. Atoms in molecules - a quantum theory; Oxford
University Press: Oxford, 1990.
(47) Henkelman, G.; Arnaldsson, A.; Jonsson, H. Comp. Mater. Sci. 2006, 36,
354.
(48) Takahashi, N.; Shinjoh, H.; Iijima, T.; Suzuki, T.; Yamazaki, K.; Yokota,
K.; Suzuki, H.; Miyoshi, N.; Matsumoto, S.; Tanizawa, T.; Tanaka, T.; Tateishi, S.;
Kasahara, K. Catal. Today 1996, 27, 63.
(49) Liu, Z. M.; Woo, S. I. Catal. Rev.-Sci. Eng. 2006, 48, 43.
109
(50) William s. Epling, L. E. C. Catal. Today 2004, 96, 21.
(51) Burcham, L. J.; Wachs, I. E. Catal. Today 1999, 49, 467.
(52) Olsson, L.; Westerberg, B.; Persson, H.; Fridell, E.; Skoglundh, M.;
Andersson, B. J. Phys. Chem. B 1999, 103, 10433.
(53) Fridell, E.; Persson, H.; Westerberg, B.; Olsson, L.; Skoglundh, M. Catal.
Lett. 2000, 66, 71.
(54) Mahzoul, H.; Brilhac, J. F.; Gilot, P. Appl. Catal. B-Environ. 1999, 20, 47.
(55) Lietti, L.; Forzatti, P.; Nova, I.; Tronconi, E. J. Catal. 2001, 204, 175.
(56) Cant, N. W.; Patterson, M. J. Catal. Today 2002, 73, 271.
(57) Stone, P.; Ishii, M.; Bowker, M. Surf. Sci. 2003, 537, 179.
(58) Casapu, M.; Grunwaldt, J. D.; Maciejewski, M.; Wittrock, M.; Gobel, U.;
Baiker, A. Appl. Catal. B-Environ. 2006, 63, 232.
(59) Szailer, T.; Kwak, J. H.; Kim, D. H.; Hanson, J. C.; Peden, C. H. F.;
Szanyi, J. J. Catal. 2006, 239, 51.
(60) Szanyi, J.; Kwak, J. H.; Kim, D. H.; Burton, S. D.; Peden, C. H. F. J.
Phys. Chem. B 2005, 109, 27.
(61) Broqvist, P.; Panas, I.; Fridell, E.; Persson, H. J. Phys. Chem. B 2002, 106,
137.
(62) Karlsen, E. J.; Nygren, M. A.; Pettersson, L. G. M. J. Phys. Chem. B 2003,
107, 7795.
(63) Schneider, W. F. J. Phys. Chem. B 2004, 108, 273.
(64) Branda, M. M.; Di Valentin, C.; Pacchioni, G. J. Phys. Chem. B 2004,
108, 4752.
110
(65) Broqvist, P.; Gronbeck, H.; Fridell, E.; Panas, I. Catal. Today 2004, 96,
71.
(66) Broqvist, P.; Panas, I.; Gronbeck, H. J. Phys. Chem. B 2005, 109, 15410.
(67) Gronbeck, H.; Broqvist, P.; Panas, I. Surf. Sci. 2006, 600, 403.
(68) Tutuianu, M.; Inderwildi, O. R.; Bessler, W. G.; Warnatz, J. J. Phys.
Chem. B 2006, 110, 17484.
(69) Broqvist, P.; Gronbeck, H.; Fridell, E.; Panas, I. J. Phys. Chem. B 2004,
108, 3523.
(70) Piacentini, m. Top. Catal. 2004, 30/31, 71.
(71) Piacentini, M.; Maciejewski, M.; Baiker, A. Appl. Catal. B-Environ. 2007,
72, 105.
(72) Olsson, L.; Fridell, E.; Skoglundh, M.; Andersson, B. Catal. Today 2002,
73, 263.
(73) Hilgendorff, M. Topics in Catalysis 2004, 30-31, 155.
(74) Ingelsten, H. H.; Skoglundh, M.; Fridell, E. Appl. Catal. B-Environ. 2003,
41, 287.
(75) Svedberg, P.; Jobson, E.; Erkfeldt, S.; Andersson, B.; Larsson, M.;
Skoglundh, M. Top. Catal. 2004, 30-31, 199.
(76) Westerberg, B.; Fridell, E. J. Mol. Catal. a 2001, 165, 249.
(77) Piacentini, M.; Strobel, R.; Maciejewski, M.; Pratsinis, S. E.; Baiker, A. J.
Catal. 2006, 243, 43.
(78) Abdulhamid, H.; Fridell, E.; Skoglundh, M. Appl. Catal. B-Environ. 2006,
62, 319.
111
(79) Toops, T. J.; Smith, D. B.; Epling, W. S.; Parks, J. E.; Partridge, W. P.
Appl. Catal. B-Environ. 2005, 58, 255.
(80) Szanyi, J.; Kwak, J. H.; Hanson, J.; Wang, C. M.; Szailer, T.; Peden, C. H.
F. J. Phys. Chem. B 2005, 109, 7339.
(81) Dawody, J.; Skoglundh, M.; Wall, S.; Fridell, E. J. Mol. Catal. A-Chem.
2005, 225, 259.
(82) Pinto, H. P.; Nieminen, R. M.; Elliott, S. D. Phys. Rev. B 2004, 70.
(83) Collins, S. E.; Baltanas, M. A.; Bonivardi, A. L. J. Phys. Chem. B 2006,
110, 5498.
(84) Piacentini, M.; Maciejewski, M.; Baiker, A. Appl. Catal. B-Environ. 2005,
60, 265.
(85) Piacentini, M.; Maciejewski, M.; Baiker, A. Appl. Catal. B 2005, 59, 187.
(86) Wang, C. M.; Kwak, J. H.; Kim, D. H.; Szanyi, J.; Sharma, R.;
Thevuthasan, S.; Peden, C. H. F. J. Phys. Chem. B 2006, 110, 11878.
(87) Kresse, G.; Joubert, D. Phys. Rev. B 1999, 59, 1758.
(88) Perdew, J. P.; Burke, K.; Ernzerhof, M. Phys. Rev. Lett. 1996, 77, 3865.
(89) Monkhorst, H. J.; Pack, J. D. Phys. Rev. B 1976, 13, 5188.
(90) Sanville, E.; Kenny, S. D.; Smith, R.; Henkelman, G. J. Comput. Chem.
2007, 28, 899.
(91) Zollweg, R. Phys. Rev. 1995, 100, 671.
(92) Sun, M. Y.; Nelson, A. E.; Adjaye, J. J. Phys. Chem. B 2006, 110, 2310.
(93) Nelson, A. E.; Sun, M. Y.; Adjaye, J. J. Phys. Chem. B 2006, 110, 20724.
(94) Paglia, G.; Buckley, C. E.; Rohl, A. L. J. Phys. Chem. B 2006, 110, 20721.
112
(95) Digne, M.; Raybaud, P.; Sautet, P.; Rebours, B.; Toulhoat, H. J. Phys.
Chem. B 2006, 110, 20719.
(96) Digne, M.; Sautet, P.; Raybaud, P.; Euzen, P.; Toulhoat, H. J. Catal. 2004,
226, 54.
(97) Gutierrez, G.; Taga, A.; Johansson, B. Phys. Rev. B 2002, 65, 012101.
(98) Broqvist, P.; Gronbeck, H.; Fridell, E.; Panas, I. J. Phys. Chem. B 2004,
108, 3523.
(99) Ozensoy, E.; Szanyi, J.; Peden, C. H. F. J. Phys. Chem. B 2005, 109, 3431.
(100) Dawody, J.; Eurenius, L.; Abdulhamid, H.; Skoglundh, M.; Olsson, E.;
Fridell, E. Appl. Catal. A-Gen. 2005, 296, 157.
(101) Du, A. J.; Smith, S. C.; Yao, X. D.; Lu, G. Q. Journal of Physical
Chemistry B 2005, 109, 18037.
(102) Bazzanella, N.; Checchetto, R.; Miotello, A.; Sada, C.; Mazzoldi, P.;
Mengucci, P. Appl. Phys. Lett. 2006, 89.
(103) Checchetto, R.; Bazzanella, N.; Miotello, A.; Mengucci, P. J. Alloys
Compd. 2007, 446, 58.
(104) Du, A. J.; Smith, S. C.; Yao, X. D.; Lu, G. Q. J. Phys. Chem. B 2006, 110,
21747.
(105) Du, A. J.; Smith, S. C.; Yao, X. D.; Lu, G. Q. J. Am. Chem. Soc. 2007,
129, 10201.
(106) Pozzo, M.; Alfe, D.; Amieiro, A.; French, S.; Pratt, A. J. Chem. Phys.
2008, 128.
113
(107) Dolci, F.; Di Chio, M.; Baricco, M.; Giamello, E. J. Mater. Sci. 2007, 42,
7180.
(108) Du, A. J.; Smith, S. C.; Yao, X. D.; Sun, C. H.; Li, L.; Lu, G. Q. Appl.
Phys. Lett. 2008, 92.
(109) Jung, K. S.; Kim, D. H.; Lee, E. Y.; Lee, K. S. Catal. Today 2007, 120,
270.
(110) Grochala, W.; Edwards, P. P. Chem. Rev. 2004, 104, 1283.
(111) Liang, G.; Huot, J.; Boily, S.; Van Neste, A.; Schulz, R. J. Alloys Compd.
2000, 297, 261.
(112) Wagemans, R. W. P.; van Lenthe, J. H.; de Jongh, P. E.; van Dillen, A. J.;
de Jong, K. P. J. Am. Chem. Soc. 2005, 127, 16675.
(113) Li, W. Y.; Li, C. S.; Ma, H.; Chen, J. J. Am. Chem. Soc. 2007, 129, 6710.
(114) Frisch, M. J. Gaussian 03; Gaussian Inc.: Pittsburgh, PA, 2003.
(115) Parr, R. G.; Yang, W. Density-functional theory of atoms and molecules;
Oxford University Press: Oxford, 1989.
(116) Lee, C. T.; Yang, W. T.; Parr, R. G. Phys. Rev. B 1988, 37, 785.
(117) Kresse, G.; Furthmuller, J. Comp. Mater. Sci. 1996, 6, 15.
(118) Blochl, P. E. Phys. Rev. B 1994, 50, 17953.
(119) Lyalin, A.; Solov'yov, I. A.; Solov'yov, A. V.; Greiner, W. Phys. Rev. A
2003, 67, 063203.
(120) Knight, W. D. Phys. Rev. Lett 1984, 52, 2141.
(121) Diederich, T.; Doppner, T.; Braune, J.; Tiggesbaumker, J.; Meiwes-Broer,
K. H. Phys. Rev. Lett. 2001, 86, 4807.
114
(122) Rao, B. K.; Jena, P. J. Chem. Phys. 1999, 111, 1890.
(123) Kiran, B.; Jena, P.; Li, X.; Grubisic, A.; Stokes, S. T.; Gantefor, G. F.;
Bowen, K. H.; Burgert, R.; Schnockel, H. Phys. Rev. Lett. 2007, 98.
(124) Thomas, J. M.; Thomas, W. J. Principles and practice of heterogeneous
catalysis; VCH: New York, 1997.
(125) Ertl, G.; Knozinger, H.; Weikamp, J. T., Handbook of heterogeneous
catalysis.
(126) Al-Abadleh, H. A.; Grassian, V. H. Surf. Sci. Rep. 2003, 52, 63.
(127) Cheng, L.; Ge, Q. F. Surf. Sci. 2007, 601, L65.
(128) Cheng, L.; Ge, Q. F. J. Phys. Chem. C 2008, 112, 16924.
(129) Kwak, J. H.; Mei, D.; Yi, C. W.; Kim, D. H.; Peden, C. H. F.; Allard, L.
F.; Szanyi, J. J. Catal. 2009, 261, 17.
(130) Mei, D.; Ge, Q.; Kwak, J. H.; Kim, D. H.; Szanyi, J.; Peden, C. H. F. J.
Phys. Chem. C. 2008, 112, 18050.
(131) Backhaus-Ricoult, M. Annu. Rev. Mater. Res. 2003, 33, 55.
(132) Wachs, I. E.; Weckhuysen, B. M. Appl. Catal. A-Gen. 1997, 157, 67.
(133) Deo, G.; Wachs, I. E. J. Catal. 1994, 146, 323.
(134) Hu, H. C.; Wachs, I. E. J. Phys. Chem. 1995, 99, 10911.
(135) Kim, D. S.; Wachs, I. E.; Segawa, K. J. Catal. 1994, 149, 268.
(136) Niwa, M.; Sano, M.; Yamada, H.; Murakami, Y. J. Catal. 1995, 151, 285.
(137) Yamada, H.; Niwa, M.; Murakami, Y. Appl. Catal. A-Gen. 1993, 96, 113.
(138) Matsuoka, Y.; Niwa, M.; Murakami, Y. J. Phys. Chem. 1990, 94, 1477.
115
(139) Wachs, I. E.; Deo, G.; Kim, D. S.; Vuurman, M. A.; Hu, H.; Ozkan, U. S.;
Solymosi, F.; Datye, A. K.; Trifiro, F.; Iwasawa, Y.; Vanommen, J. G.; Andersson, A.;
Jozwiak, W. K.; Wang, D.; Thomas, J. M.; Krauss, H. L.; Bordes, E.; Kung, H. H.; Dixit,
L. Stud. Surf. Sci. Catal. 1993, 75, 543.
(140) Freund, H. J.; Kuhlenbeck, H.; Staemmler, V. Reports on Progress in
Physics 1996, 59, 283.
(141) Schubert, M. M.; Hackenberg, S.; van Veen, A. C.; Muhler, M.; Plzak, V.;
Behm, R. J. J. Catal. 2001, 197, 113.
(142) Comotti, M.; Li, W. C.; Spliethoff, B.; Schuth, F. J. Am. Chem. Soc. 2006,
128, 917.
(143) Panagiotopoulou, P.; Kondarides, D. I. Catal. Today 2006, 112, 49.
(144) Mul, G.; Zwijnenburg, A.; van der Linden, B.; Makkee, M.; Moulijn, J. A.
J. Catal. 2001, 201, 128.
(145) Stangland, E. E.; Stavens, K. B.; Andres, R. P.; Delgass, W. N. J. Catal.
2000, 191, 332.
(146) Kalvachev, Y. A.; Hayashi, T.; Tsubota, S.; Haruta, M. J. Catal. 1999,
186, 228.
(147) Waters, R. D.; Weimer, J. J.; Smith, J. E. Catal. Lett. 1995, 30, 181.
(148) Haruta, M. Cattech 2002, 6, 102.
(149) Campbell, C. T.; Peden, C. H. F. Science 2005, 309, 713.
(150) Yang, J.; Sudik, A.; Siegel, D. J.; Halliday, D.; Drews, A.; Carter, R. O.;
Wolverton, C.; Lewis, G. J.; Sachtler, J. W. A.; Low, J. J.; Faheem, S. A.; Lesch, D. A.;
Ozolins, V. J. Alloys Compd. 2007, 446, 345.
116
(151) Trovarelli, A. Catal. Rev.-Sci. Eng. 1996, 38, 439.
(152) Trovarelli, A. Catalysis by ceria and related materials; Imperial College
Press: UK, 2002.
(153) Gamarra, D.; Belver, C.; Fernandez-Garcia, M.; Martinez-Arias, A. J. Am.
Chem. Soc. 2007, 129, 12064.
(154) Ganduglia-Pirovano, M. V.; Hofmann, A.; Sauer, J. Surf. Sci. Rep. 2007,
62, 219.
(155) Kaspar, J.; Fornasiero, P.; Graziani, M. Catal. Today 1999, 50, 285.
(156) Aguila, G.; Gracia, F.; Araya, P. Appl. Catal. A-Gen. 2008, 343, 16.
(157) Madier, Y.; Descorme, C.; Le Govic, A. M.; Duprez, D. J. Phys. Chem. B
1999, 103, 10999.
(158) Martinez-Arias, A.; Fernandez-Garcia, M.; Salamanca, L. N.; Valenzuela,
R. X.; Conesa, J. C.; Soria, J. J. Phys. Chem. B 2000, 104, 4038.
(159) Reddy, B. M.; Lakshmanan, P.; Bharali, P.; Saikia, P.; Thrimurthulu, G.;
Muhler, M.; Grunert, W. J. Phys. Chem. C 2007, 111, 10478.
(160) Sayle, D. C.; Maicaneanu, S. A.; Watson, G. W. J. Am. Chem. Soc. 2002,
124, 11429.
(161) Deo, G.; Wachs, I. E. J. Phys. Chem. 1991, 95, 5889.
(162) Putna, E. S.; Bunluesin, T.; Fan, X. L.; Gorte, R. J.; Vohs, J. M.; Lakis, R.
E.; Egami, T. Catal. Today 1999, 50, 343.
(163) Reddy, B. M.; Bharali, P.; Saikia, P.; Thrimurthulu, G.; Yamada, Y.;
Kobayashi, T. Ind. Eng. Chem. Res. 2009, 48, 453.
117
(164) Reddy, B. M.; Saikia, P.; Bharali, P.; Park, S. E.; Muhler, M.; Grunert, W.
J. Phys. Chem. C 2009, 113, 2452.
(165) Sasikala, R.; Gupta, N. M.; Kulshreshtha, S. K. Catal. Lett. 2001, 71, 69.
(166) Wang, R.; Crozier, P. A.; Sharma, R.; Adams, J. B. Nano Lett. 2008, 8,
962.
(167) Reddy, B. M.; Khan, A. Catal. Surv. Asia 2005, 9, 155.
(168) Wang, R. G.; Crozier, P. A.; Sharma, R.; Adams, J. B. J. Phys. Chem. B
2006, 110, 18278.
(169) Fabris, S.; Vicario, G.; Balducci, G.; de Gironcoli, S.; Baroni, S. J. Phys.
Chem. B 2005, 109, 22860.
(170) Piinkerton, F. E.; Meyer, M. S.; Meisner, G. P.; Balogh, M. P.; Vajo, J. J.
J. Phys. Chem. C 2007, 111, 12881.
(171) Nolan, M.; Parker, S. C.; Watson, G. W. Phys. Chem. Chem. Phys. 2006,
8, 216.
(172) Huang, M.; Fabris, S. J. Phys. Chem. C 2008, 112, 8643.
(173) Stefanovich, E. V.; Shluger, A. L.; Catlow, C. R. A. Phys. Rev. B 1994,
49, 11560.
(174) Kwak, J. H.; Hu, J. Z.; Kim, D. H.; Szanyi, J.; Peden, C. H. F. J. Catal.
2007, 251, 189.
(175) Bolis, V.; Morterra, C.; Volante, M.; Orio, L.; Fubini, B. Langmuir 1990,
6, 695.
(176) Morterra, C.; Aschieri, R.; Volante, M. Mater. Chem. Phys. 1988, 20, 539.
118
(177) Paukshtis, E. A. Infrared spectroscopy in heterogeneous acid-base
catalysis; Nauka: Novosibirsk, 1992.
(178) Christensen, A.; Carter, E. A. Phys. Rev. B 1998, 58, 8050.
(179) Zecchina, A.; Platero, E. E.; Arean, C. O. J. Catal. 1987, 107, 244.
(180) Morterra, C.; Magnacca, G. Catal. Today 1996, 27, 497.
(181) Pan, Y.; Liu, C.-j.; Ge, Q. Langmuir 2008, 24, 12410.
(182) Tai, J. R.; Ge, Q. F.; Davis, R. J.; Neurock, M. J. Phys. Chem. B 2004,
108, 16798.
(183) Turek, A. M.; Wachs, I. E.; Decanio, E. J. Phys. Chem. 1992, 96, 5000.
(184) Li, C.; Sakata, Y.; Arai, T.; Domen, K.; Maruya, K.; Onishi, T. J. Chem.
Soc. Faraday Trans. 1 1989, 85, 929.
(185) Li, C.; Sakata, Y.; Arai, T.; Domen, K.; Maruya, K. I.; Onishi, T. J. Chem.
Soc. Faraday Trans. 1 1989, 85, 1451.
(186) Thomas, J. R.; Deleeuw, B. J.; Vacek, G.; Crawford, T. D.; Yamaguchi,
Y.; Schaefer, H. F. J. Chem. Phys. 1993, 99, 403.
(187) Liu, X. W.; Zhou, K. B.; Wang, L.; Wang, B. Y.; Li, Y. D. J. Am. Chem.
Soc. 2009, 131, 3140.
(188) Sayle, T. X. T.; Parker, S. C.; Sayle, D. C. Phys. Chem. Chem. Phys. 2005,
7, 2936.
(189) Aneggi, E.; Llorca, J.; Boaro, M.; Trovarelli, A. J. Catal. 2005, 234, 88.

APPENDICES
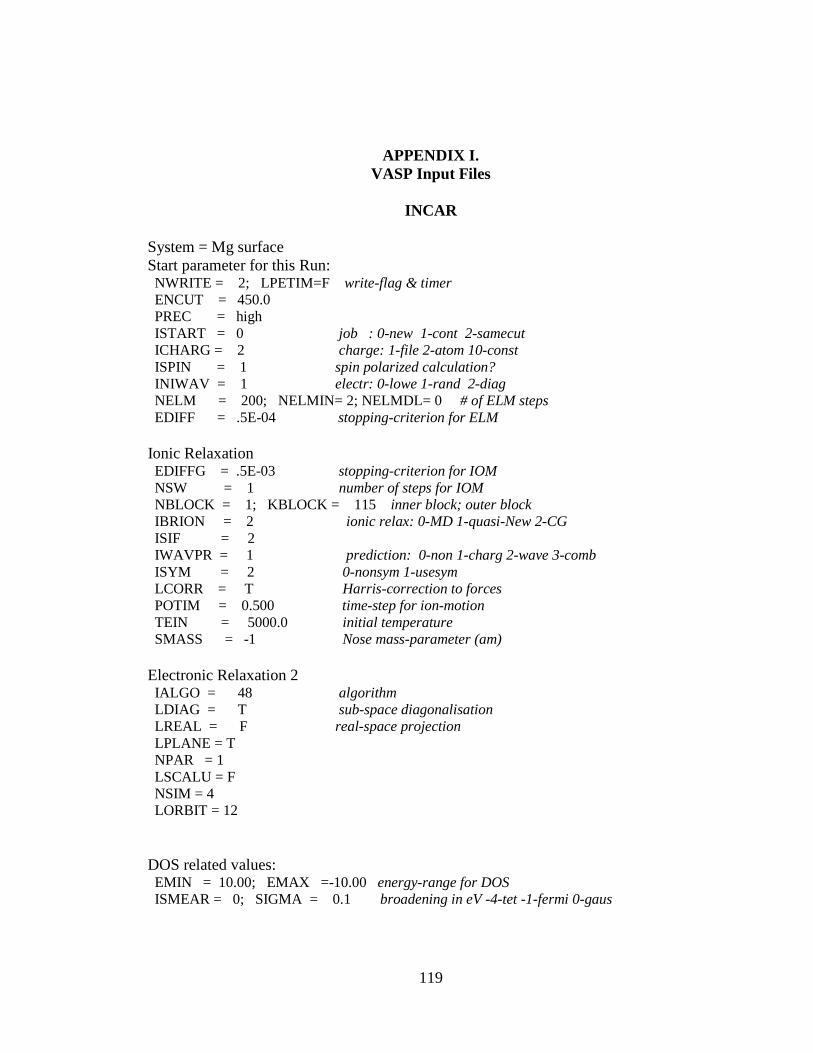
119
APPENDIX I. VASP Input Files
INCAR
System = Mg surface Start parameter for this Run: NWRITE = 2; LPETIM=F write-flag & timer ENCUT = 450.0 PREC = high ISTART = 0 job : 0-new 1-cont 2-samecut ICHARG = 2 charge: 1-file 2-atom 10-const ISPIN = 1 spin polarized calculation? INIWAV = 1 electr: 0-lowe 1-rand 2-diag NELM = 200; NELMIN= 2; NELMDL= 0 # of ELM steps EDIFF = .5E-04 stopping-criterion for ELM Ionic Relaxation EDIFFG = .5E-03 stopping-criterion for IOM NSW = 1 number of steps for IOM NBLOCK = 1; KBLOCK = 115 inner block; outer block IBRION = 2 ionic relax: 0-MD 1-quasi-New 2-CG ISIF = 2 IWAVPR = 1 prediction: 0-non 1-charg 2-wave 3-comb ISYM = 2 0-nonsym 1-usesym LCORR = T Harris-correction to forces POTIM = 0.500 time-step for ion-motion TEIN = 5000.0 initial temperature SMASS = -1 Nose mass-parameter (am) Electronic Relaxation 2 IALGO = 48 algorithm LDIAG = T sub-space diagonalisation LREAL = F real-space projection LPLANE = T NPAR = 1 LSCALU = F NSIM = 4 LORBIT = 12 DOS related values: EMIN = 10.00; EMAX =-10.00 energy-range for DOS ISMEAR = 0; SIGMA = 0.1 broadening in eV -4-tet -1-fermi 0-gaus
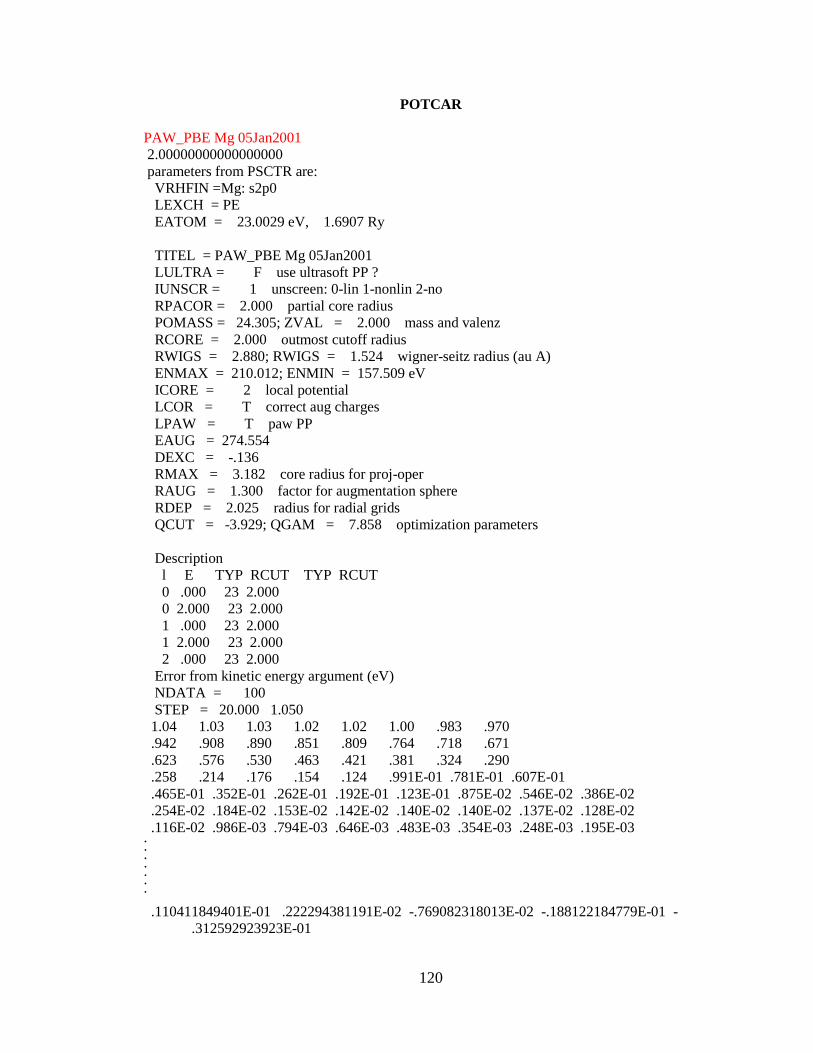
120
POTCAR
PAW_PBE Mg 05Jan2001 2.00000000000000000 parameters from PSCTR are: VRHFIN =Mg: s2p0 LEXCH = PE EATOM = 23.0029 eV, 1.6907 Ry TITEL = PAW_PBE Mg 05Jan2001 LULTRA = F use ultrasoft PP ? IUNSCR = 1 unscreen: 0-lin 1-nonlin 2-no RPACOR = 2.000 partial core radius POMASS = 24.305; ZVAL = 2.000 mass and valenz RCORE = 2.000 outmost cutoff radius RWIGS = 2.880; RWIGS = 1.524 wigner-seitz radius (au A) ENMAX = 210.012; ENMIN = 157.509 eV ICORE = 2 local potential LCOR = T correct aug charges LPAW = T paw PP EAUG = 274.554 DEXC = -.136 RMAX = 3.182 core radius for proj-oper RAUG = 1.300 factor for augmentation sphere RDEP = 2.025 radius for radial grids QCUT = -3.929; QGAM = 7.858 optimization parameters Description l E TYP RCUT TYP RCUT 0 .000 23 2.000 0 2.000 23 2.000 1 .000 23 2.000 1 2.000 23 2.000 2 .000 23 2.000 Error from kinetic energy argument (eV) NDATA = 100 STEP = 20.000 1.050 1.04 1.03 1.03 1.02 1.02 1.00 .983 .970 .942 .908 .890 .851 .809 .764 .718 .671 .623 .576 .530 .463 .421 .381 .324 .290 .258 .214 .176 .154 .124 .991E-01 .781E-01 .607E-01 .465E-01 .352E-01 .262E-01 .192E-01 .123E-01 .875E-02 .546E-02 .386E-02 .254E-02 .184E-02 .153E-02 .142E-02 .140E-02 .140E-02 .137E-02 .128E-02 .116E-02 .986E-03 .794E-03 .646E-03 .483E-03 .354E-03 .248E-03 .195E-03 . . . . . . . .110411849401E-01 .222294381191E-02 -.769082318013E-02 -.188122184779E-01 -
.312592923923E-01
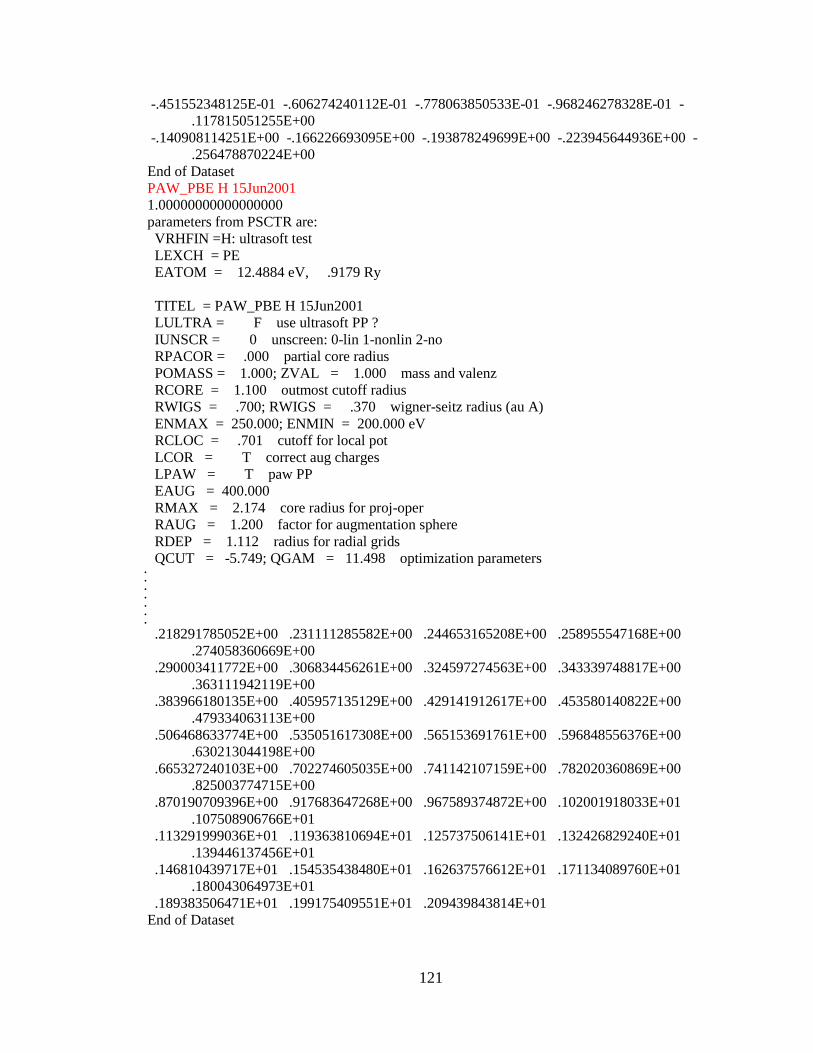
121
-.451552348125E-01 -.606274240112E-01 -.778063850533E-01 -.968246278328E-01 -.117815051255E+00
-.140908114251E+00 -.166226693095E+00 -.193878249699E+00 -.223945644936E+00 -.256478870224E+00
End of Dataset PAW_PBE H 15Jun2001 1.00000000000000000 parameters from PSCTR are: VRHFIN =H: ultrasoft test LEXCH = PE EATOM = 12.4884 eV, .9179 Ry TITEL = PAW_PBE H 15Jun2001 LULTRA = F use ultrasoft PP ? IUNSCR = 0 unscreen: 0-lin 1-nonlin 2-no RPACOR = .000 partial core radius POMASS = 1.000; ZVAL = 1.000 mass and valenz RCORE = 1.100 outmost cutoff radius RWIGS = .700; RWIGS = .370 wigner-seitz radius (au A) ENMAX = 250.000; ENMIN = 200.000 eV RCLOC = .701 cutoff for local pot LCOR = T correct aug charges LPAW = T paw PP EAUG = 400.000 RMAX = 2.174 core radius for proj-oper RAUG = 1.200 factor for augmentation sphere RDEP = 1.112 radius for radial grids QCUT = -5.749; QGAM = 11.498 optimization parameters . . . . . . . .218291785052E+00 .231111285582E+00 .244653165208E+00 .258955547168E+00
.274058360669E+00 .290003411772E+00 .306834456261E+00 .324597274563E+00 .343339748817E+00
.363111942119E+00 .383966180135E+00 .405957135129E+00 .429141912617E+00 .453580140822E+00
.479334063113E+00 .506468633774E+00 .535051617308E+00 .565153691761E+00 .596848556376E+00
.630213044198E+00 .665327240103E+00 .702274605035E+00 .741142107159E+00 .782020360869E+00
.825003774715E+00 .870190709396E+00 .917683647268E+00 .967589374872E+00 .102001918033E+01
.107508906766E+01 .113291999036E+01 .119363810694E+01 .125737506141E+01 .132426829240E+01
.139446137456E+01 .146810439717E+01 .154535438480E+01 .162637576612E+01 .171134089760E+01
.180043064973E+01 .189383506471E+01 .199175409551E+01 .209439843814E+01 End of Dataset
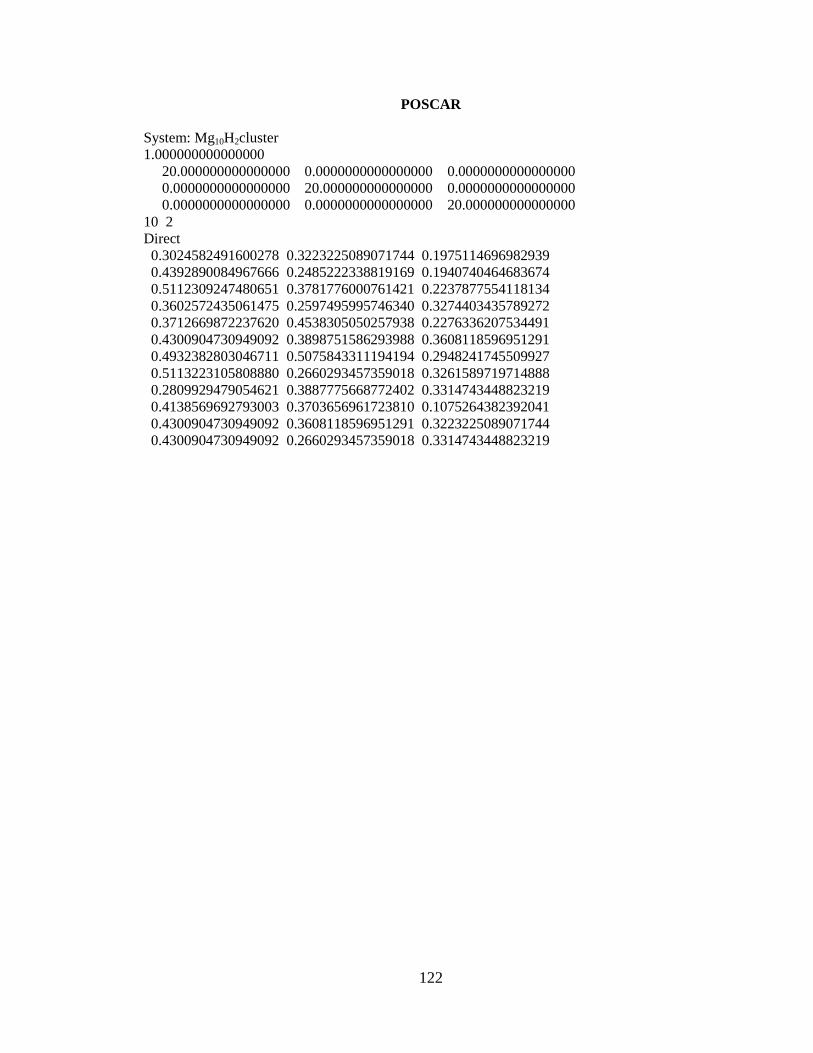
122
POSCAR
System: Mg10H2cluster 1.000000000000000 20.000000000000000 0.0000000000000000 0.0000000000000000 0.0000000000000000 20.000000000000000 0.0000000000000000 0.0000000000000000 0.0000000000000000 20.000000000000000 10 2 Direct 0.3024582491600278 0.3223225089071744 0.1975114696982939 0.4392890084967666 0.2485222338819169 0.1940740464683674 0.5112309247480651 0.3781776000761421 0.2237877554118134 0.3602572435061475 0.2597495995746340 0.3274403435789272 0.3712669872237620 0.4538305050257938 0.2276336207534491 0.4300904730949092 0.3898751586293988 0.3608118596951291 0.4932382803046711 0.5075843311194194 0.2948241745509927 0.5113223105808880 0.2660293457359018 0.3261589719714888 0.2809929479054621 0.3887775668772402 0.3314743448823219 0.4138569692793003 0.3703656961723810 0.1075264382392041 0.4300904730949092 0.3608118596951291 0.3223225089071744 0.4300904730949092 0.2660293457359018 0.3314743448823219

123
KPOINTS For Surfaces: K-Point Grid 0 Monkhorst Pack 3 3 1 0 0 0 For Clusters: K-Point Grid 0 Monkhorst Pack 1 1 1 0 0 0 For Clusters: K-Point Grid 0 Monkhorst Pack 3 3 4 0 0 0
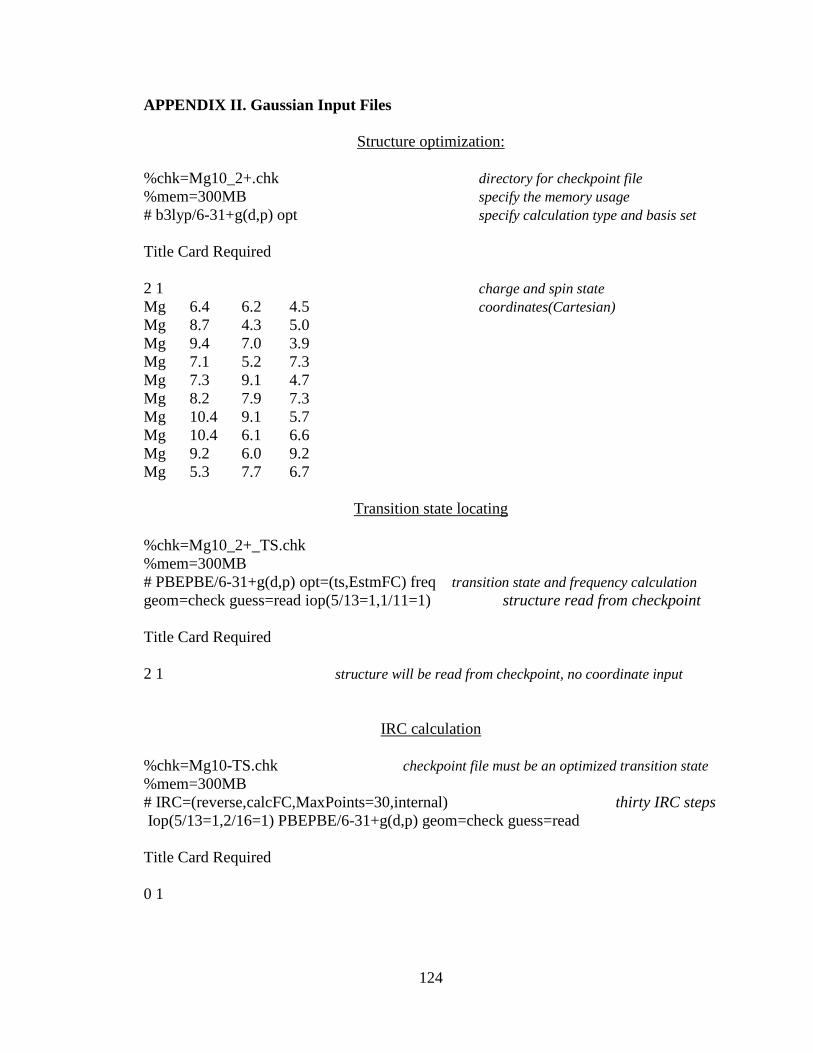
124
APPENDIX II. Gaussian Input Files
Structure optimization:
%chk=Mg10_2+.chk directory for checkpoint file %mem=300MB specify the memory usage # b3lyp/6-31+g(d,p) opt specify calculation type and basis set Title Card Required 2 1 charge and spin state Mg 6.4 6.2 4.5 coordinates(Cartesian) Mg 8.7 4.3 5.0 Mg 9.4 7.0 3.9 Mg 7.1 5.2 7.3 Mg 7.3 9.1 4.7 Mg 8.2 7.9 7.3 Mg 10.4 9.1 5.7 Mg 10.4 6.1 6.6 Mg 9.2 6.0 9.2 Mg 5.3 7.7 6.7
Transition state locating
%chk=Mg10_2+_TS.chk %mem=300MB # PBEPBE/6-31+g(d,p) opt=(ts,EstmFC) freq transition state and frequency calculation geom=check guess=read iop(5/13=1,1/11=1) structure read from checkpoint Title Card Required 2 1 structure will be read from checkpoint, no coordinate input
IRC calculation
%chk=Mg10-TS.chk checkpoint file must be an optimized transition state %mem=300MB # IRC=(reverse,calcFC,MaxPoints=30,internal) thirty IRC steps Iop(5/13=1,2/16=1) PBEPBE/6-31+g(d,p) geom=check guess=read Title Card Required 0 1
125
VITA
Graduate School
Southern Illinois University
Lei Cheng Date of Birth: May 17, 1981
500 W. Charles Rd. #26, Carbondale, IL 62901
Shengli Str. #26, Rushan, Shandong 264500, China
Qingdao University, Qingdao, China, Bachelor of Science, Polymer Synthesis, July 2003
Dissertation Title: FIRST-PRINCIPLES DENSITY FUNCTIONAL THEORY STUDIES OF REACTIVITIES OF HETEROGENEOUS CATALYSTS DETERMINED BY STRUCTURE AND SUBSTRATE
Major Professor: Qingfeng Ge
Publications:
Lei Cheng and Qingfeng Ge, Surf. Sci. 601, L65-L68 (2007)
Lei Cheng and Qingfeng Ge, J. Phys. Chem. C, 112, 16924 (2008)
Lei Cheng, Donghai Mei and Qingfeng Ge, J. Phys. Chem. C, 113, 18296 (2009)
Lei Cheng, Jianjun Liu and Qingfeng Ge (in preparation)
Copyright © 2022 FDOKUMEN