Effects of grain interactions on deformation and local texture in polycrystals
19
Pergamo. Acta metall, mater. Vol. 43, No. 7, pp. 2701 2719, 1995 ElsevierScience Ltd 0956-7151(94)00460-9 Copyright © 1995 Acta Metallurgica Inc. Printed in Great Britain. All rights reserved 0956-7151/95$9.50+ 0.00 EFFECTS OF GRAIN INTERACTIONS ON DEFORMATION AND LOCAL TEXTURE IN POLYCRYSTALS R. BECKERIt and S. PANCHANADEESWARAN = 'Alcoa Technical Center, Alcoa Center, PA 15069 and 2Alumax Technical Center, Golden, CO 80403, U.S.A. (Received 20 May 1994: in revised form 19 October 1994) Abstract--Detailed simulations of grain deformation and crystal orientation evolution in a small region at the interior of polycrystal have been performed. The finite element model accounts for deformation by crystallographic slip and for crystal lattice rotation with deformation. The initial shapes and orientations of the grains and the crystal hardening relations were determined from polycrystalline aluminum samples. The results clearly demonstrate the effects of grain interaction on local deformation and texture evolution. A comparison of the predicted lattice orientations with results from plane strain compression experiments shows good agreement for some of the grains and little agreement for others. Part of the discrepancy results from kinematic restrictions which were necessary to model the 3D microstrueture with 2D models. The model shows very nonuniform strain fields and provides detailed information on grain interactions. 1. INTRODUCTION Material anisotropy affects the formability and mech- anical properties of many commercial alloys. Conse- quently, significant effort is often directed toward controlling anisotropy in order to improve product performance. One means of controlling anisotropy is through manipulation of the crystal orientation dis- tribution, often referred to as the crystallographic texture. Experimentation and modelling have in- creased our understanding of texture evolution during deformation, and aided in determining pro- cess modifications which will enhance product per- formance. Polycrystal plasticity models which predict texture evolution during deformation processing have been successful in many cases, but the number of different models currently in use suggests that none of the formulations is totally satisfactory. For the present discussion, the model deficiencies will be placed into two classes: grain interactions and crystal constitutive relations. Into the latter class are placed uncertainties regarding slip system hardening relations, effects of stacking fault energy, crystal kinematics, slip system selection, strain rate sensitivity and numerous other factors. These will not be addressed here. Rather, attention will focus on grain interactions and the use of detailed finite element simulations to gain a better understanding of how grain interactions effect local deformation and texture evolution. The deformation fields in polycrystals are complex and must be approximated in order to formulate tTo whom all correspondence should be addressed. texture evolution models which execute with reason- able computational effort. A variety of models have been formulated, nearly all assuming that the individ- ual grains deform homogeneously. The models differ primarily in their treatment of interactions among neighboring grains. These grain interaction models govern local compatibility and equilibrium between grains and specify a relationship between the defor- mation of the grains and the applied deformation. Several general classes of interaction models and representative implementations are: Taylor-like models which enforce strict compatibility and ignore intergrain equilibrium [1-3]; relaxed constraint models which satisfy selected compatibility relations and ignore some intergrain equilibrium components [4, 5]; self-consistent models which satisfy both com- patibility and equilibrium in an average sense [6-8]; and Sachs [9] type models which are driven by equilibrium with compatibility ignored. There are also models which utilize the specific neighboring grain orientations in order to include grain inter- action effects [I0, l 1]. These interaction models have relied largely on engineering judgment in assessing the relative import- ance of equilibrium, compatibility and grain inter- actions. However, some experiments have been performed to explore these effects. Skalli et al. [12] have compared crystal orientations from rolled, large grain polycrystalline sheet with results from several polycrystal models. The results showed that the qual- ity of agreement varied from grain to grain for the different interaction models, but no one model gave the best predictions for all of the grains. With increasing computational power, it is possible to explore the role of compatibility and equilibrium 2701
-
Upload
independent -
Category
Documents
-
view
1 -
download
0
Transcript of Effects of grain interactions on deformation and local texture in polycrystals

Pergamo. Acta metall, mater. Vol. 43, No. 7, pp. 2701 2719, 1995
Elsevier Science Ltd 0956-7151(94)00460-9 Copyright © 1995 Acta Metallurgica Inc.
Printed in Great Britain. All rights reserved 0956-7151/95 $9.50 + 0.00
EFFECTS OF GRAIN INTERACTIONS ON DEFORMATION AND LOCAL TEXTURE IN POLYCRYSTALS
R. BECKERIt and S. PANCHANADEESWARAN = 'Alcoa Technical Center, Alcoa Center, PA 15069 and 2Alumax Technical Center, Golden,
CO 80403, U.S.A.
(Received 20 May 1994: in revised form 19 October 1994)
Abstract--Detailed simulations of grain deformation and crystal orientation evolution in a small region at the interior of polycrystal have been performed. The finite element model accounts for deformation by crystallographic slip and for crystal lattice rotation with deformation. The initial shapes and orientations of the grains and the crystal hardening relations were determined from polycrystalline aluminum samples. The results clearly demonstrate the effects of grain interaction on local deformation and texture evolution. A comparison of the predicted lattice orientations with results from plane strain compression experiments shows good agreement for some of the grains and little agreement for others. Part of the discrepancy results from kinematic restrictions which were necessary to model the 3D microstrueture with 2D models. The model shows very nonuniform strain fields and provides detailed information on grain interactions.
1. INTRODUCTION
Material anisotropy affects the formability and mech- anical properties of many commercial alloys. Conse- quently, significant effort is often directed toward controlling anisotropy in order to improve product performance. One means of controlling anisotropy is through manipulation of the crystal orientation dis- tribution, often referred to as the crystallographic texture. Experimentation and modelling have in- creased our understanding of texture evolution during deformation, and aided in determining pro- cess modifications which will enhance product per- formance.
Polycrystal plasticity models which predict texture evolution during deformation processing have been successful in many cases, but the number of different models currently in use suggests that none of the formulations is totally satisfactory. For the present discussion, the model deficiencies will be placed into two classes: grain interactions and crystal constitutive relations. Into the latter class are placed uncertainties regarding slip system hardening relations, effects of stacking fault energy, crystal kinematics, slip system selection, strain rate sensitivity and numerous other factors. These will not be addressed here. Rather, attention will focus on grain interactions and the use of detailed finite element simulations to gain a better understanding of how grain interactions effect local deformation and texture evolution.
The deformation fields in polycrystals are complex and must be approximated in order to formulate
tTo whom all correspondence should be addressed.
texture evolution models which execute with reason- able computational effort. A variety of models have been formulated, nearly all assuming that the individ- ual grains deform homogeneously. The models differ primarily in their treatment of interactions among neighboring grains. These grain interaction models govern local compatibility and equilibrium between grains and specify a relationship between the defor- mation of the grains and the applied deformation. Several general classes of interaction models and representative implementations are: Taylor-like models which enforce strict compatibility and ignore intergrain equilibrium [1-3]; relaxed constraint models which satisfy selected compatibility relations and ignore some intergrain equilibrium components [4, 5]; self-consistent models which satisfy both com- patibility and equilibrium in an average sense [6-8]; and Sachs [9] type models which are driven by equilibrium with compatibility ignored. There are also models which utilize the specific neighboring grain orientations in order to include grain inter- action effects [I0, l 1].
These interaction models have relied largely on engineering judgment in assessing the relative import- ance of equilibrium, compatibility and grain inter- actions. However, some experiments have been performed to explore these effects. Skalli et al. [12] have compared crystal orientations from rolled, large grain polycrystalline sheet with results from several polycrystal models. The results showed that the qual- ity of agreement varied from grain to grain for the different interaction models, but no one model gave the best predictions for all of the grains.
With increasing computational power, it is possible to explore the role of compatibility and equilibrium
2701

2702 BECKER and PANCHANADEESWARAN: GRAIN INTERACTIONS IN POLYCRYSTALS
between grains using finite element simulations. Har- ren and Asaro [13] conducted detailed polycrystal simulations with models of idealized 2-dimensional crystals and compared the predicted texture to that from a Taylor-like model. Similar calculations were performed utilizing the 12 slip systems for f.c.c. crystals [14]. In these studies it was also found that the Taylor model gave good predictions for some of the FEM grains (or parts of grains) but not for others. Since the underlying crystal model was the same for both the finite element model and the Taylor model, it was concluded that the grain interactions were responsible for the discrepancies in the model predictions.
The aim of the present work is to compare predic- tions from detailed simulations of deformation in a polycrystal with experiments. The simulations model a small region of a split channel-die sample examined experimentally by Panchanadeeswaran et al. [15, 16]. The sample was characterized carefully both before and after plane strain compression. The initial shape and lattice orientation of the grains in a small region on one of the split faces were used to construct the model. The deformation measured in this region was applied in the simulation. The results of this study will be useful in evaluating the relative importance of enforcing compatibility and equilibrium constraints in polycrystal models and in understanding how grain interactions effect texture evolution.
2. CRYSTAL MODEL
A crystal constitutive model which accounts for deformation by crystallographic slip and for lattice rotation with deformation was used in these analyses. The formulation and time integration scheme are identical to that developed by Peirce et al. [17] and used by Asaro and Needleman [3] in a Taylor-like model. This formulation was also employed by others in finite element simulations [13, 14]. Implementation of the constitutive relations as a User Material sub- routine in the finite element code ABAQUS [18] was described by Smelser and Becker [19].
In the crystal model, the velocity gradient is de- composed additively into an elastic part and a part due to slip on prescribed slip systems
~ 12
0x U + ~" ~;~s~m~. (1) ~=1
Here, U is the elastic part of the velocity gradient; s= is a vector in the slip direction; m~ is a vector normal to the slip plane; and 9~ is the slip rate. The Greek subscripts and superscripts are slip system indices which range from 1 to 12 for f.c.c, materials. The model assumes that plastic flow occurs by slip through the crystal lattice, leaving the lattice undis- turbed. The rotation and distortion of the crystal lattice are embodied in the elastic term. The evolution
equations for the orthogonal lattice vectors are writ- ten in terms of the elastic part of the velocity gradient
g= = L e • s~
m. = - m ~ " U . ( 2 )
The elastic and viscoplastic constitutive equations relate the deformation to the stress. The rate form of the elastic constitutive relation is determined from a strain energy function in terms of the elastic defor- mation of the crystal lattice. Using the decomposition of the velocity gradient given in equation (1), the elastic constitutive relation can be used to express the Jaumann rate of Kirchhoff stress; ~, in terms of a modulus, o~ff; the total rate of deformation, D; the slip rate, ,)5; and a tensor containing the slip geometry, R ~ .
12
= ~ : o - ~ ~ R o . (3) ~=1
The formulation is completed by specification of the slip rate. For the rate dependent material model considered here, the slip rate on a slip system is given explicitly in terms of the resolved shear stress, z ~ = s~- r • ms, and the slip system's resistance to slip, q(~).
9==a(T)sign(z=)Isinh ( r= ~]" q~ / j . (4)
q(?) is assumed to be the same on all slip systems at a material point (Taylor hardening), and the evol- ution of the hardness is given in terms of a single parameter: the accumulated slip, ?. The parameter a(T) is a function of temperature and n is a material constant.
The relations outlined above are numerically "stiff", and a very small time step would be required to achieve stable and accurate numerical integration. Here, the rate tangent modulus method of Peirce et al. [17] is used to increase the stable time step size. Application of this technique to the slip rate relation in equation (4) is given by Smelser and Becker [19]. While the resulting time integration scheme permits significantly larger time increments, the time incre- ments in these analyses were restricted to ensure accurate time integration of the constitutive relations.
3. FINITE ELEMENT MODEL
The model simulated plane strain compression of a set of grains within a polycrystal. A detailed account of the specimen characterization, experimen- tal procedure and analysis of the results is given by Panchanadeeswaran et al. [16]. Only a brief descrip- tion is incorporated here. The simulations were run using the finite element code ABAQUS [18] employ- ing the crystal constitutive model as a User Material Subroutine.
3.1. Property definition The material was an as-cast commercial purity
aluminum containing approx. 0.08% Si and 0.15%

BECKER and PANCHANADEESWARAN: GRAIN INTERACTIONS IN POLYCRYSTALS 2703
Fe and having equiaxed grains with an average size of 300 ~tm. A specimen was prepared for plane strain deformation in a channel die. An additional cut was made along a plane normal to the direction of no strain. The surfaces were polished and a 1 x 1 mm region on one of the split faces was marked with indentations. The grains in this region were photo- graphed, and their orientations were measured from back-scattered electron patterns on an SEM. The initial grain structure is depicted in Fig. 1. The region outlined by the dashed lines was modelled in the simulations.
The photograph was scanned by an image analyzer to obtain coordinates for the grain boundaries. The grain boundaries defined regions in which the finite element mesh was constructed, Fig. 2. The model
contained 2187 elements, all but three of which were quadrilaterals. The three triangular elements lay on the model boundary, and most of the badly shaped elements were near the centers of the grains. The quadrilateral elements used in the simulations were four node, plane strain, isoparamet- ric elements with selective reduced integration for the pressure. The triangles were constant strain el- ements.
The black areas in Fig. 2 are regions for which the crystal orientations were unknown. The letters on the shaded grains correspond to the letter designation assigned by Panchanadeeswaran and Doherty [15]. The Euler angles defining the orientations of these grains are given in Table 1, and a (111) pole figure of the initial 32 orientations is presented in Fig. 3.
Z 0
W oc
0
Fig. 1. Region of the split channel-die sample considered in the analysis.

2704 B E C K E R a n d P A N C H A N A D E E S W A R A N :
~"-×1 Fig. 2. Finite element discretization of the model region. The black regions contain grains of unknown orientation.
The split compression sample was reassembled, wrapped in P T F E tape and deformed at 37Y'C to approx. 40% reduction. The stress-strain response recorded during the experiment was fit with a power law relation. By assuming an approximate Taylor factor of 3, a slip system hardening relation consistent with macroscopic stress strain response was deter- mined for use in the simulations.
q(7)/ao = 0.6092(7 + 0.002)°15; ~r 0 = 13.63 MPa. (5)
The parameters in the rate constitutive model, equation (4), were calculated from a steady state flow model which is valid for polycrystalline samples of this alloy at temperatures >300~C. For this model the rate coefficient can be written as
a(T) = 3 exp(29.77-21300/T) (6)
where the temperature is in ~K and the factor of three results from the conversion of strain rate to slip rate
G R A I N I N T E R A C T I O N S I N P O L Y C R Y S T A L S
×1
×3 ÷ + +÷ ÷++÷
÷% ÷ ÷÷ ÷ * ÷
÷ ++~ ÷+ ÷
Fig. 3. (111) pole figure showing the 32 initial orientations.
using the approximate Taylor factor. The constant n in equation (4) is 4.75. The cubic elastic constants used in these analyses are typical for commercial purity aluminum C11 = 7924a0, C12 = 4549a0 and C44 = 2076~r 0 [20].
The crystal orientations were not known for the black areas shown in Fig. 2. It was expected that the orientations of these grains would influence the deformation of the internal grains. Rather than skew the results by guessing lattice orientations for these regions, they were modelled as an isotropic J-2 flow theory material following the measured macroscopic hardening relation. It was anticipated that this choice would minimize the error introduced by estimating properties for these grains.
3.2. Boundary conditions
The indentations on the face of the split sample were used to determine the final deformation of the model region. Based on the initial and final coordi- nates of the indentations, the deformation gradient was computed. Due to experimental difficulties during the plane strain compression test, the sample
Table 1. Euler angles for initial orientations
Gra in ~0 0 ~ Gra in q~ 0 q5
A 217.1 155.2 264.3 AI 84.3 152.9 357.1 B 76.3 134.0 355,3 C 27.8 151.8 347.6 D 315.5 162.1 1.8 D1 235.8 153.5 333.9 F 120.6 109.9 338.8 E 349.6 121.4 24.9 E1 64.7 100.5 33.9 G 52.1 115.6 18.9 H 38.9 142.8 342.2 I 255.4 168.6 280.4 J 137.0 131.2 256.7 J ' 149.1 129.9 243.2 J" 141.0 121.7 259.2 K 135.5 130.9 276.1 L 83.8 141.9 351.5 M 85.6 116.7 0.5 N 255.3 142.0 325.1 O 23.4 118.0 11.6 P 98.8 123.2 311.6 Q 91.7 131.6 289.6 R 350.6 150.6 33.1 S 224.6 152.3 298.8 T 295.8 143.9 334.3 U 123.5 118.8 313.1 V 74.6 95.9 12.3 W 37.1 142.6 8.4 X 142.7 113.1 315.2 Y 276.8 164.8 293.5 y / 310.0 165.9 334.2 Z 141.3 132.3 281.7
BECKER and PANCHANADEESWARAN: GRAIN INTERACTIONS IN POLYCRYSTALS 2705
experienced shear in addition to compression [16]. The boundary conditions applied to the model ac- count for this shear. The deformation gradient also indicated a slight rotation of the region and an increased area. The area change may or may not have been real. It could have resulted from local nonzero out-of-plane strain, or it could be due to inaccuracies in the measurement of the indentations.
In order to apply the measured deformation to the model, the deformation gradient was made isochoric by dividing all of the in-plane components of F~i by Det[Fi/]. Another adjustment was made to the defor- mation gradient to facilitate applying the boundary conditions. A rotation of 5 was applied to the model so that the shear occurred parallel to the X~ axis in the model The resulting deformation gradient is
lil 4 01,04 i] F,.z = .0 0.61 . (7)
0
The rigid body rotation does not affect the deformation. However, the predicted pole figures are adjusted by the 5 rotation for comparison with the experiment.
The final shape of the model region is described by the deformation gradient, equation (7), but no infor- mation is available about the deformation path. The path dependence of the texture predictions for this specimen was investigated [21] using a Taylor model. Only minor texture changes were found for different strain paths, so investigation of alternate strain paths was not conducted with the finite element model. The deformation path chosen for the analyses was a constant compressive strain rate combined with a constant XI velocity to impart shear.
The boundary conditions were applied by prescrib- ing the displacements at all points on the boundary. The nodes along the sides of the model were con- strained to lie on lines between the corner nodes with their relative positions along the lines fixed. This reduced the boundary conditions to specifying the displacements on the four corner nodes. The lower
two corner nodes (Fig. 2) were constrained from vertical motion (X~ direction), and displacement in- crements consistent with a constant compressive strain rate of -0 .05 s ~ were applied to the upper corner nodes. An additional constraint equation was used to keep the lengths of the upper and lower surfaces equal. Rigid body motion was prevented by pinning the lower left corner of the model in the X~ direction. The shear was applied by prescribing a constant velocity corresponding to an initial shear rate of -0.0105 s ~ to the upper left corner node. These boundary conditions allowed one degree of freedom on the boundary unconstrained in the X~ direction which permitted free extension of the model.
4. PLANE STRAIN MODEL RESULTS
4.1. Deformed geometry
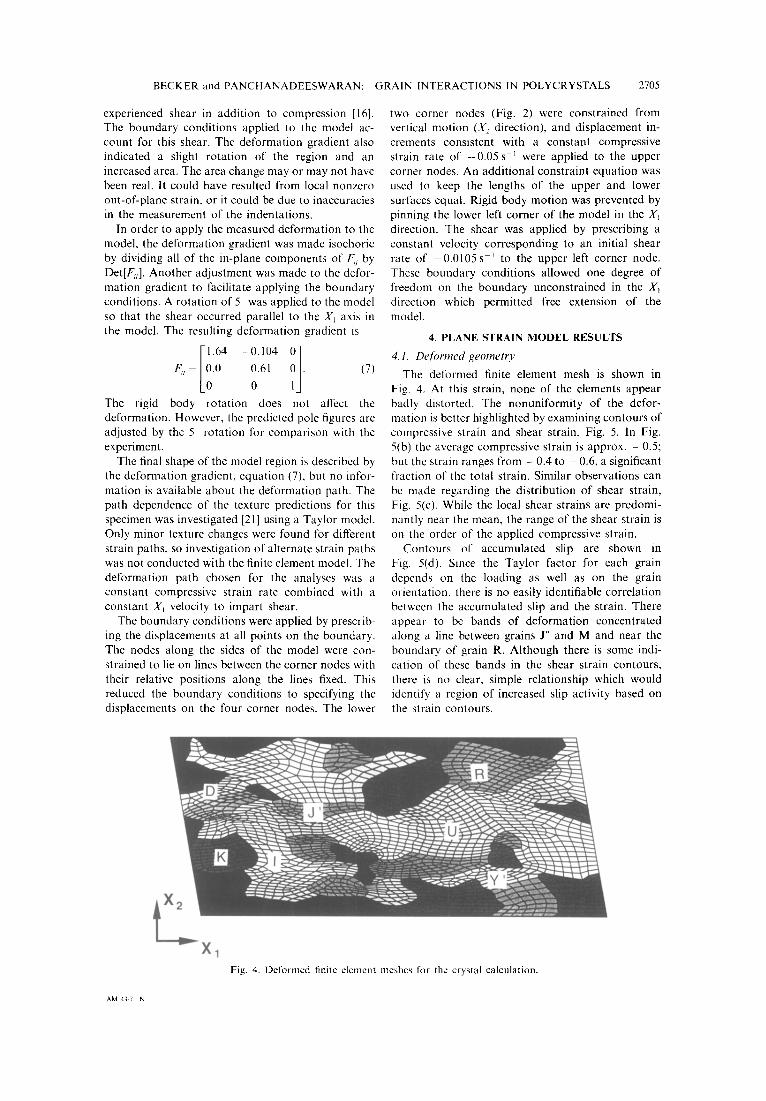
The deformed finite element mesh is shown in Fig. 4. At this strain, none of the elements appear badly distorted. The nonuniformity of the defor- mation is better highlighted by examining contours of compressive strain and shear strain, Fig. 5. In Fig. 5(b) the average compressive strain is approx. -0 .5 ; but the strain ranges from - 0 . 4 to -0 .6 , a significant fraction of the total strain. Similar observations can be made regarding the distribution of shear strain, Fig. 5(c). While the local shear strains are predomi- nantly near the mean, the range of the shear strain is on the order of the applied compressive strain.
Contours of accumulated slip are shown in Fig. 5(d). Since the Taylor factor for each grain depends on the loading as well as on the grain orientation, there is no easily identifiable correlation between the accumulated slip and the strain. There appear to be bands of deformation concentrated along a line between grains J" and M and near the boundary of grain R. Although there is some indi- cation of these bands in the shear strain contours, there is no clear, simple relationship which would identify a region of increased slip activity based on the strain contours.
_ . . , ~ . . . , ~ _ - _ : ~ , . % ~ ~ ~,a,,~m,, ..........
- - m ~ 1 ~ "~" . . . . - - ~ i i ' ~ ' ~ - ~ ' ' - ......... : : : = ~ - -
..... ~------~ ~ , . . , ~ m , ' ~ I ~ ~ ' - , ~ . . a ~ T . . . ~
k ........... ............. - - - - - - - - = = ~ : - _ ~ . , ~ . ~ a : = , ......
E" Fig. 4. Deformed finite element meshes lk)r the crystal calculation.
A M 4217 N

2706 BECKER and P A N C H A N A D E E S W A R A N : G R A I N INTERACTIONS IN POLYCRYSTALS
X
~ 8 ~ 8 ~ °
ro
d.
E
©
o
2 8
8
o
t~ &
.-&
E o
,¢

BECKER and PANCHANADEESWARAN: GRAIN INTERACTIONS IN POLYCRYSTALS 2707
×1
, × 3
Fig. 6. Predicted (I11) pole figure contours depicting the finite element results. The discrete points are predictions
from a Taylor-like model.
4.2. Crystal orientations
The texture predicted by the plane strain finite element model is shown by the contours on the (111) pole figure in Fig. 6. Here, X l denotes the direction of extension and X 3 is the direction with no strain. The finite element results give a discrete crystal orientation at each element integration point. A smooth distribution of intensities was created by constructing a Gaussian intensity distribution around the poles. The discrete symbols on the pole figure are results from a Taylor model simulation using the same initial orientations and applied deformation. In the Taylor model, the strain is the same in each grain. Most of the predicted orientations from the Taylor model lie near the contour peaks from the finite element simulations. However, several of the Taylor model results lie significantly far from the detailed model predictions.
The (111) pole figures in Fig. 7 show the orien- tations from individual elements of several grains from the FE model. The initial orientations are indicated by open circles and the predictions from the Taylor model are depicted by squares. The difference between the predictions of the Taylor model and the finite element model varies from grain to grain. The textures from the detailed model show an orientation spread by a rotation primarily about the X 3 axis, the direction of no strain. The orientation spread ranges from a little in grain L to a large spread in grain U. In all cases, the Taylor model predictions lie within
tThe Taylor model results shown in the experimental pole figures were calculated using an applied strain deter- mined from a larger area of the specimen. Since the local strain was not uniform in the experiment, the average strain over the larger area was different, and the resulting texture predictions are slightly different.
the spread of the FEM results, but not necessarily at the peak orientations.
4.3. Comparison with experiments
The deformed grains from the experiments are shown in Fig. 8. The grain boundaries are difficult to discern from the micrographs so they have been drawn for clarity. The solid lines were drawn along obvious grain boundaries, and the dashed lines were drawn where there was uncertainty in the boundary or sub-boundary location. The calculated results, Fig. 4, do not predict the deformed configuration accurately. The most obvious difference is the shape of grain I which appears highly sheared in the experiment but not in the prediction. The shapes of other grains, such as U and R, are fairly in good agreement.
The orientation distribution within the model region was determined by systematically scanning the specimen with an automated system on an SEM [22]. Orientation measurements at over 5000 discrete locations [16] were obtained from the backscattered electron patterns. A smooth orientation distribution on a (111) pole figure, Fig. 9, was obtained by constructing a Gaussian intensity distribution around each of the poles on the pole sphere. These results can be compared to the predicted pole figure (Fig. 6) which is plotted with the same contour levels. The model texture resembles the experiment, but there are clearly differences in the locations of the peak intensities and the orientation spread.
A comparison of the texture predictions for several individual grains is given in Fig. 10. The experimental results are given by the (111) pole figures on the left and the predictions are on the right. Here, initial orientations are shown by the squares and orien- tations predicted by a Taylor model are indicated by the diamonds. The details of the experimental measurements are given by Panchanadeeswaran et al. [16]t. For both the FE model and the Taylor model, the predictions are in good agreement with the exper- iments for grains A and L; approx. 10-15 ° off for grains J' and O; and substantially in error for grains H, K, I, and U. These grains are indicative of the range of agreement. In general, the FEM results are no closer to the experimental orientations than the Taylor model predictions.
5. QUASI-3D MODEL
In all of the grains with a large predicted orien- tation spread, the lattice rotation is primarily about the X 3 axis. As discussed in an earlier study [14], this rotation may be related to the boundary conditions and grain interactions. While the model allows the lattice to rotate with respect to the material about any axis, material rotations are permitted only about the X 3 axis, and grain interactions occur only in the X~-X 2 plane. Thus, the significant orientation spread

×1
×1
GRAIN INTERACTIONS IN POLYCRYSTALS
X3
×3
Grain L
×1
I i
×3
Grain I
×3
X1
©
Gr: tin A
Grain K
BECKER and PANCHANADEESWARAN:
×1
Grain U
×1
Grain H
X3
2708
X3
Fig. 7. Predicted orientation distributions from individual grains. The circular symbols denote the initial orientations and the squares denote the predictions from a Taylor-like model.
may be related to either material rotations or grain interactions.
In order to investigate the effects of material rotations, a quasi-3D model was employed. Using the same in-plane discretization as the plane strain model, a mesh of 3D elements, one element thick, was constructed (Fig. 11). The elements were predomi- nantly eight node bricks with selective reduce inte- gration for the pressure. Three triangular prism elements were used in place of the plane strain
triangular elements. The boundary conditions applied around the four edges of the model were the same as in the plane strain model. The interior nodes on the faces with normals in the X 3 direction were free to move in the plane (X1 and X2 directions), but not normal to the plane. Thus, shear could occur through the thickness, but the thickness strain was zero.
The plane strain model required q3 = E23 = E 3 3 = 0 as well as constraining material rotations about the

BECKER and PANCHANADEESWARAN: GRAIN INTERACTIONS IN POLYCRYSTALS 2709
Fig. 8. Micrograph of the experimental deformed grain structure. Grain boundaries are drawn for clarity.
X~ and .~ axes. In terms of the deformation gradi- ents, the pointwise constraints on the plane strain model were F13 = F23 = F31 = F32 = 0 and F33 = 1. The constraints on the deformation gradient in the quasi- 3D model were k~ 1 =/~2 = 0 and F33 = 1. Thus, two of the kinematic restrictions were removed in this model. Further reduction of the number of con- straints would require modeling the grains in the X 3 direction. This is not feasible with the current compu- tational facilities.
The compressive strain contours from the quasi-3D model are very similar to those in Fig. 5(b) from the plane strain model. Contours of the out-of- plane shear strains, El3 and [23, are given in Fig. 12 (a and b). These shear strains were constrained to be zero in the plane strain model but were on the order of the compressive strain in the quasi-3D simulation.
×5
×1
Fig. 9. Experimental (l I l) pole figure based on approx. 5000 discrete orientations.
The final orientation distribution from the quasi- 3D model is similar to that from the plane strain model. There are minor differences, primarily in the orientation spread, but the peak orientations are essentially in the same locations. Predicted pole figures for several individual grains are shown in Fig. 13. These can be compared with the plane strain predictions given in Fig 7. The results from the quasi-3D model show a small additional orientation spread by rotations about the Xj and X2 axes, but the predicted textures are not substantially different.
The texture results showed little affect from the additional large shear strains and material rotations. The material rotations about the X1 and X 2 axes appear to have had a different effect than the rota- tions about the )(3 axis. The material rotations were examined by expressing the rotation in the form of an axis-angle pair. In this representation, the rotation from the initial to the final configuration is defined in terms of an axis of rotation and the rotation angle about that axis. The results were analyzed in terms of the projection of this rotation vector along the coor- dinate directions. While the magnitudes of the pro- jected rotations were similar, the distribution of rotations about the X 3 axis is significantly different. The projected rotations on the Xt and X 2 axes were nearly constant within individual grains suggesting that the rotations were primarily due to the natural shear deformation of the crystals. The rotations projected on the X3 axis were not uniform within the grains, highlighting the effects of the in-plane neigh- bor grain interactions on the material rotations. The grain interactions perturb the deformation field and, consequently, the rotations about the normal to the model plane.
6. MODEL OF THE COMPRESSION PLANE
The role that grain interactions may play in the compression plane (X~-X3 plane) was investigated by

(i) Grain A
BECKER and PANCIqANADEESWARAN: GRAIN INTERACTIONS IN POLYCRYSTALS
Initial Orientations o Compression+Shear
~D Measurements
, , q , , ~ ,
TD
TD
RD
G r a i n A
RD
Grain L
o Initial Orientations o Compression +Shear
Measurements RD
2710
G r a i n L Fig. 10(a). Caption on p. 2712.
2"I9
constructing a 2D model in this plane. Since nothing is known about the grain structure or orientation distribution across the J(~ direction for this sample, these were chosen arbitrarily to be the same as in the previous calculations. Here, the grain structure and mesh shown in Fig. 2 were assumed to lie in the Xj-J(~ plane and subjected to compression normal to the plane of the diagram, now the X: direction. Again, no overall strain was permitted in the X~ direction. The crystals had the same initial orientation with respect to the axes of the channel die. Hence, the initial texture for this model was the same as for the previous calculations, but a different planar section was simulated.
The mesh was comprised of generalized plane strain elements which permitted uniform strain normal to the model plane. The compressive strain
rate used in the previous simulations, ~ = - 0 . 0 5 , was applied in the ~ direction. In-plane boundary conditions, consistent with homogeneous plane strain compression, were impose on all boundary points. Extension occurred in the X~ direction, and no overall strain was permitted in the ~y~ direction. As in the previous models, 1 d.f. in the extension direction was unconstrained so that the average stress in that direction was zero. The macroscopic shear imposed on the previous models could not be included here since gradients in the compression direction are not captured by the generalized plane strain elements.
The simulation was run to a 40% thickness reduction, the same as the previous analyses. Strain contours are given in Fig. 14. Although no overall strain was permitted in the )(3 direction, contours of E33 Fig. 14(a) show that the range of lateral strains is

BECKER and PANCHANADEESWARAN:
[] Initial Orientation o Compression+Shear
, ~ r e m e n t s
[ ~ , ' ' ~ T D
Grain H
GRAIN INTERACTIONS IN POLYCRYSTALS
RD
Grain H
2711
TD
RD
[] Initial Orientations
<> C o m p r e s s i o n + Shea
Measurements
TD
Grain K
RD
TD <
Grain K Fig. 10(b). Caption on p. 2712.
a significant fraction of the applied compressive strain. In addition, the range of the shear strain is also on the order of the applied strain, Fig. 14(b).
Pole figures from individual grains are given in Fig. 15. In these plots, the initial orientations are indicated by the circles and the results from the Taylor model calculation are depicted by the squares. It is evident from comparing these results with those from the model of the other plane (Fig. 7) that the predicted grain rotations are different. Crystal rotations in this simulation were primarily about the compression axis, but they were about the axis of no strain in the previous calculation. This supports the hypothesis that the lattice rotations in 2D simulations occur primarily about the axis normal to the model plane.
Comparison of these predicted pole figures with the experimental results given in Fig. 10 shows that the
overall agreement is no better here than for the previous analyses. Predictions for grains J' and L are somewhat better, but those predictions which differed substantially from the experiments in the previous calculations are in no better agreement.
7. EFFECTS OF THE CONSTITUTIVE MODEL
Another reason for the model not predicting the experimental texture may be related to the constitu- tive model. Although the focus of this study is on grain interactions, it is important to demonstrate the type and range of effects that the slip system consti- tutive model has on the predicted texture. Two variations of the constitutive behavior were con- sidered: the latent hardening and the strain rate sensitivity.

RD
Grain I
Initial Orientations Compression+Shear Measurements
:4!!! \ '",' '.' ,i",. ..
G r a i n I
TD
]
o
R D '
[,'"i,' ',,,,~:,,:', <
RD
G r a i r U
[] Initial Orientations <> Compression+Shear
RD ' Measurements
TD
Grain U
Fig. 10(c)
2 7 1 2 BECKER and PANCHANADEESWARAN: GRAIN INTERACTIONS 1N POLYCRYSTALS
TD
Fig. 10. Comparison between the experimentally measured (111) pole figures for individual grains (left) and the results from the finite element simulation (right). The initial orientations are indicated by the
squares and the diamonds show predictions from a Taylor-like model.
Z 1. Latent hardening
In the analyses presented above, Taylor hardening was assumed in which the strength of all slip systems was the same. However, other hardening models may be employed. A common modification to the Taylor hardening model makes the hardening rate on the latent slip systems greater than that of the active slip systems [23]. This increase in latent hardening is based on measured rotation overshoot in tensile tests on single crystals oriented for single slip. A latent hardening rate of 1.4 times the self-hardening rate was selected for all non-coplanar systems. This value was used by Asaro and Needleman [3], and it can
provide a large variation in strength for different slip systems.
The plane strain simulation described in Section 4 was re-run with a latent hardening factor of 1.4. The resulting pole figure is shown in Fig. 16. A compari- son with the previous results (Fig. 6) shows only subtle differences. This latent hardening model has a relatively small effect on the texture in these simu- lations.
Z2. Strain rate sensitivi O'
The behavior of commercial purity aluminum at 375 C is highly rate dependent. If the strain rate

BECKER and PANCHANADEESWARAN: GRAIN INTERACTIONS IN POLYCRYSTALS 2713
X2
X 3
Fig. I i. Mesh of eight-node brick elements used in the Quasi-3D simulation.
sensitivity given by equation (6) is expressed in terms of a power law strain rate sensitivity at the nominal strain rate, the strain ratc exponent is approx. 0.15. In the crystal model, a high strain rate sensitivity permits appreciable slip on systems which may be inactive with a rate independent constitutive relation. For certain loading conditions, the high strain rate sensitivity may retard the lattice rotation rate.
The effect of varying the strain rate sensitivity was explored by replacing the slip rate expression from equation (6) with a power law model
sign(z~) z~ (/in ;,~ = 0.05 - - . q(;')
(8)
The rate sensitivity of 0.01 is significantly different from the previous value.
The (111) pole figure calculated using this lower strain rate sensitivity is shown in Fig. 17. This can be compared with the results from the model using equation (6), (Fig. 6). By examining pole figures for the individual grains (not shown), the grains which had a large orientation spread with the high rate sensitivity exhibit a larger spread with the lower strain rate sensitivity. However. the orientation
spread is still about the Jr3 axis; the contour peaks remain in essentially the same locations: and the predictions are in no better agreement with the experiment.
8. DISCUSSION
8.1. Grain interaction effects
The Taylor model predictions show little lattice rotation during this moderate deformation. The re- sults from the plane strain finite element model, on the other hand, show large rotations, principally about the axis normal to the transverse plane. These are particularly evident in grain U in Figs 7 and 15. The cause of these large orientation changes was explored through other models. The quasi-3D model experienced significant through thickness shear strains and material rotations about other axes, but the lattice rotations were still primarily about an axis normal to the transverse plane. This result indicates that the rapid lattice rotations did not result simply from the kinematic freedom of the material to shear and rotate. Otherwise, large lattice rotations would have occurred about other axes. The results from the 2D model of the compression plane showed lattice rotations primarily about the compression axis, demonstrating that large lattice rotations occur about the normal to the plane which is modeled. Together, the results from these analyses imply that the cause of the large (relative to those in the Taylor model) lattice rotation rates in the finite element simulations is grain interactions. Thus, the most important differ- ence between the finite element model and the Taylor model is grain interactions, not kinematic freedom.
The grain interactions are dictated by the relative resistance of adjacent grains to the applied deform- ation and their preferred deformation mode. Certain orientations can be considerably "'softer" than others. This is particularly evident by examining the strain contours in Figs 5, 12 and 14. Although one of the strains is uniform in each of the models, the results show considerable variation in both shear and normal strains. Larger variations may be possible in 3D deformations where the softer grains have more freedom to deform. Such out-of-plane strains may account for some of the area change associated with the measurements of the indents or for the unusual distortion of grain i in the experiments (Fig. 8). The range of strains predicted by the models is on the order of the applied strain. Whether or not this relative range of strains would persist to very large strains cannot be determined without simulations to large reductions.
The effects of the material model were explored by using a simple latent hardening model and by chang- ing the material strain rate sensitivity model. The latent hardening model made little difference in the predicted grain orientations at this reduction. As expected, the reduced strain rate sensitivity permitted more rapid lattice rotations and more spread in the

2714 BECKER and PANCHANADEESWARAN: GRAIN INTERACTIONS IN POLYCRYSTALS
E13 VALUE
~ . 2 5
~ . 1 5 ~ . 1 0 ~ .05 0 . ~ O.OS 0.10 0.15 0.20 0.25
xQ. a/ Xl
E23 VALUE ~ -0.5 41.4 41.3
41.2
0.0
0.1 0.2
0.3 0,4 0.5
0.6
b) Fig. 12. Results from the quasi-3D simulations: (a) contours of Et3; and (b) contours of e32.
predicted orientations, but the results are not much closer to the experiments. Examination of other changes in the slip system constitutive model may be warranted. Bonneville et al. [24] and Maurice and Driver [25] review evidence of slip on non-compact planes at the high homologous temperatures. Such a radical change in the deformation mechanism may have a significant impact on texture predictions.
8.2. M o d e l validation
Based on the reasonable comparison between some of the experiments and simulations shown in Fig. 10, it is tempting to conclude that the model predicts some of the orientations correctly. However, for grains A and L where the model orientations agree with the experiment, there was little orientation change during deformation. Hence, the model may predict the relative stability of the initial orientation rather than orientation evolution. Many more examples and comparisons with the Taylor model are given by Panchanadeeswaran et al. [15, 16].
One objective of these calculations was to deter- mine ifa detailed finite element model which accounts for grain interactions, compatibility and equilibrium could reproduce measured crystal lattice orientations changes. The results from these 2D simulations did not show good agreement with experiments. How-
ever, this is not necessarily an indictment of the crystal modeling capabilities since the shortcomings may be related to approximations in the boundary conditions. The various simulations presented here demonstrate clearly that the lattice rotations are intricately tied to the material rotations and to the details of the grain interactions. The models used in this study do not account for the 3D grain structure or permit the range of kinematic freedom necessary to compute the proper orientation changes. The constraints used do not allow out of plane strains, and they enforce either zero shear strain or zero shear stress through the thickness. Hence, the failure of these predictions may be due to inappropriate bound- ary conditions, and the crystal model cannot be evaluated properly.
8.3. A hypothesis on texture evolution
In the simulations described above, it was found that the lattice rotations proceed much more rapidly in the experiments than in the Taylor model, and that many of the predicted orientations lie far from the experimental results. This seems contrary to previous findings. The prior results are based on comparisons of texture evolution rates as seen in pole figures representing many grains. In the pole figures, sharp textures develop much more rapidly for the Taylor

orientations, and another force from the neighboring grain interactions adds shears and rotations in order to maintain local compatibility and equilibrium. These interactions would modify the evolution path for crystal orientations and keep the texture diffuse. Thus, even though the crystal lattices rotate more rapidly than predicted by the Taylor model, the crystal orientations are not evolving directly toward preferred orientations. This may make the accumu-
X1
X3
Grain H
X1
X3
XI
Grain L
XI
X3
Grain I
X1
model than in experiments. The present results con- centrate on individual grains. Here, both the exper- iments and the finite element calculations show more rapid grain rotations than predicted by the Taylor model. Similar results are seen in other analyses [14,26].
A hypothesis explaining the apparent contradiction is that several forces act to control the orientation evolution. One force drives the grains toward stable
Grain K
BECKER and PANCHANADEESWARAN: GRAIN INTERACTIONS 1N POLYCRYSTALS 2715
Gra in A
X3
X]
• " 7 . 2 .
L.'N,
Grain U
Fig. 13. Predicted (11l) pole figures for several grains from the quasi-3D simulation.
X3

2716 BECKER and PANCHANADEESWARAN: GRAIN INTERACTIONS IN POLYCRYSTALS
E33 VALUE
i -0.15 -0.12 -0.09 -0.06 -0.03 0.00 0.03 0.06 0.09 0.12 0.15
- ~ - 0.t8
a)
E13 VALUE
i -0.~ -0.24 ~,18 -0.12
0.~ 0.~ 0.12 0.10 0.24 0.30
b) Fig. 14. Results from the model of the compression plane: (a) contours of strain in the constraint direction;
and (b) contours of shear strain in the normal plane.
lation of grains in preferred orientations slower, giving the appearance of slower texture evolution in experiments.
Due to the interactions, grains in otherwise stable orientations may be forced to rotate, depending on their stability relative to the grain interaction forces [26]. In the experiments [15, 16], grains H, K (Fig. 2) and several others were near orientations which are normally considered to be stable, but these orien- tations changed dramatically. In addition, the altered path may take a grain near other relatively stable orientations, leading to textures not achievable by a direct path (perhaps the rapid evolution of the brass orientation). Over time, however, special compatibil- ity relationships may develop among grains, dimin- ishing the effects of the grain interactions relative to the driving force toward stable orientations. This would lead to a larger fraction of the grains lying near
(or at least pausing near) stable orientations at large strains.
The results also raise questions as to why the polycrystal texture evolution models provide reason- able predictions of orientation distributions. The explanation may lie in the large number of grains usually sampled in these comparisons. Grains evolve to "stable" orientations in both experiments and polycrystal model simulations. Due to the pertur- bations caused by grain interactions, predictions of the orientation path and final orientation of any particular grain may be in error. However, these errors may not be evident for simulations involving large numbers of grains as long as the correct types of stable orientations are predicted. The polycrystal models will place some grains in the stable orien- tations, and texture predictions might appear reason- able. The volume fractions of grains in the various

BECKER and PANCHANADEESWARAN: GRAIN INTERACTIONS IN POLYCRYSTALS 2717
stable orientations may not be predicted correctly. Thus, the models may provide some statistical rep- resentation of a possible stable orientation distri- bution rather than a deterministic prediction. If this is true, it would limit the models ' utility for establish- ing evolution paths for individual orientations and for predicting precise volume fractions in orientation distribution functions.
While these experimental results and the simu- lations are compatible with the hypothesis of a convoluted evolution path described above, they are
limited in terms of the number of grains and the range of strains. Addit ional tests considering more grains and larger strains would be necessary for experimen- tal confirmation.
8.4. Implications Jbr polycrystal models
Although the more traditional polycrystal texture evolution models employ many simplifications to make them computationally tractable, their successes and usefulness cannot be questioned. As with any model, however, knowledge of the effects of the
XI
Grain H
×5
X1
Gr, lin L
X3
X1
Grain I
×3
XI
°
X3
Grain K
X1
Grain A
×5
×1
Grain U
×3
Fig. 15. Predicted (1 l 1) pole figures for several grains from the simulation of the normal plane.

2718 BECKER and PANCHANADEESWARAN: GRAIN INTERACTIONS IN POLYCRYSTALS
simplifying assumptions is useful in interpreting the results and in developing models with better predictive capabilities.
In Taylor-like models the deformation is pre- scribed for each grain in order to satisfy compatibil- ity. The FEM results suggest that such rigorous enforcement of compatibility may be too restrictive. Similar concerns have lead to development of relaxed constraint models [4, 5]. Arguments for omitting cer- tain shear compatibility conditions in these models have focused on grain shapes. It is suggested that if the grains are long and flat, the bulk of a grain deforms as if certain shear strain components are not constrained by the neighboring grains. The FEM results show that large variations in shear strain are also possible with equiaxed grains. In addition, the large variations in normal strain components suggest that restrictions on these strains could also be relaxed somewhat.
However, the results of the finite element model also show that simply permi t t ing additional shear strains is not sufficient to induce the proper lattice rotations. The quasi-3D model which permitted shear strains gave texture predictions very similar to those of the plane strain model. Proper prediction of lattice rotation requires accounting for grain interactions which drive the additional strains and rotations. Thus, simple relaxed constraint models may not improve predictions for the evolution of individual grain orientations. However, there may still be ad- vantages in using such models for predicting overall textures at large strains.
Self-consistent models permit some strain vari- ations between grains and still satisfy compatibility and equilibrium in an average sense. However, be- cause of stiff interaction constraints in many of these models, the predicted textures are often similar to those of a Taylor model [27]. A version of the self- consistent model by Molinari et al. [l l] employs a
×1
X5
Fig. 16. Predicted (111) pole figures for latent hardening q= 1.4.
×1
Fig. 17. Predicted (111) pole figures using lower strain rate sensitivity given by equation (12).
reduced constraint modulus which permits a wider range of strains among the grains. Based on the present results, the range of strains that they predict seems reasonable. Another attractive feature of their self-consistent model is that the environment with which a grain interacts can be comprised of a small set of grains. This permits the influence of a specific set of neighbor grains to be incorporated. Further exploration of this model is warranted.
A more numerical approach to include grain inter- actions and to satisfy compatibility and equilibrium has been used by Kalidindi et al. [28]. In this model, a regular finite element mesh is constructed and one grain orientation is assigned per element. Their re- suits show a spread of orientations which is not typically seen in Taylor model simulations and a somewhat different texture. This technique was ap- plied to the small set of grains used in the more detailed analysis presented above. The results differed from those of both the Taylor model and the detailed FEM solution. Considering the importance of grain interactions in these simulations, however, this is not unexpected. For simulations involving large numbers of grains, the predicted orientation distributions may match experimental results more closely. This model seems promising, and solutions including a reason- able number of grains are readily achievable with current computational resources.
9. CLOSING REMARKS
Further detailed experimental and modeling efforts are needed to achieve a better understanding of the effects of grain interactions on local orientation evol- ution. The analyses presented here indicate that 2D simulations of 3D microstructures may be in- adequate. This suggests the necessity of either per- forming 3D analysis or conducting 2D experiments, possibly using columnar grain material.

BECKER and PANCHANADEESWARAN: GRAIN INTERACTIONS IN POLYCRYSTALS 2719
Acknowh, dgements The assistance of T. N. Rouns and W. H. Harris in generating the FE mesh was greatly appreciated.
REFERENCES
1. G. I. Taylor, J. Inst. Metals 62, 307 (1938). 2. J. F. W. Bishop and R. Hill, Phil. Mag. 42, I298 (1951). 3. R. J. Asaro and A. Needleman, Aeta metall. 33, 923
(1985). 4. H. Honneff and H. Mecking, in Textures of Materials,
Proc. ICOTOM 5, Aehen (edited by G. Gottstein and K. Lficke), Vol. 1, 265 pp. Springer, Berlin (1978).
5. U. F. Kocks and G. R. Canova, in Deformation in Poly- crystals (edited by N. Hansen, A. Horsewell, T. Leffers and H. Lilholt), p. 315. Riso National Laboratory, Denmark (1981).
6. A. V. Hershey, J. appl. Mech. 76, 241 (1954). 7. J. W. Hutchinson, J. Mech. Phys. Solids" 12, 11 (1964). 8. T. lwakuma and S. Nemat-Nasser, Proc. R. Soc. Lond.
394, 87 (1984). 9. G. Sachs, Z. Verein Deut. lng. 72, 734 (1928).
10. U. F. Kochs, C. Tom6 and G. R. Canova, in Large Deformations o/'Solids: Physical Basis and Mathematical Modelling (edited by J. Gittus, J. Zarka and S. Nemat- Nasser), p. 99. Elsevier, New York (1986).
1 I. A. Molinari, G. R. Canova and S. Ahzi, Acta metall. 35, 2983 (1987).
12. A. Skalli, R. Fortunier, R. Fillit and J. H. Driver, Acta metall. 33, 997 (1985).
13. S. V. Harren and R. J. Asaro, J. Mech. Phys. Solids 37, 191 (1989).
14. R. Becker, Acta metall. 39, 1211 (1991). 15. S. Panchanadeeswaren and R. D. Doherty, Scripta
metall mater. 28, 213 (1993). 16. S. Panchanadeeswaren, R. D. Doherty and R. Becker,
Submitted for publication. 17. D. Peirce, R. J. Asaro and A. Needleman, Acta metall.
31, 1951 (1983). 18. ABAQUS User's Manual, V-4.8. Hibbitt, Karlsson &
Sorensen. Providence, R.I. (1989). 19. R. E. Smelser and R. Becker, Proc. ABAQUS User's
Conference. Hibbitt, Karlsson & Sorensen, Providence, R.I. (1989).
20. Smithells Metals" ReJerence Book (edited by E. A. Brandies), 6th edn, pp. 5 15. Butterworths, London (1983).
21. S. Panchanadeeswaren, unpublished research. 22. B. L. Adams, S. 1. Wright and K. Kunze, Metall. Trans.
A24, 891 (1993). 23. U. F. Kocks and T. J. Brown, Acta metall. 14, 87 (1966). 24. J. Bonneville, D. Caillard, M. Carrad and J. L. Martin,
Rev. Phys. Appl. 23, 461 (1988). 25. CI. Maurice and J. H. Driver, Acta metall, mater. 41,
1653 (1993). 26. R. Becker and L. A. Lalli, Tex. Microstruct. 14, 145
(1991). 27. S. V. Harren, J. Mech. Phys. Solids 39, 361 (199l). 28. S. R. Kalidindi, C. A. Bronkhorst and L. Anand,
J. Mech. Phys. Solids 40, 537 (1992).