CONSERVATION GENETICS OF SHARKS A DISSERTATION ...
95
CONSERVATION GENETICS OF SHARKS A DISSERTATION SUBMITTED TO THE GRADUATE DIVISION OF THE UNIVERSITY OF HAWAIʻI AT MĀNOA IN PARTIAL FULFILLMENT OF THE REQUIREMENTS FOR THE DEGREE OF DOCTOR OF PHILOSOPHY IN MARINE BIOLOGY (ECOLOGY, EVOLUTION AND CONSERVATION BIOLOGY) DECEMBER 2020 By Derek W. Kraft Dissertation Committee: Brian Bowen, Chairperson Kim Holland Jeff Drazen Zac Foresman Robert Thomson, University Representative
-
Upload
khangminh22 -
Category
Documents
-
view
1 -
download
0
Transcript of CONSERVATION GENETICS OF SHARKS A DISSERTATION ...

CONSERVATION GENETICS OF SHARKS
A DISSERTATION SUBMITTED TO THE GRADUATE DIVISION OF THE UNIVERSITY OF HAWAIʻI AT MĀNOA IN PARTIAL FULFILLMENT OF
THE REQUIREMENTS FOR THE DEGREE OF
DOCTOR OF PHILOSOPHY
IN
MARINE BIOLOGY (ECOLOGY, EVOLUTION AND CONSERVATION
BIOLOGY)
DECEMBER 2020
By
Derek W. Kraft
Dissertation Committee: Brian Bowen, Chairperson
Kim Holland Jeff Drazen
Zac Foresman Robert Thomson, University Representative
ii
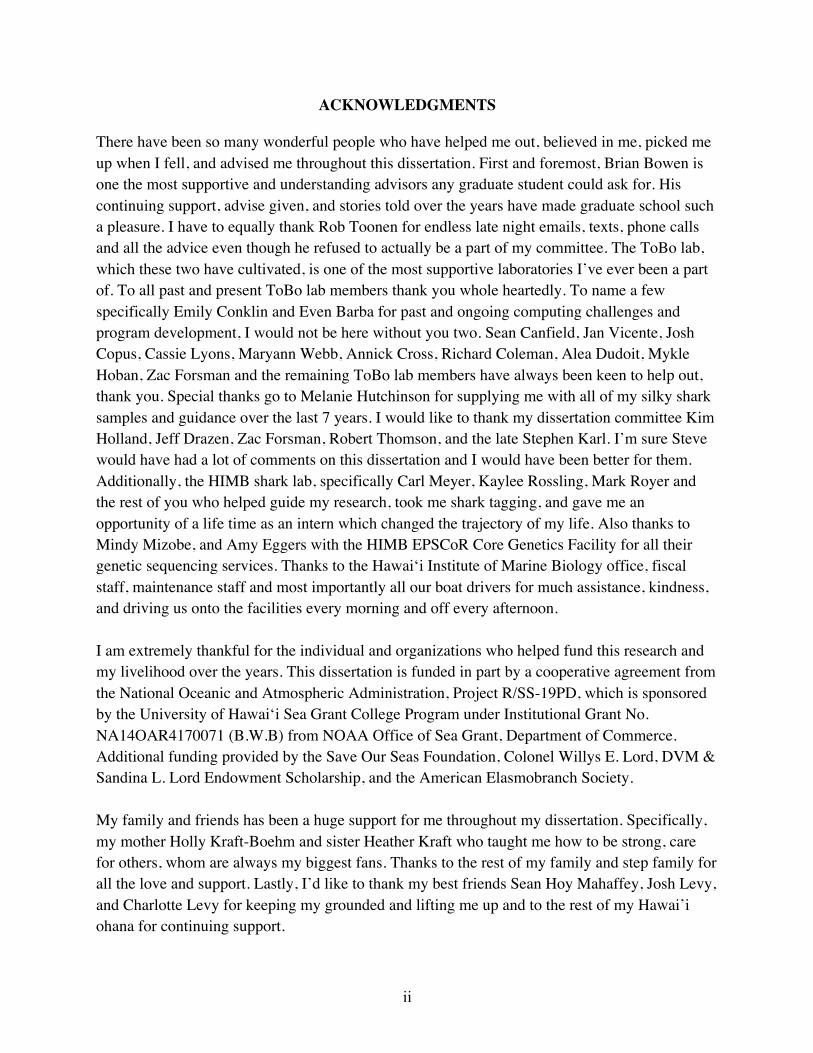
ACKNOWLEDGMENTS
There have been so many wonderful people who have helped me out, believed in me, picked me up when I fell, and advised me throughout this dissertation. First and foremost, Brian Bowen is one the most supportive and understanding advisors any graduate student could ask for. His continuing support, advise given, and stories told over the years have made graduate school such a pleasure. I have to equally thank Rob Toonen for endless late night emails, texts, phone calls and all the advice even though he refused to actually be a part of my committee. The ToBo lab, which these two have cultivated, is one of the most supportive laboratories I’ve ever been a part of. To all past and present ToBo lab members thank you whole heartedly. To name a few specifically Emily Conklin and Even Barba for past and ongoing computing challenges and program development, I would not be here without you two. Sean Canfield, Jan Vicente, Josh Copus, Cassie Lyons, Maryann Webb, Annick Cross, Richard Coleman, Alea Dudoit, Mykle Hoban, Zac Forsman and the remaining ToBo lab members have always been keen to help out, thank you. Special thanks go to Melanie Hutchinson for supplying me with all of my silky shark samples and guidance over the last 7 years. I would like to thank my dissertation committee Kim Holland, Jeff Drazen, Zac Forsman, Robert Thomson, and the late Stephen Karl. I’m sure Steve would have had a lot of comments on this dissertation and I would have been better for them. Additionally, the HIMB shark lab, specifically Carl Meyer, Kaylee Rossling, Mark Royer and the rest of you who helped guide my research, took me shark tagging, and gave me an opportunity of a life time as an intern which changed the trajectory of my life. Also thanks to Mindy Mizobe, and Amy Eggers with the HIMB EPSCoR Core Genetics Facility for all their genetic sequencing services. Thanks to the Hawai‘i Institute of Marine Biology office, fiscal staff, maintenance staff and most importantly all our boat drivers for much assistance, kindness, and driving us onto the facilities every morning and off every afternoon. I am extremely thankful for the individual and organizations who helped fund this research and my livelihood over the years. This dissertation is funded in part by a cooperative agreement from the National Oceanic and Atmospheric Administration, Project R/SS-19PD, which is sponsored by the University of Hawai‘i Sea Grant College Program under Institutional Grant No. NA14OAR4170071 (B.W.B) from NOAA Office of Sea Grant, Department of Commerce. Additional funding provided by the Save Our Seas Foundation, Colonel Willys E. Lord, DVM & Sandina L. Lord Endowment Scholarship, and the American Elasmobranch Society. My family and friends has been a huge support for me throughout my dissertation. Specifically, my mother Holly Kraft-Boehm and sister Heather Kraft who taught me how to be strong, care for others, whom are always my biggest fans. Thanks to the rest of my family and step family for all the love and support. Lastly, I’d like to thank my best friends Sean Hoy Mahaffey, Josh Levy, and Charlotte Levy for keeping my grounded and lifting me up and to the rest of my Hawai’i ohana for continuing support.
iii
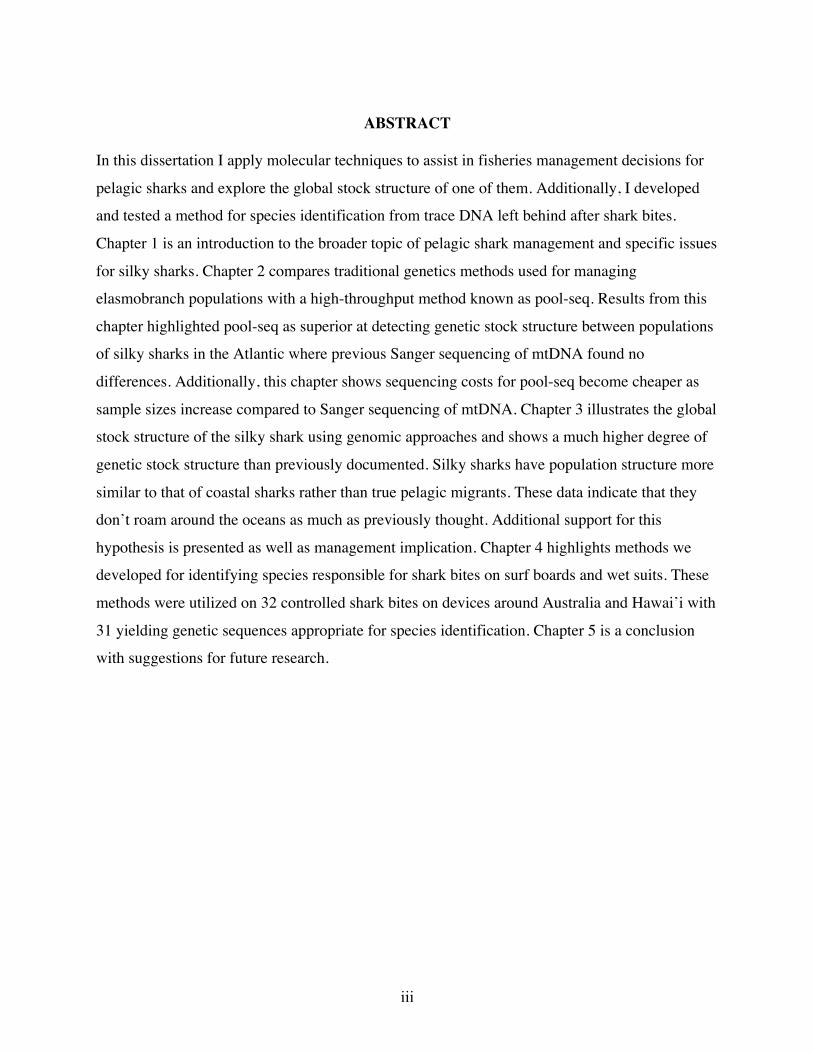
ABSTRACT
In this dissertation I apply molecular techniques to assist in fisheries management decisions for
pelagic sharks and explore the global stock structure of one of them. Additionally, I developed
and tested a method for species identification from trace DNA left behind after shark bites.
Chapter 1 is an introduction to the broader topic of pelagic shark management and specific issues
for silky sharks. Chapter 2 compares traditional genetics methods used for managing
elasmobranch populations with a high-throughput method known as pool-seq. Results from this
chapter highlighted pool-seq as superior at detecting genetic stock structure between populations
of silky sharks in the Atlantic where previous Sanger sequencing of mtDNA found no
differences. Additionally, this chapter shows sequencing costs for pool-seq become cheaper as
sample sizes increase compared to Sanger sequencing of mtDNA. Chapter 3 illustrates the global
stock structure of the silky shark using genomic approaches and shows a much higher degree of
genetic stock structure than previously documented. Silky sharks have population structure more
similar to that of coastal sharks rather than true pelagic migrants. These data indicate that they
don’t roam around the oceans as much as previously thought. Additional support for this
hypothesis is presented as well as management implication. Chapter 4 highlights methods we
developed for identifying species responsible for shark bites on surf boards and wet suits. These
methods were utilized on 32 controlled shark bites on devices around Australia and Hawai’i with
31 yielding genetic sequences appropriate for species identification. Chapter 5 is a conclusion
with suggestions for future research.
iv
TABLE OF CONTENTS
Acknowledgments ......................................................................................................................... ii Abstract…...................................................................................................................................... iii Table of Contents........................................................................................................................... iv Chapter 1 Introduction.................................................................................................................... 1 Chapter 2 Genomics versus mtDNA for Resolving Stock Structure in the Silky Shark (Carcharhinus falciformis)............................................................................................................. 9 Chapter 3 Strong population structure in the Silky shark (Carcharhinus falciformis) defies expectations for a pelagic shark, and confounds current management regimes.......................... 40 Chapter 4 Who bit my board: Identifying species with DNA barcodes from shark bites............. 69 Chapter 5 Conclusion and future direction................................................................................... 82 Chapter 6 Epilogue: Personal Perspective................................................................................... 90
1
CHAPTER ONE
Introduction
Pelagic sharks present special challenges for wildlife managers. Many species range over multiple
Exclusive Economic Zones (EEZ) and into the open ocean, therefore beyond the control of national
jurisdictions. This makes it very difficult to monitor stocks, estimate biomass, and implement law
enforcement (Dulvy et al. 2008). Even though pelagic sharks have been widely exploited, landings
are poorly reported in fisheries records (Baum et al. 2003; Clarke et al. 2006a). Few sharks have
long term catch data, and those which do show severe decline. Even in areas where some
management is implemented, such as the Northwest Atlantic, population numbers have dropped
by >50% (Baum et al. 2003). This invokes concerns about more severe declines in areas with
minimal monitoring.
One major driver for population declines is the demand for shark fins; with an estimated harvest
of 26-73 million sharks annually (Clarke et al. 2006a). This intense fishing pressure is
unsustainable for most species, the top three being the Blue shark (Prionace glauca), Silky shark
(Carcharhinus falciformis), and Dusky shark (Carcharhinus obscurus) (Bonfil 1994; Clarke et
al. 2006b). It’s a highly non-reported and non-regulated fishery. Shark fins can be valued up to
US $700 per kilogram, however shark meat (and the rest of the carcass) is of little value and is
often discarded at sea without being added to catch statistics (Clarke 2004). Therefore, there is
little to no information on extraction rates to monitor mortality and accurately assess the impacts
of these fisheries.
2
Pelagic sharks have a low intrinsic rate of population increase, due in large part to low fecundity
(K-selected). Late maturity (average = 11, range 2-21 years) and long life spans (8-65 years) make
them susceptible to over harvest with low rate of recovery (Dulvy et al. 2008). This contrasts with
short lived teleost fish such as tunas targeted in fisheries that typically yield the highest shark
bycatch ,(Stevens et al. 1999; Schindler et al. 2002). Therefore, fishing efforts which are regulated
for short-lived, highly-fecund pelagic teleost fish also catch long-lived pelagic sharks. This is
alarming due to the high intensity of these fisheries and sharks susceptibility to population crashes
(Musick et al. 2000; Baum et al. 2003).
Silky sharks are the second most commonly harvested shark on earth, one of the three most
important sharks in the fin trade, and the most common bycatch in purse-seine fisheries around the
world (Clarke et al. 2006b; Oliver et al. 2015). This pelagic shark, formerly abundant in all tropical
oceans, has declined by an estimated 85% in the last 19 years (IUCN 2020). Incidental catch in
tuna industries is a large contributor to the decline of the Silky shark populations. Silky shark
habitats overlap with commercial tuna fisheries and they account for >90% of the shark bycatch
in tropical purse seine fisheries in the western and central Pacific (Clarke 2011; Lawson 2011).
Silky sharks are subject to targeted fisheries in the Eastern Pacific and Indian Oceans (Bonfil
2009). A recent stock assessment of Silky sharks in the Pacific Ocean found that spawning
biomass, total biomass, and recruitment have all declined, indicating that fishing mortality has
surpassed the maximum sustainable yield (Rice and Harley 2013). Globally, this species is
classified as Near Threatened by IUCN (IUCN 2020) and may locally meet criteria for vulnerable
3
status in the East, Central and Southeast Pacific (Galván-Tirado et al. 2013). Overall this species
is in decline and further mismanagement could lead to unrecoverable population crashes.
Managing a harvestable resource on a stock-specific basis is crucial (Dizon et al. 1993), yet stock-
specific management goals are hard to achieve for sharks, given that few species have genetic data
or other means to define stocks. Thus far the standard for examining global population dynamics
for shark and large fish species, including Silky sharks, has been examining single nucleotide
polymorphisms (SNPs) across the mitochondrial control region (mtCR) (Duncan et al. 2006;
Castro et al. 2007; Benavides et al. 2011; Daly-Engel et al. 2012). The mtCR is a non-coding
segment in the mitochondrial genome; in Silky sharks it’s about 1069 bp long. Clarke et. al. 2015
examined 276 Silky sharks specimens from the western Atlantic, Indo-Pacific and the Red Sea,
finding 34 polymorphic sites across the mtCR (Clarke et al. 2015). They found that Indo-Pacific
and Atlantic Ocean populations were strongly differentiated. However, no significant differences
were detected between the North Atlantic, Gulf of Mexico, and Brazil. Additionally, Galvan-Tirdo
et. al. (2013) examined the mtCR of 353 Silky sharks across the Pacific and found low but
significant population structure between the eastern and western Pacific. Both of these studies
revealed population partitions on the larger scales of ocean basins but found no evidence of smaller
scale variation. Examining the mtCR alone could be missing population partitions that can be
identified using more advanced molecular methods.
Next-generation sequencing (NGS) has shown to be a very powerful tool for examining genetic
diversity. These useful methods however can be costly, especially when examining a high number
of individuals. Since allele frequency estimates are the key to population genetics, pooling samples

4
before sequencing is an affordable alternative for large scale genetic analysis (Schlötterer et al.
2014). Several studies have examining population structure using a pooled site-associated DNA
approach known as ezRAD, which was developed in our lab (Toonen et al. 2013), but when pooled,
is referred to as Pool-Seq (Zhu et al. 2012; Gautier et al. 2013; Lynch et al. 2014). This approach
is much different than those that have previously examined population structure of Silky sharks.
Therefore, a comparison of methods between the standard mtCR analysis and newly developed
Pool-Seq approach could provide insight into fine-scale genetic partitions and prove a valuable
tool for examining population structure at a larger scale. This will aid in proper management of
this ecological and economically important species.
Not only are sharks harvested for food or as by catch in other fisheries, they also can be killed to
ease the minds of humans who fear them. Shark culls have been a knee jerk reaction to shark bites
on humans for decades. The theory being the lower the number of sharks in the water, the lower
number of shark bites, although those statistics have never been significant (Clua, 2019). It’s also
commonly thought that there is one ‘problem individual’, and by culling 1000’s you have good
chances of killing the ‘one’ and you have made humankind safer. This theory also has no science
to back it up.
Human shark interactions resulting in a shark biting a human or their equipment are unfortunate
and poorly understood events. Properly reporting all available information usually results in
insufficient data to identify the species responsible. Even in an era of technology and data
exchange, 70% of shark bites from 2010-2019 are still listed as species unknown according to
International Shark Attack Files at the Florida Museum of Natural History (ISAF;
5
https://www.floridamuseum.ufl.edu/shark-attacks/). It is possible to identify species responsible
from shark tooth impressions, but results from these techniques are disputed among the experts in
the field (Clua and Reid 2013; Clua et al. 2014; Clua and Séret 2015; Tirard et al. 2015; Duarte-
Neto et al. 2019). However modern DNA technology provides a potential tool for definitive
species identification, provided sufficient DNA is transferred from the shark to the victim or
victim’s articles (e.g. surfboard, wetsuit, paddle) and adheres despite immersion in seawater.
Forensic genetics has been widely used to detect protected species in illegal markets (Baker 2000;
Roman and Bowen 2000) and to detect mislabeled foodstuffs (Marko et al. 2011; Quinto et al.
2016), including sharks (Cardeñoza 2019; Hobbs et al. 2019). Proper identification of species
involved in shark bites could lead to mitigation strategies keeping people out of the mouths of
sharks and hopefully digress from the idea that a shark cull is the answer to reduce shark bites.
For this dissertation I used the same Silky shark samples as Clarke et. al 2015 and examined
population structure using Pool-Seq libraries. Three locations from the Atlantic; Golf of Mexico,
Northern Atlantic, and Brazil, as well as one geographically separated location; the Red Sea, were
examined. Genetic libraries have been sequenced and a bioinformatics pipeline was slowly
developed over the lifespan of the project. This chapter has been accepted and is in press for
publication in PeerJ. To complete my global genomic survey, co-P.I. Hutchinson assembled a
network of scientific observers to collect specimens while aboard commercial fishing vessels. With
>2,000 specimens from almost all ocean basins in which silky sharks are present, I quantified
global stock structure of the silky shark. This manuscript will be submitted to the journal Fish and
Fisheries shortly after defending my PhD. Finally, I developed molecular tools to identify species
responsible for shark bites on surf boards and wet suits. Molecular kits were tested and validated
6
here on O’ahu, then 100 swabs and vials were sent to collect shark bite impressions from multiple
circumstances and species around the continent of Australia. These samples validate the methods
developed and demonstrate a practical tool for forensic identification of shark species from their
saliva. It is my hope that these three components of shark conservation genetics will improve the
prospects for recovery and prosperity of predators that are essential to the health of marine
ecosystem around the world.
Literature Cited:
Abercrombie DL, Clarke SC, Shivji MS (2005) Global-scale genetic identification of hammerhead sharks: Application to assessment of the international fin trade and law enforcement. Conserv Genet 6:775–788. doi: 10.1007/s10592-005-9036-2
Baker CS (2000) Predicted decline of protected whales based on molecular genetic monitoring of Japanese and Korean markets. Proc Roy Soc Lond B 267:1191 - 1199.
Baker CS (2008) A truer measure of the market: The molecular ecology of fisheries and wildlife trade. Mol Ecol 17:3985–3998. doi: 10.1111/j.1365-294X.2008.03867.x
Baum JK, Myers RA, Kehler DG, Worm B, Harley SJ, Doherty PA (2003) Collapse and conservation of shark populations in the Northwest Atlantic. Science 299:389–392. doi: 10.1126/science.1079777
Benavides MT, Horn RL, Feldheim KA, Shivji MS, Clarke SC, Wintner S, Natanson L, Braccini M, Boomer JJ, Gulak SJB, Chapman DD (2011) Global phylogeography of the dusky shark Carcharhinus obscurus: Implications for fisheries management and monitoring the shark fin trade. Endanger Species Res 14:13–22. doi: 10.3354/esr00337
Bonfil R (1994) Overview of world elasmobranch fisheries. FAO Fisheries Technical Paper No. 341. Rome. 119 pp.
Bonfil R (2009) The Biology and Ecology of the Silky Shark, Carcharhinus falciformis. In: Sharks of the Open Ocean: Biology, Fisheries and Conservation. pp 114–127
Bowen BW, Grant WS, Hillis-Starr Z, Shaver DJ, Bjorndal KA, Bolten AB, Bass AL (2007) Mixed-stock analysis reveals the migrations of juvenile hawksbill turtles (Eretmochelys imbricata) in the Caribbean Sea. Mol Ecol 16:49–60. doi: 10.1111/j.1365-294X.2006.03096.x
Cardeñoza D (2019) Genetic identification of threatened shark species in pet food and beauty care products. Conserv Genetics 20:1383 - 1387.
Castro ALF, Stewart BS, Wilson SG, Hueter RE, Meekan MG, Motta PJ, Bowen BW, Karl SA (2007) Population genetic structure of Earth’s largest fish, the whale shark (Rhincodon typus). Mol Ecol 16:5183–5192. doi: 10.1111/j.1365-294X.2007.03597.x
Chapman DD, Pinhal D, Shivji MS (2007) Tracking the fin trade genetic stock identification in western Atlantic S. lewini.pdf. Anim Conserv 10:199–207.
Clarke CR, Karl SA, Horn RL, Bernard AM, Lea JS, Hazin FH, Prodöhl PA, Shivji MS (2015) Global mitochondrial DNA phylogeography and population structure of the silky shark, Carcharhinus falciformis. Mar Biol 162:945–955. doi: 10.1007/s00227-015-2636-6
Clarke S (2004) Understanding pressures on fishery resources through trade statistics: A pilot study of four products in the Chinese dried seafood market. Fish Fish. 5:53–74.
Clarke S (2011) A status snapshot of key shark species in the Western and Central Pacific and potential

7
management options. Seventh Regul Sess Sci Comm WCPFC, Pohnpei, FSM:1–37. Clarke SC, McAllister MK, Milner-Gulland EJ, Kirkwood GP, Michielsens CGJ, Agnew DJ, Pikitch EK,
Nakano H, Shivji MS (2006a) Global estimates of shark catches using trade records from commercial markets. Ecol Lett 9:1115–1126. doi: 10.1111/j.1461-0248.2006.00968.x
Clarke SC, Magnussen JE, Abercrombie DL, McAllister MK, Shivji MS (2006b) Identification of shark species composition and proportion in the Hong Kong shark fin market based on molecular genetics and trade records. Conserv Biol 20:201–211. doi: 10.1111/j.1523-1739.2005.00247.x
Clua E, Reid D (2013) Features and motivation of a fatal attack by a juvenile white shark, Carcharodon carcharias, on a young male surfer in New Caledonia (South Pacific). J Forensic Leg Med 20:551–554.
Clua E, Séret B (2015) Species identification of the shark involved in the 2007 Lifou fatal attack on a swimmer: A reply to Tirard et al. (2015). J Forensic Leg Med 40:58–60.
Clua E, Bescond P-M, Reid D (2014) Fatal attack by a juvenile tiger shark, Galeocerdo cuvier, on a kitesurfer in New Caledonia (South Pacific). J Forensic Leg Med 25:67–70.
Clua EEG, Linnell JDC (2019) Individual shark profiling: An innovative and environmentally responsible approach for selectively managing human fatalities. Conserv Lett 12:1–8. doi: 10.1111/conl.12612
Daly-Engel TS, Seraphin KD, Holland KN, Coffey JP, Nance HA, Toonen RJ, Bowen BW (2012) Global phylogeography with mixed-marker analysis reveals male-mediated dispersal in the endangered scalloped hammerhead shark (Sphyrna lewini). PLoS One 7:e29986. doi: 10.1371/journal.pone.0029986
Dizon AE, Lockyer C, Perrin WF, Demaster DP, Sisson J (1993) Rethinking the stock concept: a phylogeographic approach. Biol Conserv 64:176–177. doi: 10.1016/0006-3207(93)90670-V
Duarte-Neto P, Rodrigues J, Lessa R (2019) Shape analysis of shark jaws as a tool to identify species involved in incidents with humans. J Forensic Leg Med 64:23–27.
Dulvy NK, Baum JK, Clarke S, Compagno LJV, Cortés E, Domingo A, Fordham S, Fowler S, Francis MP, Gibson C, Martínez J, Musick JA, Soldo A, Stevens JD, Valenti S (2008) You can swim but you can’t hide: The global status and conservation of oceanic pelagic sharks and rays. Aquat Conserv Mar Freshw Ecosyst 18:459–482. doi: 10.1002/aqc.975
Duncan KM, Martin AP, Bowen BW, De Couet HG (2006) Global phylogeography of the scalloped hammerhead shark (Sphyrna lewini). Mol Ecol 15:2239–2251. doi: 10.1111/j.1365-294X.2006.02933.x
Galván-Tirado C, Díaz-Jaimes P, García-de León FJ, Galván-Magaña F, Uribe-Alcocer M (2013) Historical demography and genetic differentiation inferred from the mitochondrial DNA of the silky shark (Carcharhinus falciformis) in the Pacific Ocean. Fish Res 147:36–46. doi: 10.1016/j.fishres.2013.03.020
Gautier M, Foucaud J, Gharbi K, Cézard T, Galan M, Loiseau A, Thomson M, Pudlo P, Kerdelhué C, Estoup A (2013) Estimation of population allele frequencies from next-generation sequencing data: Pool-versus individual-based genotyping. Mol Ecol 22:3766–3779. doi: 10.1111/mec.12360
Hobbs CAD, Potts RWA, Walsh MB, Usher J, Griffiths AM (2019) Using DNA barcoding to investigate patterns of species utilisation in UK shark products reveals threatened species on sale. Sci Reports 9:1028 DOI 10.1038/s41598-018-38270-3.
IUCN IU for the C of N (2020) IUCN Red List of Threatened Species. In: Version 2013.1. http://www.iucnredlist.org/about/overview.
Kraft DW, Conklin EE, Barba E, Hutchinson M, Toonen RJ, Forsman ZH, Bowen BW. 2020. Genomics versus mtDNA for resolving stock structure in the silky shark (Carcharhinus falciformis). PeerJ 8:e10186 DOI 10.7717/peerj.10186
Lawson T (2011) Estimation of catch rates and catches of key shark species in tuna fisheries of the Western and Central Pacific Ocean using observer data. Seventh Regul Sess Sci Comm WCPFC, Pohnpei, FSM:1–52.
Lynch M, Bost D, Wilson S, Maruki T, Harrison S (2014) Population-genetic inference from pooled-sequencing data. Genome Biol Evol 6:1210–1218. doi: 10.1093/gbe/evu085
8
Marko PB, Nance HA, Guynn KD (2011) Genetic detection of mislabeled fish from a certified sustainable fishery. Curr Biol 21: PR621 - PR622.
Mimee B, Duceppe MO, Véronneau PY, Lafond-Lapalme J, Jean M, Belzile F, Bélair G (2015) A new method for studying population genetics of cyst nematodes based on Pool-Seq and genomewide allele frequency analysis. Mol Ecol Resour 15:1356–1365. doi: 10.1111/1755-0998.12412
Musick JA, Burgess G, Cailliet G, Camhi M, Fordham S (2000) Management of sharks and their relatives (Elasmobranchii). Fisheries 25:9–13. doi: 10.1577/1548-8446(2000)025<0009:MOSATR>2.0.CO;2
Oliver S, Braccini M, Newman SJ, Harvey ES (2015) Global patterns in the bycatch of sharks and rays. Mar Policy 54:86–97. doi: 10.1016/j.marpol.2014.12.017
Palumbi SR, Baker CS (1994) Contrasting population structure from nuclear intron sequences and mtDNA of humpback whales. Mol Biol Evol 11:426–435. doi: 10.1093/OXFORDJOURNALS.MOLBEV.A040115
Quinto CA, Tinoco R, Hellberg RS (2016) DNA barcoding reveals mislabeling of game meat species on the U.S. commercial market. Food Control 59:386392. https://doi.org/10.1016/j.foodcont.2015.05.043
Rice J, Harley S (2013) Stock assessment of the Silky shark in the Western and Central Pacific Ocean Executive summary. Ninth Regul Sess Sci Comm WCPFC, Pohnpei, FSM:1–71.
Roman J, Bowen BW (2000) The mock turtle syndrome: genetic identification of turtle meat purchased in the southeast United States. Animal Conserv 3:61-65.
Schindler DE, Essington TE, Kitchell JF, Boggs C, Hilborn R (2002) Sharks and tuna: Fisheries imacts on predators with contrasting life histories. Ecol Appl 12:735–748. doi: 10.1890/1051-0761(2002)012[0735:SATFIO]2.0.CO;2
Schlötterer C, Tobler R, Kofler R, Nolte V (2014) Sequencing pools of individuals-mining genome-wide polymorphism data without big funding. Nat Rev Genet 15:749–763. doi: 10.1038/nrg3803
Shivji MS, Chapman DD, Pikitch EK, Raymond PW (2005) Genetic profiling reveals illegal international trade in fins of the great white shark, Carcharodon carcharias. Conserv Genet 6:1035–1039. doi: 10.1007/s10592-005-9082-9
Stevens J (1999) Variable resilience to fishing pressure in two sharks: The significance of different ecological and life history parameters. ASFA Aquat Sci Fish Abstr 23:11–15.
Toonen RJ, Puritz JB, Forsman ZH, Whitney JL, Fernandez-Silva I, Andrews KR, Bird CE (2013) ezRAD: a simplified method for genomic genotyping in non-model organisms. PeerJ 1:e203. doi: 10.7717/peerj.203
Zhu Y, Bergland AO, González J, Petrov DA (2012) Empirical validation of pooled whole genome population re-sequencing in Drosophila melanogaster. PLoS One 7:1–8. doi: 10.1371/journal.pone.0041901
9
CHAPTER TWO
Genomics versus mtDNA for Resolving Stock Structure in the Silky
Shark (Carcharhinus falciformis)
Derek W. Kraft1*, Emily Conklin1, Evan Barba1, Melanie Hutchinson1,2, Robert J. Toonen1,
Zac H. Forsman1, Brian W. Bowen1
1Hawai‘i Institute of Marine Biology, University of Hawai‘i, 46-007 Lilipuna Road, Kāne‘ohe,
HI 96744
2Joint Institute for Marine and Atmospheric Research, University of Hawaiʻi, Pacific Islands
Fisheries Science Center, NOAA
NOTE: This paper is in published at PeerJ: https://peerj.com/articles/10186/
10
Abstract
Conservation genetic approaches for elasmobranchs have focused on regions of the
mitochondrial genome or a handful of nuclear microsatellites. High-throughput sequencing
offers a powerful alternative for examining population structure using many loci distributed
across the nuclear and mitochondrial genomes. These single nucleotide polymorphisms are
expected to provide finer scale and more accurate population level data; however, there have
been few genomic studies applied to elasmobranch species. The desire to apply next-generation
sequencing approaches is often tempered by the costs, which can be offset by pooling specimens
prior to sequencing (pool-seq). In this study, we assess the utility of pool-seq by applying this
method to the same individual silky sharks, Carcharhinus falciformis, previously surveyed with
the mtDNA control region in the Atlantic and Indian Oceans. Pool-seq methods were able to
recover the entire mitochondrial genome as well as thousands of nuclear markers. This volume
of sequence data enabled the detection of population structure between regions of the Atlantic
Ocean populations, undetected in the previous study (inter-Atlantic mitochondrial SNPs FST
values comparison ranging from 0.029 to 0.135 and nuclear SNPs from 0.015 to 0.025). Our
results reinforce the conclusion that sampling the mitochondrial control region alone may fail to
detect fine-scale population structure, and additional sampling across the genome may increase
resolution for some species. Additionally, this study shows that the costs of analyzing 4,988 loci
using pool-seq methods are equivalent to the standard Sanger-sequenced markers and become
less expensive when large numbers of individuals (>300) are analyzed.

11
Introduction Many elasmobranchs around the globe have experienced devastating population declines due to
overfishing in both target and non-target fisheries (Musick et al., 2000; Clarke et al., 2006; F.
Ferretti et al., 2010; Heupel et al., 2014; Dulvy et al., 2014; Oliver et al., 2015; Dulvy &
Trebilco, 2018). These species are especially vulnerable to overfishing due to life history traits
such as late maturity, slow growth, low fecundity, and high juvenile mortality, which collectively
result in low intrinsic rate of population increase (Baum et al., 2003; Dulvy et al., 2008).
Elasmobranch populations take decades to recover from overfishing, and only if fishing pressure
is relieved for an extended period (Stevens et al., 2000). Furthermore, many threatened and
endangered elasmobranchs have little to no population genetic data that would assist in the
resolution of management units (reviewed in Domingues et al., 2018a).
Genetically distinct populations are isolated management units known as stocks; however, stocks
can be defined on a smaller scale than genetic populations through other criteria, such as an
exclusive economic zone boundry (Carvalho & Hauser, 1994; Ovenden et al., 2015). Reduced
gene flow indicates that if a population is overfished it will not be replenished by immigrants
from surrounding populations. This is why managing on a genetic stock-by-stock basis is
essential for successful maintenance of exploited species and is sorely needed for over-harvested
elasmobranchs (Dizon et al., 1993; Heist, 2004; Tallmon et al., 2010).
For the past two decades the standard for examining population structure in elasmobranchs has
been a section of the mitochondrial genome, usually the control region (mtCR) (e.g. Duncan et
al. 2006; Hoelzel et al. 2006; Keeney & Heist 2006; Castro et al. 2007; Whitney et al. 2012;
Clarke et al. 2015; reviewed in Domingues et al. 2018a). Though recent studies are moving

12
towards multi-marker approaches (Momigliano et al., 2017; Pazmiño et al., 2018: Green et al.,
2019), there is still a large body of literature focusing on mtCR. The mitochondrial genome has a
higher rate of mutation than most of the nuclear genome (Brown et al., 1979; Charlesworth &
Wright, 2001; Neiman & Taylor, 2009) and this rate of mutation is a key advantage in
vertebrates with slowly-evolving genomes (Avise et al., 1992; Martin et al., 1992).
Elasmobranch mtDNA studies to date have been successful in elucidating population partitions
and evolutionary divergences, but the maternal inheritance of mtDNA can limit conclusions
about gene flow in cases of sex-biased (usually male) dispersal. Both mtDNA and nuclear
markers often have concordant results in sedentary species (e.g., Lavery et al., 1996; Avise,
2004; Zink & Barrowclough, 2008; DiBattista et al., 2015) but, when examined alone, may miss
key components of population structure, particularly in migratory fauna (Pardini et al., 2001;
Bowen et al., 2005; Toews & Brelsford, 2012). When highly mobile elasmobranchs are
examined with both mtDNA and nuclear markers (usually microsatellites), a different picture
often emerges in which females are more resident and males are dispersive (Pardini et al., 2001;
Schultz et al., 2008; Portnoy, et al., 2010; Karl, Castro, Lopez, Charvet, & Burgess, 2011; Daly-
Engel et al., 2012; Portnoy et al., 2015: Bernard et al., 2017; Domingues et al., 2018b).
Identifying outlier SNPs in the nuclear genome can highlight genes possibly under selection, or
show functional responses to environmental changes that have important management
consequences (Barrio et al., 2016; Fischer et al., 2013; Guo et al., 2016; Jones et al., 2012).
Therefore, the combination of mitochondrial and nuclear markers can yield fundamental
ecological and evolutionary insights.
13
High-throughput sequencing is a powerful tool for revealing fine-scale population structure that
may be missed by single locus studies (Andrews et al., 2016; Hohenlohe et al., 2018). However,
this method can be costly, especially when examining many individuals as is typical of
population genetic or phylogeography studies, and the perceived cost may prevent some from
considering a high-throughput sequencing approach. For population genetics approaches based
on differences in allele frequencies among populations, equimolar pooling of samples before
sequencing is an affordable and accurate strategy for large-scale genetic analysis (Schlötterer et
al., 2014). Several studies have successfully resolved population structure using a pooled site-
associated DNA approach known as pool-seq, including some in commercially valuable marine
species (e.g. Gautier et al., 2013; Mimee et al., 2015). Pool-seq provides estimates of allele
frequencies for thousands of loci distributed across the genome simultaneously, which in some
cases gives greater statistical power that can actually exceed the accuracy of allele frequency
estimates based on individual sequencing (Futschik & Schlötterer, 2010, but also see Anderson
et al. 2014). Therefore, a comparison of results between the standard mtCR analysis and high-
throughput pool-seq is informative in evaluating the relative power and cost of the two
approaches for examining population structure.
The silky shark (Carcharhinus falciformis (Müller & Henle, 1839)) is the second most
commonly harvested shark on Earth (Oliver et al., 2015; Rice & Harley, 2013). They are one of
the top contributors to the shark fin trade and the most common elasmobranch bycatch species in
tuna purse-seine fisheries around the world (Cardenosa et al., 2018; Clarke et al., 2006; Oliver et
al., 2015). This pelagic shark, formerly abundant in all tropical oceans, has declined by an
estimated 85% in the last 20 years, and is now listed as vulnerable and declining by the
14
International Union for the Conservation of Nature (Rice & Harley, 2013; IUCN, 2017).
Currently silky shark population assessments are conducted at the scale of regional fishery
management organization, and conservation management measures are implemented at this scale
in the absence of genetic or movement data to define population boundaries. Clarke et al. (2015)
surveyed silky sharks across these regional management regions and found the western Atlantic
was strongly differentiated from the Indian Ocean, but the North Atlantic, Gulf of Mexico, and
Brazil could not be differentiated and appeared to comprise a single population. In contrast,
using the same mtCR marker, Domingues et al. (2017) examined five regions across the Western
Atlantic and found the North Western Atlantic was distinct from the South Western Atlantic. The
difference between the two studies results from additional sampling in the South West Atlantic
from further south than Clarke et al. (2015).
In an era where wildlife management needs far exceed the financial resources to address them,
many seek to find the most accessible, robust, and economical means to define management
units. In this study, we provide a direct comparison of population genetic analysis methods
between Sanger sequencing of the mtCR region and high-throughput sequencing of regional
pools of individuals. The same individuals from Clarke et al. (2015) were re-sequenced using
pool-seq approaches. Regions re-sequenced included Gulf of Mexico, North West Atlantic, and
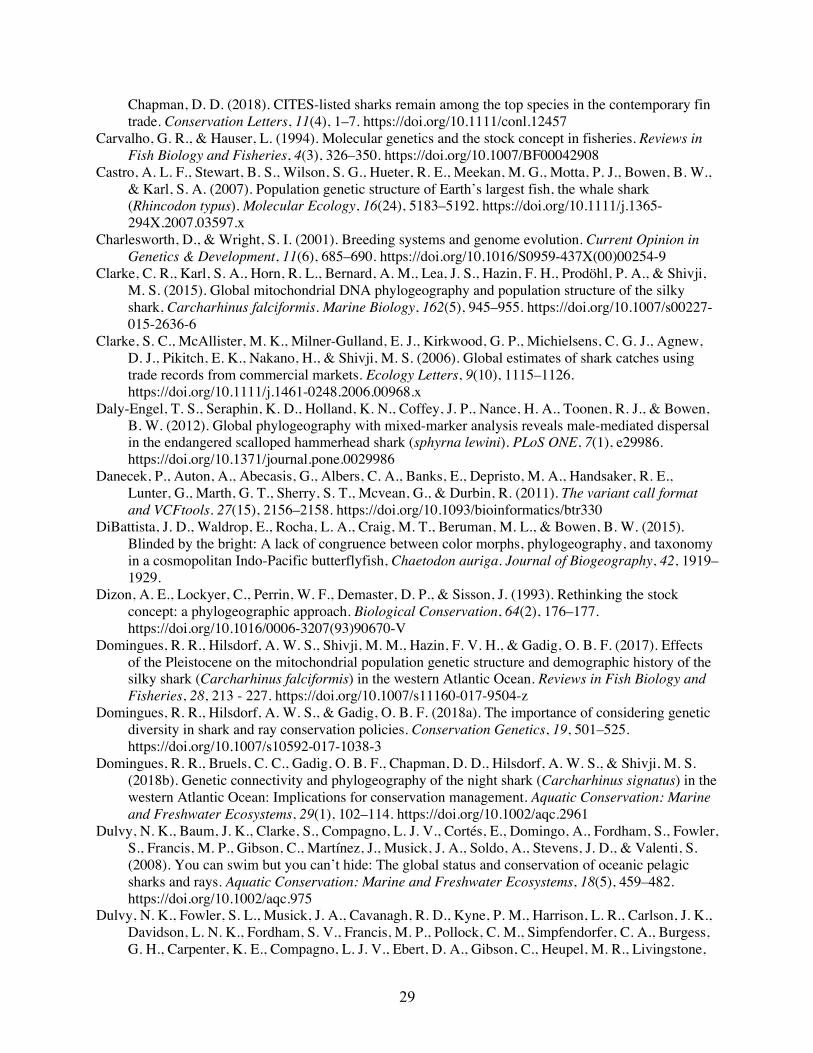
Brazil, as well as one geographically distant location in the Red Sea (Fig 1). We focused this
analysis on SNPs from the mitochondrial DNA as well as nuclear DNA. We did not analyze any
microsatellite loci because they were not a part of Clarke et al. (2015). We then evaluate the
economics of conducting pool-seq relative to conventional Sanger sequencing of these same
15
individuals. Ecological and management implications will be addressed in a subsequent
companion paper.
Materials & Methods Sampling and sequencing
A total of 143 silky shark fin clips or muscle sections were sampled from commercial or artisanal
fisheries across four geographic regions and are the same samples examined in Clarke et al.
(2015). Specifically, we sampled the Gulf of Mexico (GM, n =39), the North Atlantic (NA, n =
33), Brazil (BR, n = 34), and the Red Sea (RS, n = 37). These sample sizes are slightly lower
than Clarke et al. (2015). This reduction was due to DNA degradation over time and the need for
high-quality genomic DNA for pool-seq. This is contrary to the DNA quality needed for
amplifying a single marker from the mitochondrial control region. Additionally only a subset of
the Red Sea samples were randomly selected to keep sample sizes relatively similar.
DNA was extracted using Qiagen DNeasy Blood & Tissue kit (Qiagen, Mississauga, ON,
Canada), following manufacturer protocols. Extracted DNA quality was assessed visually by gel
electrophoresis and imaged using Gel Doc E-Z System (BIO RAD, Hercules, California, USA).
Only DNA aliquots with strong genomic DNA bands were further processed, while degraded or
overly digested DNA was discarded. Aliquots of high-quality DNA were quantified using an
AccuClear Ultra high sensitivity dsDNA quantitation kit (Biotium, Fremont CA, USA) and a
SpectroMax M2 (Molecular Devices, Sunnyvale, CA, USA). Libraries were pooled with an
equal amount of DNA (ng/µl) contributed per individual to minimize individual contribution
bias, totaling 2000 ng of DNA per library. Number of individuals per pool are displayed in Fig 1.
16
No PCR was performed to ensure individual DNA contribution was kept equal within and across
libraries (Anderson et al., 2014). The rest of the library preparation followed the ezRAD library
preparation protocol (Toonen et al. 2013; Knapp et al., 2016). This included DNA digested with
DpnII restriction enzyme and adapters ligated using a Kapa hyper Prep Kit (Kapa Biosystems,
Wilmington, MA, USA). Pooled libraries were sequenced using Illumina MiSeq (v3 2x300bp
PE) at the Hawai‘i Institute of Marine Biology EPSCoR Core sequencing facility.
Genetic analyses
MultiQC was used to assess sequence quality scores, sequence length distributions, duplication
levels, and overrepresented sequences (Ewels et al., 2016). To analyze the mitochondrial
genome, a previously published mitochondrial genome from Carcharhinus falciformis was used
as a reference (GeneBank accession number KF801102). Raw paired-end reads were trimmed
with TRIMMOMATIC, mapped to the mitochondrial genome reference BWA (mem algorithm),
and variants called using the dDocent bioinformatics pipeline, modified for pool-seq (Puritz et al.
2014, see below for details). Called SNPs were then analyzed with AssessPool
(github.com/ToBoDev/assessPool, see below for details).
The bioinformatics pipeline included dDocent followed by AssessPool. Given that no reference
genome was available, a reference was constructed using the dDocent de novo assembly and
optimized utilizing the reference optimization steps provided on the dDocent assembly tutorial
(http://ddocent.com/assembly/). Before assembly reads were trimmed using default settings and
then an overlap (OL) assembly was performed, followed by clustering with CD-HIT with a –c
parameter of 90% similarity. For mapping using BWA (mem algorithm) all match, mismatch,
17
and gap open penalty score parameters were also default settings. Different parameters were
tested during optimization but did not improve mapping. Within-pool (K1) and between-pool
(K2) minimum locus depth values selected for the de novo assembly did impact the results.
dDocent provides graphical outputs to help select these values; however, testing a few different
values of each is recommended to fully explore the potential of the data by balancing number of
contigs by coverage depth (see ddocent.com/UserGuide for details). Selected values for K1 and
K2 were 3 and 3 respectively. Once assembled, sequences were mapped, SNPs were called
within the dDocent pipeline using FreeBayes, modified for SNP calling in pools (Garrison and
Marth 2012, https://github.com/ekg/freebayes). Any contigs that aligned to the mitochondrial
genome were removed from this nuclear dataset. The contigs that aligned specifically to the
mitochondrial control region were saved for SNP validation to directly compare the results from
this pool-seq approach to those previously reported by Clarke et al. (2015).
SNP calling with FreeBayes was optimized for pooled samples using the ‘pooled-continuous’
option, and minor allele frequency was decreased to 0.05 to capture alleles with frequency
greater than 5% in the population (See Supplementary Material for code). The dDocent pipeline
outputs SNPs in two variant call format files (.vcf), one being all raw SNPs (TotalRawSNPs.vcf)
and another with filtered SNPs (Final.recode.vcf) however dDocent does not optimize filtering
for pool-seq data. Therefore, the raw SNPs were processed with the pool-seq specific program
AssessPool which uses VCFtools and vcflib to filter SNPs (Danecek et al., 2011). SNPs were
processed with the following filters: minimum pool number of 2, minimum quality score of 20,
minimum depth threshold of 30, maximum amount of missing data of 3, maximum allele length
of 10, quality score to depth ratio of 0.25 as well as mean depth per site vs. quality score, and
18
finally a maximum mean depth threshold of 1000 (Table S1). AssessPool then sends filtered
SNPs to either PoPoolation2 (Kofler et al., 2011) or poolfstat (Hivert et al., 2018). PoPoolation2
calculates mean pairwise FST values and significance in the form of p-values obtained using
Fisher’s exact test and combined using Fisher’s method (as described in Ryman et al. 2006).
Poolfstat (Hivert et al. 2018) takes a different approach, calculating FST values based on an
analysis-of-variance framework (sensu Wier & Cockerham 1984) to eliminate biases associated
with varying pool sizes. AssessPool then organizes, summarizes, and creates visualizations of the
data using RStudio (RStudio Team 2020).
As a quality control test, sequences from Clarke et al. (2015) were downloaded from GenBank
(accession numbers KM267565–KM267626), and SNPs from these data were compared directly
to SNPs called within the control region of the mitochondrial pool-seq data generated here.
Concordance of this validation set of SNPs was determined by Mantel test in R (Legendre &
Legendre, 1998) comparing the matrices of pairwise FST values among populations.
Cost Analysis
The cost of pool-seq approach compared to Sanger sequencing of individual loci was calculated
based on library preparation and sequencing cost at our facility. We did not include labor but
calculated the total cost to generate sequence data from each sample included here from such
expenses as the extraction, laboratory consumables, PCR amplification, library preparation,
reaction clean-ups, quantification, quality control testing, and sequencing costs. These costs were
translated into functions in RStudio (RStudio Team, 2020) where Sanger sequencing is a fixed
rate per individual and pool-seq costs are fixed per flow cell on our MiSeq, but individual cost
19
varies based on number of individuals and number of pooled regions per sequencing run. These
functions were then plotted together for comparison.
Results A total of 30.8 million reads were generated for the four geographic regions, which averaged 7.7
± 3.0 million reads per pooled library. Results from the MutliQC assessment showed fairly
homogenous output between libraries in regard to sequence quality scores, GC and per base
sequence content, sequence length distributions, duplication levels, overrepresented sequences,
and adapter content. Once assembled, aligned, and mapped, 5,792 SNPs were resolved across the
mitochondrial and nuclear genomes combined. There were 4,103 biallelic SNPs, 168 were
multialleleic SNPs and 48 were insertions and deletions (INDELs). INDELs and multiallelic
SNPs remain a challenge for quantification software, so we restricted our analysis to biallelic
loci (Fracassetti et al. 2015). AssessPool creates visualizations of FST values and allows for visual
outlier inspection. No visual outliers were present and given these SNPs are distributed
haphazardly across the genome, they are assumed to be putatively neutral.
Mitochondrial Genome
Analysis of the complete mitochondrial genome (17,774 bp) revealed 804 variable sites: 681
biallelic and 17 multiallelic SNPs. Because coverage in this dataset was fairly low on average,
most of these SNPs did not meet the filter threshold. After further filtering for the highest quality
markers, 30 SNPs were selected to calculate allele frequencies. Pairwise FST values were all
significant (Fig 2, Table S2). The Red Sea had much higher FST values (ranging from 0.367 to
0.745) than any inter-Atlantic comparison (ranging from 0.029 to 0.135). However, all
20
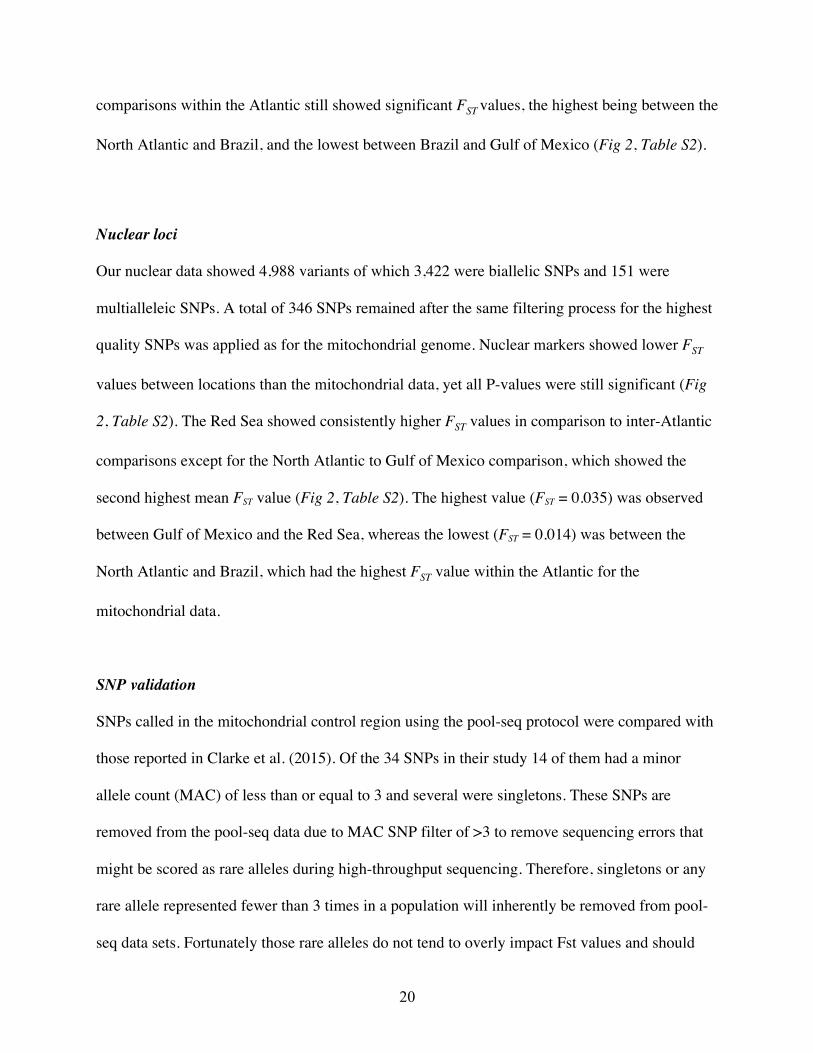
comparisons within the Atlantic still showed significant FST values, the highest being between the
North Atlantic and Brazil, and the lowest between Brazil and Gulf of Mexico (Fig 2, Table S2).
Nuclear loci
Our nuclear data showed 4,988 variants of which 3,422 were biallelic SNPs and 151 were
multialleleic SNPs. A total of 346 SNPs remained after the same filtering process for the highest
quality SNPs was applied as for the mitochondrial genome. Nuclear markers showed lower FST
values between locations than the mitochondrial data, yet all P-values were still significant (Fig
2, Table S2). The Red Sea showed consistently higher FST values in comparison to inter-Atlantic
comparisons except for the North Atlantic to Gulf of Mexico comparison, which showed the
second highest mean FST value (Fig 2, Table S2). The highest value (FST = 0.035) was observed
between Gulf of Mexico and the Red Sea, whereas the lowest (FST = 0.014) was between the
North Atlantic and Brazil, which had the highest FST value within the Atlantic for the
mitochondrial data.
SNP validation
SNPs called in the mitochondrial control region using the pool-seq protocol were compared with
those reported in Clarke et al. (2015). Of the 34 SNPs in their study 14 of them had a minor
allele count (MAC) of less than or equal to 3 and several were singletons. These SNPs are
removed from the pool-seq data due to MAC SNP filter of >3 to remove sequencing errors that
might be scored as rare alleles during high-throughput sequencing. Therefore, singletons or any
rare allele represented fewer than 3 times in a population will inherently be removed from pool-
seq data sets. Fortunately those rare alleles do not tend to overly impact Fst values and should
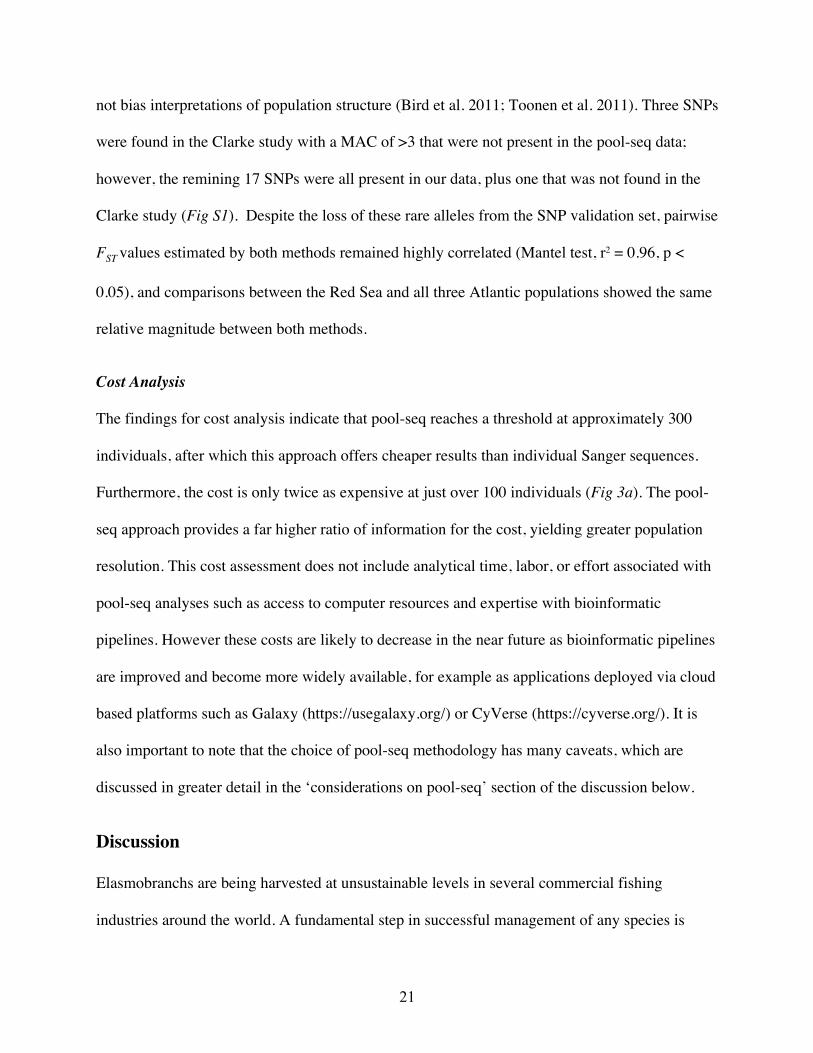
21
not bias interpretations of population structure (Bird et al. 2011; Toonen et al. 2011). Three SNPs
were found in the Clarke study with a MAC of >3 that were not present in the pool-seq data;
however, the remining 17 SNPs were all present in our data, plus one that was not found in the
Clarke study (Fig S1). Despite the loss of these rare alleles from the SNP validation set, pairwise
FST values estimated by both methods remained highly correlated (Mantel test, r2 = 0.96, p <
0.05), and comparisons between the Red Sea and all three Atlantic populations showed the same
relative magnitude between both methods.
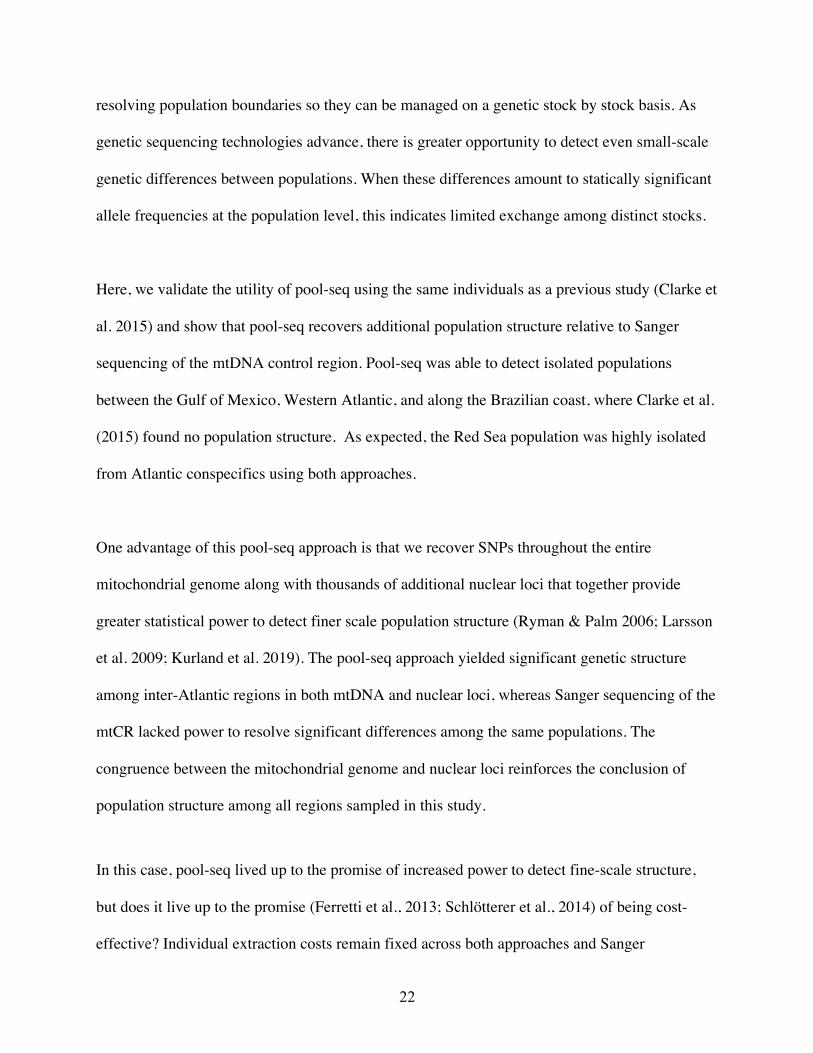
Cost Analysis
The findings for cost analysis indicate that pool-seq reaches a threshold at approximately 300
individuals, after which this approach offers cheaper results than individual Sanger sequences.
Furthermore, the cost is only twice as expensive at just over 100 individuals (Fig 3a). The pool-
seq approach provides a far higher ratio of information for the cost, yielding greater population
resolution. This cost assessment does not include analytical time, labor, or effort associated with
pool-seq analyses such as access to computer resources and expertise with bioinformatic
pipelines. However these costs are likely to decrease in the near future as bioinformatic pipelines
are improved and become more widely available, for example as applications deployed via cloud
based platforms such as Galaxy (https://usegalaxy.org/) or CyVerse (https://cyverse.org/). It is
also important to note that the choice of pool-seq methodology has many caveats, which are
discussed in greater detail in the ‘considerations on pool-seq’ section of the discussion below.
Discussion
Elasmobranchs are being harvested at unsustainable levels in several commercial fishing
industries around the world. A fundamental step in successful management of any species is
22
resolving population boundaries so they can be managed on a genetic stock by stock basis. As
genetic sequencing technologies advance, there is greater opportunity to detect even small-scale
genetic differences between populations. When these differences amount to statically significant
allele frequencies at the population level, this indicates limited exchange among distinct stocks.
Here, we validate the utility of pool-seq using the same individuals as a previous study (Clarke et
al. 2015) and show that pool-seq recovers additional population structure relative to Sanger
sequencing of the mtDNA control region. Pool-seq was able to detect isolated populations
between the Gulf of Mexico, Western Atlantic, and along the Brazilian coast, where Clarke et al.
(2015) found no population structure. As expected, the Red Sea population was highly isolated
from Atlantic conspecifics using both approaches.
One advantage of this pool-seq approach is that we recover SNPs throughout the entire
mitochondrial genome along with thousands of additional nuclear loci that together provide
greater statistical power to detect finer scale population structure (Ryman & Palm 2006; Larsson
et al. 2009; Kurland et al. 2019). The pool-seq approach yielded significant genetic structure
among inter-Atlantic regions in both mtDNA and nuclear loci, whereas Sanger sequencing of the
mtCR lacked power to resolve significant differences among the same populations. The
congruence between the mitochondrial genome and nuclear loci reinforces the conclusion of
population structure among all regions sampled in this study.
In this case, pool-seq lived up to the promise of increased power to detect fine-scale structure,
but does it live up to the promise (Ferretti et al., 2013; Schlötterer et al., 2014) of being cost-
effective? Individual extraction costs remain fixed across both approaches and Sanger
23
sequencing generally has a flat rate per individual, including PCR primers and reagents, and
sequencing per individual per locus. In contrast, pool-seq has a flat sequencing cost determined
by the number of reads generated from the high-throughput sequencing platform, plus a small
additional cost per pool for the exact quantification of DNA for equimolar pooling and the
library preparation for high-throughput sequencing. Comparing costs at our institution between a
single Sanger sequencing marker and pool-seq on the Illumina MiSeq platform indicates pool-
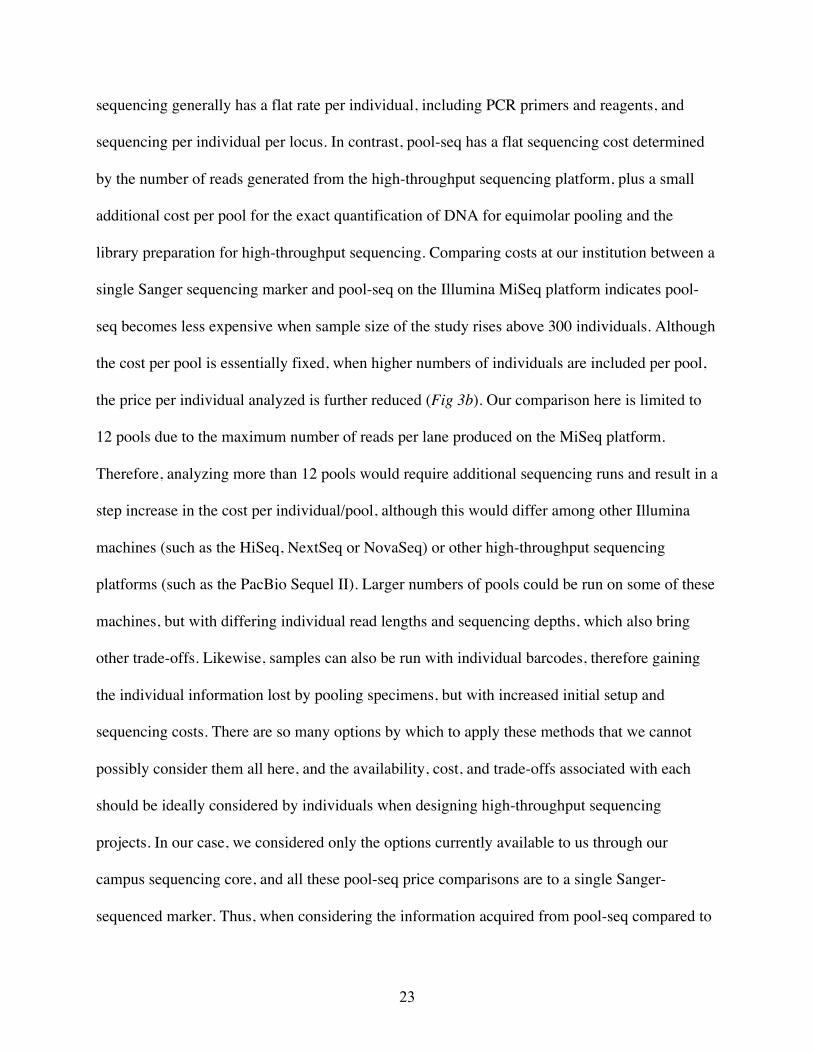
seq becomes less expensive when sample size of the study rises above 300 individuals. Although
the cost per pool is essentially fixed, when higher numbers of individuals are included per pool,
the price per individual analyzed is further reduced (Fig 3b). Our comparison here is limited to
12 pools due to the maximum number of reads per lane produced on the MiSeq platform.
Therefore, analyzing more than 12 pools would require additional sequencing runs and result in a
step increase in the cost per individual/pool, although this would differ among other Illumina
machines (such as the HiSeq, NextSeq or NovaSeq) or other high-throughput sequencing
platforms (such as the PacBio Sequel II). Larger numbers of pools could be run on some of these
machines, but with differing individual read lengths and sequencing depths, which also bring
other trade-offs. Likewise, samples can also be run with individual barcodes, therefore gaining
the individual information lost by pooling specimens, but with increased initial setup and
sequencing costs. There are so many options by which to apply these methods that we cannot
possibly consider them all here, and the availability, cost, and trade-offs associated with each
should be ideally considered by individuals when designing high-throughput sequencing
projects. In our case, we considered only the options currently available to us through our
campus sequencing core, and all these pool-seq price comparisons are to a single Sanger-
sequenced marker. Thus, when considering the information acquired from pool-seq compared to

24
the cost from traditional single mitochondrial marker the price per individual advantage is
massively amplified.
Considerations with pool-seq
As with any sequencing technique, there are still several factors to consider before deciding if
pool-seq is appropriate for a particular study. Multiple reviews have been published on high-
throughput and pool-seq approaches demonstrating pros, cons, and considerations with these
methods, which are beyond the scope of this study. Interested readers should consult Perez-
Enciso & Ferretti (2010), Futschik & Schlötterer (2010), Kofler et al. (2012), Ferretti et al.
(2013), Schlötterer et al., 2014, Andrews & Luikart (2014), Andrews et al. (2016), and Kurland
et al. (2019).
Pooling assumes individuals are from the interbreeding individuals within a single population of
the same species. Therefore, care needs to be taken to avoid cryptic species, combining multiple
populations (Wahlund effect), or other unintentional bias when selecting individuals to pool
(Garnier-Géré & Chikhi 2013). For wide ranging pelagic species such as the blue shark or
oceanic whitetip it seems reasonable to pool individuals from a larger area than it would be for
small benthic species such as horn sharks, wobbegongs, or most rays. Population structure may
be obscured if the geographic range per pool is too large or if there is complex population
structure (sensu Bowen et al. 2005), because individuals from multiple sub-populations will be
mixed into a single pool from which allele frequencies are calculated. Certainly pool-seq is not
appropriate in all cases. It is a cost-saving approach for analyses based on allele frequencies
only, because individual information is lost by pooling, including haplotypes/genotypes and
25
linkage disequilibrium information. Also, pooling makes it difficult to distinguish between low
frequency alleles in the population and sequencing error. Therefore, careful filtering must be
applied to ensure only valid SNPs are analyzed instead of analyzing sequencing noise (Anand et
al., 2016; Schlötterer et al., 2014). Finally, the estimation of FST from pooled data remains a
subject of some debate, and new approaches and bias corrections are being actively developed
(Kofler et al. 2011; Hivert et al. 2018). To account for this uncertainty, we include analyses
based on both the original PoPoolation2 (Kofler et al., 2011) package and the newer poolfstat
(Hivert et al., 2018) that explicitly considers potential biases associated with varying pool sizes.
The two approaches yield slightly different FST values (see Table S2), however a comparison of
the two FST matrices shows strong correlation (Mantel r=0.991 for mitochondrial and r=0.978 for
nuclear data, p < 0.05). Therefore, only those FST values calculated by PoPoolation2 are reported
in the main text for ease of presentation.
Though pool-seq has been shown to be an affordable and reliable tool for population genomics
(Futschik & Schlötterer, 2010; Gautier et al., 2013; Rellstab et al. 2013; Konczal et al. 2014;
Schlötterer et al. 2014; Kurland et al. 2019), projects with larger budgets could allocate funds for
any of a variety of other genomic sequencing techniques such as individual RADseq libraries
(Hohenlohe et al. 2010), GBS (Narum et al. 2013), SNP arrays (Qi et al. 2017), bait capture
(Feutry et al. 2020), or low coverage genomewide sequencing (Therkildsen & Palumbi 2017).
These approaches allow for individual genotyping to examine questions that require individual-
level information and could provide a deeper assessment of populations. However it is also
important to consider not all labs can afford to generate genomic level data, especially in
26
developing countries, and having a cost-effective alternative to single marker studies will
continue to be invaluable to many.
Conclusions The finding of population structure on the scale of North Atlantic/Gulf of Mexico/Brazil is
nearly unprecedented for a pelagic shark. Population structure in globally distributed sharks is
typically detected on a scale of ocean basins (Atlantic versus Indo-Pacific, Castro et al. 2007;
Graves & McDowell, 2015) and a few pelagic fishes have no population structure on a global
scale (e.g. Basking shark, Cetorhinus maximus, Hoelzel et al. 2006; Blue shark Prionace glauca,
Veríssimo et al. 2017; Wahoo, Acanthocybium solandri , Theisen et al. 2008). The resolution of
isolated populations on the scale of North Atlantic Ocean is more typical of coastal species than
pelagic species. The silky shark seems to be a pelagic species with a somewhat coastal
population structure. This has strong implications for international management because smaller
stocks imply smaller populations which are more readily depleted. At a minimum, these data
require rethinking a single population management approach for the Atlantic, and this pattern
needs to be investigated for this species across the Indo-Pacific as well.
Overall this study demonstrates pool-seq is a powerful and cost-effective tool for analyzing large
portions of the genome which the methods traditionally used for elasmobranchs could not
supply. Sharks and rays are an imperiled group of species that could benefit from advanced
genomic studies to outline appropriate management units. Finally, although the technology is
becoming cheaper and easier to apply, it is a common pitfall to assume everyone in the field can
afford, or must use, these approaches to produce defensible science. Bowen et al. (2014)
advocate judicious rather than wholesale application of genomic approaches as the most robust
27
course of study, particularly when considering the global inequities in available research budgets.
Sanger sequencing is still more cost effective for small numbers of individuals, but as the
number of individuals included in a study rise, the cost per individual reaches the point where
high throughput sequencing studies can be cheaper than sequencing a single mitochondrial
marker from each individual. We provide an example of just such a case here, and highlight the
potential advantage of cost savings together with increased power for resolution of fine scale
population structure. Though there is still additional cost of using cluster computer servers and
bioinformatics programs, these cost are dropping as technology advances. When study organism
and sampling strategies are assessed and implemented into the study design, pool-seq has great
promise for augmenting the scientific foundations for management of marine recourses.
Acknowledgements This study was made possible by the generous donation of specimens by Christopher R. Clarke,
Mahmood Shivji, Stephen A. Karl, J.D. Filmalter, and Julia Spaet. We thank members of the
ToBo Lab for sharing expertise, advice and discussions that contributed to this manuscript.
Special thanks to Darren Lerner, Kim Holland, Carl Meyer, S. Gulak, D. Bethe, D. McCauley, C.
Wilson, Guy Harvey Ocean Foundation, and Save Our Seas Foundation. This paper is funded in
part by a cooperative agreement from the National Oceanic and Atmospheric Administration,
Project R/SS-19PD, which is sponsored by the University of Hawai‘i Sea Grant College Program
under Institutional Grant No. NA14OAR4170071 (B.W.B) from NOAA Office of Sea Grant,
Department of Commerce. The views expressed herein are those of the authors and do not
necessarily reflect the views of NOAA or any of its subagencies UNIHI-SEAGRANT-JC-15-32.
This is contribution #1821 from the Hawaii Institute of Marine Biology, contribution #XXXX
28
from the Hawaii Sea Grant Program, and contribution #11128 from the School of Ocean and
Earth Science and Technology at the University of Hawaii.
References
Anand, S., Mangano, E., Barizzone, N., Bordoni, R., Sorosina, M., Clarelli, F., Corrado, L., Boneschi, F. M., D’Alfonso, S., & De Bellis, G. (2016). Next generation sequencing of pooled samples: Guideline for variants’ filtering. Scientific Reports, 6(August), 1–9. https://doi.org/10.1038/srep33735
Anderson, E. C., Skaug, H. J., & Barshis, D. J. (2014). Next-generation sequencing for molecular ecology: A caveat regarding pooled samples. In Molecular Ecology (Vol. 23, Issue 3, pp. 502–512). https://doi.org/10.1111/mec.12609
Andrews, K.R., & Luikart, G. (2014). Recent novel approaches for population genomics data analysis. Molecular Ecology, 23(7), 1661–1667.
Andrews, Kimberly R., Good, J. M., Miller, M. R., Luikart, G., & Hohenlohe, P. A. (2016). Harnessing the power of RADseq for ecological and evolutionary genomics. Nature Reviews Genetics, 17(2), 81–92. https://doi.org/10.1038/nrg.2015.28
Avise, J. C., Bowen, B. W., Bermingham, E., Meylan, A. B., & Lamb, T. (1992). Mitochondrial DNA evolution at a turtle’s pace: evidence for low genetic variability and reduced microevolutionary rate in the Testudines. Molecular Biology & Evolution, 9, 457–473.
Barrio, A. M., Lamichhaney, S., Fan, G., Rafati, N., Pettersson, M., Zhang, H., Dainat, J., Ekman, D., Höppner, M., Jern, P., Martin, M., Nystedt, B., Liu, X., Chen, W., Liang, X., Shi, C., Fu, Y., Ma, K., Zhan, X., … Andersson, L. (2016). The genetic basis for ecological adaptation of the Atlantic herring revealed by genome sequencing. ELife, 5(MAY2016), 1–32. https://doi.org/10.7554/eLife.12081
Baum, J. K., Myers, R. A., Kehler, D. G., Worm, B., Harley, S. J., & Doherty, P. A. (2003). Collapse and conservation of shark populations in the Northwest Atlantic. Science, 299(5605), 389–392. https://doi.org/10.1126/science.1079777
Bernard, A. M., Horn, R. L., Chapman, D. D., Feldheim, K. A., Garla, R. C., Brooks, E. J., Gore, M. A., & Shivji, M. S. (2017). Genetic connectivity of a coral reef ecosystem predator: the population genetic structure and evolutionary history of the Caribbean reef shark (Carcharhinus perezi). Journal of Biogeography, 44(11), 2488–2500. https://doi.org/10.1111/jbi.13062
Bird, C.E., Karl, S.A., Smouse, P.E. and Toonen, R.J. (2011). Detecting and measuring genetic differentiation. Phylogeography and population genetics in Crustacea, 19(3):31-55.
Bowen, B. W., Bass, A. L., Soares, L., & Toonen, R. J. (2005). Conservation implications of complex population structure : lessons from the loggerhead turtle ( Caretta caretta ). Molecular Ecology, 14, 2389–2402. https://doi.org/10.1111/j.1365-294X.2005.02598.x
Bowen, B.W., Shanker, K., Yasuda, N., Celia, M., Malay, M.C.M.D., von der Heyden, S., Paulay, G., Rocha, L.A., Selkoe, K.A., Barber, P.H. and Williams, S.T. (2014). Phylogeography unplugged: comparative surveys in the genomic era. Bulletin of Marine Science, 90(1):13-46.
Brown, W. M., George, M., & Wilson, A. C. (1979). Rapid evolution of animal mitochondrial DNA. Proceedings of the National Academy of Sciences of the United States of America, 76(4), 1967–1971. https://doi.org/10.1146/annurev.es.18.110187.001413
Cardeñosa, D., Fields, A. T., Babcock, E. A., Zhang, H., Feldheim, K., Shea, S. K. H., Fischer, G. A., &
29
Chapman, D. D. (2018). CITES-listed sharks remain among the top species in the contemporary fin trade. Conservation Letters, 11(4), 1–7. https://doi.org/10.1111/conl.12457
Carvalho, G. R., & Hauser, L. (1994). Molecular genetics and the stock concept in fisheries. Reviews in Fish Biology and Fisheries, 4(3), 326–350. https://doi.org/10.1007/BF00042908
Castro, A. L. F., Stewart, B. S., Wilson, S. G., Hueter, R. E., Meekan, M. G., Motta, P. J., Bowen, B. W., & Karl, S. A. (2007). Population genetic structure of Earth’s largest fish, the whale shark (Rhincodon typus). Molecular Ecology, 16(24), 5183–5192. https://doi.org/10.1111/j.1365-294X.2007.03597.x
Charlesworth, D., & Wright, S. I. (2001). Breeding systems and genome evolution. Current Opinion in Genetics & Development, 11(6), 685–690. https://doi.org/10.1016/S0959-437X(00)00254-9
Clarke, C. R., Karl, S. A., Horn, R. L., Bernard, A. M., Lea, J. S., Hazin, F. H., Prodöhl, P. A., & Shivji, M. S. (2015). Global mitochondrial DNA phylogeography and population structure of the silky shark, Carcharhinus falciformis. Marine Biology, 162(5), 945–955. https://doi.org/10.1007/s00227-015-2636-6
Clarke, S. C., McAllister, M. K., Milner-Gulland, E. J., Kirkwood, G. P., Michielsens, C. G. J., Agnew, D. J., Pikitch, E. K., Nakano, H., & Shivji, M. S. (2006). Global estimates of shark catches using trade records from commercial markets. Ecology Letters, 9(10), 1115–1126. https://doi.org/10.1111/j.1461-0248.2006.00968.x
Daly-Engel, T. S., Seraphin, K. D., Holland, K. N., Coffey, J. P., Nance, H. A., Toonen, R. J., & Bowen, B. W. (2012). Global phylogeography with mixed-marker analysis reveals male-mediated dispersal in the endangered scalloped hammerhead shark (sphyrna lewini). PLoS ONE, 7(1), e29986. https://doi.org/10.1371/journal.pone.0029986
Danecek, P., Auton, A., Abecasis, G., Albers, C. A., Banks, E., Depristo, M. A., Handsaker, R. E., Lunter, G., Marth, G. T., Sherry, S. T., Mcvean, G., & Durbin, R. (2011). The variant call format and VCFtools. 27(15), 2156–2158. https://doi.org/10.1093/bioinformatics/btr330
DiBattista, J. D., Waldrop, E., Rocha, L. A., Craig, M. T., Beruman, M. L., & Bowen, B. W. (2015). Blinded by the bright: A lack of congruence between color morphs, phylogeography, and taxonomy in a cosmopolitan Indo-Pacific butterflyfish, Chaetodon auriga. Journal of Biogeography, 42, 1919–1929.
Dizon, A. E., Lockyer, C., Perrin, W. F., Demaster, D. P., & Sisson, J. (1993). Rethinking the stock concept: a phylogeographic approach. Biological Conservation, 64(2), 176–177. https://doi.org/10.1016/0006-3207(93)90670-V
Domingues, R. R., Hilsdorf, A. W. S., Shivji, M. M., Hazin, F. V. H., & Gadig, O. B. F. (2017). Effects of the Pleistocene on the mitochondrial population genetic structure and demographic history of the silky shark (Carcharhinus falciformis) in the western Atlantic Ocean. Reviews in Fish Biology and Fisheries, 28, 213 - 227. https://doi.org/10.1007/s11160-017-9504-z
Domingues, R. R., Hilsdorf, A. W. S., & Gadig, O. B. F. (2018a). The importance of considering genetic diversity in shark and ray conservation policies. Conservation Genetics, 19, 501–525. https://doi.org/10.1007/s10592-017-1038-3
Domingues, R. R., Bruels, C. C., Gadig, O. B. F., Chapman, D. D., Hilsdorf, A. W. S., & Shivji, M. S. (2018b). Genetic connectivity and phylogeography of the night shark (Carcharhinus signatus) in the western Atlantic Ocean: Implications for conservation management. Aquatic Conservation: Marine and Freshwater Ecosystems, 29(1), 102–114. https://doi.org/10.1002/aqc.2961
Dulvy, N. K., Baum, J. K., Clarke, S., Compagno, L. J. V., Cortés, E., Domingo, A., Fordham, S., Fowler, S., Francis, M. P., Gibson, C., Martínez, J., Musick, J. A., Soldo, A., Stevens, J. D., & Valenti, S. (2008). You can swim but you can’t hide: The global status and conservation of oceanic pelagic sharks and rays. Aquatic Conservation: Marine and Freshwater Ecosystems, 18(5), 459–482. https://doi.org/10.1002/aqc.975
Dulvy, N. K., Fowler, S. L., Musick, J. A., Cavanagh, R. D., Kyne, P. M., Harrison, L. R., Carlson, J. K., Davidson, L. N. K., Fordham, S. V., Francis, M. P., Pollock, C. M., Simpfendorfer, C. A., Burgess, G. H., Carpenter, K. E., Compagno, L. J. V., Ebert, D. A., Gibson, C., Heupel, M. R., Livingstone,

30
S. R., … White, W. T. (2014). Extinction risk and conservation of the world’s sharks and rays. ELife, 2014(3), 1–34. https://doi.org/10.7554/eLife.00590.001
Dulvy, N. K., & Trebilco, R. (2018). Size-Based Insights into the Ecosystem Role of Sharks and Rays. In Shark Research: Emerging Technologies and Applications for the Field and Laboratory.
Duncan, K. M., Martin, A. P., Bowen, B. W., & De Couet, H. G. (2006). Global phylogeography of the scalloped hammerhead shark (Sphyrna lewini). Molecular Ecology, 15(8), 2239–2251. https://doi.org/10.1111/j.1365-294X.2006.02933.x
Ewels, P., Lundin, S., & Max, K. (2016). Data and text mining MultiQC : summarize analysis results for multiple tools and samples in a single report. Bioinformatics, 32(19), 3047–3048. https://doi.org/10.1093/bioinformatics/btw354
Ferretti, F., Worm, B., Britten, G. L., Heithaus, M. R., & Lotze, H. K. (2010). Patterns and ecosystem consequences of shark declines in the ocean. In Ecology Letters (Vol. 13, Issue 8, pp. 1055–1071). https://doi.org/10.1111/j.1461-0248.2010.01489.x
Ferretti, L., Ramos-Onsins, S. E., & Pérez-Enciso, M. (2013). Population genomics from pool sequencing. Molecular Ecology, 22(22), 5561–5576. https://doi.org/10.1111/mec.12522
Feutry, P., Devloo-Delva, F., Tran Lu Y, A., Mona, S., Gunasekera, R.M., Johnson, G., Pillans, R.D., Jaccoud, D., Kilian, A., Morgan, D.L. and Saunders, T. (2020). One panel to rule them all: DArTcap genotyping for population structure, historical demography, and kinship analyses, and its application to a threatened shark. Molecular Ecology Resources. Online Early, https://doi.org/10.1111/1755-0998.13204
Fischer, M. C., Rellstab, C., Tedder, A., Zoller, S., Gugerli, F., Shimizu, K. K., Holderegger, R., & Widmer, A. (2013). Population genomic footprints of selection and associations with climate in natural populations of Arabidopsis halleri from the Alps. Molecular Ecology, 22(22), 5594–5607. https://doi.org/10.1111/mec.12521
Futschik, A., & Schlötterer, C. (2010). The next generation of molecular markers from massively parallel sequencing of pooled DNA samples. Genetics, 186(1), 207–218. https://doi.org/10.1534/genetics.110.114397
Garnier-Géré, P., & Chikhi, L. (2013) Population subdivision, Hardy-Weinberg equilibrium, and the Wahlund effect. eLS Books, Wiley Online Library Pub. 3 https://onlinelibrary.wiley.com/doi/abs/10.1002/9780470015902.a0005446.pub3
Garrison, E., & Marth, G. (2012). Haplotype-based variant detection from short-read sequencing. 1–9. Gautier, M., Foucaud, J., Gharbi, K., Cézard, T., Galan, M., Loiseau, A., Thomson, M., Pudlo, P.,
Kerdelhué, C., & Estoup, A. (2013). Estimation of population allele frequencies from next-generation sequencing data: Pool-versus individual-based genotyping. Molecular Ecology, 22(14), 3766–3779. https://doi.org/10.1111/mec.12360
Green, M. E., Appleyard, S. A., White, W., Tracey, S., Devloo-Delva, F., & Ovenden, J. R. (2019). Novel multimarker comparisons address the genetic population structure of silvertip sharks (Carcharhinus albimarginatus). Marine and Freshwater Research, 70(7), 1007–1019. https://doi.org/10.1071/MF18296
Guo, B., Li, Z., & Merilä, J. (2016). Population genomic evidence for adaptive differentiation in the Baltic Sea herring. Molecular Ecology, 25(12), 2833–2852. https://doi.org/10.1111/mec.13657
Heist, E. J. (2004). Biology of Sahrks and Their Relatives (J. C. Carrier, J. A. Musick, & M. . Heithaus (eds.)). CRC Press, Boca Raton, FL.
Heithaus, M. R., Frid, A., Wirsing, A. J., & Worm, B. (2008). Predicting ecological consequences of marine top predator declines. Trends in Ecology and Evolution, 23(4), 202–210. https://doi.org/10.1016/j.tree.2008.01.003
Heupel, M. R., Knip, D. M., Simpfendorfer, C. A., & Dulvy, N. K. (2014). Sizing up the ecological role of sharks as predators. Marine Ecology Progress Series, 495, 291–298. https://doi.org/10.3354/meps10597
Hivert, V., Leblois, R., Petit, E. J., Gautier, M., & Vitalis, R. (2018). Measuring genetic differentiation
31
from Pool-seq data. Genetics, 210(September), 315–330. https://doi.org/10.1534/genetics.118.300900
Hoelzel, A. R., Shivji, M. S., Magnussen, J. E., & Francis, M. P. (2006). Low worldwide genetic diversity in the basking shark ( Cetorhinus maximus ). Biology Letters, 2, 639–642. https://doi.org/10.1098/rsbl.2006.0513
Hohenlohe, P. A., Hand, B. K., Andrews, K. R., & Luikart, G. (2018). Population genomics provides key insights in ecology and evolution. Population Genomics: Concepts, Approaches and Applications, doi:10.1007/13836_2018_20. https://doi.org/10.1007/13836_2018_20
Hohenlohe, P.A., Bassham, S., Etter, P.D., Stiffler, N., Johnson, E.A. and Cresko, W.A. (2010). Population genomics of parallel adaptation in threespine stickleback using sequenced RAD tags. PLoS Genetics 6(2): e1000862.
IUCN, I. U. for the C. of N. (2017). IUCN Red List of Threatened Species. Version 2013.1. http://www.iucnredlist.org/about/overview
Jones, F. C., Grabherr, M. G., Chan, Y. F., Russell, P., Mauceli, E., Johnson, J., Swofford, R., Pirun, M., Zody, M. C., White, S., Birney, E., Searle, S., Schmutz, J., Grimwood, J., Dickson, M. C., Myers, R. M., Miller, C. T., Summers, B. R., Knecht, A. K., Kingsley, D. M. (2012). The genomic basis of adaptive evolution in threespine sticklebacks. Nature, 484(7392), 55–61. https://doi.org/10.1038/nature10944
Karl, S. A., Castro, A. L. F., Lopez, J. A., Charvet, P., & Burgess, G. H. (2011). Phylogeography and conservation of the bull shark (Carcharhinus leucas) inferred from mitochondrial and microsatellite DNA. Conservation Genetics, 12(2), 371–382. https://doi.org/10.1007/s10592-010-0145-1
Karl, S. a, Bowen, B. W., & Avise, J. C. (1992). Global population genetic structure and male-mediated gene flow in the green turtle (Chelonia mydas): RFLP analysis of anonymous nuclear loci. Genetics, 131, 163–173. https://doi.org/10.1139/z05-185
Keeney, D. B., & Heist, E. J. (2006). Worldwide phylogeography of the blacktip shark (Carcharhinus limbatus) inferred from mitochondrial DNA reveals isolation of western Atlantic populations coupled with recent Pacific dispersal. Molecular Ecology, 15, 3669–3679.
Knapp, I. S. S., Puritz, J. B., Bird, C. E., Whitney, J. L., Sudek, M., Forsman, Z. H., & Toonen, R. J. (2016). ezRAD- an accessible next-generation RAD sequencing protocol suitable for non-model organisms_v3.2. https://doi.org/dx.doi.org/10.17504/protocols.io.e9pbh5n
Kofler, R., Betancourt, A. J., & Schlötterer, C. (2012). Sequencing of pooled DNA samples (Pool-Seq) uncovers complex dynamics of transposable element insertions in Drosophila melanogaster. PLoS Genetics, 8(1). https://doi.org/10.1371/journal.pgen.1002487
Kofler, R., Pandey, R. V., & Schlötterer, C. (2011). PoPoolation2: Identifying differentiation between populations using sequencing of pooled DNA samples (Pool-Seq). Bioinformatics, 27(24), 3435–3436. https://doi.org/10.1093/bioinformatics/btr589
Konczal, M., Koteja, P., Stuglik, M.T., Radwan, J. and Babik, W., 2014. Accuracy of allele frequency estimation using pooled RNA-Seq. Molecular Ecology Resources, 14(2):381-392.
Kurland, S., Wheat, C.W., de la Paz Celorio Mancera, M., Kutschera, V.E., Hill, J., Andersson, A., Rubin, C.J., Andersson, L., Ryman, N. and Laikre, L., (2019). Exploring a Pool-seq-only approach for gaining population genomic insights in nonmodel species. Ecology and evolution, 9(19), pp.11448-11463.
Larsson, L.C., Charlier, J., Laikre, L. and Ryman, N.(2009). Statistical power for detecting genetic divergence—organelle versus nuclear markers. Conservation Genetics, 10(5): 1255.
Legendre, P., & Legendre, L. (1998). Numerical Ecology. 2nd English Edition. Martin, A. P., Naylor, G., & Palumbi, S. R. (1992). Rates of mitochondrial DNA evolution in sharks are
slow compared to mammals. Nature, 357, 153–155. https://doi.org/10.1038/357153a0 Mimee, B., Duceppe, M. O., Véronneau, P. Y., Lafond-Lapalme, J., Jean, M., Belzile, F., & Bélair, G.
(2015). A new method for studying population genetics of cyst nematodes based on Pool-Seq and genomewide allele frequency analysis. Molecular Ecology Resources, 15(6), 1356–1365.
32
https://doi.org/10.1111/1755-0998.12412 Momigliano, P., Harcourt, R., Robbins, W. D., Jaiteh, V., Mahardika, G. N., Sembiring, A., & Stow, A.
(2017). Genetic structure and signatures of selection in grey reef sharks (Carcharhinus amblyrhynchos). Heredity, 119(3), 142–153. https://doi.org/10.1038/hdy.2017.21
Musick, J. A., Burgess, G., Cailliet, G., Camhi, M., & Fordham, S. (2000). Management of Sharks and Their Relatives (Elasmobranchii). Fisheries, 25(3), 9–13. https://doi.org/10.1577/1548-8446(2000)025<0009:MOSATR>2.0.CO;2
Myers, R. A., Baum, J. K., Shepherd, T. D., Powers, S. P., & Peterson, C. H. (2007). Cascading effects of the loss of apex predatory sharks from a coastal ocean. Science, 315(5820), 1846–1850. https://doi.org/10.1126/science.1138657
Neiman, M., & Taylor, D. R. (2009). The causes of mutation accumulation in mitochondrial genomes. Proceedings of the Royal Society B: Biological Sciences, 276(1660), 1201–1209. https://doi.org/10.1098/rspb.2008.1758
Narum, S.R., Buerkle, C.A., Davey, J.W., Miller, M.R. and Hohenlohe, P.A. (2013). Genotyping-by-sequencing in ecological and conservation genomics. Molecular ecology, 22(11): 2841-2847.
Oliver, S., Braccini, M., Newman, S. J., & Harvey, E. S. (2015). Global patterns in the bycatch of sharks and rays. Marine Policy, 54, 86–97. https://doi.org/10.1016/j.marpol.2014.12.017
Ovenden, J. R., Berry, O., Welch, D. J., Buckworth, R. C., & Dichmont, C. M. (2015). Ocean ’ s eleven : a critical evaluation of the role of population , evolutionary and molecular genetics in the management of wild fi sheries. Fish Fisheries, 16(125–159). https://doi.org/10.1111/faf.12052
Pardini, A. T., Jones, C. S., Noble, L. R., Kreiser, B., & Malcolm, H. (2001). Sex-biased dispersal of great white sharks. Nature, 412, 139–140.
Pazmiño, D. A., Maes, G. E., Green, M. E., Simpfendorfer, C. A., Hoyos-Padilla, E. M., Duffy, C. J. A., Meyer, C. G., Kerwath, S. E., Salinas-De-León, P., & Van Herwerden, L. (2018). Strong trans-Pacific break and local conservation units in the Galapagos shark (Carcharhinus galapagensis) revealed by genome-wide cytonuclear markers. Heredity, 120(5), 407–421. https://doi.org/10.1038/s41437-017-0025-2
Perez-Enciso, M., & Ferretti, L. (2010). Massive parallel sequencing in animal genetics : wherefroms and wheretos. Animal Genetics, 41, 561–569. https://doi.org/10.1111/j.1365-2052.2010.02057.x
Portnoy, D. S., McDowell, J. R., Heist, E. J., Musick, J. A., & Graves, J. E. (2010). World phylogeography and male-mediated gene flow in the sandbar shark, Carcharhinus plumbeus. Molecular Ecology, 19, 1994–2010.
Portnoy, D.S., Puritz, J.B., Hollenbeck, C.M., Gelsleichter, J., Chapman, D. and Gold, J.R. (2015). Selection and sex-biased dispersal in a coastal shark: The influence of philopatry on adaptive variation. Molecular Ecology, 24(23), pp.5877-5885.
Puritz, J. B., Hollenbeck, C. M., & Gold, J. R. (2014). dDocent : a RADseq, variant-calling pipeline designed for population genomics of non-model organisms. PeerJ, 2, e431. https://doi.org/10.7717/peerj.431
Qi, H., Song, K., Li, C., Wang, W., Li, B., Li, L. and Zhang, G. (2017). Construction and evaluation of a high-density SNP array for the Pacific oyster (Crassostrea gigas). PLoS One, 12(3), p.e0174007.
Rice, J., & Harley, S. (2013). Updated stock assessment of the Silky sharks in the Western and Central Pacfific Ocean. WCPFC-SC9-2013/ SA-WP-03, August.
RStudio Team (2020). RStudio: Integrated Development Environment for R. RStudio, PBC, Boston, MA URL http://www.rstudio.com/ Ryman, N. and Palm, S., (2006). POWSIM: a computer program for assessing statistical power when
testing for genetic differentiation. Molecular Ecology Notes, 6(3), pp.600-602. Schlötterer, C., Tobler, R., Kofler, R., & Nolte, V. (2014). Sequencing pools of individuals-mining
genome-wide polymorphism data without big funding. Nature Reviews Genetics, 15(11), 749–763. https://doi.org/10.1038/nrg3803
Schultz, J. K., Feldheim, K. A., Gruber, S. H., Ashley, M. V. H., McGovern, T. M., Bowen, B. W.,

33
Bruber, S. H., Ashley, M. V. H., McGovern, T. M., & Bowen, B. W. (2008). Global phylogeography and seascape genetics of the lemon sharks (genus Negaprion). Molecular Ecology, 17(24), 5336–5348. https://doi.org/10.1111/j.1365-294X.2008.04000.x
Stevens, J. D., Bonfil, R., Dulvy, N. K., & Walker, P. A. (2000). The effects of fishing on sharks, rays, and chimaeras (chondrichthyans), and the implications for marine ecosystems. ICES Journal of Marine Science, 57(3), 476–494. https://doi.org/10.1006/jmsc.2000.0724
Tallmon, D. A., Gregovich, D., Waples, R., & Baker, C. S. (2010). When are genetic methods useful for estimating contemporary abundance and detecting population trends? Molecular Ecology Resources, 10, 684–692.
Theisen, T. C., Bowen, B. W., Lanier, W., & Baldwin, J. D. (2008). High connectivity on a global scale in the pelagic wahoo, Acanthocybium solandri (tuna family Scombridae). Molecular Ecology, 17, 4233–4247.
Therkildsen, N.O. and Palumbi, S.R. (2017). Practical low-coverage genomewide sequencing of hundreds of individually barcoded samples for population and evolutionary genomics in nonmodel species. Molecular ecology resources, 17(2):194-208.
Toonen, R.J. and Grosberg, R.K. (2011). Causes of chaos: spatial and temporal genetic heterogeneity in the intertidal anomuran crab Petrolisthes cinctipes. Phylogeography and population genetics in Crustacea, 2011: 75-107.
Toonen, R. J., Puritz, J. B., Forsman, Z. H., Whitney, J. L., Fernandez-Silva, I., Andrews, K. R., & Bird, C. E. (2013). ezRAD: a simplified method for genomic genotyping in non-model organisms. PeerJ, 1, e203. https://doi.org/10.7717/peerj.203
Veríssimo A, Sampaio Í, McDowell JR, Alexandrino P, Mucientes G, Queiroz N, da Silva C, Jones CS, Noble LR (2017) World without borders—genetic population structure of a highly migratory marine predator, the blue shark (Prionace glauca). Ecol Evol 7:4768–4781. doi: 10.1002/ece3.2987
Weir, B.S. and Cockerham, C.C. (1984). Estimating F-statistics for the analysis of population structure. Evolution 38(6):1358-1370.
Whitney, N. M., Robbins, W. D., Schultz, J. K., Bowen, B. W., & Holland, K. N. (2012). Phylogeography of the whitetip reef shark (Triaenodon obesus): a sedentary species with a broad distribution. Journal of Biogeography, 39, 1144–1156.
Zink, R.M., Barrowclough, G. (2008). Mitochondrial DNA under siege in avian phylogeography. Molecular Ecology, 17, 2107–2121.
34
Tables and Figures
Figure 1. Sample locations of Carcharhinus falciformis followed by sample size. Abbreviations: GM = Gulf
of Mexico, NA = North Atlantic, BR = Brazil, RS = Red Sea.
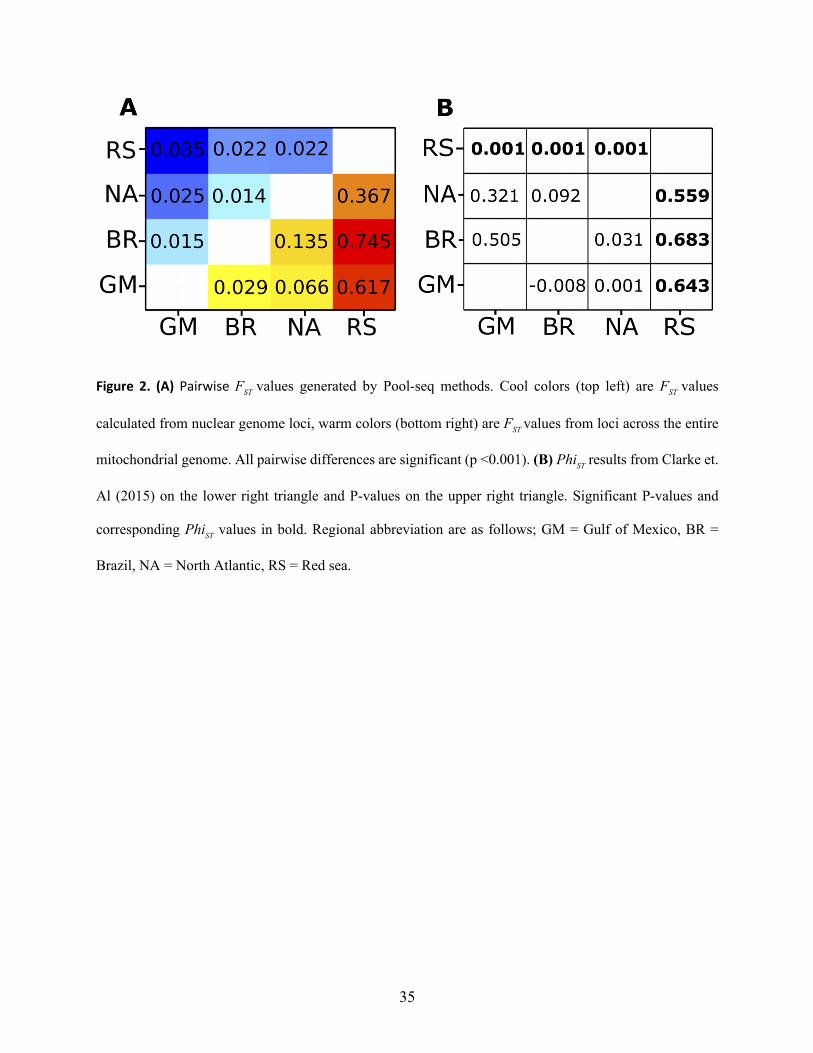
35
Figure 2. (A) Pairwise FST values generated by Pool-seq methods. Cool colors (top left) are FST values
calculated from nuclear genome loci, warm colors (bottom right) are FST values from loci across the entire
mitochondrial genome. All pairwise differences are significant (p <0.001). (B) PhiST results from Clarke et.
Al (2015) on the lower right triangle and P-values on the upper right triangle. Significant P-values and
corresponding PhiST values in bold. Regional abbreviation are as follows; GM = Gulf of Mexico, BR =
Brazil, NA = North Atlantic, RS = Red sea.
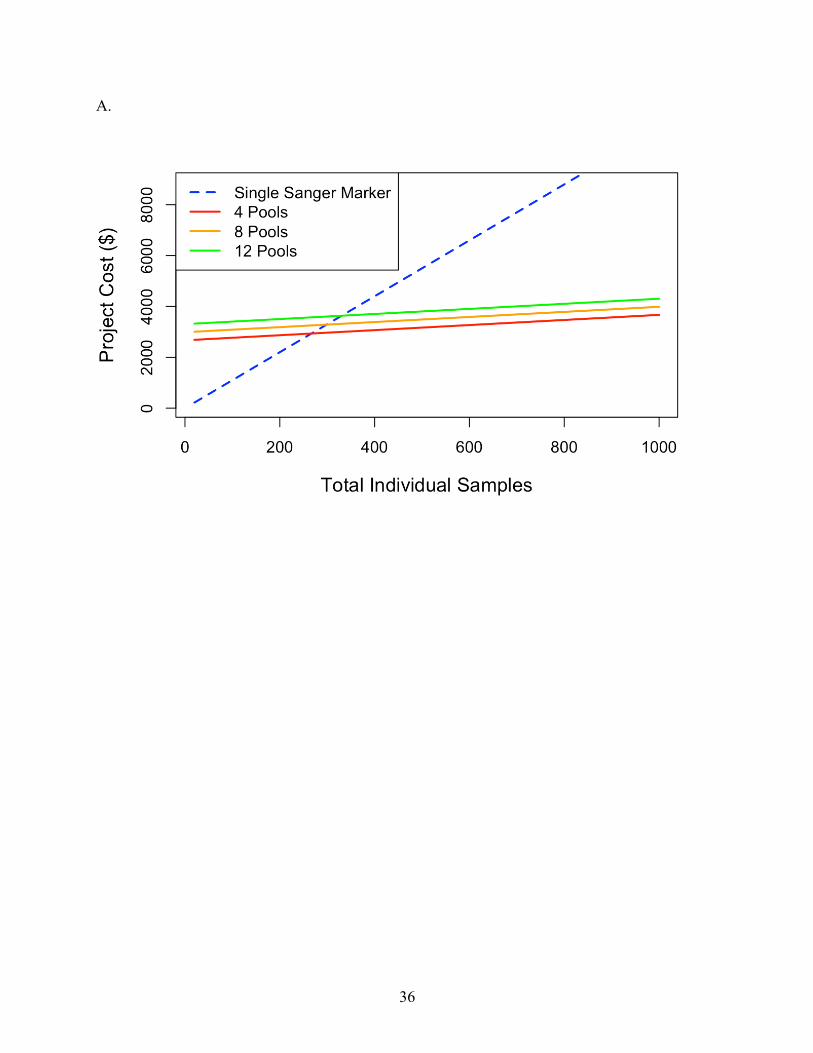
36
A.
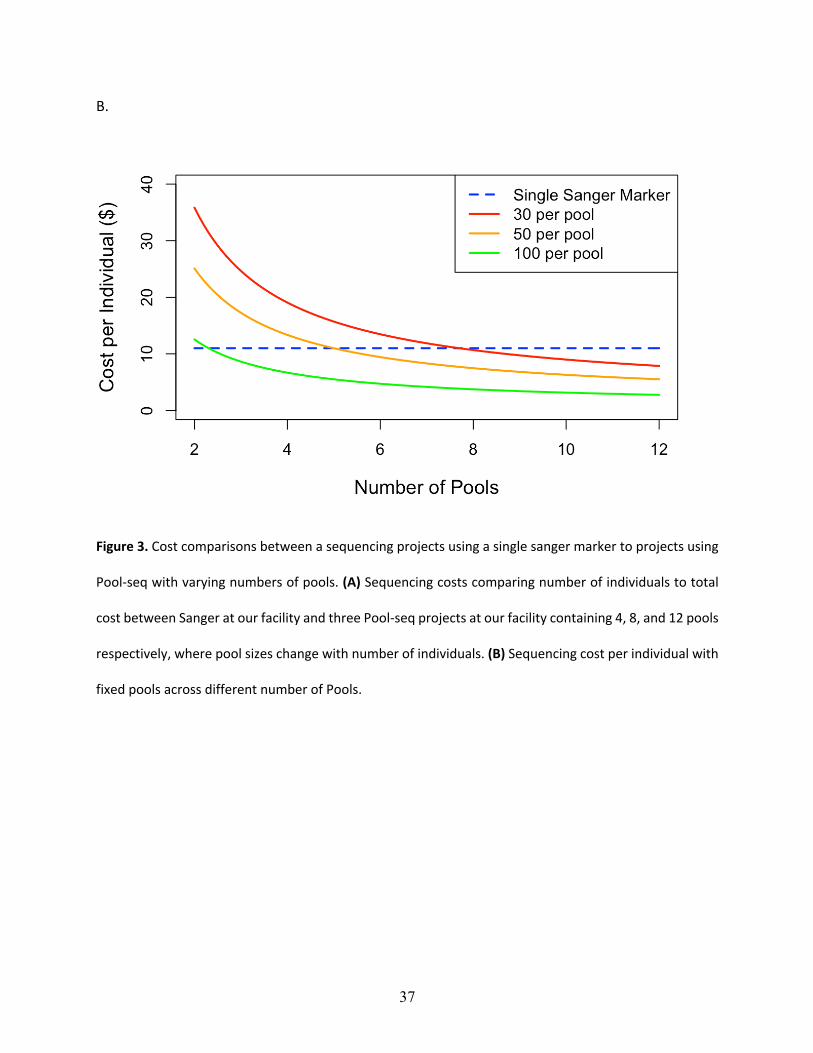
37
B.
Figure 3. Cost comparisons between a sequencing projects using a single sanger marker to projects using
Pool-seq with varying numbers of pools. (A) Sequencing costs comparing number of individuals to total
cost between Sanger at our facility and three Pool-seq projects at our facility containing 4, 8, and 12 pools
respectively, where pool sizes change with number of individuals. (B) Sequencing cost per individual with
fixed pools across different number of Pools.
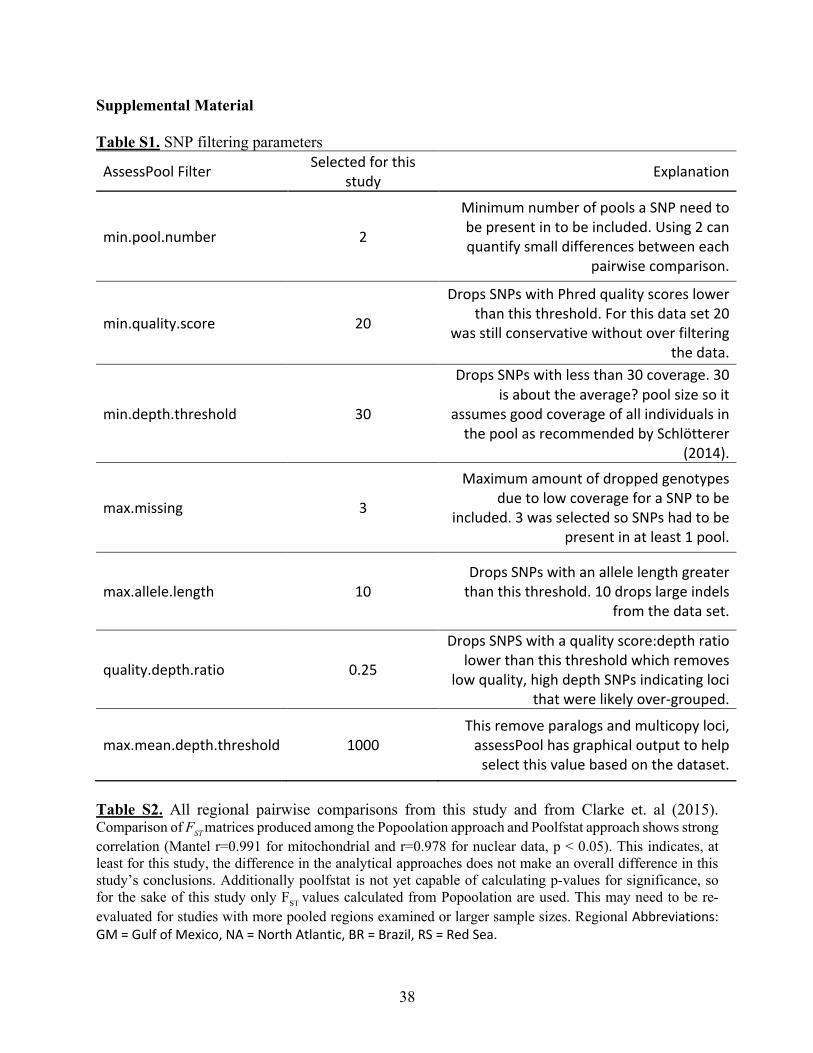
38
Supplemental Material Table S1. SNP filtering parameters
AssessPool Filter Selected for this study Explanation
min.pool.number 2
Minimum number of pools a SNP need to be present in to be included. Using 2 can quantify small differences between each
pairwise comparison.
min.quality.score 20
Drops SNPs with Phred quality scores lower than this threshold. For this data set 20
was still conservative without over filtering the data.
min.depth.threshold 30
Drops SNPs with less than 30 coverage. 30 is about the average? pool size so it
assumes good coverage of all individuals in the pool as recommended by Schlötterer
(2014).
max.missing 3
Maximum amount of dropped genotypes due to low coverage for a SNP to be
included. 3 was selected so SNPs had to be present in at least 1 pool.
max.allele.length 10 Drops SNPs with an allele length greater
than this threshold. 10 drops large indels from the data set.
quality.depth.ratio 0.25
Drops SNPS with a quality score:depth ratio lower than this threshold which removes
low quality, high depth SNPs indicating loci that were likely over-grouped.
max.mean.depth.threshold 1000 This remove paralogs and multicopy loci,
assessPool has graphical output to help select this value based on the dataset.
Table S2. All regional pairwise comparisons from this study and from Clarke et. al (2015). Comparison of FST matrices produced among the Popoolation approach and Poolfstat approach shows strong correlation (Mantel r=0.991 for mitochondrial and r=0.978 for nuclear data, p < 0.05). This indicates, at least for this study, the difference in the analytical approaches does not make an overall difference in this study’s conclusions. Additionally poolfstat is not yet capable of calculating p-values for significance, so for the sake of this study only FST values calculated from Popoolation are used. This may need to be re-evaluated for studies with more pooled regions examined or larger sample sizes. Regional Abbreviations: GM = Gulf of Mexico, NA = North Atlantic, BR = Brazil, RS = Red Sea.
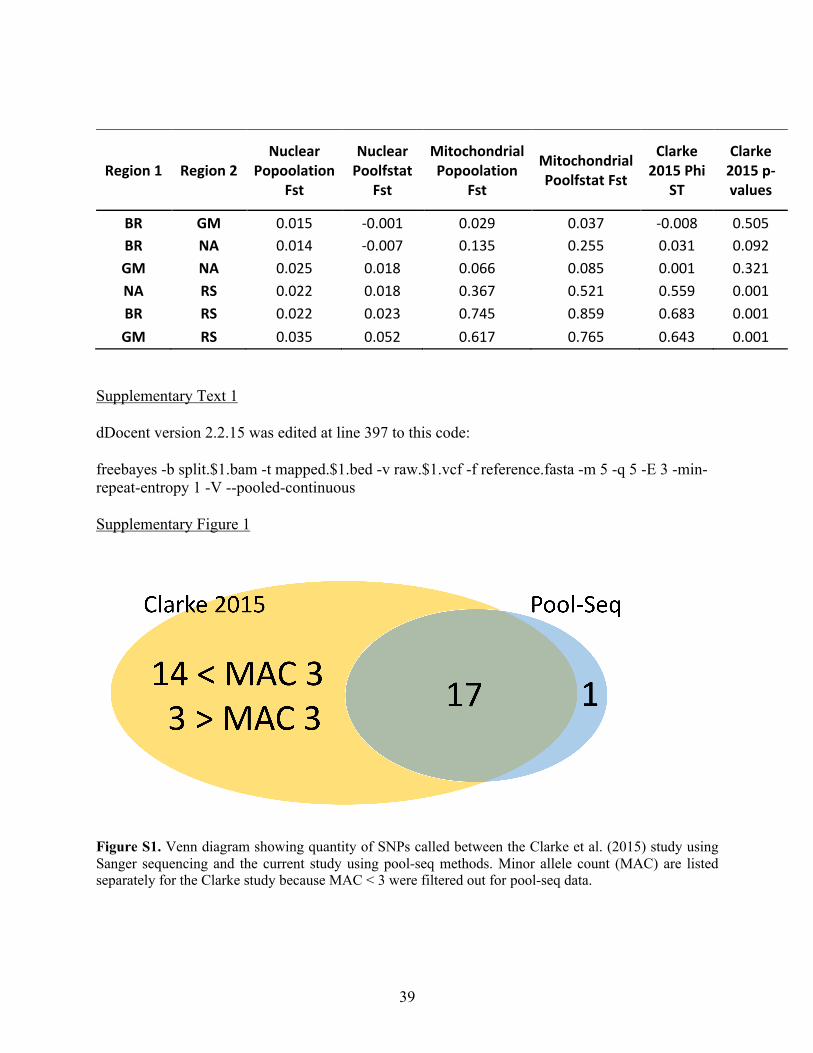
39
Region 1 Region 2 Nuclear
Popoolation Fst
Nuclear Poolfstat
Fst
Mitochondrial Popoolation
Fst
Mitochondrial Poolfstat Fst
Clarke 2015 Phi
ST
Clarke 2015 p-values
BR GM 0.015 -0.001 0.029 0.037 -0.008 0.505 BR NA 0.014 -0.007 0.135 0.255 0.031 0.092 GM NA 0.025 0.018 0.066 0.085 0.001 0.321 NA RS 0.022 0.018 0.367 0.521 0.559 0.001 BR RS 0.022 0.023 0.745 0.859 0.683 0.001 GM RS 0.035 0.052 0.617 0.765 0.643 0.001
Supplementary Text 1 dDocent version 2.2.15 was edited at line 397 to this code: freebayes -b split.$1.bam -t mapped.$1.bed -v raw.$1.vcf -f reference.fasta -m 5 -q 5 -E 3 -min-repeat-entropy 1 -V --pooled-continuous Supplementary Figure 1
Figure S1. Venn diagram showing quantity of SNPs called between the Clarke et al. (2015) study using Sanger sequencing and the current study using pool-seq methods. Minor allele count (MAC) are listed separately for the Clarke study because MAC < 3 were filtered out for pool-seq data.
40
CHAPTER THREE
Strong population structure in the Silky shark (Carcharhinus falciformis) defies expectations for a pelagic shark, and confounds
current management regimes
Derek W. Kraft1*, Melanie Hutchinson2, Emily Conklin1, Evan Barba1, Robert J. Toonen1,
Zac H. Forsman1, Michael I. Grant3, Julia Spaet4, John David Filmalter5, John Hyde6, Simon Gulak7, Brian W. Bowen1
1 Hawai‘i Institute of Marine Biology, University of Hawai‘i, 46-007 Lilipuna Road, Kane‘ohe, HI 96744 2 Joint Institute for Marine and Atmospheric Research, University of Hawaii, Pacific Islands Fisheries Science Center, NOAA 3 Centre for Sustainable Tropical Fisheries and Aquaculture and College of Science and Engineering, James Cook University, 1 James Cook Drive, Townsville, Qld 4811, Australia. 4 Evolutionary Ecology Group, Department of Zoology, University of Cambridge, Cambridge CB2 3EJ, UK 5 South African Institute for Aquatic Biodiversity, Somerset Street Makhanda, 6139, South Africa 6 National Oceanic and Atmospheric Administration, National Marine Fisheries Service, Southwest Fisheries Science Center, 8901 La Jolla Shores Drive, La Jolla, CA 92037 7 Southeast Fisheries Observer Programs, NOAA Fisheries Service Panama City Laboratory, 3500 Delwood Beach Rd, Panama City, FL 32408
41
Abstract
Silky sharks (Carcharhinus falciformis) are declining around the globe and it is currently the
second most harvested shark on the planet after the blue shark (Prionace glauca). The leading
contributor to these declines are tuna by-catch and other pelagic fisheries. This species is
currently managed as a single stock by Regional Fisheries Management Organizations (RMFO),
due to insufficient data. Genetic population structure can resolve dispersal boundaries and
provide an appropriate foundation for defining stocks, which is essential for successful wildlife
management. This study investigates the global stock structure of silky sharks using high-
throughput sequencing of pooled individuals (Pool-seq) based on 628 specimens from 11
regions, collected by commercial and artisanal fisheries. Single nucleotide polymorphism (SNPs)
indicate significant population structure between all 11 sampled regions, with mtDNA FST =
0.012 – 0.160 and nDNA FST = 0.012 – 0.030 within oceans, and a larger partition between
oceans (mean mtDNA FST = 0.642, mean nDNA FST = 0.049). These results are unprecedented
for pelagic sharks, which usually show population structure on the larger scale of ocean basins,
and challenge the single stock per RMFO management scheme currently in place. We resolved at
least four genetically distinct stocks within the jurisdiction of the Western Central Pacific
Fisheries Commission (WCPFC), two stocks within the area served by the Indian Ocean Tuna
Commission (IOTC), and four within the International Commission for the Conservation of Tuna
(ICCAT) jurisdiction.
Key words: Bycatch, conservation genetics, elasmobranch, marine fishes, phylogeography,
pool-seq
42
Introduction
Silky sharks (Carcharhinus falciformis) are a semi pelagic species inhabiting tropical and sub-
tropical waters that overlap with intensively targeted tuna stocks around the globe. Juvenile
silky sharks are often found in association with Fish Aggregating Devices (FADs) used in
tropical tuna purse seine fisheries and therefore account for >90% of the shark bycatch (Lawson
2011; Hutchinson 2014). Demographic analyses for sharks have shown that this juvenile
mortality is the most detrimental to population trajectories (Beerkircher 2003). In addition, silky
shark populations are threatened by the high demand for shark fins. According to data from
Hong Kong's Census and Statistics Department, 83 countries or territories supplied more than
10.3 million kilograms of shark fin products to Hong Kong in 2011. This intense fishing pressure
is unsustainable for most shark species, and silky sharks are one of the most abundant species in
the fin market (Bonfil 1994; Clarke et al. 2006; Cardeñosa et al. 2018). The silky shark was once
abundant in all tropical oceans, yet due to incidental capture in pelagic fisheries worldwide as
well as targeted fisheries for the fin trade, this pelagic shark has declined by 85% over the last 20
years (Rice and Harley 2013). Finally, low fecundity, late maturity, and long life spans make
sharks susceptible to overharvest, and populations can take decades to recover, and that’s only
when fishing pressure is reduced (Stevens et al. 2000; Dulvy et al. 2008). As a result, this species
is currently listed as vulnerable by the International Union for Conservation of Nature’s (IUCN)
red list (IUCN 2020) and the Convention on International Trade in Endangered Species (CITES)
appendix II. Without proper management this species will continue to decline and could follow
the footsteps of the Oceanic White Tip shark (Carcharhinus longimanus) which has recently
been classified as threatened under the U.S. Endangered Species Act (Federal Register 83 FR
4153, January 30, 2018).
43
There are five Regional Fisheries Management Organization (RFMOs) that manage and
conserve pelagic fish stocks around the world. Initially these RFMOs were created with a focus
on tuna stocks, but also are responsible for managing other highly migratory species such as
billfish, sauries, pomfrets and pelagic sharks (Tolotti et al. 2015). Each RFMO conducts their
own stock assessment and makes management recommendations within their designated regions
(Clarke et al. 2018; Ortiz de Urbina et al. 2018; Lennert-Cody et al. 2019). Four of them
currently manage silky shark stocks, the fifth is focused on the southern bluefin in waters outside
primary silky shark habitat. The Indian Ocean Tuna Commission (IOTC), Western Central
Pacific Fisheries Commission (WCPFC), Inter-American Tropical Tuna Commission (IATTC),
and International Commission for the Conservation of Tuna (ICCAT) each manage silky sharks
as a single stock within their jurisdiction (Fig. 1). The assumption of a single stock implies, for
example, that heavy fishing in one part of the SE Pacific Ocean will be replenished by sharks
from other areas within the RFMO. However, this may not be the case, as the assignment of a
single stock is based primarily on political boundaries and a lack of information. It is possible
there are several distinct stocks within an RFMO and therefore areas where heavy fishing occurs
must rely on self-recruitment. Obviously, smaller stocks are much more vulnerable to
overfishing (Hutchings and Reynolds 2004).
Testing for genetic structure amount populations can resolve dispersal boundaries and provide an
appropriate foundation for defining stocks (Carvalho and Hauser 1994; Ward 2000). Genetic
tools provide one means to delineating management units for populations important for fisheries
44
(Altukhov et al. 2000; Ablan 2006; Ovenden et al. 2015), a prerequisite for any successful
wildlife management (Dizon et al. 1993; Waldman 2005).
Three previous studies have examined the population structure of silky sharks using the
mitochondrial control region (mtCR). Two reported weak but significant population structure
across the Indo-Pacific (Galván-Tirado et al. 2013; Clarke et al. 2015). One study found
population structure within the Atlantic (Domingues et al. 2017) and two found strong
population structure between the Atlantic and Indo-Pacific (Clarke et al. 2015; Domingues et al.
2017). For the past two decades studies to resolve population structure of elasmobranchs have
focused on a handful of mitochondrial and microsatellite loci (reviewed in Domingues et al.
2017a). However, with advances in DNA sequencing technologies, there are fewer limitations
and it is now possible to genotype thousands of nuclear and mitochondrial markers.
High-throughput sequencing is a powerful tool for examining genetic diversity across tens of
thousands of single nucleotide polymorphisms (SNPs) throughout the genome. In recent years,
SNPs have become the gold standard method to establish population structure for commercially
important marine species (Hess et al. 2011; Albaina et al. 2013; Diopere et al. 2017; Puncher et
al. 2018). Genome resequencing and reduced representation sequencing provide power to resolve
population structure over recent evolutionary time scales. However, these methods can be cost
prohibitive for population-level studies. Since determining population-level allele frequency
estimates are key to population genetics, pooling individual DNA specimens into single samples
before sequencing (Pool-seq) is an affordable and accurate method for large scale genetic
analysis (Futschik and Schlötterer 2010; Rellstab et al. 2013; Schlötterer et al. 2014; Mimee et al.
45
2015; Nielsen et al. 2018, Kraft et al. 2020). This study examines population structure of the
silky shark from eleven regions across the entire range of the Silky shark. High-throughput
sequencing is used to assess both the mitochondrial and nuclear loci of silky sharks to provide
the most extensive silky shark population genetic study to date. Our analyses reveal significant
population structure between all regions examined. This information provides the scientific basis
for implementing a multiple stock management plan for silky sharks across the globe.
Methods
Sample collection
Fin clips or muscle sections were collected from 628 silky sharks from across the globe by
scientists and fishery observers aboard commercial fishing vessels. Samples were immediately
stored in 80% ethanol or saturated salt (NaCl) buffer. Collections include 11 regions across the
range of the silky shark (Fig 1. Fig S1).
DNA Sequencing
DNA was extracted using Qiagen DNeasy Blood & Tissue kit (Qiagen, Mississauga, ON,
Canada), following manufactures instructions. Extracted DNA was then passed through
electrophoresis gel and imaged using Gel Doc E-Z System (BIO RAD, Hercules, California,
USA) to ensure intact, high quality DNA. The extracted DNA was prepared for quantification
using an AccuClear Ultra High Sensitivity dsDNA Quantitation Kit (Biotium, Fremont, CA,
USA) and quantified on a SpectroMax M2 (Molecular Devices, Sunnyvale, CA, USA). Equal
amounts of DNA (ng/µl) per individual were added to regional pools to minimize individual
contribution bias. Pooled libraries contained 2000 ng of DNA total. The rest of the library

46
preparation followed the ToBo laboratory ezRAD protocol (Toonen et al. 2013; Knapp et al.
2016), with the modification that no libraries were amplified by PCR in order to prevent PCR
bias between samples, and maintain equal contributions of DNA from individuals across each
library. This library preparation utilized restriction enzyme DPNII, and Kapa hyper Prep Kit for
adapter ligation (Kapa Biosystems, Wilmington, MA, USA). Libraries were sequenced using
Illumina MiSeq with paired end, 300 bp runs (performed by the Hawai‘i Institute of Marine
Biology EPSCoR Core sequencing facility).
Genetic analyses
Sequence libraries were first examined with MultiQC v 1.2 (Ewels et al. 2016) to assess
sequence quality scores, sequence length distributions, duplication levels, overrepresented
sequences, and other artifacts. Raw paired-end reads were trimmed using Trimmomatic (Bolger
et al. 2014), mapped to the genome reference or nuclear contigs using BWA, mem algorithm (Li
and Durbin 2009), and SNPs were identified using Freebayes v 1.0.2 (Garrison and Marth 2012,
https://github.com/ekg/freebayes). All these programs are wrapped in dDocent bioinformatics
pipeline (Puritz et al. 2014).
To analyze the mitochondrial genome, a previously published silky shark mitochondrial genome
was used as a reference (GeneBank accession number KF801102). Reads were mapped to this
mitochondrial genome and SNPs called for analysis. For the nuclear data set the dDocent
pipeline was also used. A de novo assembly was constructed and optimized utilizing the
reference optimization steps following standard dDocent assembly protocols
(http://ddocent.com/assembly/). This created all the contigs to be used a reference for nuclear
47
mapping. Once assembled sequences were mapped to the contigs, then SNPs were identified. To
separate nuclear and mitochondrial data any contigs that aligned to the mitochondrial genome
were removed. Contigs with < 30x coverage were removed due to pooled library coverage depth
should be at least match the deapth of the sample size, and for this study the lowest sample size
was 33 (Fig. 1)
Due to differences between individual library analyses and pooled library analyses, the SNP
calling portion of both pipelines, Freebayes was optimized with the addition of ‘pooled
continuous’ option of the program and minor allele frequency was set to the 0.05 standard. SNPs
were analyzed with the pool-seq specific bioinformatics pipeline assessPool
(github.com/ToBoDev/assessPool). This pipeline uses VCFtools v 0.1.14 to filter SNPs
(Danecek et al. 2011) and Popoolation2 v 1.2.2 to compare allele frequencies between
populations by calculating pairwise FST values (Kofler et al. 2011). Significance of FST values
was assessed using a two-tailed Wilcoxon rank sum test (Nolte et al. 2013; Kurland et al. 2019).
AssessPool then organizes, summarizes, and creates visualizations of the data using Rstudio and
several R packages used in assessPool (RStudio Team 2020).
Results
Sequencing of all libraries yielded 95.6 million reads with each library averaging 8.6 ± 2.9
million reads. After trimming, each library averaged 7.8 ± 2.4 million reads. MulitQC
assessment showed fairly similar output between libraries in regard to sequence quality scores,
GC and per base sequence content, sequence length distributions, duplication levels,
overrepresented sequences, and adapter content. A total of 168,921 SNPs were called between

48
both the mitochondrial and nuclear data sets. 33,564 were biallelic SNPs, 2,186 were multiallelic
SNPs and 616 were insertions and deletions (INDELs). INDELs and multiallelic SNPs remain a
challenge for quantification, so this analysis is restricted to biallelic SNPs. Visualizations of FST
values created by AssessPool allow for identification of outlier SNPs and none appear to be
present in the data set. Given the randomization of SNPs called across the genome they are
assumed to be putatively neutral.
The entire mitochondrial genome was analyzed and yielded 276 SNPs. Coverage on average was
lower than anticipated, therefore most SNPs did not meet the threshold of 30x coverage. After
further conservative filtering 23 SNPs were used for allele frequency calculations. Filtering
parameters are listed in Supplemental Table 1. As reported in Clark et al. (2015), we observed
diagnostic (fixed) differences between Atlantic and Indo-Pacific cohorts. From the nuclear data
set 168,645 SNPs were generated across 9,821 contigs, however only 5,559 SNPs were called
across all pooled libraries. After identical filtering parameters as used for the mitochondrial
genome, 882 SNPs remained for allele frequency calculations.
FST values from the mitochondrial data set were larger than those from the nuclear data set,
sometimes by an order of magnitude (Figure 2, Table 1). Additionally, there is stronger structure
between populations within the Atlantic than within the Indo-Pacific. All comparisons between
Atlantic regions and Indo-Pacific regions were higher than any comparison within an ocean
basin within their respective dataset (Table 1). More importantly, FST values from all
comparisons, both mitochondrial and nuclear, yielded P values less than 0.001 from the two-
49
tailed Wilcoxon rank sum test. Hence all regions tested in this study have significant genetic
differences between them.
The North West Atlantic (NWA) library showed the highest isolation within Atlantic samples
and the lowest isolation in Atlantic to Indo-Pacific comparisons in both the mtDNA and nDNA
(Fig. 2). Where most comparisons between Atlantic and Indo-Pacific ranged from 0.60 – 0.84,
all NWA samples ranged between 0.383 – 0.455 (Table 1). However, the NWA also was the
lowest sample size in the study. The highest FST values between the Atlantic and Indo-Pacific
were in comparisons to Brazil. The lowest Brazil to any Indo-Pacific region was higher than any
other interocean comparison except in the nuclear data set, where FST = 0.055 in NWA to Indian
Ocean (IDO) and FST = 0.053 in the lowest Brazilian to Indo-Pacific comparison. Within the
Indo-Pacific, IDO and Eastern Pacific (EPAC) showed the highest isolation from all other
regions, which makes sense given their geographical distance. Though the comparisons within
the WCPFC yielded the lowest interocean isolation in both data sets, they still have significant
FST values. The Red Sea (RDS) shows lower structure with most Indo-Pacific sample locations,
but still shows stronger structure between RDS and IDO, tied for the highest FST value in the
nuclear data set and middle to upper range in the mitochondrial data set (Table 1).
To assess if FST values between mitochondrial and nuclear data sets were correlated a Mantel
statistic based on Pearson's product-moment correlation (Mantel test) was performed resulting in
an r = 0.9471 and significance of 6.25e-05. This demonstrates that the patterns found in both data
sets were correlated with one another.
50
Discussion
Silky shark populations are subject to heavy fishing pressure to the point where numbers have
plummeted. Due to their intrinsic rate of population growth, pelagic sharks including C.
falciformis are slow to recover and extremely vulnerable to overfishing (Musick et al. 2002;
Cortés et al. 2010; Rice and Harley 2013; Oliver et al. 2015; Lopez et al. 2020). Current
management of the Silky shark does not account for genetic population structure and regional
stocks are based on the RFMO default for species which lack information, which is one stock per
RFMO. This lack of management resolution could underestimate the risk associated with smaller
populations and further the depletion of silky shark population (Hutchings and Reynolds 2004).
Managing on a true genetic stock by stock basis is essential for wildlife conservation (Dizon et
al. 1993; Carvalho and Hauser 1994; Altukhov et al. 2000; Ward 2000; Ablan 2006; Ovenden et
al. 2015; Domingues et al. 2018).
Our results refined our understanding of silky shark stock structure generated from any earlier
genetic approaches. Finding strong genetic separation between the Atlantic and Indo-Pacific is
not surprising and supports previous results by Clarke et al. (2015) using microsatellite
approaches. The high FST values for between ocean comparisons in the present study (ranging
from 0.383 - 0.844) invokes the possibility of distinct evolutionary lineages in the Atlantic and
Indo-Pacific; it may be worth looking into speciation between ocean basins. Genetic population
structure was found between every region sampled in the Atlantic, including the proximal
geographical samples from GOM and NWA. Domingues et al. (2017) found structure between
the South Atlantic and North Atlantic populations utilizing mtDNA control region data but did
not detect the structure within southern or northern hemispheres that we identify here. Utilizing
51
the Pool-seq approach increased the data analyzed for these regions and revealed greater
structure as also demonstrated in Kraft et al. (in press).
The significant stock structure across the Indo-Pacific indicates that this pelagic shark may not
be as wide roaming as originally thought. Results from Clarke et al. (2015) and Galván-Tirado et
al. (2013) showed weak structure between some regions across the Indo-Pacific based on fewer
specimens and locations. Certainly the FST values for regions sampled within the WCPFC
domain demonstrated the lowest structure, albeit statistically significant. These regions showed
stronger structure when compared to EPAC and IDO suggesting possible isolation by distance.
Contrary to isolation by distance scenarios, the RDS had lower FST values in comparisons to the
Western Pacific than to the adjacent IDO. Anomalously, RDS to IDO comparisons were among
the highest FST values in the Indo-Pacific mtDNA data set. This runs counter to both the
geography and the known biogeographic history of the Red Sea, which was thought to be
recolonized from the Indian Ocean after desiccation events (DiBattista et al. 2013, 2016; but see
Coleman et al. 2016). These results are consistent with Clarke et al. (2015), which reported no
significant difference between the Red Sea and Central Pacific (Line Islands) but did find
significant differences between the Red Sea and Indian Ocean (Andaman Sea). At face value this
indicates higher connectivity between the Central Pacific to the Red Sea relative to the Indian
Ocean and Coral Triangle. However, it could also be a coincidence due to random genetic drift,
but we discount such explanations because of the much higher number of nuclear loci in the
current study. A more intriguing and alarming explanation is that intense fishing pressure in the
Indian Ocean (Amandè et al. 2008) has accelerated allele frequency changes through selection or
genetic drift on diminishing populations.

52
A recurring theme in animal population genetics is a finding of higher structure with mtDNA
than nDNA, as we report here for C. falciformis. Many of these results can be attributed to the
effective population size in haploid mtDNA, which is four-fold lower than diploid nDNA (Hartl
and Clark 1997). (In every generation, four nuclear alleles can be transmitted from diploid
parents, whereas only one mtDNA genotype can be transmitted from the maternal parent.) The
stronger genetic drift in mtDNA almost invariably yields higher FST values. However, when
mtDNA shows much higher population structure relative to nDNA, there may be additional
explanations from the natural history of the organism. Sea turtles provide an extreme example
wherein mtDNA lineages are highly structured by female site fidelity to nesting beaches, but
nDNA may show no regional structure due to male wandering (Bowen et al. 2005). This
mtDNA/nDNA pattern is apparent in several large migratory sharks, including the white shark
(Carcharadon carcharias; Pardini et al. 2001), Shortfin mako (Isurus oxyrhinchus; Schrey and
Heist 2003), Sandbar shark (C. plumbeus; Portnoy et al. 2010), and Scalloped hammerhead shark
(Sphyrna lewini; Daly-Engel et al. 2012). In all cases the finding is attributed to female site
fidelity to reproductive habitat. Females and males may have similar migratory patterns, but only
the males disperse gametes during these migrations through opportunistic mattings. Hence the
findings presented here suggest the possibility of female site fidelity to as yet undiscovered
pupping grounds.
There are two main caveats to this dataset require consideration when interpreting the results.
First, individual samples are assigned to a pool by location captured, assuming they are a part of
the same genetic population. This could be problematic in cases where members of separate
53
genetic populations overlap in habitat such as the Atlantic bluefin tunas (Rooker et al. 2008;
Puncher et al. 2018).
Future studies should focus on young of the year silky sharks to avoid possible migration of
larger individuals to elucidate important nursery grounds. Additionally, if your pooling strategies
expect larger populations, you could be pooling two smaller populations together and missing
fine scale structure (see Figure S1 for pooling strategy). The second main caveat in this study is
significance testing and interpretation of high throughput sequencing data. When presented with
low but significant FST values, it raises the question of biological significance or an artifact of
large data sets. The Wilcoxon rank sum test has been used for pool-seq population structure
analysis (Nolte et al. 2013; Kurland et al. 2019) and the most appropriate test for this type of data
but its not perfect. One assumption violated is not all comparions are completely independent
considering the same libraries are used in multiple comparions to each other (eg. EPAC to NCP,
EPAC to SCP, EPAC to IDO etc). However, it is imformative for this application because we are
testing the overall patterns between all comparisons. Considering these caveats, this dataset and
interpretation reflects the true biology of silky sharks. Given the weak structure found in
previous mtCR studies, broadening the loci examined would increase levels of structure found.
Furthermore, the mantel test showing r = 0.9471 shows a strong correlation between the
mitochondrial and nuclear datasets, supporting biological significance as opposed to artifacts in
the data. Lastly, literature from other fields such as telemetry and life history parameter studies
support evidence of silky sharks having reduced population distribution.
54
Relevant Telemetry
True roamers of the sea like the blue shark (Prionace glauca) and whale shark (Rhincodon typus)
have long distance movements documented by satellite tags. Blue sharks tagged in the Northern
mid-Atlantic have been tracked to the equator while others moved to the Caribbean and down the
west coast of Africa, traveling up to 28,000 km (Vandeperre et al. 2014, 2016). Whale sharks
have twice demonstrated trans-Pacific migrations from waters off Mexico to the Western Pacific,
as well as other long distance movements (Eckert and Stewart 2001; Guzman et al. 2018).
Genetic surveys of both of these long range sharks reveal no population structure across the
Indo-Pacific nor within the Atlantic Ocean when analyzing mitochondrial markers and
microsatellites (Castro et al. 2007; Schmidt et al. 2009; King et al. 2015; Taguchi et al. 2015;
Yagishita et al. 2020). The wahoo (Acanthocybium solandri; tuna family Scombridae) has been
documented to travel thousands of km and has no mtDNA population structure worldwide
(NMFS 1999; Theisen et al. 2008; Theisen and Baldwin 2012). Some pelagic species that have
shown long range movements do show some genetic structure when more in-depth SNP analysis
are utilized, even though mtDNA and microsatellite data did not show structure (reviewed in
Moore et al. 2020). These studies induced skipjack tuna (Katsuwonus pelamis), yellowfin tuna
(Thunnus albacares), bigeye tuna (Thunnus obesus), and albacore tuna (Thunnus alalunga), who
tag recapture data does show long distance movements across the Pacific. Therefore, some
caution needs to be taken here when comparing only mtDNA and microsatellite data. In most of
these cases however the telemetry and genetic data provide concordant and complimentary
scenarios for pelagic fish dispersal.
55
A handful of studies have investigated movement of silky sharks, and some patterns may be
emerging. Studies utilizing acoustic tags with fixed receivers, either on FADs or fixed locations
(reefs or banks) show most silky sharks demonstrated long residence times and close association
to tagging location for the duration of the studies (Clarke et al. 2011; Filmalter et al. 2011, 2015;
Hueter et al. 2018; Lara-lizardi et al. 2020). For instance, while one female Silky shark of 163
cm total length (TL) captured in the East Pacific traveled 965 km from Revillagigedo
Archipelago to Clipperton Atoll and another female 187 cm TL moved 2200 km from Galapagos
Archipelago to Clipperton Atoll, 90% of movements from all 32 sharks in the study remained
<50km of where they were tagged and showed high site fidelity (Lara-lizardi et al. 2020).
Satellite tracking data also illustrates residency at FADs, and even when silky sharks are not
associated with FADs they generally don’t travel large oceanic distances (Filmalter et al. 2015;
Hutchinson et al. 2015, 2019; Schaefer et al. 2019). One exception observed by Schaefer et al.
(2019) was a shark traveling 3,195 km over 180 days, however the maximum distance between
tagging and tag pop off location for the other 28 sharks in this study was 995 km. Pacific Silky
sharks reach sexual maturity between 180-216 cm TL and therefore a majority of subjects in
these studies were juvenile to sub adult, the age classes common found around FADs and as
bycatch in fisheries (Forget et al. 2015; Hutchinson et al. 2019). Therefore, younger silky sharks
show residency behavior either around FADs or loosely around island chains or archipelagos
with few long ocean crossings. The question remains whether adult silky sharks perform long
distance movements across ocean basins and this could possibly lead to a larger panmictic
population, however this is not reflecting in the genetic population structure found in this study.
Rather it may be that adult females migrate to particular pupping grounds given our mtDNA
results. Additional long-term satellite tracking data would be useful in outlining silky shark
56
movement behavior, especially for adult silky sharks. We provisionally conclude that Silky
sharks are less migratory than other pelagic sharks, consistent with the population genetic results.
Life History Parameters
For wide ranging elasmobranch species, differences in life history parameter (LHP) estimates
between regions can be used to provide insight into population structure and necessity of
regional management within or between ocean basins (Lombardi-Carlson et al. 2003; Smart et al.
2015). Grant et al. (2019) recently completed an intraspecific demographic analysis of C.
falciformis using LHP estimates available from several regions overlapping with the present
study, including Gulf of Mexico (Branstetter 1987; Bonfil et al. 1993), Taiwan (Joung et al.
2008), Eastern Pacific (Sánchez-de Ita et al. 2011), Central Pacific (Oshitani et al. 2003), Papua
New Guinea (Grant et al. 2018), and Indian Ocean (Indonesia, Hall et al. 2012). These studies
demonstrate that LHPs, and subsequent demographic attributes (e.g. intrinsic population growth,
generation time etc.), vary throughout the C. falciformis range, reinforcing the mandate for
management on a regional scale. However, Grant et al. (2019) noted that differences in
methodology between adjacent studies in the Gulf of Mexico (Branstetter 1987; Bonfil et al.
1993) and Western and Central Pacific (Oshitani et al. 2003; Joung et al. 2008; Grant et al. 2018)
had likely contributed to observed LHP variation. This made it unclear as to whether LHP
variation was from methodological differences between adjacent studies sampling the same
stock, or if studies spanned multiple stocks and therefore, natural variation and differences in
historic fishing pressure between stocks had also influenced LHP variation. Our present study
indicates that in the Gulf of Mexico, Branstetter (1987) and Bonfil et al. (1993) have likely
57
sampled the same Gulf of Mexico stock, supporting suggestions of Bonfil et al. (1993) and Grant
et al. (2019) that sampling design contributed to variation in LHP estimates between these
studies. For adjacent studies in the Western and Central Pacific however, the genetic population
structure largely corresponds with regions that differed in LHP estimates. This implies that
different LHP estimates within the Western and Central Pacific support discreet stocks due to
natural variation or exposure to varied levels of historic fishing pressure. Overall these LHP
differences throughout the silky shark’s range support multiple stocks per RFMO, especially
within the WCPFO, consistent with genetic results.
Management Implications
Numerous data sets support the generalization that large mobile pelagic fishes have low (or no)
population genetic structure within ocean basins (e..g. Ely et al. 2005; Daly-Engel et al. 2012;
Graves and McDowell 2015; Almojil et al. 2018). A handful of effective migrants per generation
is all that is needed to homogenize genetic population structure (Mills and Allendorf 1996; Hartl
and Clark 1997; Vucetich and Waite 2000; Wang 2004). Given the long generation time of silky
sharks (≈10 years), a handful of migrants per generation would certainly not replenish nor
sustain populations under current harvesting practices. Therefore, significant FST values in this
study, which demonstrates isolated populations, indicate that depleted stocks will need to recover
primarily via local recruitment rather than relying on immigration to bolster numbers.
These results challenge the single stock per RFMO management scheme currently in place for
silky sharks. In three of the four RFMO’s, multiple genetic stocks were identified. The East
Pacific could also have multiple stocks but only one regional sample was examined in this study.
58
Further investigation into the IATTC could show similar trends to the WCPFC, ICCAT, and
IOTC (see Fig. 1 for a map of the current RFMO scheme).
The Atlantic silky sharks are part of the Large Coastal Shark complex which was assessed in
2006, however an Ecological Risk Assessment performed in 2010 by the ICCAT Standing
Committee on Research and Statistics prompted a revised outlook. Given silky sharks low
productivity and high susceptibility to pelagic longline fisheries, they were ranked as having the
highest degree of vulnerability to fishing within the Atlantic (Cortés et al. 2010). This resulted in
a retention ban on all vessels operating under ICCAT jurisdiction (Federal Register 77 FR
60632, October 4, 2012). There is evidence these retention bans are keeping silky sharks out of
the Hong Kong shark fin market (Cardeñosa et al. in press). Though the retention ban restrains
fishermen from targeting and retaining silky sharks, they are still caught and killed as bycatch.
Therefore, these fisheries need to be reassessed on a stock by stock basis rather than across the
ocean basin as a whole.
In the Central-West Pacific, the WCPFC concluded in 2013 that silky sharks were over fished
and over fishing was continuing (Rice and Harley 2013). This was basis for a retention ban that
was also adopted by the IATTC in 2016. Though the 2018 stock assessment was data deficient, it
indicated biomass declines and increased fishing mortality over the last two decades (Clarke et
al. 2018). Though a retention ban continues for the Central-West Pacific, there is still substantial
bycatch in the Pacific and an ongoing supply to the Hong Kong fin market (Cardeñosa et al. in
press). These levels of decline accompanied by the finding of multiple genetic stocks within the
WCPFC indicate an urgent need for updated management strategies for silky sharks.
59
Corresponding Indian Ocean data is very limited, however a preliminary stock assessment
suggests overfishing is occurring, but silky sharks are not yet over fished, though uncertainty is
stressed in this document (Ortiz de Urbina et al. 2018). The Red Sea falls under the jurisdiction
of the IOTC however it is unclear if the Red Sea was considered in this assessment. Given the
genetic structure found between the IDO and RDS, these two regions should receive independent
stock assessments and be managed as separate stocks.
Conclusion
This study supplies the scientific basis to distinguish at least four genetically distinct stocks
existing within the WCPFC, two stocks within the IOTC, and four within the ICCAT
jurisdictions. These results in combination with life history parameters and telemetry data
challenge the single population per RFMO default management plan currently in place for these
RFMOs. Proper management of this highly harvested marine resource relies on accurate
delineation of stocks. A revised management plan is urgently mandated for this over-exploited
species.
Acknowledgments
This study was made possible by the generous donation of specimens by Christopher R. Clarke,
Mahmood Shivji, Stephen A. Karl, J.D. Filmalter, and Julia Spaet. We thank members of the
ToBo Lab for sharing expertise, advice and discussions that contributed to this manuscript. We
thank the staff of the HIMB EPSCoR Evolutionary Genetics Core Facility and especially Amy
Eggers and Mindy Mizobe for assistance with genotyping. Special thanks to Darren Lerner, Kim
60
Holland, Carl Meyer, S. Gulak, D. Bethe, D. McCauley, and C. Wilson for guidance and sage
advice. Thanks to the staff at Hawai’i Institute of Marine Biology for their support throughout
this project. This paper is funded in part by a cooperative agreement from the National Oceanic
and Atmospheric Administration, Project R/SS-19PD, which is sponsored by the University of
Hawai‘i Sea Grant College Program under Institutional Grant No. NA14OAR4170071 (B.W.B)
from NOAA Office of Sea Grant, Department of Commerce. The views expressed herein are
those of the authors and do not necessarily reflect the views of NOAA or any of its subagencies.
Additional funding was provided by the Save Our Seas Foundation (D.W.K.), and the U.S.
National Science Foundation (http://www.nsf.gov/) grant OCE-1558852 (B.W.B.).
References Ablan CA (2006) Genetics and the study of fisheries connectivity in Asian developing countries. Fish Res
78:158–168. Albaina A, Iriondo M, Velado I, Laconcha U, Zarraonaindia I, Arrizabalaga H, Pardo MA, Lutcavage M,
Grant WS, Estonba A (2013) Single nucleotide polymorphism discovery in albacore and Atlantic bluefin tuna provides insights into worldwide population structure. Anim G. doi: 10.1111/age.12051
Almojil D, Cliff G, Spaet JLY (2018) Weak population structure of the Spot-tail shark Carcharhinus sorrah and the Blacktip shark C. limbatus along the coasts of the Arabian Peninsula, Pakistan, and South Africa. Ecol Evol 8:9536–9549. doi: 10.1002/ece3.4468
Altukhov YP, Salmenkova EA, Omelchenko, Vladimir T (2000) Salmonid Fishes: Population Biology, Genetics and Managment. Wiley-Blackwell, Oxford
Amandè MJ, Chassot E, Chavance P, Pianet R (2008) Silky shark ( Carcharhinus falciformis ) bycatch in the French tuna purse-seine fishery of the Indian Ocean. Iotc Wpeb - 2008/016 22.
Beerkircher LR, Shivji MS, Cortes E (2003) A Monte Carlo Demographic Analysis of the Silky Shark ( Carcharhinus falciformis ): Implications of Gear Selectivity. Fish Bull 174:168–174.
Bolger AM, Lohse M, Usadel B (2014) Trimmomatic: A flexible trimmer for Illumina Sequence Data. Bioinformatics, btu170.
Bonfil R (1994) Overview of world elasmobranch fisheries. FAO Fisheries Techincal Paper No. 341. Rome. 119 pp.
Bonfil R, Mena R, De-Anda D (1993) Biological parameters of commercially exploited silky sharks, Carcharhinus falciformis, from the Campeche Bank, Mexico. NOAA Tech Rep NMFS 115:73–86.
Branstetter S (1987) Age, growth and reproductive biology of the silky shark, Carcharhinus falciformis, and the scalloped hammerhead, Sphyrna lewini, from the northwestern Gulf of Mexico. Environ Biol Fishes 19:161–173. doi: 10.1007/BF00005346
Cardeñosa D, Fields A, Shea KH, Feldheim K, Kraft D, Hutchinson M, Caballero S, Chapman D Absence of Atlantic Silky Sharks in World’s Largest Shark Fin Markets Suggest Compliance with Regional Fishery Management Organization Retention Ban. In preperation for publication.
Cardeñosa D, Fields AT, Babcock EA, Zhang H, Feldheim K, Shea SKH, Fischer GA, Chapman DD (2018) CITES-listed sharks remain among the top species in the contemporary fin trade. Conserv
61
Lett 11:1–7. doi: 10.1111/conl.12457 Carvalho GR, Hauser L (1994) Molecular genetics and the stock concept in fisheries. Rev Fish Biol Fish
4:326–350. doi: 10.1007/BF00042908 Clarke C, Lea JSE, Ormond RFG (2011) Reef-use and residency patterns of a baited population of silky
sharks, Carcharhinus falciformis, in the Red Sea. Mar Freshw Res 62:668–675. doi: 10.1071/MF10171
Clarke CR, Karl SA, Horn RL, Bernard AM, Lea JS, Hazin FH, Prodöhl PA, Shivji MS (2015) Global mitochondrial DNA phylogeography and population structure of the silky shark, Carcharhinus falciformis. Mar Biol 162:945–955. doi: 10.1007/s00227-015-2636-6
Clarke SC, Magnussen JE, Abercrombie DL, McAllister MK, Shivji MS (2006) Identification of Shark Species Composition and Proportion in the Hong Kong Shark Fin Market Based on Molecular Genetics and Trade Records Identificación de la Composición y Proporción de Especies de Tiburón en el Mercado de Aletas de Tiburón en Hong Kong. Conserv Biol 20:201–211. doi: 10.1111/j.1523-1739.2005.00247.x
Clarke SC, Langmuller A, Lennert-Cody C, Aires-da-Silva, Maunder A, Maunder M (2018) Pacific-wide Silky Shark ( Carcharhinus falciformis ) Stock Status Assessment. WCPFC 14th SC. SA-WP-08
Cortés E, Arocha F, Beerkircher L, Carvalho F, Domingo A, Heupel M, Holtzhausen H, Santos MN, Ribera M, Simpfendorfer C (2010) Ecological risk assessment of pelagic sharks caught in Atlantic pelagic longline fisheries. Aquat Living Resour 23:25–34. doi: 10.1051/alr/2009044
Daly-Engel TS, Randall JE, Bowen BW (2012) Is the Great Barracuda (Sphyraena barracuda) a reef fish or a pelagic fish? The phylogeographic perspective. Mar Biol 159:975–985. doi: 10.1007/s00227-012-1878-9
Danecek P, Auton A, Abecasis G, Albers CA, Banks E, Depristo MA, Handsaker RE, Lunter G, Marth GT, Sherry ST, Mcvean G, Durbin R (2011) The variant call format and VCFtools. 27:2156–2158. doi: 10.1093/bioinformatics/btr330
Diopere E, Vandamme SG, Hablu PI, Cariani A, Maes GE (2017) Seascape genetics of a flatfish reveals local selection under high levels of gene flow. ICES J Mar Sci. doi: 10.1093/icesjms/fsx160
Dizon AE, Lockyer C, Perrin WF, Demaster DP, Sisson J (1993) Rethinking the stock concept: a phylogeographic approach. Biol Conserv 64:176–177. doi: 10.1016/0006-3207(93)90670-V
Domingues RR, Hilsdorf AWS, Shivji MM, Hazin FVH, Gadig OBF (2017) Effects of the Pleistocene on the mitochondrial population genetic structure and demographic history of the silky shark (Carcharhinus falciformis) in the western Atlantic Ocean. Rev Fish Biol Fish 1–15. doi: 10.1007/s11160-017-9504-z
Domingues RR, Hilsdorf AWS, Gadig OBF (2018) The importance of considering genetic diversity in shark and ray conservation policies. Conserv Genet 19:501–525. doi: 10.1007/s10592-017-1038-3
Dulvy NK, Baum JK, Clarke S, Compagno LJV, Cortés E, Domingo A, Fordham S, Fowler S, Francis MP, Gibson C, Martínez J, Musick JA, Soldo A, Stevens JD, Valenti S (2008) You can swim but you can’t hide: The global status and conservation of oceanic pelagic sharks and rays. Aquat Conserv Mar Freshw Ecosyst 18:459–482. doi: 10.1002/aqc.975
Eckert SA, Stewart BS (2001) Telemetry and satellite tracking of whale wharks, Rhincodon typus, in the Sea of Cortez, Mexico, and the North Pacific Ocean. Environ Biol Fishes 60:299–308.
Ely B, Viñas J, Bremer JRA, Black D, Lucas L, Covello K, Labrie A V, Thelen E (2005) Consequences of the historical demography on the global population structure of two highly migratory cosmopolitan marine fishes: the yellowfin tuna (Thunnus albacares) and the skipjack tuna (Katsuwonus pelamis). BMC Evol Biol 5:1–9. doi: 10.1186/1471-2148-5-19
Ewels P, Lundin S, Max K (2016) Data and text mining MultiQC : summarize analysis results for multiple tools and samples in a single report. Bioinformatics 32:3047–3048. doi: 10.1093/bioinformatics/btw354
Filmalter J, Cowley P, Forget F, Dagorn L (2015) Fine-scale 3-dimensional movement behaviour of silky sharks Carcharhinus falciformis associated with fish aggregating devices (FADs). Mar Ecol Prog
62
Ser 539:207–223. doi: 10.3354/meps11514 Filmalter JD, Dagorn L, Cowley PD, Taquet M (2011) First descriptions of the behavior of silky sharks,
Carcharhinus falciformis, around drifting fish aggregating devices in the Indian Ocean. Bull Mar Sci 87:325–337. doi: 10.5343/bms.2010.1057
Forget FG, Capello M, Filmalter JD, Govinden R, Soria M, Cowley PD, Dagorn L (2015) Behaviour and vulnerability of target and non-target species at drifting fish aggregating devices (FADs) in the tropical tuna purse seine fishery determined by acoustic telemetry. Can J Fish Aquat Sci 72:1398–1405. doi: 10.1139/cjfas-2014-0458
Futschik A, Schlötterer C (2010) The next generation of molecular markers from massively parallel sequencing of pooled DNA samples. Genetics 186:207–218. doi: 10.1534/genetics.110.114397
Galván-Tirado C, Díaz-Jaimes P, García-de León FJ, Galván-Magaña F, Uribe-Alcocer M (2013) Historical demography and genetic differentiation inferred from the mitochondrial DNA of the silky shark (Carcharhinus falciformis) in the Pacific Ocean. Fish Res 147:36–46. doi: 10.1016/j.fishres.2013.03.020
Grant MI, Smart JJ, White WT, Chin A, Baje L, Simpfendorfer CA (2018) Life history characteristics of the silky shark Carcharhinus falciformis from the central west Pacific. Mar Freshw Res 69:562–573.
Grant MI, Smart JJ, Rigby CL, White WT, Chin A, Baje L, Simpfendorfer CA (2019) Intraspecific demography of the silky shark (Carcharhinus falciformis): Implications for fisheries management. ICES J Mar Sci 77:241–255. doi: 10.1093/icesjms/fsz196
Guzman HM, Gomez CG, Hearn A, Eckert SA (2018) Longest recorded trans-Pacific migration of a whale shark (Rhincodon typus). Mar Biodivers Rec 11:4–9. doi: 10.1186/s41200-018-0143-4
Hall NG, Bartron C, White WT, Dharmadi, Potter IC (2012) Biology of the silky shark Carcharhinus falciformis (Carcharhinidae) in the eastern Indian Ocean, including an approach to estimating age when timing of parturition is not well defined. J Fish Biol 80:1320–1341. doi: 10.1111/j.1095-8649.2012.03240.x
Hartl DL, Clark AG (1997) Principles of Population Genetics. Third edition. Sinauer Associates, Inc. Sunderland, Massachusetts
Hess EJ, Matala PA, Narum RS (2011) Comparison of SNPs and microsatellites for fine-scale application of genetic stock identification of Chinook salmon in the Columbia River Basin. Mol Ecol Resour 11:137–149. doi: 10.1111/j.1755-0998.2010.02958.x
Hueter RE, Tyminski JP, Morris JJ, Abierno AR, Alberto J, Valdés A, Fernández NL (2018) Movements of three female silky sharks as tracked by satellite-linked tags off the Caribbean coast of Cuba. Bull Mar Sci 94:1–14.
Hutchings JA, Reynolds JD (2004) Marine fish population collapses: Consequences for recovery and extinction risk. Bioscience 54:297–309. doi: 10.1641/0006-3568(2004)054[0297:MFPCCF]2.0.CO;2
Hutchinson M, Coffey DM, Holland K, Itano D, Leroy B, Kohin S, Vetter R, Williams AJ, Wren J (2019) Movements and habitat use of juvenile silky sharks in the Pacific Ocean inform conservation strategies. Fish Res 210:131–142. doi: 10.1016/j.fishres.2018.10.016
Hutchinson MR (2014) The impacts of commercial purse seine fishing on the biology and ecology of the silky shark, (Carcharhinus falciformis): Implications for science based management. PHD submission to University Of Hawai'i
Hutchinson MR, Itano DG, Muir JA, Holland KN (2015) Post-release survival of juvenile silky sharks captured in a tropical tuna purse seine fishery. Mar Ecol Prog Ser 521:143–154. doi: 10.3354/meps11073
IUCN IU for the C of N (2020) IUCN Red List of Threatened Species. In: Version 2013.1. http://www.iucnredlist.org/about/overview.
Joung SJ, Chen CT, Lee HH, Liu KM (2008) Age, growth, and reproduction of silky sharks, Carcharhinus falciformis, in northeastern Taiwan waters. Fish Res 90:78–85. doi: 10.1016/j.fishres.2007.09.025
63
King JR, Wetklo M, Supernault J, Taguchi M, Yokawa K, Sosa-Nishizaki O, Withler RE (2015) Genetic analysis of stock structure of blue shark (Prionace glauca) in the north Pacific ocean. Fish Res 172:181–189. doi: 10.1016/j.fishres.2015.06.029
Knapp ISS, Puritz JB, Bird CE, Whitney JL, Sudek M, Forsman ZH, Toonen RJ (2016) ezRAD- an accessible next-generation RAD sequencing protocol suitable for non-model organisms_v3.2.
Kofler R, Pandey RV, Schlötterer C (2011) PoPoolation2: Identifying differentiation between populations using sequencing of pooled DNA samples (Pool-Seq). Bioinformatics 27:3435–3436. doi: 10.1093/bioinformatics/btr589
Kraft DW, Conklin EE, Barba E, Hutchinson M, Toonen RJ, Forsman ZH, Bowen BW. 2020. Genomics versus mtDNA for resolving stock structure in the silky shark (Carcharhinus falciformis). PeerJ 8:e10186 DOI 10.7717/peerj.10186
Kurland S, Wheat CW, de la Paz Celorio Mancera M, Kutschera VE, Hill J, Andersson A, Rubin CJ, Andersson L, Ryman N, Laikre L (2019) Exploring a Pool-seq-only approach for gaining population genomic insights in nonmodel species. Ecol Evol 9:11448–11463. doi: 10.1002/ece3.5646
Lara-lizardi F, Hoyos-padilla M, Hearn A, Klimley AP (2020) Shark movements in the Revillagigedo Archipelago. bioRxiv preprint doi: https://doi.org/10.1101/2020.03.02.972844
Lawson T (2011) Estimation of catch rates and catches of key shark species in tuna fisheries of the Western and Central Pacific Ocean using observer data. Western and Central Pacific Fisheries Commission. WCPFC-SC7_2001/ EB-IP-02
Lennert-Cody CE, Aires-da-silva A, Maunder MN (2019) Updated Stock Status Indicators for Silky Sharks in the Eastern Pacific Ocean, 1994-2018. Inter-American Tropcial Tuna Comm Sci Advis Comm Tenth Meet San Deigo, California, USA May 2019 1–11.
Li H, Durbin R (2009) Fast and accurate short read alignment with Burrows-Wheeler Transform. Bioinformatics, 25:1754-60. [PMID: 19451168].
Lombardi-Carlson LA, Cortés E, Parsons GR, Manire CA (2003) Latitudinal variation in life-history traits of bonnethead sharks, Sphyrna tiburo, (Carcharhiniformes:Sphyrnidae) from the eastern Gulf of Mexico. Mar Freshw Res 54:875–883. doi: 10.1071/MF03023
Lopez J, Alvarez-berastegui D, Soto M, Murua H (2020) silky shark ( Carcharhinus falciformis ) in the tropical eastern Atlantic Ocean. Biodivers Conserv. doi: 10.1007/s10531-020-01979-7
Mills LS, Allendorf FW (1996) The One-Migrant-per-Generation Rule in Conservation and Management. Conserv Biol 10:1509–1518.
Mimee B, Duceppe MO, Véronneau PY, Lafond-Lapalme J, Jean M, Belzile F, Bélair G (2015) A new method for studying population genetics of cyst nematodes based on Pool-Seq and genomewide allele frequency analysis. Mol Ecol Resour 15:1356–1365. doi: 10.1111/1755-0998.12412
Moore BR, Bell JD, Evans K, Farley J, Grewe PM, Hampton J, Marie AD, Minte-Vera C, Nicol S, Pilling GM, Scutt Phillips J, Tremblay-Boyer L, Williams AJ, Smith N (2020) Defining the stock structures of key commercial tunas in the Pacific Ocean I: Current knowledge and main uncertainties. Fish Res 230:105525. doi: 10.1016/j.fishres.2020.105525
Nielsen ES, Henriques R, Toonen RJ, Knapp ISS, Guo B, von der Heyden S (2018) Complex signatures of genomic variation of two non-model marine species in a homogeneous environment. BMC Genomics 19:347. doi: 10.1186/s12864-018-4721-y
Nolte V, Pandey RV, Kofler R, Schloẗterer C (2013) Genome-wide patterns of natural variation reveal strong selective sweeps and ongoing genomic conflict in Drosophila mauritiana. Genome Res 23:99–110. doi: 10.1101/gr.139873.112
Oliver S, Braccini M, Newman SJ, Harvey ES (2015) Global patterns in the bycatch of sharks and rays. Mar Policy 54:86–97. doi: 10.1016/j.marpol.2014.12.017
Ortiz de Urbina J, Brunel T, Coelho R, Merino G, Rosa D, Santos C, Murua H, Bach P, Saber S, Macias D (2018) A Preliminary Stock Assessment for the Silky Shark in the Indian Ocean Using a Data-Limited Approach. IOTC Working Party on Ecosystem and Bycatch. IOTC-2018-WPEB14-33
Oshitani S, Nakano H, Tanaka S (2003) Age and growth of the silky shark Carcharhinus falciformis from the Pacific Ocean. Fish Sci 69:456–464.
64
Ovenden JR, Berry O, Welch DJ, Buckworth RC, Dichmont CM (2015) Ocean ’ s eleven : a critical evaluation of the role of population , evolutionary and molecular genetics in the management of wild fi sheries. Fish Fish. doi: 10.1111/faf.12052
Puncher GN, Cariani A, Maes GE, Houdt J Van, Herten K, Rodriguez-ezpeleta N, Cannas R, Fraile I, Laconcha U, Goni N, Tinti F (2018) Spatial dynamics and mixing of bluefin tuna in the Atlantic Ocean and Mediterranean Sea revealed using next-generation sequencing. 18:620–638. doi: 10.1111/1755-0998.12764
Puritz JB, Hollenbeck CM, Gold JR (2014) dDocent : a RADseq, variant-calling pipeline designed for population genomics of non-model organisms. PeerJ 2:e431. doi: 10.7717/peerj.431
Rellstab C, Zoller S, Tedder A, Gugerli F, Fischer MC (2013) Validation of SNP allele frequencies determined by pooled next-generation sequencing in natural populations of a non-model plant species. PLoS One. doi: 10.1371/journal.pone.0080422
Rice J, Harley S (2013) Updated stock assessment of the Silky sharks in the Western and Central Pacfific Ocean. WCPFC SC9-2013
Rooker JR, Secor DH, De Metrio G, Schloesser R, Block BA, Neilson JD (2008) Natal homing and connectivity in Atlantic bluefin tuna populations. Science (80- ) 322:742–744. doi: 10.1126/science.1161473
RStudio Team (2020) RStudio: Integrated Development Environment for R. RStudio, PBC, Boston, MA URL http://www.rstudio.com/.
Sánchez-de Ita AJ, Quiñónez-Velázquez C, Galván-Magaña F, Bocanegra-Castillo N, Félix-Uraga R Age and growth of the silky shark Carcharhinus falciformis from the west coast of Baja California Sur, Mexico. J Appl Ichthyol 27:20–24. doi: 10.1111/j.1439-0426.2010.01569.x
Schaefer KM, Fuller DW, Aires-Da-Silva A, Carvajal JM, Martínez-Ortiz J, Hutchinson MR (2019) Postrelease survival of silky sharks (Carcharhinus falciformis) following capture by longline fishing vessels in the equatorial eastern Pacific Ocean. Bull Mar Sci 95:355–369. doi: 10.5343/bms.2018.0052
Schlötterer C, Tobler R, Kofler R, Nolte V (2014) Sequencing pools of individuals-mining genome-wide polymorphism data without big funding. Nat Rev Genet 15:749–763. doi: 10.1038/nrg3803
Schmidt J V., Schmidt CL, Ozer F, Ernst RE, Feldheim KA, Ashley M V., Levine M (2009) Low genetic differentiation across three major ocean populations of the whale shark, Rhincodon typus. PLoS One. doi: 10.1371/journal.pone.0004988
Smart JJ, Chin A, Tobin AJ, Simpfendorfer CA, White WT (2015) Age and growth of the common blacktip shark Carcharhinus limbatus from Indonesia, incorporating an improved approach to comparing regional population growth rates. African J. Mar. Sci. 37:177–188.
Stevens JD, Bonfil R, Dulvy NK, Walker PA (2000) The effects of fishing on sharks, rays, and chimaeras (chondrichthyans), and the implications for marine ecosystems. ICES J Mar Sci 57:476–494. doi: 10.1006/jmsc.2000.0724
Taguchi M, King JR, Wetklo M, Withler RE, Yokawa K (2015) Population genetic structure and demographic history of Pacific blue sharks (Prionace glauca) inferred from mitochondrial DNA analysis. Mar Freshw Res 66:267–275. doi: 10.1071/MF14075
Toonen RJ, Puritz JB, Forsman ZH, Whitney JL, Fernandez-Silva I, Andrews KR, Bird CE (2013) ezRAD: a simplified method for genomic genotyping in non-model organisms. PeerJ 1:e203. doi: 10.7717/peerj.203
Vandeperre F, Aires-da-Silva A, Fontes J, Santos M, Serrão Santos R, Afonso P (2014) Movements of blue sharks (Prionace glauca) across their life history. PLoS One. doi: 10.1371/journal.pone.0103538
Vandeperre F, Aires-da-Silva A, Lennert-Cody C, Serrão Santos R, Afonso P (2016) Essential pelagic habitat of juvenile blue shark (Prionace glauca) inferred from telemetry data. Limnol Oceanogr 61:1605–1625. doi: 10.1002/lno.10321
Vucetich JA, Waite TA (2000) Is one migrant per generation sufficient for the genetic management of
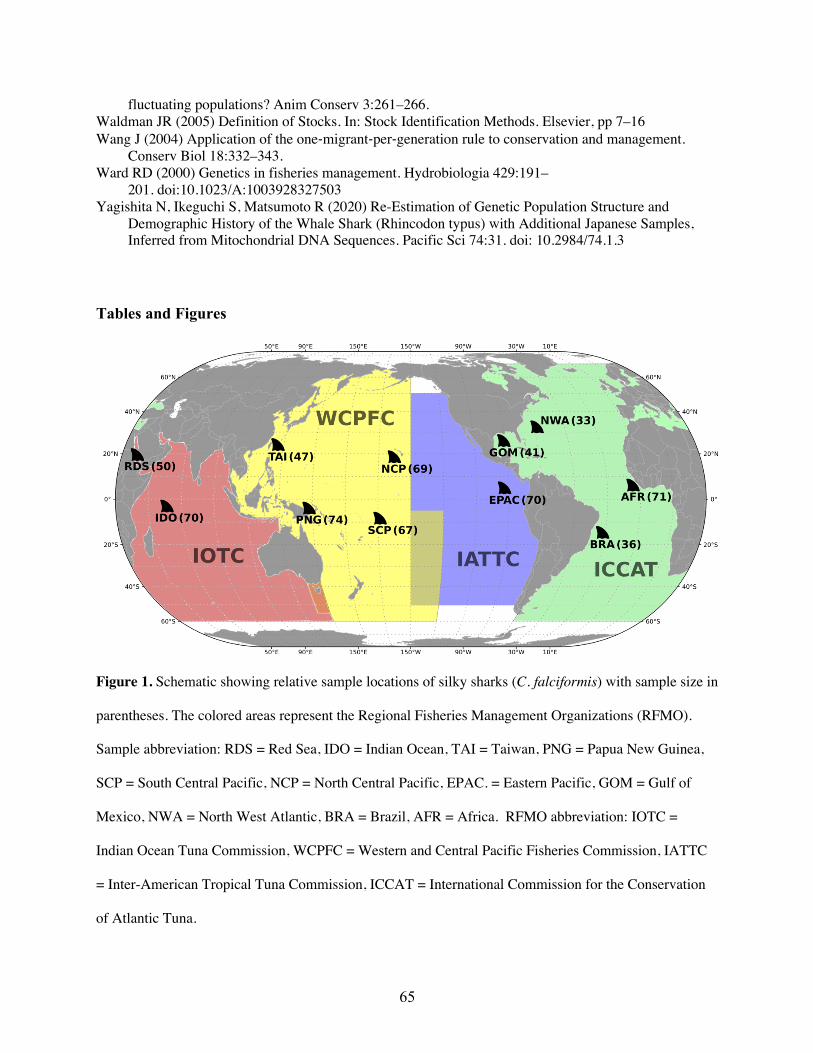
65
fluctuating populations? Anim Conserv 3:261–266. Waldman JR (2005) Definition of Stocks. In: Stock Identification Methods. Elsevier, pp 7–16 Wang J (2004) Application of the one-migrant-per-generation rule to conservation and management.
Conserv Biol 18:332–343. Ward RD (2000) Genetics in fisheries management. Hydrobiologia 429:191–
201. doi:10.1023/A:1003928327503 Yagishita N, Ikeguchi S, Matsumoto R (2020) Re-Estimation of Genetic Population Structure and
Demographic History of the Whale Shark (Rhincodon typus) with Additional Japanese Samples, Inferred from Mitochondrial DNA Sequences. Pacific Sci 74:31. doi: 10.2984/74.1.3
Tables and Figures
Figure 1. Schematic showing relative sample locations of silky sharks (C. falciformis) with sample size in
parentheses. The colored areas represent the Regional Fisheries Management Organizations (RFMO).
Sample abbreviation: RDS = Red Sea, IDO = Indian Ocean, TAI = Taiwan, PNG = Papua New Guinea,
SCP = South Central Pacific, NCP = North Central Pacific, EPAC. = Eastern Pacific, GOM = Gulf of
Mexico, NWA = North West Atlantic, BRA = Brazil, AFR = Africa. RFMO abbreviation: IOTC =
Indian Ocean Tuna Commission, WCPFC = Western and Central Pacific Fisheries Commission, IATTC
= Inter-American Tropical Tuna Commission, ICCAT = International Commission for the Conservation
of Atlantic Tuna.
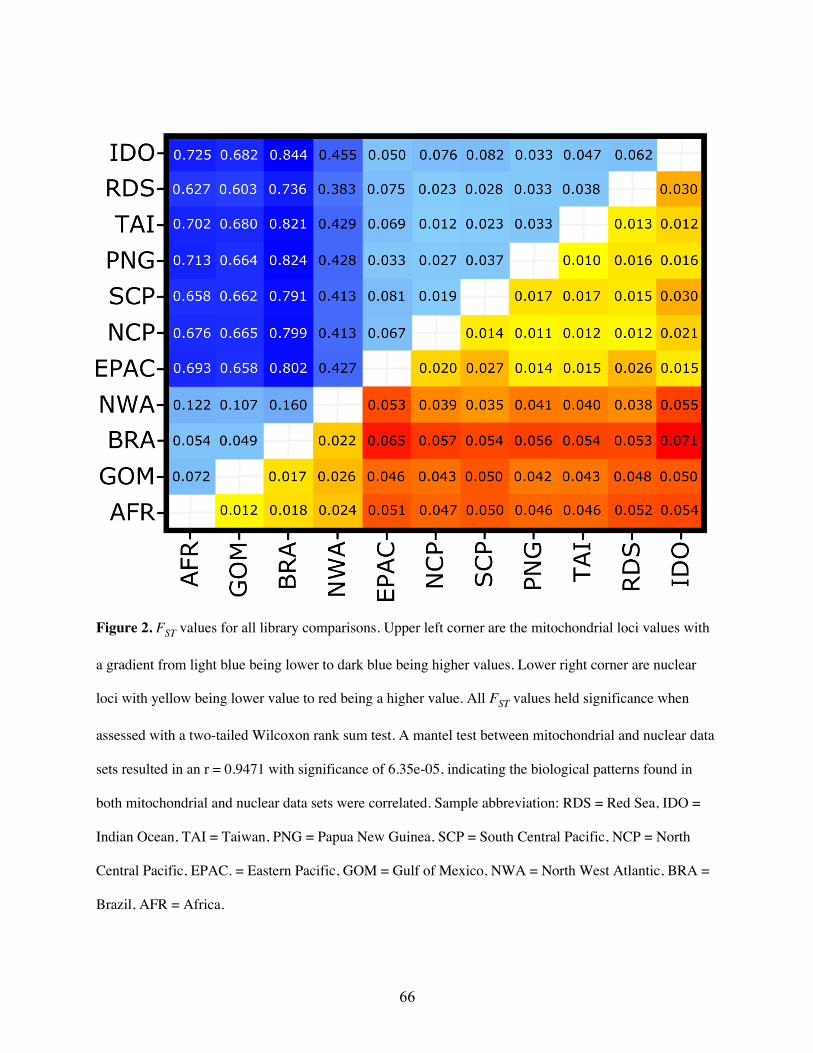
66
Figure 2. FST values for all library comparisons. Upper left corner are the mitochondrial loci values with
a gradient from light blue being lower to dark blue being higher values. Lower right corner are nuclear
loci with yellow being lower value to red being a higher value. All FST values held significance when
assessed with a two-tailed Wilcoxon rank sum test. A mantel test between mitochondrial and nuclear data
sets resulted in an r = 0.9471 with significance of 6.35e-05, indicating the biological patterns found in
both mitochondrial and nuclear data sets were correlated. Sample abbreviation: RDS = Red Sea, IDO =
Indian Ocean, TAI = Taiwan, PNG = Papua New Guinea, SCP = South Central Pacific, NCP = North
Central Pacific, EPAC. = Eastern Pacific, GOM = Gulf of Mexico, NWA = North West Atlantic, BRA =
Brazil, AFR = Africa.

67
Table 1. FST value summary within and between ocean basin for C. falciformis.
Supplementary Information
Figure S1. Map showing exact sample location of individuals and pooling designation. The larger red
dots regions where exact locations were not available.
Red Sea
Indian Ocean
Taiwan
Papua NewGuinea
NorthCentralPacific
EasternPacific
SouthCentralPacific
North West Atlantic
Brazil
Africa
Gulf of Mexico
Mitochondrial Loci Fst values Nuclear Loci Fst values Range mean (SD) Range mean (SD)
Inter Atlantic 0.049 - 0.160 0.094 (0.041) 0.012 - 0.026 0.020 (0.005) Inter Indo-Pacific 0.012 - 0.082 0.045 (0.022) 0.010 - 0.030 0.018 (0.006) Between Atlantic and Indo Pacific
0.383 - 0.845 0.642 (0.144) 0.035 - 0.071 0.049 (0.008)
All Comparisons 0.012 - 0.845 0.354 (0.312) 0.010 - 0.071 0.034 (0.017)
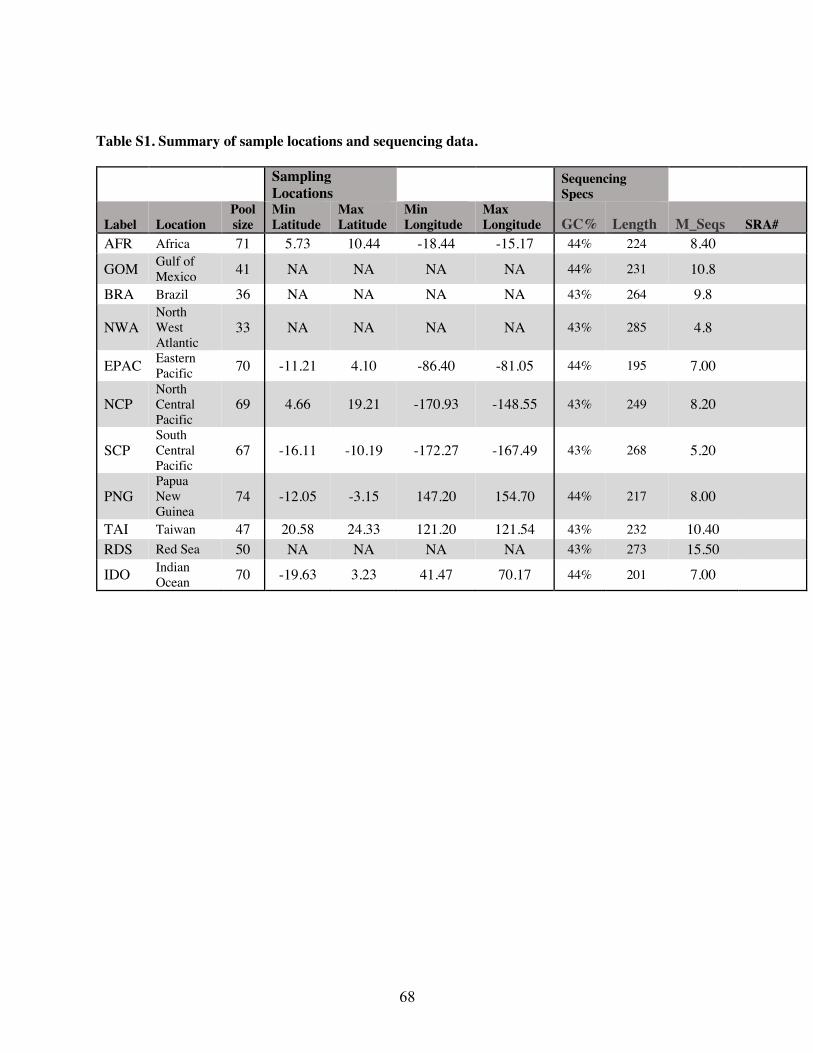
68
Table S1. Summary of sample locations and sequencing data.
Sampling Locations
Sequencing Specs
Label Location Pool size
Min Latitude
Max Latitude
Min Longitude
Max Longitude GC% Length M_Seqs SRA#
AFR Africa 71 5.73 10.44 -18.44 -15.17 44% 224 8.40
GOM Gulf of Mexico 41 NA NA NA NA 44% 231 10.8
BRA Brazil 36 NA NA NA NA 43% 264 9.8
NWA North West Atlantic
33 NA NA NA NA 43% 285 4.8
EPAC Eastern Pacific 70 -11.21 4.10 -86.40 -81.05 44% 195 7.00
NCP North Central Pacific
69 4.66 19.21 -170.93 -148.55 43% 249 8.20
SCP South Central Pacific
67 -16.11 -10.19 -172.27 -167.49 43% 268 5.20
PNG Papua New Guinea
74 -12.05 -3.15 147.20 154.70 44% 217 8.00
TAI Taiwan 47 20.58 24.33 121.20 121.54 43% 232 10.40 RDS Red Sea 50 NA NA NA NA 43% 273 15.50
IDO Indian Ocean 70 -19.63 3.23 41.47 70.17 44% 201 7.00
69
CHAPTER FOUR
Who bit my board: Identifying species with DNA barcodes from
shark bites
Derek Kraft1, Lauren Meyer2,3, Kaylee Scidmore-Rossing1, Maryann Webb1, Charlie
Huveneers2, Eric Clua4, Carl Meyer1
1Hawaii Institute of Marine Biology, 46-007 Lilipuna Road, Kaneohe, Hawaii 96744, USA
2Southern Shark Ecology Group, College of Science and Engineering, Flinders University,
Adelaide, South Australia, Australia
3The Georgia Aquarium, Atlanta, Georgia, USA
4EPHE, PSL Research University, Laboratoire d’excellence CORAIL, CRIOBE USR3278
EPHE-CNRS-UPVD, F-66860 Perpignan, France
ABSTRACT
Identifying the species and individuals responsible in shark bite incidents is an ongoing
challenge but is important to mitigate risk. Modern DNA techniques provide a potential tool for
definitive species identification, provided sufficient DNA is transferred from the shark to the
victim or victim’s articles (e.g. surfboard, wetsuit, paddle). To test the potential for shark species
identification using transfer DNA, we swabbed shark bite impressions on surfboards and wetsuit
neoprene collected under simulated real-world conditions. Thirty one of the 32 bite impressions
yielded DNA sequences sufficient for species identification, recovering barcodes from five
70
species, including dusky (Carcharhinus obscurus), Galapagos (Carcharhinus galapagensis), bull
(Carcharhinus leucas), tiger (Galeocerdo cuvier), and white shark (Carcharodon carcharias).
The latter three species are most frequently involved in fatal encounters. Our results demonstrate
that shark species can be definitively and accurately identified from transfer DNA recovered
from bite impressions on surfboards and wetsuit neoprene even if the item is repeatedly
immersed in seawater before swabbing. Transfer DNA could potentially be collected from the
wound margins of shark bite victims and used to identify the responsible individual.
KEYWORDS
forensic science; marine predator; shark attack; shark bite; species barcoding; trace
evidence; transfer DNA; wild animal;
Introduction
Sharks rarely bite humans but these poorly understood events command huge public interest and
media attention. Analyses of factors influencing occurrences or likelihood of shark bites can
illuminate conditions when shark bite risks are high and contribute towards implementing
mitigation measures to reduce risks. Such analyses, however, rely on the availability of
comprehensive information about shark bite incidents, so that patterns of occurrences can be
identified (Ryan et al. 2019). While increased ease of information exchange has improved
reporting and record of details related to shark bite incidents, identification of the species
responsible for a bite remains challenging. Shark species can be difficult to identify even for
trained professionals (e.g. Carcharhinus species), therefore it is not surprising that 70% of the
species responsible for shark bites from 2010–2019 are still listed as species unknown according
to the International Shark Attack Files at the Florida Museum of Natural History (ISAF;

71
https://www.floridamuseum.ufl.edu/shark-attacks/). Tooth impressions can sometimes identify
species responsible for bites (on victims wounds or objects such as surfboards, wetsuits etc.), but
experts using this approach have disagreed over the interpretation of bite impressions (Clua and
Reid 2013; Clua et al. 2014; Clua and Séret 2015; Tirard et al. 2015; Duarte-Neto et al. 2019).
Modern DNA technology provides a potential tool for definitive species identification provided
sufficient DNA is transferred from the shark to the victim or victim’s articles (e.g. wound,
surfboard, wetsuit, paddle) and adheres despite immersion in seawater. Forensic DNA analyses
have been widely used to detect protected species in illegal markets (Baker 2000; Roman and
Bowen 2000) and to detect mislabeled foodstuffs (Marko et al. 2011; Quinto et al. 2016),
including sharks (Cardeñoza 2019; Hobbs et al. 2019). Here we test the potential for shark
species identification using transfer DNA harvested from bite impressions from surfboards and
wetsuit neoprene collected under simulated real-world conditions.
Materials and Methods
All shark capture and handling activities were conducted under University of Hawai’i
Institutional Animal Care and Use Committee (IACUC) Protocol # 18-2976 and Flinders
University Animal Ethics Committee Protocol #E446.
Preliminary sampling:
A preliminary sampling assessment was conducted in January 2019 on Oahu, Hawai’i. We used
a baited line to capture a 3.7 m (total length) tiger shark (Galeocerdo cuvier) in waters off
Kaneohe Bay, Oahu (21.521°, -157.818°), and brought it alongside a 7 m skiff. A bite
impression was collected by inserting a surfboard section between the jaws during defensive
72
biting behavior (see Video 1 in Supplemental Information). The surfboard section was bitten,
then disgorged by the shark after several minutes and retrieved for swabbing. Immediately after
retrieval the areas around the tooth impressions were swabbed using a sterile polyester flock
swab and a fin clip was taken as a reference sample. To simulate potential washing out of the
transfer DNA that might occur in a real-world situation (e.g. where a surfer paddles to shore
following a bite incident), the board was ‘dunked’ 20 times before re-swabbing the bite
impression. A total of twelve swabs were collected from the surfboard within minutes of the bite
impression and stored in a variety of fixatives to assess their effectiveness; six were stored in
DNA extraction buffer (Buffer ATL from Qiagen DNeasy Blood & Tissue kit. Qiagen,
Mississauga, ON, Canada), two were stored in dry vials, two in 95% ethanol, and two in 20%
DMSO salt buffer.
Sampling locations and species
Subsequent bite samples were collected from Australia, New Caledonia and Hawaii by using
transfer media including neoprene and surfboard material (see details below). Samples from free-
swimming white sharks (Carcharodon carcharias) were collected at the Neptune Islands Group
Marine Park (-35.230°, 136.071°), ∼30 km off the southern coast of South Australia. Samples
from free-swimming bull sharks (Carcharhinus leucas) were collected from the Nouville
Harbour in Noumea, New Caledonia (-22.2670°, 166.4236°). Saliva from restrained Galapagos
sharks (Carcharhinus galapagensis) and one restrained tiger shark (Galeocerdo cuvier) were
collected off Oahu, Hawai’i (21.619°, -158.146°). Samples from restrained tiger sharks and
dusky sharks (Carcharhinus obscurus) were collected from Norfolk Island (-29.055°, 167.933°)
(Table 1).
73
Neoprene and surfboard set-ups
We used shark bite devices similar to Huveneers et al. (2018) and Whitmarsh et al. (2019). The
neoprene device consisted of a 3-mm thick neoprene pouch covering dense foam wrapped
around a 60 cm x 30 cm wooden board. Dense foam was unavailable at Norfolk Island, so the
neoprene pouches covered the wooden board directly. A new neoprene pouch was used for each
bite (as in Whitmarsh et al. 2019). Surfboard-based shark bite devices varied slightly between
species and locations. For white sharks, we used 120 × 30 cm custom-built surfboard replicas
made of polystyrene foam covered with layers of fiberglass cloth and epoxy resin. Surfboard
replicas were scrubbed with soap and water, and rinsed thoroughly with seawater before being
reused for subsequent bites. For bull sharks at Norfolk Island, we used 60 cm x 30 cm x 2 cm
thick wooden boards. A new wooden board was used for each bite. Free-swimming white sharks
were encouraged to bite the neoprene and surfboard replicas by attaching sections of southern
bluefin tuna (Thunnus maccoyii) to the underside of the set-up and allowing the tethered set-up
to float behind the vessel. In New Caledonia, we used albacore (Thunnus alalonga) to entice
free-swimming bull sharks to bite the devices. At Norfolk Island and Hawaii, shark bite devices
were placed in between the jaws of restrained tiger, Galapagos, and dusky sharks during
defensive biting.
Saliva swabbing
After each bite, sterile polyester flock swabs were used to collect three specimens from the bite
impression (one on top and one on the bottom surface of the shark bite device, with the third
74
swab covering both the top and the bottom to capture residual DNA not collected by the initial
two swabs). The swab tips were cut from the base, placed in a Buffer ATL (foreshadowing
results from different preservatives tested), and stored at 4˚C prior to transport to the laboratory.
DNA Extraction and Sequencing
DNA was extracted from the swab tips and associated Buffer ATL (to capture DNA sloughed off
the swab) with Qiagen DNeasy Blood & Tissue kit (Qiagen, Mississauga, ON, Canada),
following manufacturer instructions for tissue specimens. DNA was passed through gel
electrophoresis and imaged using Gel Doc E-Z System (BIO RAD, Hercules, California, USA)
to ensure high quality DNA extractions. Fragments from the mitochondrial cytochrome c oxidase
I (COI) gene were targeted for DNA barcoding. The use of tuna tissue to attract sharks resulted
in some sample contamination which was mitigated by incorporating several different primer
regimes to avoid amplifying tuna DNA (Table 1). For all samples without tuna contamination,
approximately 680 bp were amplified using general fish primers FishF2 and FishR2 as described
in Ward et al. (2005):
FishF2-5’TCGACTAATCATAAAGATATCGGCAC3’
FishR2-5’ACTTCAGGGTGACCGAAGAATCAGAA3’
However, the FishF2 – FishR2 primer set did not work well in 30% of specimens, and those
isolates which failed to amplify with FishF2 – FishR2 were retested with CO1shark25F –
CO1shark 315R and CO1shark25F – FishR2. All bull and white shark samples were
contaminated with tuna DNA and therefore were also amplified with a shark specific primer set
as described in Fotedar et al. (2019):
CO1shark25F-5'AGCAGGTATAGTTGGAACAGCCC3'
75
CO1shark315R-5'GCTCCAGCTTCTACTCCAGC3'
White shark DNA did not match well with the CO1shark315R reverse primer, hence a
combination of CO1shark25F and FishR2 was used to resolve this issue.
The first set of 20 µl PCR reaction mix included 6.6 µl of ultrapure water, 10 µl of Go Taq Green
Master Mix (Promega Corporation, USA), 0.2 µl of each designated primer (10 mM), and 3 µl of
DNA template. Amplifications were performed using a T100 thermal cycler (Bio-Rad
Laboratories, Inc.). For samples that did not amplify in the first round we tried a primer set using
CO1shark25F as our forward and FishR2 as the reverse primer. The second round of PCRs
maintained a total of 20 ul, but used 8.6 ul of ultrapure water and only 1 ul of DNA template for
each sample. The PCR program varied at the annealing temperature between primer regimes;
55°C, 60°C, 62°C for the FishF2 – FishR2, CO1shark25F – FishR2, and CO1shark25F –
CO1shark315R respectively; an initial denaturation at 95°C for three minutes, followed by 35
cycles of 95°C for 30 sec, specified annealing temperature listed above for 45 sec, and 72°C for
1 min, finished by 5-10 min at 72°C and then held at 12°C. All PCR products were run on 1 %
agarose gel stained with GelRed and purified using EXOFAP (EXO1 and FastAP). Purified PCR
products were sequenced by GENEWIZ, Inc (South Plainfield, NJ) using Applied Biosystems
BigDye version 3.1 and Applied Biosystem's 3730xl DNA Analyzer.
Sequence data were processed in Geneious 6.1.8 (Kearse et al. 2012). Sequences were trimmed
(at an error probability limit of 0.05), forward and reverse chromatograms were assembled and
edited by eye using Geneious, to ensure confidence in genotyping. Assembled sequences were
exported as a fasta file and placed in a BLAST search function with GenBank (Altschul et al.

76
1990). Species identifications were considered valid if barcodes had >98% sequence homology
with GenBank archives.
Results
Preliminary sampling
The twelve swabs taken from the initial surfboard trial yielded low to moderate amounts of
DNA, determined by electrophoresis gel, regardless of fixation protocol. The six samples stored
in extraction buffer yielded the more DNA than when compared to DMSO, ethanol, and dry
samples (DNA concentration estimated from gel electrophoresis imaging). This is likely due to
sloughing of DNA when swabs were removed from their storage liquids. The tissue sample and
three of the six swab samples stored in extraction buffer amplified robustly, including samples
from both before and after the board was dunked in the water 20 times to simulate real world
situations. These four sequences were 100% identical and had 100% query coverage to several
Galeocerdo cuvier sequences listed on GeneBank.
Thirty-one of the 32 remaining shark bite specimens provided DNA sequences for species
identification (Table 1). The different primers yielded different read lengths with CO1shark25F –
FishR2 generating the longest reads, followed by CO1shark25F – CO1shark315R, then Fish2F –
Fish2R (583.1 ± 26.70, 295.2 ± 122, 178.2 ± 16.72 respectively). Eighteen swabs provided DNA
barcodes in all three replicates, nine were successful in two replicates, and three were only
successful in one replicate. One white shark bite from wetsuit neoprene yielded insufficient DNA
from all three swabs. Of the 96 total swabs eight swabs failed due to insufficient DNA, 11 swabs
failed due to poor amplification during PCR, and two failed at the sequencing step. Twenty six
77
samples (one or more replicates) matched field identifications. Five barcodes were ambiguous
because the congeneric dusky and Galapagos sharks are indistinguishable at the CO1 marker
utilized in this study, though all five yielded quality DNA sequences and matched to the online
database for both species.
Discussion
Our results demonstrate that shark species can be definitively identified from transfer DNA
recovered from bite impressions in surfboards, wooden boards and neoprene wetsuits, even if the
article is repeatedly immersed in seawater before swabbing. The success rate (31 out of 32 shark
bites yielding identifiable DNA barcodes) from swabbed samples shows this technique can be a
useful tool in future shark bite incidents. The failure of one sample may have resulted from
insufficient swabbing hence we emphasize the importance of replication in swabbing.
Based on our study, several factors can maximize likelihood of obtaining DNA sequences
sufficient for species identification. First, storing swabs in DNA extraction buffer provides the
highest DNA yield for downstream analysis, and should be the method of choice for future shark
bite swabbing. Second, though our experimental approach resulted in contamination of some
samples with tuna DNA, this scenario is unlikely in a typical situations were swabs from shark
bites would be on bitten objects, e.g. surfboards, scuba-diving or snorkeling equipment, kayaks,
there would be much less risk of contamination. In these situations the general Fish2 primer
should suffice. However, our sequencing results yielded longer reads when using CO1shark25F
and FishR2, which might be beneficial when swabbing bite wounds containing human or fish
DNA (see discussion below). Lastly, we were not able to distinguish dusky shark and Galapagos

78
sharks with the mitochondrial CO1 barcode alone. This is due to relatively recent co-ancestry,
possibly exacerbated by hybridization between these two species (Corrigan et al. 2017; Pazmiño
et al. 2019). Only a few cases of hybridization has been documented in sharks (Morgan et al.
2012; Corrigan et al. 2017; Pazmiño et al. 2019) and these species are rarely involved in shark
bites (ISAF). It is therefore unlikely that hybridization will hinder species identification in most
shark bite situations. If swab results indicate a species known to hybridize, a second sequencing
step can be implemented, using the more variable mtDNA control region or nuclear markers, to
distinguish species.
Our swab samples were collected within minutes of the shark biting the board so the question
remains about how long (in time) useable DNA is recoverable after a bite. Future tests should
include (1) delayed swab sampling to mimic real-world scenarios where bite impression
sampling is unlikely to occur within minutes of a shark bite incident, and (2) storage of the
artifact in a range of environmental conditions to identify best handling practices to preserve
transfer DNA prior to swabbing. Despite these uncertainties, we feel this approach is already
promising enough to warrant swab-sampling surfboards and wetsuits (and other personal
artifacts) from shark bite incidents in order to attempt identification of the shark species.
Our success recovering transfer DNA from surfboards and wetsuits indicates that it may also be
possible to harvest transfer DNA directly from the wound margins of shark bite victims, but
there are a plethora of ethical and legal complications that may make this challenging in practice.
Collection of transfer DNA from shark bite victims should only occur with appropriate consent
79
after they are medically stabilized (or post-mortem), and will also require appropriate
precautions for dealing with blood-borne pathogens.
Although our current DNA barcoding test focuses only on identifying the species responsible for
the bite, a DNA fingerprinting approach could be employed to identify individual sharks
responsible for bite incidents and thereby answer the longstanding question of whether a single
individual may be responsible for multiple bite incidents (the ‘problem individual’ hypothesis,
Clua et al. 2020). For example, analyses based on the mitochondrial control region could be
used to distinguish two samples based on a single nucleotide polymorphism (SNP) difference
between them. However, robustly demonstrating that two samples originate from the same
individual will require genomic sequences coupled with an understanding of the genetic
variability within candidate species. An array of single nucleotide polymorphism (SNP) profiles
would be required, targeting polymorphic nuclear loci specific to tiger, bull, or white shark
genomes. This would provide the breakthrough to forensic identification of individuals
(Shokralla et al. 2014). Developing this SNP array will also allow shark DNA to be
differentiated from any contaminant DNA acquired by swabbing.
In conclusion our findings shows that swab-sampling surfboards and wetsuit neoprene (and other
personal artifacts) involved in shark bite incidents can provide an accurate identification of the
shark species. We recommend the development of transfer DNA sampling as a routine part of the
forensic analysis of shark bite incidents to help identify the species involved in the bite.
80
References
Altschul SF, Gish W, Miller W, Myers EW, Lipman DJ (1990) Basic Local Alignment Search Tool. J Mol Biol 215:403–410. doi: 10.1016/S0022-2836(05)80360-2
Cardeñoza D (2019) Genetic identification of threatened shark species in pet food and beauty care products. Conserv Genetics 20, 1383 - 1387.
Clua E, Reid D (2013) Features and motivation of a fatal attack by a juvenile white shark, Carcharodon carcharias, on a young male surfer in New Caledonia (South Pacific). J Forensic Leg Med 20:551–554.
Clua E, Séret B (2015) Species identification of the shark involved in the 2007 Lifou fatal attack on a swimmer: A reply to Tirard et al. (2015). J Forensic Leg Med 40:58–60.
Clua E, Bescond P-M, Reid D (2014) Fatal attack by a juvenile tiger shark, Galeocerdo cuvier, on a kitesurfer in New Caledonia (South Pacific). J Forensic Leg Med 25:67–70.
Clua EEG, Linnell JDC (2019) Individual shark profiling: An innovative and environmentally responsible approach for selectively managing human fatalities. Conserv Lett 12:1–8. doi: 10.1111/conl.12612
Clua EEG, Linnell JDC., Planes S, Meyer CG (2020) Selective removal of problem individuals as an environmentally responsible approach for managing shark bites on humans. J of Oc and Coas Manag 194; 105266. https://doi.org/10.1016/j.ocecoaman.2020.105266
Corrigan S, Maisano Delser P, Eddy C, Duffy C, Yang L, Li C, Bazinet AL, Mona S, Naylor GJP (2017) Historical introgression drives pervasive mitochondrial admixture between two species of pelagic sharks. Mol Phylogenet Evol 110:122–126. doi: 10.1016/j.ympev.2017.03.011
Duarte-Neto P, Rodrigues J, Lessa R (2019) Shape analysis of shark jaws as a tool to identify species involved in incidents with humans. J Forensic Leg Med 64:23–27.
Fotedar S, Lukehurst S, Jackson G, Snow M (2019) Molecular tools for identification of shark species involved in depredation incidents in Western Australian fisheries. PLoS One 1–14.
Hobbs CAD, Potts RWA, Walsh MB, Usher J, Griffiths AM (2019) Using DNA barcoding to investigate patterns of species utilisation in UK shark products reveals threatened species on sale. Sci Reports 9:1028 DOI 10.1038/s41598-018-38270-3.
Huveneers C, Whitmarsh S, Thiele M, Meyer L, Fox A, Bradshaw CJA (2018) Effectiveness of five personal shark-bite deterrents for surfers. PeerJ 2018:1–22. doi: 10.7717/peerj.5554
Kearse M, Moir R, Wilson A, Stones-Havas S, Cheung M, Sturrock S, Buxton S, Cooper A, Markowitz S, Duran C, Thierer T, Ashton B, Meintjes P, Drummond A (2012) Geneious Basic: An integrated and extendable desktop software platform for the organization and analysis of sequence data. Bioinformatics 28:1647–1649. doi: 10.1093/bioinformatics/bts199
Marko PB, Nance HA, Guynn KD (2011) Genetic detection of mislabeled fish from a certified sustainable fishery. Curr Biol 21: PR621 - PR622.
Morgan JAT, Harry A V., Welch DJ, Street R, White J, Geraghty PT, Macbeth WG, Tobin A, Simpfendorfer CA, Ovenden JR (2012) Detection of interspecies hybridisation in Chondrichthyes: Hybrids and hybrid offspring between Australian (Carcharhinus tilstoni) and common (C. limbatus) blacktip shark found in an Australian fishery. Conserv Genet 13:455–463. doi: 10.1007/s10592-011-0298-6
Pazmiño DA, van Herderden L, Simpfendorfer CA, Junge C, Donnellan SC, Hoyos-Padilla EM, Duffy CAJ, Huveneers C, Gillanders BM, Butcher PA, Maes GE (2019) Introgressive hybridisation between two widespread sharks in the east Pacific region. Mol Phylogenet Evol. doi: 10.1016/j.ympev.2019.04.013
Quinto CA, Tinoco R, Hellberg RS (2016) DNA barcoding reveals mislabeling of game meat species on the U.S. commercial market. Food Control 59:386392. https://doi.org/10.1016/j.foodcont.2015.05.043
Ryan LA, Lynch SK, Harcourt R, Slip DJ and others (2019) Environmental predictive models for shark attacks in Australian waters. Mar Ecol Prog Ser 631:165-179. https://doi.org/10.3354/meps13138
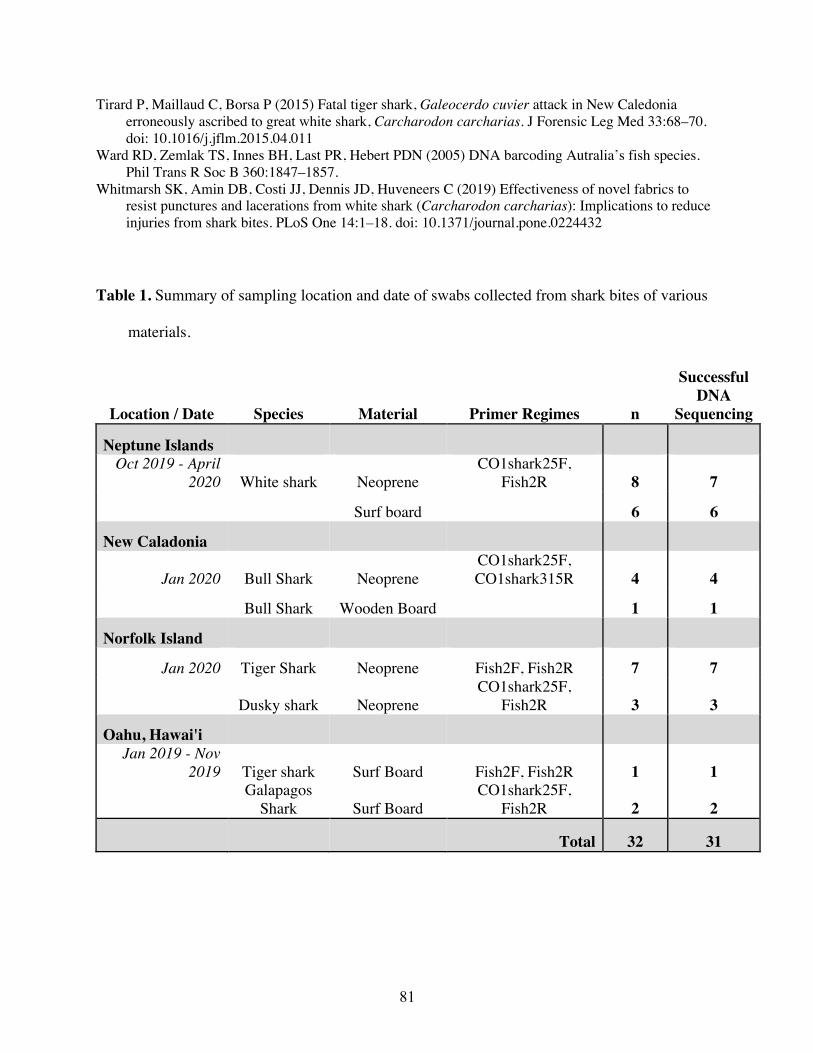
81
Tirard P, Maillaud C, Borsa P (2015) Fatal tiger shark, Galeocerdo cuvier attack in New Caledonia erroneously ascribed to great white shark, Carcharodon carcharias. J Forensic Leg Med 33:68–70. doi: 10.1016/j.jflm.2015.04.011
Ward RD, Zemlak TS, Innes BH, Last PR, Hebert PDN (2005) DNA barcoding Autralia’s fish species. Phil Trans R Soc B 360:1847–1857.
Whitmarsh SK, Amin DB, Costi JJ, Dennis JD, Huveneers C (2019) Effectiveness of novel fabrics to resist punctures and lacerations from white shark (Carcharodon carcharias): Implications to reduce injuries from shark bites. PLoS One 14:1–18. doi: 10.1371/journal.pone.0224432
Table 1. Summary of sampling location and date of swabs collected from shark bites of various
materials.
Location / Date Species Material Primer Regimes n
Successful DNA
Sequencing
Neptune Islands Oct 2019 - April
2020 White shark Neoprene CO1shark25F,
Fish2R 8 7
Surf board 6 6
New Caladonia
Jan 2020 Bull Shark Neoprene CO1shark25F, CO1shark315R 4 4
Bull Shark Wooden Board 1 1
Norfolk Island
Jan 2020 Tiger Shark Neoprene Fish2F, Fish2R 7 7
Dusky shark Neoprene CO1shark25F,
Fish2R 3 3
Oahu, Hawai'i Jan 2019 - Nov
2019 Tiger shark Surf Board Fish2F, Fish2R 1 1
Galapagos
Shark Surf Board CO1shark25F,
Fish2R 2 2
Total 32 31
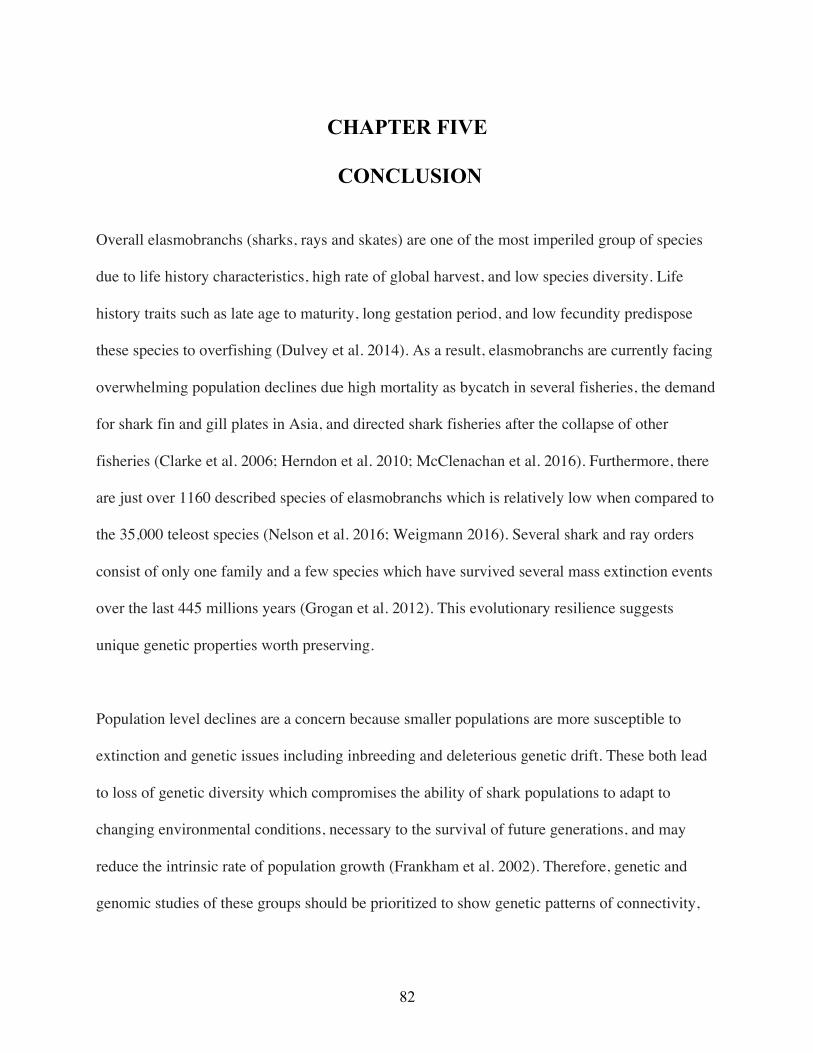
82
CHAPTER FIVE
CONCLUSION
Overall elasmobranchs (sharks, rays and skates) are one of the most imperiled group of species
due to life history characteristics, high rate of global harvest, and low species diversity. Life
history traits such as late age to maturity, long gestation period, and low fecundity predispose
these species to overfishing (Dulvey et al. 2014). As a result, elasmobranchs are currently facing
overwhelming population declines due high mortality as bycatch in several fisheries, the demand
for shark fin and gill plates in Asia, and directed shark fisheries after the collapse of other
fisheries (Clarke et al. 2006; Herndon et al. 2010; McClenachan et al. 2016). Furthermore, there
are just over 1160 described species of elasmobranchs which is relatively low when compared to
the 35,000 teleost species (Nelson et al. 2016; Weigmann 2016). Several shark and ray orders
consist of only one family and a few species which have survived several mass extinction events
over the last 445 millions years (Grogan et al. 2012). This evolutionary resilience suggests
unique genetic properties worth preserving.
Population level declines are a concern because smaller populations are more susceptible to
extinction and genetic issues including inbreeding and deleterious genetic drift. These both lead
to loss of genetic diversity which compromises the ability of shark populations to adapt to
changing environmental conditions, necessary to the survival of future generations, and may
reduce the intrinsic rate of population growth (Frankham et al. 2002). Therefore, genetic and
genomic studies of these groups should be prioritized to show genetic patterns of connectivity,
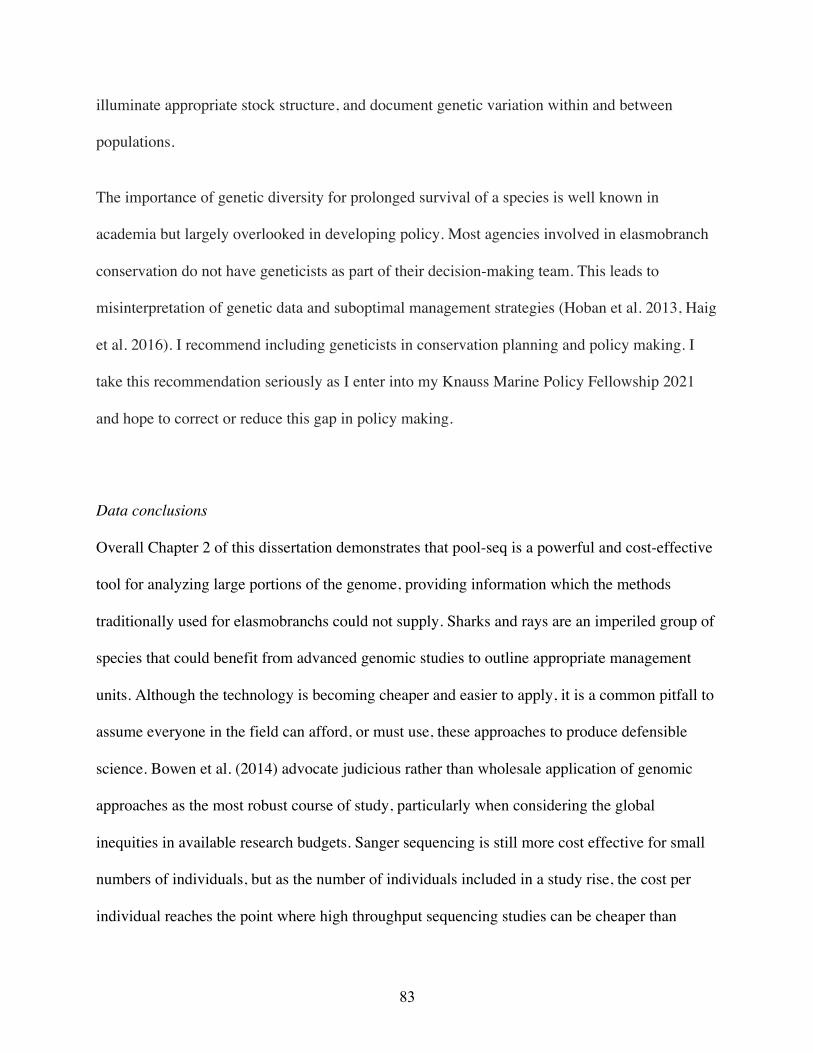
83
illuminate appropriate stock structure, and document genetic variation within and between
populations.
The importance of genetic diversity for prolonged survival of a species is well known in
academia but largely overlooked in developing policy. Most agencies involved in elasmobranch
conservation do not have geneticists as part of their decision-making team. This leads to
misinterpretation of genetic data and suboptimal management strategies (Hoban et al. 2013, Haig
et al. 2016). I recommend including geneticists in conservation planning and policy making. I
take this recommendation seriously as I enter into my Knauss Marine Policy Fellowship 2021
and hope to correct or reduce this gap in policy making.
Data conclusions Overall Chapter 2 of this dissertation demonstrates that pool-seq is a powerful and cost-effective
tool for analyzing large portions of the genome, providing information which the methods
traditionally used for elasmobranchs could not supply. Sharks and rays are an imperiled group of
species that could benefit from advanced genomic studies to outline appropriate management
units. Although the technology is becoming cheaper and easier to apply, it is a common pitfall to
assume everyone in the field can afford, or must use, these approaches to produce defensible
science. Bowen et al. (2014) advocate judicious rather than wholesale application of genomic
approaches as the most robust course of study, particularly when considering the global
inequities in available research budgets. Sanger sequencing is still more cost effective for small
numbers of individuals, but as the number of individuals included in a study rise, the cost per
individual reaches the point where high throughput sequencing studies can be cheaper than
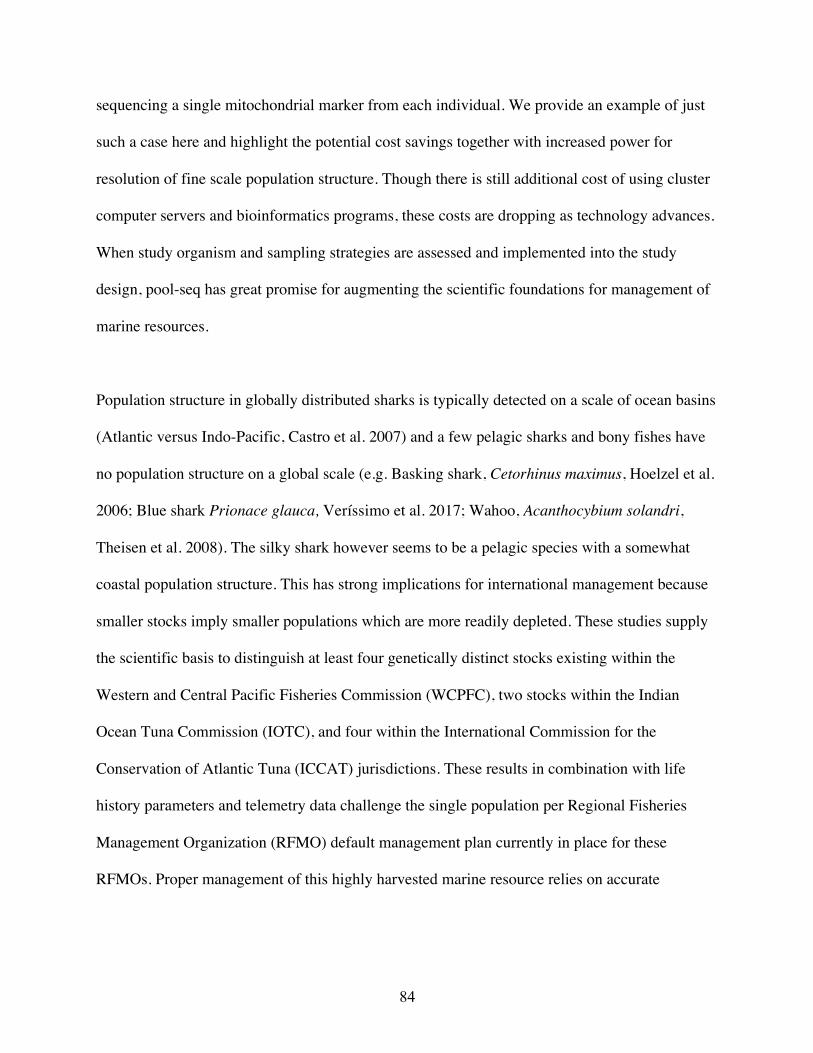
84
sequencing a single mitochondrial marker from each individual. We provide an example of just
such a case here and highlight the potential cost savings together with increased power for
resolution of fine scale population structure. Though there is still additional cost of using cluster
computer servers and bioinformatics programs, these costs are dropping as technology advances.
When study organism and sampling strategies are assessed and implemented into the study
design, pool-seq has great promise for augmenting the scientific foundations for management of
marine resources.
Population structure in globally distributed sharks is typically detected on a scale of ocean basins
(Atlantic versus Indo-Pacific, Castro et al. 2007) and a few pelagic sharks and bony fishes have
no population structure on a global scale (e.g. Basking shark, Cetorhinus maximus, Hoelzel et al.
2006; Blue shark Prionace glauca, Veríssimo et al. 2017; Wahoo, Acanthocybium solandri,
Theisen et al. 2008). The silky shark however seems to be a pelagic species with a somewhat
coastal population structure. This has strong implications for international management because
smaller stocks imply smaller populations which are more readily depleted. These studies supply
the scientific basis to distinguish at least four genetically distinct stocks existing within the
Western and Central Pacific Fisheries Commission (WCPFC), two stocks within the Indian
Ocean Tuna Commission (IOTC), and four within the International Commission for the
Conservation of Atlantic Tuna (ICCAT) jurisdictions. These results in combination with life
history parameters and telemetry data challenge the single population per Regional Fisheries
Management Organization (RFMO) default management plan currently in place for these
RFMOs. Proper management of this highly harvested marine resource relies on accurate
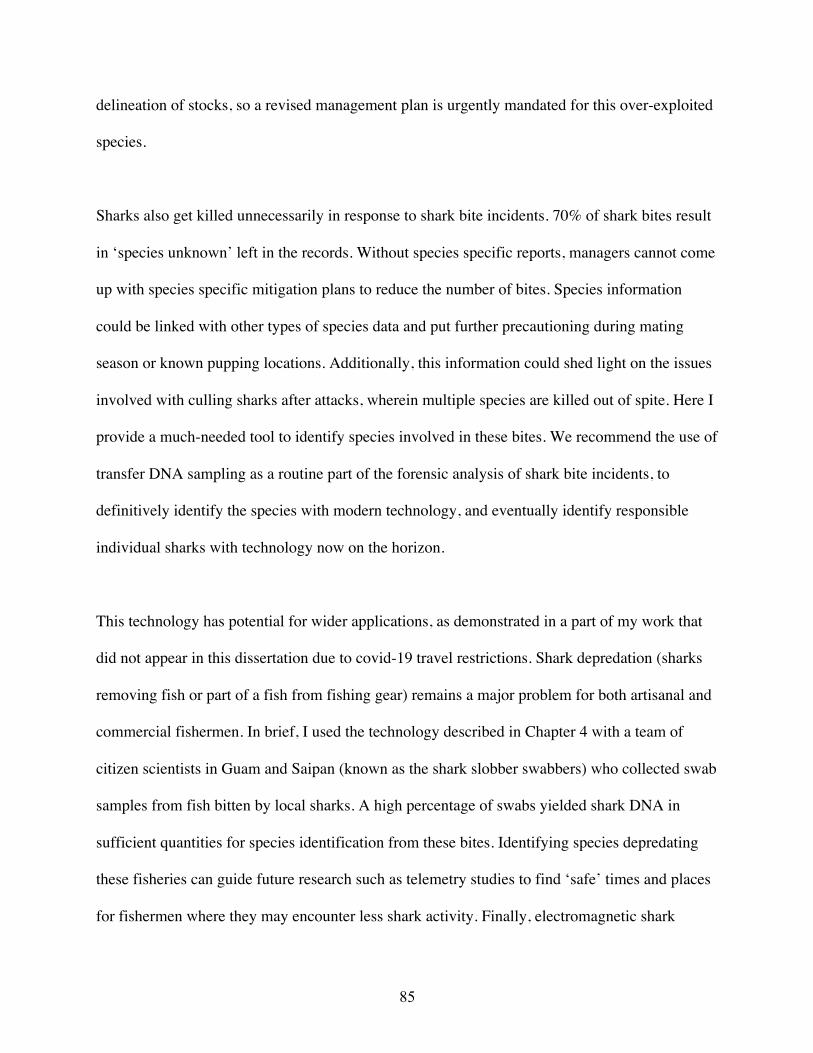
85
delineation of stocks, so a revised management plan is urgently mandated for this over-exploited
species.
Sharks also get killed unnecessarily in response to shark bite incidents. 70% of shark bites result
in ‘species unknown’ left in the records. Without species specific reports, managers cannot come
up with species specific mitigation plans to reduce the number of bites. Species information
could be linked with other types of species data and put further precautioning during mating
season or known pupping locations. Additionally, this information could shed light on the issues
involved with culling sharks after attacks, wherein multiple species are killed out of spite. Here I
provide a much-needed tool to identify species involved in these bites. We recommend the use of
transfer DNA sampling as a routine part of the forensic analysis of shark bite incidents, to
definitively identify the species with modern technology, and eventually identify responsible
individual sharks with technology now on the horizon.
This technology has potential for wider applications, as demonstrated in a part of my work that
did not appear in this dissertation due to covid-19 travel restrictions. Shark depredation (sharks
removing fish or part of a fish from fishing gear) remains a major problem for both artisanal and
commercial fishermen. In brief, I used the technology described in Chapter 4 with a team of
citizen scientists in Guam and Saipan (known as the shark slobber swabbers) who collected swab
samples from fish bitten by local sharks. A high percentage of swabs yielded shark DNA in
sufficient quantities for species identification from these bites. Identifying species depredating
these fisheries can guide future research such as telemetry studies to find ‘safe’ times and places
for fishermen where they may encounter less shark activity. Finally, electromagnetic shark
86
deterrents could be developed to deter sharks from biting the fish on its way to the boat.
Different species have different sensitivities to these electromagnetic fields, therefore species
identification can help tune the devises for optimal shark repulsion (pers. comm. Dr. Carl
Meyer).
Insights for future genomic studies on broadly distributed oceanic species
When illuminating stock structure of broadly distributed oceanic species, proper study design is
crucial. For many species we do not fully understand their ontogenetic shifts in habitat as they
develop from young of the year (YOY) to adults. It’s safe to assume YOY have not developed
the motor function to travel far from their place of origin whereas adults have the ability and
time to disperse long distances. Examining YOY exclusively would eliminate any potentially
confounding effects of migration, such as when breeding populations overlap in feeding areas. It
could also help answer important questions such as natal homing behavior or female site fidelity
and possibly improve resolution of spawning and nursery habitats. Some studies missed key
aspects of population structure that could not be detected by examining adults only, structure that
was only apparent when YOY individuals were assessed (Rooker et al. 2008; Puncher et al.
2018)
This treatment of YOY individuals is especially important when considering a pooled sampling
study design. Pooling individuals offers a financially efficient genomic assessment especially
with high sample sizes, as demonstrated in this dissertation, but it may not be appropriate for all
studies. Here, adult individuals are pooled based on location, leaving the possibility of long
distance dispersal and mixing before population assessment. Pooling YOY reduces the potential
87
to pool animals that originated from mixed locations. Specimens attained for this dissertation did
not yield enough specimens (based on length measurements) to complete an assessment using
only YOY, but should be considered for future studies of any migratory marine predator.
Care still needs to be given when pooling individual from non-migratory species but, depending
on the scope of the project, pooling adult individuals could be appropriate. When examining
species with crawl away larva or other low dispersal potential species such as limpets, snails, and
octopus, pooling of adult individuals by location could be a valid and sound study design.
However, while assessing species with a pelagic larval phase such a reef fishes, corals, and
marine invertebrates, pelagic larval duration (PLD) should be considered when designing
pooling ranges. Though the adults don’t move far, or at all for sessile organisms, PLD is what
facilitates connectivity and can still span large distances, especially for those with long PLD such
as moray eels (Reece et al. 2011; Huang et al. 2018).
Another challenge presented with pool-seq data is the interpretation of low but significant
population structure. At what point does a low but significant FST values represent population
structure or an artifact created by large data sets? This is a question that haunted this particular
data set for years and unfortunately has not been entirely answered. The compromise of using
Wilcoxon rank sum test was made based on best advice and time constraints. Though the
Wilcoxon test is a good candidate for this type of data set and has been used in published pool-
seq studies (Nolte et al. 2013; Kurland et al. 2019), the biological implications of significant but
low values remains cloudy. Additionally, the field needs to agree on standardized statistics for
88
interpreting SNP data. The uncertainty of inherent biases with high throughput pooled data sets
needs to be examined further, to say the least.
To reduce some of the current uncertainty about SNP data, sequencing duplicate libraries should
become common practice. Sequencing two identical libraries should show no structure between
them, however it’s possible that some ‘white noise’ is detected between them. This noise can
then be quantified and compared to genetic signals detected between non duplicate pooled
libraries, creating a threshold above which the signal can be attributed to biological processes
and not large data artifacts. I recommend at least a few duplicate libraries per pool-seq study to
account for this noise and making biological interpretations based on values above the “noise
threshold”.
This dissertation demonstrates some excellent tools for elasmobranch research. Though the field
is still evolving, I believe in the interpretation of my results and discussions to follow. I hope
managers take genetic recommendations into consideration when making future policy regarding
silky sharks, and that these projects set examples for future work. I’m most proud of the forensic
tools we developed from scratch, the success rate with the surf boards and wet suit project, and
the momentum it has carried in the Guam and Saipan shark depredation project.
References Bowen, B.W., Shanker, K., Yasuda, N., Celia, M., Malay, M.C.M.D., von der Heyden, S., Paulay, G.,
Rocha, L.A., Selkoe, K.A., Barber, P.H. and Williams, S.T. (2014). Phylogeography unplugged: comparative surveys in the genomic era. Bulletin of Marine Science, 90(1):13-46.
Castro, A. L. F., Stewart, B. S., Wilson, S. G., Hueter, R. E., Meekan, M. G., Motta, P. J., Bowen, B. W., & Karl, S. A. (2007). Population genetic structure of Earth’s largest fish, the whale shark (Rhincodon typus). Molecular Ecology, 16(24), 5183–5192. https://doi.org/10.1111/j.1365-294X.2007.03597.x
Clarke SC, Magnussen JE, Abercrombie DL, McAllister MK, Shivji MS (2006) Identification of shark species composition and pro- portion in the Hong Kong shark fin market based on molecular
89
genetics and trade records. Conserv Biol 20:201–211 Dulvy NK, Fowler SL, Musick JA, Cavanagh RD et al (2014) Extinction risk and conservation of the
world’s sharks and rays. eLife 3:e00590 Frankham R, Ballou JD, Briscoe DA (2002) Introduction to conservation genetics. Cambridge University
Press, Cambridge Grogan ED, Lund R, Greenfest-Allen E (2012) The origin and relationship of early Chondrichthyes. In:
Carrier JC, Musick JA, Heithaus MR (eds) Biology of sharks and their relatives, 2nd edn. CRC Press, Boca Raton, pp 3–29
Haig SM, Miller MP, Bellinger R, Draheim HM, Mercer DM, Mullins TD (2016) The conservation genetics juggling act: integrating genetics and ecology, science and policy. Evol Appl 9:181–195
Herndon A, Gallucci VF, DeMaster D, Burke W (2010) The case for an international commission for the conservation and manage- ment of sharks (ICCMS). Mar Policy 34:1239–1248
Hoban SM, Hauffe HC, Pérez-Espona S et al (2013a) Bringing genetic diversity to the forefront of conservation policy and management. Conserv Genet Resour 5:593–598
Hoelzel, A. R., Shivji, M. S., Magnussen, J. E., & Francis, M. P. (2006). Low worldwide genetic diversity in the basking shark ( Cetorhinus maximus ). Biology Letters, 2, 639–642. https://doi.org/10.1098/rsbl.2006.0513
Huang WC, Chang JT, Liao C, Tawa A, Iizuka Y, Liao TY, Shiao JC (2018) Pelagic larval duration, growth rate, and population genetic structure of the tidepool snake moray Uropterygius micropterus around the southern Ryukyu Islands, Taiwan, and the central Philippines. PeerJ. doi: 10.7717/peerj.4741
Kurland S, Wheat CW, de la Paz Celorio Mancera M, Kutschera VE, Hill J, Andersson A, Rubin CJ, Andersson L, Ryman N, Laikre L (2019) Exploring a Pool-seq-only approach for gaining population genomic insights in nonmodel species. Ecol Evol 9:11448–11463. doi: 10.1002/ece3.5646
McClenachan L, Cooper AB, Dulvy NK (2016) Rethinking trade- driven extinction risk in marine and terrestrial megafauna. Curr Biol 26:1–7
Nelson JS, Grande TC, Wilson MHV (2016) Fishes of the world. Wiley, Hoboken Nolte V, Pandey RV, Kofler R, Schloẗterer C (2013) Genome-wide patterns of natural variation reveal
strong selective sweeps and ongoing genomic conflict in Drosophila mauritiana. Genome Res 23:99–110. doi: 10.1101/gr.139873.112
Puncher GN, Cariani A, Maes GE, Houdt J Van, Herten K, Rodriguez-ezpeleta N, Cannas R, Fraile I, Laconcha U, Goni N…Tinti F (2018) Spatial dynamics and mixing of bluefin tuna in the Atlantic Ocean and Mediterranean Sea revealed using next-generation sequencing. Molecular Ecology 18:620–638. doi: 10.1111/1755-0998.12764
Reece JS, Bowen BW, Larson A (2011) Long larval duration in moray eels (Muraenidae) ensures ocean-wide connectivity despite differences in adult niche breadth. Marine Ecology Progress Series 437: 269 – 277.
Rooker JR, Secor DH, De Metrio G, Schloesser R, Block BA, Neilson JD (2008) Natal homing and connectivity in Atlantic bluefin tuna populations. Science 322:742–744. doi: 10.1126/science.1161473
Theisen, T. C., Bowen, B. W., Lanier, W., & Baldwin, J. D. (2008). High connectivity on a global scale in the pelagic wahoo, Acanthocybium solandri (tuna family Scombridae). Molecular Ecology, 17, 4233–4247.
Veríssimo A, Sampaio Í, McDowell JR, Alexandrino P, Mucientes G, Queiroz N, da Silva C, Jones CS, Noble LR (2017) World without borders—genetic population structure of a highly migratory marine predator, the blue shark (Prionace glauca). Ecol Evol 7:4768–4781. doi: 10.1002/ece3.2987
Weigmann S (2016) Annotated checklist of the living sharks, batoids and chimaeras (Chondrichthyes) of the world, with focus on bio- geographical diversity. J Fish Biol 88:837–1037
90
CHAPTER SIX
EPILOGUE: PERSONAL PERSPECTIVE Management of our marine recourses is a complex topic and finding practical solutions to
stewardship challenges is difficult to say the least. On one hand we have conservationist and
environmentalist fighting tooth and nail for the habitat and time the oceans need to thrive. On the
other hand, we have important fishing industries that supply jobs and much needed food. On the
completely underwater side of things we have complex ecosystems facing stressors beyond
fishing pressure such as pollution, habitat loss, and of course climate change. So, where do we
begin, what do we prioritize, and eventually who wins? In most cases it’s not the marine
resources, because they are just that, resources for exploiting.
Throughout this dissertation I had conservation goals in mind. I wanted to contribute to a body of
knowledge that could do some good for these pelagic sharks. I firmly believe they are being
mismanaged and these efforts can be improved. Supplying the scientific basis for reconstruction
of management units is certainly a good start. As my knowledge of governing agencies grew, I
started to learn how this would actually play out. What I propose requires additional work from
the management agencies. To compile an ocean wide stock assessment requires a lot of work,
and to present an idea that there needs to be at least 5 management units across the Pacific
multiplies the work quickly. Fisheries management budges, though plentiful, are certainly not
bottomless, especially for bycatch species of relatively little value when compared to the target
fish in these tuna fisheries. So how does one scientist doing a bunch of arm waving change the
minds and management strategies implemented at the policy level? Furthermore, what policy
changes could actually be made to reduce silky shark mortality, even if we do start managing

91
them at the true genetic stock level. Suppose we find the south-central Pacific stock is being
overfished: do we think managers are going to interfere with highly industrious tuna fishing
happening in those areas to save a bycatch species? I don’t believe they would under current
circumstances.
I know managers don’t just deal with conservation of target and non-target species. They also
have to balance the revenue fisheries contribute to the economy, they have to keep jobs, not
disrupt the fishing industry, and try to heed the advice of scientists. It’s got to be a hard task, and
in balancing all these factors I don’t believe the best interest of the resources wins. Overfishing is
not a new concept. We generally know it happening and don’t act fast enough to stop the
collapse of fisheries and yet again we deplete a resource. I hope to see a day where we value
ocean health more than profiting off its demise.
I’m looking forward to getting involved in marine policy with my upcoming Knauss fellowship
with the National Marine Fisheries Service. Though I’m not going to walk in the door and make
grand change anytime soon, I do hope to learn the ropes, contribute my scientific background
and expertise to current fisheries challenges and find practical solutions. I’m sure it’s an even
more complex system then my graduate student mind has yet to comprehend, and current
management shortcomings are rooted in deeper societal problems. Therefore, I will bite off what
I can chew, take on challenges, and try to provide realistic solutions to these issues. As a scientist
I’m excited to see what I will be able to accomplish and see some real change for our oceans.