Dissertation Fraß - RiuNet
329
Doctoral Program on Business Management Doctoral Dissertation Impact of After-Sales Performances of German Automobile Manufacturers in China in Service Satisfaction and Loyalty. With a Particular Focus on the Influences of Cultural Determinants. Submitted from: Alexander Fraß, MA Supervisor UPV: Prof. Dr. José Albors Garrigós, Universitat Politècnica de València Supervisor HAW: Prof. Dr. Klaus-Peter Schoeneberg, Hochschule für Angewandte Wissenschaften Hamburg Hamburg/Valencia: November 2015
-
Upload
khangminh22 -
Category
Documents
-
view
0 -
download
0
Transcript of Dissertation Fraß - RiuNet
I
Doctoral Program on Business Management
Doctoral Dissertation
Impact of After-Sales Performances of German Automobile
Manufacturers in China in Service Satisfaction and Loyalty.
With a Particular Focus on the Influences of Cultural Determinants.
Submitted from: Alexander Fraß, MA
Supervisor UPV: Prof. Dr. José Albors Garrigós,
Universitat Politècnica de València
Supervisor HAW: Prof. Dr. Klaus-Peter Schoeneberg,
Hochschule für Angewandte Wissenschaften Hamburg
Hamburg/Valencia: November 2015

I
Resumen Los servicios post venta en el sector del automóvil se han convertido en un elemento
esencial en su mercadotecnia global. Sin embargo, no se han investigado suficien-
temente y, especialmente en países emergentes con mercados crecientes como
China, el mercado más relevante a nivel mundial. Aquí, los fabricantes alemanes
juegan un rol fundamental al dominar el segmento premium (o de cuasi lujo) del
mercado. Cuando analizamos los servicios, un factor importante en China es la cul-
tura. Sin embargo existe, en este campo un hueco en la investigación académica ya
que en la literatura de investigación del sector automóvil, la cultura es un elemento
poco analizado. Por ello, no se pueden aplicar conocimientos de mercadotecnia es-
pecíficos en relación con el comportamiento de la demanda de servicios en China,
en un tema esencial, como es la cultura China, muy diferente a la occidental. Esta
tesis trata de enfocar las limitaciones mencionadas; en primer lugar, proporcionando
una guía de cómo la cadena de proceso de servicios postventa puede ser investiga-
da en países emergentes como China. Y en segundo lugar, porque se utiliza la teo-
ría de cultura de Schwartz como un enfoque útil de instrumentación de los valores
culturales. Así, estos se modelan como variables externas, para mostrar claramente
cuáles son los valores realmente relevantes en su conjunto. Para ello se encuesta-
ron a 301 clientes de talleres post venta chinos de las marcas Audi, BMW y Merce-
des-Benz, con el fin de evaluar los factores críticos de éxito mediante modelos de
ecuaciones estructurales de mínimos cuadrados parciales (PLS).
Resum Els serveis post venda en el sector de l'automòbil s'han convertit en un element es-
sencial del màrqueting global. No obstant això, no s'han investigat prou i, especial-
ment en països emergents amb mercats creixents com la Xina, el mercat més relle-
vant a nivell mundial. Aquí, els fabricants alemanys juguen un paper fonamental en
dominar el segment premium (o de quasi luxe) del mercat. Quan analitzem els ser-
veis, un factor important a la Xina és la cultura. No obstant això existeix, en aquest
camp un buit en la investigació acadèmica ja que en la literatura de recerca del sec-
tor automòbil, la cultura és un element poc analitzat. Per això, no es poden aplicar

Content Overview
II
coneixements de màrqueting específics en relació amb el comportament de la de-
manda de serveis a la Xina, en un tema essencial, com és la cultura Xina, molt dife-
rent a l'occidental. Aquesta tesis tracta d'enfocar les limitacions esmentades; en pri-
mer lloc, proporcionant una guia de com la cadena de procés de serveis postvenda
pot ser investigada en països emergents com la Xina. I en segon lloc, perquè s'utilit-
za la teoria de cultura de Schwartz com un enfocament útil d'instrumentació dels va-
lors culturals. Així, aquests es modelen com a variables externes, per mostrar clara-
ment quins són els valors realment rellevants en el seu conjunt. Per a això es van
enquestar a 301 clients de tallers post venda xinesos de les marques Audi, BMW i
Mercedes-Benz, per tal d'avaluar els factors crítics d'èxit mitjançant models d'equa-
cions estructurals de mínims quadrats.
Summary After-sales services have become very important in the automobile industry. Howev-
er, this area has not been sufficiently researched, particularly with regard to China,
the most important car market globally. In this respect, German manufacturers play a
leading role because they dominate the premium market segment. When it comes to
services, the one thing that is especially important in China is culture. At the same
time, this is exactly where a scientific gap exists because the cultural aspect in auto-
motive services has been mostly neglected in the research literature. Thus, specific
knowledge with regard to Chinese service demand behaviour is lacking, which could
become a crucial issue because of the enormous differences between Chinese and
Western cultures. This paper addresses this limitation by providing a guideline for
how the entire process chain of after-sales services could be researched in China. In
addition, it also introduces Schwartz's individual level value theory as a beneficial
operationalisation approach to culture. Thereby, values are modelled as exogenous
variables in order to show which ones are really causal. This significant advantage
cannot be provided by national comparison studies, which are the ones that are most
often conducted. A total of 301 Chinese workshop customers of Audi, BMW and
Mercedes-Benz were surveyed in order to assess the critical success factors of after-
sales services via partial least squares structural equation modelling.
Content Overview
III
Table
Content Overview !
CONTENT!OVERVIEW!..................................................................................................................................!III!
TABLE!OF!CONTENTS!..................................................................................................................................!IV!
TABLE!OF!FIGURES!......................................................................................................................................!VII!
TABLE!OF!TABLES!.....................................................................................................................................!VIII!
ABBREVIATIONS!...........................................................................................................................................!IX!
1! INTRODUCTION!.......................................................................................................................................!1!
2! STATE!OF!RESEARCH!..........................................................................................................................!21!
3! GERMAN!CAR!MANUFACTURERS!IN!CHINA!AS!RESEARCH!OBJECT!.....................................!49!
4! CONCEPTUAL!AND!THEORETICAL!FOUNDATION!......................................................................!87!
5! EMPIRICAL!RESEARCH!......................................................................................................................!171!
6! GENERAL!DISCUSSION!......................................................................................................................!243!
REFERENCES!................................................................................................................................................!257!
APPENDIX!.....................................................................................................................................................!301!

Table of Contents
IV
Table of Contents
CONTENT!OVERVIEW!..................................................................................................................................!III!
TABLE!OF!CONTENTS!..................................................................................................................................!IV!
TABLE!OF!FIGURES!......................................................................................................................................!VII!
TABLE!OF!TABLES!.....................................................................................................................................!VIII!
ABBREVIATIONS!...........................................................................................................................................!IX!
1! INTRODUCTION!.......................................................................................................................................!1!
1.1! STATUS!QUO!AND!PROBLEM!STATEMENT!..........................................................................................................!1!
1.2! EXPLORATORY!PRE5INVESTIGATION!AS!RELEVANCE!RATIONALISATION,!!CONCRETISATION!AND!
POSSIBLE!ADDITION!OF!TOPIC5CHOICE!...............................................................................................................!7!
1.3! IDENTIFICATION!OF!A!RESEARCH!GAP!..............................................................................................................!11!
1.4! RESEARCH!OBJECTIVE!..........................................................................................................................................!12!
1.5! SCIENTIFIC!APPROACH!AND!RESEARCH!METHODOLOGY!OVERVIEW!.........................................................!13!
1.6! COURSE!OF!RESEARCH!.........................................................................................................................................!18!
2! STATE!OF!RESEARCH!..........................................................................................................................!21!
2.1! AUTOMOTIVE!MARKETING!..................................................................................................................................!21!
2.2! AFTER5SALES!.........................................................................................................................................................!24!
2.3! CHINESE!CONSUMER!BEHAVIOUR!IN!THE!CONTEXT!OF!INTERCULTURAL!MARKETING!..........................!37!
3! GERMAN!CAR!MANUFACTURERS!IN!CHINA!AS!RESEARCH!OBJECT!.....................................!49!
3.1! GERMAN!MARKET!OVERVIEW!............................................................................................................................!49!
3.1.1! Car'Manufacturers'......................................................................................................................................'49!
3.1.2! Co4operating'Suppliers'..............................................................................................................................'53!
3.1.3! Consumer'.........................................................................................................................................................'55!
3.2! MACRO!ENVIRONMENT!OF!THE!PEOPLE´S!REPUBLIC!OF!CHINA!.................................................................!59!
3.2.1! Chinese'Economy'..........................................................................................................................................'60!
3.2.2! Chinese'Consumer'Landscape'.................................................................................................................'66!
3.2.3! Challenges'to'After4Sales'Services'in'the'Chinese'Market'..........................................................'70!
3.3! AFTER5SALES!OPERATIONS!OF!GERMAN!AUTOMOBILE!BRANDS!IN!CHINA!..............................................!80!
3.4! INTERIM!CONCLUSION!AND!DELIMITATION!OF!THE!RESEARCH!OBJECT!...................................................!83!
4! CONCEPTUAL!AND!THEORETICAL!FOUNDATION!......................................................................!87!
4.1! CONCEPTUAL!REFERENCE!FRAME!.....................................................................................................................!87!
4.2! DISAMBIGUATION!.................................................................................................................................................!88!

Table of Contents
V
4.2.1! Success'..............................................................................................................................................................'89!
4.2.2! Service'and'After4Sales'Service'..............................................................................................................'93!
4.2.3! Customer'and'Service'Satisfaction'.......................................................................................................'98!
4.2.4! Brand'and'Workshop'Loyalty'..............................................................................................................'100!
4.2.5! Culture'...........................................................................................................................................................'104!
4.3! DETERMINATION!OF!A!SUCCESS!INDICATOR!.................................................................................................!113!
4.4! DETERMINATION!OF!MODEL!VARIABLES!AND!HYPOTHESES!....................................................................!116!
4.4.1! Relationship'Between'After4Sales'Service'Satisfaction'and'Loyalty'...................................'117!
4.4.2! Determination'of'Variables'According'to'the'Marketing4Mix'...............................................'121!
4.4.2.1! Instruments!of!Service!Policy!........................................................................................................................................!121!4.4.2.2! Instruments!of!Price!Policy!............................................................................................................................................!127!4.4.2.3! Instruments!of!Place!Policy!............................................................................................................................................!133!4.4.2.4! Instruments!of!Promotion!Policy!................................................................................................................................!135!4.4.2.5! Instruments!of!Personnel!Policy!..................................................................................................................................!144!
4.4.3! Cultural'Influences'....................................................................................................................................'145!4.4.3.1! Schwartz`s!Individual!Level!Values!............................................................................................................................!146!4.4.3.2! Determination!of!Culture!Related!Variables!...........................................................................................................!154!
4.4.4! Determination'of'Control'Variables'..................................................................................................'163!
4.5! CONCEPTUAL!RESEARCH!MODEL!AND!OVERVIEW!OF!HYPOTHESES!.......................................................!164!
5! EMPIRICAL!RESEARCH!......................................................................................................................!171!
5.1! SUCCESS!FACTOR!RESEARCH!AND!STRUCTURAL!EQUATION!MODELLING!..............................................!171!
5.2! RESEARCH!DESIGN!............................................................................................................................................!177!
5.2.1! Survey'Method'and'Structure'of'the'Questionnaire'...................................................................'177!
5.2.2! Operationalisation'....................................................................................................................................'181!5.2.2.1! Specification!of!Measuring!Models!.............................................................................................................................!182!5.2.2.2! Scaling!......................................................................................................................................................................................!185!5.2.2.3! Construct!Operationalisation!of!Satisfaction!and!Loyalty!Variables!............................................................!188!5.2.2.4! Construct!Operationalisation!of!Independent!Variables!...................................................................................!190!5.2.2.5! Construct!Operationalisation!of!Individual!Level!Values!.................................................................................!192!5.2.2.6! Construct!Operationalisation!of!Control!Variables!..............................................................................................!193!5.2.2.7! Filter!Section!and!Operationalisation!Summary!...................................................................................................!194!
5.2.3! Pre4Test'.........................................................................................................................................................'197!
5.2.4! Data'Collection,'Preparation'and'Structure'of'Sample'............................................................'199!
5.3! DATA!EVALUATION!............................................................................................................................................!205!
5.3.1! Evaluation'of'Reflective'Measuring'Models'...................................................................................'211!
5.3.2! Evaluation'of'Formative'Measuring'Models'.................................................................................'216!
5.3.3! Evaluation'of'the'Structural'Model'...................................................................................................'220!
5.4! RESULTS!OF!THE!EMPIRICAL!ASSESSMENT!...................................................................................................!225!
5.4.1! Hypotheses'Testing'...................................................................................................................................'225!

Table of Contents
VI
5.4.2! Mediating'Effects'.......................................................................................................................................'232!
5.4.3! Moderating'Effects'...................................................................................................................................'233!
5.4.4! Total'Effects'and'Construct'Performances'in'Regard'to'the'Success''Indicator'...........'240!
6! GENERAL!DISCUSSION!......................................................................................................................!243!
6.1! SUMMARY!OF!THE!STUDY!.................................................................................................................................!243!
6.2! INTERPRETATION!OF!EMPIRICAL!RESULTS!AND!MANAGEMENT!IMPLICATIONS!...................................!245!
6.3! LIMITATIONS!AND!FURTHER!RESEARCH!NEEDS!..........................................................................................!253!
REFERENCES!................................................................................................................................................!257!
APPENDIX!.....................................................................................................................................................!301!
Table of Figures
VII
Table of Figures FIGURE 1: SHARE OF LIFE-CYCLE COSTS ................................................................................................... 2!FIGURE 2: REFERENCE FRAME ................................................................................................................. 17!FIGURE 3: COURSE OF STUDY .................................................................................................................. 19!FIGURE 4: OEM`S INDUSTRY TURNOVER .................................................................................................. 51!FIGURE 5: NEW CAR REGISTRATIONS IN GERMANY VS. EXPORT ................................................................. 52!FIGURE 6: COMPARISON OF TURNOVERS IN THE AUTOMOTIVE PRODUCTION ............................................... 54!FIGURE 7: CONSUMER PRICE INDEX VS. CAR DRIVER PRICE INDEX ............................................................ 56!FIGURE 8: MODAL SPLIT (TRAFFIC VOLUME); UP TO 1990 COVERS ONLY WEST GERMANY .......................... 57!FIGURE 9: RATIO OF USED- TO NEW-CAR REGISTRATIONS ........................................................................ 58!FIGURE 10: THE WORLD´S GDP SHARE OF CHOSEN ECONOMIES .............................................................. 61!FIGURE 11: SECTORAL SPLIT IN CHINA FROM 1952 TOWARDS 2012 ........................................................... 61!FIGURE 12: CHINA´S GDP GROWTH RATE COMPARED TO CHOSEN COUNTRIES ......................................... 62!FIGURE 13: RURAL AND URBAN DEBT STRUCTURE .................................................................................... 69!FIGURE 14: TOTAL AUTOMOTIVE SALES IN CHINA ...................................................................................... 71!FIGURE 15: COMPARISON OF MARKET SHARE BY OEM´S COUNTRY OF ORIGIN .......................................... 71!FIGURE 16:!SELECTED CHINESE OEMS WITH IMPORTANT JOINT-VENTURE BRANDS ................................... 75!FIGURE 17: CONCEPTUAL REFERENCE FRAME .......................................................................................... 88!FIGURE 18: SUCCESS CHAINS OF CONSUMER BEHAVIOUR AND AUTOMOTIVE AFTER-SALES SERVICE .......... 91!FIGURE 19: RELATIONSHIP OF SUCCESS VARIABLES ................................................................................. 93!FIGURE 20: DIMENSIONS OF LOYALTY ..................................................................................................... 103!FIGURE 21: CONCEPT OF CULTURE ........................................................................................................ 110!FIGURE 22: THE FRAMEWORK OF THE ROLE OF CULTURE IN CONSUMERS’ SERVICE EXPERIENCES ........... 113!FIGURE 23: RELATIONSHIP BETWEEN AFTER-SALES SERVICE SATISFACTION AND BRAND LOYALTY ........... 119!FIGURE 24: STRUCTURAL RELATION AMONG THE TEN VALUES AND THE TWO DIMENSIONS ........................ 148!FIGURE 25: RESEARCH MODEL OVERVIEW ............................................................................................. 169!FIGURE 26: METHODS TO IDENTIFY SUCCESS FACTORS .......................................................................... 172!FIGURE 27: STRUCTURAL EQUATION MODEL (SEM) ................................................................................ 175!FIGURE 28: CONSTRUCT OPERATIONALISATION ...................................................................................... 182!FIGURE 29: REFLECTIVE VS. FORMATIVE MEASUREMENT MODEL ............................................................. 183!FIGURE 30: GENDER, BRAND AND HOME PROVINCE DISTRIBUTION .......................................................... 204!FIGURE 31: REFLECTIVE-FORMATIVE SECOND-ORDER MODEL ................................................................ 208!FIGURE 32: TECHNICALLY REQUIRED PLS PATH MODEL INCLUDING THE MEASURING ITEMS ...................... 209!FIGURE 33: PLS PATH MODEL ............................................................................................................... 210!FIGURE 34: STRENGTH OF EMPIRICALLY CONFIRMED HYPOTHESES IN THE PATH MODEL .......................... 231!FIGURE 35: POTENTIALLY MEDIATED RELATIONSHIPS WITHIN THE PATH MODEL ........................................ 232!

Table of Tables
VIII
Table of Tables
TABLE 1: EXPERTS OF THE EXPLORATORY PRE-INVESTIGATION ................................................................... 8!TABLE 2: LIST OF INSIGHTS OF THE EXPERT SURVEY ................................................................................. 10!TABLE 3: GERMAN BRAND OVERVIEW ....................................................................................................... 50!TABLE 4: FIVE-YEAR PLAN OVERVIEW SINCE 1980 .................................................................................... 65!TABLE 5: THE ACTUAL FIVE-YEAR PLAN (2011-2015) ............................................................................... 66!TABLE 6: URBAN VS. RURAL HOUSEHOLD INCOME ..................................................................................... 68!TABLE 7: IMPORTANT REGIONAL DISPARITIES IN CHINA .............................................................................. 70!TABLE 8: TYPES OF AUTOMOTIVE WORKSHOPS IN CHINA ........................................................................... 73!TABLE 9: CONCEPTUAL CLASSIFICATION OF AFTER-SALES SERVICES ......................................................... 97!TABLE 10: DEFINITIONS OF BRAND LOYALTY ........................................................................................... 102!TABLE 11: IMPOSED ETIC APPROACH ..................................................................................................... 108!TABLE 12: VALUE DEFINITIONS ............................................................................................................... 111!TABLE 13: STUDIES TOWARDS AUTOMOTIVE AFTER-SALES FOCUSSING ON BRAND LOYALTY ..................... 115!TABLE 14: SERVQUAL DIMENSIONS AND AFTER-SALES CUSTOMER JUDGEMENTS .................................. 124!TABLE 15: CONCEPTUAL DEFINITION OF SCHWARTZ´S TEN BASIC HUMAN VALUES ................................... 149!TABLE 16: OVERVIEW OF SCHWARTZ´S VALUE MEASUREMENT METHODS ................................................ 154!TABLE 17: OVERVIEW OF CONSTRUCTS .................................................................................................. 166!TABLE 18: OVERVIEW OF HYPOTHESES .................................................................................................. 168!TABLE 19: ESSENTIAL REQUIREMENTS FOR THE IMPLEMENTATION OF QUANTITATIVE METHODS ................ 173!TABLE 20: RECOMMENDATIONS FOR WHEN TO USE PLS VERSUS CB-SEM ............................................. 176!TABLE 21: PROS AND CONS OF DIFFERENT SURVEY METHODS ................................................................ 178!TABLE 22: RULES FOR DETERMINING WHETHER A CONSTRUCT IS FORMATIVE OR REFLECTIVE .................. 185!TABLE 23: PVQ OPERATIONALISATION APPROACHES .............................................................................. 192!TABLE 24: OPERATIONALISATION OF CONSTRUCTS ................................................................................. 196!TABLE 25: OVERVIEW OF THE INITIAL PRE-TEST SAMPLE ......................................................................... 197!TABLE 26: OVERVIEW OF THE CHINESE PRE-TEST SAMPLE ..................................................................... 199!TABLE 27: FIELD REPORT, SAMPLE SIZE AND FINAL DATA SET ................................................................ 202!TABLE 28: SYSTEMATIC EVALUATION OF PLS-SEM RESULTS .................................................................. 211!TABLE 29: OVERVIEW OF THE EVALUATION OF REFLECTIVE MEASURING MODELS ..................................... 215!TABLE 30: OVERVIEW OF THE EVALUATION OF FORMATIVE MEASURING MODELS ...................................... 219!TABLE 31: R2 DISTRIBUTION ................................................................................................................... 222!TABLE 32: OVERVIEW OF THE EVALUATION OF THE STRUCTURAL MODEL .................................................. 225!TABLE 33: OVERVIEW OF HYPOTHESES TESTING ..................................................................................... 230!TABLE 34: GROUPS FOR PLS-MGA ....................................................................................................... 234!TABLE 35: GENDER GROUP DIFFERENCES .............................................................................................. 236!TABLE 36: INCOME GROUP DIFFERENCES ............................................................................................... 238!TABLE 37: AGE GROUP DIFFERENCES .................................................................................................... 240!
TABLE 38: TOTAL EFFECTS AND PERFORMANCES TOWARDS THE SUCCESS INDICATOR BRAND LOYALTY .... 242!

Abbreviations
IX
Abbreviations
ABS Anti-skid breaking system INC Income ACH Achievement IPMA Importance-performance matrix
analysis AMOS Analysis of Moment Structures IT Information technology ASSS After-sales service satisfaction Km Kilometre AVE Average variance extracted Mn Million AWD Acceptable workshop distance N. a. No author given BEN Benevolence N/a Not applicable BI Brand image N. p. No place given BL Brand loyalty NPS Net Promoter Score Bn. Billion OEM Original Equipment Manufacturer BRT Bus Rapid Transit PLS Partial Least Square B2B Business to Business POW Power B2C Business to Consumer PPP Purchasing Power Parity CB Covariance based PRC People´s Republic of China CCP Chinese Communist Party PSQ Perceived service quality CCT Consumer Culture Theory PVQ Portrait Values Questionnaire C/D- Confirmation/Disconfirmation-Paradigm PWSC Perceived workshop switching
costs Cf. Confer (compare) Ref. Referring to CNY Renminbi R&D Research and Development COA Country of Assembly S. See COD Country of Design SEC Security COM Country of Manufacture SE-D Self-direction CON Conformity S-D Service-dominant (logic) COO Country of Origin SEM Structural Equation Modelling CPI Consumer price index SERVPERF Service Performance Model CR Composite Reliability SERVQUAL Service Quality Model DNA Deoxyribonucleic acid
(colloquial: genetic disposition) SPSS Statistical Product and Service So-
lutions DSG Direct-shift gearbox SSVS Short Schwartz´s Value Survey EC European Commission STI Stimulation Em. Emeritus SVS Schwartz Value Survey GBI General Brand Image TRA Tradition GEN Gender UNI Universalism GDP Gross Domestic Product VAF Variance accounted for GIGA German Institute of Global and Area
Studies VIF Variance inflation factor
GM General Motors Vol. Volume HED Hedonism WL Workshop loyalty HNWI High-net-worth-individual WTO World Trade Organisation


Introduction
1
1 Introduction
1.1 Status Quo and Problem Statement
With a total revenue share of 20%, the automotive sector has been a core industry in
Germany for a long time. However, the success of German automobile manufactur-
ers is only partially based on the domestic market. In fact, the German automotive
industry association ‘Verband der Automobilindustrie’ (VDA) recently reported an ex-
port ratio of 77%.1 Aside from the saturated German market, which is too small to re-
alise the necessary economies of scale,2 the rest of Europe used to be an important
export market for German manufacturers. Today, however, it only offers moderate
growth opportunities. When considering the total global sales of the German auto-
mobile brands Audi, BMW, Daimler, VW and Porsche, the European share de-
creased from around 60% in 2002 to around 47% in 2010.3 Furthermore, the linger-
ing European debt crisis continues to be a restraint for sales in this market area.4
Thus, in 2012 Germany’s car export quota dropped by around 10% compared to the
previous year.5 Within this long-term trend only 2014 was considered as an exception,
because sales to Great Britain were strong.6
These developments were offset by steadily increasing sales in the emerging mar-
kets. In particular, China, which has experienced average market growth of over 25%
within the decade since 2000, has proved to be a drawing card.7 For manufacturers
of German automobile brands, this means that the local share of worldwide car sales
increased by over 14% to almost 20%.8 In the process, the Chinese market has be-
come the biggest and most important sales market globally.9
1 Cf. VDA (n. a.) (2015a), p. 31; VDA (n. a.) (2012), p. 14; Sopha (2012), p. 97; Barthel et al. (2010),
p. 6; VDA (n. a.) (2013a), Export. 2 Cf. Diez (2012), p. 112. 3 Own calculations based on Diez (2012), p. 116. 4 Cf. VDA (n. a.) (2012), pp. 24 ff. 5 Cf. VDA (n. a.) (2013a), Export. 6 Cf. VDA (n. a.) (2015a), p. 31. 7 Cf. VDA (n. a.) (2012), p. 20; Diez (2012), p. 22. 8 Own calculations based on Diez (2012), p. 116. 9 Cf. VDA (n. a.) (2015a), pp. 20 f.; n. a. (2013a), China ist wichtigster Markt für deutsche Autobauer;
Wang (2011), p. 100.

Introduction
2
So far, it would seem that Daimler, VW, BMW and Audi have done everything right.
However, taking an one-dimensional view of sales is dangerous because important
profit drivers could be ignored. Primarily this means services of the post purchase
phase the after-sales services. Though, the sales potential and earning power of the-
se services are regarded as well researched and scientifically proven.10
Therefore, in many industrial sectors great emphasis is placed on the potential of af-
ter-sales services because of the promise of financial gain.11 In addition, they con-
tribute to soft factors, such as improved customer relations, increased customer sat-
isfaction, customer retention and customer loyalty.12 Consequently, since the early
nineties, industrial countries have shifted their focus from predominate product sales
to value or utility generating services. Besides other factors, like the change from a
seller’s to buyer’s market, as well as the increasing homogeneity of products,13 this
development has occurred in penetrated markets and can be seen across various
sectors, including IT, the white goods industry, mechanical engineering and the au-
tomotive industry. As a result, so many products were sold over time that the service
market had grown to a size that has become four to five times bigger than the new
goods market.14 Likewise, Figure 1 below illustrates a very strong service-oriented
share ratio based on selected life-cycle costs.
Figure 1: Share of Life-Cycle Costs
Reference: Sass (2012), p. 2; Kaerner et al. (2004), p. 164.
10 Cf. Sass (2012), pp. 1 ff.; Bundschuh/Dezvane (2003), pp. 1 ff.; Cohen et al. (2000), pp. 1 ff.; Goffin
(1999), pp. 1 ff.; Wise/Baumgartner (1999), pp. 1 ff.; Hull/Cox (1994), pp. 1 ff. 11 Cf. Sass (2012), p. 2; Saccani et al. (2007), p. 52; Cohen et al. (2006), p. 130; Baader et al. (2006),
p. 3; Gaiardelli et al. (2007), pp. 702/705; Cavalieri et al. (2007), p. 449; Goffin (1999), p. 390. 12 Cf. Hättich (2009), p. 6; Hünecke (2012), p. 1; Reichhuber (2010), p. 31; Sass (2012), p. 3; Hu-
ber/Herrmann (2001), p. 100; Zollikofer-Schwarz (1999), p. 3. 13 Cf. Zerres/Zerres (2006), p. 3; Meffert/Bruhn (2009), p. 7; Simon (1993), pp. 5 ff. 14 Cf. Saccani et al. (2007), p. 52; Cohen et al. (2006), p. 129; Wise/Baumgartner (1999), p. 134.
8%!
11%!
12%!
92%!
89%!
88%!
Aircraft!
Lorry!
Machinery!and!Plant!Engineering!
Share of Life-Cycle Costs
Product!
Service!

Status Quo and Problem Statement
3
Along with these considerable market and life-cycle volumes, the profit margins in af-
ter-sales are highly attractive for the manufacturing industries as BAADER ET AL.
(2006) points out. For example, the after-sales business represents a 20% to 30%
share of turnover and 40% of overall profit.15
After-sales in the Automotive Industry
Currently, services in traditional sales-oriented automotive marketing area have be-
come increasingly important.16 Contrary to their previous sales support function, the
sum of value added services17 is viewed as an independent, and moreover, profitable
market performance of OEMs. These services, which are able to increase the value
or utility of a core product, are increasingly realised in value added steps after the
sale. While being a part of such downstream management, all automotive manufac-
turers are trying to increase their influence.18 In this context, after-sales plays an out-
standing role, even though it is not consistently defined. In the English and German
literature the term is variously described as ‘after-sales service’, ‘automotive after-
market’, ‘customer support’, ‘product support’, ‘Kundendienst’ and ‘Technischer Ser-
vice’.19 An example of the very important role that after-sales plays can be observed
in the German spare part and service business, where the contract bound car deal-
ers and workshops earn over 60% of their profit with only 20% turnover share.20
In addition, the after-sales business is considered to be relatively independent of
economic trends,21 thus in the automotive industry it is seen as a critical success fac-
tor.22 The high relevance is also well represented by the following studies.
• Increasing customer satisfaction and brand loyalty 23
• Achieving competitive advantage and differentiation 24 15 Cf. Baader et al. (2006), p. 3. Confirmed by other authors such as Goffin (1999), p. 390; Wise/
Baumgartner (1999), p. 134; Cavalieri et al. (2007), p. 437. 16 Cf. Diez (2009), p. 109; assessment of Chapter 2.1, Automotive Marketing. 17 Hereafter referred to as Laakmann (1995), pp. 1 ff. 18 Cf. Diez (2009), pp. 19 f./162/177; Reichhuber (2010), pp. 89/103; Saccani et al. (2006), p. 262;
Becker (2007), pp. 87/123 ff. 19 Cf. Hättich (2009), p. 1; Goffin (1999), p. 374. 20 Cf. Diez (2009), p. 176; Hättich (2009), pp. 2 f.; n. a. (2013b), Finanzkennzahlen 2012. 21 Cf. Zollikofer-Schwarz (1999), p. 31; Diez (2009), pp. 22 f.; Loukmidis/Luczak (2006), p. 251; Hättich
(2009), pp. 44 f.; Baader et al. (2006), p. 4. 22 Cf. Hättich (2009), pp. 2 f. 23 Cf. ibidem, pp. 1 ff.; Hünecke (2012), pp. 1 ff.; Saccani et al. (2006), pp. 1 ff.; Huber/Herrman (2001),
p. 118.
Introduction
4
• Feedback function for product improvement and development 25
• Supporting optimisation processes 26
• Promoting sales of the core product and general marketing support 27
• Increasing brand image28
• As a useful customer contact point
The points mentioned above with regard to the automotive market in China and after-
sales business are very important for corporate success. However, considering the
two together is virtually non-existent in automotive after-sales marketing, despite the
indicated need for research in this area to gain a better scientific understanding.
The Significance of Culturally Adapted After-sales Marketing in China
It is undisputed that China holds a promising future for German car sales. Neverthe-
less, there are increasing indications that the existing foundation needs to be ex-
panded to gain a deeper understanding of after-sales activities in China and to opti-
mise them using scientific methods. As in China, the government supports the do-
mestic car industry with public buying restraints and ‘buy local’ policies.29 The poten-
tial effectiveness of such activities becomes apparent as follows. According to esti-
mates from 2010 the government bought 4.5% of all new cars (measured by ex-
penditures).30 Furthermore, most of the cars sold by German manufacturers are
mainly in the metropolitan areas of Eastern China. The rural areas remain poorly
penetrated due to the low income levels there. Contrary to the past, market expan-
sion in Central and Western China could be rather difficult for the German OEMs, al-
so because of their premium orientation.31 Sometimes, the government intervenes
heavily in the market in order to take measures against environmental pollution and
traffic congestion. For instance, car permits in Beijing, Shanghai and Canton have
24 Cf. Asugman et al. (1997), pp. 1 ff.; Gallagher et al. (2005), pp. 1 ff.; Goffin (2001, 1999), pp. 1 ff.;
Hull/Cox (1994), pp. 1 ff. 25 Cf. Cohen/Whang (1997), pp. 1 ff.; Saccani et al. (2006), pp. 1 ff.; Taifi/Passiante (2012), pp. 1 ff. 26 Cf. Saccani et al. (2006), pp. 1 ff. 27 Cf. Gallager et al. (2005), pp. 1 ff.; Wise/Baumgartner (1999), pp. 1 ff. 28 Cf. Saccani et al. (2006), pp. 1 ff.; Cavalieri et al. (2007), p. 437 ff.; Gallagher et al. (2005), pp. 1 ff. 29 Cf. n. a. (2012b), Foreign cars may be shut out of govt fleet; Sopha (2012), p. 98; Wang (2011),
p. 103. 30 Cf. n. a. (2013c), Chinese officials favor Audis despite government’s buy-local policy. 31 Cf. Doll et al. (2013), Chinas Autos auf dem Weg nach Westen; Reichhuber (2010), pp. 54 ff.

Status Quo and Problem Statement
5
been restricted.32 In 2011, the China Daily reported that car sales in Beijing had de-
creased by more than 50% as a result of these governmental measures. Dealerships
therefore had to adjust their business strategies inevitably.33 One year later, with a
92% share of profit, car dealers are still extremely dependent on new sales. Com-
pared to the US, where this share is about 15%, this illustrates possible changes.34
Bill Underrinner, Chairman of the National Automobile Dealers Association, said that
‘The [Chinese] dealers have to come up with after-sales services. (...) They need to
learn how to sell the other parts of the dealership they are not selling today.’35
If the German OEMs still want to use the potential of the entire market successfully,
they will probably have to change their primary sales orientation. In addition, they will
need to take into account the aforementioned developments through appropriate af-
ter-sales marketing. First, this should be done to secure their global position, and se-
cond to achieve a leading role in what will very likely be a strongly growing36 Chinese
after-sales market.
To do this however, scientific findings can only be used to a limited extent since the
after-sales success factors with respect to German car manufacturers in China have
not been researched sufficiently.37 Nevertheless, branch specialist DIEZ (2012) has
revealed the obvious need ‘An important reason for the success of their globalisation
strategies has been the increased willingness of German manufacturers to suit their
products to the specific needs of the markets in each country. For many years, a lack
of flexibility in this area has reduced opportunities for expansion’.38 This mistake must
not be made again in the area of after-sales. However, the status quo is exactly the
cause of concern; so workshops are regarded as less qualified and repair standards
are highly in need of improvement. For example, a common criticism often made by
32 Cf. Doll et al. (2013), Chinas Autos auf dem Weg nach Westen; Jen-Kai (2011), pp. 5 f.; n. a.
(2012g), Mercedes strauchelt auf Chinas Automarkt; Barthel et al. (2010), p. 10; Arthur D. Little (n. a.) (2011), p. 2.
33 Cf. n. a. (2011a), Bejing dealers shift focus from new car sales. 34 Cf. n. a. (2012a), Dealerships too dependent on new car sales for profits, study says. 35 Underrinner cited in: n. a. (2012a), Dealerships too dependent on new car sales, study says. 36 Cf. Wise/Baumgartner (1999), p. 134; Cohen et al. (2006), p. 129; Shuqin/Gang (2012), p. 175;
Mohr et al. (2013), p. 9. 37 Cf. Wang (2011), p. 100; Chapter 1.3, Identification of a Research Gap. 38 Diez (2012), p. 116.
Introduction
6
Chinese drivers is the poor workshop service.39 Likewise, in the automotive sector,
the Customer Service Index (CSI) shows that the after-sales performance of Japa-
nese and French OEM´s ranked higher than that of German companies.40
To make things worse, in both science and practice, it is argued that the cultural fac-
tors in China have not been sufficiently considered,41 a situation that could result in
prohibition if it is not treated with the necessary respect. One example of this is a
global ad campaign for Nike that was not culturally adapted.42 Thus, it could be as-
sumed that the principles of intercultural marketing are often neglected in market cul-
tivation. This is a factor that should receive special attention with regard to services
because they cannot be provided without the involvement of the customer.43
In addition, if, for example, a repair is to be made on a vehicle, it is usually assumed
that the driver will bring it to the workshop and explain the problem. THALHOFER
(2003) describes this kind of interaction as a stress situation between staff and cus-
tomer, which has a strong influence on customer satisfaction.44 Furthermore, it is
known that different buyers have very different (service) needs even if they use the
same exact product or service. Therefore, the person becomes part of the service
creation process.45 This is why it is important for an organisation to be customer ori-
ented46 and for the after-sales marketing of the global players to be properly estab-
lished. This also means that it has to be culturally adapted, because culture influ-
ences the service perception as ZHANG ET AL. (2008) determine.47
However, it should be noted that both from a scientific and practical point of view, the
high relevance of after-sales service and the Chinese automobile market is generally
recognised. But, both of these areas together, especially with regard to intercultural
adaptation considerations apparently still continue to be ignored. A scientific problem 39 Cf. Joas (2009), p. 157. 40 Cf. n. a. (2012d), After-Sales Dealer Service Satisfaction in China Plateaus After Six Consecutive
Years of Increases; Sopha (2012), pp. 108 ff. 41 Cf. Doctoroff (2005), p. 2; Hoffmeister (2011), p. 140; Moser et al. (2011), pp. 102 f. 42 Cf. Köll (2009), p. 9. 43 Cf. Mann (1998), p. 43; Meffert/Bruhn (2009), p. 42; Corsten/Gössinger (2007), p. 27. 44 Cf. Thalhofer (2003), p. 61. 45 Cf. Cohen et al. (2006), p. 132; Edvardsson et al. (2011), p. 328 46 Cf. Meffert/Bruhn (2009), p. 42. 47 Cf. Zhang et al. (2008), pp. 211 ff.

Exploratory Pre-Investigation as Relevance Rationalisation, Concretisation and Possible Addition of Topic-Choice
7
statement can be formulated from this because the effect of cultural differences on
service demand has not been researched sufficiently. Consequently, the actual suc-
cess factors are also unknown. Another aspect to bear in mind is that the manage-
ment decisions made by OEMs are too often aligned with internal criteria. An accu-
rate knowledge of Chinese customer structures and behavioural patterns could be
helpful in this regard to actively shape the development of the after-sales market in
China in the most advantageous way. Similarly, this could help to increase the manu-
facturer’s value added share of the entire product life cycle. This decreases rapidly
over time, as seen with a OEM in the German market where the proportion of value
added (exclusively financing and leasing) decreases from 90% to 5% in ten years.48
Since the availability of statistical data is limited in rural China and therefore not suffi-
cient for the purposes of this work, this research shall be referred to the urban China
for the following reasons: First, German manufacturers mainly sell there. Second, it is
only there that enough households own a car at all and therefore able to say some-
thing about their after-sales experience.49 Finally, in most cases the culturally specific
purchase behaviour studies are carried out there too.50 According to the National Bu-
reau of Statistics of China, 52.6% of the Chinese people live in urban areas.51
1.2 Exploratory Pre-Investigation as Relevance Rationalisation, Concretisation and Possible Addition of Topic-Choice
The status quo and problem statement indicate a scientific research need, which still
needs to be concretised, delimitated and possibly supplemented. An explorative re-
search methodology will be used for this purpose,52 which will also help to define a
precise research objective later on in Chapter 1.3. Taking an adequate cost-benefit
ratio into account an expert survey as a qualitative method is suited. This requires in-
terviewing participants who have profound knowledge and experience.53 According to
48 Cf. Diez (2009), p. 400. 49 Cf. Wang (2011), p. 104. 50 Cf. ibidem; assessment of the state of research with regard to Chinese consumer behaviour in
Chapter 2.3. 51 Cf. National Bureau of Statistics of China (n. a.) (2012): XI. Population, Living Conditions and Social
Security. 52 Cf. Koch (2012), p. 41. 53 Cf. Berekoven et al. (2009), p. 88; Koch (2012), pp. 41/262 f.

Introduction
8
that, and to an, from the problem statement derived, interdisciplinary coverage, ex-
perts are chosen (s. Table 1 below).
Expert Background – Function and Company Dr. Christin Emrich Expert for Intercultural Marketing with Prestigious China-
Expertise Lecturer for marketing management at various universities and business schools in Germany and Switzerland as well as owner of the business consultancy, Sciestat
–
Inte
rcul
tura
l Asp
ects
and
Chi
na
Niels Straub Expert for Market Research, Automotive Industry and China Owner of Institut für Marktforschung, Statistik und Prognose (IMSP) as well as author with publications concerning the automotive industry and China
Aut
omot
ive
Indu
stry
and
Mar
ketin
g
Prof. Dr. Willi Diez Expert for Automotive Industry and Marketing Professor at Hochschule für Wirtschaft und Umwelt Nürtingen-Geislingen as well as Director of the Institut für Automobilwirtschaft (IFA)
–
Dr. Holger Hättich Expert for Automotive Marketing and After-Sales; Especially Free Workshops Managing Director PV Automotive GmbH
Afte
r-sa
les
anonymised Expert for After-Sales Project Leader Boston Consulting Group –
Dr. Christian Splett-Henning
Expert for Car Dealership and After-Sales Managing Director Nordostsee-Automobile GmbH u. Co. KG authorised Mercedes-Benz Trade and Service
Aut
omot
ive
Indu
stry
and
Mar
ketin
g
Norman Radtke Expert for After-Sales at a Car Dealership Chief service manager Walter Burmester GmbH northern German Mercedes-Benz representation
Dipl.-Kfm. Hans Jürgen Wahlen
Expert for Spare Part Trade Managing Director of the general association Gesamtverband Autoteile-Handel e.V. (GVA)
Thomas Fischer Expert for the German Spare Part and Service Market Chief of the board of directors Verein Freier Ersatzteilemarkt e.V. (VREI)
Prof. Dr. Michael Zerres Expert for Marketing and Success Factor Research with a Long-Time Expertise in Automotive Marketing Professor at Universität Hamburg (em.) and Publisher of various automobile-specific research works.
Suc
cess
Fac
tor R
.
Table 1: Experts of the Exploratory Pre-Investigation
Reference: Author’s table.

Exploratory Pre-Investigation as Relevance Rationalisation, Concretisation and Possible Addition of Topic-Choice
9
The survey was carried out via e-mail or telephone depending on the availability and
preference of the participant. Amongst others, the following issues were addressed.
• Is the topic considered relevant by the expert?
• Have German manufacturers already taken up this issue specifically?
• Could the recently rapidly growing Chinese new-car market have led to under-
emphasised after-sales activities?
• Are the after-sales instruments weighty and multi-variant enough that they can
actually influence any success criteria?
• How can research take into account cultural aspects and peculiarities?
• Are there any other very important aspects that are not mentioned by the re-
searcher?
All of the experts interviewed agreed that this research is of high relevance. Whereby
towards after-sales service, especially the criteria brand loyalty as a success indica-
tor has been suggested. This will be considered in the later stages of this work, es-
pecially in the development and design of the research model.54
Additionally, various specific aspects were discussed and the insights gleaned from
these interviews are listed in the following Table 2:
54 Cf. Chapter 1.6, Course of Research.

Introduction
10
Car markets After-sales Cultural aspects in China Long-term stagnation in Euro-pean car markets
The Experiences of mature car markets show that, while the market develops, after-sales profit margins become much higher than sales profit margins
Even in Germany, Chinese cus-tomers are considered to have different needs, therefore cul-tural training is needed
The German after-sales market is overstaffed and free work-shops are growing at the ex-pense of the OEM workshops
In the past, after-sales and cus-tomer retention had no priority in China due to market penetra-tion focus
Chinese customers in Germany have exceedingly high expecta-tions
The Chinese market still has potential, but realising this only by selling might be more difficult than in the past
Low emphasis on the optimal design of an after-sales busi-ness might be a result of former high sales figures
Country of origin effects have a massive impact in China, especially the ‘Made in Germa-ny’ label
The Chinese after-sales service market is considered to be cru-cial for the future of the OEMs
Due to local market conditions, the after-sales instruments used worldwide differ greatly
Chinese culture is still a great challenge for foreigners and en-terprises
After a huge first buyer wave in China, brand loyalty will be-come very important, therefore after-sales could become the main influencer
The findings of this research are valuable as feedback to im-prove after-sales training in Germany, with the aim of serv-ing Chinese customers in the best way
Being successful in China re-quires a precise understanding of the culture as a whole as well as of the specific issues at play
After-sales marketing should be strictly aligned with the specific needs of the Chinese market
It is assumed that Chinese cus-tomers are less brand or work-shop loyal and more open- minded about non-original parts
One expert is in favour of an au-tonomous local marketing effort, another says this is a huge risk with regard to the global strate-gies and controlling needs of the OEMs
Generally, social relationships are very important, therefore customer experiences are spread through the networks of influence or ‘guanxi’55
Today, after-sales networks in China are being developed; knowing the key success fac-tors helps to develop them in line with the needs of OEMs
The Chinese often use cars within the family network, which is usually very strong related (with high involvement)
Table 2: List of Insights of the Expert Survey
Reference: Author’s table.
55 Culturally strong anchored Chinese network system of relations (social exchange) for mutual benefit.
Cf. Emrich (2007), p. 336.

Identification of a Research Gap
11
1.3 Identification of a Research Gap
To be able to identify a scientific research gap, based on the issues elaborated thus
far, the following topics have to be assessed: First, automotive marketing as a parent
frame. Second, after-sales service in general and the automobile industry in particu-
lar, as well as Chinese buying behaviour in the context of intercultural marketing. In
order to ensure the best possible overview, the comprehensive review of the detailed
state of research is shown separately in Chapter 2. Thus, the most important issues
with respect to the research gap are addressed in the following section.
Generally, it could be asserted that research has been done in each of the subject
areas mentioned above. With regard to the ‘service strategies of manufacturing com-
panies’, GEBAUER ET AL. (2012) point to the following facts and research deficits: 56
• The existing research concentrates on heavy industries, capital goods and
B2B markets
• A broader industry range needs to be investigated
• Often, the research focuses on mature, saturated western markets
• Knowledge about emerging markets is limited
• The understanding of the globalisation of the service business of multinational
manufacturers can be broadened
• The western enterprises examined ‘suffer’ from a distorted self-perception (bi-
as)57 due to the relevance of high labour costs and advanced technical exper-
tise, which could lead to a disadvantage, especially within a global context and
in terms of the qualitative methods used
According to the assessment of the state of research, the author of this work con-
firmed these points most widely. Moreover, JÖNKE (2012) emphasises the need for
further research in the area of after-sales in terms of theory and practice.58 Also the
specific view on the automobile industry shows, that one from HÄTTICH (2009) em-
phasised deficit is still of high relevance. Thus, compared to the area of sales-related
automotive marketing, research in the area of after-sales marketing is indeed lack-
56 Cf. Gebauer et al. (2012), pp. 123 ff. 57 Cf. ibidem, p. 126. 58 Cf. Jönke (2012), p. 145.
Introduction
12
ing.59 Furthermore, organisational focal points towards process and cost optimisation
dominate, as well as the limitation that primarily western markets are researched. In-
ternational approaches to the after-sales marketing of OEMs are rare. One exception
is the work of HÜNECKE (2012), who focuses on Spain, Italy and France. He specifi-
cally emphasises the great importance of further intercultural, non-European re-
search.60
ZHANG ET AL. (2008) claim that in cultural research, particularly towards service
expectations, context variety is crucial. Here, workshops are worth to be focused,
due to the customer service provider relationship.61 With regard to the still insuffi-
ciently examined China,62 it is important to point out that the availability of data is lim-
ited and that mainly the supply side was investigated in the past, despite the fact that
consumer preferences and requirements were changing quickly. In addition, (in-
ter)cultural aspects generally get little attention in the automotive industry, especially
in the area of demand and service behaviour, despite continuous claims.63 In the
case of China, however, understanding these considerable cultural differences could
be crucial for success in this huge market with its enormous after-sales potential.
A customer-oriented success factor research on the after-sales of German manufac-
turers with regard to the reference object China, was, despite great scientific and
practical relevance, not executed in any work.
1.4 Research Objective
Considering the background of the current situation, the problem statement given,
the explorative pre-investigation and the research deficit identified, the objective of
this work is to investigate theoretically and to verify empirically the determinants of
success of an after-sales within the automotive marketing, under considering cultural
influence factors. Therefore, the after-sales business of German manufacturers in the
59 Cf. Hättich (2009), p. 287. 60 Cf. Hünecke (2012), p. 174. 61 Cf. Zhang et al. (2008), p. 222. 62 Cf. Knörle (2011), p. 5. 63 Cf. Löffler/Decker (2012), p. 405; Wang (2011), p. 100; Gudergan (2010), p. 251 f.; Zhang et al.
(2008), p. 222; Gong (2003), p. 379; Asugman et al. (1997), p. 26.

Scientific Approach and Research Methodology Overview
13
important Chinese car market serves as the object of reference. Furthermore, the
construct brand loyalty will also be implemented within the theoretical model in order
to explain the success of after-sales.64
Exploring a single sector in the Chinese market helps to focus on industry-specific
aspects and to derive appropriate findings. Cross-industry meta-analytic models are
unable to achieve this.65 Moreover, limiting the investigation to urban China is neces-
sary and useful because of the considerable differences in local motorisation density
throughout the country.66
The scientific added value of this work, absolutely, puts emphasis on the acquisition
of innovative knowledge. But simultaneously it is aimed to present specific, effective
and suitable recommendations for action for automotive marketing practitioners.
1.5 Scientific Approach and Research Methodology Overview
St. Galler Management Model as a Framework for the Understanding of Science
For this work with the purpose of investigating the automobile after-sales success
factors, a framework concept will be used. This research design base frame helps to
manage the high complexity of the entire research process structurally and effectively.
In this regard, the conceptual heuristic character is of great importance because the
object of study must first be captured conceptually to understand any causal relation-
ships that may arise in the course of the investigation. In other words, heuristics pro-
vide instructions in the process of knowledge acquisition with regard to an unknown
objective.67
The basis therefore is the well-established St. Galler Management Model from UL-
RICH/KRIEG of the year 1972, which, in the context of the St. Galler school of
thought, was modified in 1991 to the St. Galler Management-Concept and more re-
64 Cf. Chapter 1.2, Exploratory Pre-Investigation as Relevance Rationalisation,
Concretisation and Possible Addition of Topic-Choice; Chapter 1.6, Course of Research. 65 Cf. Backhaus (2009), p. 99. 66 Cf. Chapter 1.1, Status Quo and Problem Statement. 67 Ref. Schwaninger (2009), pp. 53 ff.
Introduction
14
cently through RÜEGG-STÜRM to the New St. Galler Management-Model. All three
models rely on system-oriented management theory, which is co-founded by UL-
RICH.68 ‘The system approach is a perspective of management theory based on sys-
tems theory and cybernetics. Systems theory is a formal theory on the structure and
behaviour of systems (i.e. organised totalities). (…) The science of cybernetics main-
ly deals with communication and control processes in and of complex dynamic sys-
tems.’69 Using this system-thinking provides some major amenities such as holism,
interdisciplinarity, process orientation, pragmatism as well as simultaneously analytic
and synthetic thinking.70 Bottom-up on this general basis of the St. Galler under-
standing, the in Chapter 1.4 defined objective shall be achieved through a research
approach of ULRICH (amongst others 1981; 1984; 1985).71
ULRICH argues that business administration is an applied social science, which dif-
fers from basic science in its purest form.72 He understands this as a ‘management
science, which deals with the problems of organisation and control of productive so-
cial systems.’73 Thus, research in the area of business administration shall deal with
practical problems in the economy, in consideration of POPPER, for whom problems
are the first step on the way to knowledge. As a result, the practitioners thus obtain
useful knowledge as well as methods, rules and models that likewise ensure an in-
dependent, solution-oriented acting. Moreover ULRICH emphasises that in applied
business administration the creation of situational aligned design rules,74 and ‘design
models for the change of the social reality’75 are especially important.
The globally operating German manufacturers face major challenges, such as the af-
ter-sales service market in China, which is extremely important for future success.76
However, it is still unknown which factors determine this success and to what extent
they are culturally influenced. In line with the aforementioned argumentation, based 68 Cf. Schwaninger (2009), p. 60. 69 Ibidem; for further explanations s. Ulrich/Krieg (1974), pp. 11 ff. 70 Cf. Ulrich/Krieg (1974), p. 12. 71 Cf. Ulrich (1981), pp. 3 ff.; Ulrich (1984), pp. 131 ff.; Ulrich (1985), pp. 4 ff. 72 Cf. for instance Ulrich (1981), p. 3 ff. 73 Ibidem, p. 3. 74 Cf. ibidem, p. 18. 75 Ibidem, p. 11. 76 Cf. Chapter 1.1, Status Quo and Problem Statement; Chapter 1.2, Exploratory Pre-Investigation as
Relevance Rationalisation, Concretisation and Possible Addition of Topic-Choice.

Scientific Approach and Research Methodology Overview
15
on the problem statement, this work uses the application-oriented research approach
of ULRICH in a conceptual manner, thus it will be theoretically analysed and empiri-
cally tested. The investigation is therefore driven by hypotheses so that innovative
scientific findings and practical management recommendations can be derived.
In the context of this work, the use of ULRICH’s seven-phase research approach
means that: 77
1. The practical problems and a scientific research gap were identified, defined
by way of an explorative pre-investigation and addressed as an objective of
the research (s. Chapters 1.1–1.4)
2. In the second phase, problem-related theories from fundamental science of
various disciplines have to be identified and interpreted
3. The detection of problem-relevant procedures of formal science will be speci-
fied according to the objective of the investigation
4. In phase four, the relevant application context will be set up and investigated
5. Related functional assessment criteria have to be derived to develop an ap-
propriate design model, including the design rules
6. This, including all the postulated hypotheses, presented as a simplified de-
scription of the (complex) reality, will be tested empirically via customer sur-
veys and appropriate statistical evaluation methods (IT-aided)
7. Finally, the scientific findings of this research are summarised and described.
Also recommendations for action are presented and the need for further re-
search is shown
Success Factor Research
At this place, a methodological overview is given; the comprehensive discussion
takes place in Chapter 5.1.
This research work is based on the success factor research method. The fundamen-
tal assumption here is that a few influencing factors have a significant impact on the
success of firms. Thus, the cause-effect relationship of special success-critical de-
77 Cf. Ulrich (1981), pp. 17 ff.

Introduction
16
terminants is shown.78 Initially, the variables that determine success, the indicators of
success, have to be defined. Afterwards, variables are searched, which affect these
indicators, namely the success factors.79
Considering the requirements,80 and the high potential for uncovering causal struc-
tures, an indirect quantitative-confirmatory method appears to be very appropriate for
this research project. In doing so, well tested theoretical and empirical effect interde-
pendencies are verified respectively falsified using a causal analytical procedure.81
In addition, in researching the success factors of after-sales services of German au-
tomobile manufacturers in China and taking the cultural aspects into consideration, it
is particularly important that non-observable variables can occur, which are relevant
and success affecting. In this regard, these so-called latent variables are typically in-
corporated in psychological and sociological constructs. BACKHAUS ET AL. (2006)
therefore recommend the application of a structural equation model supported by sta-
tistical analysis software, like AMOS (Analysis of Moment Structures) and SPSS
(Statistical Product and Service Solutions) or PLS-software (Partial Least Squares).
This allows complex relationships with various dependent variables, multistage caus-
al relationships and non-observable (latent) variables to be examined.82
Excursus
HAENECKE (2002), as well as other authors, calls for the use of a reference
frame mainly to overcome the problem of systemising the theories that are
used to set up the hypotheses.83 Moreover, the research becomes more
transparent and possible different findings become more comprehensible.84
The symbolic reference frame, illustrated in Figure 2 below, is established
within the conceptual foundations in Chapter 4.1.
78 Cf. Haenecke (2002), p. 166; Baumgarth/Evanschitzky (2009), p. 237 f.; Schoeneberg (2011), p. 48. 79 Cf. Sass (2012), p. 23; Forsmann et al. (2004), p. 3. 80 For details s. Chapter 5.1, Success Factor Research and Structural Equation Modelling. 81 Cf. Haenecke (2002), pp. 167 ff.; Töpfer (2012), pp. 281 ff.; Schoeneberg (2011), p. 52. 82 Cf. Backhaus et al. (2006), p. 11; Töpfer (2012), p. 282. 83 Cf. Haenecke (2002), p. 174; Schoeneberg (2011), p. 52; Klarmann (2008), pp. 10 ff.; Hesse (2004),
p. 45. 84 Cf. Schoeneberg (2011), p. 60; Mayring (2002), p. 29.

Scientific Approach and Research Methodology Overview
17
Figure 2: Reference Frame
Reference: Author’s illustration referring to Schoeneberg (2011), p. 61.
The state of research, comprehensively reviewed in Chapter 2, shows the existence
of necessary prior theoretical knowledge and relevant preliminary studies so that,
taking into account important theories and conceptual basis-examination, theoretical-
ly well-founded hypotheses can be formulated. Afterwards, a causal-analytical meth-
od is used for testing the hypotheses based on the empirical data collection of stand-
ardised customer surveys. This is done using an indirect quantitative-confirmatory
method using the structural equation model.85 So far, this is undoubtedly the main fo-
cus of this work.
In the following Chapter 1.6 the chosen course of research is summarised and pre-
sented in writing and graphically.
85 Ref. Backhaus et al. (2006), p. 338.
Introduction & State of Research –
Chapter 1 & 2
After-sales Service of
German Car Manufacturers in
China as a Research Object
– Chapter 3
Reference Frame
Empirical Research & Summary of the Study –
Chapter 5 & 6
Conceptual and Theoretical Foundation – Chapter 4.
Topic 1 –
Chapter 4.1
Topic n –
Chapter 4.n

Introduction
18
1.6 Course of Research
This research project on the success factors of after-sales services of German auto-
mobile manufacturers in China began with a description of the current situation, the
status quo, and the problem statement. The high relevance of this topic could be
clearly confirmed, supplemented and concretised by an exploratory pre-investigation.
The state of research in the area of automotive marketing, after-sales services and
Chinese buying behaviour in the context of intercultural marketing shows an identifi-
able scientific research gap. Consequently, the research objective was defined and a
suitable scientific method, based on an application-oriented approach of ULRICH,
was chosen and illustrated.
Chapter 2 provides the detailed presentation of the assessed state of research.
A delimitation of the research area, as well as market analysis, and the major chal-
lenges are elaborated in Chapter 3.
In Chapter 4, the definitional and conceptual foundations for the systematisation of
this study are presented and a reference frame is established. Also, the success in-
dicators and the impact of success variables are analysed. Furthermore, basic theo-
ries are examined, the conceptual research model is established and hypotheses are
derived.
Chapter 5 describes the applicable research design and empirical testing of the hy-
potheses is carried out via software-aided processing and the analysis of statistical
data. Afterwards, the findings of the empirical study are interpreted in order to estab-
lish new scientific findings.
The entire study is summarised in Chapter 6, in which recommendations for man-
agement and the implications for further research are given. The following Figure 3
summarises the course of research outlined above.

Course of Research
19
Figure 3: Course of Study
Reference: Author’s illustration.
Chapter 1
Introduction
Chapter 3
German Car Manufacturers in China as Research Object
Chapter 5
Empirical Study to Determine Success Factors
Processing, Analysis and
Interpretation of the Empirical Findings
Chapter 6
Summary of Results, Management Implications and
Further Research Needs
Chapter 4
Conceptual and Theoretical Foundations for the Analysis of
Success Indicators and Variables as well as their Influence
System of Hypotheses
Chapter 2
State of Research


State of Research
21
2 State of Research
The identification of a deficit in research in Chapter 1.3 is derived from a comprehen-
sive literature review of the state of research, which is shown in-depth in this chapter.
The object of the investigation is primarily the after-sales and Chinese consumer be-
haviour of the topic groups, for which the automotive marketing serves to begin with
as a parent frame. Due to the German perspective, the Chinese buying behaviour is
considered in the context of intercultural marketing. As follows, each state of re-
search area is a selection according to relevance, because the intention is to com-
bine these individual areas later on in this work. Thus, there is no claim to complete-
ness.
2.1 Automotive Marketing
The intended research work comes from automotive marketing, which is a business
administration area of expertise. The industry-specific consideration within the Ger-
man scientific community has intensified since the mid-90s.86 Thereby, with numer-
ous publications, DIEZ87 and DUDENHÖFFER88 take a very popular position.
The relevant international literature on automotive marketing is mostly sales-oriented
and focusses on the market, the classic instruments of the marketing mix, the 4 Ps
(product, place, price and promotion), and brand management.
A basic overview of these topics is provided by DIEZ (2009)89 in his book on automo-
bile marketing. But a treatise as a holistic marketing concept, considering all relevant
service parameters, is not done in this by trend sales oriented work. This is apparent
through, for instance, the lack of a systematic elaboration of the marketing mix in-
86 Cf. Möhlen (2007), p. 15. 87 Director of the Institute for automotive industry (IFA – Institut für Automobilwirtschaf) and professor
at the university (HfWU – Hochschule für Wirtschaft und Umwelt) Nürtingen-Geislingen (http://ww w.ifa-info.de).
88 Professor for business administration and automotive industry at the university Duisburg-Essen as well as director of the Center for Automotive Research (CAR) (http://www.uni-due.de/ car) located there.
89 Cf. Diez (2009), pp. 1 ff.

State of Research
22
strument, ‘personnel’, which is often deemed necessary.90 For the automotive manu-
facturers DIEZ states that the downstream management, to which the service-
affected after-sales area belongs, is gaining importance steadily.91
In addition, within the German marketing publications, there are a few quite well
founded omnibus volumes such as EBEL ET AL. (Pub.) (2004). Here we should take
note of the publisher’s critique, that often the technological orientation weighs more
than the customer orientation.92 GOTTSCHALK/KALMBACH (Pub.) (2007) complain
about a mostly non-holistic consideration of the automobile industry, which is why
amongst industry challenges and case studies, management recommendations are
shown here.93 The basic principles, structural characteristics and design parameters
of the German automotive industry are described by DIEZ ET AL. (Pub.), now in its
fifth edition from 2012.94 Here the globalisation challenges of OEMs as well as im-
portant growth markets like China are preliminarily outlined. This is a task area which
HÜNERBERG ET AL. have already been dedicated to since 1995, focussing on the
international automotive marketing.95 With regard to this global context DIEZ (2012)
recently examined the international competitiveness of the German automobile in-
dustry by means of the indicators of production, sales (market share) and profitabil-
ity.96 DIEZ argues, however, that an empirical coverage of the industry’s competitive-
ness cannot be carried out on the basis of a closed, generally accepted model, be-
cause there is no existing theory about the international ability of competitiveness.97
The publisher ESCH (2013) is focussing on automotive marketing primarily in terms
of brand by showing up marketing strategy and technics on the basis of the manufac-
turers´ brand identity and by taking into account the needs of consumers.98
Likewise, with regard to the marketing mix, the automotive marketing is researched in
an instrument-specific way, which is why each one important research work within
90 Cf. Meffert et al. (2012), p. 22; Meffert/Bruhn (2009), pp. 243 f./358. 91 Cf. Diez (2009), pp. 19/176 f. 92 Cf. Ebel et al. (2004), p. 5. 93 Cf. Gottschalk/Kalmbach (2007), p. vi. 94 Cf. Diez et al. (2012), pp. 1 ff. 95 Cf. Hünerberg et al. (1995), pp. 1 ff. 96 Cf. Diez (2012), pp. 1 ff. 97 Cf. ibidem p. 18; Lehmann (2006), pp. 296 f. 98 Cf. Esch (2013), pp. 1 ff.

Automotive Marketing
23
the 4 Ps is shown as follows. To the price policy ZERRES (2010) analyses the effect
of price promotions against the background of the individually perceived utility of the
respective buyers. Therefore he uses two structural equation models.99 MÖHLEN´s
(2007) empirical means-end-chain study focusses the communication policy (promo-
tion) by investigating the target group of elderly people 50plus in itself and gender
specifically, with the aim of developing a suitable communication concept for premi-
um providers.100 In the area of distribution policy SPLETT-HENNING (2004) develops
exploratively, empirically, a key-account management concept for German automo-
bile dealers, which is finally evaluated through a three-round running Delphi sur-
vey.101 To what extent the brand, as part of the product automobile, contributes to
value creation is researched by HEIDER (2001), who considers that especially sales-
related volume increases and price premiums are opportunity-rich and enforcea-
ble.102 Furthermore, value drivers of the brand-strength are identified and financially
assessed, so that their cash flow impact could be shown. Finally, the brand value can
thus be managed as one part of corporate strategy.103
VERHOEF ET AL. (2007) examine in the Dutch automobile market the relation and
correlation between dealer- and brand retention considering especially the moderat-
ing variable kind of brand. Here they distinguish between ‘economy brand’, ‘volume
brand’ and ‘prestige brand’. Their study proves empirically that through recent repur-
chases the dealer retention merely exerts a significant impact on brand retention only
if the dealer is selling brands of the volume segment. Thus the brand tier works as a
moderator.104 An important limitation is however, that Dutch dealerships are mostly
based on a mono-brand sales structure,105 a major difference from the often seen
multi-brand trade, such as exists in the US and Germany.
Finally, the theoretical-conceptual contribution by REICHHUBER (2010) will be em-
phasised, which aims at a scientific and integrated holistic consideration of strategy
99 Cf. Zerres (2010), pp. 1 ff. 100 Cf. Möhlen (2007), pp. 1 ff. 101 Cf. Splett-Henning (2004), pp. 1 ff. 102 Cf. Heider (2001), p. 219. 103 Cf. ibidem, pp. 8 ff./219 ff. 104 Cf. Verhoef et al. (2007), pp. 97 ff./110. 105 Cf. ibidem, p. 98.

State of Research
24
and organisation in the automotive industry,106 the ‘new revolutionary break (...): a
transition from a functional, proprietary added-value structure to one that is driven by
competencies (..)‘107 as well as providing a future outlook.
2.2 After-Sales
Automobile Specific After-sales Research
In the automotive industry after-sales is the subarea within the value chain that de-
scribes the performances of the post purchase phase (‘after sales’) and thereby it
does not concern the activities before the purchase (‘pre sales’) as well as during the
purchase (‘at/in sale’).108 As SASS (2012) summarises, the expression after-sales is,
within the established literature, ‘(...) used primarily temporal for the service perfor-
mance phase after purchase, and the services that are performed during this period
are designated after-sales services.’ 109 In general and in the specific context of the
automotive industry, after-sales services are subsumed under both car-related per-
formance in kind such as spare-parts, as well as services, such as repairs.110 Such
services have the ability to reduce possible problems with the use of the car and to
support the utilisation phase, in which the consumer experience could even be im-
proved.111
Unlike automotive marketing, which because of its product orientation is to be as-
signed to consumer goods marketing (commodity car),112 after-sales or after-sales
marketing is to be assigned primarily to services marketing (here: consumption-
related secondary services of automobile manufacturers).113 These areas are not
completely mutually exclusive, but overlap.114 An independent consideration of auto-
motive after-sales appears relevant and particularly important, because the mainte-
nance and repairs services, which are necessarily provided after the sale, belong to 106 Cf. Reichhuber (2010), pp. 1 ff. 107 Ibidem, p. 213. 108 Cf. Mann (1995), p. 447. 109 Sass (2012), p. 14. 110 Cf. Hättich (2009), pp. 34 f.; Saccani et al. (2007), p. 54; Goffin/New (2001), pp. 275 f. 111 Cf. Asugman et al. (1997), p. 12. 112 Cf. Meffert et al. (2012), p. 29. 113 Cf. Meffert/Bruhn (2009), p. 14. 114 Cf. ibidem, pp. 5/15.

After-Sales
25
the so-called must-services.115 In order to select relevant literature, this state of af-
fairs is taken into account below. It is started by examining to what extent the topic of
after-sales is been considered automotive industry inherent.
Already in 1995 the relevance of a market-oriented, service management covering all
purchase phases was emphasised in the omnibus volume of HÜNERBERG ET AL.,
in what MANN (1995) shows the basic service policy principles. 116 Afterwards
CANVIN/SCHINKEL (1995) addressed the changing after-sales service industry, es-
pecially from the suppliers’ perspective, with regard to the areas: kind of workshop,
technological progress, and international market differences.117
According to DIEZ (2009), the car as a physical product still captures a dominating
position in the OEM´s market performance policy. However, he observes a steadily
increasing importance of the value-added services and thus also of after-sales ser-
vices, which he considers to be of extremely high importance.118 Furthermore, he
emphasises the relevance as an independent source of income of the automobile
manufacturers and refers thereby in particular to the parts business. Finally, he ad-
dresses basic optimisation needs within the after-sales area, especially the dimen-
sions of quality, customer satisfaction, communication and costs.119
Following up on the previously mentioned issues, one of the studies of DIEZ (2010)
deals with the after-sales market in Germany, for which he predicts a sustainable
process of consolidation. Thus, among others, significant trends are the increasing
importance of intermediaries, the polarisation of customer worlds, the connected car
and e-mobility. DIEZ concludes that OEMs and their contract partners are increasing-
ly losing the first buyer contact, which means their market position is endangered,
and that this is a development which intermediaries, especially, can benefit from.120
115 Cf. Diez (2009), p. 164. 116 Cf. Mann (1995), pp. 443 ff. 117 Cf. Canvin/Schinckel (1995), pp. 475 ff. 118 Cf. Diez (2009), pp. 109/162. 119 Cf. ibidem, pp. 176 ff. 120 Cf. Diez (2010), pp. 1 ff.

State of Research
26
DUDENHÖFFER ET AL. (2005) argue in a study of the automobile sales that the
service and spare-part business is a central field of action for dealership manage-
ment. The illustrated strategic success factors, broad service spectrum, workshop
price differentiation and a high corporate customer share, show, contrary to cost-,
structural- and process-related success factors, a relationship with necessary after-
sales marketing, which may need to be initiated by the manufacturers.121
The study called ’fascination service’ by DIEZ/REINDL (2005) focusses on the ser-
vice and after-sales service area within the German car industry. The authors discuss
changing customer needs as well as the adaption tools that the workshops will need
as a result of these needs.122 Important results are, amongst others, that price
awareness continues to rise and that a price marketing aligned with it promises suc-
cess; the target groups need to be handled in a more differentiated way and the un-
derstanding of them has to be more in-depth; the German market volume is likely to
shrink until 2020; and despite that, two thirds of dealer profits are earned through af-
ter-sales.123
On the basis of 1,083 online interviews, MERTEN (2012) queries the customer be-
haviour of German private and business customers. For the segments of private cus-
tomer, self-deciding employees with a business car (the ‘user chooser’), freelancer
and commercial customers with less than 15 vehicles and without a frame-contract
(the ’small commercials’), and fleet customers with more than 20 vehicles, the follow-
ing categories are examined: workshop loyalty, information channels, customer re-
quirements and fulfilments as well as dialogue-reception. In this connection it is re-
markable that corporate customers, the target group with the highest workshop fre-
quency and the lowest price sensibility, feel worst supported.124 The after-sales po-
tential as a result of the purchase of a used car are described by MERTEN (2011) in
an additional study, for which sellers, service consultants and used car buyers have
been interviewed. From a customer perspective it shows that one out of five is willing
to change workshop, that brand-workshop customers generally have higher expecta-
tions, and that basically the potential of the after-sales business could be lifted, in- 121 Cf. Dudenhöffer et al. (2005), pp. 13 ff. 122 Cf. Diez/Reindl (2005a), pp. 1ff. 123 Cf. ibidem, pp. 8 f. 124 Cf. Merten (2012), p. 36.

After-Sales
27
cluding for the reason that after-sales services such as mobility packages are not of-
fered enough at the point of sale or point of service.125
HECKER ET AL. (2012) published a multilayer management handbook about after-
sales in the automotive industry. This practical manual takes account of consumer-
focused aspects, such as the emotionalisation of services from the perspective of
brain research.126
HÄTTICH’s (2009) dissertation develops a holistic after-sales marketing concept to
the manufacturers’ initiated increase in customer retention and brand loyalty for the
German automobile dealership. It is empirically based on a workshop customer sur-
vey and a workshop survey, evaluated through a Delphi-survey in order to assess the
elaborated concept. Moreover it is summarised and assessed in a comprehensive
meta conclusion according to the success impact.127 The results of this convincing
mixed-methods approach therefore contribute to a deeper understanding of the suc-
cess factors of after-sales. Thus for instance, responsible managers can check if the
relevance of switching barriers and relationship marketing is taken into account, and
if the after-sales marketing objectives are sufficiently adjusted across the companies`
departments.128
HÜNECKE (2012) is also dedicated to automotive loyalty research. He measures, via
a PLS path modelling verified analysis model, in the markets of France, Italy and
Spain, the relationship between customer satisfaction and brand loyalty among 1,500
premium car customers.129 As an important result he finds, ‘(…), that in no market
does customer satisfaction with service have a direct influence on brand loyalty. It is
only through the mediator of service loyalty that customer satisfaction with service
exerts an indirect influence on brand loyalty.’130 What is remarkable is that the deter-
mining factors can differ even in very culturally similar, geographically close markets.
In France, for instance, the biggest driver in automotive service quality is the friendli-
125 Cf. Merten (2011), p. 23 ff. 126 Cf. Hecker et al. (2012), p. 1 ff. 127 Cf. Hättich (2009), p. 1 ff. 128 Cf. ibidem, p. 286. 129 Cf. Hünecke (2012), p. 1 ff. 130 Ibidem, p. 4.

State of Research
28
ness of the staff, whereas in Italy and in Spain, this is insignificant. In the latter coun-
tries, however, the level of professionalism is most valued.131 The data collection in
three Latin-European countries with relatively similar cultures has the consequence
that a transfer of this knowledge to other countries is not permitted and thus repre-
sents a limitation in terms of generalisation.132
Likewise, the international business consultancy BAIN & CO. (2008) has surveyed
more than 1,800 car customers to examine after-sales service impact as one aspect
of customer retention and brand loyalty development. To assess brand loyalty the
Net Promoter Score (NPS) is used. Here, on a scale from zero to ten, customers rate
how likely they are to recommend their vehicle. Afterwards the NPS is calculated by
subtracting the percentage of customers who give a score of six or less (‘detractors’)
from the percentage of customers who give a nine or ten (‘promoters’).133 This pro-
duces the important insight that, ‘high among the factors that create promoters – and
help sustain their loyalty – is a strong after-sales service experience.’134
BLOEMER/PAUWELS (1998) still have to be mentioned. They explore the relation
between various satisfaction and loyalty constructs within the automotive industry.135
In their model they represent amongst other things the indirect impact of after-sales
satisfaction as well as the direct impact of the dealer after-sales loyalty on brand loy-
alty.136 This topic is complemented by LILJANDER/ROOS (2002) as they analyse
from the customer’s perspective, qualitatively, whether customer relations with the
automotive dealers and respectively to the after-sales service are real or unreal.
Thereby they emphasise for instance that the after-sales retention is high when it
comes to actual behaviour. Emotional retention, however, is relatively low.137
SHUQUIN/GANG (2012) analyse the automotive consumer-based after-sales service
industry (n=327), by using a structural equation model. Here they investigate the im-
pact of service quality on relationship quality with its three dimensions of satisfaction, 131 Cf. ibidem, p. 147. 132 Cf. ibidem, p. 173. 133 Cf. Flees/Senturia (2008), After-Sales Service Key to Retaining Car Buyers. 134 Ibidem. 135 Cf. Bloemer/Pauwels (1998), pp. 78 ff. 136 Cf. ibidem, p. 81. 137 Cf. Liljander/Roos (2002), pp. 603/609.

After-Sales
29
trust and commitment, and finally the impacts on the construct, relationship value,
whereas only trust does not have a significant direct influence on relationship val-
ue.138
ESCH ET AL. (2012) examine the success of automobile brands – due to the triangu-
lar relationship between brand strength, customer retention and service quality – by
surveying the customers’ perception of utility to reflect explicitly the customer`s point
of view. Utility and service experience are analysed as well with regard to auto brand
and dealer. In the context of after-sales it is to be emphasised that the general esti-
mation of brand quality significantly influences the perception of service quality, and
that the responsibility of service is seen primarily as that of the dealer. However, the
higher the brand strength, the more the service responsibility shifts towards the man-
ufacturer.139
How the manufacturer-dealer relation has changed since the EU enacted Regulation
(EC) No. 1400/2002, is researched in BODENSTEINER´s (2006) dissertation on cus-
tomer retention in contract-marketing systems, which explicitly attracts the spare-part
market of the automotive industry as a research object.140 An overview of the struc-
ture of the German automotive industry, including the after-sales areas car mainte-
nance and customer service behaviour, is provided in the DAT-report.141
In a combined consideration of sales and after-sales, BLANCHET/RADE (2007)
show the industry challenges, to maximise the value of the automotive life cycle.142
According to their analysis, the European area is characterised by a high complexity
and diversity of markets, drivers and customer habits, which leads to a mutual de-
pendency of central actors. As a result, neither OEMs, big dealer chains and finance
or insurance groups nor professional buyers have the needed market power to domi-
nate the whole life cycle. But in the emerging markets, premium manufacturers have
a chance to monetarise the automobile life cycle more strongly, if they force the verti-
138 Cf. Shuqin/Gang (2012), p. 175 ff. 139 Cf. Esch et al. (2012), p. 1 ff. 140 Cf. Bodensteiner (2006), p. 1 ff. 141 Report of the DAT (Deutsche Automobil Treuhand GmbH); available online at www.dat.de. 142 Cf. Blanchet/Rade (2007), pp. 171 ff.

State of Research
30
cal integration via their own branches.143 The background to this is the vehicles’ high
degree of complexity and their repairs, which small, independent workshops usually
cannot cope with.144
In a case study for the northern American brand, Saturn, COHEN ET AL. (2000) de-
scribe what is in their opinion an exemplary spare-part delivery concept. Here they
show how the alignment towards the customer need for speed, combined with a ho-
listic net-structure of all Saturn dealers, optimises the spare-part logistics for both
manufacturers and dealers.145
The automobile-specific after-sales supply chain optimisation is furthermore a fairly
widely discussed subject in the scientific literature. Because of its primarily organ-
isational focus, it is not dealt with here. For more on this topic, please refer to the fol-
lowing authors: BRUNNERMEIER/MARTIN (2002); 146 DORAN (2004); 147 GUN-
ASEKARAN (2008);148 KIM ET AL. (2007);149 KÜHLWEIN ET AL. (1999);150 MA-
KRIS/CHRYSSOLOURIS (2013);151 MEYR (2004);152 SÁNCHEZ/PÉREZ (2005);153
TOWILL ET AL. (2002);154 ZILLING (2006).155
Regarding the previously mentioned supply-chain issue one work from GAIARDELLI
ET AL. (2006) will be emphasised exceptionally. Here the authors propose an inte-
grated framework in order to measure the after-sales performance of the whole net-
work (authorised channels). The empirical application is carried out via two case
studies, simultaneously the works’ biggest limitation, of automotive companies and
their official service network.156 Thereby, within their performance measurements,
143 Cf. ibidem, pp. 213 ff. 144 Cf. ibidem, p. 211; Jönke (2012), p. 6. 145 Cf. Cohen et al. (2000), pp. 93 ff. 146 Cf. Brunnermeier/Martin (2002), pp. 71 ff. 147 Cf. Doran (2004), p. 102. 148 Cf. Gunasekaran (2008), pp. 549 ff. 149 Cf. Kim et al. (2007), pp. 1843. 150 Cf. Kühlwein et al. (1999), pp. 16 ff. 151 Cf. Makris/Chryssolouris (2013), pp. 2077 ff. 152 Cf. Meyr (2004), pp. 447. 153 Cf. Sánchez/Pérez (2005), pp. 681. 154 Cf. Towill et al. (2002), pp. 79 ff. 155 Cf. Zilling (2006), pp. 1 ff. 156 Cf. Gaiardelli et al. (2007), pp. 698 ff.

After-Sales
31
one of the companies focusses on the customer loyalty of the dealer network,157 but
brand loyalty seems to be ignored. Moreover the research of SACCANI ET AL.
(2006) is strongly related to this topic. They investigate empirically the role of after-
sales services in three durable consumer goods industries, and they also investigate
the related performance measurement systems.158 Generally they conclude that, ‘the
automotive industry appears to be the most advanced in terms of after-sales perfor-
mance measurement systems, in terms of their structure, reliability and exploitation
of the information gathered, due partly to higher information integration between
manufacturers and dealers.’159 Furthermore the research shows that volume oriented
manufacturers have a profitability focus on after-sales services. In contrast, premium
vendors tend to focus on aspects such as customer retention and company image to
differentiate within the competition.160
DIRLENBACH (2009), using a mixed-methods approach, analyses the success fac-
tors of after-sales service innovations in automotive management.161 In this context,
an article by GOFFIN/NEW (2001) will also be emphasised, where some years be-
fore the role and relevance of customer support is considered in the course of new
product developments. The authors thereby confirm the assumed, great importance
of this aspect and thus refer to the managements` need, to ensure an appropriate re-
source allocation in this regard.162
DOMBROWSKI ET AL. (2011) look ahead to the automotive spare part market to-
wards the year 2030, with their contribution, ‘Scenario Management for Sustainable
Strategy Development in the Automotive Aftermarket’. Using a five-phase scenario-
management method, according to GAUSEMEIER they analyse the four fields of
economy, business environment, technology and stakeholders.163 In total they por-
tray three extreme scenarios, in order to enable industry representatives to anticipate
157 Cf. ibidem p. 704. 158 Cf. Saccani et al. (2006), p. 259. 159 Ibidem, p. 280. 160 Cf. ibidem, p. 278. 161 Cf. Dirlenbach (2009), pp. 1 ff. 162 Cf. Goffin/New (2001), pp. 275 ff. 163 Cf. Dombrowski et al. (2011), pp. 285.

State of Research
32
the most relevant developments. Likewise required actions can be implemented in
the enterprise strategy if there is a need.164
Directly related to the object of research, seven compact articles – published in the
omnibus volume, BusinessFocus China: Automotive Industry (2009) – address the
Chinese after-sales market. They deal with focal points such as the automotive in-
surance market, which the authors discuss against the background of their corporate
activity. Likewise, this publication provides basical data for the Peoples Republic of
China, an automobile market overview, the illustration of relevant framework condi-
tions, as well as explanations on the areas of marketing, sales, the suppliers industry,
commercial vehicles and environment. 165
The previously mentioned state of research documents that there is no comprehen-
sive scientific consideration of after-sales for the automotive industry. Furthermore,
the main focus of this research work is only taken into account partly in a few ap-
proaches, which is why general after-sales research will be shown below.
Supplements from General After-Sales Research
A historical review shows that after-sales service in the manufacturing industry was
initially mainly regarded as a sales-enhancing accessory. So for instance, LEVITT
wrote in 1972, ‘(...) customer service is not viewed by manufactures as an integral
part of what the customer buys, but as something peripheral to landing the sale.’166 In
1983 it is again LEVITT who emphasises the relevance of ‘customer service’, mark-
ing the beginning of emerging research into service in general and after-sales ser-
vices in particular. Beyond that, in his article, ‘After the sale is over..’, he campaigns
strongly for active relationship management and for a deeper understanding of the
customer needs after the sale.167 ‘It is not a matter of just getting and then holding on
to customers. It is more a matter of giving the buyers what they want.’168 Thus the in-
creasing importance of after-sales services becomes very clear in this context. Alt-
164 Cf. ibidem, p. 289. 165 Cf. German Industry & Commerce (n. a.) (2009), pp. 1 ff. 166 Levitt (1972), p. 47. 167 Cf. Levitt (1983a), pp. 87 ff. 168 Ibidem, p. 88.

After-Sales
33
hough LEVITT draws his findings from industrial good markets, he forecasts that the
change reaches all areas, even that of fast-moving consumer goods.169
Three years later LELE refers to the strong competitive pressure within various in-
dustries in the USA,170 which is why after-sales becomes ‘(...) [a] key area for in-
vestments – a sharp contrast to its historical image (...)’.171 Building on this, LELE
(1997) provides an after-sales reference system, which allows the user to check how
high the cost of failure is to the consumer if the product fails.172
‘This is the golden age of Services, (...)’.173 In the 21st century, the great importance
of after-sales service is well known in practice and science, however, COHEN ET AL.
(2005) see a big optimisation requirement in the corporate configuration. Thus they
present, with the article ‘Winning in the aftermarket’, a six phase model called ‘Man-
aging Service Networks’. Primarily, it will contribute as a useful code of practice to
make the after-sales business more profitable, as well as effective on the one hand,
and on the other hand to increase the service quality.174
In an omnibus volume published by BARKAWI ET AL. (2006), the after-sales service
business is addressed in a comprehensive and multi-layered way by various authors
from science and industry, in seven topic complexes: market development, business
strategies, development and marketing of product supporting services, the so-called
service engineering, service supply chain management, spare-parts management,
outsourcing and collaboration with suppliers as well as technology and innovative
business models.175 Additionally, a management handbook by BROCK (2009) can be
consulted on the areas of cost optimisation, customer satisfaction, and repurchas-
es.176
169 Cf. ibidem, p. 89. 170 Cf. Lele (1986), pp. 63 ff. 171 Ibidem, p. 63. 172 Cf. Lele (1997), pp. 141 ff. 173 Cohen et al. (2006), p. 129. 174 Cf. ibidem, pp. 129 ff. 175 Cf. Barkawi et al. (2006), pp 1 ff. 176 Cf. Brock (2009), pp. 1 ff.

State of Research
34
BAUMBACH (2004) focusses on the question of how after-sales service can become
a strategic success position. To do this he develops an integrated after-sales man-
agement reference frame on the example of machinery and plant engineering, which
is supported by case studies, amongst other things. Moreover he researches in this
regard the organisational implementation into the company as a whole.177 This work
is the second revised edition of his dissertation writing, dating back to 1998.
In his cumulative dissertation JÖNKE (2012) picks up the theory-building of after-
sales by developing a holistic concept regarding ‘Strategies and Interfirm Relation-
ships’. This includes a three-phase model to develop spare-part logistic strategies,
the empirical identification of archetypes of relationship constellations as well as the
emergence of constellations due to firm-internal, net-internal and external determi-
nants.178
In a paper published in 2007, CAVALIERI ET AL. have aimed to contribute to a better
understanding about the general factors that influence the performance of after-sales.
Thus in order to allow enterprises to consistently design their corporate after-sales
service strategies with those performances required at operational levels within a
service chain. Therefore three industrial case studies were carried out to examine the
provision of durable consumer goods in a B2C scenario.179
Since the beginning of the 90s, various, often logistically focused papers on the after-
sales service supply chain have been published, which, as with those on the auto-
mobile specific supply chain, will be listed only for instruction.180
• Spare-part management: AMINI ET AL. (2005);181 COHEN ET AL. (2000,
1997);182 COHEN/LEE (1990)183
• Distribution channels and vertical integration aspects: NORDIN (2005);184
GOFFIN (1999);185 LOOMBA (1998, 1996);186 ARMISTEAD/CLARK (1991)187
177 Cf. Baumbach (2004), pp. 1 ff. 178 Cf. Jönke (2012), pp. 1 ff. 179 Cf. Cavalieri et al. (2007), pp. 436 ff. 180 A selection referring to Saccani et al. (2007), p. 55. 181 Cf. Amini et al. (2005), pp. 369 ff. 182 Cf. Cohen et al. (2000), pp. 93 ff.; Cohen et al. (1997), pp. 535 ff. 183 Cf. Cohen/Lee (1990), pp. 55 ff. 184 Cf. Nordin (2005), pp. 576 ff.
After-Sales
35
• Organisational structure and information technology: BRAX (2005);188
ZACKARIASSON/WILSON (2004);189 HULL/COX (1994)190
These focal points regarding SACCANI ET AL. (2007) also give a good literature and
study overview.191 Moreover they research the building of an after-sales supply chain
via case studies, by considering the parameters of degree of vertical integration, de-
gree of centralisation and decoupling business activities with regard to the producers
of durable consumer goods.192
The steadily increasing appreciation of after-sales that occurred in the past as an im-
portant contribution to business performance is accompanied by the emerging rele-
vance of services in general. To what extent this process leads the manufacturing in-
dustry towards special challenges, and what marks the eventual transition of product
to service providing enterprises, is researched extensively in particular in investment
goods marketing. The following studies encourage a deeper understanding of this
dynamic:193 BRAX (2005);194 DAVIES (2004);195 GAIARDELLI ET AL. (2008);196 GE-
BAUER ET AL. (2005);197 KAERNER ET AL. (2004);198 MATHIEU (2001);199 OLI-
VA/KALLENBERG (2003).200
Beyond that, it can be stated that many authors have made their after-sales investi-
gations in the previously mentioned investment goods sector or have specified them
based on that. A well-founded overview of the corresponding state of research is de-
185 Cf. Goffin (1999), pp. 374 ff. 186 Cf. Loomba (1998), pp. 143 ff.; Loomba (1996), pp. 4 ff. 187 Cf. Armistead/Clark (1991), pp. 111 ff. 188 Cf. Brax (2005), pp. 142 ff. 189 Cf. Zackariasson/Wilson (2004), pp.75 ff. 190 Cf. Hull/Cox (1994), pp. 115 ff. 191 Cf. Saccani et al. (2007), pp. 54 ff. 192 Cf. ibidem, pp. 52 ff. 193 Reffering to Gebauer et al. (2012), p. 128. 194 Cf. Brax (2005), pp. 142 ff. 195 Cf. Davies (2004), pp. 727 ff. 196 Cf. Gaiardelli et al. (2008), pp. 261 ff. 197 Cf. Gebauer et al. (2005), pp. 14 ff. 198 Cf. Kaerner et al. (2004), pp. 1 ff. 199 Cf. Mathieu (2001), pp. 451 ff. 200 Cf. Oliva/Kallenberg (2003), pp. 160 ff.

State of Research
36
livered by SASS (2012),201 who conducted customer-oriented success-factor re-
search in the German offset-printing-machine industry.
One paper out of the industrial after-sales research will be highlighted here, because
the implementation of cultural aspects is specifically addressed there. GUDERGAN
(2010) has developed a model that shows the indirect and moderating influences of
HOFSTEDE´s (2001) cultural dimensions (individualism/collectivism, uncertainty
avoidance, power distance)202 in regard to the adoption of technologies.203
KURATA/NAM (2010) examine, primarily game-theoretically, the competition in the
after-sales supply chain of durable goods and the resulting customer satisfaction.
Thereby two groups are considered, first the manufacturers who offer free, basic af-
ter-sales performances (mostly required by law), as for instance repair services in the
context of guarantee cases. Second, dealers who offer an additional, fee-based after-
sales service, as when manufacturers offer guarantees that supplement basic obliga-
tions.204 They assume that after-sales offers influence demand; likewise, that it is
possible that an oversaturation through too many services can occur, with the result
being that customer satisfaction could diminish or it deters interested consumer from
buying. This hypothesis is confirmed insofar as after-sales offers crafted strictly to
maximise profits in no case led to optimal customer satisfaction. 205
International Aspects
MORSCHETT ET AL. (2008) empirically investigate the choice of market entry of
German companies in the course of the internalisation of their after-sales services.
Conceptually thereby transaction, company- and country-specific variables are test-
ed.206
The article ‘The Role of After-Sales Service in International Marketing’ by ASUGMAN
ET AL. (1997) contributes, in the area of durable consumer goods, to the understand- 201 Cf. Sass (2012), pp. 13 ff. 202 Cf. Hofstede (2001), 79 ff./145 ff./209 ff. 203 Cf. Gudergan (2010), pp. 252 ff. 204 Cf. Kurata/Nam (2010), pp. 136 ff. 205 Cf. ibidem, pp. 138/144. 206 Cf. Morschett et al. (2008), pp. 525.

Chinese Consumer Behaviour in the Context of Intercultural Marketing
37
ing of the relationship between internalisation and the meaning of after-sales as well
as the performances offered. Furthermore, the moderating variables of intensity of
competition, relative product quality and ability to influence the distribution channels
are considered. The hypotheses testing basically shows that the higher the degree of
internalisation, the stronger is the perceived relevance of the after-sales offering by a
given management.207 This does not mean however, that at the same time the actual
offer is accordingly extended or improved. Thus, especially in markets with low com-
petitive intensity, there is the danger that too few resources flow into after-sales ser-
vices, although the responsible managers conceive this as strategically important. 208
The empirical survey is based on business decision makers, which is why the au-
thors refer to the need to investigate the customer perspective in the future. On the
one hand to uncover possible discrepancies towards the managers perspective, and
on the other hand to investigate how cultural aspects influence the perception of af-
ter-sales service.209
VAN BIRGELEN ET AL. (2002) examine the impact of cultural influences on the per-
ceived service quality, as well as the associated customer satisfaction. Their study
differentiates, according to the type of customer contact, between the technology
standard in traditional personal, telephone and online after-sales service.210 With re-
gard to the interpretation and to a thinkable transferability of the results towards other
industries, it should be noted that the customer group is composed only of B2B buy-
ers for office materials in industrialised Western countries. Also, it will be noted criti-
cally that the online affinity of the reference group could have changed significantly
since the survey in 2002.
2.3 Chinese Consumer Behaviour in the Context of Intercultural Marketing
Intercultural Marketing
For this research purpose this paper will have recourse to the scientific discipline of
intercultural marketing, to be able to fathom specific Chinese preferences in after-
207 Cf. Asugman et al. (1997), 11 ff. 208 Cf. ibidem, p. 23. 209 Cf. ibidem, pp. 25 f. 210 Cf. van Birgelen et al. (2002), pp. 43 ff.

State of Research
38
sales service. Thus it will be oriented towards the special features of the culture and
therefore as closely as possible towards local customer needs. As a generally ac-
cepted definition is not established yet, a possible definition is delivered,211 because
this one supports the project and shows the relevance of the approach, ’Intercultural
marketing encompasses the analysis, planning, coordination and control of all
corporate activities oriented toward the cultural conditions and influencing factors of
current and potential international markets or of the world market, regardless of the
chosen form of foreign involvement.’212 The preferred recourse of the intercultural
school will not diminish the importance of international marketing, but will set a target,
because ‘culture (..), as a significant independent variable, determines consumer
behavior’213 so that the knowledge gained through research examining demand-
oriented success factors could be strengthened; thus, concern (group)-wide efficien-
cy decisions are not focused accordingly. For a general understanding of the disci-
pline of intercultural marketing, please refer to EMRICH (2014),214 MENNICKEN
(2000)215 and MÜLLER/GELBRICH (2004).216
Historical Review and Current Relevance
To approach Chinese consumer behaviour within the intercultural context it is advis-
able, besides analysing current developments, to review historical developments of
country and culture in order to acquire an awareness of the entire relationship.
In ‘dragon flight’, BECKER/STRAUB (2007) dedicate themselves to promoting this
background knowledge, by presenting China`s history, explaining how philosophy led
the ways of thinking and the social system, deriving resultant differences from West-
ern culture, and against this background, discussing the economic and social stability
of China.217 In relation to this research, especially the book`s second part, ‘society in
change’ is of high relevance, as the following excerpt may demonstrate, ‘The differ-
entiation of various income groups and social milieus is proceeding as quickly as the
211 Cf. Emrich (2007), p. 25. 212 Cf. Mennicken (2000), p. 90. 213 Emrich (2007), p. 35. 214 Cf. ibidem; Emrich (2014), pp. 1 ff. 215 Cf. Mennicken (2000), pp. 1 ff. 216 Cf. Müller/Gelbrich (2004), pp. 1 ff. 217 Cf. Becker/Straub (2007), pp. 1 ff.

Chinese Consumer Behaviour in the Context of Intercultural Marketing
39
pluralisation of lifestyles and values. The [Chinese] social structure, consensus-
oriented and geared towards collectivism, is increasingly confronted with the orienta-
tion of Western industrial societies toward individualistic values, which stands in stark
contrast to basic traditional Confucian attitudes.’218 A detailed historical explanatory
statement on the consumer culture of China is also provided by GERTH (2003), who
analysis particularly the dichotomy of the unfolding forces of nationalism and materi-
alism.219 Also GERTH (2011) describes the way the Chinese emulate American con-
sumer behaviour.220
The high relevance of China-specific marketing is likewise expressed clearly through
the recently published academic journal, ‘International Journal of China Marketing’.
The publishers refer explicitly to the adaption need of the marketing and namely as
well to the automotive industry.221 Furthermore an automobile specific analysis of the
Chinese motor vehicle market can be taken from the Chapter 3.2 of the omnibus vol-
ume BusinessFocus China – automotive industry. 222 Moreover, for a continuative
consideration of current China as well as the complex, economic, political and social
developments, the publications of the German Institute of Global and Area Studies
(GIGA) are reffered;223 here in particular the freely accessible Journal of Current Chi-
nese Affairs.224
Consume in China – Structure, Segments and Market Cultivation
How multinational companies could take advantage of global marketing strategies in
emerging markets is researched by CUI/LIU (2001) using the example of China, in
which notably the heterogeneity of market segments is shown.225 Due to the enor-
mously fast change, the specific findings, based on the year 1997, are no longer up-
218 Ibidem (2007), p. XIII. 219 Cf. Gerth (2003), pp. 1 ff. 220 Cf. Gerth (2011), pp. 1 ff. 221 Cf. Tian/Rhee (2010), p. 11. 222 Cf. German Industry & Commerce (n. a.) (2009), pp. 1 ff. 223 Information about GIGA is available online at http://www.giga-hamburg.de. 224 The Journal of Current Chinese Affairs ist is available online at http://hup.sub.uni-hamburg.de/giga/j
cca/index. 225 Cf. Cui/Liu (2001), pp. 84 ff.

State of Research
40
to-date, but the basic knowledge that standardised products and global brands are
not sufficient to exploit the full market potential,226 appears, as before, highly relevant.
DEVAN ET AL. (2009) discuss the structural characteristics of private domestic con-
sumption, especially those conditions that led to a China that, based on GDP, has a
very low consumption ratio. This ratio in fact decreased from 1990 to 2009 by around
15%. With regard to consumer behaviour, it will be emphasised that the average
household`s saving rate of spendable income is quite high at 25% – in fact 15%
higher than the Asian average. Beyond that consumers are cautious when it comes
to borrowing in order to buy the high-quality products available to them.227
MC EWEN ET AL. (2006) examine the Chinese from two perspectives, the worker
and the consumer. They show on the consumer side that incomes are rising continu-
ously, but the mass of people cannot buy what they really want. Only the group of the
rich city inhabitants already has several of the most popular consumer goods, so that
here repurchases and extensions could be of interest. In the automotive area, how-
ever, first-time purchases dominate. The authors argue that in consumer durables
marketing it has to be considered that it is not all about satisfying needs, rather con-
sumers expect a good and target-group-appropriate design as well as faultless per-
formance. 228
SUN/WU (2004) survey 5,584 Chinese consumers, based on a stratified random
sample, in order to investigate the impacts of economic developments on various
lifestyles. They show that the consumption patterns of rural people differ greatly from
those of urban people.229 This is true for every part of the marketing mix. For instance,
the rural population is more price conscious, less tied to brands and less exposed to
mass media advertising. In addition they use other retail channels than urban dwell-
ers, which, in 2004, had nearly three times the disposable income.230 In 2012 this ra-
tio, with a factor of 3.1, was almost equal.231
226 Cf. ibidem, p. 99. 227 Cf. Devane et al. (2009), pp. 1 ff. 228 Cf. McEwen et al. (2006), pp. 68 ff. 229 Cf. Sun/Wu (2004), pp. 245 ff. 230 Cf. ibidem, p. 253. 231 Own calculations based on n. a. (2012e), XI. Population, Living Conditions and Social Security.

Chinese Consumer Behaviour in the Context of Intercultural Marketing
41
The segment of luxury goods is researched by SAIDI ET AL. (2010) by using a litera-
ture analysis, in order to discover what is different about people who own a great
deal of capital, the so-called high-net-worth individuals (HNWIs).232 The authors refer
to the fact that this Chinese target group strongly differs from both Western and other
Far-Eastern HNWIs. Moreover, all of society in China is subject to fast changes. ‘The
Confucian background, socialist political system, frugal-value oriented collective so-
ciety and the rapid economic growth are influencing permanent changes in societal
pre-existent values.’233 Summing up, they recommend adjusting marketing strategies
to local conditions and especially strengthening brand awareness. As well it is nota-
ble that luxury goods in China do not necessarily have to be perceived as rare, rather
they always will contain, in addition to their prestige function, a utility function.234
In place of the many available studies, carried out through the international business
consultancies, the very recent ‘Upward mobility: The future of China´s Premium Car
Market’235 will be emphasised, because it has a strong reference to the offerings of
the German automobile manufacturers. SHA ET AL. (2013) focus primarily on prod-
uct-oriented sales opportunities; however some findings are usable in the context of
after-market behaviour. In this regard, the authors emphasise the steadily growing
demand for value added services.236 The buying motives then become complex, so
that the previously mentioned really important aspect of status symbol gets supple-
mented, by fun orientation, the symbolism of business credibility and the demand for
excellent service, as being also of high relevance. Further emphasised is the mean-
ing of the target group women, which appreciate values like safety and comfort more
than men. Regarding after-sales it could be stated that the car is usually replaced af-
ter six to eight years, whereas in the premium segment this happens two to three
years faster. 237 In what direction the premium market will develop in the future the
authors cannot predict, but they do accentuate that the OEMs should try to acquire a
better understanding of the Chinese consumer.238
232 Cf. Saidi et al. (2010), pp 1 ff. 233 Ibidem, p. 2. 234 Cf. ibidem, pp. 30 f. 235 Cf. Sha et al. (2013), pp. 1 ff. 236 Cf. ibidem, p. 5. 237 Cf. ibidem, pp. 6 f. 238 Cf. ibidem, p. 13.

State of Research
42
The advertising expert DOCTOROFF239 (2005) explains, in the management hand-
book ‘Billions’, how the Chinese consumer can best be reached.240 According to his
experience, even leading business managers mistakenly tend to apply Western
norms (non-reflected) when selling consumer goods in China.241 DOCTOROFF de-
scribes three focal areas. First, the eminent importance in Chinese culture of the de-
cision making or buying process; second, he shows basics, due to which strategies
for the ‘Middle Kingdom’ can be derived, and finally he analyses the largest ‘pitfalls’
in market cultivation.242 Here he offers a comprehensive and well-founded overview.
The scientific proof of individual drivers and context relations is, however, not the ob-
jective of his work.
Chinese Buying Behaviour and Country of Origin Effects
WANG/CUI (2008) describe, in the Journal of Consumer Behaviour, the results of
seven research works on Chinese buying behaviour. Throughout, they assert that
various customer segments, a variety in behaviour and traditional values, even today,
exist. Because the emphasis on social relations, feng shui and superstition influences
the decision making process, with this effect being more pronounced for the elderly
than for the younger population.243 The key messages of the individual studies is as
follows:
• ECKHARDT/HOUSTON (2008) describe that Chinese consumers ascribe to
one and the same product different meanings, because the assessment takes
place in the context of social relationships. Interpersonal relationships might
therefore dominate over individual product attributes.244
• HERNANDEZ ET AL. (2008) examine the impacts of superstition at product
releases. They test both ‘proactive superstitious behaviors’, like wearing a tal-
isman as well as ‘passive superstitious beliefs’ such as for instance the belief
in fate.245
239 CEO JWT Greater China – J. Walter Thompson is one of the biggest ad-agencies of the USA with
globally located branches. Continuative to that, it will be referred to the case study ‘JWT China: Advertising for the New Chinese Consumer’; Köll (2009), pp. 1 ff.
240 Cf. Doctoroff (2005), pp 1 ff. 241 Cf. ibidem, p. 2. 242 Cf. ibidem, pp. 2 ff. 243 Cf. Wang/Cui (2008), pp. 421 ff. 244 Cf. Eckhardt/Houston (2008), pp. 484 ff. 245 Cf. Hernandez et al. (2008), pp. 424 ff.

Chinese Consumer Behaviour in the Context of Intercultural Marketing
43
• Via 400 personal interviews WONG/ZHOU (2005) investigate the motives of
young Chinese upon purchase of prestigious and understated foreign con-
sumer goods. They confirm previous researches by showing that the per-
ceived brand quality strongly influences the consumption of less understated
goods, whereas the perception of brand prestige and brand value has a bigger
impact on the purchase intention, if the product category symbolises a high
social position.246 In the context of this research work especially the following
partial result is to be emphasised: ‘The findings showed that for conspicuous
products, perceived brand quality is seen as a major purchasing motive by the
high social compliance group, (...)’.247
• FAM ET AL. (2008) interview 630 persons in Beijing, Shanghai and Gu-
angzhou by means of a stratified random sample. For the three age cohorts
15-21 years, 34-56 years and over 57 years, they were able to capture both
the attitude towards the advertising of controversial or socially sensitive prod-
ucts such as cigarettes, as well as about various ad execution technics. The
most significant differences were between the youngest and the oldest cohorts
and especially with regard to gender aspects.248 They strongly recommend
that Western marketers build up a good understanding of Chinese habits, in
order to make appropriate cultural adaptions.249 The reaction of potential Chi-
nese buyers to ad contents and formats are also researched by other authors
not on this list – authors like ZHOU/BELK (2004) on global and local advertis-
ing appeals,250 or LIN (2001) on reflected cultural values.251
• LINDRIGE/WANG (2008) examine twelve young Shanghai-Chinese who are
planning to have or have had plastic surgery, in order to find out whether the
cultural aspects of consumption are increasingly in line with Western values in
the course of modernisation. The authors argue that plastic surgery has be-
come a constructing function for the personality adjustment towards reaching
246 Cf. Wong/Zhou (2005), pp.1 ff. 247 Ibidem, p. 9. 248 Cf. Fam et al. (2008) pp. 461 ff. 249 Cf. ibidem, p. 468. 250 Cf. Zhou/Belk (2004), pp. 63 ff. 251 Cf. Lin (2001), pp. 83 ff.

State of Research
44
the desired ideal, reflecting social change. Thus, perfection, success and
wealth are the central attributes of the ‘new’ China.252
• LI ET AL. (2008) question 300 students via both e-mail and paper question-
naire on their service consumption behaviour (hairdressing service). Thus,
they deliver explanations for the factors that influence repurchase behaviour,
or which could lead to repurchase.253 The authors show that customer satis-
faction and the cost of switching have a positive influence on the repurchase
intention, but that the purchase interval exerts no significant influence. Fur-
thermore the perceived value correlates positively with customer satisfac-
tion.254
• HSU/NIEN (2008) compare consumers from Taiwan – whose cultural and so-
cial system was shaped by Japanese colonisation between 1895 and 1945255
– with consumers from the urban Chinese mainland for the decision-
influencing variable of ethnocentrism: ’a form of nationalism in which one sees
one's own people (one's own nation) as the centrepoint and at the same time
as superior to other peoples.’256 They acknowledge that ethnocentrism de-
creases with increasing contact with foreign influences.257
Following on ethnocentrism, the closely associated ‘country of origin (COO) effect’
will be referenced, which describes what effect the image of the originating country
has on the perception of products and services. In the context of buying behaviour,
for instance, KUMARA/CANHUA (2010) examine this effect through a survey of 170
Chinese students. They determine for the situation of buying a foreign product that
the economic value is taken into account, an information demand occurs or remains,
that the consumer considers what impacts the product has on his social status, and
therefore how his or her personality could be promoted.258
252 Cf. Lindrige/Wang (2008), pp. 496 ff. 253 Cf. Li et al. (2008), pp. 448. 254 Cf. ibidem, p. 455. 255 Cf. Hsu/Nien (2008), p. 438. 256 Duden (n. a.) (2013), Ethnozentrismus. 257 Cf. Hsu/Nien (2008), pp. 441 f. 258 Cf. Kumara/Canhua (2010), pp. 343 ff.

Chinese Consumer Behaviour in the Context of Intercultural Marketing
45
With regard to the COO in conjunction with China, the following studies can be con-
sidered: 259
• Global brands in context of decision-making: ROSENBLOOM ET AL. (2012)260
• Brand preferences of urban Chinese in buying behaviour: KWOK ET AL.
(2006)261
• Using preferences of domestic and foreign internet services: OH/ZHANG
(2010)262
• Ethnocentrism and nationalist opinions as a potential danger for foreign
goods: PARKER ET AL. (2011);263 ISHIA (2009)264
• Case studies regarding Taiwan and Acer in China to aversion and price-
quality topics: AMINE ET AL. (2005)265
• Differentiation of COO in ‘Country of Design’ (COD), ‘Country of Assembly’
(COA) and ‘Country of Manufacture’ (COM) with regard to quality assessment
and purchase intention of young Chinese: WONG ET AL. (2008)266
Research with an Intercultural Focus on Decision-making Processes
GONG (2003) picks up the need for intercultural research, as he considers the influ-
ence of the Chinese culture on all phases of the buying decision process. From this
he derives hypotheses, so that a preparatory reference frame for further analysis re-
sults. The hypotheses are not tested; instead possible implications for the interna-
tional marketing are shown.267 The hypotheses formulated by GONG offer valuable
starting points for the success factor research that is studied in this work. For exam-
ple, the usually positive effect of guarantees could be weak in China; so it is hypoth-
esis P10: ‘Chinese consumers are less likely than Westerners to be attracted by
product warranties’,268 an aspect that can influence the success of the automotive af-
ter-sales marketing.
259 A selection referring to Trotter/Lijuan (2012), pp. 47 f. 260 Cf. Rosenbloom et al. (2012), pp. 20 ff. 261 Cf. Kwok et al. (2006), pp. 163 ff. 262 Cf. Oh/Zhang (2010), pp. 227 ff. 263 Cf. Parker et al. (2011), pp. 4 ff. 264 Cf. Ishia (2009), pp. 209 ff. 265 Cf. Amini et al. (2005), pp. 369 ff. 266 Cf. Wong et al. (2008), pp. 455 ff. 267 Cf. Gong (2003), pp. 373 ff. 268 Ibidem, p. 376.

State of Research
46
KNÖRLE (2011) examines brand loyalty in China with the objective of, ‘pointing out
the cultural particularities for building brand loyalty in the Chinese context.’269 The au-
thor conducts a qualitative and a quantitative study (PLS-path modelling) that in-
cludes the consideration of central intercultural value studies. In terms of brand loyal-
ty, he explores the fact that relationship to a brand is affected most strongly by social
influences, amongst which the perception of the brand within the family context could
be seen as the most intense. Based on the hypotheses tests in the path model, he
also confirms empirically, that ’(…) when it comes to relationships to brands, social
aspects play a central role. In particular the perception of a brand as international has
a positive effect on the judgement of its quality, on prestige and its perceived value
as well as on social connectedness and brand loyalty.’270
HE/MUKHERJEE (2007) researched, with a structural equation model, how the pur-
suit of self-congruity271 in the Chinese consumer influences their buying behaviour,
especially as to their preferred business image. They notice that the Chinese con-
sumer behaviour is driven by the motives of actual self-congruity and social self-
congruity, which is why the satisfaction felt, the perception of value as well as dealer
loyalty can be positively influenced here.272 Personal and societal ideals, which are
relevant in Western decision patterns, are overlain by the pressure of social ac-
ceptance and consistency, as the authors argue.273
Also within the context of intercultural marketing MOSER ET AL. (2011) research ex-
plicitly the cultural standards of behaviour from the perspective of German managers.
They differentiate between the three generic cultural areas of time, relationship and
communication from the five specific standards of trust, collectivism, power distance,
risk perception and negotiation pattern, which usually establish aspects of the cultural
areas mentioned.274 Because people in business relationships are surveyed, caution
is advised when transferring the findings to the average consumer. However, they
269 Knörle (2011), p. 221. 270 Ibidem, p. 225. 271 The concept of self-congruity is based on the 'assumption that the agreement of a consumer‘s per-
sonality characteristics with those of a brand leads to the consumer valuing the brand.' Mäder (2005), p. 26.
272 Cf. He/Mukherjee (2007), pp. 443 ff. 273 Cf. ibidem, p. 454. 274 Cf. Moser et al. (2011), pp. 102 ff.

Chinese Consumer Behaviour in the Context of Intercultural Marketing
47
provide starting points and hints for those cultural aspects that can influence buying
behaviour – such as the special position of the value, trust, which is closely associat-
ed with the requirement to save face, the avoidance of direct confrontation as well as
the specifics of Chinese negotiation methods.275
Meta-Analysis of Consumer Behaviour
In a meta-analysis KROLL ET AL. (2011) consider 48 published studies (2000-2008)
on consumer behaviour, to derive generally valid statements and to give recommen-
dations for consumer goods marketing. Here, the main topics are: values/culture, atti-
tude/motives, product characteristics, brand choice as well as consumer profiles.276
The authors state that the novelty of Western products becomes less important as a
purchase incentive, and likewise by trend there is a general decline in the preference
of Western products;277 but young Chinese are an exception, because more and
more they are catching up with global trends, and thus they are adapting to their
Western peer-group`s consumption patterns. With regard to communication, they
recommend strict credibility, because the brand trust acts as a major success criteri-
on.278 It is important that almost all surveys were performed in urban China. A trans-
fer of the findings to the whole of the People’s Republic is therefore not possible, as
neither the single surveys nor the meta-analysis are representative of the nation as a
whole.
275 Cf. ibidem, pp. 106 f. 276 Cf. Kroll et al. (2011), pp. 1 ff. 277 Cf. ibidem, p. 9. 278 Cf. ibidem, pp. 3 ff.


German Car Manufacturers in China as Research Object
49
3 German Car Manufacturers in China as Research Object
In this chapter the aim is to delimitate the German Car manufacturers as a research
object. As set out in Chapter 1 there are a lot of indicators that demonstrate why Chi-
na is tremendously important for these OEMs and why investigations should there-
fore be done there. The following section, German Market Overview, shows the
stagnation of the domestic market and the huge contribution of foreign markets, thus
based on this foundation, the role of China as a drawing card becomes understanda-
ble. Consequently Chapter 3.2 describes the Chinese macro environment as well as
the biggest challenges for after-sales services. Following on that, the after-sales op-
erations of German brands in China are analysed (Chapter 3.3), thereby with a spe-
cial focus on provision modes. Finally in Chapter 3.4, the aggregation of findings will
result in a clear delimitation of the object of research. Overall the entire Chapter 3 is
relatively comprehensive, which is due to the requirement to describe two markets,
but therefore an appropriate understanding about the background is provided in order
to establish a profound research study.
3.1 German Market Overview
This section starts with a description of manufacturers, German market data and the
sales contribution of foreign markets. Then, Chapter 3.1.2 shows the co-operating
role of suppliers, before finally the consumer side is stressed in Chapter 3.1.3.
3.1.1 Car Manufacturers
Car manufacturers, which are also called OEMs in the automotive industry, mainly
aim to produce and sell cars as final products. Here they operate as system leaders,
because they are able to steer the above-mentioned aspects as well as the very im-
portant brand design.279 In Germany there are usually five corporations, and their
subordinated brands, stated as German manufacturers, namely BMW, VW, Daimler,
Ford and Opel. But it is needed to delve deeper into this topic of origin.
279 Cf. Diez/Reindl (2005b), p. 61; Barthel et al. (2010), pp. 16 f.; Chapter 3.1.2, Co-operating Supp-
liers.

German Car Manufacturers in China as Research Object
50
Referring to DIEZ´s (2012) definition of the ‘German automobile industry’ and the
manufacturers operating there, delimitation can be done in two different ways: firstly
location-dependent, and secondly corporation-dependent. This sharpens the focus
specifically, so both delimitations are not mutually exclusive.
A corporation-based delimitation of German automotive manufacturers would include
all corporations headquartered in Germany. Thus Ford and Opel are not defined as
German manufacturers because the groups´s headquarters of General Motors (Opel)
and Ford are located in the USA, albeit both Ford and Opel have affiliates according
to German law. Consequently German manufacturers of this definition are deemed
as originary or genuine ones. Using the second option, to delimitate based on loca-
tion, entails that all corporations producing in Germany be counted. The first-
mentioned group of five, however, are German manufacturers.280 In the context of
the German market overview, henceforth, the location-based delimitation will be used
in this section. Beyond that, both options include subordinated brands like Audi (de-
pending on VW), which likewise might be perceived by customers as autonomous
manufacturers. The following provides an overview of the most important, respective-
ly sold, brands in Germany.
German Brand Overview
Brand Corporate Group
New Car Registrations 2014 Variation towards 2013 in %
Audi VW 259,459 +3.0 BMW BMW 271,436 +2.0 Ford Ford 192,823 +3.9
Mercedes Daimler 272,566 -1.7 Opel GM 219,084 +5.6
Porsche VW 24,365 +17.1 Seat VW 92,129 +11.7
Skoda VW 173,583 +8.5 Smart Daimler 22,408 -13.8
Volkswagen VW 656,494 +2.2 Others - 5,533 +2.5
Table 3: German Brand Overview
Reference: Author’s table referring to VDA (n. a.) (2015b), Neuzulassungen.
280 Cf. Diez (2012), pp. 17 f.

German Market Overview
51
Consolidation process
After the Second World War, as part of reindustrialisation, the German automobile
industry and domestic production have grown steadily. Simultaneously with the in-
creasing output a consolidation of manufacturers has taken place. Initially 15 auton-
omous manufacturers operated in the market at the mid-fifties. But by the early sev-
enties, the consolidation peaked in an oligopolistic structure with only six highly con-
centrated manufacturers left. In fact this situation was stable for a long time until Por-
sche was integrated, as a brand, into the VW group in 2012.281
Market Volume and Contribution of Foreign Markets
The German OEMs have a strong position in the market capturing almost 71% of the
domestic share.282 To understand the development behind this figure, the market
volume, measured by turnover, should be the next issue of analysis. Here, some sta-
tistical data of the ‘Statistisches Bundesamt Wiesbaden’ is used. They classify manu-
facturers, likewise location-based, under the code ‘WZ08-291’ as manufacturers of
automobiles and automotive engines. The following figure shows the industry turno-
ver, and a split into domestic and foreign market.
Figure 4: OEM`s Industry Turnover
Reference: Own calculations and illustration referring to Statistisches Bundesamt Wiesbaden (n. a.)
(2015a; 2013d), Beschäftigte und Umsatz der Betriebe im Verarbeitenden Gewerbe.
281 Cf. Fraß (2012), pp. 50 f.; VDA (n. a.) (2013), Automobilproduktion; Diez (2012), p. 42. 282 Cf. VDA (n. a.), (2013b), p. 26.
0!
50!
100!
150!
200!
250!
300!
2006! 2008! 2010! 2012! 2014!
in!mn!EUR!
OEM´s Industry Turnover
Domestic!Turnover!
Foreign!Turnover!
Total!Turnover!
Linear!Trend!(Domestic!Turnover)!
Linear!Trend!(Foreign!Turnover)!

German Car Manufacturers in China as Research Object
52
The development shows that the domestic turnover is stagnating. The absolute
growth is a result of the foreign turnover, which increased significantly, interrupted
only briefly by the financial crisis. Taking into consideration that the VDA argues that
the meaning of activities in foreign countries has been continuously and notably
stronger since 1997,283 it is worth delving into this aspect by comparing the amount of
exported cars against new registrations with a long-term view.
In the following Figure 5 the absolute numbers show that exports have been more
significant than new registrations since the turn of the century. As well, the derived
trends indicate a far bigger sales potential on the export site. This picture is fairly sim-
ilar to the foregoing turnover analysis. It does not describe Germany as an unim-
portant market, but growth potential is clearly elsewhere.
Figure 5: New Car Registrations in Germany vs. Export
Reference: Own calculations and illustration referring to VDA (n. a.) (2015c; 2013a), Export; VDA
(n. a.) (2015c; 2013d), Neuzulassungen.
Regarding the previously mentioned aspects we should also learn which of the for-
eign markets are of high potential, and whether export explains the market develop- 283 Cf. ibidem, p. 14.
0!
500000!
1000000!
1500000!
2000000!
2500000!
3000000!
3500000!
4000000!
4500000!
5000000!
1990! 1992! 1994! 1996! 1998! 2000! 2002! 2004! 2006! 2008! 2010! 2012! 2014!
New Car Regestrations in Germany vs. Export
New!Car!Registrations! Export!
Linear!(New!Car!Registrations)! 4!Period!Moving!Average!(New)!
4!Period!Moving!Average!(Export)! Linear!(Export)!

German Market Overview
53
ment at all completely. Usually German manufacturers serve foreign car demands
with a two-pillar strategy, by export and local production in the relevant countries. To
what extent the options are used will differ significantly, depending on market condi-
tions and the models in demand. However, for German corporate groups nowadays
this means that three out of five cars are produced mainly locally in foreign markets;
a duplication of the share ten years ago. With a global view on production site re-
gions it is obvious that China is the most important country for German manufactur-
ers, because 2.9 mn cars were assembled there, the largest number in any country
in the world.284 Considering all overseas production, German OEMs produced 35% in
Chinese plants in 2012, which was an increase of about 26% over the year 2000. In
addition, at last 274,212 cars per year have been exported from Germany to China.
Looking at the global export figures in 2014, except for Europe (60.6%), the largest
national export market is USA (14.3%) followed by China (6.4%).285
As mentioned above and in Chapter 1.1 China is tremendously important for the
German manufacturers in several aspects. To specify this group as a clearly delim-
ited research object, the previous discussion about export and local production must
be combined with Chinese structures and challenges. This will happen starting in
Chapter 3.2 Macro Environment of the People´s Republic of China. Here it should be
emphasised that in China local production by German OEMs is approximately ten
times higher than export. Accordingly a delimitation therefore might be reasonable,
so that this aspect will be picked up in the examination of China.
3.1.2 Co-operating Suppliers
The fact is, to produce a car is a highly co-operative process that covers a lot of par-
ties. Even if car manufacturers are system leaders, suppliers deliver the lion´s share
of value added. The proportion of value added differs from model to model and as
well there are niche-cars, which are manufactured completely make-to-order, such as
the Mini-Countryman and the -Paceman from the BMW Group. However, the suppli-
284 Cf. VDA (n. a.) (2015a), p. 7; VDA (n. a.), (2013b), p. 29; Stobbe (2013), p. 4. 285 Cf. Own calculations based on VDA (n. a.) (2015a), Export and VDA (n. a.) (2013a), Export;
Wissmann (2013), Deutsche Automobilindustrie in China weiter auf Wachstumskurs; Percentages are rounded.

German Car Manufacturers in China as Research Object
54
er’s share in the value chain averages at around 75%.286 To consider the thereby
supplied modules in detail, only the body is still primarily made by manufacturers,
and the prognosticated trend is that suppliers will continuously increase their produc-
tion share here and in all other segments.287
The supplier enterprises are deemed to be mostly small or medium-sized compared
to the group structured and globally operating OEMs.288 The turnover comparison of
the years 2010 to 2012 in Figure 6 shows that in a global view. The group of suppli-
ers, which is about eight times bigger than the group of manufacturers, gained,
roughly considered, only half the amount of total turnovers in 2012. In the suppliers’
case only automobile-specific turnovers are illustrated.
Figure 6: Comparison of Turnovers in the Automotive Production
Reference: Author’s illustration referring to Berylls (n. a.) (2013), p. 2.
With an industry analysis it also can be demonstrated that suppliers are typically
strongly dependent on OEMs. For instance FRAß (2012) shows this for the German
automotive suppliers, using mainly PORTER´s five forces model. Important aspects
of the great bargaining power of OEMs and the high rivalry within the suppliers indus-
try are: high concentration of few but huge manufacturers, multiple less concentrated
and very heterogeneous suppliers, the importance of every single customer in view
of the high buying volume, price war within the suppliers of less differentiated offers,
and new (potential) market entrants.289
286 Cf. Fraß (2012), p. 1; VDA (n. a.) (2011), p. 47; n. a. (2011b), Noch ein Mini für Magna; BMW
Group (n. a.) (2012): Wo wird was gebaut; Barthel et al. (2010), pp. 16 ff. 287 Cf. VDA (n. a.) (2013b), p. 37; Barthel et al. (2010), p. 30. 288 Cf. Reichhuber (2009), p. 23; Diez/Reindl (2005b), p. 61. 289 Cf. Fraß (2012), pp. 82 ff.
580!
1071!
663!
1169!
665!
1256!
0!
500!
1000!
1500!
Top!100!Suppliers! Top!13!OEMs!
in!bn.!EUR!
Comparism of Turnovers in the Automotive Production
2010!
2011!
2012!

German Market Overview
55
3.1.3 Consumer
Macroeconomic Tendencies and the Average Buyer
As just set out the German car market is currently deemed to be saturated. Against
this background consumer analysis starts with a broad issue, the demographic de-
velopment. Since 31st December 2011, Germany officially has a population of 80.3
mn people. Due to a new counting method this figure shows approximately 1.5 mn
people less than the foregoing census (81.8 mn).290 Germany´s population peaked in
2003, but since that point there has been a steady decrease; a development that will
continue in the future as the official population forecast shows. Depending on the
chosen scenario, the so-called mean population, might decrease to between 65 mn
and 70 mn by 2060. The ‘maximum population’ scenario, which shows the highest
figure, projects 77 mn inhabitants. This decreasing trend, whatever the exact popula-
tion numbers might be, is accompanied by a significant age-group shift. With a view
towards 2030, the relative share of the ‘65 and older’ group will increase and the ‘un-
der 20s’ will decrease. Likewise it is expected that the motorisation grade of the latter
will decrease as well.291
Furthermore people’s income levels must be scrutinised. BARTHEL ET AL. (2010)
show that the middle class is steadily shrinking and the low-income group is growing
larger, with ever lower wages.292 The future buying power of these German consum-
ers is inclined to weaken as the mentioned macro data indicates. In what follows the
investigation scope will be narrowed, specifying the typical automobile buyer and his
behaviour, in order to assess the consumer’s impact on the market.
In 2014 the average buyer paid € 28,330 for a new car, and two-third of the buyers
did this by financing it completely or partly. Of these, 80% had already owned a car,
replaced with the new one; 8% bought an additional car; and just 12% were first-time
buyers. Typically the buyer was 43,5 years old, and if he had owned a car before, he
290 Cf. Statistisches Bundesamt Wiesbaden (n. a.) (2013a), Bevölkerung. 291 Cf. Statistisches Bundesamt Wiesbaden (n. a.) (2009), pp. 10 ff.; Barthel et al. (2010), p. 12; VDA
(n. a.) (2013b), p. 96; Pötzsch (2011), pp. 211 ff. 292 Cf. Barthel et al. (2010), p. 12.

German Car Manufacturers in China as Research Object
56
had used it nearly six years. The average monthly net income of the buyers’ house-
holds was € 3,785.293
Affordability, Usage and Kind of Demand
The prices paid for new cars as well as fuel prices have been increasing in Germany
for a long time. Thus, the development over the last 20 years shows that new car
prices increased by 63.7% while the general cost of living, measured by the consum-
er price index (CPI), increased by only 39.3%, as the DAT reveals. Focusing on the
new century, the price index for petrol on the basis of 2010 surged from 70.7% in
2000 to 117.5% in 2012.294 The following Figure 7 compares the consumer price in-
dex with the car driver price index, which explains the holistic cost of individual mo-
torised mobility. The basket of goods and services includes buying costs, repairs,
petrol, insurances and other costs such as taxes.295
Figure 7: Consumer Price Index vs. Car Driver Price Index
Reference: Own calculations and illustration referring to Statistisches Bundesamt Wiesbaden (n. a.)
(2015b; 2013c), Verbraucherpreisindex; Diez/Kohler (2010), p. 15.
With the exception of 2014, buying and using a car is, relatively speaking, steadily
more expensive than living in general. Moreover, combined with the recently observ-
able decrease of first-time buyers and the relatively small share of buyers with low
incomes, the DAT-Report already in 2013 concluded that individual mobility through 293 Cf. DAT (n. a.) (2015), pp. 10 ff. 294 Cf. ibidem, pp. 70 f.; Statistisches Bundesamt Wiesbaden (n. a.) (2013c): Verbraucherpreisindex;
Janovsky et al. (2011), pp. 99 f. 295 Cf. Statistisches Bundesamt Wiesbaden (n. a.) (2013b), Kraftfahrer-Preisindex.
100!
105!
110!
115!
120!
125!
130!
2000! 2002! 2004! 2006! 2008! 2010! 2012! 2014!
base!year!=!100%!
Consumer Price Index vs. Car Driver Price Index
Consumer!Price!Index!(Basis!2000)!
Car!Driver!Price!Index!(Basis!2000)!
Consumer!Price!Index!(Basis!2010)!
Car!Driver!Price!Idnex!(Basis!2010)!

German Market Overview
57
the use of a car is becoming more and more of a luxury for many potential buyers. As
a result people may delay or skip purchase.296
Some authors argue that, independent of affordability and willingness to pay, the
young urban generation in Germany and other highly industrialised countries esteem
cars less than ever as desirable status symbols. Even though there is no final evi-
dence for this, it should be considered that, especially in urban areas, more and more
people prefer demand-orientated car-usage like car sharing.297 In addition to that, car
use should be reviewed in a broader sense. Accordingly, it is important to emphasise
the long-term development of the traffic volume as an indicator of people’s mobility
preferences; thereby the relative car use versus other key mobility options, which of-
ten serve as substitutes.
Figure 8: Modal Split (Traffic Volume); Up to 1990 covers only West Germany
Reference: Author’s illustration referring to n. a. (2010), p. 8; n. a. (2008), p. 25.
Figure 8 shows that people used mostly the car as a means of travel. The latest data
available (2008)298 gives a figure of 43%. Aside from the finding that car use had the
biggest volume, the car driver chart itself should be focussed (it does not include car
296 Cf. DAT (n. a.) (2013), pp. 70 ff. 297 Cf. Unsöld (2013), Langsamer Abschied von einem Statussymbol; Sopha (2012), p. 99; Fraß
(2012), pp. 40 f.; Bundesverband CarSharing (n. a.) (2013), pp. 2 ff.; Diez (2012), pp. 160 ff.; Heymann et al. (2011), pp. 18 f.; Barthel et al. (2010), p. 12.
298 A Survey update is planned for the year 2016 (s. http://www.mobilitaet-in-deutschland.de).
32%!
37%!41%!
45%! 44%! 43%!
34%!
29%!27%!
22%! 23%! 24%!
9%!11%! 10%!
8%! 9%! 10%!
11%! 10%! 9%! 10%!8%! 9%!
0%!
5%!
10%!
15%!
20%!
25%!
30%!
35%!
40%!
45%!
50%!
1976! 1982! 1990! 1998! 2002! 2008!
Modal Split (Traffic Volume)
Car!Driver!
Pedestrian!
Bicycle!
Public!Transport!
Linear!Trend!(Car!Driver)!

German Car Manufacturers in China as Research Object
58
passengers, their rate averages at 14%). The remarkable increase until 1998 was
stopped by a slight decrease of 1% for each survey date. The long-term growth-trend
seems to be broken, as correspondingly indicated by the linear-trend cut-off in 2002.
Likewise what kind of purchase consumers prefer is of interest, especially whether
new or used cars are demanded. Accordingly Figure 9 shows the ratio of used- to
new-car registrations from 2004 to 2014.
Figure 9: Ratio of Used- to New-Car Registrations
Reference: Own calculations and illustration referring to DAT (n. a.) (2015), p. 16.
After a long period of stagnation the relative demand for used cars dropped in 2009.
This development was due primarily to the ‘Abwrackprämie’, a scrapping incentive
enacted by the German government as part of the economic growth package, in re-
action to the enduring financial crisis at the time. Consumers got a bonus for the pur-
chase of a new car if they scrapped one at least nine years old. In fact, next to the
environmental benefit, the aim was to support the automotive industry, which was in
a bad way.299 The rate above average of used-car-registrations since 2010 is most
likely a reaction towards this market stimulation, but the figures cannot explain how
long it will last, and if any another unknown variable effects the ratio additionally.
However, the long-term stagnation just described and the latest trend towards used
cars delivers no indication of a prospective increase in new car use or purchase.
Future Trends
Oliver Wyman and VDA developed some trends showing customer orientation,
through the FAST 2025 study. They forecast that customer demand will be very indi- 299 Cf. Horn (2013), Abwrackprämie; Barthel et al. (2010), p. 6.
2,02! 1,99! 1,94! 1,99! 1,98!1,58!
2,20! 2,15! 2,23! 2,40! 2,33!
2004! 2006! 2008! 2010! 2012! 2014!
Ratio of Used to New Car-Registrations
Ratio!of!Used!to!New!Car5Registrations!!
Average!

Macro Environment of the People´s Republic of China
59
vidual; necessarily variety in car models must be increased to satisfy this kind of de-
mand. In addition, complexity is increasing and product life cycles are shortening.
Furthermore customers tend to prefer high quality cars, but, as pointed out in this
study, prices cannot be increased at the same level due to the strong competition
within the industry.300 However, it must be emphasised that these trends are nothing
new, rather they are a process that has been going on for years.301
3.2 Macro Environment of the People´s Republic of China
This section about the macro environment of China describes three general topics,
the Chinese economy in Chapter 3.2.1, the consumer landscape (Chapter 3.2.2), and
the main challenges in reference to after-sales services in Chapter 3.2.3.
China, the third largest country in area, has approximately 1.35 bn inhabitants, which
means in absolute numbers that it is the most populated nation in the world.302 Chi-
nese people call their country ‘zhōngguó’, which means ‘The Middle Kingdom’, first
because they are surrounded by the ‘barbarian’ Vietnamese, Mongolians, Koreans
and Japanese; and second, because their historical self-conception is that they are
the centre of the world (sinocentrism). The commonly used name China is derived
from the Latin word ‘Sina’. After World War II a remaining conflict between com-
munist and nationalist groups flamed up again. Finally, Mao Zedong, leader of the
communist´s troops, won against Chiang Kai-shek. Thus the civil war ended on 1 Oc-
tober 1949, when Mao Zedong proclaimed the new Chinese state. Since this date,
the country´s name is officially People´s Republic of China (PRC), covering the Chi-
nese mainland, Hong Kong and Macau. The Republic of China must be distinguished
from the PRC, because the so-called Taiwan (Taiwan island and the Kimmen and
Matsu archipelagos), where Kai-shek and his Republic of China supporters fled, has
a special status, still struggling to be an autonomous country. By the early seventies
Taiwan was recognised by most countries as independent, but not by the People´s
Republic of China, where Taiwan is seen as a breakaway province. Sometimes, the
term ‘Greater China’ is used in the literature, which usually covers both the Republic
300 Cf. Oliver Wyman (n. a.) (2012), pp. 2 f. 301 Cf. Fraß (2012), p. 13; Kurek (2004), p. 13; Diez (2009), pp. 90 f.; Radtke et al. (2004), p. 21. 302 Cf. World Factbook (n. a.) (2013), China; Holtbrügge/Puck (2008), p. 7.
German Car Manufacturers in China as Research Object
60
of China and the People´s Republic of China.303 This work is always about the Peo-
ple´s Republic of China.
3.2.1 Chinese Economy
Still, China is a socialistic country being governed by one authoritarian party, the
Chinese Communist Party (CCP). In the late seventies China`s functionaries started
to open up their centrally planned economy with a slow but well-planned transfor-
mation process. For instance, by abandoning the state monopoly of foreign trade. As
a result, a move towards a market-oriented economy was made. In 1992, at the 14th
national congress, political leaders acknowledged the Chinese model as a socialistic
market economy, which on the one hand means that production factors remain col-
lective property, and on the other hand that their use is aligned towards market-
oriented principles. Following this opening-up process, in 2001 the entry into the
World Trade Organisation (WTO) marked an important milestone towards foreign
trade activities. After that, even the conditions for foreign enterprises operating in
China improved remarkably.304
Still classified as an emerging market, the Chinese economy has grown very re-
spectably. From the early 1980s until now, gross domestic product has increased at
an average rate of approximately 10% per year. Today China plays a major global
role in a lot of areas such as politics or trade. In fact, China outpaced the USA in
2007 and Germany in 2010, becoming the largest exporter worldwide.305
Gross Domestic Product
Next, the gross domestic product (GDP) is examined as a scale of economic
achievement. First an illustration of China´s share of world´s GDP since 1700 (Figure
10) and second the sectoral split will demonstrate where the GDP contribution comes
from and how the economic pattern has changed over the last 50 years, which is il-
303 Cf. Knörle (2011), p. 1; Holtbrügge/Puck (2008), pp. 10 ff.; Becker/Straub (2007), pp. 29 f./59 f. 304 Cf. Knörle (2011), p. 3; Maddison (2007), pp. 19/51 ff.; World Factbook (n. a.) (2013), China; Holt-
brügge/Puck (2008), pp. 9 f./18 ff.; Becker/Straub (2007), pp. 34 ff.; Kasperk et al. (2006), p. 7. 305 Cf. Wang (2011), p. 110; World Factbook (n. a.) (2013), China; Holtbrügge/Puck (2008), p. 23; Han
(2013), p. 107.

Macro Environment of the People´s Republic of China
61
lustrated in Figure 11. Both contribute to understanding contemporary China in the
long run.
Figure 10: The World´s GDP Share of Chosen Economies
Reference: Author’s illustration referring to Maddison (2007), p. 44.
In 2012, 10.1% of China´s GDP was gained through agriculture, 45.3% through the
industry sector, and 44.6% via services.306
Figure 11: Sectoral Split in China from 1952 towards 2012
Reference: Author’s illustration referring to Maddison (2007), p. 70; Botschaft der Bundesrepublik Deutschland Peking (n. a.) (2013), p. 1.
Today, if price differences are taken into account, by using purchasing power parity
(PPP), China is the world’s second largest economy since 2012. Thus, the estimated
GDP was $ 12.61 trillion in 2012. Here, only the USA surpasses China, predominant-
ly based on the highly developed service industries (nearly 80% of GDP-share). The
306 Cf. Botschaft der Bundesrepublik Deutschland Peking (n. a.) (2013), p. 1.
0!
10!
20!
30!
40!
1700! 1820! 1952! 1978! 2003!
Share!in!%!!
of!!the!World´s!GDP!
The World´s GDP Share of Chosen Economies
China!
India!
USA!
Europe!
59,7!34,4!
15,7! 10,1!
10!36,8!
57,2!45,3!
30,3! 28,8! 27,1!44,6!
0%!
20%!
40%!
60%!
80%!
100%!
1952! 1978! 2003! 2012!
Sectoral!Share!of!GDP!
Sectoral Split in China from 1952 towards 2012
Services!
Industry!and!Construction!
Agriculture,!Forestery!and!Fishery!

German Car Manufacturers in China as Research Object
62
European Union would surpass China as well, if the complete region is seen consoli-
dated as one country.307 Furthermore, to clarify these numbers it is necessary to em-
phasise that the official Chinese GDP ($ 8,227 trillion) underestimates the actual out-
put, if it is measured on the official exchange rate and not by using purchasing power
parity, as stated in the World Factbook: ‘(..) because China's exchange rate is deter-
mine by fiat, rather than by market forces, the official exchange rate measure of GDP
is not an accurate measure of China's output; GDP at the official exchange rate sub-
stantially understates the actual level of China's output vis-a-vis the rest of the world;
in China's situation, GDP at purchasing power parity provides the best measure for
comparing output across countries.’ 308
Next, GDP growth rates are examined to describe recent developments in China.
Figure 12: China´s GDP Growth Rate Compared to Chosen Countries
Reference: Author’s illustration referring to Worldbank (n. a.) (2015), GDP growth.
Reasons for these steadily high growth rates are manifold, but some are deemed to
be crucial, in the forefront the fact that China used its strength as the world´s work-
bench. The huge population seemed to be a never-ending workforce pool. Further-
307 Cf. World Factbook (n. a.) (2013), China; Bryson/Griffiths (2013), p. 8. 308 World Factbook (n. a.) (2013), China.
2004! 2005! 2006! 2007! 2008! 2009! 2010! 2011! 2012! 2013! 2014!
China! 10,1! 11,4! 12,7! 14,2! 9,6! 9,2! 10,6! 9,5! 7,8! 7,7! 7,4!
Germany! 1,2! 0,7! 3,7! 3,3! 1,1! 55,1! 4,1! 3,6! 0,4! 0,1! 1,6!
USA! 3,8! 3,3! 2,7! 1,8! 50,3! 52,8! 2,5! 1,6! 2,3! 2,2! 2,4!
55,0!
52,5!
0,0!
2,5!
5,0!
7,5!
10,0!
12,5!
15,0!
in!%!
China´s GDP Growth Rate Compared to Chosen Countries

Macro Environment of the People´s Republic of China
63
more, people as a production factor were very cheap for a long time. Simultaneously
to the increasing mass production, consumer’s domestic demand rose; this had a
stimulating effect as well. Even if wages rose (stressed later on), China is a compa-
rably cheap place to produce.309
Secondly, the low dependence on high-tech areas, which are usually sensitive to
conjuncture changes, combined with an accumulated need in all economic areas.
And finally, the unbroken trust of foreign investors in China´s future, as a prospering
market and production place;310 independent of all actually existing problems like
property rights for instance. By the way, among the emerging markets, China is the
largest foreign direct investment recipient within the last three decades.311
Conspicuously, in spite of the financial crisis dip, recently the GDP rate decreased
significantly (s. Figure 12). Incidentally, a development as assumed by a long-term
OECD study, here it is stated: ‘The pace of Chinese progress will slacken as it gets
nearer to the technological frontier.’312 Right now, experts estimate that double-digit
rates are most likely an aspect of the past. Real GDP rates under the 8%-threshold
have been expected and occurred in 2013 and 2014.313 Furthermore, it is unclear
what growth rate is needed for China to experience a healthy development. However,
a value-added comparison with the USA will be delivered here, to foster the under-
standing of scale and benchmark. If China´s yearly GDP growth rate was roughly two
and a half times larger than that of the US, both would have the same effect on the
global value added. For instance, using the 2013 growth rate of China with around
7.7%314 as a year basis, the US economy must grow by approximately 3% to equal
this example.315
309 Cf. Becker/Straub (2007), pp. 177 ff.; Knörle (2011), pp. 4 f.; Maddison (2007), p. 96; Holt-
brügge/Puck (2008), pp. 137 ff. 310 Cf. Becker/Straub (2007), p. 177; Maddison (2007), p. 96. 311 Cf. Gao et al. (2013), p. 57. 312 Maddison (2007), p. 20. 313 Cf. Worldbank (n. a.) (2015), GDP growth; Bryson/Griffiths (2013), p. 8; Ganther/Issel (2013), p. 18;
Wang et al. (2012), p. 2; Chapter 3.2.1, Five-year planning. 314 Cf. Worldbank (n. a.) (2015), GDP growth; Botschaft der Bundesrepublik Deutschland Peking
(n. a.) (2013), p. 1. 315 Cf. Bryson/Griffiths (2013), p. 8.

German Car Manufacturers in China as Research Object
64
Employment, Domestic Demand and Infrastructure
The Chinese workforce is about five times bigger than the European one. In 2012,
767 mn people were counted, of which 48.37% in urban areas. The unemployment
rate is between 4.3% and 4% since 2003 (4.1% in 2012). But this does not mean that
China achieves nearly full employment, in fact only the urban unemployment rate is
given officially.316
As mentioned before, the GDP has grown fast and continuously in the long run, part-
ly due to the total increase of employment, as well because labour productivity was
increased four-fold in the first 25 years from the political opening process started in
1978.317 According to that, likewise wages rose, a progress that fostered buying
power and domestic demand. Even today, after an enormous increase of more than
440% between 1989 and 2005, Chinese per capita income is continuously rising, but
it is still below the world average.318 Generally domestic demand is deemed to be too
weak in China. Here, relatively high saving rates and especially income inequality are
causative for corresponding low consumption rates.319 However, in the recent past,
domestic demand held up, but with the beginning of 2013 private consumption and
investments increased significantly, which is assessed as a positive economic indica-
tor in this area.320 Further micro economic income analysis follows, in section 3.2.3.
Infrastructure, as an important factor of both a viable competitive economy and an in-
fluencer of automotive markets, will be treated next. In the past, China used infra-
structure projects to stimulate the economy and to foster the automobile market.
Even the car is only one mobility option amongst others, and in general far less im-
portant than in Western countries, the expenditure on road traffic is higher than for air
or railway traffic. As a result, for instance, the motorway network grew in 2012 by
12,300 km to a length of 97,000 km. This one-year increase in construction has ap-
316 Cf. Botschaft der Bundesrepublik Deutschland Peking (n. a.) (2013), p. 1; World Bank (n. a.) (2013),
Unemployment; National Bureau of Statistics of China (n. a.) (2013): News & Events; Beck-er/Straub (2007), p. 184.
317 Cf. Maddison (2007), pp. 59 ff. 318 Cf. World Factbook (n. a.) (2013), China; Becker/Straub (2007), pp. 164/184 ff.; Jianye (2013),
p. 41; PwC (n. a.) (2011), p. 65. 319 Cf. Gan et al. (2014), p. vii; World Factbook (n. a.) (2013), China; Devan et al. (2009), pp. 3 ff.;
Becker/ Straub (2007), pp. 216 ff. 320 Cf. Jianye (2013), p. 40.

Macro Environment of the People´s Republic of China
65
proximately the same length as the sum of all existing motorways in Germany.321
Furthermore, WANG (2011) remarks that the above-mentioned infrastructural pro-
gress will ensure that there is no restriction on future automobile market growth, as
seen in other developing countries.322 But it must be considered that the latter argu-
ment is a relative comparison, and as stated in Chapter 1.1, traffic jams actually
cause massive problems, especially downtown.323
Five-year Planning
The communist party of China uses so-called five-year plans as an instrument of
country´s development. A lot of actions aim to foster the economy, but amongst oth-
ers there are also societal and environmental elements, and furthermore these as-
pects are typically related rather than being mutually exclusive. The first table below
shows some important facts for the last seven five-year plans since 1980, to provide
an overview of the development of growth focus and economical context. Afterwards,
the second table summarises the current schedule of the political leadership.
Five-Year Plan Overview since 1980
Five-year plan no. and time-scale
Growth focus Local focus Average GDP growth rate
No. 6/7 1980-1989
Reform and opening Huge metropolises 15.35%
No. 8/9 1990-1999
Export and low wages Coastal and eastern regions
18.6%
No. 10/11 2000-2009
Domestic demand and services
Coastal, eastern and rural regions
15.1%
No. 12 since 2010
Optimisation and sus-tainability
Western and central China plus rural areas
Estimate: 7%-8% Real average 2010 un-til 2014: 8.91%
Table 4: Five-year Plan Overview since 1980
Reference: Author’s table and calculation on the basis of Worldbank (n. a.) (2015), GDP growth; Botschaft der Bundesrepublik Deutschland Peking (n. a.) (2013), p. 1; PwC (n. a.) (2011), p. 64; Becker/Straub (2007), p. 146.
321 Cf. Wissmann (2013), Deutsche Automobilindustrie in China weiter auf Wachstumskurs; PwC
(n. a.) (2011), pp. 75 ff.; Becker/Straub (2007), pp. 194 ff. 322 Cf. Wang (2011), p. 110. 323 Cf. Chapter 1.1, Status Quo and Problem Statement; Pwc (n. a.) (2011), pp. 49 f./76 ff.

German Car Manufacturers in China as Research Object
66
The actual five-year plan (2011-2015) – Essential Aims and Provisions Area Motivation
Economy Optimisation and trans-formation
Society Stability
Environmental Sustainable development
Aims • To increase the sectoral service-share of GDP from 43% towards 47%
• To increase R&D-share of GDP from 1.75% to-wards 2.2%
• Maximum of 4% inflation • To increase the rate of
urban living people by 4% towards 51.5%
• To increase the rate of affordable real estate in urban areas up to 20%
• To reduce CO2-emission by minus 17% per GDP-unit
• To reduce energy con-sumption by minus 16% per GDP-unit
Provisions • Focus on R&D, innova-tion and services
• To increase the educa-tion expenditures
• To defeat inflation well-directed
• To increase the income in rural areas by more than 7% per year
• Definition of seven key-industries like new-energy vehicles
• Investment of at least 430 bn Euro
Table 5: The Actual Five-year Plan (2011-2015)
Reference: Author’s table referring to PwC (n. a.) (2011), p. 63.
Regarding the actual planning purpose, of transforming China into a more service-
oriented and sustainable economy, JIANYE (2013) sees strong indicators of success.
Here, for instance, the service sector outpaced the industry sector on the supply side,
which fostered the labour market additionally.324 However, knowledge of these poli-
cies is absolutely basic to understanding ongoing developments in China, and more-
over it delivers a broad context for some issues regarding the following sections,
whereby the Chinese consumer landscape is stressed next.
3.2.2 Chinese Consumer Landscape
A very important insight about Chinese consumerism is that there is neither the one
Chinese market nor the one Chinese consumer. Prima facie this is a banal aware-
ness of marketing in general, but it is therefore relevant to emphasise that, as op-
posed to Europe, a lot of issues are comparatively heterogeneous, such as customer
segments and communications media.325 Likewise ECKHARDT (2004) pointed out
that it might be that there are more differences within the Chinese customer seg-
324 Cf. Jianye (2013), pp. 40 f. 325 Cf. Knörle (2011), p. 7; Xin-an et al. (2008), pp. 377 ff.; Köll (2009), pp. 7ff.; Cui/Liu (2001), p. 101;
Wang et al. (2012), p. 10; Holtbrügge/Puck (2008), p. 143.

Macro Environment of the People´s Republic of China
67
ments than between China and the West.326 This indicates that examining Chinese
consumer behaviour is tremendously complex. Because of that, it is more useful to
analyse customer behaviour in regard to each special topic rather than drawing a
comprehensive picture of the Chinese consumer landscape. By doing so, plenty of
consumer behavioural issues, presented in Chapter 2.3, will be exploited later on.
Nonetheless, the situation of Chinese households will be highlighted in detail here,
because experts327 recommended examining this elementary issue with respect to
culture and to automobile after-sales. Besides, the role of households is important, as
it is China’s basic social unit.328 Finally, cars are suitable to be used by more than
one person. Regarding private car use, typically in households.
The subsequent section refers primarily to the China Household Finance Survey
conducted by GAN ET AL. (2014), because this study is quite new, comprehensive,
and furthermore it is the first representative one about this issue.329
The average Chinese household includes 2.94 persons (Germany: 2.02)330, whereby
2.67 is the size for urban households, and 3.18 is the one for rural ones. Notably,
overall, single households are comparatively rare with 6.68%. More than 50% of
people live in a two- or three-person community and nearly a quarter of households
have five or six members. Remarkably, a large number of adult Chinese live with
their parents. Thus 36.32% of 30-to-40-year-old urban Chinese live with their parents
if they are married, and 56.40% if they are unmarried. For the 40 – 50 age group the
numbers are: 23.24% for married people and 27.28% for unmarried. The mean age
of Chinese people is 38.37 years.331 Due to the so-called ‘one-child policy’ China has
a low population birth rate, ranking 163 with respect to the rest of the world. Today
the average Chinese life expectancy is nearly 75,5 years, 35 more than 1950, so the
population pyramid is becoming more and more like the Western urn form.332 That is
why aging is a remarkable problem and a serious social challenge in China. GAN ET
326 Cf. Eckhardt (2004), p. 404. 327 Cf. Chapter 1.2, Exploratory Pre-Investigation as Relevance Rationalisation,
Concretisation and Possible Addition of Topic-Choice. 328 Cf. Emrich (2014), p. 440; Gan et al. (2014), v; PWC (n. a.) (2011), p. 27. 329 Cf. Gan et al. (2014), pp. 14 ff. 330 Cf. n. a. (2012e), Bevölkerung und Haushalte. 331 Cf. Gan et al. (2014), pp. 17 ff./76 f. 332 Cf. World Factbook (n. a.) (2015), China; Holtbrügge/Puck (2008), p. 9.

German Car Manufacturers in China as Research Object
68
AL. (2014) conclude, ‘(…) China has become old before becoming rich.’333 A fact,
which should be kept in mind, especially with regard to automotive sales and after-
sales markets.
Income and Debt Structure
In considering consumerism more deeply, income is a major variable, so it is useful
to ask at first, where the consumer comes from, because there are huge disparities
between regions. Here, MADDISON (2007) states that there is a ten-to-one spread of
average per capita income between the best and the worst region that, unfortunately,
has hardly changed since 1978.334 Furthermore, in general there are big income dis-
parities between urban and rural areas. In 2012, with 24,565 CNY (€ 2,968), urban
living people earn, per capita, more than three times as much as their rural counter-
parts who achieved an average of 7,917 CNY (€ 957). Moreover, this rural-urban in-
equality is bigger than in other Asian countries and the rural-urban spread has in-
creased continuously since twenty years.335 Considering households instead of indi-
viduals, the sum of incomes averages at 59,174 CNY with a median of 27,900 CNY.
The mean to median ratio of approximately two to one indicates a big income ine-
quality as well. Table 6 will deepen this aspect by showing a mean, median and 90%
quantile comparison of rural and urban households.
Urban vs. Rural Household Income (in CNY) Household Income Mean Median
Overall sample 59,174 27,900 Household income > quantile-90% 324,612 174,880
Urban household income
Overall sample 78,944 37,500 Household income > quantile-90% 430,275 230,000
Rural household income
Overall sample 35,806 19,619 Household income > quantile-90% 175,938 93,077
Table 6: Urban vs. Rural Household Income
Reference: Author’s table referring to Gan et al. (2014), p. 161. 333 Gan et al. (2013), p. 19. 334 Cf. Maddison (2007), p. 22. 335 Cf. Botschaft der Bundesrepublik Deutschland Peking (n. a.) (2013), p. 1; National Bureau of Sta-
tistics of China (n. a.) (2013): News & Events; PwC (n. a.) (2011), p. 65; Maddison (2007), p. 22.

Macro Environment of the People´s Republic of China
69
Again the data shows clearly a huge gap between rural and urban amounts, and fur-
thermore the group of the best earning ten per cent have an income that is about five
times the average. If additionally urban households are compared to the overall sam-
ple mean, the figure is more than seven times higher than the average. In addition to
that, GAN ET AL. (2014) mention, ‘Income disparities become more extreme at the
upper end of the income ladder.’336
To complete the picture, additionally, the debt structure is illustrated in the figure be-
low, whereby issues with more than 1% are drawn. Thereby, the average total debt
of the households is 62,576 CNY (rural: 36,504 CNY; urban: 100,816 CNY).
Figure 13: Rural and Urban Debt Structure
Reference: Author’s illustration referring to Gan et al. (2014), p. 134; Percentages are rounded.
In fact, the car is the only noteworthy durable good for which households borrow
money. Here, based on the mean, the amount of money borrowed from banks is ap-
proximately twice as big as that borrowed privately, a common practice in China. Ad-
ditionally, ‘cash is king’ in China, so leasing has been allowed since 2007, saving-
rates are high and credit financed consume is less common. Few durable goods like
cars are exceptions, but as well here only approximately 10% of the purchases are
fully credit financed.337
336 Gan et al. (2014), p. 161. 337 Cf. Gan et al. (2014), pp. 87/133 ff.; PwC (n. a.) (2011), pp. 29 f.; Holtbrügge/Puck (2008), p. 152.
46%!
42%!
5%!2%! 5%!
Rural Debt Structure
Business! Housing! Cars!
Education! Others!
42%!
51%!
3%!1%!4%!
Urban Debt Structure
Business! Housing! Cars!
Education! Others!

German Car Manufacturers in China as Research Object
70
Closing this section, important disparities are summarised in Table 7, thus with a fo-
cus on regional allocation.
Important Regional Disparities in China
Density 96% live in coastal regions Sparsely populated mainland Regional disparities
West - East Axis Relatively high buying power and afflu-ence in eastern regions decreasing to-wards the West
North - South Axis Relatively high buying power and afflu-ence in southern regions decreasing to-wards the North
Urban • 52.6% of population • Per capita income: 24,565 CNY • Broad product range • Strong immigration • Average household size: 2.67
Rural • 47.4% of population • Per capita income: 7,917 CNY • Restricted product range • Strong emigration • Average household size: 3.18
Table 7: Important Regional Disparities in China
Reference: Author’s table referring to Knörle (2011), pp. 7 ff.; Chapter 3.2.2.
3.2.3 Challenges to After-Sales Services in the Chinese Market
The most important challenges for German car manufacturers when it comes to after-
sales in China are mainly driven from three areas, competition within the industry
sector, laws and political influences in the centrally planned economy environment
and last but not least consumers. Subsequently, some needed facts about the auto-
motive market in China are delivered, both as an introductory framework and as ma-
jor indicators to derive competition driven aspects, so this area will be stressed first.
Competition Driven Challenges
The subsequent Figure 14 shows the total sales in the vibrant Chinese automotive
market. Here, in 2014, over 23.4 mn cars were sold. From 2000 to 2010, the average
growth rate was approximately 25%. This enormous sales potential created a need
for nearly every OEM to participate. But within the last four years, sales rates have
decreased significantly averaging at almost 6.88%.338 This indicates a developmental
change at the moment, where it is considered that the strong year 2013 was an ex-
ception of this trend.
338 Own calculations referring to the data basis of Figure 14.

Macro Environment of the People´s Republic of China
71
Figure 14: Total Automotive Sales in China
Reference: Author’s illustration referring to VDA (n. a.) (2015a), p. 21; VDA (n. a.) (2013b), p. 19.
Having a look at the operating manufacturers shows that in total, Chinese brands
capture the highest market share actually, but the premium market draws an abso-
lutely different picture, as the figure below illustrates.
Figure 15: Comparison of Market Share by OEM´s Country of Origin
Reference: Author’s illustration referring to CAAM (n. a.) (2013): The passenger cars market share of Chinese brand continued to decline; Sha et al. (2013), p. 5.
With almost 20% of overall market share German manufacturers are recently around
2.5% above the year-average of 2009. Only the sum of Chinese’s brands surpasses
the German brands. In fact, the figure looks best in the premium segment, which is
absolutely dominated by German brands. In 2012 they captured a market share of
approximately 80%. Furthermore it is estimated that this segment will grow by dou-
0!
5!
10!
15!
20!
2000! 2002! 2004! 2006! 2008! 2010! 2012! 2014!
in!mn!
Total Automotive Sales in China
20%!
15%!
12%!9%!
27%!
17%!
Market share (Jan-Sept. 2013)
German! Japanese!American! Korean!Chinese! Other!
80%!
20%!
Premium Market Share 2012
German! Others!

German Car Manufacturers in China as Research Object
72
ble-digit rates.339 On the one hand the estimated premium market growth shows a
good short-term potential for German manufacturers, but on the other hand focussing
this segment strictly is a big market limitation. Besides, as mentioned, it is short-
sighted. Furthermore, the competition within the whole car market is much higher, as
indicated through the aforementioned four-year average market grows figure of
6.88%. As pointed out in Chapter 1.1 the after-sales could contribute high profits, due
to the most likely fast growing after-sales service market, where moreover profit mar-
gins are comparably high.340
So why is the after-sales service market in China most likely fast growing? Drawing a
comparison to a mature market shows the potential. For instance, the automotive
service and repair market of the USA could be chosen. Thereby, at the end of 20th
century new car sales were almost constant at approximately 15 mn vehicles per
year. In contrast, the service market grew from 60 mn cars in 1950 towards 200 mn
cars at the end of the century. This is a remarkable rate of 13:1 in 50 years, as
WISE/BAUMGARTNER (1999) have shown. Furthermore, other authors recognise
this development industry-wide. However, the after-sales market in the automotive
industry is also described here as four to five times bigger than the OEM-sales mar-
ket,341 and renowned consultancies acknowledge the mentioned automotive after-
sales growth potential recently. Also they refer to the need for preparing for the up-
coming challenges that will result from this growth.342
In terms of competition it should be advantageous that usually relatively new cars,
which are plentiful in the market (s. Figure 14), are repaired through the OEMs’ own
or contract-related workshops. Nonetheless there are many competing providers of-
fering after-sales services, as Table 8 illustrates. Likewise, in contrast to other
emerging markets the competitive intensity in the Chinese market is relatively high,343
and as a result GEBAUER ET AL. (2010) state that ‘China is the most challenging
339 Cf. Wissmann (2013), Deutsche Automobilindustrie in China weiter auf Wachstumskurs.; Geinitz
(2013), Deutsche Hersteller fahren in China weiter an der Spitze; CAAM (n. a.) (2013), The pas-senger cars market share of Chinese brand continued to decline; Sha et al. (2013), p. 5.
340 Cf. Chapter 1.1, Status Quo and Problem Statement. 341 Cf. Wise/Baumgartner (1999), p. 134; Cohen et al. (2006), p. 129; Shuquin/Gang (2012), p. 175. 342 Cf. Mohr et al. (2013), pp. 9/13; Arthur D. Little (n. a.) (2011), pp. 1 ff.; Gebauer et al. (2010), pp.
4 ff. 343 Cf. Gebauer et al. (2010), p. 4/9.

Macro Environment of the People´s Republic of China
73
[after-sales] market’.344 Furthermore they argue that ‘companies trying to exploit the
aftermarket with a standardized global approach will most likely fail’.345
Types of Automotive Workshops in China Type Quantity Comment OEMs’ own or contracted workshops
8,000 • Notably well accepted during warranty time • The reference in terms of quality
Workshop chains 8,000 • Here, international chains play a minor role • In the past not as successful as OEM workshops
but with remarkable growth potential Tyre specialists 8,100 • At last highest growth potential
• Offering smaller repairs and services as well Special repair workshops 11,000 Free workshops, overall Category 1 = generalists Category 2 = specialists
216,000 52,000
164,000
• Category-2 workshops often have poor standards
Do-it yourself 0 • Chinese car owners do not repair by theireselves • In contrast, in Germany around 8% of all works
are ‘do-it yourself’ Total 251,000 • Competition forces a steadily quality increase
Table 8: Types of Automotive Workshops in China
Reference: Author’s table referring to Saueressig (2009), pp. 268 ff.; DAT (n. a.) (2013), p. 60.
The service provider structure in general is similar to the European structure. In Chi-
na the existing competition within the workshops has recently tended to result in bet-
ter service offerings among the OEM competitors. This is no doubt a favourable de-
velopment for customers, but a negative one for manufacturers.
Relative to competition, it is important to have a look at the aspect of protection of in-
tellectual property in China. Working with the industry, German and European gov-
ernmental agents have been trying to convince China to take care of important rights
such as design protection, as this aspect is particularly important for German manu-
facturers that are in competition with Chinese ones,346 especially because the Ger-
mans stand for innovation and highly engineered cars. China, where before 1970 no
protection of intellectual property existed, is even today, deemed to be the biggest pi-
344 Ibidem, p. 5. 345 Ibidem. 346 Cf. VDA (n. a.) (2013b), pp. 195 f.

German Car Manufacturers in China as Research Object
74
racy market in the world, with a lot of negative impacts on other market participants
and as well on consumers.347 The question of how much harm is done to German
OEMs operating in China is difficult to establish, but a comparison with Europe, made
by VDA, illustrates the degree of the problem. The estimated harm amounts to be-
tween 5 bn and 10 bn euros, which means that even if we consider only the German
automotive market more than 80% of forgeries are from China.348
However, BECKER/STRAUB (2007) point out that insufficient protection of intellectu-
al rights obviously harms the automotive industry. In fact copying parts and products
(product piracy) is the biggest challenge. Here they show for instance that in the year
2002 two very popular Chinese car models were unmistakable reproductions of VW´s
Jetta and Daihatsu´s Xiali. Moreover, the copied Jetta costs approximately half of the
original, though it was produced with some original VW parts, bought secretly from
one of VW’s Chinese production partners.349 Issues to do with collaboration and joint
ventures are taken up again below, in Political and Law Driven Challenges. In fact,
most of the experts350 who were consulted described the topic of competition through
piracy as a big challenge for after-sales service with respect to various aspects, es-
pecially in regard to the customer who might be willing to accept non-original parts.
Political and Law Driven Challenges
Foreign companies operating in China are liable to Chinese law in general and more
specifically in terms of direct investments to the Provisions on Directing Foreign In-
vestment and the Catalogue for Directing Foreign Investment. In these documents
foreign investments, and therefore also the configuration of foreign operations, are
categorised by industry sector and by whether they are prohibited, restricted, permit-
ted or encouraged.351 In fact, usually foreign enterprises have to co-operate with Chi-
nese enterprises to cope with local law. Thereby the Chinese government mainly
aims to transfer important technologies from Western firms towards domestic ones to
347 Cf. Becker/Straub (2007), pp. 263 ff.; Holtbrügge/Puck (2008), pp. 139 ff. See also statements
made by experts in Chapter 1.2, Exploratory Pre-Investigation as Relevance Rationalisation, Concretisation and Possible Addition of Topic-Choice.
348 Cf. VDA (n. a.) (2013b), p. 197. 349 Cf. Becker/Straub (2007), pp. 265 f. 350 Cf. Table 1: Experts of the Exploratory Pre-Investigation. 351 Cf. Holtbrügge/Puck (2008), p. 93.

Macro Environment of the People´s Republic of China
75
use them in the long run by coming up with discretely self-owned innovations. This
way, Chinese enterprises will strengthen their (global) competitive ability, while fos-
tering the associated Chinese.352
There are many options for collaboration, but due to the requirements of Chinese law,
capital intensity, long-term scope, and remarkably challenges of the then newness of
the Chinese market, automotive OEMs mostly founded equity joint ventures to pro-
duce in, and to penetrate China. The following Figure 16 shows selected Chinese
OEMs with important joint ventures from a German perspective on brand level.
Figure 16: Selected Chinese OEMs with Important Joint-Venture Brands
Reference: Author’s illustration referring to n. a.(2013f), Sino-Foreign Joint Ventures. 352 Cf. Jen-Kai (2011), p. 1; Holtbrügge/Puck (2008), pp. 100 f.; Meyring (2009), p. 31; Becker/Straub
(2007), pp. 201 f.; Sopha (2012), p. 98.
Chinese OEMs with joint-
venture brands
SAIC
VW
Skoda
Cadillac Buick
et al. FAW
VW
Audi
Toyota Mazda
et al.
DFM
Honda
Peugot
Citroen
KIA Nissan
et al.
GAC
Honda Toyota Fiat
Mitsubishi et al. Brilliance
BMW et. al.
BAIC
Mercedes-Benz
et al. Hyundai
Chang´an
Ford Mazda
Volvo Suzuki
et al.

German Car Manufacturers in China as Research Object
76
In Addition to the preceding figure it must be emphasised that Porsche and Opel are
only exported to China.353
The shown connections demonstrate that foreign enterprises usually do not have an
exclusive partner at the group level. This could lead to a future challenge if competi-
tion in China becomes very strong. However, nowadays the partner choice can also
be crucial. For instance, Daimler suffered when the full sales potential could not be
achieved because distribution channels and collaboration with dealers are not on a
level with those of German competitors.354 Thus, generally, the market regulation in
China is challenging, likewise in regard to the OEMs’ after-sales service strategies
because equity joint ventures are hardly changeable, and they also define partly the
subordinated downstream organisation.
The next legally respectively politically driven aspect is itself driven, namely by envi-
ronmental challenges. In the course of the rapidly growing economy, China has
struggled with a lot of negative impacts, with regard to traffic with crucial develop-
ments like heavy environmental pollution, massive traffic congestions as well as
thereby resulting health and safety issues. Politically driven car emission and traffic
regulations are the result. Thus for all new automobiles in China the Euro 1-norm
plus catalyst has been compulsory since 2000, and since 2004 regulations have
aimed at significant fuel reductions. In some regions Euro 3 is mandatory for petrol
and diesel engines, in megacities like Shanghai Euro 4 is obligatory and Beijing has
enacted a prohibition zone for diesel engines in general. Furthermore, from 2015
regulations will specify the maximum average fleet fuel consumption to 5.9 litres. This
is an aim that is unlikely to be achieved unless e-mobility is pushed quickly and effec-
tively.355 In comparison, the Chinese regulation is not as strict as the European one,
but definitely substantial. In the EU the manufacturers’ fleet average must be under
the threshold of 130 g/km CO2 by 2015. In China the intention is to reduce emissions
to 117 grams by 2020. Even this regulatory challenge is not as strict as in the EU (95
g/km) but stricter than in the USA (121 g/km).356
353 Cf. Geinitz (2013), Deutsche Hersteller fahren in China weiter an der Spitze. 354 Cf. Pretzlaff (2012), Daimler will mit dem China-Vorstand Vollgas geben; n. a.(2012f), Daimler bün-
delt Vertrieb; n. a. (2012g), Mercedes strauchelt auf Chinas Automarkt. 355 Cf. Jen-Kai (2011), p. 5. 356 Cf. VDA (n. a.) (2013b), pp. 65 f.

Macro Environment of the People´s Republic of China
77
Besides, as mentioned beforehand, in some megacities the regulation might be even
stricter. Due to the bad air quality, one option is to allow only zero-emissions cars in
inner-city zones.357 Independent of regions, sales taxes will foster small car seg-
ments. For instance, the sales tax for very large-cylinder-capacity cars is about 40
times higher than for small ones. Remarkably, the sector promoted is the same,
where domestic players have established their products respectively a good market
share.358
As in Western countries, the need in general, caused by regulation, and especially
due to the CO2-emission reduction, has a direct impact on manufacturers’ engineer-
ing and market strategies. These appear on the face of it to be huge challenges for
selling cars, and that is undoubtedly the case, but the after-sales service is also af-
fected. Due to regional regulation activities consumers might be forced to upgrade
their cars, for instance in response to a requirement to treat waste gas, if it becomes
mandatory. Even for consumers these aspects are quite challenging. That is why it is
so important to operate with proper after-sales marketing, founded on very good
knowledge of customer needs.
The last major challenge in this section regards both political and, the hereafter
shown, consumer driven challenges. Having a look back, the financial crisis and the
resulting recession affected China significantly. That is why the Chinese government
reacted by supporting ten key-industries with special emphasis. In the process, they
stimulated the domestic market with a number of subsidies. Here, amongst others
the car sales had been massively promoted in 2009 and 2010, so due to thereby in-
creased sales the automotive market in China became for first time the largest auto-
mobile market worldwide.359 However, currently the five-year plan does not foster the
whole car market again, but rather new energy cars such as those with electric en-
gines are focused on by politics, so that new energy vehicles are affiliated to the ac-
tual five-year plan.360 The electrification of the power train is one of the biggest issues
in the automotive industry presently. Indeed heavily related to engineering, this topic
is an after-sales challenge as well. The electrification challenges are a far too wide 357 Cf. Barthel et al. (2010), p. 25. 358 Cf. PwC (n. a.) (2011), pp. 69 ff. 359 Cf. Jen-Kai (2011), pp. 1 f.; Wang (2011), p. 103. 360 Cf. Table 5: The Actual Five-year Plan (2011-2015); Jen-Kai (2011), p. 6.

German Car Manufacturers in China as Research Object
78
and complex topic to be stressed in this work and this section, but having a look at
previous developments in this context is helpful.
The technical enhancement in cars in general and thereby especially the increasing
usage of complex electronics, and prospective the electric power train are challenges,
which on the one hand are consumer driven developments because the demand for
highly engineered and differentiated products increases steadily.361 On the other
hand there are challenges for satisfactory delivery of service because this complexity
must be handled especially through the personnel, which have to be trained continu-
ously for that purpose.362
Consumer Driven Challenges
Car ownership and demand will be the first issue stressed in this consumer-related
section. In this regard, data before 1997 is extremely limited. Since that time the av-
erage rate of owned cars has increased steadily.363 In a representative study, GAN
ET AL. (2014) found that 14.53% of these households own motorised vehicles such
as cars, buses or trucks. In rural areas this rate is at 10.26%, but rural households of-
ten tend to buy vehicles that are suitable for agricultural purposes. This means the
real car ownership quota is significantly smaller. Presumably the stock of German
premium cars is very small. In contrast, the urban vehicle household owner rate av-
erages 19.23% and here the most popular brand is VW followed by Toyota and
Hyundai. In contrast to the view on households, car-density is a common recognized
indicator of market penetration. The car density per 1000 inhabits in China is at about
61 whereas this figure in Germany is well above 450.364
In China 90% of the families in the total household sample own just one car. If people
of the urban households plan to buy a car, nearly 90%365 of them prefer to buy a new
one, arguably because of the prestige gain or in other words, the loss of face inher- 361 Cf. Gerischer (2010), p. 2; Fraß (2012), pp. 13/41 f.; Diez (2009), p. 91; Kremlicka et al. (2011),
pp. 10/48 ff. 362 Cf. VDA (n. a.) (2013b), p. 190. 363 Cf. Wang (2011), p. 104. 364 Cf. VDA (n. a.) (2015a), p. 21; Gan et al. (2014), pp. 83 ff.; VDA (n. a.) (2013b), p. 20; Jen-Kai
(2011), p. 2; Janovski et al. (2011), p. 95. 365 In 2011 the management consultancy Arthur D. Little publicised that, ‘Today, about 80% of cus-
tomers are first-time purchasers; (...)’ Arthur D. Little (n. a.) (2011), p. 1.

Macro Environment of the People´s Republic of China
79
ent in purchasing a used-car. This means the figure of 90% is the same whether they
owned a car before or not. As a result, today, the used-car market amounts to only
25% of the new car market. In contrast in Germany it is twice as big. Furthermore the
second car purchase in urban areas is approximately 30,000 CNY higher than the ini-
tial purchase.366 This means that achieving strong brand loyalty could be a crucial
challenge in competition, also affected by after-sales services.
Another challenge for German car manufacturer is caused by origin. As early as
1997, ASUGMAN ET AL. showed that it can be strategically harmful if global vendors
offer after-sales services of lower quality than the services offered to their domestic
market. Additionally, this takes more effect the higher the customer expectations
are.367 Within the explorative pre-investigation for this work several experts empha-
sised that Chinese expectations of European products are usually very high, and of-
tentimes even higher when it comes to German cars.368 That is why especially Ger-
man manufacturers must be alerted to the fact that knowledge of expectations can be
crucial. On the one hand this is a major challenge, because there is a lack of scien-
tific knowledge about it.369 On the other hand because this topic has recently been a
hotly disputed issue in regard with customer complaints and political agitation.370
This became important, especially for German companies, because they were met
with hostility through the Chinese state television. As a result, at least within the in-
dustry and also the German media landscape, it is deemed to be political initiated. Al-
legedly, German car manufacturers used insulating materials with unhealthy levels of
volatile gasses.371 Here, even the after-sales areas of German manufacturers have
been affected, as various examples show. So, for example, the BMW customer Mr
Zahng refers through the media to diverse problems with his two-year-old car, which
almost caused a fatality. ‘The BMW personnel all wore friendly smiles, but they
showed little sincerity to solve my problem.’372 At VW, Chinese watchdogs focussed
366 Cf. Gan et al. (2014), pp. 83 ff.; PwC (n. a.) (2011), pp. 30 f.; Green (2009), p. 264. 367 Cf. Asugman et al. (1997), p. 13. 368 Cf. Chapter 1.2, Exploratory Pre-Investigation as Relevance Rationalisation,
Concretisation and Possible Addition of Topic-Choice. 369 Cf. Chapter 1.3, Identification of a Research Gap. 370 Cf. Chapter 1.1, Status Quo and Problem Statement. 371 Cf. n. a. (2013d), China stinkt der deutsche Erfolg. 372 Zhang cited in: n. a. (2012c), Luxury int'l car brands running over Chinese trust.

German Car Manufacturers in China as Research Object
80
their attention on so-called DSG´s (direct-shift gearboxes) by gathering more than
10,000 bits of data about possible problem cases. Thus VW increased the warranty
for gear boxes to ten years or 160,000 km, which for this component is the longest
warranty time in the world.373
As stated in Chapter 3.2.2, the family as a unit is a variable that should be noted. In
terms of after-sales service there might be a challenge because the contact person
coming to the workshop is maybe only partly the real or final decision maker. In fact,
the linkage within Chinese families is, despite a lot of changes, still very strong. Fur-
thermore, a PricewaterhouseCoopers analysis shows that older generations increas-
ingly finance car purchases, when a long-run comparison since 1960 is done.374
Thus it is likely that the role or the importance of potential influencers in Chinese´s
families is different from what it is in Western ones. The automotive after-sales mar-
keting should take this ‘addressing challenge’ into consideration to be effective. Addi-
tionally, it might be beneficial to take this into consideration, especially with respect to
brand loyalty within families.
3.3 After-Sales Operations of German Automobile Brands in China
Due to the importance of origin, and a distinct identification by the Chinese, German
manufacturers are limited to corporation-based companies in this work, which means
that only BMW, Daimler, Volkswagen and their related brands are taken into consid-
eration. Usually cars and automotive performance are marketed on brand level,
which is why this research will explicitly focus on the brand instead of the group. Ad-
ditionally, success factor research with specificity ambition requires a homogenous
basic population (object of research) on at least industry level.375 Investigating the
entire group of corporation-based limited group brands would lead to heterogeneity.
For instance Porsche, as a Volkswagen brand, is mostly deemed to be a luxury
brand, but Volkswagen is considered a quality volume brand. Audi, BMW and Mer-
cedes-Benz are therefore best suited to this research – first because these three
brands are consistently seen as premium brands in China and their relevance within 373 Cf. n. a. (2013e), Quality watchdog keeps eye on VW. 374 Cf. Chapter 3.2.2, Chinese Consumer Landscape; PwC (n. a.) (2011), pp. 27 ff.; Holtbrügge/Puck
(2008), p. 147. 375 Cf. Schoeneberg (2011), p. 6/51; Trommsdorff (2009), pp. 26 f.; Haenecke (2002), p. 169.

After-Sales Operations of German Automobile Brands in China
81
the market is high,376 second because the model portfolio they offer is similar, and fi-
nally because the after-sales operations are set up in a similar way. As regards the
focus of this research, the latter aspect will be deepened as described in the follow-
ing section.
Provision of After-Sales Services by German Brands in China
Chapter 1.1 illustrates why the manufacturers` after-sales business is so essential.
There is now a need for an analysis of the after-sales provision modes to ensure that
the objectives of the chosen manufacturers are in fact realisable. The most important
consumer-related contact points in this context are car dealerships and workshops.
Car dealers usually offer after-sales services as well as sales, and thus have an inte-
grated workshop. Exceptions are so-called showrooms (typically brand bound), which
are common in Chinese metropolises such as Beijing.377 Usually they do not offer
maintenance and repair services, which is why they are not addressed in this work.
Generally dealers and workshops can be classified by manufacturers` retention
grade, in manufacturer own companies (property), brand bound companies and so
called independent companies.378 Here, the OEM`s influence declines similar to the
chronology of this enumeration.
In order to investigate the after-sales instruments for the consumer related constructs,
service satisfaction, workshop loyalty, brand loyalty and important moderating influ-
ences, one must focus on car drivers which are customers of brand bound or brand
own workshops. Only these workshops are related tightly enough to the brand. As a
result independent workshops and their customers are not part of this research.
However, brand own workshops or branches are part of the focus of this research.
The last group, the brand bound or authorised dealers and workshops are legally and
economically independent companies; therefore we must ask whether these compa-
nies are able to properly fulfill the brands` after-sales interests, objectives and speci-
fications.
376 Cf. Figure 15: Comparison of Market Share by OEM´s Country of Origin. 377 Author’s own observations on-site. The niche manufacturer, Tesla, uses the showroom concept
very intensively by consistently separating showrooms from workshops. Further information is available online at www.teslamotors.com.
378 Ref. Zerres (2010), pp. 16 f.; Diez/Reindl (2001), p. 61.
German Car Manufacturers in China as Research Object
82
Customer retention in vertical contract marketing systems (OEM/dealer) in the auto-
motive industry is researched by BODENSTEINER (2006), who states that vertical
contract marketing systems cause a harmonisation in the marketing activities of
manufacturers and dealers, and that these systems try to coordinate the interests of
the system elements.379 In addition, contract bound dealers are directly integrated in-
to the manufacturer’s marketing and business operations.380 This understanding is
transferable to service operations,381 which is why contract bound workshops suit this
research project. Finally, some China-specific information about previously limited
brands Audi, BMW and Mercedes-Benz is shown.
In 2014, 362 Audi brand dealers are listed in China, of which most are authorised
companies. Of these last, 305 offer a 24h roadside assistance service. This service
and the availability of the dealer are centrally communicated through the manufactur-
er´s brand marketing, which is derived from global marketing to specific Chinese re-
quirements by the department ‘Audi Department Brand Operations’. Note that the
brand´s online presence focusses strictly on the products.382 There is scant mention
of service aspects, but it is made clear that Audi has had a world-standard service
system in place since 2000.383 Around 330 Mercedes-Benz dealers were operating in
China, and the short-term plan is to grow the network by a further 100.384 In contrast
to Audi, the after-sales business is aggressively promoted online. Here as well, glob-
al service standards are promoted, primarily the ‘After-Sales Service Certification’,
which means that authorised dealers and their staff are qualified and trained to satis-
fy Mercedes-Benz´s global objectives.385 As well as global standards, the manufac-
turer takes responsibility for after-sales services within the OEM to-dealer value chain,
which becomes obvious through the fact that the after-sales performance is meas-
ured centrally.386 Even though BMW´s after-sales marketing is centrally controlled
and the influence on the authorised dealers is expressed through e. g. China-wide
379 Cf. Bodensteiner (2006), p. 7 and the there stated literature. 380 Cf. ibidem, p. 33. 381 Cf. Diez (2009), pp. 183. ff. 382 Cf. Audi China (n. a.) (2014). 383 Cf. ibidem, Audi in China. 384 Cf. Daimler AG (n. a.) (2014), p. 153. 385 Cf. Mercedes-Benz China (n. a.) (2014a), After-Sales Training and Certification. 386 Cf. Mercedes-Benz China (n. a.) (2014b), After-Sales Research Projects.
Interim Conclusion and Delimitation of the Research Object
83
unified prices for service packages. Finally, BMW has 184 official brand dealerships
registered.387
The logical conclusion is that all three brands operate a vertical contract system with
owned or authorised dealers. This means that the brand´s communication about
dealers usually includes workshop services. As a result, from here on, every dealer-
ship mentioned also runs a workshop. Moreover, the after-sales services that are ex-
ecuted through these dealers are strongly coordinated, influenced and marketed by
the related manufacturers. As a result this limited group makes a homogenous object
of research.
3.4 Interim Conclusion and Delimitation of the Research Object
As was shown in Chapter 3.1, car manufacturers operate as system leaders in the
automotive industry. As a result, the production process in particular requires a highly
co-operative workflow, whereby around 75% of value added is contributed by the
supplying enterprises. Despite this major share, the mostly small- or medium-sized
suppliers are fairly dependent on OEMs. German car manufacturers can themselves
be delimitated in two ways: they are either location-based or corporation-based
(origin). The latter includes all brands of BMW, Daimler and VW because their head-
quarters are in Germany, but excludes Ford and Opel.
However, independent of this, the German market is characterised by an oligopolistic
structure on the supply side, where the five biggest manufacturers capture 71% of
market share. But the German market has been stagnating for quite some time and
growth opportunities are located in foreign markets as was demonstrated on an in-
dustry level. To complete the market analysis consumers are targeted. Here, all ex-
amined aspects, such as for instance demographic development, affordability and
car use, indicate that the saturated car market is inclined to become more challeng-
ing rather than to grow significantly. In terms of growth and after-sales potential, to-
day China is deemed to be the most important market. To penetrate this market,
German OEMs use local production approximately ten times as much as export.
387 Cf. BMW China (n. a.) (2014), BMW Aftersales.

German Car Manufacturers in China as Research Object
84
Relying on this insight, Chapter 3.2 deals with China, starting with a description of the
macro environment. Here it must be emphasised that this work always refers to the
People´s Republic of China. An examination of the economy shows that very fast
growth, with double-digit rates, is over. Real GDP rates under 8% are expected in fu-
ture. Even if China becomes more and more market orientated, political planning still
leads the way, whereas five-year plans are used as general guides. China is current-
ly striving to move its economy towards service-orientation and sustainability. As a
result, fostering the entire automotive industry ended in 2011.
The Chinese consumer landscape is extremely heterogeneous and various social
and economic disparities were apparent. Due to this complexity, households respec-
tively families, as very important Chinese units, were given special emphasis. The
average Chinese household, with nearly three members, is larger by one than a
German household. Regarding income, as a major topic, it was demonstrated that
the general level and thereby the buying power rose constantly in the past. But this
positive gain is, again, very unequally distributed. This is most obviously the case
with regard to regions, so the mean urban per capita income (24,565 CNY/€ 2,926) is
three times as high as the rural income. Moreover, credit-financed consumption is
much less common in China than in Western countries and the car is the only note-
worthy durable good that some Chinese borrow for.
Afterwards the challenges to after-sales service in the Chinese car market were in-
vestigated. First a market overview and competition driven issues were stressed,
whereby it was shown that Chinese manufacturers have the biggest market share.
An important exception is the premium market, where German manufacturers cap-
ture approximately 80% market share. In total, the Chinese car market growth de-
creased recently, but the less focused after-sales market of today provides remarka-
ble potential. However, the competition in this sector is getting stronger. With respect
to law-driven challenges, German OEM joint ventures and environmental impacts
were emphasised. Thus emission-reduction requirements and car-permit restrictions
are major challenges. The consumer-related section showed that in rural areas vehi-
cles are often used for agricultural purposes. German premium cars are most likely to
be used in urban areas, where the household-owner rate is approximately twice that
of rural areas. Offering after-sales of a low quality could be harmful, as ASUG-

Interim Conclusion and Delimitation of the Research Object
85
MAN ET AL. showed as long ago as 1997. Right now this aspect is up to date be-
cause German manufacturers are hit by hostility among complaining customers and
corresponding political agitation. Furthermore this has a strategic impact because
origin388 is a very important aspect for Chinese customers, and expectations of Ger-
man products and services are usually very high. Combined with the findings men-
tioned beforehand about Chinese households, families might play an important role
in the after-sales marketing; mainly in respect of potential influencers who live in rela-
tively big and strong communities, where furthermore older generations often pur-
chase their children´s cars.
The assessment of all these findings combined with the ones of the first two chapters
shows that a major challenge for German premium car manufacturers is the best
possible establishment within the existing market rather than focussing on penetrat-
ing China only via new car sales. As stated in Chapter 1.3, customer-orientated, sci-
entific research is limited in regard to German car manufacturers offering after-sales
services in China. Concrete knowledge concerning important performance success
factors is very beneficial for practitioners as well; especially if this allows the impact
of moderating effects to be revealed.
Finally, the after-sales operations of German automobile brands in China, and there-
by especially provision modes, are analysed, which leads to the following delimitation.
Delimitation
Due to the importance of origin, and a clear identification by the Chinese, German
manufacturers will be limited to corporation-based companies in this work, which
means that only BMW, Daimler, Volkswagen and their related brands are taken into
consideration. In order to specify this aspect, and to support the need for a homoge-
nous object of research, only customers of brand own and authorised dealers from
the premium brands of Audi, BMW and Mercedes-Benz will be discussed – only driv-
ers of cars, which means that utility-vehicle customers are explicitly excluded. Due to
the findings of this chapter, and in accordance to SUN/WU´s (2004) argumentation to
388 Cf. Chapter 2.3, Chinese Buying Behaviour and Country of Origin Effects.
German Car Manufacturers in China as Research Object
86
carry out an urban versus rural segmentation instead of a regional one,389 this empir-
ical research and the survey will be done with customers living in big cities in urban
regions, because the intention is to examine the success factors and moderating in-
fluences on after-sales rather than of sales. Therefore the people must both own a
car made by the above-mentioned brands and be accessible. This is because of the
research design, which is intended to take account of cultural aspects as well as the
latent variable brand loyalty. Thereby, again the limited extent of available data for
people living in rural areas, especially in regard to this special research design,390
supports the urban delimitation.
The next chapter sets the conceptual foundation, which is needed to investigate the
after-sales success factors for the object of research as delimited above.
389 Cf. Sun/Wu (2004), p. 249. 390 Cf. Wang (2011), p. 104; Assessment of Chapter 2.

Conceptual and Theoretical Foundation
87
4 Conceptual and Theoretical Foundation
4.1 Conceptual Reference Frame
The development of a conceptual reference frame is the starting point of this chapter,
in which the conceptual foundations are elaborated. The reference frame helps to
structure and systematise the research process in a transparent and comprehensible
manner, to show possible problem fields, and in particular to steer the conceptual
and theoretical foundations during this process.391
The conceptual reference frame expresses topic areas, where relevant cause-effect
relationships occur, so that potential success factors can be identified specifically.392
Because the objective of this work is to identify what determines the success of after-
sales in automotive marketing, with a special concentration on Chinese cultural influ-
ences, service satisfaction, workshop loyalty, brand loyalty and Chinese culture are
the topics considered. The perspective of the three automobile brands of Audi, BMW
and Merced-Benz are of particular interest, which is why a special emphasis is
placed on two areas: first, the OEM´s after-sales marketing with resulting after-sales
instruments and their impacts on service satisfaction; second, cultural issues, which
can be assumed to affect the entire functional chain from service satisfaction to
brand loyalty. Consequently the interests of individual car dealerships are not con-
sidered.
This research work focuses on the customer, therefore knowledge of customer per-
ception is highly relevant. In order to consider all possible success variables, the
success factors that can be directly influenced by the OEM must be investigated as
well as those that the OEM influences only indirectly or not at all. Considering this,
and to be able to give insights into the entire after-sales process chain, a success in-
dicator must be derived on the basis of the constructs disambiguation. Afterwards the
model variables and the related causal relationships have to be identified to finally
elaborate the conceptual model. Likewise, research hypotheses are elaborated and
391 Cf. Dorka (2012), p. 88; Schoeneberg (2011), pp. 59 f.; cited literature in Chapter 1.5, Excursus. 392 Cf. Thiebes (2012), p. 49.

Conceptual and Theoretical Foundation
88
theoretically founded, because this combined with the research model reflects the
basic structure for the empirical work and the resulting questionnaire.
The aforesaid steps are summarised graphically, whereas formally, the reference
frame is a provisional explanation model. Drawn as a diagram of boxes and arrows,
where the boxes represent the categories of interest.393 The reference frame on a
meta level, for the entire research process, was already shown in Figure 2, the de-
tailed conceptual reference frame is presented next in Figure 17.
Figure 17: Conceptual Reference Frame
Reference: Author’s illustration.
4.2 Disambiguation
Assumed assertion patterns are based on hypothetical constructs. In scientific use
this means these constructs must be precisely defined, free of contradiction and 393 Cf. Kubicek (1977), pp. 17 f.
Chapter 4
Conceptual and Theoretical Foundation
Chapter 3
Research Object –
German Manufacturers in
China
Chapter 3.4
Delimitation
Audi, BMW, Mercedes-Benz and their After-
Sales Operations
Cha
pter
4.2
Cha
pter
4.3
Dis
ambi
guat
ion
Suc
cess
Indi
cato
r
Chapter 4.4
Determination of Model Variables & Hypotheses
Chapter 5
Empirical Research
Cus
tom
er S
urve
y
Chapter 4.5
Conceptual Research Model and
Overview of Hypotheses
Chapter 4.4.1
Relationship between Satisfaction and
Loyalty
Chapter 4.4.2
After-Sales Marketing Instruments
Variable
Variable
Variable
Chapter 4.4.3
Cultural Influences
Chapter 4.4.4
Control Variables
Variable
Variable
Variable
Variable
Variable
Suc
cess
Fac
tors

Disambiguation
89
comprehensible. Only in this way it is possible to formulate valuable cause-effect re-
lationships and hypotheses for empirical testing, because indistinct terms would lead
to mistakes and inaccuracies in measurement.394
4.2.1 Success
The research design of this work is basically determined through the applied re-
search method, success-factor research. Here, the assumed relationships have to be
mathematically transformed, formally structured and statistically assessed so that
cause-effect relationships affecting success can be uncovered.395 In this regard it is
important to define what we understand by success.
Success by itself is a complex, abstract and not directly measurable construct. Even
in the context of scholarship no unified definition exists. This means that context and
precise descriptions are essential to define its content.396 In order to be able to ex-
press the construct success, it is also necessary to choose one or several suitable
success indicators, because a construct is hypothetically and therefore not directly
measurable (latent variable). But observation or measuring becomes possible by us-
ing indicators,397 which can be defined following BOLLEN (2011): ‘Indicators are ob-
served variables that measure a latent variable.’398 Due to the operationalisation of
these indicators,399 it is possible to measure success and the individual influence of
each success factor.400
As mentioned above, the context must be stressed first. In the course of this work
three brands are chosen, which undoubtedly lead to a company-related context. As
SCHOENEBERG (2011) states, a company’s success is mostly considered to be the
achievement of that company’s objectives.401 Companies usually have a bundle of
394 Cf. Töpfer (2012), pp. 53 f./72 f. 395 Cf. Fischer (2013), p. 54; Backhaus et al. (2011) pp. 65 ff. 396 Cf. Dorka (2012), p. 103; Schoeneberg (2011), p. 47; Freiling (2006), p. 177; Woywode (2004), pp.
22 f.; Bachmann (2009), p. 90. 397 Cf. Backhaus et al. (2006), p. 340; Töpfer (2012), pp. 53 f.; Kuß (2011), pp. 154 ff. 398 Bollen (2011), p. 360. 399 Cf. Chapter 5.2.2, Operationalisation. 400 Cf. Schoeneberg (2011), p. 48; Sass (2012), p. 23; Forsmann et al. (2004), p. 3. 401 Cf. Schoeneberg (2011), p. 47, and the literature cited there.

Conceptual and Theoretical Foundation
90
monetary and non-monetary objectives,402 and companies are successful to the de-
gree that they achieve their system of objectives.403 Therefore success is strictly re-
lated to the company`s objectives, which is why the success indicators of this re-
search are derived from objectives.
When considering the target system of service enterprises, MEFFERT/BRUHN
(2009) show that success is dependent to three target dimensions, the so-called en-
terprise-directed, customer-directed and staff-directed target dimensions. These di-
mensions are linked, and thus they form a success chain. The authors argue that the
link between companies and customers is of special importance ‒ for instance, what
business provisions (input) are required in order to generate effects on the customer
side (output).404 Because of that, and due to the customer orientation of this research,
first, the staff-directed target dimension will not be considered. Second, obviously the
customer-directed target dimension seems to be worthy and relevant.
‘[Customer directed objectives] (..) are virtually directly aligned with what determines
purchasing behaviour, i.e. the key influencing factors of service marketing.’405 Cus-
tomer related objectives can be differentiated into three topic groups, psychological
(e. g. image, quality perception and customer satisfaction), behavioural (e.g. repur-
chase behaviour, recommendation behaviour and customer retention) and economi-
cal (e.g. customer value) objectives.406 It should be noted that even psychological
and behavioural objectives lead both directly and indirectly to economic gain. Also,
customer-directed objectives have an impact on enterprise-directed objectives.407
This is important insofar as any after-sales marketing objective has to be in line with
the context of the entire company (enterprise objectives).408
402 Cf. Dorka (2012), p. 103; Kotler et al. (2010), p. 15; Müller-Stewens/Lechner (2005), p. 243; Fisch-
er (2013), p. 57; Dess/Robinson (1984), p. 265. 403 Cf. Baumgarth/Evanschitzky (2009), p. 243; and basically Etzioni (1964), pp. 1 ff. 404 Cf. Meffert/Bruhn (2009), pp. 139 f. 405 Ibidem, p. 142. 406 Cf. ibidem. 407 Cf. Esch et al. (2008), pp. 24 ff.; Meffert (1994), p. 96; Meffert/Bruhn (2009), pp. 139 ff.; Edvards-
son (1997), p. 36. 408 Cf. Hättich (2009), p. 83; Homburg/Krohmer (2009), p. 416; Meffert/Bruhn (2009), p. 138.

Disambiguation
91
After-Sales Marketing Objectives
As shown in Chapter 1.2, experts highly recommend the use of brand loyalty as an
expression of success in after-sales marketing for China. Moreover, brand loyalty has
a very high scientific and practical relevance.409 Finally, German premium car manu-
facturers face a major challenge in attempting to establish the best possible after-
sales market in China.410 Brand loyalty also suits the companies` customer-directed
target system mentioned above, because it is a kind of customer retention (behav-
ioural). Following these aspects, Figure 18 summarises the service success chain411
in connection with the assumed after-sales process chain.
Figure 18: Success Chains of Consumer Behaviour and Automotive After-sales Service
Reference: Author’s illustration referring to Meffert/Bruhn (2009), p. 91.
So far brand loyalty seems to be an adequate success indicator, but the final deter-
mination takes place in Chapter 4.3, because the proposed and their related con-
409 Cf. Chapter 1, Introduction and 2, State of Research. 410 Cf. Chapter 3.4, Interim Conclusion and Delimitation of the Research Object. 411 Cf. Meffert/Bruhn (2009), p. 91.
Ac#vi#es(of(Service(
Marke#ng(
Psychological(Effect(
Behaviroural(Effect(
Economic(Succes(
Effect(Factors(of(Consumer(Behaviour(in(the(Service(Sector(along(the(Success(Chain(
Customer(Sa#sfac#on(
Image(
Quality(Percep#on(
Rela#onship(Quality(
Commitment(
Customer(Reten#on(
(ReC)(Purchase(
MouthCtoCMouth(
Communica#on(
Addi#onal(Purchase(
Customer(Directed(AGerCsales(Service(Objec#ves(within(the(Success(Chain((
AGerCsales(Instruments(
Service(Sa#sfac#on(
Workshop(Loyalty(
Brand&Loyalty&
Economic(Success(

Conceptual and Theoretical Foundation
92
structs as well require a disambiguation. This will happen along the success chain (s.
Figure 18) in the next section, starting with the definition of service and after-sales
service. The explanation of the term culture closes this section.
Success Variables (Factors)
Success itself, as mentioned earlier, can be seen as a result of numerous influences.
Within success factor research it is assumed that just a few influencing factors have
a significant impact on success or success indicators. These factors are called suc-
cess factors and they are conceptualised as success variables.412 Success variables
can be separated into internal and external variables, where internal variables are in-
fluenceable through the company. Influencing the external variables is difficult or im-
possible, because they are part of the companies´ environment. Both kinds can have
a direct or indirect effect on success. Success can also be influenced by mediator
and moderator variables.413 Mediators are often latent and they have an effect be-
tween the independent variable and the dependent variable. If the mediator occurs
directly between the two, complete mediation is given. The indirect path from the de-
pendent variable via the mediator towards the dependent variable is called partial
mediation. Moderators are variables, which indirectly affect the relationship between
independent and dependent variables.414 All these variables together describe the to-
tal of all potential success factors.415
The present work considers all of these sorts of influences with a focus on both the
directly influenceable after-sales service instruments along the process chain and the
effects that are not influenceable, which are the result of Chinese culture (green box-
es). Figure 19 shows all of these sorts of variables and exemplary relationships in a
simplified and abstract manner.
412 Cf. Chapter 1.5, Success Factor Research. 413 Cf. Fischer (2013), pp. 58 f.; Herr (2007), pp. 45 f.; Töpfer (2012), pp. 160 f. 414 Cf. Töpfer (2012), pp. 160 f.; Müller (2009), pp. 237 ff. 415 Cf. Fischer (2013), p. 59.

Disambiguation
93
Figure 19: Relationship of Success Variables
Reference: Author’s illustration referring to Fischer (2013), p. 59; Herr (2007), p. 46; Töpfer (2012)
p. 161; Steffenhagen (1997), p 327 ff.
4.2.2 Service and After-Sales Service
The cross-industry and automotive-specific relevance of after-sales was exemplified
in the introduction to this work.416 The after-sales service was then described as a
manufacturers` performance that usually sustains or enhances the utility or value of a
core performance in the form of service. Furthermore it was shown that, within the
automobile context, this often includes performances in-kind, such as spare parts.417
Amongst others things, this apparent contradiction makes a definitional concretisa-
tion of the term after-sales service necessary. The relevant literature provides no uni-
fied definition,418 but indicates that the chosen perspective is important,419 which is
why the following explanations are given, in order to enable a proper derivation.
416 Cf. Chapter 1.1, Status Quo and Problem Statement. 417 Cf. Chapter 2.2, After-Sales. 418 Cf. Fitzsimmons et al. (2014), p. 4; Fischer (2013), p. 60; Saccani et al. (2007), p. 54; Dangelmaier
et al. (2006), p. 155; Edvardsson et al. (2005), pp. 107 f.; Goffin (1999), p. 374. 419 Cf. Edvardsson et al. (2005), p. 107.
Sum$of$Success$Factors$
Internal Success Variable
External Success Variable
Mediator Variable (Complete Mediation)
Moderator Variable
Success
Mediator Variable (Partial Mediation)
External Success Variable

Conceptual and Theoretical Foundation
94
Services can be seen as economic goods, which generally serve to satisfy human
needs.420 Within marketing they depict that parent category, where the after-sales
service is usually incorporated performance typologically.421 A comprehensive dis-
tinction between services and tangible goods, as well as a detailed description of
service characteristics, will not be undertaken in this work because, as mentioned be-
fore, the term is not clearly defined, the concept itself is criticised, because different
scholars exist,422 and finally as basic characteristics (mainly: inseparability, hetero-
geneity, intangibility, and perishability)423 could be looked up in established litera-
ture.424 As a result, the focus is laid on automobile-specific aspects, but a possible
and popular definition of services by MEFFERT/BRUHN (2009) is given next. The
author follows on that definition.
‘Service deliverables are independent, marketable benefits associated with provision
of (as in the case of insurance services) and/or the application of (as in hairdressing)
expertise ‒ potential approach. Internal factors (such as business premises, staff and
equipment) and external factors (i.e. those not within the control of the service pro-
vider) are combined as part of the production process ‒ process approach. The com-
bination of factors offered by the service provider is applied with the goal of providing
benefits (such as car servicing) to the external factors, to people (e.g. customers)
and to their objects (e.g. the customer’s car) ‒ results approach.’425
To systemise automotive services, first it is important to distinguish between compa-
ny- and market-directed dimensions. The company-directed dimension shows
whether the service belongs to a company’s core performance, called primary ser-
vice, or to an additional or supporting performance that is named secondary ser-
vice.426 Analogous to the term service, descriptions vary across authors, thus for in-
stance ZEITHAML ET AL. (2013) speak of pure service companies, selling services
as a product (cf. primary), and services provided in support, namely customer service 420 Cf. Dirlenbach (2009), pp. 20 f.; Corsten/Gössinger (2007), p. 19. 421 Cf. Dirlenbach (2009), p. 20; Meffert/Bruhn (2009), p. 5. 422 Cf. Zeithaml et al. (2013), p. 4.; Edvardsson et al. (2005), pp. 107 ff. 423 Cf. Edvardsson et al. (2005), p. 108. 424 Concerning the distinction between services and their characteristics s. for instance Fitzsimmons et
al. (2014), pp. 1 ff.; Zeithaml et al. (2013; 1996), pp. 1 ff.; Meffert/Bruhn (2009), pp. 1 ff.; In the au-tomotive context Dirlenbach (2009), pp. 20 ff. or Mann (1995), pp. 447 ff. can be emphasised.
425 Meffert/Bruhn (2009), p. 19. 426 Cf. Meffert/Bruhn (2009), p. 14.

Disambiguation
95
(cf. secondary).427 PEPELS (2007) describes primary services as independent sales
objects, which are characterised by the independence of core products.428 The refer-
ence object of this research is always the manufacturer’s after-sales business, which
is why pure primary services are not considered. Secondary services, also commonly
called customer services, are not autonomous, they are based on a core perfor-
mance, which can be a tangible good or a service. Consequently they are part of a
performance bundle; 429 here, in the context of the chosen research perspective, re-
lated to the car as the OEM´s core performance. MANN (1995) stated in this regard,
‘Services constitute […] secondary services that aim to increase customer satisfac-
tion by enhancing the value of the product and/or the benefit to the customer.’430 Fur-
thermore he notes that the distinction between primary and secondary services is not
always clearly possible, because the huge wide range of possible services can be re-
lated to all purchase phases.431 This is a relevant aspect that is stressed before the
market-directed dimension is described.
Generally, market performances can be distinguished temporally. Here, a three-
phase approach is applied to discriminate between the service-purchase related
phases, the phase before a market performance or before making a purchase (pre-
sales), the phase during the purchase (at/in sales), and the post purchase phase (af-
ter-sales).432 This distinction appears to be linguistically unambiguous, but in practice
it comes to overlaps, such as when advisory services towards the product usage are
used as sales arguments, and afterwards, during the usage, as utility bringing advi-
sory services. In regard to the object of research, any services, which are significant-
ly elaborated before or during the car sale, are not considered in this work. The same
applies for the special case of ‘primarisation’433 of secondary services, which de-
scribes the independent marketing of these services. Consequently, the automotive
after-sales services considered here are seen as secondary services in terms of cus-
tomer services.
427 Cf. Zeithaml et al. (2013), pp. 4 f. 428 Cf. Pepels (2007), p. 14. 429 Cf. ibidem, pp. 14 f. 430 Mann (1995), p. 447. 431 Cf. ibidem. 432 Cf. ibidem, p. 447; Sass (2012), p. 57; Foscht/Swoboda (2011), p. 35; Corsten/Gössinger (2007), p.
27; Gouthier (2013), p. 133. 433 For further information s. Gregori (2006), pp. 113 f.

Conceptual and Theoretical Foundation
96
As mentioned before, it is important to consider the market-directed dimension,
where it is distinguished: the market on which market services are offered. They can
be of a consumptive nature (consumptive services), if they are directed to private end
consumers, or of a productive nature, if they are investment-related (investing ser-
vices), thus commercial companies are addressed.434 Although in practice cars can
be used privately, commercially or both together, this consumer-focussed research
will not consider commercial buyers, because they have significantly different needs
and structures (e.g. professional buying centre) from those of individuals.
Next, the service content can differ, according to whether it is technical or commer-
cial.435 Automobile technical after-sales primarily ensure the use of the vehicle. Pre-
dominantly it relates to maintenance and repair services, but spare part supply, and
disposal services are also seen as potential aspects of this area.436 Commercial sec-
ondary services can be consultations, personal as well via hotline; training sessions;
and calculations of profitability. 437 Automobile-specific, also mobility services, such
as pick-up and delivery services are common, which shows that both technical and
commercial aspects are relevant in this after-sales context.
As part of technical after-sales services, spare part deliveries have been included,
although this can contain the pure trade of material goods, if the customer orders a
spare part from the workshop and installs it personally. In Germany, for example, this
do-it-yourself market has an 8% share of the market as a whole, and is applied pri-
marily to cars eight or more years old.438 However, in China, do-it-yourself work ac-
counts for an irrelevant or extremely small percentage of the market.439 A categorical
distinction is almost impossible because it is difficulty to capture whether a commer-
cial secondary service, such as a consultation, is being given at the same time. Final-
ly, this special distinction is unusual in the automotive industry.440 The author there-
434 Cf. Pepels (2007), p. 15; Meffert/Bruhn (2009), pp. 14 f.; Diez (2009), p. 399; Kotler et al. (2007),
p. 550. 435 Cf. Pepels (2007), p. 15. 436 Cf. Diez (2009), p. 176; Pepels (2007), p. 15; Mann (1995), p. 447. 437 Cf. Pepels (2007), p. 15; Pflaum (2007), p. 203. 438 Cf. DAT (n. a.) (2013), p. 60, Here, around 20% of surveyed people bought these spare parts in
brand workshops. 439 Cf. Table 8: Types of Automotive Workshops in China. 440 Cf. Hättich (2009), p. 36; Diez (2009), p. 176.

Disambiguation
97
fore takes the common view espoused by DIEZ (2009),441 which means that spare
parts supply is considered as part of after-sales services. The previous explanations
are now summed up in Table 9, where the conceptual classification and delineation
of the automotive after-sales service is coloured out. Areas, which are marked by a
red cross, are not considered.
Conceptual Classification of After-Sales Services
Kind of Performance Layer
Services Performances in Kind
Marketing Sector
Primary Service
Secondary Service (Consumer and Capital Goods)
Company-directed Dimension
x Pre- sales
At/In- sales
After-sales (x) Temporal Phase/
Time of Event x x Consumptive Investing x Market-directed
Dimension Commercial Technical Content
After-Sales Service Spare Part Delivery
Automobile Industry Usual
Table 9: Conceptual Classification of After-Sales Services
Reference: Author´s illustration.
Besides this derivation, one aspect of the service-dominant logic (S-D logic), invent-
ed by VARGO/LUSCH (2004, et al.),442 will be inspired, because it fits perfectly from
the perspective of providing after-sales services, ‘(...) S-D logic views goods [cars] as
being merely vehicles for the provision of service, (...).’443
In the light of the foregoing, and due to the great diversity of services within the au-
tomotive industry, the definition of the automotive after-sales service shall follow a
general perspective: The after-sales service covers all potential and actual activities
provided by a business so as to obtain, reproduce or enhance utility value after a car
sale, and to support the customers, for example in terms of disposal.444 From a cus-
441 Cf. Diez (2009), p. 176. 442 Cf. Vargo/Lusch (2004), pp. 1 ff. For this, a profund and brief introduction is given by Edvardsson et
al. (2011), pp. 327 f. 443 Edvardsson et al. (2011), p. 327 referring to Flint (2006), p. 349 ff.; Vargo/Lusch (2008), p. 7. 444 Cf. Saccani et al. (2007), p. 54; Zollikofer-Schwarz (1999), p. 22; Asugman et al. (1997), p. 12.

Conceptual and Theoretical Foundation
98
tomer perspective it is therefore a ‘(…) tangible good related customer service after
the car purchase (..).’445
Additionally, secondary services can be classified according to the degree of core
performance dependence, and to customer expectations as well, in: must, shall and
can services.446 Repairs and warranty obligations are must services in the automo-
tive industry; an internal car rental agency at dealerships is considered a shall ser-
vice; an integrated cafeteria, because it does not affect core performance, is consid-
ered a can service.447 Thereby, this can area provides the biggest differentiation po-
tential, as both customer expectations and market distribution of such services are
usually weak ‒ always assuming it offers real benefits to the customer.448
4.2.3 Customer and Service Satisfaction
In Chapter 4.2.1, the after-sales process chain as well as the service success chain
were discussed, and the construct of brand loyalty was suggested as a possible suc-
cess indicator. Moreover, Figure 18 indicates that brand loyalty is a result of preced-
ing constructs within this chain, where customer satisfaction marks a very important
link in the chain.449 It is considered as both crucial for long-term business success,450
and ‘(...) a key element of today´s marketing theory and practice.’451
The scientific literature has elaborated different concepts and various definitions of
customer satisfaction, but most of them apply the basic idea that customer satisfac-
tion is based on a complex comparison process between the perception of a perfor-
mance (the should component) and the subjective consume experience (the is com-
ponent).452 The origin of this way of thinking is the Confirmation/Disconfirmation
445 Hättich (2009), pp. 33 f. 446 Cf. Pepels (2007), p. 14; Sass (2012), p. 60; Gregori (2006), p. 115. 447 Cf. Diez (2009), p. 164; Laakmann (1995), pp. 13 f. 448 Cf. Gregori (2006), p. 115; Laakmann (1995), p. 14. 449 Cf. Figure 18 Success Chains of Consumer Behaviour and Automotive After-sales Service; Mef-
fert/Bruhn (2009), p. 53; Homburg/Krohmer (2009), p. 45; Bloemer/Pauwels (1998), p. 86. 450 Cf. Hogreve et al. (2013), p. 180. 451 Löffler/Decker (2012), p. 404. 452 Cf. Fitzsimmons et al. (2014), p. 144; Zeithaml et al. (2013), p. 80; Hättich (2009), p. 75; Mef-
fert/Bruhn (2009), p. 92; Kotler et al. (2007), p. 46; Scheuch (2007), p. 80; Oliver (2010), p. 8; Homburg/Krohmer (2009), pp. 43 f; Foscht (2002), p. 84.

Disambiguation
99
(C/D)-paradigm initiated by OLIVER (1980). Popular alternatives ‒ for instance the
attribution theory and the theory of justice ‒ are less widespread in terms of customer
satisfaction, and moreover they could be seen as additional explanation approaches
in line with the C/D-paradigm.453
A general concept is given by KOTLER ET AL. (2007), who base customer satisfac-
tion on the concept of value profit gain. The customer will choose the performance
with the highest value profit, where this describes the difference between the sum of
value and of cost. After the consume experience, satisfaction results in dependence
to the degree of achieving customers expectations (perceived value profit).454 Thus
they define that ‘Satisfaction derives from a feeling the customer experiences as a
result of comparing perceived value gain (...) with expected value gain (...).’ 455
STAUSS/NEUHAUS (2000) say that customer satisfaction is to be interpreted as a
complex construct with an affective (emotional, attitudinal), cognitive (knowledge,
perception) and intentional (or conative: behavioural intention, willingness to pur-
chase) component.456 The aforementioned process of comparison seems to mainly
describe a cognitive process, but this definition shows that it is also very important to
consider affective components, to be able to explain satisfaction-related consumer
judgments properly. The same holds for conative components, which in terms of
conceptualisation are usually captured separately. As a result customer satisfaction
usually contains the three mentioned elements (affective, cognitive, conative).457
Likewise very popular but somewhat more specific is the definition by OLIVER
(2010): ‘Satisfaction is the customer´s fulfilment response. It is a judgement that a
product/service feature, or the product or service itself, provided (or is providing) a
pleasurable level of consumption-related fulfilment, including levels of under- or over-
fulfilment.’458 This definition applies well to the current study, because it explicitly
considers services, integrates the affective component (‘pleasurable’), distinguishes
453 Cf. Borth (2004), p. 16 ff. 454 Cf. Kotler et al. (2007), pp. 43 ff. 455 Ibidem, p. 46. 456 Cf. Stauss/Neuhaus (2000), p. 79 457 Cf. Borth (2004), p. 12. 458 Oliver (2010), p. 8; Based on his definition from 1997.

Conceptual and Theoretical Foundation
100
between different fulfilment levels, and finally it has proved in a relevant scientific
context.459
Next, the automobile-specific context needs to be applied to this construct. Here, it is
common to differentiate customer satisfaction in: product, price, purchase and ser-
vice satisfaction.460 Due to the after-sales focus of this work, the car as a product and
all purchase-related aspects are not considered, so service satisfaction is clearly
most important. However, this service-related view contains aspects such as the
price, but here the service price level is crucial, and that is therefore what is re-
searched, not the vehicle’s price. To be precise, the used satisfaction construct of
this work is called after-sales service satisfaction. In line with the previously men-
tioned success chain, loyalty constructs are considered next.
4.2.4 Brand and Workshop Loyalty
Brand Loyalty
High customer satisfaction could be beneficial for companies in various ways, but it
does not necessarily lead to economic gain. In line with the aforementioned conative
components the focus must be on behavioural effects resulting from satisfaction. On
this subject, HOMBURG/KROHMER (2009) state that customer satisfaction affects
two areas, customer loyalty and price-related behaviour (willingness to pay).461 The
latter is not considered here, due to the focus chosen for this research. Nor is cus-
tomer loyalty itself discussed separately. Furthermore, brand loyalty is a part of cus-
tomer loyalty, where a single brand is the point of interest, and not for instance a
product. However the basic assumptions are equal.462
Customer and brand loyalty are sometimes used identically with similar constructs
such as retention or attachment, and moreover for each there is no generally accept-
ed definition in marketing science.463 Customer retention describes a phenomenon
459 Cf. Hünecke (2012), p. 9; Westbrook/Oliver (1991), pp. 84 f. 460 Cf. Hünecke (2012), p. 49; Diez (2009), p. 80; Hättich, (2009), p. 136; Verhoef et al. (2007), p. 99. 461 Cf. Homburg/Krohmer (2009), p. 45. 462 Cf. Foscht/Swoboda (2011), p. 244. 463 Cf. Skala-Gast (2012), pp. 36 f.; Knörle (2011), p. 89; Hättich (2009), p. 77; Liljander/Roos (2002),
p. 594; Foscht (2002), p. 48.

Disambiguation
101
which is related to the seller’s/buyer’s business relationship. This relationship can be
considered in terms of both the provider’s (seller’s) perspective and the customer’s
perspective. The distinction from loyalty is that loyalty focuses merely on the custom-
er´s perspective, which makes the construct a bit more specific.464 Additionally, the
German brand science specialist ESCH (2010) argues that customers can have an
emotional attachment to a brand without having used a single product of this brand,
such as Ferrari fans who are not owners, but are nonetheless passionately engaged
in Ferrari communities. In contrast, loyalty is necessarily built on the use of the
brand;465 or experience with a car of the brand, as was mentioned in the previous
chapters of this work.
Brand loyalty was originally understood as a behavioural reaction in terms of observ-
able phenomena. Later the attitudinal approach arose, because it was seen as re-
quired to implement the consumer’s actual preferences. Finally, loyalty was not
merely viewed as a result, but rather as a relational phenomenon. Which is why
some authors strictly focus on the relational understanding to explain loyalty.466
KNÖRLE (2011) shows a good overview about essential definition approaches (s.
Table 10).
464 Cf. Foscht/Swoboda (2011), p. 249. 465 Cf. Esch (2010), pp. 72 f. 466 Cf. Knörle (2011), pp. 90 ff.; Foscht (2002), pp. 39 ff.

Conceptual and Theoretical Foundation
102
Author & Year Definition Focus
CUNNINGHAM 1956
‘the proportion of total purchases by the largest single brand’
Behavioural Approach
NEAL 1999
‘The proportion of times a purchaser chooses the same product or service in a category compared with his or her total number of purchases in a category, assuming that acceptable competitive products or services are available’
DAY 1969
‘true brand loyalty occurs when the customer holds favourable attitude toward the brand in addition to purchasing it repeatedly’
Behavioural and
Attitudinal Approach
DICK/BASU 1994
‘(…) the strength of the relationship between an individual`s rela-tive attitude and repeat patronage’
AMINE 1998
‘an effective buying behaviour of a particular brand (and not only an intention to buy it), repeated over time (its buying proportion exceeding 50% of the purchases made within a product catego-ry) and reinforced with a strong commitment to the brand‘
OLIVER 1999
‘A deeply held commitment to rebuy or repatronize a preferred product/service consistently in the future, thereby causing repeti-tive same-brand or same brand-set purchasing, despite situa-tional influences and marketing efforts having the potential to cause switching behaviour.’
JACOBY/KNYER 1973
‘brand loyalty is essentially a relational phenomenon’ Relational Approach FOURNIER
1998 ‘a long-term, committed, and affect-laden partnership’
Table 10: Definitions of Brand Loyalty
Reference: Author’s table referring to Knörle (2011), p. 99.
Having a look at the citation index of Google Scholar shows that the most cited au-
thor among those presented in the list is OLIVER (1999),467 thus the scientific use of
this definition in general is undoubted. However, to build a good definitional basis for
the upcoming operationalisation of this construct, the research-specific context must
also be studied. His definition was recently used in highly relevant studies regarding
China and the automobile after-sales. 468 Finally, note that this approach takes into
account the fundamental critique against the behavioural paradigm, which measures
repurchase behaviour (a common operationalisation of brand loyalty) by actual ob-
servable transactions. This assumption, which means that only previous behaviour
explains future behaviour, is not favoured anymore, for instance because attitudes
467 Cited 4837 times until 6/2/14 measured by http://scholar.google.de. 468 Cf. Deng (2010), p. 290; Hünecke (2012), p. 20.

Disambiguation
103
have to be implemented.469 The dimensions of loyalty are shown next to briefly sym-
bolise this aspect graphically.
Figure 20: Dimensions of Loyalty
Reference: Author’s illustration referring to Foscht (2002), p. 104.
Due to the aforementioned arguments, brand loyalty is defined in regard to OLIVER´s
(1999)470 loyalty understanding and his definition presented in Table 10.
Workshop Loyalty
Similar to brand loyalty workshop loyalty is a kind of loyalty referred to a specific ob-
ject of interest.471 The alternative term dealer loyalty is also used in automotive re-
search.472 For instance, VERHOEF ET AL. (2007), thereby consider the dealer as a
subsystem within the entire car consumption system. Here, they primary focus after-
sales services with their dealer loyalty measures.473 However, linguistically the word
dealer is likewise strongly associated with sales efforts. To avoid any ambiguity, the
term workshop loyalty is used in this research, in order to clearly focus the after-sales
activities provided by the dealer.
469 Cf. Foscht/Swoboda (2011), pp. 244 ff. The specific discussion on this appears in Chapter 5.2.2.3,
Construct Operationalisation of Satisfaction and Loyalty Variables. 470 Cf. Oliver (1999), p. 34. 471 Cf. Foscht/Swoboda (2011), p. 244. 472 Cf. Verhoef et al. (2007), pp. 97 ff.; Huber/Herrmann (2001), pp. 97 ff.; Bloemer/Lemmink (1992),
pp. 351 ff. 473 Cf. Verhoef et al. (2007), pp. 99 ff.
Loyalty'
Previous'Behaviour'
Recommen'da*on+
Cross'buying+
Perceived+Value+
Sa*sfac*on+ Commit'ment+
Inten*on++
• Re'purchase+• Recommenda*on+• Cross'buying+
+
Re'purchase+
A2tude'

Conceptual and Theoretical Foundation
104
4.2.5 Culture
To begin with, it should be noted that the general relevance of cultural aspects are
considered very contrary in marketing. Two main schools exist. In keeping with the
expression ‘everything is global’,474 some people believe that cultural standards
adapt globally (to western standards), and therefore standardisation is most success-
ful for international firms.475 On the other hand, the idea that ‘all business is local’476
is very popular; therefore differentiation is what is most needed.477 The author of this
work does not follow a one-scholar exclusive view, as he thinks that it depends on
the specific context. Nevertheless, this work respects the idea that culture and mar-
keting need to have a strong relationship, and this means the work is noticeably
closer to the second paradigm. DE MOOIJ (2014) argues that pure global standardi-
sation approaches are not effective. She writes that ’Needs may be universal, but at-
titudes, motivations, and expressions of needs vary.’478 In this regard, it seems pos-
sible that both global and local aspects can occur simultaneously. In regard to this, a
third scholar of thought has to be mentioned, the contingency approach,479 which
‘(…) is based on the idea that the most effective (..)480 strategy varies, depending on
the situation.’481
Culture as phenomena, which explains or influences consumer’s assessment or be-
haviour is difficulty to reveal and to operationalise as explaining variables.482 In order
to enable that, important cultural constructs, fitting to the research objective, have to
be identified. Therefore this section first stresses possible definitions of the term cul-
ture. Then the research perspective is discussed in an excursus, using emic and etic
criteria. Moreover the conception of culture with its main differentiation between con-
cepta (explicative concept) and percepta (descriptive concept) is illustrated, before
474 Cf. Levitt (1983b), pp. 92 ff. 475 Cf. de Mooij (2014), pp. 12/15 ff.; Emrich (2014), p. 25; Mennicken (2000), p. 87. 476 Cf. Kotler/Bliemel (2005), p. 31/650. 477 Cf. Emrich (2014), p. 25. 478 de Mooij (2014), p. 12.; Same argumentation, but more general s. Triandis (1994), p. 34. 479 Cf. Agrawal (1993), pp. 26 f. 480 The original context of this citation focusses advertising strategies s. de Mooij (2014), p. 17;
Agrawal (1993), p. 30. 481 de Mooij (2014), p. 17. 482 Cf. Emrich (2014), p. 25.

Disambiguation
105
different levels of culture and the meaning of values are shown. Finally the role of
culture in consumers` service experiences is considered.
Defining Culture
Within traditional western marketing science, culture is a phenomenon which was
long neglected. EMRICH (2014) considers HOFSTEDE`s pioneer study about na-
tional cultures,483 published in 1980, as a break-through for the relevance of cultural
differences. It also was the starting point for an increased marketing research ef-
fort.484 Analogous to other terms before, even the word culture is not consistently de-
fined.485 Nevertheless, a description of culture is required, because in this work cul-
ture is considered an important stream of influences, which presumably affects the
entire after-sales business, as ‘Most elements of consumer behaviour are culture-
bound, (…).’486 Or as cited before in Chapter 2.3, ‘culture (..), as a significant inde-
pendent variable, determines consumer behavior.’487 This can be demonstrated with
an example of brand loyalty. A market comparison of the US with Japan shows that
consumers are relatively loyal in Japan and very fickle in the USA. Thereby, the Jap-
anese loyalty is positively influenced by their collectivistic culture.488
Culture definitions are numerous; a popular, anthropological approach is given by
KROEBER/KLUCKHOHN (1952): ‘Culture consists of patterns, explicit or implicit, of
and for behaviour acquired and transmitted by symbols, constituting the achieve-
ments of human groups, including their embodiments in artefacts; the essential core
of culture consists of traditional (i.e. historically derived and selected) ideas and es-
pecially their attached values; cultural systems may on the one hand be considered
as products of action, on the other as conditioning elements of further action.’489
YAPRAK (2008) recommends, in a review paper on cultural studies in international
marketing, a definition originally from NAKATA/HUANG: ‘that complex whole which
includes knowledge, belief, art, morals, law, custom, and any other capabilities and
483 Cf. Hofstede (1980), pp. 42 ff. 484 Cf. Emrich (2014), p. 1; Yaprak (2008), p. 215. 485 Cf. Emrich (2014), p. 10; Srnka (2005), pp. 72 f.; Müller/Gelbrich (2004), p. 40/71. 486 de Mooij (2014), p. 53. 487 Emrich (2007), p. 35. 488 Cf. Emrich (2014), p. 24; Usunier/Walliser (1993), p. 11; Cateora/Ghauri (2000), p. 19. 489 Kroeber/Kluckhohn (1952), p. 181.

Conceptual and Theoretical Foundation
106
habits acquired by man as a member of society’.490 When consumer service experi-
ences are researched, primarily the HOFSTEDE dimensions are used, as ZHANG
ET AL. (2008) describe.491 Therefore his classical definition (2001) is given next: ‘(…)
the collective programming of the mind which distinguishes the members of one
group or category of people from those of another.’492 Renewed, and suggested by
DE MOOIJ (2014) in the context of global marketing, HOFSTEDE ET AL. (2010) de-
fine culture as follows:493 ’(…) the collective mental programming of the people in an
environment. Culture is not a characteristic of individuals; it encompasses a number
of people who were conditioned by the same education and life experience.’494
This enumeration of popular definitions shows that there might be no right or wrong
definition rather than it is needed to set an appropriate basis, according to the re-
search perspective.495 So far, the HOFSTEDE ET AL. (2010) definition is used here,
because it is widely accepted within the service research field, and a given environ-
ment is crucial, thus a defined group of people (e.g. social group or society) can be
the object of interest (cf. below: levels of culture). Moreover, as it is emphasised in,
‘by the same education and life experience’, that the group focussed on does not
necessarily reflect the nation, as nations are per se politically defined constructs. Fi-
nally, it has to be emphasised that often SCHEIN496 is mentioned when culture is of
interest. However, as his works mainly refer to organisational culture, he will not be
considered in this work.
Excursus: Research Perspective: Emic vs. Etic Approach
With respect to the above chosen definition, and especially considering that
country subgroups497 can vary significantly,498 it must be emphasised that this
work does not aim to elaborate generalising insights about the whole Chinese 490 Yaprak (2008), p. 217 and the literature cited there. 491 Cf. Zhang et al. (2008), p. 213. 492 Hofstede (2001), p. 9. 493 Cf. de Mooij (2014), p. 57. 494 Hofstede et al. (2010), p. 5. 495 Cf. Triandis (1994), p. 22. 496 An overview on Edgar Schein and his publications is available on http://mitsloan.mit.edu/faculty/det
ail.php?in_spseqno=41040. 497 Cf. Chapter, 3.2.2 Chinese Consumer Landscape. 498 Cf. de Mooij (2014), pp. 185 f.; Kirkman et al. (2006), p. 311; Meffert et al (2010), p. 111; Mennick-
en, (2000), p. 59. Specifically for China s. Xin-an et al. (2008), pp. 377 ff.

Disambiguation
107
nation. Findings are limited to the delimitated group of automobile users and
there culturally affected service behaviour.499 On the one hand this is a limita-
tion, but on the other hand it is a strong (and quite intended) benefit, because
one of the globally, currently most relevant service consumer groups can
therefore be investigated most deeply. Moreover this research work is an ap-
proach from a Western perspective with the objective of understanding, as
well as possible, the cultural influences in China on globally acting brands and
companies. Further, the after-sales success chain, as one research part, is al-
ready investigated roughly similar for a few Western markets.500 Thus the find-
ings from this work can be partly compared, in order to provide an increasing
scientific value. Also, because it is not known today whether or not this suc-
cess chain will last in the Chinese context.
Within cultural research there is a strong debate about the superiority of the
emic or etic oriented research approach.501 ‘While the emic approach is based
on the premise that theorising is culture-specific and favors within-culture in-
vestigation, the etic approach advocates generalization and focuses on issues
that are universal and common to all cultures.’502 Some people present the
emic-based paradigm that only culture-inherent researchers can appropriately
apply cultural research. On the first view, following on that, for this research
topic it consequently would mean that a German researcher could not appro-
priately investigate Chinese topics; likewise that a Chinese researcher could
not appropriately investigate Western companies such as Audi, BMW and
Mercedes-Benz.
EMRICH (2014) concludes that emic approaches are deemed to be more reli-
able but in contrast they are too specific to be applied across cultures. She re-
fers to HOLZMÜLLER (1989) who suggests combining both approaches. Then
at measuring, both pan-cultural and culture-specific items are considered,
499 Cf. Chapter 3.4, and broadly referring to the ‘market place cultures concept’ from Consumer Cul-
ture Theory (CCT). Cf. Arnould/Thompson (2005), pp. 873 f. 500 Cf. Hünecke (2012), pp. 1 ff.; Hättich (2009), p. 1 ff. 501 Cf. de Mooij (2014), p. 73; Emrich (2014), pp. 195 ff.; Zhang et al. (2008), p. 221. Müller/Gelbrich
(2004), pp 224 ff. 502 Zhang et al. (2008), p. 221; Berry (1989), pp. 721 ff.

Conceptual and Theoretical Foundation
108
which then are interpreted culture-independent.503 ZHANG ET AL. (2008) also
say that there is no single best approach; rather that there is an appropriate
way to apply any methodology. They recommend BERRY´s (1989)504 three-
step process505 to identify which approach fits.506 Therefore, and also due to
the context of this research topic, a combined approach is chosen in this work,
as both so-called imposed etic (primarily) and derived etic (to some extent) is-
sues are needed. This selection is laid out in the next table, which also shows
BERRY`s (1989) three-step approach on the left.
Choosing the Imposed Etic Approach on the Basis of BERRY (1989) Berry´s three-step process Context of this research work, especially
towards the after-sales success chain 1) Initial research in one´s own culture (emic A)
- The automotive after-sales service success chain is researched emic in the West - It is not researched emic in China
2) Using the same concept to study behav-iour in another culture (imposed etic)
- Due to the assessment of step one: this is the main focus of this research work
3) Apply a discovery strategy in another cul-ture (emic B)
- Not applicable due to research economic limitations, and as the author is not Chinese
4) Compare emic A and B - Not applicable due to No. 3) 5) When step four lacks communality, com-parison is not possible With some communality so called derived comparisons are possible
- This fact is a given - Derived comparisons with established liter-ature are possible and intended, additionally scientific knowledge is fostered, because specifically cultural influences are taken into account
Table 11: Imposed Etic Approach
Reference: Author’s table referring to Zhang et al. (2008), p. 221; Berry (1989), p. 730; Berry
(1995), pp. 165 ff.
Additionally TRIANDIS (1994) shall be emphasised, specifically because he
gives a very valuable recommendation on this issue. He claims that constructs
can have both etic and emic aspects.507 Therefore he concludes, concerning
503 Cf. Emrich (2014), pp. 196 f.; Holzmüller (1989), p. 1147. 504 Cf. Berry (1989), pp. 721 ff. 505 Zhang et al. (2008), p. 221 call it five-step process. Berry (1989, p. 730; 1995, p. 165) originally
names it a three-step process, but uses five sub-stages (numbers) to describe these three stages. 506 Zhang et al. (2008), p. 221. 507 Cf. Triandis (1994), p. 72.

Disambiguation
109
such constructs: ‘They may have a universal meaning, one that most re-
searchers understand the same way; yet these concepts must be operational-
ized and measured differently in each culture, because behaviour has different
meanings in each culture (Triandis, Vassiliou, & Nassiakou, 1968).’508
With regard to the points stated, only in China approved culture studies and
related constructs as well as items are used for this research. What exactly is
required to operationalise culture is elaborated in Chapter 4.4.3.1.
Conception of Culture
It is of great importance that culture consists of both explicit and implicit aspects, as
reflected in the KROEBER/KLUCKHOHN (1952) definition, mentioned earlier.509 In
other words culture incorporates visible and invisible elements. Most researchers
agree with that, and therefore still use the concepta/percepta distinction, which was
introduced by OSGOOD in 1951.510 The descriptive elements of culture, the percepta,
contain all visible and therefore perceivable elements, which are manifested in social
(e.g. rituals) and material culture (e.g. fashion). In contrast, concepta elements (men-
tal culture) are not directly observable, but are nonetheless important, because they
cause the behaviour of cultural members (social culture) and the resulting material
culture.511 Figure 21 shows the concepta/percepta distinction and connection, and
the related layers towards the manifestation of culture.
508 Ibidem, p. 74. 509 Cf. Kroeber/Kluckhohn (1952), p. 181. 510 Cf. Emrich (2014), p. 31; Meffert et al. (2010), pp. 107 f.; Müller/Gelbrich (2004), pp. 68 f. 511 Cf. Meffert et al. (2010), p. 108; Srnka (2002), pp. 1 ff.

Conceptual and Theoretical Foundation
110
Figure 21: Concept of Culture
Reference: Author’s illustration, referring to Meffert et al. (2010), p. 108; Müller/Gelbrich (2004), p. 69;
Osgood (1951), p. 202 ff.
Values
The previous figure shows that values are one cause for culturally affected behaviour
(s. manifestation layer). Because they are causal, values are considered a central
component within the scientific concept of culture.
‘Values are taught at an early age and in an absolute manner. They describe what
people in general think the world ought to be in an absolute way: freedom, peace (…).
Values can serve as standards that guide our choices, beliefs, attitude, and actions.
Values are more stable than attitudes and occupy a more central position in a per-
son`s cognitive system. We are not aware of values; they operate unconsciously, like
on automatic pilot.’512 The next table shows widely accepted and popular definitions,
which are used in Chinese research settings as well as Western ones.
512 de Mooij (2014), p. 54.
Concepta (Explicative Concept)
Cause of Behaviour
Mental Culture
Values Norms
Attitudes
Percepta (Descriptive Concept)
Behaviour
Social Culture
Customs Mores Rituals
Social Structures Language
Results of Behaviour
Material Culture
Fashion Architecture
Art Tools
Cultural Concept Content Core
Layer Focus Manifestation

Disambiguation
111
Author Definition of Value or Values KLUCKHOHN (1951), p. 395
‘A value is a conception, explicit or implicit, distinctive of an individualistic or characteristic of a group, of the desirable which influences the selection from available modes, means and ends of actions’
ROKEACH (1968), p. 111
‘a centrally held, enduring belief which guides actions and judgements across specific situations and beyond immediate goals to more ultimate end states of existence’
SCHWARTZ (1994), p. 21
‘I define values as desirable transsituational goals, varying in importance, that serve as guiding principles in the life of a person or other social entity.’
HOFSTEDE (2001), p. 5
‘a broad tendency to prefer certain states of affairs over others’
Table 12: Value Definitions
Reference: Knörle (2012), p. 31.
DE MOOIJ (2014) gives some further valuable specifications. In her opinion, values
are either collective (macro-level values) or individual (micro-level values), where col-
lective values are often called cultural values. In contrast, individual values are called
value orientations, which can become manifest in people’s actions as cultural val-
ues.513 As stated previously, and mentioned by further important authors,514 values
can serve as standards that guide our choices and actions; a success-critical starting
point in marketing. Amongst others,515 especially HOFSTEDE pointed to values as
the culture´s core,516 which he symbolises as the core of an onion, where the whole
onion, with all its layers, stands for the manifestation of culture.517
Values as a core element of culture, and a major cause of behaviour, will thus be
used in this research as a very important determinant of culture.
Levels of Culture
LEUNG ET AL. (2005) point out that culture should be considered as a multi-layered
construct consisting of different levels, from global to group culture, and finally cultur-
513 Cf. ibidem. 514 Cf. Triandis (1994), pp. 111 f.; Schwartz (1992), p. 2; Müller/Gelbrich (2004), pp. 301 ff.; Srnka
(2005), p. 78. 515 S. for instance Engelen/Brettel (2011), p. 75 or Schwartz (2006), p. 138 f. 516 Cf. Müller/Gelbrich (2004), p. 303; Hofstede (1997), pp. 7 ff. 517 Cf. Hofstede/Hofstede (2005), pp. 7 f. Nowadays, Gert and his son Gert Jan Hofstede publish to-
gether, but Gert Hofstede is the originator of concept mentioned here.

Conceptual and Theoretical Foundation
112
al values represented in individuals.518 In line with this understanding, DE MOOIJ
(2014) recommends, when culture is considered, that it is important to be specific
about the chosen level to which the term culture applies. Cultural groups share simi-
lar values, amongst other things, which means the degree of homogeneity varies be-
tween different levels. These levels can be symbolised as a pyramid, where the indi-
vidual marks the narrowest level, followed by family, tribe, region/province, nation,
continent, and world/humanity as the widest. Moreover, because individuals belong
to different groups, different layers of culture influence them.519
Similar to that is the threefold reference layer classification into macro-level, meso-
level and micro-level. The macro-level is considered as culture or cultural area (often
a nation), and thus it determines the complex environment. The meso-level can be
described as subculture or milieu, and finally the individual or the behaviour of small
groups is at the micro-level.520 It must be mentioned that the assignment of groups
differs from author to author,521 but this is not surprising, since a three-group classifi-
cation itself marks broad categories. Finally, independent of the number of categories,
there is interplay among these levels.522
The Role of Culture in Consumers’ Service Experiences
Besides the arguments given in the first chapter of this work, ZHANG ET AL. (2008)
state that ‘A solid understanding of the role of culture in the service delivery process
is more crucial than ever for service firms operating globally.’523 In line with major
service paradigms they use a conceptual framework (s. Figure 22), which shows key
effects of culture on relevant service dimensions.524
518 Cf. Leung et al. (2005), pp. 362 f. 519 Cf. de Mooij (2014), pp. 58 ff. 520 Cf. Mennicken (2000), p. 53; Emrich (2014), pp. 1 f.; Srnka (2005), pp. 80 ff.; Wang (1996), pp. 74 f. 521 Cf. Srnka (2005), pp. 80 ff. A popular variation example is Steenkamp (2001), pp. 36 ff. 522 Cf. Yaprak (2008), p. 217; Leung et al. (2005), p. 362 ff. 523 Zhang et al. (2008), p. 212. 524 Cf. ibidem, pp. 212 f.

Determination of a Success Indicator
113
Figure 22: The Framework of the Role of Culture in Consumers’ Service Experiences
Reference: Author’s illustration referring to Zhang et al. (2008), p. 212.
The framework used in this study shows that every stage in the service experience
process is affected by cultural influences. Thus, it is most likely that the entire after-
sales service chain is likewise affected. In combination with Figure 18, it will be con-
sidered in the research model525 that culture affects all constructs, which regard to
this process chain. Besides, as was shown in the value section, values in particular
are a central point of interest. Accordingly, they are explicitly focused, which will hap-
pen level specific within the Chinese context in Chapter 4.4.3 and subchapters.
4.3 Determination of a Success Indicator
A variety of arguments, elaborated in prior chapters, indicate that brand loyalty might
be a success indicator well suited to this research. Additionally, SIVADAS/BACKER-
PREWITT (2000) note that, ‘There is increasing recognition that the ultimate objec-
tive of customer satisfaction measurement should be customer loyalty.’526
Brand loyalty is generally seen as a central objective within brand management.527
With regard to China more specifically, KNÖRLE (2011) investigates brand loyalty in
525 Cf. Chapter 4.5, Conceptual Research Model and Overview of Hypotheses. 526 Sivadas/Backer-Prewitt (2000), p. 75. 527 Cf. Esch (2010), p. 72 and the literature cited there.
Consumers` Service Experience Dimensions
National Culture / Cultural
Dimensions
• HOFSTEDE • HALL • HOFSTEDE/BOND • SCHWARTZ • OTHERS
Service Expectations
Evaluations of Service
Reactions to Service

Conceptual and Theoretical Foundation
114
China in his dissertation. There, he summarises why brand loyalty is a crucial objec-
tive of brand management, as well as why it has a success-critical role in a compa-
ny’s effort to create value. His central focal points are shown next:528
• Brand loyalty generates stable revenues
o Fosters repurchases
o High loyalty creates emotional switching barriers
o Customers are less attracted by alternatives
• Brand loyalty creates revenue growth
o Increases buying frequency
o The willingness for cross-buying becomes fostered
o Customer increasingly tend to word-of-mouth behaviour
• Brand loyalty rises profitability
o Ability to achieve higher prices (price premium)
o Increases advertisement efficiency
Besides this convincing relevance for China brand loyalty is tested now within the au-
tomobile context, and thereby especially towards the scientific use of the loyalty con-
struct. Table 13 shows the state of the literature on this topic, selected for a focus on
the after-sales service relevance.
Obviously, a number of important studies have used brand loyalty as an indicator to
identify success factors and relationships. Due to the given high context relevance,
this provides a strong indication of its suitability for this research. Notably all scientific
studies operationalise the construct at least by ‘repurchase intention’. In combination
with the definition of brand loyalty mentioned previously, which includes behavioural
and attitudinal components, this information is a first approach for the final operation-
alisation of the construct in Chapter 5.2.2.3.
528 Cf. Knörle (2011), pp. 19 f. and the literature cited there.

Determination of a Success Indicator
115
Author/Year Construct Measured by Notes/Findings BLOEMER/ PAUWELS 1998529
Brand Loyalty
‘(…) is measured as the likelihood of repeat purchase of the brand times the degree of commit-ment.’530
Automobile customers (n=407) of two related German brands in the Netherlands.
Test of three satisfaction and loyal-ty constructs with the result that satisfaction is a key determinant of loyalty. Differences exist between the two brands (one is more exclu-sive). Different loyalty constructs seem to be interdependent.
HUBER/ HERRMANN 2001531
Brand Loyalty
Measured by repurchase intention and recommendation.
N=1,000 driving licence owners in Germany.
Customer satisfaction is the main determinant of loyalty. ‘(…) manufacturers, would be wise to see their dealers as crucial suc-cess factors for their brand.’ ’The after-sales service, in particular, has tremendous potential to secure a customer’s loyalty.’532
DEVARAJ ET AL. 2001533
Brand Loyalty
Measured by actual Dealer repur-chase data and repurchase inten-tion.
2,338 Workshop customers in the U.S.A.
Mass-market cars and light trucks. ‘Brand loyalty and repurchase in-tentions are affected by both the quality of the vehicle and the quality of the service delivered (…).’534
HÄTTICH 2009535
Brand Loyalty
Measured by repurchase intention.
Workshop customers in Germany (n=4,893).
Service satisfaction indirectly af-fects brand loyalty through the me-diator workshop loyalty.
HÜNECKE 2012536
Brand Loyalty
Measured by repurchase intention.
Workshop customers in France, Ita-ly and Spain (n=1,500)
Service satisfaction affects brand loyalty through the mediator service loyalty, thereby determining factors differ across the three markets.
At Most Used Practical Approach (Consultancy) BAIN & CO. 2008537
Brand Loyalty via ‘Net Promoter Score’ (NPS)
Car owners rate, from 0 to 10, how likely they are to recommend their vehicles. By subtracting the per-centage of ‘detractors’ (score 0-6), from the percentage of ‘promoters’ (score 9-10) NPS is calculated.
N=1,800 customers in the U.S.A.
‘First, promoters are nearly 10 times more likely than detractors to repurchase (…) [the same brand]. Second, promoters are far more likely to recommend (...). Indeed, high NPS correlated with healthy new-car sales growth; (…)’538
Table 13: Studies towards Automotive After-Sales Focussing on Brand Loyalty
Reference: Author’s table.
529 Cf. Bloemer/Pauwels (1998), pp. 78 ff. 530 Ibidem, p. 80. 531 Cf. Huber/Herrmann (2001), pp. 97 ff. 532 Ibidem, pp. 117 f. 533 Cf. Devaraj et al. (2001), pp. 424 ff. 534 Ibidem, p. 435. 535 Cf. Hättich (2009), pp. 1 ff. 536 Cf. Hünecke (2012), pp. 1 ff. 537 Cf. Flees/Senturia (2008), After-Sales Service Key to Retaining Car Buyers. 538 Ibidem.

Conceptual and Theoretical Foundation
116
Because of the chosen manufacturer´s perspective, and in order to understand the
entire after-sales process chain, after-sales service satisfaction and workshop loyalty
can be seen as intermediate or secondary objectives. But in this study, the primary
focus when it comes to success indicators is brand loyalty. Predominantly product-
related aspects are consequently excluded from this research. Consciously, just one
main indicator is determined here. In contrast, a bundle is conceivable, but then eve-
ry single success factor, and particularly its strength and influence, is not precisely
assignable. This becomes obvious in the context of changing conditions, where, the
sum of the bundle could express the same result, even if each success factor itself
could differ.539
An abstract success indicator in terms of a defined construct such as brand loyalty
without a key figure, as it is common in praxis, is also used in this study, in order to
be able to show cultural influences on the after-sales process chain. A predefined
key figure would lead to a biased and subjective interpretation, because aimed fig-
ures probably differ even within the small group of chosen brands. This research
work emphasises explanatory contributions, which are helpful for getting a deeper,
more scientific understanding of the whole and complex process chain. In this regard,
the success indicator is also highly relevant for the automobile brands considered
here. The measurement of brand loyalty (operationalisation) is elaborated in Chapter
5.2.2.2.
4.4 Determination of Model Variables and Hypotheses
So far, the required general basic considerations have been discussed. Based on
that, the specific research model can be established. For this purpose, first satisfac-
tion, loyalty and constructs associated with after-sales are determined, then the role
of culture and its related variables are stressed. In the process every construct is ex-
plained conceptually, and if required the state of research from Chapter 2 is complet-
ed. The deduction of hypotheses takes place after all relevant explanations for each
construct have been given. Finally, in line with the chosen scientific approach, theo-
retical foundations support the hypotheses. Here, theories are applied in the context
539 Cf. Dorka (2012), p. 111.

Determination of Model Variables and Hypotheses
117
of this research, which is why a selection of theories is always given, based on their
relevance to the project. General explanations of theory are not offered, because
they can easily be found in the literature. There is in fact no single theory which com-
prehensively explains the entire field of service marketing.540 Therefore, this work
acknowledges pluralism of theory, which means that different, comprehensive theo-
ries are used.541 Theories cannot be selected self-servingly and at random,542 so only
theories which are both well recognised in the field of service marketing543 and ap-
propriate to the given automobile after-sales service context have been applied.
4.4.1 Relationship Between After-Sales Service Satisfaction and Loyalty
Deviating from the chronology of the marketing mix, which is stressed in the next
Chapter, first the relationship between after-sales service satisfaction, workshop loy-
alty and brand loyalty is considered, because Chapter 4.2.1 and there especially Fig-
ure 18 shows that these constructs are crucial and linked.544 Moreover SACCANI ET
AL. (2006) conclude in their durable consumer goods study, concerning the roles of
automotive after-sales, that divergent features are critical. Which means that compet-
itive priorities have to be aligned to the manufacturer’s supply portfolio or strategy.
Here, volume-oriented providers may focus on revenue and profitability, due to com-
parably (cf. sales) high after-sales margins. With regard to the premium segment
(which is focused in this work) they state that other competitive priorities are focused,
especially differentiation. Here the orientation could be to increase the companie’s
image and the customer’s loyalty.545
Within service marketing, generally customer loyalty should not be researched with-
out considering customer satisfaction, because satisfaction is considered to be the
central determinant of loyalty.546 Many researchers from both the theoretical and em-
pirical perspective have investigated these constructs and found a positive relation-
540 Cf. Meffert/Bruhn (2009), pp. 54 f. 541 Cf. Schanz (2009), p. 83. 542 Cf. Töpfer (2012), p. 122. 543 An overview could be found at Meffert/Bruhn (2009), p. 84. 544 Cf. also Zeithaml et al. (2013), p. 87. 545 Cf. Saccani et al. (2006), p. 178. 546 Cf. Meffert/Bruhn (2009), pp. 102 f.; Diez (2009), p. 66; Zeithaml et al. (2013), p. 86; Fitzsimmons
et al. (2014), pp. 106 f.

Conceptual and Theoretical Foundation
118
ship.547 Likewise, an application to many industries happens where the positive rela-
tionship can nearly always be proved.548 However, the consideration of different in-
dustries shows as well that the strength of the influence differs when it comes to
competition. Studies have shown that the stronger the competition, the stronger the
influence, and the automobile industry serves as an example of this.549 Since the
mid-nineties a number of carefully constructed articles on the subject have been pub-
lished.
Various automobile brand-specific studies have demonstrated the positive relation-
ship between customer satisfaction and dealer loyalty.550 Even the generally less of-
ten considered linkage between satisfaction and brand loyalty or retention has been
shown by some authors.551 In particular two German dissertations take up the area of
automotive after-sales service, and the related influences on brand loyalty. HÄTTICH
(2009) and HÜNECKE (2012) both suggest a positive, triangular relationship be-
tween the targeted constructs, where satisfaction directly affects both dealer and
brand loyalty. However, the empirical testing afterwards brings up the fact that the di-
rect relationship between satisfaction and brand loyalty is either not significant or
weak and negative. But in both cases there is a significant total effect via the media-
tor of workshop or service loyalty.552 In one case, too, a perfect statistical mediation
was given.553
As a result, the three constructs mentioned have to be considered as very important
in the current context. They build the basis for the suggested research model, but
due to previous findings, in a linear connection instead of the formerly assumed tri-
angular relationship (cf. Figure 23); and furthermore with the specifically elaborated
terms from Chapters 4.2.3 and 4.2.4.
547 Cf. Meffert/Bruhn (2009), pp. 102 f. 548 Cf. Hünecke (2012), p. 24. 549 Cf. Meffert/Bruhn (2009), p. 103. 550 Cf. Hünecke (2012), p. 127; Hättich (2009), p. 213; Bei/Chiao (2001), p. 138; Devaraj et al. (2001),
pp. 434 f.; Bloemer/Pauwels (1998), p. 82; Bloemer/Lemmink (1992), p. 362. 551Cf. Hünecke (2012), p. 127; Hättich (2009), p. 213; Huber/Herrmann (2001), p. 115; Mittal et al.
(1999), p. 94. 552 Cf. Hünecke (2012), p. 128; Hättich (2009), p. 213. 553 Cf. Hünecke (2012), p. 132.

Determination of Model Variables and Hypotheses
119
Figure 23: Relationship between After-Sales Service Satisfaction and Brand Loyalty
Reference: Author´s illustration referring to Hünecke (2012), p. 128; Hättich (2009), p. 213.
Deduction of Hypothesis and Theory Foundation
The remarks on construct definitions mentioned in Chapter 4.2.3 and 4.2.4, the gen-
eral acceptance of the relationship between satisfaction and loyalty within marketing
science, as well as the research findings specifically on automobile after-sales ser-
vice strongly lead to the assumption that after-sales service satisfaction is positively
related to workshop loyalty, which itself is positively related to brand loyalty.
However, the suggested relationships have actually not been tested in China. Never-
theless some service-related studies have stressed this aspect in other Chinese in-
dustries. Thus, LI ET AL. (2008) confirm a direct, positive relationship between cus-
tomer satisfaction and the intention to repurchase, using a sample of hairdressers’
customers.554 For hairdressing, YIM ET AL. (2008) also approve this in terms of fu-
ture loyalty with a sample from Hong Kong, were likewise fast food restaurant cus-
tomers are examined, but here the relationship is not significant.555 DENG ET AL.
(2010) focus on mobile instant message services in China. They also confirm that
554 Cf. Li et al. (2008), pp. 455 f. 555 Cf. Yim et al. (2008), p. 751.
(Customer)+Service+Sa1sfac1on+
Workshop/Service+Loyalty+
Brand+Loyalty+
A"er%Sales*Service*Sa.sfac.on* Workshop*Loyalty* Brand*Loyalty*
Suggested*Variables*and*Rela.onships*for*the*Research*Model**
Previously*Assumed*Rela.onship*of*Crucial*Variables**

Conceptual and Theoretical Foundation
120
satisfaction is the strongest determinant of loyalty.556 Hypotheses H1 and H2 are
based on the sum of arguments mentioned thus far.
H1: The higher the after-sales service satisfaction, the higher the workshop loyalty.
H2: The higher the workshop loyalty, the higher the brand loyalty.
Furthermore, the following scientific theories foster both hypotheses:
• Risk theory
• Dissonance theory
• Learning theory
These theories, which are considered very relevant for service marketing, have their
origin in psychological approaches, as human behaviour is the point of interest.557
The demand for services is related to risk, because the consumer cannot be sure be-
forehand whether the performance of the service will be satisfactory. The risk theory
assumes that individuals try to reduce perceived risk through their buying behaviour.
A satisfied customer with at least one after-sales service experience, could use loyal-
ty as a strategy to reduce the risk of dissatisfaction through disappointed expecta-
tions.558 Dissonance theory,559 which has some parallels with risk theory, considers
that individuals desire cognitive balance,560 whereas dissonances are often experi-
enced in after-sales phases and by products or services with a high subjective mean-
ing, for instance cars.561 According to the theory, customers with low dissonance are
more loyal than customers with dissonance or than unsatisfied customers.562 No or
low perceived dissonance means that the desired balance has been found.563 Finally,
the learning theory contributes, because in the context of services, the learning theo-
ry can be seen as a boosting principle (amplifying experiences), where when it
556 Cf. Deng et al. (2010), p. 295. 557 Cf. Meffert/Bruhn (2009), pp. 68 f. 558 Cf. ibidem, pp. 70 f.; Foscht (2002), pp. 23 ff.; Shet/Parvatiyar (1995), p. 266. 559 Cf. Festinger (1957), pp. 1 ff. 560 Cf. Meffert/Bruhn (2009), pp. 72 ff. 561 Cf. Kroeber-Riel/Gröppel-Klein (2013), pp. 259 ff. 562 Cf. Hättich (2009), pp. 151 f. 563 Cf. Foscht (2002), p. 29.

Determination of Model Variables and Hypotheses
121
comes to after-sales services, it could be assumed that customers maintain a rela-
tionship if it was useful in the past.564
4.4.2 Determination of Variables According to the Marketing-Mix
In order to further elaborate the research model, the following section lays the con-
ceptual foundations for constructs, which have a direct influence on the aforemen-
tioned after-sales relationship from satisfaction towards loyalty, primarily the after-
sales instruments. These constructs mostly express marketing variables, which are
influenceable and steerable by OEMs. Therefore, the instruments of the marketing
mix are stressed separately. With regard to the marketing mix, traditionally four main
areas have been considered: product (in this case, service), price, place and promo-
tion. Moreover, due to the special characteristics of service marketing the fifth area of
personnel is also considered.565 Finally, it has to be noted that discussing the market-
ing mix will not bring up variables to every possible aspect; rather, it will provide a set
of guidelines that will allow all areas of interest to be covered systematically. Out of
this, the most important variables are chosen and condensed so that they can be in-
tegrated into the research model.
4.4.2.1 Instruments-of-Service-Policy-
The first policy of the marketing mix is the product. In the context of this work, the
product itself is a service, and therefore named likewise. In service marketing litera-
ture quality is considers as ‘(…) the most important purchase decision factor (…)’.566
Based on this idea, the service quality concept was elaborated (see below). Likewise,
noticeably service quality is seen as directly linked and the main antecedent of cus-
tomer satisfaction,567 which was mentioned as a key element of this research within
the previous chapter.
564 Cf. Meffert/Bruhn (2009), p. 70; Foscht/Swoboda (2011), p. 248; Shet/Parvatiyar (1995), p. 257. 565 Cf. Meffert/Bruhn (2009), pp. 243 f. 566 Sachdev/Verma (2004), p. 97. 567 Cf. Zeithaml et al. (2013), p. 79; Pollack (2009), p. 46; Cronin/Taylor (1992), p. 64.

Conceptual and Theoretical Foundation
122
Service Quality
The construct of service quality can be defined ‘(…) as the degree and direction of
discrepancy between consumers` perception and expectations in terms of different
but relatively important dimensions (…)’.568
The service quality research was strongly intensified during the 80s,569 when first
GRÖNROOS (1984) fostered the understanding, when he figured out that the quality
of judgement is mainly based on two aspects, namely technical (service outcome
quality) and functional (service process quality) quality.570 Shortly after, PARASURA-
MAN ET AL. (1985) made a major contribution to marketing science when they iden-
tified ten determinants of service quality,571 which are the basis for the five service
quality dimensions of the Service Quality Model (SERVQUAL) published in 1988.572
In order to measure service quality, the five dimensions mentioned are: responsive-
ness, reliability, assurance, empathy, and tangibles (further explanations are included
in Table 14).
SERVQUAL as the measurement of service quality, an antecedent of customer satis-
faction, is successfully used in various service contexts and industries around the
world.573 Nonetheless, this model is criticised as well.574 As a result, the model has
been further developed in several regards, for instance the dimensions or the ap-
plicability of service quality in specific nations or cross-cultural settings.575 On this
subject, RAAJPOOT (2004), for instance, elaborated a new, culture-specific scale in
order to measure service quality in non-Western cultures. This PAKSERV approach
contains six dimensions (24 items), which have been validated in Pakistan.576
568 Sachdev/Verma (2004), p. 97 based on Parasuraman et al. (1985), pp. 41 ff. 569 Cf. Sachdev/Verma (2004), p. 97. 570 Cf. Pollack (2009), p. 43; Grönroos (1984), pp. 36 ff. 571 Cf. Parasuraman et al. (1985), pp. 41 ff. 572 Cf. Bearden et al. (2011), pp. 402 ff.; Parasuraman et al. (1985), pp. 41 ff.; Parasuraman et al.
(1988), pp. 12 ff. 573 Cf. Pollack (2009), p. 44; Zhang et al. (2008), p. 213; Meffert/Bruhn (2009), p. 203; Sachdev/Verma
(2004), p. 102. 574 Cf. Meffert/Bruhn (2009), pp. 203 f. 575 Cf. Zhang et al. (2008), p. 217.; Raajpoot (2004) p. 182; Brady/Cronin (2001), p. 34; Finn/Lamb
(1991), pp. 483 ff. 576 Cf. Raajpoot (2004), p. 181 ff.

Determination of Model Variables and Hypotheses
123
The most popular point of critique on SERVQUAL is that perceived service quality is
seen as an attitude similar construct, which then is measured satisfaction-oriented
through a double scale (how it shall be/how it actually is).577 This hesitancy leads to a
well-established alternative approach, the Service Performance Model (SERVPERF).
Here a performance-only scale with 50% fewer items is used, which surveys the per-
ceived service quality. CRONIN/TAYLOR´s (1992) research shows that the
SERVPERF benefits as it explains a higher variation of the construct and the model
could be confirmed in a broader variety of industries.578
BRADY/CRONIN (2001) suggest that service quality conceptualised best as a third-
order factor model, which means that the construct is multidimensional and hierar-
chical. In other words they assume that the customers decision on service quality is
based on three corresponding subfactors, which constitute the customers` overall
perception.579 Due to increasing research efforts on it, this approach becomes known
as hierarchical service quality model (HSQM).580 Nonetheless, remarkably, the fur-
ther developed models all contain or build up on the five SERVQUAL dimensions,
thus they are more differentiations, and context adapted conceptualisations rather
than completely contrary approaches.
Service Quality Operationalisation and Marketing-Mix Additions
The general thoughts behind the SERVQUAL idea are undoubtedly crucial and valu-
able, when service quality, as an antecedent of satisfaction, is the point of interest.
Therefore, the operationalisation of service quality shall consist in these dimen-
sions,581 which is why these dimensions are specified to the after-sales context.
Based on that, the intended operationalisation is shown in Table 14.
577 Cf. Cronin/Taylor (1992), pp. 57/64 and the there cited literature. 578 Cf. ibidem, pp. 55 ff.; Cronin/Taylor (1994), pp. 125 ff. 579 Cf. Brady/Cronin (2001), pp. 34 ff. 580 Cf. Pollack (2009), p. 42. 581 The detailed operationalisation takes place in Chapter 5.2.2, Operationalisation.
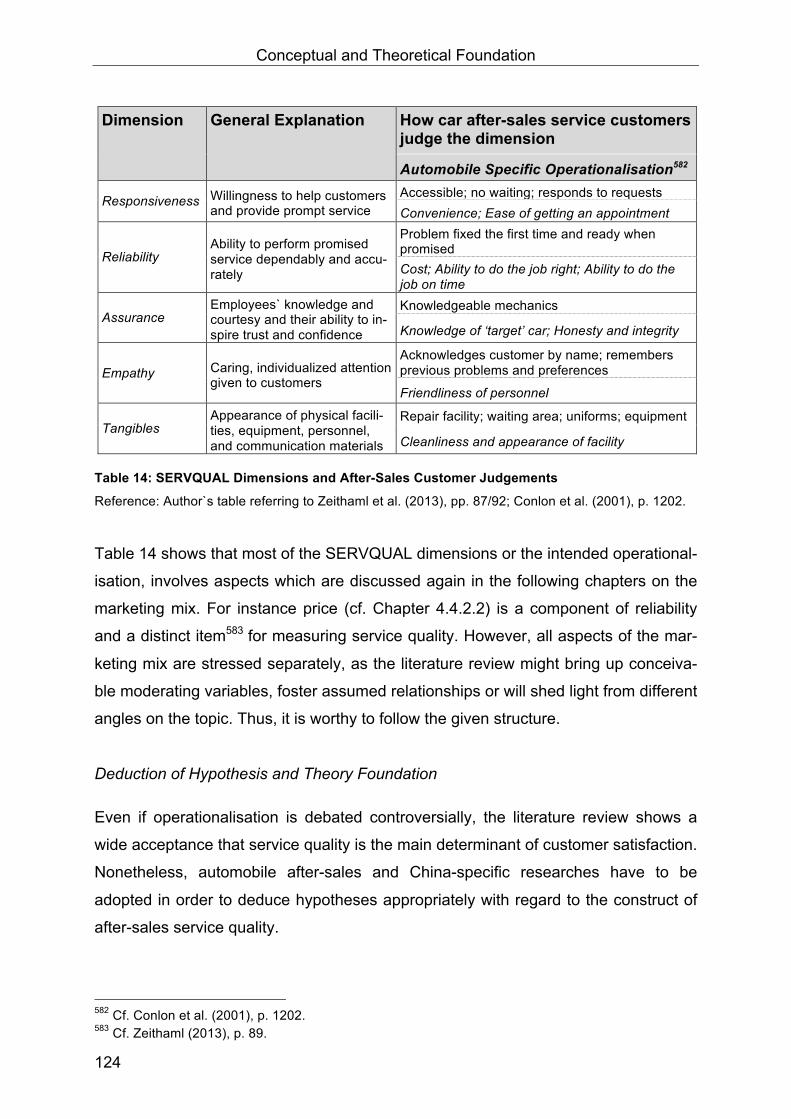
Conceptual and Theoretical Foundation
124
Dimension General Explanation How car after-sales service customers judge the dimension
Automobile Specific Operationalisation582
Responsiveness Willingness to help customers and provide prompt service
Accessible; no waiting; responds to requests Convenience; Ease of getting an appointment
Reliability Ability to perform promised service dependably and accu-rately
Problem fixed the first time and ready when promised Cost; Ability to do the job right; Ability to do the job on time
Assurance Employees` knowledge and courtesy and their ability to in-spire trust and confidence
Knowledgeable mechanics
Knowledge of ‘target’ car; Honesty and integrity
Empathy Caring, individualized attention given to customers
Acknowledges customer by name; remembers previous problems and preferences
Friendliness of personnel
Tangibles Appearance of physical facili-ties, equipment, personnel, and communication materials
Repair facility; waiting area; uniforms; equipment
Cleanliness and appearance of facility
Table 14: SERVQUAL Dimensions and After-Sales Customer Judgements
Reference: Author`s table referring to Zeithaml et al. (2013), pp. 87/92; Conlon et al. (2001), p. 1202.
Table 14 shows that most of the SERVQUAL dimensions or the intended operational-
isation, involves aspects which are discussed again in the following chapters on the
marketing mix. For instance price (cf. Chapter 4.4.2.2) is a component of reliability
and a distinct item583 for measuring service quality. However, all aspects of the mar-
keting mix are stressed separately, as the literature review might bring up conceiva-
ble moderating variables, foster assumed relationships or will shed light from different
angles on the topic. Thus, it is worthy to follow the given structure.
Deduction of Hypothesis and Theory Foundation
Even if operationalisation is debated controversially, the literature review shows a
wide acceptance that service quality is the main determinant of customer satisfaction.
Nonetheless, automobile after-sales and China-specific researches have to be
adopted in order to deduce hypotheses appropriately with regard to the construct of
after-sales service quality.
582 Cf. Conlon et al. (2001), p. 1202. 583 Cf. Zeithaml (2013), p. 89.
Determination of Model Variables and Hypotheses
125
The positive relationship from service quality towards service or customer satisfaction
within the automotive industry is proven several times through the following important
studies:
• HÜNECKE (2012) concerned the automobile after-sales service markets in
Italy, France and Spain.584
• HÄTTICH (2009) concerned the German car service market.585
• BEI/CHIAO (2001) focussed on perceived product quality, perceived price
fairness and perceived service quality in Taiwan.586
• DEVARAJ ET AL. (2001) showed for the US market that the brand has a
considerable influence on service satisfaction, but that quality of service is
most important.587
SHUQIN/GANG (2012) conducted research on relationship value within the Chinese
automotive after-sales industry, and thereby successfully incorporated the construct
of service quality, which they measured by a scale proposed by ANDALEEB/BASU
(1994). The hypothesis testing shows that in this specific Chinese context as well,
service quality is a major determinant of satisfaction. However, one service quality
dimension, namely responsiveness, failed to be significant.588 Chinese studies of
other industries, for instance the mobile telecommunication sector, likewise show that
service quality or perceived service quality is crucial in terms of building up satisfac-
tion.589
The general and automobile-specific literature review shows that service quality has
to be considered a distinct variable, which is critical to service satisfaction. The critics
mentioned do not neglect the variable itself or the function as an antecedent, but the
best suitable operationalisation. This is taken into account, especially when the final
operationalisation takes place in Chapter 5.2.2. As the aim of this study is to investi-
gate the customer´s perception, the construct is named ‘perceived service quality’.
As a result hypothesis H3 is formulated:
584 Cf. Hünecke (2012), p. 147. 585 Cf. Hättcih (2009), p. 213. 586 Cf. Bei/Chiao (2001), pp. 136 ff. 587 Cf. Devaraj (2001), p. 434. 588 Cf. Shuqin/Gang (2012), pp. 175 ff. 589 Cf. Deng et al. (2010), p. 296; Yim et al. (2008), 751.

Conceptual and Theoretical Foundation
126
H3: The higher the perceived service quality, the higher the after-sales ser-vice satisfaction.
The assumed hypothesis H3 is also in line with:
• C/D-paradigm590
• Kano-model
• Attribution theory
In Chapter 4.2.3 the C/D-paradigm initiated by OLIVER (1980), was mentioned as a
central model, which explains satisfaction.591 The theory on this is that the customer
compares the perceived performance (is) with a reference standard (should perfor-
mance). The reference can be the customer’s expectation, experience or concept of
an ideal performance level. As a result of the comparison process between should
and is, if the perceived performance is below expectations, the result is what is called
disconfirmation. In contrast, an equilibrium (confirmation) or a positive disconfirma-
tion (the product outperforms expectations) causes satisfaction. Theoretically both
sides can be influenced.592 In the given context service quality expresses the com-
parison’s is-component, which is why higher quality leads to a greater satisfaction, if
the should-component is kept stable. Inspired by HERTZBERGS (1965) two-factor
theory,593 KANO ET AL. (1984) further developed the Kano-model,594 which assumes
that satisfaction is multidimensional and related to five quality-factors. The five fac-
tors influencing satisfaction are the must-be, the one-dimensional, the attractive, the
indifferent and the reverse qualities. Notably, within evolving literature the model is
commonly known and used as a three-factor model referring to delighters, satisfiers
and basic needs.595 Each of them has a different effect, thus basic needs (must-be
quality) are expected to be delivered, and therefore do not cause satisfaction, but
cause dissatisfaction in the case of their absence. In contrast, the absence of de-
lighters (attractive quality) do not lead to dissatisfaction, but have the potential to
590 Often the C/D-paradigm is treated as a theory itself, but very strictly seen the C/D-paradigm is
based on various theories. Cf. Stauss (1999), p. 6. In this work, the C/D-paradigm is presented, as it is the best way to focus simultaneously very precisely and compact.
591 Cf. Chapter 4.2.3, Customer and Service Satisfaction. 592 Cf. Foscht/Swoboda (2011), pp. 238 ff.; Oliver (1980), pp. 460 ff. 593 Cf. Hertzberg (1965), pp. 364 ff. 594 Cf. Kano et al. (1984), pp. 39 ff. 595 Cf. Gregory/Parsa (2013), pp. 30 f.

Determination of Model Variables and Hypotheses
127
cause or strengthen satisfaction. Satisfiers (one-dimensional quality) cause (dis)-
satisfaction symmetrically.596 The positive influence of service quality towards after-
sales service satisfaction can be seen in line with the Kano-model, because the ser-
vice can be delivered at every mentioned (quality) level (cf. must/shall/can ser-
vices).597 KELLEY’s attribution theory (1973) says that transaction partners endeav-
our to explain the outcome of actions by attributing causes to their own behaviour, to
the transaction partner`s behaviour or to the environment. In service situations, due
to the integration of the external factor, often the customer aims a personal attribution.
The service provider’s staff is part of the service quality,598 which is why good service
levels can contribute to satisfaction. This is not the case if services are attributed to
situations.599
4.4.2.2 Instruments-of-Price-Policy-
The price policy is deemed to be a very important and success-critical instrument
within automotive marketing. In terms of the after-sales business the cost of owner-
ship or life-cycle cost are most relevant to the customer. Here, the loss of value is the
biggest cost factor, but it is not an after-sales service instrument that the provider can
steer. In contrast, typical after-sales services as repair and maintenance perfor-
mances are steerable and typologised as part of the customer´s operating cost.600
Besides the importance in the automotive industry, GUO (2013) summarises Chinese
consumer behaviour by saying that price is absolutely crucial, and Chinese custom-
ers are very price conscious, which he supports with an example of a typical Chinese
expression: ‘Never make a purchase until you have compared three shops’.601 More-
over he argues that pricing is a hard task in China, because of the dichotomy that
paying more than necessary is a cause for shame in the Chinese, but on the other
hand they see price as an important quality indicator: there is a strong belief that
products that are too inexpensive are bound not to be good.602
596 Cf. Foscht/Swoboda (2011), p. 242; Gregory/Parsa (2013), pp. 30 f.; Kano et al. (1984), pp. 39 ff. 597 Cf. Chapter 4.2.2, Service and After-Sales Service. 598 Cf. Chapter 4.4.2.1, Instruments of Service Policy. 599 Cf. Meffert/Bruhn (2009), pp. 72 f.; Kroeber-Riel/Gröppel-Klein (2013), pp. 393 ff.; Foscht/Swoboda
(2011), p. 242. 600 Cf. Diez (2009), pp. 211 ff. 601 Guo (2013), p. 25. 602 Cf. ibidem.
Conceptual and Theoretical Foundation
128
Undoubtedly, price or cost is a central after-sales service instrument, which has to be
analysed. However, it is already considered within the intended research model, as it
is a major part of the service quality operationalisation (dimension: reliability; item:
cost), and therefore particularly implemented.603
Combining the aspects of operational cost and customer loyalty, another influencing
factor should be considered, which becomes immediately obvious when loyalty is
seen as causing retention, namely the switching costs.604 Switching costs can be de-
fined, according to PORTER (1980), as the ‘one time costs facing the buyer of
switching from one supplier´s product to another.’605 BURNHAM ET AL. (2003) fur-
ther develop this definition when they argue that even if switching costs have to be
incurred immediately, they must be associated with a process. Thus their definition
reads, ‘(…) the one time costs that customers associate with the process of switching
from one provider to another.’606
Both generally and in the automotive context, ‘switching costs’ is an umbrella term for
three categories of economic and non-economic costs in accordance to change bar-
riers, namely economic, psychological and social-change barriers or the switching
cost due to them. Economic switching costs in the automotive after-sales area are of
a financial nature ‒ for instance contractual costs, regular customer discounts, higher
driving and time costs to reach the dealer, higher charges for services performed,
and also the benefits of loyalty. Psychological switching costs are for instance per-
sonal relationships with workshop personnel, or an emotional identification with the
brand. Finally, social switching costs concern the social environment of the customer,
such as opinions of friends and family members.607 Notably, other categorisations are
applicable, such as procedural, financial and relational switching costs,608 however
here the above-mentioned structure is used due to the popularity and established
adaptation to the automotive context. In every of the three declared areas, switching
603 Cf. Table 14: SERVQUAL Dimensions and After-Sales Customer Judgements. The specific opera-
tionalisation of final constructs and items takes place in Chapter 5.2.2, Operationalisation. 604 Cf. Baumgartner (2012), p. 281; Dick/Basu (1994), pp. 104 f. 605 Porter (1980), p. 10. 606 Burnham et al. (2003), p. 110. 607 Cf. Zeithaml (2013), pp. 161 ff.; Diez (2009), pp. 68 f.; Wang (2010), p. 254; Srivastava/Rai (2014),
p. 16. 608 Cf. Deng et al. (2010), p. 292.; Burnham et al. (2003), pp. 109 ff.

Determination of Model Variables and Hypotheses
129
costs include any kind of effort the customer has to cope with, thus it is assumed that
the higher the switching cost, the higher the perceived challenge to change provid-
er.609
With their study ‘Consumer Switching Costs: A Typology, Antecedents, and Conse-
quences’ BURNHAM ET AL. (2003) focus on the given topic intensively across in-
dustries.610 They find consistent evidence through industries for eight distinct switch-
ing costs (economic risk, evaluation, learning, set-up, benefit loss, monetary loss,
brand relationship loss, personal relationship loss costs), which can also be aggre-
gated to higher order dimensions, as mentioned earlier. Furthermore, contributions
on the consequences of switching costs are that switching costs have a stronger ef-
fect on customer retention than on customer satisfaction by explaining nearly double
the amount of variance, and all three aggregated cost dimensions are relevant (fi-
nancial at least). Moreover there was no evidence for interaction effects with custom-
er satisfaction. 611 Additionally, a review of literature on switching costs and their rela-
tionship to loyalty (or familiar) constructs shows that they are modelled as both a di-
rect effect (e. g. LI ET AL. 2008) and a moderating one (e.g. WANG 2010).612
Switching costs can be established by the provider as barriers or via benefits, and
thus refer to the after-sales instruments, but on the other hand aspects such as the
opinions of friends (social), which are difficult to influence, might be important as well.
Therefore, in this research the abstract variable of perceived switching costs is cho-
sen, and specified with regard to the after-sales focus, as perceived workshop
switching costs.
Deduction of Hypothesis and Theory Foundation
One of the first well-respected loyalty studies, which incorporate change barriers in
an automotive context, is by PETER (1997).613 She surveyed customers of a German
car brand in order to investigate important loyalty antecedents. For reasons de-
609 Cf. Wang (2010), p. 253. 610 Cf. Burnham et al. (2003), pp. 109 ff. 611 Cf. ibidem, pp. 119 ff. 612 Cf. Li et al. (2008), p. 452; Wang (2010), p. 256 or for a current overview: examplary Srivastava/Rai
(2014), pp. 16 f. 613 Cf. Peter (1997), pp. 1 ff.

Conceptual and Theoretical Foundation
130
scribed earlier, and as well particularly due to her operationalisation, the constructs
change barriers and switching costs can be considered similar. She focusses on so-
cial and psychological change barriers, rather than on financial barriers. Notably,
psychological change barriers have a stronger effect on customer loyalty as, the
mostly as crucial considered variable customer satisfaction. Moreover, this makes
psychological change barriers the strongest direct antecedent in the entire model.614
Addressing specifically automobile sales and services, VERHOEF ET AL. (2007) an-
alyse the Dutch new car market for brand and dealer retention by applying an econ-
ometric model. Thereby, they incorporate dealer and brand switching costs as ante-
cedents to retention. The nested logit model results addressing dealer retention show
that ‘Surprisingly, no significant effect is found for dealer switching costs.’615 In con-
trast, when it comes to brand retention the effect is significant, and moreover has an
expected positive contribution.616 However, the authors point to the peculiarities of
the Dutch mono-brand distribution system, where switching brands always has to go
in line with switching the dealer, thus brand switching is much more important than
dealer switching, if the buyer’s intention is to opt for another brand (disloyalty).617
HÄTTICH (2009) uses, in his research, the variable change barriers. This variable
contains the three initially mentioned social, psychological and financial dimensions,
plus a risk-related item in regard to workshop loyalty. He shows that, considering the
total effects, after customer satisfaction and price-performance ratio, change barriers
are an important factor. If only direct effects are considered, the barrier´s effect
strength is second in importance.618
As regards China, no automobile after-sales specific studies incorporating switching
costs can be found, but recent indications from other industries are presented next.
DENG ET AL. (2010) show for Chinese mobile phone services that switching costs
have a highly significant, positive effect on customer loyalty, whereby the path coeffi-
cient of trust is similar strong, and the one of satisfaction is three times stronger than
614 Cf. Peter (1998), pp. 77; Diez (2009), p. 70. 615 Verhoef et al. (2007), p. 108. 616 Cf. Ibidem. 617 Cf. ibidem, pp. 98/109 618 Cf. Hättich (2009), p. 213 ff.

Determination of Model Variables and Hypotheses
131
the one of switching costs.619 However, the authors’ summary is that ‘Our results im-
ply that the higher the switching cost, the greater [the] likelihood it will drive consum-
ers to stay with their current provider, and encourage others to use the provider’s
service.’620 These findings confirm another Chinese service study conducted in 2008
by LI ET AL., where the same three constructs are tested in accordance with repur-
chase intention. As well, findings and particularly effect strengths are nearly the same
as described above.621
The literature review shows generally, after-sales and China specific that switching
costs are important, if loyalty constructs are considered. Moreover, when direct ef-
fects are focussed on, most studies show positive effects on loyalty where automo-
bile specific both dealer and brand loyalty is the aim of research. Due to the low
amount of those particular researches, it is very worthy to contribute to the body of
knowledge regarding both dealer and brand loyalty. Therefore, on perceived switch-
ing costs H4 and H5 are formulated separately as follows:
H4: The higher the perceived workshop switching costs, the higher the dealer loyalty.
H5: The higher the perceived workshop switching costs, the higher the brand loyalty.
A review shows that the following theories contribute to the latter two hypotheses:
• Transaction cost theory
• Prospect theory (loss aversion)
• Transaction cost utility concept
The transaction cost theory by COASE (1937) belongs to the school of thought called
new institutional economics. It claims that every transaction is related to costs of var-
ious kinds, such as initiation cost, control cost, or barely quantifiable costs such as
time, cognitive effort and lost profit. Generally, it is favourable for every party, if
619 Cf. Deng et al (2010), p. 295. 620 Ibidem, p. 296. 621 Cf. Li et al. (2008), pp. 455 f.

Conceptual and Theoretical Foundation
132
transaction costs are as small as possible.622 Searching for a new service provider is
generally related to costs at least in terms of effort, such as initiation or search costs
and cognitive efforts, but it is doubtful that these costs are perceived as high enough
to prevent a provider change. Nonetheless, these costs contribute as further costs or
further change barriers, in the occasion of switching. Additionally, if switching costs
already exist that are related to the actual brand or workshop, such as benefits, dis-
counts, or preferred personal relationships, then the sum of all perceived switching
costs might be above an acceptable threshold. The latter aspect could even be
boosted if customers have strong loss aversion, which is part of the prospect theory
(s. Chapter 4.4.2.4) of KAHNEMAN/TVERSKY (1979).623 Loss aversion is an im-
portant aspect within the decision making process of customers, where it is assumed
theoretically that losses are valued higher than gains.624
To understand the advantages of the combination of both explanatory approaches,
the transaction cost utility concept of THALER (1985) is applicable and useful. THA-
LER defines the total utility as the sum of the acquisition utility and the transaction
utility.
total utility = acquisition utility + transaction utility
N (Pi. P. P*) = (Pi-P) + (P*-P)
The general idea is that a consumer could reach two kinds of utility at every transac-
tion. Here the acquisition utility is a basic utility (microeconomic net utility), which is
defined as the difference between the actual purchase price (P) and the maximum
price that the customer is willing to pay (Pi). The transaction utility is the difference
between (P), and the reference price (P*) perceived by the consumer as fair.625
Therefore, whether the customer feels he or she has made a good decision or pur-
chase is important, and furthermore dependent on buying circumstances (transaction
utility) or perceived losses through switching.
622 Cf. Rindfleisch/Heide (1997), p. 31; Müller-Stewens/Lechner (2005), pp. 149 ff.; Mann (1998), pp.
124 ff.; Coase (1937), pp. 386 ff. 623 The prospect theory discussion takes place in Chapter 4.4.2.4; Kahneman/Tversky (1979), pp.
263 ff. 624 Cf. Tversky/Kahnemann (1991), p. 1039. 625 Cf. Zerres (2010), p. 73; Thaler (1985), p. 205; Thaler (1999), p. 189.

Determination of Model Variables and Hypotheses
133
4.4.2.3 Instruments-of-Place-Policy-
The policy of place describes the distribution patterns of services ‒ for instance,
where and how the customer can receive them. Services, in contrast to products, can
be traded only with restrictions, which means that usually only performance vouchers
or service promises such as flight tickets are comparably easy to trade.626 This as-
pect is also known as perishability.627 As a result, local aspects are important, which
means where services can be performed, and where the customer or her/his car is
integrated as an external factor. Here, out of the customers view, location decisions
are more important in terms of services than in terms of consumer or industry
goods.628 As well internally, location decisions are highly relevant for automobile
manufacturers, because the service delivery system is difficult to change, due to the
high investment made or a long-term contract with the dealer workshops.629 As a re-
sult location planning is crucial in terms of elaborating an appropriate service net-
work,630 which fits both the customer`s and the OEM´s requirements. The latter as-
pect is not part of this research as it often refers to non-customer-oriented topics,
such as internal parts-logistics.631
Location planning is strongly related to customer needs, and thereby particularly to
the acceptance of distance, or how long it takes to reach the workshop,632 with 30
minutes being considered the critical maximum on the German market.633 LER-
CHENMÜLLER (2007) notes that distribution policies are rarely discussed in the lit-
erature, when customer satisfaction is considered, despite two facts: first, that some
features are directly related – for instance, the speed of processing the services pro-
vided and the accessibility of service locations; second, that after-sales operations
can contribute in terms of building customer satisfaction, only if all marketing mix in-
struments are considered.634
626 Cf. Meffert/Bruhn (2009), p. 335. 627 Cf. Zeithaml et al. (2013), pp. 22 f. 628 Cf. Meffert/Bruhn (2009), p. 336. 629 Cf. Diez (2009), p. 266; Arthur D. Little (n. a.) (2011), p. 2. 630 Cf. Diez (2009), pp. 300 ff. 631 Cf. Lerchenmüller (2007), p. 180. For further information on this topic, see for instance in presented
literature on pp. 30/34 f. 632 Cf. Meffert/Bruhn (2009), p. 337; Diez (2009), p. 301; Lerchenmüller (2007), p. 175. 633 Cf. Diez (2009), pp. 301 ff. 634 Cf. Lerchenmüller (2007), pp. 184 f.

Conceptual and Theoretical Foundation
134
When it comes to acceptance of distance, there are no accessible scientific findings
on automobiles which indicate how far or how long Chinese consumers are willing to
travel. A variable called acceptable workshop distance will therefore be integrated in
the research model. Moreover, findings on this are crucial for German automobile
manufacturers, because the Chinese workshop network is still under development.635
Deduction of Hypothesis and Theory Foundation
As stated above, there is a significant lack of specific literature towards indications on
the acceptable workshop distance in China. Nonetheless, and in accordance to
DIEZ,636 it is to be assumed that a threshold exists, a distance which customers find
too far to reach a workshop. Furthermore, that satisfaction and loyalty are the better,
the shorter the distance to the service encounter, because the customer´s conven-
ience increases. In order to explore these relationships, the following hypotheses are
assumed:
H6:
H6a:
H6a:
There is a relationship between acceptable workshop distance and af-ter-sales service satisfaction or workshop loyalty. The shorter the acceptable workshop distance, the higher the after-sales service satisfaction.
The shorter the acceptable workshop distance, the higher the workshop loyalty
Even if the literature review shows a gap in the postulated relationships, theory con-
tributes accordingly:
• Transaction cost theory
In the given context, the directions of the assumed hypotheses are in line with the
transaction cost theory,637 which says that every transaction causes costs and con-
sumers experience the greatest benefit if their own costs are as low as possible.
Thus in principle the less time customers spend on a transaction, the more they ben-
efit.
635 Cf. Chapter 3.3, Provision of After-Sales Services by German Brands in China. 636 Cf. Diez (2009), pp. 301 f. 637 Cf. Chapter 4.4.2.2, Transaction cost theory.

Determination of Model Variables and Hypotheses
135
Type of Customer Contact and Facility Appearance
Service deliveries can be distinguished by the type of contact, where three general
kinds can occur. First, the customer is physically present and interacts with the pro-
vider. Second, the contact is indirect for instance via the internet. Third, there is no
contact for providing a service.638 Automotive after-sales services thereby can occur
in different ways, however, at repairs it is usually expected that the customer inter-
acts with the provider, when he brings his car to the workshop and explains the defi-
ciency. Then, direct contacts are subdivided in two categories depending on whether
there is an interaction with service workers or not.639 The latter is called self-service,
and is not considered here. When customers make contact, facility issues are im-
portant as this affects the evaluation process of services, here image and willingness
to cooperate are deemed to be important psychological aspects, when the encounter
happens.640 The latter will not be considered, because it would require an internal
dealer analysis, not in keeping with the consumer research focussed on here.
Image, however, is highly consumer related. Here for instance, DIEZ (2009) states
that it is an important objective of an automobile-specific distribution policy that the
brand is presented properly at the point of service.641 This mainly refers to tangible
aspects, like the appearance of physical facilities, which are already considered
when service quality was stressed (cf. Chapter 4.4.2.1, especially Table 14). On the
other hand, brand image presumably affects the entire after-sales process chain, so
it shall be considered separately. However, because this topic is mainly an aspect of
promotion policy, it is discussed in the following chapter.
4.4.2.4 Instruments-of-Promotion-Policy-
The marketing-mix instruments regarding the promotion policy are manifold, such as
personnel selling, sales promotion, advertising, public relations etc.642 The previously
mentioned construct of image, in this context, is a relatively abstract construct, which
itself can be influenced by the initially named instruments. As early as 1984 GRÖN-
638 Cf. Fitzsimmons et al. (2014), p. 75; van Birgelen et al. (2002), p. 45. 639 Cf. Fitzsimmons et al. (2014), p. 75. 640 Cf. Meffert/Bruhn (2009), p. 338; Fitzsimmons et al. (2014), pp. 75/91. 641 Cf. Diez (2009), p. 265; Dahlhoff/Eickhoff (2014), p. 229. 642 Cf. Zerres/Zerres (2006), p. 116 ff.

Conceptual and Theoretical Foundation
136
ROOS figured out the exceptional importance of image for service providers, and the
direct link to perceived service quality.643 Image, as well, is highly relevant for this re-
search, as it is considered as a crucial psychological effect within the after-sales suc-
cess chain (cf. Figure 18). According to MEFFERT/BRUHN (2009) image contributes
very positively, because it reduces customers’ perceived risk, and is an important in-
dicator for judgements of quality and satisfaction.644
In the automotive context the brand is becoming more and more important.645 This is
a development which is generally acknowledged ‒ for instance DE MOOIJ (2014) ar-
gues, ‘In most categories, today´s companies do not compete with products but with
brands, (…).’646 Actually the combination of both brand and image is deemed to be
crucial, as brand image is seen as extremely important for a brand’s success. Specif-
ically in the automotive area, ESCH/ISENBERG (2013) state that brand image posi-
tively influences buying intentions, satisfaction with the brand, brand retention, and
future buying or loyalty.647 Additionally, brand image is especially important, and is
considered a strategic aspect of premium brands.648
Brand image can be defined with regard to a famous article by KELLER (1993), ‘(…)
as perceptions about a brand as reflected by the brand associations held in consum-
er memory.’649 Often researchers build on this definition, whereas various specifica-
tions are made to specific circumstances. One major aspect here is that image is
considered to be a whole picture or, as AAKER (1996) says, ‘(…) the net result of all
the experiences, impressions, beliefs, feelings and knowledge that people have
about a company.’650 It is significant that, depending on the product category, some
researchers just use the term image or the term corporate image. In this study brand
image is used, because for instance Audi is a brand of the VW concern but mostly
considered (especially from the customer´s view) to be an independent company.
643 Cf. Grönroos (1984), pp. 39 f. 644 Cf. Meffert/Bruhn (2009), pp. 93 f. 645 Cf. Dahlhoff/Eickhoff (2014), pp. 226 f.; Diez (2012), p. 123; Diez (2009), p. 514; Wallentowitz et al.
(2009), p. 74. 646 de Mooij (2014), p. 28. 647 Cf. Esch/Isenberg (2013), pp. 37 f. 648 Cf. Reichhuber (2010), p. 103; Verhoef et al. (2007), pp. 103 ff. 649 Keller (1993), p. 3; Referring to Google Scholar in 2015, this article is cited more than 8.500 times. 650 Aaker (1996), p. 113.

Determination of Model Variables and Hypotheses
137
However, this work also addresses studies that use the construct of corporate image,
because the concepts of brand image and corporate image are often interchangeable.
Obviously, brand image is generally an important aspect. Particularly for this re-
search setting, it is really interesting, as brand image primarily refers to the manufac-
turer’s side, but coincidently influences the entire after-sales success chain, which is
why analysing this construct could produce valuable insights into the interface be-
tween the customer and the dealer or manufacturer. As a result, the construct of
brand image is included in the research model as an independent variable.
Deduction of Hypothesis and Theory Foundation with Regard to Satisfaction
As regards service settings, ANDREASSEN/LINDESTAD (1998) conclude that ‘Cor-
porate image is consequently assumed to have an impact on customers’ choice of
company when service attributes are difficult to evaluate.’651 Their hypothesis testing
confirmed the assumption that brand image has a strong impact on customer satis-
faction.652 This finding is confirmed by other studies, such as ZINS (2001),653 and
AGA/SAFAKLI (2007), who compare the predictive power of price, service quality,
and corporate image on customer satisfaction at consumer services in professional
accounting firms. The result is that image has the strongest positive influence.654
In the field of automobile research, only DEVARAJ ET AL. (2001) show for the US
car-service market that brand reputation, which is quite familiar to brand image, is a
relevant antecedent to service satisfaction.655
Research concerning China directly is also rare, but OBGA/TAN (2009) state in their
study on brand image that ‘(…) one can conclude that brand image can positively in-
fluence customers’ perceived quality on a market offering and also boost customer
satisfaction (…) towards a market offering.’656 It is worth noting that they have not re-
searched the link directly, but the correlations and interpretations give a first hint on 651 Andreassen/Lindestad (1998), p. 11. 652 Cf. ibidem, pp. 19 f. 653 Cf. Zins (2001), p. 280. 654 Cf. Aga/Safakli (2007), p. 94. 655 Cf. Devaraj et al. (2001), p. 434. 656 Cf. Ogba/Tan (2009), p. 141.

Conceptual and Theoretical Foundation
138
the satisfaction aspect within the Chinese context. This hint is confirmed by LAI ET
AL. (2009), when they reveal that, in the Chinese mobile telecommunication service
industry, corporate image has a significant effect on customer satisfaction. Moreover,
in this model corporate image has the strongest direct effect on customer satisfaction,
notably stronger than service quality, which was not significant as a direct driver, but
was on an indirect path via corporate image and perceived value.657
Albeit the scientific review reveals only a few context-specific studies which show an
explanatory function of brand image on satisfaction constructs, it is valuable analys-
ing this empirically for after-sales service satisfaction in China, in order to bring up
findings contributing to the body of knowledge. Therefore, hypothesis H7 is postulat-
ed as a result of the literature mentioned:
H7:
The higher the brand image, the higher the after-sales service satisfac-tion.
Theories:
• Assimilation theory
As regards previously mentioned theories such as the C/D-paradigm,658 theory would
not contribute to this hypothesis, because higher expectations lead to dissatisfaction,
if the perceived performance is constant. Thus the image has to be relatively low, in
order to cause high satisfaction with adequate service performances. But on the oth-
er hand image serves as a surrogate for quality (information economics: signal-
ling),659 and quality is a major antecedent of satisfaction. However, one theory con-
tributes to the general understanding of such image aspects and therefore eases this
contradiction: the assimilation theory.
The assimilation theory is based on the dissonance theory (cf. Chapter 4.4.1), and
says that humans try to balance their attitudes or expectations, perceptions and be-
haviour. As a result, unconsciously an internal psychological consistency is aimed at.
657 Cf. Lai et al. (2009), p. 984. 658 Cf. Chapter 4.4.2.1, Instruments of Service Policy. 659 Cf. Chapter 4.4.2.4, Instruments of Promotion Policy.

Determination of Model Variables and Hypotheses
139
If perception and attitude are not consistent, this dissonance is reduced or overcome,
therefore attitude or perception is adjusted afterwards. This adjustment process is
called assimilation.660 FOSCHT/SWOBODA (2011) argue that customers adjust their
perception towards expectation to cause satisfaction. According to them, this is
proofed by MITTAL ET AL. (1999).661 Nonetheless the assimilation theory is criticised,
mainly by proponents of the contrast theory, which also acknowledge corrections to
discrepancies. But this correction is done towards the opposite direction, thus dissat-
isfaction increases.662
Obviously, there is no single theory delivering a comprehensive explanation. In terms
of image, combining the assimilation and the attribution theory (cf. Chapter 4.4.2.1)
seems to be favoured. If a customer selects a brand mainly because of the strong
image, and afterwards is satisfied with this selection, she might charge attribute the
outcome mainly to her own selection or in other words to the performance of her se-
lection performance. In line with the attribution theory, the image-related self-
attribution could therefore enhance the customer satisfaction, if the assimilation theo-
ry applies simultaneously. However, the contribution of theory to hypothesis H7 has
considerable limitations.
Deduction of Hypothesis and Theory Foundation with Regard to Loyalty
Often satisfaction is seen as the main antecedent of loyalty, but image can be a
strong antecedent as well. For complex and infrequent service purchases it is shown
that brand image rather than customer satisfaction is the most effective predictor of
loyalty663‒ a fact which indicates that brand image is highly relevant in terms of work-
shop loyalty, especially because of analogy of the infrequent demand behaviour.
NGUYEN/LEBLANC (2001) assume a strong relationship between corporate image
and loyalty, which they test empirically in three service industries: retail services, tel-
ecommunication services and educational services. Due to various limitations, they
cannot provide clear valid findings, but nonetheless the correlations found indicate
660 Cf. Skala-Gast (2012), p. 21. 661 Cf. Foscht/Swoboda (2011), p. 242; Mittal et al. (1999), pp. 88 ff. 662 Cf. Skala-Gast (2012), pp. 22. 663 Cf. Andreassen/Lindestad (1998), pp. 19 f.

Conceptual and Theoretical Foundation
140
the assumed positive relationship.664 A Turkish study on the antecedents of customer
loyalty by AYDIN/ÖZER (2005), shows a positive relationship between corporate im-
age and customer loyalty, but it is not statistically significant.665 Nor are BLOEMER
ET AL. (1998) able find a direct relationship between image and loyalty for the finan-
cial services sector.666 In contrast ZINS (2001) confirms the mentioned relationship
for the airline industry, and concludes that ‘Corporate image plays the dominant role
when explaining future loyalty.’667 Similarly, findings of research on the insurance in-
dustry show that brand image is a positive moderator of the relationship between
service quality and customer loyalty, and therefore seen as an amplifier.668
The view across industries does not deliver a clear view. In order to clarify this, next
the literature review is narrowed down, first, to the automotive industry, and then
specifically to the Chinese context.
GROßKURTH (2004) analyses brand loyalty at premium car sales, but he does not
incorporate brand image directly in his model, because most of variables he consid-
ers are trust-related constructs in relations to the dependent variable brand loyalty.
However, trust in the brand has by far the strongest direct effect on brand loyalty.
Neither trust in the product, as the second strongest effect, nor trust in the dealer or
satisfaction with the dealer show this strenght.669 Thus, this familiar research setting
indicates that brand image, as a non-trust related construct, might have a crucial im-
pact on loyalty as well.
Focussing on the Dutch new-car market, VERHOEF ET AL. (2007) tried incorporat-
ing the construct of brand equity in their research model, in order to predict brand re-
tention. Here, brand equity is operationalised as ‘The consumer’s awareness and im-
age of the brand’.670 However, the effect was not significant, which is why they after-
wards used the construct of brand tier as a wider concept in their final model, allow-
ing a broader scope to be applied than if they simply used brand- and image-related 664 Cf. Nguyen/Leblanc (2001), pp. 231 ff. 665 Cf. Aydin/Özer (2005), pp. 919 ff. 666 Cf. Bloemer et al. (1998), p. 283. 667 Zins (2001), p. 287. 668 Cf. Srivastava/Rai (2014), p. 21. 669 Cf. Großkurth (2004), p. 260. 670 Verhoef et al. (2007), p. 100.

Determination of Model Variables and Hypotheses
141
items. In the end, they uncovered the moderating role of brand tier in the Dutch new-
car market.671 But this is not a service-related study, and the Dutch market is quite
different from the Chinese one.
Focussing on the European markets of Spain, France and Italy, HÜNECKE (2012)
significantly confirmed a positive effect of brand image on brand loyalty. In his model
brand image is the strongest driver of the dependent variable, brand loyalty (globally
viewed).672 The differentiated view on the single markets shows that, in Italy and
Spain, brand image remains the most important variable. In contrast, in France,
product satisfaction is more important than brand image, though a positive relation-
ship does also exist between brand image and satisfaction in France.673
It is assumed that in East Asian cultures a company’s reputation contributes more
strongly to brand loyalty than in Western cultures, so next Chinese studies are
stressed.674 Even if Taiwan is not analogous to Mainland China, the study by WANG
(2010), which primarily focusses switching costs in the case of services, shows that
here, too, brand image is an important determinant of customer loyalty.675 Additional-
ly, TU ET AL. (2014) have conducted research with data from Toyota car dealers
from the Taipei area, in order to show that customer commitment is a mediator be-
tween brand image and customer loyalty. In this study, brand image has a significant
effect,676 but findings should be interpreted carefully as the research setting has limi-
tations, such as a low number of variables and a mono-brand analysis.
Familiar, but more specific than brand image, KNÖRLE (2011) incorporates per-
ceived prestige in his general research on Chinese brand loyalty. He was not able to
empirically confirm his thesis that a higher perceived prestige leads to higher brand
loyalty (negative effect) but, in combination with his qualitative study, he concluded
that brand switching takes place if the consumer has a relevant alternative which de-
671 Cf. ibidem, pp. 109 ff. 672 Cf. Hünecke (2012), p. 128. 673 Cf. ibidem, p. 136. 674 Cf. de Mooij (2014), p. 148. 675 Cf. Wang (2010), pp. 258 f. 676 Cf. Tu et al. (2014), p. 23 ff.
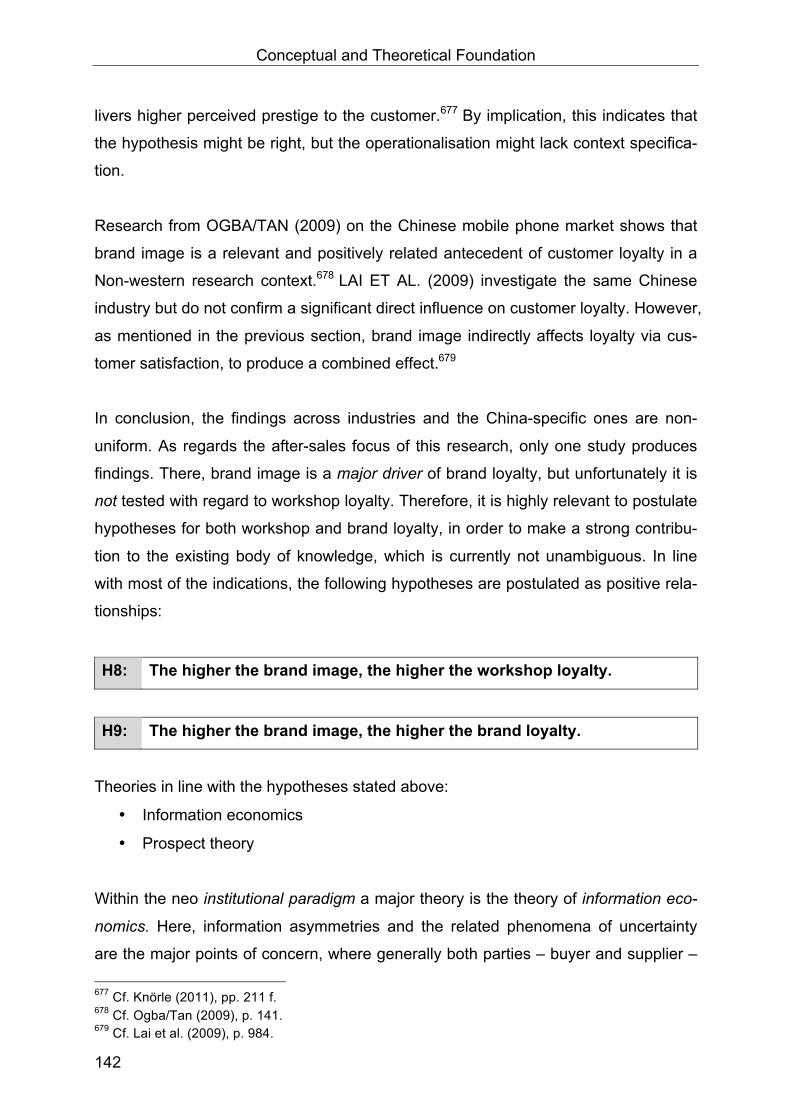
Conceptual and Theoretical Foundation
142
livers higher perceived prestige to the customer.677 By implication, this indicates that
the hypothesis might be right, but the operationalisation might lack context specifica-
tion.
Research from OGBA/TAN (2009) on the Chinese mobile phone market shows that
brand image is a relevant and positively related antecedent of customer loyalty in a
Non-western research context.678 LAI ET AL. (2009) investigate the same Chinese
industry but do not confirm a significant direct influence on customer loyalty. However,
as mentioned in the previous section, brand image indirectly affects loyalty via cus-
tomer satisfaction, to produce a combined effect.679
In conclusion, the findings across industries and the China-specific ones are non-
uniform. As regards the after-sales focus of this research, only one study produces
findings. There, brand image is a major driver of brand loyalty, but unfortunately it is
not tested with regard to workshop loyalty. Therefore, it is highly relevant to postulate
hypotheses for both workshop and brand loyalty, in order to make a strong contribu-
tion to the existing body of knowledge, which is currently not unambiguous. In line
with most of the indications, the following hypotheses are postulated as positive rela-
tionships:
H8: The higher the brand image, the higher the workshop loyalty.
H9: The higher the brand image, the higher the brand loyalty.
Theories in line with the hypotheses stated above:
• Information economics
• Prospect theory
Within the neo institutional paradigm a major theory is the theory of information eco-
nomics. Here, information asymmetries and the related phenomena of uncertainty
are the major points of concern, where generally both parties ‒ buyer and supplier ‒ 677 Cf. Knörle (2011), pp. 211 f. 678 Cf. Ogba/Tan (2009), p. 141. 679 Cf. Lai et al. (2009), p. 984.

Determination of Model Variables and Hypotheses
143
have information deficits. Especially in service settings, customers are not fully capa-
ble of judging performance, due to the immaterial nature of services. The theory of
information economics distinguishes three performance characteristics: search, ex-
perience, and trust. Here, the higher the experience and trust characteristics of an of-
fer, the higher the information deficits and uncertainties, which hamper buying deci-
sions. In order to reduce these negative effects, both parties can reduce information
deficits. For providers like automotive brands and workshops, signalling is an ap-
proach to give more information to the less-informed party (customer), whereby the
information functions as an a priori surrogate of actual performance.680 Notably, a
typical way to achieve signalling is a strong image.681 As a result brand image helps
to reduce uncertainty and information deficits, thus barriers to loyal behaviour are
lowered, via signalling.
Additionally, the repetitive use of a service performed, as in a workshop, likewise has
a signalling and a reputation-building function, if the customer is satisfied, because
trust is fostered, which is one of the three crucial characteristics.682
Another theoretical aspect, which explains loyalty, is the utility theory.683 Within utility
research KAHNEMAN/TVERSKY (1979) developed an alternative,684 the prospect
theory, which mainly refers to decision-making according to the assessment of posi-
tive or negative outcomes (s-shaped value function). Here, judgement does not rely
on a zero point, but on a reference point, and decisions above this point are as-
sessed as gain. Accordingly, below the reference point losses are felt. Thus for in-
stance, at price assessments, it is not the absolute price that is critical, but its differ-
ence from the reference price (reference dependence).685 However, the theory is ap-
plicable widely above price or finance decisions.686 Importantly, the reference point is
not fixed, rather than depended on the customer’s assessment of expectations and
680 Cf. Kuß (2011), pp. 203 ff.; Meffert/Bruhn (2009), pp. 55 ff.; Mann (1998), pp. 109 ff. 681 Cf. Meffert/Bruhn (2009), p. 60. 682 Cf. Dorka (2012), p. 189; Meffert/Bruhn (2009), p. 59. 683 Cf. Foscht/Swoboda (2011), p. 248. 684 Cf. Edwards (1996), p. 19. 685 Cf. Zerres (2010), p. 70; Kahneman/Tversky (1979), pp. 263 ff.; Tversky/Kahnemann (1991),
pp. 1039 ff. 686 Cf. Edwards (1996), p. 35; Kahneman/Tversky (1979), p. 288.

Conceptual and Theoretical Foundation
144
circumstances.687 Moreover, the theory implies that for customer preferences, losses
are valued higher than gains, which is called loss aversion.688 With regard to the pos-
tulated hypotheses, it is to be assumed that brand image has an influence on the ref-
erence point, thus competitive workshop or brand offers are viewed relatively lower, if
their brand image is comparably lower. Moreover, disloyal behaviour could be a risk,
as the known utility level could be lost, and losses are highly considered.
4.4.2.5 Instruments-of-Personnel-Policy-
MEFFERT/BRUHN (2009), argue that personnel policy is the most important internal
marketing instrument, which means that staff are viewed as internal customers. Pri-
marily, three aspects lead to this perspective. First, staff skills have to increase con-
tinuously due to the need for a permanent supply of performance potential. Second,
the integration of the external factor, where the customers’ contact is the direct con-
nection from personnel policy to customer behaviour. And finally, the immateriality of
services, where staff is often seen as a surrogate for actual performance.689
Due to the focus of this research, internal marketing aspects of personnel issues are
excluded, although they are doubtless important. However, instruments690 such as
recruitment, personnel development, and so on are not directly linked to customer
behaviour.
In contrast, the service encounter marks a situation where the employees are in a di-
rect contact with customers, and therefore it relates particularly to the previously
mentioned surrogating, and a potentially effective way of producing customer satis-
faction.691 Automotive after-sales services are mainly so called high divergence ser-
vices, which means that the service process is unprogrammed and not standardised.
Therefore, at least an information exchange (interaction) between employee and cus-
tomer is required.692 The service encounter or interaction process ‘defines the quality
687 Cf. Kahneman/Tversky (1979), p. 288. 688 Cf. Tversky/Kahnemann (1991), p. 1039. 689 Cf. Meffert/Bruhn (2009), pp. 243 f./359 ff. 690 Cf. ibidem, pp. 364 ff.; Zeithaml et al. (2013), pp. 324 ff. 691 Cf. Fitzsimmons et al. (2014), pp. 91 ff.; Zeithaml et al. (2013), pp. 315 ff.; Meffert/Bruhn (2009), pp.
358 ff.; Thalhofer (2003), p. 61. 692 Cf. Fitzsimmons et al. (2014), p. 74.

Determination of Model Variables and Hypotheses
145
of the service in the mind of the customer, [and] is called a “moment of truth”. The of-
ten brief encounter is a moment in time when the customer is evaluating the service
and forming an opinion of its quality.’693 This quotation shows on the one hand again
the encounter´s importance and on the other hand that this aspect of personnel poli-
cy is highly related to quality. In fact, the considered service quality dimensions con-
tain personnel issues directly,694 especially through the dimensions of assurance and
empathy. Thus crucial aspects such as honesty, integrity, and friendliness of person-
nel are already conceptually considered and intended to be included in the research
model (cf. Chapter 4.4.2.1).
Moreover, in this study further possible variables related to personnel policies are not
comprised in the research model, because the complexity of that model would in-
crease to the point where the number of measurable items that are economically af-
fordable would rise to an unacceptably high level. This limitation is also required, be-
cause the more important focus of this work is on cultural aspects, which are dis-
cussed next.
4.4.3 Cultural Influences
The general discussion of culture in Chapter 4.2.5 shows that every stage in the ser-
vice experience process is affected by cultural influences, so it is now important to
elaborate conceptually, how these influences are to be integrated into the research
model. Additionally, it was shown that values are a core element of culture and a
cause for given behaviour.695 Because values are causal, it is possible to operational-
ise them as independent variables, which is a powerful kind of application in order to
reach one of the objectives of this research ‒ to explain how Chinese culture influ-
ences the way the Chinese perform when it comes to satisfaction, loyalty assess-
ment and behaviour. In line with that, and due to the need for considering specifically
the level of culture,696 this research focuses on micro or individual level analysis, ra-
693 Ibidem, p. 91. 694 Cf. Zeithaml et al. (2013), p. 319; Table 14: SERVQUAL Dimensions and After-Sales Customer
Judgements. 695 Cf. Chapter 4.2.5, Culture. 696 Cf. ibidem; Zhang et al. (2008), p. 221; Craig/Douglas (2006), p. 336.

Conceptual and Theoretical Foundation
146
ther than on analysis at a macro level or on a national basis. Furthermore, the previ-
ously mentioned points suit this study’s research perspective.697
The crucial question is, which theory best fits the given priorities. Out of the huge va-
riety of cultural studies, with their quite different approaches, it is the SCHWARTZ
value theory which strongly relates to the points mentioned, especially with an em-
phasis on two key aspects: values and the individual level. In addition, significant au-
thors refer in this context to the psychologist SCHWARTZ.698
As regards service research in particular, ZHANG ET AL. (2008), claim in their cross-
cultural review paper that it is crucial to apply other theories than those of HOF-
STEDE in the field of consumer service research. They show that HOFSTEDE is by
far the most often used approach in this field,699 but despite its undoubtedly useful
contributions, it is widely criticised, and alternatives700 are too much ignored by re-
searchers. For ZHANG ET AL. (2008) ‘Going beyond Hofstede’701 promises great
benefits to service marketing, in part because authors like SCHWARTZ are widely
accepted and applied in other disciplines.702 The next section describes his value
theory, and shows in detail, why it fits this research.
4.4.3.1 Schwartz`s-Individual-Level-Values-
Theory of Basic Human Values
SCHWARTZ is an Israeli psychologist who invented the theory of basic human val-
ues (1992)703 in the area of cultural research. Today, it is considered to be one of the
best theoretically and empirically grounded value theories globally,704 and next to re-
searchers like HOFSTEDE, he is one of the most popular researchers in this field.705
697 Cf. Chapter 4.2.5, Excursus: Research Perspective: Emic vs. Etic Approach 698 Cf. de Mooij (2014), p. 183; Zhang et al. (2008), p. 219; Triandis (1994), p. 112. 699 Cf. Zhang et al. (2008), p. 213. 700 For instance Schwartz, Hall, Riddle or Keillor et al. s. Zhang et al. (2008), p. 213 Table 2 for the
whole enumeration. 701 Ibidem, p. 219. 702 Cf. ibidem. 703 Cf. Schwartz (1992), pp. 1 ff. 704 Cf. Cieciuch/Davidov (2012), p. 37. 705 In 2012 Google Scholar lists over 8,200 citations to the first three articles, which have introduced
this theory. Cf. Schwartz et al. (2012), p. 663.

Determination of Model Variables and Hypotheses
147
His theory of values is based on the former value concept, developed by ROKEACH
(1973), who argued that ‘The value concept, more than any other, should occupy a
central position … able to unify apparently diverse interests of all the sciences con-
cerned with human behaviour.’ 706 Additionally, SCHWARTZ/BILSKY (1987,1990)
elaborated a tentative theory of the universal content and structure of human val-
ues,707 which is derived from the assumption that values (in the form of conscious
goals) represent three types of universal human requirements, to which every indi-
vidual in every culture must be responsive:708 ‘biologically based needs of the organ-
ism, social institutional requirements for interpersonal coordination, and social institu-
tional demands for group welfare and survival (…).’709 Moreover they give a concep-
tual definition of values, as follows. ‘Values (1) are concepts of beliefs, (2) pertain to
desirable end states or behaviours, (3) transcendend specific situations, (4) guide se-
lection or evaluation of behaviors and events, and (5) are ordered by relative im-
portance.’710
Against this background, SCHWARTZ defined ‘(…) basic values as trans-situational
goals, varying in importance, that serve as guiding principles in the life of a person or
group.’711 Furthermore, he makes a distinction between values, because they are ex-
pressed by different motivational goals. Thus, he identified a comprehensive set of
ten basic values, relevant in every society, which are ordered around a motivational
circle and organised as a coherent system ‘that underlies and can help to explain in-
dividual decision making, attitudes, and behavior.’712 The coherent circular structure
further reflects and specifies the dynamic relation among the values, which can be
expressed as conflicts or congruities. Relatively seen, values next to each other are
fairly similar in contrast to values arranged opposite to one another.713 SCHWARTZ
exemplifies this as follows: ‘The pursuit of any value has consequences that may
conflict or may be congruent with the pursuit of other values. For example, the pursuit
of novelty and change (stimulation values) is likely to undermine [the] preservation of
706 Cited by Schwartz (1992), p. 1. 707 Cf. Schwartz /Bilsky (1987,1990). 708 Cf. Schwartz (1992), p. 4. 709 Schwartz/Bilsky (1987), p. 551. 710 Schwartz (1992), p. 4. 711 Cf. Schwartz et al. (2012), p. 664.; Schwartz (1992), pp. 1 ff. 712 Schwartz et al. (2012), p. 664. 713 Cf. Schwartz et al. (2001), p. 519; Schwartz (2003), pp. 268 ff.

Conceptual and Theoretical Foundation
148
time-honored customs (tradition values). In contrast, the pursuit of tradition values is
congruent with the pursuit of conformity values: Both motivate actions of submission
to external expectations.’714
The ten motivationally distinct basic values can also be expressed (consolidated) as
four higher order values on two orthogonal dimensions (self-enhancement vs. self-
transcendence and openness to change vs. conservation).715 In addition the circular
relation generally allows the domain of values to be partitioned into more or less de-
tailed constructs, depending how finely the researcher wants to discriminate between
the underlying motivations.716 Below, Figure 24 and Table 15 show the circular struc-
ture of the ten basic values and their conceptual definition.
Reference: Davidov et al. (2008), p. 425.
714 Cf. Schwartz et al. (2001), p. 521. 715 Cf. Davidov et al. (2008), pp. 424 f.; Schwartz/Boehnke (2004), pp. 251 f. 716 Cf. Davidov et al. (2008), p. 424.
Figure 24: Structural Relation Among the Ten Values and the Two Dimensions

Determination of Model Variables and Hypotheses
149
Value Conceptual Definition
Self-direction Independent thought and action-choosing, creating, exploring
Stimulation Excitement, novelty, and challenge in life
Hedonism Pleasure and sensuous gratification for oneself.
Achievement Personal success through demonstrating competence according to social standards
Power Social status and prestige, control or dominance over people and resources
Security Safety, harmony, and stability of society, of relationships, and of self
Conformity Restraint of actions, inclinations, and impulses likely to upset or harm others and violate social expectations or norms
Tradition Respect, commitment, and acceptance of the customs and ideas that traditional cul-ture or religion provides
Benevolence Preservation and enhancement of the welfare of people with whom one is in fre-quent personal contact
Universalism Understanding, appreciation, tolerance and protection for the welfare of all people and for nature
Table 15: Conceptual Definition of Schwartz´s Ten Basic Human Values
Reference: Author`s table referring to Schwartz (1994), p. 22.
Scope
According to scope, the ten basic values can be used for different purposes.717 Thus
far, the aspects mentioned refer mainly to values reflected in individuals, and the re-
sulting culture-specific differences (individual-level). 718 Specifically with regard to
within-country analysis, DAVIDOV ET AL. (2008) summarise that various studies
have shown important influences of individual value priorities towards attitudes such
as political preferences and behaviour such as political activism or voting.719 In fact,
this is why, in this research, the individual level values fit perfectly, particularly with
regard to both the delimitated group of car users and their service buying behavior.
SCHWARTZ/BARDI (2001) show that the same ten values can also be used with a
different scope, namely the scope of culture level, which they contrast concisely: ‘In-
dividual differences in the importance attributed to values reflect individuals’ unique
needs, temperaments, and social experiences. But the pan-cultural similarities in val-
ue importance are likely to reflect the shared bases of values in human nature and
717 Cf. Schwartz (2011b), p. 309. 718 Cf. ibidem; Schwartz/Bardi (2001), p. 280. 719 Cf. Davidov et al. (2008), p. 441.

Conceptual and Theoretical Foundation
150
the adaptive functions of each type of value in maintaining societies (…).’720 Pan-
cultural similarities, comparisons of nations or the comprehensive description of Chi-
nese Culture (culture level) is not the aim of this work, which is why these aspects
and methods are not discussed in detail, and are not utilised for this research.721
Benefits
As regards the objectives and requirements discussed in Chapter 4.2.5, applying the
theory of basic human values in this research work is a powerful method, because:
• ‘Values can provide predictive and explanatory power in the analysis of atti-
tudes, opinions and actions.’722
• The circular structure allows the whole systems of values to be studied as a
kind of an expression of culture.
• Ten single values can be analysed in detail, those that are especially relevant
to any specific topic can be identified.
• Simultaneously, beside the detailed single value analysis, a broader analysis
of four higher-order values on two orthogonal dimensions is easily applicable.
• There is evidence for the systematic relation of value priorities to behaviour for
China and also particularly for consumer purchase behavior.723
• Social desirable responding (neither individual, group nor society caused),
does not confound the self reported-values,724 which might be crucial especial-
ly in China due to the collectivist culture.
• Focussing and comparing individuals and groups is possible, because correc-
tions to individual differences in use of response scales are applicable.725
• The design is explicitly suitable for self-completion questionnaires and internet
surveys.726
• Applied and validated in China and 82 other countries.727
720 Schwartz/Bardi (2001), p. 280. 721 Concerning the ten basic human values in accordance to culture-level, further information is pro-
vided by: Schwartz (2011a), 463 ff.; Schwartz (2008), pp. 1 ff.; Schwartz (2006), pp. 137 ff.; Schwartz/Bardi (2001), pp. 268 ff.; Schwartz (1999), pp. 23 ff.
722 Schwartz (2003), p. 261. 723 Cf. Schwartz (2003), p. 271 and the literature cited there. 724 Cf. ibidem, pp. 271 f. 725 Cf. ibidem, p. 275; Schwartz (2007), pp. 180 f. 726 Cf. Schwartz (2003), p. 274. 727 Cf. Schwartz et al. (2012), p. 665.

Determination of Model Variables and Hypotheses
151
• The theory allows cross-cultural comparisons and within culture analysis.
Instruments
In order to measure the values, postulated by SCHWARTZ, different approaches are
available today.728 The first method elaborated by himself is the Schwartz Value Sur-
vey (SVS), which incorporates 57 single-value-items. Respondents rate the im-
portance of each value item on a 9-point scale from -1 (opposed to my values) to 7
as an expression of supreme importance. 729 Later, the SVS was modified, by reduc-
ing the number of items to 46, in order to provide a more equivalent meaning across
cultures.730 In addition to prior findings, SCHWARTZ/BOEHNKE (2004) confirmed
the basic value structure and the distinction of the ten values by confirmatory factor
analysis.731
However, the SVS demands a high level of abstract thought, because the value con-
cept is measured outside of any specific context, which is why the instrument failed in
some samples, which are not educated in Western schools.732 Later, a less abstract,
less cognitively complex, easier and faster instrument was elaborated, the Portrait
Values Questionnaire (PVQ). The following example shows that, here, values are
operationalised concretely and specific to gender, as verbal portraits (understandable
even by 11-year-olds in Uganda),733 where ‘Each one describes a person’s goals,
aspirations, or wishes that point implicitly to the importance of a value.’734
‘POWER: Social status and prestige, control or dominance over people and
resources. (He likes to be in charge and tell others what to do. He wants peo-
ple to do what he says.)’735
Respondents answer the question, ‘How much like you is this person?’ by checking
one of six boxes labelled for instance with ‘like me’. Beside the advantages men-
728 Cf. Schwartz et al. (2012), p. 664. Schwartz officially mentioned five different measuring scales in
the paper, but a literature review shows that beyond that others exist (e.g. Lindeman/Verkasalo (2005), p. 170 ff.).
729 Cf. Schwartz et al. (2001), pp. 520 ff. 730 Cf. Schwartz (2003), p. 268. 731 Cf. Schwartz/Boehnke (2004), p. 250. 732 Cf. Schwartz et al. (2001), p. 520. 733 Cf. Schmidt et al. (2007), pp. 263 f.; Schwartz et al. (2001), pp. 520 ff. 734 Schwartz et al. (2001), p. 523. 735 Ibidem, p. 521.

Conceptual and Theoretical Foundation
152
tioned, this proceed ensures that people do not directly recognise that values are the
topic of investigation.736
To measure values with the PVQ, different scales exist whereas the full 40-item and
the short 21-item scales are very well recognised and applied.737 Research aims and
limitations determine which version is most suitable. Generally speaking, the full ver-
sion of PVQ provides a more detailed force of expression and better statistical accu-
racy for cross-cultural comparisons.738 Independent of the item quantity, the PVQ is
easy to administer in several ways such as personal interviews, via telephone or in
internet surveys.739 Finally, it is important to emphasise that the theory itself is valid
independent of the measurement method, regardless whether PVQ or the former
SVS is used.740
The SVS and PVQ mentioned above both require remarkable answering time effort,
which is why LINDEMAN/VERKASALO (2005) invented a short scale, the Short
Schwartz´s Value Survey (SSVS). Here every value is measured by one item, thus
SSVS can be used as a very convenient and fast measurement system for compar-
ing values. Due to this reduction, only higher order values can be measured, so that
the information content is significantly less detailed than in SCHWARTZ´s approach-
es. Moreover, further limitations exist.741 Therefore and due to the intention in this
work to focus on culture, the SSVS will not be applied for this research.
Refined Theory of Basic Individual Values
Finally, the latest refined and most detailed approach by SCHWARTZ ET AL. (2012)
is shown. This is in order to support the conceptual idea of the motivational continu-
um by separating this continuum into a larger number of narrower distinct values. As
a result, with the PVQ-RR, 19 values can be measured through this refined theory,742
whereby it is considered as ‘(…) compatible with the original 10, broad value con- 736 Cf. Schwartz et al. (2001), p. 523. 737 Cf. Cieciuch/Davidov (2008), p. 37. 738 Cf. ibidem, p. 43. 739 Cf. Schwartz (2003), p. 274. 740 Cf. Schmidt et al. (2007), pp. 269 ff. 741 Cf. Lindeman/Verkasalo (2005), pp. 170 ff. 742 Cf. Schwartz et al. (2012), pp. 663 ff. For additional information Schwartz (2011b), pp. 307 ff.;
Cieciuch et al. (2014a), pp. 1 ff.; Cieciuch et al. (2014b), pp. 177 ff. are recommended.

Determination of Model Variables and Hypotheses
153
structs (…).’743 The PVQ-RR instrument incorporates 57 questions which can be an-
swered in approximately 8 minutes.744 This is roughly comparable to the PVQ-40, but
beneficial in terms of a higher explanatory power (due to the finer set of values), and
has a superior cross-cultural invariance,745 which is especially important, if a large
number of countries or samples has to be compared.
Comparison of Questionnaires
Finally the most popular approaches are compared in the Table 16 below; but the fi-
nal choice of the value operationalisation for this research takes place in Chapter
5.2.2.5. However, following the arguments of this section, and SCHWARTZ`s (1996)
claim to avoid cherry-picking specific values and to apply the whole set,746 the inten-
tion in this study is to implement the ten individual level values as separate con-
structs in the research model, in order to properly distinguish the variety of cultural ef-
fects. Addressing this issue is likewise claimed in literature very particularly with re-
gard to brand loyalty.747 In line with the lack of a detailed consideration of values,
XIAO/KIM (2009) make use of the individual level values to analyse cultural effects
on foreign brand purchasing by incorporating individualism and collectivism as two
broad constructs. As a result, both constructs together have a positive effect on for-
eign brand purchasing, which shows the lack of detailing or that the conceptualisation
is too broad,748 thus these influences are difficult to interpret.
743 Ibidem, p. 665. 744 Cf. Schwartz (2014a), pp. 1 ff. 745 Cf. Cieciuch et al. (2014), p. 8. 746 Cf. Schwartz (1996), p. 121. 747 Cf. Lam (2007), p. 10. 748 cf. Xiao/Kim (2009), pp. 615/619.

Conceptual and Theoretical Foundation
154
Name Items Approximate Time Requirement
Values Comment
SSV 57 12 minutes 10 Demands a high level of abstract thought PVQ-40 40 7 minutes 10 Faster and suitable in less educated cultures
PVQ-21 21 4 minutes 10 Fastest approach with the benefit of a high level of value distinction
SSVS 10 2 minutes 4 Fastest approach, but only the higher order values assessable
PVQ-RR 57 8-9 minutes 19 Highest degree of value distinction, remarkable time effort needed, but relatively time efficient compared with the PVQ-40
Table 16: Overview of Schwartz´s Value Measurement Methods
Reference: Author´s table.
4.4.3.2 Determination-of-Culture-Related-Variables%
Within the previous chapter ten basic values were identified in order to conceptually
model cultural effects. These individual level values are treated as separate con-
structs, which are namely self-direction, stimulation, hedonism, achievement, power,
security, conformity, tradition, benevolence and universalism (cf. Table 15).
The review of the literature shows that SCHWARTZ´s individual level method is very
often applied, but mostly in psychological or in genuine cross-cultural studies.749 In
contrast, it is sparsely used in marketing, where frequently national culture is used,
and moreover, SCHWARTZ is quite rarely applied in service or China-related re-
search. As ZHANG ET AL. (2008) conclude, one of 39 studies incorporated
SCHWARTZ in service research works.750 Recently, a very few studies focussing on
China are available. Among them only XIAO/KIM (2009) and KNÖRLE (2011) focus
on consumer behaviour and no study directly focusses on satisfaction or loyalty as-
pects.751 Therefore, it is hardly possible to deduce hypotheses in the previous man-
ner, and particularly with the aim of deducing a hypothesis for every one of the ten
individual level values against the entire after-sales process chain from service quali-
749 Cf. Chapter 4.4.3,Cultural Influences and 4.4.3.1, Schwartz`s Individual Level Values. 750 Cf. Zhang et al. (2008), p. 213. 751 Cf. Xiao/Kim (2009), pp. 610 ff.; Liu/Cohen (2010), pp. 493 ff.; Xin-an et al. (2008), pp. 377 ff.;
Knörle (2011), pp. 1 ff. Despite the study´s name ‘Markenloyalität in China/Brand Loyalty in China’ the individual level values of Schwartz are only applied on antecedent constructs, and not on brand loyalty; furthermore in an aggregated form as two individualistic and one collectivistic varia-bles. pp. 203 ff.

Determination of Model Variables and Hypotheses
155
ty to brand loyalty. To do this, 40 highly detailed hypotheses have to be established,
without the option of applying prior research adequately.
Instead, familiar literature is used, in order to discover whether there is a cultural in-
fluence on the most important model constructs (perceived service quality, after-
sales service satisfaction, workshop loyalty, brand loyalty). As a result, hypotheses
are deduced. Due to the limitation of the non-availability of particular prior research,
no ‘the higher…the lower’ hypotheses like H1-H9 are formulated, but hypotheses
which assume the existence of a significant cultural (individual-level value) influence
on each related construct. It has to be emphasised that the formulation of hypotheses
in the manner described is based on the general idea that values are widely accept-
ed as causes for behaviour;752 a fact, which is proven by BARDI/ SCHWARTZ (2003)
in a study specifically related to it.753 Notably, this proceed enables to analyse a high-
ly complex set of various relationships, in order to properly understand the role of in-
dividual level values on the entire after-sales process chain. Thereby, this progress is
a bit more explorative than the very specifically elaborated set of originary automobile
after-sales related hypotheses (H1-H9) testing. However, very valuable scientific find-
ings are expected, because the PLS-method enables path analysis, which shows in-
sights about the direction and the relative strength of every cause-effect relationship.
The formerly applied additional theory foundation is thereby not intended, because a
particular interpretation is not applicable due to the descriptions above.
Deduction of Hypothesis in Regard to Service Quality
Service quality is considered distinctively in regard to the country of interest as the
leading VW Manager HORN explains, ‘For example, about 80 percent of VW drivers
in Germany make an appointment before heading into the repair shop. In the boom-
ing Chinese market the figure is just 10 percent, (...).’754
752 Cf. Chapter 4.2.5, Values and Figure 21. 753 Cf. Bardi/Schwartz (2003), pp. 1207 ff. Also particular behaviour was studied, such as voting be-
haviour: s. Schwartz (1996), pp. 119 ff. 754 Horn cited in Krogh (2009), VW aims to be 'top player' in aftermarket service.

Conceptual and Theoretical Foundation
156
RAAJPOOT (2004) shows that service quality is also a highly relevant aspect and
construct within the scientific debate in regard to culture. He states that the construct
service encounter quality is highly dependent to cultural influences, which is why he
developed a new service quality scale (PAKSERV) for the application in Asia, which
he validated in Pakistan. Therefore, he uses national cultural dimensions as well as
individual level values.755
An analysis by SOARES ET AL. (2006) focusses on the application of HOFSTEDE
dimensions in international marketing studies. In the process they show that these
dimensions have an impact on service performance.756
Specifically in regard to after-sales services VAN BIRGELEN ET AL. (2002), analyse
the moderating effect of national culture (HOFSTEDE dimensions) on the perceived
service quality to customer satisfaction relationship for the three after-sales contact
modes face-to-face, telephone and electronic service. Here, both technology related
modes are significantly moderated, and thus culturally affected by HOFSTEDE di-
mensions.757 In line with that, REIMANN ET AL. (2008) verify empirically that uncer-
tainty avoidance is likewise a dimension which has a moderating influence on the
mentioned relationship in B2B markets. Notably, they claim for further research on
the relationship of values towards customer satisfaction by applying other approach-
es than HOFSTEDE.758
KNÖRLE (2011) writes of a consumer survey he conducted in China. He uses the in-
dividual level values of SCHWARTZ to build three variables, in order to consider cul-
tural influences in terms of the dimension individualism/collectivism. The hypothesis
testing shows that on the one hand, collectivism is marked stronger than individual-
ism,759 and on the other hand, that the variable of collectivistic values760 has a weak
negative effect on the dependent variable of perceived quality, that the Individualistic
755 Cf. Raajpoot (2004), pp. 181 ff. 756 Cf. Soares et al. (2006), p. 281. 757 Cf. van Birgelen et al. (2002), pp. 60 f. 758 Cf. Reiman et al. (2008), p. 70. 759 Cf. Knörle (2011), p. 198. 760 The variable Collectivistic Value is operationalised by the individual level values benevolence, tradi-
tion, security and conformity.

Determination of Model Variables and Hypotheses
157
Value 2761 has a weak negative effect, and that in contrast the individualistic value
1762 has a weak positive effect.763 These findings show that if – in China – the indi-
vidual level values of SCHWARTZ are applied to the construct of service quality, in-
fluences can be proven. But, because just three cultural variables are incorporated in
regard to one dimension, the expressiveness is limited.
Beyond this detailed view, ZHANG ET AL. (2008) show in their literature review that
service expectations are often of interest to researchers. Besides those mentioned
above, a further ten cross-cultural studies focus on service expectations, most of
them using SERVQUAL dimensions. The findings of six of the ten listed studies
(LEE/ULGADO 1997; DONTHU/YOO 1998; ESPINOZA 1999; FURRER ET Al. 2000;
SULTA/SIMPSON 2000; WITKOWSKI/WOLFINBARGER 2002; RAJPOOT 2004;
LAROCHE ET AL. 2005; MALHOTRA ET AL. 2005; JOHNS ET AL. 2005) state cul-
tural influences on the aimed constructs (relevant for this research) with regard to
service expectations.764
As a result, the literature assessment on service quality shows that this construct is
influenced by culture in various studies across the world. Moreover, especially
KNÖRLE (2011) shows cultural effects – measured by individual level values – on
the perception of quality in China; thus H10 and the related sub hypotheses are as-
sumed, in order to be tested.
761 Operationalised by: hedonism and stimulation. 762 Operationalised by: power, achievement, self-direction. 763 Cf. Knörle (2011), pp. 203 ff. 764 Cf. Zhang et al. (2008), p. 214.

Conceptual and Theoretical Foundation
158
H10: Perception of service quality is significantly influenced by culture, which means by at least one individual level value.
H10a: Perception of service quality is significantly influenced by conformity. H10b: Perception of service quality is significantly influenced by tradition. H10c: Perception of service quality is significantly influenced by benevolence. H10d: Perception of service quality is significantly influenced by universalism. H10e: Perception of service quality is significantly influenced by self-direction. H10f: Perception of service quality is significantly influenced by stimulation. H10g: Perception of service quality is significantly influenced by hedonism. H10h: Perception of service quality is significantly influenced by achievement. H10i: Perception of service quality is significantly influenced by power. H10k: Perception of service quality is significantly influenced by security.
Deduction of Hypothesis in Regard to After-Sales Service Satisfaction
ZHANG ET AL. (2008), mentioned above, conduct a meta analysis on cross-cultural
services research, where they suggest a framework about cultural service personality
(Western individualistic vs. Eastern collectivistic). Here they conclude that in general
Eastern service demanders have lower overall expectations of service quality, and
are more likely to be satisfied when they evaluate the service.765 Specifically to ser-
vice evaluations 14 cross-cultural studies are presented, of which three mainly con-
sider issues such as the applicability of models across cultures (GILBERT ET AL.
2004; BRADY ET AL. 2005; VELOUTSOU ET AL. 2005) and one shows consistent
effects across cultures (BRADY/ROBERTSON 2001), whereas most of them affirm
differences across cultures (WINSTED 1997, 1999, 2000; MATTILA 1999a, 1999b;
STAUSS/MANG 1999; KEILOR ET AL. 2004; LAROCHE ET AL. 2004; UELTSCHY
ET AL. 2004; VOSS ET AL. 2004; CUNNINGHAM ET AL. 2005; IMRIE 2005).766
Thus, it can be deduced that both service quality (previous section) and after-sales
service satisfaction constructs are culturally influenced.
Described in the service quality section, but also meaningful in terms of satisfaction,
VAN BIRGELEN ET AL. (2002) show that national culture significantly influences the
after-sales service satisfaction in various countries.767 Furthermore, REIMANN ET AL.
765 Cf. Zhang et al. (2008), pp. 220 f. 766 Cf. ibidem, pp. 215 f. 767 Cf. van Birgelen et al. (2002), pp. 60 f.

Determination of Model Variables and Hypotheses
159
(2008)768 empirically tested, and afterwards reported, cultural influences on satisfac-
tion as discussed previously.
Customer satisfaction specifically, UELTSCHY ET AL. (2007) examine the relation-
ship of service quality and customer satisfaction cross-culturally with a comparison of
low-context and high-context countries. They conduct a 2x2 factorial experiment with
two manipulated situations: expectations (low/high) and service performance
(low/high). ‘Regardless of expectations, when performance was low, the low-context
respondents (…) perceived lower quality than did the respondents from the high-
context country (…), but gave higher quality ratings than did the Japanese respond-
ents when the performance was high.’769 Based on these key findings, the authors
conclude that culture has to be considered when customer satisfaction, and its ante-
cedent, service quality, are of interest.770 Two years later UELTSCHY ET AL. (2009)
do the same experiment within a group of three high-context cultures (Japan, China,
Korea), to investigate whether within this group, too, cultural causes exist. Here, par-
ticularly Chinese respondents behave differently, thus the authors conclude that na-
tional culture prevents the application ’of one fits all’ service offerings.771 In line with
these two studies, the predecessor study by LAROCHE ET AL. from 2004 shows cul-
tural differences between North America (USA, Canada) and Japan when it comes to
customer satisfaction.772
FRANK ET AL. (2013) investigate Japanese/Chinese differences in customer satis-
faction by additionally considering the two perspectives of economic and cultural
country differences. In total, they show that, customers are more influenced by eco-
nomic factors than by cultural factors. But in contrast they also state that the cultural
variance is greater within Asia than Westerners might expect, and that the anteced-
ents of customer satisfaction are distinct due to cultural effects, so for instance: ‘Chi-
nese pay more attention to quality expectations and public brand image than German
consumers.’773
768 Cf. Reiman et al. (2008), p. 70. 769 Ueltschy et al. (2007), p. 410. 770 Cf. ibidem, pp. 418 f. 771 Cf. Ueltschy et al. (2009), pp. 976 ff. 772 Cf. Laroche et al. (2004), pp. 72 ff. 773 Frank et al. (2013), p. 2403.

Conceptual and Theoretical Foundation
160
As shown in this section, various studies have focussed on the effects of culture on
customer satisfaction, and in particular on the relationship between customer satis-
faction and its antecedent, service quality. This generates the following hypothesis:
H11: After-sales service satisfaction is significantly influenced by culture, which means by at least one individual level value.
H11a: After-sales service satisfaction is significantly influenced by conformity. H11b: After-sales service satisfaction is significantly influenced by tradition. H11c: After-sales service satisfaction is significantly influenced by benevolence. H11d: After-sales service satisfaction is significantly influenced by universalism. H11e: After-sales service satisfaction is significantly influenced by self-direction. H11f: After-sales service satisfaction is significantly influenced by stimulation. H11g: After-sales service satisfaction is significantly influenced by hedonism. H11h: After-sales service satisfaction is significantly influenced by achievement. H11i: After-sales service satisfaction is significantly influenced by power. H11k: After-sales service satisfaction is significantly influenced by security.
Deduction of Hypothesis in Regard to Brand Loyalty and Workshop Loyalty
ZHANG ET AL. (2008) list ten cross-cultural studies (DE WULF ET AL. 2001; LIU/MC
CLURE 2001; PATTERSON/SMITH 2001a, 2001b; HUI/AU2001; PATTERSON/
SMITH 2003; WARDEN ET AL. 2003; MATTILA/PATTERSON 2004a, 2004b; POON
ET AL. 2004; WONG 2004; PATTERSON ET AL. 2006), which are related to reac-
tions of service, and in which it is assumed that culture matters. Loyalty is considered
a reaction, thus an indication is given that loyalty as well should be considered in the
context of cultural influences. Remarkably, all these studies used HOFSTEDE di-
mensions, but just two of them really measured the dimensions, whereas eight used
them for pre-hoc justification.774 As a result no specific cultural causes can be shown
without any side-interpretations.
DE MOOIJ/HOFSTEDE´s 2011 review of research findings shows impressively that
the dimensions pertaining to national culture have various important effects, if brands
are of interest. In particular, they consider brand loyalty to the affected areas, be-
cause they present it within the cross-cultural consumer behaviour framework.775
774 Cf. Zhang et al. (2008), p. 216. 775 Cf. de Mooij/Hofstede (2011), p. 182.

Determination of Model Variables and Hypotheses
161
Moreover, collectivistic cultures such as China are considered to be relatively brand
loyal,776 which is influenced by cultural effects.777
YOO (2008) investigates how personal (individual) collectivistic orientations affect
brand loyalty and equity among US and South Korean shoe consumers. A key find-
ing is that personal collectivistic orientations have a significant influence on both con-
structs, and that brand loyalty is higher in both countries, when consumers are highly
collectivistic.778 Thus, regardless of national culture, brand loyalty is influenced by
personal orientation, which is similar compared to the concept of values.
On the issue brand loyalty in China, a study from 2007 conducted by LAM is very
valuable, as particularly the proneness to brand loyalty is researched. LAM shows
that HOFSTEDE´s cultural dimensions, individualism and uncertainty avoidance,
positively influence the proneness to brand loyalty with a β of 0,212 and 0,389.779
As regards individual level values and particularly their influence on brand loyalty,
THOMPSON ET AL. (2014) state that a research gap exists and the understanding
about it should be fostered by further research, which is why they implemented the
concept of individual level collectivistic values from DONTHU/YOO (1998) in their
study on brand loyalty; which was conducted in China.780 Thereby, THOMPSON ET
AL. (2014) show that within a given country differences exist and brand loyalty is af-
fected by these differences ‒ which is to say by cultural influences at an individual
level. Thus, consumers with individually held strongly collectivist values are more
loyal to brands than consumers who do not share these values, and cultural effects
moderate the relationship between several antecedents and brand loyalty. Finally
they conclude ‘that differences in individual level collectivist values have a significant
impact on brand loyalty (…).’781 This study provides a very valuable indication that
individual level values are a major concern and significantly effective in China, where
brand loyalty is concerned.
776 Cf. de Mooij (2014), p. 148; Emrich (2014), p. 24; Guo (2013), p. 22. 777 Cf. Emrich (2014), p. 24; Usunier/Walliser (1993), p. 11; Guo (2013), p. 22. 778 Cf. Yoo (2008), p. 54. 779 Cf. Lam (2007), p. 15. 780 Cf. Thompson et al. (2014), pp. 2438 ff. 781 Ibidem, p. 2443.
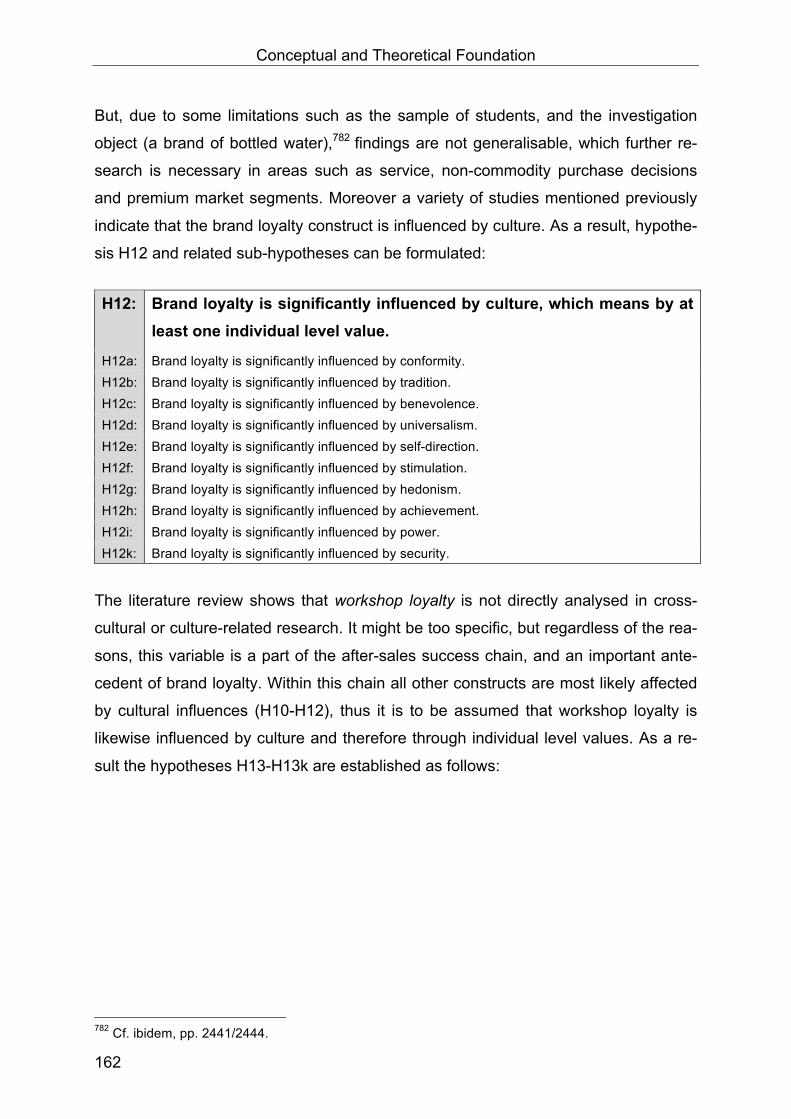
Conceptual and Theoretical Foundation
162
But, due to some limitations such as the sample of students, and the investigation
object (a brand of bottled water),782 findings are not generalisable, which further re-
search is necessary in areas such as service, non-commodity purchase decisions
and premium market segments. Moreover a variety of studies mentioned previously
indicate that the brand loyalty construct is influenced by culture. As a result, hypothe-
sis H12 and related sub-hypotheses can be formulated:
H12: Brand loyalty is significantly influenced by culture, which means by at
least one individual level value.
H12a: Brand loyalty is significantly influenced by conformity. H12b: Brand loyalty is significantly influenced by tradition. H12c: Brand loyalty is significantly influenced by benevolence. H12d: Brand loyalty is significantly influenced by universalism. H12e: Brand loyalty is significantly influenced by self-direction. H12f: Brand loyalty is significantly influenced by stimulation. H12g: Brand loyalty is significantly influenced by hedonism. H12h: Brand loyalty is significantly influenced by achievement. H12i: Brand loyalty is significantly influenced by power. H12k: Brand loyalty is significantly influenced by security.
The literature review shows that workshop loyalty is not directly analysed in cross-
cultural or culture-related research. It might be too specific, but regardless of the rea-
sons, this variable is a part of the after-sales success chain, and an important ante-
cedent of brand loyalty. Within this chain all other constructs are most likely affected
by cultural influences (H10-H12), thus it is to be assumed that workshop loyalty is
likewise influenced by culture and therefore through individual level values. As a re-
sult the hypotheses H13-H13k are established as follows:
782 Cf. ibidem, pp. 2441/2444.

Determination of Model Variables and Hypotheses
163
H13: Workshop loyalty is significantly influenced by culture, which means by at least one individual level value.
H13a: Workshop loyalty is significantly influenced by conformity. H13b: Workshop loyalty is significantly influenced by tradition. H13c: Workshop loyalty is significantly influenced by benevolence. H13d: Workshop loyalty is significantly influenced by universalism. H13e: Workshop loyalty is significantly influenced by self-direction. H13f: Workshop loyalty is significantly influenced by stimulation. H13g: Workshop loyalty is significantly influenced by hedonism. H13h: Workshop loyalty is significantly influenced by achievement. H13i: Workshop loyalty is significantly influenced by power. H13k: Workshop loyalty is significantly influenced by security.
4.4.4 Determination of Control Variables
Within the previous chapters all relevant independent and dependent variables are
stressed. Integrating control variables will complete the elaboration of the research
model, in order to deliver additional insights about the survey population, and the re-
lated characteristics, which presumably moderate various aspects of the whole con-
ceptual model.
Control variables are highly relevant, because they are neither independent nor de-
pendent variables, but important when it comes to specifying and deepening the
analysis of the relationships between those variables, or of the cause-and-effect rela-
tionships.783 Commonly implemented control variables are of a demographic nature,
and by the same token group comparisons are typically a consequence, and an es-
tablished method of analysis. Due to the high number of already considered con-
structs and effect relationships, and the consequent complexity of the research mod-
el, only the most important control variables are integrated.
For this research the basic demographic variables age and gender, plus the socio-
economic variable income are chosen.
783 Cf. Bortz/Schuster (2010), p. 7; Janssen/Laatz (2013), p. 255.

Conceptual and Theoretical Foundation
164
4.5 Conceptual Research Model and Overview of Hypotheses
Interim Conclusion of Chapter 4
Chapter 4 lays the conceptual and theoretical foundations for the empirical research.
At first the conceptual reference frame is given (s. Figure 17), in order to structure
and steer the entire research process in accordance to the research objective. In line
with this systemised approach, the term success and all fundamental constructs are
precisely disambiguated and contextually explained (s. Chapter 4.2), so as to avoid
inaccuracies or contradictions. In Chapter 4.3 brand loyalty was chosen as the suc-
cess indicator, due to the high scientific relevance, and because it is a crucial objec-
tive of brand management.
Based on this comprehensive foundation, the research model is elaborated as off
Chapter 4.4. Here, every specific construct is discussed in detail against the back-
drop of the current state of research, in order to integrate it conceptually. Based on
that hypotheses are deduced which are then supported on theoretical foundations.
With regard to the hypotheses and cause-effect relationships, first, the relationship
between after-sales service satisfaction, workshop loyalty and brand loyalty is con-
sidered (s. Chapter 4.4.1), because these are the key constructs within the after-
sales success chain. Besides these after-sales-related key constructs, the most im-
portant surrounding variables are developed, to complete the automobile part of the
research model. Here, the marketing-mix is utilised as a guideline, so that service,
price, place, promotion and personnel policies are considered as distinct from one
another in the sub-sections of 4.4.2. Of these, the very important variables are cho-
sen for the research model, which means that some conceivable variables are ex-
cluded. This is in keeping with the focus of this work – the investigation of customer-
related after-sales processes under consideration of cultural influences – and due to
the requirement to avoid unmanageable complexity in the research model, as a result
of implementing too many variables.
Within the research model cultural influences are the second big issue, which is
treated starting with Chapter 4.4.3. In this case culture is conceptually considered
with regard to values, because they are a core element of culture and a cause of be-
haviour. In line with the chosen micro-level analysis of consumer behaviour, and the

Conceptual Research Model and Overview of Hypotheses
165
claim of going beyond HOFSTEDE, the value theory of SCHWARTZ, also known as
the theory of basic (individual) level values, is discussed in Chapter 4.4.3.1.
SCHWARTZ defines ‘(…) basic values as trans-situational goals, varying in impor-
tance, that serve as guiding principles in the life of a person or group.’784 The set of
distinct individual level values is ordered around a motivational circle, and organised
as a coherent system, which allows the effects of every single value to be researched.
Various benefits of SCHWARTZ´s method and measuring approaches are shown;
thus it is concluded that using individual level values is well-suited to investigating the
cultural effects involved in after-sales services in China.
Afterwards in Chapter 4.4.3.2, the ten individual level values of universalism, benevo-
lence, conformity, tradition, security, power, achievement, hedonism, stimulation and
self-direction are integrated into the research model as separate constructs, which
probably affect the entire after-sales process-chain from service quality towards
brand loyalty. Having assessed the relevant literature, it was possible to deduce an
extensive set of hypotheses, where significant cultural effects are assumed. This kind
of operationalisation overcomes a big limitation in most of the culture-related studies
on brand loyalty, because cultural variables are specifically measured. Most of con-
ducted studies just compare nations, or use cultural dimensions for pre-hoc justifica-
tions, in order to interpret cultural effects.
Finally, important demographic and socio-economic control variables are designated
to refine the whole model (s. Chapter 4.4.4).
Conceptual Research Model and Hypotheses Overview
The central constructs of the research model (s. Figure 25) are based on the com-
prehensive, previously mentioned conceptual and theoretical discussions. In order to
provide an overview of all relevant constructs, and their definitional references, Table
17 follows.
784 Cf. Schwartz et al. (2012), p. 664.; Schwartz (1992), pp. 1 ff.

Conceptual and Theoretical Foundation
166
Construct Chapter Definition Based on
Perceived Service Quality
(PSQ)
4.4.2.1
SACHDEV/VERMA (2004), based on PAR-
ASURAMAN ET AL. (1985), pp. 41 ff.
After-Sales Service Satisfaction (ASSS)
4.2.3 & 4.4.1 OLIVER (2010), p. 8
Workshop Loyalty (WL) 4.2.4 & 4.4.1 Based on Brand Loyalty
Brand Loyalty (BL) 4.2.4 & 4.4.1 OLIVER (1999), p. 34
Acceptable Workshop Distance (AWD)
4.4.2.3 Author´s definition
Brand Image (BI) 4.4.2.4 KELLER (1993), p. 3 & AAKER (1996), p. 113
Perceived Workshop Switching Costs (PWSC)
4.4.2.2 BURNHAM ET AL. (2003), p. 110, based on
PORTER (1980), p. 10
Benevolence (BEN) Universalism (UNI)
Hedonism (HED)
Achievement (ACH)
Power (POW)
Self-Direction (SE-D)
Stimulation (STI)
Security (SEC) Conformity (CON)
Tradition (TRA)
4.4.3 DAVIDOV ET AL. (2008), p. 425 & SCHWARTZ
(1994), p. 22
Age (AGE) Gender (GEN)
Income (INC)
4.4.4
Author´s definition
Table 17: Overview of Constructs
Reference: Author´s table.
Next the overview of all established hypotheses is given. In addition, the most im-
portant contributions from the literature review are shown, because hypotheses are
deducted from them. In order to present a clear table, only major contributions are
listed, which directly have integrated the mentioned constructs or in the culture sec-
tion familiar constructs, with empirically testable relationships. Moreover, to H1-H9
only automobile and China related studies are presented in Table 18.

Conceptual Research Model and Overview of Hypotheses
167
Overview of Hypotheses
Automobile Section
No.
Hypothesis Supporting Theories Relevant Literature
H1
The higher the after-sales service satisfaction, the higher the workshop loyalty.
Risk Theory
Dissonance Theory
Learning Theory
HÜNECKE (2012), p. 127; HÄTTICH (2009), p. 213; BEI/CHIAO (2001), p. 138; DEVARAJ ET AL. (2001), pp. 434 f.; BLOEMER/PAUWELS (1998), p. 82; BLOEMER/LEMMINK (1992), p. 359 Additional Input from service industries in China: LI ET AL. (2008), pp. 455 f.; DENG ET AL. (2010), p. 295; YIM ET AL. (2008), p. 751
H2
The higher the workshop loyalty, the higher the brand loyalty. Risk Theory
Dissonance Theory
Learning Theory
HÜNECKE (2012), p. 128; HÄTTICH (2009), p. 213; BLOEMER/LEMMINK (1992), p. 359
H3
The higher the perceived service quality, the higher the after-sales ser-vice satisfaction.
C/D-paradigm
Kano Model
Attribution Theory
HÜNECKE (2012), p. 147; SHUQIN/GANG (2012), p. 177; HÄTTICH (2009), p. 213; BEI/CHIAO (2001), pp. 136 ff.; DEVARAJ ET AL. (2001), p. 434 Additional Input from service industries in China: DENG ET AL. (2010), p. 296; YIM ET AL. (2008), p. 751.
H4
The higher the perceived workshop switching costs, the higher the workshop loyalty.
Transaction Cost Theory
Prospect Theory
Transaction Cost Utility Concept
PETER (1998), pp. 77; HÄTTICH (2009), pp. 213 ff.
H5
The higher the perceived workshop switching costs, the higher the brand loyalty.
Transaction Cost Theory
Prospect Theory
Transaction Cost Utility Concept
VERHOEF ET AL. (2007), p. 108. Additional Input from service industries in China: DENG ET AL. (2010), p. 295; LI ET AL. (2008), pp. 455 f.
H6
H6a
H6b
There is a relationship between acceptable workshop distance and af-ter-sales service satisfaction or workshop loyalty.
The shorter the acceptable workshop distance (AWD), the higher the after-sales service satisfaction.
The shorter the AWD, the higher the workshop loyalty.
Transaction Cost Theory
No directly related studies available.
H7
The higher the brand image, the higher the after-sales service satisfac-tion.
Assimilation Theory
DEVARAJ ET AL. (2001), p. 434 Additional Input from service industries in China: LAI ET AL. (2009), p. 984.
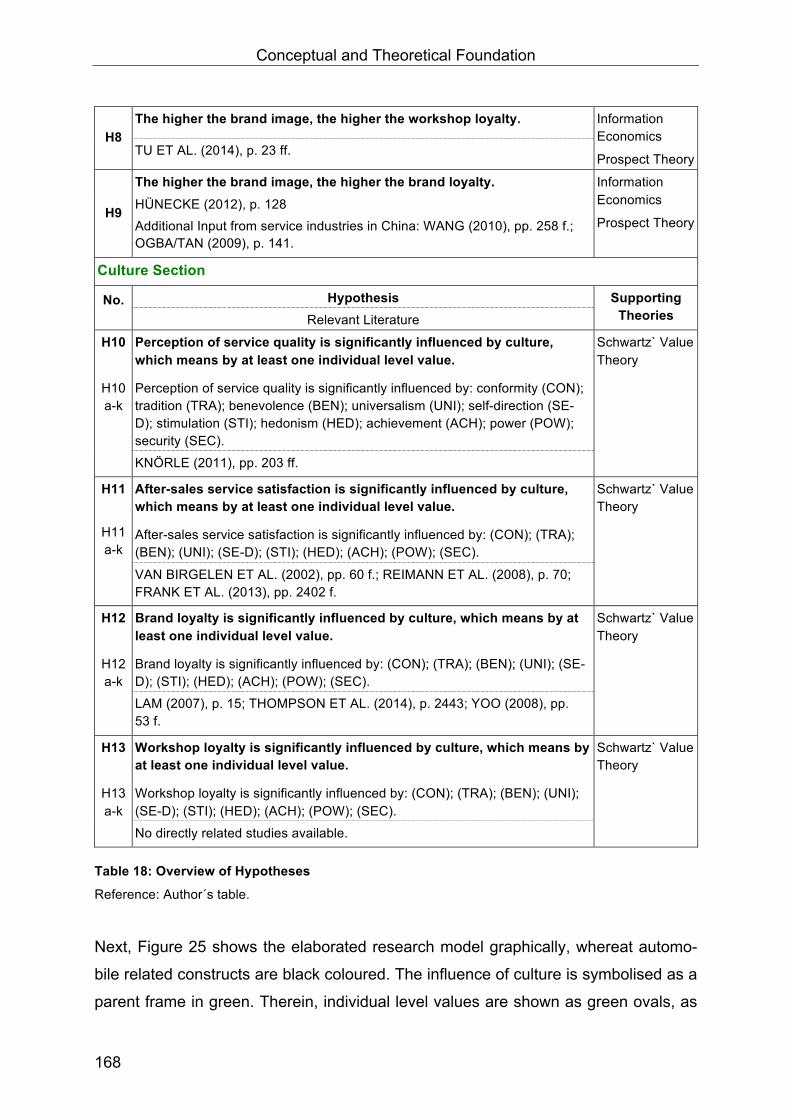
Conceptual and Theoretical Foundation
168
H8 The higher the brand image, the higher the workshop loyalty. Information
Economics
Prospect Theory TU ET AL. (2014), p. 23 ff.
H9
The higher the brand image, the higher the brand loyalty. Information Economics
Prospect Theory HÜNECKE (2012), p. 128 Additional Input from service industries in China: WANG (2010), pp. 258 f.; OGBA/TAN (2009), p. 141.
Culture Section
No.
Hypothesis Supporting Theories Relevant Literature
H10
H10 a-k
Perception of service quality is significantly influenced by culture, which means by at least one individual level value.
Perception of service quality is significantly influenced by: conformity (CON); tradition (TRA); benevolence (BEN); universalism (UNI); self-direction (SE-D); stimulation (STI); hedonism (HED); achievement (ACH); power (POW); security (SEC).
Schwartz` Value Theory
KNÖRLE (2011), pp. 203 ff.
H11
H11 a-k
After-sales service satisfaction is significantly influenced by culture, which means by at least one individual level value.
After-sales service satisfaction is significantly influenced by: (CON); (TRA); (BEN); (UNI); (SE-D); (STI); (HED); (ACH); (POW); (SEC).
Schwartz` Value Theory
VAN BIRGELEN ET AL. (2002), pp. 60 f.; REIMANN ET AL. (2008), p. 70; FRANK ET AL. (2013), pp. 2402 f.
H12
H12 a-k
Brand loyalty is significantly influenced by culture, which means by at least one individual level value.
Brand loyalty is significantly influenced by: (CON); (TRA); (BEN); (UNI); (SE-D); (STI); (HED); (ACH); (POW); (SEC).
Schwartz` Value Theory
LAM (2007), p. 15; THOMPSON ET AL. (2014), p. 2443; YOO (2008), pp. 53 f.
H13
H13 a-k
Workshop loyalty is significantly influenced by culture, which means by at least one individual level value.
Workshop loyalty is significantly influenced by: (CON); (TRA); (BEN); (UNI); (SE-D); (STI); (HED); (ACH); (POW); (SEC).
Schwartz` Value Theory
No directly related studies available.
Table 18: Overview of Hypotheses
Reference: Author´s table.
Next, Figure 25 shows the elaborated research model graphically, whereat automo-
bile related constructs are black coloured. The influence of culture is symbolised as a
parent frame in green. Therein, individual level values are shown as green ovals, as

Conceptual Research Model and Overview of Hypotheses
169
they are modelled as separate variables. Arrows symbolise the assumed cause-
effect relationships in terms of main hypotheses.
Figure 25: Research Model Overview
Reference: Author´s illustration.
Brand&Loyalty&Workshop&Loyalty&
A2er4Sales&Service&
Sa9sfac9on&
Acceptable)Workshop)Distance)
Control&Variables&&
• Age)• Gender)• Income))
Perceived&Service&Quality&
Brand)Image)
Perceived)Workshop)Switching)Costs)
Security)
Conformity)
TradiBon)
SelfCDirecBon)Achievement)Benevolence)
SBmulaBon)
Hedonism)
Power)Universalism)
H1)H3) H2)
H4)H5)H6a)
H6b) H7)H8)
H9)
H10)(aCk))
H11)(aCk)) H13)(aCk))
H12)(aCk))


Empirical Research
171
5 Empirical Research
Based on the theoretical and conceptual foundations established in this study, the
success factors governing after-sales services offered by German automobile manu-
facturers in China are analysed empirically, with particular consideration given to cul-
tural influences. Success factor research and structural equation modelling are ex-
plained in Chapter 5.1. Then, Chapter 5.2 concerns the research design and provide
all the details relating to the survey. After a data and measurement evaluation (Chap-
ter 5.3), the empirical results – including the testing of hypotheses – are presented in
Chapter 5.4.
5.1 Success Factor Research and Structural Equation Modelling
In addition to Chapter 1.5, first success factor research will be illustrated. Based on
that, an appropriate statistical method for conducting structural equation modelling
has been chosen, because both of the possible approaches, the variance-based and
the covariance-based approach have quite different strengths and limitations. There-
fore, it is necessary to evaluate which one fits this research.
Success Factor Research
Success factor research as a method has been used since the mid-20th century,
whereby retrospectively the PIMS-program (Profit Impact of Marketing Strategies) is
deemed to be the origin. Afterwards, as a result, the scientific distribution has in-
creased significantly.785 ‘The PIMS approach (…) was the most well-known approach
in the area of success factor research for a long time. The main goal of this approach
was to obtain valid evidence across all sectors on the influencing factors of the busi-
ness success of a SBU [strategic business unit].’786 Even today, success factor re-
search enjoys great popularity within the scientific community. However, it is heavily
criticised as well because the approaches often lack a theoretical foundation. In addi-
tion, the ability to isolate the determinants has been a source of contention. Likewise,
it is believed that especially the interdependence between determinants leads to ef- 785 Cf. Homburg/Krohmer (2006), p. 440. 786 Ibidem.

Empirical Research
172
fective success.787 On this exemplary enumeration, in Germany, there was a well-
known and documented discussion between the critics NICOLAI/KIESER (2002) and
the advocator FRITZ (2004).788
Despite the existing limitations, HOMBURG/KROHMER (2006) argue that this meth-
od should be applied, particularly in terms of decisions related to market cultivation
strategies.789 Moreover, SHOOK ET AL. (2004) attest in their analysis of 92 success
factor researches ‘that significant opportunities remain for SEM [structural equation
modelling] to generate insights within strategic management’ [,] ‘(…) when the tech-
nique is used prudently.’790 With regard to the criticisms mentioned above and the
aim of this work with regard to acquiring knowledge, choosing the most appropriate
method is of great importance. The different possible methods for the identification of
success factors are illustrated as an overview in the following Figure 26.
Figure 26: Methods to Identify Success Factors
Reference: Author’s illustration referring to Haenecke (2002), p. 168.
The first strategic differentiation layer takes place in accordance with the kind of sur-
vey being done: direct or indirect. A direct determination takes places by interviewing
787 Cf. Rybnikova (2011), p. 1; Annacker/Hildebrandt (2002), p. 3; Shook et al. (2004), pp. 397 ff.;
Woywode (2004), pp. 30/39; Forsmann et al. (2004), p. 3. 788 Cf. Nicolai/Kieser (2002), pp. 1 ff.; Fritz (2004), pp. 623 ff.; the documented discussion can be
found on http://www.dialog-erfolgsfaktorenforschung.de. 789 Cf. Homburg/Krohmer (2006), p. 439. 790 Shook et al. (2004), p. 403.
Empirical Identification of Strategic Success Factors
Direct Investigation
Method Aided Method and Material Aided
Indirect Investigation
Quantitative
Quantitative- Exploratory
Quantitative- Confirmatory
Qualitative

Success Factor Research and Structural Equation Modelling
173
internal (the company’s own) or external experts in order to explore possible varia-
bles affecting success. This can occur through the aid of both methods (for example
through creativity techniques) and materials (e.g. checklists). In contrast, in determin-
ing indirectly, using statistical methods either quantitatively or qualitatively, it is exam-
ined which factors influence success. In qualitative studies, for instance, non-stan-
dardised open interviewing techniques are used to find equal characteristics, which
are then interpreted as success factors.791 In indirect, quantitative investigations
quantifiable enterprise data is gathered to find out their share on the company's suc-
cess. If thus the aim is to explore new causal structures, these are exploratory ap-
proaches. With the aid of correlation, regression and factor analysis the intention is to
identify the few variables that actually influence success. In causal structure testing
approaches, the so-called quantitative-confirmatory studies, theoretically and empiri-
cally well-examined impact relationships are tested through causal-analytical proce-
dures.792 Referring to HAENECKE (2002) there are very important requirements to
consider in carrying out quantitative methods, which is why they are listed in bullet
point form in the following table:
Essential Requirements for the Implementation of Quantitative Methods
Uncover the causal structure • Use of existing findings and theories • Led through a reference frame • Setting up and testing of hypotheses • Acceptance of hypotheses only when falsification fails multiple
Consideration of all perspec-tives
• No restriction on the perspectives considered with regard to ex-isting data
• No limitation through exclusively surveying employees
Consideration of qualitative and quantitative success fac-tors
• Separation of theoretical language and observable language
Review of temporal stability • Repeated checking of success factors and causal structure Objectivity • Forgo one-person survey concepts or review the objectivity of
expert answers • Limit social interaction with respondents
Reliability • Exclusion of random errors
Table 19: Essential Requirements for the Implementation of Quantitative Methods
Reference: Haenecke (2002), p. 174.
791 Cf. 1 H E J ) 792 Cf. ibidem.

Empirical Research
174
Considering the aspects mentioned above, the requirements, and the high potential
for uncovering causal structures, an indirect quantitative-confirmatory method ap-
pears to be most appropriate for this research project. In doing so, well-tested theo-
retical and empirical effect interdependencies are verified respectively falsified using
a causal analytical procedure.793 This means that the established hypotheses (s. Ta-
ble 18) have to be tested statistically. Within the indirect quantitative-confirmatory
methods, structural equation modelling is especially appropriate, because complex
relationships between latent variables, as they occur in the given research model,
can be tested. Besides, the complete causal network can be estimated simultaneous-
ly.794
Structural Equation Modelling (SEM)
Structural equation models represent ‘complex relationships ‒ formulated a priori and
theoretically and/or logically grounded ‒ between variables in a linear equation sys-
tem, and serve both to estimate the impact coefficients between observed variables
and to take account of measurement errors.’795 Here, dependent variables are called
endogenous variables or eta (η) and independent variables are called exogenous
variables or ksi (ξ). In SEM it is possible for a variable to occur as both endogenous
and exogenous. In this case it is called an intervening or mediating variable.796 In this
research, this is for instance the case for workshop loyalty.797 The relationship of var-
iables is called a structural model. Moreover, next to the already mentioned latent
variables, manifest variables exist, and in contrast to the latent ones, they are ob-
servable, and therefore measurable, with appropriate specified measuring models.798
SEM consists of both the structural model and the measuring model, whereas the
measuring model of the exogenous and that of the endogenous latent variable are
differentiated,799 as shown in Figure 27.
793 Cf. Haenecke (2002), pp. 167 ff.; Töpfer (2012), pp. 281 ff.; Schoeneberg (2011), p. 52. 794 Cf. Backhaus et al. (2006), p. 338; Lowry/Gaskin (2014), p. 126. 795 Cf. Weiber/Mühlhaus (2014), p. 7. 796 Cf. ibidem, p. 23. 797 Cf. Figure 25: Research Model Overview. 798 Cf. Weiber/Mühlhaus (2014), p. 24; Backhaus et al. (2006), pp. 340 f.; With regard to measuring
models, s. Chapter 5.2.2.1. 799 Cf. Backhaus et al. (2006), p. 341; Weiber/Mühlhaus (2014), pp. 36 f.
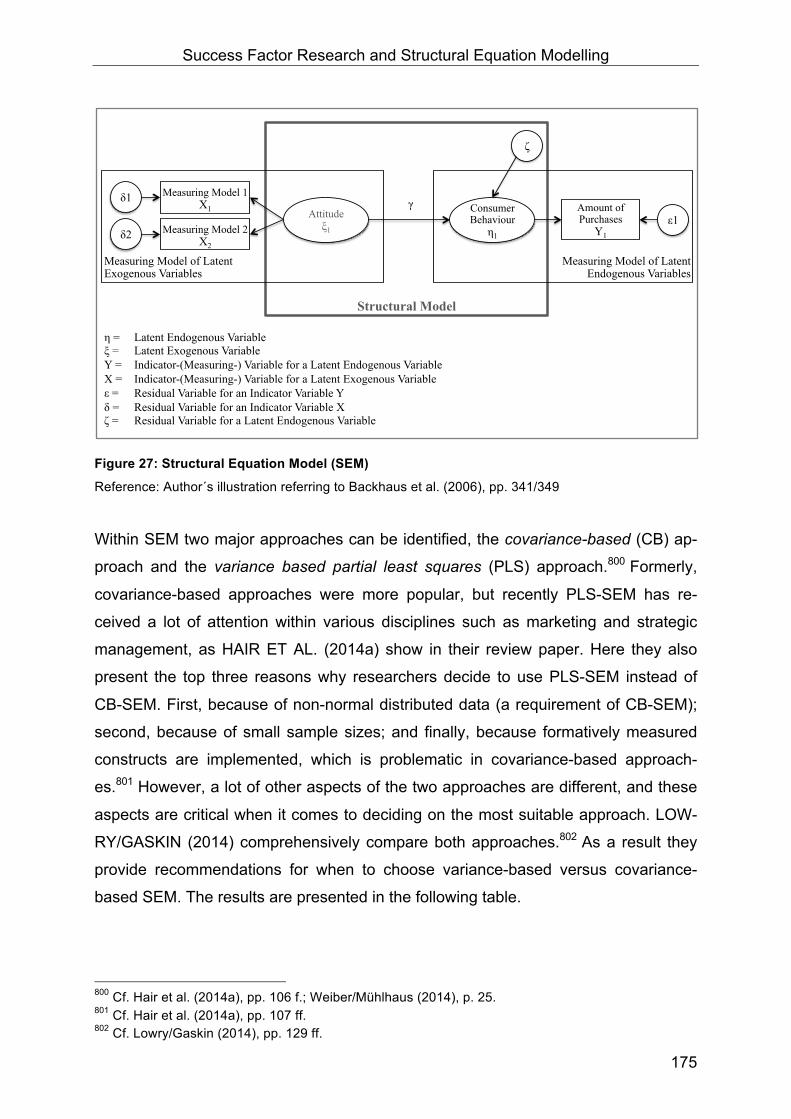
Success Factor Research and Structural Equation Modelling
175
Figure 27: Structural Equation Model (SEM)
Reference: Author´s illustration referring to Backhaus et al. (2006), pp. 341/349
Within SEM two major approaches can be identified, the covariance-based (CB) ap-
proach and the variance based partial least squares (PLS) approach.800 Formerly,
covariance-based approaches were more popular, but recently PLS-SEM has re-
ceived a lot of attention within various disciplines such as marketing and strategic
management, as HAIR ET AL. (2014a) show in their review paper. Here they also
present the top three reasons why researchers decide to use PLS-SEM instead of
CB-SEM. First, because of non-normal distributed data (a requirement of CB-SEM);
second, because of small sample sizes; and finally, because formatively measured
constructs are implemented, which is problematic in covariance-based approach-
es.801 However, a lot of other aspects of the two approaches are different, and these
aspects are critical when it comes to deciding on the most suitable approach. LOW-
RY/GASKIN (2014) comprehensively compare both approaches.802 As a result they
provide recommendations for when to choose variance-based versus covariance-
based SEM. The results are presented in the following table.
800 Cf. Hair et al. (2014a), pp. 106 f.; Weiber/Mühlhaus (2014), p. 25. 801 Cf. Hair et al. (2014a), pp. 107 ff. 802 Cf. Lowry/Gaskin (2014), pp. 129 ff.
Structural Model
Measuring Model of Latent Endogenous Variables
Measuring Model of Latent Exogenous Variables
Consumer Behaviour η1
ε1 Amount of Purchases
Y1
ζ
γ Attitude ξ1
δ1 Measuring Model 1 X1
Measuring Model 2 X2
δ2
η = Latent Endogenous Variable ξ = Latent Exogenous Variable Y = Indicator-(Measuring-) Variable for a Latent Endogenous Variable X = Indicator-(Measuring-) Variable for a Latent Exogenous Variable ε = Residual Variable for an Indicator Variable Y δ = Residual Variable for an Indicator Variable X ζ = Residual Variable for a Latent Endogenous Variable

Empirical Research
176
Recommendations for When to Use PLS Versus CB-SEM Model requirement PLS CB-SEM
Includes interaction effects Preferable, as it is designed for easy interactions
Difficult with small models, nearly impossible with large ones
Includes formative factors Easier Difficult Includes multi-group moderators
Can use, but difficult Preferable
Testing alternative models Can use Preferable, as it provides model fit statistics for comparison
Includes more than 40-50 variables
Preferable Sometimes unreliable if it does con-verge, sometimes will not converge
Non-normal distributions Preferable (although it will still af-fect results, just to a lesser extent)
Should not be used; results in unre-liable findings
Non-homogenity of variance
Preferable (although it will still af-fect results, just to a lesser extent)
Should not be used; results in unre-liable findings
Small sample size It will run (although it will still affect results negatively)
Unreliable if it does converge; often will not converge
Table 20: Recommendations for When to Use PLS Versus CB-SEM
Reference: Lowry/Gaskin (2014), p. 133.
According to these recommendations, the research objectives, and the elaborated
hypotheses, PLS is chosen because this approach is considered to be the most val-
uable and applicable, for the following reasons. First, the specification of the very im-
portant construct of perceived service quality is formative,803 thus PLS is beneficial
and less problem laden.804 Second, not all hypotheses can be tested as strictly con-
firmatory, because there is a lack of theory for the application of cultural values in the
given context. The hypotheses H10a-k to H13a-k are indeed to some extent explora-
tory, where PLS is highly recommended. Moreover, this design, which is confirmatory
at the automobile related part, and exploratory at the culture related part, is a very
good match with the statistical strengths of the variance-based approach.805 Third,
the research model is very complex with more than 45 variables, thus the modulation
in PLS should be preferred, because this complexity could lead to unreliable results
in CB-SEM.806 Finally, some research limitations with regard to the survey in China
are reasonable. Due to economic limitations the sample size could not be substan-
tially extended, which would be required by CB-approaches, and due to the fact that
803 For explanations on measuring models, s. Chapter 5.2.2.1; The particular benefits due to the form-
ative PSQ construct specification are shown in the operationalisation section in Chapter 5.2.2.4. 804 Cf. Lowry/Gaskin (2014), p. 133; Hair et al. (2014a), p. 109; Christophersen/Grape (2009), p. 108. 805 Cf. Lowry/Gaskin (2014), p. 131 ff.; Henseler/Chin (2010), p. 106; Weiber/Mühlhaus (2014), p. 78. 806 Cf. Lowry/Gaskin (2014), p. 133; Weiber/Mühlhaus (2014), p. 78; Hair et al. (2011), p. 140.

Research Design
177
the customer segment is difficult to reach, the data might be not distributed in a per-
fectly normal way, which is why PLS is also the appropriate methodological choice.807
5.2 Research Design
5.2.1 Survey Method and Structure of the Questionnaire
Survey Method
In order to gather the required data to for the empirical success factor analysis via
SEM, field research is conducted by means of a standardised online questionnaire.
Due to the time restrictions of a doctoral study this field research is a cross-sectional
data approach, as the empirical data is gathered once or in one time period.
In terms of the method, an online survey was chosen due to some important aspects
and limitations. Reaching the targeted group of automobile service customers in Chi-
na is a major challenge for Western researchers. In the case at hand, it would be
possible to co-operate with automobile manufacturers in order to reach their work-
shop customers. Due to competition-related issues, no relevant brand was willing to
do this. Moreover, the data of one single brand would be scientifically inappropriate,
because a brand-related bias would result. Face-to-face or written interviews are not
feasible options in this research setting, because of the need for a high number of re-
sponses, which would result in enormous organisational and especially economic ef-
forts. Additionally it must be considered that the government could restrict market re-
search in China.808 Some topics, such as sexuality, religion and politics, are very
sensitive and should therefore not be included in surveys.809 As a result a proper op-
tion is to work with licensed marketing research institutions with high local compe-
tence. In combination with an online survey, where the link to the questionnaire and
the incentive is administered by the agency, it is possible to reach the targeted group
appropriately.
807 Cf. Lowry/Gaskin (2014), p. 133. Hair et al. (2014a), pp. 108 f.; Weiber/Mühlhaus (2014), p. 74;
Chin (1998), p. 295. 808 Cf. Knörle (2011), p. 126. 809 Cf. Zeithaml (2013), p. 137.

Empirical Research
178
A general methodological assessment of KUß (2012) shows that online surveys have
significant strengths in the areas of data quality, effort, and the duration of an investi-
gation.810 A crucial benefit in terms of China, where questionnaire recipients are rela-
tively sceptical, is that the perceived anonymity of online surveys, in contrast to other
methods, is considered to be very high. The method is also considered to be relative-
ly objective, because there is no potential interviewer bias.811 Nonetheless online
surveys have some limitations in contrast to other methods. Here, the potential lack
of representativeness is the main point mentioned,812 because not every single unit
of the basic population is reachable via the internet (in other words, not every unit
has an equal chance to be in the sample), thus findings are often not generalisa-
ble.813 This is an important issue and therefore specifically addressed in Chapter
5.2.4, where the structure of the sample is shown. But it will be emphasised here that
this research project is not intended to generalise findings for the whole Chinese
population, as the delimitation of the research object in Chapter 3.4 shows. Next, Ta-
ble 21 compares the pros and cons of various survey methods.
Pros and Cons of Different Survey Methods Criteria Face-to-Face Telephone Written Online Representativeness High High Medium Very low Time Requirement High to medium Low to very low Medium Low Cost High to medium Low Very low Very low Flexibility Very high Very low Low High Controllableness High High Low High Bias through the interview situation Potentially high Medium to high Low Low Data accuracy Medium to high Medium to high Very high Very high Reachable quantity of data Low Medium to high Very high Very high
Table 21: Pros and Cons of Different Survey Methods
Reference: Author´s table referring to Fantapié Altobelli/Hoffmann (2011), p. 37; Kaya (2009), p. 54.
Obviously there is no generally favourable method; thus the research objectives and
capabilities must be considered, in order to choose a method. As described above,
the online survey is appropriate and was therefore chosen. More precisely, an online
panel of automotive customers was used to reach exactly the group targeted. There- 810 Cf. Kuß (2012), p. 130. 811 Cf. Fantapié Altobelli/Hoffmann (2011), pp. 34 f. 812 Cf. Kuß (2012), pp. 128 f.; Fantapié Altobelli/Hoffmann (2011), p. 33. 813 Cf. Berekoven et al. (2009), p. 107.

Research Design
179
fore, the renowned market research institute SSI was chosen as a proper partner,
because they have strong competence in China and they have a panel that ensures
a high number of after-sales service customers of German premium car brands,
which means the sample size is large enough for a proper statistical analysis via
PLS-SEM.
Structure of the Questionnaire
The data collection for this survey was done through field research and, as men-
tioned above, via an online survey. The questionnaire is constructed with regard to
the SEM requirements, in a standardised format with structured questions. Their for-
mulation or operationalisation is discussed comprehensively in Chapter 5.2.2. The
online questionnaire was programmed with a Questback Group (UNIPARK) software
package: EFS Survey version 10.6, a highly professional solution explicitly adapted
to scientists’ needs.814
The questionnaire starts with a welcome page (s. Appendix 1, No. 1, ‘Welcome
Page’), where the recipient is informed of the purpose of the survey, the responsible
sender, the thematic context, the expected duration, the general instructions, and of
the fact that all information is treated confidentially and is strictly for scientific use.
Within the questionnaire, generally two kinds of questions can be distinguished, the
result questions (factual issues), which are related to the objectives of the research,
and the instrumental questions, which are less intended to gather information than to
steer the flow through the questionnaire via contact, control, filter, and forking ques-
tions.815 In order to structure the sequence of result and instrumental questions
properly, established principles can be used as guidelines, as FANTAPIÉ ALTO-
BELLI/HOFFMANN (2011) state. In accordance with them, the best structure is to
start with contact questions (s. Appendix 1, No. 2, ‘Filter Page’), which should be
easy to answer and awaken interest, thus the recipient becomes motivated to answer
the questionnaire. In this section, a brand filter is integrated, thus first it ensures that
the target group will be reached, and second the car brand actually driven by the re-
cipient can be used as a dynamic variable for brand-specific questions. Additionally,
814 Information to EFS Survey by UNIPARK is available online at www.unipark.com. 815 Cf. Fantapié Altobelli/Hoffmann (2011), pp. 56 ff.

Empirical Research
180
the brand workshop filter question ensures the recipient’s after-sales service experi-
ence, and finally the gender distinction enables gender-specific addresses. These fil-
ter questions are programmed as must answers. The result questions (s. Appendix 1,
No. 3-6), follow the recommended logical sequence, where topic blocks are built.
These are, Block A ‘Workshop Section, Block B: ‘Loyalty Section’, which is shown to
the recipients as the brand preference section, and finally Block C, the ‘Value Sec-
tion’, which contains gender specific profiles. Sensible and crucial questions will be
placed fairly near the end of the questionnaire, which is why the value section is
placed here. Moreover this section is programmed as a must answer section. With
regard to the given guidelines, the questionnaire ends with correlation questions (s.
Appendix 1, No. 7, ‘Demographics’), which usually request personal information. In
this case, income, age and the current home province are requested.816
Translation Equivalence
The questionnaire is translated into simplified Chinese, in order to reach the urban af-
ter-sales service customers. In this context, it is critical to ensure translation equiva-
lence (linguistically and conceptually); otherwise a translation bias falsifies the survey
results, because accuracy partly depends on the understanding of the recipient.817
Generally, translation equivalence relates to four areas:818
• Lexical equivalence (context-dependent meaning of words)
• Idiomatic equivalence (phrases)
• Grammatical equivalence (grammar and syntax)
• Experience equivalence (real experiences with things)
In order to avoid translation biases, it is necessary to use an appropriate translation
method. Within the questionnaire mentioned above, no phrases are used and the
grammatical complexity is low. Moreover the recipients are car users, and therefore
they have experiences with the topic and related terms. As a result, the generally
very important lexical equivalence is the crucial item of concern. To ensure this, in
accordance to EMRICH (2014) the most commonly used technique is the translation
back-translation method. Here, one translator translates from the original language 816 Cf. ibidem. 817 Cf. de Mooij (2014), p. 181. 818 Cf. Emrich (2014), p. 202.

Research Design
181
(English) to the targeted language (Simplified Chinese). Another person, who has no
knowledge of the original text, afterwards translates the questionnaire into the lan-
guage of origin. For this exercise, native-speaker translators should be used. After-
wards the two translations are compared, problems are discussed, and then resolved,
based on the discussion.819 For this research project, the translation was conducted
in collaboration with the renowned German Institute of Global and Area Studies (GI-
GA),820 using professional native-speaker translators. The questionnaire was trans-
lated using the translation back-translation method, where GIGA ensured the re-
quired process mentioned above. After the discussion some minor changes were
made to the final version, but generally the translators assed the questionnaire as
linguistically easy. Also, it has to be emphasised that the complete cultural section is
available and validated in Chinese.821
5.2.2 Operationalisation
The conceptualisation of this research project took place in Chapter 4. Here, all con-
structs and theoretically assumed cause-effect relationships are integrated into a re-
search model via directed hypotheses. In order to verify the hypotheses empirically,
the given constructs must be operationalised, which means made measurable.822
Here every construct is measured by one or more indicators or items, which are
themselves expressed in the questionnaire as a question. In other words, a non-ob-
servable hypothetical construct becomes measurable by means of an observable fact
(item),823 which is likewise shown graphically in Figure 28.
819 Cf. ibidem; Knörle (2011), p. 131; Douglas/Craig (1983), p. 187. 820 Information about the GIGA institute is available at http://www.giga-hamburg.de. 821 Cf. Chapter 5.2.2.5, Construct Operationalisation of Individual Level Values. 822 Cf. Töpfer (2012), pp. 76 f./220; Kuß (2012), p. 25. 823 Cf. Weiber/Mühlhaus (2014), p. 105; Fantapié Altobelli/Hoffmann (2011), p. 115.

Empirical Research
182
Figure 28: Construct Operationalisation
Reference: Author´s illustration.
The operationalisation builds up on the already elaborated fundament of mentioned
and used definitions, conceptual and theoretical considerations. The particular con-
struct operationalisation starts with Chapter 5.2.2.3, thereby only applied measuring
models with good-quality criteria are used, so as to overcome one important point of
critique, when it comes to success factor research, namely the tendency toward ex-
clusive research,824 in which no replication studies are done to verify or falsify rela-
tionships and measuring models.
In terms of an adequate measuring model, it is very important to consider whether
constructs are specified as formative or reflective,825 and also which kind of scale is
appropriate. Therefore, the next two chapters emphasise these aspects in detail.
5.2.2.1 Specification-of-Measuring-Models-
When structural equation modelling is applied, the specification of the measuring
models is considered very important, because the choice of items, and also the sta-
tistical test methodology differs with the type of specification.826 In literature, con-
824 Cf. Sobotta (2012), p. 157; further aspects on this issue are discussed in Chapter 5.1, Success
Factor Research and Structural Equation Modelling. 825 Cf. Töpfer (2012), pp. 224 f. 826 Cf. Weiber/Mühlhaus (2014), p. 108; Diamtopolous/Siguaw (2006), pp. 263 ff.; Jarvis et al. (2003),
p. 199.
Construct)(Variable))
Dimension)2))Dimension)1) Dimension)n)
Item)1))
Response)to)the)ques;on)on)the)ques;onnaire)
Item)n))
Response)to)the)ques;on)on)the)ques;onnaire))
Item)2))
Response)to)the)ques;on)on)the)ques;onnaire))
Theore;cal)Layer)
Empirical)Layer)

Research Design
183
structs are often specified as reflective or formative, which strictly speaking is short
for a construct that is measured by reflective or formative indicators (items).827
In the case of reflective measuring models, hypothetical constructs (latent variables)
are the cause of measuring indicators, thus the reflective indicators are observable
consequences of the construct. On the other hand, formative indicators are the cause
of a construct, thus the direction of causality is from the measures to the construct.828
Figure 29 shows this crucial difference (direction of arrows) graphically.
Figure 29: Reflective vs. Formative Measurement Model
Reference: Author´s illustration referring to Jarvis et al. (2003), p. 201.
Another important difference becomes obvious when the inter-correlation of items is
considered. JARVIS ET AL. (2003) state, on reflective measuring models, that here
‘(…) the latent variable influences the indicators, accounting for their inter-correla-
tions. Reflective indicators (…) should be internally consistent and, because all the
measures are assumed to be equally valid indicators of the underlying construct, any
two measures that are equally reliable are interchangeable. Thus, although reliability
estimates (e.g., Cronbach’s alpha) of the set of indicators will be lower if fewer indica-
827 Cf. Diamantopoulos (2011), p. 336. 828 Cf. Jarvis et al. (2003), p. 200; Lowry/Gaskin (2014), pp. 131 f.; Christophersen/Grape (2009), pp.
104 ff.; Hair et al. (2014a), p. 109.
Construct)1)
Construct)2)
Construct)1)
Construct)2)
Item)1)
Item)2)
Item)3)
Item)4)
Item)5)
Item)6)
Item)1)
Item)2)
Item)3)
Item)4)
Item)5)
Item)6)
e1)
)(zeta))=)combined)measurement)error)term)
(e))=)measurement)error)terms)
e2)
e3)
e4)
e5)
e6)
zeta)1)
zeta)2)
Reflec%ve'Model ' ' ' ' ''''''''Forma%ve'Model'

Empirical Research
184
tors are included in the measurement model, the construct validity is unchanged
when a single indicator is removed, because all facets of a unidimensional construct
should be adequately represented by the remaining indicators.’829 Moreover, the
construct’s meaning will not change if a reflective item is removed.830 On the other
hand this is precisely what would happen if done with formative indicators; which is
also a reason why formative indicator models should not be evaluated by measures
of the reliability of internal consistency.831
In order to distinguish the construct measurement specification, JARVIS ET AL.
(2003) elaborated a catalogue of conceptual criteria to determine whether the con-
struct should be modelled formative or reflective. Here, they focus on four sets of
questions (s. Table 22). First, questions regarding the direction of causality, second,
on the interchangeability of indicators, third, on the covariation among them, and fi-
nally on the nomological net of construct indicators (antecedents and consequenc-
es).832 The specification of indicators for this research is based on these criteria and
shown in the subsequent operationalisation sections, as also in Table 24: Operation-
alisation of Constructs.
829 Jarvis et al. (2003), p. 200. 830 Cf. Christophersen/Grape (2009), p. 105. 831 Cf. ibidem, p. 106; Jarvis et al. (2003), p. 202; Lowry/Gaskin (2014), p. 132. 832 Cf. Jarvis et al. (2003), p. 203.

Research Design
185
Rules for Determining Whether a Construct is Formative or Reflective Formative Model Reflective Model 1. Direction of causality from con-struct to measure implied by the conceptual definition
Are the indicators (items) (a) defining characteristics or (b) manifestations of the construct?
Would changes in the indicators/items cause changes in the construct or not?
Would changes in the construct cause changes in the indicators?
Direction of causality is from items to construct
Indicators are define charac-teristics of the construct
Changes in the indicators should cause changes in the construct
Changes in the construct do not cause changes in the indi-cators
Direction of causality is from construct to items
Indicators are manifestations of the construct
Changes in the indicator should not cause changes in the construct
Changes in the construct do cause changes in the indica-tors
2. Interchangeability of the indica-tors/items
Should the indicators have the same or similar content? Do the indicators share a common theme?
Would dropping one of the indicators alter the conceptual domain of the construct?
Indicators need not be inter-changeable
Indicators need not have the same or similar content/ indi-cators need not share a com-mon theme
Dropping an indicator may al-ter the conceptual domain of the construct
Indicators should be inter-changeable
Indicators should have the same or similar content/ indi-cators should share a com-mon theme
Dropping an indicator should not alter the conceptual do-main of the construct
3. Covariation among the indica-tors
Should a change in one of the indica-tors be associated with changes in the other indicators?
It is not necessary for indi-cators to covary with each other
Not necessarily
Indicators are expected to covary with each other
Yes
4. Nomological net of the construct indicators
Are the indicators/items expected to have the same antecedents and con-sequences?
Nomological net for the in-dicators may differ
Indicators are not required to have the same antecedents and consequences
Nomological net for the in-dicators should not differ
Indicators are required to have the same antecedents and consequences
Table 22: Rules for Determining Whether a Construct is Formative or Reflective
Reference: Author´s table referring to Jarvis et al. (2003), p. 203.
5.2.2.2 Scaling-
Non-observable or latent constructs are measured by items as described above. Ad-
ditionally, these constructs are usually not one-dimensional, and therefore assembled
by interacting variables. In order to ensure that objects with identical manifestations
of their characteristics receive identical numbers (values), when it comes to mea-
sures, a scaling of characteristics or constructs is required. Thus, scaling is consid-

Empirical Research
186
ered to be a continuum, which positions the measured characteristics.833 Moreover it
is important whether the measuring model is applied by single-item or multi-item
scales. Only the construct, ‘acceptable workshop distance’, is measured by a single
item, as it could be measured directly by metric numbers. All other constructs are
measured with multi-item scales, because they are most appropriate in terms of la-
tent variables, and therefore mostly scientific standard.834 Crucial benefits are that
this goes some way toward ensuring that multi-item measuring captures the various
aspects of a construct of interest, that the measured data is more finely differentiated,
and because multi-item scales are considered more reliable than single-item
scales.835
By the application of structural equation modelling, rating scales are highly recom-
mended.836 They will thus be applied in this research; which implies that the poles
must be formulated as extreme statements, such as ‘extremely satisfied’.837 Strictly
speaking, rating scales deliver ordinal data, but under the given assumption of equal
distances between the points of the scale, they are usually considered and applied
as metric (interval) data,838 which is required to conduct the success factor research
via structural equation modelling.839 As a result, the scale must be presented with
numbers, so that distances can be interpreted.840
Generally, five-point and seven-point rating scales are very common within the mar-
keting research field. Odd scales have the advantage that subjects are not forced to
make a rating, which increases the willingness to answer.841 Nonetheless, providing
a middle category comes along with disadvantages, such as the differentiation prob-
lem. Which means that it could be unclear whether the response is really ambivalent
or whether indifference is given (e. g. a relevant pair of characteristics is missing).842
833 Cf. Fantapié Altobelli/Hoffmann (2011), pp. 107/115; Weiber/Mühlhaus (2014), pp. 115 f. 834 Cf. Fantapié Altobelli/Hoffmann (2011), pp. 125 f. 835 Cf. Dorka (2012), p. 211; Kuß (2012), p. 91; Fantapié Altobelli/Hoffmann (2011), p. 126; Weiber/-
Mühlhaus (2014), p. 112. 836 Cf. Weiber/Mühlhaus (2014), pp. 116 ff. 837 Cf. ibidem, p. 118. 838 Cf. Greving (2009), p. 72; Fantapié Altobelli/Hoffmann (2011), p. 121. 839 Cf. Weiber/Mühlhaus (2014), p. 35. 840 Cf. Kuß (2012), p. 94. 841 Cf. Sobotta (2012), p. 157; Fantapié Altobelli/Hoffmann (2011), p.117. 842 Cf. Weiber/Mühlhaus (2014), p. 117.

Research Design
187
Moreover, some researchers argue that people from collectivistic cultures such as
China tend to have a middle-category bias.843 But on the other hand, the advantages
of odd scales are also considered in China, which is why odd scales are recom-
mended,844 and often used in Chinese surveys,845 and therefore also in this one. As
regards the option of using five point or seven point scales, generally both options
are considered to be suitable. An expert interview with the intercultural marketing and
research expert EMRICH was conducted, in order to assess both possibilities. She
emphasises that in China the avoidance of choosing extreme values is relevant,
which is why she recommends five point scales in contrast to seven point scales.846
The author follows this recommendation. For this reason, and in order make the
questionnaire as easy and clear as possible, some rating scales that were originally
seven-point have been converted to five-point rating scales.
The item scales used in this study, which are described in detail in the next chapters,
are adapted from previous studies in order to ensure content validity, and against the
background that they are absolutely specific to the automobile industry, as well as to
after-sales services. Furthermore, scales are chosen which are already validated or
used within Chinese research. This is especially the case when it comes to the indi-
vidual-level value section, which is very sensitive to biases (here all items are availa-
ble in Chinese). If possible, originally in China applied, and in Chinese language
available scales are used. Nonetheless, some very automobile specific scales have
to be translated. Here professional translators conduct the translation back transla-
tion procedure (English/Chinese and Chinese/English), thus no linguistic problems
are expected, and conceptual equivalence and translation equivalence is provided.847
Additionally, a pre-test (s Chapter 5.2.3) is done with Chinese respondents, so that
this can be confirmed or, if misunderstandings exist, adapted. This procedure is in
accordance with the procedure used by other researchers with familiar approaches,
such as KNÖRLE (2011); DENG ET AL. (2010) or YIM ET AL. (2008).848 Finally, the
843 Cf. Emrich (2014), p. 194/211. 844 Cf. ibidem. 845 Cf. Knörle (2011), pp. 180 f.; Qin et al. (2010), p. 428; Deng et al. (2010), p. 293; Ha et al. (2009), p.
208; Ueltschy et al. (2009), p. 973; Yim et al. (2008), p. 748. 846 The personal expert interview with Ms Emrich was done via telephone on the 26th of April 2015. 847 Cf. Chapter 5.2.1, Survey Method and Structure of the Questionnaire. 848 Cf. Knörle (2011), pp. 180 f.; Deng et al. (2010), p. 293; Yim et al. (2008), p. 748.
Empirical Research
188
questionnaire contains almost only closed questions in order to avoid cultural barriers
to answering and other related problems.849
The next Chapters show why and in according to which studies, constructs are oper-
ationalised. At the end of these remarks Table 24 summarises all constructs, the re-
lated items, references and the specification of each measuring model.
5.2.2.3 Construct-Operationalisation-of-Satisfaction-and-Loyalty-Variables-
After-sales Service Satisfaction (ASSS)
In line with the chosen term definition of OLIVER (2010) in Chapter 4.2.2, an opera-
tionalisation originally from ANDALEEB/BASU (1994) is chosen, which was recently
used successfully in an automobile service study by HÜNECKE (2012).850 This oper-
ationalisation is very suitable, because it is specific to the after-sales service context,
and it asks for total satisfaction as well as for satisfaction due to service quality. This
reflective two-item measurement model captures the main dimensions of the con-
struct properly, but in addition the application is fast enough to be well integrated into
the complex research model without stressing the questionnaire´ too much. There is
no measuring model available which is validated in China, but in Chinese settings
satisfaction is measured almost similar. For instance, HA ET AL. (2009) use two very
familiar items, also including total satisfaction. Moreover their choice is closely relat-
ed to Western theory such as is found in, for instance, OLIVER (1997),851 so the op-
erationalisation chosen above is assessed as valid in the Chinese context.
Brand Loyalty (BL)
In order to operationalise brand loyalty in China, it must be considered that the Chi-
nese premium car market is still predominantly a first buyer market.852 Because of
this a behavioural measurement approach based on actual repurchases would lead
to a bias, because a significant amount of car users would be excluded from the re- 849 Cf. Knörle (2011), p. 180; Only age, home country (s. Chapter 5.2.2.6) and acceptable workshop
distance (s. Chapter 5.2.2.4) are open, but quiet easy and definite questions. 850 Cf. Hünecke (2012), p. 109/214; Andaleeb/Basu (1994), p. 378. 851 Cf. Ha et al. (2009), p. 208. 852 Cf. Table 2: List of Insights of the Expert Survey.

Research Design
189
search. For this research the actual users, which are also potential buyers, are also
of interest, and therefore the purchase intention is measured. Likewise, this market
logic is in line with the chosen theoretical remarks in Chapter 4.2.4. To operationalise
the construct, brand loyalty, a measuring model developed by DENG ET AL. (2010)
is used,853 because it is approved in China. This measuring model originates from
LIN/WANG (2006),854 but it is operationalised with fewer items, what is required in
order to integrate it into the complex research model given. DENG ET AL.´s (2010)
reflective specified measuring model contains three items (one item directly asks
about repurchase intentions), which can easily be adapted to the automobile context
with minor changes in the wording. These changes are made referring to the wording
of KUENZEL/HALLIDAY (2010).855
Workshop Loyalty (WL)
There is no available construct operationalisation for workshop loyalty in China, but
an automobile-service-specific one by HÜNECKE (2012),856 which is based on the
established approach of ANDALEEB/BASU (1994). 857 In line with HÜNECKE´s
(2012) argumentation, time and financial restrictions prevent the measurement of ac-
tual behaviour.858 Therefore, the willingness to recommend and the willingness to re-
turn to the workshop (repurchase intention) are the basis for the reflective specified
two-item measurement model. The application of this approach in China is suitable
because the concept and the items are very close to the above mentioned brand loy-
alty operationalisation, whereby the workshop is the point of reference instead of the
brand.
853 Cf. Deng et al. (2010), p. 293. 854 Cf. Lin/Wang (2006), p. 279. 855 Cf. Kuenzel/Halliday (2010), p. 172. 856 Cf. Hünecke (2012), pp. 110/215. 857 Cf. Andaleeb/Basu (1994), pp. 378 f. 858 Cf. Hünecke (2012), p. 110.

Empirical Research
190
5.2.2.4 Construct-Operationalisation-of-Independent-Variables-
Perceived Service Quality (PSQ)
When service quality is operationalised it is important to consider the industry context,
because SERVQUAL and SERVPERF approaches have failed to be operationalised
in some industries.859 Also complexity is an issue which should be considered, be-
cause the number of items is high when perceived service quality is measured.
LEE ET AL. (2000), have comprehensively researched and compared the SERV-
QUAL and the SERVPERF approach. They conclude that the performance-only
measuring approach (SERVPERF) explains more variance in overall service quality
than the gap approach (SERVQUAL).860 In combination with the fact that a perfor-
mance-based scale reduces the number of items by 50 percent, this kind of scale is
considered to be more efficient.861 This is a major aspect in combination with the as-
pect of complexity mentioned above. That SERVPERF scales are applied in research
on China becomes perceptible in various studies and industries;862 especially in the
study by SHUQIN/GANG (2012) on relationship value in China´s automobile indus-
try.863 As a result of the aspects mentioned, the SERVPERF measuring approach is
assessed as suitable in China and superior to SERVQUAL in the context of this re-
search work.
In accordance to the SERVPERF, HÜNECKE (2012) refers to CONLON ET AL.
(2001), who elaborated a specific approach with regard to automobile maintenance
services.864 Thus, a suitable and highly context-affine operationalisation is existent,
which is used as well for the construct of perceived service quality, targeted in this
study. The formative specified measuring model contains nine items, which can be
seen as an expression of the most important and supplier steerable after-sales ser-
vice instruments: cost, convenience, ease of getting an appointment, knowledge of
your car, honesty and integrity, ability to do the job right, ability to do the job on time, 859 Cf. Brady/Cronin (2001), p. 34. 860 Cf. Lee et al.(2000), p. 226. 861 Cf. ibidem. 862 Cf. for instance Law (2013), pp. 231 ff.; Qin et al. (2010), pp. 242 ff. 863 Cf. Shuqin/Gang (2012), p. 177. 864 Cf. Hünecke (2012), pp. 108 f./214; Conlon et al. (2001), p. 1202. Likewise Devaraj et al. (2001), p.
437 can be consulted as it is a similar paper, written by the same three authors.

Research Design
191
the cleanliness and appearance of the facility and friendliness of the personnel. This
level of detail is both worth measuring and needed. Needed because an elimination
of a formative item would change the meaning of the construct,865 and worth measur-
ing because in formative measuring models an assessment can be made as to what
indicator has what weighting on the construct.866 This is very important, because it
makes it possible to assess which of the after-sales service instruments are really
relevant.
Brand Image (BI)
A review of the literature on approaches to brand image operationalisation in China
shows that the scales used often originate in or are adapted from those in Western
studies. For instance, the study, ‘How quality, value, image, and satisfaction create
loyalty at Chinese telecom’ by LAI ET AL. (2009), uses items from ZEITHAML´s
(1988) and SELNES`s (1993) scales.867 Moreover, WANG/YANG (2010) builds on a
Western theory by adapting the General Brand Image (GBI) scale from AAKER
(1996),868 which likewise is the definitional basis of brand image in this research
work.869 A familiar, but particularly automobile-related scale proposed by VERHOEF
ET AL. (2007) is therefore used to measure the construct of brand image. This hap-
pens with a reflective model, measured by three items.870
Perceived Workshop Switching Costs (PWSC)
Switching costs is a construct already applied in Chinese studies. DENG ET AL.
(2010) use a three-item scale,871 which is generally applicable to the automobile ser-
vice context with minor wording changes. Only item number three, ‘Switching to other
MIM service would require too much learning’, is not valid, because here learning re-
fers to product use, which is different from service consumption. However, this ap-
865 Cf. Jarvis et al. (2003), p. 203. 866 Cf. Christophersen/Grape (2009), p. 106. 867 Cf. Lai et al. (2009), p. 983. 868 Cf. Wang/Yang (2010), p. 181. 869 Cf. Table 17: Overview of Constructs. 870 Cf. Verhoef et al. (2007), p. 105. 871 Cf. Deng et al. (2010), p. 294.

Empirical Research
192
proach will be used without the mentioned ‘learning item’, as a reflective multi-item
measuring scale.
Acceptable Workshop Distance (AWD)
In Chapter 4.4.2.3 the variable, acceptable workshop distance, is described as wor-
thy of research in terms of after-sales service satisfaction and workshop loyalty. On
this topic hardly any research is available. Only DIEZ (2009) argues that German
customers refuse to drive more than 30 minutes to reach their favourite workshop.872
Using time as the unit of interest has the advantage that it takes into account that the
same distance can be reached quickly or slowly, dependent on circumstances such
as traffic volume. It follows that minutes are the related value of measures, thus this
construct can be measured directly by a metric, single-item scale.
5.2.2.5 Construct-Operationalisation-of-Individual-Level-Values-
Chapter 4.4.3.2 gives a full analysis of the reason that the theory of individual level
values by SCHWARTZ is very valuable and suitable for this research. The argument
was made that the PVQ based approach has a lot of benefits, so it should be the
choice for the operationalisation. It has to be emphasised that this approach is also
specifically suitable with SEM based research settings.873 The operationalisation with
regard to the PVQ approach is applicable in different ways, which mainly vary in the
level of detail (values) and the number of items used (s. Table 23).
PVQ Operationalisation Approaches Name Items Approximate
Time Requirement Values Comment
PVQ-40 40 7 minutes 10 Medium fast
PVQ-21 21 4 minutes 10 Fastest approach with the benefit of a high level of value distinction
PVQ-RR 57 8-9 minutes 19 Highest degree of value distinction, remarkable time effort needed, but relatively time efficient compared with the PVQ-40
Table 23: PVQ Operationalisation Approaches
Reference: Author´s table. 872 Cf. Diez (2009), p. 61. 873 Cf. Schmidt et al. (2007), pp. 270 f.

Research Design
193
As described in the previous chapters, the complexity of the research model is al-
ready high, so the longest version the PVQ-RR is not suitable. Moreover, this ap-
proach is relatively new and therefore not validated in so many countries as the oth-
ers. In particular it is not validated and applied in China.874 The PVQ-21 as the short-
est suitable version might be a good choice. Here, SCHMIDT ET Al. (2007) use a
confirmatory factor analysis to show that the validity and reliability of the PVQ-21 is
‘very satisfying’. Nonetheless, the reduction to two items per construct brings disad-
vantages in cross-cultural settings, so that they were forced to reduce the ten factors
to seven. The use of the PVQ-40 should overcome this limitation.875 But this limitation
must not be existent at within-country research; likewise there are studies which suc-
cessfully distinguish the ten values through confirmatory factor analysis.876 The 40-
item version is considered to be superior, if explicitly cross-cultural analysis is target-
ed,877 but that is not intended in this work.
Beside the explanations of Chapter 4.4.3.2, as a result, a PVQ 21-item version is
chosen, because it is most suitable in terms of complexity and answering time re-
strictions. Moreover, the level of detail is adequate, thus relevant cultural causes can
be identified. The coding key as well as the 21 items are available in Chinese, and
SCHWARTZ has submitted them to the author via personal e-mail. These 21 ques-
tions are shown below in Table 24. The measuring model is reflectively specified.
5.2.2.6 Construct-Operationalisation-of-Control-Variables-
The demographic variables of age, gender and income are integrated into the ques-
tionnaire because group comparisons are intended. In accordance with the question-
naire developed by KNÖRLE (2011), income is measured in categories,878 which
helps to overcome Chinese scepticism on sensible or personal statements. This
structure is applied, but as the sample differs significantly (premium automobile users
vs. students) another classification is made. In accordance with various figures and
comparisons in Chapter 3.2, the annual household income is appropriate. On this,
874 Schwartz et al. (2012) applied it in ten western countries s. p. 670. 875 Cf. Schmidt et al. (2007), p. 271; Davidov et al. (2008), p. 440. 876 Cf. Schwartz (2011b), p. 310; Schwartz/Boehnke (2004), p. 254; Steinmetz et al. (2009), p. 614. 877 Cf. Cieciuch/Davidov (2012), p. 43. 878 Cf. Knörle (2011), p. 237.

Empirical Research
194
the 2012 McKinsey study, ‘Meet the Chinese consumer 2020’, is used to express in-
come categories.879 Additionally, the category of very affluent is added, as it is likely
that, in the customer segment of premium car users, very affluent Chinese are repre-
sented. The resulting classification on the basis of annual household incomes is as
follows:880
• Very affluent > 75,000$ > (435,000 CNY)
• Affluent > 34,000$ > (212,000 CNY)
• Mainstream > 16,000$ > (99,000 CNY)
• Value > 6,000$ > (37,500 CNY)
• Poor < 6,000$ < (37,500 CNY)
5.2.2.7 Filter-Section-and-Operationalisation-Summary--
In order to ensure that the targeted sample is actually reached, the first questions of
the questionnaire are filter questions. First, the recipient is asked, ‘Which brand of car
you drive?’ If a non-targeted brand is selected or ‘I don´t use a car’ is chosen, this
leads to an abort, and the recipient is directed to the questionnaires end-site, were
the causes are explained. The second question filters out those who have no experi-
ence of brand workshop service. Only those who have such experience are consid-
ered. Finally, the filter determines the recipient’s gender, because later on, the cul-
tural section is differentiated in gender specific descriptions. In addition to the re-
quirement of this section of the questionnaire, it is quite easy and convenient to an-
swer this section, which is in order to give the recipient the good feeling that the
questionnaire can be completed easily and quickly. This section closes with an over-
view of all construct operationalisation´s, presented in the sequence of the after-sales
process chain in Table 24.
879 Cf. Atsmon/Magni (2012), p. 3. 880 Cf. Numbers are rounded and calculated on the exchange rates of 23/03/2015.

Research Design
195
Operationalisation of Constructs
Construct Operationalisation & [Coding Key] Reference Meas-uring Model
Perceived Service Quality (PSQ)
1. Cost [PSQ_1_v_15] 2. Convenience (e.g.: Reachability, parking spaces, com-
fortable waiting area, etc.) [PSQ_2_v_13] 3. Ease of getting an appointment [PSQ_3_v_7] 4. Knowledge about your car [PSQ_4_v_8] 5. Honesty and integrity [PSQ_5_v_9] 6. Ability to do the job right [PSQ_6_v_10] 7. Ability to do the job on time [PSQ_7_v_185] 8. Cleanliness and appearance of facility [PSQ_8_v_11] 9. Friendliness of personnel [PSQ_9_v_14]
HÜNECKE (2012), pp. 108 f./214 based on DEVA-RAJ ET AL. (2001), p. 437 or CONLON ET AL. (2001), p. 1202 Fo
rmat
ive
After-Sales Service Satis-faction (ASSS)
1. Overall, how satisfied were you with the workshop? [ASSS_1_v_26]
2. How satisfied are you overall with the service quality you received from the workshop? [ASSS_2_v_27]
HÜNECKE (2012), pp. 109/214 based on ANDALEEB/-BASU (1994), p. 378 China: HA ET AL. (2009) p. 208
Ref
lect
ive
Workshop Loyalty (WL)
1. How willing would you be to recommend this workshop to others? [WL_1_v_54]
2. How willing would you be to return to a(n) ‘brand name’ workshop in the future? [WL_2_v_55]
HÜNECKE (2012), pp. 110/215 based on ANDALEEB/-BASU (1994), pp. 378 f. R
efle
ctiv
e
Brand Loyalty (BL)
1. My next car will also be ‘brand name’ again. [BL_1_v_59] 2. I recommend ‘brand name’ to my friends and relatives.
[BL_2_v_60] 3. Even if close friends recommended another brand, my
preference for ‘brand name’ would not change. [BL_3_v_61]
DENG ET AL. (2010), p. 293 based on LIN/WANG (2006), p. 279 R
efle
ctiv
e
Acceptable Workshop Distance (AWD)
1. In your opinion, what is the maximum distance (in minutes) you would be willing to drive to reach a work-shop? [AWD_v_32]
DIEZ (2009), p. 61
Sin
gle
Item
Brand Image (BI)
1. ‘Brand name’ is a strong brand. [BI_1_v_64] 2. ‘Brand name’ is a well-known brand. [BI_2_v_65] 3. ‘Brand name’ is a unique brand. [BI_3_v_66]
VERHOEF ET AL. (2007), p. 105
Re-
flect
ive
Perceived Workshop Switching Costs (PWSC)
1. Switching to a non ‘brand name’ workshop would cause too many problems. [PWSC_1_v_44]
2. Switching to a non ‘brand name’ workshop would be too expensive. [PWSC_2_v_45]
DENG ET AL. (2010), p. 293
Ref
lect
ive
Self-Direction (SE-D)
1. Thinking up new ideas and being creative is important to him. He likes to do things in his own original way. [SE-D_1_78]
2. It is important to him to make his own decisions about what he does. He likes to be free to plan and to choose his activities for himself. [SE-D_2_88]
Items are provided in Chinese by SCHWARTZ via personal e-mail. Cf. DAVIDOV ET AL. (2008), 427 f.
Ref
lect
ive
Universal-ism (UNI)
1. He thinks it is important that every person in the world be treated equally. He believes everyone should have equal opportunities in life. [UNI_1_v_80]
2. It is important to him to listen to people who are different from him. Even when he disagrees with them, he still wants to understand them. [UNI_2_v_85]
s. (SE-D)
Ref
lect
ive

Empirical Research
196
3. He strongly believes that people should care for nature. Looking after the environment is important to him. [UNI_3_v_159]
s. (SE-D)
Benevo-lence (BEN)
1. It’s very important to him to help the people around him. He wants to care for their well-being. [BEN_1_v_152]
2. It is important to him to be loyal to his friends. He wants to devote himself to people close to him. [BEN_2_v_158]
s. (SE-D)
Re-
flect
ive
Tradition (TRA)
1. It is important to him to be humble and modest. He tries not to draw attention to himself. [TRA_1_v_86]
2. Tradition is important to him. He tries to follow the cus-toms handed down by his religion or his family. [TRA_2_v_160]
s. (SE-D)
Ref
lect
ive
Conformity (CON)
1. He believes that people should do what they’re told. He thinks people should follow rules at all times, even when no-one is watching. [CON_1_v_84]
2. It is important to him always to behave properly. He wants to avoid doing anything people would say is wrong. [CON_2_v_156]
s. (SE-D)
Ref
lect
ive
Security (SEC)
1. It is important to him to live in secure surroundings. He avoids anything that might endanger his safety. [SEC_1_v_82]
2. It is important to him that his country be safe. He thinks the state must be on watch against threats from within and without. [SEC_2_v_154]
s. (SE-D)
Ref
lect
ive
Power (POW)
1. It is important to him to be rich. He wants to have a lot of money and expensive things. [POW_1_v_79]
2. It is important to him to be in charge and tell others what to do. He wants people to do what he says. [POW_2_v_157]
s. (SE-D)
Ref
lect
ive
Achieve-ment (ACH)
1. It’s important to him to show his abilities. He wants people to admire what he does. [ACH_1_v_81]
2. Being very successful is important to him. He likes to im-press other people. [ACH_2_v_153]
s. (SE-D)
Re-
flect
ive
Hedonism (HED)
1. Having a good time is important to him. He likes to “spoil” himself. [HED_1_v_87]
2. He seeks every chance he can to have fun. It is important to him to do things that give him pleasure. [HED_2_v_161]
s. (SE-D)
Ref
lect
ive
Stimula-tion (STI)
1. He thinks it is important to do lots of different things in life. He always looks for new things to try. [STI_1_v_83]
2. He likes to take risks. He is always looking for adventures. [STI_2_v_155]
s. (SE-D)
Re-
flect
ive
Age (AGE) Age: [AGE_v_72] Cf. KNÖRLE (2011), p. 237 –
Gender (GEN)
Gender: [GEN_v_69] s. (AGE) –
Income (INC)
Yearly Household Income (group classification) [INC_v_70] 1. Very Affluent > 75,000$ (435,000 CNY) 2. Affluent > 34,000$ (212,000 CNY) 3. Mainstream > 16,000$ (99,000 CNY) 4. Value > 6,000$ (37,500 CNY) 5. Poor < 6,000$ (37,500 CNY)
ATSMON/MAGNI (2012), p. 3.
–
Table 24: Operationalisation of Constructs
Reference: Author´s table. Cultural items are presented in the masculine form.

Research Design
197
5.2.3 Pre-Test
Initial Pre-Test
The initial pre-test was conducted on the 21th and 23th of April 2015, in the Hamburg
University of Applied Science (HAW) in three international business classes, where
all students are educated in English. The English questionnaire was delivered in the
same manner via an online survey as the final version will be.881 The pre-test was
conducted in order to evaluate the cover letter and the questionnaire. This was in-
tended to test the questionnaire, especially for its acceptance and comprehensibility.
The time required to fill it in was also measured.
Overall, the cover letter was assessed as pretty good, because it was considered to
be clear, short and informative. The questionnaire was assessed as pretty easy, both
in terms of the scales given and the questions themselves. The recipients felt that the
time taken to fill it in was acceptable. Based on the discussion on issues with optimi-
sation potential, the main point was that the cultural section (Block C) is too long to
be presented in one step on one page, which might deter some people to proceed.
As a result, Block C of the questionnaire was divided into two pages, so that after ten
questions the recipient easily detects their progress through the status bar. The av-
erage time needed to answer all questions was almost eleven minutes and the medi-
an average almost twelve minutes. Here, it has to be considered that various recipi-
ents used the comment function to assess the questionnaire. This means the final
questionnaire can be completed faster.
Overview of the Initial Pre-Test Sample Gross Sample Size (n) 43 Male
Female 60% 40%
Abort 1 Completed 42 Completed and 100% answers given 31 Process time (arithmetic average)
Process time (median) 10min 57sec 11min 52sec
Table 25: Overview of the Initial Pre-Test Sample
Reference: Author´s table; percentages are rounded.
881 Cf. Chapter 5.2.1, Survey Method.

Empirical Research
198
Chinese Pre-Test
Due to the initial pre-test some improvements were made to the questionnaire.
Based on that, a second pre-test with the Chinese questionnaire was conducted in
China between the 11th and the 21th of May 2015. Chinese car drivers were invited to
the pre-test with a separate invitation letter, which describes the pre-test procedure
and the related objectives. As the survey link can be passed to people who were not
originally invited, the filter section is supplemented with an additional filter question,
to determine whether the respondent´s nationality is Chinese. This happens in order
to filter out foreigners currently living in China. Thus, it is ensured that only Chinese
people take the Chinese pre-test.
The Chinese pre-test shows that the adjustments from the first pre-test had a signifi-
cant effect, because only one person stopped taking the survey within the cultural
section, which initially was assessed as too long. The high quota of aborts (19 out of
43 = 44.19%) was expected beforehand, because no incentive was given for the pre-
test, and the survey has a substantial time requirement, thus only really interested
respondents take part. This fact became obvious when twelve of the 19 aborts oc-
curred on the welcome page, which means that these respondents did not start the
actual survey. From the participants, seven were screened out because they did not
exactly fit the filter criteria. With regard to the translation, potential comprehension
problems, ambiguities and other issues were not mentioned, so the translation
equivalence is approved by the pre-test. Furthermore, there did not appear to be an
avoidance of extreme answers, as all the options on the scales were chosen. By
comparing the means, section A) and B) were answered above the scale average;
where positive values were expressed by high numbers. It is significant that various
means in the value section C) were answered below the scale average, so it is not
the case that the participants simply clicked quickly, because in contrast to A) and B),
in C) positive formulations are expressed by low scale numbers, which means that
the respondents read the questionnaire. Finally, the average process time of almost
8 minutes is within the scheduled range.
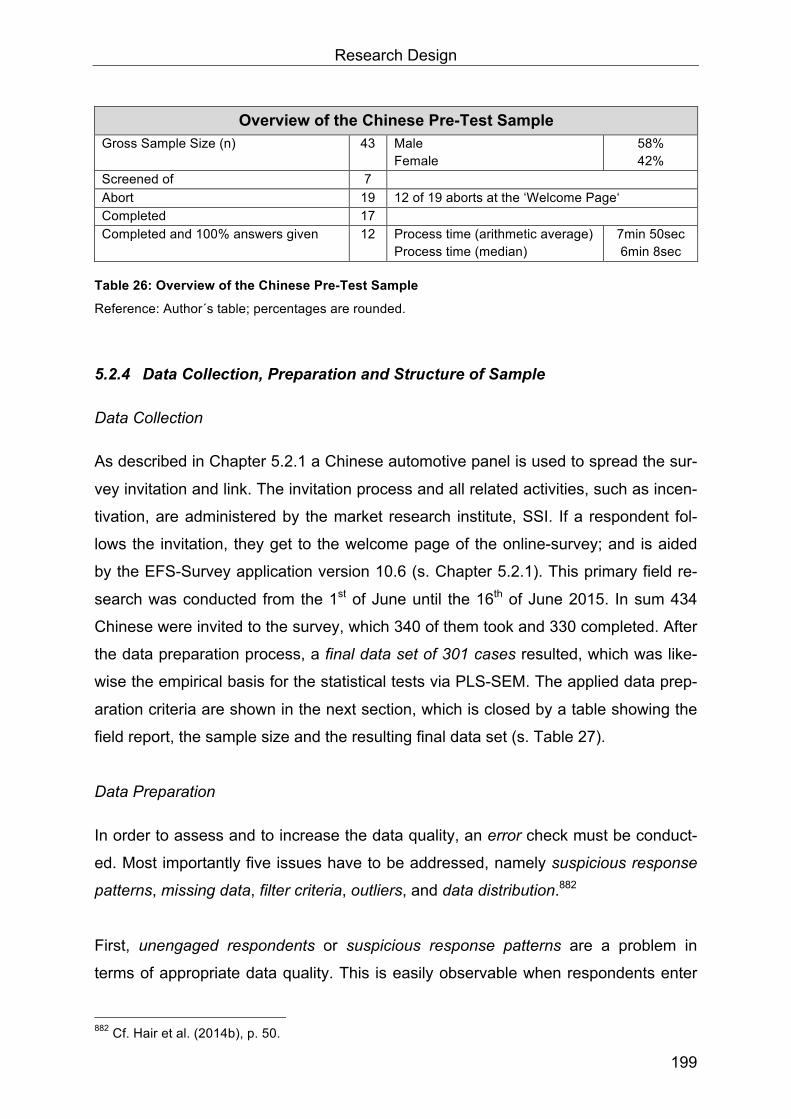
Research Design
199
Overview of the Chinese Pre-Test Sample Gross Sample Size (n) 43 Male
Female 58% 42%
Screened of 7 Abort 19 12 of 19 aborts at the ‘Welcome Page‘ Completed 17 Completed and 100% answers given 12 Process time (arithmetic average)
Process time (median) 7min 50sec 6min 8sec
Table 26: Overview of the Chinese Pre-Test Sample
Reference: Author´s table; percentages are rounded.
5.2.4 Data Collection, Preparation and Structure of Sample
Data Collection
As described in Chapter 5.2.1 a Chinese automotive panel is used to spread the sur-
vey invitation and link. The invitation process and all related activities, such as incen-
tivation, are administered by the market research institute, SSI. If a respondent fol-
lows the invitation, they get to the welcome page of the online-survey; and is aided
by the EFS-Survey application version 10.6 (s. Chapter 5.2.1). This primary field re-
search was conducted from the 1st of June until the 16th of June 2015. In sum 434
Chinese were invited to the survey, which 340 of them took and 330 completed. After
the data preparation process, a final data set of 301 cases resulted, which was like-
wise the empirical basis for the statistical tests via PLS-SEM. The applied data prep-
aration criteria are shown in the next section, which is closed by a table showing the
field report, the sample size and the resulting final data set (s. Table 27).
Data Preparation
In order to assess and to increase the data quality, an error check must be conduct-
ed. Most importantly five issues have to be addressed, namely suspicious response
patterns, missing data, filter criteria, outliers, and data distribution.882
First, unengaged respondents or suspicious response patterns are a problem in
terms of appropriate data quality. This is easily observable when respondents enter
882 Cf. Hair et al. (2014b), p. 50.

Empirical Research
200
data as a series (strait lining), such as 2,2,2,2,2. Within the given data, no such case
exists. However, the problem is not necessarily obvious, since a respondent might
choose different numbers without being actively engaged. Thus, the answering
speed will also be used to identify unengaged respondents. Therefore, EFS- Survey
delivers a sophisticated approach, which is called quality correction. Here, the an-
swering time of each respondent for every single section of the survey is calculated.
Afterwards, for each respondent the individual average time per page is brought into
relation to the average (median) time for the entire sample. Thus, for every page, and
summed up for every respondent, an index figure results, which is reported as a
quality variable. Here the value 0.5 expresses that the respondent needs exactly the
same answering time as the sample average, and 0.25 means that only half of the
average time was needed. DORKA (2012) for instance used a threshold of 0.1 to ex-
clude concerned cases.883 For this research project the 0.1 threshold would be too
liberal, because various speed test and the data of the pre-test show that the abso-
lute completion time of the respondents around the 0.1 threshold is too short to be
realistic in terms of answering the entire questionnaire seriously. Therefore, a thresh-
old of 0.2 was chosen, which is considered strict, but nonetheless is not in danger of
excluding very fast respondents. Due to this quality control 27 cases were excluded.
Second, important aspects are missing values or missings, which occur when a re-
cipient has not answered, and it was not defined as a must question. It should be de-
termined whether a case has very many missings, and whether a particular construct
is related to many missing. With regard to the first aspect, HAIR ET AL. (2014b) state
that it is typical to remove the case if 15% of the questionnaire´s answers are miss-
ing.884 One such case was removed from the data. Regarding the second aspect, the
high proportion of missings on a single construct, no issues occur, because all con-
structs were related to less than the small amount of 4% missings. However, it also
must be considered, how missing values within the analysable cases are treated.
Generally, to some extent missing data is not avoidable and no missing data treat-
ment is perfect, but some are more suitable than others, depending on the given con-
text and the data set.885 Today, numerous sometimes very complex approaches exist,
883 Cf. Dorka (2012), pp. 238 f. 884 Cf. Hair et al. (2014b), p. 51. 885 Cf. Newman (2014), pp. 372 ff.

Research Design
201
to deal with missing data, but HAIR ET AL. (2014b) recommend for PLS-SEM to
make use of one of the following three methods: mean replacement, case-wise dele-
tion or sometimes named list-wise deletion, as well as pairwise deletion.886 The rec-
ommendation for this often applied (simple) method is based on the following state-
ment, which refers to complex methods. ‘(…) as knowledge on their suitability in a
PLS-SEM context is scarce, we recommend drawing on methods described above
when treating missing values in PLS-SEM analyses.’887 However, today mean re-
placement is heavily criticised, which is why in this study the conservative case-wise
deletion approach is used. Moreover, with regard to the existing data, test-
comparisons showed that actually only very small differences exist between the two
methods. The similarity across approaches is very likely a result of the extremely low
rate of total missing (0.49%).
Third, the number of survey participants is reduced through the embedded filter
questions. In this survey, nationality, brand and service experience are crucial filters.
Because this research refers to Chinese consumers living in the Peoples Republic of
China (mainland), one case was deleted. Additionally, 20 respondents were
screened out, as they did not have the required brand-related service experience.
Fourth, outliers are considered. Outliers, appearing as extreme values, do not exist in
rating scales, but in free answerable input fields such as age. Here, the data was
questioned by logical thinking as for instance age, in internet surveys, is very unlikely
of three digits. Unusual inputs might be a result of typing errors. Within the survey da-
ta five cases are identified as highly irregular. As a result these figures were changed
to the value of zero, which expresses a missing value (s. above). All these cases oc-
curred with regard to the construct of acceptable workshop distance.
Fifth, data distribution characteristics are considered. Generally, PLS is a nonpara-
metric statistical method, which means that it does not require normally distributed
data. But, the assessment of parameter significances can lack a superior quality, if
the data is extremely non-normal distributed. In order to ensure that the given data is
886 An overview about complex missing value imputation methods is given by for instance: Newman
(2014), pp. 372 ff. or Baraldi/Enders (2010), pp. 5 ff. 887 Hair et al. (2014b), p. 52.

Empirical Research
202
suitable, skewness and kurtosis have to be assessed. These two examinations are in
line with the requirements of the PLS-algorithm, thus they are recommended instead
of the popular KOLMOGOROV/SMIRNOV and the SHAPIRO/WILKS tests. The gen-
eral guideline for skewness (extent to which the distribution is symmetrical) and kur-
tosis (a measure of the so-called peakedness of the distribution) is that values above
one or below minus one indicate non-normal distributions.888 However, this threshold
is sometimes doubted and considered to be too conservative, thus even thresholds
of skewness >2 and kurtosis >7 are postulated instead of >1.889 With regard to this
research, only the two hedonism items, and one stimulation item exceed the con-
servative >1 threshold slightly; thus the data is assessed as predominantly normally
distributed. The few non-normal cases are not extremely non-normal, so the entire
data set is very appropriate for PLS-SEM.
Finally, Table 27 shows the field report on the aforementioned aspects, the sample
size and likewise the resulting final data set.
Field Report, Sample Size and Final Data Set Description Concretisation Cases Gross % Net %
Gross Survey Sample 434 100% –
No Reply or Dropouts on the Invitation Page
74 17.05% _
Net Participation 360 82.95% 100%
Screened Out 20 – 5.56%
Dropouts During the Survey 10 – 2.78%
Total Completes 330 76.04% 91.67%
Excluded Cases Due to criterion ‘nationality’ 1 – 0.28%
Due to quality criterion ‘answering time’ 27 _ 7.5%
Due to too many missings per case 1 – 0.28%
Final Data Set Basis for the empirical analysis 301 69.35% 83.61%
Table 27: Field Report, Sample Size and Final Data Set
Reference: Author´s table.
888 Cf. Hair et al. (2014b), p. 54. 889 Cf. Weiber/Mühlhaus (2014), p. 180 and the there cited literature.

Research Design
203
Structure of Sample
The following section deals with the structure of the survey sample. As this survey
uses a sample of the total population, representativeness is an issue. As discussed
in the first Chapter, the data on Chinese consumer behaviour is limited. In fact no
public data about the targeted group of automobile premium customers is available.
Representativeness cannot be assessed directly without this information about the
total population. For cases like this – which are very common in applied research set-
tings – WEIBER/MÜHLHAUS (2014) recommend the use of the ARMSTRONG/-
OVERTON test (1977), which indicates whether there is a non-response-bias. Here,
the assumption is that people who respond late tend to share characteristics with
those who do not respond at all. Thus, groups with regard to the answering date are
established, and early responses are compared with late responses. If the two
groups show significant differences, then the test indicates that findings cannot be
generalised.890
In fact the ARMSTRONG/OVERTON test does not indicate a non-response bias for
the existing data set. Thus, it can be concluded that the findings are sufficiently rep-
resentative for the delimitated object of research. Next, the actual characteristics of
the sample are presented.
The sample of 301 respondents is composed of 66% males and 34% females. As
expected, most of these automobile after-sales service customers are Audi drivers
(57%) followed by BMW (29%) and Mercedes-Benz (14%). Around one-third of the
sample lives in Shanghai. The two second biggest home provinces are Beijing and
Guangdong, both at 19%. Customers from Zhejiang account for 5%, and every other
home province is represented by less than 5%. However, the variety from these other
places is large (26%), thus in contrast to other studies – where often students are
surveyed – this sample contains a widespread regional distribution.891
890 Cf. Weiber/Mühlhaus (2014), pp. 376 f.; Armstrong/Overton (1977), p. 396 ff. 891 Cf. for instance Knörle (2011), p. 179.

Empirical Research
204
Figure 30: Gender, Brand and Home Province Distribution
Reference: Author´s illustration.
The youngest respondent of the sample is 19 and the oldest 57, which shows that
online surveys in China are not limited to the young. The average age of respondents
is 34 and the group distribution as follows:
• Younger than 20 ! 2 (0.66%)
• Older than 20 ! 87 (28.90%)
• Older than 30 ! 145 (48.17%)
• Older than 40 ! 60 (19.94%)
• Older than 50 ! 7 (2.33%)
With regard to income levels, five subgroups or segments are predefined on the ba-
sis of the annual household income: poor, value, mainstream, affluent and very afflu-
ent. The income structure of the actual sample is presented below, however, the un-
derrepresentation of customers in the poor and value groups is obviously logical, as
the object of research is delimitated to premium car drivers.
• Very affluent > 75,000$ > (435,000 CNY) ! 50 (16.61%)
• Affluent > 34,000$ > (212,000 CNY) ! 139 (46.18%)
• Mainstream > 16,000$ > (99,000 CNY) ! 87 (28,90%)
• Value > 6,000$ > (37,500 CNY) ! 22 (7,31%)
• Poor < 6,000$ < (37,500 CNY) ! 3 (1%)

Data Evaluation
205
5.3 Data Evaluation
This section starts with some general conditions of the proper use of PLS-SEM, and
the exhibition of the path model. It is significant that the quality control of measuring
models is considered to be crucial and mandatory, in order to conduct the causal
analysis, which is why it follows that the evaluations of reflective measuring models,
formative measuring models, and finally, of the structural model should take place in
separate chapters.
General Conditions
Generally, the entire data set of 301 cases is statistically evaluated by PLS-SEM with
the Smart-PLS Version 3.2.1 software package. The following settings are applied,
for conducting the PLS-algorithm, bootstrapping, blindfolding, etc.:
• Path Weighting Scheme • Bootstrapping Subsamples: 5000
• Max. Iterations: 1000 • No Sign-Changes
• Stop Criterion: 10-5 • Bias-Corrected and Accelerated Bootstrap
• Casewise Deletion • Blindfolding Omission Distance: 8 and Cross-Validated Redundancy
PLS path model
When PLS-SEM is applied, a multi stage process has to be performed, which con-
tains the specification of inner and outer models. This operationalisation specification
was already completed in Chapter 4 and 5.2.2, thus this elaboration is the basis for
the path model. However, particularly the cultural aspects – which are operational-
ised as individual level values – have to be aligned properly to statistical require-
ments. If the ten values were modelled directly, this would lead to a huge complexity,
and therefore might affect the statistical explanation power negatively.892 For in-
stance, the R2 rises in complex models, when too many paths are pointing toward a
target construct.893 Moreover, with regard to measuring specificity, it is recommended
that predictor and latent variable should share the same level of abstraction.894 When
892 Cf. Wetzels et al. (2009), p. 178. 893 Cf. Hair et al. (2014b), p. 176. 894 Cf. Wetzels et al. (2009), p. 178.

Empirical Research
206
it comes to the modulation of individual level values, therefore, higher-order con-
structs will be applied. Higher, hierarchical or second-(third-/fourth-)order constructs
are considered to be beneficial, because they reduce complexity, lead to theoretical
parsimony, prevent confounding effects in multidimensional models, and allow the
abstraction level for predictor and criterion variable to be matched.895 Additionally,
LAW ET AL. (1998) state that ‘(…) treating dimensions as a set of individual varia-
bles precludes any general conclusion between a multidimensional construct and
other constructs.’896 Generally, hierarchical or multidimensional constructs can be de-
fined as constructs involving more than one dimension.897
Due to the previously mentioned points, and because the ten individual level values
are considered to be theoretically distinct dimensions, four second-order constructs
are implemented in the path-model as auxiliary variables. These latent variables are
named ‘Culture1–4’. BECKER ET AL. (2012) provide particular guidelines – which
are strictly applied here – for modelling reflective-formative second-order constructs,
which is the appropriate structure for the intended path model, because the ten val-
ues are causal in regard to the auxiliary variables.898 Technically, for every target var-
iable (perceived service quality, after-sales service satisfaction, workshop loyalty,
brand loyalty), one auxiliary variable, ‘Culture’, is used. Thus, via total effects every
individual level value can be identified as a separate influence with its distinct param-
eters, such as strength of path coefficients. In contrast, if only one auxiliary variable
were used, all total effects would be calculated with the input values of the same
score of the individual level value of interest (not distinctly dependent on the related
target variable).
As shown in Figure 31, the lower-order constructs are measured reflectively, and the
second-order construct is measured formatively. Likewise the relationship between
the two layers is, in conformance to theory, considered formative, because the first-
order constructs are structured as independent variables explaining the second-order
895 Cf. Marcoulides et al. (2009), p. 172; Hair et al. (2014a), p. 115. 896 Law et al. (1998), p. 749. 897 Cf. Wetzels et al. (2009), p. 178 and the there cited literature. 898 Cf. Becker et al. (2012), pp. 359 ff. This reference specifically addresses reflective-formative higher
order constructs. Some main ideas and basics regarding this paper are discussed by Petter et al. (2012), p. 359; Wetzels et al. (2009), pp.177 ff.; Jarvis et al. (2003), pp. 199 ff.

Data Evaluation
207
construct, ‘Culture’ (dependent variable). In the case of both layers, the same indica-
tors are used to measure, and it is important that the number of indicators on both
layers is equal. Moreover, each of the first-order constructs has to be measured by
the same number of indicators. (This approach is called the repeated indicator ap-
proach, which is recommended in reflective-formative relationships.)899 As a result,
the lowest loading item of the construct of universalism is omitted (UNIV_3_v_159).
Reducing the number of items measuring universalism to two, does not interfere with
analysis, because the indicators are reflective, and therefore interchangeable. In par-
ticular, the postulated multi-item measuring approach holds true.
Finally, taking all these into account, the remarks by BECKER ET AL. (2012) on the
changing meaning of loadings and weights in hierarchical-order constructs are em-
phasised. ‘What distinguishes the assessment of higher-order constructs from that of
first-order constructs is the role of the weights and loadings in the analysis: they are
not obtained from the relations between higher-order construct and manifest varia-
bles, but are obtained from the relations between higher-order construct and lower-
order constructs. This distinction is especially important if the repeated indicator ap-
proach is used, as the weights and loadings are now represented by the path coeffi-
cients between higher-order and lower-order constructs, and not by the manifest in-
dicators that are repeated at the construct level.’900 Figure 31 illustrates in detail the
second-order concept. In regard to this figure and to both following, the full names of
indicator abbreviations can be found in Table 24.
899 Cf. Becker et al. (2012), pp. 363 ff.; Hair et al. (2014b). pp. 230 ff. 900 Becker et al. (2012), p. 378.

Empirical Research
208
Figure 31: Reflective-Formative Second-Order Model
Reference: Author´s illustration.
With regard to the testing of the hypotheses, the hierarchical modulation enables the
assessment of whether the construct of interest is generally affected by values, and
additionally by what values, with what relative effect; indicated by the total effect of
the path. Finally, it must be mentioned that using this reflective-formative second-
order concept requires the use of the factor- or path-weighting scheme; as previously
shown, the latter is applied in this research. With regard to the quality evaluations,
the same criteria for assessing measurement models must be met, as generally rec-
ommended for constructs and paths in PLS-path models.901 Building up on the con-
cepts mentioned above, the resulting technically required path model is shown in
Figure 32.
901 Cf. Hair et al. (2014b), p. 231.

Data Evaluation
209
Figure 32: Technically Required PLS Path Model including the Measuring Items
Reference: Author´s illustration.
In order to deliver a clear report, a simplified path model without measuring items,
and with just one symbolic auxiliary variable, ‘Culture1–4’, is presented in Figure 33,
and used afterwards, as well. The relationships (arrows) of the constructs of interest
visualise the hypotheses, which will be tested empirically (cf. Figure 25).

Empirical Research
210
Figure 33: PLS Path Model
Reference: Author´s illustration.
When the path model is established, the next required step is to evaluate the outer
measuring models, which is done in the following two Chapters. Here, it is crucial to
distinguish between reflectively and formatively measured constructs.902 Afterwards
in Chapter 5.3.3 the structural model is evaluated. All required evaluations are dis-
cussed in detail in the chapters mentioned. Additionally, it must be considered that
the construct acceptable workshop distance is measured by only one item. This ap-
proach is applicable, but comes with some limitations. As a result, some quality crite-
ria cannot be applied. Consequently this is marked n/a (‘not applicable’).
Table 28 provides an overview of all required tests, applied thresholds, and their se-
quence.
902 Cf. Hair et al. (2014a), pp. 109 f.; Diamantopoulos/Winkelhofer (2001), pp. 269 ff.; Chapter 5.2.2.1,
Specification of Measuring Models.

Data Evaluation
211
Systematic Evaluation of PLS-SEM Results Evaluation of the Measuring Models
Chapter 5.3.1, Reflective Measurement Models Chapter 5.3.2, Formative Measurement Models
Internal Consistency • Composite Reliability
• ρc= 0.7-0.9
Content Validity
Evaluation of the underlying theory
Convergent Validity • Indicator Reliability
(Significance) • Average Variance Extracted
• >0.708
(α 0.05 level) • >0.5
Multicollinearity among Indicators (VIF)
<3.3
Discriminant Validity • No Cross Loadings • Fornel-Larcker-Criterion
• Distance>0.1 • √AVE>Φ
Significance and Rele-vance of Outer Weights (If weights are not Signifi-cant ! Outer Loadings)
t-value>1.96
>0.5
Chapter 5.3.3, Evaluation of the Structural Model Multicollinearity Testing VIF<3.3
Size and Significance of Path Coefficients β>0.1 & t-value>1.96 (1.65)
Coefficient of Determination (R2) Min. >0.25; >0.5; >0.75
ƒ2 Effect Size Min. >0.02; >0.15; >0.35
Cross-Validated Redundancy (Q2) >0
q2 Effect Size Min. >0.02; >0.15; >0.35
Table 28: Systematic Evaluation of PLS-SEM Results
Reference: Author´s table referring to Hair et al. (2014b), p. 97; The quality criteria references are provided in the following Chapters at each relevant place.
5.3.1 Evaluation of Reflective Measuring Models
The quality control of reflective measurement models is divided in first- and second-
generation criteria. Both reliability903 and validity904 have to be tested. First-genera-
tion criteria are mainly correlation-based reliability tests. Due to problems such as
that measuring errors cannot be estimated, it is strictly required to apply criteria of the
second generation. They are based on confirmatory factor analysis and allow a varie-
ty of validity tests and the consideration of measuring errors.905 Within the next sec-
tions, every evaluation approach is explained, and applied thresholds are presented.
903 ‘Reliability: is the consistency of a measure. A measure is reliable (…) when it produces consistent
outcomes under consistent conditions’ Hair et al. (2014b), p. 116. 904 ‘Validity: is the extent to which a construct’s indicators jointly measure what they are supposed to
measure.’ Hair et al. (2014b), p. 116. 905 Cf. Weiber/Mühlhaus (2014), pp. 128 ff.; Hair et al. (2014b), pp. 97 ff.

Empirical Research
212
The exhibition of all testing results closes this section with a summarising table, in
order to provide a comprehensive overview (s. Table 29).
Internal Consistency Reliability
When it comes to SEM reliability testing, often a first-generation approach, the
Cronbach´s α reliability test is used, in order to assess reliability via internal con-
sistency.906 However, this is not without criticism. For instance, the threshold value is
debated. Generally 0.7 is recommended,907 but on the other hand some researchers
apply thresholds down to 0.4, and argue well for them.908 According to CHIN (1998)
Cronbach’s α might not be the best choice in terms of reliability testing or internal
consistency. He states, with regard to composite reliability, ‘In comparison to Cron-
bach´s alpha, this measure does not assume tau equivalency among the measures
with its assumption that all indicators are equally weighted. Therefore, alpha tends to
be a lower bound estimate of reliability, whereas (..) [composite reliability] is a closer
approximation under the assumption that the parameter estimates are accurate.’909
With regard to the issues mentioned, it is advisable to apply composite reliability (CR)
tests – a second-generation approach – to evaluate the construct measures’ internal
consistency, because it overcomes major limitations, such as the assumption of
equal outer loadings,910 and as it is ‘in line with the working principle of PLS-SEM’.911
CR values can vary between zero and one, and according to various authors, reliabil-
ity is given, if the threshold of 0.7 is reached.912 Sometimes a value of 0.6 is pro-
posed as acceptable,913 but as this recommendation is based on BAGOZZI/YI (1988),
it should only be used in exploratory research settings.914 Moreover, values above
0.9 and for sure above 0.95 indicate that all indicators measure the same phenome-
non, and thus are not valid measures of the construct. In this research project the
906 Cf. Straub et al. (2004), pp. 411 ff.; Weiber/Mühlhaus (2014), p. 135 ff. 907 Cf. ibidem. 908 Cf. Sobotta (2012), pp. 171 f.; Flake (2001), p. 201; Peter (1997), p. 180. 909 Chin (1998), p. 320. 910 Cf. Hair et al. (2014a), p. 111; Lowry/Gaskin (2014), pp. 136 f.; Wong (2013), p. 6/22. 911 Hair et al. (2014a), p. 111. 912 Cf. Hair et al. (2014a), p. 111; Lowry/Gaskin (2014), pp. 136 f.; Wong (2013), p. 6/22. 913 Cf. Weiber/Mühlhaus (2014), p. 150; Hair et al. (2014b), p. 102. 914 Cf. Wong (2013), p. 21.
Data Evaluation
213
conservative range – initially suggested by NUNALLY/BERNSTEIN (1994) – of 0.7 to
0.9 is considered to be appropriate.915
• The CR test shows that all reflective items are within the mentioned range,
with values between 0.812 (SEC) and 0.9 (ASSS).
Convergent Validity
Convergent validity expresses how much one measuring item of a construct corre-
lates positively with the other items of this construct. As measuring items of reflective
constructs are interchangeable or in other words different approaches can measure
the same construct, they should share a high proportion of variance. With regard to
convergent validity, two tests have to be done. First, the indicator reliability by as-
sessing the indicator´s outer loadings; and second, the average variance extracted
(AVE). If any test shows a lack, it might be necessary to remove an item.916
With regard to indicator reliability, high outer loadings on a construct show that the
indicators have much in common. The recommended minimal threshold is 0.708, be-
cause in this case the shared variance between the construct and its indicators is
larger (>50%) than the measurement error variance.917 Additionally, outer loadings
must be statistically significant, which can be proved by t-statistics.918 Smart-PLS
generates t-statistics as a result of resampling method called bootstrapping.
• The evaluation shows that all indicators have outer loadings above 0.708. The
lowest value is 0.761 for BI_3_v_66 and the highest 0.912 for ASSS_2_v_27.
Likewise, all outer loadings are highly significant on an α 0.01 level.
Additionally, as initially mentioned, the construct level must be focused. Here, the cri-
terion average variance extracted (AVE) is suitable.919 AVE is defined as the ‘grand
mean value of squared loadings of the indicators associated with the construct (i.e.,
the sum of squared loadings divided by the number of indicators)’.920 As a result – as
915 Cf. Hair et al. (2014b), p. 102 and the there cited literature. 916 Cf. Hair et al. (2014b), pp. 102 ff. 917 Cf. ibidem, p. 102 f. ; Chin (2010), p. 674; Krafft et al. (2005), p. 73. 918 Cf. Lowry/Gaskin (2014), pp. 135 f.; Hair et al. (2014b), p. 102; Gefen/Straub (2005), p. 93. 919 Cf. Krafft et al. (2005), pp. 74 f. 920 Hair et al. (2014b), p. 103.

Empirical Research
214
with indicator reliability – an AVE of 0.5 or higher expresses that the construct ex-
plains more than 50% of the variance of its indicators.921
• The AVE evaluation shows that all constructs far exceed the requirement, with
values between 0.664 (BI) and 0.819 (ASSS).
Discriminant Validity
Discriminant validity has to be tested, because this makes it possible to show to what
degree a single construct is empirically distinct from the others. Thereby, one option
is to check the indicator´s cross loadings.922 Discriminant validity is indicated when
the loadings of each indicator on the related construct are higher than cross loadings
on other constructs. GEFEN/STRAUB´s (2005) proposal is a bit stricter, because
they suggest that the cross loadings should be discriminant by at least a magnitude
of 0.1 to indicate discriminant validity. Their threshold is applied in this project.923
• As a result, discriminant validity is indicated, because no such cross loadings
exist. A detailed table of cross loading values is shown in Appendix 3.
However, the cross loading approach is considered to be relatively liberal,924 which is
why HAIR ET AL. (2014b) recommend the usage of the FORNELL/LARCKER-crite-
rion; established in 1981. Thereby, it is tested, whether the construct has a greater
shared variance with its indicators than with any other construct of the model.925 To
test this requirement, the square root of each construct´s AVE should be higher than
the highest correlation with any other construct.926
• The execution of the FORNELL/LARCKER test indicates strongly, discriminant
validity for all constructs. The related table is shown in detail in Appendix 4.
As a result of all evaluations in accordance to reflective measuring models, all criteria
are very well fulfilled. Thus internal consistency, convergent validity and discriminant
validity are established. Which likewise means that no indicator has to be dropped.
Table 29 shows an overview of all the criteria mentioned. 921 Cf. Hair et al. (2014a), pp. 111 f.; Weiber/Mühlhaus (2014), p. 155; Fornell/Larcker (1981), p. 46. 922 Cf. Chin (2010), p. 673. 923 Cf. Gefen/Straub (2005), p. 93 f. 924 Cf. Hair et al. (2014b), p. 105. 925 Cf. Weiber/Mühlhaus (2014), p. 165; Hair et al. (2014a), p. 112; Gefen/Straub (2005), p. 94. 926 Cf. Hair et al. (2014a), p. 112; Fornell/Larcker (1981), p. 46.

Data Evaluation
215
Overview of the Evaluation of Reflective Measuring Models
Criteria Composite Reliability
Indicator Reliability
T-Statistics (Significance) AVE No Cross
Loadings
Fornell-Larcker-Criterion
Requirement Level ρc= 0.7-0.9 >0.708 >1.96 >0.5 >0.1 √AVE > Φ
Construct Item
After-Sales-Service Satisfaction
ASSS_1_v_26 0.9
0.898 63.657*** 0.819
√ √
ASSS_2_v_27 0.912 88.632*** √ √
Workshop Loyalty
WL_1_v_54 0.89 0.903 60.896*** 0.802 √ √
WL_2_v_55 0.888 51.080*** √ √
Brand Loyalty BL_1_v_59
0.875 0.846 34.958***
0.701 √ √
BL_2_v_60 0.822 34.678*** √ √ BL_3_v_61 0.844 38.651*** √ √
Brand Image BI_1_v_64
0.856 0.869 52.519***
0.664 √ √
BI_2_v_65 0.812 29.197*** √ √ BI_3_v_66 0.761 27.889*** √ √
Perceived Workshop Switching Costs
PWSC_1_v_44 0.855
0.887 51.517*** 0.747
√ √
PWSC_2_v_45 0.841 24.450*** √ √
Self-Direction SED_1_v_78
0.866 0.870 46.293*** 0.763 √ √ SED_2_v_88 0.877 47.218*** √ √
Universalism UNI_1_v_80
0.881 0.884 55.554*** 0.788 √ √ UNI_2_v_85 0.891 56.416*** √ √
Benevolence
BEN_1_v_152 0.841
0.880 46.416*** 0.726
√ √
BEN_2_v_158 0.823 24.803*** √ √
Tradition TRA_1_v_86
0.837 0.885 36.801***
0.720 √ √
TRA_2_v_160 0.811 18,445*** √ √
Conformity CON_1_v_84
0.835 0.821 22,139***
0.716 √ √
CON_2_v_156 0.871 42,613*** √ √
Security SEC_1_v_82
0.812 0.826 21,312***
0.683 √ √
SEC_2_v_154 0.827 25,256*** √ √
Power
POW_1_v_79 0.839
0.867 31,677*** 0.723
√ √
POW_2_v_157 0.834 23,423*** √ √
Achievement ACH_1_v_81
0.872 0.885 51,561***
0.773 √ √
ACH_2_v_153 0.874 42,773*** √ √
Hedonism HED_1_v_87
0.876 0.878 38,782***
0.779 √ √
HED_2_v_161 0.887 43,781*** √ √
Stimulation STI_1_v_83
0.865 0.905 66,257*** 0.762 √ √ STI_2_v_155 0.840 28,529*** √ √
Significance Level *p≤0.1; **p≤0.05; ***p≤0.01
Table 29: Overview of the Evaluation of Reflective Measuring Models
Reference: Author´s table.

Empirical Research
216
5.3.2 Evaluation of Formative Measuring Models
Due to the different concept of formative measuring models, uncorrelated indicators
represent the causes for the latent variable, thus different evaluation criteria have to
be used (s. Table 28). In the path model of this study, perceived service quality and
the auxiliary variables Culture1–4 are formatively measured constructs, which is why
they are evaluated in detail below.
Content Validity and Collinearity Among Indicators
First, content validity should be assessed, because it must be ensured that the bun-
dle of indicators captures all facets of the construct.927 This kind of content specifica-
tion is already done in the conceptual part in Chapter 4.4.2.1, and perceived service
quality is a well-known intensively researched construct, which is why the set of indi-
cators is considered to fully exhaust the content domains. Second, the empirical
evaluation has to be done, starting with testing collinearity issues. Because more
than two indicators are used to measure perceived service quality, the correlation be-
tween indicators is called multicollinearity, and is problematic, as formative indicators
are independent of each other, explaining different aspects of the construct. Multicol-
linearity harms the estimation of the weights and their significance.928
To assess multicollinearity two aspects can be tested, namely the tolerance (TOL=
amount of tolerance of one formative indicator not explained by other indicators) and
the variance inflation factor (VIF). By definition the VIF is the reciprocal of the toler-
ance: VIFx1 = 1/TOLx1.929 With Smart-PLS 3 both aspects can be calculated, but due
to their interchangeability only the VIF is reported. The threshold for substantial mul-
ticollinearity issues is at VIF values above 5, because this indicates that 80% of the
formative indicator´s variance is expressed by the other indicators of the construct of
interest. In this case one must consider removing the indicator.930 Sometimes a very
927 Cf. Hair et al. (2014b), p. 119; Diamantopoulos/Winkelhofer (2001), pp. 271 f. 928 Cf. Diamantopoulos/Winkelhofer (2001), p. 272. 929 Cf. Hair et al. (2014b), pp. 124 f.; Lowry/Gaskin (2014), p. 137. 930 Cf. Hair et al. (2014b), p. 125.

Data Evaluation
217
conservative VIF threshold of 3.3 is recommended, and still the traditional, but loyal
threshold of 10 is mentioned.931
• The particular evaluation shows that the highest VIF value is 2.820 and thus
all indicators are well below the common threshold of 5, and the conservative
one of 3.3.
Significance and Relevance of Outer Weights
Second, because no multicollinearity issues exist, significance of the outer weights,
and the absolute and relative contribution (relevance) have to be analysed. In order
to do this, the bootstrapping procedure is conducted so that every indicator´s weight
(relative relevance) can be assessed with regard to its significance. However, a non-
significant indicator is not necessary unimportant, thus if an outer weight is non-
significant, the outer loading has to be assessed. If the outer loading is above 0.5 the
indicator is considered to be absolutely important, but not relatively important. As a
result it must be retained. Finally, formative indicators should never be eliminated on-
ly on the basis of pure statistics; the theory must always be evaluated simultaneously,
if such a case occurs.932
• The outer weights of the construct of perceived service quality are, with two
exceptions, significant on an α 0.05 level. Only PSQ_7_v_185 and PSQ_3-
_v_7 fail with a t-value of 0.703 and 1.793. However, the outer loadings of
0.596 and 0.624 (both significant on an α 0.001 level) and the theoretical con-
tribution (adding important content dimensions) clearly indicate that these indi-
cators should be retained, even they appear to be making more of an absolute
than a relative contribution.
• The outer weights of the second-order constructs Culture1–4 are almost all
non-significant on the α 0.05 level. However, the elimination of non-significant
indicators would clearly be the wrong decision. First, because the measuring
indicators of the second-order construct are the first-order latent variables,
which fulfil all evaluation criteria very well (cf. Chapter 5.3.1). Second, the VIF
analysis strongly indicates to retain all indicators. Third, the well-grounded
931 Cf. Weiber/Mühlhaus (2014), p. 263; Lowry/Gaskin (2014), p. 137. Diamantopolous/Siguaw (2006),
p. 270; Petter et al. (2007), p. 641. 932 Cf. Hair et al. (2014b), pp. 126 ff.; Weiber/Mühlhaus (2014), pp. 265 f.; Diamantopolous/Siguaw
(2006), p. 276.

Empirical Research
218
theory of individual level values by SCHWARTZ strongly rules against discard-
ing any indicator. Finally, in this context, it must be emphasised that the se-
cond-order hierarchical construct is an auxiliary variable, used to keep the
path-model of parsimony. Partly, the content of the inherent facets is contrary,
but this does not matter, because it is not the auxiliary construct culture that
has to be explained. Indeed, the focus is on the total effect of the first-order
constructs on the targeted latent variables, such as perceived service quality.
As a result the no indicator is discarded. Nonetheless, for the sake of com-
pleteness, the significance assessment is presented in Table 30.
As a final result of all evaluation criteria, all formative measuring indicators are re-
tained. The pure statistical figures are shown in detail in Table 30.

Data Evaluation
219
Overview of the Evaluation of Formative Measuring Models Criteria VIF Outer Weight t-value
Requirement Level <3,3 n/a 1.96
Construct Indicator
Perceived Service Quali-ty
PSQ_1_v15 1.382 0.142** 2.032 PSQ_2_v13 1.583 0.280*** 3.947 PSQ_3_v_7 1.565 0.108* 1.793 PSQ_4_v_8 1.565 0.199*** 2.963 PSQ_5_v_9 1.914 0.206*** 2.766 PSQ_6_v_10 2.058 0.147** 2.059 PSQ_7_v_185 1.875 -0.047 0.703 PSQ_8_v_11 1.500 0.234*** 3.481 PSQ_9_v_14 1.718 0.184*** 2.773
Culture1
ACH 2.513 -0.225 1.384 BEN 2.679 0.058 0.333 CON 2.366 0.212 1.586 HED 2.595 0.169 1.031 POW 1.748 -0.021 0.171 SE-D 2.820 0.311** 2.041 SEC 1.898 0.190 1.436 STI 1.931 0.231 1.621 TRA 1.691 -0.075 0.701 UNI 2.563 0.340** 2.319
Culture2
ACH 2.513 -0.116 0.584 BEN 2.679 0.261 1.239 CON 2.366 0.020 0.109 HED 2.595 0.079 0.383 POW 1.748 0.048 0.325 SE-D 2.820 0.200 1.035 SEC 1.898 0.190 1.175 STI 1.931 0.036 0.193 TRA 1.691 -0.146 1.119 UNI 2.563 0.565*** 3.171
Culture3
ACH 2.513 0118 0.706 BEN 2.679 0.174 0.840 CON 2.366 0.016 0.102 HED 2.595 0.012 0.075 POW 1.748 0.003 0.025 SE-D 2.820 0.281 1.603 SEC 1.898 0.174 1.126 STI 1.931 0.026 0.169 TRA 1.691 -0.157 1.261 UNI 2.563 0.482*** 2.904
Culture4
ACH 2.513 0.093 0.665 BEN 2.679 -0.060 0.388 CON 2.366 0.048 0.323 HED 2.595 -0.074 0.600 POW 1.748 0.147 1.336 SE-D 2.820 0.400*** 2.950 SEC 1.898 0.163 1.331 STI 1.931 0.164 1.271 TRA 1.691 0.224* 1.937 UNI 2.563 0.202 1.487
Significance Level *p≤0.1; **p≤0.05; ***p≤0.01
Table 30: Overview of the Evaluation of Formative Measuring Models
Reference: Author´s table.

Empirical Research
220
5.3.3 Evaluation of the Structural Model
The operationalisation of all constructs was proved in the previous section, therefore
now, the quality of the structural model can be assessed. In order to do this, initially,
it must be emphasised that PLS-SEM does not provide a goodness-of-fit criterion as
with CB-SEM. Instead, various single evaluations have to be performed, and they
must be interpreted in total to understand the entire context on which the structural
model is finally assessed.933 The key criteria to evaluate the structural model are: the
significance of the path coefficients, the level of R2 values, the f2 effect size, the pre-
dictive relevance Q2 and the q2 effect size.934 Beyond these key criteria, HAIR ET AL.
(2014a;b) strongly recommend beginning with a collinearity assessment of the struc-
tural model; particularly if the path model contains formatively measured con-
structs.935 The evaluation of the path coefficients will be conducted after the general
assessment of the model, because one also has to empirically test the postulated
hypothesises; which will be discussed in Chapter 5.4.1.
Collinearity Issues of the Structural Model
The evaluation starts by assessing collinearity. Here, the same measures and thresh-
olds as those that are relevant for formative measuring models can be applied (s.
Chapter 5.3.2), thus VIF values below five or very conservative below 3.3 are consid-
ered to be suitable. In fact every predictor construct must be checked separately.936
• Actually all predictor constructs have VIF values below the conservative
threshold of 3.3. The highest VIF value of the entire model (2.82) is the VIF of
Culture1–4 and their relation to SE-D. The detailed VIF table for the structural
model is presented in Appendix 5.
Coefficient of Determination (R2)
The coefficient of determination R2 is the most often used measure for the structural
model; showing the model´s predictive accuracy. It is calculated by the squared cor-
933 Cf. Hair et al. (2014b), pp. 168 f. 934 Cf. ibidem, p. 169; Weiber/Mühlhaus (2014), pp. 326 ff.; Chin (2010), pp. 674 ff.; Krafft et al. (2005),
pp. 83 ff. 935 Cf. Hair et al. (2014a), p. 113. 936 Cf. Hair et al. (2014b), p. 170.

Data Evaluation
221
relation of the actual and predicted values of an endogenous construct. Due to that,
the R2 also shows the variance of a construct explained by its predecessor con-
structs. This measure ranges from zero to one, where higher values indicate a higher
predictive accuracy.937 In marketing-related or success-driver studies commonly the
R2 thresholds 0.75, 0.5 and 0.25 are considered to be substantial, moderate and
weak, respectively.938 Notably, lower thresholds are also applied, even in the men-
tioned field.939 However, relying on a conservative approach, the first-mentioned
stricter thresholds are used here.
• All endogenous constructs of the path model have sufficient R2 values, where
satisfaction and loyalty constructs show a moderate predictive accuracy. The
perceived service quality has the lowest R2 value with 0.361, which is consid-
ered to be weak, but satisfactory.
• An R2 evaluation of the variables Culture1–4 is not required, because these
auxiliary variables do not claim to explain culture. They are just used to
properly model the total effects of individual level values. Thus, no R2 values
are interpreted and reported.940
In order to give an additional overview, the R2 compound is addressed. The R2 con-tribution of every exogenous construct can be calculated with regard to a specific en-dogenous construct by multiplying the correlation with the path coefficient. The sum of all these calculations is the R2 of the endogenous variable. This split is shown in Table 31, where figures are rounded, and therefore may slightly vary from the original (total) R2, which is presented in the first row.
937 Cf. Hair et al. (2014b), pp. 174 f.; Chin (2010), pp. 674 f. 938 Cf. Hair et al. (2011), p. 147. 939 Cf. Hünecke (2012), p. 120; Sobotta (2012), p. 182. 940 Technically the R2 of Culture 1–4 is almost one, because the second-order auxiliary variable is –
theory conform – fully explained by its first-order constructs.

Empirical Research
222
R2 Distribution After-Sales Service
Satisfaction Workshop Loyalty Brand Loyalty
Total R2 0.633 0.643 0.648 Culture1–4 0.5% 8.7% 14.8% AWD 0.0% 0.2% BI 9.9% 10.4% 10.5% PSQ 52.8% PWSC 0.8% 17.6% ASSS 44.3% WL 21.9%
Table 31: R2 Distribution
Reference: Author´s Table.
ƒ2 Effect Size
In addition to the coefficient of determination, the effect size f2 is highly valuable, in
order to evaluate the model properly. The f2 determines the substantive impact (ef-
fect size) of an exogenous variable on an endogenous variable. Thereby, the R2 val-
ue is calculated twice, once by omitting the exogenous variable from the model, and
once by taking it into account. Thus f2 provides information about whether the omitted
construct has a substantive effect on the endogenous variable. Likewise, thresholds
0.02, 0.15 and 0.35 ‒ initially suggested by Cohen (1988) – indicate small, medium
and large effects sizes respectively.941 Below, the most remarkable effect sizes to-
wards endogenous constructs are mentioned, and likewise summarised in Table 32.
The detailed presentation of all numbers – which includes as well the effect sizes on
Culture 1‒4, takes place in Appendix 6. Because, in contrast to the constant and in
its absolute value not meaningful R2, the relative f 2 values are meaningful and there-
fore reported, as different individual level values are related to distinct effect sizes,
depending on the endogenous construct. However, their meaning is only of im-
portance with regard to the total effects analysed later, and not as quality criteria of
the structural model or, more precisely, of its auxiliary variables.
941 Cf. Hair et al. (2014b), pp. 177 f.; Hair et al. (2012), p. 430; Chin (2010), p. 675.; Krafft et al. (2005),
p. 84.

Data Evaluation
223
• The perceived service quality has only one exogenous latent variable. Actual-
ly, Culture1´s effect size f2 is 0.566, which is considered to be a large effect
size.
• The exogenous variable of perceived service quality has the largest effect size
on after-sales service satisfaction, with an f2 of 0.643. Culture2 and acceptable
workshop distance both fail to reach the minimum f2 threshold of 0.02; thus
they are assessed as effectless.
• With regard to workshop loyalty, the antecedent after-sales service satisfac-
tion is by far the most important, because its effect size is large (0.552). Again,
two exogenous constructs do not exceed the threshold to reach a small effect,
namely the acceptable workshop distance and the perceived workshop switch-
ing costs.
• By contrast, perceived workshop switching costs has the biggest f2 (0.210) on
brand loyalty, and therefore the effect size is classified as a medium.
Cross-Validated Redundancy (Q2)
The predictive relevance of the path model with regard to a particular endogenous
construct is assessed by the cross-validated redundancy measure, Q2. ‘The measure
builds on a sample re-use technique, which omits a part of the data matrix, estimates
the model parameters and predicts the omitted part using the estimates. The smaller
the difference between predicted and original values the greater the Q2 and thus the
model’s predictive relevance.’942 In order to calculate Q2 via SmartPLS 3 the blind-
folding procedure is conducted. 943 Due to the research of STONE (1974) and
GEISSER (1974), the applicable criterion is called the STONE/GEISSER-criterion.944
A Q2>0 indicates that the model has predictive relevance for the particular endoge-
nous construct of interest here. In contrast, values below zero indicate that the model
has no predictive relevance.945 However, the relative quality of prediction cannot be
assessed with the cross-validated redundancy analysis.946 Finally, it must be men-
942 Hair et al. (2014a), p. 113. 943 Cf. Chin (2010), p. 680, An overview about this technique is provided by for instance Hair et al.
(2014b), pp. 178 ff. 944 Cf. Chin (2010), pp. 680 ff. 945 Cf. ibidem, p. 680; Hair et al. (2011), p. 145. 946 Cf. Hair et al. (2014a), pp. 113 f.; Sarstedt et al. (2014), p. 156.

Empirical Research
224
tioned that the Q2 measure is only applicable on reflectively measured latent varia-
bles.947
• Within the path model, all endogenous, reflectively measured constructs ex-
ceed the required >0 threshold very well (s. Table 32).
q2 Effect Size
As mentioned previously the Q2 measure does express anything about the quality of
prediction,948 but analogously to the f2 measure, the q2 effect size can be used as a
representation of the relative impact of one exogenous construct of the structural
model on an endogenous variable.949 The recommended thresholds for the evalua-
tion of the relative impact of the predictive relevance are likewise 0.02, 0.15 and 0.35,
which indicate a small, medium or large q2 effect size on the endogenous latent vari-
able.950 Analogue to Q2, q2 can only be applied at single-item and reflectively meas-
ured, endogenous constructs, thus in Table 32 no figures are shown for PSQ and the
reflective-formative specified second-order constructs Culture1–4.
• BI has no predictive relevance on workshop loyalty, because the minimal q2
threshold is not exceeded. All other relationships are assessed as having a
small q2 effect size on the endogenous constructs of interest in this study.
As a result of the applied evaluation criteria, the structural model is considered to be
pretty good, because it shows predictive accuracy and relevance by well exceeding
all R2 and Q2 requirement levels. Remarkably, the brand loyalty success indicator
has particularly good expressiveness, because 64.8% of the construct´s variance is
explained by its linked endogenous constructs. This section closes with an overview
of all relevant or required quality criteria (s. Table 32). In the table arrows are an ex-
pressions of an exogenous construct´s direction towards the target construct.
947 Cf. Hair et al. (2014b), p. 178. 948 Cf. Sarstedt et al. (2014), p. 156. 949 Cf. Chin (2010), p. 680; Henseler et al. (2009), pp. 303 ff.; Sarstedt et al. (2014), p. 156. 950 Cf. Hair et al. (2014b), p. 184.

Results of the Empirical Assessment
225
Overview of the Evaluation of the Structural Model Criteria R2 f2 Q2 q2
Construct ↓ Requirement Level
Min. >0.25; >0.5; >0.75
Min. >0.02 >0.15; >0.35
>0 Min. >0.02
>0.15; >0.35
Perceived Service Quality 0.361 !ASSS: 0.643 n/a n/a
After-Sales-Service Satisfaction 0.633 !WL: 0.552 0.491 !WL: 0.059
Workshop Loyalty 0.643 !BL: 0.180 0.492 !BL: 0.033
Brand Loyalty 0.648 0.427
Brand Image !ASSS: 0.033
!WL: 0.034 !BL: 0.034
!ASSS: 0.051 !WL: -0.003 !BL: 0.024
Perceived Workshop Switching Costs
!WL: 0.001 !BL: 0.210
!WL: -0.020 !BL: 0.068
Acceptable Workshop Distance !ASSS: 0.000
!WL: 0.003
!ASSS: -0.020 !WL: 0.031
Table 32: Overview of the Evaluation of the Structural Model
Reference: Author´s table.
5.4 Results of the Empirical Assessment
The empirical evaluation of measuring models and of the structural model shows that
this survey, with its applied structural equation modelling approach, fits all the re-
quirements of empirical social research, which is why the hypotheses can be tested
to provide new and valuable scientific knowledge.
5.4.1 Hypotheses Testing
The estimates for structural relationships, the path coefficients (β), represent the hy-
pothesised relationships, which can vary mathematically between -1 and 1 (standard-
ized values). The closer it is to one the stronger is the relationship, the closer to zero
the weaker, and vice versa for negative values. Notwithstanding that strong relation-
ships are mostly significant, every path has to be proved assessing the standard er-
ror with the bootstrapping routine ‒ for instance by using the t-values. In this study
two thresholds are applied. The entire automobile context has to be significant on an
α 0.05 level. As the cultural context is more explorative, here the less conservative,

Empirical Research
226
but often applied, α 0.1 level is used,951 when it comes to testing hypotheses via total
effects. Moreover path coefficients within the model are comparable and therefore
their relevance can be assessed. This is required, because sometimes relationships
with a minor relevance are significant, nonetheless they might be unimportant.952 In
this empirical study – as recommended in HAIR ET AL. (2014b) – only relevant ef-
fects are considered to be sufficient to accept a hypothesis;953 therefore a threshold
for the path coefficient´s strength of 0.1 is applied.954
As a result, hypotheses are rejected for the following reasons. First, if the empirical
relationship has a different direction from the hypothesised one, which is expressed
by an opposing algebraic sign. Second, if the path coefficient´s strength is below 0.1.
Third, if the relationship is not significant. Fourth, if at direct effects the effect size f2 is
not considered to be at least small, which marks the minimum. The effect size f2 for
the total effects is not applicable and therefore marked with n/a. Finally, with regard
to the cultural part, the direct effect of the second-order constructs, Culture1‒4, to-
wards the endogenous constructs is used to test the hypotheses H10-H13. The re-
lated subsequent hypotheses a-k are tested via the total effects of the first-order con-
structs, the individual level values. If – in this hierarchical structure – the main relation
fails to satisfy any of these criteria, the subsequent hypotheses are likewise rejected.
Below, all hypothesised relationships are tested and, at the end of this section, Table
33 gives an overview of all hypotheses. Here, criteria which lead to rejection, are
marked in italics.
• The theoretically postulated positive relationship between after-sales service
satisfaction and workshop loyalty (H1) is empirically confirmed, very strongly,
and highly significantly, on an α 0.01 level.
• H2, which postulates a positive relationship between workshop loyalty and
brand loyalty, is also empirically confirmed, but the path coefficient’s strength
is almost 43% weaker than the relationship H1. Nonetheless, this relationship
is considered to be important.955 Moreover, workshop loyalty is the strongest
driver of the brand loyalty success indicator in the entire path model.
951 Cf. Hünecke (2012), p. 127; Knörle (2011), p. 202; Hair et al. (2014b), p. 138. 952 Cf. Hair et al. (2014b), p. 173; Chin (2010), pp. 676 f. 953 Cf. Hair et al. (2014b), p. 173. 954 Cf. Weiber/Mühlhaus (2014), p. 331; Sobotta (2012), p. 190; Hünecke (2012), p.127. 955 Cf. Weiber/Mühlhaus (2014), p. 326.

Results of the Empirical Assessment
227
• The relationship between perceived service quality and after-sales service sat-
isfaction has the strongest path coefficient (0.673) of the entire model. Conse-
quently H3 is accepted and highly significant.
o Because perceived service quality is measured formatively, additional
information can be derived, to explain which are the most important
drivers of this construct. Such findings are particularly relevant, with re-
gard to managerial implications, because every item is comparable to
the after-sales service instruments of the marketing mix.956
o Remarkably, the price or costs, a dimension that is often considered
crucial, is not the most important driver for perceived service quality in
China. It is only at position seven out of nine.
o The most important aspects are at first convenience with a weight of
0.280, followed by the appearance of the facility (0.234), and third hon-
esty and integrity (0.206).
o The ability to do the job on time is the least important dimension, having
a small negative weight of -0.047 towards perceived service quality.
• Workshop switching costs have been postulated to predict workshop and
brand loyalty, but only the relationship to brand loyalty is significant. As results
H4 is rejected, H5 is accepted, and perceived switching costs can be consid-
ered a relevant antecedent of brand loyalty, as the effect size f2 is medium.
• H6 and likewise the two sub-hypotheses H6a and H6b must be rejected, be-
cause neither a significant relationship, nor any relevant f2 or q2 contribution
exists. This construct does not, in any case, contribute to the research model.
• Brand image contributes with a significant path coefficient of 0.162 and a small
effect size f2 towards after-sales service satisfaction; thus H7 is empirically
confirmed.
• Actually, with similar characteristics H8 and H9 are accepted; thus brand im-
age contributes positively towards workshop and brand loyalty.
• Notably, the success indicator brand loyalty, is the latent variable with the
highest R2 of the entire path model, which means that brand loyalty is ex-
plained by all linked exogenous variables with a variance of 64,8%.
956 Cf. Chapter 4.4.2; All related measures are presented in Table 30.

Empirical Research
228
• Within the culture related hypotheses testing, perceived service quality is the
strongest culturally affected construct. The relationship theorised in H10 is
highly significant and empirically confirmed.
• The detailed view of the subsequent hypotheses, H10a-k, shows that most of
the individual level values do not predict a significant effect on the perceived
service quality. However, H10d is accepted, thus universalism is a value which
is quite relevant (β=0.205) when it comes to perceived service quality. Moreo-
ver self-direction contributes positively with a path coefficient of 0.187, but only
on an α 0.1 level.
• The latent variable, after-sales service satisfaction, is not significantly influ-
enced by any individual level value, so H11 and the subsequent hypothesised
relationships are rejected. Nonetheless, this is valuable information, useful for
determining what parts of the automobile after-sales success chain are influ-
enced by cultural effects.
• Brand loyalty is very significantly influenced by culture, which is why H12 is
accepted. Here, self-direction is the most important individual level value, with
a positive directed path coefficient of 0.136. Likewise, universalism is of rele-
vance (0.101), but on an α 0.1 significance level. The remaining hypotheses,
H12a-c and H12f-k, are rejected, as no empirical support is given.
• Finally, workshop loyalty – as the main driver of the brand loyalty success in-
dicator – is significantly predicted by one individual level value, namely univer-
salism (β=0.158), thus H13 and H13d are accepted. Consequently, the re-
maining sub-hypotheses are rejected, due to their insignificance.
The testing results of all hypotheses are summarised in a comprehensive overview,
which follows in Table 33.

Results of the Empirical Assessment
229
Overview of Hypothesis Testing Criteria
Requirement Level
β ≥0.1
t-value ≥1.96
(≥1.65)
f2
≥small All criteria
fulfilled
No. Hypothesis Result
H1 The higher the after-sales service satisfaction, the higher the workshop loyalty. 0.578*** 7.733 Large Accepted
H2 The higher the workshop loyalty, the higher the brand loyalty. 0.331*** 5.453 Medium Accepted
H3 The higher the perceived service quality, the higher the after-sales service satisfaction. 0.673*** 10.723 Large Accepted
H4 The higher the perceived workshop switching costs, the higher the workshop loyalty. 0.022 0.448 x Rejected
H5 The higher the perceived workshop switching costs, the higher the brand loyalty. 0.305*** 5.720 Medium Accepted
H6 There is a relationship between acceptable workshop distance and after-sales service sat-isfaction or workshop loyalty.
x x x Rejected
H6a
The shorter the acceptable workshop distance (AWD), the higher the after-sales service satisfac-tion.
-0.003 0.143 x Rejected
H6b The shorter the AWD, the higher the workshop loy-alty. 0.031 1.032 x Rejected
H7 The higher the brand image, the higher the af-ter-sales service satisfaction. 0.162** 2.523 Small Accepted
H8 The higher the brand image, the higher the workshop loyalty. 0.165*** 2.629 Small Accepted
H9 The higher the brand image, the higher the brand loyalty. 0.162*** 2.730 Small Accepted
H10 Perception of service quality is significantly in-fluenced by culture, which means by at least one individual level value.
0.601*** 14.982 Large Accepted
H10a Perception of service quality is significantly influ-enced by conformity. 0.127 1.239 n/a Rejected
H10b Perception of service quality is significantly influ-enced by tradition. -0.045 0.659 n/a Rejected
H10c Perception of service quality is significantly influ-enced by benevolence. 0.035 0.311 n/a Rejected
H10d Perception of service quality is significantly influ-enced by universalism. 0.205** 2.173 n/a Accepted
H10e Perception of service quality is significantly influ-enced by self-direction. 0.187* 1.910 n/a Accepted
H10f Perception of service quality is significantly influ-enced by stimulation. 0.139 1.486 n/a Rejected
H10g Perception of service quality is significantly influ-enced by hedonism. 0.102 0.962 n/a Rejected
H10h Perception of service quality is significantly influ-enced by achievement. -0.135 1.290 n/a Rejected
H10i Perception of service quality is significantly influ-enced by power. -0.013 0.161 n/a Rejected
H10k Perception of service quality is significantly influ-enced by security. 0.114 1.349 n/a Rejected
Significance Level *p≤0.1; **p≤0.05; ***p≤0.01

Empirical Research
230
Criteria Requirement Level
β ≥0.1
t-value ≥1.65
f2
≥small All criteria
fulfilled
H11 After-sales service satisfaction is significantly influenced by culture, which means by at least one individual level value.
0.010 0.151 x Rejected
H11 a-k
After-sales service satisfaction is significantly influ-enced by conformity, tradition, benevolence, uni-versalism, self-direction, stimulation, hedonism, achievement, power or security
x x x Rejected
H12 Brand loyalty is significantly influenced by cul-ture, which means by at least one individual level value.
0.242*** 4.141 Small Accepted
H12a Brand loyalty is significantly influenced by conformi-ty. 0.029 0.511 n/a Rejected
H12b Brand loyalty is significantly influenced by tradition. 0.040 0.889 n/a Rejected
H12c Brand loyalty is significantly influenced by benevo-lence. 0000 0.007 n/a Rejected
H12d Brand loyalty is significantly influenced by univer-salism. 0.101* 1.799 n/a Accepted
H12e Brand loyalty is significantly influenced by self-direction. 0.136** 2.376 n/a Accepted
H12f Brand loyalty is significantly influenced by stimula-tion. 0.059 1.182 n/a Rejected
H12g Brand loyalty is significantly influenced by hedon-ism. -0.004 0.083 n/a Rejected
H12h Brand loyalty is significantly influenced by achievement. 0.011 0.193 n/a Rejected
H12i Brand loyalty is significantly influenced by power. 0.034 0.754 n/a Rejected H12k Brand loyalty is significantly influenced by security. 0.064 1.301 n/a Rejected
H13 Workshop loyalty is significantly influenced by culture, which means by at least one individual level value.
0.157** 2.427 Small Accepted
H13a Workshop loyalty is significantly influenced by con-formity. 0.052 0.792 n/a Rejected
H13b Workshop loyalty is significantly influenced by tradi-tion. -0.043 0.849 n/a Rejected
H13c Workshop loyalty is significantly influenced by be-nevolence. 0.042 0.475 n/a Rejected
H13d Workshop loyalty is significantly influenced by uni-versalism. 0.158** 2.152 n/a Accepted
H13e Workshop loyalty is significantly influenced by self-direction. 0.118 1.624 n/a Rejected
H13f Workshop loyalty is significantly influenced by stimulation. 0.058 0.866 n/a Rejected
H13g Workshop loyalty is significantly influenced by he-donism. 0.042 0.578 n/a Rejected
H13h Workshop loyalty is significantly influenced by achievement. -0.035 0.466 n/a Rejected
H13i Workshop loyalty is significantly influenced by power. -0.004 0.073 n/a Rejected
H13k Workshop loyalty is significantly influenced by se-curity. 0.073 1.144 n/a Rejected
Significance Level *p≤0.1; **p≤0.05; ***p≤0.01
Table 33: Overview of Hypotheses Testing
Reference: Author´s table.

Results of the Empirical Assessment
231
Figure 34 shows the path model with a summary of all theoretically proposed rela-
tionships, which are also empirically accepted. The strength of each path coefficient
(β) is indicated through the thickness of the arrow. Additionally, the significance level
is reported. The total effects of individual level values are symbolised targeting the
second-order construct, Culture1–4, but the number of the hypothesis indicates the
full relationship ‒ for instance H10d shows a total effect on perceived service quality.
Non-significant relationships are not illustrated.
Figure 34: Strength of Empirically Confirmed Hypotheses in the Path Model
Reference: Author´s illustration.
After all hypotheses were tested empirically, an in depth-analysis was conducted, in
order to provide additional information, which enables deeper knowledge and a prop-
er understanding of the entire relevant context. The focus was especially on mediat-
ing and moderating effects.
Perceived(Service(Quality(
A1er2Sales(Service(
Sa4sfac4on(
Workshop(Loyalty(
Brand(Loyalty(
Perceived(Workshop(Switching(Costs(
Acceptable(Workshop(Distance(
Brand(Image(
Culture124(
Bene2volence(
Achieve2ment( Power( Hedo2
nism(
Self2Direc4on(
Tradi24on(
Conform2ity(
S4mu2la4on(
Univer2salism(
Secu2rity(
((((((((β:(0,1–0,199 (((( ((((((((β:(0,2–0,299 ( (((((((β:(≥0,3( ( (((((Significance(Level(*p≤0.1;(**p≤0.05;(***p≤0.01(((((
H1***( H2***(H3***(
H5***(H7**(H8***(
H9***(
H10***( H12***(H13**(
H10d**(
H10e*(
H12d*(H12e**(
H13d**(

Empirical Research
232
5.4.2 Mediating Effects
Mediator variables can be directly implemented within the PLS path model, and their
effects are – in contrast to moderator variables (s. Chapter 5.4.3) – automatically
considered. However, the resulting path coefficients do not allow the assessment of
the character and strength of mediating effects, as only the final results are present-
ed. Mediation occurs if the effect of an exogenous latent variable (i.e. Y1) is partly or
completely directed toward an endogenous latent variable (Y2) by means of the me-
diator variable (Y3), as shown in Figure 35. Partial mediation occurs if paths a and b
are significant and path c is weaker than without the mediator variable. Perfect or full
mediation occurs if path c becomes so weak through mediation that it is no longer
significant. If the direction of a path changes due to mediation (sign change), than a
special effect of mediation occurs, namely the suppressor effect.957
Figure 35: Potentially Mediated Relationships within the Path Model
Reference: Author´s illustration.
In order to explain mediating effects, the variance accounted for (VAF) can be calcu-
lated by the formula VAF = (a x b) / (a x b + c). The VAF shows the size of an indirect
effect (a/b) in relation to the total effect (c), which is the sum of indirect and direct ef-
fects. As a result, the endogenous construct’s variance can be distinguished with re- 957 Cf. Hair et al. (2014b), pp. 219 ff.; Hünecke (2012), pp. 130 f.; Figure 19: Relationship of Success
Variables.
A"er%Sales*Service*
Sa.sfac.on*
Workshop*Loyalty*
Brand*Loyalty*
Brand*Image*
********β:*0,1–0,199 **** ********β:*0,2–0,299 * *******β:*≥0,3* * *****Significance*Level**p≤0.1;***p≤0.05;****p≤0.01*****
H1**** H2****
H7***H8****
H9****
Y1* Y2*
Y3*
a* b*
c*
**Poten.ally*Mediated*Rela.onship*
Poten&ally*Mediated*Rela&onship*within*the*Path*Model*
Example*of*Media&on*

Results of the Empirical Assessment
233
gard to the actual percentage of the direct and the indirect (mediating) relationship.
Importantly, a general condition is that the indirect effects have to be significant. A
VAF below 20% is considered to be no mediation, 20%-80% is considered partial
mediation, and percentages above 80% full mediation. Moreover, the VAF number
explains simultaneously how much of the endogenous construct´s variance is ex-
plained via the mediator.958
As shown by the broken arrows in Figure 35, H8 and H9 are relationships that might
be affected by mediation, so the related VAF is calculated.
• VAF (H8) = 0.362, thus after-sales service satisfaction partially mediates the
direct relationship between brand image and workshop loyalty. Thereby, the
mediator variable of after-sales service satisfaction explains 36,2% of the vari-
ance of workshop loyalty.
• VAF (H9) = 0.252, so workshop loyalty partially mediates the direct relation-
ship between brand image and brand loyalty. Here, the variable workshop loy-
alty mediator explains 25,2% of the variance of brand loyalty.
5.4.3 Moderating Effects
As discussed in Chapter 4.2.1, moderator variables are influences which affect the
relationship between independent and dependent variables;959 in contrast to media-
tion, a moderator is without being itself a predictor variable. Thereby, strength and di-
rection of any related path coefficient could change. Moderators can generally be
known a priori, which is why often control variables such as gender are considered;
or they can be completely unknown.960 Next, the control variables that are defined a
priori are checked via multi-group analysis to determine possible moderating effects.
Multigroup Analysis
Multigroup analysis is a kind of moderator analysis, where usually categorical data
(e.g. gender) are compared to the entire path model.961 A moderator effect is valid if
958 Cf. Hair et al. (2014b), p. 225. 959 Cf. Töpfer (2012), pp. 160 f.; Müller (2009), pp. 237 ff.; Sarstedt et al. (2011), 197. 960 Cf. Hair et al. (2014b), p. 245. 961 Cf. Hair et al. (2014a), pp. 115 f.; Cf. Sarstedt et al. (2011), p. 198 ff.

Empirical Research
234
the difference of a path coefficient, in accordance with the groups being considered,
is significant.962 For the actual moderator analysis the control variables, which are
discussed in Chapter 4.4.4, are used to establish subgroups. Thus, gender, income,
and age are of interest in this study and are therefore analysed. Analogue to the
main analysis, a sufficient sample size is required to ensure statistical power.963 Un-
fortunately, the income groups poor and value, as well as the age group 50‒59, are
too small, which is why they are excluded. The remaining groups are presented in
Table 34.
Groups for PLS-MGA Gender n Income n Age n
Male 198 > 99,000 CNY (mainstream) 87 20-29 87
Female 103 > 212,000 CNY (affluent) 139 30-39 145
> 435,000 CNY (very affluent) 50 40-49 60
Table 34: Groups for PLS-MGA
Reference: Author´s table.
Unlike previous versions, SmartPLS 3 enables pairwise multigroup analysis directly,
by establishing groups and using the PLS-MGA algorithm.964 PLS-MGA presents a
table with actual path coefficient differences with regard to chosen groups, and like-
wise the p-value, which indicates significance. The same significance levels are ap-
plied as are used in hypotheses testing (s. Chapter 5.4.1). With regard to the follow-
ing tables, for instance, a significant group difference on a 5% level is given, if p-
values are above 0.95 or below 0.05. Also, only truly relevant paths are accepted, so
the minimum β-threshold of 0.1 is applied. The resulting significant group differences
are shown below.
Gender
When it comes to gender comparisons two paths show significant differences (s. Ta-
ble 35), and interestingly both significant differences are related to individual level
962 Cf. Hünecke (2012), p. 134; Eberl (2010), pp. 496 f. 963 Cf. Hair et al. (2014b), p. 250. 964 Cf. For further details on PLS-MGA s. Sarstedt et al. (2011), pp. 195 ff. and the there cited litera-
ture.

Results of the Empirical Assessment
235
values or more generally to cultural aspects. Likewise, two drivers for perceived ser-
vice quality differ significantly, which indicates that for male and female customers
different aspects (of the marketing mix) are of importance. As a consequence, R2
values differ substantially, as presented in Table 35. The conclusion drawn in this
study is that gender is a relevant moderator in the given model:
• Two individual level values have path coefficient differences due to gender.
o UNI predicts perceived service quality much more strongly for female
(0.5) than for male customers (0.12).
o ACH is not a significant predictor in the total model, but for the sub-
group, females, it is. The effect is quite significant, because of its extent
(-0.28) and its negative direction. Thus, the more ACH is manifested,
the fewer females perceive service quality as adequate.
• The comparison of the drivers for perceived service quality shows that the
biggest weight difference of 0.523 occurs with regard to the item ability to do
the job right. With a weight of 0.306, it is for the group of man a very strong
driver towards perceived service quality, but interestingly, for women a like-
wise strong, but negative one. Less strong, but also important, it is the other
way round for the item, ability to do the job on time, where the contribution is
negative for men (-0.134) and positive for women (0.221). Thus, depending on
gender, distinct dimensions lead to perceived service quality.
• On the construct level, the explained variance is much higher in the female
than in the male group. Constructs relating to satisfaction and loyalty are in
fact around 30% higher for women, and notably the perceived service quality’s
R2 is almost 80% higher for women.

Empirical Research
236
Gender Group Differences
Path β-Difference p-value β-Male β-Female UNI ! Perceived Service Quality 0.379 0.935 0.120 0.500 ACH ! Perceived Service Quality 0.290 0.096 0.010 -0.280 Weights of Perceived Service Quality β-Difference p-value Weight Weight PSQ_6_v_10 (Ability to do the job right) 0.523 0.001 0.306 -0.217 PSQ_7_v_185 (Ability to do the job on time) 0.355 0.995 -0.134 0.221 Construct’s R2 R2-Difference R2-Male R2-Female Perceived Service Quality 0.276 0.348 0.624 After-Sales Service Satisfaction 0.163 0.577 0.740 Workshop Loyalty 0.199 0.588 0.787 Brand Loyalty 0.201 0.579 0.780
Table 35: Gender Group Differences
Reference: Author´s table. Results may vary, due to rounding to three decimal places.
Income
The PLS-MGA allows pairwise calculations, but income and later age are categories
with more than two group characteristics, thus the recommendations of EBERL
(2010) are followed, to conduct a series of pairwise multi-group analyses via PLS-
MGA.965 In the process, some general conditions have to be met. The most important
of these are that the data should not be too non-normally distributed, each sub model
must be valid in terms of the PLS evaluation criteria, and there should be measure-
ment invariance.966 These conditions are met for the following purposes. In this study
the largest subsample is simultaneously compared with other groups, which are pre-
sented in Table 36. Generally, much more culture-related differences are significant.
Compared with the affluent reference group, the subgroup, mainstream, has seven
more differences than the very affluent subgroup. Next, the most remarkable group
differences are discussed.
• AWD is not a significant predictor in the total model, but it is for the very afflu-
ent subgroup. Here, AWD has a path coefficient towards workshop loyalty of
0.2.
• Workshop loyalty is for very affluent people less important than in the total
model, and much less important (β-difference=0.414) in MGA-comparison to
affluent Chinese, thus workshop loyalty effects brand loyalty by only 0.193. 965 Cf. Eberl (2010), pp. 497 ff./507. 966 Cf. ibidem, pp. 503 ff.

Results of the Empirical Assessment
237
• In the total model only SE-D und UNI are significant individual level values
predicting endogenous constructs, but the MGA shows that for subgroups,
seven more and distinct values are relevant and significant.
• Very affluent Chinese service customers:
o HED is a value which affects all automobile-related endogenous con-
structs significantly, with path coefficients between 0.255 and 0.325.
o In contrast, and in accordance with the individual level value, theory,967
BEN negatively predicts brand loyalty (-0.425).
o The strength of the generally significant total effect of SE-D on per-
ceived service quality (0.822) is remarkably high for the very affluent
subgroup.
• Mainstream income subgroup:
o BEN is an important and positive predictor for perceived service quality,
after-sales service satisfaction and brand loyalty.
o POW shows significant differences and is therefore a factor that con-
tributes to perceived service quality, after-sales service satisfaction and
workshop loyalty (0.311; 0.265; 0.234).
o SEC is only in this subgroup (with comparably low income rates) signif-
icant. Surprisingly, it affects both loyalty constructs negatively (-0.287;
-0.185).
o Familiar to SEC, TRA also has significant negative effects. All endoge-
nous constructs except brand loyalty are affected.
• In contrast to the moderator, gender, no significant differences are given, if the
formative drivers for perceived service quality are analysed.
• Due to the moderating effects, R2 values for the automobile-related endoge-
nous constructs differ. Compared with the affluent subgroup, the highest dif-
ference (Δ=-0.21) occurs at the comparably low R2 of the mainstream sub-
group (0.548).
967 Both values are on opposite sides of the self-enhancement/self-transcendence axis.

Empirical Research
238
Income Group Differences
Path
Afflu-ent
Compared to Mainstream
Compared to Very Affluent
β-value β-Diff. p-value β-value β-Diff. p-value β-value AWD ! Workshop Loyalty -0.040 0.240 0.986 0.200 Workshop Loyalty ! Brand Loyalty 0.414 0.221 0.034 0.193 ACH ! Workshop Loyalty 0.100 0.441 0.073 -0.340 BEN ! Perceived Service Quality 0.034 0.639 0.975 0.673 BEN ! After-Sales Service Satisfaction 0.040 0.547 0.955 0.587
BEN ! Workshop Loyalty 0.088 0.423 0.934 0.511 BEN ! Brand Loyalty -0.005 0.420 0.083 -0.425 HED ! Perceived Service Quality -0.233 0.386 0.932 0.153 0.501 0.905 0.267 HED! After-Sales Service Satisfaction -0.186 0.511 0.931 0.325
HED ! Workshop Loyalty -0.202 0.487 0.932 0.286 HED ! Brand Loyalty -0.121 0.376 0.940 0.255 POW ! Perceived Service Quality -0.136 0.447 0.970 0.311 POW ! After-Sales Service Satisfaction -0.102 0.367 0.950 0.265
POW ! Workshop Loyalty -0.099 0.333 0.952 0.234 SEC ! After-Sales Service Satisfaction 0.292 0.653 0.009 -0.361
SEC ! Workshop Loyalty 0.265 0.552 0.015 -0.287 SEC ! Brand Loyalty 0.227 0.412 0.015 -0.185 SE-D ! Perceived Service Quality 0.325 0.520 0.016 -0.195 0.497 0.906 0.822 SE-D ! After-Sales Service Satisfaction 0.263 0.456 0.020 -0.193
SE-D ! Workshop Loyalty 0.182 0.319 0.072 -0.137 TRA ! Perceived Service Quality 0.024 0.245 0.081 -0.220 TRA ! After-Sales Service Satisfaction 0.020 0.290 0.040 -0.269
TRA ! Workshop Loyalty 0.010 0.276 0.049 -0.350
Construct’s R2 Afflu-
ent R2-Diff.
R2-Main- stream
R2- Diff.
R2-Very Affluent
Perceived Service Quality 0.515 0.004 0.511 0.124 0.639 After-Sales Service Satisfaction 0.690 0.094 0.596 0.018 0.708 Workshop Loyalty 0.659 0.051 0.608 0.034 0.693 Brand Loyalty 0.758 0.210 0.548 0.025 0.733
Table 36: Income Group Differences
Reference: Author´s table; Results may vary, due to rounding to three decimal places.
Age
Based on three age subgroups, some relevant differences occur due to moderating
effects.

Results of the Empirical Assessment
239
• BI is a valid predictor of after-sales service satisfaction in the total model, but
for the youngest subgroup (20-29) the effect is comparably strong. Moreover,
there is no relevant effect or path coefficient for the subgroup of Chinese be-
tween 30 and 39.
• The total effect of perceived service quality towards workshop loyalty is signifi-
cantly stronger for 30-39 year old customers (0.436) than for older customers
between 40 and 49 (0.25).
• In contrast to other groups and to the total model, CON significantly influences
perceived service quality (0.408), if the youngest subgroup is taken into ac-
count.
• Analogously, SEC is an important influence (0.264) only for the age group 40-
49.
• With regard to the after-sales services instruments or the formative drivers of
perceived service quality, the ease of getting an appointment is fairly important
for young Chinese between 20 and 29. In contrast, these customers do not
value friendliness of personnel.
• Customers in the age group 40 to 49 show another significant difference: the
ability to do the job on time is fairly important.
• On construct level, the highest resulting R2-difference occurs, when it comes
to the comparison of the age groups 40-49 (R2=0.77) and 30-39 (R2=0.26).

Empirical Research
240
5.4.4 Total Effects and Construct Performances in Regard to the Success Indicator
In order to properly explain all influences on the success indicator, the total effects need to be assessed. As here brand loyalty is of primary interest, only total effects towards brand loyalty are considered below and summarised in Table 38. The entire total effects table is presented in Appendix 7. Total effects are the sum of indirect and direct causal effects. PLS-SEM provides the benefit of extending the findings about total effects with regard to any endogenous construct, because an additional dimension can be evaluated – the importance-
performance matrix analysis (IPMA). ‘(…) IPMA contrasts the structural model total effects (importance) and the average values of the latent variable scores (perfor-
Age Group Differences
Path
Age 30-39
Compared with Age 20-29
Compared with Age 40-49
β-value β-Diff. p-value β-value β-Diff. p-value β-value BI ! After-Sales Service Satisfac-tion 0.003 0.250 0.965 0.253
Perceived Service Quality ! Work-shop Loyalty 0.436 0.250 0.047 0.186
CON ! Perceived Service Quality -0.013 0.422 0.925 0.408 SEC ! Brand Loyalty 0.000 0.265 0.932 0.264 Weights of Perceived Service Quality β-value β-Diff. p-value β-value β-Diff. p-value β-value PSQ_3_v_7 (Ease of getting an appointment) -0.020 0.339 0.970 0.319
PSQ_9_v_14 (Friendliness of personnel) 0.301 0.375 0.037 -0.074
PSQ_7_v_185 (Ability to do the job on time) -0.146 0.365 0.981 0.219
Construct’s R2 Age
30-39 R2-Diff R2-
20-29 R2- Diff R2-
40-49 Perceived Service Quality 0.260 0.243 0.503 0.510 0.770 After-Sales Service Satisfaction 0.656 0.016 0.640 0.091 0.747 Workshop Loyalty 0.589 0.114 0.703 0.142 0.731 Brand Loyalty 0.667 0.046 0.621 0.124 0.791
Table 37: Age Group Differences
Reference: Author´s table; Results may vary, due to rounding to three decimal places.

Results of the Empirical Assessment
241
mance) to highlight significant areas for the improvement of management activities (or the specific focus of the model).’968 If for instance, any exogenous construct has a high importance (path coefficient) towards the endogenous variable, but a low per-formance (indicated by IPMA), then this is a very valuable anchor point for improve-ments, because there is a lot of headroom, here. PLS-IPMA directly calculates the performance values, which are indexed varying from zero (lowest performance) to 100 (highest performance). The IPMA analysis via SmartPLS 3 requires that all latent variables be rescaled, with accordance to their original measuring scales. Further information on the details of this algorithm is com-prehensively discussed by HAIR ET AL. (2014b).969 The rounded performance values are integrated into the following total effects table. In order to provide a good overview, only significant total effects are presented.
• Generally the deviation between the performances of the exogenous con-structs is rather low (Δ=11).
• The combined assessment of importance and performance suggests that the variable perceived workshop switching costs is most valuable to be addressed (which is especially important for practitioners), as the lowest performance value of 71 indicates the biggest room for improvement, and also the path co-efficient of 0.312 is the model´s second strongest total effect.
• The improvement of brand image would be the last choice, due to this per-spective.
• Additionally, it must be emphasised that the two individual level values cannot be changed through management decisions.
968 Hair et al. (2014b), p. 206. 969 Cf. ibidem, pp. 206 ff.

Empirical Research
242
Total Effects and Performances Towards the Success Indicator Brand Loyalty Exogenous Construct Total Effect (β) Performance
Universalism 0.101* 77
Self-Direction 0.136** 77
Brand Image 0.247*** 82
Perceived Workshop Switching Costs 0.312*** 71
Perceived Service Quality 970 0.129*** 76
After-Sales Service Satisfaction 0.191*** 76
Workshop Loyalty 0.331*** 77
Significance Level *p≤0.1; **p≤0.05; ***p≤0.01
Table 38: Total Effects and Performances Towards the Success Indicator Brand Loyalty Reference: Author´s table.
970 The index figure of this construct is very slightly inaccurately, because one of the nine formative
measuring item´s weight is negative on two decimal places. This inaccuracy is ignorable, as it is smaller then the rounding differences.

General Discussion
243
6 General Discussion
The objective of this work was to investigate theoretically and to verify empirically the
determinants of success of after-sales services for German automobile manufactur-
ers in China, under consideration of the influence of cultural factors. This objective
and the related research questions have been achieved and comprehensively an-
swered, where especially the in-depth analysis of culture shows that this topic must
be analysed pretty much in detail (here moderation is crucial), in order to understand
the whole picture properly. The following chapters summarise this study (Chapter
6.1), compare and discuss the empirical findings with scientific and managerial inter-
pretations (Chapter 6.2), and finally close by considering the limitations of this study
and the need for further research (Chapter 6.3).
6.1 Summary of the Study
Automobile premium brands operate globally, which is undoubtedly required, be-
cause, for the most part, domestic markets are either decreasing or stagnating. Chi-
na has become the most important and biggest car market, with an average growth
rate of over 25% between 2000 and 2010. But recently selling has become challeng-
ing because urban areas are well penetrated, and in poorly penetrated rural areas,
incomes are low. This is particularly alarming for German brands, because of their
premium orientation. Simultaneously, the after-sales market in China has been grow-
ing continuously. As a result, today this market has huge potential, which is likewise
attractive because it has been scientifically proven across industries that after-sales
services are high-margin profit drivers. Despite its great significance, the Chinese au-
tomobile after-sales market remains insufficiently researched, especially in terms of
critical success factors and cultural influences, which therefore was the starting point
for this study.
Initially an exploratory expert survey was conducted (s. Chapter 1.2), in order to
specify, and to challenge the given problem statement. On this basis, and especially
due to an assessment of the state of research on automotive marketing, after-sales
services and Chinese consumer behaviour (s. Chapter 2), the objective was formu-

General Discussion
244
lated to investigate theoretically and to verify empirically what determines the auto-
mobile manufacturer´s success in the Chinese after-sales market, while considering
cultural influences.
In order to elaborate relevant context information, German car manufacturers are
presented and discussed as the object of research (s. Chapter 3). In the light of con-
sumer demands, the role of consumers on both the domestic and the global markets
is illustrated. A China-specific market overview is provided to illustrate the local con-
sumer landscape and important challenges with regard to after-sales services. Based
on that, the three brands, Audi, BMW and Mercedes-Benz are defined as the manu-
facturer group of interest. Due to their market penetration, the empirical research is
focussed on service customers living in urban areas.
In order to elaborate empirical findings and success drivers, a conceptual research
model and a linked system of hypotheses is elaborated in Chapter 4. Here, theoreti-
cal and conceptual foundations are comprehensively discussed. Brand loyalty is de-
fined as the predominant success indicator, and the after-sales service success
chain is presented as the basis for the research model. Additionally, cultural influ-
ences are conceptualised and integrated. The focus is on values as a core element
of culture and a cause of behaviour. These are operationalised with regard to the
theory of individual level values, which SCHWARTZ defines as ‘trans-situational
goals, varying in importance, that serve as guiding principles in the life of a person or
group.’971 The set of ten distinct individual level values is organised around a motiva-
tional circle, as a coherent system which allows the effects of every single value to be
researched.
Based on these comprehensive discussions, and the set of hypotheses deduced
from them, Chapter 5 concerns the empirical research process. Here, the success-
factor research approach is presented, and PLS-SEM is chosen as the best-fitting
method to statistically evaluate possible success factors. The research design takes
various requirements into consideration. An online survey results which suits the
Chinese` target group specific operationalisation, scaling and translation equivalence
requirements. The surveys questionnaire was tested using two pre-tests. The col- 971 Cf. Schwartz et al. (2012), p. 664.; Schwartz (1992), pp. 1 ff.

Interpretation of Empirical Results and Management Implications
245
lected data was challenged through an error control system, which is why the final
data set was reduced to 301 cases. Afterwards, reflective and formative measure-
ment models, as well as the structural model were strictly tested with conservative
standards and thresholds. As a result, the final path model is acknowledged as abso-
lutely appropriate, which is why the testing of hypotheses was conducted afterwards.
The detailed results of this empirical assessment (s. Chapter 5.4) provide significant
new findings, which, first, substantially enrich the scientific body of knowledge, and
second, foster the managerial understanding of the topic. The summary of the most
important findings as well as the interpretation of these results follow in the next
Chapter 6.2. Finally, this research project closes with an assessment of its own limi-
tations and a consideration of the need for important further research (s. Chapter 6.3).
6.2 Interpretation of Empirical Results and Management Implications
Chapter 5.4 provided a detailed discussion of this study’s findings, which now are
summarised and interpreted. The interpretation takes place against the background
of a priori theorised relationships and context-related studies. The endogenous au-
tomobile constructs are presented sequentially – in the manner of ‘How to achieve…’
– starting with perceived service quality. Finally, cultural aspects are deepened.
How to Achieve Perceived Service Quality
Perceived service quality is the starting point of the after-sales service success chain.
The formative measurement approach makes it possible to give information about
the most important drivers of perceived service quality, which are very familiar to the
after-sales service instruments of the marketing mix, which can be steered by the
OEMs. Often Chinese consumers are considered to be highly price sensitive,972 and
very different from Westerners, especially when it comes to rich consumers.973 The
perceived service quality is not generally moderated by income, but in fact the forma-
tive drivers are different from those in Western markets. In China costs are only the
seventh important driver for quality, in contrast to France, Italy and Spain, where they
972 Cf. Guo (2013), p. 25. 973 Cf. Saidi et al. (2010), pp 1 ff.

General Discussion
246
rank within the top four.974 KNÖRLE has (2011) doubted the predominance of price
consciousness in Chinese consumer behaviour,975 and the findings of the current
study acknowledge his argumentation.
The most important drivers for Chinese premium customers are convenience, the at-
tractiveness of the facility (both relatively unimportant in Europe), as well as honesty
and integrity (desired in Europe). Additionally, the after-sales marketing should be
aware of significant age- and gender-related customer preferences (s. Table 35 and
36). Here most importantly, the ability to do the job right is a strong positive driver for
men but a negative one for women.
Finally, cultural effects as proposed, significantly influence the perception of service
quality, thus H10 is accepted. Two individual level values are empirically identified as
causal influences.
First, universalism significantly predicts perceived service quality with a path coeffi-
cient of 0.205, thus hypothesis H10d is accepted. Generally, universalism expresses
tolerance of others and the understanding, appreciation, and protection of the welfare
of all people and of nature. (Note that here the dimension of tolerance or wisdom and
equality is emphasised, not the enhancement of welfare, which would be individual
level value benevolence). On the first view that might seem to be a mismatch with the
automotive context, but understanding and appreciation are dimensions which can
be seen as linked to the C/D paradigm. The theory is that the customer compares
perceived performance (is) with a reference standard (should be). If the reference
standard is relatively low, which might be the case due to the characteristics of high
tolerance and understanding, then the customer perceives or judges the service
quality as being relatively high.
Second, the perception of service quality is significantly influenced by self-direction
(H10e). Likewise, this proposed relationship holds true for the empirical tests. Self-
direction is an individual level value which stands for such things as independent
974 All ranks are related to a maximum of nine drivers. Western markets are analysed in the same
manner by Hünecke (2012), pp. 229 ff. 975 Cf. Knörle (2011), p. 225.

Interpretation of Empirical Results and Management Implications
247
thinking, choosing action over inaction, creativity and exploration. As mentioned in
Chapter 4.4.2.1, KELLEY’s attribution theory (1973) says that transaction partners
endeavour to explain the (positive) outcome of actions by attributing causes to their
own behaviour, and in contrast the transaction partner`s behaviour to the environ-
ment.976 With regard to the customer’s own perception, this theory might explain that
self-direction fosters perceived service quality, because if a person thinks they have
made a good choice with their car service provider, the perception of quality likewise
adapts in its strength or is more generous. In fact, this arguments, and that universal-
ism and self-direction both are causal for the mentioned perception, is in line with the
general argumentation of SCHWARTZ (1996) who say that, ‘Self-direction and uni-
versalism both express reliance upon one´s own judgement and comfort with the di-
versity of existence.’977 Moreover, ZHANG ET AL. (2008) argue that in general, East-
ern service demanders have lower overall expectations of service quality, and are
more likely to be satisfied when they evaluate services.978 The two individual level
values self-direction and universalism in combination with the CD-paradigm may now
offer an explanation for the causal background.
The in-depth analyses, which elaborates insights going beyond the hypothesis sys-
tem show, via multiple group analysis, that gender, age and income moderate the re-
lationship between individual level values and perceived service quality. Importantly,
universalism is much more strongly causal for women than for men. Moreover, vari-
ous values become significant if sub-groups are analysed in detail. For instance,
achievement (personal success through a demonstration of competence according to
social standards) is a significant individual level value for women, which negatively
affects their perception of quality. For young Chinese between 20 and 29, conformity
(restraint of actions, inclinations, and impulses likely to upset or harm others and vio-
late social expectations and norms) is a valid influence of culture with a path coeffi-
cient of 0.408. Additionally, if we focus on income groups, benevolence, hedonism,
power and tradition become relevant and significant (s. Table 36). Marketers should
take this into account for every kind of marketing action, because it allows them to
address target groups very specifically. 976 Cf. Meffert/Bruhn (2009), pp. 72 f.; Kroeber-Riel/Gröppel-Klein (2013), pp. 393 ff.; Foscht/Swoboda
(2011), p. 242. 977 Cf. Schwartz (1996), p. 124. 978 Cf. Zhang et al. (2008), pp. 220 f.

General Discussion
248
How to Achieve After-Sales Service Satisfaction
Service quality or its perception is regarded as the main antecedent of customer sat-
isfaction in various predominantly Western car markets.979 However, no knowledge in
accordance with today’s most important car market China existed. Hypothesis H3 is
accepted, thus it is empirically confirmed that ‘the higher the perceived service quality,
the higher the after-sales service satisfaction’. As the highest path coefficient of the
whole model indicates (0.673), this relationship is quite strongly, and likewise the ef-
fect size f2 is considered large. As a result, perceived service quality is the most im-
portant exogenous factor of the model, in order to reach after-sales service satisfac-
tion.
Perceived service quality explains 52.8% of the variance of after-sales service satis-
faction. Brand image contributes too (0.163), but with a small effect size f2 (percent-
age of R2=9.9%). Nonetheless, hypothesis H7 is empirically confirmed, which is in
line with prior studies concerning other Chinese industries.980 Moreover, marketers
should notice that this relationship is moderated by the customer’s age, as brand im-
age is more important for customers under 30 than for older generations.
With regard to cultural aspects, this study was not able to validate a relationship be-
tween individual level values and after-sales service satisfaction. However, due to
non-significance, though cannot be concluded that ZHANG ET Al. (2008), who argue
that culture influences every service experience dimension,981 are wrong. But re-
searchers and practitioners should be aware that cultural effects are indeed most rel-
evant when it comes to the dimensions of perceived quality and loyalty.
How to Achieve Workshop Loyalty
According to previous studies,982 after-sales service satisfaction is postulated as the
main antecedent of workshop loyalty. This holds true for the Chinese premium mar-
979 Cf. Hünecke (2012), p. 147; Hättich (2009), p. 213; Bei/Chiao (2001), pp. 136 ff.; Devaraj (2001), p.
434. 980 Cf. Lai et al. (2009), p. 984; Ogba/Tan (2009), p. 141. 981 Cf. Zhang et al. (2008), p. 212. 982 Cf. Hünecke (2012), p. 127; Hättich (2009), p. 213; Bei/Chiao (2001), p. 138; Devaraj et al. (2001),
pp. 434 f.; Bloemer/Pauwels (1998), p. 82; Bloemer/Lemmink (1992), p. 362.

Interpretation of Empirical Results and Management Implications
249
ket, as the empirical acceptance of hypothesis H1 shows. This relationship, called
‘the higher the after-sales service satisfaction, the higher the workshop loyalty’, is the
second strongest in the model, and the effect size f2 is correspondingly large.
Moreover, hypothesis H8 is accepted, because the path analysis of the relationship
described as ‘the higher the brand image, the higher the workshop loyalty’, shows
significance and relevance; indicated through a coefficient of 0.165. From a detailed
scientific perspective we should consider that this path coefficient would be higher if,
after-sales service satisfaction were omitted from the model, because this variable
works as a partial mediator (VAF= 0.362). However, usually satisfaction is consid-
ered when it comes to loyalty analysis; thus the explained variance of workshop loy-
alty is composed of the following exogenous factors.
• After-sales service satisfaction ! 44.3%
• Brand Image ! 10.4%
• Culture ! 8.7%
With regard to culture generally (H13), and to the causal influence of the individual
level value of universalism in particular (H13d), the empirical analysis shows that sig-
nificant relationships exist.
Analogue to perceived service quality, more basic values are significant, if we focus
on distinct subgroups (s. Table 36). It is significant that, compared with the total
model or with other income-subgroups, very affluent Chinese are less loyal to a given
workshop. One explanation is that achievement is a value with a strong cultural influ-
ence, which negatively affects workshop loyalty by an extent of -0.340.
How to Achieve Brand Loyalty
Brand loyalty is the primary success indicator of this study. In order to achieve it, the
most important factor is achieving workshop loyalty. Because the hypothesised rela-
tionship (H2), which says ‘the higher the workshop loyalty, the higher the brand loyal-
ty’, holds true for the empirical evaluation in China. The path coefficient has a value
of 0.331 and the f2 effect size is considered medium. Looking deeper into Chinese
customer subgroups, we see that a significant difference occurs with regard to in-

General Discussion
250
come levels: the path coefficient towards brand loyalty is much stronger in the case
of the affluent (0.414), than it is for the very affluent (0.193).
With very similar characteristics to those of workshop loyalty, perceived workshop
switching costs are causal (0.305/medium), which is why hypothesis H5 is accepted.
This is an important finding, because switching costs can be influenced by brands,
with for instance linked guarantees, which tie the customer to the brand, in other
words increase the switching costs. Interestingly, the perceived switching costs in
this study are not significant towards workshop loyalty, which is different from the
German market, where they are causal towards workshop loyalty, but comparably
less relevant towards brand loyalty.983
As twice before, brand image is a significant determining factor. Hypothesis H9,
which postulates that a higher brand image leads to higher brand loyalty, is empirical-
ly confirmed, and the path coefficient (0.162) is relevant. This finding is in line with
HÜNECKE (2012) who shows empirically that brand image is the most important
driver for brand loyalty in Italy and Spain, and an important one in France.984 In China,
analogue to the previously mentioned mediation, again the direct effect of brand im-
age on brand loyalty is partially mediated through workshop loyalty (VAF=0.252), and
thus weaker as if the mediator would be omitted. However, taking everything into ac-
count, in fact brand image is more important than focussing on each single brand im-
age path coefficient indicates, because brand image is the only significant non-
cultural effect which influences more than one endogenous construct. Actually, brand
image constantly influences, and therefore fosters almost the entire after-sales ser-
vice success chain. In fact this is an important contribution to the existing body of
knowledge, because prior research on this topic reveals ambiguities, and widely ne-
glects the analysis of image in accordance with the entire service delivery chain.
Regarding the explained variance in brand loyalty, this study concludes that the ap-
plied model has fairly strong predictive accuracy, and the success indicator is fairly
well explained by the model, in other words by the predictor constructs. The ex-
plained variance of brand loyalty is 64.8%. This is a high number, particularly be-
983 Cf. Hättich (2009), p. 213/217. 984 Cf. Hünecke (2012), p. 137.
Interpretation of Empirical Results and Management Implications
251
cause this study focusses on and therefore researches only after-sales services. But
usually, brand loyalty is predicted by pre- and at sales services, as well as product-
related aspects such as for instance product satisfaction. Generally, PLS- and CB-
SEM approaches are not directly comparable, but prior familiar research on automo-
bile after-sales was not able to elaborate a model with such a high predictive accura-
cy R2. Brand loyalty in Germany is explained by a variance of 22% and in France,
Spain and Italy by 40.3%.985 On the one hand, after-sales services seem to be rela-
tively important for Chinese customers. On the other hand, culture is considered a
relevant dimension of interest, because 14,8% of brand loyalty´s R2 are predicted by
individual level values or, more generally, by cultural effects. The whole R2 contribu-
tion split of brand loyalty is as follows.
• Brand image ! 10.5%
• Culture ! 14.8%
• Perceived workshop switching costs ! 17.6%
• Workshop loyalty ! 21.9%
Finally, in order to reach brand loyalty, focussing on the total effects is important.
Here, the three most important drivers are workshop loyalty, perceived workshop
switching costs and brand image. If additionally the perspective of effectiveness is
taken into account via performance analysis, then one should first focus on perceived
workshop switching costs, because besides the second strongest path coefficient,
this variable shows the biggest room for improvement (s. Table 38). This is especially
essential in order to support managerial decisions, because due to limited resources
– which should be the common case – knowledge about effectiveness is crucial.
Collectivistic cultures such as China are considered relatively brand loyal.986 This
study cannot achieve a national comparison, but the R2 contribution of culture indi-
cates strongly that cultural effects are quite important (14,8% of 64,8%). In line with
that, the empirical confirmation of hypothesis H12 shows that cultural influences in-
deed affect brand loyalty. Particularly, universalism (H12d) and self-direction (H12e)
are individual level values which have a significant influence, thus both hypothesis
are accepted. With respect to sub-groups, security (safety, harmony stability of socie- 985 Cf. Hättich (2009), p. 213; Hünecke (2012), p. 127. 986 Cf. de Mooij (2014), p. 148; Emrich (2014), p. 24; Guo (2013), p. 22.

General Discussion
252
ty and relationships, and of self) is a value which is also causal in a positive sense for
40-to-49-year-old Chinese, and in a negative sense for Chinese with a mainstream
income. For very affluent customers, hedonism (pleasure and sensuous gratification
of one’s own desires) contributes to brand-loyal behaviour, but in contrast benevo-
lence has a strong negative effect. The two latter opposed effects are in line with
SCHWARTZ’s theory, because within the circular arrangement of values, the values
are diametrically opposed.
Individual Level Values as Cultural Causes
Often researchers argue that various aspects of consumer behaviour are affected by
culture, particularly when it comes to services. As a result, ZHANG ET AL. (2008)
claimed to go beyond HOFSTEDE by applying other theories. Prior research usually
focussed on national comparisons, which is why it offered no information on the cau-
sality of culture. Due to the individual level value approach of this study, particular
values have been empirically confirmed as being causal with regard to after-sales
services. At first view, it seems to be sober that just two of ten individual level values
are predominantly causal. However, the deeper analysis acknowledges the argu-
ments of KNÖRLE (2011) who researches brand loyalty in China more generally than
this study. He says that the constant change in China leads to a very complex con-
sumer, and a reduction to any single cultural dimension is not valid any more. For in-
stance, he argues that collectivistic and individualistic aspects exist simultaneous-
ly.987 The in-depth multi-group analysis of this study shows that moderating effects
have a strong influence in China. If age, income and gender are considered, various
other relationships with causal individual level values become significant, which is
why a detailed picture of subgroups can be drawn (s. Table 35, 36 and 37).
But, how could this be in line with the widely accepted condition that culture and val-
ues are both very time-stable phenomena?988 In fact, values should be the same, if
income subgroups are considered. In contrast, for instance RALSTON ET AL. (1999)
have the rarely mentioned opinion that cultural aspects might shift more than gener-
ally thought. They focus on, and empirically confirm a general shift of work values in
987 Cf. Knörle (2011), p. 224. 988 Cf. Chapter 4.2.5, Culture.

Limitations and Further Research Needs
253
Chinese management from Confucian dynamism toward individualism.989 If this idea
is taken into consideration as along with the new findings of the present study, the
author raises the question whether it is likely that broad cultural norms such as col-
lectivism are relatively stable, and that finely distinct sub dimensions (as revealed via
individual level values) might be more strongly affected by cultural shifts.
A second approach might be worth considering if the behavioural research of
BARDI/SCHWARTZ (2003) is taken into account. They focus on value-behaviour re-
lationships, and found substantial correlations between both, but some values are
more strongly related to common behavior than others.990 As a reason they argue in
line with SHODA (1999) that external situational pressure has to be considered, be-
cause ‘(…) the stronger the situational pressure to act in a particular way, the weaker
the influence of internal factors [i.e. values ]. Norms for behavior in relevant groups
pose an important situational pressure. People may conform with norms, even when
the normative behavior opposes their own values.’991
This argumentation, indeed, is fostered by the detailed multi-group analysis results
(moderation) of this study, which empirically show that differences exist, and distinct
values are causal, if it comes to consumer behaviour. It is very likely that different
groups are exposed to different circumstances (or situational pressure), which is why
values may appear insignificant, if a total research model has not taken all relevant
aspects into account. Very likely, there are more moderating issues that are relevant,
but which could not be addressed by this study. However, the findings mentioned in
this study strongly enrich the body of knowledge with regard to automotive after-sales
service behaviour and cultural determinants.
6.3 Limitations and Further Research Needs
The current study is based on a comprehensive theoretical and conceptual founda-
tion, and assessments are judged cautiously. However, as in every empirical work,
989 Cf. Kirkman et al. (2006), p. 312; Ralston et al. (1999), pp. 415 ff.; Moreover, Lennartowicz/Roth
(2001), pp. 305 ff. can be stated, because they show that subculture matters within country boarders.
990 Cf. Bardi/Schwartz (2003), p. 1216. 991 Ibidem, p. 1217.

General Discussion
254
limitations exist, which is why they are summarised in this chapter. A limitation by its
nature establishes a limit for the existing study, but at the same time it is a valuable
source for new research. Therefore, as well as limitations, further research needs are
addressed.
China is a country exposed to dramatic changes which take place in short durations.
Industrialisation, rising incomes, urbanisation and ecological challenges are only a
few major forces of change. Due to these many processes, consumer behaviour is
constantly changing. One considerable limitation of this research is the time re-
striction, which leads to the cross-sectional approach. The empirical data is gathered
in one period, so that changes cannot be shown directly. The Chinese car market
changes from a first-buyer market to a riper market, and the after-sales market will
follow. Future longitudinal-research should take this into account, in order to provide
proper knowledge of the after-sales-specific forces of change, resulting consumer
demands and the implications for marketing.
The object of this research is limited to German premium car brands and consumers
in urban areas. As a first step, this procedure is effective and necessary, because for
instance it is hardly possible to collect rural data. However, the premium market
segmentation is a constraint which should be extended, because prior research
shows significantly different consumer behaviour with regard to other segments like
volume or low-cost brands. China-specific knowledge on this topic is something that
needs researching, in order to scientifically understand, and – from a company´s per-
spective – to penetrate the whole market effectively and efficiently.
With regard to consumers as the database of this study, representativeness is an is-
sue, because the total population of the delimited group is unknown. As a result, the
representativeness of the sample cannot be assessed directly. The discussion of the
structure of the sample (s. Chapter 5.2.4), and especially the ARMSTRONG/OVER-
TON-test (1977) indicate that the findings are sufficiently representative for the delim-
itated object of research. However, they should not be generalised. Thus, future re-
search could build on this issue. Gathering information about the total population
would be advantageous; particularly with regard to the point mentioned previously:
the need for future research on market segments.

Limitations and Further Research Needs
255
The suggestion and the use of brand loyalty as a success indicator is seen as limita-
tion in some ways, because for instance loyalty does not necessarily lead to econom-
ic success. Future research could incorporate the variety of outcomes, in order to
broaden the understanding of the after-sales success chain. Second, the explained
variance of brand loyalty, due to the research model, is 64,8%. Thus, 35,2% are re-
lated to unobserved variables and measuring errors. The figure itself is relatively high,
especially because this research is limited to after-sales as one dimension of the re-
lationship of the consumer to the seller which leads to brand loyalty. However, the
unobserved variables predicting brand loyalty should be figured out and incorporated
so that brand loyalty can be explained in all of its facets. Third, in this research, brand
loyalty is considered to be mainly attitudinal. Notably, every approach, including the
behavioural and the relational, is imperfect. As a result, future replications of this re-
search may take this into account by measuring all three dimensions, so the complex
phenomenon of brand loyalty can be described comprehensively without being even-
tually biased in any technical way of measurement.
This study introduces SCHWARTZ´s individual level values as an advantageous op-
erationalisation approach of culture for the automotive marketing, which overcomes
the limitation of just presenting national comparisons without also uncovering cultural
causalities. The quality criteria of PLS-SEM show that this approach is appropriate
and the results are well able to explain the researched aspects. However, this study
should be replicated, for instance on further markets, so as to validate advantages,
and more importantly, to discuss problems which might occur in other research set-
tings so that a comprehensive picture of the most suitable approach can be drawn.
This study has shown that cultural effects influence important aspects of consumer
behaviour, but the focus on the industry leads to subgroup analysis. In contrast, prior
research often focussed on national comparisons, which generally neglect the im-
portance of subgroups. As a result, cultural analysis even in applied business re-
search settings, is mostly concerned with one specific level. Future research should
make considerable efforts to enlarge this limited perspective, by focussing on simul-
taneously important levels of culture, such as the macro-level (i.e. nation or country),
the meso-level (i.e. subgroups such as regions, religions, social layers, etc.), and to
the micro-level, which concerns individuals or culturally affected behaviour.

General Discussion
256
This study uses the widely accepted and manifold applied approach of ten distinct in-
dividual level values, because it effectively combines a high level of detail with the
option of a relatively short operationalisation (21 items). If, as in this study, require-
ments such as path model parsimony and limited acceptance of the questionnaire’s
length have to be accounted for, then the approach is favourable. But if greater re-
sources are available, then future research should incorporate the recently presented
refined theory of basic values (s. Chapter 4.4.3.2), which offers a finer set of 19 dis-
tinct individual level values measured by 57 items. Besides the level of detail, this
approach provides superior cross-cultural invariance, which is important if a large
number of countries or cultures has to be compared.
In line with the need to extend the level of values or level of detail in future research,
the findings of this study on moderating effects describe a reasonable limitation. Var-
ious individual level values become significant if subgroups are considered. This
study shows that moderating effects have a strong influence in China, but the mod-
erating effects that were discussed are not exhaustive. It is very likely that further un-
known factors are significant. Future research is needed to take this up, in order to
explain today’s unobserved heterogeneity. This should be addressed, particularly
with respect to the following issues of the previous Chapter 6.2 and are therefore
considered in detail there: cultural subgroups, external situational pressure, which
might weaken (or cover) cultural influences, and finally the possibility of cultural
change.
With regard to the latter aspect, the difficulty is that there is not a single definition of
culture, and culture is therefore often interpreted differently. However, there are indi-
cations that culture is not always as stable as it was long considered to be. By impli-
cation this research raises the question whether it is likely that broad cultural dimen-
sions are relatively stable, and finely distinct sub-dimensions (as revealed via individ-
ual level values) might be more strongly affected by cultural shifts. Here again, future
research should consider the 19-value approach, as here three hierarchical levels
are incorporated, easily applicable and therefore comparable.
The limitations mentioned here are not exhaustive, but due to their importance highly
significant for future research.

References
257
References
A
Aaker D. A. (1996): Building strong brands, New York: Free Press.
Aga, M./Safakli, O. V. (2007): An Empirical Investigation of Service Quality and Customer
Satisfaction in Professional Accounting Firms: Evidence from North Cyprus, in: Prob-
lems and Perspectives in Management, Vol. 5 (3), pp. 84-98.
Agrawal, M. (1993): Review of a 40-year debate in international advertising: Practitioner and
academician perspectives to the standardization/adaptation issue, in: International
Marketing Review, Vol. 12 (1), pp. 26-48.
Andaleeb, S. S./Basu, A. K. (1994): Technical complexity and consumer knowledge as mod-
erators of service quality evaluation in the automobile service industry, in: Journal of
Retailing, Vol. 70 (4), pp. 367-381.
Andreassen, W. T./Lindestad, B. (1998): Customer loyalty and complex services: The impact
of corporate image on quality, customer satisfaction and loyalty for customers with
varying degrees of service expertise, in: International Journal of Service Industry
Management, Vol. 9 (1), pp. 7-23.
Annacker, D./Hildebrandt, L (2002): Unobservable effects in structural models of business
performance, in: Discussion Papers, Interdisciplinary Research Project 373: Quantifi-
cation and Simulation of Economic Processes, No. 2002,22, available online at
http://nbn-resolving.de/urn:nbn:de:kobv:11-10048804, accessed: 29/4/2014.
Amine, L. S./Chao, M. C. H./Arnold, M. J. (2005): Exploring the practical effects of country of
origin, animosity, and price-quality issues: two case studies of Taiwan and Acer in
China, in: Journal of International Marketing, Vol. 13 (2), pp. 114-150.
Amini, M. M./Retszaff-Roberts, D./Bienstock, C. C. (2005): Designing a reverse logistics op-
eration for short cycle time repair services, in: International Journal of Production
Economics, Vol. 96 (3), pp. 369-380.
Arnould, E. J./Thompson, C. J. (2005): Consumer Culture Theory (CCT): Twenty Years of
Research, in: Journal of Consumer Research, Vol. 31 (4), pp. 868-882.
Armistead, C./Clark, G. (1991): A framework for formulating after-sales support strategy, in:
International Journal of Operations and Production Management, Vol. 11 (3), pp. 111-
124.

References
258
Arthur D. Little (n. a.) (2011): China´s Automotive Market, in: Automotive Viewpoint, available
online at http://www.adlittle.com/automotive-viewpoints.html?&view= 525, accessed
25/3/2014.
Asugman, G./Johnson, J. L./McCullough, J. (1997): The Role of After-Sales Service in Inter-
national Marketing, in: Journal of International Marketing, Vol. 5 (4), pp. 11-28.
Atsmon, Y./Magni, M. (2012): Meet the 2020 Chinese consumer, in: McKinsey Quarterly,
March, pp. 1-8.
Audi China (n. a.) (2014): Audi China, available online at http://www.audi.cn/cn/brand/en.html
and there especially http://contact.audi.cn/dealer_procity.action?en=1 & http://www.a
udi.cn/cn/brand/en/about/careers01/Audi_China_general/Departments.html, ac-
cessed 4/4/2014.
Audi China (n. a.) (2014): Audi in China, available online at http://www.audi.cn/cn/brand/en/a
out/audi_branding/corp_intro/audi_in_china.html, accessed 4/4/2014.
B
Baader, A./Montanus, S./Sfat, R. (2006): After Sales Services – mit produktbegleitenden
Dienstleistungen profitabel wachsen, in: Barkawi, K. et al. (Pub.), Erfolgreich mit After
Sales Services – Geschäftsstrategien für Servicemanagement und Ersatzteillogistik,
pp. 3-14, Berlin/Heidelberg: Springer.
Bachmann, A. (2009): Subjektive versus objektive Erfolgsmaße, in: Albers, S. et al. (Pub.),
Methodik der empirischen Forschung, 3. ed, pp. 89-102, Wiesbaden: Gabler.
Backhaus, K./Erichson, B./Weiber, R. (2011): Fortgeschrittene Multivariate Analysemethoden
– Eine anwendungsorientierte Einführung, Berlin/Heidelberg: Springer.
Backhaus, K./Erichson, B./Plinke, W./Weiber, R. (2006): Multivariate Analysemethoden – Ei-
ne anwendungsorientierte Einführung, 11. ed., Berlin: Springer.
Baraldi, A. N./Enders, C. K. (2010): An introduction to modern missing data analyses, in:
Journal of School Psychology, Vol. 48, pp. 5-37.
Bardi, A./Schwartz, S. H. (2003): Values and Behavior: Strength and Structure of Relations,
in: Personality and Social Psychology Bulletin, Vol. 29 (10), pp. 1207-1220.
Barkawi, K./Baader, A./Montanus, S. (Pub.) (2006): Erfolgreich mit After Sales Services –
Geschäftsstrategien für Servicemanagement und Ersatzteillogistik, Berlin/Heidelberg:
Springer.

References
259
Barthel, K./Böhler-Baedeker, S./Bormann, R./Dispan, J./Fink, P./Koska, T./Meißner, H.-
R.,Pronold, F. (2010): Zukunft der deutschen Automobilindustrie – Herausforderun-
gen und Perspektiven für den Strukturwandel im Automobilsektor, in: Friedrich-Ebert-
Stiftung (Pub.), Diskussionspapier der Arbeitskreise Innovative Verkehrspolitik und
Nachhaltige Strukturpolitik der Friedrich-Ebert-Stiftung, available online at http://librar
y.fes.de/pdf-files/wiso/07703.pdf, accessed 6/9/2013.
Baumbach, M. (2004): After-Sales-Management im Maschinen- und Anlagenbau, 2. ed., Re-
gensburg: Transfer-Verlag.
Baumgarth, C./Evanschitzky, H. (2009): Erfolgsfaktorenforschung, in: Baumgarth, C./Eisend,
M./Evanschitzky, H. (Pub.), Empirische Mastertechniken – Eine anwendungsorientier-
te Einführung in die Marketing- und Managementforschung, pp. 235-261, Wiesbaden:
Gabler/GWV Fachverlage.
Baumgartner, H. (2012): Repetitive Purchase Behavior, in: Diamantopoulos, A. et al. (Pub.),
Quantitative Marketing and Marketing Management – Marketing Models and Methods
in Theory and Practice, pp. 401-422, Wiesbaden: Springer/Gabler.
Bearden, W. O./Netemeyer R. G/ Haws K. L. (2011): Handbook of Marketing Scales: Multi-
ple-Item Measures for Marketing and Consumer Behavior Research, 3. ed., Thou-
sand Oaks: Sage Publications.
Becker, H. (2010): Darwins Gesetz in der Automobilindustrie – Warum deutsche Hersteller
zu den Gewinnern zählen, Heidelberg et al.: Springer.
Becker, H. (2007): Auf Crashkurs: Automobilindustrie im globalen Verdrängungswettbewerb,
2. ed., Berlin et al.: Springer.
Becker, H./Straub, N. (2007): Drachenflug: Wirtschaftsmacht China quo vadis? Berlin et al.:
Springer.
Becker, J.-M./Klein, K./Wetzels, M. (2012): Hierarchical Latent Variable Models in PLS-SEM:
Guidelines for Using Reflective-Formative Type Models, in: Long Range Planning,
Vol. 45, pp. 359-394.
Bei, L.-T./Chiao, Y.-C. (2001): An Integrated Model for the Efects of Perceived Product, Per-
ceived Service Quality, and Perceived Price Fairness on Consumer Satisfaction and
Loyalty, in: Journal of Consumer Satisfaction Dissatisfaction and Complaining Behav-
ior, Vol. 14, pp. 125-140.
Steenkamp, J.-B. E. M. (2001): The role of national culture in international marketing re-
search, in: International Marketing Review, Vol. 18 (1), pp. 30-44.

References
260
Berekoven, L./Eckert, W./Ellenrieder, P. (2009): Marktforschung – Methodische Grundlagen
und praktische Anwendung, 12. ed., Wiesbaden: Gabler/GWV Fachverlage.
Berry, J. W. (1999): Emics and Etics: A symbiotic conception, in: Culture & Psychology,
Vol. 5 (2), pp. 165-171.
Berry, J. W. (1989): Imposed Etics–Emics–Derived Etics: The operationalization of a compel-
ling idea, in: International Journal of Psychology, Vol. 24 (6), pp. 721-735.
Berylls (n. a.) (2013): 2. ”Global Top Automotive Supplier 2012”-Studie, München: Berylls
Strategy Advisors GmbH.
Blanchet, M./Rade, J. (2007): The sales and after-sales challenge: capturing value along the
car lifecycle, in: Gottschalk, B./Kalmbach, R. (Pub.), Mastering Automotive Challeng-
es, pp. 171-215, London/Philadelphia: Kogan Page.
Bloemer, J./De Ruyter, K./Peeters, P. (1998): Investigating drivers of bank loyalty: the com-
plex relationship between image, service quality and satisfaction, in: International
Journal of Bank Marketing, Vol. 16 (7), pp. 276-286.
Bloemer, J. M. M./Pauwels, K. H. (1998): Explaining brand loyalty, dealer sales loyalty and
dealer after-sales loyalty: The influence of satisfaction with the car, satisfaction with
the sales service and satisfaction with the after-sales service, in: Journal of Consumer
Satisfaction Dissatisfaction and Complaining Behaviour, Vol. 11, pp. 78-90.
Bloemer, J. M. M./Lemmink (1992): The Importance of Customer Satisfaction in Explaining
Brand and Dealer Loyalty, in: Journal of Marketing Management, pp. 351-364.
BMW China (n. a.) (2014): BMW Aftersales, available online http://www.bmw.com.cn/cn/en/o
wners/aftersales/overview.html, accessed 4/4/2014.
BMW Group (n. a.) (2012): Wo wird was gebaut, available online at http://www.bmwgroup.co
m/d/nav/index.html?../0_0_www_bmwgroup_com/home/home.html&source=oveview,
accessed 10/5/12.
Bodensteiner, K. (2006): Kundenbindung in vertikalen Kontraktmarketingsystemen – eine
Analyse anhand des Marktes für Ersatzteile der Automobilwirtschaft, in: Hünerberg et
al. (Pub.), Gabler Edition Wissenschaft: Forum Marketing, Wiesbaden: Deutscher
Universitäts-Verlag/GWV Fachverlage.
Bollen, K. A. (2011): Evaluating Effect, Composite, and Causal Indicators in Structural Equa-
tion Models. in: MIS Quarterly, Vol. 35 (2), pp. 359-372.

References
261
Borth, B.-O. (2004): Beschwerdezufriedenheit und Kundenloyalität im Dienstleistungsbereich
– Kausalanalysen unter Berücksichtigung moderierender Effekte, in: Hünerberg,
R./Töpfer, A. (Pub.), Forum Marketing, Wiesbaden: Deutscher Universitätsver-
lag/GWV Fachverlage.
Bortz, J./Schuster, C. (2010): Statistik für Human-und Sozialwissenschaftler, 7. ed., Berlin et
al.: Springer.
Botschaft der Bundesrepublik Deutschland Peking (n. a.) (2013), Wirtschaftsdaten kompakt,
state: first half-year 2013, available online at http://www.china.diplo.de/contentlob/344
3046/Daten/3493380/1201Wirtschaftsdatendd.pdf, accessed 1/10/2013.
Brady, M. K./Cronin, J. J. Jr. (2001): Some New Thoughts on Conceptualizing Perceived
Service Quality: A Hierarchical Approach, in: Journal of Marketing, Vol. 65 (3), pp. 34-
49.
Brax, S. (2005): A manufacturer becoming service provider – challenges and a paradox, in:
Managing Service Quality, Vol. 15 (2), pp. 142-155.
Brock, D. (2009): Aftersales Management – Creating a Successful Aftersales Strategy to Re-
duce Costs, Improve Customer Service and Increase Sales, London/Philadelphia:
Kogan Page.
Brunnermeier, S. B./Martin, S. A. (2002): Interoperability costs in the US automotive supply
chain, in: Supply Chain Management, Vol. 7 (2), pp. 71-82.
Bryson, J./Griffith, Z. (2013): How much does slower Chinese growth matter?, in: ABA Ban-
king Journal, Vol. 105 (8), p. 8.
Bundesverband CarSharing e.V. (n. a.) (2013): Jahresbericht 2012/2013 – Das Jahr des
CarSharing: fast 500.00 CarSharing-Kunden in Deutschland, available online at http://w
ww.carsharing.de/sites/default/files/uploads/ueber_den_bcs/pdf/bcs_ja hresbericht_2012
-13.pdf, accessed 6/9/2013.
Bundschuh, R. G./Dezvane, T. M. (2003): How to make after-sales services pay off, in:
McKinsey Quarterly, Vol. 4, pp. 116-127.
Burmann, C. (1991): Konsumentenzufriedenheit als Determinante der Marken- und Händler-
loyalität, in: Marketing ZFP, Vol. 4, pp. 249-258.
Burnham, T. A./Frels, J. K./Mahajan, V. (2003): Consumer Switching Costs: A Typology, An-
tecedents, and Consequences, in: Journal of the Academy of Marketing Science, Vol.
31 (2), pp. 109-126.

References
262
C
CAAM – China Association of Automobile Manufacturers (n. a.) (2013): The passenger cars
market share of Chinese brand continued to decline, available online at
http://www.caam.org.cn/AutomotivesStatistics/20131014/1705103416.html, accessed
14/10/2013.
Calvin, J./Schinckel, R. (1995): International Passenger Car After-Sales Service, in: Hüner-
berg, R. et al. (Pub.), Internationales Automobilmarketing – Wettbewerbsvorteile
durch marktorientierte Unternehmensführung, pp. 475-488, Wiesbaden: Gabler.
Cateora, P. R./Ghauri, P. N. (2000): International Marketing, London et al.: McGraw-Hill.
Cavalieri, S./Gaiardelli, P./Ierace, S. (2007): Aligning strategic profiles with operational met-
rics in after-sales service, in: International Journal of Productivity and Performance
Management, Vol. 56 (5/6), pp. 436-455.
Chin, W. W. (2010): How to Write Up and Report PLS Analyses, in: Esposito Vinzi, V. et al.
(Pub.), Handbook of Partial Least Squares – Concepts, Methods and Applications, pp.
665-690, Berlin/Heidelberg: Springer.
Chin, W. W. (1998): The Partial Least Squares Approach to Structural Equation Modeling, in:
Marcoulides, G. A (Pub.), Modern Methods for Business Research, pp. 295-336,
Mahwah: Lawrence Erlbaum.
Christophersen, T./Grape, C. (2009): Die Erfassung latenter Konstrukte mit Hilfe formativer
und reflektiver Messmodelle, in: Albers et al. (Pub.), Methodik der empirischen For-
schung, 3. ed., pp. 103-118, Wiesbaden: Springer Fachmedien.
Cieciuch, J./Davidov, E./Schmidt, P./Algesheimer, R./Schwartz, S. H. (2014a): Comparing
results of an exact vs. an approximate (Bayesian) measurement invariance test: a
cross-country illustration with a scale to measure 19 human values, in: Frontiers in
Psychology. Vol. 5, pp. 1-10.
Cieciuch, J./Davidov, E./Vecchion, M./S. H. Schwartz (2014b): A Hierarchical Structure of
Basic Human Values in a Third-Order Confirmatory Factor Analysis, in: Swiss Journal
of Psychology, Vol. 73 (3), pp. 177-182.
Cieciuch, J./Davidov, E./Vecchione, M./Beierlein, C./Schwartz, S. H. (2014c): The Cross-
National Invariance Properties of a New Scale to Measure 19 Basic Human Values A
Test Across Eight Countries, in: Journal of Cross-Cultural Psychology, pp. 1-13.

References
263
Cieciuch, J./Davidov, E. (2012): A comparison of the invariance properties of the PVQ-40
and the PVQ-21 to measure human values across German and Polish Samples, in:
Survey Research Methods, Vol. 6 (1), pp. 37-48.
Coase, R. H. (1937): The nature of the firm, in: Economica, Vol. 4 (16), pp. 386-405.
Cohen, M. A./Agrawal, N./Agrawal, V. (2006): Winning in the aftermarket, in: Harvard Busi-
ness Review, Vol. 84 (5), pp. 129-138.
Cohen, M. A./Cull, C./Lee, H. L./Willen, D. (2000): Saturn‘s supply-chain innovation: high
value in after-sales service, in: Sloan Management Review, Vol. 41 (4), pp. 93-101.
Cohen, M. A./Whang, S. (1997): Competing in product and service: a product life-cycle mod-
el, in: Management Science, Vol. 43 (4), pp. 535-545.
Cohen, M. A./Zheng, Y.-S./Agrawal, V. (1997): Service parts logistics: A benchmark analysis,
in: IIE Transactions, Vol. 29 (8), pp. 627-639.
Cohen, M. A./Lee, H. L. (1990): Out of touch with customer needs? Spare parts and after
sales service, in: Sloan Management Review, Vol. 31 (2), pp. 55-66.
Conlon, E./Devaraj, S./Matta, K. F. (2001): The Relationship Between Initial Quality Percep-
tions and Maintenance Behavior: The Case of the Automotive Industry, in: Manage-
ment Science, Vol. 47 (9), pp. 1191-1202.
Corsten, H./Gössinger, R. (2007): Dienstleistungsmanagement, 5. ed., München: Olden-
bourg Wissenschaftsverlag.
Craig, C. S/Douglas, P. (2006): Beyond national culture: implications of cultural dynamics for
consumer research, in: International Marketing Review, Vol. 23 (3), pp. 322-242.
Cronin J. J. Jr./Taylor, S. A. (1994): SERVPERF versus SERVQUAL: Reconciling Perfor-
mance-Based and Perceptions-Minus-Expectations Measurement of Service Quality,
in: Journal of Marketing, pp. 125-131.
Cronin J. J. Jr./Taylor, S. A. (1992): Measuring Service Quality: A Reexamination and Exten-
sion, in: Journal of Marketing, pp. 55-68.
Cui, G./Liu, Q. (2001): Emerging market segments in a transitional economy: a study of ur-
ban consumers in China, in: Journal of International Marketing, Vol. 9 (1), pp. 84-106.
D
Dahlhoff, D/Eickhoff, J. (2014): Den Automobilvertrieb und -handel markengerecht aufbauen
und steuern, in: Esch, F.-R. (Pub.), Strategie und Technik des Automobilmarketing,
pp. 215-236, Wiesbaden: Springer/Gabler.

References
264
Daimler AG (n. a.) (2014): Geschäftsbericht 2013, available online at http://www.daimler.com
/Projects/c2c/channel/documents/2432178_Daimler_2013_Geschaeftsbericht.pdf,
accessed 4/4/2014.
Dangelmaier, W./Emmrich, A./Gajewski, T. (2006): Referenzmodell zur Serviceproduktge-
staltung in der Automobilzulieferindustrie, in: Barkawi, K. et al. (Pub.), Erfolgreich mit
After Sales Services, pp. 153-177, Berlin/Heidelberg: Springer.
DAT – Deutsche Automobil Treuhand GmbH (n. a.) (2015): DAT-Report 2015, available
online at http://www.autohaus.de/fm/3478/DAT-Report_2015.pdf, accessed 26/8/2015.
Davidov, E./Schmidt, P./Schwartz, S. H. (2008): Bringing values back in – The adequacy of
the European Social Survey to measure values in 20 countries, in: Public Opinion
Quarterly, Vol. 72 (3), pp. 420-445.
Davies, A. (2004): Moving base into high-value integrated solutions: a value stream ap-
proach, in: Industrial and Corporate Change, Vol. 13 (5), pp. 727-756.
de Mooij, M. (2014): Global Marketing and Advertising: Understanding Cultural Paradoxes,
4. ed., Thousand Oaks et al.: Sage Publications.
de Mooij, M./Hofstede, G. (2011): Cross-Cultural Consumer Behavior: A review of Research
Findings, in: Journal of International Consumer Marketing, Vol. 23, pp. 181-192.
Deng, Z./Lu, Y./Wei, K. K./Zhang, J. (2010): Understanding customer satisfaction and loyalty:
An empirical study of mobile instant messages in China, in: International Journal of
Information Management, Vol. 30, pp. 289-300.
Dess, G. G./Robinson, R. B. (1984): Measuring organizational performance in the absence of
objective measures: The case of the privately-held firm and conglomerate business
unit, in: Strategic Management Journal, Vol. 5 (3), pp. 265-273.
Devan, J./Rowland, M./Woetzel, J. (2009): A consumer paradigm for China, in: McKinsey
Quarterly, August 2009, pp. 1-9, available online at http://unpan1.un.org/Intradoc/grou
ps/public/documents/apcity/unpan049280.pdf, accessed 2/6/2013.
Devaraj, S./Matta, K. F./Conlon, E. (2001): Product And Service Quality: The Antecedents Of
Customer Loyalty In The Automotive Industry, in: Production and Operations Man-
agement, Vol. 10 (4), pp. 424-439.
Diamantopoulos, A. (2011): Incorporating Formative Measures into Covariance-Based Struc-
tural Equation Models, in: MIS Quarterly, Vol. 35 (2), pp. 335-358.

References
265
Diamantopoulos, A./Siguaw, J. A. (2006): Formative Versus Reflective Indicators in Organi-
zational Measure Development: A Comparison and Empirical Illustration, in: British
Journal of Management, Vol. 17, pp. 263-282.
Diamantopoulos, A./Winkelhofer, H. M. (2001): Index Construction with Formative Indicators:
An Alternative to Scale Development, in: Journal of Marketing Research, Vol. 38 (2),
pp. 269-277.
Dick, A. S./Basu, K. (1994): Customer Loyalty: Toward an Integrated Conceptual Framework,
in: Journal of the Academy of Marketing Science, Vol. 22 (2), pp. 99-113.
Diez, W. (2012): Die internationale Wettbewerbsfähigkeit der deutschen Automobilindustrie –
Herausforderungen und Perspektiven, München: Oldenbourg Wissenschaftsverlag.
Diez, W. (2010): Zeitwende im Automobilservice, Nürtingen-Geislingen: Institut für Automo-
bilwirtschaft (IFA) an der Hochschule für Wirtschaft und Umwelt.
Diez, W. (2009): Automobil-Marketing – Navigationssysteme für neue Absatzstrategien, E-
Book, 5. ed., München: mi-Wirtschaftsbuch/FinanzBuch.
Diez, W./Kohler, M. (2010): Otto-, Diesel, Elektromotor – wer macht das Rennen?, in: Indust-
rie und Handelskammer Region Stuttgart (Pub.), available online at http://www.stuttga
rt.ihk24.de/linkableblob/sihk24/serviceleiste/Publikationen/Branchen/979512/.5./data/
Broschuere_Gruene_Mobilitaet-data.pdf;jsessionid=6DD3BBE9A034D4B4CAE371C
18A4DC884.repl23, accessed 25/9/2013.
Diez, W./Reindl, S. (2005a): Faszination Service, Hamburg: Auto Business Services.
Diez, W./Reindl, S. (2005b): Das Automobil aus verkehrs- und politischer Sicht, in: Diez, W.
et al. (Pub.), Grundlagen der Automobilwirtschaft, 4. ed., pp. 21-69, München: Auto
Business Verlag.
Diez, W./Reindl, S./Brachat, H. (Pub.) (2012): Grundlagen der Automobilwirtschaft – Das
Standardwerk für Ihren Erfolg, 5. ed., München: Autohaus Buch und Formular.
Dillerup, R./Stoi, R. (2011): Unternehmensführung, 3. ed., München: Verlag Franz Vahlen.
Dirlenbach, H. C.-P. (2009): Erfolgreiches Management von After-Sales-Service-Innovatio-
nen in der Automobilindustrie – Eine Mixed-Methods-Analyse, in: Schuh, G. (Pub.),
Schriftenreihe Rationalisierung und Humanisierung, Vol. 94, Aachen: Shaker Verlag.
Doctoroff, T. (2005): Billions: Selling To The New Chinese Consumer, New York et al.: Pal-
grave Macmillan.
Doll, N./Erling, N./Trentmann, N. (2013): Chinas Autos auf dem Weg nach Westen, in: Die
Welt – iPad Edition, 22/4/2013.

References
266
Dombrowski, U./Engel, C./Schulze, S. (2011): Scenario Management for Sustainable Strate-
gy Development in the Automotive Aftermarket, in: Hesselbach, J./Herrmann, C.
(Pub.), Functional Thinking for Value Creation: Proceedings of the 3rd CIRP Interna-
tional Conference on Industrial Product Service Systems, pp. 285-290, Ber-
lin/Heidelberg: Springer.
Doran, D. (2004): Rethinking the supply chain: an automotive perspective, in: Supply Chain
Management, Vol. 9 (1), pp. 102-109.
Dorka, M. (2012): Bancassurance in Deutschland – Herausforderungen und Gestaltungs-
möglichkeiten des Vertriebsweges Bancassurance im Versicherungsverkauf unter
besonderer Berücksichtigung empirischer Erfolgsfaktoren, in: Zerres, M./Zerres, C.
(Pub.), Hamburger Schriften zur Marketingforschung, Vol. 87, München/Mering: Rai-
ner Hampp Verlag.
Douglas, S. P./Craig, C. (1983): International Marketing Research, Prentice-Hall: New Jersey.
Duden (n. a.) (2013): Ethnozentrismus, available online at http://www.duden.de/rechtschreib
ung/Ethnozentrismus, accessed 9/6/2013.
Dudenhöffer, F./Wiegand, P./Neuberger, K./Steinel, J. (2005): Entwicklungen und Erfolgsfak-
toren im Automobilvertrieb – Gemeinschaftsstudie von KPMG und CAR, Ber-
lin/Gelsenkirchen: KPMG/CAR.
Düsing, R. (1997): Betriebswirtschaftliche Anwendungsbereiche Konnektionistischer Syste-
me, in: Barth, K. et al. (Pub.), Duisburger Betriebswirtschaftliche Schriften, Vol. 14,
Hamburg: S+W Steuer und Wirtschaftsverlag.
E
Ebel, B./Hofer, M.B./Al-Sibai, J. (Pub.) (2004): Automotive Management – Strategie und
Marketing in der Automobilwirtschaft, Berlin et al.: Springer.
Eberl, M. (2010): An Application of PLS in Multi-Group Analysis: The Need for Differentiated
Corporate-Level Marketing in the Mobile Communications Industry: in: Esposito Vinzi,
V. et al. (Pub.), Handbook of Partial Least Squares – Concepts, Methods and Appli-
cations, pp. 487-514, Berlin/Heidelberg: Springer.
Eckhardt, G. M (2004): The Role of Culture in Conducting Trustworthy and Credible Qualita-
tive Business Research in China, in: Marschan-Piekkari R., Welch C. (Pub.), Hand-
book of Qualitative Research Methods for International Business, pp. 402-419, Chel-
tenham/Northampton: Edward Elgar Publishing.
References
267
Eckhardt, G. M./Houston, M. J. (2008): On the malleable nature of product meaning in China,
in: Journal of Consumer Behaviour, Vol. 7 (6), pp. 484-495.
Edvardsson, B. (1997): Quality in new service development: Key concepts and a frame of
reference, in: International Journal of Production Economics, Vol. 52, pp. 31-46.
Edvardsson, B./Tronvoll, B./Gruber, T. (2011): Expanding understanding of service exchange
and value co-creation: a social construction approach, in: Journal of Academy of Mar-
keting Science, Vol. 39 (2), pp. 327-339.
Edvardsson, B./Gustafsson, A./Roos, I. (2005): Service portraits in service research: a critical
review, in: International Journal of Service Industry Management, Vol. 16 (1), pp. 107-
121.
Edwards, K.D. (1996): Prospect Theory: A Literature Review, in: International Review of Fi-
nancial Analysis, Vol. 5 (1), pp. 19-38.
Emrich, C. (2014): Interkulturelles Marketing-Management – Erfolgsstrategien, Konzepte,
Analysen, 3. ed., Wiesbaden: Springer/Gabler.
Emrich, C. (2007): Interkulturelles Marketing-Management – Erfolgsstrategien, Konzepte,
Analysen, Wiesbaden: Deutscher Universitäts-Verlag/GWV Fachverlage.
Engelen, A./Brettel, M. (2011): A cross-cultural perspective of marketing departments‘ influ-
ence tactics, in: Journal of International Marketing, Vol. 19 (2), pp. 73-94.
Esch, F.-R. (Pub.) (2013): Strategie und Technik des Automobilmarketing, Wiesbaden:
Springer/Gabler.
Esch, F.-R. (2010): Strategie und Technik der Marken-Führung, 6. ed., München: Verlag
Franz Vahlen.
Esch, F.-R./Isenberg, M. (2013): Markenidentität und Markenpositionierung festlegen, in:
Esch, F.-R. (Pub.), Strategie und Technik des Automobilmarketing, pp. 35-57, Wies-
baden: Springer/Gabler.
Esch, F.-R./Rühl, V./von Einem, E./Gawlowski, D. (2012): „Deutsche Marken dominieren“, in:
Horizont, 27.9.2012, S. 84, available online at http://www.esch-bra nd.com/4644-
deutsche-marken-dominieren/, accessed 13/6/2013., as well as the press release:
Aktuelle Studie des AIM zum magischen Dreieck Markenstärke, Servicequalität und
Kundenbindung aus Sicht der Kunden, available online at http://www.ebs.edu/artikel.h
tml?&L=0&cHash=841599ca77f3487e5626215a5acb8b5e&tx_ttnews%5Btt_news%5
D=1550, accessed 13/6/2013.

References
268
Esch, F.-R./Herrmann, A./Sattler,H. (2008): Marketing – Eine Managementorientierte Einfüh-
rung, 2. ed., München: Verlag Franz Vahlen.
Etzioni, A. (1964): Modern organizations, Englewood Cliffs (N. J.): Prentice-Hall.
Eurostat (n. a.) (2013): Reale BIP-Wachstumsrate, available online at http://epp.eurostat.ec.e
uropa.eu/tgm/table.do?tab=table&init=1&plugin=1&language=de&pcode=tec00115,
accessed 8/10/2013.
F
Fam, K.-S./Waller, D. S./Ong F.-S./Yang, Z. (2008): Controversial product advertising in Chi-
na: perceptions of three generational cohorts, in: Journal of Consumer Behaviour, Vol.
7 (6), pp. 461-469.
Fantapié Altobelli, C./Hoffmann, S. (2011): Grundlagen der Marktforschung, Kon-
stanz/München: UVK Verlagsgesellschaft.
Festinger, L. (1957): A Theory of Cognitive Dissonance, Stanford: Stanford University Press.
Finn, D. W./Lamb, D. W. Jr. (1991): An Evaluation of the Servqual Scales in a Retailing Set-
ting, in: Association for Consumer Research (Pub.), NA – Advances in Consumer Re-
search, Vol. 18, pp. 483-490.
Fitzsimmons, J. A./Fitzsimmons, M. J./Bordoloi, K. (2014): Service Management – Opera-
tions, Strategy, Information Technology, 8. ed., New York: McGraw-Hill.
Flees, L./Senturia T. (2008): After-Sales Service Key to Retaining Car Buyers, in: Business
Week Online, 23.09.2008, available online at http://www.bain.com/publications/article
s/after-sales-service-key-to-retaining-car-buyers-businessweek.aspx, accessed
7/1/2014.
Flake, K. (2007): Controlling in mittelständischen Unternehmen – Ausgestaltung, Einflussfak-
toren der Instrumentennutzung und Einfluss auf die Bankkommunikation, Inaugural-
Dissertation, available online at http://d-nb.info/98380205X/34, accessed 11/6/15.
Flint, D. J. (2006): Innovation, symbolic interaction and customer valuing: thoughts stemming
from a service-dominant logic of marketing, in: Marketing Theory, Vol. 6 (3), pp. 349-
362.
Fornell, C./Larcker, D. (1981): Evaluation structural equation models with unobservable vari-
ables and measurement error, in: Journal of Marketing Research, Vol. 18, pp. 39-50.

References
269
Forsmann, D./Haenecke, H./Zerres, C./Zerres, M. (2004): Erfolgsfaktorenforschung, availa-
ble online at http://bookboon.com/de/erfolgsfaktorenforschung-ebook, accessed
19/6/2013.
Foscht, T. (2002): Kundenloyalität – Integrative Konzeption und Analyse der Verhaltens - und
Profitabilitätswirkungen, in: Forschungsberichte aus der Grazer Management Werk-
statt, Liebmann, H. P./Schneider, U. (Pub.), Wiesbaden: Deutscher Universitäts-
Verlag.
Foscht, T./Swoboda, B. (2011): Käuferverhalten – Grundlagen, perspektiven, Anwendungen,
4. ed., Wiesbaden: Gabler.
Frank, B./Abulaiti, G./Herbas Torrico, B./Enkawa, T. (2013): How do Asia’s two most im-
portant consumer markets differ? Japanese–Chinese differences in customer satis-
faction and its formation, in: Journal of Business Research, Vol. 66 (12), pp. 2397-
2405.
Fraß, A. (2012): Automobilzuliefererindustrie in Deutschland, in: Zerres, M./Zerres, C. (Pub.),
Hamburger Schriften zur Marketingforschung, Vol. 88, München/Mering: Rainer
Hampp Verlag.
Freiling, J. (2006): Entrepreneurship – Theorethische Grundlagen und unternehmerische
Praxis, München: Verlag Franz Vahlen.
Fritz, W. (2004): Die Erfolgsfaktorenforschung – ein Misserfolg?, in: Die Betriebswirtschaft
(DBW), Vol. 64 (5), pp. 623-625.
G
Gaiardelli, P./Cavalieri, S./Saccani, N. (2008): Exploring the relationship between after-sales
service strategies and design for X methodologies, in: International Journal of Product
Lifecycle Management, Vol. 3 (4), pp. 261-278.
Gaiardelli, P./Saccani, N/Songini, L. (2007): Performance measurement of the after-sales
service network – Evidence from the automotive industry, in: Computers in Industry,
Vol. 58, pp. 698-708.
Gallagher, T./Mitchke, M. D./Rogers, M. C. (2005): Profiting from spare parts, in: McKinsey
Quarterly, Vol. 2, pp. 1-4.
Gan, L./Yin, Z./Jia, N./Xu, S./Ma, S./Zheng, L. (2014): Data you need to know about China:
Research Report of China Household Finance Survey 2012, Heidelberg et al.: Sprin-
ger.

References
270
Ganther, R./Issel, H. (2013): Westliche Nutzniesser des Wachstums in den Schwellenlän-
dern, in: UBS Investor´s Guide, 1/2/2013, Frankfurt am Main: UBS AG.
Gao, Y./Liu, Z./Song, S./Zheng, J. (2013): Technological Capacity, Product Position, and
Firm Competitiveness – An Empirical Analysis, in: The Chinese Economy, Vol. 46. (1),
pp. 55-74.
Gebauer, H./Ren, G.-J./Valtakoski, A./Reynoso, J. (2012): Service-driven manufacturing:
provision, evolution and financial impact of services in industrial firms, in: Journal of
Service Management, Vol. 23 (1), pp. 120-136.
Gebauer, H./Tennstedt, F./Elsässer, S./Betke, R. (2010): The Aftermarket in the Automotive
Industry – How to Optimize Aftermarket Performance in Established and Emerging
Markets, available online at http://www.capgemini.com/resource-file-access/resource
/pdf/tl_The_Aftermarket_in_the_Automotive_Industry.pdf, accessed 26/3/2014.
Gebauer, H./Fleisch, E./Friedli, T. (2005): Overcoming the service paradox in manufacturing
companies, in: European Management Journal, Vol. 23 (1), pp. 14-26.
Gefen, D./Straub, D. (2005): A Practical Guide to Factorial Validity Using PLS-Graph: Tutori-
al and Annotated Example, in: Communications of the Association for Information
Systems, Vol. 16, pp. 91-109.
Geinitz, C. (2013): Deutsche Hersteller fahren in China weiter an der Spitze, in: FAZ Online,
22.4.2013, available online at http://www.faz.net/aktuell/wirtschaft/chinesen-fahren-
volkswagen-deutsche-hersteller-fahren-in-china-weiter-an-der-spi tze-12157084.html,
accessed 27/9/2013.
Gerischer, C. A. (2010): Der Zusammenhang zwischen Händler- und Kundenzufriedenheit in
der Automobilwirtschaft – Am Beispiel eines Premium-Automobilherstellers, available
online at http://publikationen.ub.uni-frankfurt.de/frontdoor/index/index/docId/21149,
accessed 6/9/2013.
German Industry & Commerce (n. a.) (Pub.) (2009): BusinessFocus China – Automo-
bilindustrie, Karlsruhe: German Industry and Commerce Verlag.
Gerth, K. (2011): As China goes, so goes the world – How Chinese consumers are trans-
forming everything, New York: Hill and Wang.
Gerth, K. (2003): China made: Consumer Culture and the Creation of the Nation, in: Harvard
East Asian Monographs, Vol. 224, Cambridge et al.: Harvard University Press.

References
271
Goffin, K. (1999): Customer support – A cross-industry study of distribution channels and
strategies, in: International Journal of Physical Distribution and Logistics Management,
Vol. 29 (6), pp. 374–397.
Goffin, K./New, C. (2001): Customer support and new product development – An exploratory
study, in: International Journal of Operations & Production Management, Vol. 21 (3),
pp. 275-301.
Gong, W. (2003): Chinese consumer behavior: a cultural framework and implications, in:
Journal of American Academy of Business, Vol. 3 (1/2), pp. 373-380.
Gottschalk, B./Kalmbach, R. (Pub.) (2007): Mastering automotive challenges, London/Phila-
delphia: Kogan Page.
Gouthier, M. H. J. (2013): Die Produkte und Dienstleistungen aufwerten und weiterentwickeln,
in: Esch, F.-R. (Pub.), Strategie und Technik des Automobilmarketing, pp. 129-147,
Wiesbaden: Springer/Gabler.
Green, N. (2009): Die Entwicklung des Gebrauchtwagenmarktes in China, in: German Indus-
try & Commerce (Pub.), BusinessFocus China – Automobilindustrie, pp. 262-264,
Karlsruhe: German Industry and Commerce Verlag.
Gregori, C. (2006): Instrumente einer erfolgreichen Kundenorientierung – Eine empirische
Untersuchung, in: Hübner, H. et al. (Pub.), Gabler Edition Wissenschaft: Kasseler
Wirtschafts- und Verwaltungswissenschaft, Vol. 22, Wiesbaden: Deutscher Universi-
tätsverlag/GWV Fachverlage.
Gregory, A. M./Parsa, H. G. (2013): Kano’s Model: An Integrative Review of Theory and Ap-
plications to the Field of Hospitality and Tourism, in: Journal of Hospitality Marketing
& Management, Vol. 22 (1), pp. 25-46.
Greving, B. (2009): Messen und Skalieren von Sachverhalten, in: Albers et al. (Pub.), Me-
thodik der empirischen Forschung, 3. ed., pp. 65-78, Wiesbaden: Springer Fach-
medien.
Großkurth, B. (2004): Markenloyalität im Premiumsegment des Automobilmarktes – Deter-
minanten und Wirkbeziehungen, in: Hünerberg, R./Töpfer, A. (Pub.), Gabler Edition
Wissenschaft – Forum Marketing, Wiesbaden: Deutscher Universitäts-Verlag.
Grönroos, C. (1984): A Service Quality Model and its Marketing Implications, in: European
Journal of Marketing, Vol. 18 (4), pp. 36-44.

References
272
Gudergan, S. (2010): Adoption of technologies in industrial after-sales services across cul-
tures, in: International Journal of Services Technology and Management, Vol. 14 (2/3),
pp. 250-258.
Gunasekaran, A./Lai, K.-H. /Cheng, T. C. E. (2008): Responsive supply chain: a competitive
strategy in a networked economy, in: Omega, Vol. 36 (4), pp. 549-564.
Guo, G. (2013): Consumer Behaviour in China, in: Paliwoda, S. et al. (Pub.), Marketing Ma-
nagement in Asia, pp. 20-32, New York/London: Routledge.
H
1 1 : H 8 6 KE 8 , - 7I I M M IH H H HM BK M I I K H
I M 0 H KI /C H H 8I MC IK H- 2HM KH M IH 5 KE M HB 7 P 9I
) JJ ,
1 H E 1 - 5 MCI HIK HM KM 8 M M K HB K K M E H K 0K I B EMI
K H IK C HB in: M CK M SK . MK P KM C M 9I ), pp. )( .
Hair, J. F. Jr./Sarstedt/Hopkins, L./ Kuppelwieser, V. G. (2014a): Partial least squares struc-
tural equation modeling (PLS-SEM) – An emerging tool in business research, in: Eu-
ropean Business Review, Vol. 26 (2), pp. 106-121.
Hair, J. F. Jr./Hult, G. T. M./Ringle, C. M./Sarstedt, M. (2014b): A Primer on Partial Least
Squares Structural Equation Modeling (PLS-SEM), Los Angeles et al.: Sage Publica-
tions.
Hair, J. F./Ringle, C. M./Sarstedt, M. (2011): PLS-SEM: Indeed a silver bullet, in: The Journal
of Marketing Theory and Practice, Vol. 19 (2),pp. 139-152.
Hättich, H. (2009): Markenloyalität im Aftersales-Marketing – Konzept zur Erhöhung der Mar-
kenloyalität in der deutschen Automobilbranche durch Optimierung eines herstellerini-
tiierten Aftersales-Marketing, in: Zerres, M./Zerres, C. (Pub.), Hamburger Schriften
zur Marketingforschung, Vol. 73, München/Mering: Rainer Hampp Verlag.
Han, P.-C. (2013): Confucian Leadership and the Rising Chinese Economy – Implicaions for
Developing Global Leadership, in: The Chinese Economy, Vol. 46 (2), pp. 107-127.
He, H./Mukherjee, A. (2007): I am, ergo I shop: does store image congruity explain shopping
behaviour of Chinese consumers? in: Journal of Marketing Management, Vol. 23 (5/6),
pp. 443-460.

References
273
Hecker, F./Hurth, J./Seeba, H. G. (Pub.) (2012): Strategisches Management im Aftersales-
Service, 2. ed., München: Autohaus Buch und Formular.
Heider, U. H. (2001): Markenbewertung – die Marke als Quelle der Wertschaffung: Eine em-
pirische Analyse am Beispiel der deutschen Automobilindustrie, in: Zerres, M. (Pub.),
Hamburger Schriften zur Marketingforschung, Vol. 16, München/Mering: Rainer
Hampp Verlag.
Henseler, J./Chin, W. W. (2010), A Comparison of Approaches for the Analysis of Interaction
Effects Between Latent Variables Using Partial Least Squares Path Modeling, in:
Structural Equation Modeling, Vol. 17, pp. 82-109.
Henseler, J./Ringle, C. M./Sinkovics, R. R. (2009): The use of partial least squares path
modeling in international marketing, in: Advances in International Marketing, Vol. 20,
pp. 277–319.
Hernandez, M. D./Wang, Y. J./Minor, M. S./Liu, Q. (2008): Effects of superstitious beliefs on
consumer novelty seeking and independent judgment making: Evidence from China,
in: Journal of Consumer Behaviour, Vol. 7 (6), pp. 424-435.
Herzberg, F. (1965): The New Industrial Psychology, in: Industrial/Labour Relations Review,
Vol. 18 (3), pp. 364-376.
Hesse, J. (2004): Erfolgsfaktoren im Vertrieb – Empirische Analysen von Herstellerunter-
nehmen schnelldrehender Konsumgüter, Wiesbaden: Deutscher Universitäts-Verlag.
Heymann, E./Koppel, O./Puls, T. (2011): Elektromobilität – Sinkende Kosten sind conditio si-
ne qua non, in: Deutsche Bank Research (Pub.), Aktuelle Themen 526, available online
at http://www.dbresearch.de/MAIL/DBR_INTERNET_D E-PROD/PROD0000000000277
861.pdf, accessed 9/6/2012.
Hoffmeister, M. (2011): Herausforderungen internationaler Geschäftsbeziehungen aus Sicht
deutscher Unternehmen, in: Mann, A. (Pub.), Herausforderungen der internationalen
marktorientierten Unternehmensführung, pp. 135-149, Wiesbaden: Gabler.
Hofstede, G. (2001): Culture’s consequences: Comparing values, behaviors, institutions and
organizations across nations, 2. ed., Thousand Oaks et al.: Sage Publications.
Hofstede, G. (1997): Lokales Denken, globales Handeln: Kulturen, Zusammenarbeit und
Management, München: Deutscher Taschenbuch Verlag.
Hofstede, G. (1980): Motivation, Leadership, and Organization: Do American Theories Apply
Abroad?, in: Organizational Dynamics, pp. 42-63.

References
274
Hofstede, G./Hofstede, G. J. (2005): Cultures and Organizations – Software of the Mind, 2.
ed., New York et al.: McGraw-Hill.
Hofstede, G./Hofstede G. J./Minkov, M (2010): Cultures and organizations: Software of the
mind, 3. ed., New York: McGraw-Hill.
Hogreve, J. E./Toennjes F./Iseke, A./Derfuss, K. (2013): Does the Service-Profit Chain Hold
True? A Meta-Analysis, in: AMA Winter Educators‘ Conference Proceedings Vol. 24,
pp. 179-180.
Holzmüller, H. H. (1989): Konsumentenforschung, interkulturelle, in: Macharzina, K./Welge,
M. K. (Pub.), Handwörterbuch Export und Internationale Unternehmenstätigkeit, pp.
1143-1157, Stuttgart: Schäffer-Poeschel.
Homburg, C./Krohmer, H. (2009): Marketingmanagement: Strategie – Instrumente – Umset-
zung – Unternehmensführung, 3. ed., Wiesbaden: Gabler.
Homburg, C./Krohmer, H. (2006): Marketingmanagement: Strategie – Instrumente – Umset-
zung – Unternehmensführung, 3. ed., Wiesbaden: Gabler.
Holtbrügge, D./Puck, J. F. (2008): Geschäftserfolg in China – Strategien für den größten
Markt der Welt, 2. ed., Berlin/Heidelberg: Springer.
Horn, G. A. (2013): Abwrackprämie, available online at http://wirtschaftslexikon.gable
r.de/Archiv/89412/abwrackpraemie-v8.html, accessed 5.9.2013.
Huber, F./Herrmann, A. (2001): Achieving brand and dealer loyalty: the case of the automo-
tive industry, in: The International Review of Retail, Distribution and Consumer Re-
search, Vol. 11 (2), pp. 97-122.
Hull, D./Cox, J. (1994): The field service function in the electronics industry: Providing a link
between customers and production/marketing, in: International Journal of Production
Economics, Vol. 37 (1), pp. 115-126.
Hünecke, P. (2012): Einfluss von After-Sales-Service Determinanten auf die Markenloyalität
im Premiumautomobilsektor – eine empirische Analyse in drei Märkten, in: Audi Dis-
sertationsreihe, Vol. 68, Göttingen: Cuvillier Verlag.
Hünerberg, R./Heise, G./Hoffmeister, M. (Pub.) (1995): Internationales Automobilmarketing –
Wettbewerbsvorteile durch marktorientierte Unternehmensführung, Wiesbaden: Gab-
ler.
Hsu, J. L./Nien, H. (2008): Who are ethnocentric? Examining consumer ethnocentrism in
Chinese societies, in: Journal of Consumer Behaviour, Vol. 7 (6), pp. 436-447.

References
275
I, J
IBM (n. a.) (2011): IBM SPSS Modeler 14.2 – Anwendungshandbuch, available online
at ftp://public.dhe.ibm.com/software/analytics/spss/documentation/modeler/14.2/de/A
pplicationsGuide.pdf, accessed 12/11/2013.
Ishia, K. (2009): Nationalistic sentiments of Chinese consumers: the effects and determi-
nants of animosity and consumer ethnocentrism, in: Journal of International Consum-
er Marketing, Vol. 21 (4), pp. 299-308.
Janovsky, J./Khashabian, B./Pilarek, D./Pulg, C. (2011): Marktexpansion in Schwellenlän-
dern – Mit Service-Innovationen zum Geschäftserfolg, Wiesbaden: Gabler Ver-
lag/Springer Fachmedien.
Janssen, J./Laatz, W. (2013): Statistische Datenanalyse mit SPSS – Eine anwendungsorien-
tierte Einführung in das Basissystem und das Modul Exakte Tests, 8. ed., Berlin/Hei-
delberg: Springer Gabler.
Jarvis, C. B./MacKenzie, S.B./Podsakoff, P. M. (2003): A critical review of construct indica-
tors and measurement model misspecification in marketing and consumer research,
in: Journal of Consumer Research, Vol. 30 (2), pp. 199-218.
Jen-Kai, L. (2011): Jia You – Gib Gas! Chinas Automobilindustrie startet durch, in: GIGA -
German Institute of Global and Area Studies (Pub.), GIGA Focus Vol. 9, pp. 1-8.
Jianye, W. (2013): Is the Chinese Economy Slowing down?, in: China today, The China Wel-
fare Institute (Pub.), Vol. 62 (8), pp. 40-41.
Joas, A. (2009): Marke, Vertrieb und Service entscheiden den Wettbewerb in China, in:
German Industry & Commerce (Pub.), BusinessFocus China – Automobilindustrie,
pp. 155-158. Karlsruhe: German Industry and Commerce Verlag.
Jönke, R. (2012): Managing after-sales services: strategies and interfirm relationships, avail-
able online at http://dx.doi.org/10.3929/ethz-a-007307425, accessed 17/5/2013.
K
Kaerner, H./Kasper, M./Mattmüller, R. (Pub.) (2004): After-Sales – Der Service macht den
Gewinn; wie sie Produkte erfolgreich mit Dienstleistungen verbinden, Frankfurt am
Main: FAZ-Institut für Management-, Markt- und Medieninformationen.
Kahneman, D./Tversky, A. (1979): Prospect theory: An analysis of decision under risk, in:
Econometrica: Journal of the Econometric Society, Vol. 47 (2), pp. 263-291.
References
276
Kano, N./Seraku, N./Takahashi, F./Tsuji, S. (1984): Attractive quality and must-be quality, in:
The Journal of the Japanese Society for Quality Control, Vol. 14 (2), pp. 39-48.
Kasperk, G./Woywode, M./Kalmbach, R. (2006): Erfolgreich in China – Strategien für die Au-
tomobilzulieferindustrie, Berlin et al.: Springer.
Keller, K. L. (1993): Conceptualizing, measuring, and managing customer-based brand equi-
ty, in: Journal of Marketing, Vol. 57 (1), pp. 1-22.
Kaya, M. (2009): Verfahren der Datenerhebung, in: Albers, S. et al. (Pub.), Methodik der em-
pirischen Forschung, 3. ed, pp. 49-64, Wiesbaden: Gabler.
Kim, S.-H./Cohen, M. A./Netessine, S. (2007): Performance contracting in after-sales service
supply chains, in: Management Science, Vol. 53 (12), pp. 1843-1858.
Kirkman, B.L./ Lowe, K. B./Gibson, C. B. (2006): A quarter century of Culture’s Consequenc-
es: A review of empirical research incorporating Hofstede’s cultural values framework,
in: Journal of International Business Studies, Vol. 37 (3), pp. 285-320.
Klarmann, M. (2008): Methodische Problemfelder der Erfolgsfaktorenforschung – Bestands-
aufnahme und empirische Analysen, Wiesbaden: Gabler.
Knörle, C. (2011): Markenloyalität in China – Kulturelle und markenbeziehungstheoretische
Determinanten, Berlin: Logos.
Koch, J. (2012): Marktforschung – Grundlagen und praktische Anwendungen, 6. ed., Mün-
chen: Oldenbourg.
Kotler, P./Bliemel, F. (2005): Marketing-Management – Analyse, Planung, und Verwirkli-
chung, 9. ed, Stuttgart: Schäffer-Poeschel.
Kotler, P./Berger, R./Bickhoff, N. (2010): The Quintessence of Strategic Management – What
You Really Need to Know to Survive in Business, Heidelberg et al.: Springer-Verlag.
Kotler, P./Keller, K. L./ Bliemel, F. (2007): Marketing-Management – Strategien für Wert-
schaffendes handeln, 12. ed. München et al.: Pearson Studium.
Köll, E. (2009): JWT China: Advertising for the New Chinese Consumer, in: HBS Case 9-
809-079, pp. 1-26.
Krafft, M./Götzt, O./Liehr-Gobbers, K. (2005): Die Validierung von Strukturgleichungsmodel-
len mit Hilfe des partial-Least-Squares (PLS)-Ansatzes, in: Bliemel, F. et al. (Pub),
Handbuch PLS-Pfadmodellierung – Methode, Anwendung, Praxisbeispiele, pp. 71-86,
Stuttgart: Schäffer-Poeschel Verlag.
References
277
Kremlicka, R. et al. (2011): Megatrends in der Automobilindustrie und ihre Auswirkungen auf
den AC Centrope, available online at http://www.clusterwien.at/files/mobility/Jahresev
ent2012/STUDIE_Megatrends-in-der-Automobilindustrie.pdf, accessed 16/6/12,
Wien: Wirtschaftsagentur Wien.
Kroeber, A. L./Kluckhohn, C. (1952): Culture: a Critical Review of Concepts and Definitions,
in: Anthropological Papers, Vol. 47 (1), Cambridge: The Museum.
Kroeber-Riel, W./Gröppel-Klein, A. (2013): Konsumentenverhalten, 10. ed., München: Verlag
Franz Vahlen.
Krogh, H. (2009), VW aims to be 'top player' in aftermarket service, in: Automotive News Eu-
rope (Pub.), E-Mail Newsletter from 19.10.2009.
Kroll, F./Chudziak, F./Decker, R. (2011): Der (Urbane) Chinesische Konsument – Eine Me-
taanalytische Betrachtung, working paper series, in: SSRN – Social Science Re-
search Network, pp. 1-14, available online at http://papers.ssrn.com/sol3/papers.cf
m?abstract_id=1843048, accessed 1/6/2013.
Kubicek, H. (1977): Heuristische Bezugsrahmen und heuristisch angelegte Forschungsdes-
igns als Elemente einer Konstruktionsstrategie empirischer Forschung, in: Köhler, R.
(Pub.), Empirische und handlungsorientierte Forschungskonzeption in der Betriebs-
wirtschaftslehre, pp. 3-36, Stuttgart: Poeschel.
Kuenzel, S./Halliday, S. V. (2010): The chain of effects from reputation and brand personality
congruence to brand loyalty: The role of brand identification, in: Journal of Targeting,
Measurement and Analysis for Marketing, Vol. 18 (3/4), pp. 167-176.
Kumara, S./Canhua, K. (2010): Perceptions of country of origin: An approach to identifying
expectations of foreign products. in: Journal of Brand Management, Vol. 17 (5), pp.
343-353.
Kurata, H./Nam, S. H. (2010): After-sales service competition in a supply chain: Optimization
of customer satisfaction level or profit or both?, in: International Journal of Production
Economics, Vol. 127 (1), pp. 136-146.
Kurek, R. (2004): Erfolgsstrategien für Automobilzulieferer – Wirksames Management in ei-
nem dynamischen Umfeld, Berlin/Heidelberg: Springer Verlag.
Kuß, A. (2012): Marktforschung – Grundlagen der Datenerhebung und Datenanalyse, 4. ed.,
Wiesbaden: Springer Gabler.
Kuß, A. (2011): Marketing-Theorie – Eine Einführung, 2. ed., Wiesbaden: Gabler.

References
278
Kühlwein, R./Ponssen, H./Lück, A. (1999): Ersatzteillogistik als Erfolgsfaktor des globalen Af-
tersales in der Automobilindustrie, in: Distribution: Logistik im Warenfluß und Vertei-
lung, Vol. 9, pp. 16-19, Mainz/Stuttgart: EuroTransportMedia-Verlag.
Kwok, S./Uncles, M./Huang, Y. (2006): Brand Preferences and Brand Choices among Urban
Chinese Consumers: An Investigation of Country-of-Origin Effects, in: Asia Pacific
Journal of Marketing and Logistics, Vol. 18 (3), pp. 163-172.
L
Laakmann, K. (1995): Value Added Services als Profilierungsinstrument im Wettbewerb –
Analyse, Generierung und Bewertung, in: Meffert, H. (Pub.), Schriften zu Marketing
und Management, Vol. 27, Frankfurt am Main et al.: Peter Lang – Europäischer Ver-
lag der Wissenschaften.
Lai, F./Griffin, M./Babin, B. J. (2009): How quality, value, image, and satisfaction create loyal-
ty at a Chinese telecom, in: Journal of Business Research, Vol. 62, pp. 980-986.
Lam, D. (2007): Cultural Influence on Proneness to Brand Loyalty, in: Journal of International
Consumer Marketing, Vol. 19 (3), pp. 7-21.
Laroche, M./Ueltschy, L. C./Abe, S./Cleveland, M./Yannopoulos, P. P. (2004): Service Quali-
ty Perceptions and Customer Satisfaction: Evaluating the Role of Culture, in: Journal
of International Marketing, Vol. 12 (3), pp. 58-85.
Law, D. (2013): Initial assessment of two questionnaires for measuring service quality in the
Hong Kong post-secondary education context, in: Quality Assurance in Education,
Vol. 21 (3), pp. 231 - 246.
Law, K. S./Wong C./Mobley, W. H. (1998): Toward a Taxonomy of Multidimensional
Constructs, in: Academy of Management Review, Vol. 23 (4), pp. 741-755.
Lee, H./Lee, Y./Yoo, D. (2000): The determinants of perceived service quality and its rela-
tionship with satisfaction, in: Journal of Services Marketing, Vol. 14 (3), pp. 217-231.
Lehmann, H. (2006): Internationale Rankings der Wettbewerbsfähigkeit von Volkswirtschaf-
ten: geringer diagnostischer und prognostischer Aussagehalt, in: Halle Institute for
Economic Research (Pub.), Wirtschaft im Wandel, Vol. 12 (10), pp. 296-302, availab-
le online at http://ideas.repec.org/a/iwh/iwhwiw/10-06-4.html, accessed 29/4/2013.
Lele, M. M. (1997): After-sales service-necessary evil or strategic opportunity?, in: Managing
Service Quality, Vol. 7 (3), pp. 141-145.
References
279
Lele, M. M. (1986): How service needs influence product strategy, in: Sloan Management
Review, Vol. 28 (1), pp. 63-70.
Lerchenmüller, M. (2007): Die Distributionspolitik im After Sales Service, in: Pepels, W.
(Pub.), After Sales Service – Geschäftsbeziehungen profitable gestalten, 2. ed.,
pp. 157-188, Düsseldorf: Symposium Publishing.
Lennartowicz, T./Roth, K. (2001): Does Subculture Within a Country Matter? A cross-Cultural
Study of Motivational Domains and Business Performance in Brazil, in: Journal of In-
ternational Business Studies, Vol. 32 (2), pp. 305-325.
Leung, K./Bhagat, R. S./Buchan, N. R./Erez, M./Gibson, C. B. (2005): Culture and interna-
tional business: recent advances and their implications for future research, in: Journal
of International Business Studies, Vol. 36 (4), pp. 357-378.
Levitt, T. (1983a): After the sale is over, in: Harvard Business Review, Vol. 61 (5), pp. 87-93.
Levitt, T. (1983b): The globalization of markets, in: Harvard Business Review, Vol. 61 (3),
pp. 92-102.
Levitt, T. (1972): Production-line approach to service, in: Harvard Business Review,
Vol. 50 (5), pp. 41-52.
Li, D./An, S./Yang, K. (2008): Exploring Chinese consumer repurchasing intention for ser-
vices: an empirical investigation, in: Journal of Consumer Behaviour, Vol. 7 (6),
pp. 448-460.
Liersch, A. (2012): Neukundenakquisition als Herausforderung für Premiumautomobilmarken
– Eine Analyse des Nutzungs- und Wirkungsverhaltens von Kommunikationsinstru-
menten unter besonderer Berücksichtigung des Premiumsegments der Automobil-
wirtschaft, Wiesbaden: Springer Fachmedien.
Liljander, V./Roos, I. (2002): Customer-relationship levels – from spurious to true relation-
ships, in: Journal of Services Marketing, Vol. 16 (7), pp. 593-614.
Lin, C.A. (2001): Cultural values reflected in Chinese and American television advertising, in:
Journal of Advertising, Vol. 30 (4), pp. 83-94.
Lin, H.-H./Wang, Y.-S. (2006): An examination of the determinants of customer loyalty in
mobile commerce contexts, in: Information & Management, Vol. 43, pp. 271-282.
Lindeman, M./Verkasalo, M. (2005): Measuring Values With the Short Schwartz’s Value Sur-
vey, in: Journal of Personality Assessment, Vol. 5 (2), pp. 170-178.
Lindridge, A. M./Wang, C. (2008): Saving “face” in China: modernization, parental pressure,
and plastic surgery, in: Journal of Consumer Behaviour, Vol. 7 (6), pp. 496-508.
References
280
Liu, Y./Cohen, A. (2010): Values, commitment and OCB among Chinese employees, in: In-
ternational Journal of Intercultural Relations, Vol. 34, pp. 493 ff.
London Economics (n. a.) (2006): Developments in car retailing and after-sales markets un-
der regulation No 1400/2002 – Volume 1 – final report to EC DG Competition, Lux-
embourg: Office for Official Publications of the European Communities.
Löffler, M./Decker, R. (2012): Service Satisfaction With Premium Durables: A Cross-Cultural
Investigation, in: Diamantopoulos, A. et al. (Pub.), Quantitative Marketing and Market-
ing Management – Marketing Models and Methods in Theory and Practice, pp. 401-
422, Wiesbaden: Springer Gabler.
Loomba, A. (1998): Product distribution and service support strategy linkages, in: Interna-
tional Journal of Physical Distribution and Logistics Management, Vol. 28 (2),
pp. 143–161.
Loomba, A. (1996): Linkages between product distribution and service support functions, in:
International Journal of Physical Distribution and Logistics Management, Vol. 26 (4),
pp. 4–22.
Loukmidis, G./Luczak, H. (2006): Lebenszyklusorientierte Planungsstrategien für den Ersatz-
teilbedarf, in: Barkawi, K. et al. (Pub.), Erfolgreich mit After Sales Services – Ge-
schäftsstrategien für Servicemanagement und Ersatzteillogistik, pp. 251-270, Ber-
lin/Heidelberg: Springer.
Lowry, P. B./Gaskin, J. (2014): Partial Least Squares (PLS) Structural Equation Modeling
(SEM) for Building and Testing Behavioral Causal Theory: When to Choose It and
How to Use It, in: IEEE Transactions on Professional Communication, Vol. 57 (2),
pp. 123-146.
M
Maddison, A. (2007): Chinese Economic Performance in the Long Run – 960-2030 AD, 2.
ed., n. p.: OECD – Organisation for Economic Co-operation and Development.
Mäder, R. (2005): Messung und Steuerung von Markenpersönlichkeit – Entwicklung eines
Messinstruments und Anwendung in der Werbung mit prominenten Testimonials, in:
Bauer, H. H./Homburg, C. (Pub.), Schriften des Instituts für Markenorientierte Unter-
nehmensführung Universität Mannheim, Wiesbaden: Deutscher Universitätsver-
lag/GWV Fachverlage.

References
281
Makris, S./Chryssolouris, G. (2013): Web-services-based supply-chain-control logic: an au-
tomotive case study, in: International Journal of Production Research, Vol. 51 (7),
pp. 2077-2091.
Mann, A. (1995): Grundlagen der Service-Politik im internationalen Automobil-Wettbewerb,
in: Hünerberg, R. et al. (Pub.), Internationales Automobilmarketing – Wettbewerbsvor-
teile durch marktorientierte Unternehmensführung, pp. 443-474, Wiesbaden: Gabler.
Mann, A. (1998): Erfolgsfaktor Service: strategisches Servicemanagement im nationalen und
internationalen Marketing, in: Hünerberg, R./Töpfer, A. (Pub.), Gabler Edition Wis-
senschaft – Forum Marketing, Wiesbaden: Deutscher Universitäts-Verlag.
Marcoulides, G. A/Chin, W. W./Saunders, C. (2009): A Critical Look At Partial Least Squares
Modeling, in: MIS Quarterly, Vol. 33 (1), pp. 171-175.
Mathieu, V. (2001): Service strategies within the manufacturing sector: benefits, costs and
partnership, in: International Journal of Service Industry Management, Vol. 12 (5), pp.
451-475.
Mayring, P. (2002): Einführung in die qualitative Sozialforschung – Eine Anleitung zu qualita-
tivem Denken, 5. ed., Weinheim/Basel: Beltz.
McEwen, W./Fang, X./Zhang, C./Burkholder, R. (2006): Inside the Mind of the Chinese Con-
sumer, in: Harvard Business Review, Vol. 84 (3), pp. 68-76.
Meffert, H. (1994): Marketing-Management – Analyse, Strategie, Implementierung, Wiesba-
den: Gabler.
Meffert, H./Burmann, C./Kirchgeorg, M. (2012): Marketing – Grundlagen marktorientierter
Unternehmensführung, 11. ed., Wiesbaden: Gabler.
Meffert, H./Burrmann, C./Becker, C. (2010): Internationales Marketing-Management – Ein
markenorientierter Ansatz, 4. ed., Stuttgart: Kohlhammer.
Meffert, H./Bruhn, M. (2009): Dienstleistungsmarketing – Grundlagen – Konzepte – Metho-
den, Wiesbaden: Gabler.
Mels, G./Boshoff, C./Nel, D. (1997): The Dimensions of Service Quality: The Original Euro-
pean Perspective Revisited, in: Service Industries Journal, Vol. 17 (1), pp. 173-189.
Mennicken, C. (2000): Interkulturelles Marketing – Wirkungszusammenhänge zwischen Kul-
tur, Konsumverhalten und Marketing, Wiesbaden: Deutscher Universitäts-Verlag.

References
282
Mercedes-Benz China (n. a.) (2014a): After-Sales Training and Certification, available online
at http://www.mercedes-benz.com.cn/content/china/mpc/mpc_china _ website/enng/h
ome_mpc/passengercars/home/services_accessories/after_s al es_services/After-Sal
es_Service_Highlights/AfterSales_Service_Training_and _Certification.html, ac-
cessed 4/4/2014.
Mercedes-Benz China (n. a.) (2014b): After-Sales Research Projects, available online at
http://www.mercedes-benz.com.cn/content/china/mpc/mpc_china_w ebsite/enng/hom
e_mpc/passengercars/home/services_accessories/after_sales_services/research_pro
jects.html, accessed 4/4/2014.
Merten, C. F. (2012): Den Servicekunden auf der Spur – Die Wünsche der unterschiedlichen
Kundensegmente, in: Jürgensen, K./Meunzel, R. M. (Pub.), Service Studie 2012,
München: Autohaus.
Merten, C. F. (2011): Erfolgsfaktoren After Sales – versteckte Potenziale bei Gebrauchtwa-
gen heben, in: Meunzel, R. M. (Pub.), Eine Autohaus-Studie in Zusammenarbeit mit
Volkswagen Financial Services, München: Autohaus.
Meyr, H. (2004): Supply chain planning in the German automotive industry, OR Spectrum,
Vol. 26 (4), pp. 447-470.
Meyring, N. (2009): Chinas nationaler Automobilmarkt, in: German Industry & Commerce
(Pub.), BusinessFocus China – Automobilindustrie, pp. 30-35, Karlsruhe: German In-
dustry and Commerce Verlag.
Mittal, V./Kumar, P./Tsiros, M. (1999): Attribute-Level Performance, Satisfaction, and Behav-
ioral Intentions over Time: A Consumption-System Approach, in: Journal of Marketing,
Vol. 63, pp. 88-101.
Mohr, D./Müller, N./Krieg, A./Gao, P./Kaas, H.-W./Krieger, A./Hensley, R. (2013): The road to
2020 and beyond – What’s driving the global automotive industry?, in: McKinsey&-
Company (Pub.), Automotive & Assembly – Latest thinking, available online at http://
www.mckinsey.com/~/media/McKinsey/dotcom/client_service/Automotive%20and%0
Assembly/PDFs/McK_The_road_to_2020_and_beyond.ashx, accessed 28/3/2014.
Morschett, D./Schramm-Klein, H./Swoboda, B. (2008): Entry Modes for Manufacturers‘ Inter-
national After-Sales Service – Analysis of Transaction-specific, Firm-specific and
Country-specific determinants, in: Management International Review, Vol. 48 (5), pp.
525-549.

References
283
Moser, R./Migge, T./Lockstroem, M./Neumann, J. (2011): Exploring Chinese cultural stand-
ards through the lens of German managers: A case study approach, in: IIMB Man-
agement Review, Vol. 23 (2), pp. 102-109.
Möhlen, M. (2007): Automobilmarketing – Entwicklung eines Kommunikationskonzeptes für
Premiumanbieter auf dem deutschen Automobilmarkt im Hinblick auf die Zielgruppe
Senioren 50plus, in: Zerres, M. (Pub.), Hamburger Schriften zur Marketingforschung,
Vol. 47, München/Mering: Rainer Hampp Verlag.
Müller, D. (2009): Moderatoren und Mediatoren in Regressionen, in: Methodik der empiri-
schen Forschung, Albers, S. et al. (Pub.), 3. ed, pp. 237-252, Wiesbaden: Gabler.
Müller, S./Gelbrich, K. (2004): Interkulturelles Marketing, München: Verlag Franz Vahlen.
Müller-Stewens, G./Lechner, C. (2005): Strategisches Management – Wie strategische Initia-
tiven zum Wandel führen, 3. ed., Stuttgart: Schäffer-Poeschel Verlag.
N
n. a. (2014): Enterprise Feedback Suite – EFS Survey, German Manual, Version 10.4/1.0,
Questback GmbH.
n. a. (2013a): China ist wichtigster Markt für deutsche Autobauer, in: N24 Nachrichten,
20/01/2013, available online at http://www.n24.de/n24/Nachrichten/Wirtschaft/d/1743
952/china-ist-wichtigster-markt-fuer-deutsche-autobauer.html, accessed 23/5/2013.
n. a. (2013b): Finanzkennzahlen 2012, in: Autohaus online, 17/01/2013, available online at
http://www.autohaus.de/finanzkennzahlen-2012-kfz-gewerbe-erreicht-nur-1-5-prozent
-umsatzrendite-1191791.html, accessed 24/5/2013.
n. a. (2013c): Chinese officials favor Audis despite government's buy-local policy, in: Bloom-
berg News, 6/3/2013, available online at http://www.bloomberg.com/ne ws/2013-03-
05/audis-trump-patriotism-for-china-s-elite-as-local-bran ds-falter.html, accessed
27/5/2013.
n. a. (2013d): "China stinkt der deutsche Erfolg", in: Automobilwoche, 1/4/2013, available
online at http://www.automobilwoche.de/article/20130401/NACHRIC HTEN/13032991
8/1098/china-stinkt-der-deutsche-erfolg#.UZz_3ZXKhC8, accessed 27/5/2013.
n. a. (2013e): Quality watchdog keeps eye on VW, in: ChinaDaily, 7/1/2013, available online
at http://www.chinadaily.com.cn/business/2013-01/07/content_16092396.htm, ac-
cessed 27/5/13.

References
284
n. a. (2013f): Sino-Foreign Joint Ventures, in: ChinaAuto Web, available online at
http://chinaautoweb.com/auto-companies/, accessed 16/10/2013.
n. a. (2012a): Dealerships too dependent on new-car sales for profits, study says, in: Auto-
motive News China, 11/9/2012, available online at http://www.autonewschina.com/en
/article.asp?id=9175, accessed 27/5/2013.
n. a. (2012b): Foreign cars may be shut out of govt fleet, in: ChinaDaily, 28/2/2012, available
online at http://www.chinadaily.com.cn/business/2012-02/28/content _14715011.htm,
accessed 27/5/2013.
n. a. (2012c): Luxury int'l car brands running over Chinese trust, in: ChinaDaily, 14/12/2012,
available online at http://www.chinadaily.com.cn/business/2012-12/14/content_16018
333.htm, accessed 27/5/13.
n. a. (2012d): After-Sales Dealer Service Satisfaction in China Plateaus After Six Consecu-
tive Years of Increases, in: J.D. Powers Asia Pacific Reports, 30/7/2012, available
online at https://pictures.dealer.com/jdpower/d5b3f0b60a0d02b70145bb9db890c18
0.pdf, accessed 28/5/2013.
n. a. (2012e): Bevölkerung und Haushalte, in: Bundeszentrale für politische Bildung –
Soziale Situation in Deutschland, 24/10/2012, available online at http://www.bpb.de/n
achschlagen/zahlen-und-fakten/soziale-situation-in-deutschland/61584/bevoelkerung-
und-haushalte, accessed 11/10/2013.
n. a. (2012f): Daimler bündelt Vertrieb, in: Auto Motor und Sport, DPA Pressemeldung,
17/12/2012, available online at http://www.auto-motor-und-sport.de/ne ws/mercedes-
in-china-daimler-buendelt-vertrieb-6326564.html, accessed 25/10/2013.
n. a. (2012g): Mercedes strauchelt auf Chinas Automarkt, in: Handelsblatt-Online, 21/9/2012,
available online at http://www.handelsblatt.com/unternehmen/indus trie/schlechte-
absatzzahlen-mercedes-strauchelt-auf-chinas-automarkt/71652 38.html, accessed
25/10/2013.
n. a. (2011a): Bejing dealers shift focus from new car sales, in: Automotive News China,
1/3/2011, available online at http://www.autonewschina.com/en/articl e.asp?id=6605,
accessed 27/5/2013.
n. a. (2011b): Noch ein Mini für Magna, available online at http://www.automobil-produktion.d
e/2011/01/noch-ein-mini-fuer-magna/, accessed 10/5/2012.

References
285
n. a. (2010): Alltagsverkehr in Deutschland – Struktur - Aufkommen - Emissionen - Trends,
updated version (March 2010) of the project presentation, 19/8/2009, available online
at http://www.mobilitaet-in-deutschland.de/pdf/MiD2008_Pra esentation_Abschlussve
ranstaltung_August2009_FassungMaerz2010.pdf, accessed 6/9/2013, Bonn: infas –
Institut für angewandte Sozialwissenschaft GmbH.
n. a. (2008): Mobilität in Deutschland 2008 Ergebnisbericht – Struktur - Aufkommen - Emis-
sionen - Trends, online Verfügbar unter http://www.mobilitaet-in-deutschland.de/pdf/M
iD2008_Abschlussbericht_I.pdf, accessed 6/9/2013, Bonn/Berlin: infas – Institut für
angewandte Sozialwissenschaft GmbH/DLR – Deutsches Zentrum für Luft und
Raumfahrt e. V.
National Bureau of Statistics of China (n. a.) (2013): News & Events, available online at
http://www.stats.gov.cn/english/newsandcomingevents/t20130222_402874607.htm,
accessed 9/10/2013.
National Bureau of Statistics of China (n. a.) (2012): XI. Population, Living Conditions and
Social Security, available online at http://www.stats.gov.cn/english/newsa ndcom-
ingevents/t20130222_402874607.htm, accessed 7/6/2013.
Newman, D. A. (2014): Missing Data: Five Practical Guides, in: Operational Research Meth-
ods, Vol. 17 (4), pp. 372-411.
Nguyen, N./Leblanc, G. (2001): Corporate image and corporate reputation in customers’ re-
tention decisions in services, in: Journal of Retailing and Consumer Services, Vol.
8 (4), pp. 227-236.
Nicolai, A./Kieser, A. (2002): Trotz eklatanter Erfolglosigkeit: die Erfolgsfaktorenforschung
weiter auf Erfolgskurs, in: Die Betriebswirtschaft, Vol. 62 (6), pp. 579-596.
Nordin, F. (2005): Searching for the optimum product service distribution channel: Examining
the actions of five industrial firms, in: International Journal of Physical Distribution and
Logistics Management, Vol. 35 (8), pp. 576–594.
Nunnally, J. C./Bernstein, I. H. (1994): Psychometric Theory, 3. ed., New York: McGraw-Hill.
O
Ogba, I.-E./Tan, Z. (2009): Exploring the impact of brand image on customer loyalty and
commitment in China, in: Journal of Technology Management in China, Vol. 4 (2),
pp. 132-144.

References
286
Oh, L.-B./Zhang, Y. (2010): Understanding Chinese users’ preference for domestic over for-
eign internet services, in: Journal of International Consumer Marketing, Vol. 22 (3), pp.
227-243.
Oliva, R./Kallenberg, R. (2003): Managing the transition from products to services, in: Inter-
national Journal of Service Industry Management, Vol. 14 (2), pp. 160-172.
Oliver, R. L. (2010): Satisfaction – A Behaviorl Perspective on the Consumer, 2. ed., Armonk
et al.: Sharpe.
Oliver, R.L. (1999): Whence Consumer Loyalty? in: Journal of Marketing Management, Vol.
63, pp. 33-44.
Oliver, R. L. (1980): A Cognitive Model of the Antecedents and Consequences of Satisfaction
Decisions, in: Journal of Marketing Research, Vol. 17 (4), pp. 460-469.
Oliver Wyman (n. a.)/VDA – Verband der Automobilindustrie e. V. (n. a.) (2012): FAST 2025
– Massiver Wandel in der automobilen Wertschöpfungsstruktur, available online at
http://www.oliverwyman.de/5771.htm, accessed 6/9/2013
Osgood, C. E. (1951): Culture: its empirical and non-empirical character, in: Southwestern
Journal of Anthropology, Vol. 7 (2), pp. 202-214.
P, Q
Parasuraman, A./Zeithaml, V. A./Berry, L. L. (1988): SERVQUAL: A multiple-item scale for
measuring consumer perceptions of service quality, in: Journal of retailing, Vol. 64 (1),
pp. 12-40.
Parasuraman, A./Zeithaml, V. A./Berry, L. L. (1985): A Conceptual Model of Service Quality
and Its Implications for Future Research., in: Journal of Marketing, Vol. 49, pp. 41-50.
Parker, R. S./Haytko, D. L./Hermans, C. M. (2011): Ethnocentrism and its effect on the Chi-
nese consumer: A threat to foreign goods?, in: Journal of Global Marketing, Vol. 24
(1), pp. 4-17.
Pepels, W. (2007): Die Bedeutung von Dienstleistungen, in: Pepels, W. (Pub.), After Sales
Service – Geschäftsbeziehungen profitable gestalten, 2. ed., pp. 11-28, Düsseldorf:
Symposium Publishing.
Peter, S. I. (1998): Beziehungsmanagement – Kundenbindung als Marketingziel, Absatzwirt-
schaft, Vol. 7, pp. 74-81.
Peter, S. I. (1997): Kundenbindung als Marketingziel – Identifikation und Analyse zentraler
Determinanten, Wiesbaden: Gabler.

References
287
Petter, S./Straub, D./Rai, A. (2007): Specifying Formative Constructs in Information System
Research, in: MIS Quarterly, Vol. 31 (4), pp. 623-656.
Pflaum, D. (2007): Die Kommunikationspolitik im After Sales Service, in: Pepels, W. (Pub.),
After Sales Service – Geschäftsbeziehungen profitable gestalten, 2. ed., pp. 191- 223,
Düsseldorf: Symposium Publishing.
Pollack, B. L. (2009): Linking the hierarchical service quality model to customer satisfaction
and loyalty, in: Journal of Services Marketing, Vol. 23 (1), pp. 42-50.
Pötzsch, O. (2011): Entwicklung der Privathaushalte bis 2030: Ende des Ansteigenden
Trends, in: Statistisches Bundesamt Wiesbaden (Pub.), Wirtschaft und Statistik,
available online at https://www.destatis.de/DE/Publikationen/Wirtscha ftStatistik/Bevo
elkerung/Privathaushalte2030_32011.pdf?__blob=publicationFile, accessed
25/9/2013.
Porter, M. E. (1980), Competetive Strategy: Techniques for Analyzing Industries and Copeti-
tors, New York: Macmillian.
Pretzlaff, H. (2012), Daimler will mit China-Vorstand Vollgas geben, in: Stuttgarter-Zeitung.de,
20/11/2012, available online at http://www.stuttgarter-zeitung.de/in halt.mercedes-pro
bleme-in-china-daimler-will-mit-dem-china-vorstand-vollgas-geben.e57b3eab-7b1d-4
8cf-a373-87425e4f05df.html, accessed 25/10/2013.
PwC – PricewaterhouseCoopers (n. a.) (2011): Automobilindustrie und Mobilität in China:
Plan, Wunsch und Realität, – Strategien und Perspektiven für den größten Automo-
bilmarkt der Welt, n. p.: PwC.
Qin, H./Prybutok, V.R./Zhao, Q. (2010): Perceived service quality in fast-food restaurants:
empirical evidence from China, in: International Journal of Quality Reliability Man-
agement, Vol. 27 (4), pp. 424-437.
R
Raajpoot, N. (2004): Reconceptualizing Service Encounter Quality in a Non-Western Context,
in: Journal of Service Research, Vol. 7 (2), pp. 181-201.
Radtke, P./Abele, E./Zielke, A. E. (2004): Die smarte Revolution in der Automobilindustrie,
Frankfurt/Wien: Wirtschaftsverlag Carl Ueberreuter.

References
288
Ralston, D.A./Egri, C.P./Stewart, S./Terpstra, R.H./Kaicheng, Y. (1999): Doing business in
the 21st century with the new generation of Chinese managers: a study of genera-
tional shifts in work values in China, in: Journal of International Business Studies, Vol.
30 (2), pp. 415–428.
Reichhuber, A. W. (2010): Strategie und Struktur in der Automobilindustrie – Strategische
und organisatorische Programme zur Handhabung automobilwirtschaftlicher Heraus-
forderungen, in: Ringlstetter, J. (Pub.), Schriften zur Unternehmensentwicklung,
Wiesbaden: Gabler.
Reimann, M./Lünemann, U. F./Chase, R. B. (2008): Uncertainty Avoidance as a Moderator of
the Relationship between Perceived Service Quality and Customer Satisfaction, in:
Journal of Service Research, Vol. 11 (1), pp. 63-73.
Rennert, C. (1993): Dienstleistungen als Elemente innovativer Betreibungskonzepte im Au-
tomobilhandel – Eine theoretische und empirische Fundierung, Ottobrunn: Autohaus.
Ringle, C. M./Sarstedt, M./Straub, D. W. (2012): A Critical Look at the Use of PLS-SEM in
MIS Quarterly, in: MIS Quarterly, Vol. 36 (1), pp. iii-xiv.
Rindfleisch, A./Heide, J. B. (1997): Transaction Cost Analysis: Past, Present, and Future Ap-
plications, Journal of Marketing, pp. 30-54.
Rosenbloom, A./Haefner, J./Lee, J.-w. (2012): Global Brands in the Context of China: In-
sights into Chinese Consumer Decision Making, in: International Journal of China
Marketing, Vol. 3 (1), pp. 20-43.
Rybnikova, I. (2011): Erfolgsfaktorenforschung auf den Zahn gefühlt, in: Rybnikova, I. (Pub.),
Schriften zur Organisationswirtschaft – Berichte aus der Forschung, Vol. 17, pp. 1-3,
available online at http://www.tu-chemnitz.de/wirtschaft/bwl5/forschung/schriften/doc/
17.pdf, accessed 22/6/2013.
S
Saccani, N./Johansson, P./Perona, M. (2007): Configuring the after-sales service supply
chain: A multiple case study, in: International Journal of Production Economics,
Vol. 110 (1), pp. 52-69.
Saccani, N./Songini, L./Gaiardelli, P. (2006): The role and performance measurement of af-
ter-sales in the durable consumer goods industries: an empirical study, in: Interna-
tional Journal of Productivity and Performance Management, Vol. 55 (3/4), pp. 259-
283.

References
289
Saidi, S./Mohiuddin, M./Su, Z./Chrysostome, E. (2010): Challenges and Strategies of Luxury
Goods Marketing in Advanced Emerging Countries: A Case Study of Chinese Luxury
Consumers, in: Benefits and Pitfals of Relocation Business in Emerging and Develop-
ing Countries, pp. 1-38, Routledge, available online at http://ssrn.com/abstract=199
2753, accessed 3/6/2013.
Sánchez, A.M./Pérez, M.P. (2005): Supply chain flexibility and firm performance: a concep-
tual model and empirical study in the automotive industry, in: International Journal of
Operations & Production Management, Vol. 25 (7), pp. 681-700.
Sass, B. (2012), Erfolgsfaktoren des Aftersales Service im Investitionsgütermarketing – Eine
Analyse am Beispiel deutscher Offsetdruckmaschinenhersteller, in: Zerres, M./Zerres,
C. (Pub.), Hamburger Schriften zur Marketingforschung, Vol. 78, München/Mering:
Rainer Hampp Verlag.
Saueressig, W. (2009): Der nationale Werkstattmarkt in China, in: BusinessFocus China –
Automobilindustrie, German Industry & Commerce (Pub.), pp. 268-271, Karlsruhe:
German Industry and Commerce Verlag.
Sarstedt, M./Henseler, J./Ringle, C. M. (2011): Multigroup analysis in partial least squares
(PLS) path modeling: Alternative methods and empirical results, in: Measurement and
Research Methods in International Marketing Advances in International Marketing,
Vol. 22, pp. 195-218.
Schanz, G. (2009): Wissenschaftsprogramme der Betriebswirtschaftslehre, in: Bea, F.
X./Schweitzer, M. (Pub.), Allgemeine Betriebswirtschaftslehre, Vol. 1, 10. ed., Stutt-
gart: Lucius & Lucius.
Schmidt, P./Bamberg, S./Davidov, E./Herrmann, J./Schwartz, S. H. (2007): Die Messung von
Werten mit dem “Portraits Value Questionnaire”, in: Zeitschrift für Sozialpsychologie,
Vol. 38 (4), pp. 261-275.
Schoeneberg, K-P. (2012): Predictive Analytics und Data Mining – Einführung, Material for
the lectures at the FH Wedel University of Applied Science, not published.
Schoeneberg, K-P. (2011): Kritische Erfolgsfaktoren von IT-Projekten – Eine empirische
Analyse von ERP-Implementierungen am Beispiel der Mineralölbranche, in: Zerres, M.
(Pub.), Hamburger Schriften zur Marketingforschung, Vol. 77, München/Mering: Rai-
ner Hampp Verlag.
Schwaninger, M. (2009): Was ist ein Modell?, in: Dubs, R. et al. (Pub.), Einführung in die
Managementlehre, Vol. 1, 2. ed., pp. 53-62., Bern et al.: Haupt.

References
290
Schwartz, S. H. (2014a): Scoring Key for 19 Values in the PVQ-RR Value Scale, submitted
via personal E-Mail, 27/9/2014.
Schwartz, S. H. (2014b): Scoring Key for PVQ IV Value Scale, submitted via personal E-Mail
(including Chinese versions), 27/9/2014.
Schwartz, S. H. (2011a) Values: cultural and individual, in: van de Vijver, F. J. R. et al. (Pub.),
Fundamental Questions in Cross-Cultural Psychology, pp. 463-493, Cambridge:
Cambridge University Press.
Schwartz, S. H. (2011b): Studying Values: Personal Adventure, Future Directions, in: Journal
of Cross-Cultural Psychology, Vol. 42 (2), pp. 307-319.
Schwartz, S. H. (2008): Cultural Value Orientations: Nature and Implications of National Dif-
ferences, in: The Hebrew University of Jerusalem (Pub.), No. 921/02, available online
at http://blogs.helsinki.fi/valuesandmorality/files/2009/09/Schw artz-Monograph-Cultur
al-Value-Orientations.pdf, accessed 2/10/2014.
Schwartz, S. H. (2007): Value orientations: measurement antecedents and consequences
across nations, in: Jowell, R. et al. (Pub.), Measuring Attitudes Cross-Nationally, pp.
169-204, Los Angeles et al.: Sage Publications.
Schwartz, S. H. (2006): A Theory of Cultural Value Orientations: Explication and Applications,
in: Comparative Sociology, Vol. 5 (2/3), pp. 137-182.
Schwartz, S. H. (2003): A Proposal for Measuring Value Orientations Across Nations, in: The
European Social Survey (ESS), available online at http://www.europea nsocialsurvey.
org/docs/methodology/core_ess_questionnaire/ESS_core_ques tionnaire_human_val
ues.pdf, accessed 01/10/2014, pp. 259-319.
Schwartz, S. H. (1999): A Theory of Cultural Values and Some Implications for Work, in: Ap-
plied Psychology, Vol. 48 (1), pp. 23-47.
Schwartz, S. H. (1996): Value Priorities and Behavior: Applying a Theory of Integrated Value
Systems, in: Erlbaum, L. (Pub.), The Psychology of Values, The Ontario Symposium,
Vol. 8, pp. 119-144.
Schwartz, S. H. (1994): Are There Universal Aspects in the Structure and Contents of Hu-
man Values?, in: Journal of Social Issues, Vol. 50 (4), pp. 19-45.
Schwartz, S. H. (1992): Universals in the content and structure of values: Theoretical ad-
vances and empirical tests in 20 countries, in: Zanna, M. (Pub.), Advances in Experi-
mental Social Psychology, Vol. 25 (1), pp. 1-65.

References
291
Schwartz, S.H./Bardi, A. (2001): Value Hierarchies Across Cultures Taking a Similarities
Perspective, in: Journal of Cross-Cultural Psychology, Vol. 32 (3), pp. 268-290.
Schwartz, S. H./Bilsky, W. (1990): Toward a theory of the universal content and structure of
values: Extensions and cross-cultural replications, in: Journal of Personality and So-
cial Psychology, Vol. 58 (5), pp. 878-891.
Schwartz, S. H./Bilsky, W. (1987): Toward A Universal Psychological Structure of Human
Values, in: Journal of Personality and Social Psychology, Vol. 53 (3), pp. 550-562.
Schwartz, S. H./Boehnke, K. (2004): Evaluating the Structure of Human Values with Con-
firmatory Factor Analysis, in: Journal of Research in Personality, Vol. 38 (3), pp. 230-
255.
Schwartz, S. H./Cieciuch, J./Vecchione, M./Davidov, E./Fischer, R./Beierlein, C./Ramos,
A./Verkasalo, M./Lönnqvist, J.-E./Demirutku, K. Dirilen-Gumus, O./ Konty, M. (2012):
Refining the Theory of Basic Individual Values, in: Journal of Personality and Social
Psychology, Vol. 103 (4), pp. 663-688.
Sha, S./Huang, T./Gabardi, E. (2013): Upward Mobility: The future of China´s Premium Car
Market, in: McKinsey Automotive & Assembly Practice in Greater China, available
online at http://www.mckinseychina.com/2013/03/07/upward-mobility-the-future-of-
chinas-premium-car-market/, accessed 10/6/2013.
Sheth, J. N./Parvatlyar, A. (1995): Relationship Marketing in Consumer Markets: Anteced-
ents and Consequences, in: Journal of the Academy of Marketing Science, Vol. 23 (4),
pp. 255-271.
Shook, C. L./Ketchen, D. J./Hult, G. T. M./ Kacmar, K. M. (2004): An Assessment of the use
of structural equation modelling in strategic management research, in: Strategic Man-
agement Journal, Vol. 25, pp. 397-404.
Shuqin, W./Gang, L. (2012): An Empirical Study of After-sales Service Relationship in Chi-
na’s Auto Industry, in: Atlantic Press, Proceedings of 2012 International Conference
on Mechanical Engineering and Material Science (MEMS), pp. 175-178.
Simon, H. (1993): Industrielle Dienstleistungen, Stuttgart: Schäffer-Poeschel Verlag.
Sivadas, E./Backer-Prewitt, J. L. (2000): An examination of the relationship between service
quality, customer satisfaction, and store loyalty, in: International Journal of Retail and
Distribution Management, Vol. 28 (2), pp. 73-82.
Soares, A. M./Farhangmehr, M./Shoham, A. (2007): Hofstede’s dimensions of culture in in-
ternational marketing studies, Journal of Business Research, Vol. 60 (3), pp. 277-284.

References
292
Sobotta, R. (2012): Strategische Erschließung von Emerging Markets im Investitionsgüter-
marketing – Eine empirische Erfolgsfaktorenforschung am Beispiel des deutschen
Maschinenbaus in Indien, in: Zerres, M./Zerres C. (Pub.), Hamburger Schriften zur
Marketingforschung, Vol. 80, München/Mering: Rainer Hampp Verlag.
Sopha, W. (2012): Herausforderung Globalisierung: Rahmenbedingungen einer ganzheitli-
chen Strategie für Automobilhersteller, in: Diez et al. (Pub.), Grundlagen der Automo-
bilwirtschaft – Das Standardwerk der Automobilbranche, pp. 93-112, 5. ed.,München:
Autohaus Buch und Formular.
Splett-Henning, C. (2004): Key-Account-Management im Automobilhandel – Entwicklung und
Evaluierung eines adaptiven und innovativen Key-Account-Management-Konzeptes
für den Großkundenvertrieb im deutschen Automobilhandel, in: Zerres, M. (Pub.),
Hamburger Schriften zur Marketingforschung, Vol. 26, München/Mering: Rainer
Hampp Verlag.
Srivastava, M./Rai, A. K. (2014): An investigation into service quality–customer loyalty rela-
tionship: the moderating influences, in: Decision, Vol. 41 (1), Indian Institute of Man-
agement Calcutta (Pub.), pp. 11-31.
Srnka, K. (2005): marketing.ethik.&kultur, München/Mering: Rainer Hampp Verlag.
Statistisches Bundesamt Wiesbaden (n. a.) (2015a): Beschäftigte und Umsatz der Betriebe
im Verarbeitenden Gewerbe: Deutschland, Jahre, Wirtschaftszweige (WZ2008 2-/3-
/4-Steller), available online at https://www-genesis.destatis.de/genesis/online;jsession
id=48CF98D293FD89F3A8DE222A3B73EDED.tomcat_GO_1_2?operation=previous
&levelindex=3&levelid=1440687193301&step=3, accessed 27/8/2015.
Statistisches Bundesamt Wiesbaden (n. a.) (2015b): Verbraucherpreisindex: Deutschland,
Jahre, Klassifikation der Verwendungszwecke des Individualkonsums (COICOP 2-/3-
/4-/10-Steller/Sonderpositionen), available online at https://www-genesis.destatis.de/g
enesis/online;jsessionid=48CF98D293FD89F3A8DE222A3B73EDED.tomcat_GO_1_
2?operation=previous&levelindex=3&levelid=1440689144546&step=3, accessed
27/8/2015.
Statistisches Bundesamt Wiesbaden (n. a.) (2013a): Bevölkerung, available online at https://
www.destatis.de/DE/ZahlenFakten/GesellschaftStaat/Bevoelkerung/Bevoelkerung.ht
ml, accessed 25/9/2013.
Statistisches Bundesamt Wiesbaden (n. a.) (2013b): Kraftfahrer-Preisindex, available online
at https://www.destatis.de/DE/Publikationen/STATmagazin/Preise/2010_02/Tabelle2.
html, accessed 25/9/2013.

References
293
Statistisches Bundesamt Wiesbaden (n. a.) (2013c): Verbraucherpreisindex: Deutschland,
Jahre, Klassifikation der Verwendungszwecke des Individualkonsums (COICOP 2-/3-
/4-/10-Steller/Sonderpositionen), available online at https://www-genesis.destatis.de/g
enesis/online;jsessionid=513974CBEC5C6DEA941EBD75EEF266E8.tomcat_GO_2_
1?operation=previous&levelindex=2&levelid=1380119 541332&step=2, accessed
25/9/2013.
Statistisches Bundesamt Wiesbaden (n. a.) (2013d): Beschäftigte und Umsatz der Betriebe
im Verarbeitenden Gewerbe: Deutschland, Jahre, Wirtschaftszweige (WZ2008 2-/3-
/4-Steller), available online at https://www-genesis.destatis.de/ genesis/online;jsessio
nid=E8A1E121A06F9B3495990897C3EAA7B3.tomcat_ GO_2_2, accessed
26/9/2013.
Statistisches Bundesamt Wiesbaden (n. a.) (2009): Bevölkerung Deutschland bis 2060 – 12.
koordinierte Bevölkerungsvorausberechnung, available online at https://www.destati
s.de/DE/Publikationen/Thematisch/Bevoelkerung/VorausberechnungBevoelkerung/B
evoelkerungDeutschland2060Presse5124204099004.pdf?__blob=publicationFile, ac-
cessed 25/9/2013.
Stauss, B./Neuhaus, P. (2000): Das Qualitative Zufriedenheitsmodell (QZM), in: Hinterhuber,
H. H./Matzler, K. (Pub.), Kundenorientierte Unternehmensführung – Kundenorientie-
rung, Kundenzufriedenheit, Kundenbindung, 2. ed., Wisebaden: Gabler Verlag.
Stauss, B. (1999): Kundenzufriedenheit, Marketing ZFP, Vol. 19 (1), pp. 6-7.
Steffenhagen, H. (1997): Erfolgsfaktorenforschung für die Werbung – Bisherige Ansätze und
deren Beurteilung, in: Marktorientiertee Unternehmensführung – Reflexionen – Denk-
anstöße – Perspektiven, Bruhn, M./Steffenhagen, H. (Pub.), pp. 323-350, Wiesbaden:
Gabler Verlag.
Steinmetz, H./Schmidt, P./Tina-Booh, A./Wieczorek, S./ Schwartz, S. H. (2009): Testing
measurement invariance using multigroup CFA: Differences between educational
groups in human values measurement, in: Quality & Quantity, Vol. 43 (4), pp. 599-
616.
Stoebe, M. J. (2013): Consumer attitudes toward foreign versus local brands in emerging
markets – A study based on the consumer goods industry in brazil, in: Zerres,
M./Zerres C. (Pub.), Hamburger Schriften zur Marketingforschung, Vol. 90, Mün-
chen/Mering: Rainer Hampp Verlag.

References
294
Stobbe, A. (2013): German industry: China market growing moderately, in: Research Briefing,
10.4.2013, available online at http://www.dbresearch.com/PROD/DBR_INTERNET_E
N-PROD/PROD0000000000303900/German+industry%3A+China+market+growing+
moderately.PDF, accessed 8/10/2013, Frankfurt am Main: Deutsche Bank Research.
Straub, D./Bodreau, M.-C./Gefen, D. (2004): Validation Guidelines for IS Positivist Research,
in: Communications of the Association for Information Systems, Vol. 13, pp. 380-427.
Sun, T./Wu, G. (2004): Consumption patterns of Chinese urban and rural consumers, in:
Journal of Consumer Marketing, Vol. 21 (4), pp. 245-253.
T
Taifi, N./Passiante, G. (2012): Speeding up „new products and service development“ through
strategic community creation: case of automaker after-sales services partners, in: The
Service Industries Journal, Vol. 32 (13), pp. 2115-2127, Abingdon: Routledge.
Tian, R. G./ Rhee, E. (2010): Editorial Commentary – China Marketing, Marketing China: A
Relatively New But Fast Growing Field Of Study, in: International Journal of China
Marketing, Vol. 1 (1), pp. 11-13.
Thaler, R. H. (1985): Mental Accounting and Consumer Choice, in: Marketing Science, Vol. 4,
pp. 199-214.
Thaler, R. H. (1999): Mental Accounting Matters, in: Journal of Behavioral Decision Making,
Vol. 12, pp. 183-206.
Thalhofer, R. (2003): Markt – Werbung – Umsetzung, in: Thalhofer, R. (Pub.), Das 1x1 für
den Servicevertrag – Standards, Chancen, Strategien, pp. 37-66, Ottobrunn: Auto
Business Verlag.
Thiebes, F. (2012): Kundenintegriertes Innovationsmanagement – Eine Erfolgsfaktorenfor-
schung am Beispiel des deutschen Kunststoffmaschienenbaus, in: Zerres, M./Zerres,
C. (Pub.), Hamburger Schriften zur Marketingforschung, Vol. 79, München/Mering:
Rainer Hampp Verlag.
Thompson, F. M./Newman, A./Liu, M. (2014): The moderating effect of individual level collec-
tivist values on brand loyalty, in: Journal of Business Research, Vol. 67, pp. 2437-
2446.
Töpfer, A. (2012): Erfolgreich forschen – Ein Leitfaden für Bachelor-, Master-Studierende
und Doktoranden, 3. ed., Wisebaden: Springer/Gabler.

References
295
Towill, D.R./Childerhouse, P./Disney, S.M. (2002): Integrating the automotive supply chain:
where are we now?, in: International Journal of Physical Distribution & Logistics Man-
agement, Vol. 32 (2), pp. 79-95.
Triandis, H. C. (1994): Culture and Social Behaviour, New York et al.: McGraw Hill.
Trommsdorff, V. (2009): Konsumentenverhalten, 7. ed., Stuttgart: Kohlhammer.
Trotter, D. L./Lijuan, W. (2012): A Descriptive Analysis of the Contents and Origins of Re-
search on China Marketing in English, in: International Journal of China Marketing,
Vol. 3 (1), pp. 44-70.
Tu, Y.-T./Liu, W.-C./Chang, Y.-Y. (2014): Customer Commitment as a Mediating Variable be-
tween Corporate Brand Image and Customer Loyalty, in: Journal of Education and
Vocational Research, Vol. 5 (1), pp. 17-27.
Tversky, A./Kahneman, D. (1991): Loss aversion in riskless choice: A reference-dependent
model, The Quarterly Journal of Economics, Vol. November, pp. 1039-1061.
U
Ueltschy, L .C./Laroche, M./Zhang, M./Cho, H./Yingwei, R. (2009): Is there really an Asian
connection? Professional service quality perceptions and customer satisfaction, in:
Journal of Business Research, Vol. 62 (10), pp. 972-979.
Ueltschy, L. C./Laroche, M./Eggert, A./Bindl, U. (2007): Service quality and satisfaction: an
international comparison of professional services perceptions, in: Journal of Services
Marketing, Vol. 21 (6), pp. 410-423.
Ulrich, H. (1985): Betriebswirtschaftslehre als Management- und Führungslehre, in: Wunde-
rer, R. (Pub.), Betriebswirtschaftslehre als Management- und Führungslehre, pp. 3-32,
Stuttgart: C. E. Poeschel Verlag.
Ulrich, H. (1984): Management, in: Dyllick, T./Probst, G. J. B. (Pub.), Schriftenreihe Unter-
nehmung und Unternehmensführung, Vol. 33, Bern/Stuttgart: Verlag Paul Haupt.
Ulrich, H. (1981): Die Betriebswirtschaftslehre als anwendungsorientierte Sozialwissenschaft,
in: Geist, M. N./Köhler, R. (Pub.), Die Führung des Betriebes – Herrn Professor Dr. Dr.
h. c. Curt Sandig zu seinem 80. Geburtstag, pp. 1-26, Stuttgart: C. E. Poeschel Ver-
lag.
Ulrich, H./Krieg, W. (1974): St. Galler Management-Modell, 3. ed., Bern: Verlag Paul Haupt.
Usunier, J.-C./Walliser, B. (1993): Interkulturelles Marketing: mehr Erfolg im internationalen
Geschäft, Wiesbaden: Gabler Verlag.

References
296
Unsöld, J. (2013): Langsamer Abschied von einem Statussymbol, in: tagesschau.de,
24.4.2013, available online at http://www.tagesschau.de/wirtschaft/autobranche-zuku
nft100.html, accessed 8.10.2013.
V
van Birgelen, M./de Ruyter, K./de Jong, A./Wetzels, M. (2002): Customer evaluations of af-
ter-sales service contact modes: an empirical analysis of national culture‘s con-
sequences, International Journal of Research in Marketing, Vol. 19 (1), pp. 43-64.
Vargo, S. L./Lusch, R. F. (2008): Service-dominant logic: continuing the evolution, in: Journal
of the Academy of Marketing Science, Vol. 36, pp. 1-10.
Vargo, S. L./Lusch, R. F. (2004): Evolving to a New Dominant Logic for Marketing, in: Journal
of Marketing, Vol. 68 (1), pp. 1–17.
VDA – Verband der Automobilindustrie e. V. (n. a.) (2015a): Jahresbericht 2015, available
online at https://www.vda.de/de/services/Publikationen/jahresbericht-2015.html, ac-
cessed 26/8/2015.
VDA – Verband der Automobilindustrie e. V. (n. a.) (2015b): Neuzulassungen, available
online at https://www.vda.de/de/services/zahlen-und-daten/jahreszahlen/neuzulassun
gen.html, accessed 26/8/2015.
VDA – Verband der Automobilindustrie e. V. (n. a.) (2015c): Export, available online at
https://www.vda.de/de/services/zahlen-und-daten/jahreszahlen/export.html, accessed
26/8/2015.
VDA – Verband der Automobilindustrie e. V. (n. a.) (2013a): Export, available online at
http://www.vda.de/de/zahlen/jahreszahlen/export/, accessed 23/5/2013.
VDA – Verband der Automobilindustrie e. V. (n. a.) (2013b): Jahresbericht 2013, available
online at http://www.vda.de/de/publikationen/jahresberichte/index.html, accessed
23/5/2013.
VDA – Verband der Automobilindustrie e. V. (n. a.) (2013c): Automobilproduktion, available
online at http://www.vda.de/de/zahlen/jahreszahlen/automobilproduktion/, accessed
26/9/2013.
VDA – Verband der Automobilindustrie e. V. (n. a.) (2013d): Neuzulassungen, available
online at http://www.vda.de/de/zahlen/jahreszahlen/neuzulassungen/, accessed
26/9/2013.

References
297
VDA – Verband der Automobilindustrie e. V. (n. a.) (2012): Jahresbericht 2012, available
online at http://www.vda.de/de/publikationen/jahresberichte/index.html, accessed
26/9/2013.
VDA − Verband der Automobilindustrie e.V. (n. a.) (2011): Jahresbericht 2011, available
online at http://www.vda.de/de/publikationen/jahresberichte/index.html, accessed
27/9/2013.
Verhoef, P. C./Langerak, F./Donkers, B. (2007): Understanding brand and dealer retention in
the new car market: The moderating role of brand tier, in: Journal of Retailing,
Vol. 83 (1), pp. 97-113.
W
Wallentowitz, H./Freialdenhoven, A./Olschewski, I. (2009): Strategien in der Automobilindust-
rie – Technologietrends und Marktentwicklungen, Wiesbaden: Vieweg+Teubner|GWV
Fachverlage.
Wang C. L. (1996): The Evolution of International Consumer Research: A Historical Assess-
ment from the 1960s to Mid-1990s, in: Journal of Euromarketing, Vol. 5 (1), pp. 57-81.
Wang, C.-Y. (2010): Service Quality, Perceived Value, Corporate Image, and Customer Loy-
alty in the Context of Varying Levels of Switching Costs, in: Psychology & Marketing,
Vol. 27 (3), pp. 252-262.
Wang, Q. (2011): Development and trends of China‘s automobile market: evidence from ur-
ban household ownership of cars, bicycles, motorcycles and motorbikes, in: Interna-
tional Journal of Automotive Technology and Management, Vol. 11 (2), pp. 99-113.
Wang, C. L./Cui, G. (2008): Understanding the rising Chinese consumer: an introduction, in:
Journal of Consumer Behaviour, Vol. 7 (6), pp. 421-423.
Wang, A./Liao, W./Hein, A.-P. (2012): Bigger, better, broader: A perspective on China´s auto
market in 2020, in: McKinsey&Company (Pub.), Automotive & Assembly Practice,
available online at http://csi.mckinsey.com/knowledge_by_region/asia/china/chinas_a
uto_market_in_2020, accessed 15/10/2013.
Wang, X./Yang, Z. (2010): The Effect of Brand Credibility on Consumers’ Brand Purchase
Intention in Emerging Economies: The Moderating Role of Brand Awareness and
Brand Image, in: Journal of Global Marketing, Vol. 23, pp. 177-188.
References
298
Weiber, R./Mühlhaus, D. (2014): Strukturgleichungsmodellierung – Eine anwendungsorien-
tierte Einführung in die Kausalanalyse mit Hilfe von AMOS, SmartPLS und SPSS,
2.ed, Springer Gabler.
Westbrook, R. A./Oliver, R. L. (1991): The Dimensionality of Cconsumption Emotion Patterns
and Consumer Satisfaction, in: Journal of Consumer Research, Vol. 18, pp. 84-91.
Wetzels, M./Oderkerken-Schröder, G./van Oppen, C. (2009): Using PLS Path Modeling For
Assessing Hierachical Construct Models: Guidelines And Empirical Illustration, in:
MIS Quarterly, Vol. 33 (1), pp. 177-195.
Wise, R./Baumgartner, P. (1999): Go downstream – The New Profit Imperative in Manufac-
turing, in: Harvard Business Review, Vol. 77 (5), pp. 133-141.
Wissmann, M. (2013): Deutsche Automobilindustrie weiter auf Wachstumskurs, available
online at www.vda.de/de/meldungen/news/20130422-1.html, accessed 27/9/2013.
Wong, K. K. (2013): Partial Least Squares Structural Equation Modeling (PLS-SEM) Tech-
niques Using SmartPLS, in: Marketing Bulletin, Vol. 24, pp. 1-32.
Wong, A./Zhou, L. (2005): Consumers’ Motivations for Consumption of Foreign Products: an
Empirical Test in the People’s Republic of China, in: U21Global working paper, Vol. 4,
pp. 1-11, available online at http://papers.ssrn.com/sol3/papers.cfm?abstract_id=160
6345, accessed 3/6/2013.
Wong, C. Y./Polonsky, M. J./Garma, R. (2008): The impact of consumer ethnocentrism and
country of origin sub-components for high involvement products on young Chinese
consumers’ product assessments, in: Asia Pacific Journal of Marketing and Logistics,
Vol. 20 (4), pp. 455-478.
World Bank (n. a.) (2015): GDP growth, available online at http://data.worldbank.org/indicator
/NY.GDP.MKTP.KD.ZG, accessed 27/8/2015.
World Bank (n. a.) (2013): Unemployment, available online at http://search.worldbank.
org/data?qterm=unemployment%20china&language=EN, accessed 10/10/2013.
World Factbook (n. a.) (2015): China, Central Intelligence Agency (CIA) (Pub.), available
online at https://www.cia.gov/library/publications/the-world-factbook/geos/ch.html, ac-
cessed 27/8/2015.
World Factbook (n. a.) (2013): China, Central Intelligence Agency (CIA) (Pub.), available
online at https://www.cia.gov/library/publications/the-world-factbook/geos/ch.html, ac-
cessed 30/9/2013.

References
299
Woywode, M. (2004): Wege aus der Erfolglosigkeit der Erfolgsfaktorenforschung, in: KfW-
Bankengruppe (Pub.), Was erfolgreiche Unternehmen ausmacht: Erkenntnisse aus
Wissenschaft und Praxis, pp. 15-48, Heidelberg: Physica Verlag.
X, Y
Xiao, G./Kim, J. (2009): The Investigation of Chinese Consumer Values, Consumption Val-
ues, Life Satisfaction, and Consumption Behaviors, in: Psychology & Marketing, Vol.
26 (7), pp. 610-624.
Xin-an, Z./Grigoriou, N./Ly, L. (2008): The myth of China as a single market – The influence
of personal value differences on buying decisions, in: International Journal of Market
Research, Vol. 50 (3), pp. 377-402.
Yaprak, A. (2008): Culture study in international marketing: a critical review and suggestions
for future research, in: International Marketing Review, Vol. 25 (2), pp. 215-229.
Yim, C. K./Tse, D. K./Chan, K. W. (2008): Strengthening Customer Loyalty Through Intimacy
and Passion: Roles of Customer-Firm Affection and Customer-Staff Relationships in
Services, in: Journal of Marketing Research, Vol. 45 (6), pp. 741-756.
Yoo, B. (2009): Cross-national invariance of the effect of personal collectivistic orientation on
brand loyalty and equity –The United States versus South Korean consumers, in:
Asia Pacific Journal of Marketing and Logistics, Vol.21 (1), pp. 41-57.
Z
Zackariasson, P./Wilson, T. (2004): Internetworked after-sales service, in: Industrial Market-
ing Management, Vol. 33 (2), pp. 75-86.
Zhang, J./Beatty, S. E./Walsh, G. (2008): Review and future directions of cross-cultural con-
sumer services research, in: Journal of Business Research, Vol. 61, pp. 211-224.
Zeithaml, V. A. (1988): Consumer Perceptions of Price, Quality, and Value: A Means-end
Model and Synthesis of Evidence, in: Journal of Marketing, Vol. 52 (3), pp. 2-22.
Zeithaml, V. A./Bitner, M. J./Gremler, D. D. (2013): Services Marketing – Integrating Cus-
tomer Focus Across the Firm, 6. ed., New York: McGraw-Hill.
Zeithaml, V. A./Bitner, M. J. (1996): Services Marketing, New York: McGraw-Hill.
Zerres, C. (2010): Preis-Promotions im Automobilverkauf, in: Hünerberg, R. et al. (Pub.),
Gabler Research – Forum Marketing, Wiesbaden: Gabler Verlag/GWV Fachverlage.

References
300
Zerres, M./Zerres, C. (2006): Marketing – Die Grundlagen, 2. ed., Stuttgart: Verlag W. Kohl-
hammer.
Zielke, A./Cornet, A./Grüntgens, V. (2008): CARE – Creating higher After-sales Revenues
and Earnings, Düsseldorf: McKinsey.
Zilling, M.P. (2006): Effizienztreiber innovativer Prozesse für den Automotive Aftermarket –
Implikationen aus der Anwendung von kollaborativen und integrativen Methoden des
Supply Chain Managements, in: Biethan, J./Schumann, M. (Pub.), Göttinger Wirt-
schaftsinformatik, Vol. 52, Göttingen: Cuvillier.
Zins, A. H. (2001): Relative attitudes and commitment in customer loyalty models: some ex-
periences in the commercial airline industry, in: International Journal of Service Indus-
try Management, Vol. 12 (3), pp. 269-294.
Zhou, N./Belk, R.W. (2004): Chinese consumer readings of global and local advertising ap-
peals, in: Journal of Advertising, Vol. 33 (3), pp. 63-76.
Zollikofer-Schwarz, G. (1999): Die Entwicklung des After-Sales-Managements, Bamberg:
Difo-Druck.

Appendix
301
Appendix
APPENDIX 1: ENGLISH VERSION OF THE QUESTIONNAIRE ......................................................................... 302!APPENDIX 2: FINAL VERSION OF THE CHINESE QUESTIONNAIRE ............................................................... 308!APPENDIX 3: TABLE OF CROSS LOADINGS OF REFLECTIVE MEASURING ITEMS .......................................... 313!APPENDIX 4: MEASURE ASSESSMENT BY THE FORNELL-LARCKER-CRITERION .......................................... 314!APPENDIX 5: VIF ASSESSMENT OF THE STRUCTURAL MODEL .................................................................. 315!APPENDIX 6: EVALUATION OF F2 ON FIRST- AND SECOND-ORDER CONSTRUCTS ....................................... 316!APPENDIX 7: TOTAL EFFECTS OF THE PATH MODEL ................................................................................. 317!

Appendix
302
Appendix 1: English Version of the Questionnaire
DruckversionDruckversion
To start, please cklick the "Continue" button on the right-hand side.
FragebogenFragebogen
11 Welcome Page Welcome Page
Questionnaire
Dear Sir or Madam,
In the context of a scientific study within the universities UPV Valencia and HAW Hamburg, we are conducting a survey to explore workshop satisfactionand consumer behaviour in China.As part of this, we would like to ask you some questions. It should take less than 10 minutes to complete. There are no right or wrong answers. Pleaseread the instructions and questions carefully, then answer the questions spontaneously. When all questions have been answered, please click the"Continue" button to proceed.
All information will be treated confidentially and you will not be identified in any way. The data will be used for scientific purposes only.
Thank you very much for your help!
22 Filter Page Filter Page
Which brand of car do you drive?
Audi
BMW
Mercedes-Benz
BYD
I don´t use a car.
Other:
Do you have any service experience with a workshop of the brand you selected above?
Yes
No
Gender
Are you male or female?
Male
Female
What is your nationality?
Chinese
Other.
33 Workshop Section Workshop Section
Block A: First of all, we would like to gain insight into your experience with your #v_18# #v_183# workshop.
A.1 Based on your experience, please rate the workshop on the following measures.

Appendix
303
Please rate each of the following aspects on a scale from 1 to 5.1 means "Very Poor" and 5 "Very Good". With the values between them, you can grade your rating accordingly.
Very poor 1 2 3 4 Very Good 5
Cost
Convenience (e.g.: reachability, parkingspaces, comfortable waiting area, etc.)
Ease of getting an appointment
Knowledge about your car
Honesty and integrity
Ability to do the job right
Cleanliness and appearance of facility
Friendliness of personnel
A.2
Please rate in the same manner as above from 1 to 5 how unsatisfied or satisfied you are.
Not satisfied atall 1 2 3 4 Extremely
satisfied 5
Overall, how satisfied were you with theworkshop?
How satisfied are you overall with theservice quality you received from theworkshop?
A.3
Please rate in the same manner as above from 1 to 5 how unwilling or willing you are.
Very unwilling 1 2 3 4 Very willing 5
How willing would you be to recommendthis workshop to others?
How willing would you be to return to a#v_18# #v_183# workshop in thefuture?
A.4 In your opinion, what is the maximum distance (in minutes) you would be willing to drive to reach a workshop?
Please fill in below.
Minutes
44 Loyalty Section Loyalty Section
Block B: The next couple of questions are about your brand preferences.
B.1 Please rate the extent to which you disagree or agree with the following statements.
Please rate each of the following aspects on a scale from 1 to 5.1 means "I strongly disagree" and 5 "I strongly agree". With the values between them, you can grade your rating accordingly.
I stronglydisagree 1 2 3 4 I strongly agree
5
My next car will also be #v_18# #v_183#again.
I will recommend #v_18# #v_183# tomy friends and relatives.
Even if close friends recommendedanother brand, my preference for #v_18##v_183# would not change.
B.2
I stronglydisagree 1 2 3 4 I strongly agree
5
#v_18# #v_183# is a strong brand.
#v_18# #v_183# is a well-known brand.
#v_18# #v_183# is a unique brand.
B.3
I strongly I strongly agree

Appendix
304
disagree 1 2 3 4 5
Switching to a non #v_18# #v_183#workshop would cause too manyproblems.
Switching to a non #v_18# #v_183#workshop would be too expensive.
55 Value Section 1/2 Value Section 1/2
Block C: Here we briefly describe some people. Please read each description and think about how much each personis or is not like you. Tick the box to the right that shows how much the person in the description is like you.
HOW MUCH LIKE YOU IS THE PERSON? .
Very muchlike me Like me Somewhat
like meA little like
me Not like me Not like me atall
Thinking up new ideas and being creativeis important to him. He likes to do thingsin his own original way.
It is important to him to be rich. Hewants to have a lot of money andexpensive things.
He thinks it is important that everyperson in the world be treated equally. Hebelieves everyone should have equalopportunities in life.
It's very important to him to show hisabilities. He wants people to admire whathe does.
It is important to him to live in securesurroundings. He avoids anything thatmight endanger his safety.
He thinks it is important to do lots ofdifferent things in life. He always looks fornew things to try.
He believes that people should do whatthey're told. He thinks people shouldfollow rules at all times, even when no-one is watching.
It is important to him to listen to peoplewho are different from him. Even whenhe disagrees with them, he still wants tounderstand them.
It is important to him to be humble andmodest. He tries not to draw attention tohimself.
Having a good time is important to him.He likes to “spoil” himself.
It is important to him to make his owndecisions about what he does. He likes tobe free to plan and to choose hisactivities for himself.
Block C: Here we briefly describe some people. Please read each description and think about how much each personis or is not like you. Tick the box to the right that shows how much the person in the description is like you.
HOW MUCH LIKE YOU IS THE PERSON? .
Very muchlike me Like me Somewhat
like meA Little like
me Not like me Not like me atall
Thinking up new ideas and being creativeis important to her. She likes to do things

Appendix
305
in her own original way.
It is important to her to be rich. Shewants to have a lot of money andexpensive things.
She thinks it is important that everyperson in the world be treated equally.She believes everyone should have equalopportunities in life.
It's very important to her to show herabilities. She wants people to admirewhat she does.
It is important to her to live in securesurroundings. She avoids anything thatmight endanger her safety.
She thinks it is important to do lots ofdifferent things in life. She always looksfor new things to try.
She believes that people should do whatthey're told. She thinks people shouldfollow rules at all times, even when no-one is watching.
It is important to her to listen to peoplewho are different from her. Even whenshe disagrees with them, she still wantsto understand them.
It is important to her to be humble andmodest. She tries not to draw attention toherself.
Having a good time is important to her.She likes to “spoil” herself.
It is important to her to make her owndecisions about what she does. She likesto be free to plan and to choose heractivities for herself.
66 Value Section 2/2 Value Section 2/2
The last questions of Block C.
HOW MUCH LIKE YOU IS THE PERSON? .
Very muchlike me Like me Somewhat
like meA little like
me Not like me Not like me atall
It's very important to him to help thepeople around him. He wants to care fortheir well-being.
Being very successful is important to him.He likes to impress other people.
It is very important to him that hiscountry be safe. He thinks the state mustbe on watch against threats from withinand without.
He likes to take risks. He is alwayslooking for adventures.
It is important to him always to behaveproperly. He wants to avoid doinganything people would say is wrong.
It is important to him to be in charge andtell others what to do. He wants people todo what he says.
It is important to him to be loyal to hisfriends. He wants to devote himself topeople close to him.
He strongly believes that people shouldcare for nature. Looking after theenvironment is important to him.
Tradition is important to him. He tries tofollow the customs handed down by his
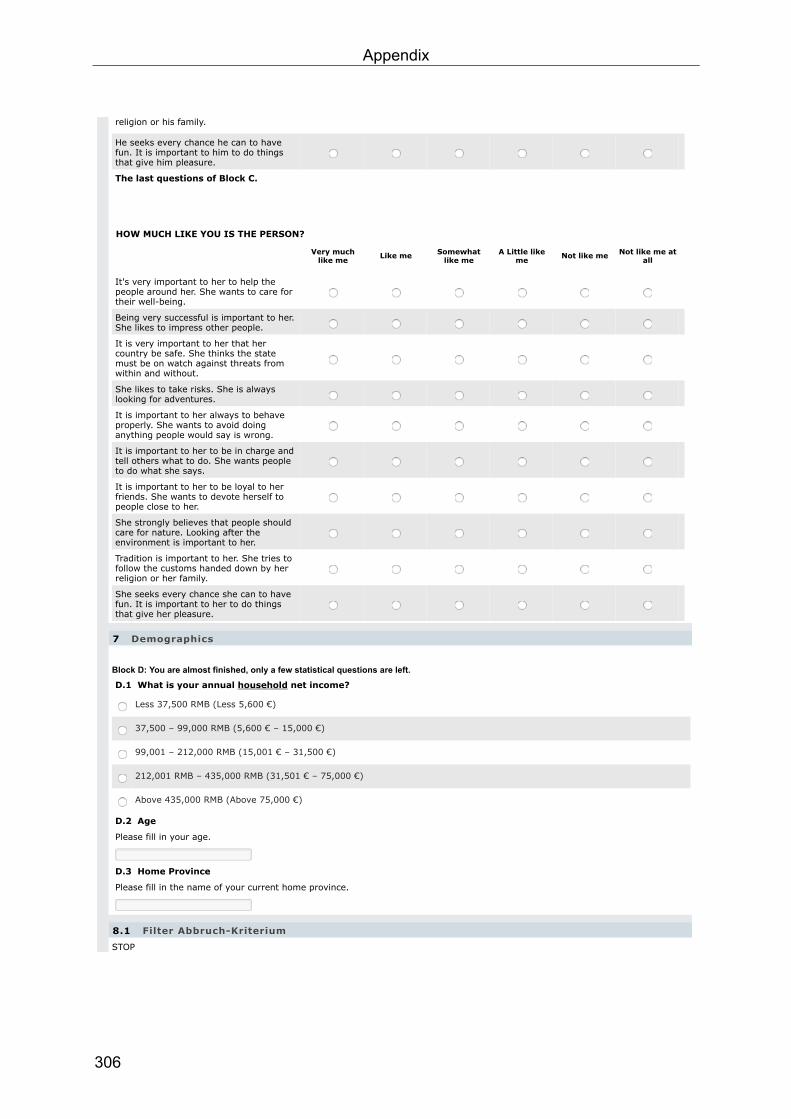
Appendix
306
religion or his family.
He seeks every chance he can to havefun. It is important to him to do thingsthat give him pleasure.
The last questions of Block C.
HOW MUCH LIKE YOU IS THE PERSON? .
Very muchlike me Like me Somewhat
like meA Little like
me Not like me Not like me atall
It's very important to her to help thepeople around her. She wants to care fortheir well-being.
Being very successful is important to her.She likes to impress other people.
It is very important to her that hercountry be safe. She thinks the statemust be on watch against threats fromwithin and without.
She likes to take risks. She is alwayslooking for adventures.
It is important to her always to behaveproperly. She wants to avoid doinganything people would say is wrong.
It is important to her to be in charge andtell others what to do. She wants peopleto do what she says.
It is important to her to be loyal to herfriends. She wants to devote herself topeople close to her.
She strongly believes that people shouldcare for nature. Looking after theenvironment is important to her.
Tradition is important to her. She tries tofollow the customs handed down by herreligion or her family.
She seeks every chance she can to havefun. It is important to her to do thingsthat give her pleasure.
77 Demographics Demographics
Block D: You are almost finished, only a few statistical questions are left.
D.1 What is your annual household net income?
Less 37,500 RMB (Less 5,600 €)
37,500 – 99,000 RMB (5,600 € – 15,000 €)
99,001 – 212,000 RMB (15,001 € – 31,500 €)
212,001 RMB – 435,000 RMB (31,501 € – 75,000 €)
Above 435,000 RMB (Above 75,000 €)
D.2 Age
Please fill in your age.
D.3 Home Province
Please fill in the name of your current home province.
8.18.1 Filter Abbruch-Kriterium Filter Abbruch-KriteriumSTOP

Appendix
307
Note: This illustration of the questionnaire is a pdf-export, which slightly differs from the online version,
because latter is programmed in a responsive design; which adapts to each terminal device or monitor.
Additionally this illustration shows the final pre-test version. The final version of the Chinese question-
naire does not contain the question to nationality, as this is already regarded by the chosen sample.
Participant is not part of the targeted group.
(Text follows)
99 Endseite Endseite
Well Done
Thank you very much for answering this questionnaire.
Have a nice day!

Appendix
308
Appendix 2: Final Version of the Chinese Questionnaire
DruckversionDruckversion
“有 ”还
FragebogenFragebogen
11 Welcome Page Welcome Page
G�
和 上,
现 事 家 都 现 个 着想 就
现 10 以 现 看 ⾃自 现 时现 “有 ” 还
没现 们
dT+Y8�kz�
22 Filter Page Filter Page
DG8$^�����6�
成
我
说-
着
8�Aw�8�K5Ry���[���~WpQsc�
>:

Appendix
309
33 Workshop Section Workshop Section
A q: eh����F�g�V8� #v_18# �~WpQscAw�
A.1 D �txnrZ8��~WpQsc/w�
1 5 1 “ 能”现5 “ ”
�� 1 2 3 4 dT� 5
: 现好 现可不你
下
的
⼀一
A.2
⽣生 , 1 5,
?.dT�]0 1 2 3 4 dT]0 5
现 着想 就
现 着想 就
A.3
1 5现 ⽣生
dT�j0 1 2 3 4 dTj0 5
着想 就
#v_18# 着想 就
A.4 �8� �8��j0E�a$6����~WpQsc�� �o�`�
44 Loyalty Section Loyalty Section
B q: P� �GK�@18�<����
B.1 DrZ830_�30�2�iX�uI�
1 5 要1 “ ”现5 “ ” 新 ⼈人

Appendix
310
�?.�30 1 2 3 4 �dT30 5
#v_18#
过 #v_18#
现 #v_18# 快B.2
�?.�30 1 2 3 4 �dT30 5
#v_18#
#v_18#
#v_18#
B.3
�?.�30 1 2 3 4 �dT30 5
是 #v_18# 着想 就了是 #v_18# 着想 就
55 Value Section 1/2 Value Section 1/2
C q: ���S���;O�D����-�l��O�X�(,4m7����98=��D���N8�UfLvX�
��\��C? .
dTC� C� ;C� �))C� �C� �)��C�
⼤大⼤大为
,
中爱 在⼦子个
, 国 得他
给 ,
在
C q: ���S���;O�D����-�l��O�X�(,4m7����98=��D���N8�UfLvX�
��\��C? .
dTC� C� ;C� �))C� �C� �)��C�
⼤大⼤大为

Appendix
311
,
中爱 在⼦子个
, 国 得他
给 ,
在
66 Value Section 2/2 Value Section 2/2
C q��(��GK�
��\��C? .
dTC� C� ;C� �))C� �C� �)��C�
到
分多
⼦子 很也地 最
起 去⼼心
后 在
点 ⾥里
中爱
⼰己
开
C q��(��GK�
��\��C? .
dTC� C� ;C� �))C� �C� �)��C�
到
分多
⼦子 很也地 最
起 去⼼心
后 在

Appendix
312
Note: This illustration of the questionnaire is a pdf-export, which slightly differs from the online version, because latter is programmed in a responsive design.
点 ⾥里
中爱
⼰己
开
77 Demographics Demographics
D q: 8���#?%G���'���))@1{`�GK�
D.1 8�!�&I�MB�H?
来 37,500 情
对 37,500 99,000 情
对 99,001 212,000 情
对 212,001 435,000 情
435,000 情
D.2 &�
⽤用
D.3 }J��b
会
8.18.1 Filter Abbruch-Kriterium Filter Abbruch-Kriterium
"���
着 这 现 现 年
99 Endseite Endseite
dT�
dT+Y8,��bG��
|8*��#�

Appendix
313
Appendix 3: Table of Cross Loadings of Reflective Measuring Items
Reference: Author´s table.

Appendix
314
Appendix 4: Measure Assessment by the Fornell-Larcker-Criterion
Reference: Author´s table.

Appendix
315
Appendix 5: VIF Assessment of the Structural Model
Reference: Author´s table.
VIF%Assessment%of%the%Structural%Model%
Predictor--Variable-
Dependent%Variable- Culture1–4! PSQ! ASSS! WL! BL!
BI- !!! !
2,172! 2,272! 2,165!
PSQ- !!! !
1,919!! !AWD- !!
! !1,012! 1,008!
!ACH- !! 2,513!! ! ! !ASSS- !!
! ! !1,696!
!BEN- !! 2,679!! ! ! !BL- !!
! ! ! ! !CON- !! 2,366!! ! ! !Culture1- !!
!1!
! ! !Culture2- !!! !
1,825!! !Culture3- !!
! ! !1,754!
!Culture4- !!! ! ! !
1,68!
HED- !! 2,595!! ! ! !POW- !! 1,748!! ! ! !PWSC- !!
! ! !1,264! 1,255!
SESD- !! 2,82!! ! ! !SEC- !! 1,898!! ! ! !STI- !! 1,931!! ! ! !TRA- !! 1,691!! ! ! !UNI- !! 2,563!! ! ! !WL- !!
! ! ! !1,731!

Appendix
316
Appendix 6: Evaluation of f2 on First- and Second-Order Constructs
Reference: Author´s table.
Evaluation of f2 on First- and Second-Order Constructs
f2 Linked Construct: !
Requirement Level: Min. >0.02; >0.15; >0.35
Culture1–4
!PSQ: 0.566 !ASSS: 0.000 !WL: 0.039 !BL: 0.099
Self-Direction
!Culture1: 10,292 !Culture2: 3.880 !Culture3: 5.196 !Culture4: 11.002
Universalism
!Culture1: 13.587 !Culture2: 33.881 !Culture3: 16.824 !Culture4: 3.098
Benevolence
!Culture1: 0.379 !Culture2: 6.904 !Culture3: 2.093 !Culture4: 0.258
Tradition
!Culture1: 0.997 !Culture2: 3.423 !Culture3: 2.721 !Culture4: 5.776
Conformity
!Culture1: 5.711 !Culture2: 0.046 !Culture3: 0.021 !Culture4: 0.185
Security
!Culture1: 5.747 !Culture2: 5.193 !Culture3: 2.971 !Culture4: 2.712
Power
!Culture1: 0.076 !Culture2: 0.357 !Culture3: 0.001 !Culture4: 2.399
Achievement
!Culture1: 6.032 !Culture2: 1.447 !Culture3: 1.034 !Culture4: 0.674
Hedonism
!Culture1: 3.318 !Culture2: 0.649 !Culture3: 0.010 !Culture4: 0.412
Stimulation
!Culture1: 8.291 !Culture2: 0.188 !Culture3: 0.067 !Culture4: 2.715

Appendix
317
Appendix 7: Total Effects of the Path Model
Reference: Author´s table.
Total Effects of the Path Model ASSS BL Culture1 Culture2 Culture3 Culture4 PSQ WL ACH -0,092 0,011 -0,225 -0,116 0,118 0,093 -0,135 -0,035 AWD -0,003 0,01 0,029 ASSS 0,191 0,578 BEN 0,026 0 0,058 0,261 0,174 -0,06 0,035 0,042 BI 0,162 0,247 0,259 BL CON 0,086 0,029 0,212 0,02 0,016 0,048 0,127 0,052 Culture1 0,405 0,078 0,601 0,234 Culture2 0,01 0,002 0,006 Culture3 0,052 0,157 Culture4 0,242 HED 0,069 -0,004 0,169 0,079 0,012 -0,074 0,102 0,042 POW -0,008 0,034 -0,021 0,048 0,003 0,147 -0,013 -0,004 PSQ 0,673 0,129 0,389 PWSC 0,312 0,022 SE-D 0,128 0,136 0,311 0,2 0,281 0,4 0,187 0,118 SEC 0,079 0,064 0,19 0,19 0,174 0,163 0,114 0,073 STI 0,094 0,059 0,231 0,036 0,026 0,164 0,139 0,058 TRA -0,032 0,04 -0,075 -0,146 -0,157 0,224 -0,045 -0,043 UNI 0,143 0,101 0,34 0,565 0,482 0,202 0,205 0,158 WL 0,331