Document downloaded from - RiuNet
22
Document downloaded from: This paper must be cited as: The final publication is available at Copyright http://dx.doi.org/10.1177/1468087413485209 http://hdl.handle.net/10251/51256 SAGE Publications Lujan Martinez, JM.; Guardiola García, C.; Plá Moreno, B.; Cabrera López, P. (2014). Considerations on the low-pressure exhaust gas recirculation system control in turbocharged diesel engines. International Journal of Engine Research. 15(2):250-260. doi:10.1177/1468087413485209.
-
Upload
khangminh22 -
Category
Documents
-
view
0 -
download
0
Transcript of Document downloaded from - RiuNet
Document downloaded from:
This paper must be cited as:
The final publication is available at
Copyright
http://dx.doi.org/10.1177/1468087413485209
http://hdl.handle.net/10251/51256
SAGE Publications
Lujan Martinez, JM.; Guardiola García, C.; Plá Moreno, B.; Cabrera López, P. (2014).Considerations on the low-pressure exhaust gas recirculation system control inturbocharged diesel engines. International Journal of Engine Research. 15(2):250-260.doi:10.1177/1468087413485209.
1
Considerations on the low pressure EGR system control inturbocharged diesel engines
Jose Manuel Lujan, Carlos Guardiola, Benjamım Pla, Pedro Cabrera
CMT Motores Termicos, Universidad Politecnica de Valencia, Camino de Vera s/n, E-46022 Valencia, Spain
Abstract
Although high pressure exhaust gas recirculation has been commonly used in turbochargeddiesel engines for controlling the NOx formation, recent advances in after-treatment and materialtechnology make possible using a low pressure architecture, which recirculates the exhaust gasupstream the compressor. This brief paper presents a basic study of control aspect related to thelow pressure architecture, emphasising the similarities and differences with the high pressure sys-tem. Data coming from experimental tests with both configurations, and from a one-dimensionalwave action model simulations, are combined for the analysis of the input-output paring, linearityand the transient performance of both systems.
Keywords: Diesel engine, engine control, exhaust gas recirculation, turbocharging, modelpredictive control.
Email addresses: [email protected] (Jose Manuel Lujan), [email protected] (Carlos Guardiola),[email protected] (Benjamım Pla), [email protected] (Pedro Cabrera)
Preprint submitted to International Journal of Engine Research February 18, 2013
Nomenclature
BGF burnt gas fractionma air mass flowp2 boost pressureX actuator positionλ relative air-to-fuel ratioBMEP brake mean effective pressureBPV back pressure valveDPF diesel particulate filterDOC diesel oxidation catalystECU electronic control unitEGR exhaust gas recirculationHP high pressureLP low pressureLTC low temperature combustionNOx nitrogen oxides (at exhaust)O2 (intake manifold) oxygenVGT variable geometry turbine
1. Introduction
Exhaust gas recirculation (EGR) has become a widespread technique for controlling nitrogenoxides (NOx) formation and emission in current automotive turbocharged diesel engines [1, 2].Although low pressure (LP) EGR is not a new technical solution and has been known for long[3], it has been traditionally discarded because compressor wheel damaging and soiling and acidcorrosion problems in the intercooler [4]. Hence, high pressure (HP) EGR system is currentlythe standard solution. However, new engine technologies, like particulate filters for exhaust gasafter-treatment [5], the development of high resistance intercoolers [6] and the generalization oflow sulfur content fuels, could allow using low pressure EGR systems.
HP-EGR system control has been a major topic of research because it is strongly coupled withthe turbocharging system [7, 8, 9, 10, 11, 12, 13, 14, 15]. On the contrary, LP-EGR has not beendeployed in series engines until recently and limited research has been conducted in this topic,and particularly about LP-EGR control [16]. This paper compares the two systems and analysesthe advantages and disadvantages of the LP-EGR system from the control point of view. For thepresent study, simulation results from a one dimensional engine code and experimental resultsare combined.
2. Engine model and experimental facility
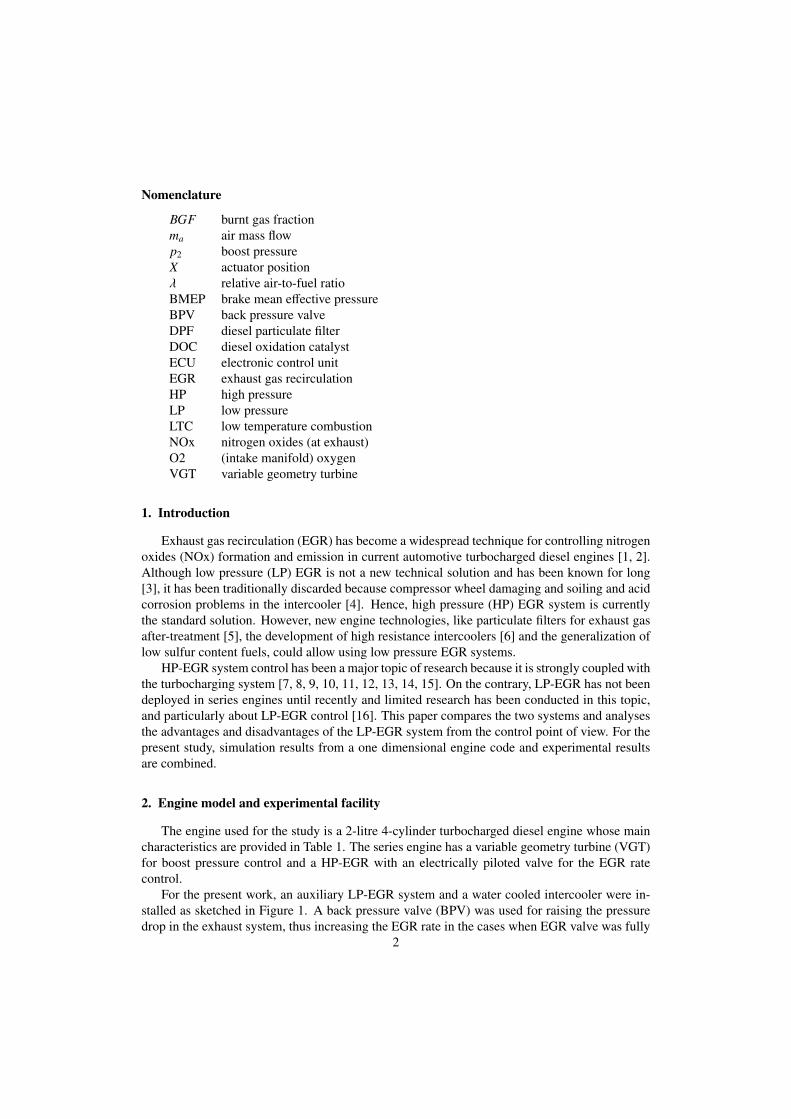
The engine used for the study is a 2-litre 4-cylinder turbocharged diesel engine whose maincharacteristics are provided in Table 1. The series engine has a variable geometry turbine (VGT)for boost pressure control and a HP-EGR with an electrically piloted valve for the EGR ratecontrol.
For the present work, an auxiliary LP-EGR system and a water cooled intercooler were in-stalled as sketched in Figure 1. A back pressure valve (BPV) was used for raising the pressuredrop in the exhaust system, thus increasing the EGR rate in the cases when EGR valve was fully
2
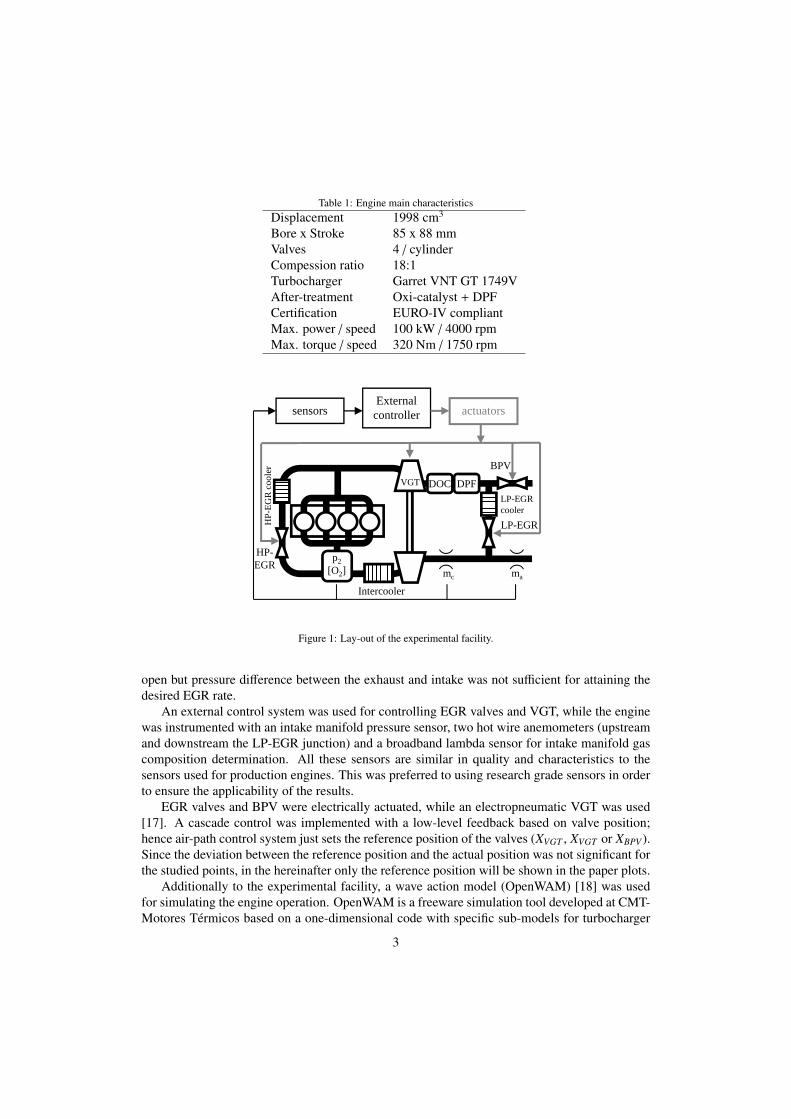
Table 1: Engine main characteristicsDisplacement 1998 cm3
Bore x Stroke 85 x 88 mmValves 4 / cylinderCompession ratio 18:1Turbocharger Garret VNT GT 1749VAfter-treatment Oxi-catalyst + DPFCertification EURO-IV compliantMax. power / speed 100 kW / 4000 rpmMax. torque / speed 320 Nm / 1750 rpm
p2[O2]
External controllersensors actuators
mc ma
LP-EGR
HP-EGR
Intercooler
HP-
EGR
coo
ler BPV
LP-EGR cooler
VGT DPFDOC
Figure 1: Lay-out of the experimental facility.
open but pressure difference between the exhaust and intake was not sufficient for attaining thedesired EGR rate.
An external control system was used for controlling EGR valves and VGT, while the enginewas instrumented with an intake manifold pressure sensor, two hot wire anemometers (upstreamand downstream the LP-EGR junction) and a broadband lambda sensor for intake manifold gascomposition determination. All these sensors are similar in quality and characteristics to thesensors used for production engines. This was preferred to using research grade sensors in orderto ensure the applicability of the results.
EGR valves and BPV were electrically actuated, while an electropneumatic VGT was used[17]. A cascade control was implemented with a low-level feedback based on valve position;hence air-path control system just sets the reference position of the valves (XVGT , XVGT or XBPV ).Since the deviation between the reference position and the actual position was not significant forthe studied points, in the hereinafter only the reference position will be shown in the paper plots.
Additionally to the experimental facility, a wave action model (OpenWAM) [18] was usedfor simulating the engine operation. OpenWAM is a freeware simulation tool developed at CMT-Motores Termicos based on a one-dimensional code with specific sub-models for turbocharger
3
EGR rate (%)
engine speed (rpm)
fuel
inje
ctio
n (m
g/st
r)
A
C
B
D
1000 1500 2000 2500 3000 35000
10
20
30
40
50
60
0
10
20
30
40
50
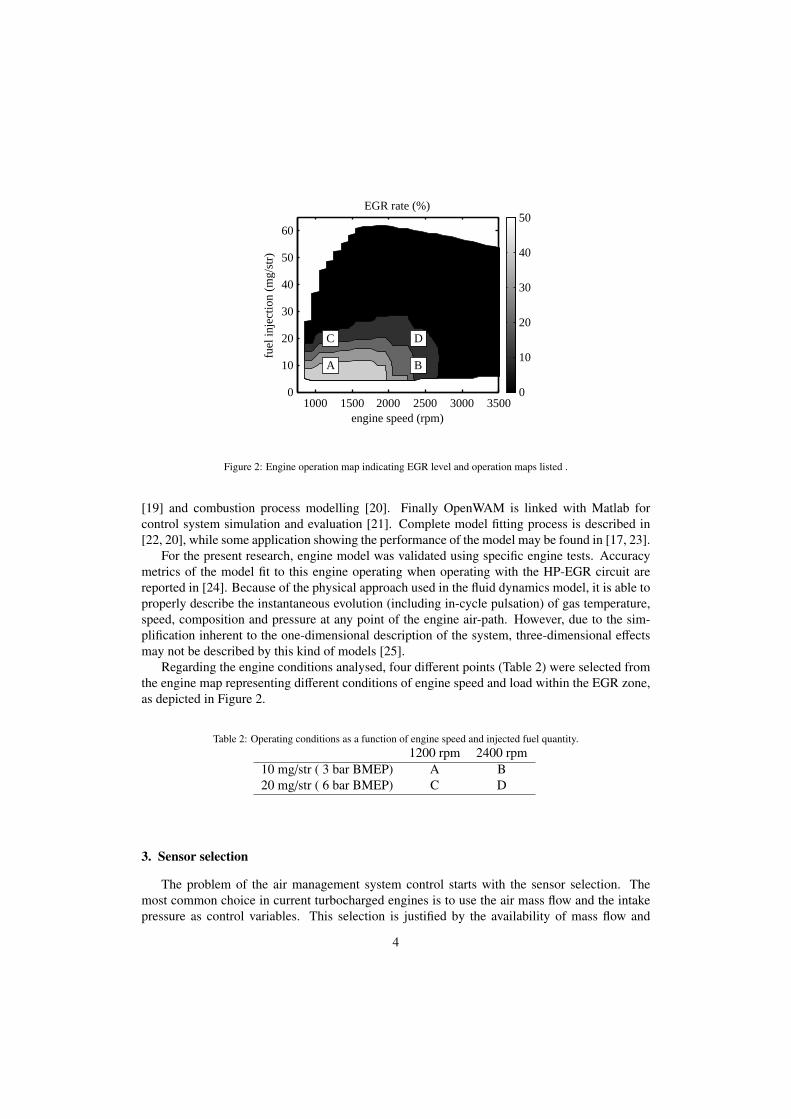
Figure 2: Engine operation map indicating EGR level and operation maps listed .
[19] and combustion process modelling [20]. Finally OpenWAM is linked with Matlab forcontrol system simulation and evaluation [21]. Complete model fitting process is described in[22, 20], while some application showing the performance of the model may be found in [17, 23].
For the present research, engine model was validated using specific engine tests. Accuracymetrics of the model fit to this engine operating when operating with the HP-EGR circuit arereported in [24]. Because of the physical approach used in the fluid dynamics model, it is able toproperly describe the instantaneous evolution (including in-cycle pulsation) of gas temperature,speed, composition and pressure at any point of the engine air-path. However, due to the sim-plification inherent to the one-dimensional description of the system, three-dimensional effectsmay not be described by this kind of models [25].
Regarding the engine conditions analysed, four different points (Table 2) were selected fromthe engine map representing different conditions of engine speed and load within the EGR zone,as depicted in Figure 2.
Table 2: Operating conditions as a function of engine speed and injected fuel quantity.1200 rpm 2400 rpm
10 mg/str ( 3 bar BMEP) A B20 mg/str ( 6 bar BMEP) C D
3. Sensor selection
The problem of the air management system control starts with the sensor selection. Themost common choice in current turbocharged engines is to use the air mass flow and the intakepressure as control variables. This selection is justified by the availability of mass flow and
4
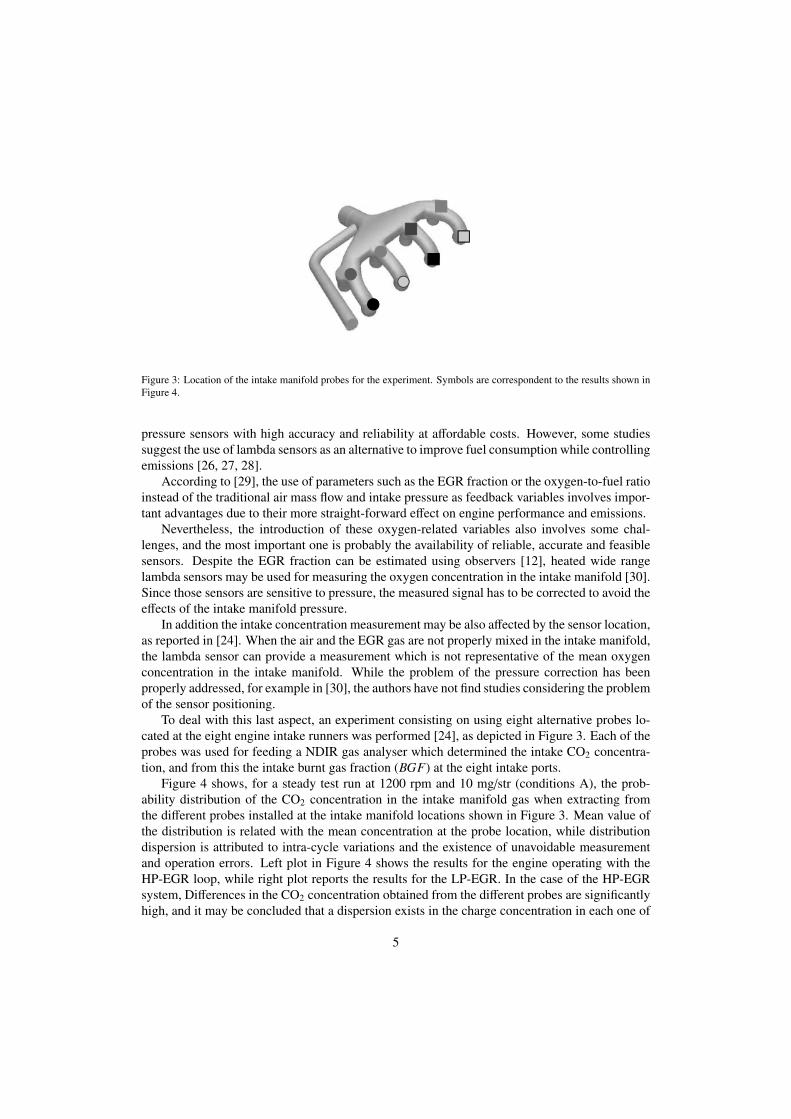
Figure 3: Location of the intake manifold probes for the experiment. Symbols are correspondent to the results shown inFigure 4.
pressure sensors with high accuracy and reliability at affordable costs. However, some studiessuggest the use of lambda sensors as an alternative to improve fuel consumption while controllingemissions [26, 27, 28].
According to [29], the use of parameters such as the EGR fraction or the oxygen-to-fuel ratioinstead of the traditional air mass flow and intake pressure as feedback variables involves impor-tant advantages due to their more straight-forward effect on engine performance and emissions.
Nevertheless, the introduction of these oxygen-related variables also involves some chal-lenges, and the most important one is probably the availability of reliable, accurate and feasiblesensors. Despite the EGR fraction can be estimated using observers [12], heated wide rangelambda sensors may be used for measuring the oxygen concentration in the intake manifold [30].Since those sensors are sensitive to pressure, the measured signal has to be corrected to avoid theeffects of the intake manifold pressure.
In addition the intake concentration measurement may be also affected by the sensor location,as reported in [24]. When the air and the EGR gas are not properly mixed in the intake manifold,the lambda sensor can provide a measurement which is not representative of the mean oxygenconcentration in the intake manifold. While the problem of the pressure correction has beenproperly addressed, for example in [30], the authors have not find studies considering the problemof the sensor positioning.
To deal with this last aspect, an experiment consisting on using eight alternative probes lo-cated at the eight engine intake runners was performed [24], as depicted in Figure 3. Each of theprobes was used for feeding a NDIR gas analyser which determined the intake CO2 concentra-tion, and from this the intake burnt gas fraction (BGF) at the eight intake ports.
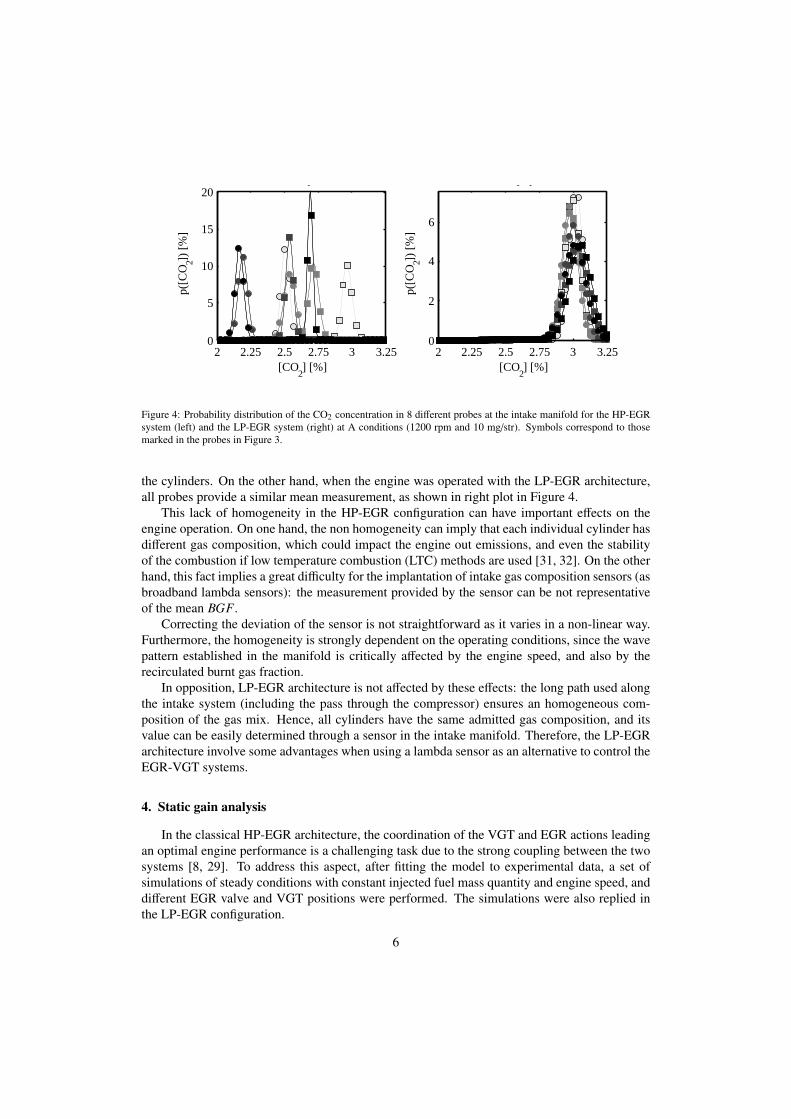
Figure 4 shows, for a steady test run at 1200 rpm and 10 mg/str (conditions A), the prob-ability distribution of the CO2 concentration in the intake manifold gas when extracting fromthe different probes installed at the intake manifold locations shown in Figure 3. Mean value ofthe distribution is related with the mean concentration at the probe location, while distributiondispersion is attributed to intra-cycle variations and the existence of unavoidable measurementand operation errors. Left plot in Figure 4 shows the results for the engine operating with theHP-EGR loop, while right plot reports the results for the LP-EGR. In the case of the HP-EGRsystem, Differences in the CO2 concentration obtained from the different probes are significantlyhigh, and it may be concluded that a dispersion exists in the charge concentration in each one of
5
EGR alta presión
[CO2] [%]
p([C
O2])
[%]
2 2.25 2.5 2.75 3 3.250
5
10
15
20EGR baja presión
[CO2] [%]
p([C
O2])
[%]
2 2.25 2.5 2.75 3 3.250
2
4
6
Figure 4: Probability distribution of the CO2 concentration in 8 different probes at the intake manifold for the HP-EGRsystem (left) and the LP-EGR system (right) at A conditions (1200 rpm and 10 mg/str). Symbols correspond to thosemarked in the probes in Figure 3.
the cylinders. On the other hand, when the engine was operated with the LP-EGR architecture,all probes provide a similar mean measurement, as shown in right plot in Figure 4.
This lack of homogeneity in the HP-EGR configuration can have important effects on theengine operation. On one hand, the non homogeneity can imply that each individual cylinder hasdifferent gas composition, which could impact the engine out emissions, and even the stabilityof the combustion if low temperature combustion (LTC) methods are used [31, 32]. On the otherhand, this fact implies a great difficulty for the implantation of intake gas composition sensors (asbroadband lambda sensors): the measurement provided by the sensor can be not representativeof the mean BGF.
Correcting the deviation of the sensor is not straightforward as it varies in a non-linear way.Furthermore, the homogeneity is strongly dependent on the operating conditions, since the wavepattern established in the manifold is critically affected by the engine speed, and also by therecirculated burnt gas fraction.
In opposition, LP-EGR architecture is not affected by these effects: the long path used alongthe intake system (including the pass through the compressor) ensures an homogeneous com-position of the gas mix. Hence, all cylinders have the same admitted gas composition, and itsvalue can be easily determined through a sensor in the intake manifold. Therefore, the LP-EGRarchitecture involve some advantages when using a lambda sensor as an alternative to control theEGR-VGT systems.
4. Static gain analysis
In the classical HP-EGR architecture, the coordination of the VGT and EGR actions leadingan optimal engine performance is a challenging task due to the strong coupling between the twosystems [8, 29]. To address this aspect, after fitting the model to experimental data, a set ofsimulations of steady conditions with constant injected fuel mass quantity and engine speed, anddifferent EGR valve and VGT positions were performed. The simulations were also replied inthe LP-EGR configuration.
6
XVGT
(% of opening)
XE
GR (
% o
f ope
ning
)
3035
40
45
505560
6540 60 80 100
0
50
100
XVGT
(% of opening)
50
5560
40 60 80 100
XE
GR (
% o
f ope
ning
)
30
45
600
50
100
45
607590105
HP−EGR ma (kg/h)
XE
GR (
% o
f ope
ning
)
100
120
140160
0
50
100
LP−EGR ma (kg/h)
100
120140D
B
A
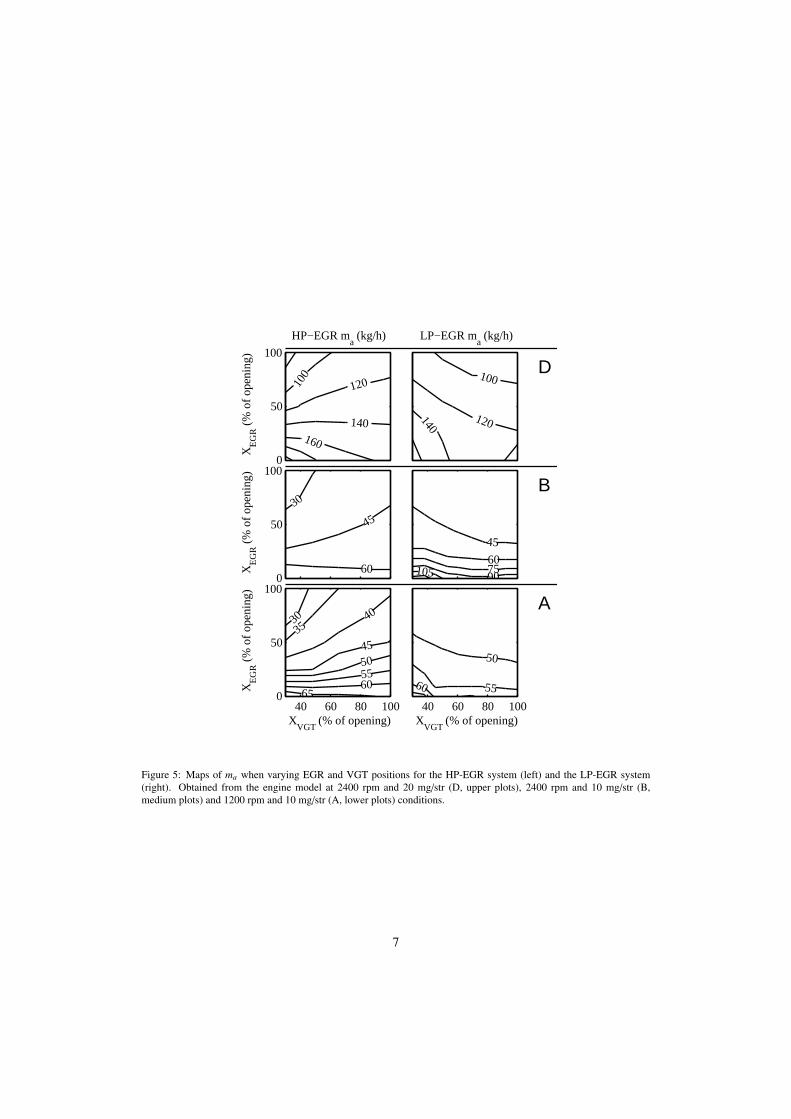
Figure 5: Maps of ma when varying EGR and VGT positions for the HP-EGR system (left) and the LP-EGR system(right). Obtained from the engine model at 2400 rpm and 20 mg/str (D, upper plots), 2400 rpm and 10 mg/str (B,medium plots) and 1200 rpm and 10 mg/str (A, lower plots) conditions.
7

XVGT
(% of opening)
XE
GR (
% o
f ope
ning
)
1.05
1.11.15
40 60 80 1000
50
100
XVGT
(% of opening)
1.05
1.1
1.151.2
1.25
40 60 80 100
XE
GR (
% o
f ope
ning
)
1.051.11.151.21.251.3
0
50
100
1.1
1.15
1.21.251.3
1.351.4
HP−EGR p2 (bar)
XE
GR (
% o
f ope
ning
)
1.1
1.15
1.21.251.31.351.4
0
50
100
LP−EGR p2 (bar)
1.1
1.151.2
1.251.3
1.351.4
D
B
A
Figure 6: Maps of p2 when varying EGR and VGT positions for the HP-EGR system (left) and the LP-EGR system(right). Obtained from the engine model at 2400 rpm and 20 mg/str (D, upper plots), 2400 rpm and 10 mg/str (B,medium plots) and 1200 rpm and 10 mg/str (A, lower plots) conditions.
8

XVGT
(% of opening)
XE
GR (
% o
f ope
ning
)
0 0
2
4
68
10121416
40 60 80 1000
50
100
XVGT
(% of opening)
02468
10
40 60 80 100
XE
GR (
% o
f ope
ning
)
05
1015202530
354045
50
5560
0
50
100
05101520
25
30
HP−EGR BGF (%)
XE
GR (
% o
f ope
ning
)
0
102030
40
0
50
100LP−EGR BGF (%)
0
10
20
30
30D
B
A
Figure 7: Maps of BGF when varying EGR and VGT positions for the HP-EGR system (left) and the LP-EGR system(right). Obtained from the engine model at 2400 rpm and 20 mg/str (D, upper plots), 2400 rpm and 10 mg/str (B, mediumplots) and 1200 rpm and 10 mg/str (A, lower plots) conditions.
9

Maps in Figures 5 to 7 summarise the results of these simulations, where the steady interac-tions between the VGT and EGR systems and their effects on air mass flow (ma), intake pressure(p2) and intake burnt gas fraction (BGF) are shown. The upper row of each figure contains theresults obtained at the engine conditions with the highest power demands (D), the medium rowshows the air-loop behaviour at B conditions, while the lower row presents the effects of EGRvalve and VGT opening at point A, with the lowest power requirements. On the other hand, theleft column contains the results obtained with the HP-EGR loop, while results for he LP-EGRlayout appear in the right column.
Figure 5 shows the static maps of air mass flow as a function of VGT and EGR positions forthe two studied EGR architectures. For the three conditions analysed, the air mass flow throughthe engine increases as the VGT closes if the EGR valve remains closed. However, as the HP-EGR valve opens, the increase in the air mass flow as the VGT closes is progressively reduceduntil an EGR opening in which the VGT does not affect the air mass flow is reached. This EGRopening in which there is not appreciable effect of the VGT position on air mass flow depends onthe engine operating conditions. According to the results shown in Figure 5, the higher the powerdemand, the higher the EGR opening in which the gain between the VGT position and air massflow is zero, and therefore the wider the zone in which closer VGT positions involve higher airmass flows. If the EGR valve opening increases even more, closing the VGT gives rise to lowerair mass flows. In fact, closing the VGT vanes leads to an increase in the exhaust pressure. If theHP-EGR valve is closed, the whole exhaust mass flow will go through the turbine, acceleratingthe turbocharger and increasing the mass flow through the compressor. Nevertheless, as the EGRvalve gets open the increase in exhaust pressure also leads to an increase in the recirculated flow,then reducing the air mass flow. Both effects, which are opposite, provide a gain inversion in therelation between air mass flow and VGT position. The operating conditions at which this gaininversion appears depend on engine parameters such as the engine speed and fuelling rate.
Figure 6 shows the static maps of intake pressure as a function of VGT and EGR positions forboth EGR systems. Since the exhaust gas recirculation does not reduce the energy availabilityat the turbine inlet when LP-EGR is employed, the intake pressures achieved when the EGRvalve is open reach higher values with LP-EGR than with HP-EGR loop. In fact, from theorientation of the lines of constant intake pressure it can be stated that the intake pressure isalmost independent of the LP-EGR valve opening. This aspect and others related to the signalpairing will be addressed in section 5.
Finally, in Figure 7 the static maps of intake burnt gas fraction as a function of VGT andEGR positions are shown. In this case, it can be observed how the burnt gas fraction of the intakegases is almost independent of the VGT position when the LP-EGR architecture is employed.On the contrary, the VGT position impact on the exhaust gas recirculation increases as the HP-EGR valve gets open. In addition, Figure 7 shows that the LP-EGR system does not allow toachieve EGR rates as high as those obtained with the HP-EGR architecture, this fact is speciallyimportant at low speed and load (engine conditions A and B) due to the low air mass flow andthen the low pressure difference between DPF outlet and compressor inlet. At those conditions,a BPV placed downstream the EGR extraction or a throttling valve before the EGR dischargeis required in order to increase the pressure difference between exhaust and intake lines, thusallowing higher EGR rates.
Results shown in Figures 5 to 7 suggest that the LP-EGR architecture is essentially decou-pled if boost pressure and BGF (or oxygen concentration) are considered. This can be considereda clear advantage with regard to the traditional approach, where air mass flow and boost pres-sure are used as controlled variables. Note that significant differences in the ma, p2 and BGF
10

responses appear depending on engine speed and load and controller parameters must be sched-uled in order to be adapted to the engine operating conditions.
Results shown for the tested engine confirm that the behaviour of the EGR system and thegain in the different variables is significantly dependent of the operating conditions. This isrooted in the complex coupling between the engine, the compressor and the turbine. As a conse-quence, the extrapolation of the reported results for different diesel engines will be conditionedby the specific engine selected and by the effective actuator range and operative conditions. Inthis sense, it could happen that some of the reported effects for the HP-EGR configuration do notappear in a given diesel engine. However, sign inversions in the HP-EGR configuration are morelikely to occur if the engine operates with high EGR rate, which implies a wide EGR valve thatmay be fully closed during transients. This situation is usual in downsized light duty engines,and can also occur on heavy duty engines operating with high EGR rate.
5. Signal pairing
On the basis of the static gain maps shown in Figures 5 to 7, and using the method proposedby Bristol [33], it is possible to study the convenience of a given input-output pairing. Themethod is based on studying the coefficients µi j obtained through the input-output gain matrix Φ,where
µi j = Φi j
(Φ−1
)ji
(1)
µi j determines the coupling between input i and output j. µi j = 0 implies that the giveninput does not influence the output, while µi j > 0 marks the relative influence of the input onthe output; µi j < 0 is associated with instabilities in the control. Due to the construction of thecoefficients
∑j µi j = 1, then, perfect decoupled system occurs with a given µi j = 1 while the rest
of coefficients for the same output are equal to 0. In the case of a 2 × 2 system, it is evident thatµ11 = µ22 and µ12 = µ21.
For the studied system, three different sets of outputs can be selected: {ma, p2}, {BGF, p2}
and {ma, BGF}. For each one of the sets and each EGR architecture, maps representing the valueof µi j at the studied operating conditions A, B and D in the whole range of regulation of theVGT and EGR valve can be built. The variation of these coefficients can be used for inferringthe effect of the EGR and VGT positions on the system controllability.
Figure 8 shows the µi j maps for the {ma, p2} set, in HP- and LP-EGR configurations. Themaps obtained for the HP-EGR system confirm the convenience of the usual pairing (ma-EGRand p2-VGT). Values near 1 show the higher influence of the EGR valve position on air massflow than on intake pressure, and accordingly, the higher effect of the VGT on intake pressurethan on air mass flow. It can be noticed how as the VGT opens, the effect of the EGR valve onair mass flow is progressively reduced, specially at B conditions. Also, Figure 8 shows that inthe case of the VGT very closed at D conditions, the risk of instabilities exists if both signalsare controlled simultaneously. In that zone µHPEGR,ma > 1, so µHPEGR,p2 < 0. In the case of theLP-EGR system, µLPEGR,ma and µVGT,p2 are in a narrow range arround 1, and therefore an almostperfect decoupling between EGR and VGT is expected.
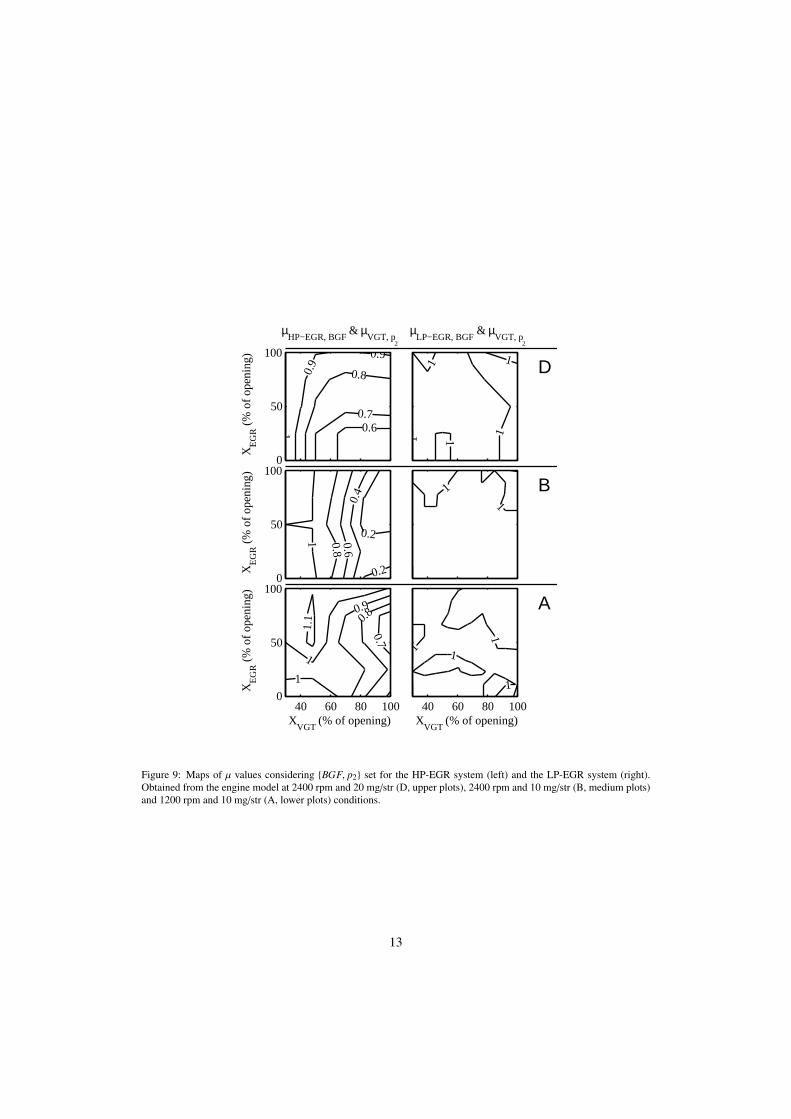
In case that {BGF, p2} is selected as output pair, the maps of Figure 9 are obtained. As inthe previous case, as far as the HP-EGR architecture is concerned the EGR and VGT systemsare strongly coupled, although instabilities do not occur in this case. Note that the couplingof the system increases when the VGT is large open, since at these situations the sensitivity of
11

XVGT
(% of opening)
XE
GR (
% o
f ope
ning
)
0.7
0.7
0.80.91
1
1.1
40 60 80 1000
50
100
XE
GR (
% o
f ope
ning
)
0.2
0.4
0.60.8
1
1
1
0
50
100
µHP−EGR, m
a
& µVGT, p
2
XE
GR (
% o
f ope
ning
)
0.81
1.2
1.6
0
50
100
XVGT
(% of opening)
1
1
40 60 80 100
1
1
1
1
µLP−EGR, m
a
& µVGT, p
2
11.1
D
B
A
Figure 8: Maps of µ values considering {ma, p2} set for the HP-EGR system (left) and the LP-EGR system (right).Obtained from the engine model at 2400 rpm and 20 mg/str (D, upper plots), 2400 rpm and 10 mg/str (B, medium plots)and 1200 rpm and 10 mg/str (A, lower plots) conditions.
the system to the EGR valve position is lower. Although it is possible to control the system,multivariable control techniques will be necessary due to the important crossed influence. Thesuggested pairing for this system is BGF-EGR and p2-VGT since the effect of the EGR openingon BGF is larger than its effect on p2, and the opposite for the VGT. On the other hand, the LP-EGR system presents an almost decoupled situation, where VGT can be used for controlling p2and EGR for BGF. In fact, it can be stated, that for the LP-EGR loop architecture, the choice ofp2 and BGF as feedback variables allows a better decoupling than the traditional p2-m−a, as canbe checked in the slopes of iso-p2 and iso-BGF lines appearing in Figures 6 and 7 respectively.
Finally, maps for the {ma, BGF} set (not shown) reveal instabilities for both the LP-EGR andHP-EGR cases. This is due to the fact that the EGR position has an important direct influence onboth quantities, which are importantly correlated. Hence these two variables must be rejected ascontrol pairs.
Note that, as pointed in the precedent section, results will be dependent of the selected en-gines, the considered operating points and the actuator range.
12
XVGT
(% of opening)
XE
GR (
% o
f ope
ning
)
0.7
0.80.9
1
1
1.1
40 60 80 1000
50
100
XE
GR (
% o
f ope
ning
)
0.2
0.2
0.4
0.60.8
1
0
50
100
µHP−EGR, BGF
& µVGT, p
2
XE
GR (
% o
f ope
ning
)
0.60.7
0.80.9
0.9
1
0
50
100
XVGT
(% of opening)
1
1
1 1
40 60 80 100
1
1
µLP−EGR, BGF
& µVGT, p
2
11 1 1
1 D
B
A
Figure 9: Maps of µ values considering {BGF, p2} set for the HP-EGR system (left) and the LP-EGR system (right).Obtained from the engine model at 2400 rpm and 20 mg/str (D, upper plots), 2400 rpm and 10 mg/str (B, medium plots)and 1200 rpm and 10 mg/str (A, lower plots) conditions.
13
6. Dynamic analysis
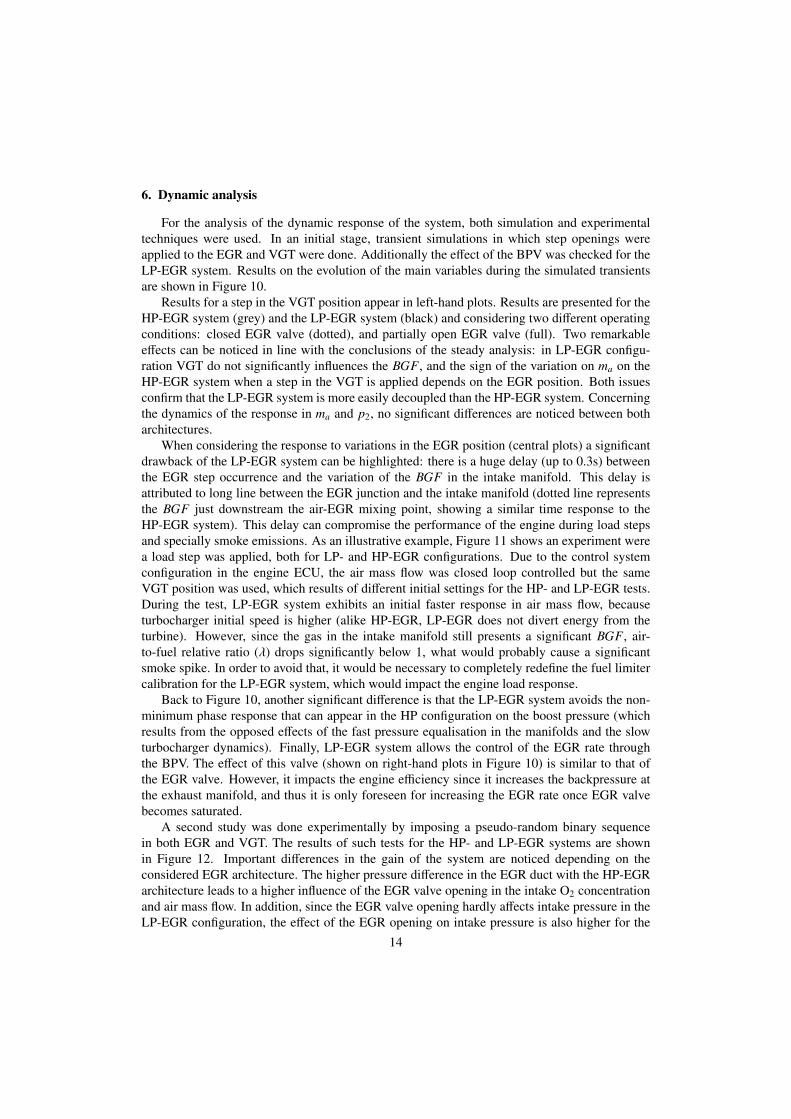
For the analysis of the dynamic response of the system, both simulation and experimentaltechniques were used. In an initial stage, transient simulations in which step openings wereapplied to the EGR and VGT were done. Additionally the effect of the BPV was checked for theLP-EGR system. Results on the evolution of the main variables during the simulated transientsare shown in Figure 10.
Results for a step in the VGT position appear in left-hand plots. Results are presented for theHP-EGR system (grey) and the LP-EGR system (black) and considering two different operatingconditions: closed EGR valve (dotted), and partially open EGR valve (full). Two remarkableeffects can be noticed in line with the conclusions of the steady analysis: in LP-EGR configu-ration VGT do not significantly influences the BGF, and the sign of the variation on ma on theHP-EGR system when a step in the VGT is applied depends on the EGR position. Both issuesconfirm that the LP-EGR system is more easily decoupled than the HP-EGR system. Concerningthe dynamics of the response in ma and p2, no significant differences are noticed between botharchitectures.
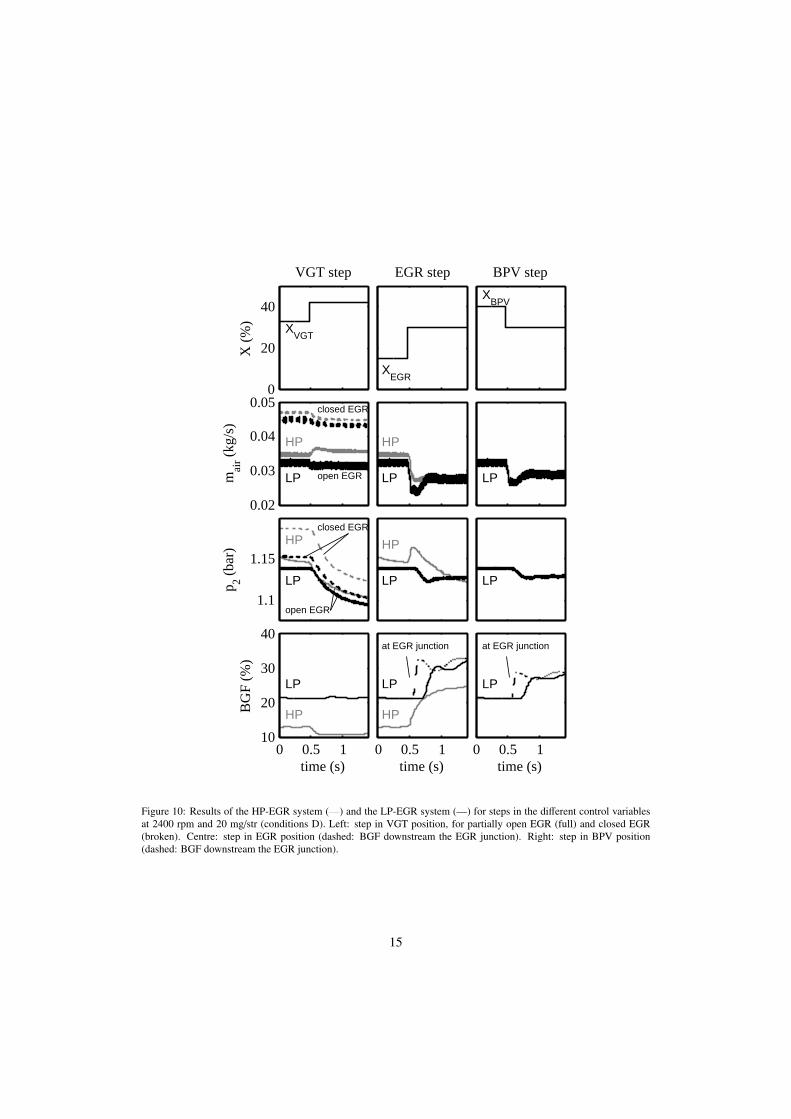
When considering the response to variations in the EGR position (central plots) a significantdrawback of the LP-EGR system can be highlighted: there is a huge delay (up to 0.3s) betweenthe EGR step occurrence and the variation of the BGF in the intake manifold. This delay isattributed to long line between the EGR junction and the intake manifold (dotted line representsthe BGF just downstream the air-EGR mixing point, showing a similar time response to theHP-EGR system). This delay can compromise the performance of the engine during load stepsand specially smoke emissions. As an illustrative example, Figure 11 shows an experiment werea load step was applied, both for LP- and HP-EGR configurations. Due to the control systemconfiguration in the engine ECU, the air mass flow was closed loop controlled but the sameVGT position was used, which results of different initial settings for the HP- and LP-EGR tests.During the test, LP-EGR system exhibits an initial faster response in air mass flow, becauseturbocharger initial speed is higher (alike HP-EGR, LP-EGR does not divert energy from theturbine). However, since the gas in the intake manifold still presents a significant BGF, air-to-fuel relative ratio (λ) drops significantly below 1, what would probably cause a significantsmoke spike. In order to avoid that, it would be necessary to completely redefine the fuel limitercalibration for the LP-EGR system, which would impact the engine load response.
Back to Figure 10, another significant difference is that the LP-EGR system avoids the non-minimum phase response that can appear in the HP configuration on the boost pressure (whichresults from the opposed effects of the fast pressure equalisation in the manifolds and the slowturbocharger dynamics). Finally, LP-EGR system allows the control of the EGR rate throughthe BPV. The effect of this valve (shown on right-hand plots in Figure 10) is similar to that ofthe EGR valve. However, it impacts the engine efficiency since it increases the backpressure atthe exhaust manifold, and thus it is only foreseen for increasing the EGR rate once EGR valvebecomes saturated.
A second study was done experimentally by imposing a pseudo-random binary sequencein both EGR and VGT. The results of such tests for the HP- and LP-EGR systems are shownin Figure 12. Important differences in the gain of the system are noticed depending on theconsidered EGR architecture. The higher pressure difference in the EGR duct with the HP-EGRarchitecture leads to a higher influence of the EGR valve opening in the intake O2 concentrationand air mass flow. In addition, since the EGR valve opening hardly affects intake pressure in theLP-EGR configuration, the effect of the EGR opening on intake pressure is also higher for the
14
BG
F (%
)
time (s)0 0.5 1
10
20
30
40
time (s)0 0.5 1
p 2 (ba
r)
1.1
1.15
mai
r (kg
/s)
0.02
0.03
0.04
0.05
X (
%)
VGT step
0
20
40
EGR step
time (s)0 0.5 1
BPV step
XVGT
XEGR
XBPV
LP
HP
LP
HP
LP
HP
LP
HP
LP
LP
LP
at EGR junctionat EGR junction
closed EGR
open EGRLP
HP
closed EGR
open EGR
LP
HP
Figure 10: Results of the HP-EGR system (—) and the LP-EGR system (—) for steps in the different control variablesat 2400 rpm and 20 mg/str (conditions D). Left: step in VGT position, for partially open EGR (full) and closed EGR(broken). Centre: step in EGR position (dashed: BGF downstream the EGR junction). Right: step in BPV position(dashed: BGF downstream the EGR junction).
15
λ (−
)
time (s)0 1 2 3
0.8
1
1.2
1.4
1.6
BG
F (
%)
0
10
20
mai
r (kg
/h)
120
140
160
fuel
(m
g/cc
)
20
25
30
35
LP
HP
LP
HPat EGR junction
LP
HPref.
LPHP
measured
Figure 11: Evolution during a load response for the HP-EGR configuration (—) and the LP-EGR configuration (—).Dotted lines in the ma plot correspond to experimental values; BGF and λ were obtained after fitting OpenWAM modelto the experimental test.
16

ma (
kg/h
)
time (s)0 50 100 150 200
50
100
150
p 2 (ba
r)
1
1.1
1.2
O2 (
%)
10
15
20
X (
%)
0
50
100
XEGR
XVGT
LP
HP
LP
HP
LP
HP
Figure 12: Evolution of O2, p2 and ma for a pseudo-random binary sequence in VGT and EGR positions with HP-EGRarchitecture (—) compared with LP-EGR layout (—) at 2400 rpm and 20 mg/str (conditions D).
HP-EGR architecture.From results presented in Figure 12 it can be concluded that LP-EGR presents a quasi-linear
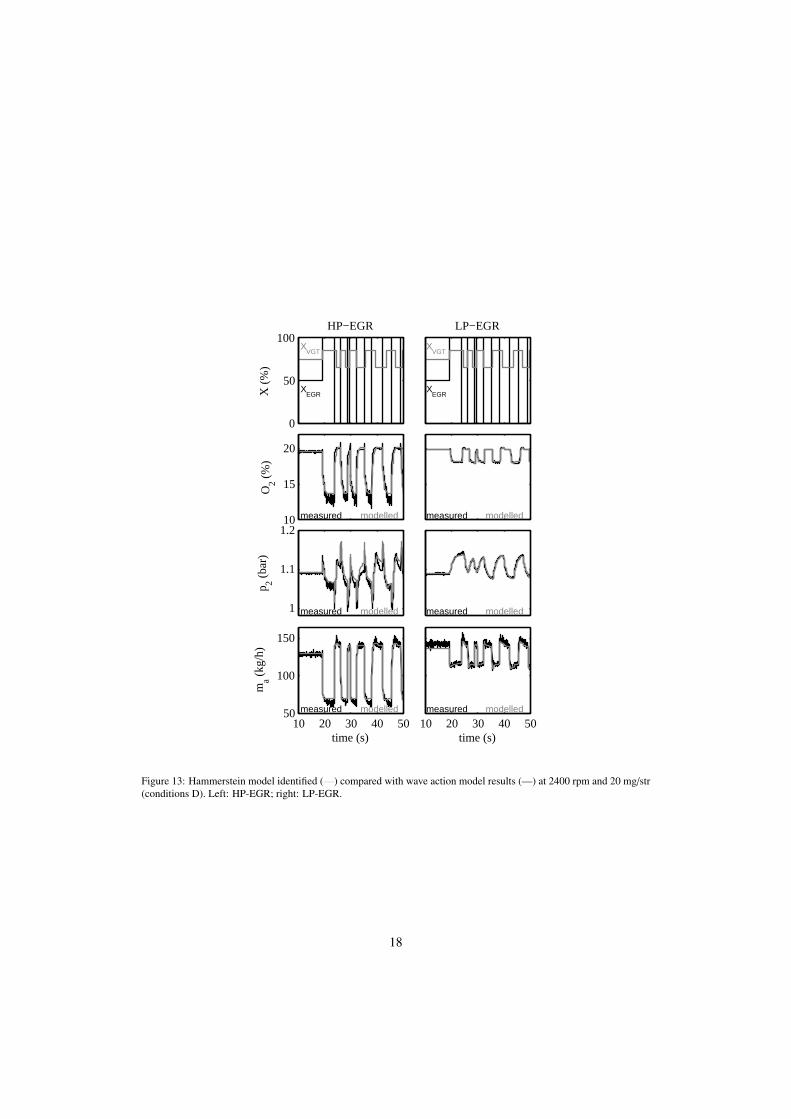
behaviour, while this is not the case of the HP-EGR system due to the sign inversions and non-minimum phase behaviours that were discussed previously. In fact, the only nonlinear effect thatexists in the LP-EGR configuration is associated with the variation of the output gain for differ-ent actuator positions. This may be corrected through a Hammerstein model, which combines anonlinear static correction of the control action with dynamic linear model [34]. With the propercorrection of the nonlinear system gain, the identified model provides an almost perfect predic-tion of the LP-EGR system behaviour. This is illustrated the in right-hand plots of figure 13,where the results of the model are compared to the measured signal for the first 50 seconds ofthe test shown in Figure 12.
On the other hand, if the same modelling approach is used for the HP-EGR configuration,the model is not able to provide a correct prediction of the system, as it is shown in left-handplots of figure 13. Significantly in the case of boost pressure the existence of the non-minimumphase behaviour with the EGR opening becomes evident [35]. The existence of such effects in
17
ma (
kg/h
)
time (s)10 20 30 40 50
50
100
150
time (s)10 20 30 40 50
p 2 (ba
r)
1
1.1
1.2
O2 (
%)
10
15
20
X (
%)
HP−EGR
0
50
100LP−EGR
XEGR
XVGT
XEGR
XVGT
measured
measured
measured
measured
measured
measured
modelled
modelled
modelled
modelled
modelled
modelled
Figure 13: Hammerstein model identified (—) compared with wave action model results (—) at 2400 rpm and 20 mg/str(conditions D). Left: HP-EGR; right: LP-EGR.
18
the HP-EGR system, along with sign reversals and saturations in the actuators authority [36],significantly complicate its control. In order to deal with it, some authors have proposed usingnon-linear compensators [29], or a model-based approach that shifts between different controllersaccording to the EGR valve position, engine speed and load [30]; however, in many industrialapplications, air mass flow and boost pressure are not closed-loop controlled at the same time, inorder to improve system robustness [37]. The results obtained when modelling the LP-EGR, andthe almost decoupled behaviour of the EGR and VGT, suggest that easier control solutions maybe used.
7. Conclusions
The present paper shows a comparison between HP- and LP-EGR architectures from thepoint of view of engine control. A set of experimental and modelling studies have been carriedout to reach the following conclusions:
• The long path followed by the gas from the air-EGR junction to the cylinders allows aperfect mixing between this two species; then a broadband lambda sensor placed anywherein the intake manifold provides a representative value of the intake O2 concentration. Onthe contrary, the non homogeneity in the intake charge when HP-EGR configurations areused prevents lambda sensor measurement from being representative of the real cylinderintake O2 concentration, which involves difficulties when this sort of sensors are used withcontrol purposes.
• The static gain analysis has shown that with the LP-EGR system the BGF is decoupledfrom the VGT opening; similarly, the intake pressure is almost independent of the EGRvalve opening. On the contrary, a strong coupling between the previous signals is observedwith the HP-EGR architecture. Regarding the air mass flow, a gain inversion has beenobserved with the HP-EGR loop, since the VGT closing leads to an air mass flow increasewhen the EGR valve is closed, but an air mass flow decrease when the EGR valve is largeopen. This behaviour has not been observed with the LP-EGR architecture.
• From the static gain analysis, a study of the signal pairing for air management control hasbeen carried out. The main conclusion is that the coupling between EGR and VGT withthe HP-EGR layout make air path control tasks difficult: when the standard control pair{ma, p2} is chosen there is a risk of instability when the VGT is closed and a simultaneouscontrol of both variables is required; if the control pair {p2, BGF} is selected, the systemwill be stable, but strongly coupled. On the contrary, with the LP-EGR architectures theair path can be more easily controlled with both {ma, p2} and {p2, BGF}. Particularly, thecontrol set {p2, BGF} is specially suitable for the LP-EGR loop since the BGF does notdepend on the VGT opening, and the EGR valve hardly affects intake pressure. As faras the control pair {ma, BGF} is concerned, the engine behaviour with this control set isunstable regardless the EGR loop employed due to the strong effect of the EGR openingon both control variables.
• The dynamic analysis has confirmed the conclusions obtained from the static maps pre-sented, and also has shown the non-minimum phase behaviour of the p2 with the EGRopening when the HP-EGR configuration is used. In addition, from the dynamic analysisthe important BGF delay with the LP-EGR loop can be observed. This delay is due to thehigh distance between the air-EGR junction and the cylinders.
19
• The experiment with pseudo-random binary evolutions for both EGR and VGT positionshas allowed to conclude that while the LP-EGR loop shows a quasi-linear behaviour, theHP-EGR architecture involves important non-linearities that restrict the linear identifica-tion to local regions.
Some of the reported effects significantly depend on the operating conditions for the testedengine; however identified features are expected to appear in other diesel engines. In the caseof the concentration non-homogeneity for the HP-EGR architecture, the geometric design of theEGR feed and of the intake manifold will be a key factor. On the other hand, sign inversions andother non-linearities in HP-EGR loop will appear depending on the selected engine, the operatingrange and the effective range of the actuators.
Acknowledgement
This research has been partially financed by the Spanish Ministerio de Economıa y Com-petitividad, thorugh project IPT-370000-2010-022 ”Investigacion y desarrollo de tecnologıas deEGR adaptadas a las nuevas arquitecturas y requerimientos de refrigeracion en motores dieselsobrealimentados para automocion (HIREFIRE)”.
References
[1] N. Ladommatos, S. Abdelhalim, H. Zhao, The effects of exhaust gas recirculation on diesel combustion and emis-sions, International Journal of Engine Research 1 (1999) 107–126.
[2] M. Lapuerta, J. Hernandez, F. Gimenez, Evaluation of exhaust gas recirculation as a technique for reducind dieselengine NOx emissions, Proc. Inst. Mech. Eng. Part D-J. Automob. Eng. 214 (2000) 85–93.
[3] R. Baert, D. Beckman, A. Veen, Efficient EGR technology for future HD diesel engine emission targets, SAE paper1999-01-0837.
[4] S. Moroz, G. Bourgoin, J. Lujan, B. Pla, A 2.0 litre diesel engine with low pressure exhaust gas recirculation andadvanced cooling system, The Diesel Engine Conference, Proceedings of the SIA 2008 Conference, Rouen, France.
[5] A. Walker, Controlling particulate emissions from diesel vehicles, Topics in Catalysis 28 (2004) 165–170.[6] S. Kruger, UandEdwards, E. Pantow, R. Lutz, R. Dreisbach, M. Glensvig, High performance cooling and EGR
systems as a contribution to meeting future emission standards, SAE paper 2008-01-1199.[7] M. Jankovic, M. Jankovic, I. Kolmanovsky, Constructive Lyapunov control design for turbocharged diesel engines,
IEEE Transactions on Control System Technology 8(2) (2000) 288–299.[8] I. Kolmanovsky, A. Stefanopoulou, P. Moraal, M. van Nieuwstadt, Issues in modeling and control of intake flow
in variable geometry turbocharged engines, Proceedings of the 18th IFIP COnference on System Modeling andOptimization, Detroit July 1997.
[9] J. Ruckert, Schloß, H. Rake, B. Kinoo, M. Kruger, S. Pischinger, Model based boost pressure and exhaust gas recir-culation rate control for a diesel engine with variable turbine geometry, IFAC Workshop: Advances in AutomotiveControl.
[10] M. Ammann, N. Fekete, L. Guzella, A. Glattfelder, Model-based control of the VGT and EGR in a turbochargedcommon-rail diesel engine: Theory and passenger car implementation, SAE paper 2003-01-0357.
[11] J. Merten, K. Glover, U. Christen, Comparison of uncertainty parametrisations for h∞ robust control of tur-bocharged diesel engines, Control engineering practice.
[12] R. Ramajani, Control of a variable-geometry turbocharged and wastegated diesel engine, Proceedings of the Insti-tution of Mechanical Engineers, Part D: Journal of Automobile Engineering 219 (2005) 1361–1368.
[13] P. Ortner, L. del Re, Predictive control of a diesel engine air path, IEEE Transactions on Control Systems Technol-ogy 15(3) (2007) 449–456.
[14] M. van Nieuwstadt, I. Kolmanovsky, P. Moraal, A. Stefanopoulou, M. Jankovic, EGR-VGT control schemes:Experimental comparison for a high-speed diesel engine, IEEE Control Systems Magazine 20 (2000) 63–79.
[15] A. Stefanopoulou, I. Kolmanovsky, J. Freudenberg, Control of variable geometry turbocharged diesel engines forreduced emissions, IEEE Transactions on Control Systems Technology 8 (2000) 733–745.
20
[16] B. Youssef, G. Le Solliec, G. Corde, O. Hayat, C. Jabeur, P. Calendini, Low pressure EGR control for a tur-bocharged diesel HCCI engine, 18th IEEE International Conference on Control Applications. Part of 2009 IEEEMulti-conference on Systems and Control (2009) 346–351.
[17] J. Galindo, H. Climent, C. Guardiola, J. Domenech, Modeling the vacuum circuit of a pneumatic valve system,Journal of Dynamic Systems, Measurement and Control, Transactions of the ASME 131 (3) (2009) 1–11.
[18] J. Galindo, J. Serrano, F. Arnau, P. Piqueras, Description and analysis of a one-dimensional gas-dynamic modelwith independent time discretization, Proceedings of the ASME Internal Combustion Engine Division 2008 SpringTechnical Conference.
[19] J. Galindo, F. J. Arnau, A. Tiseira, P. Piqueras, Solution of the turbocompressor boundary condition for one-dimensional gas-dynamic codes, Mathematical and Computer Modelling 52 (7-8) (2010) 1288–1297.
[20] J. Serrano, H. Climent, C. Guardiola, P. Piqueras, Methodology for characterisation and simulation of turbochargeddiesel engines combustion during transient operation. Part 2: Phenomenological combustion simulation, AppliedThermal Engineering 29 (2009) 150–158.
[21] J. Galindo, H. Climent, C. Guardiola, A. Tiseira, J. Portalier, Assessment of a sequentially turbocharged dieselengine on real-life driving cycles, International Journal of Vehicle Design 49 (1-3) (2009) 214–234.
[22] J. Serrano, H. Climent, C. Guardiola, P. Piqueras, Methodology for characterisation and simulation of turbochargeddiesel engines combustion during transient operation. part 2: Phenomenological combustion simulation, AppliedThermal Engineering 29 (1) (2009) 150–158.
[23] V. Macian, J. Galindo, J. Lujan, C. Guardiola, Detection and correction of injection failures in diesel engines onthe basis of turbocharger instantaneous speed frequency analysis, Proceedings of the Institution of MechanicalEngineers, Part D: Journal of Automobile Engineering 219 (5) (2005) 691–701.
[24] J. Lujan, J. Galindo, J. Serrano, B. Pla, A methodology to identify the intake charge cylinder-to-cylinder distributionin turbocharged direct injection diesel engines, Measurement Science and Technology 19 (6) (2008) 065401.
[25] C. Guardiola, A. Gil, B. Pla, P. Piqueras, Representation limits of mean value engine models, Lecture Notes inControl and Information Sciences 418 (2012) 185–206.
[26] A. Amstutz, L. del Re, EGO sensor based robust output control of EGR in diesel engines, IEEE Transactions onControl Systems Technology 3(1) (1995) 37–48.
[27] J. Arregle, J. Lopez, C. Guardiola, C. Monin, Sensitivity study of a NOx estimation model for on-board applica-tions, SAE paper 2008-01-0640.
[28] L. Guzzella, A. Amstutz, Control of diesel engines, IEEE Control Systems 18(5) (1998) 53–71.[29] J. Wahlstrom, L. Eriksson, L. Nielsen, EGR-VGT control and tuning for pumping work minimization and emission
control, IEEE Transactions on Control Systems Technology 18(4) (2010) 993–1003.[30] P. Langthaler, L. Del Re, Fast predictive oxygen charge control of a diesel engine, Proceedings of the American
Control Conference (2007) 4388–4393.[31] C.-J. Chiang, A. Stefanopoulou, M. Jankovic, Nonlinear observer-based control of load transitions in homogeneous
charge compression ignition engines, IEEE Trans. on Cont. Sist. Technol. 15 (2007) 438448.[32] C. Beatrice, G. Avolio, C. Bertoli, N. Del Giacomo, C. Guido, M. Migliaccio, Critical aspects on the control in
the low temperature combustion systems for high performance di diesel engines, Oil Gas Sci. Technol. 62 (2007)471–482.
[33] E. Bristol, New measure of interaction for multivariable process control, IEEE Transactions on Automatic Control11 (1965) 133–134.
[34] F. Giri, F. Chaoui, Y. Rochdi, Parameter identification of a class of hammerstein plants, Automatica 37 (5) (2001)749 – 756.
[35] J. Wahlstrom, L. Eriksson, Performance gains with egr-flow inversion for handling non-linear dynamic effects inegr vgt ci engi..., Fifth IFAC Symposium on Advances in Automotive Control,2007 s. 531-538.
[36] A. Stefanopoulou, I. Kolmanovsky, J. Freudenberg, Control of variable geometry turbocharged diesel engines forreduced emissions, Control Systems Technology, IEEE Transactions on 8 (4) (2000) 733 –745.
[37] F. Payri, J. Lujan, C. Guardiola, G. Lapuente, Experimental evaluation of the impact of vgt control malfunction onpollutant emissions, Proceedings of the ECOSM New Trands in Engine COntrol, Simulation and Modelling.
21