Electronic tongue, 2018_Autor.pdf - RiuNet
30
Document downloaded from: This paper must be cited as: The final publication is available at Copyright Additional Information http://hdl.handle.net/10251/115875 Sobrino-Gregorio, L.; Bataller Prats, R.; Soto Camino, J.; Escriche Roberto, MI. (2018). Monitoring honey adulteration with sugar syrups using an automatic pulse voltammetric electronic tongue. Food Control. 91:254-260. doi:10.1016/j.foodcont.2018.04.003 https://doi.org/10.1016/j.foodcont.2018.04.003 Elsevier
-
Upload
khangminh22 -
Category
Documents
-
view
0 -
download
0
Transcript of Electronic tongue, 2018_Autor.pdf - RiuNet

Document downloaded from:
This paper must be cited as:
The final publication is available at
Copyright
Additional Information
http://hdl.handle.net/10251/115875
Sobrino-Gregorio, L.; Bataller Prats, R.; Soto Camino, J.; Escriche Roberto, MI. (2018).Monitoring honey adulteration with sugar syrups using an automatic pulse voltammetricelectronic tongue. Food Control. 91:254-260. doi:10.1016/j.foodcont.2018.04.003
https://doi.org/10.1016/j.foodcont.2018.04.003
Elsevier

1
Monitoring honey adulteration with sugar syrups using an automatic 1
pulse voltammetric electronic tongue 2
Lara Sobrino-Gregorioa, Román Batallerb, Juan Sotob, Isabel Escrichea,c, * 3
aInstituto de Ingeniería de Alimentos para el Desarrollo, Universitat Politècnica de 4
València, Camino de Vera 14, 46022, Valencia, Spain 5
bInstituto de Reconocimiento Molecular y Desarrollo Tecnológico (IDM), Centro Mixto 6
Universitat Politècnica de València. Departamento de Química, Universitat Politècnica 7
de València, Camino de Vera 14, 46022, Valencia, Spain 8
cFood Technology Department (DTA), Universitat Politècnica de València, Camino de 9
Vera 14, 46022, Valencia, Spain 10
*Correspondence to: Isabel Escriche ([email protected]) 11
ABSTRACT 12
The new tendency to detect adulterated honey is the development of affordable 13
analytical equipment that is in-line and manageable, enabling rapid on site screening. 14
Therefore, the aim of this work was to apply an electronic tongue based on potential 15
multistep pulse voltammetry, in combination with multivariate statistical techniques to 16
detect and quantify syrup in honey. Pure monofloral honey (heather, orange blossom 17
and sunflower), syrup (rice, barley and corn), and samples simulating adulterated honey 18
with different percentages of syrup (2.5, 5, 10, 20 and 40) were evaluated. An 19
automatic, electrochemical system for cleaning and polishing the electronic tongue 20
sensors (Ir, Rh, Pt, Au) significantly improved the repeatability and accuracy of the 21
measurements. PCA analysis showed that the proposed methodology is able to 22
distinguish between types of pure honey and syrup, and their different levels of 23
adulterants. A subsequent PLS analysis successfully predicted the level of the 24

2
adulterants in each honey, achieving good correlations considering the adjusting 25
parameters. The best results being for sunflower honey adulterated with corn syrup and 26
heather honey with barley syrup (r2=0.997), and heather with corn (r2=0.994) whereas 27
the weakest was found for heather honey adulterated with brown rice syrup (r2=0.763) 28
and orange blossom honey with corn syrup (r2=0.879). The measurement system here 29
proposed could be a very quick and effective option for the honey packaging sector with 30
the finality of providing information about a characteristic as important as the 31
adulteration of honey. 32
Keywords: honey adulteration, syrups, pulse voltammetry, electronic tongue 33
1. Introduction 34
Honey is a nutritional natural sweetener highly valued for its healing properties (Naila 35
et al., 2018, Cabanero et al., 2006; Padovan et al., 2003; Ruiz-Matute et al., 2010; Bázár 36
et al., 2016). The European Commission has stipulated that nothing should be added to 37
honey (European Commission, 2002), but the limited availability and its price have 38
provided major incentives for adulteration (Anklam, 1998). Honey is adulterated mainly 39
with cheaper sweeteners such as sugar syrups that simulate its own sugar composition 40
(Naila et al., 2018, Li et al., 2017; Sobrino-Gregorio et al., 2017, Cai et al., 2013). 41
Adulterated honey affects the international honey market and the economy of the 42
producers. In addition, it could have negative effects on consumer’s nutrition and health 43
(Tosun, 2013). Therefore, guaranteeing the authenticity of honey has become a very 44
important issue for everyone involved in the food chain (Sobrino-Gregorio, 2017). 45
In recent years, a large number of analytical methods have been used to differentiate 46
genuine honey from adulterated. Among them, the most recognized are NMR 47
spectroscopy (Bertelli et al., 2010; Boffo et al., 2012; Davide and Massimo, 2010; 48
Ohmenhaeuser et al., 2013; De Oliveira et al., 2014) and stable carbon isotopic ratio 49

3
mass spectrometry (SCIRA) (Elfleing & Raezke, 2008; Adnan et al., 2012; Simsek et 50
al., 2012; Tosun, 2013). Another commonly used method is the reflectance-Fourier 51
transforms infrared spectroscopy (Oroian & Ropciuc, 2017, Rios-Corripio et al., 2012;), 52
high performance liquid chromatography (HPLC) to detect starch syrups (Wang et al., 53
2015), enzymatic activity (diastase, invertase) (Serra et al., 2000), specific markers (Xue 54
et al., 2013) and differential scanning calorimetry (DSC) (Cordella et al., 2002 y 2003; 55
Sobrino-Gregorio et al., 2017). 56
However, using these techniques individually the results obtained are not always 57
conclusive, therefore, to guarantee the purity in honey the combination of several of 58
them is required. Moreover, these techniques are very expensive, they require highly 59
specialized equipment and are time-consuming (Sobrino-Gregorio et al., 2017). 60
To identify the authenticity of honey the industry needs to have simple, fast and easy to 61
handle techniques without the need for expensive equipment and highly skilled workers 62
(Bougrini et al., 2016; Juan-Borrás et al., 2017). Furthermore, the honey sector does not 63
require data of exact levels of adulteration of honey, since any type of addition is 64
prohibited. Only with a screening technique that able is to detect the slightest 65
adulteration is enough. 66
Among the most promising techniques that fulfill this requirement, in addition to being 67
more environmentally friendly than the usual methods, the electronic tongue has the 68
advantage, as it can be an alternative tool to the traditional analytic methods (Bougrini 69
et al., 2016). Unlike the traditional methods, electronic tongues do not obtain 70
information about the nature of the compounds under consideration, but only present a 71
digital fingerprint of the food material (Ghasemi-Varnamkhasti et al., 2010). It is also a 72
qualitative analytical technique that permits recognition, classification or identification 73

4
of samples, depending on the composition of the sensor array and the mathematical 74
procedure adopted for data treatment. 75
Electronic tongue systems are based on an array of sensors with low selectivity while 76
being sensitive to several components in the measured sample (cross-sensitivity). The 77
signals collected by these sensors are processed by means of pattern recognition tools in 78
order to generate prediction models that allow the classification of the samples and the 79
quantification of some of their physicochemical properties (Gutés et al., 2007). 80
There are several alternatives to electronic tongue systems, the voltammetric being one 81
of the most used (Martínez-Mañez et al., 2005; Lvova et al., 2006; Winquist et al., 82
2005), which has different advantages: high sensitivity, versatility, simplicity, 83
robustness and good signal to noise ratio (Winquisk, 2008). 84
These techniques, using arrays of electrodes, is at present the most popular for the 85
design of electronic tongue systems, which include linear voltammetry, differential 86
pulse voltammetry (Bataller et al., 2013), stripping voltammetry and over all cyclic 87
voltammetry (Campos et al., 2010). Cyclic voltammetry is the most widely used 88
technique (Bollo et al., 2004; De Beer et al., 2004; Dogan et al., 2005) and the obtained 89
voltammogram permits the characterisation of electrochemical processes (oxidation–90
reduction) over a wide potential range. On the other hand, pulse voltammetry is used 91
when higher sensitivity and resolution are required, allowing the detection of lower 92
concentrations of compounds (Escobar et al., 2013). In all cases the enormous amount 93
of data generated by these systems must be processed using appropriate multivariate 94
analysis techniques such as PCA (principal component analysis), LDA (linear 95
discriminant analysis) or CA (cluster analysis) (Benedetti et al., 2004; Dias et al., 2008; 96
Wei et al., 2009). 97

5
Electronic tongue systems are capable of identifying and classifying liquid samples such 98
as wine, beer, coffee, milk, juices, teas and vegetable oils (Schreyer & Mikkelsen, 2000; 99
Parra et al., 2004; Apetrei et al., 2005; Huang et al., 2007; Chen et al., 2008; Moreno-100
Codinachs et al., 2008; Rodríguez-Méndez et al., 2008; He et al., 2009; Oliveri et al., 101
2009; Gutiérrez et al., 2010; Gutierrez-Capitan et al., 2013; Apetrei & Apetrei, 2014; 102
Veloso et al., 2016). Moreover, it is used in quality assessment of solid foods such as 103
meat, fish, fruit and vegetables (Han et al., 2008; Rodríguez-Méndez et al., 2009; 104
Campos et al., 2010; Labrador et al., 2010). In the context of discriminating different 105
classes within the same food type, it has been successfully used in honey, specifically 106
focused on its differentiation according to its botanical and geographical origin (Dias et 107
al., 2008; Wei et al., 2009; Wei & Wang, 2011; Major et al., 2011; Escriche et al., 2012; 108
Garcia-Breijo et al., 2013; Tiwari et al., 2013; Sousa et al., 2014; Bougrini et al., 2016; 109
Juan-Borrás et al., 2017). 110
One of the most promising applications of the electronic tongue systems is the detection 111
of food adulterations. Good results have been reported in the identification of sunflower 112
oil introduced in argan oil (Bougrini et al., 2014) or in the case of goat milk adulterated 113
with bovine milk (Dias et al., 2009). However, little research about the use of electronic 114
tongue systems to identify adulteration of honey has been reported using pulse 115
voltammetry (Men et al., 2014) or cyclic voltammetry (Bougrini et al., 2016; Ropciuc et 116
al., 2017). However, the application of pulse voltammetry, in the above context, could 117
provide important advantages since it has higher sensitivity and resolution (Bataller et 118
al., 2013). 119
Nevertheless, an important problem that limits the use of electronic tongues as a 120
technique for on-line quality controls is that of sensor system cleaning. In the aim to 121
solve this, a mechanical system was developed by Swedish Sensor Center for polishing 122

6
the electrodes of the electronic tongues (Olsson et al., 2006). However, it significantly 123
limits the utility of the technique in controlling automated processes, as it requires high 124
maintenance and costs. As a cheaper and easier alternative, the same group proposed the 125
use of electropolishing to clean the electronic tongues (Holmin et al., 2004). The 126
procedure consists of applying a high enough voltage to oxidize the surface of the 127
electrodes, and to apply proper cathodic voltage to regenerate the different metal 128
surfaces. Although studies using this technique were promising, the methodology was 129
not optimized for systems that have high concentrations or high levels of contaminant 130
load. Honey falls within the group of substances for which there is no well-defined 131
electropolishing methodology. 132
Taking this into consideration, the aim of this study was to optimize an adequate 133
electropolishing system to investigate the capacity of a pulse voltammetric electronic 134
tongue, which consisted of a set of metal electrodes, to differentiate the presence of 135
syrups in honey samples simulating various levels of adulteration. 136
2. Materials and methods 137
2.1. Samples preparation 138
Three types of raw honey harvested in 2016, provided by the company Melazahar 139
(Montroy, Valencia), were used in this study: sunflower (Helianthus annuus); orange 140
blossom (Citrus spp.) and heather (Erica spp.). They were selected based on their 141
different physicochemical characteristics (Juan-Borrás et al., 2015). The botanical 142
categorization of all the batches was carried out by means of pollinic analysis following 143
the recommendations of the International Commission for Bee Botany (Von Der Ohe et 144
al., 2004). Microscopic examination, identification and the interpretation of pollen types 145
were carried out by an experienced pollen analyst, using pollen slides and references 146
(Sáenz & Gómez, 2000; Persano-Oddo & Piro, 2004). Furthermore, three kinds of 147
7
syrups from different origins were used: barley (La Finestra sul Cielo, Italy); corn 148
(Roquette Laissa, Spain) and brown rice (Mitoku Macrobiotic, Japan). 149
The samples evaluated in the present work were: three pure syrups, three pure honeys 150
and a mixture of both in different percentages (40, 20, 10, 5 and 2.5%, respectively) 151
simulating the adulteration of honey. In each case, 8 g of sample (considered on a dry 152
basis) were used. For this, the moisture content was obtained by using a refractometer 153
(Abbe-type model T1; Atago, Bellevue, WA, USA) and the Chataway tables in 154
accordance with the Harmonized Methods of the European Honey Commission 155
(Bogdanov, 2009). All samples were analysed three times achieving four repetitions for 156
each replication. 157
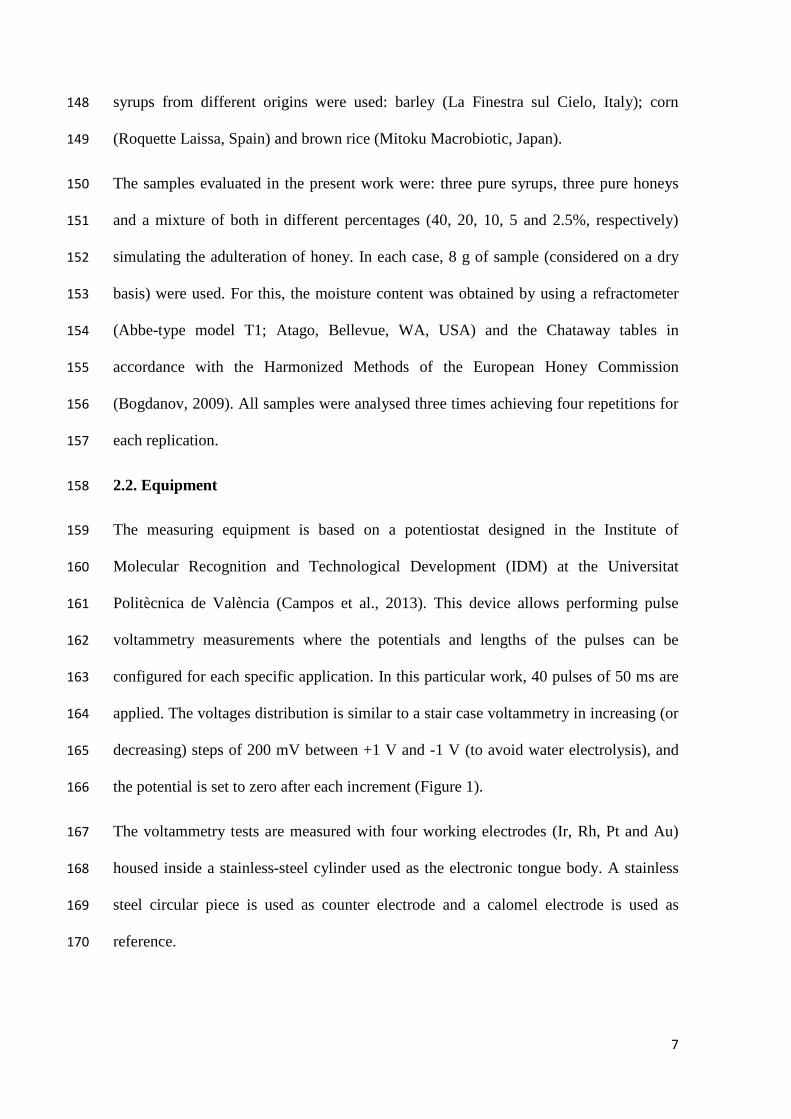
2.2. Equipment 158
The measuring equipment is based on a potentiostat designed in the Institute of 159
Molecular Recognition and Technological Development (IDM) at the Universitat 160
Politècnica de València (Campos et al., 2013). This device allows performing pulse 161
voltammetry measurements where the potentials and lengths of the pulses can be 162
configured for each specific application. In this particular work, 40 pulses of 50 ms are 163
applied. The voltages distribution is similar to a stair case voltammetry in increasing (or 164
decreasing) steps of 200 mV between +1 V and -1 V (to avoid water electrolysis), and 165
the potential is set to zero after each increment (Figure 1). 166
The voltammetry tests are measured with four working electrodes (Ir, Rh, Pt and Au) 167
housed inside a stainless-steel cylinder used as the electronic tongue body. A stainless 168
steel circular piece is used as counter electrode and a calomel electrode is used as 169
reference. 170
8
An integrated system of solenoid valves and a pump permit the automatic injection of 171
liquid samples into a specifically designed measurement chamber. This complete 172
system allows the implementation of an innovative electrochemical polishing of the 173
working electrodes. For each metal, a configuration of basic or acidic solution is used 174
when a sequence of cathodic and anodic pulse (or reversed) is applied to them. The aim 175
is desorbing the organic material accumulated at the surface of the electrodes, and 176
detaching any oxide layer that may have been formed (Table 1). 177
An in-house design of a specific software manages both the measuring equipment and 178
the pumping system. It performs a complete set of measurements with the same setup, 179
and stors the results for a later statistical analysis. 180
This system was patented in 2016, under the name “Sistema y método de control de la 181
calidad del agua en plantas de tratamiento”, which translation would be “System and 182
method to control water quality in treatment plants”, property of the company Fomento 183
Agrícola Castellonense, S.A. and the by the Interuniversity Research Institute for 184
Molecular Recognition and Technological Development (IDM) of the Universitat 185
Politècnica de València, with reference number P201631405 (Bataller et al., 2016). 186
2.3. Statistical analysis 187
Multivariate statistical analysis techniques were used to analyse the data gathered for 188
this study. Principal Components Analysis (PCA) was used to discriminate between 189
samples and Partial Least Square (PLS) to quantify the content of honey adulterant in 190
the analysed samples. The PLS model was calibrated with 66% of the data set and 191
validated with the remaining 33%. Model’s assessment is done by comparing real 192
versus predicted adulteration levels. The parameters used are the correlation coefficient 193
(r2), a, b (from the simplest linear model: y = ax + b) and the root mean square error of 194

9
prediction (RMSEP) as the most common metric obtained to measure accuracy of this 195
methodology (Bataller et al., 2012). 196
All these statistical studies have been performed with Solo 8.6 software (Eigenvector 197
Research, Inc., Wenatchee, Washington, DC, USA). 198
3. Results and discussion 199
3.1. Differentiation of pure honeys and syrups 200
A PCA analysis was applied (from the data generated by the four electrodes of the 201
electronic tongue) in order to show if there was a classification of the different types of 202
pure samples (honeys and syrups). Figure 2 shows the score plot of this analysis, in 203
which the first two principal components together explain 80.01% of the data 204
variability, specifically 59.59% by PC1 and 20.42% by PC2. Discrimination between 205
honeys and syrups is mainly determined by the X axis (PC1), where the honey samples 206
are in the centre of the score graph and the syrups are placed on both sides (on the left 207
the barley and brown rice syrups, on the right the corn). Since, proximity between 208
samples indicates similar behaviour in terms of the electrochemical response of the 209
sensors, small differences between barley and brown rice syrups with respect to corn 210
syrups were found. On the contrary, the type of honey is differentiated by PC2, where 211
heather honey is in the upper half and sunflower honey in the lower, whereas orange 212
blossom honey is in the middle. 213
Once proven that this methodology could differentiate between all types of pure 214
samples analysed, the next phase was to verify if this type of electronic tongue was able 215
to discriminate honeys in which syrups have been added. 216
3.2. Differentiation by adulteration levels 217

10
Figure 3 shows, as an example, the behaviour of the signal obtained by applying the 218
corresponding potential pulse pattern to sunflower honey adulterated with barley syrup. 219
There is a clear differentiation between the signals obtained for syrup, pure honey and 220
the different percentages of adulteration (40, 20, 10, 5 and 2.5%, respectively). It is 221
evident that the signals are affected by the samples and the adulteration levels. The 222
highest signal corresponds to pure syrup which progressively decreases to pure honey, 223
going through its different and ordered stages of adulteration. This behaviour was in 224
most cases constant, regardless of the type of syrup and honey. 225
For the purpose of evaluating from a descriptive point of view, the global effect of the 226
electronic tongue response in the pure honeys, syrups and their corresponding 227
adulteration levels, different Principal Component Analysis (PCA) were carried out. 228
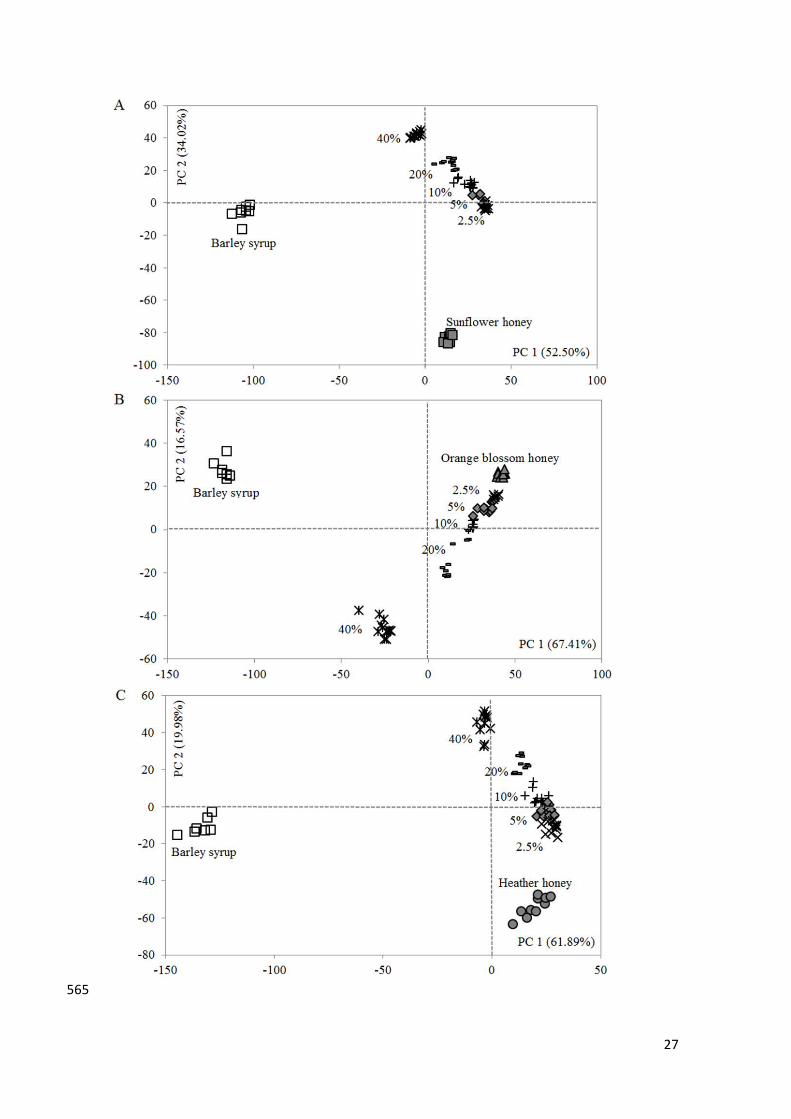
Figure 4 shows, as an example, the PCA performed in the case of adding barley syrup 229
(40, 20, 10, 5 and 2.5%) to the three pure honeys. In this figure (4.A to 4.C), the two 230
principal components represent 86.5% (PC1: 52.50%; PC2: 34.02%); 83.98% (PC1: 231
67.41%; PC2: 16.57%) and 78.87% (PC1: 61.89%; PC2:19.98%) for sunflower; orange 232
blossom and heather, respectively. Pure barley syrup and honey with 40% of barley 233
syrup are in all cases on the left side of the plots (but in opposite quadrants), whereas 234
the rest of the samples are placed on the right side. In all these PCA plots, a progressive, 235
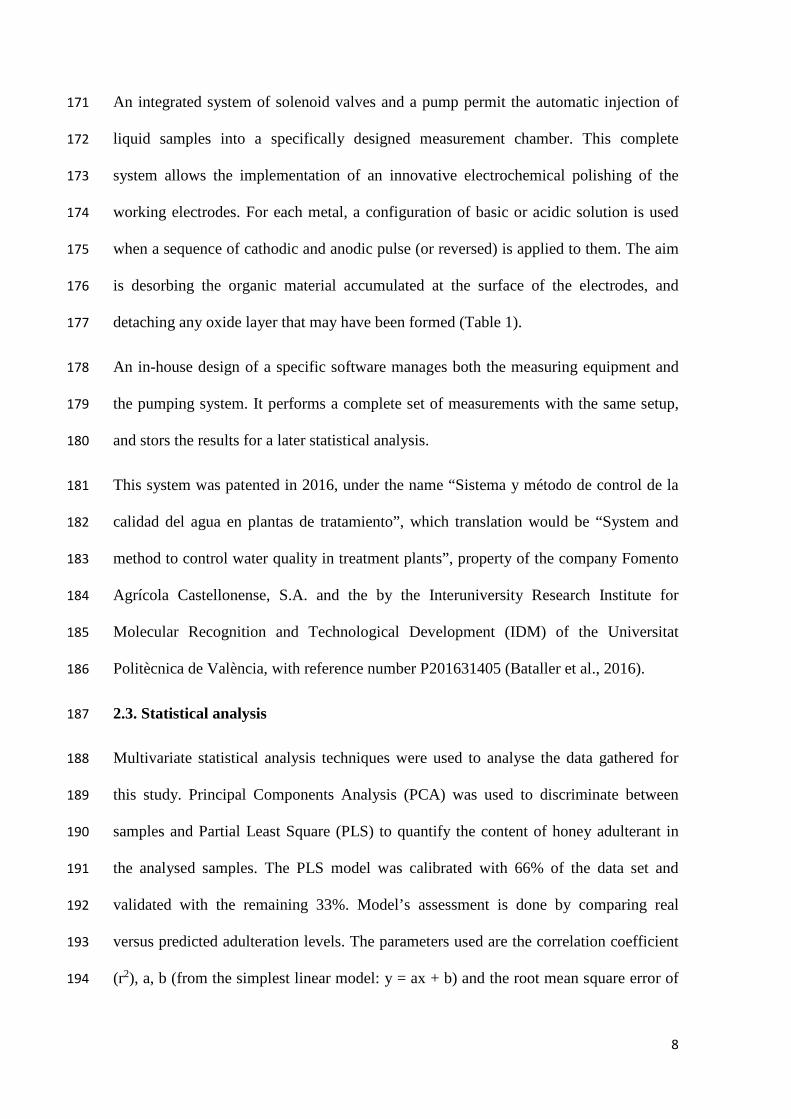
ordered and clear tendency is observed in relation to the adulteration level. The higher 236
level (40%) is farther away from the pure honey, whereas the lower level (2.5%) is 237
closer to it. 238
Similar results were reported by Bougrini et al., (2016) using cyclic voltammetry for 239
adulteration detection, from 2 to 20%, of pure honey although glucose and sacharose 240
syrups were added. The values of adulteration detected by these authors in honey are 241
even better than those described by them in the case of adulteration in argan oil 242

11
adulterated with different proportions of sunflower oil (10 to 70%) (Bougrini et al., 243
2014). Ropciuc et al. (2017), using cyclic voltammetry (with Ag and Au as working 244
electrodes) differentiated honeys adulterated with inverted sugar and malt wort only 245
when they did not exceed 20%. 246
The present work confirms that using pulse voltammetry allowed for further 247
possibilities by designing a specific pulse pattern. In addition to the automation of the 248
electrochemical cleaning process while providing good reproducibility of the sensors 249
and good classification results, it also permitted the detection of a wider adulteration 250
range (up to 40%). Moreover, among other advantages it was observed that the time 251
required to analyse one sample using the pulse voltammetry technique is considerably 252
less: 8 seconds to scan with the 4 electrodes; 40 seconds for 5 iterations; 12 seconds for 253
electropolishing per electrode; 4 minutes for the final cleaning of the sensor system if 5 254
consecutive cleanings are performed. However, considering the protocol described by 255
Bougrini et al. in 2016, the cleaning alone (disassembled, manual cleaning of 256
electrodes, electrochemical cell re-assembled, etc.) takes at least 20 min. 257
3.3. PLS analysis: correlation of pulse voltammetric data with the level of 258
adulteration 259
In order to verify whether the data provided by the electronic tongue could be useful in 260
predicting the adulteration of pure honeys (sunflower, orange blossom, heather) with 261
syrup (barley, corn, brown rice) at different percentages (40, 20, 10, 5 and 2.5%), a 262
Partial Least Square (PLS) analysis was applied. Nine PLS models of prediction were 263
created (3 honeys multiplied by 3 syrups) with the voltammetric experimental data 264
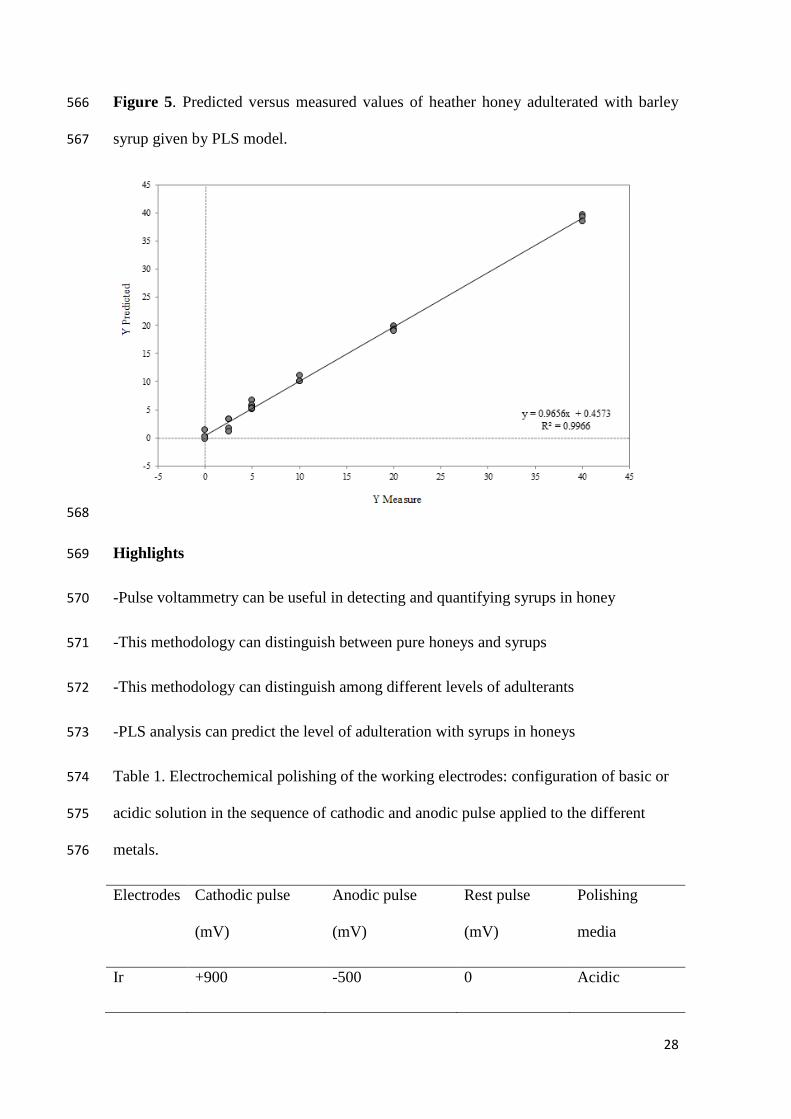
obtained from the four metallic electrodes (Ir, Rh, Pt, Au). Figure 5 shows one of these 265
PLS graphs (heather honey adulterated with barley syrup) in which measured vs. 266
predicted values of the adulteration levels are plotted together in order to evaluate the 267
12
performance of the created prediction linear model. Table 2 shows the PLS prediction 268
results (slope, intercept, the regression coefficient, number of latent variables and 269
RMSEP) for the nine models obtained. In most cases, there is a good result, the best one 270
being for sunflower-corn and heather-barley with correlation coefficients of 0.997 and 271
heather-corn with 0.994. The weakest correlation was for heather-brown rice (0.763) 272
and orange blossom-corn (0.879). In order to quantitatively describe the accuracy of 273
model outputs obtained, the RMSEP were shown (Table 2). The best model in terms of 274
capability of prediction corresponded to that obtained for heather-barley (0.834) 275
followed by sunflower- barley (1.252). The worst model was for orange blossom-corn 276
(5.261) and header brown-rice (5.159). 277
Cai, et al., in 2013, applied cyclic voltammetry in Chinese Angelica honey adulterated 278
with rice syrup (from 20% to 50%). They were able to prove that in quantitative 279
analysis of honey adulteration, a multiple linear regression (MLR) model fitted and 280
predicted well with the square of the correlation coefficients (Rc=0.921 and Rp=0.898). 281
Other authors proposed the combination of PLS with Fuzzy ARTMAP tools to improve 282
the classification of honey adulterated in different proportions (from 0 to 70%) when a 283
voltammetric electronic tongue system is applied (Men et al, 2014). 284
4. Conclusions 285
This paper has presented for the first time that an innovative automatic pulse 286
voltammetry can be applied to quantify the presence of syrups in honey. The outcome is 287
the possibility that this type of electronic tongue (with automatic, electrochemical 288
system for cleaning and polishing the electronic tongue sensors) permits detecting this 289
kind of fraud in a bee product to which no addition of substances is allowed. PCA 290
analysis demonstrated that this automatic pulse voltammetry electronic tongue system, 291
made of four metallic electrodes (Ir, Rh, Pt, Au) was capable of not only differentiating 292

13
between types of pure honey and pure syrups but also to discriminate honeys to which 293
syrups have been added at different levels. The PLS models are capable of predicting 294
the additions of adulterants in different types of honey, and therefore provides a 295
powerful tool to quantify their level of incorporation. 296
The present findings might help to solve the necessity to have a manageable and in-line 297
analytical equipment that enables rapid on site screening and also more affordable for 298
the apiculture sector. However, future studies on the current topic are recommended in 299
order to create a wide and comprehensive data base of pure types of honey from 300
different botanical and geographical origin. 301
Conflicts of interest 302
The authors declare that they have no conflict of interest. 303
Acknowledgment 304
This study forms part of the projects funded by the “Agencia Estatal de Investigación” 305
(AGL2016-77702-R) and by the “Generalitat Valenciana” (AICO/2015/104) of Spain, 306
for which the authors are grateful. 307
References 308
Adnan, S., Mine, B., Ahmet, C. G. (2012). 13C/12C pattern of honey from Turkey and 309
determination of adulteration in commercially available honey samples using EA-310
IRMS. Food Chemistry, 130, 1115−1121. 311
Anklam, E. (1998). A review of the analytical methods to determine the geographical 312
and botanical origin of honey. Food Chemistry, 63, 549-562. 313

14
Apetrei, C., Rodríguez-Mendez, M. L., de Saja, J. A. (2005). Modified carbon paste 314
electrodes for discrimination of vegetable oils. Sensors and Actuators B, 111-112, 315
403-409. 316
Apetrei, I. M., Apetrei, C. (2014). Detection of virgin olive oil adulteration using a 317
voltammetric e tongue. Computers and Electronics in Agriculture, 108, 148-154. 318
Bataller, R., Campos, I., Laguarda-Miro, N., Alcañiz, M., Soto, J., Martínez-Máñez, R., 319
Gil, L., García-Breijo, E., Ibáñez-Civera, J. (2012). Glyphosate Detection by Means 320
of a Voltammetric Electronic Tongue and Discrimination of Potential Interferents. 321
Sensors, 12, 17553-17568. 322
Bataller, R., Campos, I., Alcañiz, M., Gil-Sánchez, L., García-Breijo, E., Martínez-323
Máñez, R., Pascual, L., Soto, J., Vivancos, J. L. (2013). A humid electronic nose 324
based on pulse voltammetry: A proof-of-concept design. Sensors and Actuators B: 325
Chemical, 186, 666-673. 326
Bataller, R., Martínez-Bisbal, M. C., Alcañiz, M., Berlanga-Clavijo, J. G., Carbó-327
Mestre, N., Folch, E., Tormos, I. (2016). Sistema y método de control de la calidad 328
del agua en plantas de tratamiento. P201631405 (patent). 329
Bázár, G., Romvári, R., Szabó, A., Somogyi, T., Éles, V., Tsenkova, R. (2016). NIR 330
detection of honey adulteration reveals differences in water spectral pattern. Food 331
Chemistry, 194, 873-880. 332
Benedetti, S., Mannino, S., Sabatini, A. G., Marcazzan, G. L. (2004). Electronic nose 333
and neural network use for the classification of honey. Apidologie, 35, 397-402. 334
Bertelli, D., Lolli, M., Papotti, G., Bortolotti, L., Serra, G., Plessi, M. (2010). Detecction 335
of adulteration by sugar syrups using one-dimensional and two-dimensional high-336

15
resolution Nuclear Magnetic Resonance. Journal of Agricultural and Food 337
Chesmistry, 58, 8495-8501. 338
Boffo, E. F., Tavares, L. A., Tobias, A. C. T., Ferreira, M. M. C., Ferreira, A. G. (2012). 339
Identification of components of Brazilian honey by H NMR and classification of its 340
botanical origin by chemometric methods. LWT. Food Science and Technology, 49, 341
55-63. 342
Bogdanov, S. (2009). Harmonized methods of the International Honey Commission. 343
http://www.terezinka.cz/vcely/Med/IHCmethods_e.pdf / Accessed 08/07/17 344
Bollo, S., Nuñez-Vergara, L., Squella, J. (2004). Cyclic voltammetric determination of 345
free radical species from nitroimidazopyran: A new antituberculosis agent. Journal 346
of Electroanalytical Chemistry, 562, 9-14. 347
Bougrini, M., Tahri, K., Haddi, Z., Saidi, T., Bari, N. E., Bouchikhi, B. (2014). 348
Detection of Adulteration in Argan Oil by Using an Electronic Nose and a 349
Voltammetric Electronic Tongue. Journal of Sensors, 10 pages. 350
Bougrini, M., Tahri, K., Saidi, T., Hassani, N. E. A. E.,Bouchikhi, B., Bari, N. E. 351
(2016). Classification of Honey According to Geographical and Botanical Origins 352
and Detection of Its Adulteration Using Voltammetric Electronic Tongue. Food 353
Analytical Methods, 9, 2161-2173. 354
Cabanero, A. I., Recio, J. L., Ruperez, M. (2006). Liquid chromatography coupled to 355
isotope ratio mass spectrometry: A new perspective on honey adulteration detection. 356
Journal of Agricultural and Food Chemistry, 54, 9719-9727. 357
Cai, J.; Wu, X.; Yuan, L.; Han, E.; Zhou, L.; Zhou. A. (2013). Determination of 358
Chinese Angelica honey adulterated with rice syrup by an electrochemical sensor and 359
chemometrics. Analytical Methods, 5, 2324-2328. 360

16
Campos, I., Masot, R., Alcañiz, M., Gil, L., Soto, J., Vivancos, J. L., Garcia-Breijo, E., 361
Labrador, R. H., Barat, J. M., Martínez-Máñez, R. (2010). Accurate concentration 362
determination of anions nitrate, nitrite and chloride in minced meat using 363
voltammetric electronic tongue. Sensors and Actuators B: Chemical, 149, 71–78. 364
Campos, I., Bataller, R., Armero, R., Gandia, J. M., Soto, J., Martínez-Máñez, R., Gil-365
Sánchez, L. (2013). Monitoring grape ripeness using a voltammetric electronic 366
tongue. Food Research International, 54, 1369-1375. 367
Chen, Q., Zhao, J., Vittayapadung, S. (2008). Identification of the green tea grade level 368
using electronic tongue and pattern recognition. Food Research International, 41, 369
500-504. 370
Cordella, C.; Antinelli, J. F.; Aurieres, C.; Faucon, J. P.; Cabrol-Bass, D.; Sbirrazzuoli, 371
N. (2002). Use of differential scanning calorimetry (DSC) as a new technique for 372
detection of adulteration in honeys. 1. Study of adulteration effect on honey thermal 373
behavior. Journal of Agriculture Food Chemistry, 50, 203-208. 374
Cordella, C.; Faucon, J. P.; Cabrol-Bass, D.; Sbirrazzuoli, N. (2003). Application of 375
DSC as a tool for honey floral species characterization and adulteration detection. 376
Journal of Thermal Analysis and Calorimetry, 71, 279-290. 377
Davide, B., Massimo, L. (2010). Detection of honey adulteration by sugar syrups using 378
one-dimensional and two-dimensional highresolution nuclear magnetic resonance. 379
Journal of Agricultural and Food Chemistry, 58, 8495-8501. 380
De Beer, D., Harbertson, J. F., Kilmartin, P. A., Roginsky, V., Barsukova, T., Adams, 381
D. O. (2004). Phenolics: A comparison of diverse analytical methods. American 382
Journal of Enology and Viticulture, 55, 389-400. 383

17
De Oliveira, R., Teixeira, E., Da Silva, C., Guerra, M. L., Conte, C., Oliveira de Jesus, 384
E. F. (2014). Detection of honey adulteration of high fructose corn syrup by low field 385
Nuclear Magnetic Resonance (LF1H NMR). Journal of Food Engineering, 135, 39-386
43. 387
Dias, L. A., Peres, A. M., Vilas-Boas, M., Rocha, M. A., Estevinho, L., Machado, A. 388
(2008). An electronic tongue for honey classification. Microchimica Acta, 163 (1), 389
97-102. 390
Dias, L. A., Peres, A. M., Veloso, A. C. A., Reis, F. S., Vilas-Boas, M., Machado, A. A. 391
S. C. (2009). An electronic tongue taste evaluation: Identification of goat milk 392
adulteration with bovine milk. Sensors and Actuators B, 136, 209-217. 393
Dogan, B., Ozkan, S., Uslu, B. (2005). Electrochemical characterisation of flupentixol 394
and rapid determination of the drug in human serum and pharmaceuticals by 395
voltammetry. Analytical Letters, 38, 641–656. 396
Elfleing, L., Raezke, K. (2008). Improved detection of honey adulteration by measuring 397
differences btween 13C/12C stable carbon isotope ratios of protein and sugar 398
compounds with a combination of elemental analyser- isotope ratio mass 399
spectrometry and liquid chromatography- isotope ratio mass spectrometry (g13C-400
EA/LC-IRMS). Apidologie, 39:574. 401
Escobar, J. D., Alcaniz, M., Masot, R., Fuentes, A., Bataller, R., Soto, J., Barat, J. M. 402
(2013). Quantification of organic acids using voltammetric tongues. Food Chemistry, 403
138, 814-820. 404
Escriche, I., Kadar, M., Domenech, E., & Gil-Sánchez, L. (2012). A potentiometric 405
electronic tongue for the discrimination of honey according to the botanical origin. 406
18
Comparison with traditional methodologies: Physicochemical parameters and 407
volatile profile. Journal of Food Engineering, 109, 449-456. 408
European Commission (2002). Council Directive 2001/110/EC (20 December 2001) 409
relating to honey. Official Journal of the European Union, L010, 47-52. 410
Garcia-Breijo, E., Garrigues, J., Sanchez, L. G., Laguarda-Miro, N. (2013). An 411
embedded simplified Fuzzy ARTMAP implemented on a microcontroller for food 412
classification. Sensors, 13, 10418-10429. 413
Ghasemi-Varnamkhasti, M., Mohtasebi, S.S., Siadat, M. (2010). Biomimeticbased 414
odour and taste sensing systems to food quality and safety characterization: an 415
overviewon basic principles and recent achievements. Journal of Food Engineering, 416
100,377-387. 417
Gutés, A., Céspedes, F., Del Valle, M. (2007). Electronic tongues in flow analysis. 418
Analytical Chimica Acta, 600, 90-96. 419
Gutiérrez, M., Llobera, A., Vila-Planas, J., Capdevila, F., Demming, S., Büttgenbach, S. 420
(2010). Hybrid electronic tongue based on optical and electrochemical microsensors 421
for quality control of wine. The Analyst, 135, 1718-1725. 422
Gutierrez-Capitan, M., Santiago, J. L., Vila-Planas, J., Llobera, A., Boso, S., Gago, P. 423
(2013). Classification and characterization of different white grape juices by using a 424
hybrid electronic tongue. Journal of Agricultural and Food Chemistry, 61, 9325-425
9332. 426
Han, J., Huang, L., Gu, Z., Tian, S., Deng, S. (2008). Evaluation of meat quality and 427
freshness based on the electronic tongue. Journal of Chinese Institute of Food 428
Science & Technology, 8 (3), 125-132. 429

19
He, W., Hua, X., Zhao, L., Liao, X., Zhang, Y., Zhang, M. (2009). Evaluation of 430
Chinese tea by the electronic tongue: Correlation with sensory properties and 431
classification according to geographical origin and grade level. Food Research 432
International, 42, 1462-1467. 433
Holmin, S., Krantz-Rülcker, C., Winquist, F. (2004). Multivariate optimisation of 434
electrochemically pre-treated electrodes used in a voltammetric electronic tongue. 435
Analytica Chimica Acta, 519, 39-46. 436
Huang, X. Y., Zhang, H. Y., Zhao, J. W. (2007). Research and application of electronic 437
tongue technology in food industry. Food Science & Technology, 7, 20-24. 438
Juan-Borrás, M., Doménech, E., Conchado, A., Escriche, I. (2015). Physicochemical 439
quality parameters at the reception of the honey packaging process: influence of type 440
of honey, year of harvest, and beekeeper. Journal of Chemistry, 1-6. 441
doi:10.1155/2015/929658. 442
Juan-Borrás, M., Soto, J., Gil-Sánchez, L., Pascual-Maté, A., Escriche, I. (2017). 443
Antioxidant activity and physico-chemical parameters for the differentiation of 444
honey using a potentiometric electronic tongue. Journal of the Science of Food and 445
Agriculture, 97, Issue 7, Version of Record online: 5 Oct 2016. 446
Labrador, R. H., Masot, R., Alcañiz, M., Baigts, D., Soto, J., Martínez-Mañez, R. 447
(2010). Prediction of NaCl, nitrate and nitrite contents in minced meat by using a 448
voltammetric electronic tongue and an impedimetric sensor. Food Chemistry, 122, 449
864-870. 450
Li, S., Zhang, X., Shan, Y., Su, D., Ma, Q., Wen, R., Li, J. (2017). Qualitative and 451
quantitative detection of honey adulterated with high-fructose corn syrup and 452
maltose syrup by using near-infrared spectroscopy. Food Chemistry, 218, 231-236. 453

20
Lvova, L., Martinelli, E., Mazzoneb, E., Pede, A., Paolesse, R., Di Natale, C., D’Amico, 454
A. (2006). Electronic tongue based on an array of metallic potentiometric sensors. 455
Talanta, 70, 833-839. 456
Major, N., Markovic, K., Krpan, M., Saric, G., Hruskar, M., Vahcic, N. (2011). Rapid 457
honey characterization and botanical classification by an electronic tongue. Talanta, 458
85, 569-574. 459
Martínez-Máñez, R., Soto, J., Garcia-Breijo, E., Gil, L., Ibáñez, J., Llobet, E. (2005). 460
An ‘‘electronic tongue’’ design for the qualitative analysis of natural waters. Sensors 461
and Actuators B, 104, 302-307. 462
Men, H., Gao, H., Li, J., Liu, J., Zhang, Y. (2014). Fuzzy ARTMAP for the adulterated 463
honey discrimination with voltammetric electronic tongue. Sensors & Transducers, 464
178, 40-46. 465
Moreno-Codinachs, L., Kloock, J. P., Schöning, M. J., Baldi, A., Ipatov, A., Bratov, A. 466
(2008). Electronic integrated multisensor tongue applied to grape juice and wine 467
analysis. The Analyst, 133, 1440-1448. 468
Naila, A., Flint, S. H., Sulaiman, A. Z., Ajit, A., Weeds, Z. (2018). Classical and novel 469
approaches to the analysis of honey and detection of adulterants. Food Control, In 470
Press, Available online 19 February 2018, 471
https://doi.org/10.1016/j.foodcont.2018.02.027. 472
Ohmenhaeuser, M., Monakhova, Y. B., Kuballa, T., Lachenmeier, D. W. (2013). 473
Qualitative and Quantitative Control of Honeys Using NMR Spectroscopy and 474
Chemometrics. Analytical Chemistry, 9 Pages. 475

21
Oliveri, P., Baldo, M. A., Daniele, S., Forina, M. (2009). Development of a 476
voltammetric electronic tongue for discrimination of edible oils. Analytical and 477
Bioanalytical Chemistry, 395, 1135-1143. 478
Olsson, J., Winquist, F., Lundström, I. (2006). A self-polishing electronic tongue. 479
Sensors and Actuators B, 118, 461-465. 480
Oroian, M., Ropciuc, S. (2017). Botanical authentication of honeys based on Raman 481
spectra. Journal of Food Measurement and Characterization. 482
https://doi.org/10.1007/s11694-017-9666-3. 483
Padovan, G. J., De Jong, D., Rodrigues, L. P., Marchini, J. S. (2003). Detection of 484
adulteration of commercial honey samples by the 13C/12C isotopic ratio. Food 485
Chemistry, 82 (4), 633-636. 486
Parra, V., Hernando, T., Rodríguez-Mendez, M. L., de Saja, J. A. (2004). 487
Electrochemical sensor array made from bisphthalocyanine modified carbon paste 488
electrodes for discrimination of red wines. Electrochimca Acta, 49, 5177-5185. 489
Persano-Oddo, L., Piro, R. (2004). Main European unifloral honeys: Descriptive sheets. 490
Apidologie, 35, 38-81. 491
Rios-Corripio, M. A., Rojas-López, M., Delgado-Macuil, R. (2012). Analysis of 492
adulteration in honey with standard sugar solutions and syrups using attenuated total 493
reflectance-Fourier transform infrared spectroscopy and multivariate. CyTA-Journal 494
of Food, 10, 119-122. 495
Rodríguez-Méndez, M. L., Parra, V., Apetreri, C., Gay, M., Prieto, N., Martínez, J. 496
(2008). Electronic tongue base don voltammetric electrodes modified with materials 497
showing complementary electroactive properties. Applications Electrochimica Acta, 498
163 (1-2), 23-31. 499

22
Rodríguez-Méndez, M. L., Gay, M., Apetreri, C., De Saja, J. A. (2009). Biogenic 500
amines and fish freshness assessment using a multisensor system based on 501
voltammetric electrodes. Comparison between CPE and screen-printed electrodes. 502
Electrochimica Acta, 54 (27), 7033-7041. 503
Ropciuc, S., Oroian, M., Paduret, S., Buculei, A. (2017). Honeydew honey adulteration: 504
e-tongue and physicochemical analyses. Food and Environment Safety-Journal of 505
Faculty of Food Engineering, 16, 98-103. 506
Ruiz-Matute, A. I., Weiss, M., Sammataro, D., Finley, J., Sanz, M. L. (2010). 507
Carbohydrate composition of high fructose corn syrups (HFCS) used for bee feeding 508
effect on honey composition. Journal of Agricultural and Food Chemistry, 58, 7317-509
7322. 510
Sáenz, C., Gómez, C. (2000). Mieles españolas. Características e Identificación 511
Mediante el Análisis Del Polen. Ediciones Mundi-Prensa, Madrid. 512
Schreyer, S. K., Mikkelsen, S. R. (2000).Chemometric analysis of square wave 513
voltammograms for classification and quantitation of untreated beverage samples. 514
Sensors and Actuators B, 71, 147-153. 515
Serra, J., Soliva, M., Muntane, J. (2000). Invertase activity in fresh and processed 516
honeys. Journal of the Science of Food and Agriculture, 80, 507-512. 517
Simsek, A.; Bilsel, M.; Goren, A. C. (2012). 12C/13C pattern of honey from Turkey 518
and determination of adulterationin commercially available honey samples using EA-519
IRMS. Food Chemistry, 130, 1115-1121. 520
Sobrino-Gregorio, L.; Vargas, M.; Chiralt, A.; Escriche, I. (2017). Thermal properties 521
of honey as affected by the addition of sugar syrup. Journal of Food Engineering, 522
213, 69-75. 523

23
Sousa, M. E. B. C., Dias, L. G., Veloso, A. C. A., Estevinho, L., Peres, Machado, A. 524
M., A. A. S. C. (2014). Practical procedure for discriminating monofloral honey with 525
abroad pollen profile variability using an electronic tongue. Talanta, 128, 284-292. 526
Tiwari, K., Tudu, B., Bandyopadhyay, R., Chatterjee, A. (2013). Identification of 527
monofloral honey using voltammetric electronic tongue. Journal of Food 528
Engineering 117, 205–210. 529
Tosun, M. (2013). Detection of adulteration in honey samples added various sugar 530
syrups with 13C/12C isotope ratio analysis method. Food Chemistry, 138, 1629-1632 531
Veloso, A. C. A., Dias, L. G., Rodrigues, N., Pereira, J. A., Peres, A. M. (2016). 532
Sensory intensity assessment of olive oils using an electronic tongue. Talanta, 146, 533
585-593. 534
Von Der Ohe, W., Persano-Oddo, L., Piana, M. L., Morlot, M., Martin, P. (2004). 535
Harmonized methods of melissopalynology. Apidologie, 35, 18-25. 536
Wang, S., Guo, Q., Wang, L., Lin, L., Shi, H., Cao, H., Cao, B. (2015). Detection of 537
honey adulteration with starch syrup by high performance liquid chromatography. 538
Food Chemistry, 172, 669-674. 539
Wei, Z., Wang, J., Liao, W. (2009). Technique potential for classification of honey by 540
electronic tongue. Journal of Food Engineering, 94, 260-266. 541
Wei, Z., Wang, J. (2011). Classification of monofloral honeys by voltammetric 542
electronic tongue with chemometrics method. Electrochimica Acta, 56, 4907-4915. 543
Winquist, F., Bjorklund, R., Krantz-Rülcker, C., Lundströma, I., Östergren, K., 544
Skoglund, T. (2005). An electronic tongue in the dairy industry. Sensors and 545
Actuators B, 111-112, 299-304. 546

24
Winquisk, F. (2008). Voltammetric electronic tongues-basic principles and applications. 547
Microchim Acta, 163:3-10. 548
Xue, X., Wang, Q., Li, Y., Wu, L., Chen, L., Zhao, J., Liu, F. (2013). 2-Acetylfuran-3-549
Glucopyranoside as a novel marker for the detection of honey adulterated with rice 550
syrup. Journal Agriculture and Food Chemistry, 61 (31), 7488-7493. 551
552

25
Figure caption 553
Figure 1. Voltammetric pulse pattern. 554
555
Figure 2. Score plot of the PCA performed on pure honeys (sunflower, orange blossom, 556
heather) and pure syrups (barley, corn, brown rice) samples. 557
558
Figure 3. Electrochemical trace of the layered sequence of the potential for sunflower 559
honey adulterated with barley syrup at different levels (40, 20, 10, 5 and 2.5%). 560

26
561
Figure 4. Scores plot of the PCA performed on barley syrup and pure honey (A: 562
sunflower; B: orange blossom; C: heather hone), and mixtures of both in different 563
percentages (40, 20, 10, 5 and 2.5 %) simulating the adulteration of honey. 564
27
565
28
Figure 5. Predicted versus measured values of heather honey adulterated with barley 566
syrup given by PLS model. 567
568
Highlights 569
-Pulse voltammetry can be useful in detecting and quantifying syrups in honey 570
-This methodology can distinguish between pure honeys and syrups 571
-This methodology can distinguish among different levels of adulterants 572
-PLS analysis can predict the level of adulteration with syrups in honeys 573
Table 1. Electrochemical polishing of the working electrodes: configuration of basic or 574
acidic solution in the sequence of cathodic and anodic pulse applied to the different 575
metals. 576
Electrodes Cathodic pulse
(mV)
Anodic pulse
(mV)
Rest pulse
(mV)
Polishing
media
Ir +900 -500 0 Acidic

29
Rh +1500 -1500 0 Basic
Pt +1800 -500 0 Acidic
Au +1500 -1500 0 Basic
577
Table 2. PLS prediction results obtained from the validation data for the adulteration of 578
pure honeys (sunflower, orange blossom, heather) with syrup (barley, corn, brown rice) 579
at different percentages (40, 20, 10, 5 and 2.5%). 580
581 Adulterations No. latent
variables Correlation coefficient
Slope Intercept RMSEP
Sunflower-barley 4 0.991 0.999 0.206 1.252 Sunflower-corn 5 0.997 0.937 1.858 2.622 Sunflower-brown rice 2 0.949 0.909 1.073 3.489 Orange blossom- barley 7 0.993 0.983 0.589 1.336 Orange blossom-corn 6 0.879 0.847 1.234 5.261 Orange blossom- brown rice
6 0.988 1.029 0.203 1.681
Heather- barley 5 0.997 0.966 0.457 0.834 Heather- corn 5 0.994 1.012 0.997 1.479 Heather- brown rice 4 0.763 0.823 3.936 5.159
582