Employee Satisfaction in Financial Services - RiuNet
98
FACULTAD DE ADE GRADO EN ADMINISTRACIÓN Y DIRECCIÓN DE EMPRESAS Employee Satisfaction in Financial Services: A Comparison between the UK and the US Course: BUS 498 Independent Study in Business Management Supervisor: Professor Patrice Fontaine Nealon Student name: Pablo Galán Verdú Student ID: 200175249 Academic course 2016/17 I, Pablo Galán, confirm that this submission is my own work and I accept all responsibility for any copyright infringement that may occur as a result of this submission.
-
Upload
khangminh22 -
Category
Documents
-
view
0 -
download
0
Transcript of Employee Satisfaction in Financial Services - RiuNet

FACULTAD DE ADE
GRADO EN ADMINISTRACIÓN Y DIRECCIÓN DE EMPRESAS
Employee Satisfaction in Financial
Services: A Comparison between
the UK and the US
Course: BUS 498 Independent Study in Business Management Supervisor: Professor Patrice Fontaine Nealon
Student name: Pablo Galán Verdú
Student ID: 200175249
Academic course 2016/17 I, Pablo Galán, confirm that this submission is my own work and I accept all responsibility for any copyright infringement that may occur as a result of this submission.

Executive Summary
The purpose of this study is to find out how effective salaries are in terms of employee
satisfaction within the context of the financial industry. The research questions are the
following:
• How does working more hours affect employee satisfaction?
• How do workers from different ages (20-35, 36-55, 56+) value the different
aspects of their job?
• Do people in the higher salary tier (+$180k) value compensation as the most
important aspect?
Undertaken in London (United Kingdom) and then continued in Raleigh (United States),
this research was conducted using a survey as the research instrument in the financial
districts of both cities. The data collected was of quantitative nature.
The results ultimately showed that even though there is a negative relationship between
working more hours and the satisfaction level of the employee who works in London,
there is no relationship with the workers at Raleigh. Interestingly, it also showed that the
workers from both cities value the same things at different ages. The workers aged 20-35
value career opportunities as the most important aspect of their job whereas employees
aged 36-55 valued job recognition and compensation as the most important factors.
Lastly, employees who were 56 years old or more, gave importance to the job recognition
element but also their co-workers. Therefore, the recommendations for this dissertation
are:
• Inform about career opportunities to young prospective employees
• Promote those workers aged 30 to 55 to keep them motivated
• When rewarding employees from ages 30 to 55, use pay raises
• Praise the oldest employees (56+ years old)
Key words: salary, productivity, working hours, employee satisfaction, motivation,
leadership style

Table of Contents
CHAPTER 1: INTRODUCTION ........................................................................................................... 1 1.1 Background Information ................................................................................................... 1 1.2 Research Questions ........................................................................................................... 1 1.3 Research Objectives .......................................................................................................... 1 1.4 Dissertation Structure ....................................................................................................... 2
CHAPTER 2: LITERATURE REVIEW.................................................................................................... 4 2.1 Introduction ...................................................................................................................... 4 2.2 Praise and Recognition ...................................................................................................... 5 2.3 Incentive Theory ................................................................................................................ 5 2.4 Consequences and Punishment ......................................................................................... 6 2.5 Self-Determination Theory ................................................................................................ 6 2.6 Maslow’s Hierarchy of Needs ............................................................................................ 7 2.7 McGregor.......................................................................................................................... 8 2.8 Herzberg’s Two Factor Theory ........................................................................................... 8 2.9 Vroom’s Theory ................................................................................................................. 9
CHAPTER 3: METHODOLOGY......................................................................................................... 11 3.1 Research Philosophy ........................................................................................................ 11 3.2 Research Approach ......................................................................................................... 12 3.3 Research Strategy ........................................................................................................... 12 3.4 Research Instruments ...................................................................................................... 13 3.5 Sampling ......................................................................................................................... 13 3.6 Data Collection ................................................................................................................ 14 3.7 Research Ethics ............................................................................................................... 15 3.8 Data Analysis .................................................................................................................. 15 3.9 Research Reliability and Validity ...................................................................................... 16
CHAPTER 4: RESULTS ..................................................................................................................... 17
CHAPTER 5: DISCUSSION AND ANALYSIS ...................................................................................... 21
CHAPTER 6: CONCLUSION AND RECOMMENDATIONS .................................................................. 23 6.1 Summary of Results ......................................................................................................... 23 6.2 Recommendations .......................................................................................................... 23 6.3 Limitations and Suggestions for Future Studies ................................................................ 24
CHAPTER 7: FINANCIAL SERVICES IN THE US ................................................................................. 25 7.1 Introduction .................................................................................................................... 25 7.2 Methodologies ................................................................................................................ 25 7.3 Research Findings ........................................................................................................... 26 7.4 Conclusions ..................................................................................................................... 31 7.5 Recommendations .......................................................................................................... 32
BIBLIOGRAPHY .............................................................................................................................. 33
APPENDICES .................................................................................................................................. 36 Appendix 1 ............................................................................................................................ 36 Appendix 2 ............................................................................................................................ 37 Appendix 3 ............................................................................................................................ 38 Appendix 4 ............................................................................................................................ 39 Appendix 5 ............................................................................................................................ 40 Appendix 6 ............................................................................................................................ 41 Appendix 7 ............................................................................................................................ 42

1 | P a g e
Chapter 1: Introduction
1.1 Background Information
A major part of performance management involves managing employees and managers,
as their actions have a significant impact on the performance of the organization as a
whole. To boost performance, extrinsic factors must exist as compensatory rewards to
motivate employees. The drive for money and success can often stimulate people to work
harder.
The main objective of this research is to find out the repercussion the rewards financial
industry’s employees receive have in their satisfaction and a comparison between the
British and the American work environment. The population of this research are,
therefore, workers in the British and American financial industries. The sample used were
workers from London, the capital of the United Kingdom for the British, and workers
from Raleigh, the capital of the state of North Carolina for the Americans.
1.2 Research Questions
To guarantee the success of the research, three determinant questions are needed to be
answered by the investigation as a basis to achieve all the objectives of the study. The
following questions must be answered by the research study:
• How does working more hours affect employee satisfaction?
• How do workers from different ages (20-35, 36-55, 56+) value the different
aspects of their job?
• Do people in the higher salary tier (+£180k/ 180k$) value compensation as most
important aspect?
1.3 Research Objectives
The purpose of this investigation is to examine how effective are job rewards when it
comes to employee satisfaction in United Kingdom. The procedure of this research is to
infer the data taken from a sample of workers in London to the rest of the UK. Such a
2 | P a g e
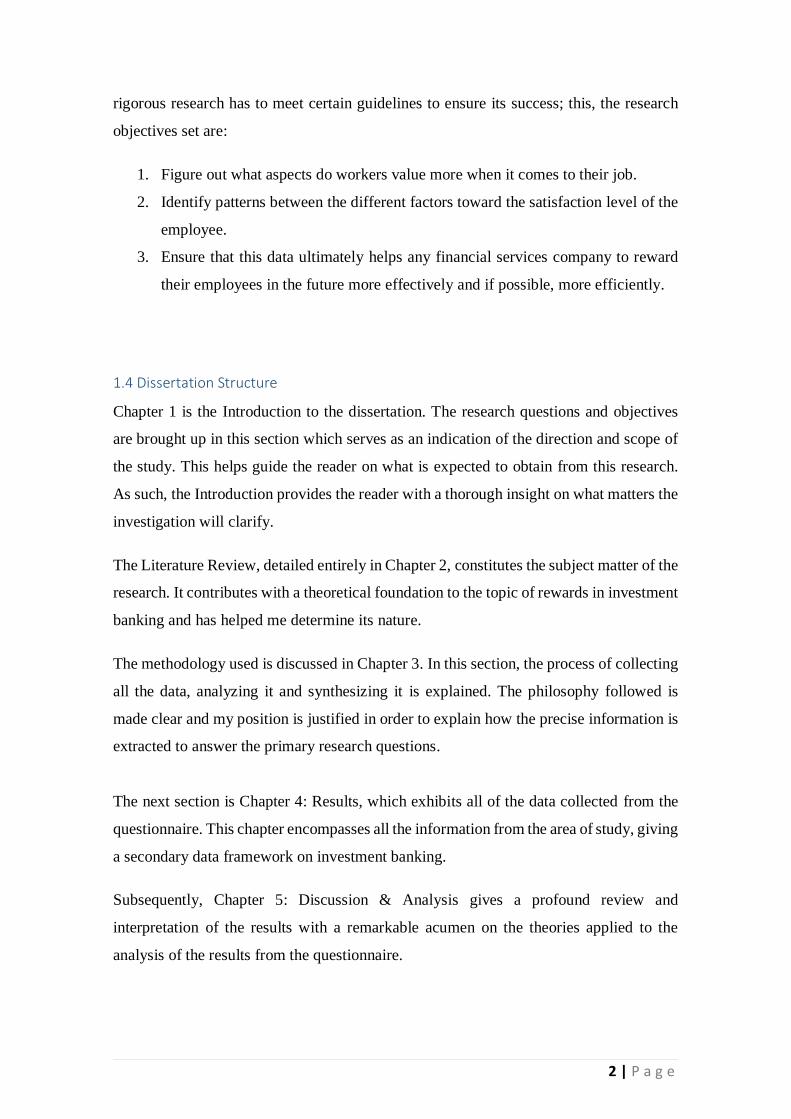
rigorous research has to meet certain guidelines to ensure its success; this, the research
objectives set are:
1. Figure out what aspects do workers value more when it comes to their job.
2. Identify patterns between the different factors toward the satisfaction level of the
employee.
3. Ensure that this data ultimately helps any financial services company to reward
their employees in the future more effectively and if possible, more efficiently.
1.4 Dissertation Structure
Chapter 1 is the Introduction to the dissertation. The research questions and objectives
are brought up in this section which serves as an indication of the direction and scope of
the study. This helps guide the reader on what is expected to obtain from this research.
As such, the Introduction provides the reader with a thorough insight on what matters the
investigation will clarify.
The Literature Review, detailed entirely in Chapter 2, constitutes the subject matter of the
research. It contributes with a theoretical foundation to the topic of rewards in investment
banking and has helped me determine its nature.
The methodology used is discussed in Chapter 3. In this section, the process of collecting
all the data, analyzing it and synthesizing it is explained. The philosophy followed is
made clear and my position is justified in order to explain how the precise information is
extracted to answer the primary research questions.
The next section is Chapter 4: Results, which exhibits all of the data collected from the
questionnaire. This chapter encompasses all the information from the area of study, giving
a secondary data framework on investment banking.
Subsequently, Chapter 5: Discussion & Analysis gives a profound review and
interpretation of the results with a remarkable acumen on the theories applied to the
analysis of the results from the questionnaire.

3 | P a g e
Chapter 6: Conclusion & Recommendations is the closing chapter of the study in the UK,
giving an overall conclusion of the investigation and a culmination of the findings
obtained in Chapter 4. Based on the analyzed findings, I contribute with recommendations
for any company in the industry who is interested in developing their rewards system to
increase their employee satisfaction. Moreover, this chapter also addresses any potential
limitations or flaws I may have encountered whilst doing the research; accordingly, it
points out suggestions and advice for future studies.
Finally, the last chapter of the dissertation is Chapter 7: Financial Services in the US. This
is an addendum to the previous research done. It is, essentially, an extension to the project
done in the UK, making its emphasis on the differences in the findings obtained from the
of global metropolis of London to the small city of Raleigh, North Carolina. It describes
all the research done in each city, making an emphasis on how such a different
environment influences the results obtained. Ultimately, it provides a comparison
between the financial industry within the different cultural, economic, and social
backgrounds.
4 | P a g e
Chapter 2: Literature Review
2.1 Introduction
The term ‘reward’ is a concept that generally encompasses every type of remuneration
made to an employee, including a pay in cash and many different kinds of benefit
packages (pensions, paid leave and so on). Provisions with the term ‘total reward’ that
comprise a broader category of non-pay benefits can also be included.
Pay is divided into two categories:
• Base (or fixed) income – This is the guaranteed wage or salary given to employees
in return for doing their work for a determined period of time, on a fixed schedule,
usually a month.
• Total earnings – This is the total of the base pay plus additional variable
components such as commissions per sales, bonus payments or extraordinary
earnings.
Pay definitions are of different nature. For example, some employers see as part of the
base pay some location bonuses, while others may see it as a variable component of the
salary and exclude it from base pay. Many banks in the UK use this remuneration method
as part of their bonus scheme. Other jargon may also be utilized. ‘Compensation’ for
example is typically used to refer only to financial rewards (base pay and earnings) while
‘remuneration’ can be used conversely with ‘reward’ to refer to the broader benefit
packages (CIPD, 2016).
In many banks, high salaries for certain employees known as “material risk takers”
(MRTs) – a category that typically includes all managing directors are now peripheral by
“role-based allowances” (eFinancialCareers, 2016).
In the literature review for this research however, I do not focus on how much
compensation and benefits the bankers get for the task they do, but more specifically on
how these financial and non-financial rewards actually alter their performance. And
ultimately, the satisfaction with their job. In order to do this, I have been putting in
practice several theories to measure the impact and effectiveness these rewards have on
employee satisfaction. They are the following:
5 | P a g e
2.2 Praise and Recognition
Some people want to gratify others and obtain recognition. There is nothing that gratifies
them more than receiving praise for their work. This extrinsic motivator is one of the most
powerful in the workplace (Smallbusiness.chron.com). But an individual is not a hard
worker per se. Recognition and praise contribute more to job satisfaction than financial
incentives and could bring a person to become an achiever, an eager beaver, a full-time
generator of yields. However, this is not as common in the sector of investment banking,
where intrinsic factors used for self-motivation tend to be the norm. Praise helps to
increase internal motivation. Delivering sincere and genuine compliment in a frequent
manner in the banking industry is a powerful method as an extrinsic motivator for
employees. Researchers found out that offering positive feedback when people do
something better when compared to others improves intrinsic motivation (Lussier and
Achua, 2014).
2.3 Incentive Theory
"People are pulled toward behaviors that offer positive incentives and pushed away from
behaviors associated with negative incentives. In other words, differences in behavior
from one person to another or from one situation to another can be traced to the incentives
available and the value a person places on those incentives at the time" (Bernstein, 2011).
Bernstein is one of the fathers of the incentive theory. The incentive theory is one of the
most generalized theories of motivation and advocates that behavior is driven by a desire
for incentives. For sure, this is particularly true in the banking sector specially, since,
bankers are getting the largest bonuses than any other white-collar executive in the
industry (Min-Hui et al., 2008). The tendency however, is for bonuses to decrease since
that is what has been happening in the recent years. Nevertheless, other approaches are
being tested; an altruistic approach for example, under the belief that if the money given
to the worker is spent on prosocial actions, the motivation of the employee will be much
higher than if it was given to him. For example, the National Australia Bank gave their
employees bonuses to spend on charities and surprisingly, employees reported to be
happier overall and more satisfied with their jobs (HBR, 2013).
6 | P a g e
2.4 Consequences and Punishment
When a time of great pressure begins, many people take action or step up their
performance. Knowing the boss will be angry or their duration on their job may be at risk
is a reason why many people get their work done. Psychologists and management experts
debate fear might be the best motivational tool to make a worker actually work. Whether
this is true or not, it is definitely an extrinsic motivator factor. Albeit it is not a theory per
se, it is an adequate doctrine to be considered because its scenarios and the type of
environment where it is applied, is present in this industry. In some cases, the
consequences might be extremely intense since some investment directors can manage
portfolios of some billions of pounds. Thereby, the losses can be tremendous and
accordingly, its consequences.
2.5 Self-Determination Theory
Starting with Deci in 1971, continuing with Pitchard and Campbell in 1977 and ending
up with Chua and Koestner in 2008, the Self-Determination theory has been gradually
developed by these researchers who by means of experiments they progressively
improved it to what it is today. The interaction between the extrinsic forces acting on
people and the intrinsic motivators and needs that are inherent in human nature is the field
of the Self-Determination Theory.
SDT illustrates a wider scheme for the study of human motivation and personality by
defining the intrinsic and varied extrinsic sources of motivation in cognitive and social
development and in individual differences by asserting that there are three psychological
needs which motivate a behavior of eagerness to do something, also called initiative:
competence, autonomy and psychological relatedness (Deci and Ryan, 2000). But most
importantly, this empirical theory also focuses on how social and cultural factors facilitate
or undermine people’s sense of freedom and initiative in addition to their well-being and
the quality of their performance. Considering the research is undertaken in London, thus
the selection for this theory in the literature, since London is one of the top ten most
culturally influential cities in the world (Forbes, 2016).
7 | P a g e
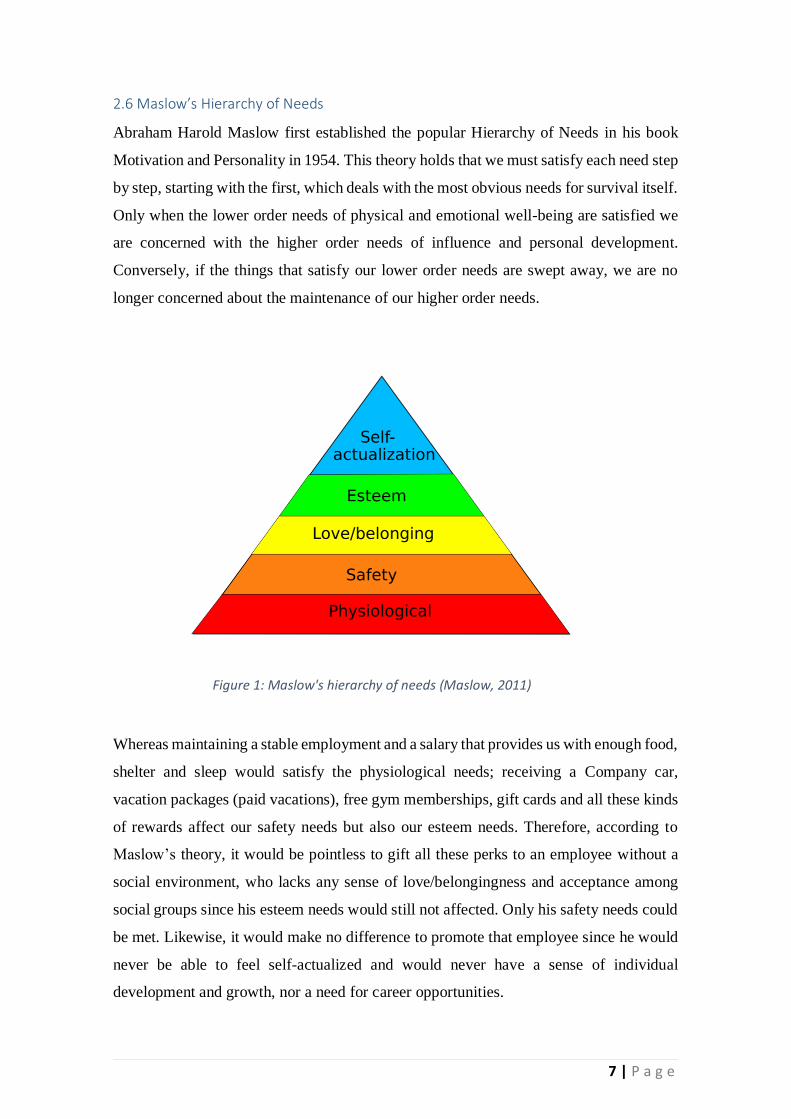
2.6 Maslow’s Hierarchy of Needs
Abraham Harold Maslow first established the popular Hierarchy of Needs in his book
Motivation and Personality in 1954. This theory holds that we must satisfy each need step
by step, starting with the first, which deals with the most obvious needs for survival itself.
Only when the lower order needs of physical and emotional well-being are satisfied we
are concerned with the higher order needs of influence and personal development.
Conversely, if the things that satisfy our lower order needs are swept away, we are no
longer concerned about the maintenance of our higher order needs.
Figure 1: Maslow's hierarchy of needs (Maslow, 2011)
Whereas maintaining a stable employment and a salary that provides us with enough food,
shelter and sleep would satisfy the physiological needs; receiving a Company car,
vacation packages (paid vacations), free gym memberships, gift cards and all these kinds
of rewards affect our safety needs but also our esteem needs. Therefore, according to
Maslow’s theory, it would be pointless to gift all these perks to an employee without a
social environment, who lacks any sense of love/belongingness and acceptance among
social groups since his esteem needs would still not affected. Only his safety needs could
be met. Likewise, it would make no difference to promote that employee since he would
never be able to feel self-actualized and would never have a sense of individual
development and growth, nor a need for career opportunities.

8 | P a g e
2.7 McGregor
Douglas McGregor based his influential theories of management behavior on two
contrasting poles, which he named theory “X” and theory “Y” (Lynch, 1994). As
explained in his book A Theory of Human Motivation: “Man is a wanting animal - as
soon as one of his needs is satisfied, another appears in its place. This process is unending.
It continues from birth to death.” The popular belief is that the atmosphere in financial
services is extremely profits-focused and workers are in a constant theory X climate (Job
Search Digest, 2016). However, as I will explain later, my findings showed that this
assumption is not completely legitimate.
2.8 Herzberg’s Two Factor Theory
Also known as Herzberg’s motivation-hygiene theory, these studies have helped us
understand that those factors which create job satisfaction and therefore increase
motivation, are different from those causing job dissatisfaction. Motivation factors create
job satisfaction while hygiene factors create job dissatisfaction according to this theory.
Below, I built a table showing examples of both types of factors:
Motivation Factors Hygiene Factors
Achievement
Job Recognition
Advancement
Growth
Responsibility
Job Interest
Supervision
Salary
Personal life
Work conditions
Relationship with boss
Relationship with peers
Status
Security
Table 1: Motivation & Hygiene factors (Own elaboration)

9 | P a g e
The theory holds that there are two distinct human needs to be covered. On one hand we
have the physiological needs which can be satisfied with money, to buy food and shelter
for example. On the other hand, there are psychological needs which are fulfilled by the
sense of achievement and growth.
In the investment banking sector, a big part of the total compensation to the employee
comes from the bonuses (eFinancialCareers, 2016). This of course does not mean that
workers will be dissatisfied but they are certainly not being motivated in the long-run if
these are the only means of motivation. Yet research shows that job security is the most
important motivational factor for employees in all age groups (Recruiter, 2012).
2.9 Vroom’s Theory
The Expectancy Theory of Motivation, also known as Valence-Instrumentality-
Expectancy Theory developed by Victor Vroom in 1964 during his study on the
motivation behind decision-making provides an explication for an individual’s decision-
making process. Whereas Maslow and Herzberg looked at the relationship between
internal needs and the resulting effort expended to fulfil them, Vroom's expectancy theory
separates effort (which arises from motivation), performance, and outcomes.
In order to choose when facing different options, an individual will be motivated toward
goals if they believe that a positive correlation between performance and efforts exists,
and that the outcome of a favorable performance will result in a desirable reward, and in
the end, the reward from a performance will satisfy an important need, or at least satisfy
their need enough to make the effort worthwhile. The individual’s own perception of the
probability of reaching his expected outcome is the basis of the decision-making process
when facing several options.
For Vroom, in order to do so, there are three variables to take into account: Valence,
Expectancy and Instrumentality. Valence represents the value as an individual place on
the reward of an outcome, based on their needs, goals, values and Sources of Motivation.
Expectancy is the conviction that one’s effort will result in a fulfilment of the desired
performance. Instrumentality is the belief that a person will receive a reward given the

10 | P a g e
performance expectation is met. If reward does not change according to the performance,
instrumentality is low. These three components define the Motivation Force through the
following equation: Motivational Force = Expectancy x Instrumentality x Valence.
The Motivation Force is what drives an individual to make the decision: they will choose
the option with the greatest extent of motivation force. However, it is worthy taking into
account that the theory does not take the emotional state of the individual into
consideration, along with the fact that individual’s characteristics such as personality,
ability, skills, knowledge, past experience are all factors affecting the outcome of the
model.

11 | P a g e
Chapter 3: Methodology
3.1 Research Philosophy
Figure 2: The research onion (Saunders, Lewis and Tornhill, 2008)
As you can see from the diagram above, I am following a cross-sectional time horizon
since the study is done at one specific point in time. I selected a mono method choice
since I only used quantitative data. The research was undertaken by means of a survey. I
followed a deductive approach since I tested the theories by putting them in practice. And
of course, I followed a positivism philosophy. This is because by doing a survey, I only
considered factual knowledge gained from the questionnaire as trustworthy. And also my
main concern in this research is to study observable and measurable variables. Besides,
certain emphasis is placed on predicting the outcomes of the research so that the main
observable variable – job satisfaction, can be controlled or, more precisely, be improved
in the future.

12 | P a g e
3.2 Research Approach
The first thing I did to validate the validity of my survey was a pilot study. I went on the
street and undertook the survey, asking them as well if there were any confusions in
understanding the questions or with the wording. They all agreed on saying that all
questions were very clear and easy to understand.
Once I had my raw data sorted out and ready to be analyzed, the methodological approach
I took to investigate how effective are the rewards on employee satisfaction was
comprehensively impartial thanks to the questionnaire design. Given that the wording of
the questionnaire was not designed in a way that would make the participant might feel
constrained into saying 'yes' or 'no' since the option “Maybe” would also be included. An
example of such is question 7 from the updated questionnaire in Appendix 4: “Do you
think that putting more effort into your job would yield better job performance?”. Also,
in the updated questionnaire there was an absence of sensitive questions which could
force the subject to be in an uncomfortable situation. The question that was removed was
“What are your bonuses ranging from?”. This has also guaranteed me to maintain
consistently a neutral stance. By maintaining such position, I reassured the outcomes were
unbiased, and accordingly, the findings accurate.
3.3 Research Strategy
The easiest way to conduct this research was with the use of a survey. The initial title of
the dissertation was “The Effectiveness of Rewards on Employee Satisfaction in
Investment Banking in the UK” but due to the difficulties I had when it came to gathering
information from the investment banks which I will further explain later, I had to
turnabout and devise a solution, which eventually was to widen my population to not only
workers in the investment banking sector but everyone in the industry of financial
services. And instead of focusing in one country I focused on two in order to obtain
different points of view and provide a comparison. Hence, I changed the title to
“Employee Satisfaction in Financial Services: A Comparison between the UK and the
US”.

13 | P a g e
Previous research shows this is a male-dominated industry in London based on the
Empowering Productivity report commissioned by HM Treasury (Gandhi, 2016). For this
reason, this became another concern to be confirmed with the research; consequently,
being the gender question the first one on the questionnaire.
3.4 Research Instruments
All data collected was of quantitative nature and was obtained by carrying out a simple
questionnaire whose initial population were the employees working in the investment
banks but then, as I explained before, due to a null response rate from the emails I sent to
the banks, I had to broaden my population to everyone working in financial services in
the UK.
By carrying out a questionnaire which initially had nine simple questions and then it was
reduced to eight, answered in approximately one minute, I am not only encouraging the
population to actually take it but it also helps me to analyze the data handily. The
questionnaire had to be modified due to reasons I will explain in the Data Collection part.
These eight questions are enough to see how effective rewards are since there are many
other factors which lead to motivation in the workplace and to observe any possible trends
in the findings. The intention is for the survey to be answered by first and middle level
managing positions from the banks ranging from analysts to account managers.
3.5 Sampling
I sent an email to the most important investment banks located in London. The reason for
this was the choice of sampling – convenience sampling. I was initially going to conduct
a quota sampling. However, I realized the impossibility of implementing this kind of
sampling due to a lack of time and resources. Due to this reason primarily, I adapted my
sampling methods to a convenience sampling. But besides, given the case I have to
extraordinarily conduct any possible interview with any of the collaborators, it will be
easy to meet due to the proximity. Yet, in my case, not only the sampling is convenient
but also the location: London. This city is the major global financial hub. It recently
overtook New York as the most competitive financial center in the world (The Telegraph,

14 | P a g e
2015). The email also included a Participant Information Leaflet which can be seen on
Appendix 1 and of course, the questionnaire.
The rationale for subject selection and sampling procedure was simple: I selected the
most important investment banks by revenue which had their headquarters based in
London. As higher its revenue, the more significant the bank is in the sample. The list of
the leading investment banks worldwide as of February 2016 was from a study made by
statistics company Statista. The statistic depicts the revenue of the largest investment
banks worldwide from February 23, 2015 to February 22, 2016 (Statista, 2016). Look at
Appendix 3 to view the full list.
3.6 Data Collection
Two weeks after sending all the emails to the different banks I obtained a null response
rate. They either ignored my email or replied me back saying that due to the very large
number of requests they receive from students, the bank is unable to validate academic
research, nor can fill in questionnaires, take part in surveys or provide individual advice
to students for university theses. For this reason, I decided to go out in the street and
obtain some first-hand data by myself by giving out the questionnaires to people working
in the industry. Of course, getting workers in the sector of investment banking was going
to be much trickier and would have taken much more time, so I decided to broaden my
focus and change my population to workers in financial services industry. In order to do
this, I had to give the questionnaire a more generic outlook. Thereby, it was amended by
removing all those questions that were only applicable to investment bankers or just not
so relevant anymore i.e. I changed former question 3 to “Which sector do you work in?”
and deleted former question 4 since bonuses are not as significant in other sectors as they
are in investment banking and could also pose certain retaliation from the participants
due to their participation. In such a way that the questionnaire was now reduced to only
eight questions, which encouraged people to answer as it was now quicker to complete it.
A copy of the updated questionnaire can be seen in Appendix 4.

15 | P a g e
3.7 Research Ethics
To comply with the research ethics requirements, participants were told throughout the
whole process of data collection that their data would remain anonymous and of course
their participation was completely voluntary. This was said by me when introducing
myself and the project to each of the participants when I took the research in the street.
Before this, it was shown written in the Participant Information Leaflet on Appendix 1,
which was attached to the emails sent to all the different banks.
3.8 Data Analysis
The sample used were workers in all types of financial services in London I kindly went
to ask them to fill out the questionnaire between a time range from 1pm to 8pm. The
referred population to the sample are all the workers in financial services in the UK.
By having analyzed the different motives (question 4 from the questionnaire) that make
people want to go to work, you acquire an understanding of how intrinsic and extrinsic
factors alter motivation. More precisely, the importance compensation and other types
of rewards have for employees when it comes to their levels of satisfaction. It really made
a difference when people were offered money or time off as a reward. These are both
types of extrinsic motivators since in both cases, the individual is motivated to perform a
behavior to earn an award. In spite of that, workers in this industry still have a certain
tendency to choose rewards concerning time off. It makes sense since jobs in any
investment banking division (IBD) are the most stressful in the market. “The main reason
is that investment bankers are confronted with the two main triggers for career stress: the
difficulty of the work coupled with the sheer amount of it, particularly for analysts and
associates and despite banks’ attempts to mitigate the strain.” (eFinancialCareers Ltd,
2015).
Intrinsic motivation, on the other hand, is the motivation that engages you in a behavior
because you feel it is personally rewarding; essentially, performing an activity for its own
sake rather than the desire for some external reward. The best example I can think of is
when you Solve a puzzle because you find the challenge itself fun and exciting.

16 | P a g e
Notwithstanding how effective external rewards can be, some studies have demonstrated
that offering too many external rewards for an already internally rewarding activity, can
lead to a reduction in intrinsic motivation, a phenomenon known as the over-justification
effect (Griggs, 2010). In one of the studies, for example, children who were awarded for
playing with a toy they had already expressed interest in playing with became less
interested in the toy after being externally rewarded.
3.9 Research Reliability and Validity
Conditions of the employees answering the survey could have added certain bias since in
the moment answering the questionnaire they were on their way to their job, or going
back home – this means they could for example, have had a bad day. If that was the case,
their mood would certainly influence their responses, which would diminish accuracy to
the survey. In the same way, there is no way to tell how truthful a respondent is being.
Moreover, the existence of lurking variables always represents a problem in an analysis
of cause-effect. A lurking variable is, by definition, a variable that has an important effect
and yet is not included amongst the predictor variables under consideration (UC Berkeley,
2013). In other words, they are variables from the study which hide the true relationship
between other variables by falsely identifying strong relationship between these and the
explanatory and response variables. For example, the findings of the questionnaire
surprisingly revealed there was a strong negative correlation between the level of pay
someone received and their level of satisfaction. The lurking variable in this case was the
number of hours that person worked. As more hours someone worked, higher was their
salary but lower their level of satisfaction. This made me realize that in all the responses,
the hours someone worked outweighed any other variable when considering the level of
satisfaction.

17 | P a g e
Chapter 4: Results
Since the prior pilot study taken showed that everyone understood the questions in the
survey, I didn’t have any problem with its wording and apparently, the research protocol
was realistic and workable. Additionally, I asked the subjects to give me any feedback to
identify ambiguities or ambiguous questions and they all agreed that no further
amendments were necessary.
The total number of participants were 45, many of which worked in investment banking,
insurance and securities, making these last two sectors be the more predominant. By
looking closer at the demographics, 36% were women. Hence, the research has served as
a corroboration to the data from the Gadhia report mentioned in the 3.3 Research Strategy
section, which stated this is a male-dominated industry. Following the age distribution,
63% of the total were between ages 20 to 35, 32% between 36 to 55 and only 5% more
than 55 years old.
The majority of participants worked from 31 to 48 hours weekly, 32% more than 48 and
only 5% from 16 to 30. As a reference, the average working week by full timers in the
UK in 2015 was 37.4 (Financial Times, 2016).
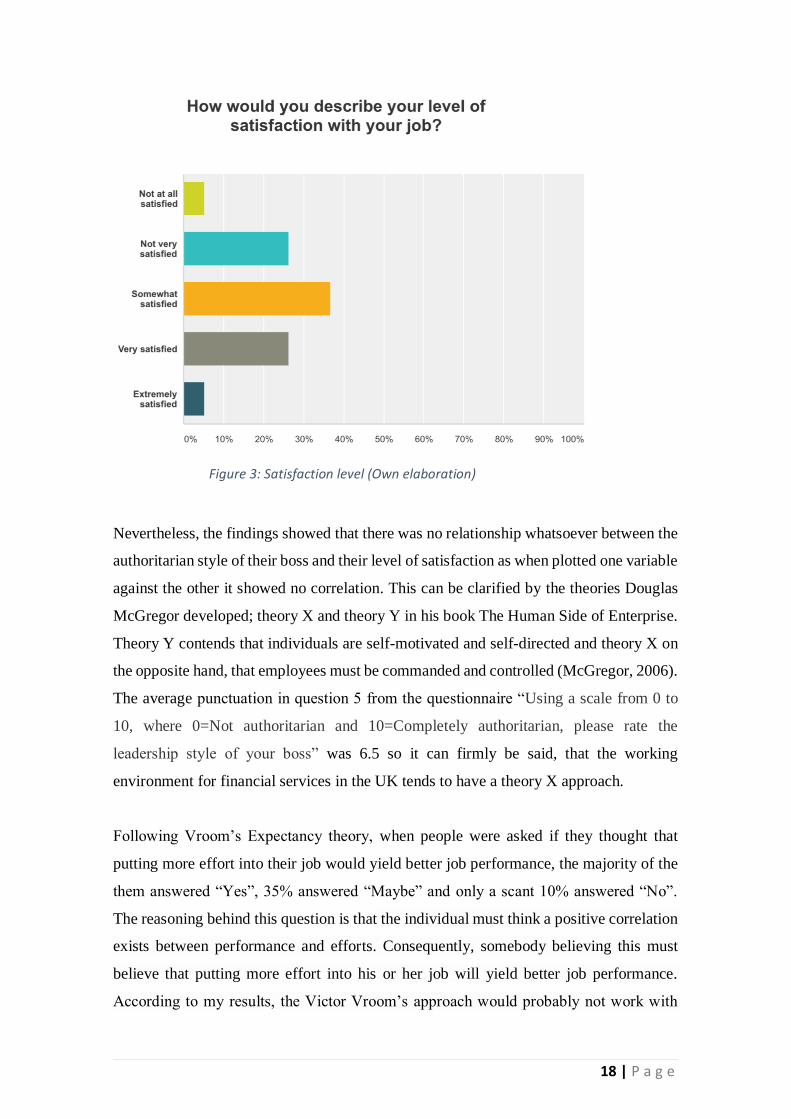
Interestingly, as you can see on the chart below, the level of satisfaction from the workers
follows a perfect normal distribution, being “Somewhat satisfied” the most answered
option. Most of the people who answered “Extremely satisfied” belonged to the +55 years
old group; which is not a coincidence since, normally these workers are the ones in senior
positions at companies earning a hefty income and working less hours than the average.
18 | P a g e
Figure 3: Satisfaction level (Own elaboration)
Nevertheless, the findings showed that there was no relationship whatsoever between the
authoritarian style of their boss and their level of satisfaction as when plotted one variable
against the other it showed no correlation. This can be clarified by the theories Douglas
McGregor developed; theory X and theory Y in his book The Human Side of Enterprise.
Theory Y contends that individuals are self-motivated and self-directed and theory X on
the opposite hand, that employees must be commanded and controlled (McGregor, 2006).
The average punctuation in question 5 from the questionnaire “Using a scale from 0 to
10, where 0=Not authoritarian and 10=Completely authoritarian, please rate the
leadership style of your boss” was 6.5 so it can firmly be said, that the working
environment for financial services in the UK tends to have a theory X approach.
Following Vroom’s Expectancy theory, when people were asked if they thought that
putting more effort into their job would yield better job performance, the majority of the
them answered “Yes”, 35% answered “Maybe” and only a scant 10% answered “No”.
The reasoning behind this question is that the individual must think a positive correlation
exists between performance and efforts. Consequently, somebody believing this must
believe that putting more effort into his or her job will yield better job performance.
According to my results, the Victor Vroom’s approach would probably not work with

19 | P a g e
10% of the participants since their answered the question with a resounding “No”. But
this answer could mean that they do not believe there exists a positive correlation between
putting more effort into their job and performance because they believe that a
performance increase will come from another source; but it could also mean that they are
already giving their 100% at work so there is no margin left for improvement. Equally,
the people who answered “Maybe” might be because they actually do not know if a
correlation exists between the effort they put into their job and their job performance. Or
it could also indicate that they know for sure that they could do better at work and are
aware of the positive correlation. But since answering “Yes” implies they are certainly
not giving their best, it might be a little bit embarrassing to acknowledge this, so they
may just answer “Maybe” to not feel so uncomfortable. What we know for sure is that
for the great majority, Vroom’s theory of motivation still applies.
When taking into account the first research objective “1. Figure out what aspects workers
value more when it comes to their job”, some people took more time than the average to
answer question 4 in the questionnaire since it is the “trickiest” one (as many of them told
me after completing the questionnaire). The ones who took more time to answer it were
the people who gave priority to co-workers amongst other choices. i.e. they ranked “Co-
workers” as the most important aspect of their job. This was because they had to actually
think about it. Thus, these workers realized their performance was indirectly dependent
on their colleagues. In other words, if their peers performed well, they would too; and
vice versa. This behavior can be explained by how peer-based control in self-managing
teams influence individual performance (Stewart et al., 2012).
This type of workers is therefore better off working in groups, considering that their
performance will be reliant on their peers’ performance. It is a solution therefore, for a
company to identify these kind of employees, put them in groups working together, and
adopt one of them as an “implicit leader”. He is implicit because he acts as any other
employee and does not give instructions to any of their peers. He is a “leader” because
the rest of his companions will follow his behavior, but he does not necessarily need to
know this. The company will only have to focus in maintaining this “implicit leader”
motivated and ensuring that he performs well on his job so that the other employees see
him and use him as a role model to follow. As said, some companies might prefer to
uncover the identity of this employee by making it public. For example, when a company

20 | P a g e
puts the name or a picture of the “employee of the month” in the wall of the office. This
is a common way to select this “implicit leader”. The advantage of making it public is
that since the rest are aware that this employee is getting extra rewards, competition to
get his place is created, in such way that certain aggressiveness is generated which will
probably boost performance of some employees much more than if it was not made
public.

21 | P a g e
Chapter 5: Discussion and Analysis
I did a comparison between the different variables by plotting them once against each
other on a graph. The independent variable in the x axis and the dependent on the y axis.
This was done to examine the relationship between how the participants ranked the
different independent variables from question 4 in the questionnaire (compensation,
career opportunities, co-workers, job recognition) and the dependent variable (employee
satisfaction). Strong emphasis was made on the answers which had “Compensation” as
their first choice. The analysis was done by comparing each answer which had the first
choice for each independent variable and compare the level of satisfaction of that
participant by looking at his or her answer in question 8. As explained before, 82% of the
people who gave priority to compensation scored low satisfaction levels with answers
being “Not satisfied at all” or “Not very satisfied”. This is due to the fact that in order to
get a higher compensation, they need to be working more hours unless they are in senior
positions.
In any case, those who were in senior positions had more responsibility in their job than
the rest, meaning that they have more authority over their job. People in this situation
were more likely to have answered question 5 with a low number since when more
decisions have to be made by an individual, the less autocratic the leadership style of his
or her boss will be as they do not have to be so “on top” of the worker. These findings
therefore show that there exists a negative correlation between someone’s position in the
chain of command1 of the company and the grade of authoritarianism in the leadership
from their boss. In other words, as lower their position in the company is, the more
authoritarian their supervisor will be. It is also important to take into account that I did
not find anyone who did not have a boss or a director to report to answer the question and
therefore, no one said they did not have a boss or simply that the question was just not
applicable to them.
1 Chain of command: The order in which authority and power in an organization is wielded and delegated from top management to every employee at every level of the organization (Business Dictionary)

22 | P a g e
As said before, this variable still had no correlation with the employee satisfaction. This
is since there is not a correct and wrong approach but both types of theories work for
different kind of people. Instead, the causal relationship between the variable in question
and the job satisfaction variable came with the weekly working hours and the level of
satisfaction of the individual. It turned out that those workers who worked more than 48
hours weekly; and made up 32% of the sample, also had the lowest satisfaction levels
with their jobs. In most cases, it matched with those who ranked “Compensation” as their
first or second choice.
The majority of workers however, selected in question 4 of the questionnaire Job
Recognition as the most important aspect of their job. This may be explained by
Herzberg’s theory of motivation where he asserts that motivation factors do motivate or
create satisfaction and are rarely the cause of dissatisfaction (Herzberg, 1959).
Job recognition is indeed one of the motivator factors which lead to satisfaction in the
workplace according to Herzberg, so it is reasonable to think that a participant has chosen
job recognition rather than other option as this would affect more positively to its morale
than any other factor in their job. Yet, some of the participants might not have chosen the
option of job recognition simply because it is not present in the office. In other words,
they may lack of a boss who praises them from time to time.
It could also be given to the fact that there exist too many hygiene factors (which lead to
dissatisfaction) in their company, which in this case they would neutralize the motivation
factors. For instance, frustration due to too much bureaucracy, poor governance, internal
conflicts or simply feeling exploited because of an excess of overwork would undermine
any motivator factor.

23 | P a g e
Chapter 6: Conclusion and Recommendations
6.1 Summary of Results
The strong negative correlation between the weekly number of hours someone worked,
and their level of satisfaction showed that workers, on a general basis, value most their
free time no matter how many rewards get. As more hours they work, the less free time
they get to do the things they love and therefore, the less happy they are. This leads them
to blame their job for that lack of free time, hence inducing to lower motivation levels
which directly contribute to poor satisfaction in the workplace.
The research therefore demonstrated, that rewards are not as effective to increase the job
satisfaction of the employee as giving the worker more time off. Ideally, the company
should give the employee more breaks and not so many long hours.
Nevertheless, the findings showed that workers exhibit more predisposition to give more
importance to the compensation or the career opportunities when the participant is
between 20 to 35 years old. Yet, the tendency for them is to change their preferences
towards wanting their work to be honored, i.e. job recognition once they have reached a
certain position. For this reason, apart from Frederick Herzberg’s theory of motivation,
the majority of the people chose the Job Recognition option in question 4.
6.2 Recommendations
Any company in the financial services industry should hire more employees making them
work less time by increasing variable pay instead of paying higher fixed base hourly pay.
This allows the workforce to have more free time, since the workload is divided between
more workers. Moreover, it improves results, since a bigger part of their pay now depends
on results. In addition, with this new compensation structure many workers would be able
to earn more. But most importantly, since all of them would be working less, job
satisfaction would be increased. The best part of such adjustment is that even though it
represents a tiny change organizationally speaking, it has a huge impact since it creates,
in essence, a vicious circle – thanks to their improved job satisfaction, motivation would
increase, and results would in turn, be improved.

24 | P a g e
6.3 Limitations and Suggestions for Future Studies
One of the most obvious limitations I can think of is an impact limitation caused by a
strong regional focus, since the research has most likely been somewhat too population-
specific; having had all the participants who took part in the study being selected in the
areas of Canary Wharf and the City of London.
Statistical limitations may have also resulted considering the sample size; thus, such
matter has also been affected by time constraints. Similarly, I had had problems gathering
data in the first place when I sent emails to the different banks and they all had a reluctant
attitude to participate on the research.
Ultimately, the type of research undertaken – quantitative research might not give an in-
depth analysis, since the questionnaire, which was the only research instrument used, does
not provide the exhaustive feedback an interview would for instance. Nonetheless, it
brought plentiful amount of data to tackle the research questions and meet objectives.
As a recommendation for any future research done on the topic, I would suggest to the
potential author and researcher to examine the conceptual framework I presented in the
literature review in a new context e.g. a new location (preferably a financial hub
tantamount to London). This would permit to observe new possible trends, perhaps due
to changes in culture in this new region studied without altering the parameters from the
environment very much.

25 | P a g e
Chapter 7: Financial Services in the US
7.1 Introduction
The city where the project and its subsequent investigation has been continued is Raleigh,
the capital city of the state of North Carolina, whose population is 451,066 as of July
2015.
Due to the nature of Chapter 7, a final analysis and comparison of the data already
obtained with the results obtained in Raleigh; a less comprehensive study was done in
terms of supplemental knowledge. For example, there was no need to add more literature
about the general topic or industry except for the one which was specific to Raleigh, or
to the whole United States.
Since the same investigation is being carried out, the same survey is being used and
therefore, the research questions are the same but amended to the new country. The ones
amended are as follows:
• How does working more hours affect employee satisfaction?
• How do workers from different ages (20-35, 36-55, 56+) value the different
aspects of their job?
• Do people in the higher salary tier (+$180k) value compensation as most
important aspect?
In total, 63 people took part in the survey, of which, 53 took the paper version and 11
used the link to the survey online. The data was obtained from the following banks who
agreed to collaborate (all of which I am very thankful to): Wells Fargo, State Employees
Credit Union, BB&T, PNC, North State Bank, and New Bridge Bank.
7.2 Methodologies
Some previous secondary research regarding differences in work culture and employees’
behavior between both countries was done before carrying out the collection of primary
data. Sources including books and websites helped me to understand the office
environment in the US.

26 | P a g e
For the collection of the data, the solely instrument used was the same questionnaire as it
was used to undertake the research in London. Nevertheless, it yet had to be modified
again since the initial questionnaire had some errors such as the Salary question not being
mutually exclusive. The updated questionnaire was also improved by putting the Gender
and Age questions at the end rather than at the beginning as it was initially done. For
transparency purposes, all the paper version surveys collected have been attached on
Appendix 7.
7.3 Research Findings
7.3.1 Lit Review Findings
The scrutiny of secondary data brought up some interesting findings on how the industry
of financial services changes not only from one country to another, but also, from a global
metropolis like London to a small city like Raleigh.
Commercial banks in North America seek long-term relationships with their business
clients. However, it is the US who do better their job in this aspect when compared to
their neighbor country of Canada for example, where there is way more bureaucratic
inflexibility (Paulin et al. 2008). In their work, they also found that the industry in
United States is customer-oriented and innovative. That explains that the financial
industry in Raleigh is mainly composed of commercial banks.
The dress code in the office varies from bank to bank. However, employees generally
tend to wear clothes that lean more towards a formal dress code as the general norm.
Moreover, the people from the southern part of the country (North Carolina included)
tend to have a greater hospitality for strangers (Campbell and Kean, 2016). I personally
experienced the southern friendliness when giving out the surveys to the representative
of each bank branch and I highly appreciated it.
7.3.2 Quantitative Findings
To gather the quantitative data, the tool used was a simple survey consisting of nine
questions. A sample of which can be seen on Appendix 5. Once the process of collecting
data was completed, all the input was coded and typed to a database. The data was

27 | P a g e
analyzed using software packages JMP, Excel and SPSS. You can see in Appendix 6 the
Codebook used to examine the different variables.
The crosstab used to analyze the data was done by linking the following variables:
• HOURS and SATISFACTION (Questions 5&7)
I also observed at the distribution of variable Age with Aspects of Job (Questions 9&2).
Then I did the same with the distribution of variable Salary (but filtering those who earned
more than $180k) with Aspects of Job (Questions 3&2). This was done to observe how
the age and a high salary of a workers has an impact on the different aspects of their job.
The rest of the variables were used to obtain supportive data and background information
used for the comparison with the previous input from London. Some background
information the findings brought with Question 1 was that the financial industry in
Raleigh is predominantly composed of commercial banking, followed by other sectors
(which include private equity, credit unions, and non-profit) as opposed as in London,
where the predominant sectors were Insurance and Securities. Figure 4 shows the
distribution.

28 | P a g e
Figure 4: Percentage of workers by sector
Below, Figure 5 shows most employees worked from 31 to 48 hours per week. In the
British city, this working schedule was the most popular too, yet there were more people
who worked more than 48 hours (32% versus 12%).
Figure 5: Number of hours worked per week
29 | P a g e
After analyzing the crosstab HOURS x SATISFACTION, a chi-square statistic of 0.0867
was obtained and therefore, the null hypothesis - there is no relationship between number
of hours worked and the level of satisfaction - was accepted. Moreover, when analyzing
the data per group, I found that many who worked more than 48 hours weekly were
satisfied or extremely satisfied, as opposed as in London. This can be explained due to
the belief that Americans tend to be workaholics compared to the rest of the citizens in
developed economies (Free, J., 2015).
For the research question “How do workers from different ages (20-35, 36-55, 56+) value
the different aspects of their job?”, I looked at the distribution of the different aspects of
their job by AGE. It showed that the best rated answer was Career Opportunities. The
majority of people who rated it with a 5/5 belonged to the 20 to 35. They were also the
largest age group. This can be backed up by an article saying that young workers in the
US value frequent promotion and raises (CNN, 2015).
The middle group, those aged from 36-55 valued Job Recognition and Compensation as
the most important aspects in their job. This makes sense from a logical perspective since
as they climb up the ladder, they also demand higher salaries. The oldest group (+56 years
old) however, equally valued Job Recognition and Co-workers as their most important
aspects of their job. This is probably given to the fact that many of them don’t have the
burden of having to pay their children’s fees anymore since they are hopefully
independent and self-sufficient. Alternatively, they use the total amount of their salaries
which have also probably been increasing over the years for themselves. Therefore, their
compensation is not as scarce anymore so they don’t value it as extremely important.
Instead, they value higher the personal relationships created with their co-workers over
the years and the job positions they have achieved. According to the Maslow’s hierarchy
of needs, the personal relationships created over the years would cover the
Love/belonging needs of the worker and the job recognition would enhance the self-
actualization need. Both needs are on top of the Safety needs in the pyramid, which are
the ones money can cover. It therefore makes sense that the oldest workers did not value
Compensation as the most important.

30 | P a g e
For the third research question “Do people in the higher salary tier (+$180k) value
compensation as most important aspect?” only the people who earned more than $180k
were analyzed. The chi-square statistic was 0.0753. The null hypothesis is accepted. This
means that there is no relationship between salary and valuing compensation as the most
important aspect once you earn more than $180k. By analyzing the distribution of
SALARY x AGE and then looking at the joint distribution of only those who earned more
than $180k, I also realized that they all belonged to the oldest group (+56 years old)
except for two respondents who belonged to age group 20 to 35. Here, the reason behind
it could have also been explained by the theory developed for the second research
question but since their salaries are outliers, the same reasoning might not apply to them.
They might not value compensation as high for many other reasons.
The mode range was $30,001 to $80K. In other words, most people from this industry
earned a salary between those amounts. Unfortunately, this question was not included in
the survey used in London so there is no data about salaries to compare it against.
However, the literature previously used in Chapter 2 shows that salaries in the United
Kingdom tend to be higher.
The answers of the participants concerning the leadership style of the person they report
in the fourth question of the survey revealed that the most selected answer was 5, with a
mean value of 5.547 and a standard deviation of 1.31. The mean value for this question
obtained in the British capital was of 6.47 with a standard deviation of 1.22. Therefore,
from this we can infer that the supervisors in the US tend to be less authoritarian.
Almost an 80% of the workers answered “YES” to question 6 in the survey: “Do you
think that putting more effort into your job would yield better job performance?”. Only
7% answered “NO” and 14% answered “Maybe”. This means the great majority have the
perception of not working at their full capacity. In London, only 42% of the surveyed
answered “YES” to this question.
7.3.3 Limitations to Research
Due to time limitations, only quantitative research was done. Doing some qualitative
research beforehand would have been helpful in getting some more insight from the
industry. However, in any research, quantitative findings are always more relevant since
they are used to back up the qualitative findings to confirm their veracity.
31 | P a g e
When doing this research, I took a local focus. In other words, no global banks where
analyzed. Nevertheless, many global banks were already analyzed in London since all the
major worldwide banks have their headquarters in the city.
7.4 Conclusions
Before carrying out the research, I was initially expecting a negative relationship between
variables HOURS and SATIFACTION just how it happened in London. In other words,
the more hours someone would work weekly, the lower their satisfaction level would be.
Surprisingly, the findings showed the opposite. The part of the literature review saying
that Americans tend to be workaholics (Free, J. 2015) is therefore, consistent with the
findings. Yet, we now know that these workaholics workers are, surprisingly, motivated
and happy. Indeed, they have higher satisfaction levels than the average workers.
It was also found out that the youngest workers (aged 20 to 35) value Career opportunities
in their job the most. Accordingly, any bank who is looking to recruit young workers
should make sure the HR department communicates this aspect the most when advertising
job vacancies to recent graduates and young professionals.
Workers belonging to ages 36 to 55 however, find Compensation and Job Recognition
the most attractive components of their job. For this reason, any bank who wants to
reward or maintain motivated employees belonging to this age group, should only focus
on giving them a salary increase or promote them. Or both.
Those employees who are in the last phase of their working lives (56 years old and over)
acknowledged Job recognition and Co-workers as the preferred elements. It would
therefore be advisable for their supervisors to ensure that good cohesion and a friendly
environment co-exists between workers belonging to this age. Praising them from time
to time for their job is also important. This is to make sure that they know the job they
are doing in the company is being recognized and highly appreciated. Specially, if they
have been a long time in the company since in this case, the bond is even stronger.
Finally, we can conclude that Compensation is not paramount for the richest workers.
Subsequent reasons from this conclusion however, are hard to determine. Since these

32 | P a g e
workers tend to belong to the 56+ age group, a possible reason could be because many of
these workers would tend to have enough money saved so they would not be as eager for
higher compensations. Although in the end, it all depends on personal reasons based on
each individual employee.
7.5 Recommendations
Based on the conclusions drawn from the study, the most fundamental recommendations
for the banks in Raleigh to enhance their employee satisfaction would be to consider of
utmost importance the following points:
• Inform young prospective employees about prominent career opportunities.
• Promote workers aged 30 to 55 as a way of keeping them motivated.
• Use any means of compensation when rewarding employees from ages 30 to 55.
• Praise the oldest employees (56+ years old).

33 | P a g e
Bibliography
Bernstein, A. (2011) Essentials of psychology. Belmont: Wadsworth
Campbell, N. and Kean, A. (2016) American Cultural Studies: An Introduction to
American Culture, 4th edition. Routledge: New York
Cook, S. (2008) The Essential Guide to Employee Engagement. London: Kogan Page
CNN (2015) How companies are changing old ways to attract young workers.
Retrieved from http://money.cnn.com/2015/07/23/pf/companies-millennial-workers/
[Accessed 3 December 2016]
Deci, E. and Ryan, R. (1985) Intrinsic Motivation and Self-Determination in Human
Behavior (Perspectives in Social Psychology). Berlin: Springer
Deci, E. and Ryan, R. (2000). "Self-determination theory and the facilitation of intrinsic
motivation, social development, and well-being", American Psychologist Journal 55
(1), 68-78
eFinancialCareers (2016) The current state of banking salaries in London. [ONLINE]
Available at: http://news.efinancialcareers.com/uk-en/164/the-current-state-of-salaries-
bank-by-bank/. [Accessed 02 October 2016]
eFinancialCareers (2016) The most (and least) stressful jobs in banking and finance.
[ONLINE] Available at: http:// http://news.efinancialcareers.com/us-en/160184/the-
most-and-least-stressful-jobs-in-banking-and-finance. [Accessed 28 December 2016]
eFinancialCareers (2016) This is how much you should earn as an investment banker in
your 20s, 30s and 40s. [ONLINE] Available at: http://news.efinancialcareers.com/uk-
en/185046/much-earn-now-investment-banker-30s/. [Accessed 14 November 2016]
Forbes (2016) The Most Influential Cities in the World [ONLINE] Available at:
http://www.forbes.com/sites/joelkotkin/2014/08/14/the-most-influential-cities-in-the-
world/#b4f2f7c7370c. [Accessed 25 October 2016]
Free J. (2015) 5 Differences Between U.S. and U.K. Working Culture. Retrieved from
http://www.webberkerr.com/blog/2015/10/13/5-differences-between-us-and-uk-
working-culture [Accessed 2 December 2016]
FT (2016) Fast FT. [ONLINE] Available
at: http://www.ft.com/fastft/2016/02/03/average-hours-worked-by-uk-full-timers-fell-in-
2015/. [Accessed 24 October 2016]
Ghadia J. (2016) Empowering Productivity: Harnessing the Talents of Women in
Financial Services. London: HM Treasury
Gov.uk. 2016. New charter to link City bonuses to the appointment of senior women -
News stories - GOV.UK. [ONLINE] Available at:

34 | P a g e
https://www.gov.uk/government/news/new-charter-to-link-city-bonuses-to-the-
appointment-of-senior-women. [Accessed 19 October 2016]
Griggs, R. A. (2010). Psychology: A concise introduction. New York: Worth Publishers
Herzberg - Motivation-Hygiene Theory (2016) Herzberg - Motivation-Hygiene Theory.
[ONLINE] Available at: http://www.netmba.com/mgmt/ob/motivation/herzberg/.
[Accessed 13 October 2016]
Herzberg, F. (1959) Motivation to Work. Hoboken: John Wiley & Sons, Inc.
Harvard Business Review (2013) The Bonus Employees Really Want [ONLINE]
Available at: https://hbr.org/2013/10/the-bonus-employees-really-want-even-if-they-
dont-know-it-yet [Accessed 8 October 2016]
Immihelp (2016) Work Culture and Office Environment. Retrieved from
http://www.immihelp.com/newcomer/work-culture-office-environment-usa.html
Job Search Digest (2016) Investment Banking Job Culture. [ONLINE] Available at:
http://investmentbanking.jobsearchdigest.com/119/investment-banking-job-culture/.
[Accessed 24 October 2016]
Lussier and Achua (2013) Leadership: Theory, Application & Skill Development, 6e.
Boston: Cengage Learning, Inc.
Lynch, J. (1994) Banking and Finance: Managing the Moral Dimension. Cambridge:
Woodhead
McGregor, D. (2006) The Human Side of Enterprise, Annotated Edition. New York:
McGraw-Hill
Min‐Hui, F., Douglas, G., and Mervyn, J. (2008) "Incentive schemes in the financial
services sector: Moderating effects of relationship norms on customer‐brand
relationship", International Journal of Bank Marketing 26 (2), 99 – 118
Myers, D.G. (2010) Psychology: Eighth Edition in Modules. New York: Worth
Publishers.
Paulin, Perrien, and Ferguson (2008) Organizational Culture and Services
Management in Canada, Mexico and the United States: An Empirical Study of
Commercial Banking. Canada: University of Montreal
Pew Research Center for the People and the Press (2016) Question Wording | Pew
Research Center. [ONLINE] Available at: http://www.people-
press.org/methodology/questionnaire-design/question-wording/. [Accessed 9 November
2016]
Plotnik and Kouyoumjian (2011) Introduction to psychology. Belmont: Wadsworth.
35 | P a g e
Recruiter.com (2012) Survey Reveals Most Important Factors in Attracting and
Retaining Employees. [ONLINE] Available at: https://www.recruiter.com/i/factors-in-
attracting-and-retaining-employees/. [Accessed 15 October 2016]
Reward and pay: an overview - Factsheets – CIPD (2016) Reward and pay: an overview
- Factsheets - CIPD. [ONLINE] Available at: http://www.cipd.co.uk/hr-
resources/factsheets/reward-pay-overview.aspx. [Accessed 03 November 2016]
Yousaf, S., Latif, M., Aslam, S., and Saddiqui, A. (2014) “Impact of Financial and non-
Financial Rewards on Employee Motivation”, Middle-East Journal of Scientific
Research 21 (10), 1776-1786
Saunders and Lewis (2012) Doing Business Research in Business & Management.
Essex: Prentice Hall
Smallbusiness (2016) Extrinsic Motivation Factors | Chron.com. [ONLINE] Available
at: http://smallbusiness.chron.com/extrinsic-motivation-factors-1971.html. [Accessed
02 November 2016]
Statista. 2016. Leading global investment banks by revenue 2016 | Statistic. [ONLINE]
Available at: http://www.statista.com/statistics/371143/leading-global-investment-
banks-by-revenue/. [Accessed 19 October 2016]
Stewart, Greg L.; Courtright, Stephen H., Barrick, and Murray R. (2012) “Peer-based
control in self-managing teams: Linking rational and normative influence with
individual and group performance”, Journal of Applied Psychology 97 (2), 435-447
The Telegraph (2016) Rule Britannia: London overtakes New York as the world's best
financial centre. [ONLINE] Available at:
http://www.telegraph.co.uk/finance/newsbysector/banksandfinance/11884783/Rule-
Britannia-London-overtakes-New-York-as-the-worlds-best-financial-centre.html.
[Accessed 18 October 2016]
The Economist (2016) Theories X and Y | The Economist. [ONLINE] Available at:
http://www.economist.com/node/12370445. [Accessed 24 October 2016]
The Telegraph (2016) Banks have another crack at talking about women. [ONLINE]
Available at: http://www.telegraph.co.uk/business/2016/03/22/banks-have-another-
crack-at-talking-about-women/. [Accessed 19 November 2016]
Vroom, V. (1990) Manage People Not Personnel. New York: McGraw-Hill

36 | P a g e
Appendices Appendix 1
Participant Information Leaflet for Participants
A Research Project Examining the Effectiveness of Rewards on Employee
Satisfaction on Investment Banking in the UK
Introduction
It is a great pleasure to invite your company to take part on this project, which objective
is to determine how effective are financial and non-financial rewards on employee
satisfaction within the sector of investment banking. The project is entirely carried out
in London since all investment banks in the UK have offices in this city.
Why am I doing the project?
The project is part of my exchange programme at Coventry University London Campus
for my degree on business administration. It is hoped that the project could provide
useful information for professionals working in the HR departments of the respective
banks and give them advice and recommendations on how adapt rewards in order to
improve employee motivation in the most effective way possible.
What will you have to do if you agree to take part?
Answer back this email so that I know you are interested.
1. You will provide your employees with the questionnaire attached. The
questionnaire can also be taken online via the link
https://www.surveymonkey.co.uk/r/P9P38XR
2. When I have completed the study I will produce a summary of the findings
which I will be more than happy to send you if you are interested.
How much time will your participation involve?
The questionnaire consists of nine questions which can all be answered in less than one
minute.
Will your participation in the project remain confidential?
If you agree to take part, your name will not be recorded on the questionnaires and the
information will not be disclosed to other parties. Your responses to the questions will
be used for the purpose of this project. You can be assured that if you take part in the
project you will remain anonymous.
Do you have to take part in the study?
No, your participation in this project is entirely voluntary. You are not obliged to take
part. If you do not wish to take part, you do not have to give a reason and you will not
be contacted again.
Researcher:
Pablo Galan, Undergraduate Student, Coventry University London Campus
37 | P a g e
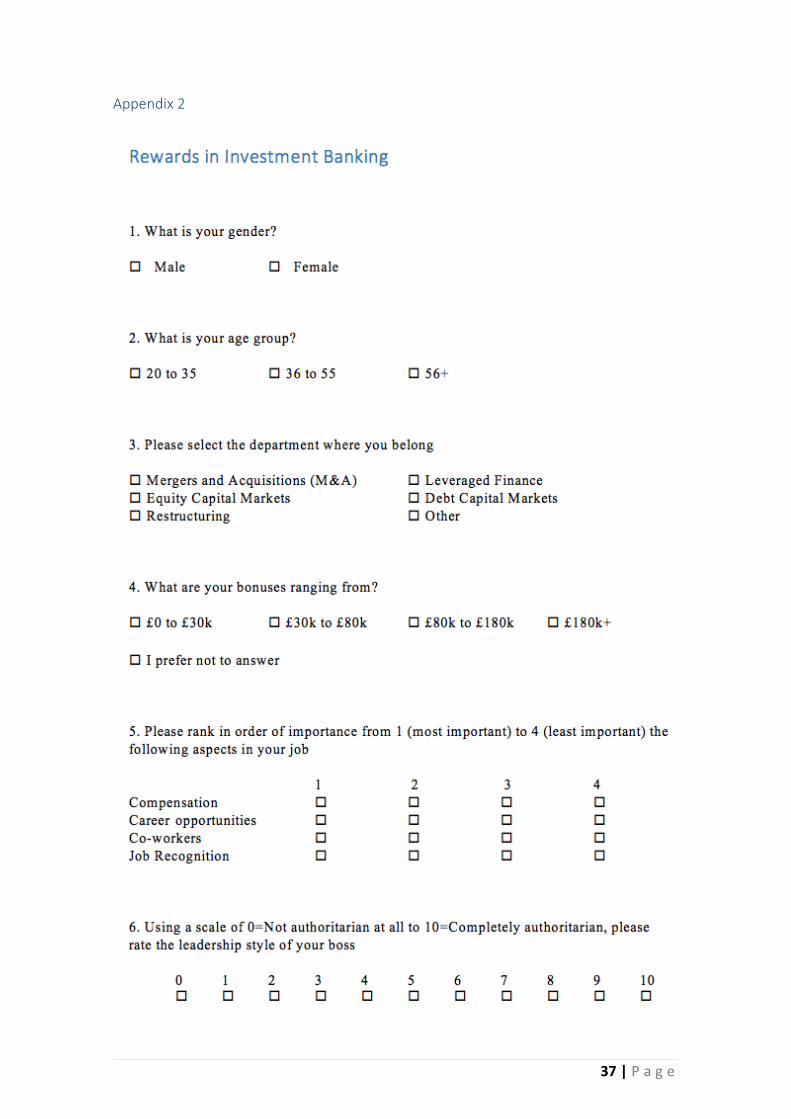
Appendix 2

38 | P a g e
Appendix 3
List of Most Important Investment Banks in London
1 - JPMorgan Chase
2 - Goldman Sachs
3 - Bank of America Merrill Lynch
4 - Morgan Stanley
5 - Citigroup
6 - Deutsche Bank
7 - Credit Suisse
8 - Barclays Capital
9 - UBS
10 - Wells Fargo
11 - RBC Capital Markets
12 - HSBC
13 - Jefferies Group
14 - BNP Paribas
15 - Société Générale

39 | P a g e
Appendix 4
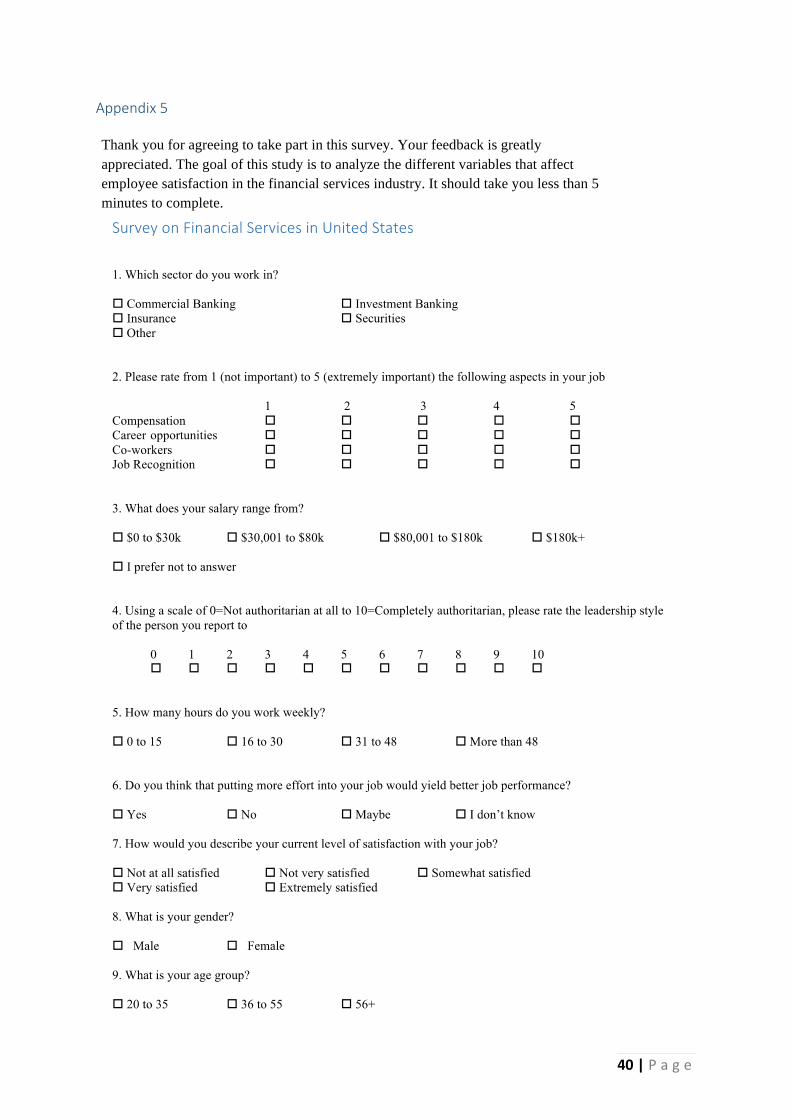
40 | P a g e
Appendix 5
Thank you for agreeing to take part in this survey. Your feedback is greatly
appreciated. The goal of this study is to analyze the different variables that affect
employee satisfaction in the financial services industry. It should take you less than 5
minutes to complete.
! !

41 | P a g e
Appendix 6
Variable Name Description Response Options
SECTOR Which sector do you work in? 0=Commercial Banking, 1=Insurance, 2=Investment Banking, 3=Securities, 4=Other
SALARY What does your salary range from? 0=$0 to $30k, 1=$30,001 to $80k, 2=$80,001 to $180k, 3=$180k+, 4= I prefer not to answer
STYLE Using a scale of 0=Not authoritarian at all to 10=Completely authoritarian please rate the leadership style of the person you report to
0=0, 1=1,......10=10
HOURS How many hours do you work weekly?
0=0 to 15, 1=16 to 30, 2=31 to 48, 3=More than 48
PERFORMANCE Do you think that putting more effort into your job would yield better job performance?
0=YES, 1=NO, 2=Maybe, 3=I don’t know
SATISFACTION How would you describe your current level of satisfaction with your job?
0=Not at all satisfied, 1=Not very satisfied, 3=Somewhat satisfied, 4=Very satisfied, 5=Extremely satisfied
GENDER What is your gender? 1=Male, 2=Female
AGE What is your age group? 1=20 to 35, 2=36 to 55, 3=56 or more

42 | P a g e
Appendix 7

43 | P a g e
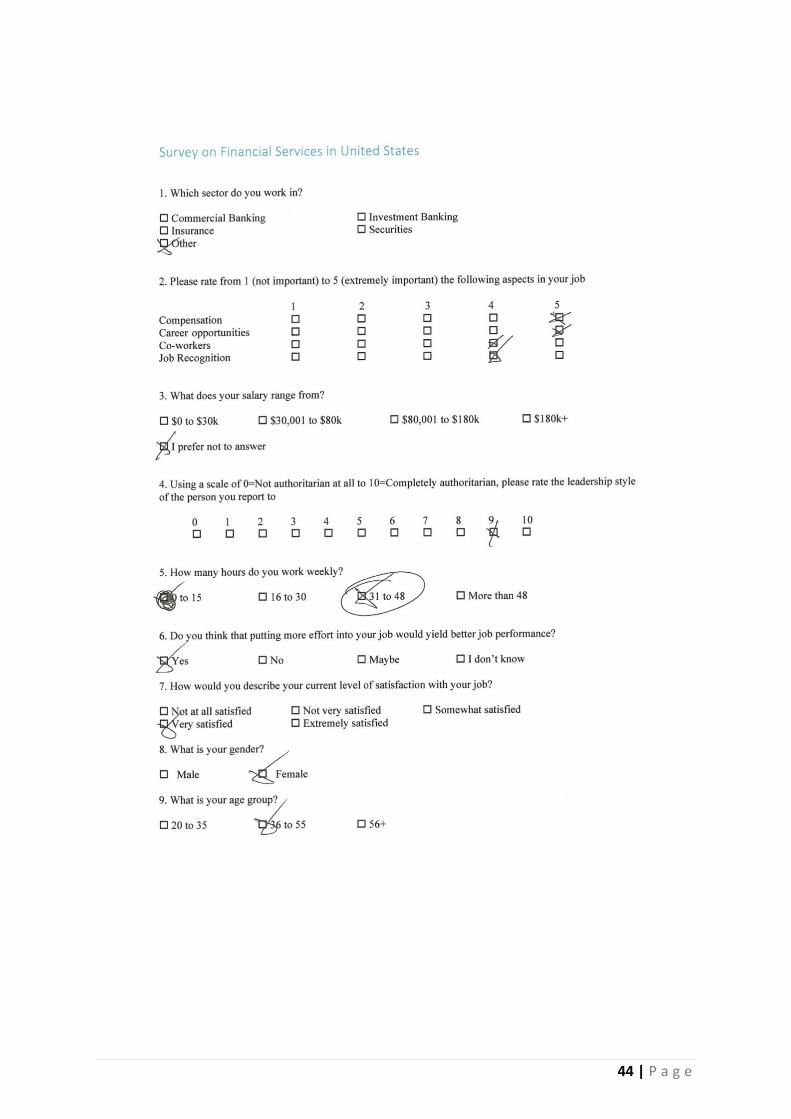
44 | P a g e

45 | P a g e

46 | P a g e

47 | P a g e

48 | P a g e

49 | P a g e

50 | P a g e

51 | P a g e
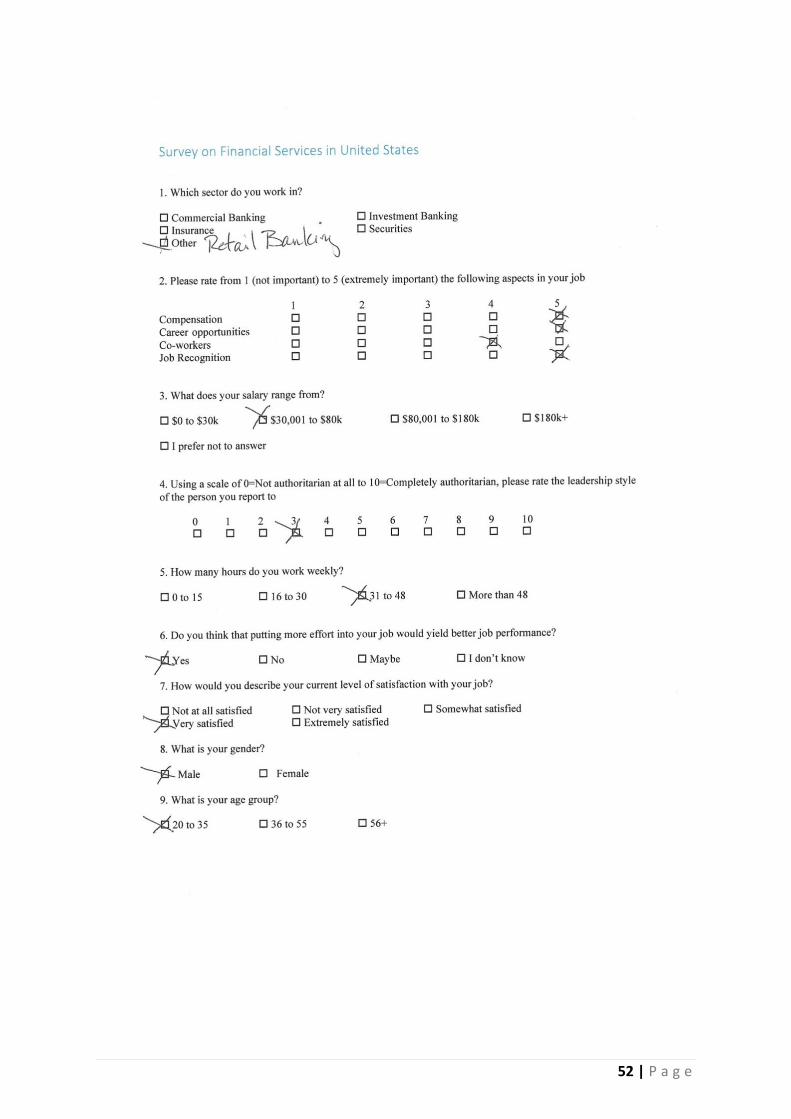
52 | P a g e

53 | P a g e

54 | P a g e
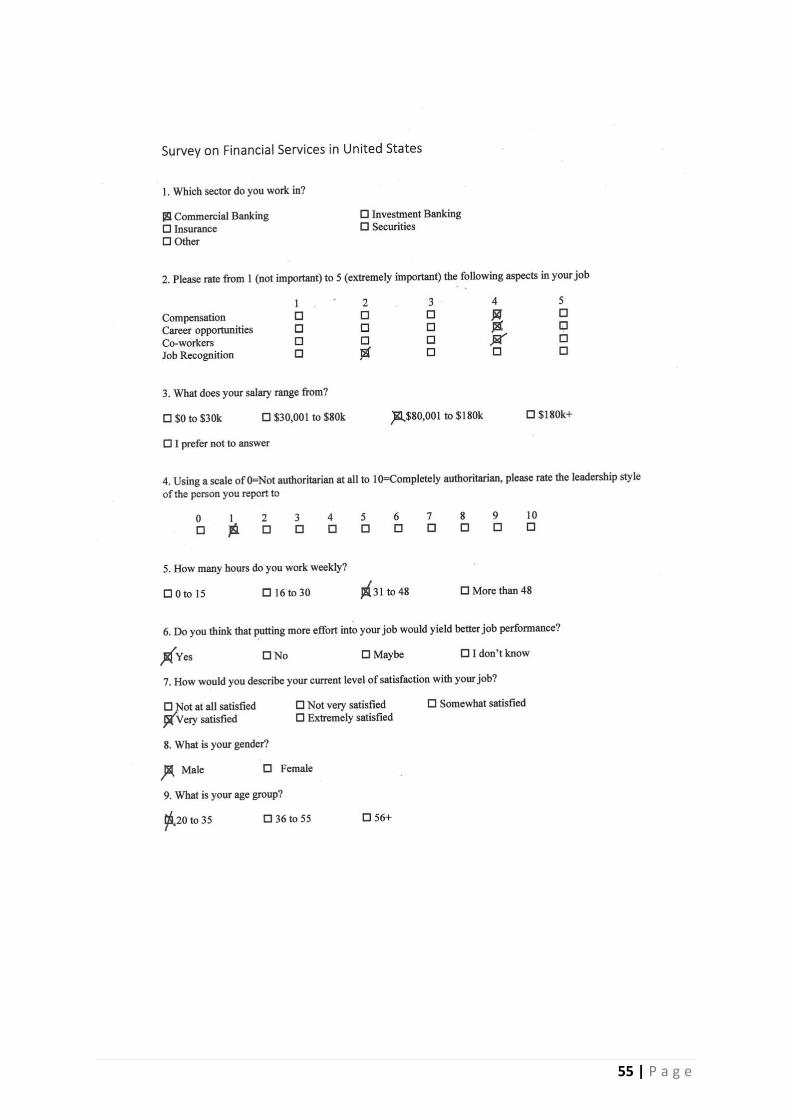
55 | P a g e

56 | P a g e

57 | P a g e

58 | P a g e
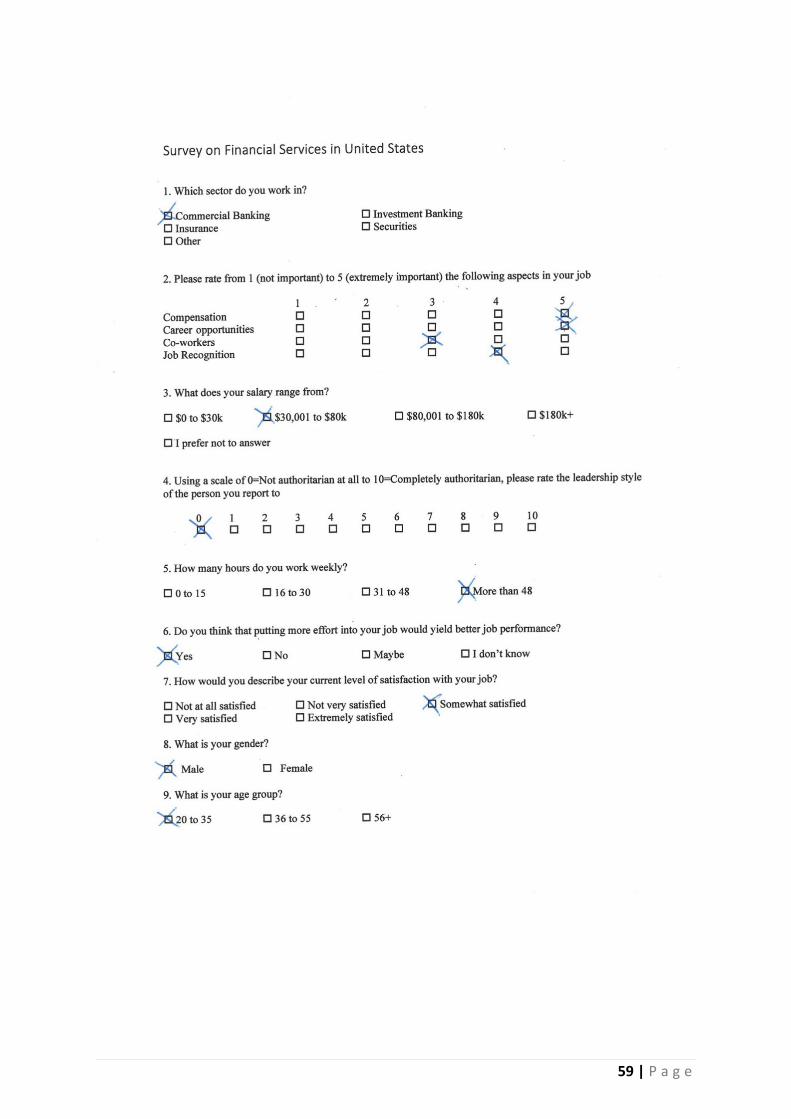
59 | P a g e

60 | P a g e

61 | P a g e

62 | P a g e
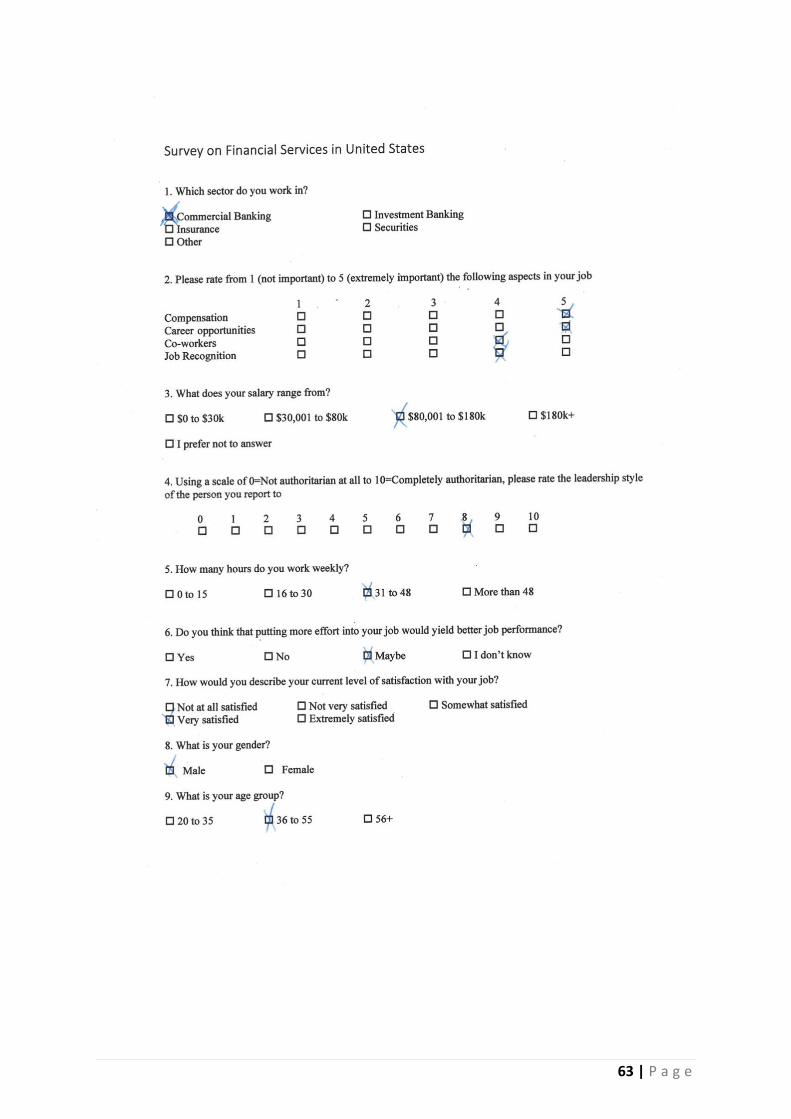
63 | P a g e

64 | P a g e

65 | P a g e

66 | P a g e

67 | P a g e

68 | P a g e

69 | P a g e

70 | P a g e

71 | P a g e

72 | P a g e

73 | P a g e

74 | P a g e

75 | P a g e

76 | P a g e

77 | P a g e
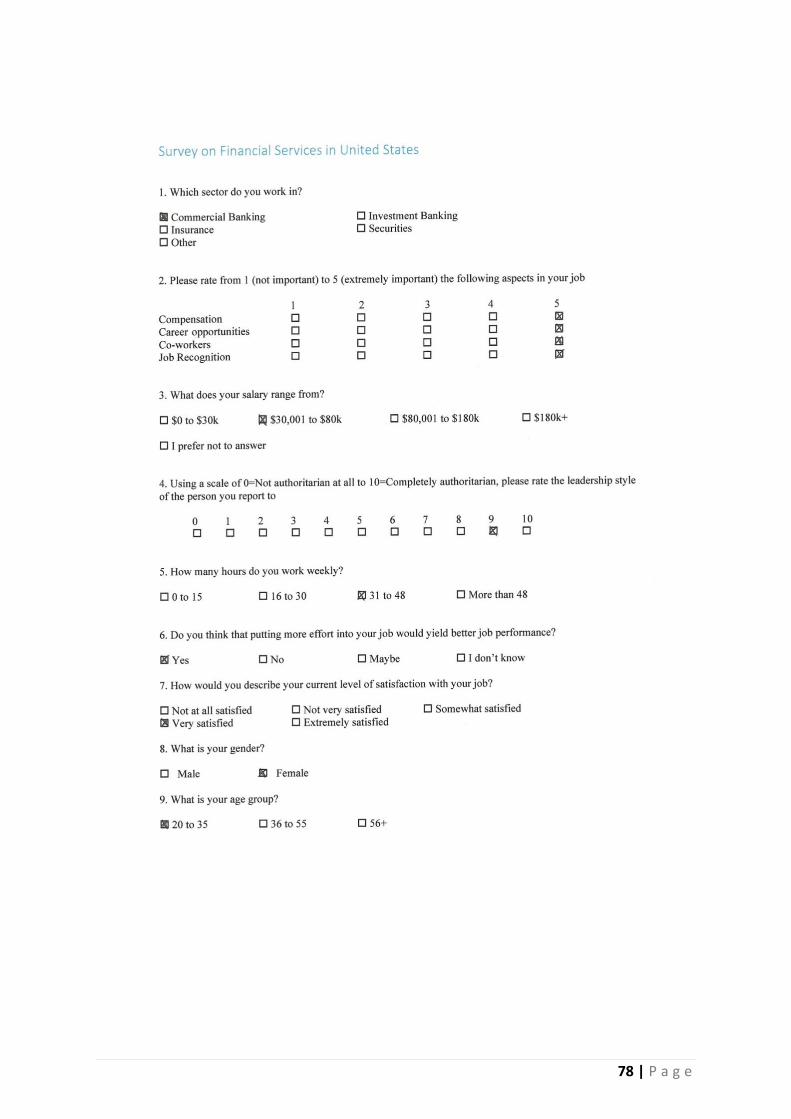
78 | P a g e

79 | P a g e

80 | P a g e

81 | P a g e

82 | P a g e

83 | P a g e

84 | P a g e

85 | P a g e

86 | P a g e

87 | P a g e
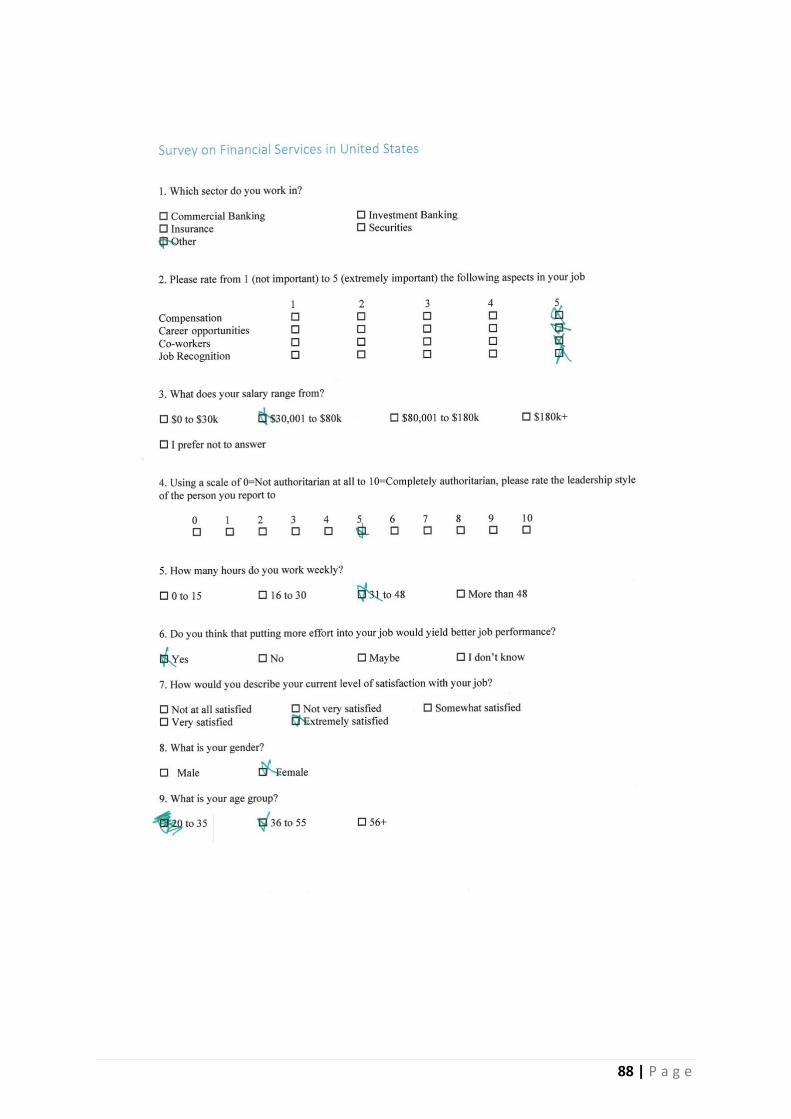
88 | P a g e

89 | P a g e

90 | P a g e

91 | P a g e

92 | P a g e

93 | P a g e

94 | P a g e

95 | P a g e