Llopis-Castelló et al.pdf - RiuNet - UPV
24
Document downloaded from: This paper must be cited as: The final publication is available at Copyright Additional Information http://doi.org/10.3141/2602-13 http://hdl.handle.net/10251/93342 Transportation Research Board Llopis-Castelló, D.; Camacho Torregrosa, FJ.; Marín-Morales, J.; Pérez Zuriaga, AM.; García García, A.; Dols Ruiz, JF. (2016). Validation of Low-Cost Driving Simulator Based on Continuous Speed Profiles. Transportation Research Record Journal of the Transportation Research Board. 2602:104-114. doi:10.3141/2602-13
-
Upload
khangminh22 -
Category
Documents
-
view
0 -
download
0
Transcript of Llopis-Castelló et al.pdf - RiuNet - UPV

Document downloaded from:
This paper must be cited as:
The final publication is available at
Copyright
Additional Information
http://doi.org/10.3141/2602-13
http://hdl.handle.net/10251/93342
Transportation Research Board
Llopis-Castelló, D.; Camacho Torregrosa, FJ.; Marín-Morales, J.; Pérez Zuriaga, AM.;García García, A.; Dols Ruiz, JF. (2016). Validation of Low-Cost Driving Simulator Based onContinuous Speed Profiles. Transportation Research Record Journal of the TransportationResearch Board. 2602:104-114. doi:10.3141/2602-13

Validation of a Low-Cost Driving Simulator Based on Continuous
Speed Profles
Corresponding Author:
David Llopis-Castelló
Ph.D. Student
Highway Engineering Research Group (HERG), Universitat Politècnica de València
Camino de Vera, s/n. 46022 – Valencia. Spain
Tel: (34) 96 3877374; Fax: (34) 96 3877379; E-mail: [email protected]
Other Authors:
Francisco Javier Camacho-Torregrosa
Assistant Professor
HERG, Universitat Politècnica de València
E-mail: [email protected]
Javier Marín-Morales
Research Assistant
LabHuman, Universitat Politècnica de València
Camino de Vera, s/n. 46022 – Valencia. Spain
Tel: (34) 96 3877000; E-mail: [email protected]
Ana María Pérez-Zuriaga
Assistant Professor
HERG, Universitat Politècnica de València
E-mail: [email protected]
Alfredo García
Professor
HERG, Universitat Politècnica de València
E-mail: [email protected]
Juan F. Dols
Associate Professor
Institute of Design and Manufacture, Universitat Politècnica de València
Camino de Vera, s/n. 46022 – Valencia. Spain
Tel: (34) 96 3877000; Fax: (34) 96 3877629; E-mail: [email protected]
Word count: 227 words abstract + 4122 words text + 861 words references + 9 tables/figures x 250
words (each) = 7,460 words
TRR Paper number: 16-1441
Submission Date: March 1st, 2016

Llopis-Castelló et al. 2
ABSTRACT
The amount of road safety studies based on driving simulators is significantly growing. The
Universitat Politècnica de València (UPV) has developed a low-cost driving simulator: SE2RCO
(Simulator for the Assessment, Training and Rehabilitation of Drivers, in Spanish).
The main objective of this research is the validation of the SE2RCO driving simulator in order to
perform studies about road safety and highway geometric design considering human factor. Its
validation is based on continuous speed profiles collected from 28 volunteers on a 30 km two-lane
rural road section. The same volunteers drove through the same road section built in SE2RCO.
Speed data of 79 curves and 52 tangents were selected for the analysis. The comparison of the real
and simulated speeds ensured the objective validity according to average and operating speeds.
Two models were developed to predict field speeds from simulated speeds. Results show that a
simulated average speed lower than 90 km/h approximately is linked to a similar real average
speed. For higher simulated speeds, the average speed in the real environment is lower than the
simulated one. In addition, the actual operating speed is around 5 km/h lower than the operating
speed in the driving simulator. Most volunteers assessed the quality and similarity of the virtual
environment to the real world as medium or high, as well as for the driving tasks, thus achieving
the subjective validation.

Llopis-Castelló et al. 3
INTRODUCTION Road accidents may be caused by several concurrent factors, being infrastructure, vehicle and
human factor the most important ones. Human factor is estimated to be behind over 90% of all
road accidents. Thus, the importance of its inclusion in the highway geometric design process.
However, analyzing the human factor may become a very difficult task.
Driving simulators may become an interesting and effective tool to include human factor in
road safety. They can be loaded with scenarios where drivers provide similar responses than on a
real situation. Under this controlled environment, researchers can monitor several more
parameters, but without the physical risk of driving through an actual road. Thus, simulators are a
flexible tool for research, since they allow performing studies that otherwise would be
unaffordable.
Currently, most studies about road safety and geometric design use operating speed as a
surrogate measure of driver behavior. This speed is defined by the AASHTO as “the speed at
which drivers are observed operating their vehicles during free-flow conditions” (1). It is usually
considered as the 85th percentile of the speed distribution for passenger cars under free-flow
conditions with no environmental restrictions (V85).
Many researchers have used driving simulators to study the influence of the road geometric
design in the driver behavior. Their research lines can be grouped into the following topics:
coordination of the horizontal and vertical alignment (2-4); passing maneuvers (5, 6); acceleration
and deceleration lanes (7); intersections design (8-10); cross section (11-13); speed analysis (14,
15); assessment of traffic signs (16, 17). The wide variety of topics gives an insight about the
extensive use of driving simulators in road safety and highway engineering. Note that the
validation of the driving simulator is different depending on the objective of the research.
Simulators must provide a close-to-reality environment in order to allow the researchers to
obtain valid results. Validity is achieved by means of the validation process, which consists on
determining how similar drivers’ behaviors under simulated and real conditions are.
In 1982, Blaauw carried out a research proposing two levels of validity: physical and
behavioral (18). The first one is the physical correspondence of the simulated vehicle components
and its dynamics with a real car; while the second one tries to establish a correspondence between
the simulator and reality according to drivers’ behavior. The last one presents two dimensions:
absolute and relative validity. Absolute validity is the numerical correspondence between behavior
in the driving simulator and in the real road, while relative validity is the correspondence between
the different variations in the driving situation and the variations in the real situation.
Later, Törnros (19) indicated that relative validity is of a major importance for determining
the usefulness of a simulator, while absolute validity is not required. This is why most validation
efforts have not been focused on determining how accurate the simulator is in absolute terms, but
on establishing partial validations for specific fields of research.
The validation process is usually divided into:
Objective validation based on comparison of the observed measures in the simulator with
those collected in field study.
Subjective validation through the driver’s perception.
In the literature, there are many studies about how simulators are validated (20 21). Driving
simulators present the following issues compared to real world, which might bias the results:
The user does not perceive a homogeneous sensory answer
The sampling rate may be unconsciously perceived by drivers
Lack of risk

Llopis-Castelló et al. 4
Lack of knowledge of the vehicle, as well as errors in the sensory feedback
Despite of these issues, previous research indicate that drivers operate more similarly to the
real environment when using advanced simulators with high quality graphics.
On the other hand, one of the most important advantages of using driving simulation is the
ability to collect continuous speed data, which is very difficult in field. This is why most previous
validation studies have used spot-speed data. Pérez-Zuriaga et al. (22) introduced a new
methodology for obtaining continuous operating speed profiles in field conditions.
This paper presents how SE2RCO simulator has been validated. After a first exploratory
analysis, some models to estimate the field speed as a function of the simulated speed have been
obtained. Both the mean speed and the operating speed have been considered.
OBJECTIVES AND HYPOTHESES
The main objective of this research is the validation of SE2RCO driving simulator at the
Universitat Politècnica de València to perform studies about road safety and highway geometric
design.
The validation process considers two dimensions: objective and subjective validity. The
first one is achieved by means of a comparison between field (Vf) and simulated (Vs) speeds. The
subjective validity is performed considering drivers’ perception, obtained through surveys. It has
also enabled the study of the symptoms of adaptation to the simulation (SAS), which is always an
issue when a driving simulator is used.
The underlying hypothesis is that there is a correlation between Vs and Vf, which allows
the validation of a driving simulator. According to Bittner et al. (23) and Bella et al. (14), the
difference between the simulated speed (Vs) and the field speed (Vf) increases when Vs increases.
In addition, according to Bittner et al., a lower simulated speed is expected for hard-controlled
geometric features.
METHODOLOGY
Two-lane Road Section
The researchers proposed a 30 km long two-lane rural road section of the CV-35 road for the
analysis, from Losa del Obispo (PS 53+500) to Titaguas (PS 83+700). This road section is located
in the Valencian Region (Spain). It presents a lane width of 3.25 m, and a shoulder width of 0.25
m. The AADT is 2012 vpd.
This road section has been selected since it is composed by three homogeneous road
segments with different features, covering a wide range of geometric features. The first one
extends from Losa del Obispo to Chelva (PS 67+800) and it is basically composed of isolated
smooth curves, low longitudinal grades and long tangents. The second segment is located between
Chelva and Tuéjar (PS 73+100) and it is characterized by successive sharp curves, moderate
longitudinal grades and short tangents. The last one includes sharp curves, large grades and diverse
tangents (TABLE 1).
The total length is 30.185 km. However, the effective length is 28.877 km because there is
1.308 km of urban road between segments 1 and 2. As a result, a total amount of 79 isolated
horizontal curves and 52 tangents longer than 120 m were selected for the study.
Volunteers
Twenty-eight volunteers took part in the experiment. The age ranged from 27 to 61 years-old,
while the men/women ratio was 80/20. Participants were students, faculties and staff of the

Llopis-Castelló et al. 5
University, as well as non-university-related volunteers. All participants drove their own vehicle
for the field tests. None of the volunteers was directly involved in the research or was aware about
its final objective.
The age and gender distributions of the drivers were representative of the actual drivers of
this region, according to the naturalistic data collected by Pérez-Zuriaga et al. (22). In their study,
age and gender distributions from more than 80 actual drivers (not volunteers) along the same road
were obtained in 2008 for a different research, where continuous individual speed profiles were
also collected. García et al. (24) compared how mean and operating speed profiles of volunteers
and actual drivers matched, validating the use of data from volunteers as a surrogate measurement
of actual drivers.
Field Study
Data Collection
The quasi-naturalistic methodology of this study was presented by García et al. (24). Each one of
the 28 volunteers performed one forward and backward trip, driving their own vehicle (passenger
cars in all cases). The tests were carried out between March and April 2014 under daylight and
favorable weather conditions.
Every vehicle was equipped with three VIRB Elite cameras, which include a GPS unit.
These cameras record a HD video of the road, as well as the position (1 Hz), speed and
accelerations (10 Hz). Two of these cameras were centered in the windshield, facing towards the
front of the vehicle. The third one was also in the windshield, pointing towards the interior of the
vehicle in order to record driver’ expressions (FIGURE 1).
Collected data was used for developing continuous operating speed profiles for every
driver. In addition, driving experience, road familiarity, dizziness and workload demand were also
asked to participants before or after the test (24).
Data Reduction
Once data were collected, a computer program developed by the research group was used to
transform the original time-based data to a station-based one. In addition, the horizontal alignment
was recreated according to the procedure proposed by Camacho-Torregrosa et al. (25).
Drivers not performing at free-flow conditions were removed, using the methodology
proposed by Pérez-Zuriaga et al. (26). This procedure states that drivers experience a sudden
variation of their corresponding operating speed percentile under non-free-flow conditions. After
this step, 66% of curve data and 68% of tangent data performed under free-flow conditions.
Considering each element separately, the amount of valid data ranges from 43% to 79% in curves
and from 50% to 75% in tangents.
Driving simulator study
The SE2RCO Driving Simulator
The SE2RCO is an interactive fixed-base driving simulator (FIGURE 2). It consists of a simulation
computer, which provides the graphics performance required for the implementation of the
simulation software; data collection in real time; wireless router; three-screen-display monitors
1.80x0.34 m with 120º of the field of view; Matrox TripleHead2Go, which is the intermediary

Llopis-Castelló et al. 6
between the graphics card of the simulation computer and the three screens; sound stereo system;
steering wheel, pedals and gear shift of a Citroen Saxo; and generic adjustable seat.
In addition, the simulator has sensoring brake pedal by load cell to measure forces;
sensoring displacement in the three pedals by potentiometers; sensoring of gear changes by
microswitch; sensoring the steering wheel by encoder; and sensoring the torque on the wheel by
torque sensor.
That provides a view of the road and the environment very close to the real conditions. The
equipment of the simulator offers very close-to-reality driving conditions and allows to collect
many variables, such as longitudinal and lateral speed, location and heading direction, with a
frequency of 10 Hz. After data collection, all these variables are transformed into a station-based
reference system using a software developed by the HERG.
Development of the virtual scenario
The first step to undertake data collection in the driving simulator was to build the road segment
and its environment in a virtual reality. It was necessary to dispose of:
Horizontal and vertical alignments of the road segment
Surface model of the area
Orthophotography of the area
Inventory of road and environmental elements
The horizontal alignment was obtained according to the methodology proposed by
Camacho-Torregrosa et al. (25). The vertical alignment was extracted from GPS data of the tests,
using the same methodology. All different road and environmental elements, such as trees, traffic
signs or safety barriers, were located in a CAD file and uploaded to the simulator. The SE2RCO
driving simulator was able to merge all elements, providing a very accurate recreation of the actual
infrastructure and environment (FIGURE 2).
Data Collection
The scope of the driving simulator study was the same as in the field study. In order to ensure the
validity of the collected data, it consisted of the following steps:
1. Drivers are informed about how they should perform. No information about the research
project is given.
2. Drivers fill out the first survey
3. Training segment
4. Test
5. Drivers fill out the second survey
The first survey collected personal information, such as driving experience or road
knowledge. The second one asked about test-related topics, such as:
Dizziness (nothing/low/medium/high)
Sickness (yes/no)
Eyestrain (yes/no)
Headache (yes/no)
Sleepiness (yes/no)
Reality of the virtual environment (low/medium/high)
Similarity between driving task in the simulator and the reality (low/medium/high)
Natural driving (nothing/low/medium/very natural)
Workload demand (nothing/low/medium/high)

Llopis-Castelló et al. 7
Familiarity with the road segment (no/little/medium/a lot)
This information was collected in order to analyze the symptoms of adaptation to the
simulation (SAS) and to complement the driving simulator validation through drivers’ perception.
The training session was needed to ensure that drivers do adapt to the simulator controls
and environment. It consisted of driving through a road segment that presented similar
characteristics than the road segment under study. The duration of the training session was 10
minutes at least.
In order to prevent dizziness, every participant had to stand up and walk for several
minutes between the training stage and the beginning of the test, as well as between the forward
and backward trips. In this regard, the researchers wrote down whether the driver had shown
symptoms of dizziness along the test or not.
The driving simulator test was performed by 24 out of 28 volunteers who participated in
the field test.
ANALYSIS
An exploratory and statistical analysis comparing the simulated speed (Vs) and the field speed (Vf)
is presented. Drivers’ perception and reaction to the simulator were also analyzed.
Speed
Exploratory Analysis
Before analyzing the relationship between field and simulated speeds, it was necessary to validate
the operating speed profiles obtained from the real environment. This was achieved by comparing
the field speed distribution of the 28 participants to the speed distribution observed by
Pérez-Zuriaga et al. (22) in the same road section. The operating speed profiles for several speed
percentiles were very similar, so it was concluded that volunteers were not biased. This process
was deeply explained by Garcia et al. (24), using the same data set. In addition, the surveys results
showed that all drivers performed in a natural (or quasi-natural) way in the field test, with a low
workload demand.
Three volunteers reported dizziness and sickness problems and could not finish the driving
simulator test. Hence, data of 21 drivers were processed. However, 87.5% of the volunteers
indicated that they performed in a natural or quasi-natural way.
The next step was to compare the operating speed distributions of the simulated and the
real environments. Percentiles 15th, 30th, 50th, 70th and 85th of the simulated speed (Vs) were
compared to the same field speed (Vf) percentiles. FIGURE 3 shows that these speed percentiles
were quite similar in road features that presented a strong geometric control, i.e., the difference
between Vs and Vf was found to be lower on curves than on tangents. This meets the conclusions
provided by Bella (14) and Bittner et al. (23), who reported a higher speed variability in
simulators.
Average and operating speed were also analyzed in all curves and tangents separately.
Curves were analyzed using the minimum observed speed, while the maximum speed was used on
tangents. The identification of these speed data was possible thanks to availability of continuous
operating speed profiles in both cases.
Horizontal curves impose a geometric control, so the minimum speed was selected in order
to determine how strong this control was. On the contrary, tangents are not geometric controls, so
higher speeds can be reached. Thus, maximum speeds were selected.

Llopis-Castelló et al. 8
The difference between the speed observed in the driving simulator and the speed
developed in the field study (Vs-Vf) was also analyzed according to geometric features. On curves,
the difference between average speeds (Vms-Vmf) ranged from -9.92 km/h to +8.65 km/h, whereas
the difference between 85th percentiles (V85s-V85f) ranged from -8.57 km/h to +15.70 km/h.
Attending to tangents, the difference (Vms-Vmf) ranged from -7.12 km/h to +16.14 km/h, whereas
the difference (V85s-V85f) ranged from -8.76 km/h to +27.84 km/h.
Statistical Analysis
A hypothesis test was performed to determine whether the speed observed in the driving simulator
could be considered similar to the speed observed in the field study or not. For each element, the
following hypotheses were formulated: (a) Null hypothesis H0: Vms=Vmf; (b) Alternative
hypothesis H1: Vms≠Vmf. The level of significance considered in the analysis was 95%.
A first analysis was performed only for curves (TABLE 2a). The null hypothesis was
checked for all curves except seven, where speeds were influenced by external factors, such as the
relative proximity to important intersections and some issues related to the simulated scenario.
The same analysis was carried out for tangents (TABLE 2b). The null hypothesis was only
rejected for six tangents. Three of them can be explained due to the presence of important
intersections nearby, while the others are more related to the accuracy of the driving scenario.
All anomalous data were discarded from further analyses.
Drivers’ perception and adaptation to the simulator
The driving simulator should also be validated from drivers’ perception. This was performed by
analyzing the results obtained from surveys.
The results showed that 62.5% and 33.33% of the drivers assessed the quality of the virtual
environment as medium and high, respectively.
In addition, 80% of all volunteers indicated that the similarity of the driving task between
the simulator and the real world was medium or high. As expected, drivers who suffered dizziness
evaluated this similarity as low.
Finally, it is worth to highlight that only 16.67% of the users reported that the test presented
a high workload demand. These drivers were mainly who suffered dizziness. Hence, most
volunteers indicated a mid-workload demand, similar to the field test.
Regarding the symptoms of adaptation to the simulation (SAS), the drivers who suffered
dizziness performed in the simulator much slower than in the field study. In addition, drivers older
than 45 drove faster in the reality than in the simulator. The speed in the backward trip was lower
than the speed in the forward one, probably due to the influence of the training session. On the
other hand, the driving experience did not have any influence in the average speed of the
volunteers who participated in the simulation test, although in the real world those users with
greater experience often drive faster. Also notice that the problems related to dizziness and nauseas
were presented in drivers older than 50.
DISCUSSION
The operating and average speeds were analyzed in field and simulated conditions, for curves and
tangents separately.
FIGURE 4b shows the 85th percentile of the simulated speed distribution (V85s) versus the
85th percentile of the field speed distribution (V85f) on curves. A close relationship between both
parameters can be observed, being the simulated speed higher (V85s) than the field one (V85f). This

Llopis-Castelló et al. 9
conclusion meets most previous research (14), and is mainly due to the lack of lateral acceleration
and lack of risk provided by the simulator.
Conversely, the average simulated speed (Vms) is very similar to the average field speed
(Vmf) (FIRURE 4a), which is remarkable. This could be explained taking into account how an
average driver performs. In this condition, drivers experience a lower lateral acceleration than
those driving at an 85th percentile speed, so the difference compared to the simulated environment
is lower or even negligible.
The analysis of average and operating speed for tangents is shown in FIGURE 5. In this
case, the relationships are weaker than for horizontal curves, probably due to the higher speed
magnitude and dispersion on tangents. In addition, both the average simulated speed (Vms) and the
simulated operating speed (V85s) were greater than the field ones (Vmf and V85f, respectively).
Considering both curves and tangents, it can be concluded that the more complex an
alignment layout, the lower the difference between the field and simulated average speeds, which
is consistent with the research of Bella (14) and Bittner et al. (23). In other words: the higher the
speed, the higher the difference between simulated and field speed.
As stated by Bella (14), this phenomenon may be due to a lower perception of risk in the
simulated road. According to Fuller’s driver behavior theory (27), drivers continuously make
comparisons between their capability and the risk perception, trying to keep a constant level of
perceived risk. In the simulator, the perceived risk on tangents or smooth curves is very low, thus
enabling drivers to reach higher speeds.
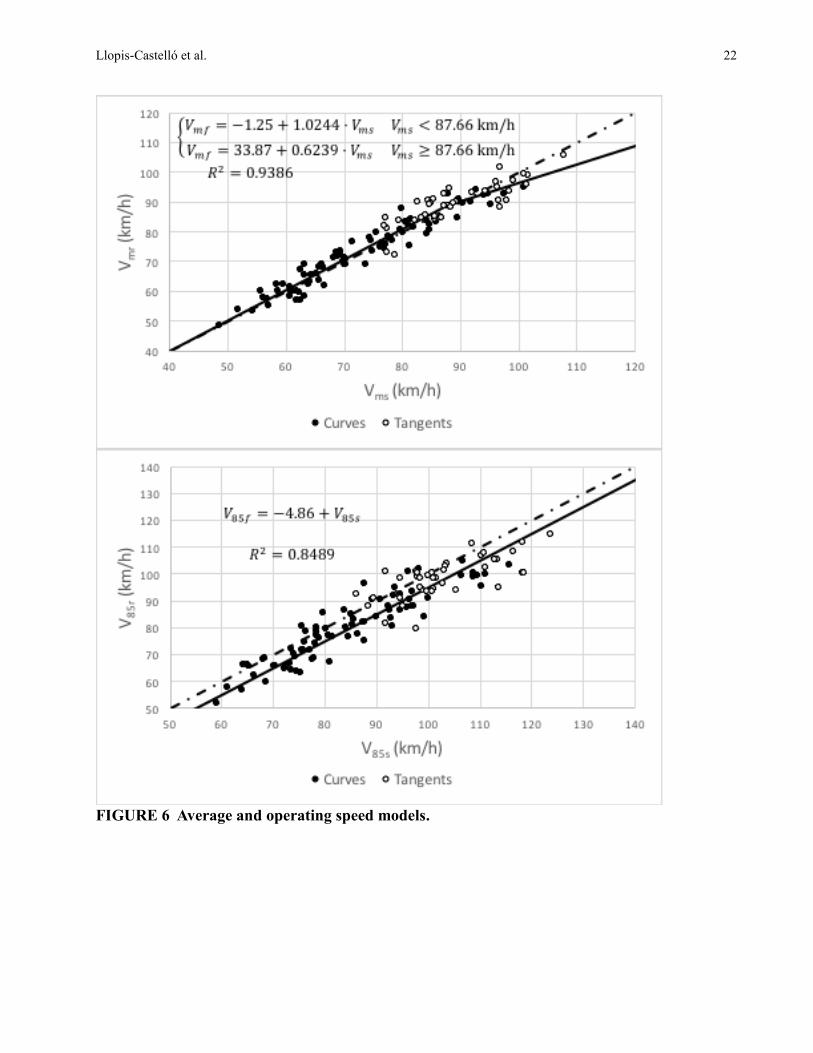
Considering the behavior of speed data, two regression models were calibrated in order to
predict field speeds as a function of the simulated ones (FIGURE 6a). They will allow designers to
estimate actual speed from simulator speed in the road design phase. These analyses were
performed merging curve and tangent data, since the relationship between simulated and field
speeds could be performed in terms of speed or geometric constraint.
Although the first analysis showed that the mean field speed was statistically equal to the
simulated one, a slight change in the tendency has been observed when simulated speed is higher
than approximately 90 km/h (FIGURE 6a). A composite linear model was proposed accordingly.
For simulated speeds lower than 87.66 km/h, field average speeds are very similar to simulated
ones. For higher simulated average speeds, field speeds are a bit lower than simulated ones.
In addition, another model was calibrated for operating speeds (FIGURE 6b). This is a
simpler unique model that estimates the field operating speed to be 4.86 km/h lower than the
simulated operating speed.
This analysis can also be performed determining the speed difference as a function of
geometry. The difference between the speed observed in the driving simulator and the speed
developed in the field study (Vs-Vf) was analyzed according to curve radius and tangent length
(FIGURE 7).
As the geometric constraint becomes stronger, (Vms-Vmf) is lower, and viceversa. In this
regard, sharp curves (radii lower than 300 m) and short tangents (length lower than 300 m)
presented very low values -even negative in some cases-, whereas smooth curves and long
tangents presented higher simulated speeds. Nevertheless, the tendency of the difference between
mean speeds in curves was constant and equal to 0 km/h approximately. Finally, the negative
difference observed in some short tangents might be due to the preceding and/or following curve.
Considering (V85s-V85f), a higher tangent length produces a higher operating speed
difference. On the other hand, this difference was around 5 km/h in curves, being slightly higher
for sharp curves.
Llopis-Castelló et al. 10
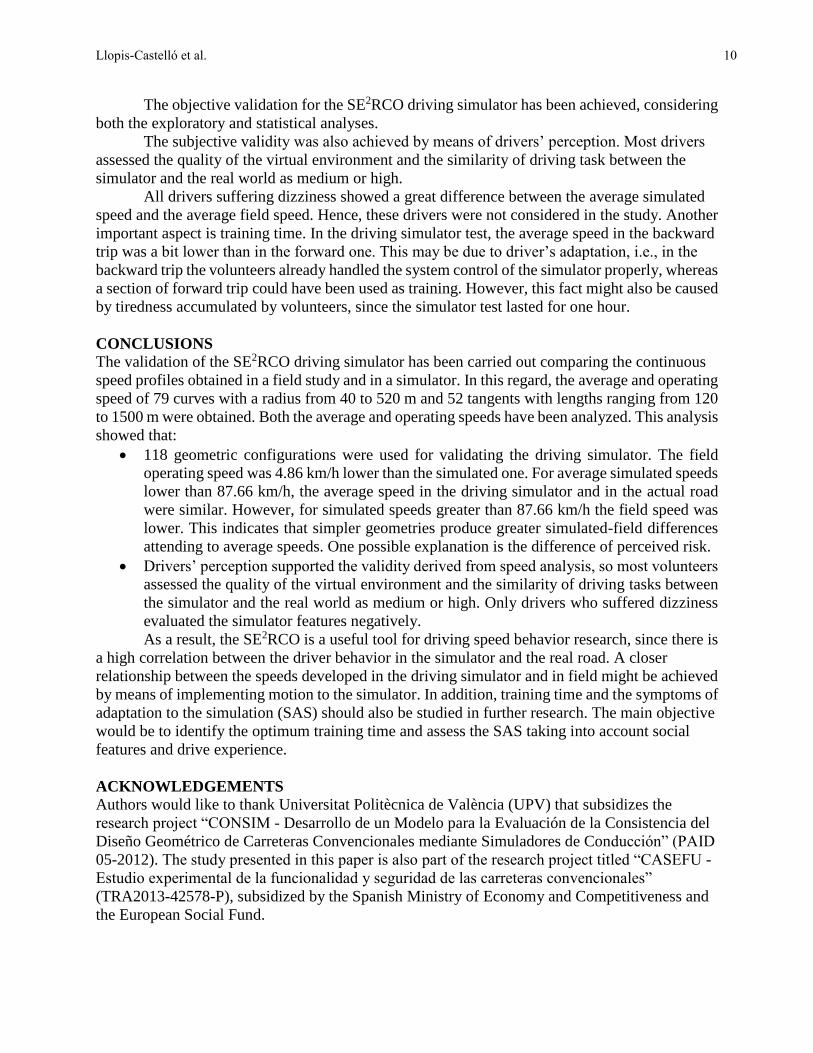
The objective validation for the SE2RCO driving simulator has been achieved, considering
both the exploratory and statistical analyses.
The subjective validity was also achieved by means of drivers’ perception. Most drivers
assessed the quality of the virtual environment and the similarity of driving task between the
simulator and the real world as medium or high.
All drivers suffering dizziness showed a great difference between the average simulated
speed and the average field speed. Hence, these drivers were not considered in the study. Another
important aspect is training time. In the driving simulator test, the average speed in the backward
trip was a bit lower than in the forward one. This may be due to driver’s adaptation, i.e., in the
backward trip the volunteers already handled the system control of the simulator properly, whereas
a section of forward trip could have been used as training. However, this fact might also be caused
by tiredness accumulated by volunteers, since the simulator test lasted for one hour.
CONCLUSIONS
The validation of the SE2RCO driving simulator has been carried out comparing the continuous
speed profiles obtained in a field study and in a simulator. In this regard, the average and operating
speed of 79 curves with a radius from 40 to 520 m and 52 tangents with lengths ranging from 120
to 1500 m were obtained. Both the average and operating speeds have been analyzed. This analysis
showed that:
118 geometric configurations were used for validating the driving simulator. The field
operating speed was 4.86 km/h lower than the simulated one. For average simulated speeds
lower than 87.66 km/h, the average speed in the driving simulator and in the actual road
were similar. However, for simulated speeds greater than 87.66 km/h the field speed was
lower. This indicates that simpler geometries produce greater simulated-field differences
attending to average speeds. One possible explanation is the difference of perceived risk.
Drivers’ perception supported the validity derived from speed analysis, so most volunteers
assessed the quality of the virtual environment and the similarity of driving tasks between
the simulator and the real world as medium or high. Only drivers who suffered dizziness
evaluated the simulator features negatively.
As a result, the SE2RCO is a useful tool for driving speed behavior research, since there is
a high correlation between the driver behavior in the simulator and the real road. A closer
relationship between the speeds developed in the driving simulator and in field might be achieved
by means of implementing motion to the simulator. In addition, training time and the symptoms of
adaptation to the simulation (SAS) should also be studied in further research. The main objective
would be to identify the optimum training time and assess the SAS taking into account social
features and drive experience.
ACKNOWLEDGEMENTS
Authors would like to thank Universitat Politècnica de València (UPV) that subsidizes the
research project “CONSIM - Desarrollo de un Modelo para la Evaluación de la Consistencia del
Diseño Geométrico de Carreteras Convencionales mediante Simuladores de Conducción” (PAID
05-2012). The study presented in this paper is also part of the research project titled “CASEFU -
Estudio experimental de la funcionalidad y seguridad de las carreteras convencionales”
(TRA2013-42578-P), subsidized by the Spanish Ministry of Economy and Competitiveness and
the European Social Fund.

Llopis-Castelló et al. 11
REFERENCES
1. AASHTO. A Policy on Geometric Design of Highways and Streets. American Association of
State Highway and Transportation Officials, 2011.
2. Bella, F. Driver perception hypothesis: Driving simulator study. Transportation Research Part
F: Traffic Psychology and Behaviour, Vol. 24, 2014, pp. 183–196.
3. Easa, S. M., and W. He. Modeling Driver Visual Demand on Three-Dimensional Highway
Alignments. Journal of Transportation Engineering, Vol. 132, No. 5, 2006, pp. 357–365.
4. García, A., A. Tarko, J. F. Dols Ruíz, A. T. Moreno Chou, and D. Calatayud. Analysis of the
influence of 3D coordination on the perception of horizontal curvature using driving simulator.
Advances in Transportation Studies, No. 24, 2011, pp. 33–44.
5. Toledo, T., and H. Farah. Alternative Definitions of Passing Critical Gaps. Transportation
Research Record: Journal of the Transportation Research Board, Vol. 2260, No. -1, 2011, pp.
76–82.
6. Bella, F. How traffic conditions affect driver behavior in passing maneuver. Advances in
Transportation Studies, No. SPEC, 2011, pp. 113–126.
7. Bella, F., A. García, F. Solves, and M. A. Romero. Driving simulator validation for
deceleration lane design. Transportation Research Board 86th Annual Meeting. No. 07-0894.
2007.
8. Yan, X., M. Abdel-Aty, E. Radwan, X. Wang, and P. Chilakapati. Validating a driving
simulator using surrogate safety measures. Accident Analysis and Prevention, Vol. 40, No. 1,
2008, pp. 274–288.
9. Montella, A., M. Aria, A. D’Ambrosio, F. Galante, F. Mauriello, and M. Pernetti. Perceptual
Measures to Influence Operating Speeds and Reduce Crashes at Rural Intersections.
Transportation Research Record: Journal of the Transportation Research Board, Vol. 2149,
2010, pp. 11–20.
10. Rossi, R., M. Gastaldi, C. Meneguzzer, and G. Gecchele. Gap-Acceptance Behavior at Priority
Intersection: Field Observations Versus Experiments with Driving Simulator. Transportation
Research Board 90th Annual Meeting. No. 11-3241. 2011.
11. Bella F. Driver perception of roadside configurations on two-lane rural roads: Effects on speed
and lateral placement. Accident Analysis and Prevention, Vol. 50, 2013, pp. 251-262. doi:
10.1016/j.aap.2012.04.015.
12. Yang, Q., R. Overton, and S. H. Richards. Driver Behaviors on Rural Highways with and
without Curbs – A Driving Simulator Based Study. International journal of injury control and
safety promotion, Vol. 21, No. 2, 2014, pp. 115–126.
13. Rosey, F., J.-M. Auberlet, O. Moisan, and G. Dupré. Impact of Narrower Lane Width:
Comparison Between Fixed-Base Simulator and Real Data. Transportation Research Record:
Journal of the Transportation Research Board, Vol. 2138, No. 1, 2009, pp. 112–119.
14. Bella, F. Driving simulator for speed research on two-lane rural roads. Accident Analysis and
Prevention, Vol. 40, No. 3, 2008, pp. 1078–1087.
15. Bella, F., A. Calvi, and F. D’Amico. Analysis of driver speeds under night driving conditions
using a driving simulator. Journal of Safety Research, Vol. 49, No. February, 2014, pp. 45–52.

Llopis-Castelló et al. 12
16. Daniels, S., J. Vanrie, A. Dreesen, and T. Brijs. Additional road markings as an indication of
speed limits: Results of a field experiment and a driving simulator study. Accident Analysis
and Prevention, Vol. 42, No. 3, 2010, pp. 953–960.
17. Jamson, S., and F. Lai. Are Novelty Effects of Road Safety Treatments Observable in
Simulator Experiments? Transportation Research Board 90th Annual Meeting. No. 11-0535.
2011.
18. Blaauw, G. J. Driving Experience and Task Demands in Simulator and Instrumented Car: A
Validation Study. Human Factors: The Journal of the Human Factors and Ergonomics Society,
Vol. 24, No. 4, 1982, pp. 473–486.
19. Törnros, J. Driving behaviour in a real and a simulated road tunnel—a validation study.
Accident Analysis and Prevention, Vol. 30, No. 4, 1998, pp. 497–503.
20. Bella, F. Can Driving Simulators Contribute to Solving Critical Issues in Geometric Design?
Transportation Research Record: Journal of the Transportation Research Board, Vol. 2138,
2009, pp. 120–126.
21. Kaptein, N., J. Theeuwes, and R. Van Der Horst. Driving Simulator Validity: Some
Considerations. Transportation Research Record: Journal of the Transportation Research
Board, Vol. 1550, 1996, pp. 30–36.
22. Pérez-Zuriaga, A., A. García, F. J. Camacho-Torregrosa, and P. D’Attoma. Modeling
Operating Speed and Deceleration on Two-Lane Rural Roads with Global Positioning System
Data. Transportation Research Record: Journal of the Transportation Research Board, Vol.
2171, 2010, pp. 11–20.
23. Bittner, A., O. Simsek, W. Levison, and J. Campbell. On-Road Versus Simulator Data in
Driver Model Development Driver Performance Model Experience. Transportation Research
Record: Journal of the Transportation Research Board, Vol. 1803, 2002, pp. 38–44.
24. García, A., F. J. Camacho-Torregrosa, and J. Marín-Morales. Experimental determination of
the inertial operating speed for consistency and segmentation analysis. Transportation
Research Board 94th Annual Meeting. No. 15-4079. 2015.
25. Camacho-Torregrosa, F. J., A. M. Pérez-Zuriaga, J. M. Campoy-Ungría, A. García, and A. P.
Tarko. Use of Heading Direction for Recreating the Horizontal Alignment of an Existing
Road. Computer-Aided Civil and Infrastructure Engineering, Vol. 30, No. 4, 2015, pp. 282–
299.
26. Pérez-Zuriaga, A. M., F. J. Camacho-Torregrosa, A. García, and J. M. Campoy-Ungría.
Application of global positioning system and questionnaires data for the study of driver
behaviour on two-lane rural roads. IET Intelligent Transport Systems, Vol. 7, No. 2, 2013, pp.
182–189.
27. Fuller, R. Towards a general theory of driver behaviour. Accident Analysis and Prevention,
Vol. 37, No. 3, 2005, pp. 461–472.
Llopis-Castelló et al. 13
LIST OF TABLES
TABLE 1 Geometric Features of the Road Segment
TABLE 2 Statistical Analysis
LIST OF FIGURES
FIGURE 1 Location of the VIRB Elite cameras in the volunteers’ car.
FIGURE 2 SE2RCO driving simulator.
FIGURE 3 Comparison between Vs and Vf.
FIGURE 4 Average speed and operating speed on curves.
FIGURE 5 Average and 85th percentile of the speed distributions on tangents.
FIGURE 6 Average and operating speed models.
FIGURE 7 Speed difference vs Geometric features.

Llopis-Castelló et al. 14
TABLE 1 Geometric Features of the Road Segment
Road segment Rmin Rmax AR AG Gmax Lmax AL
Losa del Obispo-Chelva 73 603 260 ±2.13 % ±6.70 % 664 175
Chelva-Tuéjar 56 840 250 ±3.54 % ±7.81 % 358 56
Tuéjar-Titaguas 37 483 145 ±4.33 % ±10.28 % 1511 150
Rmin=minimum radius (m); Rmax=maximum radius (m); AR=average radius (m); AG=average
longitudinal grade (%); Gmax=maximum longitudinal grade (%); Lmax=maximum length of
tangent (m); AL=average length of tangent (m)

Llopis-Castelló et al. 15
TABLE 2 Statistical Analysis
Curves
Forward Backward
Id Vmf σf Vms σs t P-Val Id Vmf σf Vms σs t P-Val 1 58.22 6.33 60.60 10.74 -0.8553 0.3990 1 59.77 5.67 55.73 9.15 1.5451 0.1341 2 61.98 6.27 63.99 12.76 -0.6340 0.5313 2 67.03 6.18 62.58 10.46 1.5946 0.1216 3 81.56 7.09 81.97 13.91 -0.1154 0.9090 3 80.66 7.14 84.79 11.21 -1.3206 0.1970 4 82.27 8.09 84.72 14.21 0.6695 0.5083 4 83.04 7.20 85.81 13.42 -0.7912 0.4356 5 84.48 6.92 89.45 12.45 -1.5602 0.1293 5 83.70 6.24 84.22 12.41 -0.1294 0.8986 6 62.84 6.31 64.16 12.03 -0.4250 0.6742 6 63.36 5.59 65.66 11.98 -0.7187 0.4797 7 71.23 5.48 70.08 11.34 0.3982 0.6938 7 65.31 4.75 64.48 10.58 0.2961 0.7699 8 78.44 7.58 77.73 13.21 0.2042 0.8397 8 80.42 7.86 79.77 10.50 0.1975 0.8448 9 69.95 6.14 69.87 11.64 0.0257 0.9797 9 72.66 6.95 68.76 9.42 1.3747 0.1796 10 68.99 6.98 70.12 14.09 -0.2892 0.7751 10 71.02 6.68 68.34 10.03 0.9165 0.3673 11 70.53 8.22 70.36 13.42 0.0403 0.9683 11 62.20 6.19 59.63 9.89 0.8825 0.3858 12 65.24 7.07 63.25 12.30 0.5623 0.5791 12 71.80 6.47 69.30 10.16 0.8807 0.3858 13 68.68 6.14 73.72 12.36 -1.4579 0.1590 13 77.86 7.75 67.94 13.34 2.6503 0.0136 14 78.01 6.12 74.34 14.64 0.9535 0.3510 14 92.51 9.06 87.92 16.45 0.9472 0.3539 15 89.45 10.32 90.43 18.68 -0.1713 0.8657 15 90.94 8.31 89.73 16.27 0.2488 0.8061 16 93.79 9.23 92.72 18.06 0.1984 0.8448 16 87.59 7.31 80.01 12.84 1.8488 0.0801 17 82.43 8.62 81.05 13.53 0.3089 0.7606 17 73.48 8.33 69.46 11.09 1.1572 0.2570 18 57.93 6.02 63.17 9.78 -1.8248 0.8003 18 59.47 5.22 62.39 10.74 -1.0370 0.3098 19 61.83 5.92 66.70 13.18 -1.3903 0.1782 19 61.17 4.82 60.66 9.91 0.1962 0.8461 20 73.49 7.99 74.80 13.94 -0.3663 0.7167 20 75.80 6.39 76.59 11.93 -0.2545 0.8010 21 56.97 6.52 62.57 12.41 -1.6485 0.1122 21 74.29 7.31 76.95 12.66 -0.8126 0.4228 22 53.15 4.76 54.42 9.41 -0.5100 0.6145 22 57.28 7.28 72.96 12.01 -4.9928 0.0000 23 74.96 8.43 81.21 18.59 -1.2978 0.2068 23 70.73 5.30 70.24 12.73 0.1554 0.8778 24 67.04 10.27 75.69 13.43 -2.1094 0.0434 24 59.59 4.76 61.02 10.32 -1.3206 0.1970 25 65.55 6.83 65.18 13.55 0.1085 0.9144 25 83.31 8.54 80.51 12.55 0.8038 0.4275 26 60.12 5.26 61.87 10.78 -0.6512 0.5203 26 79.52 7.62 80.13 15.25 -0.1642 0.8707 27 76.96 7.78 74.74 13.72 0.6140 0.5441 27 76.28 7.65 71.47 12.20 1.5295 0.1355 28 77.99 8.66 78.07 13.13 -0.0233 0.9815 28 59.98 6.22 58.63 10.49 0.4936 0.6251 29 76.88 7.95 78.43 13.21 -0.4479 0.6573 29 50.12 3.52 44.77 9.64 2.3314 0.0285 30 60.16 5.55 60.95 12.42 -0.2678 0.7908 30 57.59 5.23 56.06 11.03 0.5740 0.5704 31 56.76 5.44 61.83 12.40 -1.7158 0.0975 31 67.92 4.47 65.82 11.10 0.8041 0.4285
32 53.51 4.71 51.84 8.91 0.7261 0.4740 32 84.12 9.18 81.56 14.85 0.6728 0.5057
33 48.38 3.78 48.65 9.85 -0.1128 0.9112 33 62.28 6.19 58.43 10.13 1.4879 0.1462 34 54.88 4.56 57.02 11.21 -0.7926 0.4354 34 65.10 6.43 59.24 9.38 2.3613 0.0238 35 79.70 6.74 75.67 13.33 1.2060 0.2379 35 68.11 5.18 59.34 11.36 3.2167 0.0033 36 57.31 6.87 56.89 9.68 0.1607 0.8733 36 75.54 6.55 77.23 12.36 -0.5548 0.5931 37 68.66 5.43 66.31 12.11 0.7712 0.4478 37 68.11 7.32 66.52 13.75 0.4459 0.6592 38 68.65 5.52 63.18 15.81 1.4235 0.1684 38 71.52 7.54 69.06 12.57 0.7339 0.4688 39 69.88 7.53 62.68 12.92 2.2074 0.0345
40 68.75 7.10 70.32 12.37 -0.5075 0.6153
41 74.56 7.01 76.32 13.50 -0.4892 0.6289
Tangents
Forward Backward
Id Vmf σf Vms σs t P-Val Id Vmf σf Vms σs t P-Val 1 85.44 7.25 96.01 15.35 -2.8511 0.0080 1 93.49 10.20 98.51 14.22 -1.2176 0.2326 2 78.98 7.13 84.31 13.24 -1.6244 0.1145 2 89.90 8.38 89.30 15.15 0.1524 0.8800

Llopis-Castelló et al. 16
3 94.63 7.53 100.90 15.86 -1.5968 0.1219 3 95.74 8.38 101.42 12.19 -1.7171 0.0952 4 92.24 7.75 94.05 15.00 -0.4784 0.6360 4 93.50 8.41 94.32 11.67 -0.2536 0.8013 5 92.74 7.57 97.48 14.50 -1.2948 0.2057 5 97.01 9.48 99.09 16.97 -0.4676 0.6437 6 92.44 7.08 94.85 14.36 -0.6735 0.5062 6 96.72 9.34 96.05 16.12 0.1512 0.8809 7 88.95 7.60 95.16 16.26 -1.5466 0.1336 7 94.29 7.96 88.27 11.50 1.8275 0.0775 8 89.67 9.14 91.80 14.73 -0.5505 0.5858 8 94.88 9.33 96.38 14.01 -0.3771 0.7088 9 85.60 7.60 84.10 14.04 0.3878 0.7015 9 90.30 8.64 84.53 10.92 1.8062 0.0797 10 98.61 13.37 101.55 15.76 -0.5492 0.5873 10 101.2 9.04 96.79 18.01 0.8630 0.3980 11 100.6 11.91 113.85 16.47 -2.4264 0.0232 11 99.41 9.28 100.87 17.90 -0.2902 0.7743 12 75.63 10.02 91.77 24.29 -2.4574 0.0233 12 72.00 7.51 78.89 16.06 -1.6472 0.1125 13 84.59 7.62 86.87 16.63 -0.5279 0.6025 13 84.68 8.22 83.46 13.27 0.3483 0.7299 14 87.96 7.41 96.83 17.32 -1.9422 0.0652 14 83.40 7.91 93.52 15.89 -2.5504 0.0165 15 90.10 10.28 96.52 18.35 -1.3291 0.1944 15 90.52 10.72 97.93 20.27 -1.4452 0.1592 16 102.2 10.93 114.54 21.94 -2.2909 0.0293 16 105.2 9.81 107.73 17.92 -0.5340 0.5974 17 88.34 10.28 87.97 14.39 0.0963 0.9238 17 89.27 8.02 88.78 14.51 0.1287 0.0898 18 80.85 7.76 77.43 13.10 1.0024 0.3240 18 89.58 9.21 84.88 12.36 1.3973 0.1706 19 83.65 8.10 82.23 13.60 0.3894 0.6998 19 89.08 9.63 84.81 13.63 1.1750 0.2477 20 90.66 9.56 85.38 14.09 1.3860 0.1749 20 88.34 9.78 87.33 17.16 0.2332 0.8171 21 83.95 8.99 85.58 14.03 -0.4483 0.6568 21 84.36 8.34 77.24 13.92 -1.3949 0.1725 22 72.96 7.34 77.31 12.25 -1.3949 0.1725 22 83.65 8.02 79.37 15.44 1.1257 0.2692 23 85.45 7.91 85.85 15.74 -0.1021 0.9194 23 92.73 10.18 87.18 14.92 1.4073 0.1681 24 88.23 9.04 88.32 15.51 -0.0236 0.9813 24 89.81 10.09 82.68 12.96 1.9871 0.0542 25 82.00 7.12 76.98 14.29 1.3700 0.1822 25 75.19 6.15 69.09 10.68 2.2662 0.0304 26 93.01 9.46 91.94 17.56 0.2463 0.8071 26 85.01 8.84 85.55 12.84 -0.1604 0.8735

Llopis-Castelló et al. 17
FIGURE 1 Location of the VIRB Elite cameras in the volunteers’ car.

Llopis-Castelló et al. 18
FIGURE 2 SE2RCO driving simulator.

Llopis-Castelló et al. 19
FIGURE 3 Comparison between Vs and Vf.

Llopis-Castelló et al. 20
FIGURE 4 Average speed and operating speed on curves.

Llopis-Castelló et al. 21
FIGURE 5 Average and 85th percentile of the speed distributions on tangents.
Llopis-Castelló et al. 22
FIGURE 6 Average and operating speed models.

Llopis-Castelló et al. 23
FIGURE 7 Speed difference vs Geometric features.