Identifying Differences in Understandings of PBL, Theory and Interactional Interdependencies
Upload
independentCategory
view
5download
0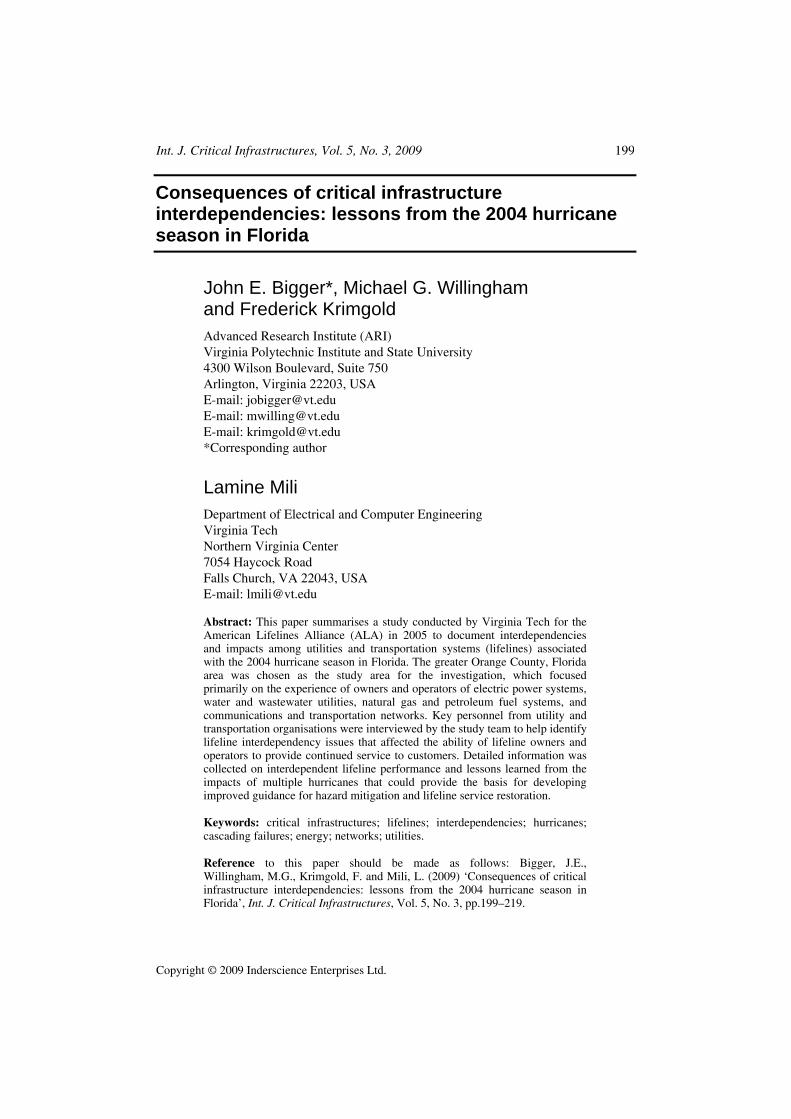
Int. J. Critical Infrastructures, Vol. 5, No. 3, 2009 199
Copyright © 2009 Inderscience Enterprises Ltd.
Consequences of critical infrastructure interdependencies: lessons from the 2004 hurricane season in Florida
John E. Bigger*, Michael G. Willingham and Frederick Krimgold Advanced Research Institute (ARI) Virginia Polytechnic Institute and State University 4300 Wilson Boulevard, Suite 750 Arlington, Virginia 22203, USA E-mail: [email protected] E-mail: [email protected] E-mail: [email protected] *Corresponding author
Lamine Mili Department of Electrical and Computer Engineering Virginia Tech Northern Virginia Center 7054 Haycock Road Falls Church, VA 22043, USA E-mail: [email protected]
Abstract: This paper summarises a study conducted by Virginia Tech for the American Lifelines Alliance (ALA) in 2005 to document interdependencies and impacts among utilities and transportation systems (lifelines) associated with the 2004 hurricane season in Florida. The greater Orange County, Florida area was chosen as the study area for the investigation, which focused primarily on the experience of owners and operators of electric power systems, water and wastewater utilities, natural gas and petroleum fuel systems, and communications and transportation networks. Key personnel from utility and transportation organisations were interviewed by the study team to help identify lifeline interdependency issues that affected the ability of lifeline owners and operators to provide continued service to customers. Detailed information was collected on interdependent lifeline performance and lessons learned from the impacts of multiple hurricanes that could provide the basis for developing improved guidance for hazard mitigation and lifeline service restoration.
Keywords: critical infrastructures; lifelines; interdependencies; hurricanes; cascading failures; energy; networks; utilities.
Reference to this paper should be made as follows: Bigger, J.E., Willingham, M.G., Krimgold, F. and Mili, L. (2009) ‘Consequences of critical infrastructure interdependencies: lessons from the 2004 hurricane season in Florida’, Int. J. Critical Infrastructures, Vol. 5, No. 3, pp.199–219.

200 J.E. Bigger, M.G. Willingham, F. Krimgold and L. Mili
Biographical notes: John E. Bigger has over 30 years of project and programme management experience in the electric utility and energy fields, including 10 years of engineering experience at the Los Angeles Department of Water and Power and 21 years managing energy technology research, development, demonstration and integration projects at the Electric Power Research Institute, Palo Alto, California, USA. In September 2000, Mr. Bigger was appointed Adjunct Professor at Virginia Tech, USA where he has conducted research studies of energy infrastructures organisations, their security, vulnerabilities and organisation for the Advanced Research Institute (ARI). Mr. Bigger has a BS degree from Iowa State University and an MS degree from the University of Southern California, both in Electrical Engineering.
Dr. Michael G. Willingham is an Energy and Environmental Analyst with experience in policy, technology, educational programme design and professional training. Since joining the Advanced Research Institute (ARI) in April 2000, his responsibilities have included coordinating Virginia Tech’s Critical Infrastructure and Modeling Program (CIMAP), which was established to provide Virginia stakeholders with long-term perspectives and guidance on the various issues that affect the planning, commissioning and operation of critical infrastructures. His previous work experience includes the Navajo Tribe, the Peace Corps, the US Congress, the United Nations, the World Bank and the private sector. He has an undergraduate degree in Mathematics from MIT, USA and a PhD in Energy Management from the University of Pennsylvania, USA.
Dr. Frederick Krimgold is the Director of the Disaster Risk Reduction Programme at Virginia Tech, USA. He is a graduate of Yale University and the Royal Institute of Technology, Stockholm. He was a Research Associate at MIT and a Programme Director at NSF. He has served as a member of the Building Research Board of the National Research Council and as a member of the Advisory Board of the Federal Emergency Management Agency. He has worked as a Consultant on disaster management for the World Bank, USAID, the Swedish Agency for Development Cooperation and the US Department of Homeland Security.
Dr. Lamine Mili is a Professor of Electrical Engineering and Computer Engineering at Virginia Tech, USA. He received an Electrical Engineering diploma from the Swiss Federal Institute of Technology, Lausanne, Switzerland, in 1976 and a PhD from the University of Liege, Belgium, in 1987. His research interests include risk assessment and management of catastrophic failures, risk-based decision theory, multicriteria decision making under uncertainty, robust statistics, power system stability analysis and control, robust signal processing, robust state estimation, nonlinear optimisation and multifunction radar systems. He is the co-founder and Co-Editor of the International Journal of Critical Infrastructures.
1 Introduction
Newspapers report daily the devastating effects of cyclones, floods, and droughts on people and infrastructure worldwide. These extreme events strain critical infrastructures in countries most at risk. For example, in western India, heat surge that followed several months of intense drought in many regions of the country triggered large-scale electric

Consequences of critical infrastructure interdependencies 201
power blackouts spreading over five states on 30 July 2002. In North America, an ice storm of an unprecedented magnitude knocked down a sizable segment of the electric transmission grid of Canada and the northeastern region of the USA on 5–10 January 1998. The restoration of the Canadian network took months and cost the taxpayers several billion dollars. In Europe on 17 and 26 December 1999, two consecutive waves of fierce windstorms hit France, Germany, Switzerland, Spain and several other Western European countries, killing dozens of people and damaging infrastructure. The impact of the wind was so intense in France that it inflicted considerable damage to the French public transport network and the electric power networks, leaving millions of people without electricity for several days (ABC News, 1999). More recently, Hurricane Katrina devastated New Orleans late August 2005, destroying most of the infrastructure of the city and leaving tens of thousands of people homeless for weeks.
Central America and Florida are annually exposed to floods and hurricanes, which take many lives and damage infrastructure. Recently, the impact analysis of hurricanes on the US southeastern states has received a great deal of attention. In particular, an investigation of the consequences of Hurricane Hugo on the South Carolina electric power grid and communications systems are reported in Davidson et al. (2003) and Griswold et al. (1990), respectively. A review of the evacuation policies and practices is provided by Wolshon et al. (2005).
The integrity of critical infrastructures is at risk worldwide not only because of the growing frequency of extreme events of natural causes, but also because they are increasingly vulnerable to local disturbances. This is, in part, due to the strong reliance of critical infrastructure on each other, which may turn a local disturbance in one of them into a large-scale failure via cascading events that have catastrophic consequences on society as a whole. For instance, the normal operation of water, telecommunications, transportation, and banking systems is maintained only if there is a steady supply of electric energy. On the other hand, the generation and delivery of electric power cannot be ensured without the provision of fuel, water, and various telecommunications and computer services for data transfer and control purposes to the power plants and networks.
Recognising this fact, President Clinton’s Commission on Critical Infrastructure Protection issued a report in 1997 (Clinton, 1996) that highlighted the need for conducting investigations on the vulnerabilities induced by infrastructure interdependencies and called for a thorough analysis of the roles that they play in exacerbating cascading failures across interdependent infrastructures. As expected, this report triggered a growing number of research activities and studies in this area. A milestone has been achieved with the paper authored by Rinaldi et al. (2001), which outlines the foundation of a new science that relies on a host of theories and methods ranging from risk assessment and management to agent-based complex adaptive systems. A comprehensive classification of interdependencies is provided, illustrated by real-life examples. In particular, physical, cyber, logical and geographical interdependencies are defined and their potential impacts analysed. Similar concepts are investigated by Little (2003).
This paper summarises information gathered during a field investigation conducted by the authors in the spring of 2005, with the major thrust of assessing the performance of critical infrastructure systems and their respective interdependencies in coping with the hurricane impacts during the 2004 hurricane season in Florida. The investigation focused

202 J.E. Bigger, M.G. Willingham, F. Krimgold and L. Mili
on lifeline systems and organisations, which included energy (electric power, petroleum fuels, and natural gas), water (fresh, waste, and storm water), communications (cell and conventional phones, radio, and TV), and transportation (air, marine, and highway). Both public agencies and private firms were included in the study.
The geographic area covered in the study included Orlando, Florida and surrounding communities in Orange County, along with portions of Lake and Osceola counties. This area was selected because of its development as a major commercial and population centre, extensive lifeline systems, and the damage suffered from the 2004 hurricanes. The study area’s infrastructure is characterised by a mix of public and private organisations, two international airports, three rail systems (AMTRAK, CSX and Florida Southern), and is centrally located on the state’s north-south highway corridor, including Interstate I-4 and Federal highways US-441 and US-17/92.
This paper documents how intra-dependencies within a critical infrastructure, and interdependencies between and among critical infrastructures, affected their operations and serviceability during and after three hurricanes struck the area. It identifies lessons that, if integrated into the organisation’s emergency procedures, will enhance an understanding of the roles that interdependencies play, and it outlines how changes in emergency plans and procedures can be implemented before, during and after future hurricanes to improve lifeline performance, reliability and restoration.
The paper is organised as follows: Section 2 deals with the hurricane activities of the 2004 season in Florida. Section 3 describes the field investigation methodology. Section 4 analyses the dependent infrastructure relationships while Section 5 is devoted to the interdependent infrastructure relationships and provides examples of cascading failures across lifeline infrastructures. Section 6 evaluates the main failure impacts on lifeline infrastructures. Finally, Section 7 provides a summary of the information analysis in the four studied critical infrastructures.
2 The 2004 Atlantic hurricane season
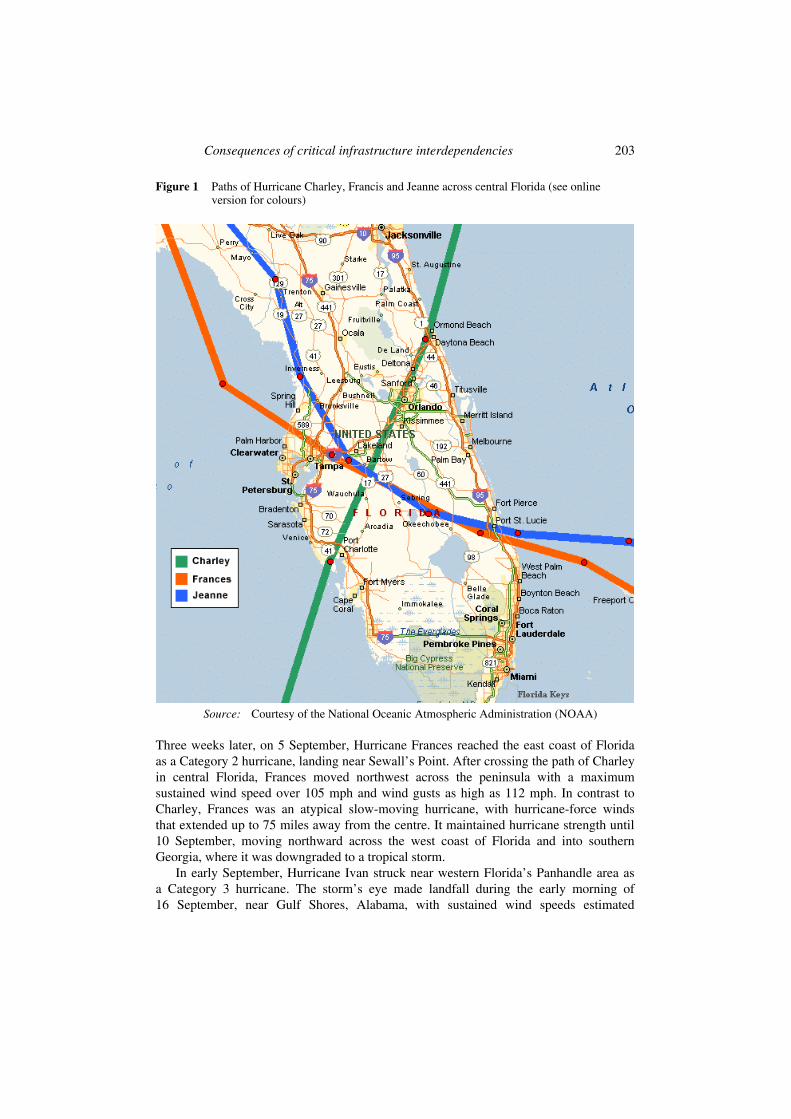
The 2004 Atlantic hurricane season was above average in activity, with 15 named storms and 9 hurricanes. For the State of Florida, it was a particularly devastating season with four hurricanes making landfall in the state over a period of 45 days. According to the Insurance Information Institute and National Hurricane Survival Institute records through December 2004, Hurricanes Charley, Ivan, Frances and Jeanne ranked as the second, third, fifth and sixth most costly hurricanes in US history (Bigger et al., 2006). Figure 1 shows the paths across central Florida taken by Hurricanes Charley, Francis and Jeanne. A brief description of each hurricane’s characteristics follows.
Hurricane Charley made landfall at Cayo Costa, a barrier island just west of Cape Coral, as a Category 4 (Saffir-Simpson Hurricane Scale) storm at approximately 3:45 PM EDT on Friday, 13 August 2004. Maximum winds were estimated at 145 mph, with a minimum central pressure of 941 millibars. Charley continued its track northeast across DeSoto, Hardee, Polk and Osceola counties. Charley took approximately 9 h to traverse the Florida peninsula from the southwest to the northeast coast. For a very brief time, until the arrival of Hurricane Ivan, Charley held the honour as the strongest hurricane to make landfall in the state since Hurricane Andrew in 1992.
Consequences of critical infrastructure interdependencies 203
Figure 1 Paths of Hurricane Charley, Francis and Jeanne across central Florida (see online version for colours)
Source: Courtesy of the National Oceanic Atmospheric Administration (NOAA)
Three weeks later, on 5 September, Hurricane Frances reached the east coast of Florida as a Category 2 hurricane, landing near Sewall’s Point. After crossing the path of Charley in central Florida, Frances moved northwest across the peninsula with a maximum sustained wind speed over 105 mph and wind gusts as high as 112 mph. In contrast to Charley, Frances was an atypical slow-moving hurricane, with hurricane-force winds that extended up to 75 miles away from the centre. It maintained hurricane strength until 10 September, moving northward across the west coast of Florida and into southern Georgia, where it was downgraded to a tropical storm.
In early September, Hurricane Ivan struck near western Florida’s Panhandle area as a Category 3 hurricane. The storm’s eye made landfall during the early morning of 16 September, near Gulf Shores, Alabama, with sustained wind speeds estimated
204 J.E. Bigger, M.G. Willingham, F. Krimgold and L. Mili
at 121 mph. With the strongest winds occurring near the Alabama-Florida border, Hurricane Ivan was directly responsible for 14 deaths in Florida, and caused significant damage along the coast near Pensacola, including overland flooding in some watersheds.
Finally, ten days after Hurricane Ivan and following a similar path to Frances, Hurricane Jeanne struck central Florida as a Category 3 hurricane. Jeanne caused additional wind and flood damage along its slow-moving and wide-ranging path, and added to the flood and wind damage produced just three weeks earlier by Hurricane Frances. Jeanne weakened to a tropical storm over central and northwestern Florida while turning northward, and further weakened to a depression over Georgia on 27 September.
3 Field investigation methodology
The approach used for this empirically based study was primarily direct interviews supplemented by review of relevant after-action, lessons learned, and other reports. Personnel from a total of 18 lifeline organisations that provide service in the selected impact area in central Florida were interviewed. Field interviews were conducted to elicit and document the selected organisation’s activities and timelines for the event sequence from pre-hurricane through post-hurricane activities, including loss of service and stakeholder experience with lifeline interdependencies. The approach used for selecting organisations for collecting field data included the following:
1 A list of candidate organisations was prepared prior to initial telephone contacts, based on an inventory of critical lifeline organisations in the study area.
2 Telephone contact was made at each organisation to:
• introduce the project and team
• elicit participation in the project
• outline types of information sought
• outline the types of personnel desired for the interviews
• describe information handling
• schedule the on-site interviews.
3 In parallel with the on-site interviews, the project team examined relevant publicly available documents generated by regional, state and federal organisations to help identify interdependencies and obtain quantitative metrics for loss of service and economic impacts.
The questions asked of the interviewees were grouped into seven main topic areas: hurricane impact; sequence of events; operation during emergency; priorities for service restoration; upstream dependencies; critical downstream services; and recovery and restoration processes.
The interviews were generally from 1 to 2 h in duration. The interviewees in each session ranged from maintenance, operating, engineering, and management personnel and in one instance, the utility CEO; however, not all types of personnel were present in each session. Prior to the interviews, it was agreed that the interviewees would not be identified in the report.
Consequences of critical infrastructure interdependencies 205
Three types of information were obtained from the interviewees:
1 direct experience of the individuals during the periods of interest
2 personal observations made regarding other related activities both within and outside the interviewees’ organisation
3 information received from others and the organisation’s communication systems.
4 Infrastructure failures
4.1 Root causes of the failures
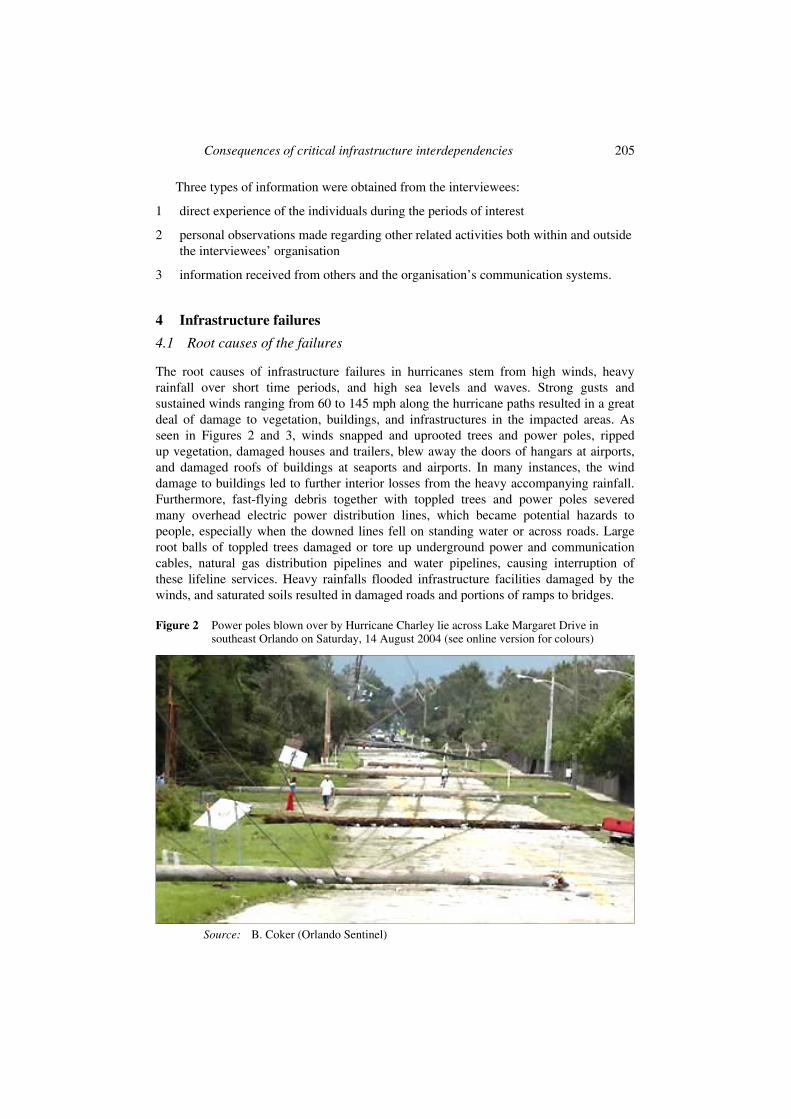
The root causes of infrastructure failures in hurricanes stem from high winds, heavy rainfall over short time periods, and high sea levels and waves. Strong gusts and sustained winds ranging from 60 to 145 mph along the hurricane paths resulted in a great deal of damage to vegetation, buildings, and infrastructures in the impacted areas. As seen in Figures 2 and 3, winds snapped and uprooted trees and power poles, ripped up vegetation, damaged houses and trailers, blew away the doors of hangars at airports, and damaged roofs of buildings at seaports and airports. In many instances, the wind damage to buildings led to further interior losses from the heavy accompanying rainfall. Furthermore, fast-flying debris together with toppled trees and power poles severed many overhead electric power distribution lines, which became potential hazards to people, especially when the downed lines fell on standing water or across roads. Large root balls of toppled trees damaged or tore up underground power and communication cables, natural gas distribution pipelines and water pipelines, causing interruption of these lifeline services. Heavy rainfalls flooded infrastructure facilities damaged by the winds, and saturated soils resulted in damaged roads and portions of ramps to bridges.
Figure 2 Power poles blown over by Hurricane Charley lie across Lake Margaret Drive in southeast Orlando on Saturday, 14 August 2004 (see online version for colours)
Source: B. Coker (Orlando Sentinel)

206 J.E. Bigger, M.G. Willingham, F. Krimgold and L. Mili
Figure 3 A toppled tree on Cree Trail in the Indian Hills neighbourhood of south Seminole County (see online version for colours)
Source: Courtesy of Jennifer Clayton, 19 August 2004
4.2 Infrastructure dependent relationships
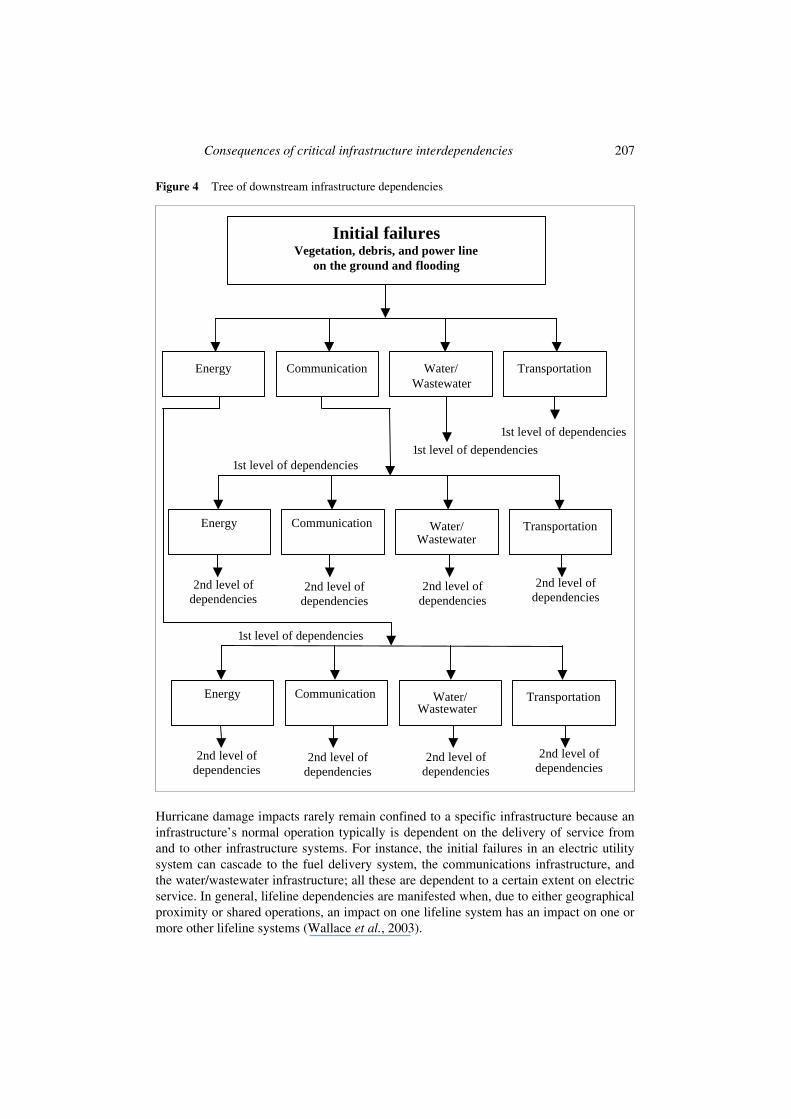
Following Rinaldi et al. (2001) and Peerenboom et al. (2001), we shall make a distinction between dependencies and interdependencies among infrastructures and their customers. A dependent relationship is defined as a basic lifeline service, such as a supplier-customer relationship. Specifically, in the event of a problem or failure in the lifeline, the product or service to the customers and to a second infrastructure can be degraded or interrupted. In addition to service connections to customers, there can be a large number of service connections between any two lifelines in a specific area. These interconnections between lifelines can lead to failures cascading to other infrastructures. To indicate the number of downstream infrastructures involved in a causal chain of service losses initiated by a single failure and leading to one or more downstream infrastructure failures, we can say that this process results from a first order, a second order, a third order dependency effect, and so forth. To make this concept clearer, we introduce a tree of downstream infrastructure dependencies and define a first order dependency failure as one that cascades from an initial infrastructure to a downstream one, a second order dependency failure as one that results from a sequence of two successive infrastructure failures, and in general an nth order dependency failure as one stemming from {n} cascading infrastructure failures subsequent to an initial event. This tree is depicted in Figure 4.
Consequences of critical infrastructure interdependencies 207
Figure 4 Tree of downstream infrastructure dependencies
Hurricane damage impacts rarely remain confined to a specific infrastructure because an infrastructure’s normal operation typically is dependent on the delivery of service from and to other infrastructure systems. For instance, the initial failures in an electric utility system can cascade to the fuel delivery system, the communications infrastructure, and the water/wastewater infrastructure; all these are dependent to a certain extent on electric service. In general, lifeline dependencies are manifested when, due to either geographical proximity or shared operations, an impact on one lifeline system has an impact on one or more other lifeline systems (Wallace et al., 2003).
2nd level ofdependencies
2nd level ofdependencies
Initial failuresVegetation, debris, and power line
on the ground and flooding
Water/Wastewater
1st level of dependencies1st level of dependencies
2nd level ofdependencies
2nd level ofdependencies
2nd level ofdependencies
Energy Communication Transportation
Water/Energy Communication Transportation
2nd level ofdependencies
2nd level ofdependencies
Water/Energy Communication Transportation
2nd level ofdependencies
1st level of dependencies
1st level of dependencies
Wastewater
Wastewater
208 J.E. Bigger, M.G. Willingham, F. Krimgold and L. Mili
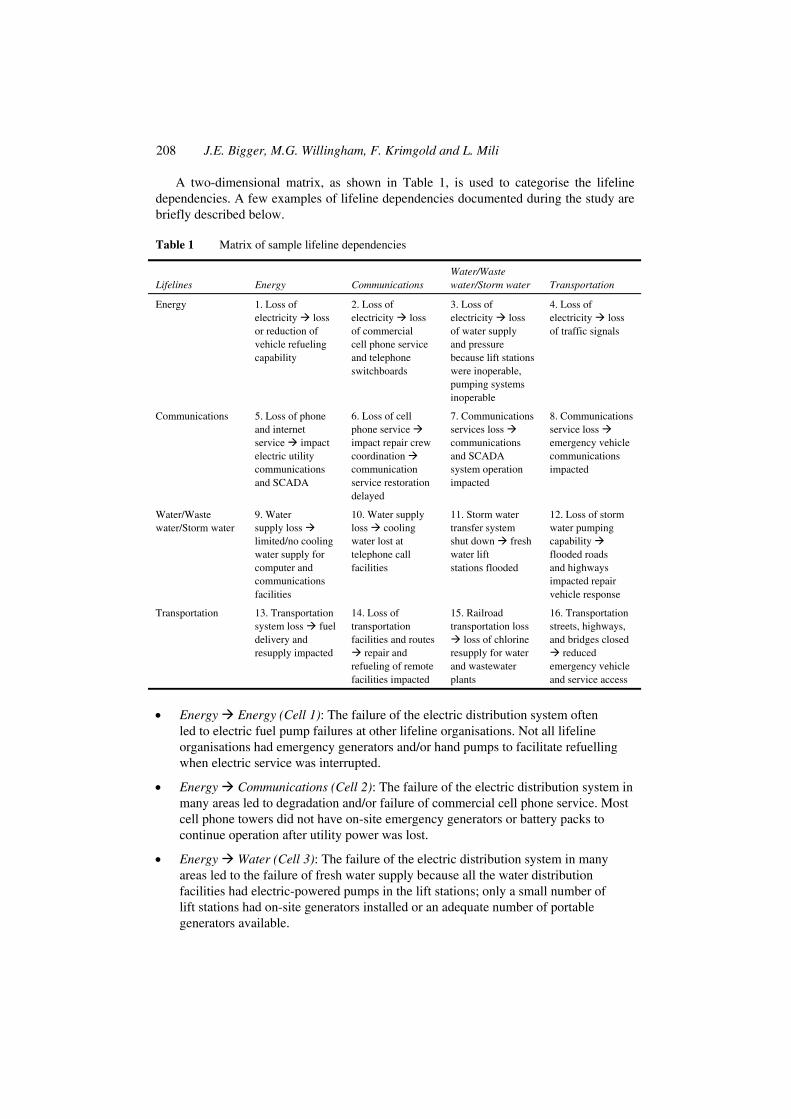
A two-dimensional matrix, as shown in Table 1, is used to categorise the lifeline dependencies. A few examples of lifeline dependencies documented during the study are briefly described below.
Table 1 Matrix of sample lifeline dependencies
Lifelines Energy Communications Water/Waste water/Storm water Transportation
Energy 1. Loss of electricity loss or reduction of vehicle refueling capability
2. Loss of electricity loss of commercial cell phone service and telephone switchboards
3. Loss of electricity loss of water supply and pressure because lift stations were inoperable, pumping systems inoperable
4. Loss of electricity loss of traffic signals
Communications 5. Loss of phone and internet service impact electric utility communications and SCADA
6. Loss of cell phone service impact repair crew coordination communication service restoration delayed
7. Communications services loss communications and SCADA system operation impacted
8. Communications service loss emergency vehicle communications impacted
Water/Waste water/Storm water
9. Water supply loss limited/no cooling water supply for computer and communications facilities
10. Water supply loss cooling water lost at telephone call facilities
11. Storm water transfer system shut down fresh water lift stations flooded
12. Loss of storm water pumping capability flooded roads and highways impacted repair vehicle response
Transportation 13. Transportation system loss fuel delivery and resupply impacted
14. Loss of transportation facilities and routes
repair and refueling of remote facilities impacted
15. Railroad transportation loss
loss of chlorine resupply for water and wastewater plants
16. Transportation streets, highways, and bridges closed
reduced emergency vehicle and service access
• Energy Energy (Cell 1): The failure of the electric distribution system often led to electric fuel pump failures at other lifeline organisations. Not all lifeline organisations had emergency generators and/or hand pumps to facilitate refuelling when electric service was interrupted.
• Energy Communications (Cell 2): The failure of the electric distribution system in many areas led to degradation and/or failure of commercial cell phone service. Most cell phone towers did not have on-site emergency generators or battery packs to continue operation after utility power was lost.
• Energy Water (Cell 3): The failure of the electric distribution system in many areas led to the failure of fresh water supply because all the water distribution facilities had electric-powered pumps in the lift stations; only a small number of lift stations had on-site generators installed or an adequate number of portable generators available.

Consequences of critical infrastructure interdependencies 209
• Energy Transportation (Cell 4): The failure of the electric distribution system in some areas led to the loss of local traffic signals. This situation necessitated a mix of short-term measures including: placing four-way stop signs at critical intersections, which considerably slowed traffic (including lifeline repair vehicles); installing portable emergency generators at critical intersections to power the traffic signals and refuelling them every few hours; and stationing law enforcement or Florida National Guard personnel at intersections for traffic control.
• Communications Communications (Cell 6): The loss of commercial cell phone service impacted repair crew coordination within individual companies and between public agencies and private communication company repair crews.
• Communications Water (Cell 7): The loss of commercial phone and communication services impacted water system controls and sensors. Commercial phone lines are used for a number of environmental and system status sensors where the lifeline organisations do not have their own communication systems.
5 Infrastructure interdependent relationships
5.1 Closed-loop interdependent relationships
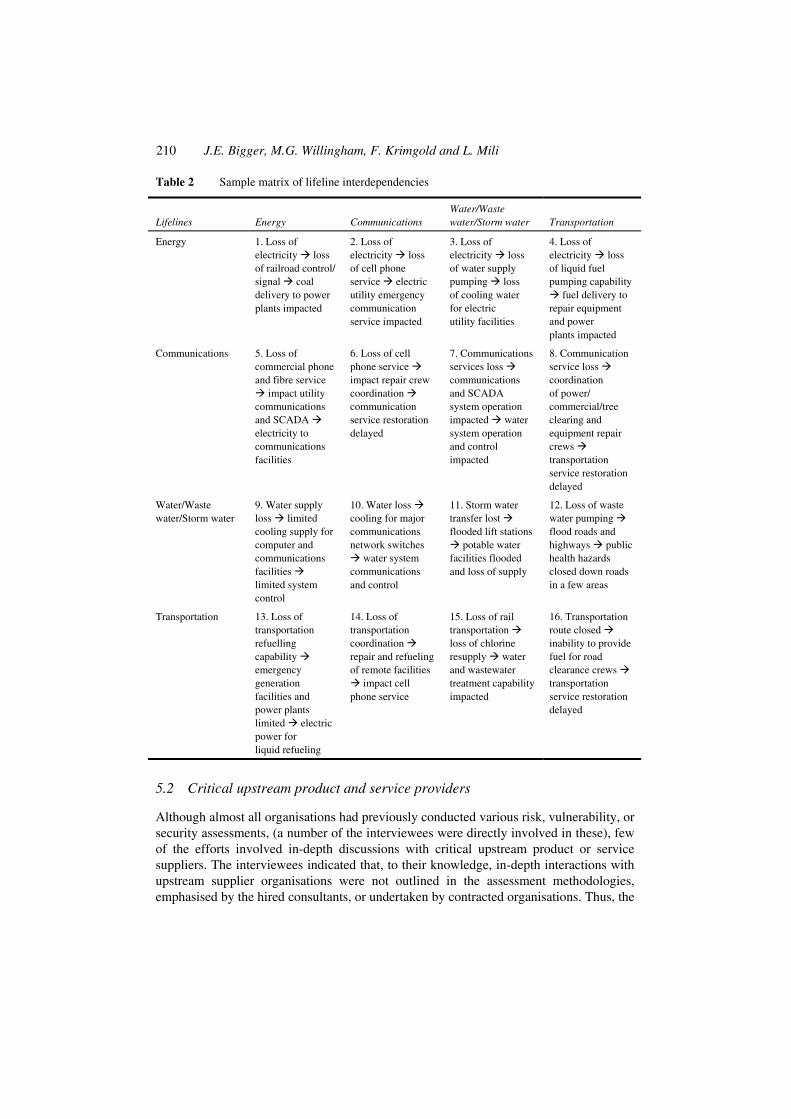
Again, following the definitions of Peerenboom et al. (2001; Rinaldi et al., 2001), a closed-loop, interdependent relationship results when one lifeline system provides a product or service to a second lifeline, which in turn supplies the first with a critical product or service. A sample matrix of closed-loop lifeline interdependencies identified in this study is shown in Table 2.
Descriptions of three of the examples shown in Table 2 are expanded below:
• Energy Transportation Energy (Cell 1): The failure of the electric distribution system in an area led to the failure of local railroad control signals and highway-railroad crossing signals, causing railroad traffic through that area to be curtailed. When the railroad could not deliver coal to coal-fired utility power plants in central and southern Florida, the utility electric generating plant production was affected.
• Energy Communications Energy (Cell 2): The failure of the electric distribution system in some areas led to a reduction or total loss of commercial cell phone service in these same areas. Many electric and natural gas utilities depend upon commercial cell service for part of their communication and coordination of repair crews and tree removal contractors to get the distribution system back up and operating. Cell phone service failure produced ‘dead spots’ that hampered communications.
• Communications Communications Communications (Cell 6): Loss of cell and radio tower operations impacted the communication and coordination of equipment repair and system restoration crews. This delayed restoration of commercial communications service to both lifeline organisations and retail customers.
210 J.E. Bigger, M.G. Willingham, F. Krimgold and L. Mili
Table 2 Sample matrix of lifeline interdependencies
Lifelines Energy Communications Water/Waste water/Storm water Transportation
Energy 1. Loss of electricity loss of railroad control/ signal coal delivery to power plants impacted
2. Loss of electricity loss of cell phone service electric utility emergency communication service impacted
3. Loss of electricity loss of water supply pumping loss of cooling water for electric utility facilities
4. Loss of electricity loss of liquid fuel pumping capability
fuel delivery to repair equipment and power plants impacted
Communications 5. Loss of commercial phone and fibre service
impact utility communications and SCADA electricity to communications facilities
6. Loss of cell phone service impact repair crew coordination communication service restoration delayed
7. Communications services loss communications and SCADA system operation impacted water system operation and control impacted
8. Communication service loss coordination of power/ commercial/tree clearing and equipment repair crews transportation service restoration delayed
Water/Waste water/Storm water
9. Water supply loss limited cooling supply for computer and communications facilities limited system control
10. Water loss cooling for major communications network switches
water system communications and control
11. Storm water transfer lost flooded lift stations
potable water facilities flooded and loss of supply
12. Loss of waste water pumping flood roads and highways public health hazards closed down roads in a few areas
Transportation 13. Loss of transportation refuelling capability emergency generation facilities and power plants limited electric power for liquid refueling
14. Loss of transportation coordination repair and refueling of remote facilities
impact cell phone service
15. Loss of rail transportation loss of chlorine resupply water and wastewater treatment capability impacted
16. Transportation route closed inability to provide fuel for road clearance crews transportation service restoration delayed
5.2 Critical upstream product and service providers
Although almost all organisations had previously conducted various risk, vulnerability, or security assessments, (a number of the interviewees were directly involved in these), few of the efforts involved in-depth discussions with critical upstream product or service suppliers. The interviewees indicated that, to their knowledge, in-depth interactions with upstream supplier organisations were not outlined in the assessment methodologies, emphasised by the hired consultants, or undertaken by contracted organisations. Thus, the
Consequences of critical infrastructure interdependencies 211
vulnerabilities and failures that a lifeline organisation’s critical upstream suppliers might be subject to were not well known or understood. Two examples of this situation are briefly described.
Example 1: Some, but not all, of the electric generating plants in the Florida area have the capability of using multiple fuels such as coal or oil at steam plants, and natural gas or fuel oil at peaking and intermediate gas turbine plants. When one fuel is in short supply, fuel switching is possible. In 2004, however, even this flexibility proved inadequate. Following Hurricane Charley, the railroads were unable to deliver coal and other emergency supplies through the hurricane-impacted areas in the central part of the state; this was a result of electric distribution systems failed and railroad control signals and highway safety signals became inoperable. In addition to limited rail operation, the closing of Port Canaveral due to silting and the inability of Tampa Bay to receive shipments of liquid fuels due to the threat of another imminent hurricane meant that electric generating plants had difficulty receiving supplies of either fuel.
Example 2: At one point, electric power from generating plants, fueled by natural gas in central and southern Florida, were close to curtailment because gas production facilities in the eastern Gulf of Mexico had been shut down due to concerns about Hurricane Ivan. Thus, the gas transmission facilities were not operating at capacity. Those generating plants that had the capability and stored fuel switched to oil, but the on-site storage capacity of oil at the power plants was limited. This dilemma indicates that even having dual-fueled electric generating plants in the region is no guarantee of continued electric power production. The supply chains for all fuels need to be examined carefully to ensure that fuel is available and that a sufficient supply can be stored or obtained to support operation of the plants during extended emergency situations.
Another aspect regarding upstream support was brought up by interviewees at more than one organisation. When preparing for a hurricane, it is common practice for many water and electric utilities to pre-position equipment (e.g., bucket trucks, winch trucks, and conductor reel trucks) and repair parts (e.g., power poles, cables, pipe, and conductors, etc.) away from one central facility. This includes both an organisation’s own resources and those brought in under mutual aid contracts. This is normally done for two reasons:
1 to reduce the risk of central equipment and parts repositories being wiped out or extensively damaged
2 to locate critical equipment and parts nearer the expected impact area to reduce service recovery and restoration times.
Due to the large amount of storm water and the failure of various electric distribution systems, especially during Hurricane Charley, many storm water lift stations failed and a few of the equipment pre-positioning sites, or their access roads, were flooded. As a result, equipment and spare parts were not accessible to repair crews until after the storm water had been drained away. A more thorough examination of the physical characteristics and vulnerabilities of these ‘strategic’ pre-positioning sites is needed.
212 J.E. Bigger, M.G. Willingham, F. Krimgold and L. Mili
5.3 Downstream lifeline customers
Each of the lifeline organisations interviewed in this study provides critical products and services to other infrastructures. All are interconnected and interdependent – some loosely, some very tightly. The interviews indicated that in more than one situation, emergency personnel are not being informed of the critical needs of certain lifeline facilities and customers; often, this was a result of failure to get relevant information to the right people within a single organisation or between a lifeline organisation and the local Emergency Operations Center (EOC) staff. When emergency operations and disaster plans are reviewed, service restoration priorities are usually reviewed. However, updating downstream service requirements to critical lifeline facilities and customers is not always included. Moreover, it was found that such review and updating is not always done on an annual basis.
During and after any disaster event, the ‘First Tier’ facilities slated for priority service restoration by lifeline organisations – both public and private – usually include the following: public safety (police, fire, EMT, 911 call centres, and EOC); emergency medical facilities (hospitals and short-term medical treatment facilities); emergency, public, and commercial communications facilities; and special care facilities, (e.g., storm shelters, schools used for shelters, and nursing homes). Lists of vulnerable population facilities are usually maintained at the EOC and/or by police, fire, utility, emergency services, or social services personnel in an area. However, it was found that lists of other vulnerable persons (e.g., those in private homes with special electric, gas, or water associated medical equipment) are not always available or up-to-date and, therefore, are not used in developing or changing the priorities of service restoration by energy or water organisations.
‘Second Tier’ restoration lists may have a wide range of organisations/priorities. Most organisations did not directly involve customers, whether public or private, in the establishment of priorities below those concerned with public safety and health.
In many instances, restoration was implemented by returning service to the largest number of customers after restoration of service to the above-noted public health and safety categories was completed. Also, different jurisdictions had different restoration priorities. In one area, residential service came first while in an adjacent area, it was commercial service that had priority. Absent any comprehensive programme to focus on the primacy of lifelines, along with the requisite training to systematically and quantitatively address weaknesses in current policies, this situation will continue to prevail.
5.4 Point failures and area impacts
Over many decades, electric, natural gas, and water utilities; communication companies; petroleum distribution companies; and various transportation agencies have independently developed, expanded, and (often without fully understanding the consequences) linked their specific systems in response to customer requirements and economic limits. While failure at a single point in one lifeline may impact customers in a specific area, interdependencies with other lifelines can affect customers located in entirely different areas. Thus, a point failure at one location can adversely affect a large numbers of customers connected to different utilities. Several examples of this phenomenon were identified during the interviews:

Consequences of critical infrastructure interdependencies 213
First, when an electric utility’s distribution system failed in a specific service area, its direct customers in that area lost power. If that same service area housed one or more cell phone towers providing phone service to a geographically different service area, the loss of electric power also dictated loss of communications services for the cell phone customers.
A second example also started with an electric failure in one area. In addition to the customers impacted in a distribution system area, the system served a feeder that supplied power to a number of nearby storm water lift stations. When the electric power failed, the lift stations shut down and an area flooded, blocking highways and roadways and forcing traffic to be rerouted around the flooded areas until the lift stations were put back into operation. Again, just counting the electric customers directly impacted by the power outage does not provide a complete or accurate picture of the impact.
6 Failure impacts
6.1 General findings
When one reads of infrastructure failures in the popular press, as the result of a natural or technical disaster, the direct impacts are generally reported in the form of a specific infrastructure’s customers that have lost service, the feet/miles of water or gas pipeline out of service, the spans of telephone cable that have been brought down, etc.
Regardless of the infrastructure, a failure at a single point normally results in a number of customers losing service. The usual way of quantifying the impact of such a failure is counting the number of customers directly impacted by the specific infrastructure’s failure. However, more in-depth investigation of the impacted service area almost always can identify a larger number of persons, organisations, and facilities impacted because of the initial failure’s propagated to other infrastructures.
This cascading of the initial failure can be traced into a number of other infrastructure systems. This is regardless of which infrastructure one starts with: communications, energy, transportation or water. Thus, in general, just counting the number of direct customers that lost service from a specific infrastructure can significantly underestimate the impact of an infrastructure failure.
6.2 Project examples
First, using the electric distribution system failure as an example, one can trace the impact downstream from the point of the electrical safety device action (e.g., blown fuse, opened circuit breaker, etc.) to a variety of customers that can include other electric system facilities/equipment and those of other infrastructures (e.g., communications, water, transportation, etc.)
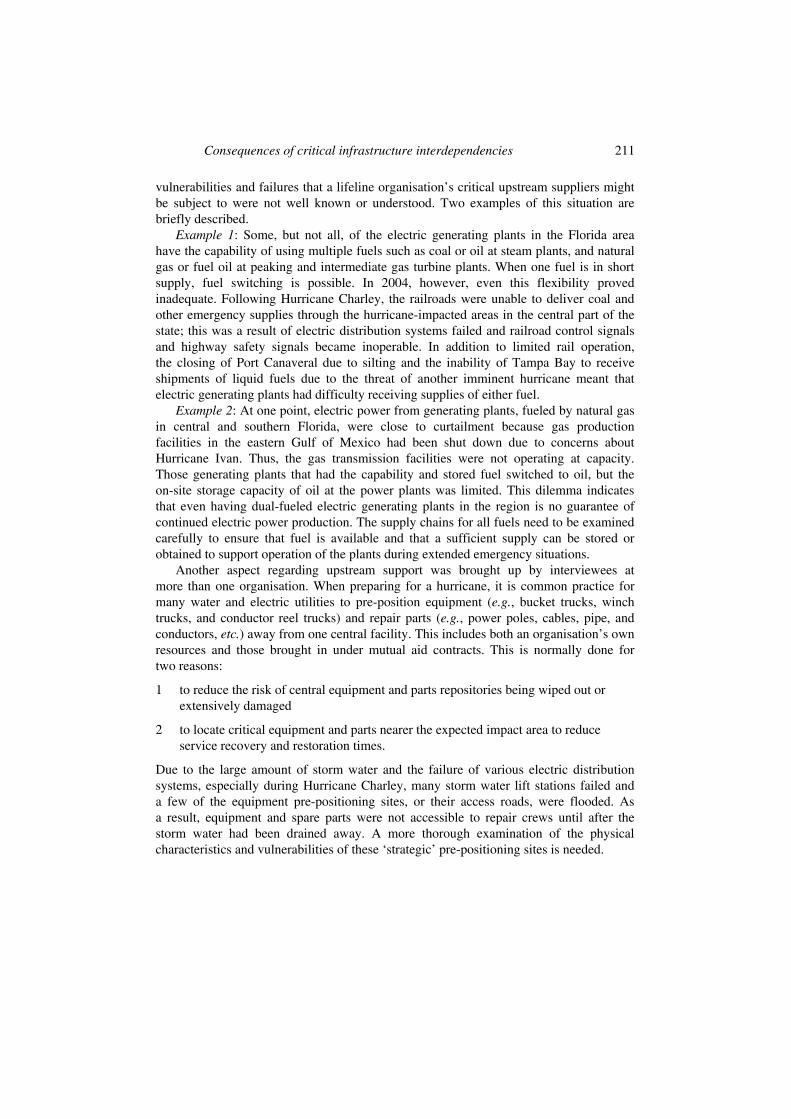
Figure 5 is a representative drawing that illustrates one of the types of examples found at almost every electric utility interviewed in the project. These examples are found most commonly in areas where an electric feeder(s) serves a combination residential-commercial area. The figure illustrates that a point failure at Location A interrupts electric service in the white area. This area also provides services to
214 J.E. Bigger, M.G. Willingham, F. Krimgold and L. Mili
transportation (traffic lights along a highway – cross-hatched area), communications (a cell phone tower – shaded area), and water (a distribution lift station – vertical lines) infrastructure facilities.
Figure 5 Electric distribution failure impact areas
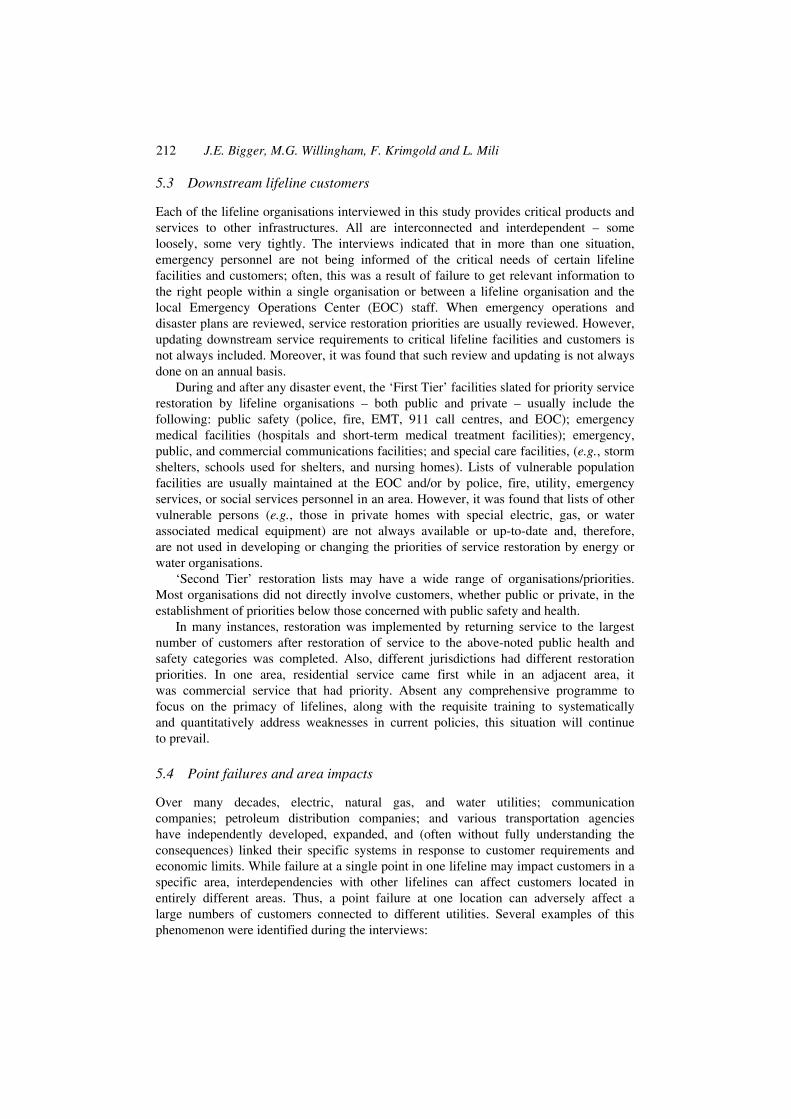
Second, using the water distribution system as another example, a pipeline failure at point B, in Figure 6 directly impacts water customers in the white area. This area also includes services to emergency services (emergency medical facility – cross-hatched area), and communications (cooling water to a major telephone company central office – shaded area) infrastructure facilities.
Figure 6 Water distribution failure impact areas
6.3 Infrastructure failures and area impacts
Because the infrastructure organisations and their facilities have developed and expanded independently over the past decades, when one infrastructure fails the impacted area does not coincide with that of a second infrastructure that the failure can cascade into. Because individual infrastructure organisations can have hundreds and even thousands of individual areas served by individual electric feeders, water and gas distribution system
Elec.
Transportation
Water Comm’s
Water Emerg. Services Comm’s

Consequences of critical infrastructure interdependencies 215
pipes, individual cable runs (copper or fibre), or individual transportation routes, examining each individual area for interdependency and/or cascading potential can be a very large effort to undertake. This is especially true where complete infrastructure information is not available via an electronic or GIS-based database. And even if the paper information has been converted to electronic, the different electronic databases and tools used are neither compatible nor available for examination.
What the ‘bottom-up’ approach of this project has again demonstrated is that efforts to identify and individual infrastructure’s interdependencies is a very significant effort. These findings have shown that the development of infrastructure interdependency and cascading failure templates to quickly identify examples are a critical step in the effort to increase resilience of both public agencies and jurisdictions and infrastructure organisations and their facilities.
6.4 Toll on emergency workers
Although not initially emphasised in the interviews, executives, managers, and supervisors are only beginning to recognise the physical, mental, and emotional toll that a schedule of ‘12 h on–12 h off’ for many weeks has on their employees and themselves. Many organisations mentioned that managers and supervisors need better training to enable them to identify and understand the signs of severe physical, mental, and emotional fatigue. One organisation interviewed reported one suicide and two hospitalisations among its employees due to stress.
Most critical of all, interviewed personnel indicated they were neither able to completely rest nor to repair their own homes before they had to begin preparation for the next hurricane. Several interviewees mentioned that organisations also needed better rewards to recognise major efforts by both their own employees and contract workers; ‘…a baseball cap, a T-shirt and an afternoon barbecue were felt to be inadequate.’
7 Information analysis summary
When a lifeline system partially fails, it can cause failures and impacts in every other lifeline system. If an entire lifeline system in a large area goes down, the magnitude and complexity of that impact can increase significantly, and as outage time increases the cost and complexity of recovery and restoration also increases significantly. Identifying interdependencies, whether cascading or feedback, presents opportunities to interrupt failures and keep vital services in operation. Samples of these efforts are briefly described below.
7.1 Energy
7.1.1 Emergency and portable electric generators
Most organisations interviewed indicated that they have, or will be, purchasing additional portable and fixed emergency generators for critical facilities. The interviewees indicated that the number being purchased by each organisation ranged from a half dozen to a few hundred units. On a cumulative basis, public and private organisations in the survey area report they plan to purchase a few thousand portable and fixed emergency generating

216 J.E. Bigger, M.G. Willingham, F. Krimgold and L. Mili
units. However, in addition to maintaining vital lifeline services, these additional units will significantly add to each organisation’s maintenance and testing burden. Experience has shown that if periodic maintenance is not implemented, including full-load testing, the reliability and capability of these units will drop precipitously.
7.1.2 Refuelling emergency and portable generators
Most of the portable generators being procured are in the 1 to 15 kW size range. Most are gasoline-powered; a few are fuelled by propane or Liquefied Petroleum Gas (LPG). Permanently installed emergency generators (usually less than 1 MW) are typically diesel-fuelled, although a number of smaller natural gas units have been installed.
The smaller gasoline-fuelled units usually have fuel tanks that support operation about four to ten hours before refuelling. As the number of emergency and portable generators increases, maintaining integrity of the fuel supply chain – from port or wholesale distribution point to end customer – takes on greater significance.
Following Hurricane Charley, for example, Florida Governor Jeb Bush directed Florida Highway Patrol troopers to escort fuel trucks to speed their deliveries. The presence of hundreds of trucks filled with gasoline, propane, LPG, and diesel fuel in a disaster impact area is expected to eventually cause emergency authorities to recognise the inherent risk of such a practice. It was found that local and regional emergency managers are generally unaware of most fuel distribution organisations, including their delivery networks, routes, and customer locations. As a consequence, these organisations are not identified in government (city, county, or region) emergency operating plans. This issue was cited by Grimsley Oil Co., a bulk diesel and gasoline dealer that supplies the City of Wauchula and Hardee County (Leposky, 2005). According to the supplier, “… the local EOC never included his company in its planning, and had no idea what his service delivery requirements were or how the community might depend on his services”.
Interdependency was also demonstrated with the closing of the seaports in Florida, including Tampa, Port Canaveral, Port Everglades, and Jacksonville. These closures disrupted the delivery of not only petroleum and coal, but also of chemicals and emergency materials. This prompted the Florida Department of Transportation to organise twice-daily teleconferences with the state EOC to discuss ways to overcome the disruption.
7.2 Transportation
Standard practice for traffic signals and controls provides that both highway traffic signals and railroad warning signals and controls are connected to the closest electric distribution circuit by a single feed. Because of the number of signals involved, this practice is the most cost-effective. When electrical power distribution systems fail partially or totally, the default solution for keeping traffic flowing is very labour-intensive: hundreds of National Guard personnel, city, county, and state police officers and traffic personnel need to be deployed during the early recovery and restoration periods to keep traffic moving.
A number of organisations responsible for street and highway signals and controls are beginning to seek alternative methods to either keep units operating or quickly restore them to full functionality in the event of a power outage. During the interviews,
Consequences of critical infrastructure interdependencies 217
the following approaches were noted as being studied or implemented: retrofitting signals with LEDs and signal controllers with transfer switches; installing reliable and dedicated electric feeders; and purchasing additional emergency generators.
The central Florida regional transit company LYNX experienced similar energy dependency. With some 250 buses and 200 vehicles operating under contract for the Para-transit service, LYNX is the seventy-seventh largest transit system in the country. One of the key tasks assigned to its emergency personnel was to ensure fuelling at critical maintenance facilities. Normally, a one-and-a-half to two-day fuel supply is stored on LYNX grounds. However, the closing of major ports in concert with EPA limits to current underground storage (40 000 gallons for the Transit Authority facility sites), placed the transit system in jeopardy. Although the storage system could be expanded to anticipate future emergencies, increased storage capacity will invoke a new permitting and regulatory protocol.
7.3 Communications
Communications systems are critical to public safety and the continued operation of all other lifelines. Simply having a second technology in an organisation’s communication programme may be insufficient; a comprehensive back-up plan, with pre-negotiated contracts with suppliers, should be in place for each technology sector.
The annual spring Florida State and county emergency exercises do not sufficiently exercise the communication systems. There is a range of emergency exercises available to test systems and train personnel including process and procedure reviews; tabletop exercises; functional; and full-scale exercises. Each requires different preparation, resources, and time to conduct. Merely reviewing processes and procedures, however, does not increase confidence in the hardware and software components of communications systems. Due to the critical nature of the communications systems, lifeline organisations should conduct exercises that power up and thoroughly test the various primary and backup systems, both internally and with external organisations.
7.4 Water, wastewater and storm water
Potable water, wastewater, and storm water lifeline systems are good examples of where a lengthening, unremediated failure increases the impact and complexity of restoration. Meeting federal, state, and local regulatory requirements for these systems grows more complicated the longer the system is down. And the shutdown of both lifeline and customer computer and communications installations due to lack of cooling water may be necessary if service is interrupted, even for short periods of time (minutes to hours). Closure and evacuation of medical facilities may be required within a few days when the water supply is interrupted, especially if such facilities have no significant water storage on site.
Storm water system failures can have almost immediate impact: the backing up of storm drains can occur in a few minutes or hours, especially when a slow-moving hurricane brings very heavy rains. Area flooding can flood freshwater, waste water, and storm water lift stations. System operators can increase resistance to flooding and facilitate rapid recovery by ensuring that emergency backup generators at key locations are strategically positioned and well-maintained, and also ensure that sufficient on-site fuel is available to survive short-term interruptions in electrical power loss.

218 J.E. Bigger, M.G. Willingham, F. Krimgold and L. Mili
8 Conclusions
This paper summarises the main outcomes of a study (Bigger et al., 2006) dealing with hurricane-related lifeline service losses in Central Florida in the 2004 hurricane season. This study has documented more specific evidence of complex interdependencies among tightly coupled critical lifeline systems. These interdependencies greatly increase the negative consequences of initial, direct, physical damage to individual components of the lifeline systems. Lifeline systems, which are designed to distribute services to support basic activities, are also capable of distributing the consequences of disaster impacts. Unidentified interdependencies can result in cascading failures within and between lifelines (Rinaldi et al., 2001; Peerenboom et al., 2001), thus increasing the impacts and complicating disaster response and recovery.
This study followed an empirical approach to identify and catalogue interdependencies among four infrastructures in the central Florida region. It also showed that investigations of lifeline systems in areas after natural disasters provide a valuable opportunity to highlight interdependencies not only to the organisations themselves but also to lifeline organisations throughout the USA, thus enabling them to take informed actions to interrupt failure paths to their critical facilities.
Acknowledgements
The authors would like to thank each of the organisations and their personnel that supported the initial Florida interdependency study (Bigger et al., 2006). Without the freely shared information, this project would not have been possible. The experiences and suggestions shared with the project team will be of value to a large number of lifeline organisations in the USA.
References
ABC News (1999) ‘France, Austria battered again’, Paris, 28 December, http://abcnwes.com/ sections/world/DailyNews/eurowea991228.html.
Bigger, J., Willingham, M., Krimgold, F. and Mili, L. (2006) Power Systems, Water, Transportation and Communications Lifeline Interdependencies, Prepared for American Lifelines Alliance, March, publication pending.
Clinton, W.J. (1996) ‘Executive Order 13010-Critical Infrastructure Protection,’ The White House, 17 July, http://www.ciao.gov.
Davidson, R.A., Liu, H., Sarpong, I.K., Sparks, P. and Rosowsky, D.V. (2003) ‘Electric power distribution systems performance in Carolina hurricanes’, Natural Hazards Review, February, pp.36–45.
Griswold, J.S., Lightle, T.L. and Lovelady, J.G. (1990) ‘Hurricane Hugo: effect on state government communications’, IEEE Communications Magazine, June, pp.12–17.
Leposky, R.E. (2005) ‘Florida towns share generators in hurricane Charley’s wake’, Distributed Energy, The Journal for Onsite Power Solutions, June, www.forester .net/de_0505_wauchula.html.
Little, R.G. (2003) ‘Toward more robust infrastructure: observations on improving the resiliency and reliability of critical systems’, National Research Council, 6–9 January, http://csdl.computer.org/comp/proceedings/hicss/2003/18742005aabs.htm.
Consequences of critical infrastructure interdependencies 219
Peerenboom, J., Fisher, R. and Whitfield, R. (2001) ‘Recovering from disruptions of interdependent critical infrastructures’, Proceedings of the CRIS/DRM/IT/NSF Workshop, Alexandria, Virginia, 10–11 September.
Rinaldi, S.M., Peerenboom, J.P. and Kelly, T.K. (2001) ‘Identifying, understanding, and analyzing critical infrastructure interdependencies’, IEEE Control Systems Magazine, December, pp.11–25.
Wallace, W.A., Mendonça, D., Lee, E., Mitchell, J. and Chow, J. (2003) ‘Managing disruptions to critical interdependent infrastructures in the context of the 2001 World Trade Center attack’, in J. Monday (Ed.) Beyond September 11th: An Account of Post-Disaster Research, Boulder, CO: Natural Hazards Research and Applications Information Center, University of Colorado.
Wolshon, B., Urbina, E., Wilmot, C. and Levitan, M. (2005) ‘Review of policies and practices for hurricane evacuation’, Natural Hazards Review, August, pp.129–161.
Copyright © 2022 FDOKUMEN