
The use of reciprocal interdependencies ... - Scholars Junction
491
Mississippi State University Mississippi State University Scholars Junction Scholars Junction Theses and Dissertations Theses and Dissertations 5-3-2008 The use of reciprocal interdependencies management (RIM) to The use of reciprocal interdependencies management (RIM) to support decision making during early stages design support decision making during early stages design Mona C. Shelton Follow this and additional works at: https://scholarsjunction.msstate.edu/td Recommended Citation Recommended Citation Shelton, Mona C., "The use of reciprocal interdependencies management (RIM) to support decision making during early stages design" (2008). Theses and Dissertations. 4689. https://scholarsjunction.msstate.edu/td/4689 This Dissertation - Open Access is brought to you for free and open access by the Theses and Dissertations at Scholars Junction. It has been accepted for inclusion in Theses and Dissertations by an authorized administrator of Scholars Junction. For more information, please contact [email protected].
-
Upload
khangminh22 -
Category
Documents
-
view
1 -
download
0
Transcript of The use of reciprocal interdependencies ... - Scholars Junction
Mississippi State University Mississippi State University
Scholars Junction Scholars Junction
Theses and Dissertations Theses and Dissertations
5-3-2008
The use of reciprocal interdependencies management (RIM) to The use of reciprocal interdependencies management (RIM) to
support decision making during early stages design support decision making during early stages design
Mona C. Shelton
Follow this and additional works at: https://scholarsjunction.msstate.edu/td
Recommended Citation Recommended Citation Shelton, Mona C., "The use of reciprocal interdependencies management (RIM) to support decision making during early stages design" (2008). Theses and Dissertations. 4689. https://scholarsjunction.msstate.edu/td/4689
This Dissertation - Open Access is brought to you for free and open access by the Theses and Dissertations at Scholars Junction. It has been accepted for inclusion in Theses and Dissertations by an authorized administrator of Scholars Junction. For more information, please contact [email protected].

THE USE OF RECIPROCAL INTERDEPENDENCIES MANAGEMENT (RIM)
TO SUPPORT DECISION MAKING DURING EARLY STAGES DESIGN
By
Mona C. Shelton
A Dissertation Submitted to the Faculty of Mississippi State University
in Partial Fulfillment of the Requirements for the Degree of Doctor of Philosophy
in Engineering in the Department of Industrial and Systems Engineering
Mississippi State, Mississippi
May 2008

Copyright by
Mona Carty Shelton
2007

THE USE OF RECIPROCAL INTERDEPENDENCIES MANAGEMENT (RIM)
TO SUPPORT DECIION MAKING DURING EARLY STAGES OF DESIGN
By
Mona C. Shelton Approved: _________________________________ _________________________________ Allen G. Greenwood Stanley F. Bullington Professor of Industrial & Systems Professor of Industrial & Systems Engineering Engineering (Director of Dissertation) Graduate Coordinator, Department of Industrial and Systems Engineering (Committee Member) _________________________________ _________________________________ Masoud Rais-Rohani John M. Usher Professor of Aerospace Engineering Professor of Industrial & Systems and Engineering Mechanics Engineering (Committee Member) (Committee Member) _________________________________ W. Glenn Steele Interim Dean of the College of Engineering

Name: Mona Carty Shelton Date of Degree: May 2, 2008 Institution: Mississippi State University Major Field: Industrial and Systems Engineering Major Professor: Dr. Allen G. Greenwood Title of Study: THE USE OF RECIPROCAL INTERDEPENDENCIES MANAGEMENT (RIM) TO SUPPORT DECISION MAKING DURING EARLY STAGES OF DESIGN Pages in Study: 466 Candidate for Degree of Doctor of Philosophy
Published works cite that 70-80% of the total cost of a product is established
during conceptual design, and that improvements in time-to-market, quality,
affordability, and global competitiveness require the development of better approaches to
assist decision-making during the early stages of product design, as well as facilitate
enterprise knowledge management and reuse.
For many years, concurrent engineering and teaming have been viewed as “the
answer” to product development woes, but studies reveal teaming is not sufficient to
handle the task complexities of product development and the long-term goal of enterprise
learning. The work of Roberto Verganti (1997) provides new insights with regard to
reciprocal interdependencies (RIs), feedforward planning, selective anticipation in the
context of improving teaming and concurrent engineering, as well as enterprise learning,
knowledge management, reuse.
In this research, reciprocal interdependencies management (RIM) is offered as a
means of addressing product development and concurrent engineering issues occurring in

the early stages of design. RIM is a combination of Verganti’s concepts, a conceptual
RIs structure, new RIM-application strategies, RIM-diagramming, and a conceptual RIM-
based decisions support system, which come together to form a vision of a RIM-based
enterprise knowledge management system. The conceptual RIM-based DSS is presented
using the specific case of supporting a working-level integrated product team (IPT)
engaged in the design of an aircraft bulkhead. A qualitative assessment tool is used to
compare RIM to other approaches in the literature, and initial results are very favorable.
Keywords: conceptual design, reciprocal interdependencies management, RIM,
reciprocal interdependencies, feedforward planning, selective anticipation,
superficial anticipation, feature-based design, feature-based cost, aircraft cost analysis,
IPT, integrated product team, working-level IPT, decision support systems, enterprise
learning, enterprise knowledge systems, early process engineering, preplanning
knowledge

ii
DEDICATION
This research is dedicated to my family, for without their love, support, and
sacrifice, none of it would have been possible. To my mother and father, Janice and
Taulbee Carty, for instilling in me the value of education, and my mother especially, for
her love of learning. To my brother Gary and his wife, Kathy, for their encouragement.
To my stepson, Gregory Shelton, and his wife, Jessica, for keeping me in their thoughts
and prayers. To my children, Afton and Geordan Strain, for encouraging me to study
even when it sometimes meant that they missed out on my attention. To my husband,
Robert Shelton, who has sacrificed many weekends, summer vacations, and holidays in
support of my educational pursuits. Without his support, love, and encouragement, none
of which would have been possible.

iii
ACKNOWLEDGMENTS
I would like to express my sincere appreciation to my major professor, Dr. Allen
Greenwood, for his encouragement and guidance throughout this process. Dr.
Greenwood has been an outstanding professor, and the knowledge gained from his
courses, as well as his publications, have proven to be invaluable to this research effort.
He has spent countless hours wading through many first draft pages, and without his
contribution and guidance, this research effort would not have been possible.
It has been said that first impressions are lasting ones, and the Department of
Industrial and Systems Engineering could not have a better ambassador to potential
graduate students than Dr. Stanley Bullington. In his role as graduate coordinator, he was
the first person that I spoke with regarding the PhD program as Mississippi State
University, and the way in which he treated me during my initial inquiries played a major
role in my decision to pursue graduate education at MSU. My sincere thanks to Dr.
Bullington for helping me choose the right graduate school, being a great professor, and
graciously serving on my committee.
My sincere gratitude is extended to Dr. John M. Usher for being one of the best
professors that I have had in my academic career, a role model for organization and hard
work, and serving on my committee. His book, Integrated Product and Process

iv
Development: Methods, Tools, and Technologies,” made lasting impression on me, and
contributed significantly to the vision for this research.
Special thanks to Dr. Masoud Rais-Rohani from the Department of Aerospace
Engineering for serving on my committee, and providing me with invaluable research
assistance. His though-provoking questions related to the research topic challenged me
and added depth to my understanding. Dr. Rais-Rohani’s writings, and those he inspired
by Dr. Peter Chapman, which were extremely beneficial in the realm of conceptual
aircraft design.
Thanks to Dennis Mohr for the contributions he made to my knowledge during
our time together at MSU and for being my friend, and also to Rusty Foster for his
unwavering support of distance education and the personal touch he added to all aspects
of his job in support of distance students. In addition, I am forever grateful for the
unwavering friendship and support of Sheila McClung as well as the many mentors and
integrated product team members who have contributed to my professional life.
Finally, I would like to thank the Department of Industrial and Systems
Engineering at Mississippi State University for providing me with the opportunity to
pursue graduate education. In particular, for making so many courses available at a
distance to accommodate working adults.

v
TABLE OF CONTENTS
DEDICATION....................................................................................................... ii ACKNOWLEDGEMENTS.................................................................................... iii LIST OF TABLES................................................................................................. v LIST OF FIGURES ............................................................................................... viii I. INTRODUCTION...................................................................................... 1
1.1 Identification of Problems and Needs.................................................... 5 1.1.1 Obstacles to Product Development Process Improvement................ 6 1.1.1.1 Sequential Task Completion and Information Exchange ............ 7 1.1.1.2 Product Development Decision Making Processes are Not Formalized ......................................................................... 7 1.1.1.3 Early Product Development Decision Making Information is Not Linked to Downstream Activities........................................ 8 1.1.1.4 Product Development Decision Making Information Guarded by Cultural and Behavioral Issues.............................................. 9 1.1.1.5 Enterprise Information Systems Do Not Support Knowledge Reuse During Early Product Development.............. 10 1.1.2 Concurrent Engineering Problems and Lack of Success ................. 12 1.1.2.1 Poor Planning and Management of Communication Linkages and Complexities....................................................... 13 1.1.2.2 Specialized Hierarchies of Knowledge ..................................... 15 1.1.2.3 Cultural Aversion to Methodical Problem Solving and Outcome Control ............................................................... 16 1.1.2.4 Cultural Bureaucracy and Systemic Complexity ....................... 18 1.2 Initial List of Research Considerations and Next Steps.......................... 18 1.3 An Executive Summary of Verganti’s Research.................................... 20 1.3.1 Definitions of Reciprocal Interdependencies ................................... 21 1.3.2 Reciprocal Interdependencies Management..................................... 26 1.3.2.1 Feedback Planning versus Feedforward Planning ...................... 26 1.3.2.2 Selective Anticipation ............................................................... 27 1.3.2.3 Commonality ............................................................................ 29

vi
1.3.3 Factors Affecting/Indicating Successful RIM .................................. 31 1.4 Feedforward Planning Knowledge Management Issues........................ 32 1.4.1 Knowledge Management Strategy is Inhibited by Enterprise Culture ......................................................................... 33 1.4.2 IPT Knowledge Management Prior to Design Release is Dependent Upon Personalization ............................................... 34 1.4.3 Functional Knowledge Management After Design Release is Not Codified for Reuse .............................................................. 35
1.4.4 The Knowledge Management Strategy Does Not Fully Utilize Selective Anticipation and Commonality Opportunities ................ 35 1.5 Research Objectives............................................................................. 37 1.6 Scope of the Research.......................................................................... 37 1.7 Research Limitations ........................................................................... 40 1.8 Dissertation Outline ............................................................................. 42
II. REFINING THE GENERIC PRODUCT DEVELOPMENT PROCESS..... 44
2.1 Generic Product Development Process (GPDP) for a Manufacturing Enterprise ............................................................. 45 2.2 IDEFO Diagrams of the GPDP ............................................................. 49 2.3 Summary .............................................................................................. 57
III. LITERATURE REVIEW ........................................................................... 58
3.1 Categorization of Relevant Research..................................................... 59 3.2 Discussion of Categorized Relevant Research....................................... 61 3.2.1 Group 1: Engineering Design Activity – Design Systems Emphasis ........................................................................................ 62 3.2.2 Group 2: Engineering Design Activity – Design Systems With Cost Emphasis ................................................................................ 67 3.2.3 Group 3: Engineering Design Activity - Logistics Engineering Emphasis ........................................................................................ 75 3.2.4 Group 4: Engineering Activity – IPT Systems Emphasis ................. 76 3.2.5 Group 5: Engineering and Planning Activities – Systems Integration Emphasis....................................................................... 81 3.2.6 Group 6: Business Management, Engineering, and/or Factory
Management Activities - High-Level Cost Estimation Tasks Without Process Plan Generation Emphasis .................................... 84

vii
3.2.7 Group 7: Business Management, Engineering, Factory Management Activities, and Planning Activities - Detail-Level
Cost Estimating Tasks With Process Plan Generation...................... 88 3.2.8 Group 8: Business Management, Engineering, Factory
Management and Planning Activities - Detail-Level Cost Estimating and Scheduling Tasks ............................................ 93 3.2.9 Group 9: All Enterprise Activities – Knowledge Reuse Emphasis ... 96 3.3 Synopsis of Literature Review Findings................................................ 98 3.4 Summary and Conclusions.................................................................... 100
IV. RIM CONCEPTS AND THE PRODUCT DEVELOPMENT LIFE CYCLE ............................................................................................. 101
4.1 Design Freedom and “Cost Commitment” Curves................................. 103 4.2 Cost Commitment (Cost Estimates) ...................................................... 105 4.3 Design Knowledge and Total Enterprise Effort ..................................... 107 4.4 Conclusions Related to Figure 4.1......................................................... 108 4.5 IDEF0 Diagram Relationships and RIM Concepts ................................ 108 4.6 Summary .............................................................................................. 110
V. THE CONCURRENT ENGINEERING WORKING-LEVEL INTEGRATED PRODUCT TEAM (IPT) IN THIS RESEARCH............... 112
5.1 Working-level IPT Responsibilities ...................................................... 114 5.2 Working-level IPT Members................................................................. 116 5.3 The Product Development Process and the Working-level IPT.............. 121 5.4 Summary .............................................................................................. 124
VI. THE CONCEPTUAL ARCHITECTURE OF A RIM-BASED DSS AND A PROCESS FLOW DIAGRAM OF A DECISION-MAKING INSTANCE................................................................................................ 127
6.1 High-Level Representations .................................................................. 128 6.1.1 Reciprocal Interdependencies Management (RIM).......................... 132 6.1.2 Reciprocal Interdependencies.......................................................... 132 6.1.3 RIM-Based Methodology for Assessing Manufacturing Capability: Capability Framework..................................................................... 133 6.1.4 Commonality .................................................................................. 134 6.1.5 RIM-Diagramming ......................................................................... 135 6.1.6 Feedforward Planning ..................................................................... 137 6.1.7 Selective Anticipation ..................................................................... 138

viii
6.1.8 Superficial Anticipation .................................................................. 138 6.1.9 Early Process Engineering............................................................... 139 6.1.10 Preplanning Knowledge ................................................................ 139 6.1.11 Feedforward Planning Effectiveness.............................................. 140 6.1.12 RIM-Learning by Development and RIM-Learning by Experience .................................................................................... 140 6.1.13 Cost Breakdown Structure (CBS) Work Center ............................. 141 6.1.14 Feedforward Planning Model (FFPM)........................................... 141 6.1.15 Feedforward Planning Model (FFPM) Fabrication Plan................. 142 6.1.16 Other Database Contents ............................................................... 142 6.1.17 Conceptual Design Release Package ............................................. 142 6.1.18 The Generic Product Development Process ................................... 143 6.1.19 The Segregation of Activities #7 and #8 ........................................ 143 6.1.20 Manufacturing Constraints and Opportunities................................ 144 6.1.21 Summary....................................................................................... 144 6.2 Conceptual Architecture: A Connection of Higher-Level and Lower-Level Information...................................................................... 145 6.3 A Flow Diagram of a Decision Making Instance................................... 153
VII. THE CONCEPTUAL FRAMEWORK FOR THE RIM-BASED DSS APPLIED TO THE DESIGN OF AN AIRCRAFT BULKHEAD ............... 165
7.1 The Basic Approach.............................................................................. 167 7.2 Project Management and RIM .............................................................. 167 7.3 Product Structure .................................................................................. 175 7.4 Cost Breakdown Structure .................................................................... 176 7.4.1 High–Level Cost Breakdown Structure ........................................... 177 7.4.2 Lower–Level Cost Breakdown Structure......................................... 179 7.5 Detail Fabrication Capability ................................................................ 186 7.5.1 Hole Processing Systems Capability – Context 1: Technical ........... 186 7.5.2 Hole Processing Systems Capability – Context 2: Resources........... (Management Strategy) ................................................................... 190 7.5.3 Hole Processing Systems Capability – Context 3: Sequencing (Availability/Scheduling) ................................................................ 192 7.6 RIM-Diagram for Manufacturing Capabilities-Based Decision Making ................................................................................................. 192 7.7 Design Processing Categories ............................................................... 201 7.8 Product Data Management, Design Features, and the Tool Classification and Control System ........................................................ 204 7.8.1 Design Selective Anticipation Features for Detail Fabrication ......... 206 7.8.2 Product Data Management System Hierarchies ............................... 211 7.8.3 Tool Classification and Control System Hierarchies........................ 212 7.8.4 Update of the DSS Information Hierarchy....................................... 216
ix
7.9 Technical Processing Systems Information – Specific Processing Capabilities Limits (Based on Features) ................................................ 218 7.9.1 Importance of Technical Information and Teaming ......................... 218 7.9.2 RIM-Diagramming of Technical Information: Specific Processing Capabilities Limits .......................................................................... 221 7.9.3 Beginning Framework of the Feedforward Planning Model FFPM Fabrication Plan ................................................................... 246 7.9.4 Recap of Decision Making Supported Thus Far............................... 256 7.10 Resources .......................................................................................... 262 7.10.1 Feedforward Planning Concepts from Verganti’s Study of Teaming/IPTs ................................................................................ 262 7.10.1.1 Early Process Engineering ....................................................... 262 7.10.1.2 Superficial Anticipation........................................................... 264 7.10.2 RIM-Diagramming of Labor and Machine Hours.......................... 265 7.10.3 Conclusions Related to Table 7.14 ................................................ 274 7.10.4 The MES Work Measurement System........................................... 275 7.10.5 Key Assumptions Related to the Work Measurement System........ 276 7.10.6 Work Measurement System RIM-Diagramming............................ 278 7.10.7 Feedforward Planning Model ........................................................ 291 7.10.8 Cultural Implications..................................................................... 292 7.10.9 Resources – Direct Labor Hours (Other) and Procurement Dollars .......................................................................................... 294 7.10.10 Estimation and Dollarization of Resources .................................. 300 7.10.11 Summarization and Conceptual Framework and Information Hierarchies Updates .................................................................... 302 7.11 Sequencing Decisions Based on the Management of Existing Requirements ..................................................................................... 305 7.11.1 Manufacturing Execution System (MES) Assumptions ................. 305 7.11.2 Capacity Requirements Planning................................................... 306 7.11.3 IPT Decisions Supported by the DSS ............................................ 313 7.12 Technical Sequencing Considerations Linked with the Master Schedule ............................................................................................ 317 7.12.1 Feedforward Planning Concepts and Sequencing (Scheduling)...... 317 7.12.2 High-Level Master Scheduling for First-Article ............................ 319 7.12.3 RIM-Diagram of Sequencing (Scheduling).................................... 322 7.12.4 Technical Scheduling Considerations: Conceptual DSS Approach ...................................................................................... 327 7.12.5 Integrated Resources Scheduling System....................................... 335 7.12.6 Recap of DSS Development Thus Far ........................................... 337 7.13 Sequencing Based on Management of “New” Requirements (Incomplete Designs) by Work Center ............................................... 340 7.14 Executive Summary of Chapter 7........................................................ 346

x
VIII. COMPARISONS OF CONCEPTUAL RIM-BASED DSS APPROACH TO OTHER CONCEPTUAL DESIGN DECISION-MAKING SUPPORT TOOLS AND METHODOLOGIES ........................................................... 351
8.1 Qualitative Assessment Tool Development ........................................... 352 8.1.1 Inputs/Entries (Category 1) ............................................................. 353 8.1.2 Regeneration of Results (Category 2) .............................................. 354 8.1.3 Processes and Costs (Category 3) .................................................... 354 8.1.4 Scheduling (Category 4).................................................................. 355 8.1.5 Tooling (Category 5)....................................................................... 356 8.1.6 Planning (Category 6) ..................................................................... 357 8.1.7 Manufacturability (Category 7) ....................................................... 357 8.1.8 Project Management and Reuse (Category 8) .................................. 358 8.1.9 Number of Questions and Structure of the Qualitative Assessment
Tool ................................................................................................ 358 8.2 Selection of Comparative Approach Samples From Published Works ... 361 8.3 Qualitative Assessment Tool Results .................................................... 362 8.4 Discussion of Assessment Tool Results ................................................ 369
8.4.1 Category 1: Inputs........................................................................... 369 8.4.2 Category 2: Regeneration of Results ............................................... 369 8.4.3 Category 3: Processes and Costs ..................................................... 370 8.4.4 Category 4: Scheduling ................................................................... 370 8.4.5 Category 5: Tooling ........................................................................ 371 8.4.6 Category 6: Planning....................................................................... 371 8.4.7 Category 7: Manufacturability......................................................... 371 8.4.8 Category 8: Project Management and Information Reuse ................ 372
8.5 Conclusions .......................................................................................... 373 IX. SUMMARY AND DIRECTIONS FOR FUTURE RESEARCH................. 374
9.1 Summary .............................................................................................. 375 9.2 Directions for Future Work................................................................... 378 9.2.1 Development of a Computerized RIM-Based NC Machining Prototype ........................................................................................ 378 9.2.2 Development of a True Working NC Machining Prototype System. 379 9.2.3 Expanding the Defined DSS............................................................ 379 9.2.4 Development of a RIM-Based DSS for Aircraft Assembly .............. 379 9.2.5 Application of the Methodology to Another Industry ...................... 380 9.3 Final Thoughts...................................................................................... 381
xi
REFERENCES ...................................................................................................... 383 APPENDIX A. CONCURRENT ENGINEERING INVESTIGATION ............................... 410
A.1 Definition of Concurrent Engineering and Related Terminologies........ 412 A.2 Benefits of Concurrent/Simultaneous Engineering, and Product Lifecycle Management............................................................ 414 A.3 Have Companies Embraced the Philosophy of Simulataneous Engineering? ................................................................ 415 A.3.1 Success Stories.............................................................................. 415 A.3.2 Surveys ......................................................................................... 416
A.4 Have Companies Adequately Embraced the Philosophies of Concurrent/Simultaneous Engineering? If So, Have the Claimed Benefits Been Realized? ........................................................ 416 A.4.1 Aerospace/Defense Industry.......................................................... 417 A.4.2 Automotive Manufacturing Industry.............................................. 418 A.4.3 Motorcycle Manufacturing Industry .............................................. 420 A.4.4 Information Technology Industry .................................................. 421 A.4.5 Commercial Aircraft Manufacturing Industry................................ 421 A.4.6 Decision Council Survey: United Kingdon .................................... 422 A.4.7 Conclusions................................................................................... 422 A.5 If Companies Have Not Realized the Benefits of Simultaneous Engineering,What Has Stood in Their Way? ........................................ 423 A.5.1 Poor Planning and Management of Communication Linkages and Complexities .......................................................................... 424 A.5.2 Specialized Hierarchies of Knowledge .......................................... 426 A.5.3 Cultural Aversion to Methodical Thinking .................................... 427 A.5.4 Cultural Bureaucracy and Systemic Complexity............................ 428 A.5.5 Conclusions................................................................................... 429 A.6 Summary ............................................................................................. 430 A.7 Implications of Dissertation Research on Improving Concurrent/ Simultaneous Engineering Implementation....................... 431 A.7.1 Specialized Hierarchies of Knowledge .......................................... 431 A.7.2 Reduction in Cross-Functional Non-Productive Teaming Meetings......................................................................... 431 A.7.3 Improved Training ........................................................................ 432 A.7.4 Movement Toward Methodical and Increased Outcome Controls .. 433

xii
B. TECHNICAL INFORMATION REFERENCES ........................................ 434
B.1 Aircraft Product Structure Organization and Naming ........................... 436 B.2 Work Breakdown Structure (WBS) ..................................................... 437 B.3 Design Organization and Numbering.................................................... 439 B.4 Common Materials and Related Issues in Aircraft Manufacturing ........ 440 B.5 Processes Used in Aircraft Manufacturing............................................ 440 B.6 Material and Process Specifications...................................................... 442 B.7 Equipment Specifications and Process Capability Limits...................... 443 B.8 Standard Parts Manual ......................................................................... 446 B.9 Cost Breakdown Structure.................................................................... 446 B.10 Non-Recurring and Recurring Cost .................................................... 447 B.11 Fracture Critical and Service Life ....................................................... 447 B.12 NC Machining Processes Discussed ................................................... 448 B.13 Tool Codes......................................................................................... 449 B.14 Accounting and Financial Data........................................................... 450 B.15 Engineering and Non-Manufacturing Deliverables ............................. 453 B.16 Estimating Rates and Factors.............................................................. 456 B.17 OSD Escalation Rates ........................................................................ 458 B.18 Performance and Efficiency Factors ................................................... 460 B.19 Learning Curves................................................................................. 461 B.19.1 Learning Curve Methodologies..................................................... 461 B.19.2 Learning Curve Application ......................................................... 463 B.20 Cost Engineering................................................................................ 465 B.21 Requirements Engineering ................................................................. 465 B.22 Process Engineering ........................................................................... 466

v
LIST OF TABLES 6.1 Generic RIM-Diagram Layout....................................................................... 136 6.2 Collections of Conceptual Information Hierarchies for the Business Management System....................................................................... 146 6.3 Collections of Conceptual Information Hierarchies for the Factory Management and Engineering Product Data Management Systems ............. 149 6.4 Collections of Conceptual Information Hierarchies for the Planning System and the Tool Design and Control System ......................................... 151 7.1 RIM-Diagram for High-Level Project Management Tools ........................... 169 7.2 RIM-Diagram of Manufacturing Capabilities ............................................... 193 7.3 RIM-Diagram for NC Milling Group: 1 of 9................................................. 224 7.4 RIM-Diagram for Special Hole Processing Group: 2 of 9 ............................ 230 7.5 RIM-Diagram for Hand Finish Group: 3 of 9................................................ 231 7.6 RIM-Diagram for Coatings Group: 4 of 9 ..................................................... 232 7.7 RIM-Diagram for Hardening and/or Special Treatment Group: 5 of 9 ......... 233 7.8 RIM-Diagram for Chemical Processing Group: 6 of 9.................................. 234 7.9 RIM-Diagram for Forming Group: 7 of 9 ..................................................... 235 7.10 RIM-Diagram for Marking and Quality Assurance Groups: 8 and 9 of 9..... 236

vi
7.11 Partial/Beginning RIM-Diagram for Assembly Processes Sequencing and Capabilities .......................................................................... 239
7.12 Conceptual FFPM Fabrication Plan (Processing Sequence) ......................... 249 7.13 Examples of CBS Work Center Numbers ..................................................... 257 7.14 RIM-Diagram for Resources (Labor and Machine Hours)............................ 266 7.15 Work Measurement RIM-Diagramming Effort: 1 of 6................................. 280 7.16 Work Measurement RIM-Diagramming Effort: 2 of 6................................. 281 7.17 Work Measurement RIM-Diagramming Effort: 3 of 6................................. 282 7.18 Work Measurement RIM-Diagramming Effort: 4 of 6................................. 283 7.19 Work Measurement RIM-Diagramming Effort: 5 of 6................................. 284 7.20 Work Measurement RIM-Diagramming Effort: 6 of 6................................. 285 7.21 Conceptual Work Measurement Application Matrix..................................... 289 7.22 Aircraft Total Cost Percentages ..................................................................... 294 7.23 Capacity Requirements Forecasting Example ............................................... 309 7.24 RIM-Diagram of Sequencing (Master and Internal Scheduling)................... 323 7.25 Example of Integrated Resources Scheduling Information ........................... 336 7.26 Example of Capacity Requirements Forecasting for “Planned Future Jobs – Firm” ....................................................................... 342 7.27 Example of Capacity Requirements Forecasting for
“Planned Future Jobs – Firm” and “Planned Future Jobs – Potential” ................................................................ 343 8.1 Qualitative Assessment Tool ......................................................................... 360 8.2 Comparative Approach Samples.................................................................... 361 8.2 Comparative Approach Samples.................................................................... 361

vii
8.3 Qualitative Assessment Tool Results for Samples 1 Through 3.................... 363 8.4 Qualitative Assessment Tool Results for Samples 4 Through 6.................... 364 8.5 Qualitative Assessment Tool Results for Samples 7 Through 9.................... 365 8.6 Qualitative Assessment Tool Results for Sample 10..................................... 366 8.7 Ranking of Results Based on “YES” Responses ........................................... 367 8.8 Percentages of Positive Results by Question ................................................. 368 B.1 Work Breakdown Structure Example ............................................................ 438 B.2 Equipment Specification Example................................................................. 444 B.3 Fastener Specification Example – Alcoa Fastening Systems ........................ 445 B.4 Accounting Month Calendar.......................................................................... 451 B.5 Percentage Completion Illustration................................................................ 453 B.6 The Affects of Achieving Design Stability After Manufacturing Start ......... 455 B.7 Cost Factors Example – Material Unity Factor ............................................. 457 B.8 Cost Factors Example – Direct Labor Unity Factor ...................................... 458 B.9 OSD Escalation Rates Example..................................................................... 459 B.10 Theoretical T1 Projection Examples.............................................................. 465

viii
LIST OF FIGURES 1.1 Types of Work Accomplishment Interdependencies..................................... 22 1.2 Types of Task Accomplishment Interdependencies ...................................... 23 1.3 Types of Product Lifecycle Reciprocal Interdependencies ........................... 25 1.4 Commonality: The Potential for Knowledge Reuse and Systemic Learning ......................................................................................... 30 2.1 Product Development Process Six-Phase Approach With Activity-Level Modifications................................................................ 48 2.2 IDEF0 Diagram Layout and Definitions........................................................ 49 2.3 Abbreviated (High-Level) Generic Product Development Process Organized Using Eight Activities .................................................................. 51 2.4 The Generic Product Development Process Activities Represented in IDEF0 Diagrams: Activities 1 and 2......................................................... 53 2.5 The Generic Product Development Process Activities Represented in IDEF0 Diagrams: Activities 3 and 4.................................... 54 2.6 The Generic Product Development Process Activities Represented in IDEF0 Diagrams: Activities 5 and 6.................................... 55 2.7 The Generic Product Development Process Activities Represented in IDEF0 Diagrams: Activities 7 and 8......................................................... 56 3.1 Association of Literature Review Groups to GPDP IDEF0 Activities 1 Through 8 ................................................................................... 60 4.1 Factors Related to Product Development Decision Making During Conceptual, Preliminary, and Detail Design Phases ......................... 103

ix
5.1 Product Development Process Six-Phase Approach With Activity-Level and IPT-Level Modifications ................................................ 123 5.2 Product Development Process Six-Phase Approach With Activity-Level IPT-Level and DSS Level Modifications.............................. 126 6.1 Working-Level IPT Decision Making Is Supported by a RIM-Based DSS .. 129 6.2 RIM-Based Decision Support Approach Utilizing Verganti’s High-Level
Concepts and Findings................................................................................... 130 6.3 Business Management System: Conceptual Information Hierarchies Supporting the DSS........................................................................................ 148 6.4 Factory Management System: Conceptual Information Hierarchies Supporting the DSS........................................................................................ 150 6.5 Engineering, Planning, and Tooling Systems: Conceptual Information Hierarchies Supporting the DSS................................................ 152 6.6 Flow Diagram of DSS Operation: 1 of 11 ..................................................... 154 6.7 Flow Diagram of DSS Operation: 2 of 11 ..................................................... 155 6.8 Flow Diagram of DSS Operation: 3 of 11 ..................................................... 156 6.9 Flow Diagram of DSS Operation: 4 of 11 ..................................................... 157 6.10 Flow Diagram of DSS Operation: 5 of 11 ..................................................... 158 6.11 Flow Diagram of DSS Operation: 6 of 11 ..................................................... 159 6.12 Flow Diagram of DSS Operation: 7 of 11 ..................................................... 160 6.13 Flow Diagram of DSS Operation: 8 of 11 ..................................................... 161 6.14 Flow Diagram of DSS Operation: 9 of 11 ..................................................... 162 6.15 Flow Diagram of DSS Operation: 10 of 11 ................................................... 163 6.16 Flow Diagram of DSS Operation: 11 of 11 ................................................... 164 7.1 Conceptual Product Structure Information Hierarchies................................. 175

x
7.2 Conceptual High-Level Cost Breakdown Structure Information Hierarchies ..................................................................................................... 177 7.3 Lower-Level CBS Information Hierarchies Not Related to Detail Fabrication ..................................................................................................... 180 7.4 Lower-Level CBS Information Hierarchies for Detail Fabrication............... 181 7.5 Information Silos in Table 7.2 Correlated to Conceptual Information Hierarchies ................................................................................. 197 7.6 RIM-Based DSS Development Framework Based Manufacturing Capabilities............................................................................ 199 7.7 Information Hierarchies for Design Processing Categories........................... 203 7.8 Design Selective Anticipation Features for the NC Machining Processing Category .................................................................... 207 7.9 Part Envelope Definition of an Aircraft Bulkhead ........................................ 209 7.10 PDMS Conceptual Information Hierarchies.................................................. 212 7.11 Tool Classification and Control System Information Hierarchies................. 213 7.12 RIM Development Conceptual Framework (Update of Figure 7.6).............. 217 7.13 Design Selective Anticipation Features for a Mechanically Fastened NC Machined Bulkhead (IPT Inputs in Blue Bold) ...................... 222 7.14 Conceptual Manufacturing Engineering (ME) Technical Information Hierarchies ................................................................................ 237
7.15 Processing Category and Design Selective Anticipation
Features for a Mechanically Fastened NC Machined Bulkhead - IPT Inputs/Entries in Blue and Bolded (Repeat)......................... 247 7.16 Conceptual Manufacturing Engineering (ME) Technical Information Hierarchies (Modified from Figure 7.14) ................................. 248 7.17 Recap of DSS Conceptual RIM-Based Codification Discussed in Sections 7.0 Through 7.9.......................................................... 258 7.18 RIM Development Conceptual Framework (Update of Figure 7.12)............ 260
xi
7.19 Information Silos Transformed Into Conceptual Information Hierarchies (Updated From Figure 7.5)..................................... 286 7.20 WMS Conceptual Information Hierarchies ................................................... 291 7.21 Non-Recurring Engineering and Tool Design Direct Labor Conceptual Information Hierarchies.............................................................. 297 7.22 Make/Buy Policies Management Conceptual Information Hierarchies ........ 298 7.23 Procurement Management Conceptual Information Hierarchies .................. 299 7.24 Conceptual Business Management Information Hierarchies......................... 301 7.25 Recap of DSS Conceptual RIM-Based Codification Discussed in Section 7.10.................................................................................................... 303 7.26 RIM DSS Development Conceptual Framework (Update of Figure 7.18).................................................................................. 304 7.27 Capacity Conceptual Information Hierarchies............................................... 312 7.28 Scheduling Conceptual Information Hierarchies........................................... 313 7.29 RIM DSS Development Conceptual Framework (Update of Figure 7.26).................................................................................. 315 7.30 Recap of DSS Conceptual RIM-Based Codification Discussed In Section 7.11.............................................................................. 316 7.31 Example of a First-Article Internal Schedule Provided to an IPT ................. 321
7.32 Conceptual Information Hierarchies to Support MES Simulation of CBS Work Center Internal Schedule Make span (or Setback) ...................... 330 7.33 Non-Recurring Engineering and Tool Design Direct Labor and Scheduling Conceptual Information Hierarchies (Updated Figure 7.23).................................................................................... 333 7.34 Procurement Management Conceptual Information Hierarchies (Update of Figure 7.23 Reflecting Scheduling Templates) ........................... 334 7.35 RIM DSS Development Capability Conceptual Framework (Update of Figure 7.29).................................................................................. 338

xii
7.36 Recap of DSS Conceptual RIM-Based Codification Discussed In Section 7.12.............................................................................. 339 7.37 RIM DSS Development Capability Conceptual Framework (Update of Figure 7.35).................................................................................. 345 7.38 Product Development Process Six-Phase Approach With Activity-Level IPT-Level and DSS Level Modifications.............................. 349

1
CHAPTER I
INTRODUCTION
There is a well-identified need in literature to develop frameworks,
methodologies, and systems that have the potential to extend knowledge with regard to
enterprise decision making during the conceptual design phase of the product
development process. The majority of published works related to product development
assert that between 70-80% of the total cost of a product is established during the
conceptual design phase (Fabrycky and Blanchard, 1991; Feng and Song, 2000; Lee and
Kelce, 2003; Park et al., 2002; Shehab and Abdalla, 2001; Wang and Wang, 2002).
Likewise, improvements in conceptual design decision making are also linked to needed
enterprise improvements in time-to-market, quality, affordability, and global
competitiveness (Feng and Song, 2000; Greenwood and Ormon, 2004; Liebl and Hoehne,
1999; Rehmann and Guenov, 1998; Yang et al., 2003).
In order to improve conceptual design phase activities, the decision-drivers of
downstream activities need to be conveyed systematically to the earliest decision makers
in business management, engineering, and manufacturing. Enterprise knowledge and
learning need to be captured and formalized for reuse in order to improve conceptual
design decision making. (Allada and Agarwal, 1996; Hsu and Woon, 1998; Lee et al.,

2
2001; Ma et al., 2002; Reich et al., 1999; Richards, 2000; Xiong, 2003; Yang et al.,
2003).
Though much is understood about what needs to be done, the elusive question is
“How?” How does an enterprise go about improving early design stage decision making
strategies and tools?
Since the late 1980s, the question of “how” has been addressed within the context
of concurrent engineering, teaming, and a wide array of decision making tools intended
to improve the product development process. However, a review of the literature
indicates that many of the product development improvement obstacles identified in the
1980s as the justification for concurrent engineering still exist today and concurrent
engineering efforts are not uniformly successful. (Verganti, 1998, chapter 11; Appendix
A.)
In the book chapter titled “Anticipating Manufacturing Constraints and
Opportunities in the Concept Generation and Product Planning Phases,” Roberto
Verganti (1998, chapter 11) addresses the elusive question of “how” in an in-depth study
that involves a literature review and a survey of 12 companies that utilize teaming and
concurrent engineering in the automobile, helicopter, and white-goods (small appliances)
industries. The results of Verganti’s work offer insights into why some companies are
successful in utilizing concurrent engineering to anticipate manufacturing constraints and
opportunities during conceptual design, why others are not successful, and offers
concepts to improve product development decision making strategies and tools.
The results of Verganti’s study provide several new insights that have relevance
to improving product development endeavors. Verganti reports that even though many

3
tools had been proposed in the literature, they lack insight into the complex mutual
interactions that take place in conceptual design decision making. Further, he asserts that
the empirical validation of these tools and their effectiveness is often overlooked.
Verganti’s study also discusses relevant survey results in the context of reciprocal
interdependencies management (RIM), feedforward planning, and relevant factors in
order to explain key components of successful and unsuccessful concurrent engineering
conceptual design efforts. The concepts and factors Verganti discusses directly or
indirectly (to be discussed more in-depth in Section 1.3) in this research are:
• Reciprocal interdependencies management (RIM) o Feedforward planning o Selective anticipation o Commonality
• Factors affecting and measurements of successful RIM o Superficial anticipation o Early process engineering o Preplanning knowledge o Feedforward planning effectiveness
However, it should be noted that Verganti never uses the phrase reciprocal
interdependencies management or RIM. Instead, he discusses various concepts that are
implied to deal with their management.
Verganti acknowledges task complexities involved in the identification of
reciprocal interdependencies and the use of feedforward planning efforts to manage them
is usually hindered by a lack of well-structured methods and the amounts of information
involved. In addition, teaming is not sufficient to handle the management of reciprocal
interdependencies.

4
Another problem of product development teaming efforts noted by Verganti is
that the efforts of the pre-project team, or earliest decision makers, is not documented in a
manner that is meaningful to later teams. Hence, there is limited opportunity for systemic
learning. The enterprise cannot recreate how the increase in product development
knowledge leads to a new decision.
The majority of Verganti’s discussions and recommendations remain at a high-
level, and the work eventually focuses on broader recommendations dealing with
feedforward planning, such as systemic knowledge, knowledge reuse, communication,
harmonized objectives, supported proactive thinking, and planned flexibility. However,
for individuals with integrated product team (IPT) experience and associated knowledge
of task complexities and approaches used in industry, Verganti’s work provides many
avenues from which to expand upon or further refine within the context of conceptual
design decision making. Verganti’s research offers an effective springboard to further
investigate the question - “How does an enterprise go about improving early design stage
decision making strategies and tools?”
The remainder of this chapter is organized as follows: • Identification of problems and needs
o Obstacles to development process (PDP) improvement ! Sequential task completion and information interchange ! Product development decision making processes are not
formalized ! Early product development decision making information is not
linked to downstream activities ! Product development decision making information guarded by
cultural and behavioral issues ! Enterprise information systems do not support knowledge
reuse during early product development o Concurrent engineering problems and lack of success
• Poor management of communication linkages and complexities

5
• Specialized hierarchies of knowledge • Cultural aversion to detailed and methodical thinking ! Cultural bureaucracy and systemic complexity
• Initial list of research considerations (based on problems/needs) and next steps • An executive summary of Verganti’s research
o Definitions of reciprocal interdependencies o Reciprocal interdependencies management (RIM)
! Feedback planning versus feedforward planning ! Selective anticipation ! Commonality
o Factors affecting/indicating successful RIM ! Superficial anticipation ! Early process engineering ! Preplanning knowledge ! Feedforward planning effectiveness
• Feedforward planning knowledge management issues o Knowledge management strategy is inhibited by enterprise culture o IPT knowledge management prior to design release is dependent upon
personalization o Functional knowledge management after design release is not codified
for reuse o Knowledge management strategy does not fully utilize selective
anticipation and commonality opportunities • Research objectives • Scope of the research • Research limitations • Dissertation roadmap
1.1 Identification of Problems and Needs
In order to address the basic question of “How does an enterprise go about
improving early design stage decision making strategies and tools?” - it is necessary to
begin by identifying and categorizing pertinent problems and needs at a high-level. In
the next two sections, obstacles to product development process improvement and
concurrent engineering are discussed and relevant research issues are identified.
6
1.1.1 Obstacles to Product Development Process Improvement
The obstacles that stand in the way of improving the product development process
have been a topic covered in research for a very long time, and they are well represented
in the literature. One of the contributions of this research is to collect and distill into
prioritized categories the many different obstacles identified in the literature. The
prioritization is based not only on the number of occurrences in the literature, but also on
this author’s work experience.
This research highlights the fact that a significant number of the problems
discussed many years ago still exist today. For example even after 20 years of concurrent
engineering teachings, sequential task completion and information exchange are still
noteworthy problems for a significant number of enterprises.
The literature identifies a variety of obstacles to product development process
improvements within a manufacturing enterprise. The sections that follow discuss these
categories of predominant recurring themes:
• Sequential task completion and information exchange
• Product development decision making processes are not formalized
• Early product development decision making information is not linked to downstream activities that occur after engineering design release
• Product development decision making information is guarded by cultural and behavioral issues
• Enterprise information systems do not support knowledge reuse during early product development
7
1.1.1.1 Sequential Task Completion and Information Exchange
Most enterprises are made up of organizations, job descriptions, information
systems, procedures, problem-solving approaches, etc. that were originally created based
upon Adam Smith’s division of labor theory. Even though these systems have adapted to
incorporate computer technology and new theories, the underlying procedural structures
remain intact (Lee and Kelce, 2003; Wierda, 1990). Hence, the collective knowledge of
the enterprise is geared toward the completion of specialized tasks in a sequential fashion
using complete information supplied from the preceding supplier of information in the
process (Boothroyd, 1994; Evans et al., 1998; Ferrelrinha et al., 1993; Tolometti and
Saunders, 1998; Shehab and Abdalla, 2001).
The sequential nature of task completion and information interchange is most
readily apparent in the activities that take place after engineering design release. The
sequential orientation is ideally structured for short-term shop floor control objectives.
However, it does not readily support a user’s effort to work with incomplete or varying
levels of information availability before design release.
1.1.1.2 Product Development Decision Making Processes are Not Formalized
Most of the product development decision making within an organization is not
formalized. The how and why of decision making is usually not documented in
enterprise systems, and “lessons learned” are primarily applied on an individual basis.
Information related to decision making resides in someone’s desk or brain, and only the
results of their efforts are stored in the systems. The formalization of the available
information takes place once decisions are made and placed into the system to be used by

8
the next function. This problem has been a primary obstacle in creating many different
types of expert systems. (Andersson et al., 1995; Austin et al., 2001; Ou-Yang and Lin,
1997; Park and Khoshnevis, 1993; Xiong, 2003.)
1.1.1.3 Early Product Development Decision Making Information is Not Linked to Downstream Activities
In most cases, information created during early product development is not
directly linked to downstream activities that take place after an engineering design is
released. Before a design is released to the manufacturing execution system, there is no
quick and easy way for a user to develop a “best guess” of the processes, routing,
resources requirements, schedule, or potential quality issues related to a design.
However, as soon as a design is released, there are automated computer systems,
processes, and procedures within the enterprise that exist for the sole purpose of
developing these types of information, i.e., manufacturability assessment, process
routing, pricing (direct labor hours estimates), and scheduling.
Once a design drawing is released during the detail design phase, a variety of
systems are used for shop floor control related tasks, such as the creation of work
instructions, capacity requirements planning, etc. However, during the early stages of
product development, any decision making related to these tasks is performed using ad
hoc or stand-alone approaches that are not fundamentally a part of the enterprise systems
that engage after a design is released. Examples include the following:
• Manufacturing standard information is created and formatted to load capacity requirements and cost accounting systems, but it is not directly linked to engineering design or cost assessment systems used by analysts supporting Business Management or Engineering

9
• Manufacturing process availability and capability data are not systematically linked to design systems used by Engineering
• Process cost and schedule information found in Factory Management systems is not linked to engineering systems
Once a completed design drawing is released, a formalized approach exists to
translate the engineering design information for predefined manufacturing execution
purposes. This approach is computerized, and has a significant level of automation.
Prior to the event of design release, a formalized, computerized (automated) exchange of
information between the engineering activity and factory management systems involved
in manufacturing execution does not occur. (Brunetti and Golob, 2000; Chen and Jang-
Jong, 1999; Chen and Liang, 2000; Lee and Kelce, 2003; Huang et al., 2001; Kimura and
Grote, 2002; Kolb and Bailey, 1993; Vollerthun, 1998).
1.1.1.4 Product Development Decision Making Information Guarded by Cultural and Behavioral Issues
Many manufacturing enterprises started and adapted years before automated
information systems became so readily available. As one can imagine, in the past, job
titles and promotions were often based on one’s ability to be the person in the know, as
well as how effectively functional organizations protected access to information. As
computer information systems became mainstream, the cultural view of guarding
information played a role in how these systems were used. Quite often, new information
systems were structured around traditional organizational theory, as opposed to
discovering new ways of doing business that optimized information sharing within the

10
enterprise. In other words, the new software tools were formatted to old organizational
structures and processes, as opposed to using the capabilities of the software as the basis
of creating new organizational structures and processes.
In many corporate cultures there is still a general reluctance among personnel to
share knowledge, information, and expertise. In particular, when it comes to “tricks of
the trade” with regard to working with incomplete information, it is not uncommon for
“experts” to assert that their job is just too complex to explain. These experts resist
efforts to computerize/automate significant aspects of their decision making processes.
(Asideu and Gu, 1998; Austin et al., 2001; Pratt, 1984; Tolometti and Saunders, 1998;
Vollerthun, 1998; Wierda, 1990).
1.1.1.5 Enterprise Information Systems Do Not Support Knowledge Reuse During Early Product Development
Many manufacturing enterprises have information systems that store historical
data. The problem is that these organizations do not go a step further to turn data into
knowledge and information for reuse. For example, a company’s computer system may
hold 50 years of NC (numerical control) machining data for bulkheads. However, in
order to extract the data and make comparisons to the current design, one has to be an
expert programmer and know, in detail, the changes in department numbers, computer
record fields, etc. to get needed information and make sure it is utilized properly. To
make matters more complicated, even if someone retrieves the data, there is likely no
record as to “why” someone previously selected one process over another, or “why” one
bulkhead costs more than another. At that point, a person will likely have to access all of
11
the design drawings and specifications, and try to rationalize the variances. (It is no
wonder employees guard this type of information once they go to such trouble to develop
it.)
The task of modeling relationships between product design drivers and the
process-dependent parameters is a very difficult obstacle for integrated product and
process development to overcome. (Rais-Rohani and Greenwood, 1998.) When an
organization fails to systematically record the “whys” of decision making, it makes the
task of relationship modeling increasingly complex; one that can only be accomplished
consistently by a few dedicated experts within an organization.
In the book, The 7 Habits of Highly Effective People, Stephen Covey lists the first
two habits as: Rule 1: Be proactive, and Rule 2: Begin with the end in mind. The
underlying problem with many enterprise information systems is that they were not
designed with the goal of creating enterprise knowledge and the capturing of and reuse of
organizational learning. Instead, the data collected are just a byproduct of short-term
shop floor control needs. Keeping years of actual data in computer files is not “learning.”
(Covey, 1989; Cutosky et al., 1988; Geiger and Dilts, 1984; Haimes and Schneiter, 1996;
Hsu and Woon, 1998; Kimura and Grote, 2002; Luby et al., 1986; Ou-Yang and Lin,
1997; Sky and Buchal, 1999; Taleb-Bendiab, 1993; Vollerthun, 1998; Yang et al., 2003.)
The conclusion is reached that the following items need to be considered at a
high-level when contemplating strategies and tools to improve conceptual design decision
making:
• Concurrent task completion and information interchange
• Product development decision making systems that inhibit negative cultural

12
and behavioral issues related to information and associated power • Formalized product development decision making processes that are linked to downstream activities and are a part of a larger enterprise information system that supports reuse
1.1.2 Concurrent Engineering Problems and Lack of Success
Most individuals involved in product development decision making are familiar
with concurrent engineering and its envisioned benefits. The following quotes are
offered to serve as a basis of discussion.
Concurrent Engineering is “a systematic approach to the integrated, concurrent design of products and their related processes, including manufacture and support. This approach is intended to cause the developers, from the outset, to consider all elements of the product life-cycle from conception through disposal, including quality, cost, schedule, and user requirements." (Winner et al., 1988.)
Concurrent Engineering “offers the potential benefits of reduced development time, the ability to uncover design flaws earlier in the development process, fewer engineering changes, improved quality, increased white collar productivity, and higher return on assets.” (Schultz, 2006.)
Studies and surveys report that most companies utilize concurrent engineering,
but that their efforts have not been as successful as anticipated due to a variety of
problems. (Constable, 1993; Lawson and Karandikar, 1994; Waterson et al.,1999;
Portioli-Staudacher et al., 2003.) Another contribution of this research is to distill the
many different concurrent engineering problems identified in the literature into
prioritized categories.
Specific issues related to the lack of success are identified as:
• Poor management of communication linkages and complexities • Specialized hierarchies of knowledge • Cultural aversion to methodical thinking and outcome control

13
• Cultural bureaucracy and systemic complexity
The majority of the identified concurrent engineering issues deal with how
knowledge links (reciprocal interdependencies – discussed in Section 1.3.1) are managed
within an enterprise. These issues are discussed in more detail in the sections that follow.
In addition, pertinent relevant conclusions are highlighted.
1.1.2.1 Poor Planning and Management of Communication Linkages and Complexities
Concurrent engineering sounds very promising and the explanation borders on
being nearly “common sense.” However, the complexities of the required
communication/knowledge linkages are not fully explored in the literature that discusses
“Concurrent Engineering.” (What sounds so simple…is not so simple.)
Hoedemaker et al. (1999) demonstrates that limits to the benefits of concurrency
exist. As communication linkages within the organization become more complex, the
less able concurrency can positively affect development time. In general, the more
complex the organization and the project, the stricter the limits to concurrency, and the
greater need to understand which decisions are affected by concurrency and which may
not be. There are potentially adverse effects to placing too much emphasis on
concurrency without fully exploring communication linkages.
Alcatel-Lucent (a global communications solutions provider) has achieved
considerable success with concurrent engineering, but also reports that problems exist
when the coding process is broken down into too many independent modules. The
coding process for large programs for switching systems is attacked by dividing into

14
modules. As the module size becomes smaller, the degree of parallel activity clearly
increases. However, at the same time, the inefficiencies increase because of problems
created by poor interfacing (poorly defined knowledge links). As the communication
burdens increase on individual programmers, the number of avoidable errors increases.
(Hoedemaker et al., 1999.)
Constable (1993) discusses how companies in the United Kingdom interpreted
cross-functional teaming and simultaneous engineering as being approaches to reduce the
need for management planning. The idea being that teaming should be done in an
organic manner where management’s main role is to provide a mutually supportive
environment. This thinking appears to be opposite of what Toyota Corporation, known
for its success in concurrent engineering, used on the development of the new Camry
where the emphasis was on management planning. (World Car Fans, 2006.)
Patrashkova and McComb (2004) developed a computational model to simulate
cross-functional teaming effectiveness in a simultaneous engineering environment and
determined that having the entire team involved in every decision was ineffective.
Instead, management should establish a framework where only requisite pieces of
information required team involvement.
Rickman (2001) reported that having a poorly defined IPT structure was more
detrimental to Raytheon in implementing concurrent engineering than not using IPTs at
all. The IPTs at Raytheon are tasked with developing technical product requirements
plus schedule and cost requirements for the product as well as their own functional
deliverables. Few (if any) individuals possessed the knowledge or skills to meet these
expectations.

15
It is inferred from the preceding discussions that the following items should be
considered when contemplating strategies and tools to improve product development
decision making:
• Definition of the product development process (high-level)
• Definition of the decisions that IPTs are expected to make (lower-level)
1.1.2.2 Specialized Hierarchies of Knowledge
Winter (1999) discusses how specialized hierarchies of knowledge have played a
role in the U.S. automakers’ ability to capitalize on the benefits of simultaneous
engineering in an article titled, “Back to the Future? – Simultaneous Engineering.”
During the prolonged period of industrial growth in the 1960s, 1970s, and 1980s, many
companies moved toward Adam Smith’s theory of organization, and workers were
organized by specialty. Government regulation also dramatically increased during this
same time period, and this also added to automakers’ decisions to create highly
specialized hierarchies. Specific groups were formed inside corporations to coincide with
particular regulatory legislation. (Winter, 1999.)
During the same period of time, Japan went through hard times, and had to
become more efficient. Japanese automakers required staffs that were considered jacks-
of-all-trades. (Winter, 1999). Ironically, the jacks-of-all-trades approach was historically
the philosophy in the U.S. prior to the 1960s and Adam Smith’s theory of organization by
specialty. Hence, this author implies that in order to solve some of their problems,
companies are going to have to go “back to the past” and find, or train, employees and
create systems that support more than one-dimensional, specialized problem-solving.
16
It is inferred from the preceding discussion that there are knowledge gaps that
exist with regard to how knowledge is linked within an enterprise. Effective strategies
and tools used in conceptual design decision making need to identify existing hierarchies,
drawing information from these hierarchies, and convey it in a manner that meets many
different aspects of decision making concurrently. Further, the strategies and tools need
to facilitate multi-dimensional thinking.
The list of items/needs provided in earlier sections expands as follows:
• Definition of the product development process (at a high-level)
• Definition of the decisions the IPTs are expected to make (at a low- level/working-level) • Specialized hierarchies/systems require restructuring for other uses (at a low- level of detail)
1.1.2.3 Cultural Aversion to Methodical Problem Solving and Outcome Control
The typical IPT is composed of individuals with engineering degrees, individuals
with degrees in other disciplines, and individuals with no college degree. In general,
individuals who have not been trained in methodical thinking tend to resist systematically
solving issues, and more often than not, make decisions using their “feelings” or the
desire for consensus. If everyone’s opinion is not validated, regardless of the level of
substantiation, it becomes a real problem. Dana L. Hargitt is an executive at Toyota who
worked 20 years at General Motors (GM) prior to joining Toyota in 1996. When asked
about concurrent engineering at GM, she said, … “Too often, concurrent engineering
meetings turn into coffee klatches and lack a systematic approach to problem solving.”

17
(Vasilash, 2001.) This assertion is also supported by this author’s work experience in
IPTs.
Miller and Guimaraes (2005) discuss that one of the problems with cross-
functional teaming is how it is managed. There are two types of control: behavioral and
outcome. Behavioral control deals with how a task is accomplished, and outcome control
deals with the results of the task. Effective cross-functional teaming required both types
of controls, but the emphasis at many companies has been very heavily weighted on the
behavioral aspects of control, such as teamwork, communication, support, consensus,
diversity, and validation.
It is inferred from the preceding discussions that in order for an individual to be
effective as an IPT member, he/she requires: 1) extensive training in multi-dimensional
thinking and how to work with incomplete information, 2) systems and tools to “lead
them through” the required decision making process, or 3) some combination of both.
The list of items/needs provided in earlier sections expands as follows:
• Definition of the product development process
• Definition of the decisions the IPTs are expected to make
• Specialized hierarchies require restructuring and/or reformatting for other uses • IPT members require systems and tools that “cue them” as to which decisions need to be made and provide information in a format to assist with the decisions (i.e., decision support systems)

18
1.1.2.4 Cultural Bureaucracy and Systemic Complexity
For some companies bureaucracy and complexity are built into the very fabric of
their culture. For example, the defense industry has many oversight agencies involved in
the defense acquisition process, and its approach to doing business grew up in the era of
cost plus contracting. Hence, unnecessary complexity and paper trails are part of the
culture. It is going to be very difficult to make radical changes as long as the primary
customer and “manager” of the acquisition process is the government. (Ingols and Brem,
1998.) Similarly, automakers routinely have considerable management involvement in
routine decisions and a great deal of government agency oversight. In general,
individuals and enterprises resist changing roles and responsibilities and performing
management functions differently. (Winter, 1999.)
The conclusion is reached that even the “best ideas” for improving product
development decision making systems and tools may not be fully implemented because
of the information-power that some organizations and individuals would have to
relinquish to implement detailed decision support systems.
1.2 Initial List of Research Considerations and Next Steps
Based on the consideration of product development decision making obstacles
and concurrent engineering problems, the following list of research considerations
emerges:

19
• Definition of the product development process
• Definition of the decisions the IPTs are expected to make
• Specialized hierarchies require restructuring and/or reformatting for other uses
• IPT members require systems and tools that “cue” them on which decisions need to be made and provide information in a format to assist with the decisions
• Concurrent task completion and information interchange
• Product development decision making systems that inhibit negative cultural
and behavioral issues related to information and associated power
• Formalized product development decision making processes that are linked to downstream activities and are a part of a larger enterprise information system that supports reuse
One research consideration identified is the need for a better defined product
development process. Two other research considerations that come to the forefront are
the need to better define IPT decisions and the need to develop integrated decision
support systems for use by IPTs.
In order to improve the product development process, it makes sense that one
must first define it. However, a generic product development process was not readily
available in the literature. Hence, one of the first tasks associated with this research is to
develop a generic product development process. Further rationale behind the need for a
generic product development process and a series of IDEF0 (Integration Definition for
Function Modeling) diagrams are presented in Chapter 2.
The literature review effort located hundreds of different approaches that are
dedicated to improving early product development decision making. Once the need for a
20
generic product development process was identified, it seemed logical to go back and
reorganize the literature using the activities on the diagram.
As discussed in the literature review in Chapter 3, the effort ultimately indicates
that the most promising works in the realm of product development process
improvement, concurrent engineering, and conceptual design decision making are those
that emphasize the systematic integration of multiple product development activities and
related decision making, with an emphasis on structured knowledge reuse. From among
the promising works, the approaches of Roberto Verganti (1998, chapter 11) are selected
for further study. (Verganti’s work is published in a book co-edited by Dr. John Usher,
titled “Integrated Product and Process Development: Methods, Tools, and Technologies.)
In the next section, Verganti’s research is discussed.
1.3 An Executive Summary of Verganti’s Research
Roberto Verganti performed a survey of 12 companies operating in the
automobile, helicopter, and white goods (small appliances) industries involved in new
product development using concurrent engineering and teaming. Based on the results of
this research, Verganti offers explanations as to why some companies are successful at
teaming, concurrent engineering, and the systematic anticipation of manufacturing
constraints and opportunities during conceptual design while other are not. In addition,
he offers insights as to why the majority of published works fall short with regard to
addressing the real needs of teams and early decision makers. The key concepts that
Verganti discusses (either directly or indirectly) are as follows:

21
• Reciprocal interdependencies management (RIM) • Feedforward planning
o Selective anticipation o Commonality
• Factors affecting and measurements of successful RIM o Superficial anticipation o Early process engineering o Preplanning knowledge o Feedforward planning effectiveness
Verganti’s concepts deal with decision making and how knowledge is created and
exchanged among activities and teams to make decisions. The relevance of Verganti’s
assertions to other industries or the application potential of his concepts may not be
immediately “seen” or understood by individuals who have not been involved in the
product development process or have not been a member of an IPT. Hence, this author’s
professional work experience played a role in selecting this avenue for further research.
Many of the problems Verganti identifies in his research are those that this author has
experienced in the workplace, and similarly, the concepts for improving decision making
ring true. In the sections that follow, each of Verganti’s concepts is discussed.
1.3.1 Definitions of Reciprocal Interdependencies
Before discussing the management of reciprocal interdependences, it is first
appropriate to discuss some definitions of reciprocal interdependencies (RI) found in the
literature. Definitions of RI vary in the literature, and until very recently, were not
widely applied. When this research began, there was little relevant discussion of RI
within the context of the product development process other than Verganti’s work from

22
1998. Before presenting Verganti’s definition of RI and his ideas for managing them,
two other definitions of reciprocal interdependencies used in the literature are offered,
which include illustrations and an expanded context of use. These two definitions are
used in the context of supply chain management improvement.
Levitt (2006) defines three types of work accomplished in a supply chain as
follows:
• Pooled work: work accomplished dependent of other workers
• Sequential work: work accomplished once others have completed specified work • Reciprocal work: work accomplished in cooperation or collaboration with
other work through a series of “mutual adjustments”
Levitt offers the following illustration related to work accomplishment
interdependencies:
Levitt asserts that most reciprocal work is accomplished via meetings, but would
benefit from collaborative design processes and supporting tools. Further, some work
that is accomplished sequentially would be better accomplished using a reciprocal
approach. Though not explicitly stated by Levitt, it can be asserted that reciprocal
POOLED SEQUENTIAL RECIPROCAL
Figure 1.1 Types of Work Accomplishment Interdependencies
(Levitt, 2006)

23
interdependencies management approaches are needed to facilitate supply chain
management.
Schwingenschloegl (2007) provides a classification of task interdependencies
within the context of supply chain modeling and simulation in the illustration that
follows:
Schwingenschloegl’s wording and pictorial interpretation of interdependencies is
slightly different from Levitt’s, but the conceptual similarity is easily recognizable.
Schwingenschloegl affirms that reciprocal interdependencies require a high
degree of organizational integration for tasks to be accomplished effectively. Further, he
suggests that the effective coordination of the supply chain will involve the
transformation of sequential tasks into reciprocal tasks. Though not explicitly stated by
POOLED
P
SEQUENTIAL RECIPROCAL
Entity working on project Result from task performed Pool of tasks from entities P
Figure 1.2 Types of Task Accomplishment Interdependencies
(Schwingenschloegl, 2007)

24
Schwingenschloegl, it can be asserted that reciprocal interdependencies management
approaches are applicable to facilitate supply chain management.
It is not surprising the reciprocal interdependencies are being discussed in the
context of supply chain management, given that the trends of the past 20 years have been
toward developing “core competencies” and doing less work “in-house.” Managing the
reciprocal interdependencies in the context of in-house processes is far less complex than
those that are not in-house. Product development decision making in the context of the
increased complexity of supply chains adds more opportunities for error.
Verganti (1998, chapter 11) asserts that reciprocal interdependencies are the
knowledge links between activities or entities. They represent the information exchange
that takes place between activities/entities in order to solve a problem (or, address a
question) during the product development lifecycle. Though not specifically stated by
Verganti, it can be postulated that reciprocal interdependencies occur when the
accomplishment of ongoing tasks requires a mutual exchange of continuously
updated/revised information between activities/entities.
Reciprocal interdependencies can exist between various types of entities,
activities, or teams. Verganti’s examples of reciprocal interdependencies interactions that
take place during the lifecycle of a product are illustrated below:

25
Verganti goes a step further and affirms that in order to manage reciprocal
interdependencies, the anticipated requirements of one activity must be systematically
balanced (traded) against the known (or forecasted) constraints and opportunities of
another activity. Though not specifically stated, it can be reasoned that when the
anticipated requirements are in the same format as the forecasted opportunities, then
knowledge flow between the activities can be automated and improved.
Verganti’s definition of reciprocal interdependencies is broad in context, and it is
geared toward the exchange of knowledge and information. It is slightly different from
other discussions of reciprocal interdependences, but that does not detract from its
usefulness. Even though the typical organizational structures and processes used do not
always effectively manage the reciprocal interdependencies that exist – they should.
Further, there is a need for strategies and approaches to manage reciprocal
interdependencies that exist, and Verganti goes to the next level offering approaches for
accomplishing this end within the context of teaming/IPTs and concurrent engineering.
Figure 1.3 Types of Product Lifecycle Reciprocal Interdependencies
Enterprise manufacturability (internal – external) Next-generation product design (common-new; across time; sequence or order) Product/process technologies (technically specific) Subsequent/prior product lifecycle stage (large groups of resources; across time; sequence or order)
Customer expectations Existing product design Design concepts Product lifecycle stage

26
1.3.2 Reciprocal Interdependencies Management
In the sections that follow, the key concepts related to Verganti’s approaches in
the context of reciprocal interdependencies management (RIM) are discussed. First,
feedforward planning (as opposed to feedback planning) is defined. Next, the concepts
of selective anticipation and commonality are presented.
1.3.2.1 Feedback Planning versus Feedforward Planning
The source material for this section is primarily due to the work of Verganti.
(1998, chapter 11.) The information that follows contains material that has been
paraphrased based on this reference unless otherwise noted.
Feedback planning is a reactive, after-the-fact, approach to managing RIs. The
future constraints and opportunities are assumed to be at such a high-level of uncertainty
in the early stages of product development that attempting to account for them is not
worthwhile. An example of feedback planning from Figure 1.3 involves designing a
product and then considering process technologies after the design is manufactured. The
general consensus is that the range of possibilities for manufacturing a particular design
configuration is just too large. When the number of design unknowns substantially
decreases and design rigidity increases, then the engineering design will react to feedback
generated. This can be an effective approach as long as engineering changes do not
significantly impact performance.
Feedforward planning is a proactive approach to managing reciprocal
interdependencies. The future constraints and opportunities that exist, such as in-house
and supplier process capability, are anticipated and accounted for as early as possible at

27
the level of detail required for effective decision making. Hence, if a new product should
require something “totally new,” this situation quickly comes to the forefront of the
development process. The assumption is that the time spent on accounting for future
constraints and opportunities are a worthwhile expenditure, and that it will more than
cover the cost of engineering changes. In addition, improvements in cycle time and
quality are expected additional benefits.
While feedback planning may be advantageous in some situations, the
documentation of such situations is not readily available in the literature. Conversely, the
negative impacts of engineering changes, which include rework, scrap, and increased
total product costs, are well documented. (Fujimoto, 1997; Hayes et al., 1988; Meredith
and Mantel, 1989; Trygg, 1991.) The majority of research and opinion indicate that
feedforward planning is likely the best approach to managing reciprocal
interdependencies. However, the implementation of feedforward planning is a very
complicated undertaking because of the knowledge management complexities and issues
its implementation involves. In the next two sections, the key components of Verganti’s
feedforward planning strategy are discussed, i.e., selective anticipation and commonality.
A discussion of knowledge management complexities related to feedforward planning is
presented following the section dealing with factors affecting successful RIM.
1.3.2.2 Selective Anticipation
Selective anticipation is an approach that Verganti discusses in the context of
product development, RIM, and feedfoward planning. In order to manage reciprocal
interdependencies, the anticipated requirements of one activity must be systematically

28
balanced (traded) against the known (or forecasted) constraints and opportunities of
another activity. In Verganti’s writings, this systematic balancing is referred to as
“selective anticipation.”
“Selective anticipation consists of anticipating only a limited amount of information that allows one to verify the coherence between the product concept and the future constraints. Dedicating the most attention on a few critical areas.”
Verganti offers an example of selective anticipation dealing with helicopter
design and weight, within the context of the product development process. Weight
targets are normally identified early in the design process, are a critical element of the
design, and play a greater role in early decision making strategies than design information
that is not going to be known or identifiable until later. (Similarly, systems and analytical
approaches that are not sensitive to weight will not be as useful during conceptual
design. Likewise, approaches that are used later could be made useful earlier if they
were restructured in such a way as to be sensitive to weight.)
Within the context of conceptual design decision making, selective anticipation
involves recognition of:
• Types of design information
• Patterns of design information
• Timing of design information
• The need for future constraints and opportunities to be sensitive to information identified via selective anticipation.
Selective anticipation is one of the most difficult aspects of RIM and feedforward
planning to apply because it requires proactive thinking on many levels of project
planning and management, technical processes and tools, and design characteristics.

29
1.3.2.3 Commonality
Another concept that Verganti discusses in the context of RIM and feedfoward
planning is systemic learning. Verganti’s approach involves the recognition of the
requirement for systemic learning. Systemic learning is defined as “the capability of a
company to learn from past projects and to incorporate experience.”
A minor extension of Verganti’s definition of systemic learning is the application
of what is referred to in industry as “commonality,” i.e., the shared features and/or
attributes from past endeavors. Commonality is the mechanism this research uses to
accomplish certain aspects of systemic learning.
In general terms, if a system of people, facilities, and equipment is to be reused on
a new project, more than likely, there is a tremendous amount of “known” information
that can be reused. The faster the enterprise understands and can anticipate what will
occur based on past experiences and available information, then new designs that are
truly “new” will more quickly get the emphasis and planning needed. Figure 1.4
illustrates the concept.

30
Next Generation Design
Existing DesignOutdated technologies, processes, materials, etc.
New technologies, processes, materials, etc.
Commonality
The application of commonality provides a large list of features, attributes, and
processes that are potentially shared between past and future endeavors. However, the
application of selective anticipation determines which of these elements will come to the
forefront in the development of systems and methodologies to support product
development decision making during the early stages of design. Though Verganti does
not explicitly use the word “commonality,” it is not a significant deviation from his
discussion of systemic learning, and it is shown later in this research to be an important
element of feedforward planning application. In the next section, the factors
affecting/indicating successful RIM are discussed.
Figure 1.4 Commonality: The Potential for Knowledge Reuse and Systemic Learning

31
1.3.3 Factors Affecting/Indicating Successful RIM
Verganti’s study revealed several factors that affect or indicate the successful
implementation of RIM strategies. These factors are superficial anticipation, early
process engineering, preplanning knowledge, and feedforward effectiveness. The basic
definitions of these concepts are discussed in the paragraphs that follow. (These concepts
will be discussed more in-depth later in Chapter 6.)
Superficial anticipation results in a baseline of assumptive information that has
limited definition from which to make meaningful change or adjustment. Companies that
are effective in reciprocal interdependencies management consider and manage important
information earlier, and they create a baseline that is useful during multiple stages of
product development. Companies that do not do well in RIM confuse selective
anticipation with superficial anticipation.
Early process engineering entails collecting large amounts of relevant
information prior to need and organizing the information in accordance to constraints and
opportunities identified via selective anticipation. In particular, information related to
specific technical tasks, such as manufacturing processes, would be considered early
process engineering information. Companies that are not effective in RIM gather large
amounts of data, but do not make it useful to teaming decisions.
Preplanning knowledge is the ability to identify the tasks to be accomplished and
questions to be addressed in advance of the availability of specific task information.
Preplanning knowledge includes items such as checklists, contingency plans, and
procedures for handling “new” requirements. Preplanning knowledge also includes

32
formal procedures and documents between activities. Companies that do better in
preplanning knowledge do better in overall RIM and feedfoward planning.
Feedfoward planning effectiveness is the capability of a company to anticipate
constraints and opportunities and avoid rework and other associated problems.
Feedforward effectiveness is not directly measured by overall product development
project performance as measured by sales and product functionality. Just because a
product sells and functions properly does not mean that the product development process
utilized was an efficient one. Verganti uses a fuzzy function to measure feedforward
planning effectiveness that is sensitive to the occurrences of: 1) rework, 2) engineering
changes, 3) unanticipated product cost increases, and 4) missed time to market estimates.
In Verganti’s study, there were companies that believed they were utilizing
concurrent engineering in their teaming efforts, yet they had poor results because they
were not managing reciprocal interdependencies. Companies with better results with
regard to feedforward planning effectiveness were also doing better in their utilization of
selective anticipation and commonality to anticipate constraints and opportunities.
1.4 Feedforward Planning Knowledge Management Issues
Knowledge management is defined as:
“A range of practices and techniques used by organizations to identify, represent and distribute knowledge, know-how, expertise, and intellectual capital and other forms of knowledge for leverage, reuse, and transfer of knowledge and learning across the organization.” (Nuschke and Jiang, 2007).

33
Further, there are two basic types of knowledge management: personalization and
codification. Personalization is less dependent on systems and more interpersonal.
Codification involves the systematic classification and storage of knowledge to address
predefined questions and issues. (Alavi and Leidner, 2001.)
There are four knowledge management issues that currently inhibit the effective
utilization of feedforward planning to manage reciprocal interdependencies. There is
some overlap between feedforward planning knowledge management issues and the
previously identified product development obstacles and concurrent engineering
problems. However, this is not surprising given that multifaceted problems quite often
trace back to the same, or very similar, root causes. Each of the feedforward planning
knowledge management issues is discussed in the sections that follow.
1.4.1 Knowledge Management Strategy is Inhibited by Enterprise Culture
As discussed earlier, in many corporate cultures there is still a general reluctance
among personnel to share knowledge, information, and expertise. All are often viewed as
sources of individual or functional power. (Asideu and Gu, 1998; Austin et al., 2001;
Pratt, 1984; Tolometti and Saunders, 1998; Vollerthun, 1998; Wierda, 1990). In order to
effectively anticipate and account for future constraints and opportunities, the knowledge
and learning of individuals and functions will ultimately have to take a backseat to the
knowledge and learning needs of the enterprise.
34
1.4.2 IPT Knowledge Management Prior to Design Release is Dependent Upon Personalization
When the use of concurrent engineering and integrated product teams (IPTs)
became popular in the early 1990s, many organizations responded by keeping the same
functional personnel and systems, and merely collocated the respective individuals closer
to engineering earlier in the design stage. The end result was a multifunctional team that
relied heavily upon a personalization approach to knowledge management prior to design
release. Then, after design release, the traditional functional systems behaved exactly as
they had before.
One downside of heavy reliance on individuals to carry the knowledge and
learning experience of the enterprise is that both become very subjective in nature as
opposed to objective. Another negative is that if ten individuals in an organization have
one level of expertise, and five have lesser experience, then the inexperience of the five
can cause preventable errors to ripple throughout the entire process. Likewise, when an
individual leaves the organization, then the knowledge and experience leaves as well, and
a good method of training new replacements typically does not exist. (Haque, 2003;
Valdez and Kleiner, 1996.)
In order to utilize feedforward planning to manage reciprocal interdependencies,
the anticipation of constraints and future opportunities must become more standardized.
This standardization will ensure that members of the IPT have the best available
information, and that the variability in approach is reduced.

35
1.4.3 Functional Knowledge Management After Design Release is Not Codified for Reuse
Each of the activities in the generic product development process presented in
Chapter 2 has one or more systems that support its efforts. However, the knowledge
required to utilize these systems is not codified for reuse beyond the task at hand.
(Andersson et al., 1995; Austin et al., 2001; Ou-Yang and Lin, 1997; Park et al., 2002;
Xiong, 2003).
For example, after a design is actually released, a planning expert creates routings
and work instructions; but the reasoning behind why one process was selected over
another is not recorded. Similarly, manufacturing engineering studies are used to select
processes and set up fabrication areas, but the knowledge within these studies is not
codified for reuse in future decision making. Increased codification and reuse are
essential for efficient application of feedforward planning strategies.
1.4.4 The Knowledge Management Strategy Does Not Fully Utilize Selective Anticipation and Commonality Opportunities
As defined by Verganti, selective anticipation is a narrowing process an enterprise
uses to identify the minimum amount of information that will be required to make a
future decision. Commonality is the shared features/attributes from past endeavors. In
order to use feedforward planning to manage reciprocal interdependencies during the
early stages of product development, the enterprise knowledge management system must
become efficient in the utilization of selective anticipation and commonality.
Due to the advances in computer technology, most enterprises have a tremendous
capability to generate and store data. However, quite often the data from past endeavors

36
are not organized (or codified) in a manner that makes it meaningful to future conceptual
design decision making with incomplete (sketchy) information.
In addition, the overabundance of data can actually lead to enterprise
inefficiencies. Analysts supporting product development activities spend large amounts
of time trying to take data collected for one purpose and reformat it in order to make
inferences to product development decision making. This reformatting procedure is
referred to as being an ad hoc (for this purpose) approach.
The reformatting of data is not within itself a bad thing. In fact, in order to utilize
information from the systems of various functional organizations during the early stages
of design, considerable reformatting and/or data grouping strategies are required. The
significant difference is that approaches need to be standardized, computerized, and
become a part of the collective knowledge of the enterprise. Having different, segmented
approaches that are left to the devices of individuals is not the preferred approach.
In order to use feedforward planning to manage reciprocal interdependencies
during the early stages of product development, the enterprise knowledge management
strategy must use selective anticipation to identify information availability and
corresponding systems sensitivity requirements. In addition, commonality strategies
must be a part of enterprise systems design in order to facilitate the codification of
knowledge.
When the four primary feedforward planning knowledge management issues are
combined with prior issues related to product development obstacles and concurrent
engineering problems, the need for fully integrated RIM-based decision support systems
37
is overwhelmingly supported. Hence, the incorporation of a conceptual framework for a
RIM-based decision support system is incorporated into this research.
1.5 Research Objectives
The objectives of this research are to:
1) Systematically apply Verganti’s findings and concepts (i.e., reciprocal
interdependencies, feedforward planning, selective anticipation, etc.) to
demonstrate how they can be used to improve IPT decision making during the
early stages of product design.
2) Address the information needs/issues associated with product development
process obstacles, concurrent engineering problems, and feedforward planning
knowledge management issues by developing the following:
a. Generic product development process diagrams
b. Definition of integrated product team members and decisions
c. Conceptual framework for a RIM-based DSS for use during conceptual design of an aircraft NC machined bulkhead
3) Examine the potential usefulness of using RIM concepts in the construction of
enterprise systems by comparing the defined RIM-based DSS to other approaches
found in the literature.
1.6 Scope of the Research
Verganti’s research and the associated findings are based on 12 case studies of
Italian and Swedish companies, and for the sake of confidentiality, none of the companies

38
are specifically identified. In order to make Verganti’s findings relevant to companies in
the U.S. and this author’s work experience, some extrapolation is necessary.
As a part of this research, an investigation is undertaken to determine how well
U.S. companies have embraced concurrent engineering and whether the claimed benefits
have been realized. The results of this investigation are presented in Appendix A and
some results have been presented in Section 1.1.2. The results are similar to Verganti’s
in that they are mixed, i.e., success is not widespread and commonplace. In addition,
many of the same factors that stood in the way of successful results identified in the
investigation were similar to those identified in Verganti’s research.
In order to demonstrate the application of RIM-based strategies in the context of a
conceptual decision support system, it is necessary to extrapolate further to a specific
case/industry. For this research, the specific case of aircraft manufacturing in the defense
industry is used. This industry is chosen for two reasons: 1) the need for improved
feedforward effectiveness in the defense industry and 2) this author’s work experience.
Verganti’s study reveals that feedfoward planning effectiveness is measurable
using criteria such as the amount of rework, engineering changes, unanticipated product
costs, and missed time-to-market estimates. In other words, if an enterprise is not doing
well in these areas, then their feedforward planning effectiveness is likely less than
desirable. No matter what the enterprise may believe it is accomplishing with regard to
teaming, concurrent engineering, and the anticipation of constraints and opportunities
(feedforward planning), it is ineffective if these factors (e. g., rework, engineering
changes, cost and schedule growth, etc.) are not improving.

39
A specific study geared toward aircraft manufacturing could not be located.
However, several studies are available that deal with military contracting and defense
acquisition at large. Swank et al. (2000) report that the Office of the Secretary of
Defense (OSD) funded a five-year study on acquisition performance trends. The study
covers a 16-year period in which no program metrics show improvement in cost or
schedule overruns. The overruns in cost and schedule performance were 40% and 60%,
respectively, and the study concludes: “there is a lack of trend data to determine if DOD
acquisition management is improving.”
In addition, there are specific aircraft examples that indicate poor feedforward
planning effectiveness. In the 1990s, the F-22 Raptor program was one of the first to use
concurrent engineering, and the project experienced some of the worst performance
measures in history. The United States Government Accountability Office (GAO)
determined that the predominant cost and schedule growth driver was traceable to
management of data that should have occurred prior to manufacturing start. (GAO,
2002.) In 2005, the F-35 Joint Strike Fighter was labeled as the most expensive fighter
in history, and cost overruns were causing international partners to cut planned purchases,
which will ultimately drive up the cost per unit. Some fear that the F-35 is in a cost-
induced “death spiral.” (Aero-News, 2005.) If aircraft manufacturing enterprises were
doing well in the areas of feedforward planning effectiveness, then one would suspect
that their performance metrics would be better and that the metrics would be improving.
However, in general, this does not appear to be the case, so it is reasonable to assume that
there is great deal of room for improvement.

40
Lastly, in order to demonstrate Verganti’s concepts within the context of a RIM-
based decision support system (DSS), the scope of the specific tasks has to be limited. In
this research, an operational DSS is not developed. Instead, a conceptual framework for
a RIM-based DSS is presented using the specific case of an aircraft NC machined
bulkhead.
1.7 Research Limitations
It is beyond the scope of this research to develop the ultimate generic product
development process or decision support system conceptual framework for an aircraft
manufacturing enterprise. Further, Verganti’s concepts are not to be misconstrued as the
“end all” when it comes to anticipating manufacturing constraints and opportunities in the
concept generation phase and improving teaming. Likewise, the work experiences of
this author are not representative of all possible experiences. Therefore, the deliverables
of this research should not be confused with an actual improvement within a specific
enterprise, but instead provide insights into the complexities involved in the difficult
work of design and implementation of sophisticated systems to address labyrinthine
decisions.
Another limitation of this research is the lack of published works related to actual
industrial endeavors. As noted by Shumaker and Thomas (1998) in Chapter 10,
“Integrated Processes in Defense Manufacturing,” of the book Integrated Product and
Process Development: Methods, Tools, and Technologies - the approaches, models,
successes, and failures of most companies are held within their proprietary annals.
Verganti also noted that while many tools and approaches are proposed in the literature,
there is a lack of empirical validation.

41
In Chapter 8 of this dissertation, comparisons are made between the conceptual
framework presented in this research and other approaches in the literature using a
qualitative assessment tool. It is understood that a quantitative assessment tool is
preferred, but is not possible due to a lack of detail in published works as well as the
complexities of data translation to make sure comparisons.
Finally, the work accomplished in this research does not address quantitative
uncertainty or risk, and the feedforward planning model presented generates only
traditional point estimates. The consideration of uncertainty would significantly increase
complexity and is beyond the scope of this research. The author believes uncertainty can
more effectively be added once a solid baseline is established. Therefore, the
consideration of uncertainty is believed to be an extension beyond this research.
However, if uncertainty modeling and management were explicitly considered,
then the following list provides a starting point for the general tasks that would need to be
accomplished:
1) Define the key input parameters that affect the value to be estimated, and develop a deterministic model.
2) Estimate the uncertainty in each process cost estimating relationship (CER). 3) Estimate the probability of process occurrence. 4) Estimate the risk in each input parameter. 5) Analyze the estimate using Monte Carlo simulation. 6) Based on the results of the Monte Carlo simulation, make user appropriate
decisions.
If additional analysis using multiple models simultaneously was found to be
appropriate, then some type of response surface methodology (RSM) could be applied
that includes risk and uncertainty. RSM enables the decision-maker to change the initial
input parameters to detect the effects of the responses in a time-efficient manner.

42
1.8 Dissertation Outline The remainder of this dissertation is organized as follows.
Chapter 2 discusses a generic product development process and associated IDEF0
diagrams created as a part of this research and correlates RIM approaches to the activities
in the generic product development process. The development of the generic product
development process addresses specific information needs identified in Chapter 1 that are
not currently provided in the literature. Chapter 2 is presented before the literature
review because the activities on the generic product development process diagrams are
used to organize the literature review.
Chapter 3 presents the literature review of relevant research organized using the
activities of the generic product development process presented in Chapter 2. Organizing
the research based on the product development process supports Verganti’s assertion that
many tools in the literature lack insight into the complex mutual interactions that take
place during conceptual design decision making.
In Chapter 4, some of the commonly held views of the product development life
cycle are discussed in the context of RIM. When appropriate, relevant assertions are
offered in the context of aircraft manufacturing in the defense industry.
In Chapter 5, the integrated product team is defined for this research. As
identified earlier in this chapter, there is a need to better define the members, roles, and
responsibilities of an IPT before attempting to develop systems to assist them in decision
making. As asserted by Verganti and supported by the literature review, too often the
important step of placing the system in the appropriate empirical context is overlooked by
43
those espousing to develop new systems and approaches for improving conceptual design
decision making.
Chapter 6 presents the conceptual architecture of the RIM-based DSS developed
in Chapter 7, as well as a process flow to illustrate a decision making instance. Chapter 6
is offered as an executive summary of information to be presented in Chapter 7 to better
orient the reader.
In Chapter 7, the conceptual framework of a RIM-based decision support system
(DSS) is systematically developed. If the reader is not familiar with common aircraft
terminologies and concepts, then Appendix B should be read before Chapter 7.
Appendix B provides a sampling of information related to aircraft manufacturing. The
appendix is provided in order to shorten Chapter 7. There are many topics covered in
Chapter 7 that are commonly used in aircraft manufacturing and do not warrant a great
deal of explanation within the body of the dissertation.
Chapter 8 compares the defined RIM-based DSS to other approaches in the
literature using a qualitative assessment tool. Ten other approaches are qualitatively
compared.
Chapter 9 discusses conclusions and future work.
Appendix A contains the concurrent engineering investigation referenced in
Chapter 1.
Appendix B contains technical information referenced in Chapter 7.

44
CHAPTER II
REFINING THE GENERIC PRODUCT DEVELOPMENT PROCESS
In Chapter 1, the obstacles and problems related to product development
improvement and concurrent engineering are discussed. One of the identified needs is a
generic product development process. This need correlates with Verganti’s concepts
related to reciprocal interdependencies (RIs) and supports his approach. Verganti asserts
that RIs are the knowledge links between activities or entities, and they represent the
information exchange that takes place between activities/entities in order to solve a
problem (or address a question) during the product development lifecycle.
Further, Verganti reports that even though many tools had been proposed in the
literature, they lack insight into the complex mutual interactions taking place in
conceptual design decision making. The generic product development process diagrams
illustrate the complex interactions and when the literature is organized using the generic
product development process diagram, Verganti’s conclusion is supported because the
majority of the published works do not consider multiple activities simultaneously.
(1998, chapter 11.)
The generic product development process diagrams and associated activities serve
as a high-level frame of reference for the remainder of the information presented in this

45
research. Further justification of the need for these diagrams and the diagrams
themselves are presented in the next section.
2.1 Generic Product Development Process (GPDP) for a Manufacturing Enterprise
As discussed in Chapter 1, one of the first steps toward improving the product
development process and the associated conceptual design decision making for a
manufacturing enterprise is to define the product development process. Ulrich and
Eppinger (2000) define the product development process as follows: “The sequence of
steps or activities which an enterprise employs to conceive, design, and commercialize a
product.”
Further, Ulrich and Eppinger define the product development process as a series
of six phases:
0. Planning (numbering starts at zero because it precedes product launch or approval) 1. Concept development
2. System-level design
3. Detail design
4. Testing and refinement
5. Production ramp-up
While Ulrich and Eppinger (2000) focus on six generic phases and the basic activities to
be accomplished in each phase (See Figure 2.1) much of the literature related to product
development process improvement is organized differently. The available literature

46
related to product development process improvement normally groups the activities listed
in the six phases by the various organizations that accomplish them, the enterprise
systems they use to accomplish a task, or some combination thereof. Examples of
common “task groups” within a manufacturing enterprise discussed in the literature
include engineering design, cost estimating, process planning, detail part fabrication, and
assembly. Examples of common enterprise systems discussed in the literature support
engineering, manufacturing, and business management (business management being
something other than engineering or manufacturing.)
This does not imply that activities such as marketing (i.e., the identification of
customer requirements, advertising, distribution, selling, public relations, market
research), logistics, human resource management, and procurement are not important to
the product development process. They are undeniably part of the value chain of any
organization. However, these activities are often not the specific focus of the literature
related to improving product development decision making during the early stages of
design. While these tasks are a part of the generic product development process to be
presented later, their contributions are treated as mechanisms/resources or controls that
support a larger activity group - with the exception of the identification of customer
requirements, which is treated as a primary input.
It should be noted in a functionally oriented enterprise, the organization’s name
nearly becomes synonymous with the activities that the organization performs. For
example, “business management” develops the tools for managing business, such as
schedules, budgets, and financial controls, “engineering” creates designs and performs
tasks associated with the test and validation of those designs, “planning” generates work

47
instructions, “fabrication” manufactures parts and tools, and so on. In the literature, as in
the workplace, the functional name of the organization quite often becomes “one in the
same” with the activities it performs.
Therefore, for the purposes of this research, it is necessary to develop a generic
product development process (GPDP) for a manufacturing enterprise that is
function/activity oriented as opposed to Urlich and Eppinger’s six-phase approach. The
GPDP emphasizes the activities and their associated deliverables, which are most
commonly the subject of published research. Currently, a GPDP approach of this type is
not documented in the literature, and hence, is considered a contribution of this research
effort.
In Figure 2.1, the product development process of Ulrich and Eppinger (2000) has
been edited to include the naming of the activities utilized in the IDEF0 diagrams
presented in Section 2.2. The items in blue itallics are additions to the original six-phase
approach. Please note that the use of IDEF0 diagrams is not directly correlated to the
number zero in Ulrich and Eppinger (2000) the six-phased approach.

48
AC
TIV
ITIE
S A
sses
smen
t of
busi
ness
and
m
arke
t (c
usto
mer
) ob
ject
ives
(B
usin
ess
Man
agem
ent)
A
sses
smen
t of
tech
nolo
gy
(Eng
inee
ring
) O
UT
PU
TS
Prod
uct p
lan
Mis
sion
st
atem
ent
AC
TIV
ITIE
S T
arge
t mar
ket
iden
tifi
cati
on
and
busi
ness
al
tern
ativ
es
(Bus
ines
s M
anag
emen
t)
Alt
erna
tive
pr
oduc
t co
ncep
ts
(Eng
inee
ring
an
d F
acto
ry
Man
agem
ent)
O
UT
PU
TS
One
or
mor
e co
ncep
ts
AC
TIV
ITIE
S D
efin
ed s
yste
m
arch
itec
ture
(E
ngin
eeri
ng)
Prod
uct s
truc
ture
/d
ecom
posi
tion
in
to s
ubsy
stem
s (E
ngin
eeri
ng a
nd
Fac
tory
M
anag
emen
t)
Ong
oing
as
sess
men
t of
busi
ness
ob
ject
ives
(B
usin
ess
Man
agem
ent)
O
UT
PU
TS
Geo
met
ric
layo
ut
Spec
ific
atio
ns f
or
each
sub
syst
em
Prel
imin
ary
proc
ess
flow
AC
TIV
ITIE
S Fo
r ea
ch p
art,
Com
plet
e sp
ecif
icat
ion
of
- G
eom
etry
-
Mat
eria
ls
- T
oler
ance
s (E
ngin
eeri
ng)
Des
ign
of to
olin
g (T
ool D
esig
n)
Des
ign
of p
roce
ss
flow
(P
lann
ing
and
Fac
tory
M
anag
emen
t)
OU
TP
UT
S D
raw
ing
of p
arts
(D
esig
n re
leas
e)
Dra
win
g of
tool
ing
(Too
l des
ign
com
plet
ion)
Sp
ecif
icat
ions
for
pu
rcha
sed
part
s Pr
oces
s pl
ans
(Rou
ting/
wor
k in
stru
ctio
ns)
AC
TIV
ITIE
S T
esti
ng o
f pr
oduc
t (E
ngin
eeri
ng)
Ref
inem
ent o
f pr
oduc
t (E
ngin
eeri
ng)
Fabr
icat
ion
of
alph
a an
d be
ta
prot
otyp
es a
nd
refi
nem
ent o
f pr
oduc
tion
pr
oces
s (F
acto
ry
Man
agem
ent,
Fab
rica
tion
&
Ass
embl
y)
OU
TP
UT
S W
orki
ng
prod
ucti
on
proc
ess
Prod
ucti
on in
tent
pa
rts
(C
ompl
eted
tool
s an
d pa
rts)
AC
TIV
ITIE
S W
orkf
orce
tr
aini
ng
(AL
L)
Eva
luat
ion
and
impr
ovem
ent o
f pr
oduc
tion
pr
oces
s (A
LL
to s
ome
degr
ee)
OU
TP
UT
S O
ngoi
ng
prod
ucti
on
0. P
lann
ing
1.C
once
pt
D
evel
op-
m
ent
2. S
yste
m
Lev
el
Des
ign
3. D
etai
l
Des
ign
4. T
estin
g
a
nd R
e-
f
inem
ent
5
. Pro
duct
ion
Ram
p-U
p
*Par
tial
sou
rce:
Ulr
ich
and
Epp
inge
r (2
000)
*S
ecti
ons
in b
lue
italli
cs a
dded
by
this
aut
hor
Figu
re 2
.1 P
rodu
ct D
evel
opm
ent
Proc
ess
Six
-Pha
se A
ppro
ach
Wit
h A
ctiv
ity-
Lev
el M
odif
icat
ions
48

49
2.2 IDEFO Diagrams of the GPDP
Integration Definition for Function Modeling, IDEF, is a set of definition
languages that have become standardized modeling techniques. IDEF0 is a method used
to model the decisions, actions, and activities of an organization or system. The National
Institute of Standards and Technology, NIST, released IDEF0 as the standard for function
modeling in 1993. (NIST, 2002.) The basic layout and definitions related to an IDEF0
diagram is presented in Figure 2.2.
Function – an activity, action, process, or operation; typically begins with a verb (but not required), i.e., “fabricate part” can be viewed as synonymous with “fabrication” Inputs – things “consumed” (e.g., data) or transformed Outputs – things that are produced (e.g. reports, deliverables) Mechanisms – things or resources used, but not consumed Controls – things that ensure proper completion
Function (Activity)
Inputs
Mechanisms
Controls
Outputs
Figure 2.2 IDEF0 Diagram Layout and Definitions

50
Figure 2.3 provides an overview of the generic product development process for a
manufacturing enterprise. Figure 2.3 is intended to provide the reader with a single-page,
executive summary of the generic product development process used in this research.
The red arrows in Figure 2.3 indicate Business Management controls that are
developed by the Business Management activity and used by other activities. The blue
arrows indicate the Factory Management controls developed by the Factory Management
activity and used by other activities. The green arrows indicate the Engineering controls
developed by the Engineering activity and used by the other activities. The outputs that
are color-coded are permanent controls, in that, once developed in their final form they
require an extensive change procedure before they can be altered. The controls maintain
the continuity of how information is shared/used by the activities.
The functions/activities denoted on the generic process diagrams do not include a
verb. As explained earlier, the collective group of tasks involved with “developing,
testing, controlling, managing of the design” is simply referred to as “Engineering,” and
so forth. The acronyms used in Figures 2.3 through 2.7 are:
• WBS – Work Breakdown Structure • CWBS – Contract Work Breakdown Structure • SOW – Statement of Work • ROM – Rough Order Magnitude (Initial estimates of schedule and cost are
“rough” and provide a starting point. An iterative process and information refinement leads to final estimates of cost and schedule.)
• M&P – Materials & Processes • EBOM – Engineering Bill of Material • MRP – Material Requirements Planning • FMS – Factory Management System • ME – Manufacturing Engineer • IE – Industrial Engineer • Mfg Rep – manufacturing representative • QA Rep – quality assurance representative • IPT – integrated product team

51
5. Planning (Parts/Tools/Assembly)
Figure 2.3 Abbreviated (High-Level) Generic Product Development Process Organized Using Eight Activities
Engineering Controls M&P Specifications Test & Inspection Requirements MRP Requirements/Data (EBOM) Engineering Schedules & Releases (ROM & Final)
Engineering Releases4. Factory Management
Factory Management Controls Factory Management System Information Requirements/Process Capabilities Planning Orders
Business Management Controls Engineering Controls Factory Management Controls
Planning Orders Work Instructions Tool Orders Performance Data
6. Tool Design
7. Fabrication (Parts and Tools)
Tool Designs Performance Data
Raw Materials Purchased Items
8. Assembly
Parts / Assembly ToolsRaw Materials
Purchased ItemsPerformance Data
Finished Good (For Test or Delivery) Performance Data
1. Business Management
Customer Requirements
Business Management Controls WBS/CWBS & Make/Buy Policies Schedule/Budget/Accounting Performance Data Proposal Estimates/SOW Requirements
2. Factory Management
ROM Proposal EstimatesROM Drawing Release
Schedules
3. Engineering
Planned Orders (High-level) Factory Simulations (High-level) Factory Design Preferences (High-level)
SOW Requirements for Design and AnalysisFactory Preferences
*** The remaining activities take place after the design drawings are released ***

52
Figures 2.4, 2.5, 2.6, and 2.7 provide IDEF0 representations of the activities
involved in the generic product development process for a manufacturing enterprise.
These diagrams provide details not included in Figure 2.3. The activities, inputs,
mechanisms, controls, and outputs shown in these IDEF0 representations are used as a
frame of reference throughout the remainder of this research.
The first three activities on the high-level IDEF0 representation, Business
Management, Factory Management, and Engineering, take place before the release of the
engineering drawings during the conceptual and preliminary design phases. “Business
Management” is a collector activity for tasks that are not engineering or manufacturing.
The last five activities on the IDEF0 representation, Factory Management,
Planning, Tool Design, Fabrication, and Assembly, take place after the release of
engineering drawings during the detail design phase. The “Factory Management”
activity is broken into two activities on the IDEF0 representation in order to more easily
convey the tasks that occur before design release (Activity 2, Figure 2.4-bottom) and
those that occur after design release (Activity 4, Figure 2.5-bottom).
The dashed line box containing the letters “IPT,” indicate that the members of the
IPT are part of these activities.

53
Customer Requirements for System,Price, and Delivery
Analysts:Cost
PurchasingOther
Cost & Schedule Models Factory Simulations (High-level) ROM Engineering Release Schedules/Historical Data
Management Controls Schedule/Budget/Accounting Rules
Make/Buy Policies & WBS/CWBS
Statement of Work (Requirements)
Proposal Estimates/Performance Data
1. Business
Management
Legacy Systems
Risk Mgmt Strategy
Lessons Learned
Marketing/Sales Goals Human Resource Plan Procurement Plan
Financial Goals/Estimating Philosophies
Cost Studies Simulation Models (High-level) Historical Data
Figure 2.4 The Generic Product Development Process Activities Represented in IDEF0 Diagrams: Activities 1 and 2
Factory Simulations (High-level) 2. Factory
Management
ROM Proposal Estimates of Cost and Schedule
ROM Drawing Release Schedule
Analysts IE (cost)
LegacySystems
Lessons Learned
Management Controls
Engineering Controls
Factory Preferences
IPT Member
IPT Member

54
Engineering Controls
Lessons Learned
M & P Specifications
Engineering Drawings Schedules & Releases
Test & Inspection Requirements
MRP Requirements/Data (EBOM)
Analysts/ Design
Engineers /Trade Studies
LegacySystems
Engineering Cost & Schedule Models Historical Data
Management Controls
Performance Data
3. Engineering
Logistics Plan
Drawing Release Schedule/Staffing Plan
Factory Preferences
Statement of Work Requirements
PerformanceSpares & Support Equipment
Stress/Analysis/Materials and ProcessesReliability & Maintainability
*** The remaining activities take place after the design drawings are released ***
Planning Order Releases
AnalystsI.E (cost) IE (other)
LegacySystems
Cost Studies/Scheduling Studies Simulation Models (Detail Level) (Linked to processes and sequencing) Historical Data
FMS Controls
Factory Management System Information Requirements and Production & Inventory Control List of Requirements (MBOM)
4. Factory
Management
Final Engineering Releases (EBOM)
Engineering Controls
Management Controls
Lessons Learned
Figure 2.5 The Generic Product Development Process Activities Represented in IDEF0 Diagrams: Activities 3 and 4
IPT Member
IPT Member

55
Planners Process Capabilities
Planning Orders
Management Controls Engineering Controls FMS Controls
Lessons Learned
Planning Manual/Planning Templates
MEs Planners
Work Instructions (Routing)
(With Tool No./Tool Code)
Tool Orders
Performance Data
5. Planning
(Parts/Tools/Assembly)
PlanningSystems
Tool Design Systems
Tool Orders
Lessons Learned
Tooling Manual/Tooling Templates
Tool Designers Process Capabilities
Tool Designs
Performance Data
6. Tool Design
Figure 2.6 The Generic Product Development Process Activities Represented in IDEF0 Diagrams: Activities 5 and 6
Management Controls Engineering Controls FMS Controls
IPT Member
IPT Member

56
Figure 2.7 The Generic Product Development Process Activities Represented in IDEF0 Diagrams: Activities 7 and 8
Raw Materials
Management Controls Engineering Controls FMS Controls (Standards/Schedules/ Personnel Forecasts/Capacity Planning/ Performance Measurement) Work
InstructionsEquipment & Process
Specifications/CapabilitiesLessons Learned
Purchased ItemsParts and Tools
Performance Data
7. Fabrication (Parts and Tools)
Tools & Machines
Facility & Equipment Rate Tooling Estimates
Direct Laborers Mfg Reps QA Rep
WIP Systems
Tool Designs & Tools
IPT Member
Work Instructions
Equipment & ProcessSpecifications/Capabilities
Lessons Learned
Fabricated Parts & Components
Tools & Machines
Finished Good
Performance Data
8. Assembly
Purchased Items
WIP Systems
Facility & Equipment
Direct Laborers Mfg Reps QA Rep
Fixture Forecast Crewload Analysis Simulation Models
(Ready for Further Test and/or Final Delivery
Tools
Management Controls Engineering Controls FMS Controls (Standards/Schedules/ Personnel Forecasts/Capacity Planning/ Performance Measurement)
IPT Member

57
2.3 Summary
In this chapter, the generic product development process (GPDP) IDEF0 diagrams
are presented. The six-phased approach of Ulrich and Eppinger - planning, concept
development, system-level design, detail design, testing and refinement, and production
ramp-up – is reformatted using an IDEF0 approach. The IDEF0 approach utilizing
functions/activities is more readily useful to correlate the literature review information
and Verganti’s concepts of reciprocal interdependencies, which utilize knowledge links
between activities.
In the next chapter, the literature review is organized and discussed using the
activities on the GPDP diagrams as the frame of reference. These activities are:
1. Business Management 2. Factory Management (before design release) 3. Engineering 4. Factory Management (after design release) 5. Planning 6. Tool design 7. Fabrication 8. Assembly
58
CHAPTER III
LITERATURE REVIEW
The competitiveness of an enterprise is greatly influenced by the cost, quality, and
timeliness with which it brings new products into the marketplace. The majority of
published works related to product development assert that 70-80% of the total cost of a
product is committed during the early stages of product design. (Feng and Song, 2000;
Lee and Kelce, 2003; Park et al., 2002; Shehab and Abdalla, 2001; Wang and Wang,
2002). Likewise, improvements to any stage of the product development process can be
linked to corresponding enterprise improvements in time-to-market, quality, and global
competitiveness. (Asiedu and Gu, 1998; Ferrelrinha et al., 1993; Hsu and Woon, 1998;
Kroll, 1992; Rehmann and Guenov, 1998; Yang et al., 2003.)
Current literature contains many methodologies, frameworks, and systems that
have the potential to improve product development process related decision making.
This chapter reviews, organizes, and categorizes a significant sampling of literature using
the generic product development process (GPDP) IDEF0 diagrams presented in Chapter
2 as a frame of reference. The effort results in the creation of a synergism of new product
development knowledge, which is another contribution of this research.
59
Using the GPDP activities and associated deliverables identified in Figure 2.1, the
literature is systematically grouped and discussed based on the activities addressed by the
research methodologies. In addition, a high-level synopsis of the identified groups and
findings are presented.
3.1 Categorization of Relevant Research
Over one hundred articles related to some aspect of product development process
improvement and early design decision making were surveyed. The literature was then
categorized using the generic process flow diagrams in Figure 2.3 through 2.7 as a frame
of reference. The following nine groups resulted:
Group 1: Engineering Design Activity – Design Systems Emphasis
Group 2: Engineering Design Activity – Design Systems With Cost Emphasis
Group 3: Engineering Design Activity - Logistics Engineering Emphasis
Group 4: Engineering Design Activity – IPT Systems Emphasis
Group 5: Engineering and Planning Activities – Systems Integration Emphasis
Group 6: Business Management, Engineering, and/or Factory Management Activities - High-Level Cost Estimation Tasks Without Process Plan Generation Emphasis Group 7: Business Management, Engineering, Factory Management, and Planning Activities - Detail-Level Cost Estimation Tasks With Process Plan Generation Emphasis Group 8: Business Management, Engineering, Factory Management, and Planning Activities - Detail-Level Cost Estimating and Scheduling Tasks Emphasis Group 9: All Enterprise Activities – Knowledge Reuse Emphasis The nine groups are further categorized in Figure 3.1 as follows:

60
1. Business
2. Factory
3. Engineering
GPDP Activities to the left of design release
Design Release
GPDP Activities to the right of design release
Group 1: Engineering (design systems) [25] Group 2: Engineering (design systems with cost) [19] Group 3: Engineering (logistics) [3] Group 4: Engineering (IPT systems) [27] Group 6: Business Man agement, Engineering, and Factory Management [15]
Group 8: Business Management, Engineering, Factory Management, and Planning (process plan based cost estimating; scheduling) [4]
Group 5: Engineering and Planning [11] Group 7: Business Management, Engineering, Fa ctory Management, and Planning (process plan based cost estimating) [17]
Group 9: All Activities – Knowledge Reuse Emphasis [5]
89
28
4
5
Figure 3.1 Association of Literature Review Groups to GPDP IDEF0 Activities 1 Through 8
As the number of activities considered increases, the number of articles decreases Very few articles discretely consider all GPDP activities The results agree with Verganti’s findings, i.e., though many tools have been proposed in the literature, they lack insight into the complex mutual interactions that take place in conceptual design decision making
4. Factory
5. Planning
6. Tool
7. Fabrication
8. Assembly
The number in brackets [ ] is the number of articles in the group. The number in the yellow box is the total number for the combined
CONCEPTUAL & PRELIMINARY DETAIL

61
Figure 3.1 correlates the GDPD activities, the design release, the nine literature
review groups, and the number of articles. The top portion of the figure contains the
eight activities identified in the GPDP IDEF0 diagrams. Three activities that take place
before design release and five that take place after design release.
The first block illustrates the literature in Groups 1, 2, 3, 4, and 6 are primarily
dedicated to activities that take place prior to design release. The number of articles in
each group is provided in brackets and the total number of articles is contained in the
highlighted box.
The second block illustrates the literature in Groups 5 and 7 begin to include
activities that take place after design release; primarily Planning and cost analyses. The
number of articles in each group is provided in brackets and the total number of articles is
contained in the highlighted box. The total number of articles in this block is three times
smaller than the first block.
The remaining two blocks on the diagram are organized in a manner similar to the
first two blocks. It is noteworthy that as the number of activities considered and
complexity increases, the number of articles decreases.
3.2 Discussion of Categorized Relevant Research
In the sections that follow, each of the nine groups is discussed using the generic
product development process IDEF0 diagrams from Chapter 1 as the frame of reference.
In each group, an overview of methodologies and approaches is presented.

62
3.2.1 Group 1: Engineering Design Activity – Design Systems Emphasis
This group of research deals with the Engineering activity on the GPDP IDEF0
diagram and the design systems mechanism in Figure 2.5. The emphasis of the research
is on improvements to engineering design systems used the early design stages of the
product development process. The intended user is the design engineer, and the goal is to
support better and faster design generation. Cost is not a direct consideration or
demonstration in these approaches. In addition, while production rules are sometimes
considered, there are no direct links to existing Factory Management Systems.
Blasi et al. (2000) suggest improvements in conceptual aircraft design using a
multiconstraint genetic algorithm optimizer. A genetic optimizer is coupled with a sizing
code to define preliminary aircraft configuration and sizing in the early stages of design.
Condoor and Weber (1999) present a model for conceptual design methodology
that combines parameter analysis with robust design techniques. Two cases studies
illustrate the application of qualitative design techniques prior to the development of
concept details.
Fliedl (1999) applies natural language based requirements analysis to the design
of information systems. Since system and information requirements are normally
established via dialogues between potential users, it is postulated that by properly
classifying texts that candidate lists of subjects, actions, and objects can be generated
based on linguistic categories. This methodology has specific application to the
development of engineering design systems or other types of information systems.

63
Grierson (1994) proposes the development of a computer-based capability for the
application of evolutive-cognitive techniques during the early stages of design. The
computational model is based on a neural network.
Irgens (1995) demonstrates how case-based reasoning could be used to provide
design support during the early stages of product design. Information generated during
the later stages of the product development life cycle would be stored in such a manner as
to offer future advice. Cases are developed, and then stored in a historic advice for
product prototyping (HAP) online system. Users input key criteria to search for past
cases similar to present design problems.
Hira and Tanaka (1999) discuss the development of an artificial design assistant
by combining rule-based inference, a genetic operator, and genetic case-based
algorithms. The concept of a personalized assistant for early design is demonstrated
using skeletal designs.
Kleban (2001) captures heuristic knowledge in an online computer system
prototype called the Materials and Process Design Environment (MPDE). The MPDE
contains Smart Process Advisors (SPA) that serve as “virtual manufacturing experts” for
product designers. The MPDE contains three SPAs for material, near net shapes, and
joining. The system theoretically provides the engineer with a candidate set of solutions
for problems as well as organized manufacturing rules of thumb.
Kolb and Bailey (1993) utilize object-oriented modeling with constraint
propagation to integrate design analysis codes with multidisciplinary design decision

64
making. A prototype for flexible representation of objects for design optimization,
FRODO, is discussed and some applications are presented.
Kumara and Kamarthi (1992) use adaptive resonance theory networks to organize
families of design problems using functional requirements. Adaptive resonance networks
identify learned design problems and their solutions to develop optimal design solutions.
The research also compares adaptive resonance networks to k-mean clustering
algorithms.
O’Sullivan (2002) presents a theoretical framework based on an interactive
constraint-based approach to supporting the conceptual design process. A computational
reasoning environment is coupled with constraint filtering to form the basis of an
interactive early design tool.
Pallez et al. (2001) propose a framework that combines function to form mapping
techniques with an intermediate specification model to create a collaborative conceptual
design environment.
Parmee and Bonham (2000) develop a strategy for supporting conceptual design
based on variable mutation cluster-oriented genetic algorithms (vmCOGAs). The
technique is demonstrated through application on two-dimensional test functions.
Qiu et al. (2002) propose an evolutionary strategy to improve conceptual design
based on an attribute encapsulation method. The method requires the combining of
design features to general potential design concepts.
Rao and Lu (1993) propose inverse engineering as a means of facilitating iterative
exploration of tradeoffs in the design space. Machine learning techniques are utilized to

65
learn bi-directional models that can provide design support. The methodology is
demonstrated using the design of diesel engines.
Roller (1989) proposes a design by features for high-level shape manipulations as
a means for generating drawings in a faster more accurate way. Further, the approach is
seen as the means to integrate computer aided design (CAD) systems with subsequent
applications, like process planning. The research primarily formalizes the definition of
features and demonstrates examples of advanced solid model design. The means of
integrating the approach with subsequent applications is not explored.
Schroder and Jetter (2003) use the term “fuzzy front end” for the earliest stages of
the new product development process. They apply psychological findings related to
action regulation to the process of generating conceptual designs, and propose a
framework for a management support system based on fuzzy cognitive mapping. The
architecture and examples are presented at a very high-level, and one simple example is
illustrated for wind turbine manufacturing. The potential benefits of the approach are
discussed, along with the opportunities for future research to address the questions not yet
answered with regard to the proposed concept. (Verganti’s work is referenced in this
document.)
Simpson et al. (1995) present a conceptual framework that combined Design for
Assembly (DFA) with a decision-based extension called Decision Support Problems
(DSP). DSPs are abstracted DFA principles for use during conceptual design.

66
Smith and Sankaran (2003) apply a methodology for probabilistic
multidisciplinary design optimization. Reliability analysis methods are demonstrated in a
multidisciplinary system framework.
Sycara and Navinchandra (1992) explore the use of case-based reasoning to create
a computerized Case-based Design Engineering Tool, CADET. The system attempts to
use the physical attributes, function, and behavior of designs to retrieve candidates from a
case database.
Wilcox and Wakayama (2003) discuss the use of commonality to minimize
aircraft design costs. Commonality is used to simultaneously optimize designs across
multiple aircraft, as opposed to just derivative aircraft. This type of approach has been
used in automobile manufacturing for many years, but an extension into the arena of
aircraft design has not been studied. The study shows that significant reductions in
design time and ultimately total cost can be accomplished by defining commonalities
between aircraft designs in general, not just derivatives.
Xu et al. (2002) present a conceptual NC configuration model based on
cooperative multi-agents. Modularization is a fundamental building block of the system.
Each module is a unique entity participating in design, and the product design process is
accomplished by the cooperative work of agents. The prototype system is in the infancy
of development.
Ye et al. (2000) use feature-based design and object-oriented representation to
provide guidance on the hierarchical assembly of injection molded parts. The use of
features allows the designer to work at a higher-level of abstraction and objects combine

67
data structures and behaviors. Design for assembly (DFA) concepts are explored using
the relationships between assembly objects, such as part-of (next assembly), fit (size),
and limits of motion.
Yang et al. (2003) integrate Quality Function Deployment (QFD) with fuzzy set
theory to create a fuzzy QFD methodology for producibility evaluation.
Zhang et al. (2001) develop a prototype knowledge-based system for conceptual
design (KBCS). The prototype uses functional reasoning processes to match a
production rule base to an object-oriented behavior base. Desired engineering
requirements/functions are causally matched in order to define design solution starting
points.
Zhao and Zhang (2002) study the use of extenics during the conceptual design
phase of mechanical products. Extenics is a new artificial intelligence mathematical tool.
The study applies extenics to a conceptual tool storage design problem. Comparisons are
made to neural network and fuzzy logic approaches.
3.2.2 Group 2: Engineering Design Activity – Design Systems With Cost Emphasis
This group of research deals with the Engineering activity on the GPDP IDEF0
diagram Figure 2.5, and the design systems and trade studies mechanisms. The
methodologies are stand-alone efforts within the Engineering activity, and do not require
linkage to other existing activities or enterprise systems. The emphasis is on
improvements to engineering design systems for use by the design engineer during the
early design stages of product development. The primary goal of the research is to couple

68
part design knowledge with cost information in order to facilitate better design decision
making. Some use of manufacturing process data may be used, but the knowledge is in a
system that is not directly linked to vendor or in-house capability databases.
Ayag (2005) discusses the use of the analytic hierarchy process (AHP) in
combination with simulation techniques to evaluate design alternatives during conceptual
design. A framework for AHP integrated simulation analysis and seven generic
application steps are presented. A case study for a manufacturing system producing
plastic injection molded parts for an auto-supplier is presented.
The manufacturing organization is analyzed, and operations data are broken down
into groups by weight, lot size, common engineering materials, the types of molding
machines used, machine capacity, assembly, and testing. A generic molding sequence is
developed, and criteria are established as ease of manufacture, color, durability, and
weight. A simulation procedure is then utilized to determine the potential matrix of
conceptual design alternatives and associated costs. The resulting matrix of information
provides sensitivity ranges that can assist a designer with decision making. For example,
if concept X has a specified set of attributes, then it can be expected to cost 20% more
than concept Y having a variation on attributes.
Ayag proposes that future work will entail creating a knowledge-based system
that operates on pre-defined rules via a user interface. Fuzzy logic is also a possibility to
add to the AHP approach.
Boothroyd (1994) utilizes the philosophy of Design for Manufacture and
Assembly (DFMA) as the basis for early design decision making. DFMA time standards

69
and knowledge bases are created to estimate assembly costs, detail part costs, and tooling
costs without detail drawings. Case studies are used to discuss DFMA application
successes with regard to part count reduction.
Butterfield et al. (2004) use a multidisciplinary approach to design a cascade box
for a thrust reverser. Three different conceptual design configurations are analyzed using
finite element analysis (FEA), computational fluid dynamics (CFD), and a SEER-DFM
costing software package. After several design iterations, the researchers are able to
make cost inferences related to the differing design features on each conceptual design
configuration.
Choi et al. (2005) describe a computerized tool for estimating the cost of
manufacturing composite parts. The system uses a Visual Basic for Applications (VBA)
graphical user interface to input certain design features and key elements of the assembly
process. Interfaces with CATIA V5, (Computer Aided Three-dimensional Interactive
Application), extract geometric properties directly from electronic representations. A
stand-alone Production Cost Analysis Database, (PCAD), generates a total cost estimate
using first order velocity models.
Curran et al. (2005) discuss the use of genetic-causal cost modeling during the
conceptual design of aircraft. The genetic makeup is inherited from the design definition,
product nature, and process nature as organized into defined groupings. The causal
makeup is characterized by drivers that are influenced by items such as weight, parts
count, sizing, material selection, and other environmental factors. The methodology is
demonstrated using engine nacelles examples. Linear regression is used to develop cost
70
models based on the genetic-causal factors. The genetic aspect identifies weight, part
count, and fastener count as significant cost identifiers. The causal aspect identified
material, part fabrication processes, assembly, and procurement cost. The genetic-causal
models provided better results than traditional weight driven parametrics.
Curran et al. (2006) present a methodology for modeling aircraft cost during the
conceptual design phase using engine nacelles examples. The study selects a group of
features known early in the design process, and then develops stand-alone cost models
sensitive to these features. The selected features are weight, fan diameter, air wash area,
and thrust. Actual data from prior nacelles manufacturing effort is broken into six
manufacturing steps, and the cost drivers are used for linear regression modeling of cost.
Other costs for raw materials, purchased parts, support, amortization, and
“miscellaneous/other” are derived using actual data and factors. The modeling effort
ascribed in the paper claims to achieve better results that just parametric approaches
based on weight alone.
Giachetti (1997) proposes a set-based approach based on relational databases
could be used to provide a ranked list of manufacturing process and material selection
alternatives during early design. Material properties, process capabilities, and costs are
represented in a relational database. Then, mathematical approaches, i.e., relational
algebra, possibility theory, and trapezoidal fuzzy numbers, are used to produce a list of
ranked solution alternatives.
Hsu and Woon (1998) present a thorough overview of current research in
conceptual design products, and then discuss their interpretation of the best future

71
research direction. Data mining, neural networks, genetic algorithms, and machine
learning techniques are deemed to be promising. Future research direction proposals are
the primary outcome of the study.
Johnson and Robinson (2005) discuss the process used to develop a conceptual
design for the X-43D, a Mach 15 flight test vehicle. The study provides insights into how
a baseline conceptual design and key technical issues are used in the development of a
high-level project plan, including work breakdown structure (WBS) costs and key
programmatic risks. It is not readily apparent how the results would be repeatable for
another design configuration.
Kroll (1992) introduces a new approach for performing cost estimates to guide the
design process through what is called Function Realization Cost (FRC). Instead of using
features or processes to estimate cost, FRC utilizes functional allocations of cost.
Specifically, data are categorized by four simple definitions and their associated
arguments; FRC variables are function, form, context, and cost. Kroll claims that the
strength of the approach lies within its simplicity. In some regards, the approach seems
very similar to grouping data to develop parametric cost relationships. It is difficult to
determine without more detail, and the proposed extensions discussed could not be found
in the literature.
Oh et al. (1995) propose the use of constraint networks coupled with DFA
principles to facilitate design decision making. A conceptual prototype, SPARK, is
discussed.

72
Park and Khoshnevis (1993) describe an approach where real-time computer
aided processing planning (RTCAPP) is coupled with precedence rules, process rules,
machine rules, tool rules, manufacturing facts, and a cost evaluation module to produce
real-time cost feedback to design engineers.
Rais-Rohani and Greenwood (1998) discuss the development of systems to be
used by designers during the early design stages that are based on product and process
coupling within a framework of integrated process and product development (IPPD) and
multidisciplinary design optimization (MDO). The three-tier approach described in this
paper describes a procedure by which product and process requirements coupled. A
manufacturability analyzer examines key manufacturability compatibility factors. The
concept of variable-complexity cost estimation (VCCE) is introduced to obtain a relative
cost measure for trade studies. An enterprise model addresses factors related to non-
manufacturing entities throughout the enterprise.
Rowell and Braun (1999) present a multidisciplinary conceptual design
optimization framework and approaches, which uses a variety of computational
approaches, including parameter, gradient-based, stochastic, and collaborative methods.
Design to cost techniques are part of the conceptual design framework. The application
examples are geared toward the development of space transportation systems.
Sandberg (2005) discusses how knowledge enabled engineering (KEE) can be
used to improve overall manufacturability. KEE includes engineering design, knowledge
based engineering (KBE), and related knowledge intensive tools, used in unison, in order
to improve decision making during the concept phase. First, design and process
73
knowledge is formalized into classes, properties, and rules. Next, a cost model is
developed that is sensitive to the acquired knowledge in the formalized database. Lastly,
once a design has been generated into a concept view, the user selects various
manufacturing properties from a list, and the inputs generate a parametric cost value
and/or producibility feedback. A prototype example of a flange design is presented.
Schlimbach and Mitschang (2006) develop a methodology for estimating the
process time associated with thermoplastic composite tape placement using a
combination of geometry, weight, and complexity. Complexity is further defined by the
number of local reinforcements, fiber angles, machine axes, machine movability, and
acceleration/deceleration. Once the cost model is defined, a variety of response surface
procedures are used to study the possible combinations of factors and related cost.
Taleb-Bendiab (1993) presents a conceptual knowledge-based system called
Concept Designer using a combination of design knowledge reuse and a heuristic costing
function. Design concept reuse is based on reusing past cases, components, or concepts.
Various Concept Designer system representations of proposed solutions are presented
along with conceptual schematics.
Vollerthun (1998) discusses the development of an Integrated System Model
(ISM) for use on the design of a Solar Probe spacecraft being studied at NASA’s Jet
Propulsion Laboratory. The ISM combined three tools: 1) subsystem simulation tool, 2)
cost estimating tool, and 3) effectiveness rating tool. First, a simulation tool models size
(dimensioning/features) and performance of a proposed subsystem. Next, a cost
accounting tool combines the dimensions with cost estimating relationships that match

74
the Work Breakdown Structure. Finally, a tool predicts the effectiveness of the proposed
design. The paper discusses how the ISM is used to identify the primary cost drivers of
design.
Wall (2004) discusses model-based design within the context of space missions.
Space missions are divided into four phases: 1) conceptual design, 2) formulation, 3)
implementation, and 4) operations. In conceptual design, the determination of the
existence of a feasible design is performed, a total cost is estimated within an accuracy of
+/- 30%, and a realistic schedule is determined. The formulation phase involves
engineering a buildable design. The implementation phase involves the fabrication,
purchase, and test. Finally, the operations phase begins with the launch of the spacecraft.
Wall further asserts that model-based design has been used during conceptual
design for many years, but the goal of extending these methods to the later phases of
design has been obscure. In order to improve the ability to explore design trade spaces, it
is necessary to develop connections between conceptual and detail design tools. In this
article, a prototype system called MMPAT (Multmission Power Analysis Tool) is
presented to illustrate how conceptual design tools can be linked to tools used in the
formulation phase. The system utilizes a predetermined set of key user parameters and
cost models to allow mission-wide trades. The article says that an operational version of
the tool is in work, and that a full suite of models is planned for development, but no
follow-up references were located.

75
3.2.3 Group 3: Engineering Design Activity - Logistics Engineering Emphasis
This group of research deals with the Engineering activity on the GPDP IDEF0
diagram in Figure 2.5 and the logistics plan control, trade studies, and IPT mechanisms.
In particular, logistics engineering issues and related cost assessments during the early
design stages are discussed. In general, logistics can be defined as the procurement,
distribution, maintenance, and replacement of products, material, or personnel. The
intended users are the design engineers and members of a concurrent engineering team.
The efforts result in stand-alone systems that are not linked to other enterprise systems.
Smith and Knezevic (1996) discuss the concept of increasing quality and reducing
overall product cost by focusing on supportability. Spares and support equipment
estimation are highlighted.
Dowlatshahi (1999) proposes the use of Design for Logistics (DFL) along with a
modeling approach for logistics called Bond Energy Algorithm (BEA). DFL is further
broken down into four subgroups: logistics engineering, manufacturing logistics, design
for packaging, and design for transportability. BEA is a clustering approach. The goal of
BEA is to group design factors into Design Factor Families (DFF) and Module Families
(MF). This allows designers to consider design factors common to a set of modules.
Theoretical application examples are presented.
Wahl et al. (2001) discuss the effects of testing on logistics systems and cost.
Testing is required for preventative maintenance and repair, and Design for Test (DFT) is
a methodology to consider these logistics costs during design. The paper presents the
prototype of a new tool called Systems Test (ST); a model based cost optimization tool.
76
3.2.4 Group 4: Engineering Activity – IPT Systems Emphasis
This group of research deals with the Engineering activity on the GPDP IDEF0
diagram in Figure 2.5. The mechanisms considered are the IPTs and legacy systems.
The primary emphasis is on the re-design of processes, systems, and methodologies to
support the collaboration of people in different disciplines and in different locations in
the new product development process. Some of the literature is dedicated to the
discussion of various theories to improve IPT product development decision making,
while other research deals with a particular computer software only, without changing
existing processes. Lastly, some of the research focuses on studies of how IPT members
interact.
It is possible that a few of the conceptual approaches in this group of research
could have application to other activities besides Engineering. However, it was not
readily apparent whether the resulting systems were something other than stand-alone
systems. Ongoing system linkages to activities downstream of Engineering are not fully
explored or explained.
Austin et al. (2001) conduct an experimental workshop with multidisciplinary
design professionals and mapped their progressions in decision making phases. The
results are used to develop a preliminary framework for use in developing design activity
models.
Barski et al. (2001) propose the use of group problem solving, conforming
decision making, and simulation to develop decision support system (DSS) environments.
The DSS technology would support manufacturing systems organization management for

77
strategic planning and conceptual design. The frameworks of two prototype systems are
discussed, MultiExpert and DIANA-11.
Carballo and Director (2001) apply constraint-based heuristics to collaborative
design processes called active approach to design process management (ADPM). In
order to evaluate ADPM, an evaluation environment called TeamSim is developed.
Simulation results suggest that ADPM is a viable approach.
Chen and Liang (2000) propose the unification of the principles of virtual
enterprise and concurrent engineering to define a new approach called Allied Concurrent
Engineering (ACE). The authors present a conceptual system architecture that facilitates
communication, control, and coordination of the multifunctional product development
environment.
Huang and Gu (2006) describe the dynamic characteristics of the product
development process, and attempt to model a product development process as a dynamic
system with feedback. A fuzzy evaluation and design structure matrix (DSM) approach
is illustrated. The results suggest how design constraints, design processes, and designer
preferences can be optimized based on reorganization.
Huang et al. (2001) develop a prototype, web-based platform for pragmatic online
project management information (POPIM). POPIM is designed to manage collaborative
product development projects. POPIM provides a common workspace for
multidisciplinary teams in different locations to use.
Huifen et al. (2003) present a model and conceptual architecture for a virtual
enterprise system based on feature-based collaborative design. Features are regarded as

78
the communication unit of the model and facilitates processing between multiple users at
different places.
Hung and Adeli (1994) develop an artificial neural network environment,
(ANNDE), using object-oriented backpropagation techniques. The integration of
ANNDE with a knowledge-based expert system is presented as a viable means of
improving the structural design process.
Kan et al. (2001) develop virtual reality-based collaborative environment (VRCE)
using VNet, Java, and Virtual Reality Modeling Language (VRML) to demonstrate the
potential for use in the collaborative design process of small companies. A theoretical
case is used to illustrate the application of the system.
Lee et al. (2001) propose feature-based modeling as the means for integrating
engineering and supporting activities. By using features in a wide range of applications,
a web-enabled distributed collaborative environment would be possible.
Lee and Kelce (2003) develop a conceptual model of a new tool called Total
Manufacturing Information System (TMIS), based on an integrated systems concept.
Decision making is no longer sequential, but is instead, concurrent. The authors present
the conceptual system architecture for the TMIS supported product development
environment.
Leihn (2003) asserts that online collaboration as being the most important next
step in improving the product development process. New internet-based technologies
used in conjunction with XML (Extensible Markup Language) and J2EE (Java 2 Platform
Enterprise Edition) are discussed.
79
Li et al. (1996) present a study that concentrates on automating the conceptual
design process using heuristics and qualitative techniques. Specification libraries are
created for a standard set of devices that cataloged function requirements, behavior, and
qualitative descriptions.
Ma et al. (2002) discuss an approach to implement the architecture to support
network-based conceptual design for geographically dispersed design teams. The
approach is based on current CAD systems and the use of multi-modal technology, which
integrates gesture, speech, and sketch surfaces with traditional interfaces.
Ma and Tong (2003) propose the use of associative feature modeling for
concurrent engineering integration. An associative feature allows for a consistent set of
data among users with different functional views.
Miller (2001) discusses the need for collaborative product definition management.
Investment in collaborative software was stressed as being the primary means to connect
physical and intellectual supply chains across the manufacturing enterprise.
Neff and Presley (2002) implement a prototype system called Concept Design
Center (CDC). The software demonstrates how teams could theoretically solve
concurrent engineering problems in a collaborative environment.
Qin et al. (2003) investigate virtual reality modeling language (VRML) design
tools. In particular, the use of sketch and simulation design tools that are web-based and
linked to behavioral simulation programs.
Reich et al. (1999) propose the use of n-dimensional information modeling (n-
dim) to facilitate the development of Agile Design Information Systems (ADIS) for use

80
in the Collaborative Product Design (CPD) environment. The conceptual system
architecture is presented, along with a matrix of n-dim features matched to ADIS
requirements.
Schut (2003) reviews the state of the art in E-Collaboration software tools.
E-Collaboration is being used by some companies, but is not progressing as expected.
The most successful implementation cases are reported for mature designs that have CAD
files available for viewing.
Sky and Buchal (1999) develop an integrated conceptual product life cycle model
within a virtual collaborative environment framework to support concurrent engineering.
The major emphasis of the study is on the technologies, such as text-based chat,
whiteboards, video conferencing, audio communication, and net meeting.
Sundar et al. (2001) present a framework for the facilitation of agile collaboration
technology. The framework suggests not only a need for improved communication
platforms, but that additional support is required to make certain that team members are
being provided feedback on the product features, time to market, and cost within the
communication environment.
Tay and Gu (2002) describe a function-based product model for conceptual
design decision making support. Product information is represented in an object-
oriented manner. Function-form mapping is used to correlate functional and physical
domains. A prototype system is partially demonstrated.
Tolometti and Sanders (1998) propose a conceptual framework for implementing
a collaborative enterprise environment (CEE) to support Air Force acquisition reform.

81
The paper presents a framework that supports enterprise level collaboration of
multifunctional experts using a CEE, along with the conceptual system architecture called
Decision Support and Resource Management System (DSRMS).
Wang and Chien (2003) present a conceptual prototype of a web-based group
decision support system (GDSS). The system architecture is based on object-oriented
and agent technologies. Two modules are demonstrated that use rule-based reasoning
and Bayesian network-based reasoning. An example demonstrates how the system could
be utilized to assist with a pricing decision.
Wang et al. (2002) present a state of the art review and future trends discussion of
collaborative conceptual design systems. The authors conclude that knowledge
management and reuse in design are the most important areas of research. Web-based
and agent-based approaches are identified as dominant and enabling strategies.
Developing a shared ontology is seen as the most difficult task.
Xu et al. (2001) propose a constraint-based distributed intelligent conceptual
design environment system model as the means of managing computer supported
collaborative conceptual design (CSCCD). Samples of the constraint-based distributive
knowledge representation model are presented.
3.2.5 Group 5: Engineering and Planning Activities – Systems Integration Emphasis
This group of research deals primarily with the Engineering activity and the
Planning activity on the GPDP IDEF0 diagrams Figure 2.5 and Figure 2.6, including
planning systems, engineering systems, and IPT mechanisms. The primary emphasis is

82
the interface between design engineering and process planning systems. The premise is
that expert planning systems or planning knowledge-based support systems can help
facilitate the link between CAD and CAM domains. Ultimately, the improvements will
facilitate earlier and more effective decision making. The intended user is the
manufacturing engineer, planning expert, or design engineer.
Allada and Agarwal (1996) propose the use of design feature relationships to
formalize the process of determining machining operation sequencing. The paper defines
a variety of negative and positive feature interactions, and then provides examples of IF-
THEN statements to drive sequencing decisions.
Cutosky et al. (1993) assert that the most effective way to design products is to
develop products concurrently with manufacturing plans. Their approach, process-
oriented design, couples design and manufacturing features to generate process plans.
Expert systems that emulate human design teams is discussed. On-going work on a
prototype system, First Cut, is presented.
Feng and Song (2000) provide an overview of the various aspects of information
modeling to integrate early design knowledge with process planning. An activity model
for the conceptual design process is presented along with an object model for classes used
in conceptual design. Standard interface specifications between design and process
planning systems are discussed.
Hale et al. (2003) discuss the development of a prototype of a knowledge-based
system that is capable of generating a process plan and costing of an aircraft engine using
minimal design information. The system includes a common ontology, rules for

83
generating a generic manufacturing sequence, and a comprehensive library of rules and
algorithms for creating a parametric cost estimate. A great deal of progress was reported,
but the amount of information required to make the system functional poses challenges.
Hayes and Wright (1989) develop a conceptual prototype system that is modeled
primarily after a human planning process. Design features and subfeatures are defined
for various part configurations. An expert system contains rules and guidance associated
with features and subfeatures. Feature interactions are used to guide search the system to
develop a viable process plan.
Kastelic et al. (1993) propose the use of relational databases of process
parameters to drive computer-aided process planning (CAPP). The relational databases
would contain numerical values of process parameters and be coupled with expert system
data and various design feature libraries. The conceptual design and architecture of the
proposed relational database approach is discussed.
Krause and Schlingheider (1995) discuss the use of knowledge-based software
tools (KBST) to solve a variety of design and development problems. Their fundamental
requirements for KBST are object-oriented programming, rule-based processing, and
algorithmic knowledge. The planning task is theoretically accomplished by using
features coupled with stored planning knowledge.
Matsushima et al. (1982) demonstrate how artificial intelligence techniques could
provide design feedback and generate the optimum manufacturing sequence based on
part features.

84
Molloy et al. (1993) explore the use of feature-based modeling to integrate Design
for Assembly (DFA) and computer-aided process planning (CAPP) systems. The
theoretical architecture of the envisioned system is presented.
Phillips et al. (1984) perform a preliminary investigation into the use of artificial
intelligence techniques to develop a system to integrate CAD and planning knowledge to
generate process plans. The theoretical system consisted of three parts, a planning expert
system, a part database, and a process database. Part features are used to couple the three
subsystems and generate process plans.
Pratt (1984) proposes the use of automatic feature recognition as a means to
automating process planning. Simple machining features from a particular type of
boundary representation are utilized.
3.2.6 Group 6: Business Management, Engineering, and/or Factory Management Activities - High-Level Cost Estimation Tasks Without
Process Plan Generation Emphasis
This group of research deals with cost estimating tasks potentially performed
within the Business Management, Engineering, and/or Factory Management activities on
the GPDP IDEF0 diagrams, Figures 2.4 and 2.5. The mechanisms considered are cost
models, design systems, trade studies, and cost studies. This group of research deals with
the development of cost estimating tools that can be utilized during early product
development, and they perform with high-level information. The intended users are
engineers and cost analysts. The tools do not utilize a “best guess,” or intermediate,
process plan approach to establish an estimating baseline and discrete tooling
85
requirements and scheduling considerations are not considered. (An intermediate plan
would occur before a detailed final process plan was developed.) Hence, there is no
linkage to the activities downstream of the engineering activity. For example, the design
feature of “hole” could be estimated, but the cost information would not be sensitive to
where the hole was drilled in the factory, what type of drilling process was used, or the
specific tooling costs and scheduling impacts of using one process versus another.
Asiedu and Gu (1998) propose that cost should be added to the “Design for X”
realm. In past undertakings, the “X” has stood for assembly, manufacturing,
producibility, etc., and while these approaches reduced cost, the design criteria they
utilize is not cost.
Bode (2000) demonstrates the use of neural networks for cost estimating using a
personal computer development case as a pilot application. The cost estimating
performance is compared to linear and non-linear parametric regression. Neural
networks are deemed better when fewer cost drivers are known. The desired parameters
are cost drivers of five or six, and at least 50 to 100 past cases available.
Chen and Jang-Jong (1999) combine design rules from DFM and DFA with
feature-based cost value to develop a prototype online cost evaluation tool for injection
molding.
Creese and Patrawala (1998) provide a thorough review of feature-based cost
modeling efforts published in the 1950s to make the point that feature-based cost
modeling is not a new idea. Then, they proceed to develop a cost approach that uses
elements of feature-based cost and parametric cost modeling.
86
Curran et al. (2001) propose using a multidisciplinary IPPD framework in
conjunction with historical cost estimating relationships (CERs) to improve integrated
aerospace design. Key IPDD drivers are identified using QFD and DFMA principles,
and then correlated to appropriate CERs. Overall performance is measured by using
direct operating cost (DOC).
Greenwood (2003) defines key processes that provide the foundation for the
development of an Insitu Design Cost Trades (IDCT) tool and future design/cost decision
support systems, including cost estimation, requirements engineering, and product
design. This paper is one of the few that considers risk and uncertainty, including a
Monte Carlo simulation engine. A cost analysis decision support system architecture and
the results of a working prototype of the IDCT tool are presented.
Jahan-Shahi et al. (1999) propose using fuzzy sets and probability distributions
within an activity based costing (ABC) framework to address the problem of uncertainty
in estimating the cost of flat plate processing. Mamdani-style fuzzy inferences are used
to develop a simple, rule-based fuzzy model. Input variables, such as plate size and labor
type facilitated the use of the ABC costing framework.
Jung (2002) uses feature-based methods to develop a conceptual prototype system
for estimation of the metal removal time for machined parts that is subsequently used in
cost estimating models. A metal cutting classification scheme defines features as
rotational, prismatic, slab, and revolving. Equations are used to estimate the processing
time required by feature. In addition, supplementary inputs for machine type, number of

87
machines, tools, cutter type, number of cutters, cutter ID numbers, material type, material
specification, material dimensions, and batch size.
LaMont and Benjamin (1995) introduce a new costing methodology for modular
spacecraft called Dynamic Integrate Cost and Engineering (DICE). Existing engineering
models for selected spacecraft subsystems are appended with hardware and cost
databases to create a new model to output engineering analytical parameters like torque
and momentum with power, weight, and cost.
Park et al. (2002) introduce the approximate product life cycle costing (APLCC)
method for conceptual product design cost estimating. Significant product attributes are
determined using statistical analysis. Neural network algorithms are applied using the
product attributes as inputs and the APLCC as outputs. Trained learning algorithms for
known characteristics of past products provide the estimation of APLCC for new product
designs. A conceptual methodology is presented.
Rehmann and Guenov (1998) present a conceptual methodology for modeling
manufacturing costs at conceptual design based on the blackboard framework of problem
solving. The blackboard framework integrates case-based and rule-based reasoning to
create a new, hybrid knowledge-based adaptation approach. An overview of the
proposed architecture is presented, and prototype was reported to be under development.
Wierda (1990) publishes a survey of design-oriented costing methodologies. The
most widely used approaches included some type of design rules, manufacturability
information, and features.

88
Xue and Dong (1993) propose a methodology for automated concurrent design
based on combining tolerance, feature, and cost models. The conceptual system utilizes
feature-based reasoning, and knowledge and data are stored in clusters. A framework of
the prototype system is presented.
Yeo et al. (1997) develop and apply cost-tolerance relationships for non-
traditional machining processes, in particular, electrical discharge wire machining and
laser beam machining. Four mathematical models are developed from empirical data, and
based on fitting errors; a third degree polynomial model gives the best fit.
3.2.7 Group 7: Business Management, Engineering, Factory Management Activities, and Planning Activities - Detail-Level Cost Estimating Tasks
With Process Plan Generation
This group of research deals with cost estimating tasks potentially performed
within the Business Management, Engineering and/or Factory Management activities on
the GPDP IDEF0 diagrams in Figures 2.4 and 2.5 in conjunction with knowledge that
resides in the planning activity on Figure 2.6. The mechanisms considered are legacy
systems, cost models, trade studies, cost studies, the IPTs, planning experts, and planning
systems. The emphasis of this research is on the development of information systems
that can be utilized during early design that have systemic linkages to detailed (lower-
level) information. The tools utilize an intermediate process plan approach to establish a
detailed information baseline. Hence, there is potential for linkage to activities
downstream of the planning activity, even though it is not explored.

89
The approaches in this group of research highlight methodologies to integrate
design, planning, and cost estimating information for use during the early stages of
product development. In most cases, the design information is used to generate an
intermediate process plan, and then the process plan information is used to develop cost
estimates. In some articles, the primary purpose is to demonstrate a conceptual planning
system, while cost estimating is secondary. The tone of the articles depends on the
emphasis of the author(s). The intended user varies between the design engineer,
manufacturing engineer, the cost engineer/analyst, or a multifunctional team.
Abdalla and Knight (1994) present a prototype system that combines the use of
three components, a CAD automated feature recognition, a manufacturing facility expert,
and a product features expert. Rule-based reasoning and object-oriented programming
are used to develop the interface between the components. Features from CAD are
recognized and expert systems create a process plan and cost estimates.
Brinke et al. (2000) propose a structure based on the Manufacturing Engineering
Reference Model (MERM) for defining products and product characteristics that relate
four cost drivers: geometry, material, processes, and production planning. The system
queries historic databases and makes appropriate matches based on various elements,
relations, and attributes. A viable process plan is generated and costs are estimated.
Evans et al. (1998) develop a framework for using process-oriented cost
estimating as the basis for manufacturing process flow simulation and analysis. A viable
process planning sequence is developed from previous experience or published materials.
Processes are broken down into elemental details, and then customized parametric

90
process algorithms are used to estimate the cost. An Organic Matrix Composite (OMC)
material example is overviewed. (OMC is an advanced material for which little historical
data is available.)
Feng (2005) continues prior research related to integrating conceptual engineering
information with process planning. In this research, the use of web-based intelligent
software agents is discussed. A prototype platform is presented where the user inputs a
variety of details to generate preliminary process planning. Future work includes more
exploration of design factors in order to develop better relationships between design
factors and process selection and the ability to perform complex cost estimating tasks.
Feng and Zhang (1999) describe a conceptual process planning (CPP) prototype
system that is integrated with a conceptual design system. The system integrates
conceptual design and process planning in order to estimate cost. The integration uses
engineering requirements, function, configuration, features, tolerance requirements,
quantity, and delivery date.
Ferrelrinha et al. (1993) outline a knowledge-based expert system HKB.
(German: Herstell-Kosten-Berechnung.) The components of HKB are design,
production planning, and tendering. (Tendering includes evaluation of potential bidders,
bidder selection, solicitation, evaluation, and award.) The three modules of the software
system are rule-based and rely on knowledge stored in tables, symbol catalogs, and
process libraries. Part features and other information are input, a production plan is
generated, and a cost estimate is tendered. (“Tendered” is used in the context that sales
people are utilizing the system. It is not a common term in the United States, but
91
different forms of “tender” are used throughout this article, which was published in
Canada.) An overview of one example is presented.
Geiger and Dilts (1996) develop a conceptual model and partially working
prototype to demonstrate automated design to cost. The conceptual methodology uses
part features and group technology to develop an interim process plan. Activity based
costing is used to organize cost accounting data into a format that will be sensitive to
process costing.
Han et al. (2001) propose a conceptual approach for integrating part features,
process planning, and manufacturing process cost. Hint-based reasoning (HBR) and
integrated feature finder (IF2) are used to integrate CAD data with machining sequence
knowledge. Cost equations are used to generate cost estimates based on the anticipated
machining sequence developed from process planning knowledge.
Khoshnevis et al. (1994) propose an architecture for a cost based system referred
to as real time computer aided process planning, (RTCAPP). A knowledge-based
hierarchical planning scheme uses multi-bank rule matching to generate interim process
planning. Cost estimation is performed using feature-based and equation-based
approaches that are linked to processes.
Liebl and Hoehne (1999) describe a procedure for determining costs concurrently
with design using a feature-based CAD system. The feature-based cost analysis modules
generate a viable process plan from CAD system design features and provide cost
calculations, comparisons, and forecasts.

92
Lukibanov et al. (2000) develop a conceptual process planning system, Socharis,
for polymer composites manufacturing planning. DFM knowledge is translated into a
conceptual process plan using various problem-solving modules using features, shape,
joining, and part data. The refining module uses cost to develop ranked manufacturing
plans.
Ou-Yang and Lin (1997) present a framework for estimating early manufacturing
cost using a feature-based approach. Features are used to develop the process sequence
and projected cost. The framework includes, but is not limited to, a feature library, a part
database, feature-based CAD tools, feature manufacturing times, feature
manufacturability rules, feature specifications file, machine specifications file, and
manufacturing feature cost file. The approach requires that manufacturing and
engineering data be retrievable in a feature-based format.
Sharma and Gao (2002) describe a feature-based conceptual design system
(FBCDS) for use in progressive design and manufacturing evaluation. The system uses a
feature-based approach to generate an interim process plan. An embedded cost system
provides the cost of iterative designs.
Shehab and Abdalla (2001) propose a system for manufacturing cost modeling to
support a concurrent engineering environment. Feature-based modeling is used in
conjunction with feature-based knowledge bases for machines, production rules,
machining times, etc., to generate a process plan. Cost algorithms, heuristics, and fuzzy
logic are used to generate cost estimates and analysis of uncertainty. Some features of a
socket are used to generate cost for a pocket, hole, and slot.

93
Shing (1999) develops a spreadsheet-based program to rapidly estimate the
manufacturing costs of molded part designs. Preliminary concept sketches provide the
design input. Features and design attributes are matched to tolerances and production
rules in order to generate a process plan. Costs are calculated using a series of equations
and costs sensitive to features and design attributes.
Tseng and Jiang (2000) develop an activity-based cost analysis methodology to
use in conjunction with feature-based design and feature-based planning. The framework
assumes the existence of feature-based design and feature-based process planning
systems. The contribution of the research is the proposed methodology to incorporate
activity-based cost analysis.
Wei and Egbelu (2000) propose a framework for estimating machining
manufacturing cost using “And/Or tree” representation and decomposed removal volume
(DRV). The input for the framework comes from an “And/Or tree” graph, then DRV unit
cost data are used to generate the process plan routing, and the total manufacturing cost.
3.2.8 Group 8: Business Management, Engineering, Factory Management, and Planning Activities -Detail-Level Cost Estimating and Scheduling Tasks
This group of research deals with the Business Management, Engineering,
Factory Management system, and Planning activities on the GPDP IDEF0 diagrams,
Figures 2.4, 2.5, and 2.6. The mechanisms considered are cost models, legacy systems,
trade studies, cost studies, schedule models, scheduling simulations, planning experts,
and the IPT.

94
The approaches in this group focus on the integration of design, work instructions,
cost estimating, and scheduling systems information. This research recognizes that the
best way to improve product development is to model it as a network of interconnected
activities. The literature in this group discusses methodologies that consider scheduling
decisions concurrently with other decision making, particularly design and cost.
The number of articles in this group of research is small, but they begin to more
closely emulate (imitate) what takes place in the real world. Scheduling is most often a
key factor in product development decision making, and hence, should be systematically
considered.
For example, the schedule sometimes causes a design to be fabricated using NC
machining, when in actuality, the "low cost" decision using traditional estimating
methods is a sheet metal design. When the makespan of a design is on the critical path,
it becomes increasingly difficult to do trade studies. Intuitively, it is known that "time is
money," but it is difficult to estimate and trade program schedule performance against
cost performance. In addition, the timing of tasks and associated expenditures are
necessary building blocks of project plans, capacity analysis, rate-tooling studies,
financial forecasts, and many other management systems/tools.
Browning and Eppinger (2002) integrate several product development processes
into a single model, and then analyze changes using simulation. Outputs include cost and
schedule outcome distributions. Alternative process architectures are compared. The
authors asserted that in order to increase efficiency and predictability in the product
development processes the entire process needs to be modeled as a network of activities

95
that exchange deliverables. Design delivers a drawing, planning delivers work
instructions, estimating delivers projections of process cost, scheduling provides
estimates of the timing of the tasks, etc. Effective trade studies should be done in a
manner than consider the interconnection of deliverables, especially cost and schedule
risk.
Mosher (1999) develops a prototype tool for conceptual spacecraft design, the
spacecraft concept optimization and utility tool (SCOUT), which couples design
information to other criteria of the trade study process. Genetic algorithm optimization is
used to demonstrate the potential to use SCOUT in the cost and schedule trade selection
process.
Shobrys and White (2000) assert that design, planning, scheduling, estimating,
and control systems must be integrated in order for companies to make significant
improvements in internal process efficiencies. Proactive integration, the removal of
information silos, and designing new work processes that integrate multiple traditional
functions are seen as the means for improving traditional approaches. The authors
provide examples of how multidisciplinary workers and processes provided increased
efficiencies.
Murman et al. (2000) assert that value is a function of performance, cost, and
time. In order for aircraft manufacturing to be better, faster, and cheaper, (BFC), then the
elements of value must be concurrently considering as a part of decision making
processes. The authors demonstrate how key characteristics coupled with relative
96
probabilities could be used to project cost and schedule decisions making solution spaces.
The result is an optimized value function for BFC results.
3.2.9 Group 9: All Enterprise Activities – Knowledge Reuse Emphasis
This group of research deals with the all of the enterprise activities shown on the
GPDP IDEF0 diagrams, Figures 2.4, 2.5, 2.6, and 2.7. The emphasis is on linking the
mechanisms used prior to engineering release with those mechanisms used to created
deliverables and monitor performance after the engineering design is released. In
addition, the lessons learned controls in various activities are linked to facilitate
knowledge reuse and enterprise level learning.
The approaches and methodologies take a “bigger picture” approach in how they
deal with product development decision making. The goal is to create fully integrated
systems that are geared toward capturing organizational knowledge and learning to be
reused seamlessly within all enterprise activities. The downside to this research is that it
is primarily still at the conceptual level.
Liang and O'Grady (2002) couple object-oriented formalism with feature-based
engineering principles in order to achieve the goal of knowledge reusability in the
situation where participants are geographically separated could be best facilitated by
coupling object-oriented formalism with feature-based engineering principles. Their
approach is called feature-based distributed concurrent engineering, (FBDCE). The
conceptual framework for the architecture, process model, and implementation are
presented.
97
Richards (2000) presents a user-centered approach for building knowledge-based
systems that incorporated knowledge reuse. The knowledge acquisition (KA) technique
is used in conjunction with ripple-down rules (RDR) to develop a knowledge-based
system (KBS) prototype that will allow users to access knowledge in a variety of ways.
This approach is broader than the traditional method of trying to build a KBS to emulate
one, pre-defined expert.
Verganti (1998, chapter 11) proposes the use of reciprocal interdependencies and
feedforward planning to improve decision making during conceptual design. General
frameworks describing information reuse possibilities are presented in the context of
teaming. The research describes how information from past product development efforts
can be used in conjunction with anticipated manufacturing constraints to facilitate design
concept generation and related decision making. (Chapter 1 provides an in-depth
discussion of Verganti’s work and it is not reiterated in detail here.)
Xiong (2003) takes a very high-level approach to discussing global manufacturing
by using conceptual design, and begins with human society, manufacturing system, and
natural environment. Then, he provides the frameworks for the forming process of a
conceptual design system and a product conceptual design system. The article
emphasizes the significance of the “factor of man” and society in developing a
conceptual design system (CDS) where knowledge is effectively reused and continuously
renewed. Instead of promoting the progress of computers, knowledge renewal and
intelligent networks need to work to educate all actors in the conceptual design process.
The renewal of knowledge of the workers should be viewed as one of the critical

98
components of competitive advantage. In addition, multi-media technologies and
training in multiple disciplines and theories should be viewed as critical to the global
manufacturing system of the future. The paper claims that information will flow
seamlessly throughout the enterprise, and the organizational barriers will dissolve when
man, machine, and environment are viewed as a whole system.
Xu et al. (2007) present a theoretical decision support system for product design
in a concurrent engineering environment. Fuzzy numbers and fuzzy line segments are
used to support decision making during multi-stage evaluation. Unlike the other
members of the group, this work does not emphasize knowledge reuse, and is geared
toward using multi-stage fuzzy logic to organize abstractions.
3.3 Synopsis of Literature Review Findings
The majority of the research dealing with the product development process and
related decision making deals with the engineering activity on the IDEF0 diagram and the
activities that take places prior to design release, i.e., Groups 1 through 4. While there is
often the recognition of the need to use information that resides in other activities, the
resulting solution normally creates a stand-alone methodology or prototype that is not
integrated with other existing activities on the IDEF0 diagram of the product
development process.
Cost estimating and trade studies are emphasized in the majority of the research.
Cost related techniques are discussed in Groups 2, 6, 7, and 8. Many techniques are
reviewed, but the ones utilizing information that is linked or linkable to the process plan

99
hold the greatest promise. In general, IPT members prefer to work with information that
“looks like” what they are used to seeing in the production environment.
The Planning activity is where engineering information is translated into a critical
piece of manufacturing control data that will follow a part or tool throughout its life on
the shop floor -- the work instructions. Hence, the research found in Groups 5, 7, and 8
provide good starting points for integrating the activities that occur after design release
with activities that take place prior to design release.
As more activities are considered in conjunction with the Engineering activity, the
amount of available research becomes less and less. The increasing complexity makes
the presentation and demonstration of methodologies equally complex and time
consuming. The research in Group 8 is the only place where multiple activities are
considered in conjunction with cost and schedule. As asserted by Verganti, most of the
published literature does not reflect the task complexities involved with teaming and
early design decision making.
A small percentage of the research takes a “bigger picture” view of the product
development process. It focuses on how best to collect data and format knowledge for
reuse throughout the enterprise. Knowledge as it exists today is housed in various
formats and spread throughout the activities, and in most cases it is only formatted for the
next user in the product development sequence. The needed improvement is to create an
approach that allows for seamless information flow across all activities.

100
3.4 Summary and Conclusions
For many years, researchers have been working on approaches that consider the
product development process within the context of one activity or a group of activities,
and these approaches have not yet yielded methodologies and frameworks with industry-
wide acceptance. It is apparent that there is a need for continued research related to
manufacturing enterprise product development process improvement.
The GPDP approach and associated IDEF0 diagrams utilized by this research
offer new perspectives not represented in the literature. These perspectives coupled with
the insights gleaned from the literature review serve as a good starting point for further
research.
Based on the literature review efforts, the area in most need of further research is
found to be Group 9. Group 9 seeks to integrate all the activities within the product
development process, and it emphasizes knowledge reuse. Intuitively, it stands to reason
that in order to capitalize on the theories related to concurrent engineering, life cycle
management, and virtual enterprise that Group 9 holds the greatest promise. In the long
run, methodologies, frameworks, and approaches that do not concurrently consider all of
the activities in the process flow diagram are likely to yield localized, suboptimal results.
Among the promising efforts identified in Group 9, the ideas of Roberto Verganti
(1998, chapter 11) are selected for further study and extension by this research. The
Verganti approach involves managing reciprocal interdependencies using feedforward
planning concepts.

101
CHAPTER IV
RIM CONCEPTS AND THE PRODUCT DEVELOPMENT LIFE CYCLE
In this chapter, some of the more commonly held views of the product
development life cycle are discussed in the context of reciprocal interdependencies
management (RIM). Where appropriate, relevant assertions are offered in the context of
aircraft manufacturing.
In Chapter 1, reciprocal interdependencies are defined as the knowledge links
between activities or entities. Reciprocal interdependencies represent the information
exchange that takes place between activities/entities in order to solve a problem (or,
address a question) during the product development life cycle. Feedforward planning is a
proactive approach to managing reciprocal interdependencies, and commonality and
selective anticipation are strategies that are utilized within the context of feedforward
planning.
There are several figures that are referenced in slightly different formats in a great
deal of literature that speak to the problems related to the product development process.
For the discussion that follows, the information from two different authors was combined
to develop Figure 4.1. (Chapman, 2004; Kirby, 2001.) Figure 4.1 illustrates the
following four factors.

102
• Design freedom (the ability to act on information and make changes to the design) • Cost commitment (the majority of total cost is committed early on, and is nearly the inverse of design freedom) • Design knowledge (design information availability) • Total personnel assigned (approximately 1% of the total employees during the
conceptual design; an additional 9% are added during the preliminary design phase; the remaining 90% are added during the detail design phase, for a total of 100%; since the majority of early team personnel are designers, there is a correlation to non-design knowledge)
Since these types of figures are widely used in textbooks and journal articles,
Figure 4.1 provides a good high-level starting point for considering the potential
implications of RIM in aircraft manufacturing. In the sections that follow, Verganti’s
ideas related to RIM are discussed within the context of the four factors on Figure 4.1.

103
4.1 Design Freedom and “Cost Commitment” Curves Figure 4.1 illustrates that significant reciprocal interdependencies exist between
“design freedom” and “cost commitment.” These curves convey that “the design
process” follows a pattern and the corresponding “cost commitment” follows a nearly
Design Knowledge
Cost Commitment
Total Enterprise Personnel/ Computer Systems Non-Design Knowledge
0%
CONCEPTUAL PRELIMINARY
DETAILED 100%
Figure 4.1 Factors Related to Product Development Decision Making During Conceptual, Preliminary, and Detail Design Phases
50%
Design Freedom
Note: Ulrich and Eppinger (2000) terminology classifies the first segment as 0. Planning and 1.Conceptual, the second segment as 2.System-Level, and the last segment as 3. Detailed.

104
inverse pattern. The figure conveys that once a design starts down a particular path
toward completion, it quickly eliminates significant portions of the potential solution
space. Similarly, even though the “cost commitment” for the design is not yet fully
defined with regard to management of cost, i.e., “what, when, how, and how much”, it
has nonetheless reciprocally been established. The critical aspect of these two curves is
that they both “flatten out” during the conceptual design phase, which leaves little room
for change in subsequent design phases. Hence, the common assertion referenced in
Chapter 1 is supported by these curves, in that, between 70-80% of the total cost of a
product is established during the conceptual design phase.
The patterns of “design freedom” and “cost commitment” can be discussed with
the context of Verganti’s feedforward planning strategy, “selective anticipation.”
“Selective anticipation consists of anticipating only a limited amount of information that allows one to verify the coherence between the product concept and the future constraints. Dedicating the most attention on a few critical areas.”
If the enterprise develops information management and approaches with the idea
of predicting the patterns related to “design freedom” and “cost commitment,” then it will
take important steps toward better management of the reciprocal interdependencies that
exist between the two. The obvious deliverables related to these sources of information
to be managed are the “design representations” and the “cost estimates.”
Since the curves on Figure 4.1 do not provide insights with respect to where this
type of information comes from, the GPDP IDEF0 diagrams provide better insights with
regard to applying RIM concepts. The IDEF0 diagrams from Chapter 2 support the
assertion that activity with the most influence over the design is Engineering, however,

105
the “cost estimates” aspects are not as clearly traceable, which is discussed in the next
section.
4.2 Cost Commitment (Cost Estimates)
The technical descriptions of “cost commitment” are linked to the various
definitions of cost and the analytical methods used to estimate cost. The GPDP IDEF0
diagrams from Chapter 2 show that systems and personnel concerned with “cost” are
located in four activities, Business Management, Engineering, Factory Management
(before release), and Factory Management (after release). Clearly, significant reciprocal
interdependencies exist, and therefore, opportunities to manage them more effectively
exist. RIM strategies of commonality and selective anticipation have implications at a
global level, in that, these users should have tools and processes that are developed using
commonality and methodologies applied should recognize selective anticipation in the
assignment of cost drivers.
However, at this point a conflict between the IDEF0 diagrams and Figure 4.1
occurs for aircraft manufacturing in the defense industry, as well as any other industry
that has to agree upon a price to the customer in advance of the actual design effort. The
Business Management activity controls the contractual price (Price = Cost + Profit)
quoted to the customer. In many industries, price quoting takes place after design and
manufacture of a product. It is easily understood that the greatest amount of “cost/price
flexibility” (ease of change) exists before the price is quoted to, and agreed upon, by the
enterprise and the customer. While other analyses related to “cost” are performed later,
some of the most important cost-related analyses in aircraft manufacturing happen much

106
earlier than the typical industry/enterprise. Once the price is agreed upon, an associated
“cost commitment” has been made to the customer, and this is the value that will be used
to judge success or failure.
When one studies the “cost commitment” curve on Figure 4.1, it is difficult to
correlate the “cost commitment” by Business Management in the aircraft industry to the
“cost commitment” curve on this diagram. It seems the typical “cost commitment” curve
found in the literature is missing something, or that some other representation of total
cost should be added to the diagram.
Figure 4.1 illustrates that 80% of the technical aspects of cost are established
during the conceptual design phase, but it does not appear to address how costs are
actually developed and managed. While it is good information to understand, it seems to
overemphasize the role of the technical engineering information and underemphasize the
role of cost forecasting and management related decision making. Even a perfect design
will not by itself lead to an optimal total cost if the endeavor is improperly managed or
the original estimates of “cost commitment” are unrealistic and unrealizable.
In order to manage reciprocal interdependencies, an enterprise has to recognize
their existence, and it appears that important reciprocal interdependencies related to
management decisions that effect total cost commitment are missing from Figure 4.1
Tremendous advances have been made in the last 30 years with regard to
managing technical engineering information, yet cost and schedule overruns continue to
increase instead of decrease in the defense industry. (Swank, 2000.) This leads one to
conclude that studying the reciprocal interdependences that exist between the Business
Management activity and the Engineering activity and understand how they affect “cost

107
commitment” is worthwhile. Though it is difficult to know what the real shape of the
“cost commitment” line on Figure 4.1 should be for aircraft manufacturing, RIM has
something to offer with regard to the investigation.
4.3 Design Knowledge and Total Enterprise Effort
Another interesting aspect to Figure 4.1 is the implication that “design
knowledge” starts at zero percent. It is difficult to understand when the situation exists
that design knowledge truly starts at zero percent. In actuality, it is highly likely that
reciprocal interdependencies exist between past design efforts and the current design
effort, and that RIM concepts of commonality and selective anticipation are applicable.
However, the curves on Figure 4.1 do not offer any insights.
The S-curve for “design knowledge” looks more like an illustration of
engineering drawing releases, which is based on a deliverable instead of “design
knowledge,” though published works do not go into this level of detail with regard to
how the shape of the curve was derived. Again, it is difficult to envision how the
reciprocal interdependencies between past design efforts and current design efforts
change the shape of the “design knowledge” curve on Figure 4.1, they nonetheless exist.
In this instance, a starting point to managing reciprocal interdependencies more
effectively is the recognition that they exist and the application of feedforward planning
strategies (commonality and selective anticipation) as discussed in Chapter 1.
As in previous discussions related to “design knowledge,” the “non-design
knowledge” is probably does not start at zero percent. “Non-design knowledge” is
available from past endeavors if it is properly categorized using commonality. Similarly,

108
“design knowledge” is available that these “non-design” users can apply to make
inferences about their tasks earlier in the product development process if they use
selective anticipation. This is another example of how RIM strategies can be applied to
rethink the application of “non-design” effort. If more efficient ways of utilizing “non-
design” effort are identified, then one would expect the “non-design knowledge” curve to
move closer to the “design knowledge” curve, and for it to start somewhere further from
zero.
4.4 Conclusions Related to Figure 4.1
Once reciprocal interdependencies are recognized as existing, then the RIM
strategies of commonality and selective anticipation have the potential to be used to alter
the shapes of curves like those in Figure 4.1. Though it is difficult to determine what the
shapes in the future will actually be, the application of RIM strategies are expected to add
a new cost commitment curve based on management, move the starting points of the
curves away from zero, and perhaps move the curves closer together in some fashion.
4.5 IDEF0 Diagram Relationships and RIM Concepts
While illustrations similar to Figure 4.1 are useful, when one tries to apply them
to defining problems and solutions, they do not provide enough information about the
underlying problems. In addition, these figures seem to overemphasize the role of
engineering information in decision making and underemphasize how the information is
being used to manage the enterprise. The relationships presented in the generic product
development process IDEF0 diagrams from Chapter 2 offer better insights into how

109
information is exchanged, the problems that exist, and potential solutions. An example
is presented in the discussed in the paragraphs that follow.
The Factory Management (after release) activity controls how estimates of labor
and schedule are used to manage the execution of the manufacture of tools and parts.
The estimating procedures for labor and schedule requirements are part of a
manufacturing execution system (MES) that has limited flexibility. Because of factors
such as floor space, equipment, and the number of personnel that can actually be
effectively assigned to a particular job, these estimates of cost and schedule requirements
are meant to be representative of what is needed to achieve the “should cost” for a
product within established parameters.
It is important to note that no matter what any individual within another activity
may have estimated with regard to manufacturing hours and schedule requirements, it
plays no role in what is loaded for shop floor control via the MES. The MES work
measurement system provides the estimate of the hours needed to do a job, and the MES
scheduling system determines when these hours are to be earned/accomplished. Even if
the scheduling dates are moved around, the total estimated hours (should cost) for the job
is not changed. The actual hours charged and the earned hours to the baseline are what
changes.
However, the “cost performance” of the job is determined by how well the
information in the MES matches budget established during the original bidding process.
If the original budget and SOW information provided by the Business Management
activity led to the decision to hire too many personnel, then the result is poor performance
and associated cost overruns. No matter what the work measurement system predicts
110
jobs “should cost,” once workers are hired, they have to charge to the work available in a
particular area until they are laid off or moved to another area that has work. If the
budget and SOW information provided by Business Management led to hiring too few
personnel or the wrong mix of personnel (e.g. machinists were hired but painters were
needed), then the result is poor performance and cost overruns.
Hence, the observation is made that the enterprise should utilize information
found within the MES as quickly as possible in its estimating procedures, and it should
maintain traceability to a defined baseline of information. Referring back to the IDEF0
diagrams in Chapter 2 and Figure 3.1 in Chapter 3, if an approach is developed to
emulate the logic used within the Factory Management activity (i.e., activity 4) after
design release to feedforward knowledge to activities engaged in decision making before
design release using RIM strategies, (i.e., activities 1, 2, and 3), then the feedforward of
knowledge offers the potential to improve conceptual design decision making.
4.6 Summary
In this chapter, high-level discussions of RIM concepts are offered in the context
of figures commonly used in the literature and then another level of detail is discussed
using the IDEF0 diagrams in Chapter 2. Recall the discussion of feedforward planning
presented in Chapter 1. Feedforward planning is a proactive approach to managing
reciprocal interdependencies. The future constraints and opportunities that exist are
anticipated and accounted for as early as possible at the level of detail required for
effective decision making. A great deal of common enterprise knowledge related to

111
future constraints and opportunities is housed within Activities 4 through 8 (i.e., the
IDEF0 diagrams in Figures 2.5-2.7) that are completed once a design is released.
The discussions in this chapter provide insights into how RIM concepts are used
to rethink commonly held views of the product development life cycle. Referring to
Figure 3.1, information housed on the “right side” (after design release activities) of the
GPDP diagrams has feedforward planning potential to create knowledge for use by
earlier activities on the “left side” (before design release activities) of the GPDP
diagrams. RIM concepts of commonality and selective anticipation can be used to
organize information from past endeavors and make it recognizable during conceptual
design, significantly raising the design and non-design knowledge from a starting point of
zero percent.
In the next chapter, the integrated product team is defined for this research. As
identified in Chapter 1, there is a need in the literature to better define the members,
roles, and responsibilities of an IPT before attempting to develop systems to assist them
in decision making. As asserted by Verganti and supported by the literature review in
Chapter 3, too often this critical step is overlooked by those espousing to develop new
systems and approaches for improving conceptual design decision making.

112
CHAPTER V
THE CONCURRENT ENGINEERING WORKING-LEVEL INTEGRATED
PRODUCT TEAM (IPT) IN THIS RESEARCH
Figure 4.1 in Chapter 4 and the GPDP IDEF0 diagrams in Chapter 2 are the high-
level starting points for considering the reciprocal interdependencies that exist within the
enterprise and the concept of managing them using RIM strategies. The next level of
reciprocal interdependencies exist within the integrated product teams (IPTs) and the
decisions they are required to make to support the activities on the IDEF0 diagrams.
Earlier in Chapter 1, the product development obstacles and concurrent
engineering problems are discussed. One identified need is further definition of the types
of decisions IPTs are expected to make. This need correlates with Verganti’s concepts
related to reciprocal interdependencies, and it supports that his research is on the right
track. One of the reasons that Verganti’s conclusions are so insightful with regard to
improving conceptual design decision making is because it is performed within the
context of teaming. Verganti’s study uses real world IPTs to frame his assertions related
to reciprocal interdependencies management and feedforward planning.
During the conceptual and preliminary design phases, the reciprocal
interdependencies (knowledge links) between activities on the GPDP IDEF0 diagrams
are being filled with the information from a relatively small number of IPT members and

113
administrative analysts. (See Figure 4.1-Total enterprise personnel curve.) The members
of an IPT support activities on the generic product development process diagram. The
product designers support the Engineering activity, tool designers support the Tool
Design activity, cost analysts support multiple activities, and so on. In order to improve
processes, strategies, and tools used by IPTs during conceptual design, one first needs to
define the members of the IPT, their primary jobs, and the types of basic decisions that
they make.
A majority of the literature reviewed in Chapter 3 discusses improving the
product development process and conceptual design decision making in a limited context,
and very few fully recognize the complex mutual relationships that exist within an
enterprise and between IPT members. As discussed in Section 4.2, the cost commitment
curve in Figure 4.1 seems to overemphasize the technical engineering information related
to cost and underemphasize the management of information that ultimately establishes
cost. Similarly the literature seems to overemphasize the technical aspects of design
information and underemphasize the management of information required to make the
design a reality. Knowledge exchange between the IPT members and activities that they
support that takes place after design release is often overlooked and the difficulties of
managing/coordinating IPT tasks are not addressed.
In order to better understand the types of reciprocal interdependencies that exist
between IPT members and how to manage them more effectively, it is necessary to
define an IPT and the decisions that it is expected to make. In the next section, the
responsibilities of an aircraft manufacturing working-level IPT, that is assigned the
particular task of designing an NC machined bulkhead, is discussed.
114
5.1 Working-level IPT Responsibilities
Since the specific case for this research is aircraft manufacturing and the design of
a NC machined bulkhead, it is necessary to first define some of the basic responsibilities
of the working-level IPT. As stated earlier, it is very difficult to find descriptions of IPT
members and responsibilities in the literature within the articles where new tools and
frameworks are offered, so inferences must be made from the sources available. One
source located was the “Integrated Master Plan and Schedule Guide” published by the
United States Air Force Material Command (2004).
This document provides insights regarding duties IPTs are expected to carry out
in support of integrated master planning (IMP) and integrated master scheduling (IMS)
efforts following contract award. Some of the tasks IPTs are expected to perform, as
listed in this Air Force guide are as follows:
• Identify all critical tasks for each functional discipline for all products listed as
system-level events. • Break down all IMS tasks into subtasks.
• Locate errors in the original IMS (developed during negotiations) and provide
additional criteria and accomplishment information.
• Determine all technical relationships with other IPTs and coordinate them accordingly.
• Define relationships between system-level tasks, subtasks, and other IPTs with
defined precedence relationships.
• Develop strategies for cross flow of information with other IPTs to avoid “team stove pipes.”
• Maintain direct traceabilty between the IMS, IMP, and earned value management
system (EVMS) once work commences.

115
• Update the IMS and IMP using EVMS information on an ongoing basis to maintain consistency once work commences.
• Generate cost estimates and cost reports for all assigned tasks and subtasks.
• Identify technology insertion candidates and associated technical requirements,
cost, schedule, and risk.
The implication is that initial programmatic schedules and cost estimates are
developed using a top-down approach prior to award, and that this approach does not
lend itself to knowledge transfer for the purposes of managing a project. As soon as the
contract is awarded, the working-level IPT is asked to perform a bottoms-up type
approach to develop management information. Based on work experience, this is in fact
the condition that exists.
It is very difficult to find documents published by aircraft manufacturing
contractors with regard to internal performance. However, in 2001, an employee of
Raytheon Systems published a report on the use of IPTs. (Rickman, 2001.) This report
states that in order to get an understandable and achievable schedule and cost for their
products that the IPTs had to develop, sign up for, and take personal responsibility for
meeting schedule and cost targets. The IPTs were required to identify lower-level system
requirements, estimate associated resource expenditures, and make the resulting
information fit within the mandated confines of the contractual master schedule and
budget. The implication in this report is that even though programmatic schedules and
requirements estimates had already been developed, they were not in the format that IPTs
could use.
116
Rickman’s report (2001) also goes so far as to say that using IPTs at first made
the concurrent engineering results worse instead of better at Raytheon because each IPT
used its own approaches for determining lower-level resource requirements and
schedules. In addition, the IPT difficulties described in the report deal more with the
development of management information than the lack of technical engineering
information availability. This lack of “management information” corresponds with the
work experience of the author as well. Except for industrial engineering, few disciplines
teach individuals how to correlate technical information and project management
information. In addition, very few individuals have a broad enough base of experience to
anticipate all of the questions IPTs have to answer. Hence, as stated in Chapter 1, there is
a real need to develop systems and tools that cue IPT members regarding which decisions
need to be made and provide information in a format to assist them with these decisions.
In summary, the responsibilities of the working-level IPT are quite significant.
Being tasked with developing “all” of the detailed technical and management information
for a project is tremendous, and in most cases, the “IPT process” is not managed or
supported appropriately. In 1994, Lawson and Karandikar surveyed 70 U.S. companies,
of which 35 were in the aerospace and defense sector. The significant barriers to
concurrent engineering identified in this survey include: 1) poorly defined concurrent
engineering processes, 2) lack of IPT training, and 3) the lack of integrating technologies.
5.2 Working-level IPT Members
In the paragraphs that follow, a discussion of generic working-level IPT members
and support personnel involved in early product development decision making for an

117
aircraft bulkhead is offered. In addition, some of the basic decisions each member is
involved in are discussed.
However, keep in mind that IPTs are generally chartered to do all aspects of many
difficult tasks, such as “determine all technical relationships with other IPTs and
coordinate them accordingly.” Basically, the IPTs seem to be required to redo many
tasks that has been performed previously, find the errors, figure out anything else that
needs to be done, develop the plan, monitor the plan, etc. Unless an individual has
actually been a member of a working-level team, it is difficult to convey that an IPT
member is to become an expert at everyone else’s job, as well as convey to management
what information is needed to manage.
The discussion in this chapter is not meant to imply that every aircraft
manufacturing organization has the same type of membership, the descriptions are
universal, or all that all possible tasks that IPTs could actually perform are listed.
Instead, these representations are offered to provide more insights into the complexities
that are involved in the exchange of knowledge between IPT members and how their
decisions have implications to both “technical” reciprocal interdependencies and
“management” reciprocal interdependencies. In addition, these discussions support the
development of the RIM-based conceptual decision support system discussed later in the
research.
The working-level IPT members for this research are:
• Structural design engineer (leader) • Systems design engineer • Test engineer • Tool designer • Planner

118
• Manufacturing engineer • Manufacturing representative • Purchasing representative • Cost representatives (various; depends on program management) • Quality assurance representative
The structural design engineer is typically the leader of an IPT when it involves
working on a structural part, such as a bulkhead. He/she is concerned with the tasks
required to complete a design that can be manufactured within specified design targets,
design budget, and design release schedule. This designer works with other IPT
members to make sure that the design requirements meet a variety of technical
expectations and capabilities. The designer also coordinates with other designers
working on the installation drawings. In addition, in order for a designer to know when
the drawing must be released to meet master scheduling commitments, information
related to tasks scheduled after design release must be concurrently considered.
The systems design engineer is concerned with the overall game plan for
installing systems that will lead to penetrations in the structure, as well as sequencing
issues related to structural interference. (The information needs of this IPT member are
not addressed specifically in this research, so the discussion of these tasks is brief.)
The test engineer is concerned with testing requirements. (The information needs
of this IPT member are not addressed specifically in this research, so the discussion of
tasks is brief.)
The tool designer is responsible for conveying general feedback on tool design
issues to the designer, formulating an overall tool design plan, and developing tool
designs. One tool designer rarely designs all of the tools for the manufacture of a design
119
because the tasks are too great to be accomplished within the scheduled time frame. In
order for a tool designer (or management support person) to provide information to the
Tool Design activity (Figure 2.6) about tooling deliverables, a projection of the release
date of the engineering design is required. However, because of reciprocal
interdependencies that exist between tool design tasks and the engineering design tasks,
the release date to support the master schedule cannot be determined without establishing
tooling requirements. Similarly, reciprocal interdependencies between the tool design
tasks and other IPT tasks exist, and it is difficult to know when tool designs can start until
the work instructions are available and in the preferred format…and so on. Many pieces
of information have to be considered concurrently in order to do this job well.
The planner is responsible for conveying general feedback on processing issues to
the designer, providing advice to the tool designer on tool manufacturing issues,
developing a work instructions plan, identifying how many tool orders will have to be
written, and conveying the requirements in the appropriate format to the Planning activity
(Figure 2.6). One planner rarely writes all of the work instructions for tool and design
manufacturing related to one design release. Instead, the work instructions are often
allocated to teams of planners doing similar jobs. In order for a planner (or support
person) to plan the tasks required for the Planning activity, a projected release date of the
engineering drawing is required. In addition, the tool designer and the planner have to
determine how many tool orders are required so that he/she can allocate resources to
write them. Due to reciprocal interdependencies that exist, the planner does know when
his/her tasks should start or when it should finish without considering the tasks of other
IPT members concurrently.

120
The manufacturing engineer is responsible for providing additional technical
information that may not be known to a planner or a tool designer. In some
organizations, a manufacturing engineer actually performs some of the task described in
previous paragraphs for the tool designer and planner during the early stages of design,
and the contract or hourly workers do not appear on the program until later. In addition,
a manufacturing engineer assists in identifying requirements for new technology insertion
projects and assists with planning required manufacturing studies.
The manufacturing representative is responsible for representing the factory, and
conveys feedback to the designer, the tool designer, the planner, and others related to
perceived manufacturing preferences and requirements. This individual is also
responsible for conveying to the other IPT members key information about make span
requirements that will effect how manufacturing plans and organizes its tasks. This
individual is also responsible for conveying to the Factory Management system
information that might effect critical load dates on the master schedule, what new
equipment might be needed, or other things that affect the factory’s ability to perform the
required manufacturing tasks. Many reciprocal interdependencies exist between the
manufacturing representative and the other IPT members, and there is obvious overlap
between what he/she does and some of the other technical areas. However, if the
departments actually performing the work do not have a representative on teams, then
this lack of participation in decision making becomes a point of contention later on.
The purchasing representative is responsible for providing general information on
vendors, as well as obtaining rough order of magnitude (ROM) and detailed quotes. To
quotes from vendors, basic design requirements must be provided to the vendor. This
121
person relays information to vendors and in return receives quotes from a vendor, which
are supplied to the IPT and cost analysts. (The information needs of this IPT member are
not addressed specifically in this research, so the discussion of tasks is brief.)
Various cost representative(s) are involved with the IPT to generate estimates or
perform special studies. Depending on how the project is managed, there may be one or
more persons who are involved in developing cost (and schedule) related estimates and
inputting information into various systems. The Business Management activity may have
an estimator assigned to pull together inputs from other estimators who report to the
Engineering activity or the Factory Management activity. Or, the program may have a
representative that does various types of cost estimates. The significant point is that each
of these cost estimators normally has their own cost models for developing a baseline for
trade studies, cost to complete exercises, and cost and schedule compression exercises.
In addition, nearly all of management models/tools/reports require that the IPTs provide
them with requirements, assumptions, dates, or other inputs.
The quality assurance representative provides input with regard to processes
related to determining whether products or services meet or exceed required customer
expectations. Typically these deal with program policies and objectives at a higher-level
and may also deal with inspection plans. (The information needs of this IPT member are
not addressed specifically in this research, so the discussion of tasks is brief.)
5.3 The Product Development Process and the Working-level IPT At this point in the presentation it is necessary to link the generic product
development process presented in Chapter 2 and the working-level IPT. Figure 5.1 is a

122
slightly modified version of Figure 2.1. Figure 5.1 illustrates the successive levels of
detail and illustrates the need for decisions support systems that support IPT efforts.
In addition, Figure 5.1 illustrates that RIM and feedforward planning approaches seek to
move information from right to left in the GPDP.

12
3
AC
TIV
ITIE
S
Bef
ore
Des
ign
Rel
ease
IP
T d
rive
n A
fter
Des
ign
Rel
ease
In
tegr
ated
(au
tom
ated
) sy
stem
s dr
iven
1.
Bus
ines
s M
anag
emen
t Pu
rcha
sing
rep
rese
ntat
ive,
co
st r
epre
sent
ativ
es/a
naly
sts
Bus
ines
s M
anag
emen
t sy
stem
s 2.
Fac
tory
Man
agem
ent
Cos
t rep
rese
ntat
ive
(est
imat
or)
3. E
ngin
eeri
ng
Stru
ctur
al d
esig
n en
gine
er,
syst
ems
desi
gn e
ngin
eer,
test
en
gine
er
Eng
inee
ring
pro
duct
dat
a m
anag
emen
t (PD
M)
syst
ems
4. F
acto
ry M
anag
emen
t
FMS
– M
ES
(wor
k m
easu
rem
ent,
sche
duli
ng)
5. P
lann
ing
Plan
ner,
ME
Pl
anni
ng s
yste
ms
6. T
ool D
esig
n T
ool d
esig
ner,
ME
T
ool d
esig
n sy
stem
s
7. F
abri
catio
n M
anuf
actu
ring
rep
rese
ntat
ive,
qu
alit
y re
pres
enta
tive
ME
S &
ear
ned
valu
e
8. A
ssem
bly
Man
ufac
turi
ng r
epre
sent
ativ
e,
qual
ity
repr
esen
tati
ve
M
ES
& e
arne
d va
lue
*Par
tial s
ourc
e: U
lric
h an
d E
ppin
ger
(200
0)
*Sec
tions
in b
lue
italic
s at
the
Act
ivity
-lev
el
add
ed b
y th
is a
utho
r *I
PT-
leve
l add
ed b
y th
is a
utho
r
Mos
t con
curr
ent e
ngin
eeri
ng e
ffor
ts
have
foc
used
on
mov
ing
peop
le to
the
left
of
desi
gn r
elea
se.
Mor
e fo
cus
is n
eede
d in
fee
dfor
war
d pl
anni
ng o
f kn
owle
dge
(int
egra
ted
syst
ems)
to th
e le
ft o
f de
sign
rel
ease
AC
TIV
ITIE
S 1.
Bus
ines
s
M
anag
emen
t 3.
Eng
inee
ring
AC
TIV
ITIE
S 1.
Bus
ines
s
M
anag
emen
t 2.
Fac
tory
M
anag
emen
t 3.
Eng
inee
ring
AC
TIV
ITIE
S 1.
Bus
ines
s
M
anag
emen
t 2.
Fac
tory
Man
agem
ent
3.E
ngin
eeri
ng
AC
TIV
ITIE
S 3.
Eng
inee
ring
4.
Fac
tory
Man
agem
ent
5. P
lann
ing
6. T
ool D
esig
n
AC
TIV
ITIE
S 3.
Eng
inee
ring
4.
Fac
tory
M
anag
emen
t 7.
Fab
rica
tion
8. A
ssem
bly
AC
TIV
ITIE
S A
LL
0. P
lann
ing
1.C
once
pt
D
evel
op-
m
ent
2. S
yste
m
Lev
el
Des
ign
3. D
etai
l
Des
ign
4. T
estin
g
a
nd R
e-
f
inem
ent
5
. Pro
duct
ion
Ram
p-U
p
Figu
re 5
.1 P
rodu
ct D
evel
opm
ent
Proc
ess
Six
-Pha
se A
ppro
ach
Wit
h A
ctiv
ity-
Lev
el a
nd I
PT
-Lev
el M
odif
icat
ions
Six
-pha
se
Act
ivit
y-le
vel
IPT
-lev
el
123

124
5.4 Summary
Teaming and the use of integrated product teams (IPTs) is the most common way
in which concurrent engineering is implemented. The IPTs are usually composed of
“functional” individuals who are specialists in their fields, and these individuals are a part
of activities discussed in Chapter 2, as well as designated on the IDEF0 diagrams. Based
on the definition of concurrent engineering, these individuals are tasked to consider “all
information within the enterprise,” make decisions using processes and procedures (that
may not be defined), and then convey their decisions in a manner that will lead to a
“management plan” resulting in the best practical quality, schedule, and cost
performance. This is a tremendous undertaking, and there is no “job description” for an
IPT member in the literature that reflects the overall requirements for what these
individuals are being asked to do. As Verganti noted, much of the literature does not
recognize the true task complexities involved in teaming decision making.
Based on earlier discussions of concurrent engineering, IPTs are required to make
decisions related to: 1) technical requirements, 2) resources requirements, and 3)
sequencing requirements (scheduling). Hence, in order to support IPT decision making,
methodologies and tools are required that consider the reciprocal interdependencies
(knowledge links) related to these types of decision making.
A generic description of a working-level IPT for the design of an aircraft
bulkhead is provided. The working-level IPT decisions discussed in this chapter are used
as the basis for the development of the conceptual framework of the RIM-based DSS
presented in the next chapter. The RIM-based DSS presented in the next chapter add a

125
new level to Figure 5.1 and is illustrated in Figure 5.2. Figure 5.2 is provided at this
point to serve as a high-level representation of where Chapter 6 is headed.

126
Collaborative work environment
Figure 5.2 Product Development Process Six-Phase Approach With Activity-Level IPT-Level and DSS Level Modifications
ACTIVITIES 1. Business Management 3. Engineering
ACTIVITIES 1. Business Management 2.Factory Management 3.Engineering
ACTIVITIES 1. Business Management 2.Factory Management 3.Engineering
ACTIVITIES 3. Engineering 4. Factory Management 5. Planning 6. Tool Design
ACTIVITIES 3. Engineering 4. Factory Management 7. Fabrication 8. Assembly
ACTIVITIES ALL
0. Planning 1.Concept Develop-
ment
2.System Level
Design
3.Detail Design
4. Testing and Re- finement
5. Production
Before Design Release After Design Release ACTIVITIES IPT Driven Integrated (automated) Systems Driven 1. Business Management Purchasing representative, Business Management cost representatives/analysts systems 2. Factory Management Cost representative estimator 3. Engineering Structural design engineer, Engineering product data systems design engineer, management (PDM) systems test engineer 4. Factory Management FMS – MES (work measurement, scheduling) 5. Planning Planner, ME Planning systems 6. Tool Design Tool designer, ME Tool design systems 7. Fabrication Manufacturing representative, MES & earned value quality representative 8. Assembly Manufacturing representative, MES & earned value quality representative
1 2 3
5 6 7 84
Databases and systems typically engaged once the design is released
are engaged earlier via the DSS
IPTs
RIM-Based Decision Support System
Reformat databases using RIM concepts of commonality and selective anticipation to facilitiate…
FEEDFORWARD PLANNING
Before Design Release Left Side
After Design Release Right Side
Six-Phase Level
DSS- Level
(Chapter 2)
(Chapter 2)
(Chapter 5)
(Chapter 6)
Activity-Level
IPT-Level
Personnel have moved to the left of design release, but much of knowledge in computerized systems has not

127
CHAPTER VI
THE CONCEPTUAL ARCHITECTURE OF A RIM-BASED DSS AND A
PROCESS FLOW DIAGRAM OF A DECISION MAKING INSTANCE
In Chapter 6, the high-level conceptual architecture of a RIM-based DSS is
described and a flow diagram of a decision making instance is offered. This chapter is
organized into three major subsections. The first section contains two, high-level
illustrations: 1) the DSS approach in the context of Verganti’s concepts (Figure 6.1) and
2) the working-level IPT decision making supported by the RIM-based DSS (Figure 6.2).
The illustrations provide a view of the conceptual architecture and approach at the
highest level. In the second section, conceptual information hierarchies developed using
RIM concepts and RIM-diagramming are offered in groups coinciding with the activities
on the IDEF0 diagrams (Chapter 2, pages 53 through 56). This section assists with
making the connection between the highest level of detail in Figures 6.2 and 6.3 and the
lowest level of detail offered in Chapter 7. Lastly, a flow diagram of a working-level IPT
decision-making instance is overviewed to provide more insight into the reciprocal
interdependencies (i.e., knowledge links) supported by the RIM-based DSS.

128
6.1 High-Level Representations
This section contains two, high-level illustrations:
1) Working-level IPT decision making supported by a RIM-based DSS
(Figure 6.1) and
2) RIM-based decision support utilizing Verganti’s concepts (Figure 6.2) and
new approaches offered by this author.
These illustrations provide high-level viewpoints of the conceptual architecture and
approach described in Chapter 7.
A brief discussion of terminologies found in Figures 6.1 and 6.2 is presented
following the figures. The discussion is intentionally concise since Verganti’s concepts
and terminologies are discussed in detail in Chapter 7.

12
9
Fi
gure
6.1
Wor
king
-Lev
el I
PT
Dec
isio
n M
akin
g Is
Sup
port
ed b
y a
RIM
-Bas
ed D
SS
RIM
-Lea
rnin
g by
Dev
elop
men
t R
IM-L
earn
ing
by E
xper
ienc
e
Fee
dfor
war
d pl
anni
ng u
tili
zes
com
mon
alit
y an
d se
lect
ive
anti
cipa
tion
for
stru
ctur
ed k
now
ledg
e sh
arin
g fa
cilit
ated
by
RIM
-di
agra
mm
ing
and
iden
tifi
ed c
hang
es
to s
yste
ms
typi
cally
not
eng
aged
unt
il
the
deta
il d
esig
n ph
ase
follo
win
g de
sign
rel
ease
Fee
dfor
war
d an
d fe
edba
ck p
lann
ing
(Act
ual p
erfo
rman
ce)
UT
ILIZ
ES
– ea
rly
proc
ess
engi
neer
ing
and
prep
lann
ing
know
ledg
e –
to R
ED
UC
E s
uper
fici
al a
ntic
ipat
ion
– an
d IM
PR
OV
E fe
edfo
rwar
d pl
anni
ng
effe
ctiv
enes
s
Ver
gant
i’s
conc
epts
(19
98)
incl
ude:
rec
ipro
cal i
nter
depe
nden
cies
, fee
dfor
war
d pl
anni
ng,
com
mon
alit
y, s
elec
tive
ant
icip
atio
n, fe
edfo
rwar
d ef
fect
iven
ess,
sup
erfi
cial
ant
icip
atio
n, p
repl
anni
ng
know
ledg
e, e
arly
pro
cess
eng
inee
ring
, lea
rnin
g by
dev
elop
men
t, an
d le
arni
ng b
y ex
peri
ence
. H
owev
er, “
how
” to
app
ly th
ese
conc
epts
is a
con
trib
utio
n of
this
res
earc
h, a
nd th
is a
utho
r ha
s ti
tled
th
e “
how
” R
ecip
roca
l Int
erde
pend
enci
es M
anag
emen
t (R
IM).
Gen
eric
Pro
duct
Dev
elop
men
t Pro
cess
Pla
nnin
g
Con
cept
D
evel
opm
ent
Sys
tem
-Lev
el
Des
ign
Tes
ting
and
R
efin
emen
t
Pro
duct
ion
R
amp-
Up
Det
ail
Des
ign
IDE
F0 A
ctiv
itie
s 1
-3
IDE
F0 A
ctiv
itie
s 4
- 8
Det
ail D
esig
n R
elea
ses
Con
cept
ual D
esig
n R
elea
ses
Ass
embl
y C
ompl
etio
ns
RIM
-Bas
ed
DSS
IDE
F0
activ
ities
(#1
- #
6)en
terp
rise
sys
tem
s ut
ilize
co
mm
onal
ity a
nd s
elec
tive
antic
ipat
ion
feat
ures
Des
ign
Req
uire
men
ts
Add
ress
ed
by th
is
rese
arch
Tec
hnic
al
R
esou
rces
RIM
-Bas
ed M
etho
dolo
gy f
or A
sses
sing
Ent
erpr
ise
Man
ufac
turi
ng C
apab
iliti
es
Rec
ipro
cal I
nter
depe
nden
cies
are
mul
tidim
ensi
onal
kno
wle
dge
links
Act
ivity
#7
Fab
rica
tion
Act
ivity
#8
Ass
embl
y
I E
C
NC
N
I E
C –
Com
mon
N –
New
I
– In
tern
al
E
– E
xter
nal
Man
ufac
turi
ng
Cus
tom
er re
quir
emen
ts
Perf
orm
ance
Wor
king
-lev
el I
PT
Ana
lysi
s of
C
onst
rain
ts a
nd O
ppor
tuni
ties
Ope
rati
ons
& S
uppo
rt
TBD
TBD
Rec
ipro
cal i
nter
depe
nden
cies
are
the
know
ledg
e li
nks
util
ized
in d
ecis
ion
mak
ing
invo
lvin
g m
ultip
le in
divi
dual
s or
act
ivit
ies
Ulr
ich
and
Epp
inge
r (2
000)
Sequ
enci
ng
129
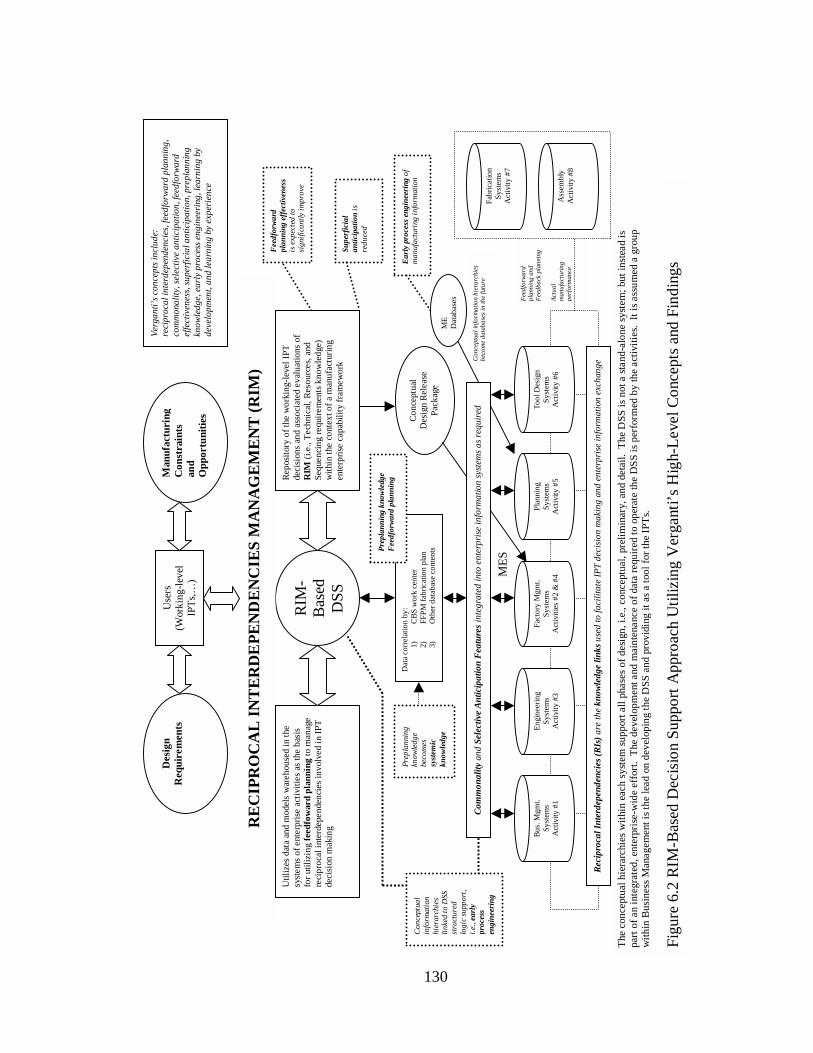
13
0
Con
cept
ual i
nfor
mat
ion
hier
arch
ies
beco
me
data
base
s in
the
futu
re
The
con
cept
ual h
iera
rchi
es w
ithi
n ea
ch s
yste
m s
uppo
rt a
ll ph
ases
of
desi
gn, i
.e.,
conc
eptu
al, p
reli
min
ary,
and
det
ail.
The
DSS
is n
ot a
sta
nd-a
lone
sys
tem
; but
inst
ead
is
part
of a
n in
tegr
ated
, ent
erpr
ise-
wid
e ef
fort
. T
he d
evel
opm
ent a
nd m
aint
enan
ce o
f da
ta r
equi
red
to o
pera
te th
e D
SS
is p
erfo
rmed
by
the
acti
viti
es.
It i
s as
sum
ed a
gro
up
wit
hin
Bus
ines
s M
anag
emen
t is
the
lead
on
deve
lopi
ng th
e D
SS a
nd p
rovi
ding
it a
s a
tool
for
the
IPT
s.
Fee
dfor
war
d
plan
ning
and
F
eedb
ack
plan
ning
A
ctua
l m
anuf
actu
ring
pe
rfor
man
ce
ME
S
Figu
re 6
.2 R
IM-B
ased
Dec
isio
n Su
ppor
t A
ppro
ach
Uti
lizin
g V
erga
nti’
s H
igh-
Lev
el C
once
pts
and
Find
ings
RIM
-B
ased
D
SS
Use
rs
(Wor
king
-lev
el
IPT
s,…
)
Man
ufac
turi
ng
Con
stra
ints
an
d O
ppor
tuni
ties
Des
ign
Req
uire
men
ts
Eng
inee
ring
S
yste
ms
Act
ivity
#3
Bus
. Mgm
t. S
yste
ms
Act
ivity
#1
Fac
tory
Mgm
t. S
yste
ms
Act
ivit
ies
#2 &
#4
Pla
nnin
g S
yste
ms
Act
ivity
#5
Too
l Des
ign
Sys
tem
s A
ctiv
ity #
6
Dat
a co
rrel
atio
n by
: 1)
C
BS
wor
k ce
nter
2)
F
FP
M f
abri
catio
n pl
an
3)
Oth
er d
atab
ase
cont
ents
Con
cept
ual
Des
ign
Rel
ease
Pa
ckag
e
Pre
pla
nnin
g kn
owle
dge
beco
mes
sy
stem
ic
know
ledg
e
RE
CIP
RO
CA
L I
NT
ER
DE
PE
ND
EN
CIE
S M
AN
AG
EM
EN
T (
RIM
)
Rec
ipro
cal I
nter
depe
nden
cies
(R
Is)
are
the
know
ledg
e lin
ks u
sed
to fa
cili
tate
IP
T d
ecis
ion
mak
ing
and
ente
rpri
se in
form
atio
n ex
chan
ge
Ear
ly p
roce
ss e
ngin
eeri
ng o
f m
anuf
actu
ring
info
rmat
ion
ME
D
atab
ases
Com
mon
ality
and
Sel
ectiv
e A
ntic
ipat
ion
Fea
ture
s in
tegr
ated
into
ent
erpr
ise
info
rmat
ion
syst
ems
as r
equi
red
Supe
rfic
ial
antic
ipat
ion
is
redu
ced
Rep
osit
ory
of th
e w
orki
ng-l
evel
IPT
de
cisi
ons
and
asso
ciat
ed e
valu
atio
ns o
f R
IM (
i.e.,
Tec
hnic
al, R
esou
rces
, and
Se
quen
cing
req
uire
men
ts k
now
ledg
e)
wit
hin
the
cont
ext o
f a
man
ufac
turi
ng
ente
rpri
se c
apab
ilit
y fr
amew
ork
Pre
plan
ning
kno
wle
dge
Fee
dfor
war
d pl
anni
ng
Util
izes
dat
a an
d m
odel
s w
areh
ouse
d in
the
syst
ems
of e
nter
pris
e ac
tivi
ties
as th
e ba
sis
for
utili
zing
fee
dfow
ard
plan
ning
to m
anag
e re
cipr
ocal
inte
rdep
ende
ncie
s in
volv
ed in
IPT
de
cisi
on m
akin
g
Fab
rica
tion
S
yste
ms
Act
ivity
#7
Ass
embl
y A
ctiv
ity #
8
Fee
dfor
war
d
plan
ning
eff
ectiv
enes
s is
exp
ecte
d to
si
gnif
ican
tly
impr
ove
Ver
gant
i’s
conc
epts
incl
ude:
re
cipr
ocal
inte
rdep
ende
ncie
s, fe
edfo
rwar
d pl
anni
ng,
com
mon
alit
y, s
elec
tive
ant
icip
atio
n, fe
edfo
rwar
d ef
fect
iven
ess,
sup
erfi
cial
ant
icip
atio
n, p
repl
anni
ng
know
ledg
e, e
arly
pro
cess
eng
inee
ring
, lea
rnin
g by
de
velo
pmen
t, an
d le
arni
ng b
y ex
peri
ence
Con
cept
ual
info
rmat
ion
hier
arch
ies
link
ed to
DSS
st
ruct
ured
lo
gic
supp
ort,
i.
e., e
arly
pr
oces
s en
gine
erin
g
130
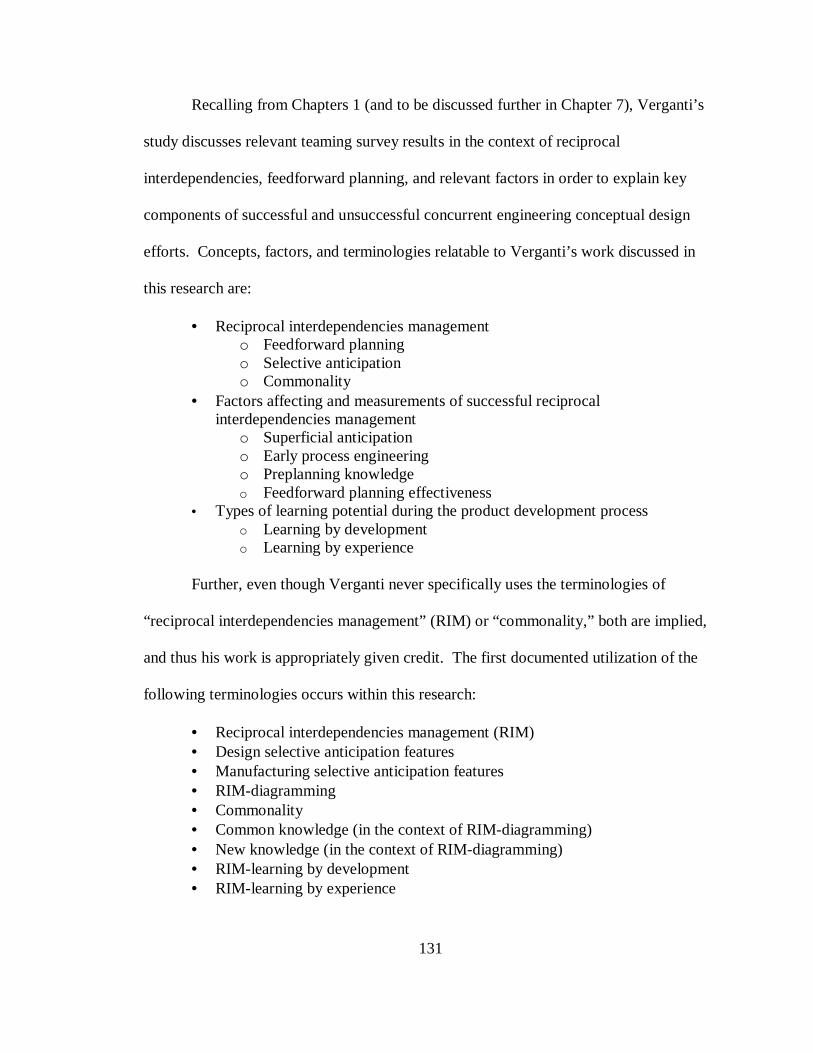
131
Recalling from Chapters 1 (and to be discussed further in Chapter 7), Verganti’s
study discusses relevant teaming survey results in the context of reciprocal
interdependencies, feedforward planning, and relevant factors in order to explain key
components of successful and unsuccessful concurrent engineering conceptual design
efforts. Concepts, factors, and terminologies relatable to Verganti’s work discussed in
this research are:
• Reciprocal interdependencies management o Feedforward planning o Selective anticipation o Commonality
• Factors affecting and measurements of successful reciprocal interdependencies management
o Superficial anticipation o Early process engineering o Preplanning knowledge o Feedforward planning effectiveness
• Types of learning potential during the product development process o Learning by development o Learning by experience
Further, even though Verganti never specifically uses the terminologies of
“reciprocal interdependencies management” (RIM) or “commonality,” both are implied,
and thus his work is appropriately given credit. The first documented utilization of the
following terminologies occurs within this research:
• Reciprocal interdependencies management (RIM) • Design selective anticipation features • Manufacturing selective anticipation features • RIM-diagramming • Commonality • Common knowledge (in the context of RIM-diagramming) • New knowledge (in the context of RIM-diagramming) • RIM-learning by development • RIM-learning by experience

132
In the paragraphs that follow, terminologies that appear on Figures 6.1 and 6.2 are
discussed in order to facilitate understanding the descriptive details of the figures.
6.1.1 Reciprocal Interdependencies Management (RIM)
Reciprocal interdependencies management (RIM) is the collection of concepts,
strategies, and methodologies used to facilitate organization and utilization of knowledge
links that exist for the purposes of decision making involving multiple individuals,
activities, or task groups. The concepts and strategies include, but are not limited, to
feedforward planning, selective anticipation, commonality, preplanning knowledge, early
process engineering, and superficial anticipation as related to the improvement of
enterprise feedforward planning effectiveness.
6.1.2 Reciprocal Interdependencies
Reciprocal interdependencies (RIs) are multidimensional knowledge links
between activities. They represent the information exchange that takes place between
activities in order to solve a problem (or, address a question) during the product
development lifecycle.
Though not specifically stated by Verganti, it can be postulated that reciprocal
interdependencies occur when the accomplishment of ongoing tasks requires a mutual
exchange of continuously updated/revised information between activities. In this
research, reciprocal interdependencies are initially modeled for three contexts of
enterprise manufacturing capability (i.e., Technical, Resources, and Sequencing) within
subsequent categorizations of Common, New, Internal processes and External suppliers.

133
6.1.3 RIM-Based Methodology for Assessing Manufacturing Capability: Capability Framework
Reciprocal interdependencies are multidimensional knowledge links existing
throughout an enterprise. In an attempt to bring order to the consideration of reciprocal
interdependencies, an enterprise capability framework is used. First, capability is loosely
defined by how well an enterprise can utilize knowledge to make decisions and achieve
the desired outcomes. Second, enterprise knowledge in the context of capability is
divided into three basic types of reciprocal interdependencies, i.e., technical, resources,
and sequencing.
Technical reciprocal interdependencies deal with knowledge that is specialized in
nature, technological, and associated with the exchange of information that is often
unique to carrying out a specific task. Types of technical reciprocal interdependencies
include specific knowledge related to task specific processes and tools unique to an
activity.
Resources reciprocal interdependencies are knowledge links that deal with
decisions related to expenditures of assets or capital within a single activity or between
multiple activities. Types of reciprocal interdependencies include specific knowledge
links related to labor, personnel, and procurement dollars in relation to activities. In
addition, resources reciprocal interdependencies are typically used to execute the highest
levels of management strategy.
Sequencing reciprocal interdependencies are knowledge links that deal the logical
ordering of decisions and tasks within a single activity or between multiple activities.

134
Examples of sequencing reciprocal interdependencies include knowledge links related to
master scheduling.
However, even the aforementioned three RIs have overlapping and soft
boundaries. An example of overlap is the sequencing knowledge links used to establish
the order of occurrence of technical processes or the order of occurrence of tasks within a
process. Another example is assembly tolerance. Assembly tolerance sequencing has
elements of both technical and sequencing reciprocal interdependencies. Similarly, the
assessment of “cost” utilizes both resources and sequencing RIs, in that, cost valuation is
relevant only when resources knowledge are considered in a specific window of time
(sequence/order).
In summary, the capability of an enterprise is defined at a high level by how well
it understands and manages the reciprocal interdependencies dealing with technical,
resources, and sequencing knowledge links.
6.1.4 Commonality
Commonality is a mechanism that facilitates accomplishment of systemic learning
(i.e., the capability of a company to learn from past projects and incorporate experiences).
In general terms, if a system of people, facilities, and equipment is to be reused on a new
project, there is a high likelihood a significant amount of “known/learned” information
can be reused. The information from past experiences represents “common” knowledge.
The application of commonality involves the systematic differentiation between certain
aspects of a new design decision that can be satisfied by using common knowledge and
those requiring development of new knowledge.

135
This research utilizes knowledge categories of Common and New to demonstrate
the application of commonality. Further, occurrences of Common and New knowledge
can be further subdivided into internal and external sources. Internal sources are in-
house sources of knowledge and external sources of knowledge are related to vendors,
suppliers, benchmarking, etc.
6.1.5 RIM-Diagramming
RIM-diagramming is used to strategize as to how to manage reciprocal
interdependencies using previously discussed terminologies of technical, resources,
sequencing, common, new, internal, and external. RIM-diagramming provides a starting
point to organize knowledge in an effort to identify exchange interfaces, associated
problems, and potential improvements. These diagrams help the users to focus on the
premise that knowledge of new design endeavors never really begins at zero percent as
suggested in many widely published figures, i.e., Chapter 4, Figure 4.1, page 103.
At first glance, a RIM-diagram looks very much like a table. However, it is being
referred to as a diagram because knowledge is being segmented into parts using parallel
columns. In general, RIM-diagrams have a far left column for the three basic types of
reciprocal interdependencies (i.e., knowledge links) of Technical, Resources, and
Sequencing. Next, there are columns to the right, labeled Common and New. There is
no predefined number of Common and New columns. Multiple columns can be used to
show how knowledge transitions during different phases of product development. In
addition, there are dashed horizontal lines within the columns. The horizontal dashed
line is used to further categorize the knowledge between Internal and External sources or

136
to designate that another type of reciprocal interdependency is being considered
simultaneously. A generic RIM-diagram is offered in Table 6.1.
Table 6.1 Generic RIM-Diagram Layout
Enterprise Manufacturing Capabilities
Common Category 1
Common Category 2
Common Category…
Common Category (i)
New Category (j)
Type 1:Technical
Internal ----------------- External Type (k) ----------------- Type (k)
Internal ----------------- External Type (k) ----------------- Type (k)
(placeholder)
(placeholder)
Internal ----------------- External Type (k) ----------------- Type (k)
Type 2: Resources
Internal ----------------- External Type (k) ----------------- Type (k)
Internal ----------------- External Type (k) ----------------- Type (k)
(placeholder)
(placeholder)
Internal ----------------- External Type (k) ----------------- Type (k)
Type 3: Sequencing
Internal ----------------- External Type (k) ----------------- Type (k)
Internal ----------------- External Type (k) ----------------- Type (k)
(placeholder)
(placeholder)
Internal ----------------- External Type (k) ----------------- Type (k)
(i) indicates there is not a predefined number of Common columns (j) indicates there is not a predefined number of New columns (k) indicates there is overlap with one of the other types of reciprocal interdependencies Arrows indicate potential knowledge links and knowledge transitional direction Note: The elements in bold italics are not specifically addressed within this research and are marked as TBD because of the required development of supplier information. Additionally, only very simplistic examples of New Internal/External are offered

137
In some RIM-diagrams, the knowledge exchange transitions downward in the
diagram as Technical RIs are linked to Resources RIs and so on. Similarly, in some
diagrams, the Common knowledge transitions are diagrammed to correlate with design
stage transitions, i.e., conceptual, conceptual/preliminary, preliminary, detail, and so on.
RIM-diagramming facilitates the identification of knowledge exchange issues and how to
potentially alleviate problems. In most instances, the knowledge exchange issues are
facilitated using conceptual information hierarchies within the conceptual DSS, which
will typically become databases in an operational DSS.
In Figure 6.1, the RIM-based methodology for assessing enterprise manufacturing
capability correlates to terminologies used in RIM-diagramming, i.e., Technical,
Resources, Sequencing, Common, New, Internal, and External. The illustration
represents the multidimensional knowledge links that exist between the eight activities on
the IDEF0 diagrams in Chapter 2 at the lowest (and most complex) level of detail.
6.1.6 Feedforward Planning
Feedforward planning is a proactive approach to managing reciprocal
interdependencies. The future constraints and opportunities that exist, such as in-house
and supplier process capability, are anticipated and accounted for as early as possible at
the level of detail required for effective decision making. Hence, if a new product should
require something “totally new,” this situation quickly comes to the forefront of the
development process. The assumption is time spent on accounting for future constraints
and opportunities is a worthwhile expenditure, in that it will more than compensate for
the cost of future engineering changes.
138
6.1.7 Selective Anticipation
Selective anticipation is the action of determining the types of information and
patterns of information use related to the verification of coherence between the product
concept and future constraints, dedicating most attention to a few critical areas. In this
research, the systematic documentation of selective anticipation efforts results in design
selective anticipation features and manufacturing anticipation features. Design selective
anticipation features are the features known with relative certainty near the beginning of
the conceptual design process. Pre-identified Manufacturing selective anticipation
features correlate to design selective anticipation features and convey the most desired
features by process to the working-level IPT. Manufacturing selective anticipation
establishes the features manufacturing would most like to have incorporated into a
design. Collectively, design selective anticipation features and manufacturing selective
anticipation features are referred to as selective anticipation features.
6.1.8 Superficial Anticipation
Superficial anticipation results in a baseline of assumptive information that has
limited definition from which to make meaningful change or adjustment. Companies that
are effective in reciprocal interdependencies management consider and manage important
information earlier, and they create baseline of information useful during multiple stages
of product development. Companies that perform poorly in both RIM and feedforward
planning tend to confuse superficial anticipation with selective anticipation. RIM-
diagramming helps to uncover multiple examples of superficial anticipation discussed in
Chapter 7 with regard to how initial estimates of technical requirements, resources

139
allocation, and associated project schedules are determined and subsequently updated.
The RIM-based DSS is anticipated to potentially reduce superficial anticipation.
6.1.9 Early Process Engineering
Early process engineering entails collecting large amounts of relevant
information prior to need and organizing the information in accordance to constraints and
opportunities identified via selective anticipation. In particular, information related to
manufacturing processes. Companies that are not effective in RIM gather large amounts
of data, but do not make it useful to teaming decisions. Chapter 7 provides multiple
examples of early process engineering in the context of information typically developed
by manufacturing engineering but not organized appropriately for reuse. RIM-
diagramming efforts highlight the need for manufacturing engineering conceptual
information hierarchies, which ultimately become databases supporting the DSS.
6.1.10 Preplanning Knowledge
Preplanning knowledge is the ability to identify the tasks to be accomplished and
questions to be addressed in advance of the availability of specific task information.
Preplanning knowledge includes items such as checklists, contingency plans, and
procedures for handling new requirements. Companies that perform better in preplanning
knowledge accomplish more effectively overall RIM and feedfoward planning. The
development of the RIM-based DSS itself addresses the implementation of preplanning
knowledge. In addition, Chapter 7 documents how RIM-diagramming underscores the
need for the development of several conceptual information hierarchies related to

140
capacity contingency plans, the removal of information silos, and the organization of
manufacturing engineering information related to new processes and equipment.
6.1.11 Feedforward Planning Effectiveness
Feedfoward planning effectiveness is the capability of a company to anticipate
constraints and opportunities thereby avoiding rework and other associated problems.
Feedforward effectiveness is not directly measured by overall product development
project performance in terms of sales and product functionality. Just because a product
sells and functions properly does not mean that the product development process utilized
was an efficient one. Verganti uses a fuzzy function to measure feedforward planning
effectiveness that is sensitive to the occurrences of: 1) rework, 2) engineering changes, 3)
unanticipated product cost increases, and 4) missed time to market estimates. It is
anticipated that the use of a RIM-based DSS facilitates improvement in overall
feedforward planning effectiveness.
6.1.12 RIM-Learning by Development and RIM-Learning by Experience
RIM-learning by development relies on knowledge gained from developing a new
solution, i.e., a new design. Hence, the comparison to determine what has been learned
during development is between the conceptual design release and the final design release.
Many companies do not accomplish a formal conceptual design release, and therefore,
have difficulty modeling the design process. The approach suggested by this research
includes the use of a formal concept design release to facilitate RIM-learning by
development.

141
RIM-learning by experience relies on knowledge gained from actually
manufacturing a past product. Hence, the comparison to determine what has been learned
by experience is between the final configuration of the product manufactured versus the
design released and the information related to the forecasted requirements of the task
versus the accomplishment of the task.
6.1.13 Cost Breakdown Structure (CBS) Work Center
Cost breakdown structure (CBS) work center is a discretionary name used in this
research to refer to the CBS designation applied to the tasks of routing jobs and
accumulating labor charges by fabrication process or assembly task within the enterprise.
The name used for each level of a CBS will vary by enterprise and work center is not to
be confused with an industry-wide terminology. The designation of a work center is a
part of an overall Business Management activity cost management strategy. The strategic
use of the CBS work center structure facilitates the exchange of knowledge related to in-
house processes.
6.1.14 Feedforward Planning Model (FFPM)
The feedforward planning model (FFPM) is a term used to describe the collective
logic unique to the DSS. The FFPM is the mechanism facilitating the management of
reciprocal interdependencies and anticipated capability at a level of detail required for
effective conceptual design decision making. In many instances, the FFPM
imitates/emulates the logic used by automated systems with the eight IDEF0 activities
once a complete design is released.

142
6.1.15 Feedforward Planning Model (FFPM) Fabrication Plan
A Feedforward Planning Model (FFPM) fabrication plan is an assumption-based
processing sequence and manufacturing plan developed and maintained by
manufacturing engineering in conjunction with Fabrication activity consensus. The
FFPM fabrication plan is organized by CBS work center and includes forecasted design
tooling requirements by tool code by work center. The FFPM fabrication plan is initially
obtained by the DSS from the Planning activity based on design selective anticipation
features. The FFPM contains important information related to design complexity
features, and the IPT utilizes this information as a consistent starting point for
determining the most likely process sequence for the design.
Once the IPT finalizes the FFPM fabrication plan, it becomes part of the
conceptual design release package and facilitates knowledge exchange between the RIM-
based DSS and the manufacturing execution system (MES) within the Factory
Management activity.
6.1.16 Other Database Contents
In Figure 6.2, there is a reference to “Other database contents” under the RIM-
Based DSS circle. The conceptual information hierarchies presented within this research
are envisioned to be a part of a future database scheme supporting the DSS.
6.1.17 Conceptual Design Release Package
A conceptual design release package is the formalization of the conceptual design
requirements information in electronic format so it can be used by the manufacturing
143
execution system. The conceptual design release package is a simulation of a detail
design release package. The conceptual information hierarchies defined in Chapter 7
combined with IPT decisions made within the DSS framework support the generation of
this package. Once the final design is released, the conceptual design release package
offers a much-needed source of information to model the design process.
6.1.18 The Generic Product Development Process
In Chapter 2, Ulrich and Eppinger’s (2000) six-phase generic product
development process (i.e., planning, concept development, system level design, etc.) is
further refined into eight activities on IDEF0 diagrams. Activities #1 through #8 on
Figures 6.1 and 6.2 correlate to the eight activities on the IDEF0 diagrams in Chapter 2.
These activities are:
1. Business Management 2. Factory Management (before design release) 3. Engineering 4. Factory Management (after design release) 5. Planning 6. Tool design 7. Fabrication 8. Assembly
6.1.19 The Segregation of Activities #7 and #8
Activities #7 and #8 (i.e., Fabrication and Assembly) are not as heavily involved
in feedforward planning efforts when compared to other activities described in Chapter 7
because the knowledge related to these activities is typically maintained in the Factory
Management activity. Activities #7 and #8 are more heavily oriented toward feedback
planning and actual performance of manufacturing tasks. The manufacturing execution

144
system (MES) within the Factory Management activity is the repository of shop floor
control related knowledge.
6.1.20 Manufacturing Constraints and Opportunities
Manufacturing constraints and opportunities is a phrase utilized by Verganti.
The title of the literature reference is “Anticipating Manufacturing Constraints and
Opportunities in the Concept Generation and Product Planning Phases.” Thus, the term
is maintained in this research for consistency.
6.1.21 Summary
The proceeding definitions and explanations provide the reader with the
foundational knowledge required to correlate Figures 6.1 and 6.2 with information
presented in the first five chapters of this research as well as to be presented Chapter 7.

145
6.2 Conceptual Architecture: A Connection of Higher-Level and Lower-Level Information
In this section, the conceptual information hierarchies presented in Chapter 7 are
offered in groupings that coincide with the activities on the IDEF0 diagrams (i.e., Chapter
2, pages 53 through 56). The grouping effort is intended to assist the reader in making
the connection between the highest level of detail in Figures 6.2 and 6.3 and the lowest
level of detail offered in Chapter 7.
In Chapter 7, the conceptual framework for developing a RIM-based DSS is
presented in the context of an aircraft manufacturing enterprise using the detailed,
specific case of an NC machined bulkhead. At various points throughout Chapter 7,
conceptual information hierarchies are presented. In section 6.2, the first steps toward
organizing and grouping the conceptual information hierarchies to support the
development of a conceptual architecture is overviewed.
Tables 6.1, 6.2, and 6.3 illustrate the beginning of the grouping task (i.e.,
organizing the individual conceptual hierarchies in accordance with the numbered
activities on the IDEF0 diagrams in Chapter 2). Each table represents the collection of
conceptual information hierarchies presented in Chapter 7 as being part of a larger
information system developed and maintained by a specified activity. Table 6.1 is
offered first, and an explanation of the table follows.

146
Table 6.2 Collections of Conceptual Information Hierarchies for the Business Management System SYSTEM DESCRIPTION AND IDEF0 DIAGRAM ACTIVITY NUMBER PAGE
FIGURE OR TABLE
REFERENCE
FIGURE OR TABLE
DESCRIPTION
Business Management System (IDEF0 Activity #1)
Financial Management and Estimating
177 Figure 7.2 Conceptual High-Level Cost Breakdown Structure Information Hierarchies
180 Figure 7.3 Lower-Level CBS Information Hierarchies Not Related to Detail Fabrication
258 Figure 7.4 Lower-Level CBS Information Hierarchies for Detail Fabrication
258 Figure 7.7 Design Processing
Categories
303 Figure 7.24 Conceptual Business
Management Hierarchies
340 Figure 7.33 Non-Recurring Engineering and Tool Design Information Hierarchies (Direct Labor and Scheduling Templates)
297 Figure 7.21 (Subset of Figure 7.33)
Non-Recurring Engineering and Tool Design Information Hierarchies (Direct Labor Templates)
Procurement
303 Figure 7.22 Make/Buy Policies Management Conceptual Information Hierarchies
340 Figure 7.34
299 Figure 7.23
(Subset of Figure 7.34) Procurement Management Conceptual

147
The first column of Tables 6.1 through 6.3 contains the description of the system
and the IDEF0 activity number with which it is associated. (IDEF0 diagrams previously
presented in Chapter 2, pages 53 through 56.)
The second column provides a page reference where the conceptual information
hierarchy is presented. (Note pages 258, 303, 316, and 340 are pages where multiple
conceptual information hierarchies are collected within a major section of Chapter 7.)
The third column lists the figure number or table number reference. In some
instances, the reference is italicized. The italics indicate the reference is a subset of the
prior reference. For example, in Table 6.1, Figure 7.21 is italicized. The conceptual
information hierarchy in Figure 7.21 was developed first in Chapter 7, and subsequently
the information hierarchy was updated to Figure 7.34. Hence, Figure 7.21 is a subset of
Figure 7.34. The fourth columns of Tables 6.1 through 6.3 contain the descriptions for
each figure or table reference in the third column.
Figure 6.3 provides an illustration of the conceptual hierarchies grouped in
accordance to Table 6.1. Figure 6.3 is not intended to represent linkages of order; but is
only offered to assist the reader with recalling the conceptual information hierarchies
presented in Chapter 7.

14
8
Bus
ines
s M
anag
emen
t Act
ivity
#1
148
Fig
ure
7.22
Mak
e/B
uy P
olic
ies
Man
agem
ent
Con
cept
ual I
nfor
mat
ion
Hie
rarc
hies
Figu
re 7
.2 C
once
ptua
l Hig
h-L
evel
Cos
t B
reak
dow
n
S
truc
ture
Inf
orm
atio
n H
iera
rchi
es
• A
ircr
aft S
yste
m C
ost
o E
ngin
eeri
ng
! D
esig
n (N
onre
curr
ing)
[de
sign
er]
! R
ecur
ring
o T
oolin
g !
Non
recu
rrin
g (1
st a
rtic
le &
rat
e to
olin
g)
• T
ool d
esig
n
o T
ool d
esig
n [t
ool d
esig
ner]
o W
ork
inst
ruct
ions
[pl
anne
r]
o T
ool e
ngin
eeri
ng [
man
ufac
turi
ng e
ngin
eer]
•
Too
l man
ufac
turi
ng
o T
ooli
ng m
ater
ial
o T
ooli
ng la
bor
! R
ecur
ring
(su
stai
ning
tool
mai
nten
ance
) o Q
ualit
y !
Non
recu
rrin
g qu
alit
y as
sura
nce
! R
ecur
ring
insp
ecti
on a
nd te
st
o R
ecur
ring
Pro
duct
ion
! M
anuf
actu
ring
•
Man
ufac
turi
ng m
ater
ial
o M
ater
ial d
irec
t o M
ater
ial i
ndir
ect [
purc
hasi
ng r
epre
sent
ativ
e]
• M
anuf
actu
ring
ove
rhea
d o M
anuf
actu
ring
indi
rect
[in
dust
rial
eng
inee
r]
• M
anuf
actu
ring
labo
r
o M
anuf
actu
ring
dir
ect [
touc
h la
bor]
o M
anuf
actu
ring
indi
rect
[m
anuf
actu
ring
supe
rvis
ion
and
dire
ct s
uppo
rt; m
anuf
actu
ring
repr
esen
tati
ves]
o P
roje
ct M
anag
emen
t !
Oth
er [
othe
r co
st e
ngin
eers
] o T
BD
o T
BD
Figu
re 7
.3 L
ower
-Lev
el C
BS
Info
rmat
ion
Hie
rarc
hies
N
ot R
elat
ed to
Det
ail F
abri
cati
on
• Fi
nal A
ssem
bly
o M
ate
& C
ompl
ete
o P
aint
•
Com
pone
nt A
ssem
bly
o (
mul
tiple
leve
ls f
or s
truc
ture
and
sys
tem
s)
• M
echa
nica
l Sub
asse
mbl
y o (
mul
tiple
leve
ls)
• Sp
ecia
l Fab
rica
tion
and
Sub
asse
mbl
y o W
eldi
ng
! E
lect
ron
Bea
m
! L
aser
Bea
m
o E
lect
rica
l Com
pone
nts
(Ele
ctri
cal)
!
Har
ness
es
! C
able
s o T
ubin
g an
d D
ucts
(Pl
umbi
ng)
! T
ubin
g &
duc
t fab
rica
tion
! T
ubin
g &
duc
t ass
embl
y o O
ther
….
Figu
re 7
.4 L
ower
-Lev
el C
BS
Info
rmat
ion
Hie
rarc
hies
for
Det
ail F
abri
cati
on
• D
etai
l Fab
rica
tion
o
Com
posi
tes
Fabr
icat
ion
!
TB
D (
hier
arch
ies
not d
efin
ed o
r di
scus
sed)
o
Shee
t Met
al F
abri
catio
n
• T
BD
(hi
erar
chie
s no
t def
ined
or
disc
usse
d)
o
NC
Mill
ing
and
Supp
ort
[Gro
up 1
of 9
] !
NC
Mill
ing
•
3-A
xis
mill
ing
(wor
k ce
nter
leve
l)
• 5-
Axi
s m
illin
g
• 5-
Axi
s hi
gh s
peed
mil
ling
!
Spec
ialty
Hol
e Pr
oces
sing
(E
quip
men
t) [
Gro
up 2
of 9
] •
Dri
lling
/Bor
ing
type
1 (
wor
k ce
nter
leve
l)
• D
rilli
ng/B
orin
g ty
pe 2
•
3-A
xis
(too
ling
hole
s)
! M
inor
Sub
asse
mbl
y fo
r NC
Mac
hine
d Pa
rts
[Not
dis
cuss
ed]
• H
ole
proc
essi
ng (
wor
k ce
nter
leve
l)
• B
ushi
ng in
stal
latio
n •
Nut
plat
e in
stal
latio
n !
Han
d Fi
nish
[G
roup
3 o
f 9]
•
Vap
or d
egre
ase
(wor
k ce
nter
leve
l)
• D
ebur
r •
Hol
e pr
oces
sing
(po
rtab
le s
yste
ms)
•
Too
ling
tab
rem
oval
o
Coa
ting
s [G
roup
4 o
f 9]
! W
ash/
Cle
an (
wor
k ce
nter
leve
l)
! M
ask
!
Prim
e !
Pain
t !
Ele
ctri
cal b
ondi
ng
! Se
al b
ondi
ng (
not d
iscu
ssed
) o
Har
deni
ng a
nd/o
r Sp
ecia
l Tre
atm
ent [
Gro
up
5 of
9]
! W
ash/
Cle
an (
wor
k ce
nter
leve
l)
! H
eat t
reat
!
Hea
t tre
at a
ge
o
Che
mic
al P
roce
ssin
g [G
roup
6 o
f 9]
!
Was
h/C
lean
(w
ork
cent
er le
vel)
!
Che
mic
al m
illin
g !
Ann
odiz
e !
Plat
ing
o
Form
ing
[Gro
up 7
of 9
] !
Was
h/C
lean
(w
ork
cent
er le
vel)
! Sh
ot p
een
o
Mar
king
[G
rou
p 8
of 9
] !
Stam
ping
(w
ork
cent
er le
vel)
!
Vib
roen
grav
e •
Det
ail F
abri
cati
on Q
ualit
y A
ssur
ance
[G
roup
9 o
f 9]
o
Plat
e in
spec
tion
o
Inte
rmed
iate
insp
ecti
on
o
Non
-des
truc
tive
test
ing
o
Fina
l ins
pect
ion
o
TB
D
Figu
re 7
.7 I
nfor
mat
ion
Hie
rarc
hies
for
Des
ign
Proc
essi
ng C
ateg
orie
s
•
Des
ign
Proc
essi
ng C
ateg
orie
s
o
Shap
ing
! Fo
rgin
g +
Mac
hini
ng
! N
C M
achi
ning
!
Shee
t Met
al F
abri
catio
n !
Com
posi
tes
!
Oth
er (
TB
D)
o
Mec
hani
cal
Ass
embl
y o
Ele
ctri
cal H
arne
sses
and
Cab
les
(E
lect
rica
l)
o
Tub
ing
and
Duc
ts (
Plum
bing
) o
TB
D
Fig
ure
6.22
Mak
e/B
uy P
olic
ies
Man
agem
ent
C
once
ptua
l In
form
atio
n H
iera
rchi
es
•M
ake/
Buy
Pol
icie
s o
Proc
essi
ng c
ateg
orie
s !
NC
mac
hini
ng (
mak
e)
! P
roce
ssin
g ca
tego
ry x
(m
ake,
buy
) !
Pro
cess
ing
cate
gory
(m
ake,
buy
) !
TB
D
o D
esig
n ty
pe
• B
ulkh
ead
xxx
NC
mac
hini
ng (
buy)
•
TB
D
o D
esig
n T
ools
!
Too
l co
de y
•
Con
trol
num
ber
xxx
(mak
e)
! T
ool
code
z
• C
ontr
ol n
umbe
r xx
x (b
uy)
! T
BD
•
Raw
Mat
eria
ls
o M
ater
ial a
o
Mat
eria
l b
o T
BD
Figu
re 6
.3 B
usin
ess
Man
agem
ent
Sys
tem
: C
once
ptua
l Inf
orm
atio
n H
iera
rchi
es S
uppo
rtin
g th
e D
SS
•
Raw
Mat
eria
l o
M&
P m
ater
ial c
ode
! Pl
ate
• S
tand
ard
size
s o
Ven
dors
!
Cos
t (B
Y, u
nbur
dene
d $)
!
Ord
er h
isto
ry (
M-d
ays)
!
Ord
er h
isto
ry (
M-d
ays)
o
Proj
ect
tem
plat
es
! P
roje
ct x
!
Cos
t (B
Y, u
nbur
dene
d $)
!
Ord
er h
isto
ry (
M-d
ays)
!
Bar
sto
ck
• S
ame
as p
late
o
“”
! T
BD
•
Sam
e as
pla
te
o “”
!
Too
l Cod
e •
Whe
re u
sed
o D
esig
n se
lect
ive
anti
cipa
tion
fea
ture
s !
Sta
ndar
dize
d ra
nges
•
Ven
dors
(hi
stor
ical
dat
a)
o C
ost (
BY
, unb
urde
ned
$)
o O
rder
his
tory
(M
-day
s)
• P
roje
ct t
empl
ates
o
Proj
ect
x o
Cos
t (B
Y, u
nbur
dene
d $)
o
Ord
er h
isto
ry (
M-d
ays)
o
RO
M Q
uote
s !
Des
ign
num
ber
! T
ool n
umbe
r !
TB
D
o F
inal
Bid
s !
Des
ign
num
ber
! T
ool n
umbe
r !
TB
D
o T
BD
Figu
re 7
.34
Proc
urem
ent M
anag
emen
t Con
cept
ual
Inf
orm
atio
n H
iera
rchi
es (
Upd
ate
of
Fig
ure
7.23
Ref
lect
ing
Sch
edul
ing
Tem
plat
es
•
Proj
ect
o D
esig
n se
lect
ive
antic
ipat
ion
feat
ures
!
Det
ail d
esig
n te
mpl
ates
•
Des
ign
hour
s •
Des
ign
M-d
ays
• W
ork
inst
ruct
ions
hou
rs
• W
ork
inst
ruct
ions
M-d
ays
!
Too
l cod
e te
mpl
ates
•
Too
l mod
el h
ours
•
Too
l mod
el M
-day
s •
Too
l des
ign
hour
s •
Too
l des
ign
M-d
ays
• T
ool m
anuf
actu
ring
wor
k in
stru
ctio
ns h
ours
•
Too
l man
ufac
turi
ng w
ork
ins
truc
tion
s M
-day
s
Figu
re 7
.33
Non
-Rec
urri
ng E
ngin
eeri
ng a
nd T
ool
Des
ign
Dir
ect L
abor
and
Sch
edul
ing
C
once
ptua
l Inf
orm
atio
n H
iera
rchi
es
(U
pdat
ed F
igur
e 7.
23)
•
Pro
ject
/Pro
gram
o
WB
S
o S
WB
S (
Mas
ter
Sche
dule
) o
CB
S
o A
ccou
ntin
g m
onth
s o
Fac
tors
!
Non
rec
urri
ng
• T
BD
•
TB
D
! R
ecur
ring
•
TB
D
• T
BD
o
Rat
es
! N
on r
ecur
ring
•
TB
D
• T
BD
!
Rec
urri
ng
• T
BD
•
TB
D
o L
earn
ing
curv
es
! A
ssem
bly
CB
S nu
mbe
r •
TB
D
• T
BD
!
Fabr
icat
ion
CB
S n
umbe
r •
TB
D
• T
BD
!
Oth
er
• T
BD
Figu
re 7
.24
Con
cept
ual B
usin
ess
M
anag
emen
t
Inf
orm
atio
n H
iera
rchi
es
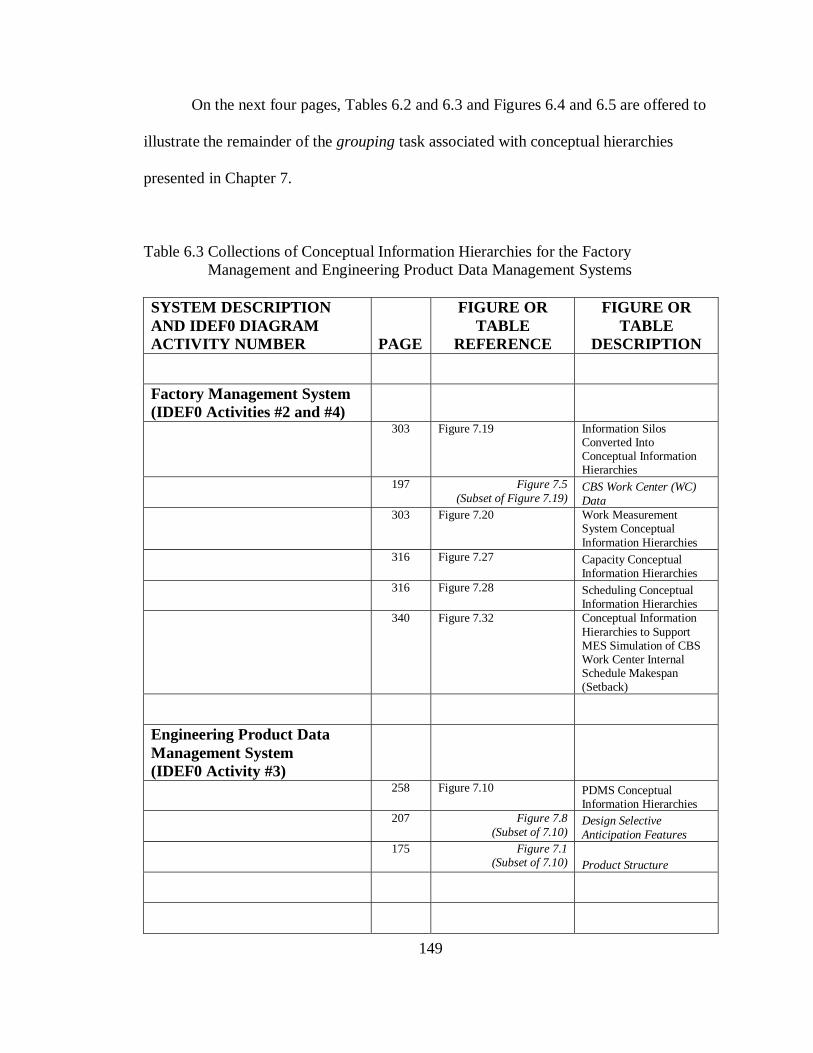
149
On the next four pages, Tables 6.2 and 6.3 and Figures 6.4 and 6.5 are offered to
illustrate the remainder of the grouping task associated with conceptual hierarchies
presented in Chapter 7.
Table 6.3 Collections of Conceptual Information Hierarchies for the Factory Management and Engineering Product Data Management Systems SYSTEM DESCRIPTION AND IDEF0 DIAGRAM ACTIVITY NUMBER PAGE
FIGURE OR TABLE
REFERENCE
FIGURE OR TABLE
DESCRIPTION
Factory Management System (IDEF0 Activities #2 and #4)
303 Figure 7.19 Information Silos Converted Into Conceptual Information Hierarchies
197 Figure 7.5
(Subset of Figure 7.19) CBS Work Center (WC) Data
303 Figure 7.20 Work Measurement System Conceptual Information Hierarchies
316 Figure 7.27 Capacity Conceptual
Information Hierarchies
316 Figure 7.28 Scheduling Conceptual
Information Hierarchies
340 Figure 7.32 Conceptual Information Hierarchies to Support MES Simulation of CBS Work Center Internal Schedule Makespan (Setback)
Engineering Product Data Management System (IDEF0 Activity #3)
258 Figure 7.10 PDMS Conceptual
Information Hierarchies
207 Figure 7.8
(Subset of 7.10) Design Selective Anticipation Features
175 Figure 7.1
(Subset of 7.10) Product Structure

15
0
150
Figu
re 6
.4 F
acto
ry M
anag
emen
t Sy
stem
: Con
cept
ual I
nfor
mat
ion
Hie
rarc
hies
Sup
port
ing
the
DSS
Fac
tory
Man
agem
ent #
2 (P
re-D
esig
n R
elea
se)
and
#4 (
Pos
t-D
esig
n R
elea
se)
•
CB
S W
ork
Cen
ter
(WC
) D
ata
o W
C n
umbe
r o
WC
loc
atio
n o
WC
layo
ut
o P
roce
ss d
escr
ipti
ons
o W
ork
er c
lass
ific
atio
ns
o M
ater
ial h
andl
ing
info
rmat
ion
! W
C i
ngre
ss/e
gres
s co
rrel
ated
to fe
atur
es
o P
roce
ssin
g sy
stem
inf
orm
atio
n !
Mos
t use
d M
& P
Spe
cs
! N
on-d
esig
n to
ols
! E
quip
men
t inv
ento
ry
• C
orre
late
d to
fea
ture
s (T
BD
)
Fig
ure
7.19
Inf
orm
atio
n S
ilos
Tra
nsfo
rmed
Int
o
Con
cept
ual
Info
rmat
ion
Hie
rarc
hies
(
Upd
ated
Fro
m F
igur
e 7.
5)
•
Wor
k M
easu
rem
ent
• W
ork
cent
er n
umbe
r •
Proc
ess
stud
ies
•
Mat
eria
l ha
ndli
ng c
onst
rain
ts
bas
ed o
n de
sign
sel
ecti
ve
an
tici
pati
on f
eatu
res
• G
roup
ed s
tand
ard
CE
Rs
sens
itiv
e
to
des
ign
sele
ctiv
e
ant
icip
atio
n fe
atur
es
• D
etai
l fe
atur
es-b
ased
sta
ndar
d
va
lues
(se
nsit
ive
to a
ll f
eatu
res;
for
spe
cifi
c ap
plic
atio
n to
nea
rly
c
ompl
ete
desi
gn)
• T
BD
Figu
re 7
.20
WM
S C
once
ptua
l Inf
orm
atio
n
H
iera
rchi
es
•
Sch
edul
ing
o SW
BS
!
Wor
k ce
nter
num
ber
• M
-day
s o
His
tori
cal
data
!
Wor
k ce
nter
mak
espa
n (s
etba
ck)
• D
esig
n se
lect
ive
anti
cipa
tion
fe
atur
es
• T
ool d
esig
n se
lect
ive
anti
cipa
tion
fe
atur
es (
not
defi
ned
in t
his
re
sear
ch)
• T
BD
Figu
re 7
.28
Sche
duli
ng C
once
ptua
l
I
nfor
mat
ion
Hie
rarc
hies
•
Cap
acity
o
Wor
k ce
nter
num
ber
! M
ax h
eadc
ount
by
shif
t !
Max
mac
hine
s by
shi
ft
! M
ax a
ctua
l ho
urs
avai
labl
e by
shi
ft
by
acc
ount
ing
mon
th
! Fo
reca
st a
ctua
l hou
rs f
irm
pla
nned
(com
plet
e de
sign
s) b
y sh
ift b
y
ac
coun
ting
mon
th
• Fi
rm p
lann
ed C
apac
ity (
com
plet
e
d
esig
ns)
by s
hift
by
acco
unti
ng
mon
th
• A
vaila
ble
capa
city
rem
aini
ng b
y
shi
ft b
y ac
coun
ting
mon
th
• C
onti
ngen
cy p
lans
•
TB
D
• C
RP
Sim
ulat
ion
o W
ork
cent
er
! R
eali
zati
on f
acto
r •
Oth
er f
acto
rs
• T
BD
Figu
re 7
.27
Cap
acity
Con
cept
ual
Inf
orm
atio
n H
iera
rchi
es
•
ME
S S
imul
atio
n o
CB
S W
ork
cent
er
! D
esig
n se
lect
ive
anti
cipa
tion
fea
ture
s •
Sch
edul
e m
akes
pan
(M-d
ays)
Figu
re 7
.32
Con
cept
ual I
nfor
mat
ion
Hie
rarc
hies
t
o Su
ppor
t ME
S S
imul
atio
n of
CB
S
W
ork
Cen
ter
Inte
rnal
Sch
edul
e M
akes
pan
(
or S
etba
ck)

151
Table 6.4 Collections of Conceptual Information Hierarchies for the Planning System and the Tool Design and Control System SYSTEM DESCRIPTION AND IDEF0 DIAGRAM ACTIVITY NUMBER PAGE
FIGURE OR TABLE
REFERENCE
FIGURE OR TABLE
DESCRIPTION
Planning System (IDEF0 Activity #5)
258 Figure 7.16 Conceptual Manufacturing Engineering (ME) Technical Information Hierarchies (Update of Figure 6.14)
237 Figure 7.14 (Subset of Figure 7.16)
Conceptual Manufacturing Engineering (ME) Technical Information Hierarchies
249 Table 7.12 (Subset of Figure 7.16)
Conceptual FFPM Fabrication Plan (Processing Sequence)
Tool Design and Control System (IDEF0 Activity #6)
258 Figure 7.11 Tool Classification and Control System Information Hierarchies

15
2
CB
S
Wor
k C
ente
r #
CB
S
Pro
cess
ing
Des
crip
tion
Des
ign
Too
ls
Mak
e/B
uy
xxx
Mat
eria
l rec
eipt
-p
late
(s)
xx
x P
late
insp
ectio
n
xx
x V
ibro
engr
ave
xxx
Too
ling
hole
s T
ool c
ode
X
xxx
Pla
te s
urfa
ce m
ill
xxx
*1 M
illin
g T
rial
Run
T
ool c
ode
X
xxx
Han
d fi
nish
- c
lean
xx
x --
----
----
----
----
----
----
----
--
----
--
----
- xx
x *2
Spe
cial
hol
e pr
oces
sing
T
ool c
ode
X
xxx
*2 T
oolin
g (c
oord
inat
ed)
ho
les
Too
l cod
e X
xxx
----
----
----
----
----
----
----
--
----
----
--
---
xxx
Mar
k
Figu
re 6
.5 E
ngin
eeri
ng, P
lann
ing,
and
Too
ling
Sys
tem
s: C
once
ptua
l Inf
orm
atio
n H
iera
rchi
es S
uppo
rtin
g th
e D
SS
152
Pla
nnin
g A
ctiv
ity #
5
ME
FF
PM
fabr
icat
ion
plan
s ar
e co
mpo
sed
of
info
rmat
ion
sim
ilar
to
Tab
le 7
.12
for
vari
ous
proc
essi
ng c
ateg
orie
s ba
sed
on s
elec
tive
an
tici
pati
on fe
atur
es
Eng
inee
ring
Act
ivity
#3
•
EB
OM
o
WB
S
o SW
BS
o
Des
ign
cont
rol n
umbe
r o
Nom
encl
atur
e o
Des
crip
tion
o N
ext
asse
mbl
y o
Des
ign
sele
ctiv
e an
tici
pati
on f
eatu
res
! D
etai
l typ
e =
bul
khea
d •
Mat
eria
l typ
e •
Fini
shed
wei
ght
(tar
get)
•
Part
env
elop
e {L
, W, D
} •
Surf
ace
area
(2D
-1S
) •
Serv
ice
life
•
Suba
ssem
bly
proc
ess
! D
etai
l typ
e (T
BD
) •
Bas
ed o
n de
tail
type
•
Bas
ed o
n de
tail
type
•
TB
D
• E
lect
roni
c re
pres
enta
tion
s •
Pro
cess
ing
cate
gori
es d
efin
ition
s (u
sed
by D
SS)
• M
ater
ials
and
pro
cess
es (
M&
P)
spec
ific
atio
ns
• M
ater
ials
and
pro
cess
es (
M&
P)
mat
eria
l cod
es
• S
tand
ard
part
s •
TB
D
Figu
re 7
.10
PD
MS
Con
cept
ual I
nfor
mat
ion
H
iera
rchi
es
•
ME
Tec
hnic
al In
form
atio
n
o W
ork
cent
er n
umbe
r !
Mac
hine
s (s
tudi
es)
!
Equ
ipm
ent (
stud
ies)
!
Por
tabl
e sy
stem
s (s
tudi
es)
!
TB
D (
stud
ies)
!
Man
ufac
turi
ng s
elec
tive
ant
icip
atio
n fe
atur
es
! T
echn
ical
pro
cess
cap
abili
ty l
imit
atio
ns
! T
echn
ical
pro
cess
rul
es a
nd p
refe
renc
es
o B
ench
mar
king
o
Supp
lier
s !
New
pro
cess
es
! N
ew m
achi
nes/
equi
pmen
t o
ME
FF
PM
fabr
icat
ion
plan
s !
Com
plex
ity fe
atur
es e
xpla
nati
ons
• P
roce
ssin
g ca
tego
ries
•
Des
ign
sele
ctiv
e an
tici
pati
on fe
atur
es
• D
esig
n ty
pe
• M
ater
ial t
ype
• F
inis
hed
wei
ght
(wei
ght
rang
e)
• D
esig
n en
velo
pe (
size
ran
ge)
• Su
rfac
e ar
ea
• Se
rvic
e li
fe
• Su
bass
embl
y pr
oces
s
Fi
gure
7.1
6 C
once
ptua
l Man
ufac
turi
ng E
ngin
eeri
ng (M
E)
Tec
hnic
al
Inf
orm
atio
n H
iera
rchi
es (
Mod
ifie
d fr
om F
igur
e 7.
14)
Too
l Des
ign
Act
ivity
#6
Fig
ure
7.11
Too
l C
lass
ific
atio
n an
d C
ontr
ol S
yste
m I
nfor
mat
ion
Hie
rarc
hies
• D
esig
n to
ol c
lass
ific
atio
n an
d co
ntro
l nu
mbe
r o
Seri
al n
umbe
r o
Des
ign
tool
cod
e (n
ame/
type
) o
Tool
sel
ectiv
e an
ticip
atio
n fe
atur
es (
TB
D)
o
Whe
re u
sed
(CB
S w
ork
cent
er n
umbe
r)
o
Des
ign
cont
rol
num
ber
refe
renc
e (p
art n
umbe
r )
! D
esig
n ty
pe
! D
esig
n m
ater
ial t
ype
! D
esig
n fi
nish
ed w
eigh
t !
Des
ign
part
env
elop
e !
Des
ign
surf
ace
area
(2D
-1S)
!
Des
ign
serv
ice
life
{ca
tego
ry}
o
Too
l con
trol
num
ber
refe
renc
e (i
f too
l-to
-mak
e-to
ol)
! To
ols-
to-m
ake-
tool
s se
lect
ive
antic
ipat
ion
feat
ures
(TB
D)
o
Plac
ed i
n se
rvic
e da
te
o
In-h
ouse
man
ufa
ctur
ed
! T
ool
desi
gn h
ours
by
tool
cod
e !
Too
l m
anuf
actu
ring
hou
rs b
y to
ol c
ode
! D
irec
t m
ater
ial d
olla
rs [
base
yea
r (B
Y)
doll
ars]
o
Purc
hase
d to
ols
! V
endo
r by
tool
cod
e !
Unb
urde
ned
purc
hase
dol
lars
(B
Y)
• T
ool
esti
mat
ing
data
(hi
stor
ical
ave
rage
s)
o
Too
l cod
e
• W
here
use
d (w
ork
cent
er n
umbe
r) o
ccur
renc
e •
In-h
ouse
man
ufa
ctur
ed
o
Too
l des
ign
hour
s o
Too
l man
ufac
turi
ng h
ours
o
Dir
ect
mat
eria
l do
llars
[ba
se y
ear
(BY
) do
llar
s]
• P
urch
ased
tool
s o
Ven
dor
o
Unb
urde
ned
purc
hase
dol
lars
(B
Y)

153
Section 6.3 A Flow Diagram of a Decision Making Instance
This section provides a flow diagram of a working-level IPT decision-making
instance illustrates to provide the reciprocal interdependencies (i.e., knowledge links) and
information exchange supported by the RIM-based DSS. The flow diagram is composed
of a series of 11 figures, Figures 6.6 through 6.16.
Recall the figures are referring to conceptual information hierarchies from
Chapter 7 are summarized in Figures 6.3 through 6.5. These three figures provide a
useful reference when reviewing the flow diagram figures.
These flow diagram figures describe the envisioned operation of the DSS at a
very high level. They also provide a means to further assimilate the conceptual
information hierarchies from Chapter 7.

154
Figure 6.6 Flow Diagram of DSS Operation: 1 of 11
NO-New process
YES-Common process
YES
NO
DSS -Start
Design Processing Categories (Activity #1, Fig. 6.7) -Select process category
Design Selective Anticipation Features (DSAF) -Manually enter or -Electronically transfer from PDMS (Activity #3, Fig. 6.10)
Help is available to explain selective anticipation features and includes examples
FFPM Assumption-Based Fabrication Plan Provided by DSS Feedback on key technical information is available
Processing Category supported by DSS?
Supplier-based approach TBD
Design Make/Buy Policy? (Activity #1, Fig. 6.22)
BUY
New In-house process?
New technology insertion project
ME and IE studies required to incorporate process CBS and MES systems changes DSS updates
MAKE
Supplier-based approach TBD
Design Control Number -Manually enter or -Select from PDMS (Activity #3, Fig. 6.10)
DSS Logic Utilizes DSAF to Relate to Key Databases
Data from Activity #5, Fig. 7.16 (FFPM fabrication plan) Activity #6, Fig. 7.11 (Tool codes by WC - Make) Activity #1, Fig. 7.24 (Tool codes by WC – Buy) Activity #1, Fig. 7.24 (Raw material by type – Buy)
Technical Feedback Examples Activity #2, Fig. 7.19; Activity #5, Fig. 6.16 – equipment and machine sizes compared to DSAF for compatibility Activity #2, Fig. 7.20 - work measurement material handling limits compared to DSAF for compatibility Activity #2, Fig. 7.19 - work center (process) descriptions available Activity #5, Fig. 7.16 – manufacturing engineering studies Activity #6, Fig. 7.11 - design tool codes examples and definitions available Activity #2, Fig. 7.19 - most used M&P specifications by work center Activity #2, Fig. 7.19 - existing equipment and non-design tools used in each work center Activity #6, Fig. 7.16 - manufacturing selective anticipation features by work center Activity #6, Fig. 7.16 – process capability limits by work center; process rules and preferences by work center Activity #1, Fig. 7.34 – material codes and standard sizes compared to DSAP to select closest standard plate stock Historical Data Examples Activity #1, Fig. 7.34; Activity #6, Fig. 7.11
• Design Processing Category = NC Machining • Detail Type = Bulkhead
o Material Type = n o Finished Weight (target) = w o Part Envelope
! Length (longest) = L ! Width (next longest) = W ! Depth (shortest) = D
o Surface area (two dimensional-one side, or 2D-1S) = SA o Service Life {= fracture critical} o Subassembly process = mechanical fastening
Figure 7.13
Go to next page
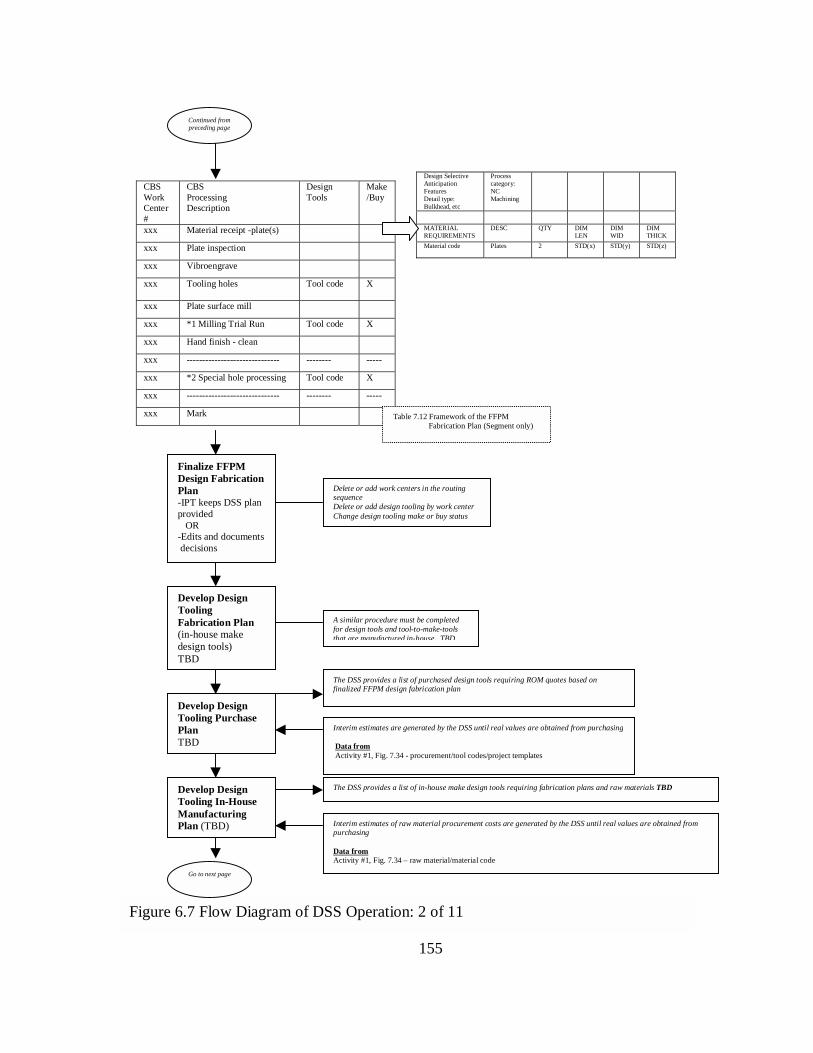
155
CBS Work Center #
CBS Processing Description
Design Tools
Make/Buy
xxx Material receipt -plate(s)
xxx Plate inspection
xxx Vibroengrave
xxx Tooling holes Tool code X
xxx Plate surface mill
xxx *1 Milling Trial Run Tool code X
xxx Hand finish - clean
xxx ------------------------------ -------- -----
xxx *2 Special hole processing Tool code X
xxx ------------------------------ -------- -----
xxx Mark
Design Selective Anticipation Features Detail type: Bulkhead, etc
Process category: NC Machining
MATERIAL REQUIREMENTS
DESC QTY DIM LEN
DIM WID
DIM THICK
Material code
Plates 2 STD(x) STD(y) STD(z)
Figure 6.7 Flow Diagram of DSS Operation: 2 of 11
Delete or add work centers in the routing sequence Delete or add design tooling by work center Change design tooling make or buy status
Finalize FFPM Design Fabrication Plan -IPT keeps DSS plan provided OR -Edits and documents decisions
A similar procedure must be completed for design tools and tool-to-make-tools that are manufactured in-house. TBD
Develop Design Tooling Fabrication Plan (in-house make design tools) TBD
Develop Design Tooling In-House Manufacturing Plan (TBD)
Interim estimates are generated by the DSS until real values are obtained from purchasing Data from Activity #1, Fig. 7.34 - procurement/tool codes/project templates
Develop Design Tooling Purchase Plan TBD
Interim estimates of raw material procurement costs are generated by the DSS until real values are obtained from purchasing Data from Activity #1, Fig. 7.34 – raw material/material code
Table 7.12 Framework of the FFPM Fabrication Plan (Segment only)
Go to next page
The DSS provides a list of purchased design tools requiring ROM quotes based on finalized FFPM design fabrication plan
The DSS provides a list of in-house make design tools requiring fabrication plans and raw materials TBD
Continued from preceding page

156
Related Work or Information Packages Qty Direct Charging Activity
Override Notes
Requirements List
Detail designs 1 As required
Design tools (make) X As required
Design tools (buy) Y As required
Deliverables List
Detail designs 1 Engineering activity As required
Design fabrication tool orders X+Y Planning activity As required
Design fabrication work instructions 1 Planning activity
Tool fabrication work instructions X Planning activity As required
Tool models X+Y Tool design activity As required
Tool designs X Tool design activity As required
Touch Labor DSS Generates Direct Touch Labor Requirements By Work Center Design fabrication Tool fabrication (TBD)
DSS Provides FFPM Assumption –Based Direct Labor (Non-touch) Support Plan
The DSS correlates the plans generated thus far to develop a list of work/information packages requiring development by direct charging personnel not classified as touch labor Note: These are deliverables not hours
Data from Activity #4, Fig. 7.20 - work measurement grouped standards sensitive to DSAF Activity #4, Fig. 7.27 – CRP simulation – realization and other factors -Tool fabrication TBD
Finalize FFPM Direct Support Plan -Keep generated direct support plan OR -Edit
Most edits should entail going back and revising fabrication plans Overrides require documentation
DSS logic discussed in Section 7.12
Go to next page
Figure 6.8 Flow Diagram of DSS Operation: 3 of 11
Continued from preceding page

157
Design Selective Anticipation Features-Detail type: Bulkhead, etc
Process category: NC Machining
CBS WORK CENTER
CBS DESCRIPTION SET UP Hrs
RUN Hrs
WC # Material receipt-plate(s) xx.xx xx.xx WC # Plate inspection Insp Insp WC # Vibroengrave xx.xx xx.xx WC# Tooling holes xx.xx xx.xx WC # Plate surface mill xx.xx xx.xx WC # Milling * Trial Run xx.xx xx.xx WC # Hand finish xx.xx xx.xx WC # Vibroengrave xx.xx xx.xx WC # ------------------------------ ------ ------ WC # ------------------------------ ------ ------ * - complexity considerations
No
Yes
The DSS generates an estimate of setup and run hours for each step in the processing sequence (fabrication plan)
Design Other Mfg Features?
If the design other manufacturing features are provided, a new value is calculated using Data from Activity #4, Fig. 7.20 – work measurement detail feature-based standard values
Generate Direct Support Labor Requirements Non-touch labor hours by activity
Data from Activity #1, Fig. 7.33 – non-recurring design and tooling labor (Refer to Figure 7.2 high-level CBS structure)
Other Direct Labor Go to next page
Figure 6.9 Flow Diagram of DSS Operation: 4 of 11
The only way the estimated hours can be changed is by entering the complete list of design other manufacturing features
IPT Finalizes Touch Labor Estimate -Keep generated values OR -Edit by providing additional detail
Continued from preceding page

158
Related Work or Information Packages Qty Direct Charging Activity Template Hours Total Direct Hours Justification for changes
Detail designs 1 Engineering activity xx.xx 1(xx.xx) As required
Design tools (make) X Fabrication activity xx.xx X(xx.xx) As required
Design fabrication tool orders X+Y Planning activity xx.xx (X+Y)(xx.xx) As required
Design fabrication work instructions 1 Planning activity xx.xx 1(xx.xx) As required
Tool fabrication work instructions X Planning activity xx.xx X(xx.xx) As required
Tool models X+Y Tool design activity xx.xx (X+Y)(xx.xx) As required
Tool designs X Tool design activity xx.xx X(xx.xx) As required
DSS Generates Schedule Start Dates for In-house Tool Fabrication by Work Center Data from
Activity #4, Fig. 7.32 - MES Simulation– schedule setback by work center for tool fabrication work centers - simulations used until actual release to MES
DSS Generates Raw Material Purchase Order Date For Detail Design
Data from Activity #1, Fig. 7.34 – procurement “order history” - project template used until actual quote is received
Finalize Non-Touch Labor Plan -Keep generated values OR -Edit
The individual IPT members may edit the DSS generated values, but the rationale behind changes must be documented
DSS Generates Schedule Start Dates for Design Fabrication By Work Center
DSS Generates Raw Material Need Date
The first work center start date is the need date for the raw material
Scheduling
Data from Activity #1, Fig. 7.24 – SWBS – next assembly need date Activity #4, Fig. 7.32 – MES Simulation – schedule makespan (M-days) by WC - (simulations used until some type of release is made to the MES)
Go to next page
Figure 6.10 Flow Diagram of DSS Operation: 5 of 11
Start date of detail fabrication work centers (generated previously) is used as the need date for tools by work center
Continued from preceding page

159
Figure 6.11 Flow Diagram of DSS Operation: 6 of 11
DSS Generates Schedule Purchase Order (PO) Dates for Purchased Tools
DSS Generates Raw Material Need Dates For Each In-House Tool
The first work center start date is the need date for the raw material
DSS Generates Raw Material Purchase Order Dates For Each In-House Make Tool
Data from Activity #1, Fig. 7.34 – project templates used until actual quotes are received
Start date of detail fabrication work centers (generated previously) is used as the need date for tools by work center
DSS Generates Schedule Requirements for Tool Design Tool Models for Purchased Tools
PO release date generated previously is the need date of the tool model
DSS Generates Schedule Requirements Tool Design and Tool Model for In-House Make Tools
Data from Activity #1, Fig. 7.33 - tool design M-day template Activity #1, Fig. 7.33 - tool model M-day template – tool model template is used to generate the tool model start date
DSS Generates Schedule Requirements for -Tooling work instructions -Manufacturing work instructions -Detail design
The tooling work instructions start is at the tool design release The tool model start is the design release The work instructions start is at the design release
Go to next page
Data from Activity #1, Fig. 7.34 – project templates used until actual quotes are received-PO release date is the date when the tool model must be finished
Data from Activity #1, Fig. 7.33 - tool model M-day template
Start date of the work center where the tool is used is the need date Start date of the tool design is the finish date for the tool model
Data from Activity #1, Fig. 7.33 contains schedule M-day templates for work instructions
Continued from preceding page
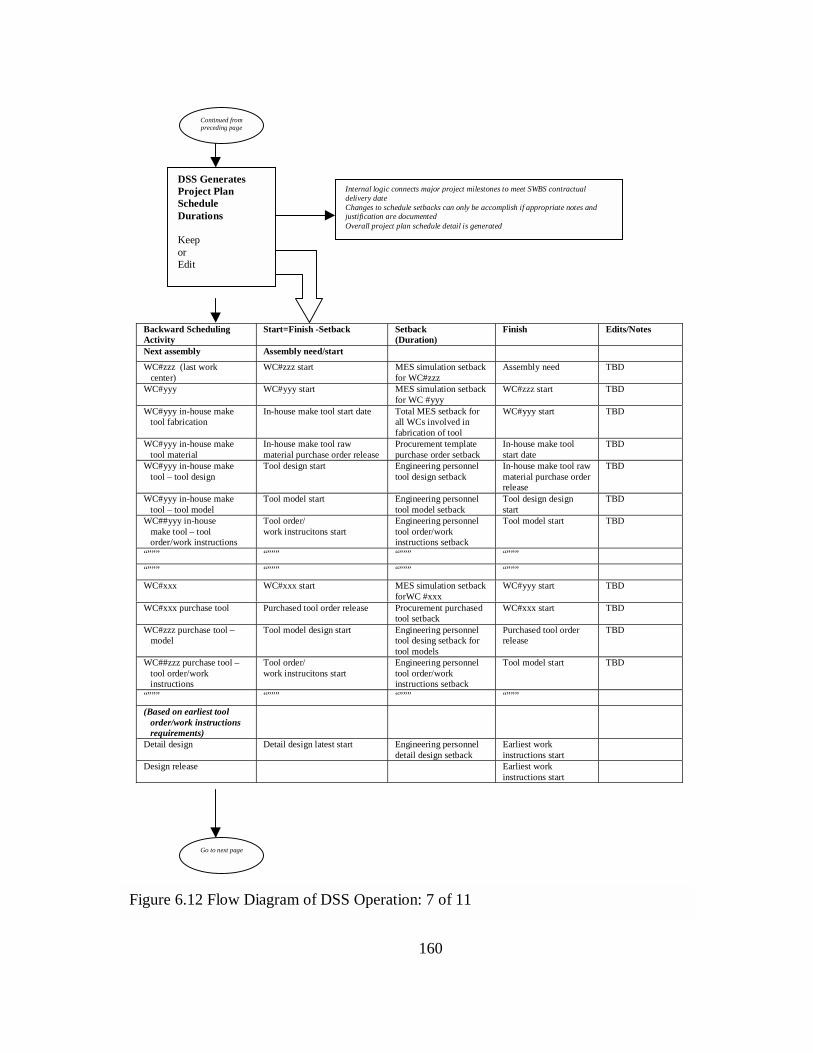
160
Backward Scheduling Activity
Start=Finish -Setback
Setback (Duration)
Finish Edits/Notes
Next assembly Assembly need/start
WC#zzz (last work center)
WC#zzz start MES simulation setback for WC#zzz
Assembly need TBD
WC#yyy WC#yyy start MES simulation setback for WC #yyy
WC#zzz start TBD
WC#yyy in-house make tool fabrication
In-house make tool start date Total MES setback for all WCs involved in fabrication of tool
WC#yyy start TBD
WC#yyy in-house make tool material
In-house make tool raw material purchase order release
Procurement template purchase order setback
In-house make tool start date
TBD
WC#yyy in-house make tool – tool design
Tool design start Engineering personnel tool design setback
In-house make tool raw material purchase order release
TBD
WC#yyy in-house make tool – tool model
Tool model start Engineering personnel tool model setback
Tool design design start
TBD
WC##yyy in-house make tool – tool order/work instructions
Tool order/ work instrucitons start
Engineering personnel tool order/work instructions setback
Tool model start TBD
“””” “””” “””” “”””
“””” “””” “””” “”””
WC#xxx WC#xxx start MES simulation setback forWC #xxx
WC#yyy start TBD
WC#xxx purchase tool Purchased tool order release Procurement purchased tool setback
WC#xxx start TBD
WC#zzz purchase tool – model
Tool model design start Engineering personnel tool desing setback for tool models
Purchased tool order release
TBD
WC##zzz purchase tool – tool order/work instructions
Tool order/ work instrucitons start
Engineering personnel tool order/work instructions setback
Tool model start TBD
“””” “””” “””” “”””
(Based on earliest tool order/work instructions requirements)
Detail design Detail design latest start Engineering personnel detail design setback
Earliest work instructions start
Design release Earliest work instructions start
DSS Generates Project Plan Schedule Durations Keep or Edit
Internal logic connects major project milestones to meet SWBS contractual delivery date Changes to schedule setbacks can only be accomplish if appropriate notes and justification are documented Overall project plan schedule detail is generated
Figure 6.12 Flow Diagram of DSS Operation: 7 of 11
Go to next page
Continued from preceding page

161
Capacity
DSS GENERATES CAPACITY ANALYSIS In-house bottlenecks are identified
Data from Activity #4, Fig. 7.27 – capacity by work center
In order to determine an appropriate value for cost in dollars, a timeframe of occurrence/expenditure is required. Rates and factors are typically applied at the accounting month level. If a task is performed in a timeframe later than originally forecast, then original cost estimates are no longer valid, and changes typically result in increases. Similarly, if the schedule for a design’s manufacture is assumed achievable without appropriate MES line balancing, then a significant management task is overlooked and the resulting forecast is likely erroneous, potentially leading to increases in cost. Until the manufacturing line is balanced, the actual schedule dates for a design’s manufacture cannot be accurately determined. Line balancing should occur for each task using backward scheduling to the engineering design task and its associated release date - for touch labor fabrication and assembly tasks alone. Proper line balancing requires a:
1) Detailed assembly load sequence for each design 2) Detailed fabrication sequence for each design 3) Detailed task completion sequence for other support tasks for each design 4) Compilation of a significant amount of design related information forecasts at the component and/or aircraft level,
such as: a. Assembly design installation drawings b. MES fabrication capacity c. Vendor quotes d. Direct support level (all tasks cannot be accomplished at once)
DSS Generates Cost Baseline Project Plan Cost Baseline for Non-Factored Tasks
Cost
Go to next page
The DSS makes comparisons to scheduled in-house touch labor requirements and availability in the estimated time frame IPTs can also make individual work center queries as desired Actual capacity analysis is not possible until a design release of some type is made and subsequent order release into the MES
Unburdened dollars for purchased items and direct labor hours are combined with schedule information at the accounting month level to develop a cost baseline
Figure 6.13 Flow Diagram of DSS Operation: 8 of 11
Continued from preceding page

162
DESIGN CONTROL NUMBER xxxxxx-xxx
Continues by accounting month
unburdened May-08 Jun-08
DOLLARS HRS DOLLARS HRS NEED START FINISH
BUSINESS MAGAGEMENT (Activity #1)
Master Scheduling
SWBS 00/00/00
Procurement
Raw material xx TBD TBD 00/00/00
ENGINEERING (Activity #3)
Design TBD TBD 00/00/00 00/00/00
Release date 00/00/00
PLANNING (Activity #5)
Total tool orders 5
Work instructions (WI)
Tool Manufacturing WI 2 TBD TBD 00/00/00 00/00/00
Design Manufacturing WI 1 TBD TBD 00/00/00 00/00/00
Total WI 3
TOOLING (Activity #6)
Tool Models
T1 1 TBD TBD 00/00/00 00/00/00
T2 1 TBD TBD 00/00/00 00/00/00
T3 1 TBD TBD 00/00/00 00/00/00
T4 1 TBD TBD 00/00/00 00/00/00
T5 1 TBD TBD 00/00/00 00/00/00
Total tool models 5
Tool Designs 2
(Tool-to-make tool) T3 1 TBD TBD 00/00/00 00/00/00
T4 1 TBD TBD 00/00/00 00/00/00
T5 1 TBD TBD 00/00/00 00/00/00
Total tool designs 5
Procured Tools
T1 1 TBD TBD 00/00/00
T2 1 TBD TBD 00/00/00
Total procured tools 2
Manufactured Tools
(Tool-to-make tool) T3 1 TBD TBD TBD TBD 00/00/00 00/00/00
T4 1 TBD TBD TBD TBD 00/00/00 00/00/00
T5 1 TBD TBD TBD TBD 00/00/00 00/00/00
Total in-house manufactured tools 3
FABRICATION (Activity #7)
Tool Manufacturing Not detailed in this research 00/00/00 00/00/00
Design Manufacturing TBD TBD TBD TBD 00/00/00 00/00/00
Design completion 00/00/00
(Factory Management Activites #2 and #4 are not correlated to monitored IPTdeliverables) Figure 6.14 Flow Diagram of DSS Operation: 9 of 11
Go to next page
Continued from preceding page
Similar to Figure 7.24, page 292
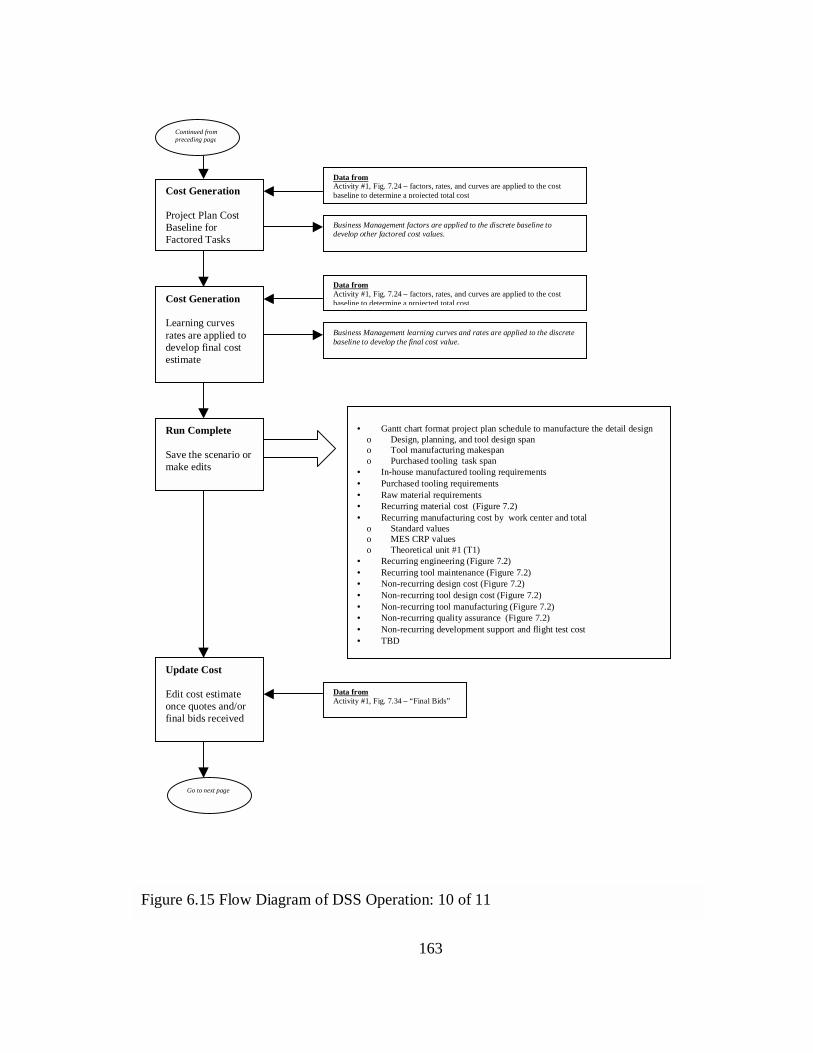
163
Figure 6.15 Flow Diagram of DSS Operation: 10 of 11
Data from Activity #1, Fig. 7.24 – factors, rates, and curves are applied to the cost baseline to determine a projected total cost
Business Management factors are applied to the discrete baseline to develop other factored cost values.
Cost Generation Project Plan Cost Baseline for Factored Tasks
Cost Generation Learning curves rates are applied to develop final cost estimate
Business Management learning curves and rates are applied to the discrete baseline to develop the final cost value.
Go to next page
Data from Activity #1, Fig. 7.24 – factors, rates, and curves are applied to the cost baseline to determine a projected total cost
Run Complete Save the scenario or make edits
Update Cost Edit cost estimate once quotes and/or final bids received
• Gantt chart format project plan schedule to manufacture the detail design
o Design, planning, and tool design span o Tool manufacturing makespan o Purchased tooling task span
• In-house manufactured tooling requirements • Purchased tooling requirements • Raw material requirements • Recurring material cost (Figure 7.2) • Recurring manufacturing cost by work center and total
o Standard values o MES CRP values o Theoretical unit #1 (T1)
• Recurring engineering (Figure 7.2) • Recurring tool maintenance (Figure 7.2) • Non-recurring design cost (Figure 7.2) • Non-recurring tool design cost (Figure 7.2) • Non-recurring tool manufacturing (Figure 7.2) • Non-recurring quality assurance (Figure 7.2) • Non-recurring development support and flight test cost • TBD
Data from Activity #1, Fig. 7.34 – “Final Bids”
Continued from preceding page

164
In the next chapter, comparisons between the DSS offered in this research and
other decision support approaches found in the literature are presented.
Figure 6.16 Flow Diagram of DSS Operation: 11 of 11
MES Conceptual Design Release Required for line leveling
Once the projected designs have been planned using the DSS, a conceptual design release takes place into the MES This allows for real capacity line leveling and capacity analysis. It also brings the work of multiple IPTs together The conceptual design release provides a baseline from which actual comparisons can be made once final design releases are made
DSS Receives MES Feedback and Performs Schedule and Cost Updates
MES Schedules. Once the schedules are leveled in the MES, then the “real” schedule dates are available for feedback to the DSS Based on the “real” schedules, the associated non-touch labor task schedules are revised and new cost estimates generated
Final Design Release All schedule and cost reporting moves to EVMS
The DSS generates preliminary FFPM fabrication plans and interfaces with the MES until final design release Then normal production and earned value management systems are utilized from that point forward
COMPLETE
Includes 1) Finalized FFPM fabrication plan 2) Design with features information stored in an electronic format interpretable by the MES work measurement system
Conceptual design release package
Data from MES line balancing
Continued from preceding page

165
CHAPTER VII
THE CONCEPTUAL FRAMEWORK FOR THE RIM-BASED DSS
APPLIED TO THE DESIGN OF AN AIRCRAFT BULKHEAD
This chapter presents the conceptual framework for developing the envisioned
reciprocal interdependencies management (RIM) based decision support system (DSS).
Chapter 7 does not contain the entire effort required by an enterprise to develop an
operational DSS. Instead, Chapter 7 provides a large cross-section of the required
information development, which correlates to the executive summary conceptual
architecture and utilization instance flow diagrams in Chapter 6.
In Chapter 7, RIM concepts of commonality and selection anticipation are used to
create RIM-diagrams for feedforward planning. These RIM-diagrams are then translated
into conceptual information hierarchies of commonality information (i.e., databases and
systems) the enterprise develops, maintains, and the IPT reuses for early design decision
making. In addition, where appropriate, Verganti’s findings and other research findings
are interjected into the presentation to validate the need for certain types of information.
RIM-diagrams are not attributed to Verganti, and are instead a contribution of this
research in the context of RIM application strategies. RIM-diagramming offers more
detail with regard to the technical complexities of early design decision making than is
currently documented in the literature.

166
RIM-diagramming was “discovered” by coupling Verganti’s high-level concepts
of RIM with the information requirements of a typical IPT within the context of aircraft
manufacturing. In general, RIM-diagrams have a far left column for the reciprocal
interdependencies (knowledge links) of technical, resources, and sequencing; and then
other columns to the right labeled “commonality” or “common” and “new.” RIM-
diagrams help to organize knowledge more meaningfully and highlight that knowledge of
new design endeavors is never really at zero percent as suggested in Figure 4.1, page 103.
RIM-diagramming will become clearer later in this chapter when examples are provided.
It is important to note that Verganti does not specifically explain how to apply
RIM concepts, feedforward planning, selective anticipation, etc. Instead, this author
extrapolates from and elaborates upon Verganti’s high-level findings. The conceptual
framework presented in this chapter identifies the broad content of the systems
architecture, some of the envisioned systems changes, and a general course of action to
develop a RIM-based DSS for the specific process of NC machining an aircraft bulkhead.
The ideas of common knowledge and knowledge reuse are not new. Much of the
literature in Chapter 3 mentions these ideas; but they are lacking in explanation as to how
to accomplish these ends. In most cases, software descriptions and functionality are in
the forefront and the underlying data development and technical knowledge correlation
are afterthoughts. (As Chapter 7 illustrates, the detail-level work to accomplish these
goals is excruciating.)
This author is not suggesting the framework outlined in this research is the only
way to approach assembling the extremely large enterprise information “jigsaw puzzle”
required for meeting all of the information requirements of an IPT. Instead, this

167
conceptual framework is one way to systematically approach the undertaking and its
presentation offers more technical information than is typically available.
7.1 The Basic Approach
In order to define a DSS for an aircraft manufacturing enterprise within the
context of RIM, a starting point for assembling the enterprise information “jigsaw
puzzle” is selected where minimal changes are expected to be required. The starting
point for this application is a baseline where the tools for managing reciprocal
interdependencies already exist to a great degree, and only need to be examined within
the context of RIM. Once the baseline information is established, RIM concepts and
RIM-diagramming are used to progressively move into less defined areas of aircraft
conceptual design decision making knowledge.
The first discussion/application of RIM is in the context of project management,
and is presented in the next section.
7.2 Project Management and RIM Multiple reciprocal interdependencies exist within the enterprise with regard to
project management knowledge and information. Many widely accepted project
management (PM) tools that manage reciprocal interdependencies already exist within
aircraft manufacturing enterprises. Examples of these tools are the product structure,
work breakdown structure, and cost breakdown structure. Even though these tools may
be thought of as having some other function, the underlying reason they exist is to
manage reciprocal interdependencies. RIM approaches offer a different way to view

168
these tools, and hopefully improve their use. Table 7.1 is offered as the starting point for
using RIM-based strategies to develop a DSS for use during conceptual design. Table
7.1 is at a very high-level and is not intended to illustrate all possible relationships. In
addition, the discussion of Table 7.1 is at a very high-level only, and not every entry in
each cell is fully explained. More detailed discussed is provided for subsequent RIM-
diagrams.

169
Table 7.1 RIM-Diagram for High-Level Project Management Tools
Reciprocal Interdependencies PM Tools
COMMON (Past Designs and Past Processes)
NEW
TECHNICAL Design Engineering Planning and Factory Management Control Processes and Tools Business Management Planning, Factory Management, or Fabrication
Features Product Structure EBOM ----------------------------------------- MBOM Features Processes SOW/WBS/CBS (high-level) ----------------------------------------- MBOM Features Process availability information is organized in CBS Translated to work instructions (WI) by the planner
Very similar Organization of information is unlikely to change for in-house processes Organization of information unlikely to change for in-house processes -------------------------- Some change may occur for new process or vendors
RESOURCES Business Management Factory Management, Planning, or Fabrication
SOW/WBS Make or Buy Policy Requirements forecasts Budgeted hours Procurement contracts CBS & WBS (high-level) ------------------------------------------ In-house CBS (low-level) Routing on (WI) MES work measurement loading Staffing plans
Organization of information is unlikely to change --------------------------- Some change may occur for new process or vendors
SEQUENCING Business Management Factory Management, Planning, or Fabrication
Master Schedule (Deliveries) Integrated Master Schedule (high- level SWBS) WBS/CBS (high-level) ------------------------------------------ Internal schedules by WBS/CBS (low-level) Work instructions by WBS by CBS (low-level) Schedule translated by MES
Organization of information is unlikely to change ----------------------------- Some change may occur for new process or vendors
Features not uniformly defined Translation mismatches
Potential mismatch
Potential mismatch

170
The information in the RIM-diagram in Table 7.1 is organized into three columns.
The first column represents the reciprocal interdependencies to be managed from the
perspective of high-level project management. The second and third columns provide
insights into how to manage the reciprocal interdependencies. Commonality items (i.e.,
as defined in Chapter 1, page 29) are considered in the second “Common” column, and
“New” (i.e., non-commonality) items are considered in the third column. The fact that
many of the tools listed in Table 7.1 (e.g. SOW, WBS, CBS) are used over and over
conveys commonality exists between past and current endeavors in the context of aircraft
manufacturing.
In the second column, the cells have a horizontal dashed line to represent how
information transfers or transitions within the reciprocal interdependencies. For
example, technical engineering information is found in the features, product structure,
and engineering bill of material. The engineering bill of material (EBOM) transitions to
manufacturing, and is used in the form of the manufacturing bill of material (MBOM).
The features also transfer, in that, they do not substantially change. Another example is
found in the reciprocal interdependency titled, “Processes and Tools” in the first column.
During the conceptual design phase, information is provided to manufacturing in the
SOW, WBS, and CBS (at a high-level). Later, the information transitions by expanding
to a lower-level of detail or being used in a different format. For example, once a project
progresses to a certain point, the relevance of the SOW is superceded by the lower-level
detail translated into the work instructions.
171
Selective anticipation deals with identification of the patterns related to how
information is classified and developed by one activity and used by another activity. The
most critical patterns of use are those that exist early in the product development
lifecycle. Hence, some of highest payoff RIM opportunities exist between engineering
and manufacturing in the first segment of Table 7.1 titled “Technical.”
In the course of applying concurrent engineering concepts, many organizations
have already discovered the need to make MBOM=EBOM. (Johnson, 2007; Ou-Yang
and Pei, 1999; Xuebao 2005.) The assumption for the RIM-based DSS being defined by
this research is that EBOM=MBOM. This author’s work experience validates the needs
identified by the aforementioned authors. The following discussion is based on work
experience and provides insights as to why the EBOM=MBOM assumption is necessary
in the context of developing a system to assist IPT members in decision making.
When EBOM=MBOM, the IPT members must try to figure out the major
component assemblies and potential subassemblies at the beginning of the design process
and assigns design numbers. The design number is used to control the fabrication of
details, plan subassembly kits, and monitor progress once the design is released.
EBOM = MBOM makes the management of information more seamless. When
EBOM = MBOM, subassembly design numbers are assigned by manufacturing in the
MBOM. This makes it very difficult to automate the exchange of information and keep it
up-to-date and error-free.
Even though computer programs can be written to translate the information,
invariably, it leads to problems. The subassembly number an operator uses on work

172
instructions does not match a design drawing, and sometimes it takes hours to figure out
what to do if the work instructions have a mistake on the detail parts list. Also,
the required translation between the EBOM and MBOM makes it difficult to incorporate
material requirements into the material requirements planning (MRP) systems. Rummler
and Brache (1995) describe this type of interface as being where the “baton is passed in
the white spaces of an organization chart.” A problem exists because the information
could not flow seamlessly without translation.
This author worked on a project during the conceptual design phase where
EBOM=MBOM was used. There was tremendous resistance to the approach because it
required so much work by the IPTs. Instead of leaving decisions until later when the
design was mature, considerable additional effort had to be accomplished using
incomplete design information. Some teams were talented at working with sketchy
information, but most were not. More teams could have been successful if there had
been better tools available and training to help them work with incomplete information.
Referring to the RIM-diagram in Table 7.1, another “Technical” RIM opportunity
that has not been fully utilized exists with regard to “features.” The application of
commonality and selective anticipation in the context of features offers potential insights
into improving decision making, and is an important aspect of this research. Verganti
notes the use of expected features to simulate real information in formats recognizable to
the teams was one of the most effective strategies. Features are discussed in greater
detail later in this chapter in Section 7.8.
Another “Technical” RIM opportunity exists within the context of “Processes.”
As “processes” are traced downward in the second column of Table 7.1, the commonality

173
aspect of processes has already been established for in-house manufactured designs. The
available processes are found in the Cost Breakdown Structure (CBS). The CBS project
management tool exists to facilitate RIM from a commonality perspective - even if it has
not been identified in this context before. However, from the perspective of selective
anticipation, the RIM-based strategy conveys the information used in the CBS requires a
defined pattern of use. (These patterns of use are systematically developed as this
research applies RIM strategies throughout Chapter 7.) Again, from the perspective of
project management tools (e.g., WBS, CBS, and product structure) their use and
availability is well documented in the literature. RIM-based strategies provide a way to
consider these tools from a different perspective and identify lower-level detail patterns
of use related to knowledge exchange.
Another RIM opportunity exists with regard to the combination of “Technical”
Features and “Technical” Processes in Table 7.1. As one surveys the middle column of
Table 7.1, the “Technical” Features information transitions via the process availability
information organization by CBS and the planner’s translation of features into work
instructions. Developing a consistent definition of features and a structured approach in
applying features knowledge offers the potential to convert expert knowledge available to
common knowledge.
In the last segment of Table 7.1, “Sequencing” RIM opportunities are considered
with regard to how the Master Schedule is translated by the manufacturing execution
system (MES). The information above the horizontal dashed line is different from the
information below the dash line and a clearly defined knowledge link during early design
is needed - but not defined. If one surveys the information from top to bottom in the

174
middle column, then it becomes apparent that one way to develop the knowledge link is
by using the information available from other sources. In particular, the “Technical”
information related to “Features” and “Processes.”
The conceptual framework for developing the RIM-based DSS assumes several
project management tools mentioned above are used (basically) in their existing formats
as a starting point. As discussed in earlier chapters, there is room for improvement with
regard to how these tools are initially created, but these improvements are not anticipated
to significantly impact this conceptual framework as a whole. There can be some
variation between the product structure, high-level cost breakdown structure, and low-
level cost breakdown structure presented here and the actual structures used in a specific
real world enterprise. These variations are typically driven by management preferences
and are not envisioned to cause a problem with regard to developing an operational DSS
based on the conceptual framework presented.
In the next two sections, conceptual information hierarchies for tools listed in the
commonality column of Table 7.1 - product structure and CBS - are discussed. In
subsequent sections, additional items listed in Table 7.1 are further defined. However,
complete information hierarchies are not presented and emphasis is on information
dealing with NC machining of an aircraft bulkhead.

175
7.3 Product Structure
Product structures have been used in the aircraft industry for many years. More
technical information related to product structures is provided in Appendix B. The
product structure is controlled by the Engineering activity (i.e., IDEF0 diagram Activity
3, Figure 2.5, page 54). The conceptual information hierarchies of the product structure
for an aircraft enterprise in the RIM-based DSS are as follows:
Assumptions related to the product structure in the context of the RIM-based DSS
are as follows: 1) EBOM=MBOM and 2) nomenclature (naming) of detail designs is
defined based on commonality, is consistent, and a part of the electronic record of the
product data management system (PDMS).
Figure 7.1 Conceptual Product Structure Information Hierarchies
• Airframe o Fuselage ! Components (forward, center, aft, etc.)
• Subassemblies o Details (bulkhead, frame, floor, etc.)
o Wing ! Components
• Subassemblies (combinations of details) o Details (spars, skins, ribs, etc.)
o Empennage ! Horizontal stabilizers
• Components o Subassemblies ! Details
! Vertical tail • Components o Subassemblies ! Details
• TBD
TBD

176
7.4 Cost Breakdown Structure
Cost breakdown structures (CBSs) have been used in the aircraft industry for
many years. More technical information related to CBSs is provided in Appendix B.
The CBS is controlled by the Business Management activity (i.e., IDEF0 diagram
Activity 1, Figure 2.4, page 53) and used by the enterprise to organize information for
estimating, developing budget distributions, collecting actual performance data,
controlling cost, and reporting contractual cost information to the customer. Hence, the
cost breakdown structure must be “linkable” to the WBS at some level. However, as
long as the CBS meets higher-level external reporting needs, there is flexibility in the
CBS to meet the lower-level information needs of the internal users.
Each CBS level has both a unique number and descriptive identifier. The CBS
work center numbering system is used to relate various databases within the enterprise.
The verbal description is used to help users understand the content.
The next two sections, 7.4.1 and 7.4.2, deal with high-level and low-level
segments of the CBS. These sections are offered to: 1) give the reader an overview of the
general ways in which “cost” is defined within an aircraft manufacturing enterprise and
2) provide the conceptual approach used in this research from both high-level and low-
level CBS perspectives. (Note the RIM-diagram in Table 7.1 does not provide lower-
level detail and remains a high-level only.)
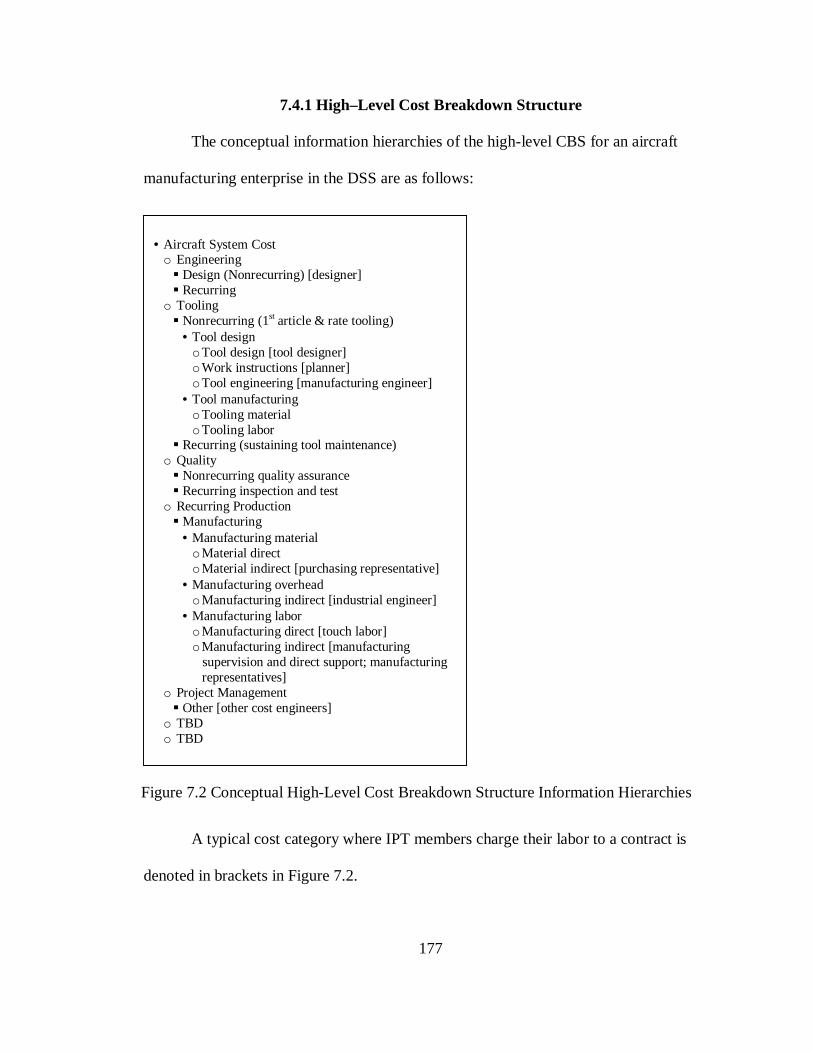
177
7.4.1 High–Level Cost Breakdown Structure
The conceptual information hierarchies of the high-level CBS for an aircraft
manufacturing enterprise in the DSS are as follows:
A typical cost category where IPT members charge their labor to a contract is
denoted in brackets in Figure 7.2.
Figure 7.2 Conceptual High-Level Cost Breakdown Structure Information Hierarchies
• Aircraft System Cost o Engineering ! Design (Nonrecurring) [designer] ! Recurring
o Tooling ! Nonrecurring (1st article & rate tooling)
• Tool design o Tool design [tool designer] o Work instructions [planner] o Tool engineering [manufacturing engineer]
• Tool manufacturing o Tooling material o Tooling labor
! Recurring (sustaining tool maintenance) o Quality ! Nonrecurring quality assurance ! Recurring inspection and test
o Recurring Production ! Manufacturing
• Manufacturing material o Material direct o Material indirect [purchasing representative]
• Manufacturing overhead o Manufacturing indirect [industrial engineer]
• Manufacturing labor o Manufacturing direct [touch labor] o Manufacturing indirect [manufacturing supervision and direct support; manufacturing representatives]
o Project Management ! Other [other cost engineers]
o TBD o TBD

178
The assumptions related to the high-level CBS within the RIM-based DSS are as
follows:
1) The high-level structure utilized by the DSS matches the actual structure the enterprise uses
2) Direct labor requirements are estimated using feature-based relationships
(discussed later in Section 7.10)
3) Direct material and tooling requirements are estimated using feature-based relationships (discussed later in Section 7.8.2)
4) IPTs use the platform provided within the DSS as opposed to developing their
own worksheets to calculate this type of cost
The high-level CBS is used to accommodate the needs of information exchange
with the customer and the traditional aircraft estimating process. Once lower-level
estimating work is accomplished, the “total cost” estimate is accumulated into a
customary high-level format using generally accepted terminologies, like “recurring and
nonrecurring.”
The organization of data at the highest level varies among enterprises based on
their internal definitions of engineering, tooling, and manufacturing. For example, in
some enterprises the tasks of manufacturing engineering effort and the tool design effort
are organized under the higher-level category of nonrecurring engineering. To a great
degree, these nuances do not matter as long as the labor charges associated with the
design engineering effort is separable from the manufacturing engineering effort and so
forth. If the lower-level details of a cost information hierarchy are defined, then sorting
the information differently is straightforward.

179
Much research is devoted to the cost visibility problems associated with the
methodologies used in the traditional high-level CBS illustrated, but this segment of
RIM-based DSS information development is assumed to be in the traditional format for
simplicity. (Traditional formats are discussed in Appendix B.) The emphasis of this
research is toward developing information at a lower-level of detail, so this assumption
does not significantly impact the overall outcomes. The next section discusses the lower-
level cost breakdown structure.
7.4.2 Lower–Level Cost Breakdown Structure
The high-level CBS illustrated in Figure 7.2 is typically allocated into smaller
segments to develop a lower-level CBS. The lower-level CBS is used for internal
information management, i.e., the collection of direct labor charges, organizing personnel
and departments, routing jobs, etc. In this research the lower-level CBS used for routing
jobs and cumulating labor charges by process is referred to as the CBS “work center”
level. (The name “work center” is a discretionary identification in that it is not being
represented as an industry-wide term. Most companies have their own naming
conventions for different levels of a CBS.)
There are many ways to establish a lower-level CBS for a Fabrication activity
(i.e., IDEF0 diagram Activity 7, Figure 2.7, page 56). The CBS organization depends on
the enterprise strategy for use (and reuse) of cost information. In the next two figures,
Figure 7.3 and 7.4, conceptual lower-level CBS information hierarchies are presented.
Figure 7.3 illustrates segments of the CBS not related to “Detail Fabrication.” This figure
is considered a placeholder, in that, the emphasis of this research is on “Detail
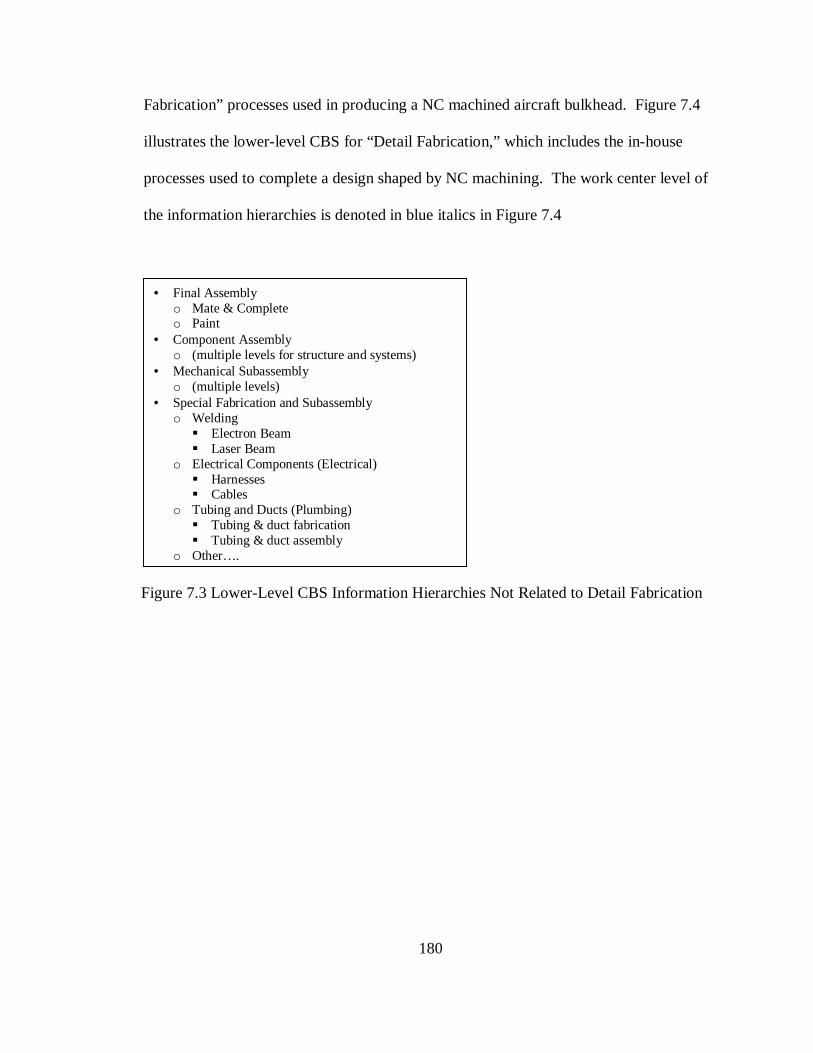
180
Fabrication” processes used in producing a NC machined aircraft bulkhead. Figure 7.4
illustrates the lower-level CBS for “Detail Fabrication,” which includes the in-house
processes used to complete a design shaped by NC machining. The work center level of
the information hierarchies is denoted in blue italics in Figure 7.4
Figure 7.3 Lower-Level CBS Information Hierarchies Not Related to Detail Fabrication
• Final Assembly o Mate & Complete o Paint
• Component Assembly o (multiple levels for structure and systems)
• Mechanical Subassembly o (multiple levels)
• Special Fabrication and Subassembly o Welding ! Electron Beam ! Laser Beam
o Electrical Components (Electrical) ! Harnesses ! Cables
o Tubing and Ducts (Plumbing) ! Tubing & duct fabrication ! Tubing & duct assembly
o Other….

181
Figure 7.4 Lower-Level CBS Information Hierarchies for Detail Fabrication
• Detail Fabrication o Composites Fabrication ! TBD (hierarchies not defined or discussed)
o Sheet Metal Fabrication • TBD (hierarchies not defined or discussed)
o NC Milling and Support [Group 1 of 9] ! NC Milling
• 3-Axis milling (work center level) • 5-Axis milling • 5-Axis high speed milling
! Specialty Hole Processing (Equipment) [Group 2 of 9] • Drilling/Boring type 1 (work center level) • Drilling/Boring type 2 • 3-Axis (tooling holes)
! Minor Subassembly for NC Machined Parts [Not discussed] • Hole processing (work center level) • Bushing installation • Nutplate installation
! Hand Finish [Group 3 of 9] • Vapor degrease (work center level) • Deburr • Hole processing (portable systems) • Tooling tab removal
o Coatings [Group 4 of 9] ! Wash/Clean (work center level) ! Mask ! Prime ! Paint ! Electrical bonding ! Seal bonding (not discussed)
o Hardening and/or Special Treatment [Group 5 of 9] ! Wash/Clean (work center level) ! Heat treat ! Heat treat age
o Chemical Processing [Group 6 of 9] ! Wash/Clean (work center level) ! Chemical milling ! Annodize ! Plating
o Forming [Group 7 of 9] ! Wash/Clean (work center level) ! Shot peen
o Marking [Group 8 of 9] ! Stamping (work center level) ! Vibroengrave
• Detail Fabrication Quality Assurance [Group 9 of 9] o Plate inspection o Intermediate inspection o Non-destructive testing o Final inspection o TBD
Note: each CBS description also has a unique numerical identifier used by various enterprise systems to relate the lower-level CBS to higher levels of the CBS, departmental budgets, planning routes, work measurement studies, MES scheduling logic, etc. In many instances the CBS work center number is used by the DSS for similar purposes. As much as possible the DSS seeks to emulate/imitate enterprise systems the IPTs may have some familiarity with.

182
The assumptions related to the lower-level CBS within the RIM-based DSS are as
follows:
1) The overall CBS structure is based on the the EBOM=MBOM philosophy (Detail fabrication, Subassembly, Assembly). However, some variation may occur for manufacturing preferences, but these will be limited.
2) The work center in the detail fabrication CBS is the baseline for assessing
process capabilities. The work center grouping in the detail fabrication CBS reflects how processes are managed for the consideration of similar types of labor classifications, etc.
3) The detail fabrication CBS work center number is used to route jobs based on
work instructions.
4) Capacity information is organized at the CBS work center level for detail fabrication. It is expressed relative to shifts, personnel, and equipment over a forecasted timeframe based on the M-day and accounting month calendar provided by Business Management. This information is used to assess labor and machine hours availability in a given time frame.
A brief explanation of the rationale behind the CBS in Figures 7.3 and 7.4 is
offered.
In Figure 7.3, “Final Assembly, Component Assembly, and Mechanical
Subassembly” are considered to be self-explanatory. “Special Fabrication and
Subassembly” processes are those joining details, wires, and/or hardware; but do not
involve “traditional” mechanical assembly using rivets, bolts, or other fasteners. Work
areas dedicated to electrical harnesses and tubing manufacture are specialized in both
their fabrication and assembly equipment and procedures. Also, the persons performing
these tasks typically hold a unique classification or certification.
In Figure 7.4, the “Detail Fabrication” information hierarchies are organized to
simultaneously facilitate the method in which the design is conveyed (i.e., the drawing
183
type - detail, next assembly, installation drawing) similarities of processes, equipment
utilization, and worker assignments. Work centers are designated in parentheses.
“Composites Fabrication” is used to segregate composite related work centers
from traditional “Metal Fabrication” work centers. “Composites Fabrication” and “Sheet
Metal Fabrication” are not discussed in this research.
In Figure 7.4, the “NC Milling” group of work centers is where plate preparation
and major milling (i.e., shaping) are accomplished. The work center designated as 3-
Axis milling is where plate surfaces are prepared and simple designs are milled.
“Specialty Hole Processing” is the group of work centers where specialized hole
processing equipment resides, and typically this equipment has hole processing
capabilities beyond that of the major NC milling machines. Also, when the amount of
hole processing reaches a certain level, then the decision is typically made to perform the
hole processing in these work centers to “free up” the NC milling machine to start the
next job. The “Special Hole Processing” equipment may or may not be dedicated to
designs that are shaped by NC milling. These work centers could also have composite
designs routed to them. These types of factory policies are driven by management
decision, and the important information in the context of IPT decision making is
awareness of the policies in place. These types of factory policies information typically
reside in some form (i.e., either expert knowledge or written policies) within the Factory
Management and Planning activities (i.e., IDEF0 diagram Activities 4 and 5, Figures 2.5
and 2.6, pages 54 and 55).
“Minor Subassembly for NC Machined Parts” is an exception because
“subassembly” is being performed in “Detail Fabrication.” There are instances where

184
bulkheads, frames, and other NC machined details require bushings or nutplates to be
installed prior to assembly with other major structural details, and these installations are
reflected on subassembly drawings. For these types of simple installation drawings (e.g.,
bushing and nutplates installed on a bulkhead), manufacturing often prefers to maintain a
dedicated work area within “Detail Fabrication.” (Note that this segment of the lower-
level CBS is provided for information only. For this research, only detail
designs/drawings are being considered by the IPT utilizing the DSS. Subassembly and
installation drawings are not being considered.)
In Figure 7.4, “Hand Finish” involves cleaning parts, checking for burrs,
removing tooling tabs, and minor hole processing (e.g., rework/repair) with portable
systems. NC machined details are assumed to be processed by teams of workers, some
assigned to NC machines and others assigned to “Hand Finish.” It is assumed more
experienced machinists are operating the machines, but perform other tasks as needed if
work is unavailable.
The processes in “Coatings” are grouped because of similar environments and the
likelihood of similar worker classification/certification. These processes located “lower”
in the assembly sequence because, in most cases, they are best performed prior to
subassembly. (Note that “Seal bonding” is not used on NC machined details, so this
process is not discussed or diagrammed in later sections.)
In order to have cost visibility at different levels, the CBS has to recognize these
levels. For example, in order to have improved cost visibility of the “Masking” process
versus the “Painting” process, the tasks and labor charging should be designated
differently via the work center designations in the CBS. In addition, by identifying and

185
scheduling “Masking” separate from “Painting,” it facilitates concurrent scheduling of
the tasks on different jobs, i.e., the start of “Masking” on a second job can be scheduled
prior to the completion of “Painting” on a first job. If enterprise management desires to
segregate the CBS to a lower-level, then it typically can be accomplished; provided the
Business Management activity approves.
“Hardening,” “Chemical Processing,” and “Forming” are included in Detail
Fabrication and segregated due to: 1) the technical requirements of the processes, 2) the
preference to independently sequence and manage their occurrence, or 3) the desire to
perform these tasks prior to assembly. It is not preferable to load a design in an assembly
fixture and subsequently unload it for routing back to Detail Fabrication.
In Figure 7.4, “Marking” processes include ink stamping control number on detail
designs and vibroengraving serial numbers onto detail designs. Marking is used to
control inventory and configuration. Some type of “Marking” is typically required on
each processed design. Some designs are only marked upon completion; but critical
designs, such as “fracture critical” bulkheads, are serialized (i.e., uniquely assigned) to a
specific aircraft, and are closely monitored. Personnel performing marking tasks are
assumed to travel throughout departments, and are either a different classification or a
different experience level (i.e., the best machinists are not assigned to perform marking
tasks).
The “Detail Fabrication Quality Assurance” group of work centers deals with
inspection processes.
From the perspective of the conceptual framework, the following assumptions are
being made: 1) process capabilities for in-house processes are relatable via the lower-

186
level CBS at the work center level and 2) the work center level is the lowest level of the
information hierarchies for “Detail Fabrication.” In the next section, a RIM-based
approach is used to discuss the definition of “capability" within the context of the
conceptual framework.
7.5 Detail Fabrication Capability
In this section, RIM is used to discuss capability. While capability is mentioned
in a great deal of available literature, it is typically not clearly defined. One of the tasks
associated with developing a conceptual framework is the systematic definition of
capability. This section provides the explanation of capability in relation to development
of a conceptual framework for a RIM-based DSS.
First, a general discussion of common interpretations of capability is presented in
three contexts: 1) technical, 2) resources (management strategy), and 3 sequencing
(availability/scheduling), using “hole processing systems” as an example. These three
contexts match the reciprocal interdependencies previously listed in Table 7.1, page 175.
Second, a RIM-diagram is offered to provide additional insights into the use of
commonality and selective anticipation to facilitate the development of a DSS within the
three contexts of capability. Lastly, the conceptual approach used to address capability
within the envisioned DSS is presented.
7.5.1 Hole Processing Systems Capability – Context 1: Technical
One context of hole processing capability is based on the technical differences
between hole processing systems. Hole processing systems are defined as combinations

187
of people and portable tools, small machines, non-design tooling, design tooling, and
specialized machines required to process holes.
The typical design features used to compare hole processing systems are material,
hole diameter, thickness, tolerance on hole diameter, and tolerance on hole location.
Because certain in-house hole processing systems have been used on past designs -
certain technical information regarding capability of hole processing systems is available
(due to commonality) and is organized (or unfortunately, disorganized) in various ways
in the enterprise.
One way in which hole processing systems technical information and associated
relationships have been utilized on past designs is illustrated in the following statements:
1) A worker can only process certain holes “by hand” based on the capabilities of the
hand-processing systems available. These capabilities are expressed in terms of some combination of design features:
a. If the tolerance on hole diameter requirement reaches specified limits, then tooling is required.
i. This tooling requirement can generate a second tooling requirement. (Tools to make tools.)
1. If the tolerance on hole reaches another specified limit, then specialized hole processing machines are utilized.
b. If the material thickness requirement reaches a certain limit, then tooling is required.
i. This tooling requirement can generate a second tooling requirement. (Tools to make tools.)
1. If the material thickness reaches another specified limit, then specialize hold processing machines are utilized.
2) Similarly, a worker can only locate a hole within a certain tolerance range using
hand-layout procedures. a. If the tolerance on hole location requirement reaches a specified limit, then
tooling is required. i. This tooling requirement can generate another tooling requirement.
1. If the tolerance on hole location requirement reach a specified limit, special hole processing machines are utilized.

188
3) Purchased hand-held processing systems have published values associated with
their specifications and manufacturing engineering typically performs tests to establish guidelines before the equipment is placed in service.
4) Purchased drilling, reaming, and boring machines have published specifications,
and manufacturing engineering typically performs tests to establish guidelines before the equipment is placed in service.
5) Purchased NC milling machines also perform hole processing, the specifications
are published, and manufacturing engineering typically performs tests to establish guidelines before the machine is placed in service.
6) A “materials and processes” group typically maintains process information for
materials and processes used in the past. In addition, this group organizes MIL-SPECs and MIL-STDs (Department of Defense standardized information) and other information for the enterprise to use.
7) Factory management and workers typically have preferences for the use of one
hole processing system instead of another, but this only comes into play once the technical requirements of the job are met. (Preferences are not allowed that do not meet the requirements of M&P specifications.) For example, if two hole processing systems exist in the same department or the same area, and both systems have the capability to meet the requirements, then manufacturing has flexibility.
The preceding statements provide insights into the reciprocal interdependencies
related to technical aspects of hole processing capability. Recall the RIM-Diagram in
Table 7.1 on page 175. The technical hole processing information represents an example
of lower-level detail for the “Technical” reciprocal interdependencies shown on this
RIM-diagram.
Another type of technical reciprocal interdependency is related to
installation/assembly tolerance. For example, it is easy to understand a designer cannot
release drawings where all of the holes are processed in the detail designs of a major
component prior to assembly. The detail designs likely would not fit together properly
due to assembly tolerances. The reason hole processing capability can exist away from

189
the assembly in Detail Fabrication is because the designer consciously made the decision
some assembly tolerance requirements are to be met in other ways. Hence, the decision
for selecting the hole processing system is influenced by assembly tolerance
considerations made by the designer. The following statements illustrate the way in
which installation relates to hole processing capability:
• In order for holes to be processed using large pieces of specialized equipment in detail fabrication, the consideration of assembly tolerances related to the holes has to be addressed in the assembly sequence. This in turn, establishes whether a control tool is going to be used to locate the detail to the assembly after processing and/or whether the holes processed are going to be used to establish the “hole location” for subsequent details installed.
• When certain assembly tolerance decisions are made, then it affects subsequent
decisions on where, how, and when hole processing is accomplished on other details.
• In order to modularize some of the assembly work and concurrently control
assembly tolerances, some hole processing is performed with two or more parts together in a subassembly. This is typically accomplished using a hole processing system involving tooling, and by its very nature is performed in subassembly instead of detail fabrication.
• Some hole processing is done during the final stages of assembly because the
assembly tolerances have to be reconciled. In aircraft manufacturing, it is not likely that all clips, brackets, supports, etc. can be installed in subassembly because of installation interferences.
• Because hole processing systems are tied to sequencing issues, the same hole
processing systems are likely to be found in different locations on the assembly line.
While the above descriptions are intentionally broad and do not cover all of the
information required to make technical hole processing systems decisions, the point is
being emphasized that a certain aspect of hole processing capability reflects a prior
decision related to assembly tolerance - either knowingly or by default. Though this

190
research does not use the constraint of total assembly tolerance, intuitively, it makes
sense that in order to address the needs of improved conceptual design decision support,
more work needs to be done to describe the technical details of this type of information
exchange. (An opportunity for future work for this author.)
There are many problems associated with the methods used in the development
and application of cost estimating relationships (CERs) dealing with assembly and
tolerance considerations. Based on this author’s work experience, some of the most
common mistakes of those performing cost studies during the conceptual design phase
are directly correlated to their inability to recognize the installation tolerance reciprocal
interdependencies of the processes being estimated. For example, the emphasis is placed
on the touch labor hours to process a hole and the remaining considerations are either not
discretely considered or buried in a CER. It is possible that one hole may seem relatively
simple from the perspective of “direct labor hours to drill,” but can lead to a subsequent
requirement for a design tool – then possibly a design tool to make the design tool -- and
so on. The failure to identify and schedule tooling requirements typically has far greater
impact on total cost than the per-hole CER value or the hole quantity allocated by the
estimator. In the next section, capability is discussed in the context of resources
(management strategy.)
7.5.2 Hole Processing Systems Capability – Context 2: Resources (Management Strategy)
A second aspect of hole processing capability is based on resources and the
associated management strategy. Resources include direct labor hours, machine hours,

191
and procured capability (i.e., dollars) associated with Fabrication and Assembly
activities, (i.e., IDEF0 diagrams, Chapter 2.) With regard to in-house processing, it is
highly unlikely all hole processing systems are physically located in one location in
“Detail Fabrication.” (Note: Detail Fabrication is defined in Figure lower-level CBS in
Figure 7.3, page 180.) Quite often, highly specialized hole processing equipment is
located in specific work areas, and a variety of designs are routed to these areas.
Similarly, fabrication organizations may have some hole processing capability dedicated
based on the type of work being performed, i.e., NC machining, composites, tubing
systems, etc. The way in which hole processing systems, and the personnel that utilize
them, are assigned is based management’s strategy for utilizing the hole processing
capability. The current management strategy for hole processing systems and other
fabrication processing systems is conveyed via the CBS lower-level information
hierarchies (i.e., Figure 7.4, page 181).
The statements above provide insights into the reciprocal interdependencies
related to the “resources” reciprocal interdependencies associated with hole processing
capability. Recall the RIM-Diagram in Table 7.1 on page 175. This is an example of the
lower-level detail for the “Resources” reciprocal interdependencies shown in the first
column of this RIM-diagram. In the next section, capability is discussed in the context
of sequencing (availability/scheduling.)
192
7.5.3 Hole Processing Systems Capability – Context 3: Sequencing (Availability/Scheduling)
The third context of hole processing systems capability is based on the sequencing
(availability/scheduling) of hole processing systems. In order to consider sequencing
availability, multiple reciprocal interdependences are addressed concurrently. Once a
design requirement for a particular hole (i.e., hole-related design feature) is established
on a new design - in order to use the in-house capability - the availability of the
appropriate hole processing system must be determined based on capacity within a
stipulated (scheduled) timeframe of need. Recall the RIM-Diagram in Table 7.1 on page
175. This context of capability is an example of lower-level detail for the “Sequence”
reciprocal interdependencies shown in the first column of this diagram.
Now that “capability” has been discussed in three contexts [e.g., technical,
resources, and sequencing] it can be illustrated in lower-level RIM-diagram. In the next
section, a RIM-diagram for “capability” is illustrated and discussed.
7.6 RIM-Diagram for Manufacturing Capabilities-Based Decision Making
A RIM-Diagram incorporating the previously discussed contexts of capability is
presented in Table 7.2. A discussion of Table 7.2 follows the RIM-diagram.
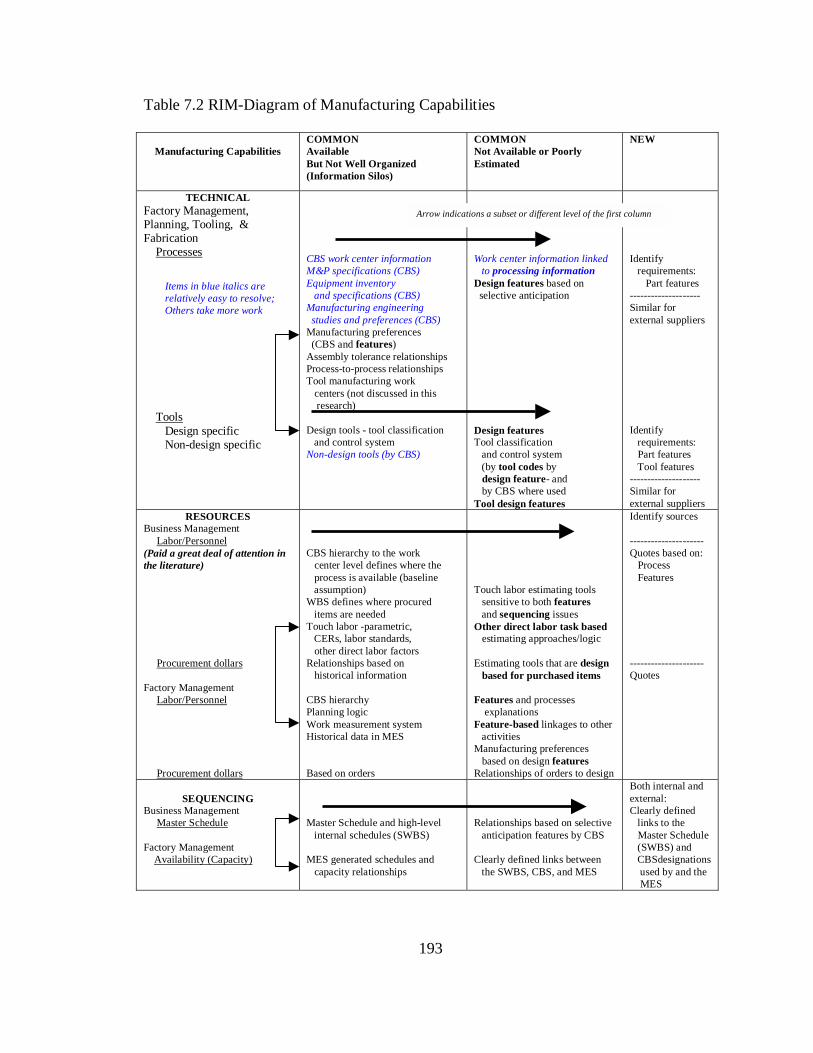
193
Table 7.2 RIM-Diagram of Manufacturing Capabilities
Manufacturing Capabilities
COMMON Available But Not Well Organized (Information Silos)
COMMON Not Available or Poorly Estimated
NEW
TECHNICAL Factory Management, Planning, Tooling, & Fabrication Processes Tools Design specific Non-design specific
CBS work center information M&P specifications (CBS) Equipment inventory and specifications (CBS) Manufacturing engineering studies and preferences (CBS) Manufacturing preferences (CBS and features) Assembly tolerance relationships Process-to-process relationships Tool manufacturing work centers (not discussed in this research) Design tools - tool classification and control system Non-design tools (by CBS)
Work center information linked to processing information Design features based on selective anticipation Design features Tool classification and control system (by tool codes by design feature- and by CBS where used Tool design features
Identify requirements: Part features -------------------- Similar for external suppliers Identify requirements: Part features Tool features -------------------- Similar for external suppliers
RESOURCES Business Management Labor/Personnel (Paid a great deal of attention in the literature) Procurement dollars Factory Management Labor/Personnel Procurement dollars
CBS hierarchy to the work center level defines where the process is available (baseline assumption) WBS defines where procured items are needed Touch labor -parametric, CERs, labor standards, other direct labor factors Relationships based on historical information CBS hierarchy Planning logic Work measurement system Historical data in MES Based on orders
Touch labor estimating tools sensitive to both features and sequencing issues Other direct labor task based estimating approaches/logic Estimating tools that are design based for purchased items Features and processes explanations Feature-based linkages to other activities Manufacturing preferences based on design features Relationships of orders to design
Identify sources --------------------- Quotes based on: Process Features --------------------- Quotes
SEQUENCING
Business Management Master Schedule Factory Management Availability (Capacity)
Master Schedule and high-level internal schedules (SWBS) MES generated schedules and capacity relationships
Relationships based on selective anticipation features by CBS Clearly defined links between the SWBS, CBS, and MES
Both internal and external: Clearly defined links to the Master Schedule (SWBS) and CBSdesignations used by and the MES
Arrow indications a subset or different level of the first column
Items in blue italics are relatively easy to resolve; Others take more work

194
The RIM-diagramming strategy for illustrating the management of reciprocal
interdependencies related to “capability” is slightly different from the RIM-diagramming
procedure presented earlier for “project management” in Table 7.1, page 175. The three
major reciprocal interdependency levels are the same as the first RIM-Diagram in Table
7.1, i.e., “Technical, Resources, and Sequence.” Now, in Table 7.2, additional levels
have been added to “Resources” and are designated as “Labor/Personnel” and
“Procurement dollars”, (i.e., material, tooling, etc.) Under “Technical,” the “Process and
Tools” section of Table 7.1 is now broken down into two, separate levels in Table 7.2,
“Processes” and “Tools.” Further, “Tools” in Table 7.2 is further subdivided into two
levels: “Design specific” and “Non-design specific.”
The “Commonality” column of Table 7.1 has now been expanded into two
“Common” columns in Table 7.2. This two-column approach is used to conceptualize
how common information can be converted to common knowledge within the enterprise.
The last column on both diagrams is still labeled as “New.” Less attention is paid to
“New” aspects of reciprocal interdependencies in RIM-diagramming efforts because the
focus is on known/common information related to in-house processes.
The first “Common” column identifies where information is available, but it is
typically not structured or organized in a manner making it easily accessible to the
envisioned user of the DSS - the IPT member. In addition, this column provides some
significant baseline assumptions and where information silos are identified. The
problems caused by information silos can be alleviated by interfacing the DSS with other
enterprise systems in a context useful to IPT members for their particular decision
making needs. For example, the enterprise typically expends a great deal of resources

195
developing “material and process (M&P) specifications, equipment specifications, and
manufacturing engineering studies. However, in order for the information to be useful to
IPTs, it requires organization in a manner relatable to specific CBS work centers used in
routing logic and work instructions.
The second “Common” column identifies where additional work is required to
define the information and the sources of information. For example, “Part features” and a
methodology for their utilization utilizing “selective anticipation” requires definition. In
addition, new requirements for “Tools” information queries are identified, such as “by
tool codes by part feature.” Lastly, a requirement to further categorize the definition of
features using selective anticipation is identified.
The last column is in Table 7.2 titled, “New.” This column is used as a
placeholder for the identification requirements and sources of information for processes
not currently defined in-house.
A technical system addition appears in the second column of the RIM-diagram,
i.e., “tool classification and control system.” A general discussion of the system is
offered. Tool designs are the responsibility of the Tool Design activity (i.e., IDEF0
diagram Activity 6, Figure 2.6, page 55). Tool designs are typically classified and
controlled using tool codes (i.e., tool nomenclature/names) and tool numbers in a manner
similar to how detail designs are classified and controlled using design nomenclature and
unique numbers. (Additional discussion of tool codes is available in Appendix B.)
Examples of tool codes are holding fixture, drill plate, assembly fixture, etc. In addition,
some enterprises classify electronic information, such as NC tapes, as a design tool and
assign a code (e.g., milling tape).

196
In this research, it is assumed that a tool classification and control system exists.
Further it is assumed that changes are likely required in the tool classification and control
system – specifically the additions of: 1) “Part features” information, 2) “Tool design
features” information, and 3) the “CBS where the design tool is used.”
This type of information is assumed in the conceptual framework because if it
does not exist, then the usefulness of a DSS for conceptual design decision making is
greatly diminished. Based on this author’s work experience, when this type of tooling
information is not formatted and organized for reuse, IPT members develop their own ad
hoc approaches to collecting and utilizing historical information. In addition, recall from
Chapter 1, Section 1.1.1.3, page 8, ad hoc approaches result when information sources
are not linked in a manner that supports the needs of users. The information hierarchies
related to the “tool classification and control system” are specifically discussed later in
Section 7.8.
All of the items within Table 7.2 are not fully explained at this time, and the
executive summary of RIM-diagramming efforts is offered. RIM-diagramming efforts in
Table 7.2 result in two major products: 1) typical information silos converted to
conceptual information hierarchies and 2) the higher-level organization of the reciprocal
interdependencies management conceptual framework based on capability.
It is understood there are many ways to construct a conceptual framework for
systematically defining the extremely large enterprise information “jigsaw puzzle”
required for meeting the information needs of IPT decision making. The previously
defined contexts/reciprocal interdependencies of capability are the organizing approach
taken by this author.

197
The RIM-based conceptual framework should not be confused with conceptual
information hierarchies. Conceptual information hierarchies are similar to databases –
while the knowledge links represented by the conceptual framework are a two-
dimensional organization illustration of a multidimensional knowledge construct. The
conceptual framework’s RIM capabilities “hierarchies” (i.e., Figure 7.6) are for keeping
track of knowledge links development only – not the absolute layout of computer
architecture.
Figure 7.5 illustrates the conversion of some elements within the “Common –
Available But Not Well Organized (Information Silos)” column in Table 7.2 into
conceptual information hierarchies. The information hierarchies are presented as a
segment of conceptual work center information hierarchies. Some of the work center
information has not been specifically discussed, but its relevance and usefulness are
nearly self-explanatory. For example, the work center location, layout, and process
descriptions, etc. information is potentially very beneficial for newer employers who may
be unfamiliar with the manufacturing organization.
• CBS Work Center (WC) Data o WC number o WC location o WC layout o WC Process descriptions o WC Worker classifications o WC Processing system information ! WC most-used Material & Processes (M&P) specifications ! WC Non-design tools inventory ! WC Equipment inventory
• Correlated to features (TBD)
Figure 7.5 Information Silos in Table 7.2 Correlated to Conceptual Information Hierarchies
CBS work center number is used in work instructions routing, the work measurement application approach, MES scheduling logic, MES capacity forecasting, manufacturing engineering studies, etc. The vision of the RIM-based DSS is that the work center is used to organize manufacturing knowledge.

198
In Figure 7.6, the conceptual framework’s RIM capabilities “hierarchies” are
offered. Again, this figure is for keeping track of conceptual framework information
development and should not be confused with computer information systems hierarchies.
The section numbers in parentheses and color-coded in bold green indicate the
section in Chapter 7 where the reciprocal interdependencies (knowledge links) are
discussed. Items listed in black have already been discussed in previous sections of
Chapter 7, and items listed in blue italics are yet to be explained. Notes in red indicate
specific segments or topics that will not be addressed due to added complexity and time
constraints. The three contexts of capability discussed using the example of hole
processing systems are highlighted in yellow.
Again, this figure is a two-dimensional representation of multi-dimensional
reciprocal interdependences (knowledge links – technical, resources, sequencing,
common, new, internal, and external).

199
The RIM-based DSS development framework specifically addresses the
translation issues identified in RIM-diagramming efforts. The framework is the starting
point for subsequent conceptual information hierarchies and data development. The
framework in Figure 7.6 is not to be confused with an information hierarchy that directly
• Design Processing Categories (Section 7.7) o Product Data Management System (EBOM/Product Structure) (Section 7.3; Section 7.8.2) ! Features [Features DesignSelectiveAnticipation (Mfg) + Features ManufacturingSelectiveAnticipation (Design)] (Section 7.8.1) (Section 7.9.2)
• Feedforward Planning Model (FFPM) o CBS Work Centers (Section 7.4.2) ! Technical processing systems information
• Material and processes (M&P) standards and specifications by work center (Section 7.6)
• Equipment inventory (Section 7.8) o Equip specs correlated to Features DesignSelectiveAnticipation (Mfg) +
Features ManufacturingSelectiveAnticipation (Design) + FeaturesDesignOther(Mfg) • Manufacturing Engineering studies by work center (Section 7.6) • Specific processing capabilities limits [FeaturesDesignSelectiveAnticipation(Mfg)
FeaturesManufacturingSelectiveAnticipation(Design)] (Section 7.9) • Design specific tooling used on past designs (historical data by product by type, i.e., part of tool classification and control system) (Section 7.8.2)
o Tool codes (Tool Type; Features DesignSelective anticipation (Mfg) ) o Tools to make tools on past designs ! Tool features (Will not be addressed)
• Non-design specific tools (located in the areas, such as portable hole processing systems) inventory (Section 7.6)
! Resources (management strategy) (overhead not discussed) • Direct labor hours (touch) (Section 7.10) • Machine hours (Section 7.10) • Direct labor hours (other) (Section 7.10) • Procurement dollars (Section 7.10)
! Sequencing (availability) • Sequence decisions based on the management of existing requirements
(already planned for other products) (Section 7.11) o Labor hours by shift by timeframe (Section 7.11) o Machine hours by shift by timeframe (Section 7.11)
• Technical sequencing considerations linked with Master Schedule (internal scheduling (Section 7.12)
• Sequencing decisions based on management of new requirements by work center (incomplete designs) (Section 7.13)
Figure 7.6 RIM-Based DSS Development Framework Based on the RIM-diagram of Manufacturing Capabilities
#1
#2
#3
Highlighted numbers refer to capability contexts
discussed in Section 7.5 from the perspective of hole
processing systems
Even a very low level of detail – such as hole processing reciprocal interdependencies – can be described within the three contexts of manufacturing capabilities reciprocal interdependencies i.e.,
1) Technical, 2) Resources
(management strategy), and
3) Sequencing (scheduling/
availability)

200
correlates to a computer architecture. It is instead a means of keeping track with the
development of strategies for improved reciprocal interdependencies management (RIM).
The RIM-based capability representation facilitates utilization of the envisioned
DSS in the following manner:
1) The “Processing Category” is selected. (This is marked TBD and is presented in blue italics because this area of the DSS is yet to be defined.)
2) EBOM information is retrieved from a “Product Data Management” system.
(This is marked TBD and is presented in blue italics because this area of the DSS has yet to be defined.)
3) “Features” which have been categorized as “Design Selective Anticipation”
features and “Manufacturing Selective Anticipation” features have been used to establish a feedforward planning model. (This is marked TBD and is presented in blue italics because this area of the DSS has yet to be explained.)
4) The “Feedforward Planning Model” (FFPM) organizes CBS work center
information for the IPT within the context of the “Processing Category.” (This is marked TBD and is presented in blue italics because it requires the definition of all hierarchies below it to be defined for completion.)
5) Once a CBS work center is designated by the FFPM, CBS work center based
information is organized and provided to the IPT for decision making. a. Processing systems information is information related to current
equipment and facilities, as well as historical databases. b. Technical, resources, and sequencing information baselines are
developed by the system as starting points and may require additional information input. (Areas marked in blue italics have not been defined.)
The “Feedforward Planning Model” (FFPM) is the mechanism/logic within the
RIM-based facilitating the management of reciprocal interdependencies and anticipated
“capability” (as defined in the three contexts from Section 7.5) at a level of detail
required for effective conceptual design decision making. In order to develop the FFPM
201
for the conceptual DSS, each segment in blue in Figure 7.6 must be systematically
addressed. The remainder of Chapter 7 is devoted to this undertaking.
7.7 Design Processing Categories In this section, the “Design Processing Categories” segment of Figure 7.6 is
explained. As a starting point, lower-level process definitions are already defined in the
DSS by default, i.e., they are defined within CBS work center charters/descriptions that
correlate to Figure 7.4 on page 181. (Figure 7.4 - Lower-Level CBS Information
Hierarchies for Detail Fabrication.) Other categories should be defined by a cross-
functional effort between activities where these definitions are relatable to other
enterprise systems.
In the conceptual RIM-based DSS, the higher-level “NC machining processing
category” is selected when NC machining is used to mill (e.g., shape) plate material, and
it includes all other processes required to complete the detail design. It is interesting to
note that none of the literature reviewed which utilized NC milling examples provided
insights to the other processes involved in completing an NC machined detail design or
their sequence of occurrence. Several articles provide a great deal of detail related to
machining complex designs, and then jump to an estimate of total cost for a design. The
reader is left to speculate how (or even whether) the other processes are considered, how
tooling decisions are made, what assembly tolerance information is considered, and how
the time/schedule element of cost calculation is applied. Similarly, the literature rarely
explains the source of the schedule duration that is used to develop cost estimates. The
reader is also often left to make assumptions as to how the cost is developed and used
202
based solely on complex formulas and diagrams, and it is difficult to make the connection
to real world IPT decision making. Based on working-level IPT responsibilities
discussed in Chapter 5, Section 5.1 and this author’s work experience, IPT members
typically need more insights to the details behind a cost estimate than these approaches
have to offer. Cost estimates alone are not sufficient to build an integrated master plan
and master schedule or effectively manage IPT-level tasks.
There are many ways to envision how a DSS would be used by an IPT. In
simplest terms, this research assumes that a conceptual representation of a design is being
considered, and the IPT members need information related to the manufacture of the
design using “NC Machining” as defined earlier. The IPT enters the required information
and an assortment of feedback related to in-house process capabilities is made available
to the IPT based on the entries.
The RIM-based DSS is not intended to define the lower-level topology of an NC
machined surface. Instead, the RIM-based DSS queries the enterprise systems to find the
best match of historical data related to the design task at hand. The RIM-based DSS
provides the process capabilities by work center as well as examples of manufacturing
engineering studies to “show” the engineer what topologies have been successful in the
past, as well as configurations that have caused problems. The RIM-based DSS gives the
IPT the best starting point possible, considering there is very little detail actually
available during conceptual design.
If an IPT member wishes to compare “NC Machining” to “Composites
Fabrication,” then two different reports are generated, and the user compares these
reports for differences. This does not mean that the information hierarchies within the

203
envisioned DSS could not be used to develop an enhancement to directly compare
material types (e.g. aluminum versus composite) for a specific detail design. Once RIM
approaches are used to define “Composites Fabrication,” then this type of comparative
procedure is possible. However, the amount of RIM-diagramming associated with
development of the conceptual information hierarchies make the tasks infeasible for this
research due to time constraints.
The conceptual information hierarchies for “Design Processing Categories” are as
follows:
Note “Design Processing Categories” are visible in Figure 7.6, but the complete
information hierarchy including “Shaping, Forging, NC Machining, etc.” is not visible in
the figure. This is because the information in Figure 7.7 at lower-level, or different
dimension, than Figure 7.6
Figure 7.7 Information Hierarchies for Design Processing Categories
• Design Processing Categories o Shaping ! Forging + Machining ! NC Machining ! Sheet Metal Fabrication ! Composites ! Other (TBD)
o Mechanical Assembly o Electrical Harnesses and Cables (Electrical) o Tubing and Ducts (Plumbing) o TBD
Do not confuse the category NC Machining with only the milling process. This category is used to locate ALL work centers typically used by the Factory activity to complete a part whose major shaping task is performed using NC milling processes.
Similarly, the Sheet Metal Fabrication category is used to locate ALL work centers typically used by the Factory activity to complete a part whose major shaping task is performed using sheet metal fabrication processes. The IPT needs to ultimately determine the labor requirements, schedule, tooling, and cost for a complete part.

204
The next section, the systematic definition of the conceptual framework illustrated
in Figure 7.6 continues.
7.8 Product Data Management, Design Features, and the Tool Classification and Control System
In this section, segments of Figure 7.6 labeled “Product Data Management
System,” “Features”, and “tool classification and control system” are discussed. First, a
high-level discussion of design features is offered and specific design selective
anticipation features for NC machining are identified. Next, the basic contents of the
PDMS are presented. This is followed by a discussion of the tool classification and
control system hierarchies, and finally, Figure 7.6 is updated to reflect the knowledge
links developed in this section.
Developing a strategy to manage the reciprocal interdependencies involving
design features is one of the more difficult aspects of the RIM-based DSS to define; in
particular, the use of features in the context of selective anticipation. According to
Verganti’s findings, selective anticipation is the most difficult exercise of feedforward
planning. Selective anticipation involves anticipating only the right amount of detail
required to verify coherence, while at the same time correlating the design detail in the
appropriate contexts.
The reciprocal interdependencies involved with design features are far more
multi-dimensional than any considered thus far and certain areas of the solution space can
only be assumed at this point. In general terms, a “manufacturing feature” is a subset of

205
“design features” that conveys information to manufacturing regarding processing
selections or assists in the reuse of enterprise data.
The solution space for design features is defined by the equation 7-1:
Σ Features = FeaturesDesignSelectiveAnticipation(Mfg) + Features ManufacturingSelectiveAnticipation(Design) +
FeaturesDesignOther(Mfg) +
Σ[Features DesignSelectiveAnticpation(x) + Features(x)SelectiveAnticipation(Design) +
FeaturesDesignOther(x)] (7-1)
Where,
Σ Features = the total set of all possible features
FeatureDesignSelectiveAnticipation(Mfg) = the set of features that must be first identified by design to begin to manage reciprocal interdependencies that exist between Design and Manufacturing using feedfoward planning. FeatureManufacturingSelectiveAnticipation(Design) = the set of features identified by Manufacturing after FeatureDesignSelectiveAnticipation(Mfg) are identified by design that serve as the starting point for reciprocal interdependencies management and feedforward planning. FeaturesDesignOther(Mfg) = the remaining features identified by Design as the design matures. The absence of this knowledge does not critically inhibit conceptual design decision making. FeaturesDesignSelectiveAnticipation(x) = the set of features that must be first identified by Design to begin to manage reciprocal interdependencies that exist between Design and an unidentified entity, x, using feedfoward planning. Features(x)SelectiveAnticipation(Design) = the set of features that are identified by entity, x after FeatureDesignSelective Anticipation(x) are identified by Design which serve as the starting point for reciprocal interdependencies management and feedforward planning. FeaturesDesignOther(x) = the remaining features identified by Design as the design matures. The absence of this knowledge does not critically inhibit conceptual design decision making.

206
Based on this broad definition of features, the next step of DSS development
involves identifying “selective anticipation features.”
7.8.1 Design Selective Anticipation Features for Detail Fabrication
“Design selective anticipation features” [i.e., Figure 7.6 –
FeaturesDesignSelectiveAnticipation (Mfg)] are those features that are known, or can be reasonably
estimated, early in the conceptual design phase. Since the product is an aircraft, and
aircraft have been manufactured before, then the design process is not totally new.
Similarly, certain “features” of an aircraft can be defined in broad terms that have
commonality to past designs. Design selective anticipation features are important data
entries/inputs for the Feedforward Planning Model.
Even though it is not possible to define/specify the complete list of features at this
point, it is assumed there is some number of features in the solution space and the design
selective anticipation features are a subset of the total.
The types of engineering data available during early conceptual design will likely
differ depending upon the product being developed. Since the specific case in this
research is aircraft manufacturing, it is necessary to identify the features information
typically available during conceptual design that have a quantifiable impact on
manufacturing tasks. The following listing of conceptual design features information is
based on combining material from three sources, Chapman (2004), Hall (2000), and
Morrison and Neff (1997). This list is not intended to serve as the complete list of
conceptual design data available and is oriented more toward structure.

207
• Inboard profile [Consists of at least a side-view cross section and, depending on the complexity of the aircraft, top-view and front-view cross sections. It is used to allocate space among various systems. It assists in the identification and location of the propulsion system and fuel, avionics, crew station, payload, and the primary structure such as bulkheads. Provides an initial concept of overall size and shape, and serves other design functions such as outer mold line (OML), center of gravity, water line, fuselage station, and butt line.]
• Preliminary estimates of understructure arrangement
• Preliminary estimates of weight
• Preliminary estimates of material types and proportions
In order to develop and use the FFPM, an assumption of “design selective
anticipation features” must be made in order to narrow the solution space and provide a
starting point for the consideration of multiple reciprocal interdependencies. The list of
“design selective anticipation features” for the NC machining processing category is
offered in Figure 7.8.
Figure 7.8 Design Selective Anticipation Features for the NC Machining Processing Category
• Detail type o Material type o Finished weight (target) o Part envelope ! Length (longest) ! Width (next longest) ! Depth (shortest)
o Surface area (two dimensional-one side, or 2D-1S) o Service life {fracture critical} o Subassembly process

208
In Figure 7.8, “Detail type” is based on reference material presented in Appendix
B and the product structure presented in Figure 7.1, page 175. “Detail type” examples
are bulkhead, frame, floor, web, support, etc. Nomenclature (part naming) has meaning
within the context of design, and is used to help the designer to manage design reciprocal
interdependencies related to function.
“Material type” is self-explanatory. Based on reference material presented in
Appendix B, the most common materials used in the aircraft industry are aluminum,
titanium, steel, and composites. Within the RIM-based DSS defined, the “NC Machining
Process” category does not have capability for a “composite” material type, so if this
material is selected as an input, the DSS provides appropriate feedback.
“Finished weight,” or an estimated target, is self-explanatory. Weight estimates
are used for aircraft sizing.
“Part envelope” is derived from OML definition and is used in aircraft sizing. It
is easy to conceptualize how this information provides insights into material handling,
work surfaces requirements, and equipment bed surfaces, such as milling machines, tape
laying machines, specialty drilling machines, etc. A work measurement engineer can use
these categories to restructure the work measurement data to be sensitive only to these
features available during conceptual design. Similarly, if machine and equipment
information within a work center is cataloged/organized by the same types of
measurements, then automated comparisons are possible.
The “Part envelope” depth is the primary direction in which work will be
accomplished, such as the direction the cutter faces during processing, or the orientation
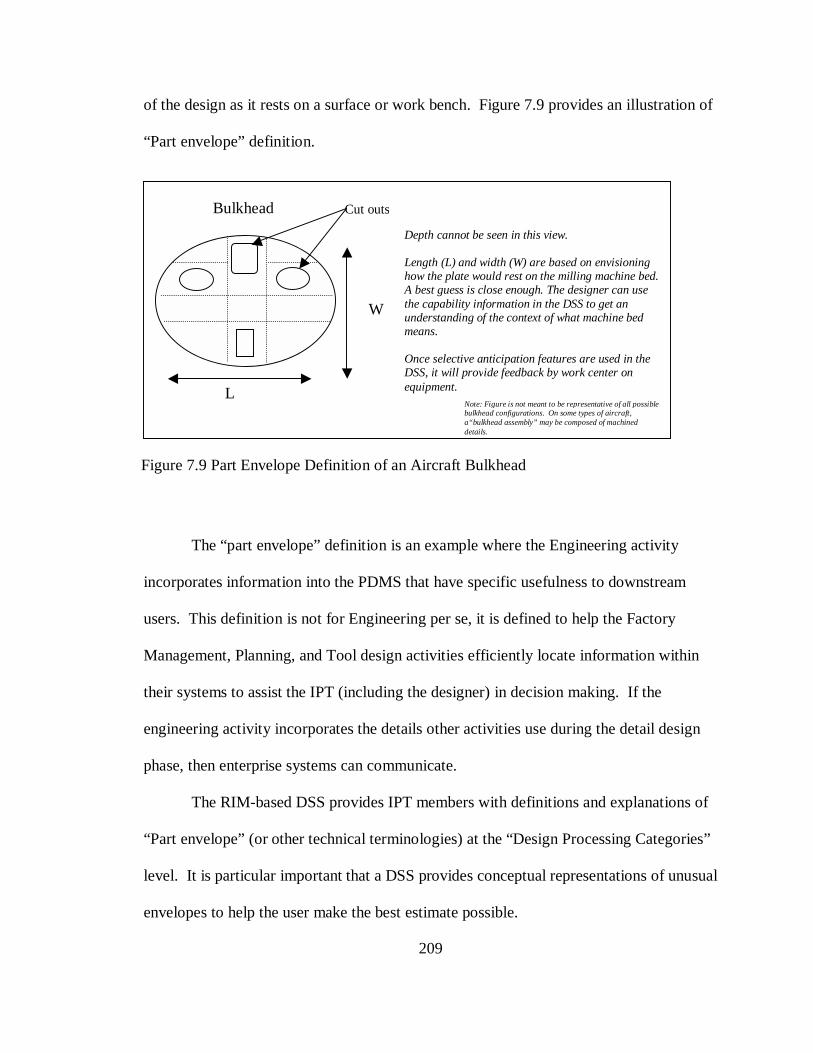
209
of the design as it rests on a surface or work bench. Figure 7.9 provides an illustration of
“Part envelope” definition.
The “part envelope” definition is an example where the Engineering activity
incorporates information into the PDMS that have specific usefulness to downstream
users. This definition is not for Engineering per se, it is defined to help the Factory
Management, Planning, and Tool design activities efficiently locate information within
their systems to assist the IPT (including the designer) in decision making. If the
engineering activity incorporates the details other activities use during the detail design
phase, then enterprise systems can communicate.
The RIM-based DSS provides IPT members with definitions and explanations of
“Part envelope” (or other technical terminologies) at the “Design Processing Categories”
level. It is particular important that a DSS provides conceptual representations of unusual
envelopes to help the user make the best estimate possible.
L
W
Depth cannot be seen in this view. Length (L) and width (W) are based on envisioning how the plate would rest on the milling machine bed. A best guess is close enough. The designer can use the capability information in the DSS to get an understanding of the context of what machine bed means. Once selective anticipation features are used in the DSS, it will provide feedback by work center on equipment.
Figure 7.9 Part Envelope Definition of an Aircraft Bulkhead
Bulkhead Cut outs
Note: Figure is not meant to be representative of all possible bulkhead configurations. On some types of aircraft, a“bulkhead assembly” may be composed of machined details.

210
The “Surface area” (i.e., two-dimensional, one-side surface, or 2D-1S) is
represented in Figure 6.9. This surface area definition does not include the surface area
of any internal characteristics that cannot be seen in the two-dimensional view in Figure
6.9. The outer mold line (OML) information is used as the reference to make a best
estimate of 2D-1S surface area as illustrated in Figure 7.9. Even if the design is not a
bulkhead, the OML and the fuselage station locations from sizing efforts can also be used
to estimate similar surface areas for longitudinal structural members. Again, the
envisioned DSS provides IPT members with explanations of these types of definitions at
the “Design Processing Categories” level in order to avoid application errors.
Even though this research does not specifically model “Service life,” the
importance of service life is understood, and a placeholder is provided in Figure 7.9. The
reason “fracture critical” is enclosed within brackets is to highlight that the baseline
service life assumption for a bulkhead is being stipulated as “fracture critical.” For the
initial purposes of the conceptual DSS, the sensitivity is “fracture critical” as a safety of
flight structure as described in Appendix B. A service life example in Appendix B uses
fracture critical 1, fracture critical 2, durability critical, and normal controls as four basic
service life categories. However, it is understood that the modeling of service life
ultimately likely requires a separate module/approach not covered in this research.
The use of the term “fracture critical” in the context of manufacturing processes
conveys the necessity to take extra care in monitoring the job. Examples include
increased occurrences of marking and inspection. If a design is not “fracture critical,”
then the additional care is not required.
211
In Figure 7.8, “Subassembly process” conveys information with regard to whether
a design is likely to be mechanically fastened, welded, etc. in the installation phase.
Looking ahead to how a design is assembled to other structure (i.e., Assembly activity,
IDEF0 diagram Activity 8, Figure 2.7, page 56) offers insights into detail fabrication
decisions (i.e., Fabrication activity, IDEF0 diagram Activity 7, Figure 2.7, page 56)
7.8.2 Product Data Management System Hierarchies
For this research, it is assumed that a product data management system (PDMS)
exists. A PDMS contains a configuration control numbering system, the product
structure in Figure 7.1, design features discussed in Section 7.8.1, electronic
representations, the WBS number scheme, and Schedule Work Breakdown Structure
(SWBS) information. Conceptual PDMS information hierarchies are presented in Figure
7.10
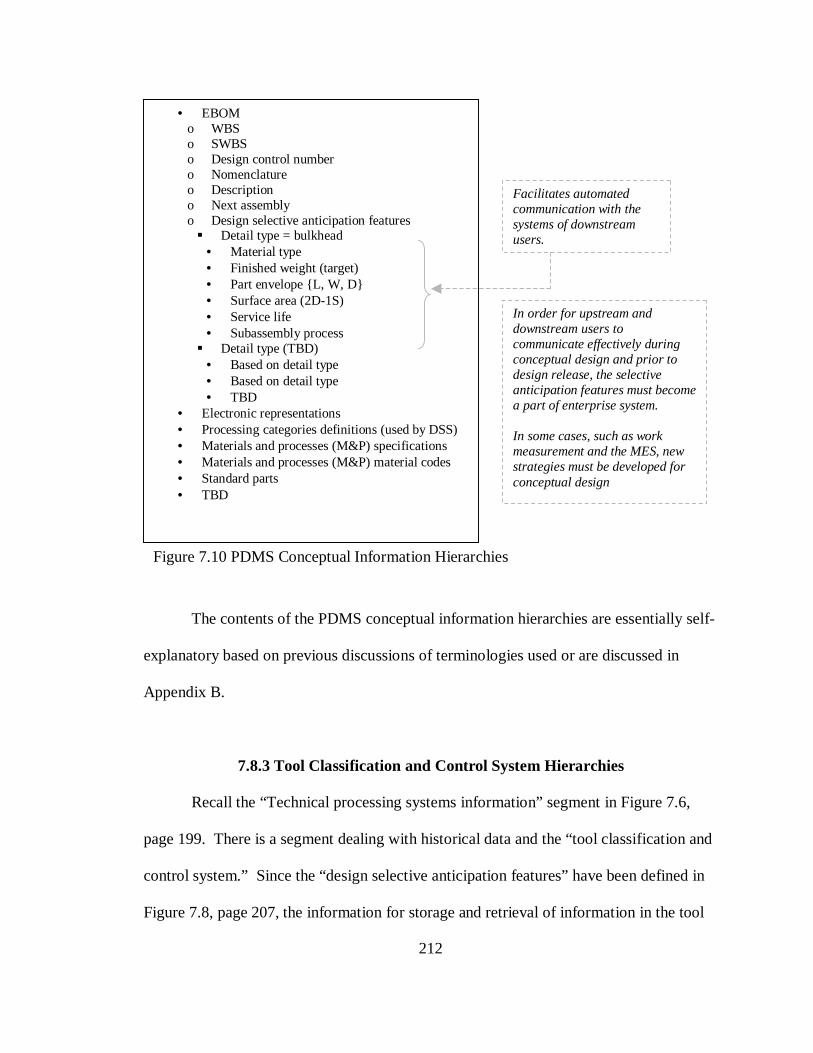
212
The contents of the PDMS conceptual information hierarchies are essentially self-
explanatory based on previous discussions of terminologies used or are discussed in
Appendix B.
7.8.3 Tool Classification and Control System Hierarchies
Recall the “Technical processing systems information” segment in Figure 7.6,
page 199. There is a segment dealing with historical data and the “tool classification and
control system.” Since the “design selective anticipation features” have been defined in
Figure 7.8, page 207, the information for storage and retrieval of information in the tool
• EBOM o WBS o SWBS o Design control number o Nomenclature o Description o Next assembly o Design selective anticipation features ! Detail type = bulkhead
• Material type • Finished weight (target) • Part envelope {L, W, D} • Surface area (2D-1S) • Service life • Subassembly process ! Detail type (TBD)
• Based on detail type • Based on detail type • TBD
• Electronic representations • Processing categories definitions (used by DSS) • Materials and processes (M&P) specifications • Materials and processes (M&P) material codes • Standard parts • TBD
Figure 7.10 PDMS Conceptual Information Hierarchies
Facilitates automated communication with the systems of downstream users.
In order for upstream and downstream users to communicate effectively during conceptual design and prior to design release, the selective anticipation features must become a part of enterprise system. In some cases, such as work measurement and the MES, new strategies must be developed for conceptual design

213
classification and control system is established based on these features reciprocal
interdependencies. The conceptual tool classification and control system hierarchies are
listed in Figure 7.11.
Figure 7.11 Tool Classification and Control System Information Hierarchies
• Design tool classification and control number o Serial number o Design tool code (name/type) o Tool selective anticipation features (TBD) o Where used (CBS work center number) o Design control number reference (part number) ! Design type ! Design material type ! Design finished weight ! Design part envelope ! Design surface area (2D-1S) ! Design service life {category}
o Tool control number reference (if tool-to-make-tool) ! Tools-to-make-tools selective anticipation features (TBD)
o Placed in service date o In-house manufactured ! Tool design hours by tool code ! Tool manufacturing hours by tool code ! Direct material dollars [base year (BY) dollars]
o Purchased tools ! Vendor by tool code ! Unburdened purchase dollars (BY)
• Tool estimating data (historical averages) o Tool code
• Where used (work center number) occurrence • In-house manufactured
o Tool design hours o Tool manufacturing hours o Direct material dollars [base year (BY) dollars]
• Purchased tools o Vendor o Unburdened purchase dollars (BY)
Work center number
Design selective anticipation features
Work center number
Make tools
Buy tools
Tool code name conveys function
Make tools
Buytools
214
The design selective anticipation features link the design knowledge and the
tooling knowledge. Because the design type is a bulkhead, the IPT is enabled to review
only the tooling information related to bulkheads, and if desired, only those that are
similar in size and weight to the design being considered.
The tool code is correlated to the work center where it is used (via the work center
number) so this information can in turn be linked to a fabrication plan/routing sequence.
Once the information related to tool codes is linked to the work center and the design
type, then the tool family (groups of tools typically used to make a design) is much easier
for the IPT to interpret.
Historical averages related to tool codes are available to everyone in the
enterprise, as opposed to only those individuals who can write an ad hoc programs to
retrieve the information.
The tool classification and control system contains information required to
manage the reciprocal interdependencies between Engineering design information (i.e.
IDEF0 Activity 3, Figure 2.5) and Tool Design information (i.e., IDEF0 Activity 6,
Figure 2.6). The contents of the tool classification and control hierarchies in Figure 7.11
are explained as follows:
• “Tool classification and control number” is a unique number assigned to a specific tool for a specific job.
• “Serial number” is used to distinguish between rate tools for the same job.
• “Tool code” (name/type) conveys the basic function of a tool, examples include
holding fixture, drill plate, etc.
• “Where used” conveys the work center in which a design tool is required. The work center information links tool utilization with work instructions routing for the detail design requiring the tool.

215
• “Design control reference number” is the same as the design number in the
EBOM, and provides a link to the PDMS. Note that this type of field is populated when a tool is actually built. For the most part, the IPT is interested in the information at the bottom of the figure related to estimating the most likely tooling task for the new design based on historical data.
• “Design selective anticipation features” (e.g. as explained in Section 7.8.1) are
integrated in the tool classification and control system, i.e., part type, part material type, etc. This information is not typically stored in tool design systems, but is required for electronically linking detail design knowledge and tool design knowledge, as well as enhanced simulation capabilities.
• “Tool control reference number” is required if the tool is used to make another
tool.
• “Tools-to-make-tools selective anticipation features” are yet to be determined, but are required for the envisioned DSS and enhanced simulation capabilities. This segment of RIM-based DSS will not be discussed in this research for reasons previously discussed.
• “Placed in service dates” are used for design tooling maintenance decisions.
• “In-house manufactured” contains the information related to design tool
manufacturing for specific design tools. This area of the information hierarchy correlates information from Tool Design (i.e., IDEF0 Activity 6) and Fabrication (i.e., IDEF0 Activity 7). Direct costs in dollars are recorded with a base year (BY) designation.
• “Purchased tools” contains the high-level purchasing information, i.e., the vendor
name and the unburdened purchase cost in base year dollars for a specific tool.
• “Estimating data (historical averages)” contains standardized templates used for decision making in the absence of detailed tool design information.
• “TBD” is a placeholder signifying that other required elements of the tool
classification and control system are likely to be discovered once more detailed work and RIM-diagramming are performed in the context of tool manufacturing processing.
The Feedforward Planning Model (FFPM) organizes information for a detail
design by work center, so “Where used” is a key component of the tool classification and

216
control system. Once work centers for processing a particular design type are identified,
the tool code requirements by work center are estimated using historical occurrence
information in the tool classification system.
Even though detail design processing patterns are given a great deal of
consideration in the literature, based on this author’s work experience, the estimation of
design tooling requirements is more difficult. Most articles do not directly address
tooling requirements (i.e., IDEF0 Activities 6 and 7), and tooling knowledge is
oftentimes buried in a factor or an equation. In addition, the devastating effect on
schedule performance that occurs when there is a failure to identify tooling requirements
early on is not adequately addressed in the literature.
One detail design typically requires several tools for its fabrication. If one
considers that various tooling scenarios that exist, i.e., tools-to-make-tools, then it quickly
becomes apparent from the perspective of scheduling (and resource leveling) how
important that these relationships are to the estimation of the design release date that
supports the IPT’s total project plan. Tool design selective anticipation features and
associated processing relationships are not discussed in this research and are a part of
planned future work.
7.8.4 Update of the DSS Information Hierarchy
Recall Figure 7.6, page 199, where the yet to be defined items are in blue italics.
Figure 7.6 is now updated to create a new figure, Figure 7.12, to highlight the areas of the
FFPM still requiring definition. Certain segments of “Technical processing systems
information” are now complete and are color coded in black. The remaining segments

217
requiring definition are offered in blue italics and the upcoming sections where these
segments are discussed are colored in bolded green.
In the next section, the definition of Figure 7.12 continues.
• Design Processing Categories (Section 7.7) o Product Data Management System (EBOM/Product Structure) (Section 7.3; 7.8.2) ! Features [Features DesignSelectiveAnticipation (Mfg) + Features ManufacturingSelectiveAnticipation (Design)] (Section 7.8.1; Figure 7.8) (Section 7.9.2)
• Feedforward Planning Model (FFPM) o CBS Work Centers (Section 7.4.2) ! Technical processing systems information
• M&P standards and specifications by work center (Section 7.6) • Equipment inventory (Section 7.8)
o Equip specifications correlated to Features DesignSelectiveAnticipation (Mfg) + Features ManufacturingSelectiveAnticipation (Design) + FeaturesDesignOther(Mfg) • Manufacturing Engineering studies by work center (Section 7.6) • Specific processing capabilities limits [FeaturesDesignSelectiveAnticipation(Mfg)
FeaturesManufacturingSelectiveAnticipation(Design)] (Section 7.9) • Design specific tooling used on past designs (historical data by product by type, i.e., part of tool classification and control system) (Section 7.8.2)
o Tool codes (Tool Type; Features DesignSelective anticipation (Mfg) ) o Tools to make tools on past designs ! Tool features (Will not be addressed)
• Non-design specific tools (located in the areas, such as portable hole processing systems) inventory (Section 7.6)
! Resources (management strategy) (overhead not discussed) • Direct labor hours (touch) (Section 7.10) • Machine hours (Section 7.10) • Direct labor hours (other) (Section 7.10) • Procurement dollars (Section 7.10)
! Sequencing (availability) • Sequence decisions based on the management of existing requirements
(already planned for other products) (Section 7.11) o Labor hours by shift by timeframe (Section 7.11) o Machine hours by shift by timeframe (Section 7.11)
• Technical sequencing considerations linked with Master Schedule (internal scheduling (Section 7.12)
• Sequencing decisions based on management of new requirements by work center (incomplete designs) (Section 7.13)
Figure 7.12 RIM Development Conceptual Framework (Update of Figure 7.6)
#1
#2
#3
Highlighted numbers refer to capability
contexts discussed in Section 7.5.

218
7.9 Technical Processing Systems Information – Specific Processing Capabilities Limits (Based on Features)
In this section, the development of “Technical processing systems information”
related to the segment titled “Specific processing capabilities limits” in Figure 7.12 is
discussed. First, some of the key findings and concepts from Verganti’s study are
reviewed in the context of technical information development and utilization by IPTs.
Next, RIM-diagramming is used to identify feedforward planning opportunities in the
context of capabilities limits by feature and work center. Finally, the beginnings of a
FFPM fabrication plan are presented.
7.9.1 Importance of Technical Information and Teaming
Verganti’s research involves studying and describing product development teams’
anticipation of manufacturing constraints and opportunities during concept generation
and product planning phases. Findings from 12 case studies related to teaming and early
design decision making in the automobile, helicopter, and white-goods (small appliances)
industries provide the basis of assertions.
Verganti concludes selective anticipation is the most difficult aspect of
feedforward planning because it requires individuals to utilize only a small, unique set of
information to make a decision. Some teams effectively utilized selective anticipation in
feedforward planning efforts, while others could/did not. Verganti reports one of the
issues noted by teams whose performance was poor on feedforward planning was - the
technical information believed needed to make timely and informed decisions is not
available at project start. Based on this author’s work experience, many IPT members

219
do not understand how to work with sketchy information, and become fixated on the
unavailable information - as opposed to focusing on selectively anticipating how to
utilize the available information. These individuals believe a decision cannot be made
without a complete design.
Verganti also notes efforts related to selectively anticipating detailed design
information are fruitless if the design information is not maintained, transferred, and
exploited during subsequent product development activities. Further, he asserts that
effective feedforward planning requires both “learning from past experience” and
“learning from development of a new solution.” Learning from development requires the
efforts of development be appropriately documented. If IPTs effectively “start over” on
each new endeavor and the enterprise operates under the assumption that various types of
knowledge start out at zero percent (i.e., Chapter 4, Figure 4.1, page 103), then learning
from development is not occurring.
Further, Verganti discovered that successful anticipation of manufacturing
constraints and opportunities during the conceptual design phase was correlated to the
development of “preplanning knowledge,” i.e., knowledge developed and maintained
well in advance of the presently identified need. However, lacking in his study are
specific examples and explanation. Based on this author’s work experience in an IPT
environment, Verganti’s assertion is valid; but extrapolation and elaboration are required
based to correlate the study to the working-level IPT job roles and responsibilities
discussed in Chapter 5, (i.e., Section 5.2, page 116.)
With regard to the “Technical information” (i.e., context 1, Figure 7.12, page 217)
aspects of preplanning knowledge from an aircraft manufacturing perspective,

220
manufacturing engineering plays the lead role for Detail Fabrication (and Assembly)
technical information. (Manufacturing engineering is referenced in IDEF0 diagram
Activity 5, Figure 2.6, page 55.) However, in many instances, manufacturing engineering
information is organized in a format that supports ongoing production activities, but not
the information needs of IPTs. This assertion is based on: 1) Verganti’s findings, (e.g.,
most teams reported not having the information they needed), 2) problems noted in
Chapter 1 dealing with the lack of success of concurrent engineering efforts, and 3) this
author’s practical work experience.
Manufacturing engineering is classically responsible for the following types of
tasks:
• Performing studies of in-house process/equipment capabilities limits • Managing the data associated with performance of studies related to process
capabilities
• Identifying new equipment and integrating it with the existing facility
• Developing processing requirements for suppliers
• Performing benchmarking activities
• Developing the manufacturing plan (and associated tooling plan) for new products
However, the information resulting from manufacturing engineering efforts is
typically not maintained in a format readily available for reuse by IPTs or integration
with existing enterprise systems. (Arai et al., 2004; Prasad; 2000; Brown et al. 1997.)
During conceptual design, the user of technical processing capabilities limits information
must often develop RIM-relationships, i.e., make an ad hoc assessment as to the

221
correlation of technical knowledge, resource knowledge, and sequencing knowledge
related to required decision making.
Further, the literature review contains many articles that discuss “process
capabilities limits” considerations for new designs as if these limits are novel or unknown
- even though existing processes and equipment have been utilized on past designs (i.e.,
commonality as defined in Chapter 1).
In order to develop the envisioned DSS and realize its associated benefits,
significant change is required with regard to how the enterprise obtains, formats, and
maintains technical information that is typically related to manufacturing engineering
efforts. The manufacturing engineering information is critical to success in “preplanning
knowledge” and “learning by development.”
7.9.2 RIM-Diagramming of Technical Information: Specific Processing Capabilities Limits
Recall Figure 7.12, the “Technical” information piece contains a segment in blue
italics titled “ Specific processing capabilities limits.” RIM-diagrams are offered in
Tables 7.3 through 7.10 to explain the types of specific processing capabilities limits that
are typically required by IPTs, but are unavailable. The information in the RIM-diagrams
is attributed to manufacturing engineering (i.e., IDEF0 diagram Activity 5, Figure 2.6,
page 55). In addition, the RIM-diagrams illustrate the type of computerized information
queries conceptualized for the RIM-based DSS.
The previously identified “design selective anticipation features” (Figure 7.8,
page 207) are inputs/entries made by the IPT to the DSS. Once the “design selective

222
anticipation features” are entered, the “manufacturing selective anticipation features” are
identified by the DSS. (This assumes that manufacturing engineering develops and
maintains the appropriate data/information in information hierarchies that are relatable by
the work center number.) The “manufacturing selective anticipation features” are not yet
specified by the detail design, but in order to develop the preferred design, these features
require consideration and planning as soon as possible.
Recall the design selective anticipation features from Figure 7.8. If the working-
level IPT is considering a NC machined bulkhead detail design, which is later
mechanically assembled/fastened, then the DSS input information is offered in Figure
7.13. (Variables are used in the figure as placeholders.)
Once the DSS input information is established, the next step is to determine the
pertinent reciprocal interdependences (i.e., knowledge links) existing between the “design
selective anticipation features” and the “manufacturing selective anticipation features.”
The information in the RIM-diagrams in Tables 7.3 through 76.10 represents the
Figure 7.13 Design Selective Anticipation Features for a Mechanically Fastened NC Machined Bulkhead (IPT Inputs in Blue Bold)
IPT Selection Design Processing Category = NC Machining • Detail Type = Bulkhead o Material Type = n o Finished Weight (target) = w o Part Envelope
! Length (longest) = L ! Width (next longest) = W ! Depth (shortest) = D
o Surface area (two dimensional-one side, or 2D-1S) = SA o Service Life {= fracture critical} o Subassembly process = mechanical fastening

223
“Technical processing systems information” in Figure 7.12 that requires collection,
electronic formatting, and maintenance in order for the DSS to provide feedback in the
context of “Specific processing capabilities limits” to the IPT.
Before reviewing Tables 7.3 through 7.10 on the following pages, a cursory
review of cost breakdown structure (CBS) work centers previously presented Figure 7.4,
page 181, is recommended. Figure 7.4 assists with correlating the work center
information in the CBS to the tables presented. In addition, Tables 7.3 through 7.10 are
not intended to discuss every possible technical processing relationship, but are offered
for example purposes only.

224
Table 7.3 RIM-Diagram for NC Milling Group: 1 of 9
R I M T, R, S
Manufacturing Capabilities by Work Center
COMMON Manufacturing Selective Anticipation Features
COMMON Technical Process Capabilities Limitations (Ranges)
COMMON Technical Process Rules and Preferences (Most desired within the range)
NEW (FUTURE) In-house planning --------------- Vendor data
3-Axis Milling After plate inspection and tooling holes ------------------------- Processing envelope correlated to part envelope Material handling equipment (features, part envelope, weight) Surface finish ranges
Machine bed Nominal = X
Plates can be surface milled before receipt ------------------- Identify vendors
5-Axis Milling Locating features associated with the IPT’s manufacturing plan
5-Axis is preferred resource to 5-Axis high speed based on management preference -------------------------- After surface milling (plate prep) --------------------------- Processing envelope correlated to part envelope Material handling equipment (features, part envelope, weight) Surface finish ranges Hole processing Hole dia tol Hole loc tol Hole depth Web thickness (WT) Web thick tol Pocket size (PS) Stiffener thickness (ST) Stiffener thickness tolerance Cut outs Location tolerance
Ratios Tables PS to WT Flange height to ST
In general, staying below the limits are preferable Exact values can be stated “Thinness” limit – consider chemical milling If limits require exceeding, then consider replanning for 5-Axis high speed work center Outside of limit, consult M.E.
Internal Test patterns and published results First-article test part required ------------------- External Vendor data Equipment Process coordination Turn key The same types of detailed technical information is coordinated with supppliers
5-Axis High Speed
In general, same as 5-Axis Milling
In general, same as 5-Axis for sequencing and technical, but the specific values likely differ
In general, same as 5-Axis, but the values likely differ
In general, same as 5-Axis
Resource
Sequence
Technical
Note: Group numbers and work centers are from lower-level CBS, Figure 6.4
Expansion of related capabilities knowledge

225
“RIM” is listed in the far left column of Tables 7.3 through 7.10 to signify that
“Technical, Resources, and Sequencing” reciprocal interdependencies are being
considered concurrently. The “Work Center” column designates the Detail Fabrication
work centers containing the touch labor resources, non-design tools, and design tooling
utilized to manufacture aircraft NC machined bulkheads. (Refer to the prior explanation
of CBS work centers correlating to Figure 7.4)
The next three columns are designated as “Common” because they deal with how
past designs have been manufactured using in-house processes. The last column is
identified as “New.” This column specifies the general types of “preplanning
knowledge” required for future decision making related to “new” products.
The first “Common” column deals with “Manufacturing Selective Anticipation
Features.” These are the features most critical to fabrication and/or installation
sequencing in subassembly or component assembly. These features have not yet been
discretely identified, but they are the features that should be in the forefront of IPT
planning and decision making.
The identification of “manufacturing selective anticipation features” prior to
actual design definition “feeds forward” manufacturing constraints and opportunities to
an earlier point in the design process. In simple terms, manufacturing is conveying to
engineering - these are the most desirable features based on past experience and the
constraints and opportunities associated with these features. Instead of leaving each IPT
member the task of identifying “manufacturing selective anticipation features,” the DSS
facilitates RIM by conveying “manufacturing selective anticipation features” identified
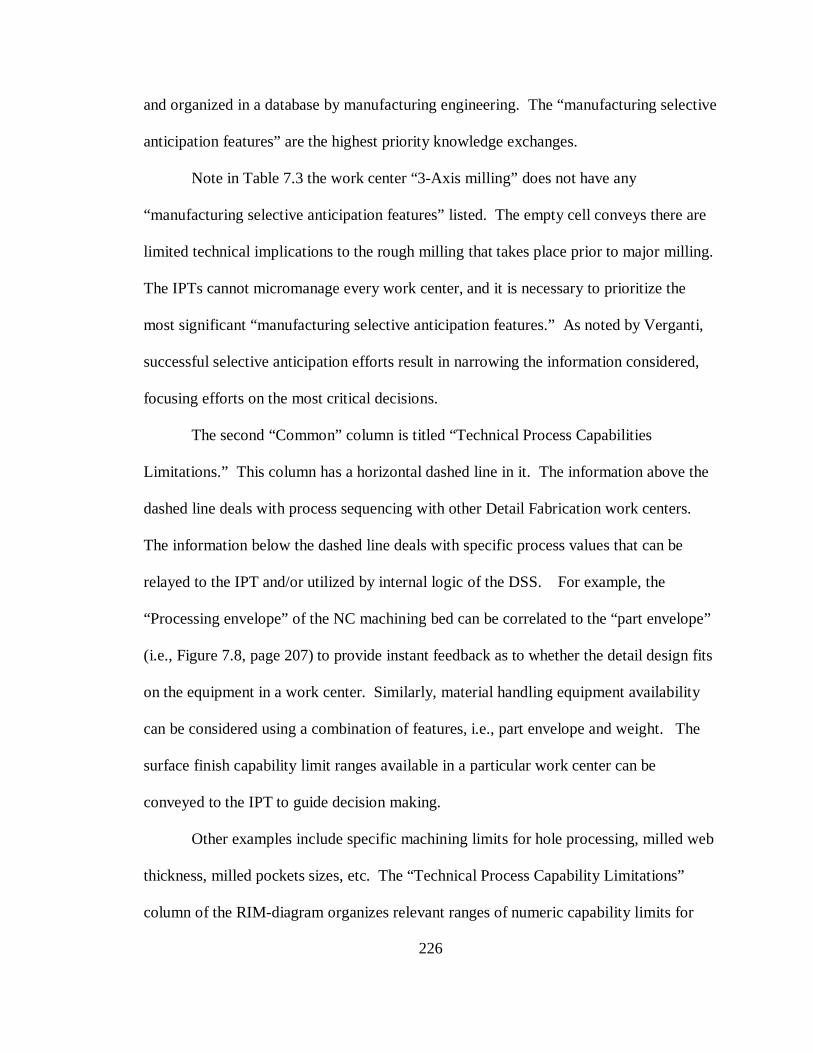
226
and organized in a database by manufacturing engineering. The “manufacturing selective
anticipation features” are the highest priority knowledge exchanges.
Note in Table 7.3 the work center “3-Axis milling” does not have any
“manufacturing selective anticipation features” listed. The empty cell conveys there are
limited technical implications to the rough milling that takes place prior to major milling.
The IPTs cannot micromanage every work center, and it is necessary to prioritize the
most significant “manufacturing selective anticipation features.” As noted by Verganti,
successful selective anticipation efforts result in narrowing the information considered,
focusing efforts on the most critical decisions.
The second “Common” column is titled “Technical Process Capabilities
Limitations.” This column has a horizontal dashed line in it. The information above the
dashed line deals with process sequencing with other Detail Fabrication work centers.
The information below the dashed line deals with specific process values that can be
relayed to the IPT and/or utilized by internal logic of the DSS. For example, the
“Processing envelope” of the NC machining bed can be correlated to the “part envelope”
(i.e., Figure 7.8, page 207) to provide instant feedback as to whether the detail design fits
on the equipment in a work center. Similarly, material handling equipment availability
can be considered using a combination of features, i.e., part envelope and weight. The
surface finish capability limit ranges available in a particular work center can be
conveyed to the IPT to guide decision making.
Other examples include specific machining limits for hole processing, milled web
thickness, milled pockets sizes, etc. The “Technical Process Capability Limitations”
column of the RIM-diagram organizes relevant ranges of numeric capability limits for

227
each work center using manufacturing features. During early conceptual design, many of
these features are not known, but the information is useful to provide design guidance as
the design matures. For example, the exact configuration of machined pockets has not
been defined in the two-dimensional, conceptual representation of the bulkhead
illustrated in Figure 7.9, page 209, but pocket sizing limits information is useful to the
designer/IPT as this aspect of the design is considered.
The third “Common” column in Tables 7.3 through 7.10 entitled “Technical
Process Rules and Preferences.” This column narrows the complete range of capability
limits specified in the previous column to only a smaller subset of preferences, and it also
provides general “rules of thumb” not stated in the previous “common” column.
For example, a machine may be capable of wide range of surface finishes, but the
preferred finish is nominal, i.e., some yet to be determined value (x). Similarly, as a
general rule, manufacturing prefers “looser” tolerances and to avoid “special processing”
(e.g. chemical milling, forming, plating, or heat treatment). Special processing are
processes that are not typically performed on all NC machined details. While preferences
are worthy to consider, if a design requires more complex processing, then the defined
limits in the previous “Technical Process Capabilities Limitations” suffices.
The last column in the tables, entitled “New,” describes the information required
to address new designs, and may contain a horizontal dashed line. The information above
the horizontal dashed line pertains to decision making related to new processes or
equipment utilized in-house. For example, when a new machine is purchased, it is
expected that manufacturing engineering performs tests on various complex patterns and
publishes the results of these tests electronically in a format accessible to outside users

228
and the DSS. In addition, for a design type of “bulkhead,” the “New” column designates
the manufacturing plan for a new 5-axis milling process includes a first-article test part.
The area below the horizontal dashed line in the “New” column pertains to vendor
data in the context of new equipment purchases, supplier process coordination, and
project coordination of “turnkey” jobs. In order to support early decision making,
technical vendor data should be systematically developed, organized, and maintained.
If design requirements exceed the capabilities limitations of existing in-house
processes, then effective decision making mandates the timely identification of new
equipment/processes and/or the identification of outside suppliers to manufacture the
design. If new equipment/process data and supplier data are not appropriately identified,
then the decision making process related to “new” requirements is inefficient. If the
manufacturing plan for a new product merely assumes “new requirements” can be
achieved without appropriate validation procedures, then it results in what Verganti
defines as “superficial anticipation.”
Now, the attention turns to the discussion of the “Manufacturing Selective
Anticipation Features” identified by work center in Tables 7.3 through 7.10. Since an
aircraft bulkhead is typically a first load item in an assembly sequence, the locating
features that are machined into the bulkhead by the “5-Axis” work center (Table 7.3) are
critical. (5-Axis is used instead of 5-Axis High Speed because the assumption is that the
majority of requirements can be met using the less expensive machines.) If locating
features are designed into the bulkhead, then it saves time in orienting subsequent
structural parts in the assembly load sequence, and it also improves quality related to
human error.

229
Similarly, the holes drilled in the “Specialty Hole Processing,” Table 7.4, have
these types of subsequent structural parts orientation implications. Holes in bulkheads
are typically used to:
• Pin-locate other structural detail designs
• Back-drill hole patterns in other structural designs
• Locate tools for drilling shared fastener patterns
Special processing requirements (Tables 7.7, 7.8, and 7.9) such as heat treatment,
plating, and forming are typically “requirement” critical. A work center process is
requirement critical when planning for tasks to be performed during fabrication and
making appropriate schedule allowances are the most important considerations. Even if
lower-level detail related to the specific special processing specifications cannot be
identified, the IPT should consider the basic requirement early on; this deliberation has
the potential to significantly improve schedule performance.
Similarly, identifying the requirement for electrical bonding, Table 7.6, is more
important than knowing exactly how much bonding surface is required or the exact
location on the design. The preference for performing electrical bonding is in Detail
Fabrication, (i.e., IDEF0 diagram Activity 7, Figure 2.7, page 56) as opposed to
Assembly (i.e., IDEF0 diagram Activity 8). When electrical bonding surface preparation
tasks are performed in Assembly, it typically requires more labor hours or has greater
impact on the critical path.
As mentioned earlier, Table 7.3 through 7.10 are not intended to discuss every
possible technical processing systems relationship and are offered for example purposes
only. These tables illustrate the types of technical processing information that require

230
consistent coordination and dissemination throughout the enterprise, and in particular to
the IPTs during conceptual design decision making.
Table 7.4 RIM-Diagram for Special Hole Processing Group: 2 of 9
R I M T, R, S
Manufacturing Capabilities by Work Center
COMMON Manufacturing Selective Anticipation Features
COMMON Technical Process Capabilities Limitations
COMMON Technical Process Rules and Preferences
NEW (FUTURE) In-house planning Vendor data
Drilling/Boring type 1
Hole processing type: Pinning hole Fastener pattern
Process holes during NC milling first based on rule TBD ------------------------ After milling and cleaning Before heat treat ---------------------- Processing envelope (PE) Material handling (MH) Hole process type Hole processing features: Hole dia tol Hole loc tol Hole depth
Looser tolerances preferred, but this may be a tooling plan critical process
----------------- Vendor data Equipment Process coordination Turn key
Drilling/Boring type 2
Same as Type 1 Same as Type 1 but different values
Same as Type 1 Same as Type 1
3-Axis (tooling holes)
Most bulkheads are first load items and require some type of tooling holes
Before plate milling After major milling Before heat treat ---------------------- PE MH Hole processing features Hole diameter tolerance (Hole dia tol) Hole location tolerance (Hole loc tol) Hole depth
Looser tolerances preferred, but this may be a tooling plan critical process
Requires coordination with tooling plan for assembly ---------------------- Vendor data Equipment Process coordination Turn key
Resources
Sequencing
Technical
Note: Group numbers and work centers are from lower-level CBS, Figure 7.4
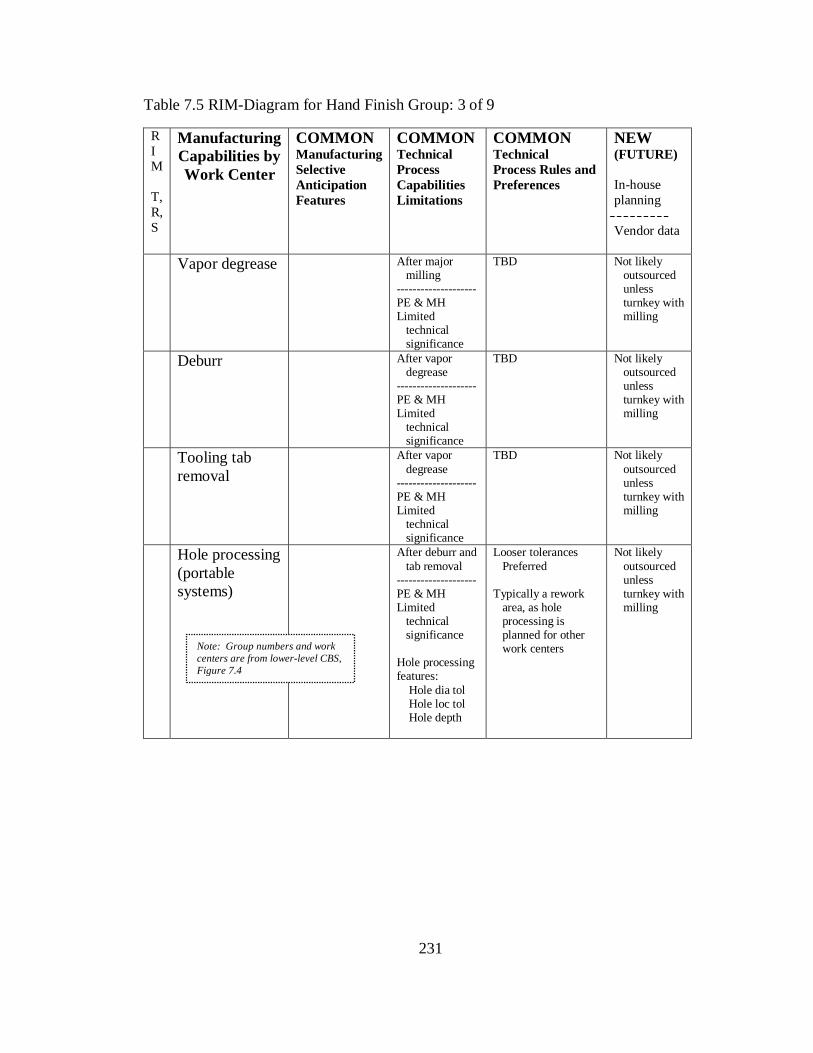
231
Table 7.5 RIM-Diagram for Hand Finish Group: 3 of 9
R I M T, R, S
Manufacturing Capabilities by Work Center
COMMON Manufacturing Selective Anticipation Features
COMMON Technical Process Capabilities Limitations
COMMON Technical Process Rules and Preferences
NEW (FUTURE) In-house planning Vendor data
Vapor degrease After major milling -------------------- PE & MH Limited technical significance
TBD Not likely outsourced unless turnkey with milling
Deburr After vapor degrease -------------------- PE & MH Limited technical significance
TBD Not likely outsourced unless turnkey with milling
Tooling tab removal
After vapor degrease -------------------- PE & MH Limited technical significance
TBD Not likely outsourced unless turnkey with milling
Hole processing (portable systems)
After deburr and tab removal -------------------- PE & MH Limited technical significance Hole processing features: Hole dia tol Hole loc tol Hole depth
Looser tolerances Preferred Typically a rework area, as hole processing is planned for other work centers
Not likely outsourced unless turnkey with milling
Note: Group numbers and work centers are from lower-level CBS, Figure 7.4

232
Table 7.6 RIM-Diagram for Coatings Group: 4 of 9
R I M T, R, S
Manufacturing Capabilities by Work Center
COMMON Manufacturing Selective Anticipation Features
COMMON Technical Process Capabilities Limitations
COMMON Technical Process Rules and Preferences
NEW (FUTURE) In-house planning Vendor data
Wash/Clean Before coatings ------------------------ PE & MH Requirement( Req) usually based on another process Limited technical significance
TBD Not likely outsourced unless turnkey with detail completion
Mask After major milling Before painting ------------------------- PE & MH Limited technical significance Req based on painting and electrical bonding
TBD Not likely outsourced unless turnkey with detail completion
Prime Before paint ------------------------- PE & MH Limited technical significance Req typically based on painting
TBD Not likely outsourced unless turnkey with detail completion
Paint Requirement After milling and specialty processing Process prior to inspection and stamping Limited technical significance ------------------------- PE & MH
During initial Detail Fabrication instead of returned later
Requires coordination with assembly plan ----------------- Vendor data Equipment Process coordination Turn key
Electrical bonding
Requirement After major milling After masking Before painting ------------------------- PE & MH Features: Bonded area Location tolerance
Looser tolerances Prefer templates Instead of tools During initial Detail Fabrication instead of returned later
Requires coordination with assembly plan ----------------- Vendor data Equipment Process coordination Turn key
Note: Group numbers and work centers are from lower-level CBS, Figure 7.4

233
Table 7.7 RIM-Diagram for Hardening and/or Special Treatment Group: 5 of 9
R I M T, R, S
Manufacturing Capabilities by Work Center
COMMON Manufacturing Selective Anticipation Features
COMMON Technical Process Capabilities Limitations
COMMON Technical Process Rules and Preferences
NEW (FUTURE) In-house planning ----------------- Vendor data
Wash/Clean Before special treatment ------------------- PE & MH Requirement usually based on another process Limited technical significance
TBD Not likely outsourced as stand- alone item
Heat treat Requirement Can be performed at various stages, but increases difficulty of other processes ------------------- PE & MH Process limits TBD
After major milling After hole processing After specialty processing During initial Detail Fabrication instead of returned later
Requires coordination with assembly plan ----------------- Vendor data Equipment Process coordination Turn key
Heat treat age Requirement Similar to Heat treat ------------------- PE & MH Process features TBD
Similar to Heat treat
Similar to Heat treat
Note: Group numbers and work centers are from lower-level CBS, Figure 7.4

234
Table 7.8 RIM-Diagram for Chemical Processing Group: 6 of 9
R I M T, R, S
Manufacturing Capabilities by Work Center
COMMON Manufacturing Selective Anticipation Features
COMMON Technical Process Capabilities Limitations
COMMON Technical Process Rules and Preferences
NEW (Future) In-house planning ------------------- Vendor data
Wash/Clean Before chemical processing ------------------------ PE & MH Requirement usually based on another process Limited technical significance
TBD Not likely outsourced as a stand-alone process
Annodize Requirement After milling Before hardening Can be performed at various stages, but increases difficulty of other processes -------------------------- PE & MH Process features: Area thickness Area thickness tol Area location tol
After major milling After hole processing After specialty processing During initial Detail Fabrication instead of returned later
--------------- Vendor data Equipment Process coordination Turn key
Chemical milling
Requirement Can be performed at various stages, but increases difficulty of other processes -------------------------- PE & MH Process features: Area thickness Area thickness tol Area location tol
TBD
---------------------- Vendor data Equipment Process coordination Turn key
Plating Requirement After milling Before hardening Can be performed at various stages, but increases difficulty of other processes ------------------------- PE & MH Features: Area thickness Area thickness tol Area location tol
After major milling After hole processing After specialty processing During initial Detail Fabrication instead of returned later
Vendor data Equipment Process coordination Turn key
Note: Group numbers and work centers are from lower-level CBS, Figure 7.4

235
Table 7.9 RIM-Diagram for Forming Group: 7 of 9
R I M T, R, S
Manufacturing Capabilities by Work Center
COMMON Manufacturing Selective Anticipation Features
COMMON Technical Process Capabilities Limitations
COMMON Technical Process Rules and Preferences
NEW (Future) In-house planning --------------------- Vendor data
Wash/Clean Before shot peening ------------------------- PE & MH Req usually based on another process Limited technical significance
Not likely outsourced as a stand-alone process
Shot peen Requirement Can be performed at various stages, but increases difficulty of other processes ------------------------- PE & MH Contour definition Features: Area thickness Area thick tol Area loc tol
After major milling After hole processing Before heat treat During initial Detail Fabrication instead of returned later
Test patterns and published results First article test part ----------------------- Vendor data Equipment Process coordination Turn key
Note: Group numbers and work centers are from lower-level CBS, Figure 7.4

236
Table 7.10 RIM-Diagram for Marking and Quality Assurance Groups: 8 and 9 of 9
R I M T, R, S
Manufacturing Capabilities by Work Center
COMMON Manufacturing Selective Anticipation Features
COMMON Technical Process Capabilities Limitations
COMMON Technical Process Rules and Preferences
NEW (FUTURE) In-house planning ----------------- Vendor data
Vibroengrave After plate mill After major milling Limited technical significance ----------------------- PE & MH Extra marking based on “fracture critical” requirement
NA
Stamp Last step before leaving Detail Fabrication Limited technical significance
NA
Plate inspection First step in processing sequence ------------------- Extra Inspection based on “fracture critical” requirement
NA Coordination of requirements ----------------- Coordination of requirements
Non-destructive inspection (NDI)
After major milling
NA Coordination of requirements ----------------- Coordination of requirements
Intermediate inspection
After special hole processing coatings, hardening or special treatment, chemical processing, forming
NA Coordination of requirements ----------------- Coordination of requirements
Final inspection
Last step in the processing sequence
NA Coordination of requirements ----------------- Coordination of requirements
Note: Group numbers and work centers are from lower-level CBS, Figure 7.4
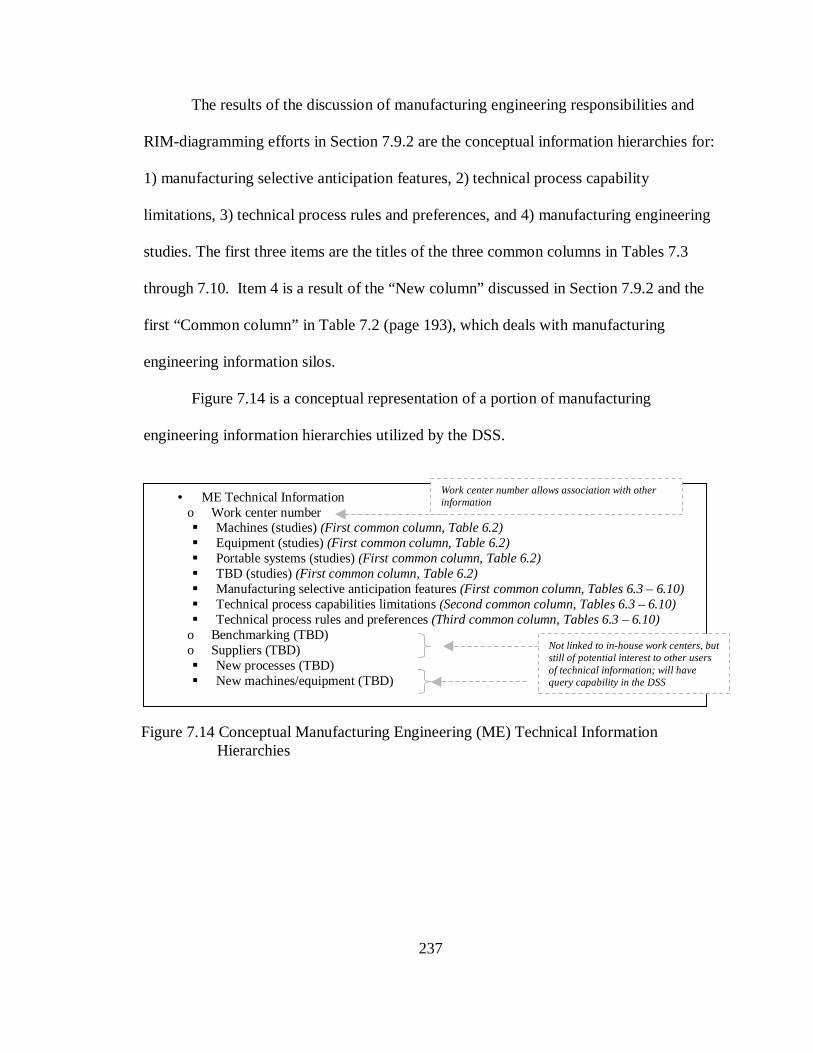
237
The results of the discussion of manufacturing engineering responsibilities and
RIM-diagramming efforts in Section 7.9.2 are the conceptual information hierarchies for:
1) manufacturing selective anticipation features, 2) technical process capability
limitations, 3) technical process rules and preferences, and 4) manufacturing engineering
studies. The first three items are the titles of the three common columns in Tables 7.3
through 7.10. Item 4 is a result of the “New column” discussed in Section 7.9.2 and the
first “Common column” in Table 7.2 (page 193), which deals with manufacturing
engineering information silos.
Figure 7.14 is a conceptual representation of a portion of manufacturing
engineering information hierarchies utilized by the DSS.
• ME Technical Information o Work center number ! Machines (studies) (First common column, Table 6.2) ! Equipment (studies) (First common column, Table 6.2) ! Portable systems (studies) (First common column, Table 6.2) ! TBD (studies) (First common column, Table 6.2) ! Manufacturing selective anticipation features (First common column, Tables 6.3 – 6.10) ! Technical process capabilities limitations (Second common column, Tables 6.3 – 6.10) ! Technical process rules and preferences (Third common column, Tables 6.3 – 6.10)
o Benchmarking (TBD) o Suppliers (TBD) ! New processes (TBD) ! New machines/equipment (TBD)
Figure 7.14 Conceptual Manufacturing Engineering (ME) Technical Information Hierarchies
Work center number allows association with other information
Not linked to in-house work centers, but still of potential interest to other users of technical information; will have query capability in the DSS

238
The conceptual framework presented in this research does not include the
information hierarchies required for RIM of the Assembly activity due to scope and
timeframe considerations. However, before continuing with further discussion related to
NC machining efforts, RIM-diagramming of assembly tasks are briefly discussed to
provide some insights as to the difficulty of the future effort. The discussion is based on
this author’s work experience and is relevant because typically the assembly load
sequence is the first information considered by the working level IPT because all
schedules are based on the delivery date of final assembly.
Table 7.11, offered on the next page, is based on the assumptions: 1) the assembly
of the design is performed in-house and 2) the “assembly processes” are those associated
with “mechanical subassembly.” Unlike “Detail Fabrication,” where a design is routed
through multiple work centers (i.e., processes), in Assembly, routing of a design is not
based on process, but product structure. One operator (or a group of operators) performs
“multiple assembly processes” in one work center until an “assembly” of the product
structure is completed. The design is typically routed to another work center for buildup
into the “next higher assembly” configuration, until it ultimately reaches final assembly.
Final assembly correlates to the “Airframe” level on the product structure in Figure 6.1
Assemblies are completed in multiple-series as structural details are located and
joined, i.e., not all drilling is performed, and then all fasteners installed. The structural
build-up series utilized is based on the concurrent consideration of assembly information,
such tolerance requirements, hole location requirements, material stack up thickness, and
fastener specification requirements.
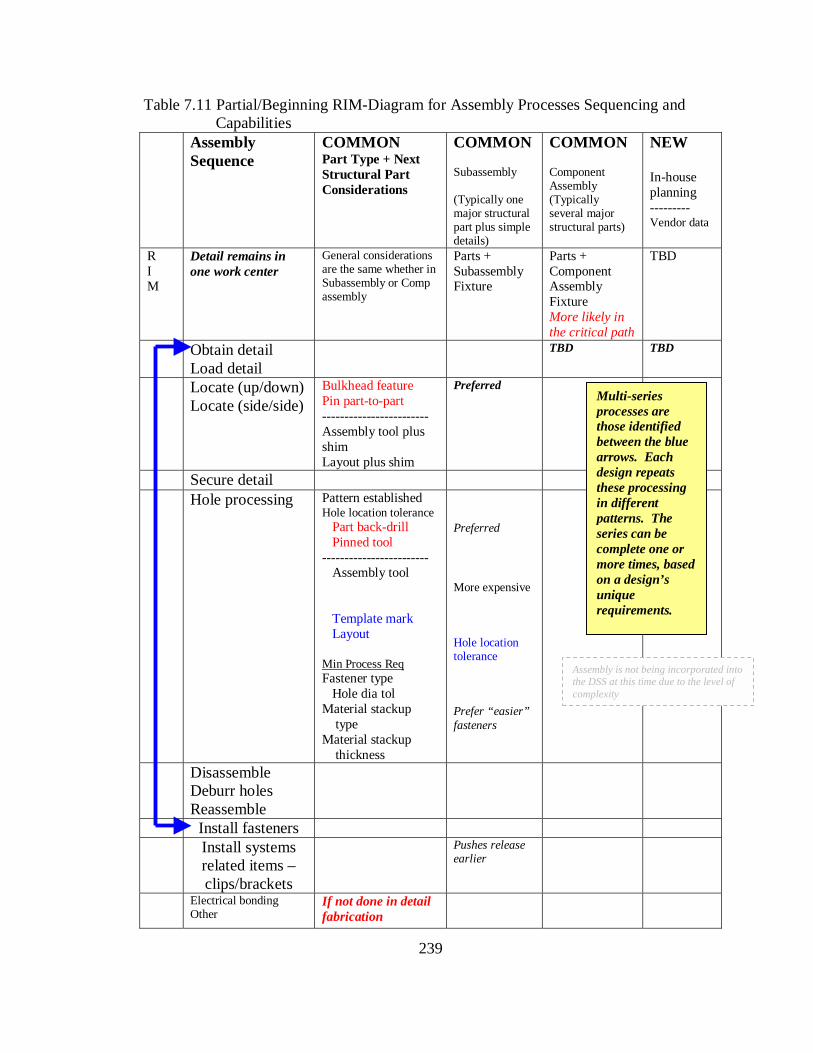
239
Table 7.11 Partial/Beginning RIM-Diagram for Assembly Processes Sequencing and Capabilities Assembly
Sequence
COMMON Part Type + Next Structural Part Considerations
COMMON Subassembly (Typically one major structural part plus simple details)
COMMON Component Assembly (Typically several major structural parts)
NEW In-house planning --------- Vendor data
R I M
Detail remains in one work center
General considerations are the same whether in Subassembly or Comp assembly
Parts + Subassembly Fixture
Parts + Component Assembly Fixture More likely in the critical path
TBD
Obtain detail Load detail
TBD TBD
Locate (up/down) Locate (side/side)
Bulkhead feature Pin part-to-part ------------------------ Assembly tool plus shim Layout plus shim
Preferred
Secure detail
Hole processing Pattern established Hole location tolerance Part back-drill Pinned tool ------------------------ Assembly tool Template mark Layout Min Process Req Fastener type Hole dia tol Material stackup type Material stackup thickness
Preferred More expensive Hole location tolerance Prefer “easier” fasteners
Disassemble Deburr holes Reassemble
Install fasteners Install systems
related items – clips/brackets
Pushes release earlier
Electrical bonding Other
If not done in detail fabrication
Multi-series processes are those identified between the blue arrows. Each design repeats these processing in different patterns. The series can be complete one or more times, based on a design’s unique requirements.
Assembly is not being incorporated into the DSS at this time due to the level of complexity

240
As discussed earlier in Section 7.5.1, it is unlikely all detail parts for a complex
component are loaded into an assembly fixture, drilled, and mechanically fastened all at
once due to tolerance considerations. In actuality, the addition of detail parts to an
assembly build-up is complex, and the correct sequencing of steps is the most difficult
aspect of modeling mechanical subassembly tasks. Due to this complexity, specific
assembly considerations are planned future work.
Table 7.11 provides additional insights with regard to a “manufacturing selective
anticipation feature” which has not been previously discussed, “Subassembly type.” If
the conceptual framework in Chapter 7 included a complete definition of the Assembly
activity (i.e., IDEF0 diagram Activity 8), then this “manufacturing selective anticipation
feature” would require identification and demonstration. “Subassembly type” is
necessary to address the various configurations (i.e., installation drawings) in which a
bulkhead is assembled. For example:
• Installation of nutplates or bushings to a bulkhead
• Buildup of a bulkhead subassembly in a floor-based fixture. Typically additional structural members are fastened to the bulkhead.
• Utilization of a bulkhead with other major structural parts in a component
assembly
• Utilization of a bulkhead with other major structural parts in a final assembly (i.e., aircraft buildup in one-fixture)
“Subassembly type” is designated as a “manufacturing selective anticipation
feature,” since manufacturing engineering is typically responsible for the manufacturing
plan and “manufacturing selective anticipation features” convey preferences to the
Engineering activity. However, when EBOM=MBOM (as stipulated in Section 7.3) the

241
members of the IPT are required to agree on the breakdown of installation drawings, or a
“drawing tree” of next assembly relationships.
Based on the previously defined “design selective anticipation features” in Figure
7.8, page 207, the information in the RIM-diagram in Table 7.11 has the most technical
significance with regard to subassembly.
In Detail Fabrication work centers (Figure 7.4, page 181) the CBS is nearly
synonymous with “process.” In that, a design in Detail Fabrication is moved from from
work center to work center (i.e., process to process). However, in subassembly/assembly
installation sequencing the design, in general, is not routed but remains for processing.
Hence, the work center CBS (Figure 7.3, page 180) in assembly typically
accommodates groups according to the product structure or type of design. For example,
an assembly work center designation may be “Forward subassembly” or “Bulkhead
subassembly.” The CBS designation within the Assembly activity depends on how
management wishes to organize similar task groups.
In the beginning RIM-diagram for assembly, Table 7.11, the reciprocal
interdependencies of “Technical, Resources, and Sequencing” are being considered
concurrently. The information presented in this diagram is based upon this author’s work
experience, as no literature could be located containing specific aircraft related
explanation.
The first column is titled “Assembly Sequence” and is similar to Detail
Fabrication process. The second column labeled “Common Part Type plus Next
Structural Part Considerations,” conveys that the NC machined bulkhead is a first load

242
item - and therefore already located/oriented utilizing the assembly fixture - and
considerations of the next structural part are being examined.
The first step that an operator performs is to “Obtain” the detail design, and then
“Load” the detail into the assembly fixture. The next step is to “Locate” the detail design
in the fixture in multiple directions. For simplicity, the locating process is listed as
up/down and side/side. There are multiple ways to locate a detail and the method
presented is for simplicity.
One way to “Locate” the next detail design is to use internal bulkhead features,
such as a shelf or stiffener. (Common aircraft nomenclature is discussed in Appendix B.)
For example, if a fuel floor is located using a shelf internal to a bulkhead, then the fuel
floor is positioned in one direction by being placed flush (i.e., net tolerances) against the
shelf. However, this action does locate/position the fuel floor in another direction. A
second method of locating the next structural detail in relation to a bulkhead is to utilize a
part-to-part pinning procedure. In order to pin-locate two detail structural parts, both
details must have tooling holes drilled during Detail Fabrication or just prior to the
locating procedure. These two methods are typically the most preferred methods.
A third method of locating the next detail in relation to a bulkhead is to utilize the
assembly fixture, and shim any remaining gap between the next structural detail and the
bulkhead. Lastly, the operator can manually layout the location of the second structural
detail manually, and shim as required. The last two methods are the least preferred
methods because they involve manual layout and shimming, which are more time
intensive and lead to increased quality issues.

243
The next step listed in the assembly sequence column is “Secure.” Securing
devices can be hand clamps, tooling clamps that are incorporated in the tool design, or
other devices. Securing steps are not typically technically difficult.
After the details are secured, the next step is “Hole processing.” There are two
primary considerations in hole processing, the establishment of the hole pattern and the
tolerances on hole location. One method for establishing a hole pattern is by using a pre-
drilled pattern on another detail part for back-drilling. Depending on the tolerance
requirements, a tooling hole may be required to locate one hole in the pattern. A second
method is the utilization of a pinned drill plate (tool). A third method for establishing the
hole pattern and maintaining appropriate tolerances is the use of a tool that is built into
the assembly fixture. Other methods include the operator making a template or laying
out the patterns by hand.
The minimum requirements for hole processing are typically found in the
specifications for the fastener to be installed in the hole. Hence, once the structural
design engineer has determined the preferred fastener(s), the fastener specification
information conveys the manufacturing minimum tooling requirements, provided the IPT
members understand these relationships. Other considerations are material stackup type
(e.g., aluminum-aluminum, aluminum-composite) and material stackup thickness.
Thicker stackups and complex stackups typically lead to more complex tooling and hole
processing systems.
The next processing steps are “Disassemble, Deburr, and Reassemble.” These are
self-explanatory, and are not technically difficult.

244
The next step in the assembly sequence depends on the requirements of the job. If
three detail structural parts share common fasteners, then the operator may stop here and
start the sequence over by obtaining another detail. Or, the operator may be able to
proceed to the installation of fasteners before adding more structural details to the
assembly. These nuances are why there is a blue arrow between “Obtain,” “Load,” and
“Install fasteners.” There are other complexities that vary from design to design that
dictate the number of times this series of steps is repeated. The discussion of these
complexities is planned for future research.
After “Install fasteners” comes “Install systems related items – clips/brackets.”
Typically, holes for clips and brackets are drilled and their fasteners installed after the
major structure is assembled. However, in some instances, these systems holes are
drilled in the same step as other structural fastener holes, and all fasteners are installed at
once. Again, it depends on other complexities, which is one of the reasons why assembly
RIM-diagramming is more complex than Detail Fabrication where the process
sequencing has easier to understand technical variations. The important thing for IPTs to
understand is if systems clips and brackets are planned for installation in subassembly,
then it pushes the Engineering activity (i.e., IDEF0 Activity 3, Figure 2.5, page 54) to
release the designs related to the clips and brackets earlier than would be required to
support a component assembly or final assembly installation.
The very last step in the assembly sequence is “Other.” Processes such as
electrical bonding, form-in-place gaskets, simple painting, etc., are typically the very last
tasks performed on a subassembly/assembly.

245
The fourth column of the partial assembly RIM-diagram deals with component
assembly. While it is possible that a major structural subassembly might not be on the
critical path, it is highly likely that a component assembly is on the critical path. The
reason for modularizing subassemblies is to remove make span from the critical path of
major assembly fixtures so that tasks may be performed in parallel. The rest of the partial
assembly RIM-diagram is intentionally left blank. The definition of Assembly related
decision making is not a part of this research, but is planned future work.
Now that assembly RIM-diagramming has been briefly discussed, it is time to
redirect the discussion back to Detail Fabrication.
The “Technical processing systems information” presented in the columns titled,
“Technical Process Capabilities Limitations” and “Technical Process Rules and
Preferences” of the RIM-diagrams in Tables 7.3 through 7.10 are similar to the
manufacturing engineering information that planners use to develop routing sequences
and work instructions. This knowledge is initially determined by manufacturing
engineering when the fabrication line is set up. An assumption of this research is
manufacturing engineering develops and maintains the work center relationships in
Tables 7.3 through 7.10 (i.e., process rules, process capabilities, and preferences) in a
computerized fashion accessible by the DSS. Similarly, it is assumed manufacturing
engineering develops and maintains manufacturing selective anticipation features by
work center. (The cultural and behavioral implications of this assumption is discussed in
a later section.)
A routing sequence by work center is the framework on which MES logic and
information is structured. In order to manage the reciprocal interdependencies existing

246
between the information in the MES from past designs and the new design being
considered by the IPT, a consistent, assumption-based model is needed to simulate the
fabrication planning/routing sequencing process that takes place after the design is
released (i.e., during the design phase). In addition, the fabrication planning/routing
sequencing simulation must initially require only the “design selective anticipation
features” in Figure 7.8, page 207. The assumption-based model is referred to as the
Feedforward Planning Model (FFPM) fabrication plan and is discussed in the next
section.
The use of a “pseudo-routing sequence/process plan” is not a new technique, and
this research is not suggesting that it is. The problem with current approaches is they are
ad hoc in nature, lack consistency, and are not part of an overall, well-defined procedure
that is useful to an IPT for multiple aspects of decision making. IPTs require a more
holistic view of the IDEF0 activities and the routing sequence is merely a small piece of a
very large information puzzle; a puzzle whose starting point is the “design selective
anticipation features.”
7.9.3 Beginning Framework of the Feedforward Planning Model (FFPM) Fabrication Plan
The complete complement of design information is not available during
conceptual design, so a methodology for generating a routing sequence and fabrication
plan cannot be utilized. However, the information gleaned from RIM-diagramming
efforts and the resulting conceptual hierarchies defined thus far supports the development
of a Feedforward Planning Model (FFPM) fabrication plan.

247
The inputs an IPT is expected to make to the DSS are presented in Figure 7.13
(page 222) and are repeated here in Figure 7.15 to improve presentation and discussion.
Based on IPT data entries/inputs of the “design selective anticipation features,”
the FFPM assumption-based fabrication plan for a NC machined bulkhead with these
features is selected by the DSS from information hierarchies of FFPM fabrication plans
developed and maintained by manufacturing engineering. The conceptual information
hierarchies are illustrated in Figure 7.16, and represent an addition to previously
presented Figure 7.14 (page 237).
Figure 7.15 Processing Category and Design Selective Anticipation Features for a Mechanically Fastened NC Machined Bulkhead - IPT Inputs/Entries in Blue and Bolded (Repeat)
Design Processing Category = NC Machining • Detail Type = Bulkhead o Material Type = n o Finished Weight (target) = w o Part Envelope
! Length (longest) = L ! Width (next longest) = W ! Depth (shortest) = D
o Surface area (two dimensional-one side, or 2D-1S) = SA o Service Life {= fracture critical} o Subassembly process = mechanical fastening

248
A conceptual FFPM assumption-based fabrication plan for a bulkhead is
presented in Table 7.12. An explanation follows the table.
• ME Technical Information o Work center number ! Machines (studies) (First common column, Table 6.2) ! Equipment (studies) (First common column, Table 6.2) ! Portable systems (studies) (First common column, Table 6.2) ! TBD (studies) (First common column, Table 6.2) ! Manufacturing selective anticipation features (First common column, Tables 6.3 – 6.10) ! Technical process capability limitations (Second common column, Tables 6.3 – 6.10) ! Technical process rules and preferences (Third common column, Tables 6.3 – 6.10)
o Benchmarking o Suppliers ! New processes ! New machines/equipment
o ME FFPM fabrication plans ! Complexity features explanations • Processing categories • Design selective anticipation features
• Design type • Material type • Finished weight (weight range) • Design envelope (size range) • Surface area • Service life • Subassembly process
Figure 7.16 Conceptual Manufacturing Engineering (ME) Technical Information Hierarchies (Modified from Figure 7.14)
ME information contains information to allow linkage via the RIM-based DSS with the PDMS, tool design and control system, the MES, etc.
Manufacturing engineering (ME) coordinates with the Fabrication activity ahead of need to develop FFPM fabrication plan/routing sequences by design type. These plans are updated and maintained by ME.

249
Table 7.12 Conceptual FFPM Fabrication Plan (Processing Sequence)
CBS WORK CENTER CBS PROCESSING DESCRIPTION
ASSUMPTIONS DESIGN TOOLS
Make/ Buy
CBS# Material receipt Material receipt -plate(s)
CBS# Plate inspection Plate inspection Both plates
CBS# Marking Vibroengrave Both plates
CBS# 3-Axis tooling holes Tooling holes Both plates Tool Code x
CBS# 3-axis milling Plate surface mill Both plates
CBS# 5-axis milling *1 Milling Trial Run Assume 5-Axis; 5-Axis High Speed is alternatve
Tool Code x
CBS# Vapor degrease Hand finish - clean
CBS# Deburr Hand finish - deburr
CBS# Remove tooling tabs Hand finish – tooling tabs
CBS# Mark Vibroengrave
CBS# Non-destruction inspection Quality assurance
CBS# 5-axis milling *1 Milling 2nd Run Line stop, 1,st or 2nd
CBS# Vapor degrease Hand finish - clean
CBS# Deburr Hand finish - deburr
CBS# Remove tooling tabs Hand finish – remove tooling tabs
CBS# Mark Vibroengrave
CBS# Non-destruction inspection Quality assurance
CBS# xxx (Proration) Drilling/Boring Type 1 Drilling/Boring Type 2
*2 Special hole processing Likely Tool Code x
CBS# 3-axis tooling holes *2 Tooling (or coordinated) holes Likely Tool Code x
CBS# Intermediate inspection Quality assurance
CBS# xxx (Proration) Hardening and/or Special Treatment Chemical processing Forming
*3 Other special processing
Not as likely; assumed due to risk
CBS# Electrical bonding Electrical bonding* Assumed until otherwise specified
CBS# Mask Mask Same as above
CBS# Prime Prime Same as above
CBS# Paint Paint Same as above
CBS# Final inspection Quality assurance
CBS# Mark Stamp
Most Likely Tools 4
COMPLEXITY FEATURES Requirement critical and schedule critical
*3 Heat treat
Same as above *3 Chemical milling Tool Code x
Same as above *3 Plating Tool Code x
Same as above *3 Annodize
Same as above *3 Forming Tool Code x
*2 Special hole processing & coordinated holes
If not done in fabrication, detail part goes down, but assembly cost goes up
Typically not schedule critical, in that, the design is already planned for milling Schedule setback allowances are measured in days and milling time is measured in hours
*1 Milling Technical capabilities are addressed prior to start using published capability limits and test patterns on the machine
Technical risk factors can be worked well in advance of design release
Possible additional tools = 3
Note: the actual work center number is associated with the CBS work centers numbers in Figure 7.4
Tool codes are linked via the Tool design classification and control system
Make or Buy status is discussed later and come from Make/Buy Policies conceptual information
All NC machined bulkheads are routed through the work centers listed in the top section of this table

250
Table 7.12 is beginning to resemble a combination of a project plan and a routing
sequence. The table contains a processing sequence by CBS, manufacturing assumptions
related to the process sequencing, and a general approach to handle first-article schedule
risk. This research assumes that manufacturing engineering organizes and defines
technical information and develops FFPM fabrication plans, which are coordinated with
the management of the Fabrication activity (i.e., IDEF0 Activity 7, page 56). Until the
IPT interjects and documents additional information or assumptions to justify changes,
the FFPM fabrication plan retrieved by the DSS for a design based on its “selective
anticipation features” is utilized. Having a pre-defined starting point facilitates computer
support of the decision-making process and assures information congruency between
decision makers.
The FFPM fabrication plan presented in Table 7.12 is not intended to be the “end
all” for fabricating an NC machined bulkhead but is intended for illustrative purposes
only. A premise/assumption conveyed in Table 7.12 is that a trial run is planned for the
first-article. (This type of assumption would be based on historical data and schedule
risks associated with missing the assembly load date of a bulkhead.) If the trial run is
successful, then the second detail is machined. If neither plate produces a production
design, then it is likely a line stop. Since bulkheads are typically first load items, when
they are late the entire assembly line schedule experiences negative schedule
performance impacts until a work-around plan is identified and implemented.
Another assumption in Table 7.12 is the utilization of the “5-Axis milling” work
center, as opposed to the “5-Axis milling high speed” work center. There are multiple
reasons why this assumption is valid; but the technical rationale is not as important as the
251
establishment of consistent assumptions that are clearly conveyed to decision makers.
Similarly, a trial run is part of the FFPM fabrication plan, and if the trial run is successful,
both plates are used to create details assignable to an aircraft.
“Manufacturing Selective Anticipation Features” relative to the “5-Axis Milling”
work center include internal design features (e.g., shelves, stiffeners, etc.) and holes to
locate other structure. These are the features most desired by manufacturing and are
previously identified in Table 7.3 - RIM-Diagram for NC Milling Group: 1 of 8, page
224. Similarly, the DSS utilizes manufacturing engineering information hierarchies
conceptually represented in Figure 7.16 to convey the importance of these features.
Since internal locating features have been used in the past, it is not unreasonable
to assume some complement of locating features is identifiable on the current design.
However, in order for this assumption to be realized, the IPTs working on other major
structural detail designs sharing common fasteners with the bulkhead must coordinate
with the bulkhead IPT to develop a plan for achieving the goal. The DSS cues the IPT
that these locating features are a priority, as bulkheads are typically the first designs
released.
“Special hole processing” and “Tooling (coordination) holes” are assumed in the
FFPM fabrication plan in Table 7.12 because of the likelihood of locating other structural
parts by referencing to the bulkhead and manufacturing’s desire to do so to reduce
assembly labor hours and/or tooling costs. Again, now that the “manufacturing selective
anticipation features” have been assumed, the designers working on structural details
sharing common fasteners with the bulkhead must ascertain a method to make this

252
anticipated opportunity a reality. The determination of the method is typically considered
in conjunction with assembly sequencing tasks.
If holes related to systems installations (i.e., clips, brackets, studs, etc.) are
identifiable, then they can be processed during these same hole processing steps as the
structural fastener holes. However, the identification of systems holes will not
significantly impact the detail fabrication hole processing labor hours or schedule; but
instead improve assembly installation costs. The schedule setback (makespan) for hole
processing work centers in detail fabrication is measured in days while the processing
time for most holes is in seconds. (Adding a few more to an estimate of labor hours
makes little difference once the work center is on the routing sequence and allowed for in
the schedule.) While manufacturing would prefer to drill holes related to systems
installations concurrently in the same work center with other structural fastener holes, the
main driver as to whether these tasks can occur concurrently is the coordination of the
design release schedules between structural designers and the associated systems
designers.
“Special hole processing” can be accomplished in multiple work centers, so a
placeholder is designated on the FFPM fabrication plan. Based on historical data, a work
center strategy is developed to prorate over multiple areas until the design becomes more
“firm.”
“Other special processing” is a placeholder at this time in Table 7.12, i.e., the
FFPM fabrication plan. It represents “Heat treat, Heat treat age, Chemical milling,
Forming, Plating, and Annodizing.” The preference is to avoid special processing but,
from a project planning perspective, it adds too much schedule risk to assume that no

253
special processing will be required until the design is more firm. Hence, a compromise is
needed for this item that is based on historical data. Initially, a prorated work center
strategy is used. (A proration strategy involves scheduling tasks across similar work
centers when it is uncertain as to which one specifically will be utilized.)
The baseline assumption is that “Electrical bonding” associated tasks are
performed in Detail Fabrication because it is more cost effective to mask off an area and
prevent it from being painted, as opposed to an operator sanding off the paint later prior
to systems installation. Electrical bonding is normally performed in areas where systems
designers have identified the need. Hence, coordination with designers working on
systems is required to avoid moving the entire task to the assembly area. If the IPT
decides that it is not reasonable to plan for electrical bonding surface preparation to be
accomplished on the bulkhead while in Detail Fabrication, then this step can be removed
from the FFPM fabrication plan by the IPT and added to the installation/assembly plan,
and ultimately the design drawing. Another consideration of the electrical bonding
surface preparation process is the tolerance on the location of the electrical bond surface.
The location tolerance should be relaxed enough for an operator to lay it out by hand, or
additional time will need to be planned into the schedule to utilize a tool. If a tolerance
on location requires tooling, then the tool design requirement and tool manufacturing
time will have to be allowed for in the schedule, and this will consequently push the
release of the installation drawing earlier.
The baseline plan in Table 7.12 assumes that “Mask, Prime, and Paint” are
performed while in Detail Fabrication. If a design is not going to be painted in detail
fabrication, then a specific plan for painting the detail must be determined well in

254
advance. Routing a major structural part from an assembly area to a detail design
painting work center is typically not preferred.
“Complexity” is discussed in the bottom section of Table 7.12, and coordinated to
the top section of the table with yellow highlighted numbers. The top section of Table
7.12 contains processes performed on all NC machined bulkheads, and the bottom section
contains processes performed only on some machined bulkhead. It is not enough to
discuss complexity as easy, average, or difficult because these are terms not directly
assignable to a specific CBS, process, tool, etc. without technical explanation. Instead,
“complexity” is discussed in terms of the CBS work centers (i.e., processing steps)
requiring the most diligent consideration.
The first type of complexity features is associated with “Milling” and is
highlighted with the number one. Milling complexity is addressed by utilizing published
capability limits and test patterns. Even though NC milling receives a great deal of
attention in the literature, the risks associated with NC milling can be mitigated with a
good test plan and by running test samples. The risks associated with failing to identify
locating features that assist with the assembly tasks are much more difficult to quantify.
The second type of complexity features deals with hole processing capability and
is highlighted with the number two. The importance of special hole processing has been
previously discussed in the context of RIM-diagramming. The third type of complexity
features deal with other special processing and is highlighted with the number three.
These five items are highlighted with the number three in the bottom section of Table
6.12, (i.e., Heat treat, Chemical milling, Plating, Annodize, and Forming) and are
“requirement critical” and “schedule critical.”

255
Two of the most common mistakes made by estimators are the oversimplification
of complexity and dealing of it on the basis of factors as opposed to the identification of
processing requirements. In addition, there is often the assumption that complexity is
bad or to be avoided, when in actuality, the nature of complexity is - it depends. A
design that is more complex to mill quite often has locating features that save assembly
time. Similarly, deferring holes from being drilled in fabrication makes the fabrication
cost decrease, but the assembly costs increase. In addition, if the design requires plating,
forming, or heat treatment for a valid technical reason, then it just does, and it not good or
bad per se. The most important consideration of complexity is that key decision makers
understand the technical need for the complexity and the implications to labor hours,
machine hours, and schedule setback.
The “Design Tools” column on Table 7.12 contains information extracted from
the previously defined tool classification and control system, i.e. the “Tool Code”
requirements by work center. Once the work center number is established for the routing
sequence, then the work center number provides the knowledge linkage to the tool
classification and control system data to estimate tool code requirements.
The estimating segment of the tool classification and control system contains
information by work center for the different types of tool codes historically required for a
similar design. Recall these estimating data from the bottom segment of Figure 7.11.
The conceptual DSS logic automatically interfaces the tool codes by work center
information and the beginning make or buy status of the design tool. For now, the make
or buy information is designated as a placeholder, x, in the “Make/Buy” column of Table
6.12. The make or buy information hierarchies are discussed later in Section 7.14.

256
The FFPM provided by the DSS to the IPT is a starting point only and a
framework of discussion. The IPT can keep the plan or edit as they see fit. Based on this
author’s work experience, it is far easier to engage individuals in editing a plan than
creating a plan from scratch. The important this is that the IPT will consider the tasks
required to make better decisions, and ultimately, those decisions will be stored in a work
center based format that other downstream users of information both recognize and
accept.
7.9.4 Recap of Decision Making Supported Thus Far
Before continuing further, it is important to recap the conceptual RIM-based
codification of information hierarchies discussed thus far. Recall from Chapter 1, page
32, codification involves the systematic classification and storage of knowledge to
address predefined questions and issues.
The relationships discussed thus far are offered in Figure 7.17. A partial section
of Table 7.12 is provided. In the first column is titled, “CBS work center number.” This
work center designation corresponds to a work center number assigned to the CBS work
center hierarchies in Figure 6.4. Typically work center numbers have both unique and
numerical narrative descriptors.
In order to improve understanding, a partial CBS work center description and
work center number identifier association is offered in Table 7.13.

257
Table 7.13 Examples of CBS Work Center Numbers
Group Cost Center Work Center Description in Figure 7.4
CBS Numerical Identifiers
NC Milling and Support
NC Milling 100
3-Axis milling 101
5-Axis milling 102
5-Axis high speed milling 103
Specialty Hole Processing 200
Drilling/Boring type 1 201
Drilling/Boring type 2 202
3-Axis tooling holes 203
Hand Finish 300
Vapor degrease 301
Deburr 302
Hole processing (portable systems)
303
Tooling tab removal 304
Coatings 400
Wash/Clean 401
Mask 402
Prime 403
Paint 404
Electrical bonding 405
Seal bonding 406
(others processed skipped)
Marking 800
Stamping 801
Vibroengrave 802
Detail Fabrication Quality Assurance
900
Plate inspection 901
(others processed skipped)

258
Des
ign
cont
rol n
um
ber:
xxx
xxxx
– x
xx
Pro
cess
ing
cate
gory
: N
C M
achi
ning
N
omen
clat
ure
(D
etai
l typ
e):
Bul
khea
d C
BS
Wor
k C
ente
r #
CB
S Pr
oces
sing
D
escr
iptio
n
Des
ign
Too
ls
Mak
e/B
uy
TB
D
Mat
eria
l rec
eipt
-pl
ate(
s)
901
Plat
e in
spec
tion
802
Vib
roen
grav
e
203
Too
ling
hol
es
Too
l cod
e X
101
Plat
e su
rfac
e m
ill
102
*1 M
illin
g T
rial
Run
T
ool c
ode
X
301
Han
d fi
nish
- c
lean
xxx
----
----
----
----
----
----
----
--
----
----
--
---
200*
*2
Spe
cial
hol
e pr
oces
sing
T
ool c
ode
X
203
*2 T
oolin
g (c
oord
inat
ed)
ho
les
Too
l cod
e X
xxx
----
----
----
----
----
----
----
--
----
----
--
---
801
Stam
p
Tab
le 7
.12
Fram
ewor
k of
the
FFPM
Fab
rica
tion
Pla
n (S
egm
ent o
nly)
Fig
ure
7.17
R
ecap
of
DS
S C
once
ptua
l RIM
-Bas
ed C
odif
icat
ion
Dis
cuss
ed in
Sec
tions
7.0
Thr
ough
7.9
Figu
re 7
.4 L
ower
-Lev
el C
BS
Info
rmat
ion
Hie
rarc
hies
for
Det
ail F
abri
cati
on
• D
etai
l Fab
rica
tion
o
Com
posi
tes
Fabr
icat
ion
!
TB
D (
hier
arch
ies
not d
efin
ed o
r di
scus
sed)
o
Shee
t Met
al F
abri
catio
n
• T
BD
(hi
erar
chie
s no
t def
ined
or
disc
usse
d)
o
NC
Mill
ing
and
Supp
ort
[Gro
up 1
of
9]
! N
C M
illin
g
• 3-
Axi
s m
illin
g (w
ork
cent
er le
vel)
•
5-A
xis
mill
ing
•
5-A
xis
high
spe
ed m
illin
g
! Sp
ecia
lty H
ole
Proc
essi
ng (
Equ
ipm
ent)
[G
rou
p 2
of 9
] •
Dri
lling
/Bor
ing
type
1 (
wor
k ce
nter
leve
l)
• D
rilli
ng/B
orin
g ty
pe 2
•
3-A
xis
(too
ling
hole
s)
! M
inor
Sub
asse
mbl
y fo
r N
C M
achi
ned
Part
s [N
ot d
iscu
ssed
] •
Hol
e pr
oces
sing
(w
ork
cent
er le
vel)
•
Bus
hing
inst
alla
tion
•
Nut
plat
e in
stal
lati
on
! H
and
Fini
sh [
Gro
up 3
of
9]
• V
apor
deg
reas
e (w
ork
cent
er le
vel)
•
Deb
urr
• H
ole
proc
essi
ng (
port
able
sys
tem
s)
• T
ooli
ng ta
b re
mov
al
o
Coa
ting
s [G
roup
4 o
f 9]
! W
ash/
Cle
an (
wor
k ce
nter
leve
l)
! M
ask
!
Prim
e !
Pain
t !
Ele
ctri
cal b
ondi
ng
! Se
al b
ondi
ng (
not d
iscu
ssed
) o
Har
deni
ng a
nd/o
r Sp
ecia
l Tre
atm
ent [
Gro
up 5
of
9]
! W
ash/
Cle
an (
wor
k ce
nter
leve
l)
! H
eat t
reat
!
Hea
t tre
at a
ge
o
Che
mic
al P
roce
ssin
g [G
roup
6 o
f 9]
! W
ash/
Cle
an (
wor
k ce
nter
leve
l)
! C
hem
ical
mil
ling
! A
nnod
ize
! Pl
atin
g o
Form
ing
[Gro
up 7
of
9]
! W
ash/
Cle
an (
wor
k ce
nter
leve
l)
!
Shot
pee
n o
Mar
king
[G
rou
p 8
of 9
] !
Stam
ping
(w
ork
cent
er le
vel)
!
Vib
roen
grav
e •
Det
ail F
abri
cati
on Q
ualit
y A
ssur
ance
[G
rou
p 9
of 9
] o
Plat
e in
spec
tion
o
Inte
rmed
iate
insp
ecti
on
o
Non
-des
truc
tive
test
ing
o
Fina
l ins
pect
ion
o
TB
D
•
CB
S W
ork
Cen
ter
(WC
) D
ata
o W
C n
umbe
r o
WC
loc
atio
n o
WC
layo
ut
o W
C P
roce
ss d
escr
ipti
ons
o W
C W
orke
r cl
assi
fica
tion
s o
WC
Pro
cess
ing
syst
em in
form
atio
n !
WC
mos
t-u
sed
Mat
eria
l &
Pro
cess
es
(M&
P)
spec
ific
atio
ns
! W
C N
on-d
esig
n to
ols
inve
ntor
y !
WC
Equ
ipm
ent i
nven
tory
•
Cor
rela
ted
to f
eatu
res
(TB
D)
Fig
ure
7.5
Info
rmat
ion
Sil
os i
n T
able
7.2
Cor
rela
ted
to C
once
ptua
l
Inf
orm
atio
n H
iera
rchi
es
Figu
re 7
.7 I
nfor
mat
ion
Hie
rarc
hies
for
Des
ign
Proc
essi
ng C
ateg
orie
s
•
Des
ign
Proc
essi
ng C
ateg
orie
s
o
Shap
ing
! Fo
rgin
g +
Mac
hini
ng
! N
C M
achi
ning
!
Shee
t Met
al F
abri
catio
n !
Com
posi
tes
!
Oth
er (
TB
D)
o
Mec
hani
cal
Ass
embl
y o
Ele
ctri
cal H
arne
sses
and
Cab
les
(E
lect
rica
l)
o
Tub
ing
and
Duc
ts (
Plum
bing
) o
TB
D
Fig
ure
7.13
Des
ign
Sel
ecti
ve A
ntic
ipat
ion
Fea
ture
s fo
r a
Mec
hani
call
y
Fas
tene
d N
C M
achi
ned
Bul
khea
d (I
PT
Inp
uts
in
Blu
e B
old)
IPT
Sel
ecti
on D
esig
n P
roce
ssin
g C
ateg
ory
= N
C M
achi
ning
•
Det
ail
Typ
e =
Bul
khea
d o
Mat
eria
l Typ
e =
n o
Fin
ishe
d W
eigh
t (t
arge
t) =
w
o
Par
t Env
elop
e !
Len
gth
(lon
gest
) =
L
! W
idth
(ne
xt lo
nges
t) =
W
! D
epth
(sh
orte
st)
= D
o
Sur
face
are
a (t
wo
dim
ensi
onal
-one
sid
e, o
r 2D
-1S)
= S
A
o
Ser
vice
Lif
e {=
frac
ture
cri
tica
l}
o
Sub
asse
mbl
y pr
oces
s =
mec
hani
cal f
aste
ning
Fig
ure
7.11
Too
l C
lass
ific
atio
n an
d C
ontr
ol S
yste
m I
nfor
mat
ion
Hie
rarc
hies
• D
esig
n to
ol c
lass
ific
atio
n an
d co
ntro
l nu
mbe
r o
Seri
al n
umbe
r o
Des
ign
tool
cod
e (n
ame/
type
) o
Tool
sel
ectiv
e an
ticip
atio
n fe
atur
es (
TB
D)
o
Whe
re u
sed
(CB
S w
ork
cent
er n
umbe
r)
o
Des
ign
cont
rol
num
ber
refe
renc
e (p
art n
umbe
r )
! D
esig
n ty
pe
! D
esig
n m
ater
ial t
ype
! D
esig
n fi
nish
ed w
eigh
t !
Des
ign
part
env
elop
e !
Des
ign
surf
ace
area
(2D
-1S)
!
Des
ign
serv
ice
life
{ca
tego
ry}
o
Too
l con
trol
num
ber
refe
renc
e (i
f too
l-to
-mak
e-to
ol)
! To
ols-
to-m
ake-
tool
s se
lect
ive
antic
ipat
ion
feat
ures
(TB
D)
o
Plac
ed i
n se
rvic
e da
te
o
In-h
ouse
man
ufa
ctur
ed
! T
ool
desi
gn h
ours
by
tool
cod
e !
Too
l m
anuf
actu
ring
hou
rs b
y to
ol c
ode
! D
irec
t m
ater
ial d
olla
rs [
base
yea
r (B
Y)
doll
ars]
o
Purc
hase
d to
ols
! V
endo
r by
tool
cod
e !
Unb
urde
ned
purc
hase
dol
lars
(B
Y)
• T
ool
esti
mat
ing
data
(hi
stor
ical
ave
rage
s)
o
Too
l cod
e
• W
here
use
d (w
ork
cent
er n
umbe
r) o
ccur
renc
e •
In-h
ouse
man
ufa
ctur
ed
o
Too
l des
ign
hour
s o
Too
l man
ufac
turi
ng h
ours
o
Dir
ect
mat
eria
l do
llars
[ba
se y
ear
(BY
) do
llar
s]
• P
urch
ased
tool
s o
Ven
dor
o
Unb
urde
ned
purc
hase
dol
lars
(B
Y)
•
ME
Tec
hnic
al In
form
atio
n
o W
ork
cent
er n
umbe
r !
Mac
hine
s (s
tudi
es)
!
Equ
ipm
ent (
stud
ies)
!
Por
tabl
e sy
stem
s (s
tudi
es)
!
TB
D (
stud
ies)
!
Man
ufac
turi
ng s
elec
tive
ant
icip
atio
n fe
atur
es
! T
echn
ical
pro
cess
cap
abili
ty l
imit
atio
ns
! T
echn
ical
pro
cess
rul
es a
nd p
refe
renc
es
o B
ench
mar
king
o
Supp
lier
s !
New
pro
cess
es
! N
ew m
achi
nes/
equi
pmen
t o
ME
FF
PM
fabr
icat
ion
plan
s !
Com
plex
ity fe
atur
es e
xpla
nati
ons
• P
roce
ssin
g ca
tego
ries
•
Des
ign
sele
ctiv
e an
tici
pati
on fe
atur
es
• D
esig
n ty
pe
• M
ater
ial t
ype
• F
inis
hed
wei
ght
(wei
ght
rang
e)
• D
esig
n en
velo
pe (
size
ran
ge)
• Su
rfac
e ar
ea
• Se
rvic
e li
fe
• Su
bass
embl
y pr
oces
s
Fi
gure
7.1
6 C
once
ptua
l Man
ufac
turi
ng E
ngin
eeri
ng (M
E)
Tec
hnic
al
Inf
orm
atio
n H
iera
rchi
es (
Mod
ifie
d fr
om F
igur
e 7.
14)
CO
DIF
ICA
TIO
N S
TRA
TE
GIE
S R
ecip
roca
l int
erde
pend
enci
es a
re m
anag
ed v
ia r
elat
iona
l co
ncep
tual
info
rmat
ion
hier
arch
ies
quer
ies
by:
1)
Info
rmat
ion
hier
arch
ies
(dat
abas
es)
2)
FF
PM
Fab
rica
tion
Pla
n
3)
CB
S w
ork
cent
er n
umbe
r
•
EB
OM
o
WB
S
o SW
BS
o
Des
ign
cont
rol n
umbe
r o
Nom
encl
atur
e o
Des
crip
tion
o N
ext
asse
mbl
y o
Des
ign
sele
ctiv
e an
tici
pati
on f
eatu
res
! D
etai
l typ
e =
bul
khea
d •
Mat
eria
l typ
e •
Fini
shed
wei
ght
(tar
get)
•
Part
env
elop
e {L
, W, D
} •
Surf
ace
area
(2D
-1S
) •
Serv
ice
life
•
Suba
ssem
bly
proc
ess
! D
etai
l typ
e (T
BD
) •
Bas
ed o
n de
tail
type
•
Bas
ed o
n de
tail
type
•
TB
D
• E
lect
roni
c re
pres
enta
tion
s •
Pro
cess
ing
cate
gori
es d
efin
ition
s (u
sed
by D
SS)
• M
ater
ials
and
pro
cess
es (
M&
P)
spec
ific
atio
ns
• M
ater
ials
and
pro
cess
es (
M&
P)
mat
eria
l cod
es
• S
tand
ard
part
s •
TB
D
Figu
re 7
.10
PD
MS
Con
cept
ual I
nfor
mat
ion
H
iera
rchi
es
CB
S w
ork
cent
er n
umbe
rs a
re
asso
ciat
ed w
ith
wor
k ce
nter
de
scri
ptio
n A
rrow
s hi
ghli
ght i
mpo
rtan
t re
lati
onsh
ips

259
Figure 7.17 provides a representation of the reciprocal interdependencies
managed thus far. The RIM-based FFPM facilitates the communication of a consistent
baseline of assumptions for manufacturing a new design. In addition, if a member of an
IPT does not have a wide range of experience, the DSS potentially provides a wealth of
information to “educate/train” the user with respect to processes information,
specifications, tools, and equipment.
Recall from Chapter 5 (Section 5.2) the types of decisions the IPT members are
required to make. The information developed thus far supports many potential IPT
decisions. For example, the planner and the manufacturing engineer assigned to an IPT
can begin to forecast how many tool orders, tool designs, and work instructions packages
are likely required. The IPTs are also cued to focus on which designs require close
coordination, in particular, the detail parts potentially located in reference to the design in
question or share common fasteners with the design in question.
Another example would involve the identification of a “design selective
anticipation feature” that was outside of the capabilities limits maintained by
manufacturing engineering. The “new” equipment, processes, and supplier information
provide a good source of preplanning knowledge to begin identifying opportunities for
new technology insertion.
Before moving on to the next section, it is necessary to recap the information
development thus far in the context of the RIM-based knowledge construction yet to be
defined. Previously provided Figure 7.12 (page 217) is updated as Figure 7.18 to show
defined segments color-coded in black and yet to be defined segments in blue italics.

260
The “Feedforward Planning Model” will not be colored in black until the reciprocal
interdependencies “Resources” and “Sequencing” are developed.
• Design Processing Categories (Section 7.7) o Product Data Management System (EBOM/Product Structure) (Section 7.3; 7.8.2) ! Features [Features DesignSelectiveAnticipation (Mfg) + Features ManufacturingSelectiveAnticipation (Design)] (Section 7.8.1; Figure 7.8) (Section 7.9.2)
• Feedforward Planning Model (FFPM) o CBS Work Centers (Section 7.4.2) ! Technical processing systems information
• M&P standards and specifications by work center (Section 7.6) • Equipment inventory (Section 7.8)
o Equip specs correlated to Features DesignSelectiveAnticipation (Mfg) + Features ManufacturingSelectiveAnticipation (Design) + FeaturesDesignOther(Mfg) • Manufacturing Engineering studies by work center (Section 7.6) • Specific processing capabilities limits [FeaturesDesignSelectiveAnticipation(Mfg)
FeaturesManufacturingSelectiveAnticipation(Design)] (Section 7.9) • Design specific tooling used on past designs (historical data by product by type, i.e., part of tool classification and control system) (Section 7.8.2)
o Tool codes (Tool Type; Features DesignSelective anticipation (Mfg) ) o Tools to make tools on past designs ! Tool features (Will not be addressed)
• Non-design specific tools (located in the areas, such as portable hole processing systems) inventory (Section 7.6)
! Resources (management strategy) (overhead not discussed) • Direct labor hours (touch) (Section 7.10) • Machine hours (Section 7.10) • Direct labor hours (other) (Section 7.10) • Procurement dollars (Section 7.10)
! Sequencing (scheduling/availability) • Sequence decisions based on the management of existing requirements
(already planned for other products) (Section 7.11) o Labor hours by shift by timeframe (Section 7.11) o Machine hours by shift by timeframe (Section 7.11)
• Technical sequencing considerations linked with the Master Schedule (internal scheduling) (Section 7.12)
• Sequencing decisions based on management of new requirements by work center (incomplete designs) (Section 7.13)
Figure 7.18 RIM Development Conceptual Framework (Update of Figure 7.12)
#1
#2
#3
Highlighted numbers refer to capability
contexts discussed in Section 6.5.

261
Figure 7.18 provides a means of organizing the development of the conceptual
framework within the previously defined contexts of “capability,” (i.e., technical,
resources, and sequencing). It is not to be confused with the designation of conceptual
information hierarchies for the purposes of codification - Figure 6.16 is offered for that
purpose.
In the next section, the segment of Figure 7.18 titled “Resources” is developed.

262
7.10 Resources
In this section the approach for developing the information hierarchies of the
“Resources” segment of Figure 7.18 are offered. First, feedforward planning concepts
from Verganti’s study are discussed. Next, RIM concepts are used to identify the
potential problems with current approaches and opportunities for common knowledge
exchange. Finally, the framework utilized by the conceptual DSS is presented for direct
labor and machine hours, direct labor (other/non-touch), procurement dollars, and
dollarization of resources using rates. (Dollarization is used in the context of real dollar
pricing and includes conversions related to base year dollars, then year dollars, inflation,
and currency conversion for contractual or financial reporting.)
7.10.1 Feedforward Planning Concepts from Verganti’s Study of Teaming/IPTs
In Verganti’s study, at least two concepts are pertinent to the “Resources” aspects
of feedforward planning: early process engineering and superficial anticipation. These
concepts and related aircraft manufacturing implications are discussed in the next two
sections.
7.10.1.1 Early Process Engineering
Verganti’s study reveals the anticipation of constraints and opportunities entails
collection and organization of large amounts of information - in particular information
related to process engineering and manufacturing. In the context of teaming and
feedforward planning, several companies performed these tasks well; but most fell short
in transferring early decisions to subsequent users of information. Subsequent users of
263
information typically start over and develop ad hoc information to support decision
making because the information needed for decision making is not made available from
upstream developers/users.
As discussed in Chapter 5, page 115, an employee of Raytheon published a report
on IPT utilization. (Rickman, 2001.) This document states that in order to get an
“understandable and achievable” (it is assumed the author meant task-oriented) schedule
and cost for their products, IPTs had to develop and take responsibility for meeting
schedule and cost targets. Schedule and cost targets both utilize resource estimates of
direct labor and machine hours as primary building blocks of information. The IPTs at
Raytheon were required to generate low-level tasks and associated resource requirements
to make schedules easier to manage and more accurate.
Rickman’s report implies that even though programmatic schedules and cost
estimates had already been developed, they were not in a format IPTs could use
effectively. Hence, the transfer of knowledge from Business Management estimating and
proposal activities to the IPTs did not occur.
Based on this author’s work experience, another type of transfer typically does
not take place. Once IPTs develop information, it is not transferred to the manufacturing
execution system (MES), and conversely, information from past endeavors stored within
the MES does not feedforward to the IPTs. The labor and machine hours requirements
used to manage shop floor activities is generated by the MES work measurement system
– not from IPT estimates. There is, for all practical purposes, no direct link between the
work measurement system values and IPT values.

264
7.10.1.2 Superficial Anticipation
Verganti’s study reveals another problem associated with ineffective feedforward
planning, superficial anticipation. Superficial anticipation occurs when decisions rely
heavily upon undocumented assumptions. Verganti reports most that enterprises who are
successful in feedforward planning efforts incorporate checkpoints along with the
teaming/concurrent engineering process in order to verify completeness of upstream
solutions for downstream users. Once the checkpoints are verified, solutions are not
allowed to change without going through a traceable change process.
The Raytheon experience documented by Rickman (2001), as well as this author’s
experience, supports the assertion that superficial anticipation takes place in the defense
industry. If a baseline of checkpoints had been established, then IPTs would not be
required to “start over” in their assessment for resources management. Further, Wynn et
al. (2005) presents the results of a six-month study conducted by Massachusetts Institute
of Technology to identify the root causes of poor performance in defense acquisition
programs. The findings indicate three major problems exist, which correlate to
Verganti’s definition of superficial anticipation: 1) the inability to breakdown planned
work to be accomplished and correlate to estimates of cost and schedule, 2) scope creep
due to poorly defined baselines, and 3) measurement systems’ inability to generate the
necessary feedback for corrective action.

265
7.10.2 RIM-Diagramming of Labor and Machine Hours
This section offers a RIM-diagram (Table 7.14) that highlights some issues
related to the development of direct labor and machine hours information. Discussion
discussed follows the presentation of the RIM-diagram.

266
Table 7.14 RIM-Diagram for Resources (Labor and Machine Hours) Labor and Machine Hours
COMMON Conceptual
COMMON Conceptual/ Preliminary
COMMON Detail (First-Article)
COMMON Detail (Production)
NEW In-house ---------- Suppliers
TECHNICAL Developer
Business Mgmt estimating
IPTs Factory Mgmt MES
Factory Mgmt MES
ME, WM ----------- TBD
Goals
Cost engineering Requirements development (limited mgmt)
Requirements development and mgmt
Process management
TBD
Focus Estimating focus IPT project requirements focus
Task focus at CBS level Schedule control Hours control Schedule reduction focus
Task focus at CBS level Schedule control Hours control Hours reduction focus
TBD
Tools Parametrics CERs Models
Type 2 standards (CBS work center averages)
Type 1 standards Feature-based system applied at CBS level
WM studies
Type of estimate Focus on “did take”
Focus on “should take”
Focus on “should take”
TBD
Learning curves Learning curves
No learning curves
No learning curves
TBD
Factors Efficiency factors (high-level)
Efficiency considered at CBS work center level for personnel forecasting
Efficiency considered at CBS work center level for personnel forecasting
TBD
RESOURCE (organization of information)
High-level Department and/or CBS
Detailed; must include all CBS work centers
Detailed; must include all CBS work centers
Must identify new CBS work centers
SEQUENCING
Process internal (overlaps with
process technical) Process-to-process
(overlaps with process technical)
Availability (scheduling)
Buried in CERs or estimating spreads Buried in CERs or estimating spreads Assumed
Work measurement studies MES capacity planning system once requirement is identified
Work measurement studies MES capacity planning system once requirement is identified
Work measurement studies MES logic changes
N O T
W E L L
D E F I N E D
Knowledge from detail design systems to IPT

267
The RIM-diagram is organized into six columns. The first column deals with the
RIM categories of technical, resource, and sequencing as in other RIM-diagrams.
The second column is titled, “COMMON Conceptual.” This column designates
the relevance of commonality information in the context of direct labor and machine
hours during conceptual design, in particular the time when the original bid is developed.
The third column is titled, “COMMON Conceptual/Preliminary.” This column
specifies the implications of commonality information in the context of direct labor and
machine hours during conceptual design when working-level IPTs begin to be utilized as
well as the preliminary design phase.
The fourth column is titled, “COMMON Detail (First-Article).” This column
designates the application of commonality information in the context of direct labor and
machine hours during the detail design phase, in particular the manufacturing of the first-
article.
The fifth column is titled, “COMMON Detail (Production).” This column
designates the implications of commonality information in the context of direct labor and
machine hours during the detail design phase, in particular the manufacturing of units
beyond the first-article.
The sixth column is titled, “NEW.” It designates the labor and machine hours
information that are required to make decisions on totally new processes to be done in-
house or by suppliers. Before reviewing the “Common” columns on the RIM-diagram,
the “New” column is first discussed.
If a “new” requirement is identified, then a plan is needed (i.e., preplanning
knowledge) for addressing the new requirement. As discussed earlier in Section 7.9,

268
enterprises typically successful in feedforward planning also dedicate considerable effort
to developing “preplanning knowledge.” There are many tasks an IPT could perform that
do not require a finished design; but individual IPT members quite often do not realize
their accomplishment is necessary or possible. The envisioned DSS provides a checklist
of tasks for IPTs to consider, and the checklist constitutes a significant step toward
automating “preplanning knowledge.” If the overall plan assumes these “new” processes
can be found in the absence of appropriate preplanning knowledge, then the result is
superficial anticipation.
The technical aspects of “new” processes and the role of manufacturing
engineering are discussed earlier in Section 7.9. In Section 7.10, the role of work
measurement studies is discussed. In order to make a meaningful decision with regard to
new processes, the work measurement group should be brought into the discussions to
develop appropriate information earlier in the decision making process. (Jiao and Tseng,
1999.) Based on this author’s work experience, the work measurement group is typically
not involved until a manufacturing job (i.e., routing/planning sequence) is loaded into the
MES and standard data are often not developed for “new” processes until production. In
other words, the decisions related to the selection of “new” processes are made before a
complete work measurement analysis has been performed.
If a “new” process is to be performed in-house, then a great deal of preplanning
effort is necessary in order to bring the process online efficiently. Examples of questions
best addressed by the IPT in advance include:
• Will the process be incorporated into an existing CBS work center or is an entirely new work center needed?

269
• Are special security clearances or worker classifications required?
• How much floor space and how many personnel?
In addition, if a new CBS work center is required, then it leads to the necessity for
multiple systems changes. Examples of changes include:
• The cost ledger (cost accounting logic) within the Business Management activity • Routing logic within the Planning activity
• Scheduling, pricing, and performances logic within the MES
• Work measurement application logic for generation of standard values
• Factory Management tables that control personnel, capacity, performance reporting, etc.
Based on this author’s work experience, many IPT members - and even project
managers - do not fully understand the level of detailed effort required to successfully
load and monitor a job order in the MES.
If a “new” process is to be performed by a vendor, then a determination has to be
made as to whether any in-house direct labor hours will be required to support receipt of
the detail design. In addition, the details of how a new vendor is incorporated into
enterprise systems have to be worked out in advance.
Next, a discussion of information in the “Common” columns is offered. The first
row of “Technical” information is titled “Developer.” These parties are involved in
estimating labor and machine hours for decision making. The first developer (Common
Conceptual column) of resource information during conceptual design is the estimating

270
group within the Business Management activity (i.e., Chapter 2, IDEF0 Activity 1, Figure
2.4, page 53).
Continuing to move across the row, the next developers (Common
Conceptual/Preliminary column) are the IPTs. The IPTs become responsible for the
resources information during conceptual design, and continue to be responsible during
preliminary design. It can be argued that “super IPTs” actually develop the cost
estimates prior to contract award (as discussed in Chapter 5, Section 5.1) as opposed to a
Business Management estimating group developing the estimates without assistance from
other activities on the IDEF0 diagrams; but this distinction really does not matter. At
some point in the process, when tasks are segmented to working-level IPTs, the problems
discussed earlier with information exchange exist.
The next “developer” (Common Detail First-Article column) is the Factory
Management manufacturing execution system (MES). When a job/order is released to
the MES, it goes through a job scheduling and pricing (work measurement) routine
typically not influenced by any prior IPT decision making. The work measurement
system assigns standard hours and the scheduling system assigns CBS load dates based
on pre-determined routines.
The next “developer” (Common Detail Production column) is also designated as
the Factory Management MES. This additional column is added to make the distinction
between what typically happens on the first-article and what happens later on during
production.

271
The last “developer” in column six is designated as manufacturing engineering
(ME) and the work measurement (WM) group for in-house “new” processes and TBD for
“new” processes performed by suppliers.
The second row under “Technical” is designated as “Goals.” The goal of
Business Management is typically “cost engineering.” Cost engineering should have as
its foundation the identification of requirements and a clearly defined baseline; but
according to Verganti’s study and others cited earlier, too many requirements are buried
in assumptions due to superficial anticipation.
Cost engineering efforts are supposed to result in business planning and project
management information. However, in the current state, a “cost estimate” is being
developed that fulfills the objectives of Business Management, but the information needs
of downstream users are not being supported. (Previously discussed in Chapter 1, Section
1.1.1.3, page 8.) If these information needs were being met, then working-level IPTs
would not “start over” to develop new estimates. Further, checkpoints to validate the
information requirements of downstream users/systems are not clearly identified.
The primary goal of the working-level IPT is requirements development. In this
diagram, the requirements/resources are direct labor, machine hours, and related
procurement. Once requirements are developed, estimates of schedule and cost are
derived from these requirements. The IPT is involved with enterprise-level requirements
management in a limited fashion, but typically do not coordinate their tasks with other
programs/projects until the design is released to the MES.
The goal of the Factory Management MES on the first-article is requirements
development and management. Once a job is planned in the MES, the information

272
related to this job and all other jobs are combined to provide a complete picture of the
direct labor and machine hours requirements for the enterprise for any given timeframe.
In column five, the goal of the Factory Management MES during production
changes slightly. Even though the MES still manages requirements, it takes on a new
role of “process management.” The MES becomes a tool for process improvement.
The third row under “Technical” is designated as “Focus.” This row is similar to
the second row. The main distinction worth noting is that on the first-article, schedule
reduction is usually the focus, while on subsequent units, labor hours reduction becomes
the focus.
The fourth row under “Technical” is designated as “Tools.” Business
Management utilizes parametrics, cost estimating relationships (CERs), and models to
generate a baseline; but the baseline is typically not easily understood by subsequent
users or particularly supportive of their decision making needs. For example, providing a
numeric value of “nonrecurring tooling dollars” does not provide insights into how many
tools are required, the tool codes, or why they are believed to be required. (If the baseline
were understood, then working-level IPTs would not need to regenerate estimates for cost
and schedule as discussed in Chapter 5.) Business Management still uses approaches that
do not incorporate the process and sequencing knowledge available from the work
measurement system. If they are, then this knowledge is likely buried and is not
transferred to the working-level IPTs. For example, instead of providing an estimate the
work center level where capacity and manning tables are maintained, estimating just
provides a total hours required for NC machining. This research assumes that feature-
based type 1 standards are available (or can be developed) from past or ongoing

273
production endeavors’ work measurement studies. (Type 1 and type 2 standards are
common industrial engineering terms and are discussed further in Section 7.10.4.)
The fifth row under “Technical” is designated as “Type of estimate.” A “did
take” focus is an actual hours emphasis. A “should take” focus is a process-based
approach that emphasizes the number of direct labor hours a task “should take” based on
standard data. The MES does not load jobs/orders based on actual hours expended; but
instead uses standard hours available from the work measurement system.
The sixth row under “Technical” is designated as “Learning curves.” The MES
does not load jobs using values based on learning curves. Again, work measurement
standard values are used.
The seventh row under “Technical” is designed as “Factors.” The MES does not
load jobs using values derived from Business Management estimating factors. Again,
standard values are used. Instead, efficiency and shift considerations are applied to
develop personnel forecasts. Efficiency, per se, is incorporated into the personnel
forecasts (e.g., manning tables). (Rai, 2004.)
The second section in Table 7.14 is designated as “Resource (organization and
information).” While Business Management can prevail with estimating information at
high-levels - the MES cannot operate effectively with this level of detail. In order for the
MES to function properly, all CBS work centers must be identified.
The third major section (or eighth row) of Table 7.14 is designated as
“Sequencing.” This row is quite complex because it is “multidimensional” and difficult
to properly illustrate in tabular format. The row contains some “technical process
information” specific to sequencing as well as availability/scheduling information.
274
During early conceptual design, important information is often buried in CERs
and not transferred to IPTs. However, once a design begins manufacture, work
measurement data begins to be applied, and information from past work measurement
studies are utilized. If a process is “new,” the work measurement group develops new
studies to fully describe the process. The technical information in these work
measurement studies is potentially valuable to decision makers, but typically they are not
available in a format easily usable by IPT members.
7.10.3 Conclusions Related to Table 7.14
The RIM-diagram in Table 7.14 illustrates several disconnects in the development
of “resources” estimates. The same CBS work centers which have performed processes
on past designs are going to be performing them again on the design being considered,
yet the enterprise is foregoing many of the known benefits of using a work measurement
system. In addition, the information transfer problems previously discussed in Section
7.2, page 167, which led to the use of EBOM=MBOM from a technical design
perspective are similarly occurring with regard to resources estimates information. There
are disconnects in “the white spaces where the baton is passed.” (Rummler and Brache,
1995.)
Since the information exchange with the RIM-based DSS, thus far, is geared
toward features and processes, one of the best sources of information for the DSS and the
IPTs is the work measurement system.

275
7.10.4 The MES Work Measurement System
The benefits of work measurement are well documented in the literature. With
today’s increasing global competition, there has been a resurgence of interest in work
measurement founded on scientific methods rather than estimates based on judgment and
experience. Work measurement system (WMS) values are the primary building blocks
utilized in shop floor scheduling, capacity requirements planning, and earned value
management systems (EVMS). (Salvendy, 2001.)
A report issued by the Office of the Undersecretary of the Defense cited that
EVMS reporting is often of little value on new programs because: 1) tasks are not well
defined, 2) the WMS is not fully integrated, and 3) interdependencies between IPTs tasks
and the Master Schedule are not well defined. (USOUSD, 2000) Further, in a study
sponsored by the Department of Defense, the Software Engineering Institute (SEI) cited
one of the problems with EVMS is insufficient attention is paid to the base measurements
on which the earned value is built. (SEI, 2002.)
This research assumes the MES utilizes a feature-based WMS to develop standard
values. It is important to note, a “standard value” is not one value applied to all
conditions or forever. A “standard value” is based on a set of conditions and assumptions
for the intended use of the value. A type 1 standard value, as defined in Handbook of
Industrial Engineering: Technology and Operations (Salvendy, 2001), is the result of
defining the resources a task “should take,” not what it “did take,” under a set of defined
ground rules and parameters. (Aft, 2000; Salvendy, 2001.)
This research assumes the WMS supporting the MES contains feature-based, type
1 standard values and associated process knowledge, which can be reused for the purpose
276
of conceptual design decision making. Specifically, the specified reuse strategy is linked
to the consideration of “Features” as defined in Section 7.8, i.e.,
FeaturesDesignSelectiveAnticipation(Mfg) + FeaturesManufacturingSelectiveAnticipation(Design) +
FeaturesDesignOther (Mfg).)
The next section discusses the additional assumptions required for the utilization
of RIM-strategies to restructure the WMS data.
7.10.5 Key Assumptions Related to the Work Measurement System
This section lists six key assumptions related to the WMS. Where appropriate,
additional explanations are offered as to the relevance of the assumption.
1) The WMS is feature-based and has sensitivity to features used to estimate labor
hours resources requirements.
If the WMS used in the MES is based on some other approach, then it is difficult
to develop a DSS to provide meaningful feedback with regard to the relationships
between features and resources (e.g., labor and machine hours).
2) Feature-based time values are derived from lower-level process analysis that
includes job-sequencing considerations.
If feature-based time values are derived from actual hours, then the sequencing
information is unintentionally buried in the actual hours and not easily restructured. For
example, a feature-based value derived from process analysis for hole drilling is based on
where the drill was obtained, the setup procedure, the steps involved in processing, etc.
A feature-based time value derived from actual hours alone cannot restructure the steps

277
or provide lower-level detail visibility to process performance. In order to manage
process-specific reciprocal interdependencies, they must be considered within each step
of data development.
3) Work measurement data is restructured/grouped to be sensitive to design selective
anticipation features only, but still maintain traceability to specific assumptions utilized in the development of restructured/grouped values.
The grouped standard values returned by the DSS are calculated using design
selective anticipation features. Once a consistent standard value baseline is defined, then
it can be revised and improved upon using actual hours and variance analysis. This
approach offers a tremendous improvement over various “cost estimators” utilizing their
own ad hoc approaches. (As previously discussed in Chapter 4, Section 4.2, page 105.)
4) The work measurement data can also be applied in a more detailed fashion using
additional features within the set of FeaturesDesignOther(Mfg).
During conceptual design, the only features known with relative certainty are the
“design selective anticipation features.” Once the design is complete, or nearly
complete, the “design other manufacturing features” can be input to the DSS to calculate
a standard value equivalent to the standard value that the WMS generates when a job
order is released to the MES. This detailed information is helpful in decision making
during conceptual/preliminary design and prior to detail design release.
5) There are historical data available that can be used to study relationships based on
the identified design selective anticipation features, i.e., by design type, material finished weight, part envelope (L,W,D) surface area (2-D,1-S) at the CBS work center level. The application of “commonality” means that similar processes have been used in the past. Now that design selective anticipation features have been
278
defined, there is a requirement to feedforward historical information utilizing design selective anticipation features.
a. If the historical data are not easily obtainable via electronic records, then
work measurement engineers develop relationships using various sources of information to create a representative sample from which to make initial decisions.
b. If the historical data are not easily obtainable via electronic records, then
required changes to historical performance records are identified and made before the new design reaches the detail design phase.
c. The performance of the WMS based on the restructured data is measured
at the first available opportunity, and changes in the selective anticipation CERs are made accordingly.
6) The WMS clearly defines “standard value” in order to facilitate inferences to “standard value” in the context of theoretical unit #1.
Theoretical unit #1 (T1) is a value used in learning curve based estimating
procedures. (Learning curve based estimating is not specifically discussed in this
research, but reference materials are provided in Appendix B.)
In the next section, work measurement RIM-diagramming is discussed.
7.10.6 Work Measurement System RIM-Diagramming
The work measurement system RIM-diagramming effort is more difficult to
understand than prior diagramming efforts presented thus far. The user must visualize
reciprocal interdependencies discussed as “Technical, Resources, and Sequencing” in
previous RIM-diagrams are being concurrently considered at the CBS work center level.
In addition, the concepts of “commonality” and “new” are being used to

279
restructure/group the work measurement data from a broader perspective of what is the
same and what is different from work center to work center.
The work measurement engineer (or team of engineers) restructures process study
information into segments/pieces based on several considerations, such as: 1) which
features are preferred for standard value development, 2) what portion of the standard
value is reasonably assigned using only design selective anticipation features, 3) what
portion of the standard value is common to all designs (e.g., basic setup and obtaining
prints), and 4) how to make allowances for not having specific features information with
the least possible error in the estimated standard value.
A series of RIM-diagrams are offered to illustrate the thought processes a work
engineer would go through in Tables 7.15 through 7.20. These RIM-diagrams are to be
viewed as “working papers” and are not intended to offer every insight into the
anticipated effort.
The RIM column on the diagrams implies that all reciprocal interdependencies are
being considered on each row of the diagram. The “Work Center” column contains
descriptions of the work centers already identified in the CBS. Additional discussion of
the diagrams is offered following the diagrams.
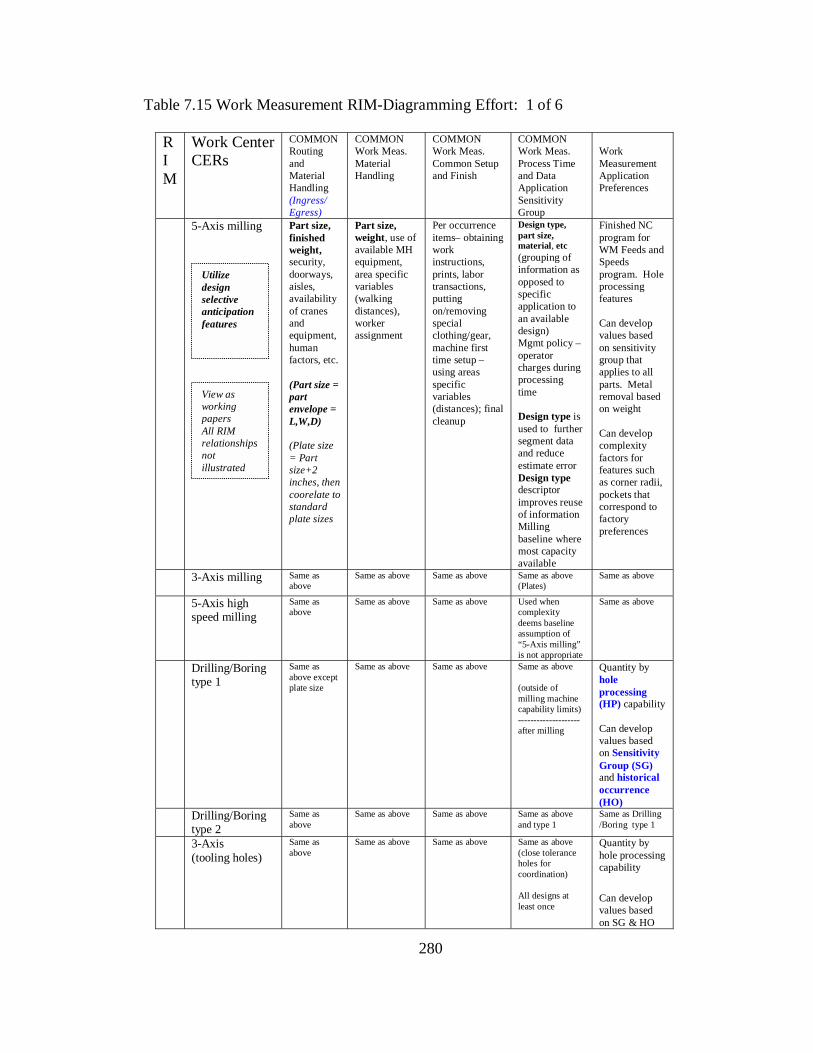
280
Table 7.15 Work Measurement RIM-Diagramming Effort: 1 of 6
R I M
Work Center CERs
COMMON Routing and Material Handling (Ingress/ Egress)
COMMON Work Meas. Material Handling
COMMON Work Meas. Common Setup and Finish
COMMON Work Meas. Process Time and Data Application Sensitivity Group
Work Measurement Application Preferences
5-Axis milling Part size, finished weight, security, doorways, aisles, availability of cranes and equipment, human factors, etc. (Part size = part envelope = L,W,D) (Plate size = Part size+2 inches, then coorelate to standard plate sizes
Part size, weight, use of available MH equipment, area specific variables (walking distances), worker assignment
Per occurrence items– obtaining work instructions, prints, labor transactions, putting on/removing special clothing/gear, machine first time setup – using areas specific variables (distances); final cleanup
Design type, part size, material, etc (grouping of information as opposed to specific application to an available design) Mgmt policy – operator charges during processing time Design type is used to further segment data and reduce estimate error Design type descriptor improves reuse of information Milling baseline where most capacity available
Finished NC program for WM Feeds and Speeds program. Hole processing features Can develop values based on sensitivity group that applies to all parts. Metal removal based on weight Can develop complexity factors for features such as corner radii, pockets that correspond to factory preferences
3-Axis milling Same as above
Same as above Same as above Same as above (Plates)
Same as above
5-Axis high speed milling
Same as above
Same as above Same as above Used when complexity deems baseline assumption of “5-Axis milling” is not appropriate
Same as above
Drilling/Boring type 1
Same as above except plate size
Same as above Same as above Same as above (outside of milling machine capability limits) -------------------- after milling
Quantity by hole processing (HP) capability Can develop values based on Sensitivity Group (SG) and historical occurrence (HO)
Drilling/Boring type 2
Same as above
Same as above Same as above Same as above and type 1
Same as Drilling /Boring type 1
3-Axis (tooling holes)
Same as above
Same as above Same as above Same as above (close tolerance holes for coordination) All designs at least once
Quantity by hole processing capability
Can develop values based on SG & HO
Utilize design selective anticipation features
View as working papers All RIM relationships not illustrated

281
Table 7.16 Work Measurement RIM-Diagramming Effort: 2 of 6
R I M
Work Center CERs
COMMON Routing and Material Handling
COMMON Work Meas. Material Handling
COMMON Work Meas. Common Setup and Finish
COMMON Work Meas. Process Time and Data Application Sensitivity Group
Work Measurement Application Preferences
Minor subassembly (cold work)
Same as 3-Axis NC (tooling holes) in Table 6.14
Same as 3-Axis NC (tooling holes) in Table 6.15
Same as 3-Axis NC (tooling holes) in Table 6.15
Same as above but may not need sensitivity to size Used on subassemblies after milling
Quantity by HP capability
Can develop values based on SG & HO
Minor subassembly (bushings)
Same as above
Same as above Same as above Same as above but may not need sensitivity to size Used on subassemblies after milling
Qty by bushing type (bushing # conveys size and processing requirement by feature which has already been matched to the areas capability to install that type of bushing)
Can develop values based on SG & HO
Minor subassembly (nutplates)
Same as above
Same as above Same as above Same as above but may not need sensitivity to size Used on subassemblies after milling
Same as bushing
Can develop values based on SG & HO
Hand finish (clean)
Same as above
Same as above Same as above Same as above but likely not sensitive to material All parts get once
Actual surface area. Can develop values based on SG & HO Can develop CERs for estimated surface area
Hand finish (deburr)
Same as above
Same as above Same as above Same as above and Clean.
Same as HF Clean
Hand finish (hole processing)
Same as above
Same as above Same as above Same as above Subassembly & Rework
Same as Drilling Boring Type 1
Hand finish (tooling tab)
Same as above
Same as above Same as above Same as above All parts get once
Prefer actual tooling tab configuration
Can develop values based on SG & HO
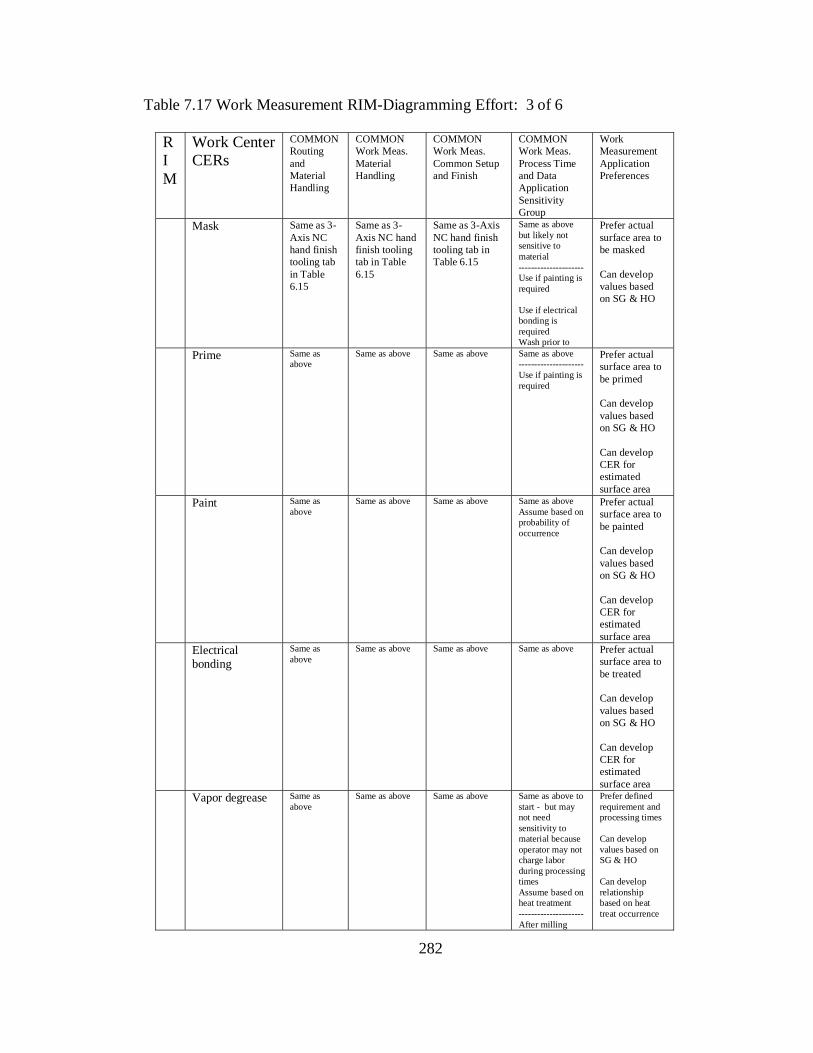
282
Table 7.17 Work Measurement RIM-Diagramming Effort: 3 of 6
R I M
Work Center CERs
COMMON Routing and Material Handling
COMMON Work Meas. Material Handling
COMMON Work Meas. Common Setup and Finish
COMMON Work Meas. Process Time and Data Application Sensitivity Group
Work Measurement Application Preferences
Mask Same as 3-Axis NC hand finish tooling tab in Table 6.15
Same as 3-Axis NC hand finish tooling tab in Table 6.15
Same as 3-Axis NC hand finish tooling tab in Table 6.15
Same as above but likely not sensitive to material --------------------- Use if painting is required Use if electrical bonding is required Wash prior to
Prefer actual surface area to be masked Can develop values based on SG & HO
Prime Same as above
Same as above Same as above Same as above --------------------- Use if painting is required
Prefer actual surface area to be primed Can develop values based on SG & HO Can develop CER for estimated surface area
Paint Same as above
Same as above Same as above Same as above Assume based on probability of occurrence
Prefer actual surface area to be painted Can develop values based on SG & HO Can develop CER for estimated surface area
Electrical bonding
Same as above
Same as above Same as above Same as above
Prefer actual surface area to be treated Can develop values based on SG & HO Can develop CER for estimated surface area
Vapor degrease Same as above
Same as above Same as above Same as above to start - but may not need sensitivity to material because operator may not charge labor during processing times Assume based on heat treatment --------------------- After milling
Prefer defined requirement and processing times Can develop values based on SG & HO Can develop relationship based on heat treat occurrence

283
Table 7.18 Work Measurement RIM-Diagramming Effort: 4 of 6
R I M
Work Center CERs
COMMON Routing and Material Handling
COMMON Work Meas. Material Handling
COMMON Work Meas. Common Setup and Finish
COMMON Work Meas. Process Time and Data Application Sensitivity Group
Work Measurement Application Preferences
Heat treat Same as Vapor degrease in Table 6.16
Same as Vapor degrease in Table 6.16
Same as Vapor degrease in Table 6.16
Same as above – but some processing time is not charged by operator Make assumptions based on probability of occurrence ----------------- Process after milling Wash prior to heat treat
Prefer defined requirement and processing times Can develop values based on SG & HO Can develop relationship based on heat treat occurrence Can develop CER for heat treat age occurrence
Heat treat age Same as
above Same as above Same as above Same as above
– but some processing time is not charged by operator Make assumptions based on probability of occurrence ------------------ Process after milling Wash prior to heat treat age
Prefer defined requirement, surface area, and processing times Can develop values based on SG & HO Can develop CER for surface area
Chemical milling
Same as above
Same as above Same as above Same as above Prefer defined requirement, milled surface area, and processing time Can develop values based on SG & HO Can develop CER for estimates of chemically milled surface area

284
Table 7.19 Work Measurement RIM-Diagramming Effort: 5 of 6
R I M
Work Center CERs
COMMON Routing and Material Handling
COMMON Work Meas. Material Handling
COMMON Work Meas. Common Setup and Finish
COMMON Work Meas. Process Time and Data Application Sensitivity Group
Work Measurement Application Preferences
Plating Same as Chemical milling in Table 6.17
Same as Chemical milling in Table 6.17
Same as Chemical milling in Table 6.17
Same as above – but some processing time is not charged by operator ---------------- After milling Wash prior to
Prefer defined requirement, plated surface area, and processing time Can develop values based on SG & HO Can develop CER for estimates of plated surface area
Shot peen Same as
above Same as above Same as above Same as above
Prefer defined requirement, shot peen ed surface area, and processing time Can develop values based on SG & HO Can develop CER for estimates of shot peen surface area
Wash Same as
above Same as above Same as above Performed prior
to specific processes
Prefer requirement Can estimate relative to other process occurrence using assumed surface area

285
Table 7.20 Work Measurement RIM-Diagramming Effort: 6 of 6
R I M
Work Center CERs
COMMON Routing Material Handling
COMMON Work Meas. Material Handling
COMMON Work Meas. Common Setup and Finish
COMMON Work Meas. Process Time and Data Application Sensitivity Group
Work Measurement Application Preferences
Stamping NA Stamping operator typically travels to the work center
Same as Wash in Table 6.18
Same as Wash in Table 6.18
Typically size and per occurrence critical only Perform prior to final inspection
Prefer defined requirement Can develop values based on SG & HO Estimate based on occurrence
Vibroengrave Same as above (except plate is considered)
Same as above Same as above Same as above to start - but may not need sensitivity to estimate labor due to small amount involved Instead occurrence is most critical
Prefer defined requirement Can develop values based on SG & HO Estimate based on occurrence
Quality Assurance
Dependent upon type of inspection Some inspection requires design to travel to a special area, while other do not
Standards not applied to inspection task
Standards not applied to inspection task
Same as above - WM not applied to inspection task but for operator waiting ------------------ Plate inspect at beginning of job Intermediate inspect after milling and special processing (e.g. chemical milling, heat treat, shot peen, etc. Final inspection as last step
Prefer defined requirement Can develop values based on SG & HO Estimate inspection allowances based on occurrence
The “Routing and Material Handling” column is directed toward the consideration
of moving the design between work centers. The RIM-diagramming effort illustrates the
work measurement engineer has designated two types of material handling data: the
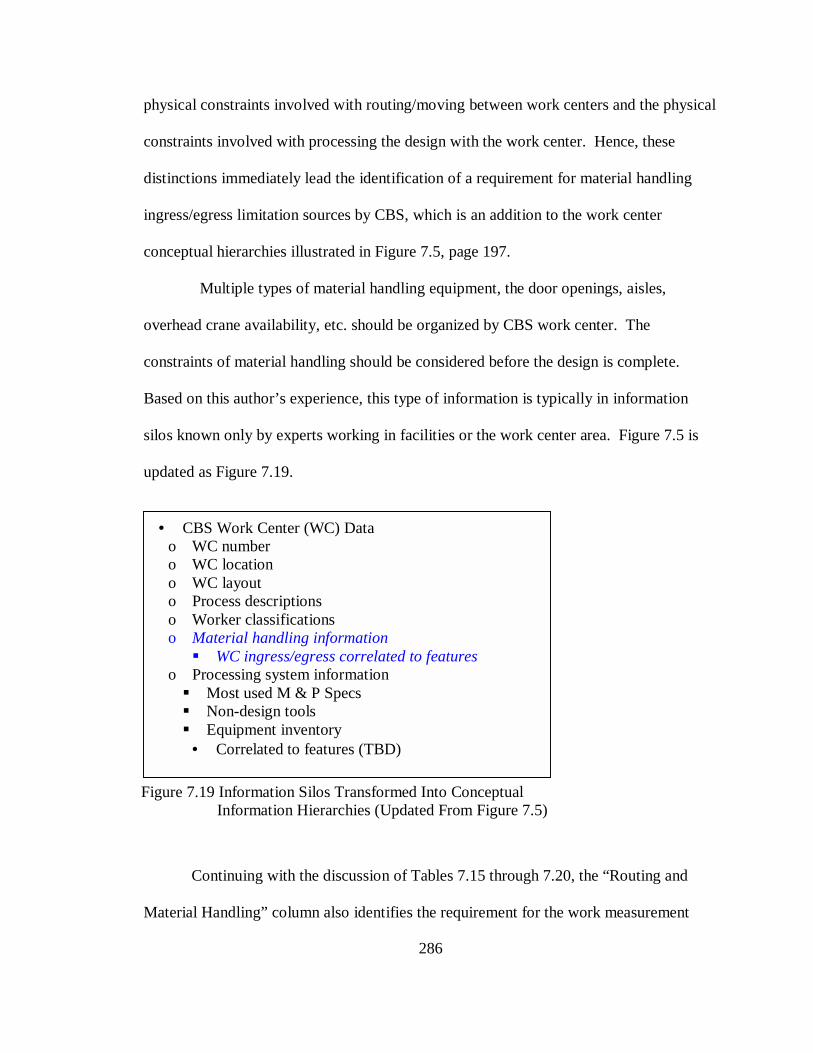
286
physical constraints involved with routing/moving between work centers and the physical
constraints involved with processing the design with the work center. Hence, these
distinctions immediately lead the identification of a requirement for material handling
ingress/egress limitation sources by CBS, which is an addition to the work center
conceptual hierarchies illustrated in Figure 7.5, page 197.
Multiple types of material handling equipment, the door openings, aisles,
overhead crane availability, etc. should be organized by CBS work center. The
constraints of material handling should be considered before the design is complete.
Based on this author’s experience, this type of information is typically in information
silos known only by experts working in facilities or the work center area. Figure 7.5 is
updated as Figure 7.19.
Continuing with the discussion of Tables 7.15 through 7.20, the “Routing and
Material Handling” column also identifies the requirement for the work measurement
• CBS Work Center (WC) Data o WC number o WC location o WC layout o Process descriptions o Worker classifications o Material handling information ! WC ingress/egress correlated to features
o Processing system information ! Most used M & P Specs ! Non-design tools ! Equipment inventory
• Correlated to features (TBD)
Figure 7.19 Information Silos Transformed Into Conceptual Information Hierarchies (Updated From Figure 7.5)

287
group to develop a CER based on an assumption of plate size for the DSS to operate. In
addition, once the actual plate size is known, a new CER is needed to incorporate the
updated information.
The “Work Measurement Material Handling” column identifies two types of
material handling variables; these are based on the design characteristics and the physical
characteristics within the work center. For example, the weight is used to determine
when an operator can be expected to move a design alone, when two persons are needed,
or when other equipment is needed for assistance. This information can be used to
develop a CER that is sensitive to a range of weight and design size combinations. The
variables associated with the area are constant. For example, “obtain plate” may be a
selection when a value is being developed for a specific design. Regardless of the design,
the distance an operator travels to obtain the plate is dependent upon the work center
variables, not the design per se.
The “Work Measurement Common Setup and Finish” column is related to per
occurrence items that happen on a job regardless of the design characteristics. This type
of information can be applied on a per occurrence basis.
The “Work Measurement Process Time and Data Application Sensitivity Group”
column designates how information related to processing time is best grouped. This
grouping is based on the selective anticipation features and how they can be combined
and applied to minimize error.
The “Work Measurement Application Preferences” column in Tables 7.15
through 7.20 is used to organize general preferences and considerations by work center.
For example, for 5-Axis milling, the work measurement engineer would prefer a

288
complete design so the NC milling process time could be estimated using on a computer
program of feeds and speeds related to the milling operation, as well as specific
application based on hole processing features. However, the work measurement engineer
has determined that it is appropriate to develop CERs by part type that will be used to
estimate all NC machined jobs until “complexity features” are established. (Note that
complexity features are defined in Table 7.12, page 249.) Similar designs by design type
within the 90th percentile are used to establish a baseline for milling time. The remaining
10% is left out to avoid padding requirements over a large sample of designs.
The work measurement engineer strives to determine a mix of CERs that
approximate the WMS standard values the system will assign to a complete design once
released into the MES. In addition, the selection of the 90th percentile is a judgment
based on review of historical data and can be changed based variance analysis or
management direction. If the CER values are determined to be “too large,” then variance
analysis can be used to discover the “flaws” in CER assumptions, and can be easily
changed if the application is consistent.
Table 7.21 illustrates a conceptual grouped standard CER application matrix for
the 5-Axis milling work center. These CERs are used to estimate machine setup and run
time for the 5-Axis milling work center. Each of the work centers in the FFPM
fabrication plan has a unique set of CERs the DSS utilizes to calculate the standard hours
for the design being reviewed by the DSS. These CERs form the basis of estimate for
direct touch labor hours.

289
Table 7.21 Conceptual Work Measurement Application Matrix
CBS Work Center 5-Axis Mill
Material Type AL Setup
Material Type AL Run
Material Type TI Setup
Material Type TI Run
Material Type STEEL Setup
Material Type STEEL Run
Design Type 90th percentile Milling Other Run Other Setup
Sm, Med, Lg, Ex Lg Per Occurrence
Weight (lb) & Plate Size est. (L+2, W+2, D+2) Per lb of material removed Part Envelope & Weight Matrix Per Occurrence
Sm, Med, Lg, Ex Lg Per Occurrence
Weight (lb) & Plate Size est. (L+2, W+2, D+2) Per lb of material removed Part Envelope & Weight Matrix Per Occurrence
Sm, Med, Lg, Ex Lg Per Occurrence
Weight (lb) & Plate Size est. (L+2, W+2, D+2) Per lb of material removed Part Envelope & Weight Matrix Per Occurrence
Surface area (2D, 1S) Ranges – S, M, Lg, Ex-Lg
Small Range (X-Y)
CER
CERM + CERO
CER
CERM + CERO
CER
CERM + CERO
Medium Range (X-Y)
CER
CERM + CERO
CER
CERM + CERO
CER
CERM + CERO
Large Range (X-Y)
CER
CERM + CERO
CER
CERM + CERO
CER
CERM + CERO
Ex-Large Range (X-Y)
CER
CERM + CERO
CER
CERM + CERO
CER
CERM + CERO
The IPT members are not required to utilize the CER matrix in Table 7.21.
Instead, an IPT member inputs/enters the “design selective anticipation features,” and
internal DSS logic automatically performs the calculations.

290
For example, assume that the IPT has made the required inputs/entries to the DSS
of the design selective anticipation features, i.e., design type, weight, material type, part
envelope, and two-dimensional, one-side (2D-1S) surface area, service life, and
subassembly process. The DSS estimates the plate size as being two inches larger than
the part envelope. Once the plate size is estimated, the calculation of the “pounds of
metal removed (milled)” is based on beginning plate volume, the density of the material
type, and the finished weight of the design. In addition, the DSS automatically
determines the bulkhead size category (e.g., small, medium, large, or extra-large) based
on the surface area (2D-1S). The “setup” columns in Table 7.21 indicate that the setup
CER is applied per occurrence. The “run” columns of Table 7.21 indicate that a portion
of the run CER is applied per occurrence and a portion is applied on a per pound basis.
The CERM designation refers to the 90th percentile milling value and the CERO
designation refers to the “Other Run.”
There are many ways to develop CERs and Table 7.21 and the accompanying
explanation for a bulkhead are provided as an example only. Based on the discussion of
the work measurement system, the conceptual information hierarchies required for
feedforward planning and operation of the RIM-based DSS are illustrated in Figure 7.20.

291
7.10.7 Feedforward Planning Model
At this point it is necessary to recap the development of the DSS thus far and the
additional IPT decisions supported by the DSS. Once the material handling database is
created for each CBS, then the IPT can begin to identify problems and issues related to
the physical constraints of the design, the physical constraints of the work center, and the
availability of appropriate equipment.
In addition, the design selective anticipation features can be used to develop
estimates of standard values by CBS for the conceptual design using grouped standard
CERs. Further, once additional information is known or can be reasonably estimated, the
estimated hours can be revised using additional manufacturing selective anticipation
features and design other features.
Once the IPT can develop a standard value in a format suitable for the MES, a
giant step toward has been taken with regard to load the MES with a planned
requirement, i.e., a job or order. Further, if many working-level IPTs can do the same
• Work Measurement • Work center number
• Process studies • Material handling constraints based on design selective
anticipation features • Grouped standard CERs sensitive to design selective
anticipation features • Detail features-based standard values (sensitive to all
features; for specific application to nearly complete design) • TBD
Figure 7.20 WMS Conceptual Information Hierarchies

292
thing, then information once unavailable until much later in the product development
process can be developed earlier. The benefits of loading the MES using a conceptual
design release package are discussed in Section 7.13. Loading the MES allows line
balancing and earlier discovery of bottlenecks.
7.10.8 Cultural Implications
In Chapter 1 (i.e., Section 1.1.1.4, page 9), the cultural problems related to
changing how enterprises approach product development are discussed. Using work
measurement during conceptual design would be a cultural shift for aircraft
manufacturing enterprises because there has been a historical reluctance to fully utilize
the potential of work measurement information. (Kapoor, 1990; Lyssy and Sharp, 1997.)
Work measurement was forced upon the industry under MIL STD 1567A (Work
Measurement, 03/11/1983), and contractors are still reluctant to utilize detailed
information until production. Even though work measurement studies can be used on
“common” processes, the reluctance exists nonetheless.
Donald Rumsfeld (1995) wrote a series of articles suggesting top-down estimating
approaches were efficient for high-level estimating, but they were not effective in
exposing inefficiencies in processes. The exposure of enterprise inefficiencies could only
be achieved through a bottom-up work measurement based approach. The fear of
inefficiencies exposure is the likely driver behind defense contractor reluctance.
With regard to contract estimating cultural issues, in aircraft manufacturing, many
of the factors used by the Business Management activity to forecast indirect labor hours
are based on direct labor (touch labor) hours. For example, if a 1:1 factor for “direct

293
(touch) labor” to “direct engineering and other labor” is used, then for every 10 hours of
“direct (touch) labor” estimated a corresponding 10 hours of “direct engineering and
other labor” is estimated. A 1:2 factor results in an estimate of 10 hours of “direct (touch)
labor” estimated a corresponding 20 hours of “direct engineering and other labor.”
In recent years three interesting phenomena are occurring: 1) the direct labor
portion of total aircraft cost is decreasing, 2) the other segments of total cost are
increasing, and 3) the cost and schedule overruns are rising. Table 6.21 is based on two
studies of aircraft manufacturing cost in the defense industry, attributable to Rogerson
(1992) and the other to Kloos (2007). When direct material is removed from the total
cost percentage, it provides insights into how errors in direct labor estimates potentially
affect other estimates. In the 1992 timeframe, when direct material is removed from the
total, the ratios of “direct labor to direct engineering” and “direct labor to other direct”
are 1:1 and 1:0.41, respectively. In 2007, when direct material is removed from the total,
these ratios change ratios from 1:1 to 1.7:1 and 1:041 to 2.9:1. Hence, effects of error in
direct labor estimates can cause a two or three fold increase in error in other segments of
the estimate. Perhaps in time, there will be an increased interest in improving estimates
of direct labor. However, at this point, only the envisioned DSS is conceptual.

294
Table 7.22 Aircraft Total Cost Percentages
(Rogerson,1992) (Kloos,2007) Percent of Percent of Total Cost Total Cost Direct Material 51.9 46.7 Direct Labor 20.1 9.6 Direct Engineering and Other 19.9 16.2 Other Indirect 8.1 27.5 Total 100.0 100.0 1989 2007 Percent of Ratio Percent of Ratio Excluding Direct Material Total Cost to D.L. Total Cost to D.L. Direct Material Direct Labor (DL) 41.8 18.0 Direct Engineering and Other 41.4 1-to-1 30.4 1.7-to-1
Other Indirect 16.8 0.41-to-1 51.6 2.9-to-1
Total 100.0 100.0
7.10.9 Resources – Direct Labor Hours (Other) and Procurement Dollars
In this section the approach used by the conceptual DSS to handle the reciprocal
interdependencies existing for direct labor hours (other) that are not touch labor is
discussed. Previously, in Sections 7.10.2 and 7.10.8, some of the problems arising from
the development of labor estimates at a high-level and/or factoring estimates of other
direct labor based on direct (touch) labor are discussed. In this section a discrete
approach is described for estimating direct labor hours (other) so these problems may be
avoided. In addition, a discrete approach is assumed to provide better feedback to the
IPT in addition to a more manageable plan. An IPT cannot manage a total number of
295
hours, but instead needs hours correlated to specific tasks to be performed based on a
schedule. The management information need by the IPTs to manage their tasks is not
fundamentally different from information needed to mange direct touch labor tasks in the
factory.
In Chapter 5 (beginning on page 118), the working-level IPT members for this
research are defined as:
• Structural design engineer (leader) (direct labor-design deliverable) • Systems design engineer (direct labor-design deliverable) • Test engineer (direct labor-design deliverable) • Tool designer (direct labor-tool design deliverable) • Planner (direct labor-work instructions deliverable) • Manufacturing engineer (direct labor-tooling model deliverable) • Manufacturing representative (allocated to touch labor as supervision) • Purchasing representative (allocated to direct material) • Cost representatives (various; depends on program management) (overhead) • Quality assurance representative (allocated as direct overhead)
In the listing above, the structural design engineer (and engineers working for
him/her) is classified as direct labor (refer to high-level CBS in Figure 7.2) and his/her
measured deliverable is a design. Similarly, planners are classified as direct labor and
deliverables associated with planning tasks are work instructions.
Depending upon the high-level CBS structure, some or all of the IPT members
may be treated as direct labor. A sampling of IPT members are discussed in this section
in the context of internal DSS logic.
Recall from Chapter 5, important aspects of IPT member decision making involve
the determination of the number of deliverables (i.e., designs, work instructions, tool
models, etc.) their respective activities are responsible for producing (i.e., Chapter 2,
IDEF0 diagrams), including the associated number of labor hours and schedule days to

296
produce each deliverable. These estimation tasks can be accomplished using rules and
templates that provide the necessary knowledge links to the framework of the FFPM
fabrication plan in Table 7.12, page 249.
Table 7.12 illustrates the fabrication plan for one detail design and it lists the
requirements for four design tools by tool code and by CBS work center. For the purpose
of illustration, it is assumed that two of the design tools are manufactured in-house (i.e.,
make), two design tools are purchased, (i.e., buy), and one of the in-house manufactured
tools requires another tool for its manufacture. Based on these requirements, the
following deliverables are projected by internal DSS logic:
• Detail designs – 1 (based on 1 NC machined bulkhead) • Detail work instructions – 1 (based on 1 per detail design)
• Tool orders – 5 (based on 2 make, 2 buy, 1 make tool-to-make-tool)
• Tooling work instructions – (based on 2 + 1 = 3 (2 make, 1 make tool-to- make-tool)
• Tool models – 5 (electronic data) (based on 2 make, 2 buy, 1 make tool-to-
make-tool) • Tool designs – 2+1 = 3 (based on 2 make, 1 make tool-to-make- tool)
Based on the high-level CBS presented in Figure 7.2 (page 177) and the logic
illustrated above, requirement for new conceptual information hierarchies to meet the
information needs of the IPT are identified for estimation of non-recurring engineering
and tool design direct labor hours. The new conceptual hierarchies are illustrated in
Figure 7.21.

297
Though not discussed previously, a make or buy decision supercedes the
generation of the FFPM fabrication plan in Table 7.12 (page 249). (United States Office
of the Secretary of Defense, 1997.) A make or buy policy (likely agreed upon during the
proposal effort) established aircraft NC machined bulkheads are to be manufactured in-
house.
At this point in the DSS development, it is necessary to back track to discuss
make/buy policies in the context of detail designs and design tools.
Recall Table 7.12 contains the basic process sequencing by CBS work center in
addition to the initial estimate of design tool requirements. There is a column at the far
right titled “Make/Buy.” The beginning entry into this column originates from a segment
of conceptual information hierarchies not previously defined, i.e., the “Make/Buy Polices
Management” conceptual information hierarchies. A segment of these hierarchies are
provided in Figure 7.22.
• Project o Design selective anticipation features ! Detail design templates
• Design hours • Work instructions hours
! Tool code templates • Tool models hours • Tool design hours • Tool manufacturing work instructions hours
Figure 7.21 Non-Recurring Engineering and Tool Design Direct Labor Conceptual Information Hierarchies

298
“NC machining” is designated an in-house make processing category. However,
an exception for design number xxx is noted. Tool codes of type y are designated as
“make,” while tool codes of type z are designated as “buy.” These conceptual hierarchies
are for illustrative purposes only, and are not the emphasis of this research.
If the design, tool code, or raw material is designated as a “buy” item, then the
DSS requires temporary values for estimated procurement dollars until a procurement
representative obtains ROM quotes or final bids for the item. Project templates for these
estimates are envisioned to be in conceptual information hierarchies maintained by
procurement within Business Management. Conceptual hierarchies for this type of
information are is provided in Figure 7.23.
Figure 7.22 Make/Buy Policies Management Conceptual Information Hierarchies
• Make/Buy Policies Management o Processing categories ! NC machining (make) ! Processing category x (make, buy) ! Processing category y (make, buy) ! TBD
o Design type • Bulkhead xxx NC machining (buy) • TBD
o Design Tools ! Tool code y
• Control number xxx (make) ! Tool code z
• Control number xxx (buy) ! TBD
• Raw Materials o Material a o Material b o TBD
Note: x, y, xxx,y, z, a, an b are placeholders

299
• Raw Material o M&P material code ! Plate
• Standard sizes o Vendors ! Cost (BY, unburdened $) ! Order history (M-days)
o Project templates ! Project x ! Cost (BY, unburdened $)
! Bar stock • Same as plate
o “” ! TBD
• Same as plate o “”
! Tool Code • Where used
o Design selective anticipation features ! Standardized ranges
• Vendors (historical data) o Cost (BY, unburdened $)
• Project templates o Project x o Cost (BY, unburdened $)
o ROM Quotes ! Design number ! Tool number ! TBD
o Final Bids ! Design number ! Tool number ! TBD
o TBD
Figure 7.23 Procurement Management Conceptual Information Hierarchies
300
7.10.10 Estimation and Dollarization of Resources
The Business Management activity (i.e., Chapter 2, IDEF0 diagrams, Activity 1)
is responsible for estimating resources at the enterprise level, which includes dollarization
of estimates for external reporting purposes. Business Management develops and
maintains many types of information (Appendix B), including, but not limited to:
• Statement of work (SOW) definitions • Work breakdown structure (WBS) definitions • Cost breakdown structure (CBS) definitions • Accounting month definitions (M-day calendars) for financial reporting • Direct and indirect labor rates • Overhead rates • Estimating factors (as discussed in Section 7.10.8) for recurring and non-
recurring elements of the high-level CBS (Figure 7.2, page 177) • Learning curves
In order for the conceptual DSS to dollarize resources estimates and calculate
total cost for the IPT, it requires data developed and maintained by Business
Management. As discussed in Chapter 4 (page 105) and Chapter 5 (page 125), there are
typically multiple activities and individuals involved in cost estimation during conceptual
design. Most often, their primary tools are personalized spreadsheets containing
Business Management data, which often contain mistakes or do not contain the most up-
to-date information. One of the envisioned improvements provided by RIM-based DSS
provides is consistent management of reciprocal interdependencies related to cost
estimating data. Conceptual information hierarchies linked to the DSS are provided in
Figure 7.24.

301
• Project /Program o WBS o SWBS (Master Schedule) o CBS o Accounting months o Factors ! Non recurring
• TBD • TBD ! Recurring
• TBD • TBD
o Rates ! Non recurring
• TBD • TBD ! Recurring
• TBD • TBD
o Learning curves ! Assembly CBS number
• TBD • TBD ! Fabrication CBS number
• TBD • TBD ! Other
• TBD
Figure 7.24 Conceptual Business Management Information Hierarchies

302
7.10.11 Summarization and Conceptual Framework and Information Hierarchies Updates
Before moving forward, it is important to recap the conceptual RIM-based
codification of information hierarchies discussed in Section 7.10. Recall from Chapter 1,
page 32, codification involves the systematic classification and storage of knowledge to
address predefined questions and issues.
The relationships discussed in Section 7.10 are offered in Figure 7.25, which is an
addition to Figure 7.17 (page 258).

30
3
Des
ign
cont
rol n
um
ber:
xxx
xxxx
– x
xx
Pro
cess
ing
cate
gory
: N
C M
achi
ning
N
omen
clat
ure
(D
etai
l typ
e):
Bul
khea
d C
BS
Wor
k C
ente
r #
CB
S Pr
oces
sing
D
escr
iptio
n
Des
ign
Too
ls
Mak
e/B
uy
TB
D
Mat
eria
l rec
eipt
-pl
ate(
s)
901
Plat
e in
spec
tion
802
Vib
roen
grav
e
203
Too
ling
hol
es
Too
l cod
e X
101
Plat
e su
rfac
e m
ill
102
*1 M
illin
g T
rial
Run
T
ool c
ode
X
301
Han
d fi
nish
- c
lean
xxx
----
----
----
----
----
----
----
--
----
----
--
---
200*
*2
Spe
cial
hol
e pr
oces
sing
T
ool c
ode
X
203
*2 T
oolin
g (c
oord
inat
ed)
ho
les
Too
l cod
e X
xxx
----
----
----
----
----
----
----
--
----
----
--
---
801
Stam
p
Det
ail d
esig
ns
1
Det
ail
wor
k in
stru
ctio
ns
1
Too
l ord
ers
5
Too
ling
wor
k in
stru
ctio
ns
3
Too
l mod
els
5
Too
l des
igns
3
303
Fig
ure
7.25
R
ecap
of
DS
S C
once
ptua
l RIM
-Bas
ed C
odif
icat
ion
Dis
cuss
ed I
n S
ectio
n 7.
10
•
Proj
ect
o D
esig
n se
lect
ive
antic
ipat
ion
feat
ures
!
Det
ail d
esig
n te
mpl
ates
•
Des
ign
hour
s •
Wor
k in
stru
ctio
ns h
ours
!
Too
l cod
e te
mpl
ates
•
Too
l mod
els
hour
s •
Too
l des
ign
hour
s •
Too
l man
ufac
turi
ng
w
ork
inst
ruct
ions
hou
rs
Figu
re 6
.20
Non
-Rec
urri
ng E
ngin
eeri
ng a
nd T
ool
Des
ign
Pers
onne
l Con
cept
ual
Info
rmat
ion
Hie
rarc
hies
Fig
ure
7.21
Non
-Rec
urri
ng E
ngin
eeri
ng a
nd T
ool
Des
ign
Dir
ect
Lab
or C
once
ptua
l
I
nfor
mat
ion
Hie
rarc
hies
Figu
re 6
.22
Mak
e/B
uy P
olic
ies
Man
agem
ent
Con
cept
ual I
nfor
mat
ion
Hie
rarc
hies
•M
ake/
Buy
Pol
icie
s o
Proc
essi
ng c
ateg
orie
s !
NC
mac
hini
ng (
mak
e)
! Pr
oces
sing
cat
egor
y x
(mak
e, b
uy)
! Pr
oces
sing
cat
egor
y (
mak
e, b
uy)
! T
BD
o
Des
ign
type
•
Bul
khea
d xx
x N
C m
achi
ning
(bu
y)
• T
BD
o
Des
ign
Too
ls
! T
ool c
ode
y •
Con
trol
num
ber
xxx
(mak
e)
! T
ool c
ode
z •
Con
trol
num
ber
xxx
(buy
) !
TB
D
• R
aw M
ater
ials
o
Mat
eria
l a
o M
ater
ial b
o
TB
D
•
Raw
Mat
eria
l o
M&
P m
ater
ial c
ode
! Pl
ate
• S
tand
ard
size
s o
Ven
dors
!
Cos
t (B
Y, u
nbur
dene
d $)
!
Ord
er h
isto
ry (
M-d
ays)
o
Pro
ject
tem
plat
es
! P
roje
ct x
!
Cos
t (B
Y, u
nbur
dene
d $)
!
Bar
sto
ck
• S
ame
as p
late
o
“”
! T
BD
•
Sam
e as
pla
te
o “”
!
Too
l Cod
e •
Whe
re u
sed
o D
esig
n se
lect
ive
antic
ipat
ion
feat
ures
!
Sta
ndar
dize
d ra
nges
•
Ven
dors
(hi
stor
y)
o C
ost (
BY
, un
burd
ened
$)
•
Pro
ject
tem
plat
es
o P
roje
ct x
o
Cos
t (B
Y,
unbu
rden
ed
$)
o R
OM
Quo
tes
!
Des
ign
num
ber
! T
ool n
umbe
r
Figu
re 6
.22
Pro
cure
men
t Man
agem
ent
Con
cept
ual
Inf
orm
atio
n H
iera
rchi
es
Fig
ure
7.23
Pro
cure
men
t Man
agem
ent C
once
ptua
l
I
nfor
mat
ion
Hie
rarc
hies
CO
DIF
ICA
TIO
N S
TRA
TE
GIE
S R
ecip
roca
l int
erde
pend
enci
es a
re m
anag
ed v
ia r
elat
iona
l co
ncep
tual
info
rmat
ion
hier
arch
ies
quer
ies
by:
1)
Info
rmat
ion
hier
arch
ies
(dat
abas
es)
2)
FF
PM
Fab
rica
tion
Pla
n
3)
CB
S w
ork
cent
er n
umbe
r
•
CB
S W
ork
Cen
ter
(WC
) D
ata
o W
C n
umbe
r o
WC
loc
atio
n o
WC
layo
ut
o P
roce
ss d
escr
ipti
ons
o W
ork
er c
lass
ific
atio
ns
o M
ater
ial h
andl
ing
info
rmat
ion
! W
C i
ngre
ss/e
gres
s co
rrel
ated
to fe
atur
es
o P
roce
ssin
g sy
stem
inf
orm
atio
n !
Mos
t use
d M
& P
Spe
cs
! N
on-d
esig
n to
ols
! E
quip
men
t inv
ento
ry
• C
orre
late
d to
fea
ture
s (T
BD
)
Fig
ure
7.19
Inf
orm
atio
n S
ilos
Tra
nsfo
rmed
Int
o
Con
cept
ual
Info
rmat
ion
Hie
rarc
hies
(
Upd
ated
Fro
m F
igur
e 7.
5)
•
Wor
k M
easu
rem
ent
• W
ork
cent
er n
umbe
r •
Proc
ess
stud
ies
•
Mat
eria
l ha
ndli
ng c
onst
rain
ts
bas
ed o
n de
sign
sel
ecti
ve
an
tici
pati
on f
eatu
res
• G
roup
ed s
tand
ard
CE
Rs
sens
itiv
e
to
des
ign
sele
ctiv
e
ant
icip
atio
n fe
atur
es
• D
etai
l fe
atur
es-b
ased
sta
ndar
d
va
lues
(se
nsit
ive
to a
ll f
eatu
res;
for
spe
cifi
c ap
plic
atio
n to
nea
rly
c
ompl
ete
desi
gn)
• T
BD
Figu
re 7
.20
WM
S C
once
ptua
l Inf
orm
atio
n
H
iera
rchi
es
•
Pro
ject
/Pro
gram
o
WB
S
o S
WB
S (
Mas
ter
Sche
dule
) o
CB
S
o A
ccou
ntin
g m
onth
s o
Fac
tors
!
Non
rec
urri
ng
• T
BD
•
TB
D
! R
ecur
ring
•
TB
D
• T
BD
o
Rat
es
! N
on r
ecur
ring
•
TB
D
• T
BD
!
Rec
urri
ng
• T
BD
•
TB
D
o L
earn
ing
curv
es
! A
ssem
bly
CB
S nu
mbe
r •
TB
D
• T
BD
!
Fabr
icat
ion
CB
S n
umbe
r •
TB
D
• T
BD
!
Oth
er
• T
BD
Figu
re 7
.24
Con
cept
ual B
usin
ess
M
anag
emen
t
Inf
orm
atio
n H
iera
rchi
es
Pag
e 29
6
Tab
le 7
.12
Fram
ewor
k of
the
FFPM
Fab
rica
tion
Pla
n (S
egm
ent o
nly)
Fig
ure
7.22
Mak
e/B
uy P
olic
ies
Man
agem
ent
Con
cept
ual I
nfor
mat
ion
Hie
rarc
hies

304
Previously presented Figure 7.18 (page 260) is now updated to reflect the
information development of Section 7.10, and is provided as Figure 7.26
In the next section, the segment of Figure 7.26 titled “Sequence decisions based
on the management of existing requirements” is developed.
• Design Processing Categories (Section 7.7) o Product Data Management System (EBOM/Product Structure) (Section 7.3; 7.8.2) ! Features [Features DesignSelectiveAnticipation (Mfg) + Features ManufacturingSelectiveAnticipation (Design)] (Section 7.8.1; Figure 7.8) (Section 7.9.2)
• Feedforward Planning Model (FFPM) o CBS Work Centers (Section 7.4.2) ! Technical processing systems information
• M&P standards and specifications by work center (Section 7.6) • Equipment inventory (Section 7.8)
o Equip specs correlated to Features DesignSelectiveAnticipation (Mfg) + Features ManufacturingSelectiveAnticipation (Design) + FeaturesDesignOther(Mfg) • Manufacturing Engineering studies by work center (Section 7.6) • Specific processing capabilities limits [FeaturesDesignSelectiveAnticipation(Mfg)
FeaturesManufacturingSelectiveAnticipation(Design)] (Section 7.9) • Design specific tooling used on past designs (historical data by product by type, i.e., part of tool classification and control system) (Section 7.8.2)
o Tool codes (Tool Type; Features DesignSelective anticipation (Mfg) ) o Tools to make tools on past designs ! Tool features (Will not be addressed)
• Non-design specific tools (located in the areas, such as portable hole processing systems) inventory (Section 7.6)
! Resources (management strategy) (overhead not discretely considered) • Direct labor hours (touch) (Section 7.10) • Machine hours (Section 7.10) • Direct labor hours (other) (Section 7.10) • Procurement dollars (Section 7.10)
! Sequencing (scheduling/availability) • Sequence decisions based on the management of existing requirements
(already planned for other products) (Section 7.11) o Labor hours by shift by timeframe (Section 7.11) o Machine hours by shift by timeframe (Section 7.11)
• Technical sequencing considerations linked with the Master Schedule (internal scheduling) (Section 7.12)
• Sequencing decisions based on management of new requirements by work center (incomplete designs) (Section 7.13)
Figure 7.26 RIM DSS Development Conceptual Framework (Update of Figure 7.18)
#1
#2
#3
Highlighted numbers refer to capability
contexts discussed in Section 7.5.

305
7.11 Sequencing Decisions Based on the Management of Existing Requirements
In this section the information hierarchy related to the segment of Figure 7.26
titled “Sequencing decisions based on management of existing requirements” is
presented. First, a general discussion of the manufacturing execution system (MES) is
offered. Next, sequencing decisions within the context of capacity decisions are
overviewed. Lastly, IPT decisions using the envisioned DSS are discussed.
7.11.1 Manufacturing Execution System (MES) Assumptions
The basics of personnel forecasting, requirements planning, and requirements
scheduling are discussed in The Handbook of Industrial Engineering: Technology and
Operations Management. (Salvendy, 2001.) Chapter 64 “Personnel Scheduling” and
Chapter 78 “Advanced Planning and Scheduling Manufacturing” discuss a variety of
algorithms commonly incorporated into computerized systems used for managing
manufacturing requirements and resources, i.e., manufacturing execution systems. In
general, the approaches presented in this research do not deviate significantly from
commonly accepted practices discussed in the handbook.
In this research, a MES is assumed to be part of the Factory Management activity,
(i.e., Chapter 2, IDEF0 diagrams, Figure 2.4, Activity 1, page 53). It is further assumed
the primary purpose of an MES is to manage the labor and schedule requirements of
manufacturing jobs (i.e., orders; not jobs in the context of employment). These
requirements are broken into two major categories: 1) jobs that are currently being
processed and 2) planned future jobs. In order to plan and manage a job within the MES,
the requirements must be expressed in terms of:
306
• Job type (design number or placeholder) • WBS designation • Routing sequence by work center • Labor hours required for the job by work center • Design tools required for each work center • Schedule timeframe for the job expressed as a start or need date calculated
from the Master Schedule SWBS (Schedule Work Breakdown Structure)
Further, this research assumes the persons who developed the MES utilized many
of the industrial engineering principles found in the Handbook of Industrial Engineering
by Salvendy (2001). Therefore, this research discusses how information already within a
typical MES can be used to support conceptual design decision making, provided the
appropriate interface is available, i.e., through the DSS.
7.11.2 Capacity Requirements Planning
In the previous section, two major categories of jobs are listed: 1) jobs being
processed and 2) planned future jobs. “Planned future jobs” can be further subdivided
within the context of the two major categories. The expansion of item 2) is offered as
items a and b in the list that follows:
1) Jobs that are currently being processed 2) Planned future jobs
a. Firm - jobs based on complete released designs which are planned but have not yet started
b. Potential - jobs based on incomplete designs which are preliminary planned but have not yet started

307
The “Planned future jobs – Potential” category based incomplete designs does not
appear to be widely utilized and is infrequently discussed in the literature. One example
found in the literature (of only a few located) dealt with Intel’s implementation of a next
generation MES. (Mouli, 2005.) Though it is fairly common to simulate future work
using this approach in large blocks of task hours, it is atypical for individual jobs to be
planned in detail prior to design release. The main reason “Planned future jobs –
Potential” is not widely utilized is because the detailed work center routing information
required is typically unavailable until after a design is released. However, the logic
presented thus far in the RIM-based DSS mitigates this problem, and therefore, alleviates
the constraint and opens the way for a new manufacturing opportunity. “Planned future
jobs – Potential” are discussed in Section 7.12. Before discussing “Planned future jobs –
Potential” is necessary to first discuss “Planned future jobs – Firm.”
With regard to “Planned future jobs – Firm,” i.e., planned jobs based on complete
designs, this research assumes once a complete design is released, a job is planned using
the order release logic existing within the Factory Management and Planning activities.
(Factory Management and Planning are Activities 4 and 5 on the IDEF0 diagrams in
Chapter 2.) Typically, Factory Management Planning releases an order/job. The
Planning activity develops the routing (by CBS work center) and associates the job to
previously written tool orders, or writes new tool orders. Then, logic within the Factory
Management System prices/assigns labor hour requirements using WMS data and Master
Schedule SWBS information maintained by Business Management.
A baseline assumption of this research is that some organization/group within the
Factory Management activity (typically Industrial Engineering) develops information to

308
describe the maximum available capacity by work center for the current facility
configuration. The maximum available capacity is expressed in terms of the labor hours
by CBS work center by shift (usually three). In addition, the “Firm Planned Capacity” is
typically derived by using a combination of the planned standards hours by CBS work
center in conjunction with factors by work center, i.e., historical realization (viz.,
measured efficiency) and “other” factors. “Other” factors might include additional
realization losses due to first article manufacturing of a new product. These factors are
typically maintained in a capacity requirements planning (CRP) simulation database
within the MES. (Baker and Reckers, 2004; Zaner, 2003.)
Examples of capacity calculations for one work center are provided in Table 7.23.
In machining work centers, the labor hours equal the machine hours if one worker is
assigned per machine. Otherwise, machine hours are forecasted in a similar manner.
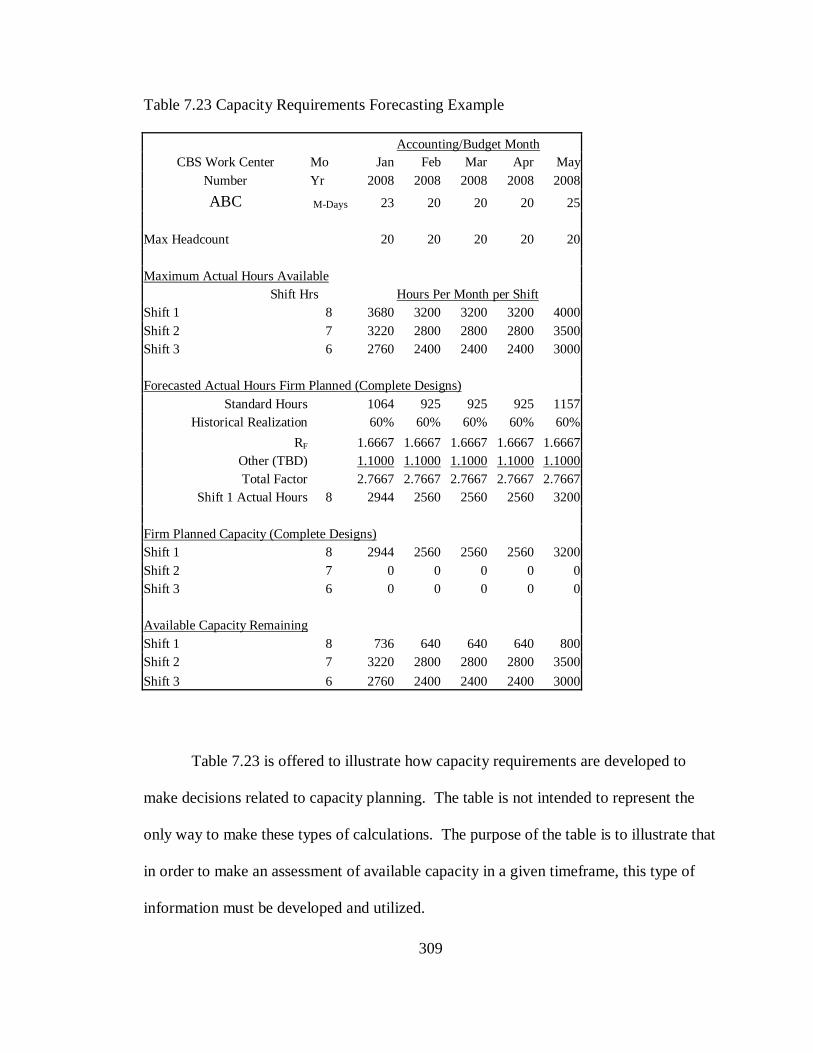
309
Table 7.23 Capacity Requirements Forecasting Example
Accounting/Budget Month CBS Work Center Mo Jan Feb Mar Apr May
Number Yr 2008 2008 2008 2008 2008
ABC M-Days 23 20 20 20 25 Max Headcount 20 20 20 20 20 Maximum Actual Hours Available Shift Hrs Hours Per Month per Shift Shift 1 8 3680 3200 3200 3200 4000 Shift 2 7 3220 2800 2800 2800 3500 Shift 3 6 2760 2400 2400 2400 3000 Forecasted Actual Hours Firm Planned (Complete Designs)
Standard Hours 1064 925 925 925 1157 Historical Realization 60% 60% 60% 60% 60%
RF 1.6667 1.6667 1.6667 1.6667 1.6667 Other (TBD) 1.1000 1.1000 1.1000 1.1000 1.1000 Total Factor 2.7667 2.7667 2.7667 2.7667 2.7667
Shift 1 Actual Hours 8 2944 2560 2560 2560 3200 Firm Planned Capacity (Complete Designs) Shift 1 8 2944 2560 2560 2560 3200 Shift 2 7 0 0 0 0 0 Shift 3 6 0 0 0 0 0 Available Capacity Remaining Shift 1 8 736 640 640 640 800 Shift 2 7 3220 2800 2800 2800 3500
Shift 3 6 2760 2400 2400 2400 3000
Table 7.23 is offered to illustrate how capacity requirements are developed to
make decisions related to capacity planning. The table is not intended to represent the
only way to make these types of calculations. The purpose of the table is to illustrate that
in order to make an assessment of available capacity in a given timeframe, this type of
information must be developed and utilized.

310
The top segment of Table 7.23 contains the M-days (i.e., manufacturing days) per
month for a given year and the maximum headcount possible for work center ABC. The
next segment illustrates the calculation of the “Maximum Actual Hours Available” based
on the headcount and the number of shift hours. (For example, in January 2008, M-days
=23, Max Headcount =20, and Shift 1 hours = 8; 23 x 20 x 8 = 3680 hours.)
The third segment of the table depicts how standard hours are adjusted by various
factors to develop the “Forecast Actual Hours Firm Planned (Complete Designs).” The
“Firm Planned Capacity (Complete Designs” depicts the results of the calculations in the
segment just prior. Rf is the realization (i.e., performance or efficiency) factor. Rf is the
inverse of “Historical Realization.” (For example, a historical realization of 60%
converts to an Rf = 1/0.60 = 1.667; 1.667 + 1.1000 = 2.7667. In January 2008, 1064
standard hours have been planned and these standard hours are estimated to require
1064 x 2.7667 = 2944 actual hours charged.)
The last section of Table 7.23 provides the value for “Available Capacity
Remaining.” The “Available Capacity Remaining” is calculated by subtracting the “Firm
Planned Capacity” in a given accounting month from the “Maximum Actual Hours
Available.” Referring to the last segment of Table 7.23, in the month of January 2008, a
second shift is not required, in that, there are 736 forecasted hours of remaining capacity.
(3680 available hours – 2944 actual hours forecast = 736 hours remaining.)
If capacity requirements go beyond the “Maximum Actual Available Hours
Available” in a given accounting month for the “Shift 1” level, then overtime and/or
additional shifts are necessary. If the total forecasted capacity requirement exceeds the
level that a three-shift operation can handle, then facility configuration changes are

311
warranted or the work must be planned for outside suppliers. Even though
manufacturing should have contingency plans that outline the alternatives for increasing
capacity, this type of information is typically not easy to locate. Hence, the DSS will
prompt the IPT to make the appropriate inquiries.
It is important to note that “accounting month” is part of capacity and
performance records because it forms the baseline for budget and cost calculations
accomplished by the Business Management activity. Period-specific rates and factors
(See Figure 7.24, page 301) are applied to period-specific requirements in order to
determine period-specific costs. Cost and budget are relative terms and only have real
world meaning when in the context of a properly derived timeframe of occurrence, (i.e.,
schedule.) For example year 1999 dollars are not the same as year 2000 dollars in the
context of pricing and contracts. If the labor hours are expended in a different
timeframe, then cost will be different. Hence, this type of knowledge has reciprocal
interdependencies related to “Sequencing” (See Figure 7.26).
In many instances, the type of capacity information presented Table 7.23 is
difficult to extract from a MES. Quite often individuals writes personal ad hoc programs
to obtain the information or is in close contact with individuals responsible for capacity
requirements planning (CRP) in order to obtain accurate and timely data. This research
assumes than an interface is developed which allows information to be directly assessed
by the RIM-based DSS for use by the IPT, and thus, eliminates ad hoc approaches.
Conceptual information hierarchies related to the “Planned future jobs – Firm” in
the context of CRP are illustrated in Figures 7.27 and 7.28. Figure 7.27 conveys the
capacity information discussed in Table 7.23. Figure 7.28 conveys the scheduling

312
hierarchies required to support pricing jobs (i.e., planning work measurement standard
hours) over a specified timeframe. It is assumed the information in Figures 7.27 and 7.28
are maintained by industrial engineering in support of the Factory Management activity,
(i.e., IDEF0 diagrams, Chapter 2.)
• Capacity o Work center number ! Max headcount by shift ! Max machines by shift ! Max actual hours available by shift
by accounting month ! Forecast actual hours firm planned
(complete designs) by shift by accounting month
• Firm planned Capacity (complete designs) by shift by accounting month • Available capacity remaining by
shift by accounting month • Contingency plans • TBD
• CRP Simulation o Work center ! Realization factor
• Other factors • TBD
Figure 7.27 Capacity Conceptual Information Hierarchies

313
7.11.3 IPT Decisions Supported by the DSS
If a working-level IPT has access to information about how much capacity is
available by work center in a given timeframe (accounting month), then they can use this
information to make decisions about incomplete designs. In particular, the IPT can
identify potential bottlenecks.
In addition, if Factory Management has already developed utilized industrial
engineering and manufacturing engineering to develop contingency plans related to
capacity, then the IPT should not spend their time doing redundant studies/assessments.
Instead, the starting point of discussion should be the existing “Contingency plans” in
Figure 7.27. A key job of the IPT and the manufacturing representative is to coordinate
with Factory Management.
There are several problems in the context of capacity planning that fall within
Verganti’s classification of superficial anticipation. Many schedule issues uncovered
• Scheduling o SWBS ! Work center number
• M-days o Historical data ! Work center makespan (setback)
• Design selective anticipation features • Tool design selective anticipation features (not defined in this research) • TBD
Figure 7.28 Scheduling Conceptual Information Hierarchies

314
during the detail design phase, (i.e., after the design is released) result from superficial
anticipation of capacity requirements during the earlier stages of design. Quite often
IPTs do not have industrial engineering expertise and fail to realize the significance of
capacity or cannot address relevant capacity issues.
It is one thing to understand what capacity generally means, however, it is
something else to understand how capacity data are developed, maintained, and used on a
daily basis in the Factory Management activity. Similarly, many do not understand the
need to do capacity contingency planning even when a new design is not fully defined.
The proposed DSS allows IPT members to query a specific timeframe and view
existing capacity. Examples of queries include:
• Design Processing Categories (Figure 7.7, page 203),
• CBS work center (Figure 7.4, page 181), and
• total project
Before proceeding to the next section, it is necessary to recap the information
development thus far in the context of the RIM-based information hierarchies not yet
defined. The previously defined Figure 7.26 now has additional items colored in “black”
that have been defined, and areas in “blue italics” that remain to be defined. The
“Sequencing decisions based on the management of existing requirements” segment is
now black. The updated version is presented in Figure 7.29.

315
In the next section, the area in blue titled “Technical sequencing considerations
linked with Master Schedule (internal scheduling)” is discussed.
• Design Processing Categories (Section 7.7) o Product Data Management System (EBOM/Product Structure) (Section 7.3; 7.8.2) ! Features [Features DesignSelectiveAnticipation (Mfg) + Features ManufacturingSelectiveAnticipation (Design)] (Section 6.8.1; Figure 76.8) (Section 7.9.2)
• Feedforward Planning Model (FFPM) o CBS Work Centers (Section 7.4.2) ! Technical processing systems information
• M&P standards and specifications by work center (Section 7.6) • Equipment inventory (Section 7.8)
o Equip specs correlated to Features DesignSelectiveAnticipation (Mfg) + Features ManufacturingSelectiveAnticipation (Design) + FeaturesDesignOther(Mfg) • Manufacturing Engineering studies by work center (Section 7.6) • Specific processing capabilities limits [FeaturesDesignSelectiveAnticipation(Mfg)
FeaturesManufacturingSelectiveAnticipation(Design)] (Section 7.9) • Design specific tooling used on past designs (historical data by product by type, i.e., part of tool classification and control system) (Section 7.8.2)
o Tool codes (Tool Type; Features DesignSelective anticipation (Mfg) ) o Tools to make tools on past designs ! Tool features (Will not be addressed)
• Non-design specific tools (located in the areas, such as portable hole processing systems) inventory (Section 7.6)
! Resources (management strategy) (overhead not discretely considered) • Direct labor hours (touch) (Section 7.10) • Machine hours (Section 7.10) • Direct labor hours (other) (Section 7.10) • Procurement dollars (Section 7.10)
! Sequencing (scheduling/availability) • Sequence decisions based on the management of existing requirements
(already planned for other products) (Section 7.11) o Labor hours by shift by timeframe (Section 7.11) o Machine hours by shift by timeframe (Section 7.11)
• Technical sequencing considerations linked with the Master Schedule (internal scheduling) (Section 7.12)
• Sequencing decisions based on management of new requirements by work center (incomplete designs) (Section 7.13)
Figure 7.29 RIM DSS Development Conceptual Framework (Update of Figure 7.26)
#1
#2
#3
Highlighted numbers refer to capability
contexts discussed in Section 6.5
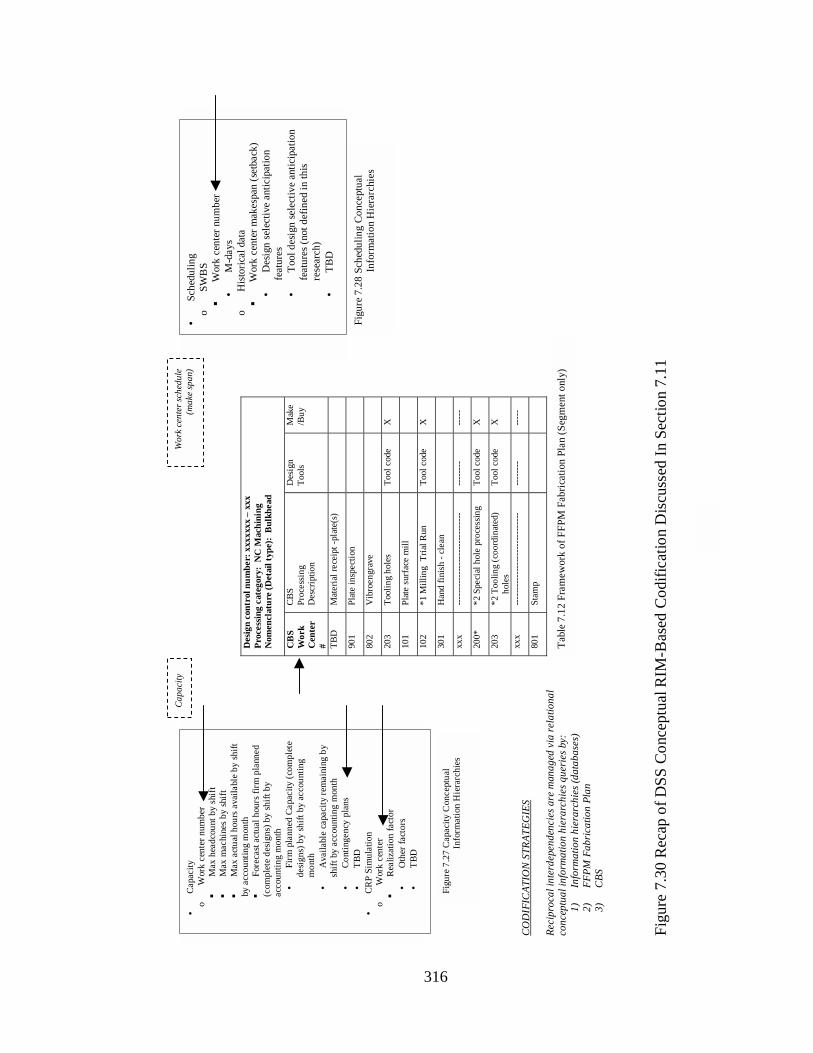
316
Des
ign
cont
rol n
um
ber:
xxx
xxxx
– x
xx
Pro
cess
ing
cate
gory
: N
C M
achi
ning
N
omen
clat
ure
(D
etai
l typ
e):
Bul
khea
d C
BS
Wor
k C
ente
r #
CB
S Pr
oces
sing
D
escr
iptio
n
Des
ign
Too
ls
Mak
e/B
uy
TB
D
Mat
eria
l rec
eipt
-pl
ate(
s)
901
Plat
e in
spec
tion
802
Vib
roen
grav
e
203
Too
ling
hol
es
Too
l cod
e X
101
Plat
e su
rfac
e m
ill
102
*1 M
illin
g T
rial
Run
T
ool c
ode
X
301
Han
d fi
nish
- c
lean
xxx
----
----
----
----
----
----
----
--
----
----
--
---
200*
*2
Spe
cial
hol
e pr
oces
sing
T
ool c
ode
X
203
*2 T
oolin
g (c
oord
inat
ed)
hol
es
Too
l cod
e X
xxx
----
----
----
----
----
----
----
--
----
----
--
---
801
Stam
p
Fig
ure
7.30
Rec
ap o
f D
SS
Con
cept
ual R
IM-B
ased
Cod
ific
atio
n D
iscu
ssed
In
Sec
tion
7.11
CO
DIF
ICA
TIO
N S
TRA
TE
GIE
S R
ecip
roca
l int
erde
pend
enci
es a
re m
anag
ed v
ia r
elat
iona
l co
ncep
tual
info
rmat
ion
hier
arch
ies
quer
ies
by:
1)
Info
rmat
ion
hier
arch
ies
(dat
abas
es)
2)
FF
PM
Fab
rica
tion
Pla
n
3)
CB
S
•
Cap
acity
o
Wor
k ce
nter
num
ber
! M
ax h
eadc
ount
by
shif
t !
Max
mac
hine
s by
shi
ft
! M
ax a
ctua
l hou
rs a
vaila
ble
by s
hift
by a
ccou
ntin
g m
onth
!
Fore
cast
act
ual h
ours
fir
m p
lann
ed
(c
ompl
ete
desi
gns)
by
shif
t by
acco
unti
ng m
onth
•
Firm
pla
nned
Cap
acity
(co
mpl
ete
des
igns
) by
shi
ft b
y ac
coun
ting
m
onth
•
Ava
ilabl
e ca
paci
ty r
emai
ning
by
s
hift
by
acco
unti
ng m
onth
•
Con
ting
ency
pla
ns
• T
BD
•
CR
P Si
mul
atio
n o
Wor
k ce
nter
!
Rea
lizat
ion
fact
or
• O
ther
fac
tors
•
TB
D
Figu
re 7
.27
Cap
acity
Con
cept
ual
Inf
orm
atio
n H
iera
rchi
es
•
Sche
duli
ng
o SW
BS
! W
ork
cent
er n
umbe
r •
M-d
ays
o H
isto
rica
l dat
a !
Wor
k ce
nter
mak
espa
n (s
etba
ck)
• D
esig
n se
lect
ive
anti
cipa
tion
fe
atur
es
• T
ool d
esig
n se
lect
ive
anti
cipa
tion
fe
atur
es (
not d
efin
ed in
this
re
sear
ch)
• T
BD
Figu
re 7
.28
Sche
duli
ng C
once
ptua
l
I
nfor
mat
ion
Hie
rarc
hies
316
Cap
acit
y W
ork
cent
er s
ched
ule
(mak
e sp
an)
Tab
le 7
.12
Fram
ewor
k of
FF
PM F
abri
cati
on P
lan
(Seg
men
t onl
y)

317
7.12 Technical Sequencing Considerations Linked with the Master Schedule
In this section, the segment of Figure 7.29 titled “Technical sequencing
considerations linked with the Master Schedule” is discussed. First, feedforward
planning concepts from Verganti’s study are overviewed within the context of IPTs and
sequencing/scheduling decisions. This is followed by the presentation of a high-level,
first-article Master Schedule. Next, RIM concepts are used to identify the potential
problems with current approaches. Finally, the method selected for the conceptual RIM-
based DSS is presented.
7.12.1 Feedforward Planning Concepts and Sequencing (Scheduling)
In Verganti’s research, three concepts are identified that reflect on the sequencing
(scheduling) aspect of feedforward planning: 1) feedforward planning effectiveness, 2)
early process engineering, and 3) superficial anticipation. These concepts are previously
discussed in Section 6.10 within the context of “Resources” and can similarly be applied
to “Sequencing.”
With regard to feedforward planning effectiveness, a 16-year study of DOD
acquisition projects performed by Swank et al. (2000) reports the average overrun in cost
and schedule were 40% and 62%, respectively. Hence, it is reasonable to conclude
current approaches are ineffective in feedforward planning efforts.
Similarly, with regard to early process engineering, there is inadequate knowledge
transfer between the earliest decision makers and the working-level IPTs. As discussed
in Chapter 5, working-level IPTs are typically required to start over and develop new
318
estimates of internal schedules, even though these tasks were supposedly performed as a
part of contract negotiations to support development of the Master Schedule.
As discussed in Section 5.1, page 115, initial programmatic schedules and cost
estimates are developed using a top-down methodology, which does not lend itself to
knowledge transfer for the purposes of managing a project. As soon as the contract is
awarded, the working-level IPTs are required to perform a bottoms-up type approach to
develop information required to populate management information tools.
Another type of knowledge transfer does not typically take place, which was
previously discussed in Chapter 1, and as observed by this author. The decision drivers
of downstream activities (e.g., capacity and line balancing) are not transferred to
working-level IPT decision makers. (Lee et al., 2001; Ma et al., 2002; Reich et al., 1999;
Richards, 2000; Xiong, 2003; Yang et al., 2003.) IPTs tend to develop schedule
knowledge in a “vacuum” and fail to recognize the real schedule can only be determined
by loading the MES with requirements information so consideration of other jobs and
line balancing can take place. There is typically no direct link between the MES
scheduling logic and the schedules the working-level IPTs develop. As discussed earlier
in the context of capacity analysis, unless an IPT member has an industrial engineering
background, he/she likely does not understand the concept of line balancing.
With regard to the third feedfoward planning concept, selective anticipation, the
problems existing in the context of estimating “resources” requirements also occur within
the context of predicting “sequencing/scheduling” requirements. Superficial anticipation
results in a basis of information with limited definition from which to make meaningful
change or adjustment. Even though the working-level IPTs are provided a high-level
319
schedule, they are tasked to develop a bottoms-up schedule, identify errors, and fill in the
technical design and manufacturing details to support a Master Schedule that has already
been agreed upon. In order to properly develop the internal schedule, bottoms-up
estimates of “resources” requirements are needed in order to develop internal schedules.
As discussed in Chapter 1, many IPT members do not have the expertise to
accomplish the required level of detailed work with incomplete design information. This
is the result of cultural issues (Asideu and Gu, 1998; Austin et al., 2001; Tolometti and
Saunders, 1998; Vollerthun, 1998; Wierda, 1990) and specialized hierarchies of
knowledge (Winter, 1999.) This assertion is further supported by this author’s practical
work experience. Due to the lack of expertise, a superficial baseline of
sequencing/scheduling knowledge exists for a very long time on a project. During the
early stages of design, changes to the baseline become fruitless; detailed trade studies of
specific design changes result in discrete deltas that are incorporated to a parametric
baseline.
7.12.2 High-Level Master Scheduling for First-Article
The “Integrated Master Plan and Schedule Guide” published by the Air Force
Material Command (2004) provides an example of an initial Integrated Master Schedule
(IMS) provided to a working-level IPT. The IMS is often created in Microsoft Project
and has very high-level activities. Examples of high-level activities include:
• Design drawings • Manufacturing plan • Material procurement

320
• Fabricate in-house parts • Assemble first article
The IPTs are required to develop internal schedules for these types of high-level
activities using the WBS and Master Schedule to support the development of the
Schedule Work Breakdown Structure (SWBS) for the first-article. The Master Schedule
typically contains the contractual delivery dates that have been promised to the customer
and the SWBS contains internal scheduling dates that are required to meet the contractual
deliveries.
An example of a first-article internal schedule is provided in Figure 7.31, and it
includes only the expanded schedule setbacks (backward schedules) for the forward,
center, and aft components of an aircraft. The word setback is a commonly used aircraft
term, as an aircraft manufacturing progress is typically conveyed as a combination of
setbacks and positions. (Gunston, 1988.) Gantt chart dates coincide with the estimates of
when these blocks of tasks start and finish, as well as how the total hours (e.g., resources)
are spread in the proposal/bid.
Based on this author’s experience, there are typically few resources estimates or
technical requirements descriptions traceable to lower-level task accomplishment. (If this
were not the case, then the Air Force Material Command document (2004) would not
direct working-level IPTs to create this detailed information.) Estimating jargon refers to
the situation as a peanut butter spread, so from the very beginning the estimate of cost is
not reflective of a useful combination of resources and schedule requirements. Though
not depicted on the Figure 7.31, an internal schedule also includes typically the projected
calendar dates of starts and completions for each WBS.

321
FORWARD
CENTER
AFT
Horizontal Vertical Wings Landing Gear (LG) TBD
F1
F2
F3
C1
C2
C3
A1
A2
TOOL ORDERS & WORK INSTRUCTIONS
DESIGN RELEASE
TOOL DESIGN & TOOL MANUFACTURING
Structure Plumbing Electrical SC – subcomponent assembly M2 –Mate 2
WORK PACKAGES/ORDERS RELEASED
FINAL ASSYM2 MATE 1COMPONENT SCDETAIL FAB
45151511535135 M-Days
PROCUREMENT
OTHER
Figure 7.31 Example of a First-Article Internal Schedule Provided to an IPT
WBS/SWBS Forward XXX/XXX Center XXX/YYY Aft XXX/ZZZ Horizontal “” Vertical “” Wings “” Landing Gear “” “” “”
321

322
Figure 7.31 depicts the typical schedule an IPT is provided. Note the entire design
release scheduled span is combined into one bar. Similarly, procurement, and other tasks
are represented as large bars only. The job of the IPT is to fill in all of the details to make
them match this type of high-level project plan representation.
7.12.3 RIM-Diagram of Sequencing (Scheduling)
In this section, a RIM-diagram (Table 7.24) is used to depict the reciprocal
interdependencies existing between various tasks in the context sequencing (scheduling)
of requirements. The RIM-diagram highlights some of the issues related to how
schedules are created for aircraft manufacturing.

Table 7.24 RIM-Diagram of Sequencing (Master and Internal Scheduling)
Master/Internal Scheduling
COMMON Conceptual
COMMON Conceptual and Preliminary
COMMON Detail First-Article
NEW (In-House) NEW (Suppliers)
TECHNICAL Master Schedule
Developer Business Management scheduling and Customer
Business Management scheduling and Customer
Business Management scheduling and Customer
Business Management scheduling and Customer
Information, Tools, and Processes
Customer delivery rate SOW Estimated EBOM Estimated design release curve Estimated hours per aircraft and learning curves Historical data , models, and “best guess”
ME & IE input -------------------------- Procurement and/or supplier information
Internal Schedules Developer Business Management
scheduling IPTs Factory Management
MES IPTs ----------------------------- Procurement/suppliers
Information, Tools, and Processes
Same as Master Start with Master Schedule, IMS, and IMP provided EBOM by WBS and SWBS (Process not well defined)
Scheduling logic within the MES Based on actual order release and need date
Internal-based on promised design release date and the estimated need date (Cost increases when dates change)
Level of Detail
Engineering Designs Work Instructions Tool Designs Tool Manufacturing Order Release
High-level (project) High-level (project) High-level (project) High-level (project) High-level (project)
Design release (DR) Dependent upon DR Dependent upon DR Dependent upon DR Occurs when all preceding tasks are complete (MES) Becomes actual start date
High-level (project) ------------------------- In general, high-level, with the exception of critical long lead procurement
Procurement High-level (project) Some suppliers identified
Dependent upon DR and/or related order date
Identify suppliers; quotes and contracts
Fabrication Assembly
High-level (WBS) High-level (WBS)
Discrete by EBOM design number (job) and work center Completion dates of prior tasks become actual start date Discrete by EBOM design number (job) and work center station
New equipment and processes – vendors located; technology insertion plan developed
RESOURCES Fabrication Hours Assembly Hours Direct Labor (non- touch) Procurement Dollars
High-level (WBS) High-level (WBS) High-level (WBS) High-level (WBS)
Detailed- work center Detailed-station Detailed-WBS/CBS Detailed-WBS/CBS
SEQUENCING
Assembly line balancing Fabrication line balancing
Assumed Assumed
MES capacity leveling Load sequencing and crew loading Cost increases when disconnects occur
Supplier delivery dates must be synced with in-house need dates Cost increases when disconnects occur
N O T
W E L L
D E F I N E D
Master Schedule delivery dates and total quantities can change based on performance to internal schedules and subsequent negotiations
IPTs should utilize information from detail design sytems, i.e., MES
323

324
The RIM-diagram in Table 7.24 is organized in a similar manner to prior RIM
diagrams. Various designations of Common and New are found within the column
headings, and major categories of Technical, Resources, and Sequencing are located in
the far left column. The Common information is further segmented into three columns
related to design phase, while the New information is broken into in-house and suppliers
considerations using by dividing the cell into upper and lower segments.
In the following paragraphs, Table 6.24 is discussed. Note that every cell in the
table is not discussed; but instead only a major sampling is offered. The significant point
being highlighted is information exchange processes and procedures between the
working-level IPTs and upstream and downstream users of information are not well
defined.
The first section under “Technical” is labeled “Master Schedule.” The Master
Schedule is developed based on negotiations between Business Management and the
customer. The contractual Master Schedule is typically composed of aircraft deliveries
only, i.e., the internal schedules for each aircraft are left to the discretion of the enterprise
and can be somewhat flexible.
The second section under “Technical” is titled “Internal Schedules.” The initial
internal schedules are developed by Business Management at a very high-level and only
designate major milestones and blocks of tasks. The IPTs are expected to fill in all of the
details below the high-level tasks for internal scheduling. Once an actual order is
released to initial the scheduling of a specific job at the work center level, the Factory
Management MES schedules an order based on the actual order release date and the need
date specified in the job/order. Suppliers develop their own internal schedules during

325
negotiations with the enterprise. Typically, these are based on promised dates of
important information. If these dates are missed, then costs increase.
The third subsection under “Internal Schedules” is titled “Level of Detail.” The
Integrated Master Schedule (IMS) and the Integrated Master Plan (IMP) (AFMC, 2004)
contain elements at a very high-level for “Engineering Designs, Work Instructions, Tool
Designs, Tool Manufacturing, Order Release, etc.” Business Management initially
agrees to “High-level (project)” schedules. Subsequently, the working-level IPTs are
supposed to fill in the lower-level details; however a method for doing so is not well
defined. Once the Engineering activity achieves a “Design release (DR),” the task
details are determined using information with detail design phase systems located in
Factory Management, Planning, and Tooling activities (i.e., IDEF0 diagrams, Chapter 2).
The actual internal schedules are developed by MES logic at order release.
The fourth subsection under “Internal Schedules” is labeled “Procurement.”
Scheduling procured items is a significant task and greatly impacts the total cost of an
aircraft. Approximately 46.7% of the cost of an aircraft is based on direct material
(Kloos, 2007). The master scheduling process typically identifies some suppliers for long
lead items, but many suppliers will have to be identified by the IPTs.
The fifth subsection under “Internal Schedules” has two categories, “Fabrication”
and “Assembly.” During the initial pricing of a project, the schedule is defined at a high-
level based on the WBS, i.e., “High-level (WBS).” The working-level IPTs are not
involved in the sequencing/scheduling process until after the post-award conference.
(AFMC, 2004.) Ultimately, designs are scheduled using design numbers from the

326
EBOM, and these design numbers correspond to jobs manufactured as design detail parts
or kits of parts.
The next section of the RIM-diagram is titled “Resources.” The subsections are
designated as “Fabrication Hours, Assembly Hours, Direct Labor (non-touch), and
Procurement Dollars.” (Procurement is mentioned a second time in this section to
emphasize the spreading of procurement dollars over a given timeframe, and how the
scheduling of these dollars affects cost calculations.) During conceptual design, the
resources are scheduled at a high-level, and during the detail design phase, the resources
are scheduled at a detailed level. A significant point being highlighted is that information
exchange processes and procedures between the working-level IPTs and both upstream
and downstream users of information are not well defined.
The next section of the RIM-diagram is titled “Sequencing.” The subsections are
designated as “Assembly line balancing” and “Fabrication line balancing.” During the
conceptual design phase, requirements are scheduled at a high-level and a balanced line is
assumed. During the detail design phase, requirements are scheduled within the MES
and line balancing is accomplished via the MES. Again, the lack of well-defined
information exchange processes and procedures is highlighted .
Based on this author’s experience, line balancing of assembly hours for an aircraft
is typically more difficult than fabrication. The CBS work centers used in Detail
Fabrication rarely change significantly from aircraft to aircraft. However, the assembly
task typically requires the designation of a new work area of the facility and the creation
of several new assembly work centers.
327
In addition, in order to balance the total assembly line (i.e., both Fabrication and
Assembly simultaneously), the assembly installation sequence, (i.e., load sequence)
processing sequence, and personnel assignments (i.e., crewloads) are required for each
assembly task by EBOM control number. Similarly, even though estimates of design
tooling are made early on, the real estimates of production rate tooling (i.e., tooling
required to sustain a monthly rate of production) cannot be accomplished until the line
balancing activity is complete. Until a real allocation of hours is established, it is very
difficult to determine the amount of work that can be accomplished on one or more
aircraft concurrently. Parallel work is typically required to meet the contractual Master
Schedule delivery dates/rates. (The enterprise does not complete build one aircraft before
starting another. Instead, multiple equivalent aircraft are in work concurrently in any
given month.)
In the next section, the approach selected for the conceptual DSS is discussed.
7.12.4 Technical Scheduling Considerations: Conceptual DSS Approach
Based on the information from the RIM-diagramming effort in Table 7.23, the
approach selected for the conceptual DSS requires several conceptual information
hierarchies, as well as a new type of design release, a formal concept design release. A
formal concept design release provides the missing link between the baseline product
data in the EBOM and the scheduling systems used by the enterprise. This missing link
is required for similar reasons to the FFPM fabrication plan in Table 7.12, page 217.
The typical MES already has the capability to schedule jobs for the purposes of
simulation, i.e., “Planned future jobs - Potential.” The use of a concept design release
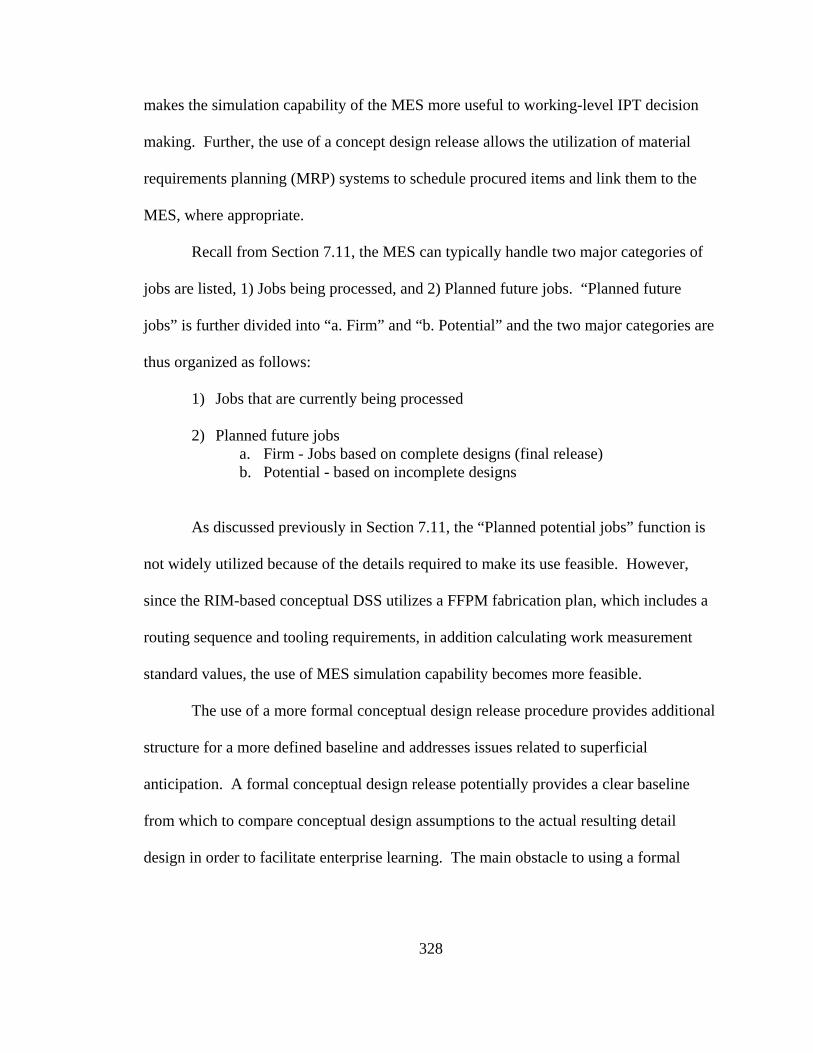
328
makes the simulation capability of the MES more useful to working-level IPT decision
making. Further, the use of a concept design release allows the utilization of material
requirements planning (MRP) systems to schedule procured items and link them to the
MES, where appropriate.
Recall from Section 7.11, the MES can typically handle two major categories of
jobs are listed, 1) Jobs being processed, and 2) Planned future jobs. “Planned future
jobs” is further divided into “a. Firm” and “b. Potential” and the two major categories are
thus organized as follows:
1) Jobs that are currently being processed 2) Planned future jobs
a. Firm - Jobs based on complete designs (final release) b. Potential - based on incomplete designs
As discussed previously in Section 7.11, the “Planned potential jobs” function is
not widely utilized because of the details required to make its use feasible. However,
since the RIM-based conceptual DSS utilizes a FFPM fabrication plan, which includes a
routing sequence and tooling requirements, in addition calculating work measurement
standard values, the use of MES simulation capability becomes more feasible.
The use of a more formal conceptual design release procedure provides additional
structure for a more defined baseline and addresses issues related to superficial
anticipation. A formal conceptual design release potentially provides a clear baseline
from which to compare conceptual design assumptions to the actual resulting detail
design in order to facilitate enterprise learning. The main obstacle to using a formal

329
concept design release is likely cultural for reasons similar to those discussed in relation
to the use of work measurement in Section 7.8.10 related to work measurement.
A conceptual design release is formalized by a conceptual design release package
of electronic information. Previously defined conceptual information hierarchies
combined with IPT decisions made within the framework of the DSS support the
generation of this package as follows:
• PDMS information hierarchies correlating WBS and design selective anticipation features
• IPTs select “design processing category”
• DSS correlates “design selective anticipation features” to ME Technical information hierarchies to obtain the beginning FFPM fabrication plan
• IPTs finalize FFPM fabrication plan, which includes (routing sequence by work
center CBS and tooling requirements)
• Once the package is released,
o MES work measurement system grouped standard “price” the design selective anticipation features (labor requirements) by CBS work center
o MES scheduling system “load” the calculated standard values by CBS in
the appropriate timeframe utilizing the Business Management SWBS
Formal concept design releases are not widely discussed in the literature, and only
one example could be located. Zhang et al. (2004) utilizes a concept design release in the
development of a collaborative product development tool for Qiqihaer Railway Ltd.
Company, a railway manufacturer in China. The use of a concept design release
facilitated the integration of information by enabling the use of software tools to work at
a lower-level of detail earlier in the design process. The information gained by digital
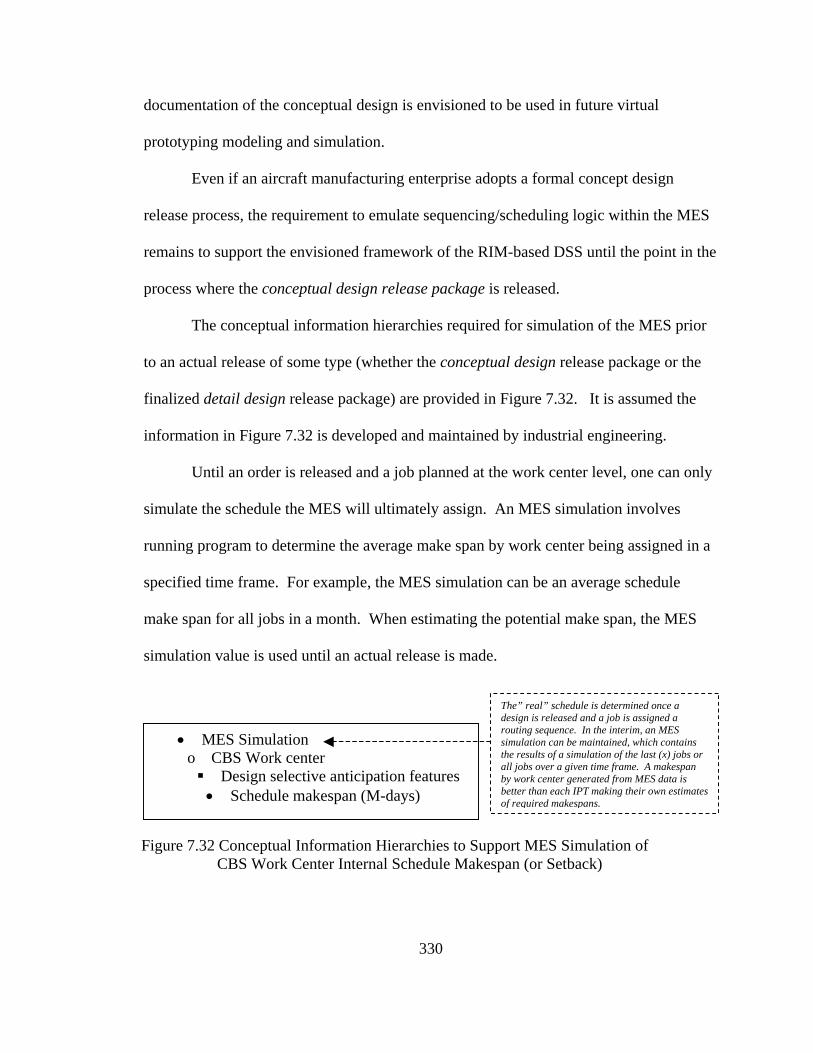
documentation of the conceptual design is envisioned to be used in future virtual
prototyping modeling and simulation.
Even if an aircraft manufacturing enterprise adopts a formal concept design
release process, the requirement to emulate sequencing/scheduling logic within the MES
remains to support the envisioned framework of the RIM-based DSS until the point in the
process where the conceptual design release package is released.
The conceptual information hierarchies required for simulation of the MES prior
to an actual release of some type (whether the conceptual design release package or the
finalized detail design release package) are provided in Figure 7.32. It is assumed the
information in Figure 7.32 is developed and maintained by industrial engineering.
Until an order is released and a job planned at the work center level, one can only
simulate the schedule the MES will ultimately assign. An MES simulation involves
running program to determine the average make span by work center being assigned in a
specified time frame. For example, the MES simulation can be an average schedule
make span for all jobs in a month. When estimating the potential make span, the MES
simulation value is used until an actual release is made.
• MES Simulation o CBS Work center Design selective anticipation features • Schedule makespan (M-days)
Figure 7.32 Conceptual Information Hierarchies to Support MES Simulation of
The” real” schedule is determined once a design is released and a job is assigned a routing sequence. In the interim, an MES simulation can be maintained, which contains the results of a simulation of the last (x) jobs or all jobs over a given time frame. A makespan by work center generated from MES data is better than each IPT making their own estimates of required makespans.
CBS Work Center Internal Schedule Makespan (or Setback)
330

331
Another aspect of “Internal Schedules” in Table 7.23 involves the “Direct Labor
(non-touch)” and “Procurement Dollars.” These internal schedules are required in order
to link the CBS work center schedules to the IPT deliverables schedules (i.e., detail
designs, work instructions, design tools), as well as to generate total cost calculations.
In Chapter 5, the working-level IPT members for this research are defined as:
• Structural design engineer (leader) (direct labor-design deliverable) • Systems design engineer (direct labor-design deliverable) • Test engineer (direct labor-design deliverable) • Tool designer (direct labor-tool design deliverable) • Planner (direct labor-work instructions deliverable) • Manufacturing engineer (direct labor-tooling integration deliverable) • Manufacturing representative (allocated to touch labor as supervision) • Purchasing representative (allocated to direct material) • Cost representatives (various; depends on program management) (overhead) • Quality assurance representative (allocated as direct overhead)
Chapter 5 discusses important working-level IPT decisions, include determining:
• The number of deliverables their respective activities (i.e., IDEF0 diagram activities, Chapter 2) are responsible for producing
• Schedule makespan (i.e., M-days) required for each deliverable, (i.e., released
designs, work instructions, tool designs, tool orders, etc.)
• Precedence relations between deliverable tasks
• The design release date that supports the contractual Master Schedule aircraft delivery date
In order for the envisioned RIM-based DSS to support the listed working-level
IPT decisions, logic rules must exist within the DSS, and schedule makespan templates
must exist within conceptual information hierarchies that pertain to
sequencing/scheduling information for each task. In addition, the information must be
relatable to the FFPM fabrication plan in Table 7.12, page 217.

332
Table 7.12 illustrates the fabrication plan for one detail design and it lists the
requirements for four design tools by tool code and by CBS work center. For the
purposes of illustration, it is assumed that two of the listed design tools are in-house make
tools, two are buy tools, and one of the in-house make tools requires a tool for its
manufacture (a tool-to-make-tool.) Based on these assumptions, the following
deliverables can be projected using the conceptual information hierarchies in Figure 7.33
and internal DSS logic rules illustrated in parentheses:
• Detail designs – 1 (based on 1 NC machined bulkhead) • Detail work instructions – 1 (based on 1 per detail design) • Tool orders – 5 (based on 2 make, 2 buy, 1 make tool-to-make-tool) • Tooling work instructions – (based on 2 + 1 = 3 (2 make, 1 make tool-to- make-tool) • Tool models – 5 (electronic data) (based on 2 make, 2 buy, 1 make tool-to- • make-tool) • Tool designs – 2+1 = 3 (based on 2 make, 1 make tool-to-make- tool)
Figure 7.33 reflects an update to the previously presented Figure 7.23 (page 299),
and includes DSS operation-required sequencing/scheduling information. The
conceptual information hierarchies’ updates are color coded in blue italics. It is assumed
the design templates information is developed and maintained by analysts in the
Engineering activity and tool code templates information is developed and maintained by
industrial engineering.

• Project o Design selective anticipation features Detail design templates • Design hours • Design M-days • Work instructions hours • Work instructions M-days Tool code templates • Tool model hours • Tool model M-days • Tool design hours • Tool design M-days • Tool manufacturing work instructions hours • Tool manufacturing work instructions M-days
Figure 7.33 Non-Recurring Engineering and Tool Design Direct Labor and Scheduling Conceptual Information Hierarchies (Updated Figure 7.23)
If a raw material, design processing category, or tool code is designated as a
procured (i.e., buy), then the DSS requires temporary values for the estimated
procurement timeframes. These temporary values are used for working-level IPT
decision making until the procurement representative obtains rough order of magnitude
(ROM) quotes or final bids for each identified requirement.
Project templates for these types of schedules are viewed as additions to
previously presented “Procurement Management” conceptual information hierarchies in
Figure 7.23, page 299, and are required for DSS operation to support IPT decision
making needs. The news conceptual hierarchies are provided in Figure 7.34 and updates
are color coded in blue italics. It is assumed the procurement historical data information
is developed and maintained by the procurement section of the Business Management
activity.
333
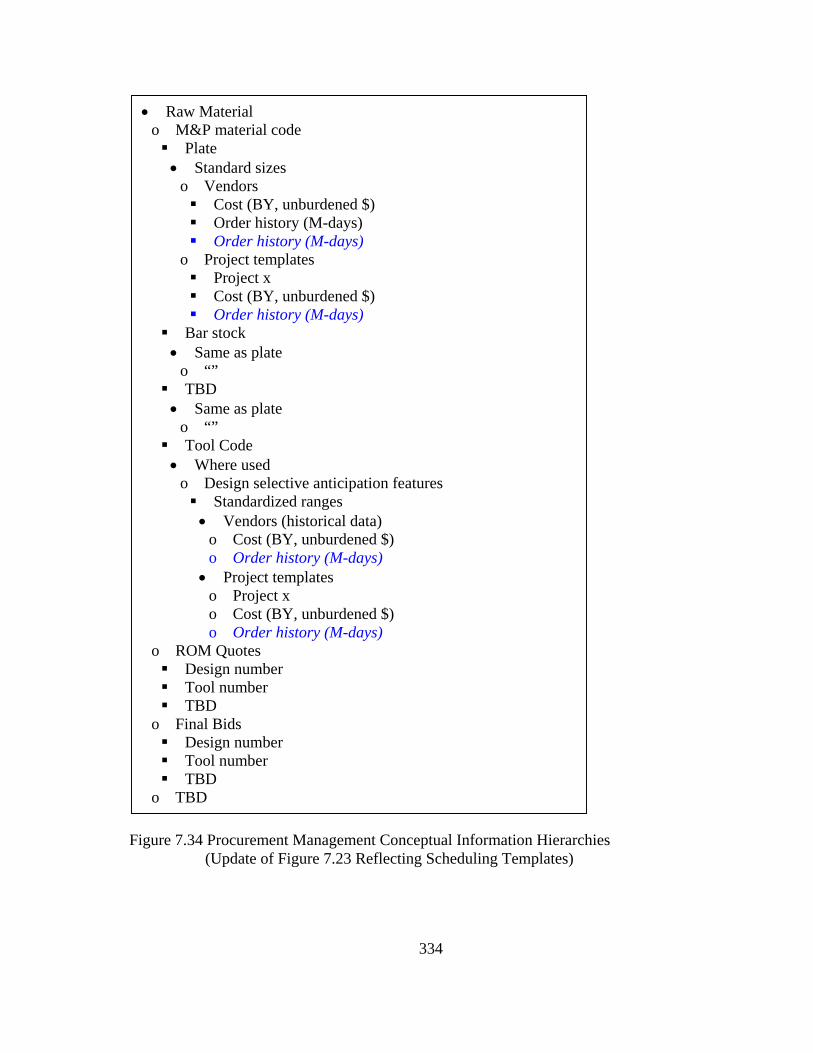
• Raw Material o M&P material code Plate • Standard sizes
o Vendors Cost (BY, unburdened $) Order history (M-days) Order history (M-days)
o Project templates Project x Cost (BY, unburdened $) Order history (M-days)
Bar stock • Same as plate
o “” TBD • Same as plate
o “” Tool Code • Where used
o Design selective anticipation features Standardized ranges • Vendors (historical data)
o Cost (BY, unburdened $) o Order history (M-days)
• Project templates o Project x o Cost (BY, unburdened $) o Order history (M-days)
o ROM Quotes Design number Tool number TBD
o Final Bids Design number Tool number TBD
o TBD
Figure 7.34 Procurement Management Conceptual Information Hierarchies (Update of Figure 7.23 Reflecting Scheduling Templates)
334

335
7.12.5 Integrated Resources Scheduling System An integrated resources schedule system (IRSS) is required to accomplish
sequencing/scheduling of resources that are not managed by the MES. It is assumed
working-level IPTs have access to an IRSS, which organizes project management type
information at the project and enterprise level. This type of information is required to
assist with project management decision making within the respective IPT supported
Activities, (i.e., IDEF0 diagrams’ Activities, Chapter 2.) It is assumed the Business
Management activity coordinates the development and maintenance of an IRRS, and the
system is interfaced to the DSS.
For example, as discussed in Chapter 5, page 115, a planner representing the
Planning activity (i.e., IDEF0 diagram, Figure 2.6, page 55) typically does not develop all
tool orders or work instructions. Instead, he/she develops – or coordinates - the plan for
how the tool orders and work instructions are managed. An example of the type of
information in a conceptual IRSS to support working-level IPT decision making is
provided in Table 7.25.

336
Table 7.25 Example of Integrated Resources Scheduling Information DESIGN CONTROL NUMBER xxxxxx-xxx
DOLLARS HRS NEED START FINISH BUSINESS MAGAGEMENT (Activity #1)
Master Scheduling SWBS 00/00/00
Procurement Raw material xx TBD 00/00/00
ENGINEERING (Activity #3)
Design TBD 00/00/00 00/00/00 Release date 00/00/00
PLANNING (Activity #5)
Total tool orders 5 Work instructions (WI) Tool manufacturing WI 2 TBD 00/00/00 00/00/00
Design manufacturing WI 1 TBD 00/00/00 00/00/00 Total WI 3
TOOLING (Activity #6) Tool Models
T1 1 TBD 00/00/00 00/00/00 T2 1 TBD 00/00/00 00/00/00 T3 1 TBD 00/00/00 00/00/00 T4 1 TBD 00/00/00 00/00/00T5 1 TBD 00/00/00 00/00/00
Total tool models 5 Tool Designs 2
(Tool-to-make-tool) T3 1 TBD 00/00/00 00/00/00 T4 1 TBD 00/00/00 00/00/00 T5 1 TBD 00/00/00 00/00/00
Total tool designs 5 Procured Tools
T1 1 TBD 00/00/00 T2 1 TBD 00/00/00
Total procured tools 2 Manufactured Tools
(Tool-to-make-tool) T3 1 TBD TBD 00/00/00 00/00/00 T4 1 TBD TBD 00/00/00 00/00/00 T5 1 TBD TBD 00/00/00 00/00/00
Total in-house manufactured tools 3
FABRICATION (Activity #7) Tool manufacturing Not detailed in this research 00/00/00 00/00/00
Design manufacturing TBD TBD 00/00/00 00/00/00 Design completion 00/00/00
(Factory Management Activities #2 and #4 are not correlated to monitored IPT deliverables)

337
Table 7.25 is organized to associate to the FFPM fabrication plan in Table 7.12,
page 217, and the DSS logic illustrated on page 332. The Chapter 2 IDEF0 activities are
denoted on the table, along with corresponding IPT deliverables. The table is assumed to
be nearly self-explanatory, and therefore, not specifically discussed. The dates shown in
Figure 7.24 are based a backward scheduling approach beginning with the contractual
delivery date of an aircraft. (Watson et al., 1997.)
Table 7.25 provides the reader with an even greater understanding of the amount
of detailed information working-level IPTs are required to develop in order to facilitate
the operation of various computerized systems within the enterprise. Even though other
disciplines may be the owners of these systems - and actually have representatives
performing data entry and reporting functions - the IPTs are typically required to generate
the underlying values and/or knowledge. The previously presented templates in Figure
7.32 , Figure 7.33, and Figure 7.34 support these efforts.
7.12.6 Recap of DSS Development Thus Far
Before moving on to the next section, it is necessary to recap the information
development thus far in the context of the RIM-based capability framework. Previously
presented Figure 7.29 is updated to become Figure 7.35. Figure 7.35 has additional items
colored in black that are defined in Section 7.11 and areas coded in blue italics that
remain to be defined.

• Design Processing Categories (Section 7.7) o Product Data Management System (EBOM/Product Structure) (Section 7.3; 7.8.2)
Features [Features DesignSelectiveAnticipation (Mfg) + Features ManufacturingSelectiveAnticipation (Design)] (Section 7.8.1; Figure 7.8) (Section 7.9.2)
• Feedforward Planning Model (FFPM) o CBS Work Centers (Section 7.4.2)
Technical processing systems information • M&P standards and specifications by work center (Section 7.6) • Equipment inventory (Section 7.8)
o Equip specs correlated to Features DesignSelectiveAnticipation (Mfg) + Features ManufacturingSelectiveAnticipation (Design) + FeaturesDesignOther(Mfg) • Manufacturing Engineering studies by work center (Section 7.6) • Specific processing capabilities limits [FeaturesDesignSelectiveAnticipation(Mfg)
FeaturesManufacturingSelectiveAnticipation(Design)] (Section 7.9) • Design specific tooling used on past designs (historical data by product by type, i.e., part of tool classification and control system) (Section 7.8.2)
o Tool codes (Tool Type; Features DesignSelective anticipation (Mfg) ) o Tools to make tools on past designs
Tool features (Will not be addressed) • Non-design specific tools (located in the areas, such as portable hole processing systems) inventory (Section 7.6)
Resources (management strategy) (overhead not discretely considered) • Direct labor hours (touch) (Section 7.10) • Machine hours (Section 7.10) • Direct labor hours (other) (Section 7.10) • Procurement dollars (Section 7.10)
Sequencing (scheduling/availability) • Sequence decisions based on the management of existing requirements
(already planned for other products) (Section 7.11) o Labor hours by shift by timeframe (Section 7.11) o Machine hours by shift by timeframe (Section 7.11)
• Technical sequencing considerations linked with the Master Schedule (internal scheduling) (Section 7.12)
• Sequencing decisions based on management of new requirements by work center (incomplete designs) (Section 7.13)
Highlighted numbers refer to capability
contexts discussed in Section 6.5
#3
#2
#1
Figure 7.35 RIM DSS Development Capability Conceptual Framework (Update of Figure 7.29)
It is important to summarize the conceptual RIM-based codification of
information hierarchies discussed in Section 7.11 before continuing to Section 7.12.
Codification involves the systematic classification and storage of knowledge
relationships to address predefined questions/issues. The relationships discussed in
Section 7.11 are offered in Figure 7.36. “Sequencing decisions based on management of
new requirements by work center” is discussed in the next section, Section 7.13.
338
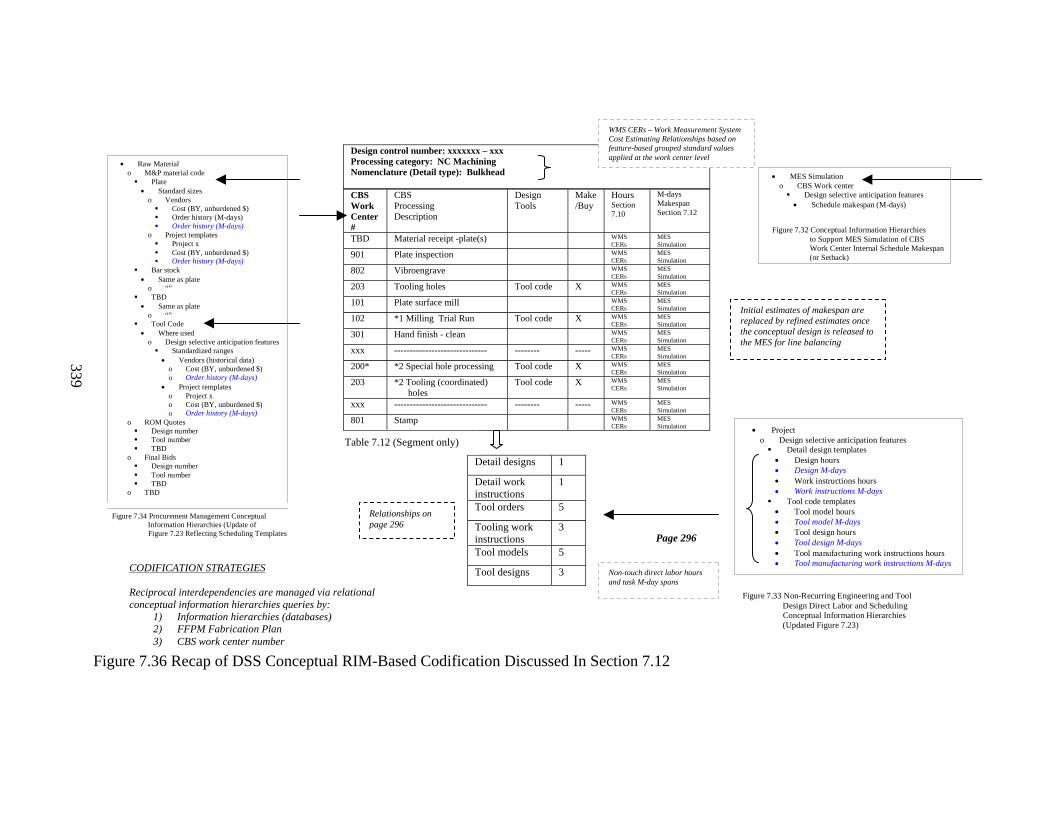
CBS Work Center #
CBS Processing Description
Design Tools
Make/Buy
Hours Section 7.10
M-days Makespan Section 7.12
TBD Material receipt -plate(s) WMS CERs
MES Simulation
901 Plate inspection WMS CERs
MES Simulation
802 Vibroengrave WMS CERs
MES Simulation
203 Tooling holes Tool code X WMS CERs
MES Simulation
101 Plate surface mill WMS CERs
MES Simulation
102 *1 Milling Trial Run Tool code X WMS CERs
MES Simulation
301 Hand finish - clean WMS CERs
MES Simulation
xxx ------------------------------ -------- ----- WMS CERs
MES Simulation
200* *2 Special hole processing Tool code X WMS CERs
MES Simulation
203 *2 Tooling (coordinated) holes
Tool code X WMS CERs
MES Simulation
xxx ------------------------------ -------- ----- WMS CERs
MES Simulation
801 Stamp WMS CERs
MES Simulation
Design control number: xxxxxxx – xxx Processing category: NC Machining Nomenclature (Detail type): Bulkhead
Detail designs 1
Detail work instructions
1
Tool orders 5
Tooling work instructions
3
Tool models 5
Tool designs 3
Figure 7.36 Recap of DSS Conceptual RIM-Based Codification Discussed In Section 7.12
• MES Simulation o CBS Work center Design selective anticipation features • Schedule makespan (M-days)
Figure 7.32 Conceptual Information Hierarchies to Support MES Simulation of CBS Work Center Internal Schedule Makespan (or Setback)
• Project o Design selective anticipation features Detail design templates • Design hours • Design M-days • Work instructions hours • Work instructions M-days Tool code templates • Tool model hours • Tool model M-days • Tool design hours • Tool design M-days • Tool manufacturing work instructions hours • Tool manufacturing work instructions M-days
Figure 7.33 Non-Recurring Engineering and Tool Design Direct Labor and Scheduling Conceptual Information Hierarchies (Updated Figure 7.23)
Page 296
• Raw Material o M&P material code Plate • Standard sizes
o Vendors Cost (BY, unburdened $) Order history (M-days) Order history (M-days)
o Project templates Project x Cost (BY, unburdened $) Order history (M-days)
Bar stock • Same as plate
o “” TBD • Same as plate
o “” Tool Code • Where used
o Design selective anticipation features Standardized ranges • Vendors (historical data)
o Cost (BY, unburdened $) o Order history (M-days)
• Project templates o Project x o Cost (BY, unburdened $) o Order history (M-days)
o ROM Quotes Design number Tool number TBD
o Final Bids Design number Tool number TBD
o TBD
Figure 7.34 Procurement Management Conceptual Information Hierarchies (Update of Figure 7.23 Reflecting Scheduling Templates
CODIFICATION STRATEGIES Reciprocal interdependencies are managed via relational conceptual information hierarchies queries by:
1) Information hierarchies (databases) 2) FFPM Fabrication Plan 3) CBS work center number
WMS CERs – Work Measurement System Cost Estimating Relationships based on feature-based grouped standard values applied at the work center level
339
Relationships on page 296
Initial estimates of makespan are replaced by refined estimates once the conceptual design is released to the MES for line balancing
Non-touch direct labor hours and task M-day spans
Table 7.12 (Segment only)

340
7.13 Sequencing Based on Management of “New” Requirements (Incomplete Designs) by Work Center
In this section, the last segment of Figure 7.29 is discussed, i.e., “Sequencing
decisions based on management of new requirements.” More specifically,
scheduling-related IPT decision making in the context of capacity line balancing for
conceptual designs (i.e., incomplete designs or designs which are yet to be finalized.)
In Section 7.12.4, the idea of a conceptual design release package is presented.
Assuming this proposed change is implemented by the enterprise, the IPTs potential for
considering line balancing decisions earlier in the product development process is
potentially enhanced greatly. Typical line balancing adjustments include scheduling
overtime, utilizing additional shifts, rescheduling jobs to lower the direct labor hours
requirements in a specific timeframe, and outsourcing task hours.
Once a conceptual design release package is released for a design, the MES is
enabled to assist with enterprise-level scheduling adjustments in support of factory line
balancing. Obviously, the usefulness of this approach is greatly enhanced once a
significant total number of packages are released for an aircraft. Further, once the factory
line is balanced, it significantly improves the enterprise’s ability to balance the entire
direct hours line (as opposed to just direct touch labor on the assembly line) by
connecting the MES information to the Integrated Resource Scheduling System (IRSS) in
Section 7.12.5. Once these two information sources are linked, the IPT has complete
start to finish visibility for project management of deliverables – beginning at the start of
the design and ending with fabrication of the design.

341
Wynn et al. (2005) presents the results of a six-month study conducted by
Massachusetts Institute of Technology to identify the root causes of poor performance in
defense acquisition programs. Poor scheduling capability and the inability to
appropriately breakdown and sequence lower-level tasks was identified as a significant
contributor to poor performance.
Based on this author’s experience, Wynn’s assertions are valid. Current line
balancing efforts are typically ineffective because much needed lower-level details at the
CBS work center level are not established until much later - when the finalized design is
released during the detail design phase. Too often, when a design is released and the real
schedule is determined, it is too late for the IPT to proactively address bottlenecks and
disconnects. These bottlenecks lead to countless, multiple occurrence of the enterprise
waiting for a bottleneck to be corrected so throughput can continue, much in the same
manner as Goldratt and Cox (1992) describe in The Goal.
Previously in Section 6.11, jobs within the MES are classified as follows:
1) Jobs currently being processed
2) Planned future jobs
a. Firm - jobs based on complete released designs which are planned but have not yet started
b. Potential - jobs based on incomplete designs which are preliminary planned but have not yet started
Additionally in Section 7.11, “Planned future jobs – Firm,” i.e., planned jobs based on
complete designs is illustrated as Table 7.23 which is repeated here as Table 7.26. In
Table 7.26, the capacity requirements by accounting month for a hypothetical work
center are offered.

342
Table 7.26 Example of Capacity Requirements Forecasting for “Planned Future Jobs – Firm”
Accounting/Budget Month CBS Work Center Mo Jan Feb Mar Apr May
Number Yr 2008 2008 2008 2008 2008
ABC M-Days 23 20 20 20 25 Max Headcount 20 20 20 20 20 Maximum Actual Hours Available Shift Hrs Hours Per Month Per Shift Shift 1 8 3680 3200 3200 3200 4000 Shift 2 7 3220 2800 2800 2800 3500 Shift 3 6 2760 2400 2400 2400 3000 Forecasted Actual Hours Firm Planned (Complete Designs)
Standard Hours 1064 925 925 925 1157 Historical Realization 60% 60% 60% 60% 60%
RF 1.6667 1.6667 1.6667 1.6667 1.6667 Other (TBD) 1.1000 1.1000 1.1000 1.1000 1.1000 Total Factor 2.7667 2.7667 2.7667 2.7667 2.7667
Shift 1 Actual Hours 8 2944 2560 2560 2560 3200 Firm Planned Capacity (Complete Designs) Shift 1 8 2944 2560 2560 2560 3200 Shift 2 7 0 0 0 0 0 Shift 3 6 0 0 0 0 0 Available Capacity Remaining Shift 1 8 736 640 640 640 800 Shift 2 7 3220 2800 2800 2800 3500
Shift 3 6 2760 2400 2400 2400 3000
Note Table 7.26 does not contain forecasts of capacity for “Planned Future Jobs –
Potential,” i.e., jobs based on incomplete/conceptual designs. Once conceptual design
release packages are released to the MES, the hours required to process these jobs
reduces the available capacity remaining. Per Table 7.27, beginning in February 2008,
the one-shift capacity is exceeded and a second shift (or overtime) is required.

343
Table 7.27 Example of Capacity Requirements Forecasting for “Planned Future Jobs – Firm” and “Planned Future Jobs – Potential”
Accounting/Budget Month CBS Work Center Mo Jan Feb Mar Apr May
Number Yr 2008 2008 2008 2008 2008
ABC M-Days 23 20 20 20 25
Max Headcount 20 20 20 20 20
Maximum Actual Hours Available Shift Hrs Hours Per Month Per Shift Shift 1 8 3680 3200 3200 3200 4000 Shift 2 7 3220 2800 2800 2800 3500 Shift 3 6 2760 2400 2400 2400 3000
Forecasted Actual Hours Firm Planned (Complete Designs)
Standard Hours 1064 925 925 925 1157
Historical Realization 60% 60% 60% 60% 60%
RF (Realization Factor) 1.6667 1.6667 1.6667 1.6667 1.6667
Other (TBD) 1.1 1.1 1.1 1.1 1.1
Total Factor 2.7667 2.7667 2.7667 2.7667 2.7667 Shift 1 Actual Hours 8 2944 2560 2560 2560 3200
FIRM Planned Capacity (Complete Designs) Shift 1 8 2944 2560 2560 2560 3200 Shift 2 7 0 0 0 0 0 Shift 3 6 0 0 0 0 0
POTENTIAL Planned Capacity (Incomplete Designs) Shift 1 8 400 640 640 640 800 Shift 2 7 0 700 700 700 875 Shift 3 6 0 0 0 0 0
AVAILABLE Capacity Remaining Shift 1 8 336 0 0 0 0 Shift 2 7 3220 2100 2100 2100 2625
Shift 3 6 2760 2400 2400 2400 300

344
If the enterprise does not implement the idea of a conceptual design release
package (CDRP), then it does not diminish from the other types of IPT decision making
support facilitated by the envisioned RIM-based DSS. However, it does diminish the
overall feedforward effectiveness potential and the enterprise’s ability to learn by
development (i.e., as definedi in Chapter 6.) However, once the FFPM fabrication plan
(i.e., Table 7.12 page 217) is available – which is a major component of a conceptual
design release package – the idea of a CDRP is the next logical step.
It is now appropriate to update information development thus far in the context of
the RIM-based capability framework. Previously presented Figure 7.35 is updated to
become Figure 7.37. There are no remaining items left to describe, and the Feedforward
Planning Model is complete.
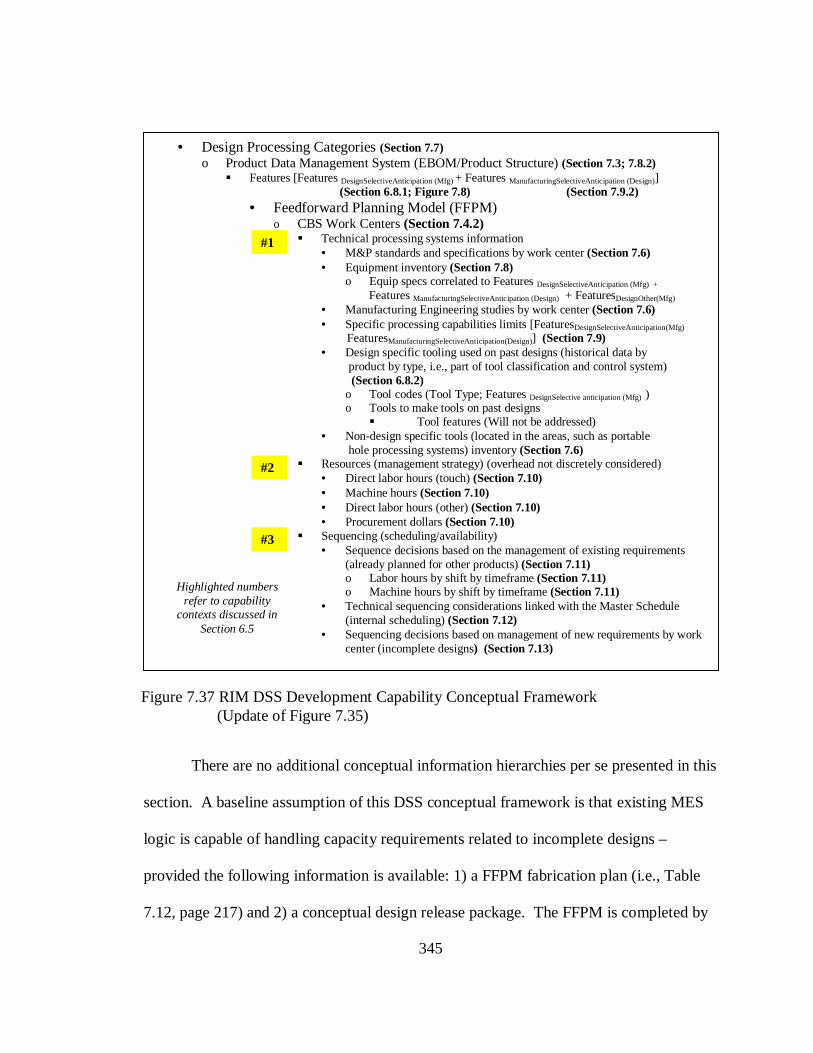
345
There are no additional conceptual information hierarchies per se presented in this
section. A baseline assumption of this DSS conceptual framework is that existing MES
logic is capable of handling capacity requirements related to incomplete designs –
provided the following information is available: 1) a FFPM fabrication plan (i.e., Table
7.12, page 217) and 2) a conceptual design release package. The FFPM is completed by
• Design Processing Categories (Section 7.7) o Product Data Management System (EBOM/Product Structure) (Section 7.3; 7.8.2) ! Features [Features DesignSelectiveAnticipation (Mfg) + Features ManufacturingSelectiveAnticipation (Design)] (Section 6.8.1; Figure 7.8) (Section 7.9.2)
• Feedforward Planning Model (FFPM) o CBS Work Centers (Section 7.4.2) ! Technical processing systems information
• M&P standards and specifications by work center (Section 7.6) • Equipment inventory (Section 7.8)
o Equip specs correlated to Features DesignSelectiveAnticipation (Mfg) + Features ManufacturingSelectiveAnticipation (Design) + FeaturesDesignOther(Mfg) • Manufacturing Engineering studies by work center (Section 7.6) • Specific processing capabilities limits [FeaturesDesignSelectiveAnticipation(Mfg)
FeaturesManufacturingSelectiveAnticipation(Design)] (Section 7.9) • Design specific tooling used on past designs (historical data by product by type, i.e., part of tool classification and control system) (Section 6.8.2)
o Tool codes (Tool Type; Features DesignSelective anticipation (Mfg) ) o Tools to make tools on past designs ! Tool features (Will not be addressed)
• Non-design specific tools (located in the areas, such as portable hole processing systems) inventory (Section 7.6)
! Resources (management strategy) (overhead not discretely considered) • Direct labor hours (touch) (Section 7.10) • Machine hours (Section 7.10) • Direct labor hours (other) (Section 7.10) • Procurement dollars (Section 7.10)
! Sequencing (scheduling/availability) • Sequence decisions based on the management of existing requirements
(already planned for other products) (Section 7.11) o Labor hours by shift by timeframe (Section 7.11) o Machine hours by shift by timeframe (Section 7.11)
• Technical sequencing considerations linked with the Master Schedule (internal scheduling) (Section 7.12)
• Sequencing decisions based on management of new requirements by work center (incomplete designs) (Section 7.13)
Figure 7.37 RIM DSS Development Capability Conceptual Framework (Update of Figure 7.35)
#1
#2
#3
Highlighted numbers refer to capability
contexts discussed in Section 6.5

346
the IPT within the DSS environment and the conceptual design release package contains
the full compliment of information to generate a “Planned Future Jobs – Potential”
requirement within the MES. The primary consideration with regard to codification and
IPT decision making is the development of an interface, which will extract capacity
requirements planning (CRP) information from the MES in a useful format once the
“Planned Future job” has been released and planned/loaded.
7.14 Executive Summary of Chapter 7
In Chapter 7, Verganti’s findings and concepts are discussed in the context of
improving IPT decision making and a conceptual framework for developing a RIM-based
DSS is offered. A conceptual framework is a formal way of thinking (i.e.,
conceptualizing) about a process or system under study, and it represents a coherent set
of ideas and concepts organized in a manner that makes them easy to communicate to
others. (Wartik, 2007.) This presentation of Chapter 7 material addresses the specific
research objectives found in Chapter 1, i.e., objectives 1 and 2c, page 36.
As presented in Chapter 1 page 3, Verganti reports task complexities surrounding
the identification of reciprocal interdependencies - and the use of feedforward planning
efforts to manage them - is usually hindered by a lack of well-structured methods and the
amounts of information required. Chapter 7 offers insights into the complexities of
knowledge exchange involved in IPT decision making, and it offers a structured approach
to organizing and considering information in the context of reciprocal interdependencies.
It is not suggested the methodology presented in Chapter 7 is the only way to consider the
exchange of knowledge involved in decision making; but instead, it is a practical,
347
comprehensive way to organize the task complexities of conceptual design decision
making for a working-level IPT.
Chapter 7 utilizes RIM-diagramming and accompanying discussion of RIM
concepts (i.e., feedforward planning, commonality, selective anticipation, etc.) to
characterize the complex interactions and knowledge exchanges involved in working-
level IPT decision making. Further, Verganti’s factors affecting measurement of
successful feedforward planning (i.e., superficial anticipation, early process engineering,
preplanning knowledge, and feedforward planning effectiveness) are methodically
overviewed. In addition, RIM-diagramming is systematically utilized to identify
information constraints and opportunities typically not considered in an organized fashion
until after design release.
Design features are defined (e.g., design selective anticipation features,
manufacturing selective anticipation features, etc.) and the definitions are subsequently
utilized within various conceptual hierarchies supporting IPT decision making –
providing a formalized approach for knowledge exchange (and reuse) between the
activities on the IDEF0 diagrams (i.e., Chapter 2, pages 53 –56). The most significant
improvements to knowledge exchange include the new links established between the
systems that support the activities that predominantly occur before design release and
that occur after design release.
By considering the information needs of the IPT members and the information
availability during conceptual design in the context of design selective anticipation
features and manufacturing selective anticipation features -- changes in typical enterprise
information hierarchies are identified to facilitate information exchange in an automated

348
fashion during early conceptual design. Design and manufacturing information that is
either unavailable until after design release - or disorganized and not understood by
typical IPT members - is made available at a point earlier in the process in support of IPT
decision making. Recall Figure 5.2 is presented again as Figure 7.38.

349
Collaborative work environment
Figure 7.38 Product Development Process Six-Phase Approach With Activity-Level IPT-Level and DSS Level Modifications
ACTIVITIES 1. Business Management 3. Engineering
ACTIVITIES 1. Business Management 2.Factory Management 3.Engineering
ACTIVITIES 1. Business Management 2.Factory Management 3.Engineering
ACTIVITIES 3. Engineering 4. Factory Management 5. Planning 6. Tool Design
ACTIVITIES 3. Engineering 4. Factory Management 7. Fabrication 8. Assembly
ACTIVITIES ALL
0. Planning 1.Concept Develop-
ment
2.System Level
Design
3.Detail Design
4. Testing and Re- finement
5. Production
Before Design Release After Design Release ACTIVITIES IPT Driven Integrated (automated) Systems Driven 1. Business Management Purchasing representative, Business Management cost representatives/analysts systems 2. Factory Management Cost representative estimator 3. Engineering Structural design engineer, Engineering product data systems design engineer, management (PDM) systems test engineer 4. Factory Management FMS – MES (work measurement, scheduling) 5. Planning Planner, ME Planning systems 6. Tool Design Tool designer, ME Tool design systems 7. Fabrication Manufacturing representative, MES & earned value quality representative 8. Assembly Manufacturing representative, MES & earned value quality representative
1 2 3
5 6 7 84
Databases and systems typically engaged once the design is released
are engaged earlier via the DSS
IPTs
RIM-Based Decision Support System
Reformat databases using RIM concepts of commonality and selective anticipation to facilitate…
FEEDFORWARD PLANNING
Before Design Release Left Side
After Design Release Right Side
Six-Phase Level
DSS- Level
(Chapter 2)
(Chapter 2)
(Chapter 4)
(Chapter 6)
Activity-Level
IPT-Level
Personnel have moved to the left of design release, but much of knowledge in computerized systems has not.

350
The IPT-level segment of Figure 7.38 illustrates that many concurrent engineering
efforts have moved IPT members to the left side of the design release event; but much of
the information housed in integrated, computerized systems has not transitioned. In the
DSS-level segment of the figure, the RIM-based DSS facilitates the restructuring and
reuse of information by utilizing RIM concepts of feedforward planning, commonality,
and selective anticipation, coupled with consistent definitions of design selective
anticipation features and manufacturing selective anticipation features to systematically
develop, maintain, and exchange common knowledge throughout the enterprise.
More discussion of Chapter 7 efforts and results are offered in Chapter 9,
Conclusions and Future Work.
The next chapter, Chapter 8, other approaches are compared to the RIM-based
DSS offered in Chapters 6 and 7.

351
CHAPTER VIII
COMPARISONS OF CONCEPTUAL RIM-BASED DSS APPROACH TO OTHER
CONCEPTUAL DESIGN DECISION-MAKING SUPPORT TOOLS
AND METHODOLOGIES
One of the primary objectives of this research is to examine the usefulness of RIM
concepts in the construction of enterprise systems to support IPT decision making by
comparing the RIM-based methodology (i.e., an enterprise manufacturing capability
framework) and resulting conceptual DSS to other conceptual approaches, frameworks,
systems discussed in the literature. This research defines a conceptual manufacturing
capability framework using NC machining as the specific case by systematically
formalizing enterprise information using reciprocal interdependencies management
(RIM) concepts (i.e., feedforward planning, commonality, selective anticipation, etc.)
In Chapter 1, Verganti (1997) acknowledges task complexities involved in the
identification of reciprocal interdependencies (RIs) and the use of feedforward planning
efforts to manage RIs is usually hindered by a lack of well-structured methods and the
amounts of information involved. Although the level of detail in Chapter 6 may be seen
as excruciating by some, or even unnecessary by others, it realistically portrays the task
complexities involved with IPT knowledge exchange during the early stages of design in
the identification of manufacturing constraints and opportunities. Further, it

352
demonstrates a structured approach (i.e., the capability framework and RIM-
diagramming) that Verganti and this author have found to be lacking in the literature.
In order to better understand the usefulness of the proposed approach, it is helpful
to compare it to a sampling of other concepts and tools found in the literature. These
comparisons highlight the contribution this research makes to the body of knowledge.
In order to accomplish the comparison task, the following steps are performed:
• Develop a qualitative assessment tool to rate each approach based on eight factors: inputs, re-creation of results, processes and costs, scheduling, tooling, planning (work instructions), manufacturability, project management, and information reuse
• Select a sample of ten relevant approaches from published research previously discussed in Chapter 3 (i.e., the literature review.) • Apply a qualitative assessment tool to the ten samples and evaluate the results
• Develop and present conclusions based on the results.
The remainder of Chapter 8 documents the details of the tasks outlined above.
8.1 Qualitative Assessment Tool Development
When performing the literature review, each approach was summarized and notes
taken on aspects considered desirable and those that detracted from usefulness in the
context of IPT decision making during conceptual design. The desirable attributes were
those this research strived to emulate, and the detractors became a list of things to try and
improve upon or avoid. Over time, recurring themes came to the forefront and these
were grouped into eight categories. The eight categories of the qualitative assessment
tool are:
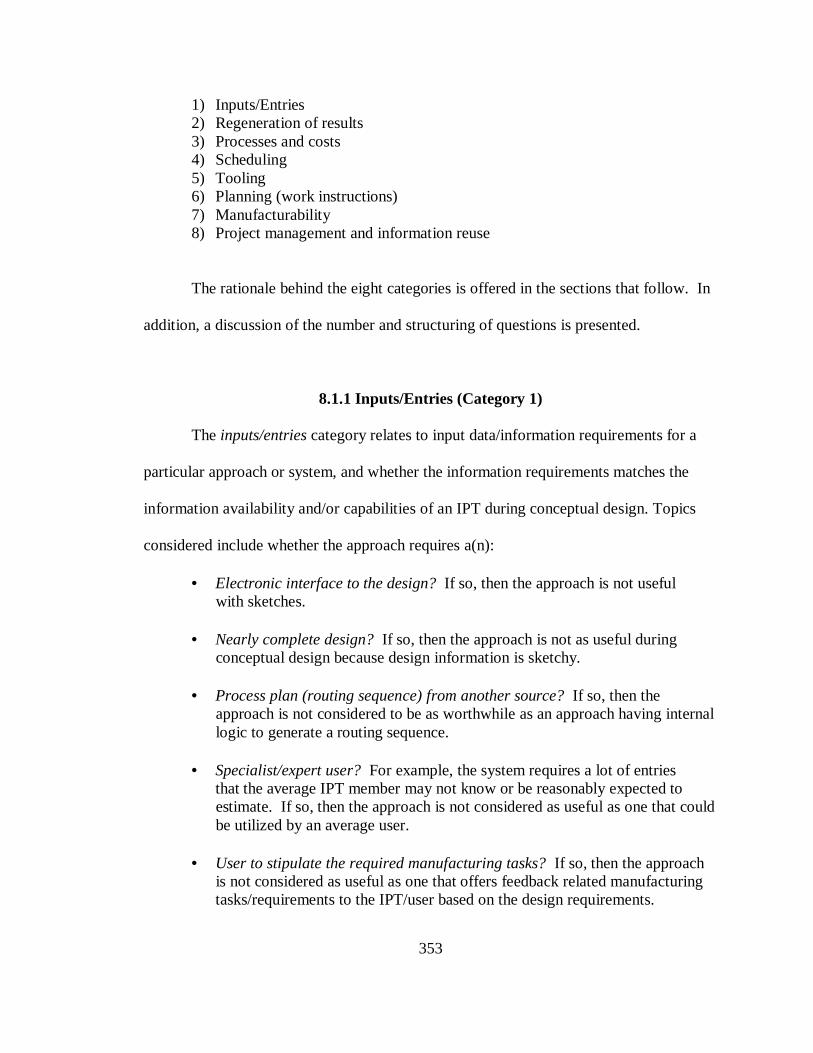
353
1) Inputs/Entries 2) Regeneration of results 3) Processes and costs 4) Scheduling 5) Tooling 6) Planning (work instructions) 7) Manufacturability 8) Project management and information reuse
The rationale behind the eight categories is offered in the sections that follow. In
addition, a discussion of the number and structuring of questions is presented.
8.1.1 Inputs/Entries (Category 1)
The inputs/entries category relates to input data/information requirements for a
particular approach or system, and whether the information requirements matches the
information availability and/or capabilities of an IPT during conceptual design. Topics
considered include whether the approach requires a(n):
• Electronic interface to the design? If so, then the approach is not useful with sketches. • Nearly complete design? If so, then the approach is not as useful during conceptual design because design information is sketchy.
• Process plan (routing sequence) from another source? If so, then the approach is not considered to be as worthwhile as an approach having internal logic to generate a routing sequence.
• Specialist/expert user? For example, the system requires a lot of entries
that the average IPT member may not know or be reasonably expected to estimate. If so, then the approach is not considered as useful as one that could be utilized by an average user.
• User to stipulate the required manufacturing tasks? If so, then the approach is not considered as useful as one that offers feedback related manufacturing tasks/requirements to the IPT/user based on the design requirements.

354
• User to develop his/her own categories of “features?” Similarly, does the approach adequately define “feature” and provide sufficient examples? If so,
these types of approaches are not considered as useful as those defining features for the user.
8.1.2 Regeneration of Results (Category 2)
The regeneration of results category relates to how easily a reader can regenerate
the results from the information presented in the literature. In addition, the category also
refers to how much of the underlying logic of the approach is applicable to a new
conceptual design decision making problem.
• Is the data and underlying logic presented in such a way that the reader can recreate the results? If not, then the approach is not considered as useful. (A recurring problem is that software prototype demonstration values could not be associated with the equations presented in the text.) • Are the production rules, sequencing logic, and cost calculation logic presented in a manner that would facilitate the reader creating a working prototype? If not, then the approach is not considered as useful. (A recurring problem with the literature is conceptual approaches lack critical explanation of the underlying logic and/or methodology. Instead, significant tasks are relegated to a single figure on a high-level diagram.
8.1.3 Processes and Costs (Category 3)
The processes and costs category relates to the elements of total cost presented
and whether critical components of cost that IPT members typically are interested in are
discernable among the defined total. In addition, the category also refers to the amount
of underlying logic presented in an approach that can be applied to a new problem.
• Are all the processes required to complete a NC machined design addressed? If not, then the approach only deals with the shaping/milling portion of the NC fabrication processing and fails to recognize other processes required to complete a NC machined design.

355
• Are design tooling requirements/costs (tool design or tool manufacturing) discussed? If not, then the approach fails to acknowledge a major portion of design cost that often determines whether one process is selected over another process, or how tolerances often lead to additional tooling costs.
• Are planning costs associated with work instructions discussed, even if not discretely addressed? If not, then the approach fails to acknowledge a significant contributor to first article cost.
• Is the timing of expenditures discussed? If not, then the approach fails to acknowledge the significance of the time value of money. If a cost value is going to be used in discussions with the customer or make comparisons for vendor selection, it cannot be a “relative cost” that has limited application usefulness in the context of managing real work or making real comparisons.
• Is overhead cost applied based on design characteristics or categories? If not, then the approach treats all overhead cost the same, and potentially understates NC machining cost.
• Are learning factors considered? If not, then the approach fails to recognize that first article products are treated differently in real world cost evaluations.
8.1.4 Scheduling (Category 4)
The scheduling category relates to the elements of scheduling tasks in conjunction
with cost calculations that are a critical element of IPT decision making. Scheduling
information needs considered include: 1) task durations to perform capacity analysis, 2) a
timeframe of occurrence for financial considerations, or 3) task sequencing decisions
relative to precedence relationships. Questions addressed in the assessment tool include:
• Are scheduling considerations discussed as part of the approach? If not, then the approach fails to recognize the importance of scheduling with regard to project management and cost related IPT decision-making.
o Critical path items may require that a decision be based on schedule as opposed to “single item cost” because of the implications to total enterprise cost expenditures.

356
o Make span is required to do capacity analysis.
o Make span is required to schedule associated tasks, such as tool
design, tool manufacturing, and assembly.
o Make span is necessary to load enterprise systems that utilize timing of expenditures for overhead cost, escalation, and budgetary considerations.
o Personnel requirements should be considered in conjunction with the
task being accomplished so that appropriate personnel forecasting can be accomplished.
8.1.5 Tooling (Category 5)
The tooling category relates to the information needs associated with IPT decision
making in the context of establishing design tooling requirements and costs. Questions
addressed by the qualitative assessment tool include:
• Are tooling and/or fixtures considered? If not, then the approach is not as useful to an IPT as an approach recognizing the need to specifically address tooling requirements. An approach receives a non-negative assessment for mentioning tooling cost, but to receive a positive assessment requires some aspect of cost be driven by the explicit consideration of tooling.
• Are discrete tooling requirements considered? If not, then the approach is not considered as useful as an approach that links design requirements to tooling requirements.

357
8.1.6 Planning (Category 6)
The planning category relates to routing and work instructions tasks considered in
the approach. For example, whether work instructions or a routing sequence is required
to facilitate the approach. In addition, another consideration is whether work instructions
tasks are considered as an integral part IPT tasks/deliverables and the overall project plan.
• Are planning (work instructions) tasks considered? If not, this approach is not as highly rated as an approach that recognizes the need for process sequencing and the consideration of work instructions tasks in the IPT’s project plan for completing a design.
8.1.7 Manufacturability (Category 7)
Many approaches discuss the importance of considering manufacturability, but
typically do not provide sufficient detail with regard to the methodology to accomplish
this goal. In addition, published works often lack relevant examples of how their
envisioned approach works in the context of a real world decision. Too often, the tasks
and complexities involved in considering manufacturability are oversimplified so that the
approach presented seems more worthwhile, (i.e., oversimplify the problem in order to
make a uncomplicated solution applicable.)
• Does the approach consider manufacturability verification? If not, the approach would not be considered as useful to IPT decision making. • Are production rules used as part of design verification? If not, the approach is considered less useful to IPTs and receives a lower rating.
• Are manufacturability examples provided for key processes? If not, then the approach is not considered as useful as one that provides examples of designs, production rules, and design features relationships to multiple processes.
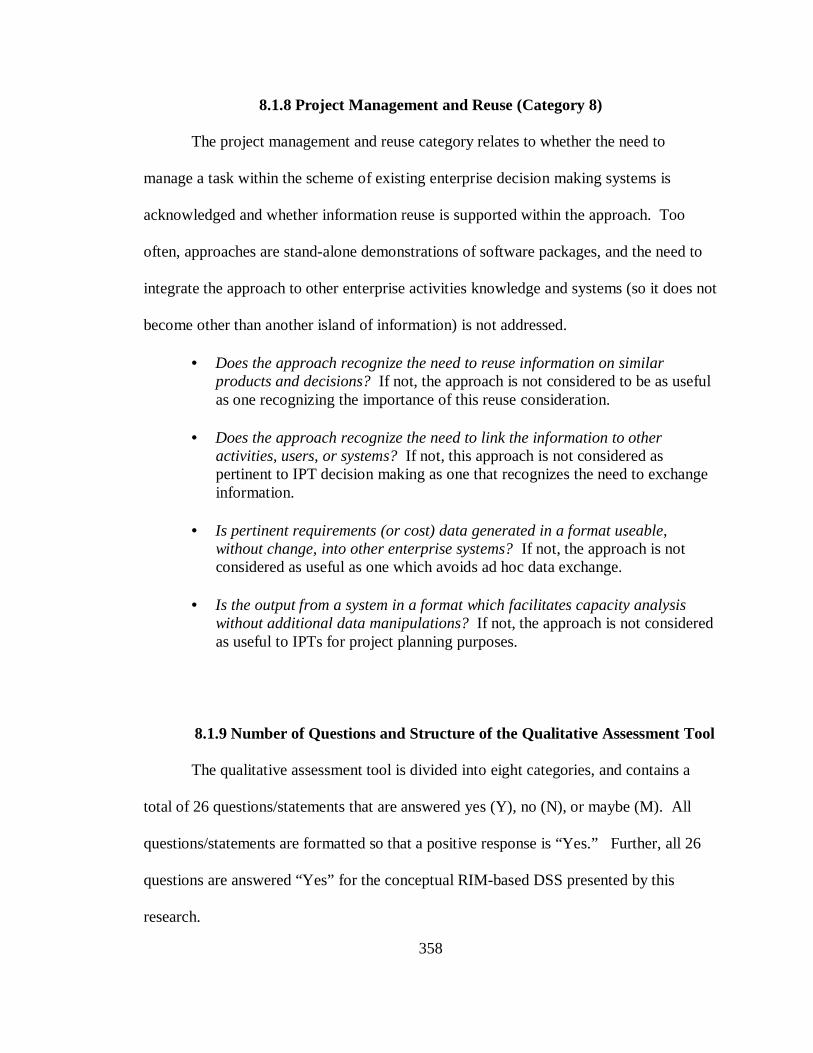
358
8.1.8 Project Management and Reuse (Category 8)
The project management and reuse category relates to whether the need to
manage a task within the scheme of existing enterprise decision making systems is
acknowledged and whether information reuse is supported within the approach. Too
often, approaches are stand-alone demonstrations of software packages, and the need to
integrate the approach to other enterprise activities knowledge and systems (so it does not
become other than another island of information) is not addressed.
• Does the approach recognize the need to reuse information on similar products and decisions? If not, the approach is not considered to be as useful as one recognizing the importance of this reuse consideration. • Does the approach recognize the need to link the information to other activities, users, or systems? If not, this approach is not considered as pertinent to IPT decision making as one that recognizes the need to exchange information.
• Is pertinent requirements (or cost) data generated in a format useable, without change, into other enterprise systems? If not, the approach is not considered as useful as one which avoids ad hoc data exchange.
• Is the output from a system in a format which facilitates capacity analysis without additional data manipulations? If not, the approach is not considered as useful to IPTs for project planning purposes.
8.1.9 Number of Questions and Structure of the Qualitative Assessment Tool
The qualitative assessment tool is divided into eight categories, and contains a
total of 26 questions/statements that are answered yes (Y), no (N), or maybe (M). All
questions/statements are formatted so that a positive response is “Yes.” Further, all 26
questions are answered “Yes” for the conceptual RIM-based DSS presented by this
research.

359
The formatting of the questions is not meant to imply the conceptual RIM-based
DSS is the end all of research in this area. Since this is a qualitative assessment tool, an
easy mechanism for comparison had to be developed using the conceptual RIM-based
DSS as the baseline. Having a mixture of yes and no answers would make comparisons
difficult, while comparisons to a “Yes” baseline is easier to understand. An example of
the qualitative assessment tool is found in Table 8.1.

360
Table 8.1 Qualitative Assessment Tool
R-Research #S-Sample R #S #S #S Q Category 1: Inputs 1 Approach does not require an interface to a conceptual design file Yes 2 Approach does not require a nearly complete drawing Yes 3 Approach does not require a nearly complete process plan Yes 4 Approach does not require a specialist user Yes 5 Approach does not require user to make assumptions on manufacturing tasks Yes 6 Approach does not require user to categorize part features Yes
Category 2: Regeneration of Results
7 The logic and underlying data used by the approach is presented in a manner that can be recreated by the reader
Yes
8 Underlying production rules, sequencing logic, and cost information is presented in a manner that would facilitate the creation of a working system
Yes
Category 3: Processes and Costs
9 All major processes required to complete a machined part are addressed Yes 10 Manufacturing cost addressed Yes 11 Tooling cost specifically addressed Yes 12 Planning cost specifically addressed Yes 13 Timing of expenditures is considered (time value of money) Yes 14 Overhead is not applied discretely based on part characteristics Yes 15 Learning factors were considered Yes
Category 4: Scheduling
16 Approach includes scheduling considerations Yes Category 5: Tooling
17 Tooling and/or fixturing is considered Yes 18 Discrete tooling requirements are considered Yes
Category 6: Planning
19 Planning tasks (work instructions/routing) are part of the approach Yes Category 7: Manufacturability
20 Approach includes manufacturability verification Yes 21 Production rules used by manufacturing are part of design verification Yes 22 Manufacturability examples are provided for key processes Yes
Category 8: Project Management and Information Reuse
23 Approach recognizes the need to reuse information from similar products Yes 24 Approach links data to the systems of downstream users/activities Yes 25 The cost data could be rolled into other financial forecasting systems Yes 26 Output would allow for capacity analysis Yes
Total Yes Answers 26 Total Maybe Answers 0 Total No Answers 0

361
8.2 Selection of Comparative Approach Samples From Published Works
Ten published works were selected from the research discussed in the literature
review. The works were chosen because, in this author’s option, they exemplified some
of the better approaches with regard to one or more facets potentially supporting IPT
conceptual design decision making. The comparative approaches selected are listed in
Table 8.2 by year of publication, with the most recent publication being first.
Table 8.2 Comparative Approach Samples
No. Author(s) Title Source
1 Shehab and Abdalla (2001)
An Integrated Prototype System for Cost Effective Design
Concurrent Engineering Research and Applications, 9, 4, 243-256.
2 Tseng and Jiang (2000) Evaluating Multiple Feature-Based Machining Methods Using an Activity-Based Cost Analysis Model
International Journal of Advanced Manufacturing Technology, 16, 617-623.
3 Wei and Egbelu (2000) A Framework for Estimating Manufacturing Cost from Geometric Design Data
International Journal of Computer Integrated Manufacturing, 13,1, 50-63.
4 Feng and Zhang (1999) Conceptual Process Planning: A Definition and Functional Decomposition
Manufacturing Engineering Divisions, ASME, Manufacturing Science and Engineering, 10, 97-106.
5 Shing (1999) Design for Manufacture of a Cost-Based System for Molded Parts
Advances in Polymer Technology, 18,10, 33-42.
6 Evans et. al (1998) Manufacturing Process Flow Simulation: An Economic Analysis Tool
30th International SAMPE Technical Conference, October 20-24, 589-595.
7 Ou-Yang and Lin (1997) Developing an Integrated Framework for Feature-Based Early Manufacturing Cost Estimation
International Journal of Advanced Manufacturing Technology, 13, 618-629.
8 Ong (1995) Manufacturing Cost Estimation for PCB Assembly: An Activity-Based Approach
International Journal of Production Economics, 38, 159-172.
9 Khoshnevis et. al (1994) A Cost Based System for Concurrent Part and Process Design
Engineering Economist, 40, 1, 101-124.
10 Park and Khoshnevis (1993)
A Real-Time Computer-Aided Process Planning System as a Support Tool for Economic Product Design
Journal of Manufacturing Systems, 12, 2, 181-192.

362
The primary goal of using the qualitative assessment tool is o provide insights
into the RIM-based DSS an improvement over a selection of other approaches, (i.e.,
methodologies, frameworks, or systems) available in the literature.
8.3 Qualitative Assessment Tool Results
The results of the qualitative assessment tool are presented in a series of tables
found on the pages that follow. First, the detailed assessments for each of the ten samples
are provided in Tables 8.3 – 8.6, followed by an executive summary, Table 8.7.

363
Table 8.3 Qualitative Assessment Tool Results for Samples 1 Through 3 R-Research #S-Sample R #1 #2 #3 Q Category 1: Inputs 1 Approach does not require an interface to a conceptual design file Yes M N N 2 Approach does not require a nearly complete drawing Yes M Y N 3 Approach does not require a nearly complete process plan Yes Y Y Y 4 Approach does not require a specialist user Yes Y Y M 5 Approach does not require user to make assumptions on manufacturing tasks Yes Y Y N 6 Approach does not require user to categorize part features Yes Y Y Y Category 2: Regeneration of Results 7 The logic and underlying data used by the approach is presented in a manner
that can be recreated by the reader Yes N Y N
8 Underlying production rules, sequencing logic, and cost information is Presented in a manner that would facilitate the creation of a working system
Yes N N N
Category 3: Processes and Costs 9 All major processes required to complete a machined part are addressed Yes N N N 10 Manufacturing cost addressed Yes Y Y Y 11 Tooling cost specifically addressed Yes N N N 12 Planning cost specifically addressed Yes N N N 13 Timing of expenditures is considered (time value of money) Yes N N N 14 Overhead is not applied discretely based on part characteristics Yes Y N N 15 Learning factors were considered Yes N M N Category 4: Scheduling 16 Approach includes scheduling considerations Yes N N N Category 5: Tooling 17 Tooling and/or fixturing is considered Yes Y Y Y 18 Discrete tooling requirements are considered Yes N N N Category 6: Planning 19 Planning tasks (work instructions/routing) are part of the approach Yes N N N Category 7: Manufacturability 20 Approach includes manufacturability verification Yes Y N Y 21 Production rules used by manufacturing are part of design verification Yes Y N N 22 Manufacturability examples are provided for key processes Yes N N N Category 8: Project Management and Information Reuse 23 Approach recognizes the need to reuse information from similar products Yes N N N 24 Approach links data to the systems of downstream users/activities Yes N N N 25 The cost data could be rolled into other financial forecasting systems Yes N N N 26 Output would allow for capacity analysis Yes N N N Total Yes Answers 26 9 8 5 Total Maybe Answers 0 2 1 1 Total No Answers 0 15 17 20
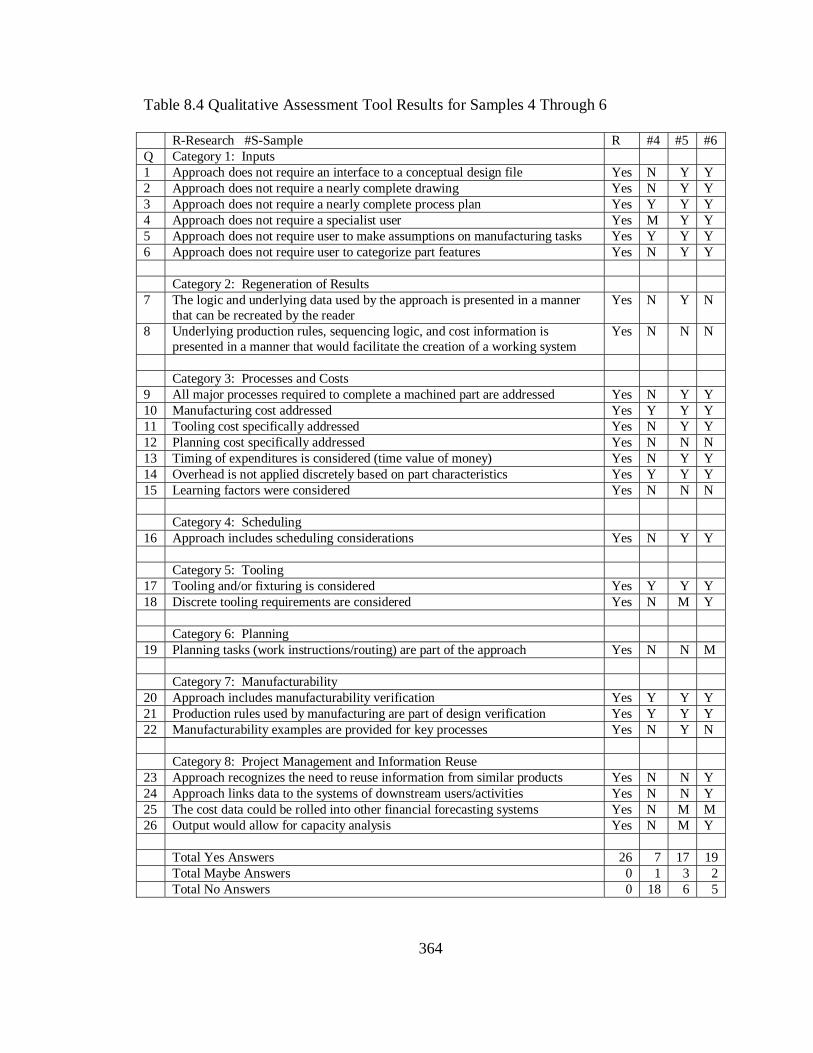
364
Table 8.4 Qualitative Assessment Tool Results for Samples 4 Through 6 R-Research #S-Sample R #4 #5 #6 Q Category 1: Inputs 1 Approach does not require an interface to a conceptual design file Yes N Y Y 2 Approach does not require a nearly complete drawing Yes N Y Y 3 Approach does not require a nearly complete process plan Yes Y Y Y 4 Approach does not require a specialist user Yes M Y Y 5 Approach does not require user to make assumptions on manufacturing tasks Yes Y Y Y 6 Approach does not require user to categorize part features Yes N Y Y Category 2: Regeneration of Results 7 The logic and underlying data used by the approach is presented in a manner
that can be recreated by the reader Yes N Y N
8 Underlying production rules, sequencing logic, and cost information is presented in a manner that would facilitate the creation of a working system
Yes N N N
Category 3: Processes and Costs 9 All major processes required to complete a machined part are addressed Yes N Y Y 10 Manufacturing cost addressed Yes Y Y Y 11 Tooling cost specifically addressed Yes N Y Y 12 Planning cost specifically addressed Yes N N N 13 Timing of expenditures is considered (time value of money) Yes N Y Y 14 Overhead is not applied discretely based on part characteristics Yes Y Y Y 15 Learning factors were considered Yes N N N Category 4: Scheduling 16 Approach includes scheduling considerations Yes N Y Y Category 5: Tooling 17 Tooling and/or fixturing is considered Yes Y Y Y 18 Discrete tooling requirements are considered Yes N M Y Category 6: Planning 19 Planning tasks (work instructions/routing) are part of the approach Yes N N M Category 7: Manufacturability 20 Approach includes manufacturability verification Yes Y Y Y 21 Production rules used by manufacturing are part of design verification Yes Y Y Y 22 Manufacturability examples are provided for key processes Yes N Y N Category 8: Project Management and Information Reuse 23 Approach recognizes the need to reuse information from similar products Yes N N Y 24 Approach links data to the systems of downstream users/activities Yes N N Y 25 The cost data could be rolled into other financial forecasting systems Yes N M M 26 Output would allow for capacity analysis Yes N M Y Total Yes Answers 26 7 17 19 Total Maybe Answers 0 1 3 2 Total No Answers 0 18 6 5

365
Table 8.5 Qualitative Assessment Tool Results for Samples 7 Through 9 R-Research #S-Sample R #7 #8 #9 Q Category 1: Inputs 1 Approach does not require an interface to a conceptual design file Yes N Y M 2 Approach does not require a nearly complete drawing Yes N Y M 3 Approach does not require a nearly complete process plan Yes Y Y Y 4 Approach does not require a specialist user Yes Y Y Y 5 Approach does not require user to make assumptions on manufacturing tasks Yes Y Y Y 6 Approach does not require user to categorize part features Yes Y Y Y Category 2: Regeneration of Results 7 The logic and underlying data used by the approach is presented in a manner
that can be recreated by the reader Yes Y N N
8 Underlying production rules, sequencing logic, and cost information is presented in a manner that would facilitate the creation of a working system
Yes N N N
Category 3: Processes and Costs 9 All major processes required to complete a machined part are addressed Yes N Y N 10 Manufacturing cost addressed Yes Y Y Y 11 Tooling cost specifically addressed Yes N M N 12 Planning cost specifically addressed Yes N N N 13 Timing of expenditures is considered (time value of money) Yes N N N 14 Overhead is not applied discretely based on part characteristics Yes Y Y N 15 Learning factors were considered Yes N N N Category 4: Scheduling 16 Approach includes scheduling considerations Yes N N N Category 5: Tooling 17 Tooling and/or fixturing is considered Yes Y Y Y 18 Discrete tooling requirements are considered Yes N N N Category 6: Planning 19 Planning tasks (work instructions/routing) are part of the approach Yes N N N Category 7: Manufacturability 20 Approach includes manufacturability verification Yes Y Y M 21 Production rules used by manufacturing are part of design verification Yes Y Y M 22 Manufacturability examples are provided for key processes Yes N N N Category 8: Project Management and Information Reuse 23 Approach recognizes the need to reuse information from similar products Yes Y Y N 24 Approach links data to the systems of downstream users/activities Yes N N N 25 The cost data could be rolled into other financial forecasting systems Yes N N N 26 Output would allow for capacity analysis Yes N N N Total Yes Answers 26 11 13 6 Total Maybe Answers 0 0 1 4 Total No Answers 0 15 12 16

366
Table 8.6 Qualitative Assessment Tool Results for Sample 10 R-Research #S-Sample R #10 Q Category 1: Inputs 1 Approach does not require an interface to a conceptual design file Yes Y 2 Approach does not require a nearly complete drawing Yes Y 3 Approach does not require a nearly complete process plan Yes Y 4 Approach does not require a specialist user Yes Y 5 Approach does not require user to make assumptions on manufacturing tasks Yes Y 6 Approach does not require user to categorize part features Yes Y Category 2: Regeneration of Results 7 The logic and underlying data used by the approach is presented in a manner
that can be recreated by the reader Yes N
8 Underlying production rules, sequencing logic, and cost information is presented in a manner that would facilitate the creation of a working system
Yes N
Category 3: Processes and Costs 9 All major processes required to complete a machined part are addressed Yes Y 10 Manufacturing cost addressed Yes Y 11 Tooling cost specifically addressed Yes Y 12 Planning cost specifically addressed Yes N 13 Timing of expenditures is considered (time value of money) Yes N 14 Overhead is not applied discretely based on part characteristics Yes Y 15 Learning factors were considered Yes N Category 4: Scheduling 16 Approach includes scheduling considerations Yes N Category 5: Tooling 17 Tooling and/or fixturing is considered Yes Y 18 Discrete tooling requirements are considered Yes M Category 6: Planning 19 Planning tasks (work instructions/routing) are part of the approach Yes N Category 7: Manufacturability 20 Approach includes manufacturability verification Yes Y 21 Production rules used by manufacturing are part of design verification Yes Y 22 Manufacturability examples are provided for key processes Yes N Category 8: Project Management and Information Reuse 23 Approach recognizes the need to reuse information from similar products Yes Y 24 Approach links data to the systems of downstream users/activities Yes M 25 The cost data could be rolled into other financial forecasting systems Yes M 26 Output would allow for capacity analysis Yes M Total Yes Answers 26 14 Total Maybe Answers 0 4 Total No Answers 0 8

367
Table 8.7 provides the ranking of each sample based on “Yes” responses, and
Table 8.8 provides the percentages of positive results by question.
Table 8.7 Ranking of Results Based on “YES” Responses #S Author(s) Article Title Yes Maybe No 6 Evans et al. (1998) Manufacturing Process Flow
Simulation: An Economic Analysis Tool
19 2 5
5 Shing (1999) Design for Manufacture of a Cost-Based System for Molded Parts
17 3 6
10 Park and Khoshnevis (1993) A Real-Time Computer-Aided Process Planning System as a Support Tool for Economic Product Design
14 4 8
8 Ong (1995) Manufacturing Cost Estimation for PCB Assembly: An Activity-Based Approach
13 1 12
7 Ou-Yang and Lin (1997) Developing an Integrated Framework for Feature-Based Early Manufacturing Cost Estimation
11 0 15
1 Shehab and Abdalla (2001) An Integrated Prototype System for Cost Effective Design
9 2 15
2 Tseng and Jiang (2000) Evaluating Multiple Feature-Based Machining Methods Using an Activity-Based Cost Analysis Model
8 1 17
4 Feng and Zhang (1999) Conceptual Process Planning: A Definition and Functional Decomposition
7 1 18
9 Khoshnevis et al. (1994) A Cost Based System for Concurrent Part and Process Design
6 4 16
3 Wei and Egbelu (2000) A Framework for Estimating Manufacturing Cost from Geometric Design Data
5 1 20
Total Questions = 26
The rating system should not be viewed as conveying that the articles lower in
ranking are not worthwhile or have lesser value. Any approach selected in this “top ten”
list has positive characteristics.
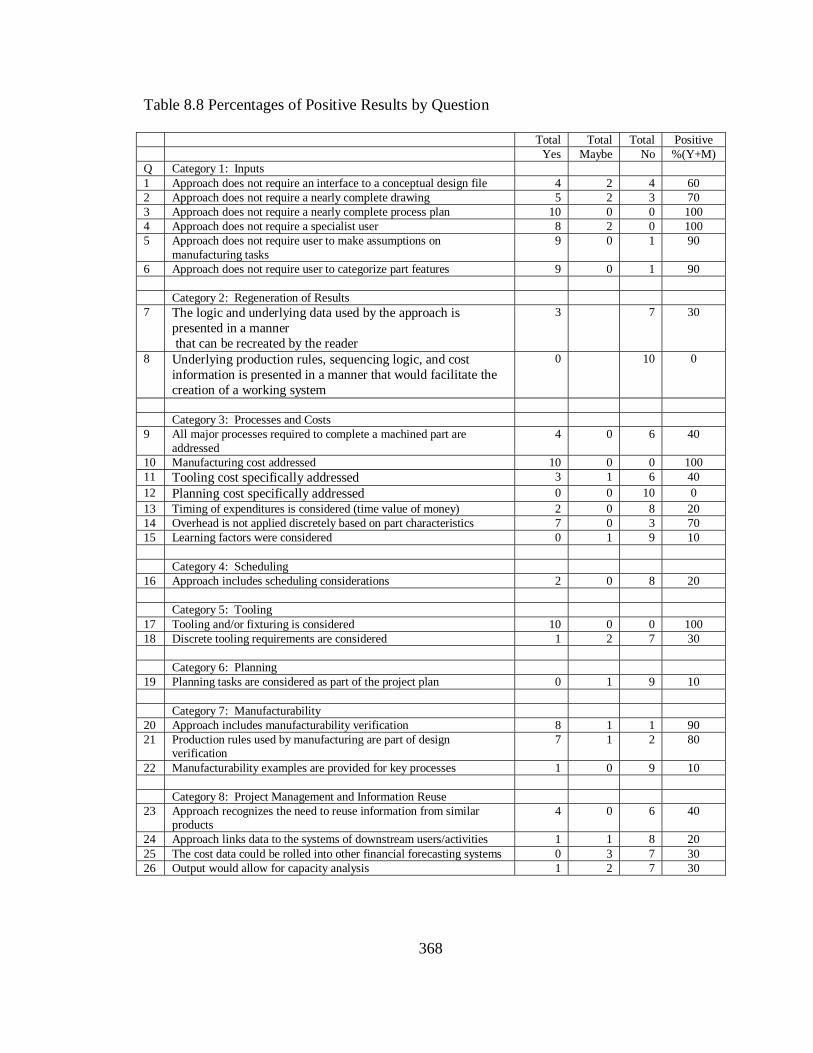
368
Table 8.8 Percentages of Positive Results by Question
Total Total Total Positive Yes Maybe No %(Y+M) Q Category 1: Inputs 1 Approach does not require an interface to a conceptual design file 4 2 4 60 2 Approach does not require a nearly complete drawing 5 2 3 70 3 Approach does not require a nearly complete process plan 10 0 0 100 4 Approach does not require a specialist user 8 2 0 100 5 Approach does not require user to make assumptions on
manufacturing tasks 9 0 1 90
6 Approach does not require user to categorize part features 9 0 1 90 Category 2: Regeneration of Results 7 The logic and underlying data used by the approach is
presented in a manner that can be recreated by the reader
3 7 30
8 Underlying production rules, sequencing logic, and cost information is presented in a manner that would facilitate the creation of a working system
0 10 0
Category 3: Processes and Costs 9 All major processes required to complete a machined part are
addressed 4 0 6 40
10 Manufacturing cost addressed 10 0 0 100 11 Tooling cost specifically addressed 3 1 6 40 12 Planning cost specifically addressed 0 0 10 0 13 Timing of expenditures is considered (time value of money) 2 0 8 20 14 Overhead is not applied discretely based on part characteristics 7 0 3 70 15 Learning factors were considered 0 1 9 10 Category 4: Scheduling 16 Approach includes scheduling considerations 2 0 8 20 Category 5: Tooling 17 Tooling and/or fixturing is considered 10 0 0 100 18 Discrete tooling requirements are considered 1 2 7 30 Category 6: Planning 19 Planning tasks are considered as part of the project plan 0 1 9 10 Category 7: Manufacturability 20 Approach includes manufacturability verification 8 1 1 90 21 Production rules used by manufacturing are part of design
verification 7 1 2 80
22 Manufacturability examples are provided for key processes 1 0 9 10 Category 8: Project Management and Information Reuse 23 Approach recognizes the need to reuse information from similar
products 4 0 6 40
24 Approach links data to the systems of downstream users/activities 1 1 8 20 25 The cost data could be rolled into other financial forecasting systems 0 3 7 30 26 Output would allow for capacity analysis 1 2 7 30

369
8.4 Discussion of Assessment Tool Results
The assessment tool clearly shows there is a wide-range of approaches in the
literature dealing with conceptual design decision-making. Most approaches do not
consider all of the activities in the IDEF0 diagrams (i.e., Chapter 2, pages 52-55) in their
methodologies or systems, but instead narrow the focus to smaller segments of the
generic product development process. The following paragraphs provide a category level
discussion of results.
8.4.1 Category 1: Inputs
Most of the samples did well in this category overall. However, the weaknesses
of some approaches were the requirements for a nearly complete drawing or a link to
CAD. The systems investigated require a level of data detail likely not available during
early conceptual design.
8.4.2 Category 2: Regeneration of Results
This category shows a potential weakness in the approaches currently found in the
literature. It is understandable a journal article is not going to have the same breadth of
detail as a dissertation. However, a journal article should convey enough information for
the user to be able to envision application of the methodology conveyed to a new
problem. There are many journal articles promising future work to fill in these types of
detail, and the results of future work cannot be located after many years have passed.

370
8.4.3 Category 3: Processes and Costs
Most of the samples did well in providing some explanation as to how they
derived total manufacturing costs. However, many but did poorly in recognizing that an
IPT needs visibility to more than one process to develop finished designs. The
approaches also did poorly with regard to considering the timing of expenditures,
learning factors, and planning costs.
8.4.4 Category 4: Scheduling
Most of the samples did not consider scheduling issues at all, and only two
presented some cursory scheduling related information. In most instances, cost values
were presented without explanation of the role of timing of expenditures, i.e., scheduling.
While some might argue that all an IPT needs are relative timeframes (and therefore,
relative costs) this philosophy likely leads to suboptimal enterprise decisions in the long
run. As discussed in Chapter 5, working-level IPTs are tasked to consider resources,
capacity, line balancing, and associated costs in the context of a specified timeframe of
occurrence in order to make real decisions. In addition, the estimates the IPTs generate
during conceptual design should be relatable to estimates developed by the Business
Management and Factory Management activities or cost deltas calculated have little real
value. Also, if IPT users must make comparisons to outside suppliers, then this
comparison cannot be made without making requirements and associated costs real.

371
8.4.5 Category 5: Tooling
Several of the samples considered tooling cost in some way, but did not provide
insights as into the initial development of design tooling requirements. The tooling costs
associated with building a design quite often dwarf the first-article cost to produce the
design. In addition, the identification of tooling requirements has a far greater impact on
project management than a dollar value. Hence, understanding how design decisions
map to tooling decisions is a critical aspect of generating good cost and schedule
estimates, as well as reducing total product cost and time-to-market.
8.4.6 Category 6: Planning
Most of the articles in this assessment did not consider the planning activity’s
involvement in the creation of work instructions as a key deliverable for an IPT or as a
component of manufacturing cost. Several of the approaches focused on estimating a
cost value, as opposed to a project plan with specific deliverables that can be related to
the estimate of cost.
A planner is typically a member of an IPT, and work instructions play an
important role in routing, work order generation, tool ordering, etc. An IPT project plan
for a design would likely include a work instructions deliverable, which is scheduled and
monitored in the real world.
8.4.7 Category 7: Manufacturability
Most of the samples discussed the need to consider manufacturability, and stated
that their approaches considered production rules. However, few provided examples of

372
manufacturability rules being applied in a meaningful way. It is difficult to visualize how
the logic found within modules shown on a diagram would be created and applied.
Several articles repeated high-level philosophies or “buzz phrases” that have been
echoed multiple times in the literature. It is easy to make the assertion that the best
design has fewer parts, but this broad statement is not always “true.” Many times the
assembly sequence does not allow detail parts to be manufactured in one piece, all holes
to be pre-drilled in fabrication, etc.
8.4.8 Category 8: Project Management and Information Reuse
This category is by far the weakest element of most of the ten approaches, as well
as the literature reviewed during the course of this research. At the beginning of many
articles, there is an explanation of the need to utilize concurrent engineering principles
and integrated systems for project knowledge reuse. Then, many proceed to develop an
output that does not directly interface with the information systems of downstream users
or activities. Also, there is little to no recognition that the reason for generating a result is
to contribute to the overall enterprise management of accomplishment.
Further, based on this author’s work experience, it is questionable if the results
generated by some sample approaches would be any more effective than combining an
estimator’s worksheet with a list of design guidance rules. Just because something is
done in a new software package does not make it an improvement over current methods.

373
8.5 Conclusions
The results of the qualitative assessment tool mirror the types of knowledge gaps
found in many approaches discussed in Chapter 3, Literature Review, as well as articles
that are not used or referenced in this research. After reading hundreds of articles, there
was always something missing with regard to how various approaches dealt with the
product development process, concurrent engineering, IPT conceptual decision-making,
the definition of design requirements, and/or the identification of manufacturing
constraints and opportunities.
The results of applying the qualitative assessment tool indicate that reciprocal
interdependencies management (RIM) concepts discussed and demonstrated in this
research are useful in the IPT conceptual design decision-making process. Further, this
research represents a positive contribution to the body of knowledge because it considers
a broader spectrum of information than the average published work, as indicated by
relative comparisons of the eight categories discussed, i.e., inputs/entries, regeneration of
results, processes and costs, scheduling, tooling, planning, manufacturability, and project
management and information reuse.

374
CHAPTER IX
SUMMARY AND DIRECTIONS FOR FUTURE RESEARCH
In Chapter 1, the objectives of this research are stated as:
1) Systematically apply Verganti’s findings and concepts (i.e., reciprocal interdependences, feedforward planning, selective anticipation, etc.) to demonstrate how they can be used to improve IPT decision-making during the early stages of product design in the defense industry, specifically aircraft manufacturing.
2) Concurrently address the information needs/issues associated with product development process obstacles, concurrent engineering problems, and feedforward planning knowledge management issues by developing the following:
a. Generic product development process diagrams
b. Definition of integrated product team members and decisions
c. Conceptual framework for a RIM-based DSS for use during conceptual design of an aircraft NC machined bulkhead
3) Examine the potential usefulness of using RIM concepts in the construction of enterprise systems by comparing the defined RIM-base DSS to other approaches found in the literature.
In this chapter, the results of the research are summarized based on the objectives
and potential directions for future research are discussed.

375
9.1 Summary
The accomplishment of research objective #1 is achieved within various chapters
of the dissertation. In Chapter 1, reciprocal interdependencies, feedfoward planning,
feedforward effectiveness, etc. are used to justify the need for the research. In particular,
feedforward planning effectiveness is discussed in the context of aircraft manufacturing
in the defense industry. Verganti’s study reveals that feedfoward planning effectiveness
is measurable using criteria such as the amount of rework, engineering changes,
unanticipated product costs, and missed time to market estimates. In other words, if an
enterprise is not doing well in these areas, then their feedforward planning effectiveness
is less than desirable. DOD acquisition data for various programs support the assertion
that there is room for improvement in the context of feedforward planning effectiveness.
In Chapter 4, RIM concepts are used to re-think some of the commonly held
views of the product development life cycle, particular in the areas of knowledge
availability and cost commitment. Information housed on the “right side” (after design
release activities) of the generic product development process (GPDP) diagrams has
feedforward planning potential to create knowledge for use by earlier activities on the
“left side” (before design release activities) of the GPDP diagrams. RIM concepts of
commonality and selective anticipation can be used to organize information from past
endeavors and make it recognizable during conceptual design, significantly raising the
design and non-design knowledge from a starting point of zero percent.

376
In Chapter 5, the reciprocal interdependencies existing between IPT members are
explored within the context of specific decisions made during the conceptual design
phase. It is determined that much of the literature does not recognize the true task
complexities involved in teaming decision-making, and based on Chapter 1 discussion of
needs, there is a need to provide IPTs with systems and tools to assist them with decision-
making.
In Chapter 6, RIM-diagramming is used to systematically develop the conceptual
framework of a decision support system. A feedforward planning model (FFPM) is
presented which utilizes design selective anticipation features and manufacturing
selective anticipation features to provide the IPT members with a plethora of useful
information and decision cues.
The accomplishment of research objective #2 is specifically addressed in the
following chapters:
• Generic product development process diagrams (Chapter 2)
• Definition of working-level integrated product team (IPT) members, typical deliverables, and types of decisions (Chapter 5)
• Conceptual framework for a RIM-based DSS for use during conceptual design
of an aircraft NC machined bulkhead (Chapter 6)
• Other contributions:
o The literature review organizes, and categorizes a significant sampling of literature using the GPDP IDEF0 diagrams presented in Chapter 2 as a frame of reference. The effort results in the creation of a synergism of new product development knowledge, which is another contribution of this research. (Chapter 3)

377
o RIM-diagrams are not attributed to Verganti, but instead are a
contribution of this research in the context of RIM application strategies. RIM-diagramming was discovered by trying to apply Verganti’s high-level concepts of RIM to the specific case of aircraft manufacturing. In general, RIM-diagrams have a far left column for the reciprocal interdependencies (knowledge links) of technical, resources, and sequencing, and then other columns to the right labeled common and new, and then horizontally denoted as internal and external. RIM-diagrams help to organize knowledge in a more meaningful way and they highlight the fact that knowledge on new design endeavors is never really at zero percent. (Chapter 6)
o RIM as a collection of Verganti’s concepts within the framework of an
application strategy. (Chapter 7, Figures 7.1 and 7.2)
In Chapter 6, conceptual framework of the RIM-based DSS offers the potential to
assist the IPT with many types of decisions. A decision making instance and associated
feedback are illustrated in a series of flow diagram in Figures 7.6 – 7.16, beginning on
page 329.
The accomplishment of research objective #3 is specifically addressed in Chapter
8. The usefulness of the RIM-based conceptual DSS developed by this research is
compared to ten other approaches found in available literature using eight categories.
The ten approaches are representative of the research discussed in the literature review in
Chapter 3. None of the approaches appear to be as comprehensive or complete as the
conceptual framework presented in this research for early design decision-making with
very limited information. The defined RIM-based DSS for NC machining is more
378
meaningful to IPT decision making during the early stages of design based on the
criterion of the qualitative assessment tool.
9.2 Directions for Future Research
There is a great deal of potential future research related to the use of RIM and
feedforward planning in the development of enterprise information systems for
conceptual design decision-making. These opportunities are discussed in the sections
that follow.
9.2.1 Development of a Computerized RIM-Based NC Machining Prototype
The added tasks of software development and testing are not objectives of this
research in part because of the estimated time and resources involved; but they are a
logical maturity for future research. A great deal of time was devoted in organizing
technical background information, data tables, and potential outputs in the course of
developing the final form of the RIM-based DSS conceptual framework presented in
Chapter 6. In actuality, many pages of data were generated that ultimately were not
needed at this stage of the research; but they nonetheless assisted this author’s thinking
through the IPT decision making process. The creation of an automated, prototype RIM-
based DSS for NC machining is the most likely direction for future research. Once
software is selected, the conceptual framework presented in this research coupled with
data already developed provides a solid starting point.

379
9.2.2 Development of a True Working NC Machining Prototype System
In this research, the data developed thus far did not come from one specific
company or identified source. However, a real world relevant working prototype could
be created if an industrial partner or government agency received access to a sufficient
complement of company specific aircraft manufacturing data for NC machining.
Working with an industrial partner would also provide an opportunity to improve upon
the approaches by involving more real world users.
9.2.3 Expanding the Defined DSS
There are many potential processing category candidates for expanding the DSS
conceptual framework. Forging and composite processes are candidates for future
research. There is process overlap between forged designs and NC machined designs.
Hence, it is anticipated that building a forging module would be fairly straightforward.
Composites manufacturing, tubing, electrical fabrication, casting, molding, and other
processes are also viable candidates. There are many possible future research directions.
9.2.4 Development of a RIM-Based DSS for Aircraft Assembly
If aircraft assembly were defined within the DSS, then the information could be
coupled to generate a project plan beginning with the design effort and ending with final
assembly completion. This type of information could be used to form the baseline
structure of a virtual manufacturing system for an aircraft manufacturing enterprise.
380
Developing a RIM-based DSS for aircraft assembly would be an enormous
undertaking. While projecting the time to install one detail, such as a bulkhead that is
normally on a single installation drawing is not difficult to estimate, the estimation
related to an installation drawing with multiple details is somewhat complex.
During conceptual design, to generate an assembly load sequence, one must take
an estimated detail design list and create a load sequence with many baseline assumptions
and ground rules. The task is further made difficult by the requirement to take factors
such as subassembly, crew loading, line balancing, and fixture forecasting into
consideration. Likewise, the balancing of assembly tasks between different laborers, i.e.,
structural, electrical, and plumbing access/sequencing adds to the overall complexity.
Creating a full-up assembly RIM-based DSS prototype would be similar to creating
several NC machining prototypes because of the many sub-processes that comprise
“aircraft assembly.”
9.2.5 Application of the Methodology to Another Industry
The approach demonstrated in this research has application in other industries.
Examples are shipbuilding or helicopter manufacturing. Even though the processes
highlighted or the patterns of information used might be different in these industries,
reciprocal interdependencies exist, and hence, selective anticipation and commonality can
be used to define and improve upon the exchange of information between IPT members
and enterprise activities.
381
Even though this author has no experience in shipbuilding, on the surface, it
seems likely shipbuilding is similar to aircraft component assembly. Aircraft component
assembly is performed in large fixtures, and prototypes are assembled completely in one
fixture. When crewloading has to be considered in conjunction with assembly tolerances
and structural buildup, it is far more complex than fabricating a single detail design.
Since repeatable patterns exist in aircraft assembly, it is logical that similar patterns exist
in shipbuilding and helicopter assembly. Further investigation in different industries
would provide insights into design progression analysis and patterns of data use.
9.3 Final Thoughts
After reading and studying hundreds of articles related to conceptual design
decision making, one comes away a variety of impressions, and often, more questions. A
few preponderances are:
1) Articles and dissertations published in the late 1980s, 1990s, and 2000s look surprisingly similar to those published in the last few years. The biggest change appears to be the sophistication in computer systems utilized to demonstrate concepts. 2) While many understand the need for enterprise systems that support conceptual design decision making, most publications do no put forth an appreciable amount of new knowledge. The most probable reason is the effort associated with developing these systems is tremendous, as illustrated by the amount of work to develop the defined RIM-based DSS for NC machining presented in this research.
As a side comment, this author contacted several authors who published papers
that discussed starting a project to develop a DSS for conceptual design decision making;
but no published follow-up works exist. The authors who answered inquiries said the

382
effort was far more complex than they had imagined, and for one reason or another, their
effort was deferred.
3) There is considerable opportunity in this field of study, and very likely some of the best models and approaches are closely held within the proprietary documents of commercial enterprises that do well in concurrent engineering, product development, and IPT conceptual design decision making.

383
REFERENCES
Abdalla, H. and Knight, J. (1994). An Expert System for Concurrent Product and Process Design of Mechanical Parts. Journal of Engineering Manufacturing, 208,3,167-172. Aero-News Network. (2005). Australia May Halve JSF Orders Over Costs. Retrieved January 7, 2006. http://www.aero-news.net/news/military.cfm?ContentBlockID= 4d4333ee-c9a5-4e7c-bbe4-c7e9d8a932ad&Dynamic=1 Aerospace Consumerist Consortium. (2005). Metal Processing and Chemical Milling. Retrieved August 17, 2005 from http://www.acc.ae/Products/surface_treatment/metal_processing_ chemical_milling.htm Aft, Lawrence S. (2000). Work Measurement & Methods Improvement. New York: John Wiley & Sons, Inc. Alavi, M. and Leidner, D. (2001). Knowledge Management and Knowledge Management Systems: Conceptual Foundations and Research Issues. Management Information Systems Quarterly, 25, 1, 107-136. Alcatel-Lucent Technologies. (2007). Corporate website. Alcatel-Lucent Innovations. Retrieved January 11, 2007 http://www1.alcatel-lucent.com/gsearch/search.jhtml?_requestid=93233 Alcoa Fastening Systems. (2004). Fasteners Catalog EB2PM1.01M: Eddie Bolt Process Manual. Alcoa Fastening Systems. Retrieved September 5, 2005 from http://www.alcoa.com/fastening_systems/aerospace/en/market.asp?cat_id=216& prod_id=536 Allada, V.and Agarwal, M. (1996). Formalization of Feature Relationships for Determining Sequencing of Machining Operations in Process Planning. Industrial Engineering Research Conference Industrial Engineering Research - Conference Proceedings, 170-175.

384
Andersson, K., Makkonen, P., and Persson, J. (1995). A Proposal to a Product Modelling Language to Support Conceptual Design. Annals of the CIRP, 44,1, 129-132. Arai, E., Goossenaerts, J., Kimura, F., and Shirase, K. (2004). Knowledge and Skill Chains in Engineering and Manufacturing: Information Infrastructure in the Era of Global Communications. International Federation for Information Processing, Springer Science: New York. Asiedu, Y, and Gu, P. (1998). Product Life Cycle Cost Analysis: State of the Art Review. International Journal of Production Research, 36,4, 883-908. Association for the Advancement of Cost Engineering (AACE). (2007). Retrieved October 15, 2007 from http://www.aacei.org/membership/about/whatIsCe.shtml Austin, S., Steele, J., Macmillan, S., Kirby, P., and Spence, R. (2001). Mapping the Conceptual Design Activity of Interdisciplinary Teams. Design Studies, 22, 3, 211-232. Ayag, Z. (2005). An Integrated Approach to Evaluating Conceptual Design Alternatives in a New Product Development Environment. International Journal of Production Research, 42, 4, 687-713.Barski, A., Bailey, J. and Tashiro, R. (2006). Design Analysis and Design Testing. Retrieved October 13, 2007 from http://www.asipcon.com/2006/06_proceed/Tuesday/1015_Bailey.pdf Baker, J. and Reckers, B. (2004). Capacity requirements planning for Shop Floor Scheduling in a Repetitive Environment. Retrieved November 2007 from http://www.camus.org/Conferences/2004-CAMUS/presentations/Session_286.ppt Barski, A., Michalewski, E., Pashkin, M., Rakmanova, I., and Smironov, A. (2001). Application of Decision Support Tools in Organization Management. Proceedings of the 14th International Conference on Systems Science, Wroclaw, Poland, 349-356. Bennett, J. and Lamb, T. (1995). Concurrent Engineering Application and Implementation for U. S. Shipbuilding. Proceedings of the National Shipbuilding Research Program Ship Production Symposium, January 1995, Report A339254, 1-29.

385
Biospace Consulting Services. (2005). Experts in Alkaline Degreasing and Metal Cleaning. Retrieved August 17, 2005. http://biospace.intota.com/multisearch.asp?strSearchType=all&str Query=alkaline+degreasing Blasi, L., Iuspa, L., and Del Core, G. (2000). Conceptual Aircraft Design Based on Multiconstraint Genetic Optimizer. Journal of Aircraft, 37,2, 351-354. Bode, J. (2000). Neutral Networks for Cost Estimating Simulations and Pilot Application. International Journal of Production Research, 38,6, 1231-1254. Boeing Corporation. (2002). Special Process Source Approval. Retrieved October 21, 2005 from http://www.boeing.com/companyoffices/doingbiz/nadcap/nadcapletter.pdf Boeing Corporation. (2006). Supplier Specification Index. Retrieved February 2, 2006 from http://active.boeing.com/doingbiz/d14426/specindex.cfm?SpecPrefix=HP Boothroyd, G. (1994). Product Design for Manufacturing and Assembly. Computer Aided Design, 26,7, 505-520. Brandt, S., Stiles, R., Bertin, J. and Whitford, B. (2004). Introduction to Aeronautics: A Design Perspective. Chapter 7: Structures. Reston, Virginia: The American Institute of Aeronautics and Astronautics, Inc. Brinke, E., Lutters, E., Streppel, T., and Kals, H. (2000). Variant-Based Cost Estimation Based on Information Management. International Journal of Production Research, 38,17, 4467-4479. British Broadcasting Corporation (BBC). (2005). Airbus vs. Boeing. BBC News, April 26th. Retrieved on January 10, 2007. http://news.bbc.co.uk/1/hi/business/4481983.stm British Broadcasting Corporation (BBC). (2006). Harley Davidson Roars into China. BBC News, March 24th. Retrieved on January 10, 2007. http://news.bbc.co.uk/2/hi/business/4842736.stm Brown, A., Judd, R., and Riddick, F. (1997). Architectural Issues in the Design and Implementation of an Integrated Toolkit for Manufacturing Engineering. International Journal of Computer Integrated Manufacturing, 10, 1-4.
386
Browning, T. and Eppinger, S. (2002). Modeling Impacts of Process Architecture on Cost and Schedule Risk in Product Development. IEEE Transactions on Engineering Management, 49, 4, 428-442. Brunetti, G. and Golob, B. (2000). A Feature-Based Approach Towards an Integrated Product Model Including Conceptual Design Information. Computer-Aided Design, 32, 877-887. Bullen, G. (2001). Automated Coldworking at Northrop Grumman. Northrop Grumman, Aerospace Engineering Online. Retrieved January, 2006 from http://www.sae.org/aeromag/features/ace/2001/highlights/page2.htm Butterfield, J., Yao, H., Curran, R., Price, M., Armstrong, C., and Raghunathan, S. (2004). Integration of Aerodynamic, Structural, Cost, and Manufacturing Considerations During the Conceptual Design of a Thrust Reverser Cascase. Proceedings of the 42nd AIAA Aerospace Sciences Meeting and Exhibit, Reno, Nevada, January 5-8, AIAA 2004-282, 1-24. Carballo, J. and Director, S. (2001). Application of Constraint-Based Heuristics in Collaborative Design. Proceedings of the Design Automation Conference, Las Vegas Nevada, 395-400. Chapman, P. (2004). Civil Transporter Conceptual Design Studies and Tradeoff Methodologies Using Matlab Computational Environment. (Doctoral dissertation, City University Department of Management Systems and Information.) Chemical Containment Systems, Incorporated. (2006). Seal Bond Polyurea Sealant and Coating. Retrieved February 2, 2006 from http://www.chemicalcontainment.com/poly_sealant_sys.htm Chen, Y. and Jang-Jong, L. (1999). Cost-Effective Design for Injection Molding. Robotics and Computer-Integrated Manufacturing, 15, 1-21. Chen, Y. and Liang, M. (2000). Design and Implementation of a Collaborative Engineering Information System for Allied Concurrent Engineering. International Journal of Computer Integrated Manufacturing,13,1,11-30. CIMData. (2007). Product Lifecycle Management. Retrieved December 12, 2007 from http://www.cimdata.com/PLM/aboutPLM.html Choi, J., Kelly, D., Raju, J., and Reidsema, C. (2005). Knowledge-Based Engineering System to Estimate Manufacturing Cost for Composite Structures. Journal of Aircraft, 42, 6, 1396-1402.

387
Cincinnati-Lamb Corporation. (2005). Products Specifications: 5-Axis Machining Centers. Cincinnati-Lamb Corporation. Retrieved September 5, 2005 from http://www.cincinnatilamb.com/products.html#anchor4 Cisco Systems, Incorporated. (2007). Corporate website. Product Development Process Approach to Quality. Retrieved January 11, 2007. http://www.cisco.com/web/about/ac50/ac208/cisco_approach_to_quality _qanda09186a00801215e6.html Cleetus, K. (1992). Definition of Concurrent Engineering. CERC Technical Report Series, Research Notes, CERC-TR-RN-92-003, Concurrent Engineering Research Center, West Virginia University, Morgantown, 1-5. Commonwealth of Massachusetts, Executive Office of Environmental Affairs, Office of Technical Assistance. (1994). Case Study – Solvent Use Reduction at Lampin Corporation. Retrieved February 2, 2006 from http://www.p2pays.org/ref/20/19166.htm Condoor, S. and Weber, R. (1999). A Model for Conceptual Design Methodology. Conceptual and Innovative Design for Manufacturing, ASME, Design Engineering, 103, 57-64. Constable, G. (1993). Concurrent Engineering – Its Procedures and Pitfalls. Engineering Management Journal, 3, 5, 215-218. Covey, S. (1989). The 7 Habits of Highly Effective People. New York: Simon and Schuster. Creese, R. and Patrawala,T. (1998). The Return of Feature Based Cost Modeling. Proceedings of the International Society for Optical Engineering, 3517, 172-182. Cutosky, M., Tenenbaum, J., and Muller, D. (1988). Features in Process-Based Design. Proceedings of the American Society of Mechanical Engineering International Computers in Engineering Conference and Exhibition, July 31-August 4, 557-562. Cutosky, M., Fikes, R., Engelmore, R., Genesereth, M., Mark, W., Gruber, T., Tenenbaum, J., and Weber, J. (1993). An Experiment in Integrating Concurrent Engineering Systems. IEEE Transactions on Computers, 26, 1, 28-37. Curran, R., Kundu, A., and Raghunathan; E. (2001). Costing Tools for Decision Making within Integrated Aerospace Design. Concurrent Engineering: Research and Applications, 9,4, 327-338.
388
Curran, R., Kundu, A., Wright, J., Crosby, S., Price, M., Raghunathan, S., and Benard, E. (2006). Modelling of Aircraft Manufacturing Cost at the Concept Stage. International Journal of Advanced Manufacturing Technology, 31, 407-420. Curran, R., Price, M., Raghunathan, S., Benard, E., Crosby, S., Castagne, S. and Mawhinney, P. (2005). Integrating Aircraft Cost Modelling into Conceptual Design. Concurrent Engineering Research and Applications, 13, 4, 321-330. Curtiss-Wright Corporation. (2005). Shot Peen Forming. Retrieved August 17, 2005 from http://www.curtisswright.com/segments/metal_treatment/shot_peen_forming.asp Dassault Systemes. (2007). Corporate History – CATIA. Retrieved December 12, 2007 from http://www.3ds.com/corporate/about-us/?RL=Attendee Day, M. (2002). What is PLM? CAD Digest, April 15, 2002. Retrieved December 12, 2007 from http://www.caddigest.com/subjects/PLM/select/day_plm.htm Defense Contract AuditAgency (2007). Defense Contract Audit Manual (DCAA). Retrieved June 29, 2007 from http://www.dcaa.mil/cam/Appendix_D_-_Technical_Specialist_Assistance.pdf Dorsey, J, Wu, C., Rivers, K., Martin, Jr., C., and Smith, R. (1999). Airframe Integration Trade Studies for a Reusable Launch Vehicle. Space Technology and Applications International Forum (STAIF '99), Albuquerque, New Mexico, January, 1-14. Dowlatshahi, Shad. (1999). A Modeling Approach to Logistics in Concurrent Engineering. European Journal of Operational Research, 115, 59-76. Evans, J., Mehta, P., and Rose, K. (1998). Manufacturing Process Flow Simulation – An Economic Analysis Tool. 30th International SAMPE Technical Conference, October 20-24, 589-595. Engineering Software and Research Analysis. (2001). Cold-Working Analysis. February 2, 2006 from http://www.esrd.com/products/features/cold_working.asp Erickson, R. (2001). Large Millimeter Telescope Project: Engineering Interface Definitions. University of Massachusetts. Retrieved September 5, 2005 from http://www.lmtgtm.org/lmto/fac/Interface_explanation.htm

389
Esterline Corporation. (2004). Non-Destructive Testing/ Penetrant Etch. Retrieved February 2, 2006 from http://www.hytekfinishes.com/capabilities/cap_pg10.stm European Agency for Safety and Health at Work. (2005). Practical Solutions for Metal Degreasing. Retrieved February 2, 2006 http://agency.osha.eu.int/publications/reports/106/en/index_8.htm Fabrycky, W. and Blanchard, B. (1991). Life-Cycle Cost and Economic Analysis. Englewood Cliffs, New Jersey: Prentice-Hall. Fatigue Technology, Incorporated. (2005). Bushing Installations. Retrieved August 17, 2005 from http://www.fatiguetech.com/products_bushings.html Feng, S. (2005). Preliminary Design and Manufacturing Planning Integration Using Web-Based Intelligent Agents. Journal of Intelligent Manufacturing, 16, 423-437. Feng, S. and Song, E. (2000). Information Modeling on Conceptual Design Integrated with Process Planning. The Proceedings of the Symposia on Design for Manufacturabilty - the 2000 International Mechanical Engineering Congress and Exposition, November 5-10, Orlando, Florida, 1-8. Feng, S. and Zhang, Y. (1999). Conceptual Process Planning - A Definition and Functional Decomposition. Manufacturing Engineering Divisions, ASME, Manufacturing Science and Engineering, 10, 97-106. Ferrelrinha, P., Hubka, V., and Eder, W. (1993). Early Cost Calculation: Reliable Calculation, Not Just Estimation. Design for Manufacturability, ASME, 52, 97-104. Fleischer, M. (1996). Concurrent Engineering Update. Automotive Production, 9, 183-185 Fliedl, G., Mayerthaler, W., Winkler, C., Kop, C., and Mayr, H. (1999). Enhancing Requirements Engineering by Natural Language Based Conceptual Predesign. Proceedings of the IEEE International Conference on Systems, Man, and Cybernetics, 5, 778-783. Fujimoto, T. (1997). Shortening Lead Time Through Early Problem Solving – A New Round of Capability Building Competition in the Auto Industry. International Conference on New Product Development and Production Networks, Berlin, Germany.

390
Geiger, T. and Dilts, D. (1996). Automated Design to Cost: Integrating Cost Into the Design Decision. Computer-Aided Design, 28, 6-7, 423-438. Giachetti, R. (1997). Manufacturing Process and Material Selection During Conceptual Design. Proceeding of the 6th Industrial Conference, Institute of Industrial Engineers, 772-777. Goldratt, E. and Cox, J. (1992). The Goal: A Process of Ongoing Improvement. Great Barrington, MA: The North River Press. Greenwood, A. (2003). Pathfinder 2: Insitu Design Cost Trades (IDCT) Tool. Air Force Research Agency, Contract F33615-00-C-5902, Report A272614. Mississippi State University, MS. Greenwood, A. and Ormon, S. (2004). Development of a Generic Cost Estimation Process. Proceedings of the American Society of Engineering Management, October 20-23, 2004, Alexandria, Virginia. Grierson, D. (1994). Conceptual Design Using Evolutive-Cognitive Computing Techniques. Computing in Civil Engineering, 2, 2183-2190. Groot, B. (2006.) The F-35 Death Spiral. The AstroProf’s Page, June 7, 2006, 1-13. Retrieved January 10, 2007. http://astroprofspage.com/archives/70 Gunston, B. (1988). Jane’s Aerospace Dictionary, Third Edition. Jane’s Information Group Limited: United Kingdom, England and Wales. Retrieved on March 12, 2008 from http://www.enotes.com/how-products-encyclopedia/business-jet Haimes, Y. and Schneiter, C. (1996). Covey's Seven Habits and the Systems Approach: A Comparative Analysis. IEEE Transactions on Systems, Man, and Cybernetics, 26,4, 483-487. Hale, P., Scanlan, J., and Bru, C. (2003). Design and Prototyping of Knowledge Management Software for Aerospace Manufacturing. Proceedings of the 10th ISPE International Conference on Concurrent Engineering Research and Application, Enhanced Interoperable Systems, 1083-1090. Han, J., Han, I., Lee, E., and Yi, J. (2001). Manufacturing Feature Recognition Towward Integration Process Planning. IEEE Transactions on Systems, Man and Cybernetics, Part B: Cybernetics, 31,3, 373-380.

391
Hall, D. (2000). Aircraft Conceptual and Preliminary Design. CalPoly State University. Retrieved November 12, 2007 from http://www.aerodesign.ufsc.br/teoria/artigos/projetos/prelim_design.pdf Haque, B. (2003). Problems in Concurrent New Product Development: An In-Depth Comparative Study of Three Companies. Integrated Manufacturing Systems, 14, 3, 15-24. Harley-Davidson, Incorporated. (2007). Company History. Retrieved from the corporate website January 10, 2007. http://www.harleydavidson.com/wcm/Content/Pages/ HD_History/history.jsp?locale=en_US&bmLocale=en_US Harris, D., Howard, R., and Cook, S. (2002). A Systems Approach to Safety in Multi- Crew Aircraft. International Council on Systems Engineering United Kingdom. Retrieved September 3, 2005 from http://www.unisa.edu.au/seec/pubs/02papers/harris-%20aviation%20safety.pdf) Hawley, Ed. (2003). Shipset Standards Reduction. Best Manufacturing Practices Program, The Office of Naval Research: Combiner Test Slip-on Terminations and Adapters. Retrieved October 21, 2005 from http://www.bmpcoe.org/bestpractices/internal/lness/lness_13.html Hayes, C. and Wright, P. (1989). Automated Process Planning: Using Feature Interactions to Guide Search. Journal of Manufacturing Systems, 8, 1-15. Hayes, R., Wheelwright, C., and Clark, K. (1988). Dynamic Manufacturing: Creating the Learning Organization. Free press: New York. Hira, T. and Tanaka, M. (1999). Personalized Assistant for Conceptual Structural Design. Japan Society of Mechanical Engineers International Journal, Series C, 42,2, 435-444. Hoedemaker, G., Geert, M., Blackburn, J., Wassenhove, and Luk, N. (1999). Limits to Concurrency. Decison Sciences, 1, 4-6. Retrieved January 10, 2007. http://calbears.findarticles.com/p/articles/mi_qa3713/is_199901/ai_n8840146 Hsu, W. and Woon, M. (1998). Concurrrent Research in the Conceptual Design of Mechanical Products. Computer Aided Design, 30,5, 377-389. Huang, G., Feng, X., and Mak, K. (2001). POPIM: Online Project Information Management for Collaborative Product Development. Proceedings of the Sixth International Conference on Computer Supported Cooperative Work in Design, Advance Program, Ontario, Canada, 255-260.

392
Huang, H. and Gu, Y. (2006). Modeling the Product Development Process as a Dynamic System with Feedback. Concurrent Engineering Research and Applications, 14,4, 283-291. Huifen, W., Youliang, Z., Jian, C., Lee, S., and Kwong, W. (2003). Feature-Based Collaborative Design. Journal of Materials Processing Technology, 139, 613-618. Hung, S. and Adeli, H. (1994). Object-Oriented Backpropagation and Its Application to Structural Design. Neurocomputing, 6, 45-55. Hurel-Hipsano Meudon Company (Aircelle). (2005). Marking – Manufacturing Instructions for Vibroengrave. IFHD 68004. Retrieved August 17, 2005 from http://www.aircelle.com/docs/IFHD68004F_FR.pdf Ingols, C. and Brem, L. (1998). Implementing Acquisition Reform: A Case Study on Joint Direct Attack Munitions. Fort Belvoir, Virginia: Defense Systems Management College. Irgens, C. (1995). Design Support Based On Projection of Information Across Product-Development Life Cycle by Means of Case-Based Reasoning. IEE Proceedings on Science, Measurement, and Technology, 142, 354-349. Ishii, K. (1990). Role of Computers in Simultaneous Engineering. Computers in Engineering, 217-224. Jahan-Shahi, H., Shayan, E., and Masood, S. (1999). Cost Estimation in Flat Plate Processing Using Fuzzy Sets. Computers and Industrial Engineering, 37, 485-488. Jiao, J. and Tseng, M. (1999). A Pragmatic Approach to Product Costing Based on Standard Time Estimation. International Journal of Operations and Production Management, 19, 7, 738-755. Johnson, C. (2007). Don’t Overlook Manufacturing Execution in Your Product Lifecycle Management Strategy. Retrieved January 3, 2008 from http://www.visiprise.com/pdf/dont_overlook_manufacturing.pdf Johnson, D. (2005). Shot Peening to Improve the Life of Atomizer Components. Retrieved August 17, 2005 from http://www.omegaatomizers.com/document.cfm?ID=18

393
Johnson, D. and Robinson, J. (2005). X-43D Conceptual Design and Feasibility Study. Proceedings of the AIAA/CIRA 13th International Space Planes and Hypersonics Systems and Technologies Conference, Capua, Italy, May 26-20, AIAA 2005-3416, 1-12. Jung, J. (2002). Manufacturing Cost Estimation for Machined Parts Based on Manufacturing Features. Journal of Intelligent Manufacturing, 13, 227-238. Kalagnanam, J., Singh, M., Verma, S., Patek, M., and Wong, Y. (2004). A System for Automated Mapping of Bill-of-Materials Part Numbers. Proceedings of the Tenth ACM SIGKDD International Conference on Knowledge Discovery and Data Mining, 805-810. Kaman Aerospace. (2006). Specification Documents – Cold Working. Retrieved February 2, 2006 from http://www.kamanaero.com/dmrdsh/F000000108.HTM Kan, H., Duffy, V., and Su, C. (2001). An Internet Virtual Reality Collaborative Environment for Effective Product Design. Computers in Industry, 45, 197-213. Kapoor, L.M. (1990). Determining Life Cycle Costs of a Work Measurement System. Proceedings of the IEEE National Conference on Aerospace and Electronics, May 21-25, 1990, 3, 995-1000. Kastelic, S., Kopac, J., and Peklenik, J. (1993). Conceptual Design of a Relational Data Base for Manufacturing Processes. Computer Aided Systems Engineering, 493-496. Keiso, D. and Weygandt, J. (1995). Intermediate Accounting – Eighth Edition. New York: John Wiley & Sons, Inc. Khoshnevis, B., Park, J. and Sormaz, D. (1994). Cost Based System for Concurrent Part and Process Design. Engineering Economist, 40, 1, 101-124. Kimura, I. and Grote, K. (2002). Design Decision-Making in the Early Stages of Collaborative Engineering. Proceedings of the Conference on Computer and Information in Engineering, ASME, Design Engineering Technical Conferences, Canada, 15-22. Kirby, M. (2001). A Methodology for Technology Identification, Evaluation, and Selection in Conceptual and Preliminary Aircraft Design. (Doctoral dissertation, Georgia Institute of Technology, Department of Aerospace Engineering).

394
Kolb, M. and Bailey, M. (1993). FRODO: Constraint-Based Object Modeling for Preliminary Design. ASME, Advances in Design Automation, 65,1, 307-318. Kleban, S., Stubblefield, K., Mitchiner, J., and Arms, M. (2001). Collaborative Evaluation of Early Design Decision and Product Manufacturability. Proceedings of the 34 Annual Hawaii International IEEE Conference on System Sciences,1-10. Krause, F. and Schlingheider, J. (1995). Development and Design With Knowledge- Based Software Tools - An Overview. Expert Systems With Applications, 8,2, 233-248. Kroll, E. (1992). Towards Using Cost Estimates to Guide Concurrent Design Process. Concurrent Engineering, American Society of Mechanical Engineers, Production Engineering Division, 59, 281-293. Kumara, S. and Kamarthi, S. (1992). Application of Adaptive Resonance Networks for Conceptual Design. Annals of the CIRP, 41,1, 213-216. Lake, J. (1994). Do We Need a Statement of Work? A Radical Argument for Elimination. Defense Acquisition University, September-October 1994, 47-51. Retrieved September 4. 2005 from http://www.dau.mil/pubs/pm/pmpdf94/lake.pdf LaMont, D. and Benjamin, B. (1995). Dynamic Integrated Cost and Engineering (DICE) Model and Its Applicability to ATP Systems. Proceedings of the International Society for Optical Engineering, 2468, 39-50. Lawson, M. and Karandikar, H. (1994). A Survey of Concurrent Engineering. Concurrent Engineering, 2, 1, 1-6. Lee, C. and Kelce, G. (2003). Total Manufacturing Information System: A Conceptual Model of a Strategic Too for Competitive Advantage. Integrated Manufacturing Systems, 14, 2, 114-122. Lee, J., Kim, H., and Kim, K. (2001). A Web-Enabled Approach to Feature-Based Modeling in a Distributed and Collaborative Design Environment. Concurrent Engineering: Research and Applications, 9,1, 74-87. Leihn, P. (2003). Connecting the Design Chain Online. Civil Engineers in Australia, Institution of Engineers, 75, 5, 46.

395
Levitt, R. (2006). Aligning Portfolio, Program and Project Management with Your Demand-Supply Networks. Stanford University Advanced Project Management Program. Retrieved October 15, 2007 from http://crgp.stanford.edu/publications/articles_presentations/ Levitt_Aligning%20Portfolio%20Program%20and%20Project%20Mgt.pdf Li, C., Tan, S., and Chan, K. (1996). Qualitative and Heuristic Approach to the Conceptual Design of Mechanisms. Engineering Applications of Artificial Intelligence, 91,1, 17-31. Liang, W. and O'Grady, P. (2002). An Object-Oriented Formalism for Feature-Based Distributed Concurrent Engineering. Concurrent Engineering: Research and Applications, 10, 1, 41-53. Liebl, P. and Hoehne, G. (1999). Concurrent Cost Calculations with a Feature-Based CAD System. American Society of Mechanical Engineers, Design Engineering Division,103, 75-87. Lockheed Martin Corporation. (2002). Engineering Requirements Flow Down Guide – LM Aero Supplier Guide. Retrieved February 2, 2006 from http://www.lockheedmartin.com/wms/findPage.do?dsp=fec&ci=15548 &rsbci=15449&fti=0&ti=0&sc=400 Lockheed Martin Corporation. (2006). Quality Control Specification Index - Penetrant Inspection. Retrieved February 2, 2006 from https://elli.lmtas.com/qads/QCS001.asp?type=ProcessName&Name= Penetrant+inspection&state=tx®ion=&Search=Search Luby, S., Dixon, J., and Simmons, M. (1986). Creating and Using a Features Data Base. Computers in Mechanical Engineering, 5,3, 25-33. Lukibanov, O., Martinez, I., Lenz, T., McDowell, J., Radcliffe, C., and Sticklen, J. (2000). Socharis: The Instantiation of a Strategy for Conceptual Manufacturing Planning . Artificial Intelligence for Engineering Design, Analysis, and Manufacturing, 14, 323-335. Luttgeharm, C. (1990). Design Considerations of Material and Process Selection for Commercial Aircraft Engine Nacelles. SAE Technical Paper Series, 901983, Aerospace Technology Conference and Exposition, Long Beach, October 1-4, 8. Lyssy, F. and Sharp, B. (1997). DoD Work Measurement/Labor Standards Redesign and System Architecture: Phase II. Falls Church, Virginia: Lockheed Martin Corporation. Lockheed Martin Reference Number: CP1O0201. (Purchased from Storming Media Pentagon Reports.)

396
Ma, C., Wang, H., Dai, G. (2002). Research on Network Based Conceptual Design. Proceedings of the Sixth International Conference on Computer Supported Cooperative Work in Design, 232-235. Ma, Y. and Tong, T. (2003). Associative Feature Modeling for Concurrent Engineering. Computers in Industry, 512, 51-71. Makino Corporation. (1998). Case Studies in High Speed Machining: Makino and Lockheed Martin Corporation. Retrieved August 17, 2005 from http://www.makino.com/industries/aerospace/structural_components/ case_studies/article.aspx?id=21 Martin, R. and Evans, D. (2000). Reducing Costs in Aircraft: The Metals Affordability Initiative Consortium. Journal of Minerals, Metals & Materials Society, 52, 3, 24-28. Mashl, S., Hebeisen, J., and Hjorth, C. (1999). Producing Large P/M Near-Net Shapes Using Hot Isostatic Pressing. Journal of Minerals, Metals & Materials Society, 51, 7, 29-31. Matsushima, K., Okada, N, and Sata, T. (1982). The Integration of CAD and CAM by Application of Artificial-Intelligence Techniques. Annals of the CIRP, 31,1, 329-332. Melan, E. (2002). Process Management. Springer US: New York. Meredith, J. and Mantel, S. (2000). Project Management: A Managerial Approach, Fourth Edition. New York: John Wiley & Sons. Meredith, J. and Mantel, S. (1989). Project Management: A Managerial Approach, First Edition. New York: John Wiley & Sons. Miller, C. and Guimaraes, T. (2005). Addressing Some HRM Issues to Improve Performance of Cross-Functional Teams in Concurrent Engineering. Proceedings of the IEEE International Engineering Management Conference, September 11-13, St. John’s, Newfoundland, Canada, 260-264. Miller, Ed. (2001). Tying It All Together. Integrated Manufacturing Solutions, SME, 7, 38-46. Mirghani, M.A. (1996). Aircraft Maintenance Budgetary and Costing Systems at the Saudi Arabian Airlines: An Integrated Business Approach. Journal of Quality in Maintenance Engineering, 2, 4, 32-47.

397
Molloy, E., Yang, H., and Browne, J. (1993). Feature-Based Modelling in Design forAssembly. International Journal of Computer Integrated Manufacturing, 6, 1-2, 119-125. Morrison, D. and Neff, G. (1997). Lofting and Conics in the Design of Aircraft. Proceedings of the ASEE Illinois/Indiana Section Conference, March 13-15, Indianapolis, Indiana, 222-227. Mosher, T. (1999). Conceptual Spacecraft Design Using a Genetic Algorithm Trade Selection Process. Journal of Aircraft, 36,1, 200-213. Mouli, C. (1005). Next Generaion Manufacturing Execution System (MES) Enabling Fully Integrated Fabrication Automation in 300mm Technology Development and Manufacturing. Proceedings of the IEEE conference on Advanced Semiconductor Manufacturing, April 11-12, 2005, Munich, Germany, 1, 77-85. Murman, E., Walton, M., and Rebentisch, E. (2000). Challenges in the Better, Faster, Cheaper Era of Aeronautical Design, Engineering, and Manufacturing. Proceedings of the Lean Aerospace Initiative, Massachusetts Institute of Technology, September 2000, 1-16. National Aeronautics and Space Administration (NASA). (2005). NASA Airframe Cost Model. Retrieved August 17, 2005 from http://cost.jsc.nasa.gov/airframe.html National Institute of Standards and Technology (NIST). (2002). Integration Definition for Function Modeling (IDEF0) Standard. Retrieved August 2006 from http://www.itl.nist.gov/fipspubs/idef02.doc NCMT, Ltd. (2000). Case Studies: High Tolerance Machining Centre for BAE Systems. Engineering Talk. Retrieved August 17, 2005 from http://www.engineeringtalk.com/news/ncm/ncm105.html Neff, J. and Presley, S. (2002). Implementing a Collaborative Conceptual Design System. Proceedings of the IEEE Aerospace Conference, 1, pp 341-353. Northrop Grumman. (1999). Northrop Grumman Manufacturing Day Calendar. Retrieved September 27, 2005 from https://oasis.northgrum.com/general/docs/MDAYALL.pdf Northrop Grumman. (2004). Northrop Grumman Supplier Tooling Manual. Retrieved September 25, 2005 from https://oasis.northgrum.com/contract/masdtlng/Tlngman.PDF

398
Nuschke, P. and Jiang, X. (2007). A Framework for Inter-organizational Collaboration Using Communication and Knowledge Management Tools. Online Communities and Social Computing. Springer Berlin / Heidelberg. Nussgaum, B. (2005). Do Ford and GM Really Get Innovation? Business Week, October 21, 1-6. Retrieved January 10, 2007. http://www.businessweek.com/innovate/NussbaumOnDesign/archives /2005/10/do_ford_and_gm.html Oh, J., Ogrady, P., and Young, R. (1995). A Constraint Network Approach to Design for Assembly. IIE Transactions, 27, 72-80. Ong, N. (1995). Manufacturing Cost Estimation for PCB Assembly: An Activity Based Approach. International Journal of Production Economics, 38, 159-172. O'Sullivan, B. (2002). Interactive Constraint-Aided Conceptual Design. Artificial Intelligence for Engineering Design, Analysis, and Manufacturing, 16, 303-328. Ou-Yang, C. and Lin, T. (1997). Developing an Integrated Framework for Feature- Based Early Manufacturing Cost. International Journal of Advanced Manufacturing Technology, 13, 618-629. Ou-Yuang, C. and Pei, H. (1999). Developing a STEP-Based Integration Environment to Evaluate the Impact of an Engineering Change on MRP. The International Journal of Advanced Manufacturing Technology, 15, 11, 769-779. Pallez, D., Dartiques, C., and Ghodous, P. (2001). Data Architecture for Collaborative Conceptual Design. Proceedings of the 8th International IEEE Symposium on Emerging Technologies and Factory Automation, 1, 597-602. Pallister, J. and Daintith, J. (2006). A Dictionary of Business and Management. Oxford University Press: New York. Park, J and Khoshnevis, B. (1993). A Real-Time Computer-Aided Process Planning System as a Support Tool for Economic Product Design. Journal of Manufacturing Systems, 12, 2, 181-192. Park, J., Seo, K., Wallace, D., and Lee, K. (2002). Approximate Product Life Cycle Costing Method for the Conceptual Product Design. CIRP Annals, Manufacturing Technology, 51,1, 421-424.
399
Parmee, I. and Bonham, C. (2000). Towards the Support of Innovative Conceptual Design Through Interactive Designer/Evolutionary Computing Strategies. Artificial Intelligence for Engineering Design, Analysis, and Manufacturing, 14, 3-16. Patrashkova, R. and McComb, S. (2004). Exploring Why More Communication is Not Better: Insights From a Computational Model of Cross-Functional Teams. Journal of Engineering Technology Management, 21, 83-114. Petrushka, E., Little, M., and Dale, C. (1990). Integrated Product Development (IPD) at General Dynamics Forth Worth. Proceedings of the AHS and ASEE Aircraft Design Systems and Operations Conference, Dayton, OH, Sept 17-19, 15. Phillips, R., Zhou, X., and Mouleeswaran, C. (1984). An Artificial Intelligence Approach to Integrating CAD and CAM Through Generative Process Planning. Proceedings of the International Computers in Engineering Conference, Computers In Engineering, 459-463. Portioli-Staudacher, A., Landeghem, H., Mappelli, M., and Redaelli, C. (2003). Implementation of Concurrent Engineering: A Survey in Italy and Belgium. Robotics and Computer-Integrated Manufacturing, 19, 3, 225-238. Prasad, B. (2000). Converting Computer-Integrated Manufacturing into an Intelligent Information System by Combining CIM With Concurrent Engineering and Knowledge Management. Industrial Management & Data Systems, 100, 7. Pratt, M. (1984). Solid Modeling and the Interface Between Design and Manufacturing. IEEE Computer Graphics and Applications, 4,7, 52-69. Qin, S., Harrison, R., West, A., Jordanov, I., and Wright, D. (2003). A Framework of Web-Based Conceptual Design. Computers in Industry, 50, 153-164. Qiu, S., Fok, S., Chen, C., and Xu, S. (2002). Conceptual Design Using Evolution Strategy. International Journal of Advanced Manufacturing Technology, 20, 683-691. Rai University. (2004). Personnel Forecasting: Human Resource Planning Method ands Measurement. Retrieved October 21, 2005 from http://www.rcw.raiuniversity.edu/management/mba/HRPD/lecture-notes/ lecture-04.pdf
400
Rais-Rohani, M. and Greenwood, A. (1998). Product and Process Coupling in Multidisciplinary Design and Flight Vehicle Structures. Proceedings of the AIAA/USAF/NASA/ISSMO Symposium on Multidisciplinary Analysis and Optimization, St. Louis, MO, September 2-4, 1998, (A98-39701), 10-31. Rao, R.and Lu, S. (2993). Inverse Engineering: A Methodology for Learning Models to Support Engineering Design. Proceedings of the Conference on Artificial Intelligence Applications, IEEE, 205-211. Raytheon Corporation. (2003). Control of Product Manufacturing Processes for Suppliers and Outside Production. Retrieved October 21, 2005 from http://www.raytheonaircraft.com/about_us/files/BS25691Rev6.pdf Raytheon Corporation. (2004). Special Processes That Require RAC Supplier Approval. Retrieved October 21, 2005 from http://www.raytheonaircraft.com/about_us/files/Supplier_Approval_ Nov_24_2004.pdf Rehmann, S. and Guenov, M. (1998). Methodology for Modelling Manufacturing Costs At Conceptual Design. Computers and Industrial Engineering, 35, 3-4, 623-626. Reich, Y., Konda, S., Subrahmanian, E., Cunningham, D. and Dutoit, A. (1999). Building Agility for Agile Design Information Systems. Research in Engineering Design,11, 67-83. Richards, D. (2000). The Reuse of Knowledge: A User-Centered Approach. International Journal of Human-Computer Studies, 52, 553-579. Rickman, D. (2001). Model Based Process Deployment. Proceedings of the 20th Conference on Digital Avionics Systems, 1, 1, 1-8. Rogerson, W. (1992). Overhead Allocation and Incentives for Cost Minimization in Defense Procurement. The Accounting Review, 67 ,4, 671-690. Roller, D. (1989). Design by Features: An Approach to High Level Shape Manipulations. Computers in Industry, 12, 185-191. Rose, J. (2002). Raytheon’s Andover Team is Uncovering the Company’s Agile Side. The Manufacturer, 2, 7, 14-18. Rowell, L., Braun, R., Olds, J., and Unal, R. (1999). Multidisciplinary Conceptual Design Optimization of Space Transportation Systems. Journal of Aircraft, 36,1, 218-226.

401
Roy, R. and Sackett, P. (2003). Cost Engineering: The Practice and the Future. Dearborn, Michigan: CASA/SME – Computer and Automated Systems Association of the Society of Manufacturing Engineers. Roy, U., Usher, J., and Parsaei, H. (1999). Preface. In Usher, J., Roy, U., and Parsaei, H. (Eds.), Simultaneous Engineering Methodologies and Applications (p. xi). Singapore: Overseas Publishers Association Rummler, G. and Brache, A. (1995). Improving Performance: How to Manage the White Space in the Organization Chart. California: Jossey-Bass. Rumsfeld, D. (1995). Five Ways to Downsize Government. Heartland Perspectives, August 4, 1995. Retrieved November 17, 2007 from http://managementconsultant.blogsome.com/2006/04/10/article-92-article-on- downsizing-by-donald-rumsfeld Salvendy, G. (2001). Handbook of Industrial Engineering: Third Edition. John Wiley: New York. Sandberg, M. (2005). Knowledge Enabled Engineering Design Tools for Manufacturability Evaluation of Jet Engine Components (Masters Thesis, Lulea University of Technology, Department of Applied Physics and Mechanical Enigneering, Division of Computer Aided Design, 2005.) Schatz, T. (2003). Bailing Boeing. National Review Online, July 24th. Retrieved January 10, 2007. http://www.nationalreview.com/comment/comment-schatz072403.asp Schill, R. and McArthur, D. (1992). Redefining the Strategic Competitive Unit: Towards a New Global Marketing Paradigm. International Marketing Review, 9, 3, 5-23. Schlimbach, J. and Mitschang, P. (2006). Process-Based Time Estimation for Thermoplastic Tape Placement. Journal of Thermoplastic Composite Materials, 19, 507-529. Schroder, H. and Jetter, A. (2003). Integrating Market and Technological Knowledge in the Fuzzy Front End: An FCM-Based Action Support System. International Journal of Technology Management, 26, 5-6, 517-539. Schultz, K. (2006). Embracing Concurrent Engineering. Appliance Magazine, 3, 1-2. Retrieve January 10, 2007 from http://www.appliancemagazine.com/editorial.php?article=1345&zone=1&first=1

402
Schut, J. (2003). E-Collaboration is Coming (But More Slowly than Expected). Plastics Technology, 3, 54-59. Schwingenschloegl, A. (2007). Coordination and Cooperation in Supplier Networks. University of Vienna, Austria. Retrieved October 15, 2007 from http://www.wu-wien.ac.at/am/Download/wp92.pdf Seco/Warwick Corporation. (2005). Solution Heat Treat. Retrieved August 17, 2005. http://www.secowarwick.com/solutionheat.html Sensmeier, M. and Jamshid, S. (2004). A Study of Vehicle Structural Layouts in Post- WWII Aircraft. 45th AIAA/ASME/ASCE/AHS/ASC Structures, Structural Dynamics and Materials Conference, Palm Springs, California, April 19-22, 1-8. Sharma, R. and Gao, J. (2002). A Progressive Design and Manufacturing Evaluation System Incorporating STEP AP224. Computers in Industry, 47, 155-167. Sharp, P. and Clark, G. The Effect of Peening on the Fatigue Life of 7050 Aluminum Alloy. Australian Government Department of Defence, DDTO-RR-0208. Retrieved August 17, 2005 from http://www.dsto.defence.gov.au/publications/2358/ Shehab, E. and Abdalla, H. (2001). An Integrated Prototype System for Cost-Effective Design. Concurrent Engineering Research and Applications, 9, 4, 243-256. Shehab, E. and Abdalla, H. (2001). Manufacturing Cost Modeling for Concurrent Product Development. Robotics and Computer Integrated Manufacturing., 17,4, 341-353. Shing, O. (1999). Design for Manufacture of a Cost-Based System for Molded Parts. Advances in Polymer Technology, 18,10, 33-42. Shobrys, D. and White, D. (2000). Planning, Scheduling, and Control Systems: Why Can They Not Work Together. Computers and Chemical Engineering, 24, 163-173. Shumaker, G. and Thomas, R. (1998). Integrated Processes in Defense Manufacturing. In Usher, J., Roy, U., and Parsaei, H. (Eds.), Integrated Product and Process Development: Methods, Tools, and Technologies (pp. 309-338). New York: John Wiley and Sons.

403
Simpson, T., Bauer, M., Allen, J., and Mistree, F. (1995). Implementation of DFA in Conceptual and Embodiment Design Using Decision Support Tools. Design Engineering Technical Conferences Volume 1, ASME, Design Engineering, 82, 119-126. Sky, R. and Buchal, R. (1999). Modeling and Implementing Concurrent Engineering in a Virtual Collaborative Environment. Concurrent Engineering: Research and Applications, 7,4, 279-289. Smith, B. (2003). The Boeing 777. Advanced Materials & Processes, 9, 41-44. Smith, C. and Knezevic, J. (1996). Achieving Quality Through Supportability – Part I: Concepts and Principles. Journal of Quality in Maintenance Engineering, 2, 2, 21-29. Smith, N. and Sankaran, M. (2003). Probabilistic Methods for Aerospace System Conceptual Design. Journal of Spacecraft and Rockets, 40,3, 411-418. Smith, R. (2005). The Virtual Machine Shop: Countersinking, Counterboring, and Spotfacing. Retrieved August 17, 2006 from http://www.jjjtrain.com/vms/cutting_tools_csinkborespot.html Software Engineering Institute (SEI). (2002). Using CMMI to Improve Earned Value Management. Retrieved November 15, 2007 from http://www.sei.cmu.edu/pub/documents/02.reports/pdf/02tn016.pdf Sundar, P., Kamarthi, S., and Zeid, I. (2001). Collaboration Platform for Design Agility. Proceedings of the International Society for Optical Engineering, Conference on Intelligent Systems in Design and Manufacturing IV, 4565, 1-10. Swank, W., Alfieri, P., Gailey, C., and Reig, R. (2000). Acquisition Trend Metrics in the Department of Defense. DAU Press Technical Report, TR 1-00. Defense Acquisition University Defense Systems Management College. Fort Belvoir, Virginia. 1-21. Sycara, K. and Navinchandra, D. (1992). Retrieval Strategies in Case-Based Design Systems. Artificial Intelligence in Engineering Design, 2, 145-163. Taleb-Bendiab, A. (1993). ConceptDesigner: A Knowledge-Based System for Conceptual Engineering Design. International Conference On Engineering Design, The Hague, August 17-19,1303-1310 Tay, F. and Gu, J. (2002). Product Modeling for Conceptual Design Support. Computers in Industry, 48, 143-155.

404
Tolometti, G. and Saunders, V. (1998). An Air Force Collaborative Enterprise Environment. Proceedings of the IEEE National Aerospace and Electronics Conference, 303-310. Trygg, L. (1991). The Need for Simulataneous Engineering in Time-Based Competition. Technology Management: Technology Strategies and Integrated Information Systems in Manufacturing. VTT: Helsinki Trygg, L. (1993). Concurrent Engineering Practices in Selected Swedish Companies: A Movement or an Activity of the Few? Journal of Product Innovation Management, 10, 5, 403-416. Tseng, Y. and Jiang, B. (2000). Evaluating Multiple Feature-Based Machining Methods Using an Activity Based Cost Analysis Model. International Journal of Advanced Manufacturing Technology, 16, 617-623. Ulrich, K. and Eppinger, S. (2000). Product Design and Development. New York: McGraw-Hill. United States Air Force. (2004). Technical Order 1-1-691: Aircraft Weapons Systems Cleaning and Corrosion Control. Retrieved February 2, 2006 from http://www.robins.af.mil/logistics/LGEDA/Documents/techord.htm United States Air Force Materiel Command. (2004). Integrated Master Plan and Schedule Guide. Retrieved October 2007 from http://www.e-publishing.af.mil/shared/media/epubs/AFMCPAM63-5.pdf United States Army Corp of Engineers. (2000). Engineering Manual EM 1110-2- 2702, Appendix A-C. Retrieved September 3, 2005 from http://www.usace.army.mil/inet/usace-docs/eng-manuals/em1110-2-2702/a-c.pdf United States Department of the Air Force. (2002). Systems Engineering Revitalization: Learning Curves. Los Angeles Base California: Headquarters Space and Missile Systems Center (AFSPC). Retrieved September 27, 2005 from http://ax.losangeles.af.mil/se_revitalization/aa_functions/manufacturing/ Attachments/18.%20The%20Learning%20Curve.htm United States Department of Defense. (1998). Work Breakdown Structure Handbook, MIL-HDB-881, Appendix A: Aircraft Systems. Department of Defense. Retrieved September 5, 2005 from https://www.nmciinfo.usmc.mil/sites/sei/MilHandbook881WBS.pdf

405
United States Department of Transportation, Federal Aviation Administration (FAA). (1997). Replacement and Modification of Standard Parts. Federal Register: March 5, 1997, 62, 9923-9925. Retrieved September 5, 2005 from http://www.s-techent.com/std-part.pdf United States Environmental Protection Agency. (2001). Pollution Prevention in Machining and Metal Fabrication – A Manual for Technical Assistance Providers. Retrieved October 21, 2005 from http://newmoa.org/prevention/topichub/23/NEWMOAmanual.pdf United States Federal Aviation Administration, Department of Transportation. (2005). Airworthiness Directives: Vibroengraving. Retrieved August 17, 2005 from http://www8.landings.com/cgi-bin/get_file?pass=12345&ADS/1972/ 72-18-02R1.html United States General Accountability Office. (1997). Major Acquisitions: Significant Changes Underway in DOD's Earned Value Management Process - GAO/NSIAD-97-108. Retrieved September 27, 2005 from http://www.fas.org/man/gao/ns97108.htm United States Government Accountability Office. (2002). Capturing Design and Manufacturing Knowledge Early Improves Acquisition Outcomes - GAO-02-701. Retrieved October 21, 2005 from http://www.gao.gov/new.items/d02701.pdf United States Office of the Secretary of Defense. (1997). Defense Science Board Task Force Report on Vertical Integration and Supplier Decisions. “Make or Buy” Conference, May 1997, Washington, D. C. Retrieved September 5, 2005 from http://www.acq.osd.mil/dsb/reports/verticle.pdf United States Office of the Secretary of Defense. (2005). Inflation Guidance – Fiscal Year (FY) 2006 President’s Budget. Fiscal Year (FY) 2006 President’s Budget, dated February 3, 2005. Retrieved September 24, 2005 from http://www.ncca.navy.mil/services/OSD_FY06_Inflation_Guidance.pdf http://www.ncca.navy.mil/services/Inflation_Calc_FY06_Ver_2.xls#'Inflation Table'!A United States Office of the Undersecretary of Defense for Acquisition Technology and Logistics. (2005). Realization Factor 8.3 - Measuring And Projecting Operation Efficiency Contract Pricing Reference Guides. Retrieved September 27,2005 from http://www.acq.osd.mil/dpap/contractpricing/vol2chap8.htm

406
United States Office of the Undersecretary of Defense for Acquisition Technology and Logistics. (2007). Defense Procurement and Acquisition Policy, Measurement and Projecting Operation Efficency, Effiency Factors and Realization. Retrieved June 29, 2007 from http://www.acq.osd.mil/dpap/contractpricing/vol2chap8 Unites States Office of the Undersecretary of Defense, Acquisition and Technology, Performance Management. (2005). Retrieved November 12, 2007 from http://stinet.dtic.mil/cgi- bin/GetTRDoc?AD=ADA402985 &Location=U2&doc=GetTRDoc.pdf Vajna, S. (2005). Optimize Engineering Processes with Simultaneous engineering (SE) And Concurrent Engineering (CE). Proceedings of the ASME International Design Engineering Technical Conferences and Computers and Information in Engineering Conferences, 711-720 Vasilash, G. (2001). Best Potential. Automotive Design & Production, 10. 1-2. Retrieved January 10, 2007. http://findarticles.com/p/articles/mi_m0KJI/is_10_113/ai_79588637 Valdez, R. and Kleiner, B. (1996). How to Build Teamwork in the Defense Industry. Team Performance Management, 2, 2, 41-48 Verganti, R. (1998). Anticipating Manufacturing Constraints and Opportunities into the Concept Generation and Product Planning Phase. In Usher, J., Roy, U., and Parsaei, H. (Eds.), Integrated Product and Process Development: Methods, Tools, and Technologies (pp. 309-338). New York: John Wiley and Sons. Vollerthun, A. (1998). Design-to-Cost in a Model Driven Environment. Proceedings of the 49th International Astronautical Congress, Melbourne, Australia, 7-10. Wahl, M., Maas, C., Ambler, T., and Rahman, M. (2001). From DFT to Systems Test - A Model Based Cost Optimisation Tool. Proceedings of the IEE Conference on Design , Automation, and Test, Computer Society, 302-306. Wall. S. (2004). Model-Based Engineering Design for Space Missions. Proceedings of the IEEE Aerospace Conference, Big Sky, Wyoming, March 6-13, 6, 3907-3915. Wang, K. and Chien, C. (2003). Designing an Internet-based Group Decision Support System. Robotics and Computer Integrated Manufacturing, 19, 1-2, 65-77

407
Wang, L., Shen, W., Xie, H., Neelamkavil, J., and Pardasani, A. (2002). Collaborative Conceptual Design - State of the Art and Future Trends. Computer- Aided Design,34, 981-996. Wang, Y. and Wang, L. (2002). Automatic Conceptual Design of Mechanical Devices Based on Reasoning the Design Rules. Proceedings of the ASME Design Engineering Technical Conference, Montreal, Canada,1, 123-128. Wartik, T. (2004). What is a Conceptual Framework? Retrieved March 2005 from http://wartik19.biotec.psu.edu/Docs/Conceptual.html Waterson, P., Clegg, C., Bolden, R., Pepper, K., Warr, P., and Wall, T. (1999). International Journal of Production Research, 37, 10, 2271-2292. Watson, E., Medeiros, D., and Sadowskil, R. (1997). A Simulation-Based Backward Planning Approach for Order Release. Proceedings of the 1997 Winter Simulation Conference, Atlanta, Georgia. Wei, Y. and Egbelu, P. (2000). A Framework for Estimating Manufacturing Cost from Geometric Design Data. International Journal of Computer Integrated Manufacturing, 13,1, 50-63. Wheeler, R., Burnett, R., and Rosenblatt, A. (1991). Concurrent Engineering: Success Stories in Instrumentation Communications. IEEE Spectrum, 7, 32-37. Wideman, M. (2002). Glossary of Common Project Management Terms. Cost breakdown structure. Retrieved August 17, 2005 from http://www.maxwideman.com/pmglossary/PMG_C10.htm Wiegers, K. (2003). Software Requirements 2: Practical Techniques for Gathering and Management Requirements Throughout the Product Development Cycle, 2nd ed. Microsoft Press: Redmond. Wierda, L. (1990). Design-Oriented Cost Information: The Need and the Possibilities. Journal of Engineering Design, 1,2, 147-167. Wilcox, K. (2002). Aircraft Engineering Systems Cost Analysis - Typical Learning Curve Percentages. MIT, Aerospace Computational Design Laboratory, 16.885 Aircraft Engineering Systems Cost Analysis. Retrieved September 25, 2005 from http://ocw.mit.edu/NR/rdonlyres/Aeronautics-and-Astronautics/16- 885JFall2003/8CACE2FE-A136-4B03-93B6-08F81FC911BB/0/pres_willcox.pdf Wilcox K. and Wakayama, S. (2003). Simultaneous Optimization of a Multiple- Aircraft Family. Journal of Aircraft, 40, 4, 616-622.

408
Winner, R.I., Pennell, J.P., Bertrend, H.E., and Slusarczuk, M.M.G.. (1988). The Role of Concurrent Engineering in Weapons System Acquisition. IDA Report R-338, Institute for Defense Analyses, Alexandria, December, 1-197. Winter, D. (1999). Back to the Future? – Simultaneous Engineering. Ward’s Auto World, March. Retrieved January 11, 2007. http://www.findarticles.com/p/articles/mi_m3165/is_n3_v25/ai_7451083 Wisconsin Historical Society (2005). Maritime Terminology Glossary. Retrieved September 3, 2005 from http://www.wisconsinshipwrecks.org/tools_glossary.cfm World Car Fans, Incorporated. (2006). Toyota Camry: a Truly Global Car. World Car Fans, May 31, 2006. Retrieved January 10, 2007. http://www.worldcarfans.com/news.cfm/newsID/2060531.007/ country/jcf/toyota/toyota-camry-a-truly-global-car Wynn, J., Laforteza, T. and Denissov, A. (2005). Cost Overruns, Schedule Delays & Performance Failures in Civil Space Programs: Lessons Learned & Recommendations for the Vision Space Exploration. Proceedings of the AIAA 1st Space Exploration Conference: Continuing the Voyage of Discovery, January 30 – February 1, Orlando, Florida, 1–20. Xiong, M. (2003). Global Manufacture by Using Conceptual Design. Journal of Materials Processing Technology, 139, 453-456. Xu, Z., Huang, K., and Liu, W. (2002). Agent-Based Cooperative NC Conceptual Design. Proceedings of the Sixth International Conference on Computer Supported Cooperative Work in Design, 354-357. Xu, L., Li, Z., Li, S., and Tang, F. (2007). A Decision Support System for Product Design in Concurrent Engineering. Decision Support Systems, 42, 2029-2042. Xu,Y., Sun, S., and Pan, Y. (2001). Constraint-Based Distributed Intelligent Conceptual Design Environment and System Model. Proceedings of the 27th Annual Conference of the IEEE Industrial Electronics Society, 1, 2105-2110. Xue, D. and Dong, Z. (1993). Automated Concurrent Design Based on Combined Feature, Tolerance, and Production Process Cost Models. American Society of Mechanical Engineers, Advances in Design Automation, Design Engineering Division, 65, 2, 199-210.

409
Xuebao, J. (2005). Research on BOM Views and BOM Mapping Model. Chinese Journal of Mechanical Engineering, 41, 2, 97-102. Yang, A., Schluter, M., Bayer, J., Kruger, J., Haberstrok, E., and Marquardt, W. (2003). A Concise Conceptual Model for Material Data and Its Applications in Process Engineering. Computers and Chemical Engineering, 27, 595-609. Yang, Q., Wang, S., Dulaimi, M., and Low, Su. (2003). A Fuzzy Quality Function Deployment System for Buildable Design Decision-Makings. Automation in Construction, 12, 381-393. Ye, X., Fuh, J., and Lee, K. (2000). Automated Assembly Modeling for Plastic Injection Moulds. International Journal of Advanced Manufacturing Technology,16, 739-747. Yeo, S., Ngoi, B., Poh, L., and Hang, C. (1997). A Cost-Tolerance Relationship for Non-Traditional Machining Processes. International Journal of Advanced Manufacturing Technology,13, 35-41. Younossi, O., Kennedy, M., and Graser, J. (2001). Military Airframe Costs: The Effects of Advanced Materials and Manufacturing Process. Washington, D.C.: RAND Corporation. Retrieved September 5, 2005 from http://www.rand.org/publications/MR/MR1370/MR1370.ch4.pdf Zaner, John A. (2003). Scheduling and Rough Cut Capacity Planning. Production and Inventory Control – Readings and Problems, Department of Technology, University of Southern Maine. Retrieved September 20, 2005 from http://www.usm.maine.edu/~zanerj/330/330%20readings2%20F03.pdf Zhang, W., Tor, S., and Britton, G. (2001). A Prototype Knowledge-Based System for Conceptual Synthesis of the Design Process. International Journal of Advanced Manufacturing Technology 17, 549-557. Zhang, H., Fan, W., and Wu, Cheng. (2004). Concurrent Design Approach And Its Collaborative Environment For Integrated Complex Product Development. Journal of Integrated Design & Process Science, 8, 3, 89-97. Zhao, Y. and Zhang, G. (2002). Study of Conceptual Design of the Extension Method for Mechanical Products. Proceedings of the ASME Design Engineering Technical Conferences, Montreal, Canada, 1, 123-128. Zinovev, P., Moiseev, V., Ginatullin, I., Nikoshin, L., and Piyadin, D. (2007). Topical Problems of Corporate Control in Aircraft Manufacturing. Russian Aeronautics, 50, 2, 204-209.

410
APPENDIX A
CONCURRENT ENGINEERING INVESTIGATION

411
APPENDIX A – Concurrent Engineering Investigation
The purpose of this investigation is to address the following questions related to
concurrent engineering:
1) Based on published reports, have companies today adequately embraced the philosophy of concurrent engineering?
2) If so, have the claimed benefits been realized?
3) If not, what has stood in the way?
The outline below provides an overview as to how the remainder of this
investigation is organized.
o Definitions of concurrent engineering and related terminology o Benefits of concurrent engineering, simultaneous engineering, and product lifecycle management o Have companies embraced the philosophy of concurrent/simulataneous
engineering? ! Success stories ! Surveys
o Have companies adquately embraced the philosophy of concurrent/simultaneous engineering? If so, have the claimed benefits been realized. ! Aerospace/Defense industry ! Automotive manufacturing industry ! Motorcycle manufacturing industry ! Telecommunications industry ! Commercial aircraft manufacturing industry

412
! Decision Council Survey – United Kingdom ! Conclusions
o If companies have not realized the benefits of concurrent/simultaneous engineering, what has stood in their way? ! Poor planning and management of communication linkages and
complexities ! Specialized hierarchies of knowledge ! Cultural aversion to detailed and methodical thinking ! Cultural bureaucracy and systemic complexity ! Conclusions
o Summary
A.1 Definition of Concurrent Engineering and Related Terminologies
Some other terminologies in literature are used nearly interchangeably with
concurrent engineering, specifically simultaneous engineering and product lifecycle
management. Beginning in the 1980s, concurrent engineering was the more widely used
term, and subsequently the use of the terms simultaneous engineering and product
lifecycle management emerged. If one compares the definitions of each approach, then it
quickly becomes apparent they are very similar. The following representative definitions
of concurrent engineering, simultaneous engineering, and product lifecycle management
were found in the literature.
Concurrent Engineering is “a systematic approach to the integrated, concurrent
design of products and their related processes, including manufacture and support."
This approach is intended to cause the developers, from the outset, to consider all
elements of the product life-cycle from conception through disposal, including quality,
cost, schedule, and user requirements." (Winner et. al., 1988.)
Concurrent Engineering is "a systematic approach to integrated product
development that emphasizes the response to customer expectations. It embodies team

413
values of cooperation, trust, and sharing in such a manner that decision making proceeds
with large intervals of parallel working by all life-cycle perspectives early in the process,
synchronized by comparatively brief exchanges to produce consensus." (Cleetus (CERC),
1992.)
Simultaneous engineering “advocates concurrent consideration of all related
issues for design of a product: its manufacturing and support processes, and a host of
other fundamental engineering concerns in the early stages of product design.” (Roy et
al., 1999.)
Simultaneous engineering “is generally recognized as a practice of incorporating
various life-cycle values into the early stages of design.” (Ishii, 1990.)
Simultaneous engineering” involves carrying out the functions involved in
introducing new products in parallel rather than in series.” (Schill and McArthur, 1992.)
Simultaneous Engineering (SE),“which means parallelizing formerly serial
executed product development processes, and Concurrent Engineering (CE), which
means to cut processes into smaller sub processes or activities and parallelize them, both
to achieve less product development time.” (Vajna, 2005)
Product lifecycle management (PLM) “is the process of managing the entire
lifecycle of a product from its conception, through design and manufacture, to service
and disposal. It is one of the four cornerstones of a corporation's information technology
structure. All companies need to manage communications and information with their
customers (i.e., CRM-Customer Relationship Management) and their suppliers (i.e.,
SCM-Supply Chain Management) and the resources within the enterprise (i.e., ERP-
414
Enterprise Resource Planning). In addition, manufacturing engineering companies must
also develop, describe, manage and communicate information about their products.”
(CIMData, 2007.)
For the purposes of this investigation, it was assumed concurrent engineering and
simultaneous engineering and are close enough in definition to be viewed as the same
with regard to searches and discussion.
A.2 Benefits of Concurrent/Simultaneous Engineering, and
Product Lifecycle Management
The potential benefits of CE, SE, and PLM are well-documented in the literature.
Representative examples of potential benefits are provided in the quotes that follow.
Again, the potential benefits read very much the same for all three approaches.
Concurrent engineering “offers the potential benefits of reduced development
time, the ability to uncover design flaws earlier in the development process, fewer
engineering changes, improved quality, increased white collar productivity, and higher
return on assets.” (Schultz, 1996)
“Simultaneous engineering increases competitiveness…. Competitiveness boils
down to the successful development of management and the deployment of new
techniques to get better products to the market faster.” (Preface, Roy et al., 1999.)
Product Lifecycle Management “offers the potential benefits of reduced time to
market, improved product quality, reduced prototyping costs, savings through re-use of
original data, a framework for product optimization, reduced waste, and savings through
complete intergration of engineering workflows.” (Day, 2002.)
415
A.3 Have Companies Embraced the Philosophy of Simulataneous Engineering?
In order to determine whether companies have embraced simultaneous
engineering, the literature searches for success stories and surveys related to concurrent
engineering were performed. The results of these efforts are presented in the sections
that follow.
A.3.1 Success Stories
There are many concurrent engineering successes documented in the literature.
Some of the companies acknowledging success include AT&T, Xerox, Motorola, Harley
Davison, and various Japanese endeavors. (Trygg, 1993; Harley Davidson, 2007.)
Small-scale concurrent engineering success stories within various organizations
are the most prominent in the literature. Large-scale, enterprise-wide efforts are not as
well documented beyond the press release level. (Wheeler et al., 1991; Bennett and
Lamb, 1996. ) Small-scale examples:
• Hewlett-Packard – a particular oscilloscope
• Cisco Systems – individual Internetworking products
• ITEK – specific optimal systems
• Raytheon – specific software engineering projects
• Ingalls Shipbuilding – SP-8 panel

416
A.3.2 Surveys
Most published surveys indicate that companies claim to be using
concurrent/simultaneous engineering.
• Lawson and Karandikar (1994) report that a survey of U.S. businesses indicated that the use of concurrent engineering had become the de facto methodology for product development.
• Waterson et al. (1999) found that the majority of firms in the U.K. employing
more than 150 people claim to utilize concurrent/simultaneous engineering practices.
• Portioli-Staudacher et al. (2003) report most industries located in the European
Union member states of Italy and Belgum also use concurrent simulataneous engineering.
Based on a sampling of information sources, the answer to the question as to
whether companies have embraced the concept of concurrent/simulataneus engineering
appears to be “Yes.”
A.4 Have Companies Adequately Embraced the Philosophies of Concurrent/Simultaneous Engineering? If So, Have the
Claimed Benefits Been Realized?
If one considers the definitions of concurrent and simultaneous engineering and
what they entail, then it sounds very much like “common sense.” In fact, it would be
difficult to understand why any company would not attempt to embrace the philosophy.
If one looks at the potential benefits of concurrent/simulateous engineering, a company
would seem foolish not to strive for these benefits. What company does not desire
improved time to market, better quality, lower cost, and increased competitiveness in the
global marketplace? Therefore, the real issue is likely what steps companies have
417
actually taken related to embracing the philosophy of concurrent/ simulateous
engineering, and how effective these efforts have actually been.
In order to answer the questions posed, a two-pronged approach was taken. First,
survyes related to concurrent/simulataneous engineering performance was queried.
Second, simultaneous engineering performane by industry sector was queried. Only one
survey was discovered that discussed concurrent/simulataneous engineering efforts, and it
was performed in the United Kingdom. No quantitative data related to sectors was found,
so an inferential approach to the discussion based on concurrent/simultaneous
engineering performance by industry sector was undertaken.
In the sections that follow, the findings for the following industries and the United
Kingdom survey are discussed:
• Aerospace/Defense Industy
• Automotive Manufacturing Industry
• Motorycle Manufacturing Industry
• Information Technology Industry
• Commercial Aircraft Manufacturing Industry
• Decision Council Survey – United Kingdon
A.4.1 Aerospace/Defense Indusry
In 1989, General Dynamics, Fort Worth Division publically committed to the
switch to concurrent engineering philosophies and integrated product development (IPD).
The expected benefits to be derived were improvement of internal processes, improved
418
quality, lower costs, and shorter delivery times. (Petrushka et al., 1990.) [This author
actually worked with authors.] In 2006, the same facility (now owned by Lockheed
Martin) just produced the F-35 Joint Strike Fighter with the some of the greatest recorded
cost and schedule overruns in history. (Groot, 2006.)
Similiary, in 1988, the Institute for Defense Analysis touted similar expections for
the application of concurrent engineering in all weapons systems acquisition. (Winner et
al, 1988.) However, these expectations have not come to fruition. Over $1 Billion was
expended on the X-33 Reusable Launch Vehicle, and the program was ultimately
cancelled due to overruns. The International Space Station was originally bid at a total
cost of $8 Billion and supposed to be operational by 1995, yet it is still under
construction and the current estimated cost at completion has ballooned to $100 Billion.
(Wynn et al., 2005.)
Hence, one can reasonably conclude based on performance, the defense industry
has very likely not adequately embraced the philosophies of concurrent/simultaneous
engineering.
A.4.2 Automotive Manufacturing Industry
In the late 1980s, Ford started its Alpha Simulataneous Enginering Program in
response to Saturn’s touted successes. According to Ford, “Alpha not only solved lots of
engineering problems at Ford, it trained hundreds of Ford engineers in concurrent
engineering methods and tools.” However, after over ten years of Alpha, Ford still took
over six years to develop a model with some of the highest development costs in the

419
world. Similarly, General Motors (G.M) brought Saturn into the company in an effort to
incorporate concurrent/simultaneous engineering. (Fleischer, 1996.) However, in last
few years, both GM and Ford have continued to lose market share, competitive ability,
and have record losses. (Nussbaum, 2006.)
The new Toyota Camry was launched in Australia at the end of 2006. According
to Toyota, “this car is the first of the international market Toyota vehicles to benefit from
true simultaneous engineering.” The effort on the new Camry took place in Japan, the
United States, Thailand, China, Taiwan, and Australia. Countless details about the car’s
design and manufacture were worked out in advance, even down to the most minor
assembly issues. Toyota’s primary goal was to avoid costly re-engineering, rework, and
quality issues. The work on the new Camry was launched in 1996, and spent ten years in
the development stage. While Toyota’s time to market has not always been the fastest in
the automotive industry, it has been one of the most effective in terms of quality results.
(World Car Fans, 2006.) Toyota’s vision is one of long-term quality.
At the outset of new Camry project, Toyota set goals to slash the development
cost by 30%, put more features into the new Camry, and keep the sticker price near
current levels. Dana L. Hargitt is an executive at Toyota who worked 20 years at GM
prior to joining Toyota in 1996. When asked about concurrent/simultaneous engineering,
Hargitt said that it is something performed at many companies, yet many snags exist in
the way in which it is carried out.
Too often, concurrent/simultaneous engineering meetings turn into coffee
klatches, and lack a systematic approach to problem solving. While there is cross-

420
functional involvement, the resources of the organization are not committed to the
endeavor.
Hargitt went further and said that it was “a statement of the obvious” if a
company says it practices concurrent/simultaneous engineering and its sales figures are
“headed to the Grand Canyon,” then it probably isn’t really practicing it. Simultaneous
engineering has potential, but if not implemented properly, it does nothing to leverage
resources, and only adds to decision-making complexity. (Vasilash, G., 2001.)
Hence, one could agree with Hargitt that automakers performing well likely have
adequately embraced concurrent/simultaneous engineering and those performing poorly
are likely inadequate in application.
A.4.3 Motorcycle Manufacturing Industry
Concurrent/simultaneous engineering is touted as one of the major reasons why
Harley Davidson (HD) was able to reinvent itself during the 1980s. In 1983, the Reagan
administration imposed tariffs on Japanese motorcycles to protect HD, and give it time to
make a turnaround. By 1987, HD made the unprecedented request to have the tariffs
removed. Harley-Davidson reported international sales in motorcycles rose 15% in 2005,
and domestic sales grew 4.2%. (Harley Davidson, 2007.) In early 2006, Harley
Davidson opened its first dealership in China in more than 50 years. (BBC News, 2006.)
Hence, one can conclude that Harley-Davison is one the right track with regard to
its implementation of concurrent/simultaneous engineering philosophies. HD continues
to create exiting products and maintains increasing market share.

421
A.4.4 Information Technology Industry
In 1995, Alcatel-Lucent (Alcatel-Lucent, 2007.) reported using
concurrent/simultaneous engineering on projectes for AT&T, and in 2006, it reports
using the philosophy to improve the IMS infructure. Likewise, Cisco Systems (Cisco
Systems, 2007.) reports utlizing simultaneous engineering, and it is one of the best
performing companies of its kind.
Based on performance, one could conclude that some companies within the
telecommunications industry are adequately embracing the concurrent/simultaneous
engineering philosophies.
A.4.5 Commerical Aircraft Manufacturing Industry
Concurrent engineering is touted as one of the major reasons for the success of the
Boeing 777. In the 1970s, the Boeing 777 was the first aircraft produced entirely on a
computer, with all drawings being done in CATIA. CATIA has many imbedded features,
and facilitated virtual simulation of many interfaces without building expensive, physical
prototypes. (Dassault Systemes, 2007.) However, by 2002, Boeing was in such bad
shape that lobbyists proposed an Air Force lease plan labeled by many as a
“congressional bailout.” (Schatz, 2003.) By 2003, Airbus had overtaken Boeing to
become the world’s best selling aircraft maker. (BBC, 2005.)
Hence, based on performance, one could conclude that problems potentially exist
with regard to how Boeing is implementing concurrent/simultaneous engineering
philosophies.

422
A.4.6 Decision Council Survey: United Kingdon
Only one survey related to concurrent/simultaneous engineering was located, and
it is approximately 15 years old. The survey is published in an article by Constable
(1993). The Decision Council conducted a survey through the magazine Engineering in
the UK. Over 700 replies were received. The following is a summary of interesting
findings related to concurrent/simultaneous engineering projects:
• 50% reported products were taking longer to get to market
• The average cost overrun was 19% and the average schedule overrun was 27%
• On an average, 10-20% of design changes were initiated after design release
A.4.7 Conclusions
The results of the survey in the United Kingdom indicate companies can have
problems implementing concurrent/simulataneous engineering. Likewise, the sector
analysis shows some companies are doing well with regard to implementing concurrent
engineering, while others are not.
In conclusion, whether companies have adequately embraced
concurrent/simultaneous engineering principles varies from company to company. Since
most companies do not publish specific information with regard to their shortcomings,
unless of course they are reporting to have overcome them, it is difficult to know with
certainty the reasons why companies perform poorly. However, if a company is
adquately embracing concurrent/simultaneous engineering principles, it should be

423
expected to do generally as well as other companies in the same industrial sector. Also,
the benefits of improved cost, time to market, and quality should be apparent.
For some companies, such as Toyota, Cisco Systems, and Harley-Davidson, it is
reasonable to conclude that real benefits have been realized, in that, these companies are
recognized as world leaders in their particular business sectors. For companies that are
having significant development cost and schedule issues, such as Ford, General Motors,
and Lockheed Martin, it is reasonable to conclude that these companies are having
problems realizing the benefits of concurrent engineernig for reasons that may not be
readily apparent.
A.5 If Companies Have Not Realized the Benefits of Simultaneous Engineering, What Has Stood in Their Way?
If companies are doing poorly in realizing the benefits of concurrent engineering,
then it is likely they are trying to answer this very question. If the answer was easy, then
obviously, these companies would fix their problems. In reviewing the literature, some
general problems regarding simultaneous engineering implementation were discovered.
The issues listed below are discussed in the sections that follow:
• Poor management of communcation linkages and complexities
• Specialized hierarchies of knowledge
• Cultural aversion to detailed and methodical thinking
• Cultural bureaucracy and systemic complexity

424
A.5.1 Poor Planning and Management of Communication Linkages and Complexities
Due to there being many concurrent/simultaneous engineering success stories in
the literature, a host of companies adopted CE/SE in an effort to shrink lead time.
However, the complexities of communication linkages are not fully explored in the
literature discussing CE/SE. (What sounds so simple…is not so simple.)
Hoedemaker et al. (1999) demonstrates that limits to the benefits of concurrency
exist. As communication linkages within the organization become more complex, the
less able concurrency is able to posititvely affect development time. In general, the more
complex the organization and the project, the stricter the limits to concurrency, and the
greater need to understand which decisions are affected by concurrency and which may
not be. There are potentially adverse affects to placing too much emphasis on
concurrency without fully exploring communication linkages.
Alcatel has achieved much success with concurrent engineering, but also reports
that problems exist with concurrent engineering when the coding process is broken down
into too many independent modules. The coding process for large programs for
switching sytsems is attacked by dividing into modules. As the module size becomes
smaller, the degree of parallel activity clearly increases. However, at the same time, the
inefficiencies increase because of problems created by interfacing. As the
communication burdens increase on individual programmers, the number of avoidable
errors increases. (Hoedemaker et al., 1999.)
This author’s practical work experiences are consistent with these assertions.
While teaming is inherently a good thing, if the communication linkages are not

425
structured – and – the number of teams gets large - then it adds error to the decision
making process. Typically individual members of teams are left nearly completely on
their own to make decisions. Management provides little real direction on objectives or
what is expected, and not much effort is placed on measuring individual performance. In
addition, little formal training or decision support systems geared toward product
development in the context of IPT decision making existed in the 1990s.
Historically, Lockheed’s Skunk Works has been very successful in concurrent
engineering, particularly when the number of people involved in the decision making
process was smaller. The group accomplished phenomental things when decision making
authority was closely-held. However, when the teaming arrangements got larger, and
more companies became involved in the 1990s, the Skunk Works experienced new
challenges. (This assertion is based on the authors work experience at the facility during
the development of the the YF-22 prototypes.) In general, the more complexity involved
in the decision making process, the more difficult it is to manage the outcomes.
Constable (1993) discusses that companies in the UK interpreted tcross-functional
teaming and concurrent/simulataneous engineering reduces the need for management
planning. The idea being that teaming should be done in an organic environment in a
mutally supportive manner. This thinking appears to be opposite of what Toyota did on
the new Acura.
Patrashkova and McComb (2004) developed a computational model to simulate
cross-functional teaming effectives in a simultaneous engineering environment. They
found that the having the entire team involved in every decision was ineffective. Instead,

426
management should establish a framework where only requisite pieces of information
required team involvement.
This author’s work experience agrees with these assertions. It is difficult to
determine the real cost versus benefit of unstructured IPT meetings. Quite often there are
meetings of many inidividuals discussing issues that could easily have been solved using
well-defined functional parameters. Likewise, involving individuals in meetings whose
function is not affected is an added expense with little measurable benefit.
A.5.2 Specialized Hierachies of Knowledge
Winter (1999) discusses how specialized hierarchies of knowledge have played a
role in the U.S. automakers ability to capitalize on the benefits of simultaneous
engineering in an article titled, “Back to the Future? – Simultaneous Engineering.”
During the prolonged period of industrial growth in the 1960s, 1970s, and 1980s, many
companies moved toward Adam Smith’s theories of organization, and workers were
organized by specialty. Government regulation also dramatically increased during this
same time period, and this increase also added to automakers decision to create highly
specialized hierarchies. Specific groups were formed inside corporations to coincide with
particular regulatory legislation. (Winter, 1999). Similarly, the American education
system followed suit, and the education system became more specialty oriented.
During the same period of time, Japan went through hard times, and had to
become more efficient. Japanese automakers had to have staffs that were considered
jacks-of-all trades. (Winter, 1999). Similarly, the education system grew up during the

427
same timeframe, and emphasized broad-based skills, and was highly performance driven
at the student level.
Ironically, the jack-of-all-trades philosophy was historically the philosophy in the
United States prior to the 1960s. Hence, Winter implies that in order to solve some of
their problems, companies are going to have to go “back to the past” and find, or train,
employees and create systems which suppport more than one-dimensional, specialized
problem-solving.
A.5.3 Cultural Aversion to Methodical Thinking
A great deal of U.S. culture has become adverse to methodical thinking. While
the U.S. spends large sums of money on the education system, we are doing, on the
average, poorly in mathematics and science. Hence, fewer individuals graduate from
high school with the types of skills they need to function in an environment of incomplete
information, such as new product development.
The typical IPT is reported to be composed of personnel with engineering
degrees, personnel holding degress in some other discipline, or no degree at all. In
general, these individuals resisted trying to systematically solve issues, and more often
than not, operated out of something to do with their feelings or the desire for consensus.
If everyone’s opinion is not appropriately validated, no matter how little fact they have to
support it, it becomes a real problem.
As discussed earlier, Dana L. Hargitt is an executive at Toyota who worked 20
years at GM prior to joining Toyota in 1996. When asked about simultaneous engineering

428
at GM, she said, …”Too often, simultaneous engineering meetings turn into coffee
klatches, and lack a systematic approach to problem solving.”
Miller and Guimaraes (2005) discuss that one of the problems with cross-
functional teaming is how it is managed. There are two types of control, behavioral and
outcome. Behavioral control deals with how a task is accomplished, and outcome control
deals with the results of the task. Effective cross-functional teaming requires both types
of controls, but the emphasis at many companies has been very heavily weighted on the
behavioral aspects of control, such as teamwork, communication, support, consensus,
diversity, and validation.
This author’s teaching experiences support the assertions of Miller and
Guimaraes. The majority of this author’s graduate business students do poorly in case
analysis when it comes to quantitative assessment or methodical problem solving. In
general, students tend to write about feelings, the need for communication, teamwork,
consensus, validation the opinions of others, etc. These adult learners are evidently
repeating back what they are being taught at work and in textbooks.
A.5.4 Cultural Bureaucracy and Systemic Complexity
For some companies bureaucracy and complexity are built into the very fabric of
their culture. For example, the defense industry has many oversight agencies involved in
the defense acquisition process, and its approach to doing business evolved in the era of
cost plus contracting. Hence, unnecessary complexity and complex paperwork are part of

429
the culture. It is going to be very difficult to make radical changes as long as the primary
customer and manager of the acquisition process is the government.
Similarly, automakers have routinely had a lot of management involvement in
routine decisions. Also, many employees in automotive manufacturers were conditioned
by the good times of the past when they could make a high wage for doing one,
specialized job function. Many human beings resist taking on added responsibility,
learning new skills, or doing “their job” differently. (Winter, 1999.)
A.5.5 Conclusions
It is very difficult to pinpoint what specifically has stood in the way of companies
realizing the benefits of concurrent/simultaneous engineering. If this answer were easy,
then it is assumed that each company would figure it out. The four issues discussed are
very complex in nature, and touch upon many aspects of enterprise decision-making,
corporate culture, and the very fabric of American culture.
Unfortunately, sometimes when things are very inefficient, the only real “fix” is
to break it down, and start over. Many U.S. companies in the news lately are
restructuring to stave off bankruptcy, merging with other companies, or simply going out
of business.
Unless a company has a monopoly or no real competition, it has little chance of
surviving without using concurrent/simultaneous engineering concepts in today’s global
marketplace. If concurrent/simultaneous engineering principles are a competitive
advantage (and most authors believe they are) as soon as one’s competition becomes

430
proficient, then the future is set. Either the company will compete, or it will start on the
downward spiral toward ceasing to exist.
A.6 Summary
The purpose of this investigation is to address the following questions:
1) Based on published reports, have companies today adequately embraced the philosophy of concurrent/simultaneous engineering?
2) If so, have the claimed benefits been realized?
3) If not, what has stood in the way?
Based on published reports, most companies assert that they are using
concurrent/simultaneous engineering. However, the success, or lack thereof, documented
in the literature indicates not all companies have adequately embraced concurrent
engineering philosophies.
For companies that have adequately embraced concurrent/simultaneous
engineering their product development performance, market share, and quality indicate
that they are indeed realizing the benefits. Toyota, Harley Davidson, and Cisco systems
are good examples.
The main factors standing in the way of realizing the benefits of
concurrent/simultaneous engineering seem to be rooted in how these companies
implemented concurrent engineering, as well as historical and cultural attributes. Simply
stated:
• If teaming is not organized and managed properly, then it will actually add complexity and error to the decision-making process.

431
• Specialized teams of personnel are not as efficient, or effective, as “jacks-of-all-trades” teams with broad-based knowledge and education.
• In general, Americans have moved away from structured and methodical thought
processes to operating feelings. In many instances teaming, the desire for consensus, and the need for inclusiveness have created a coffee klatch approach to addressing problems.
• In some instances, the bureaucratic culture is still too prevalent, and it makes real
changes in decision making difficult, if not impossible.
A.7 Implications of Dissertation Research on Improving Concurrent/ Simultaneous Engineering Implementation
In the sections that follow, the potential positive impacts to concurrent/
simultaneous engineering implementation efforts are discussed.
A.7.1 Specialized Hierarchies of Knowledge
The envisioned decision support system (DSS) and supporting databases
potentially brings the information that has been separated into the functional systems
used after design release back together into a format potentially useful for conceptual
design decision making. The whys and, engineering requirements, resources allocations,
and scheduling are in a format where the users can more easily understand the
relationships between activities and decision making.
A.7.2 Reduction in Cross-Functional Non-Productive Teaming Meetings
The envisioned DSS organizes the enterprise lessons learned into a format that
ultimately raises the foundation knowledge of the organization. The functional
432
preferences are organized, and the feedback from the system potentially alleviates the
need for redundant meetings. If the answer is available in the DSS, then there is no need
for a meeting.
A.7.3 Improved Training
The envisioned DSS can be used as part of larger vision for IPT member training.
The system assists with teaching new team members the methodologies and processes of
aircraft manufacturing and how the results of their decisions affect others.
When the jack-of-all-trades philosophy was a part of the aircraft manufacturing
mentality, design engineers desiring to be in management were required to complete a
training program. The program involved working in various departments in the company
to learn about their processes and tools. In addition, all employees had to go through
training courses and learn about how the different functions operated.
Then, in the late 1980s, a new management theory was stressed that said a person
did not need to be technically competent in a field to manage people working in that
field. A manager needed to know about management, and his team would provide the
broad based knowledge. At the same time, the need to learn technical skills outside of
one’s own discipline was de-emphasized, and the employee training programs went
away. The envisioned DSS strikes a balance between these two divergent approaches by
organizing knowledge in a format where efficiently made available to individuals.

433
A.7.4 Movement Toward Methodical and Increased Outcome Controls
The availability and use of the DSS potentially emphasizes the need to make
decisions based on facts and results. Hopefully, this will begin to move the emphasis
away from feelings and the need to spend time validating opinions that are just incorrect
and have no real basis of fact. In addition, the number errors in IPT decision making
potentially decreases because the DSS provides checkpoints for a large number of
decisions.

434
APPENDIX B
TECHNICAL INFORMATION REFERENCES

435
APPENDIX B – Technical Information References
The purpose of Appendix B is to offer additional references related to terms used
within the dissertation, in particular Chapter 6. The sections of Appendix B are
organized by topic. Some topics require merely a definition and references, while other
topics are discussed more in-depth. The topics to be discussed are as follows:
• Aircraft product structure organization and naming • Work breakdown structure (WBS) • Design organization and numbering • Common materials and related issues in aircraft manufacturing • Processes used in aircraft manufacturing • Material and process specifications • Equipment specifications and process capability limits • Standard parts manual • Cost breakdown structure (CBS) • Recurring and non-recurring cost • Fracture critical and service life • NC machining related processes discussed • Tool codes • Accounting and financial data • Engineering and non-manufacturing deliverables • Estimating rates and factors • OSD escalation rates • Performance and efficiency factors • Learning curves
o Learning curve methodology o Learning curve application
• Cost engineering • Requirements engineering • Process engineering

436
B.1 Aircraft Product Structure Organization and Naming
In order to define a potentially useful DSS for use in aircraft manufacturing, the
terminologies and approaches used within the DSS to organize and describe a product the
product structure information must be consistent with industry accepted practices.
Aircraft manufacturing has an approach to the assignment of nomenclature that is well
represented in the literature.
Examples of typical aircraft nomenclature, which includes the context of a general
product structure, is available in various publications. The National Aeronautics and
Space Administration (NASA) and other Department of Defense (DOD) organizations
use nomenclature in various published reports and trade studies (Sensmeier and Jamshid,
2004; Dorsey, et. al., 1999). Also, aircraft nomenclature examples are found in
university textbooks. (Brandt et al., 2004.)
Examples of nomenclature in the context of a product structure are as follows: • Airframe
o Forward, Center, Aft ! Frame ! Longeron ! Shear web
It is interesting to note that a great deal of aircraft terminology was derived from
shipbuilding terminology. The first aircraft designers looked to shipbuilding as a frame
of reference. The aircraft industry uses similar terms like forward, aft, inboard, outboard,
bulkhead, beam, frame, keel, rudder, and waterline. (Wisconsin Historical Society,
2004.) Other examples of common terminologies that provide additional insights to users
with regard to care considerations are, flight critical, fracture critical, fuel area, pilot-

437
safety critical, and redundant systems. These terminologies are found in various
government publications and textbooks. (United States Army Corp of Engineers, 2000;
Harris, D. et al, 2002.) Therefore, the type of product structure and nomenclature
described in the previous paragraphs are used to define the conceptual framework
presented in Chapter 6.
B.2 Work Breakdown Structure (WBS)
The Work Breakdown Structure (WBS) is a technique used in project
management in which the project is broken down into manageable pieces. The WBS is
often a listing of hierarchical tasks. (Meredith and Mantel, 2000.) The Department of
Defense publishes the WBS guidelines for military contractors to use. (United States
Department of Defense, 1998.) The Table that follows contains an example of a section
of WBS structure for an aircraft system.

438
Table B.1 Work Breakdown Structure Example
Work Breakdown Structure Level 1 Level 2 Level 3 Level 4 Aircraft Air Vehicle Airframe Structures Hydraulic Systems Electrical Systems Fuel Systems Environmental Control Systems Crew Station Propulsion AV Applications Software AV System Software
The WBS designation is normally found in nearly every contract record
maintained by military aircraft manufacturers because it must report performance in
accordance to this structure. The WBS is recorded in systems that maintain engineering
drawings, material purchases, shop orders, direct labor standards, budget forecasts, work
instructions, master scheduling records, and performance reporting systems.
This research approaches the existence of the WBS as a baseline assumption in
demonstrating the application of RIM strategies. The majority of the demonstration is
done below the level of the WBS. (For example, a bulkhead is a part of the WBS for a
component. A separate WBS does not exist for each detail design/part.)

439
B.3 Design Organization and Numbering
Aircraft manufacturers use a variety of numbering schemes to maintain control of
the aircraft configuration and to support aircraft revision activity. The design-numbering
scheme plays a critical role in how information is exchanged and reused. The careful
selection of the “right” design numbering strategy is essential in analyzing historical data.
(Kalagnanam et al., 2004.)
In many older systems, it was difficult to link “part numbers being assembly” and
drawing numbers because the Manufacturing Bill of Material (MBOM) did not equal the
Engineering Bill of Material (EBOM.) “Artificial” subassembly numbers were used, and
it was often time consuming to properly link part numbers to the correct drawings.
The benefits of EBOM=MBOM approaches are widely referenced in the
literature, as well in trade journals where vendors are offering software development
services. Some examples of how EBOM=MBOM is being specifically used as a “ground
rule” is in the development computer aided process planning systems and
EBOM=MBOM mapping strategies. When EBOM=MBOM does not exist, it makes it
very difficult to model responses in manufacturing because of the error. It is interesting
to note that the majority of the current publications are in Chinese journals. (Johnson,
2007; Ou-Yang and Pei, 1999; Xuebao 2005.) Therefore, the assumption of
EBOM=MBOM is used in this research.

440
B.4 Common Materials and Related Issues in Aircraft Manufacturing
The most common materials used in aircraft manufacturing are aluminum,
titanium steel, stainless, steel, and composites. By far, aluminum alloys are the most
popular materials in modern aircraft. (Brandt et al., 2004)
In many manufacturing enterprises, the material type is not maintained in the
same system as the various production data, and is in an information silo. For example,
one would have to enter a part number into the material department system to look up the
material. Or, one would have to read the work instructions for a callout or reference.
These types of difficulties are document in the literature as being obstacles to “economic”
aircraft engineering as well as developing systems to assist in making quality and
maintenance technical decisions. (Mirghani, 1996; Zinovev et al., 2007.) Therefore, the
DSS defined seeks to provide a solution to the problems identified.
B.5 Processes Used in Aircraft Manufacturing
Airframe manufacturing primarily still utilizes mechanical subassembly assembly
of detail parts. Further, these details are most commonly manufactured from these
shaping processes; sheet metal fabrication, NC machined hog-outs, NC machined
forgings, and composites fabrication. New technologies include laser forming, vacuum-
die casting, and hot isostatic pressing, but these processes are not yet in widespread use to
the point of taking over the traditional processing methods. (Martin and Evans, 2000;
Mashl et al, 1997.) Therefore, NC machining is selected as the process to demonstrate
the development of the conceptual framework of the DSS presented in Chapter 5. In

441
addition, the concept of shaping is incorporated as a level on the conceptual process
hierarchy presented.
The concept of organizing information in the context of “shaping” is not new, and
the author does not intend to imply that this is a “new” way of organizing information.
Instead, this information is offered to support why the decision was made for this
research.
Additional aircraft manufacturing processes information is available as follows:
• Advanced materials and processes at Boeing (Smith, 2003.) • 5-Axis and high speed machining case studies (Makino Corporation,
1998.) • High tolerance machining center case studies for BAE Systems (NCMT,
2000.) • Agile machining at Raytheon (Rose, 2002.) • Virtual machining: Countersinking, counterboring, and spotfacing
(Smith, 2005.) • Metal processing and chemical milling (Aerospace Consumerist
Consortium, 2005.) • Solution heat treating (Seco/Warwick Corporation, 2005.) • Alkaline degreasing and metal cleaning (Biospace Consulting Services,
2005.) • Automated coldworking at Northrop Grumman (Bullen, 2001.) • Coldworking analysis (Engineering Software and Research Analysis,
2001.) • Coldingworking specifications (Kaman Aerospace, 2006.) • Seal bonding (Chemical Containment Systems, 2006.) • Cleaning and solvent use (Commonwealth of Massachusetts, 1994.) • Cleaning and corrosion control (United States Air Force, 2004.) • Metal degreasing ( European Agency for Safety and Health, 2005.) • Shot peening (Curtis-Wright Corporation, 2005.) • Shot peening and fatigue life (Johnson, 2005; Sharp and Clark, 2005.) • Non-destructive testing/penetrant etch (Esterline Corporation, 2004.) • Penetrant inspection (Lockheed Martin Corporation, Quality Control
Specification Index, 2006.) • Bushing installation (Fatigue Technology, 2005.) • Vibroengraving and marking (Hurel-Hipsano Meudon Company, 2005.
United States Federal Aviation Administration, 2005.)

442
B.6 Material and Process Specifications
The appropriate selection and use of materials and processes (M & P) is critical to
both the performance and the economic success of a product. When a particular material
and/or process are used, the manufacturing enterprise is very meticulous about
documenting the appropriate procedures to follow in something called “materials and
processes specifications.” The shop floor is required to adhere to appropriate material
and process specifications to ensure that a quality part is produced. (Luttgeharm, 1990.)
Further, these specifications even convey how a design produces by a process will be
inspected. (Erickson. R, 2001; Lake, 1994.)
In some journal articles, authors imply that either engineering “doesn’t know how
to design” or that manufacturing “doesn’t know how to manufacture.” In essence, they
do not recognize that if the manufacturing enterprise has used a process on a past design,
that a great deal of information exists. The real problem is that the enterprise is not
organized to use it again. The “enterprise” has the information, but individual IPT
members have difficulty in making the connection to the information is in a silo. The
IPT members often one or more of the following issues:
• Do not know the information exists.
• It is difficult for the average person to the information to an incomplete design because they have been not trained how to do this task.
• It is difficult to find the specific information needed for a specific design
within the large amount of data that exists.
The aircraft manufacturing enterprise has spent expended a great deal of resources in
developing the information for a different purpose, and only seasoned experts usually
443
make the connection from past use to current use. Thus, the RIM concept of
commonality can be used to develop a different approach in structuring information from
the outset, provided that it is appropriately linked with a strategy for dealing with
incomplete design information. This concept is presented in the development of the
conceptual framework in Chapter 6.
B.7 Equipment Specifications and Process Capability Limits
A manufacturing enterprise purchases equipment and makes the decision to utilize
certain processes because there is an ongoing need for the capability. When the
equipment or machine is purchased, the manufacturer’s specifications normally provide
the key processing capability limits. Further, manufacturing engineering performs testing
to verify capabilities before the new purchase is put into use.
An example is offered for an NC milling machine. Cincinnati-Lamb is a
manufacturer of NC machines. Cincinnati-Lamb lists various equipment specifications
on its company website for purchasers to reference as part of their decision-making. An
example of information for a 5-axis machining system is listed below. (Cincinnati-Lamb,
2005)

444
Table B.2 Equipment Specification Example
5-Axis Machine Center Machine 1
Table Size (inches) 137.8 x 66.9
X-Axis (inches) 157.5
Y-Axis (inches) 98.4
Z-Axis (inches) 29.5
A-Axis + 40o
B-Axis + 40o
Rapid Transverse (in/min) 945
Standard Spindle RPM 15000
Spindle Taper HSK-63A
Tolerance - Hole Diameter + 005
Tolerance - Hole Location + 003
Tolerance - Surface Finish + TBD
Even though fastening is not demonstrated in this research, another example of
how capability information is “buried” exists in fastener specifications. Fastener
manufacturers publish fastener specifications with their products. The aircraft industry
has “common fasteners” that is uses, such as rivets, lockbolts, and eddie bolts.
(References.) The following example from the process manual of an Eddie Bolt
fastener. (Alcoa Fastening Systems, 2004.)

445
Table B.3 Fastener Specification Example – Alcoa Fastening Systems
Nominal Clearance Close Transition Interference
Diameter Fit Ream Fit Fit 5/32" 0.167 0.1645 0.164 0.1615
0.164 0.1635 0.161 0.1595
0.003 0.001 0.003 0.002
Based on work experience, it is asserted that the capability of “people” to drill
holes without tooling assistance is not new information. It is “common knowledge” on
the factory floor. “Manufacturing experts know” that a person cannot hold these
tolerances without some type of tooling assistance. However, in countless conceptual
design situations, estimators, manufacturing engineers, and others do not understand they
CAN make inferences in cost and schedule decisions about tooling requirements based on
nothing else but the identification of the type of fastener. The list of potential fasteners to
be used is one of the first things that engineering typically does define.
As in the prior discussion involving M&P specifications, the same problem exists
with regard to IPTs having access to capability information in a manner that makes it
relevant to the new design decision they are considering. Again, many journal articles
imply that the enterprise does not know its capabilities, and that the solution space is
nearly infinite. RIM concepts are applied based on defining what you know in the
context of multiple variables. When RIM concepts are used within the context of making
decisions about an incomplete design, then the solution space narrows very quickly.

446
The DSS defined in Chapter 5 demonstrates how to organize technical
information in a system that will start IPT members down the road to making faster and
better decisions.
B.8 Standard Parts Manual
Each time a new aircraft is developed, engineers seek to use as many standard
parts as possible. A standard part is manufactured in complete compliance with accepted
industry and government specifications. The use of standard parts substantially decreases
development and production costs. In most cases, a “Standard Parts Manual” is available
that allows engineers to look up parts by type, dimensions, tolerances, etc. (United States
Department of Transportation, Federal Aviation Administration, 1997.)
Based on work experience, the information in the “Standards Parts Manual” is
normally in a stand-alone book or system that resides in the Engineering activity. In
order to facilitate knowledge reuse, the standard parts information needs to be coupled
with a systems and a strategy to use in the information during the conceptual design
phase. Though this research does not demonstrate this part of conceptual design decision
making, it is hope that in mentioning it that design experts will understand the RIM
strategy in Chapter 5 and apply the strategy to assist IPT members.
B.9 Cost Breakdown Structure
A cost breakdown structure is a system for dividing and tracking costs at various
levels, including project, hardware, functions and subfunctions, and cost categories. It is

447
typically a hierarchical structure used to accumulate the expenditures of budgeted
resources (i.e., dollars, personnel, facility, equipment, etc.) into elements such as direct
labor, materials, and other direct costs. (Wideman, 2002.)
B.10 Non-Recurring and Recurring Cost
Non-recurring cost is a charge or expense that does not frequently occur in the
normal course of doing business. It is often referred to as one-time cost or investment.
Recurring costs occur repeatedly based on the number of units produced or amount of
service performed. Recurring costs are sometimes referred to as variable costs. (Pallister
and Daintith, 2006.)
The National Aeronautics and Space Administration (NASA) maintains an online,
airframe cost model. The nonrecurring elements of this cost model are engineering,
tooling, development support, and flight test. The recurring elements of the model are
engineering, tooling, manufacturing, material, and quality assurance. As discussed within
the dissertation, each organization and company is likely to have a unique set of
definitions when utilizing the terms recurring and non-recurring. (NASA, 2005.)
B.11 Fracture Critical and Service Life
A very good discussion of the use of fracture critical and other service life
terminologies in found within a documented titled, “Service Life and Design Analysis
and Design Testing (DADT) Control Plan,” released for public use in 2006. (Bailey and
Tashiro, 2006.) The website for this control plan is provided in the References of this
dissertation. This service plan discusses the following categorizations:
448
• Safety of flight structure o Fracture critical I o Fracture critical II
• Non-safety of flight structure o Durability critical o Normal controls
B.12 NC Machining Processes Discussed
In order to fabricate a complete NC machined design, more than one type of work
center is required, and more than one equipment option exists. There are many textbooks
available that discuss machining fundamentals and processes. Most industrial
engineering undergraduate students have some exposure to NC machining. In addition,
the Internet has a plethora of information related to NC machining and related processes.
A very good source of information published by the United States Government
can be found in a manual titled, “Pollution Prevention in Machining and Metal
Fabrication – A Manual for Technical Assistance Providers.” (United States
Environmental Protection Agency, 2001.) This manual is published by the
Environmental Protection Agency (EPA,) and it provides an excellent overview of the
machining industry by state, the types of processes used, process descriptions, and
examples of process flow diagrams.
The most efficient method for determining which manufacturing processes that
major aircraft manufacturers is to search their websites. In most cases, these companies
have overview information about processes used, specifications, and descriptions
available for potential suppliers and outside production organizations to peruse.
449
In developing the CBS work centers for this research, several major contractors
websites were studied. Some websites contained information that might not be relevant
to inexperienced users, while others contained details that even a novice would
understand. The following is a list of useful documents found on corporate websites.
• Raytheon – “ Control of Product Manufacturing Processes for Suppliers and Outside Production,” March 2003.
• Raytheon – “Special Processes That Require RAC Supplier Approval,”
November, 2004.
• Boeing – “Special Process Source Approval,” April, 2002.
• Boeing – “Supplier Specification Index,” January, 2006.
• Lockheed Martin – “Engineering Requirements Flow Down Guide – LM Aero Supplier Guide,” February, 2002.
B.13 Tool Codes
When tools are purchased, they are normally assigned a tool number in order to
keep track of program costs, tool inventory, and maintenance schedules. In addition to a
tool number, tools are also most often assigned a tool code, or tool template, in order to
help the user quickly understand the type of tool. Tool codes are normally between two
and six characters, and are shorthand versions of the tool type. For example, an assembly
template tool might be coded ASTP or ASMT. A drill template tool might be coded DT
or DRTMP. (Northrop Grumman, 2004.)

450
B.14 Accounting and Financial Data Accounting and financial departments supply two key pieces of data/information
that are necessary for consistent development of financial plans and forward pricing of
future work. These pieces of information are:
1) M-Day schedule (4-digit number that is internally controlled)
2) Accounting month budgeted hours
In order for workload and resource plans to remain consistent, all departments
inside an organization must utilize the same baseline for the number of workdays per
month, and the number of hours that represents an equivalent man-month. Quite often,
the accounting department will also add “payroll weeks” to the calendar. (Northrop
Grumman, 1999.)
An illustration of an accounting month calendar is shown on the page that
follows:

451
Table B.4 Accounting Month Calendar
January 2005 Accounting Month - 20 M-Days 160 hours
JAN S M T W T F S 1
2 3 4 5 6 7 8
1627 1628 1629 1630 1631 9 10 11 12 13 14 15
1632 1633 1634 1635 1636 16 17 18 19 20 21 22
1637 1638 1639 1640 1641 23 24 25 26 27 28 29
1642 1643 1644 1645 1646
February 2005 Accounting Month - 20 M-Days 160 hours
FEB S M T W T F S Jan 30 Jan 31 1 2 3 4 5
1647 1648 1649 1650 1651 6 7 8 9 10 11 12
1652 1653 1654 1655 1656 13 14 15 16 17 18 19
1657 1658 1659 1660 1661 20 21 22 23 24 25 26
1662 1663 1664 1665 1666
March 2005 Accounting Month - 20 M-Days 160 hours
MAR S M T W T F S Feb 27 Feb 28 1 2 3 4 5
1667 1668 1669 1670 1671 6 7 8 9 10 11 12
1672 1673 1674 1675 1676 13 14 15 16 17 18 19
1677 1678 1679 1680 1681 20 21 22 23 24 25 26
1682 1683 1684 1685 1686
Remaining March Calendar Days go into April Accounting Month.
452
One of the main pieces of information that accounting and financial requires from
manufacturing systems is the accurate gauging of percentage completion. Since large
corporations utilize the accrual method of accounting, the percentage of completion
method is utilized to recognize revenue for financial reporting. (Keiso and Weygandt,
1995.) In the defense industry, percentage completion is often tied to progress payments.
A common approach to determining percentage completion is to compare the
planned hours for a task to the earned hours. Another approach is to compare the planned
hours for shipset to the total earned hour to date. (Hawley, 2003.)
Before a job is put into work in manufacturing, an estimate of planned hours is
normally developed. These hours can be standard hours or some other engineered hour
basis. In addition, an estimate is established for the total number of hours an entire
shipset (aircraft), so that an equivalent unit value can be calculated. (United States
General Accountability Office, 1997.) The table that follows illustrates various
percentage completion values.

453
Table B.5 Percentage Completion Illustration Equivalent Planned Earned Percent Units Hours Hours Complete Complete Job xxxx Planned Hours: 44.85 33.64 75.0% NA Shipset Planned Hours (Department): 5,455.68 33.64 0.0062 Shipset Planned Hours (TOTAL): 22,499.67 33.64 0.0015 To DATE Equivalent Planned Earned Percent Units Hours Hours Complete Complete ALL JOBS IN WORK Shipset Planned Hours (Department): 5,455.68 3,245.89 59.5% 0.1443 Shipset Planned Hours (All Depts): 22,499.67 7345.67 32.6% 0.3265 Based on predetermined revenue guidelines, accounting will recognize revenue
based on the calculated percent complete.
B.15 Engineering and Non-Manufacturing Deliverables
Engineering and non-manufacturing deliverables are those items created prior to
manufacturing start. During the early stages of new product development, it is not
uncommon for deliverables such as long-lead procurement, engineering
drawings/designs, work instructions, tool designs, and supplier provided parts to be
monitored. However, in most cases, the systems utilized are ad hoc, the procedures to

454
populate the baselines are not standardized, and the data is difficult (nearly impossible) to
reuse later.
According to a study released by the General Accounting Office in 2002 titled,
“Best Practices: Capturing Design and Manufacturing Knowledge Early Improves
Acquisition Outcomes,” one of the main drivers of acquisition cost is the management of
the design release and other tasks (work instructions, tool designs, etc.) that occur prior to
the actual start of manufacturing. For example, engineering management would include
estimating the total number of engineering drawings, the projected release dates for
drawings, and the percentage completion at key schedule points, such as the critical
design review (CDR).
The GAO determined that the predominant cost and schedule growth driver was
traceable to management of data that should have occurred prior to manufacturing start.
When the manufacturing tasks are started prior to engineering design stability, the results
are unfavorable. (United States Government Accountability Office, 2002.) A summary
of the findings of the GAO are provided in the table that follows:

455
Table B6 The Affects of Achieving Design Stability After Manufacturing Start Average Drawing Product Development Average Average Completion Processes* Cost Schedule Program at CDR in Control Increase Increase AIM-9X 94% Unknown 4% 1 month F/A-18E/F ** 56% 76% 0% 3 months F-22 26% 44% 23% 18 months PAC-3 21% 35% 159% 39 months ATIRCM/CMWS 21% 0% 182% 34 months * Processes include tools that link knowledge to decisions about the products' design and manufacturing processes prior to commitments of company resources are made. ** Earlier versions F/A-18 had demonstrated some component designs and materials. Hence, some design stability knowledge may not be reflected in the drawing count. AIM-9X - Air-to-air missile carried by Navy and Air Force F/A-18E/F - Fighter; F-22 - Tactical Fighter; PAC-3 Patriot Advanced Capability Missile Program ATIRCM/CMWS - Advanced Threat Infrared Countermeasure/Common Missile Warning System (GAO-02-701, "Best Practices: Capturing Design and Manufacturing Knowledge Early Improves Acquisition Outcomes.")
If an engineer is required to release a detail design to manufacturing before the
overall design is stable, this situation creates risk, and increases the probability of cost
and schedule growth. Even if an engineer designs a drawing that manufacturing can
produce, it doesn’t matter if the drawing has to be revised later due to design changes that
were totally out of his/her control. This type of “rework cost” situation is fundamentally
different from engineering creating designs that cannot be manufactured, or designs that
will require more expensive processing.
It should be intuitively understood that engineering and other functional
departments, like planning and tool design, would benefit from using systems that are
similar in nature to those already in use by the manufacturing department. Some

456
companies already utilize similar approaches. A schedule of tasks/deliverables is created
for the entire program, along with estimated labor requirements. Then, the personnel
charge labor to the specific task. The end result is a management plan for monitoring the
engineering release and supporting functions that must take place prior to manufacturing
start.
B.16 Estimating Rates and Factors
In many estimating organizations, there is an entire group devoted to developing
rates and factors to be applied in estimates. This group is responsible for developing
various rates and factors in the formats required for enterprise systems, as well as
customer required reporting.
The dollar rates are normally established based on current and projected dollar
amounts paid for salaries and fringe benefits. These numbers are normally categorized in
various groups, such as direct manufacturing, direct material, engineering, and indirect
support. For example, if the average hourly worker is paid $15 per hour in salary in a
given year, and the value of fringe benefits is estimated to be 55% of base salary, and
then the system would utilize a value of $23.25 as the base year dollar rate for this class
of labor.
A manufacturing enterprise normally maintains a variety of estimating factors.
Some of the most common examples of factors can be found in a study done by RAND
Corporation, published in 2001. Six major airframe manufacturers contributed to this
study – Boeing, Hexcel, Lockheed Martin, Northrop Grumman, and Sikorsky. In this

457
study, factors are demonstrated by labor type and material. In the study, the ratio
reported are the airframe hours per pound of labor category by material to manhours per
pound for aluminum for that labor category. The labor categories reported were as
follows:
• Nonrecurring engineering labor
• Nonrecurring tooling labor
• Recurring engineering labor
• Recurring tooling labor
• Recurring manufacturing labor
• Recurring quality assurance labor
Examples of the cost ratios reported in the RAND study are illustrated in the
tables that follow.
Table B.7 Cost Factors Example – Material Unity Factor Cost Ratios from Rand Study Military Airframe Costs: The Effects of Advanced Materials and Manufacturing Processes NR - Non-Recurring R- Recurring NR NR R R R R Material Engr. Tooling Engr. Tooling Mfg. QA Aluminum 1.0 1.0 1.0 1.0 1.0 1.0 Aluminum-Lithium 1.1 1.2 1.1 1.1 1.1 1.1 Titanium 1.1 1.4 1.4 1.9 1.6 1.6 Steel 1.1 1.1 1.1 1.4 1.2 1.4 Carbon-epoxy 1.4 1.6 1.9 2.2 1.8 2.4 Carbon-BMI 1.5 1.7 2.1 2.3 2.1 2.5 Carbon thermoplastic 1.7 2.0 2.9 2.4 1.8 1.8 (Younossi, Kennedy, & Graser, 2001 – Rand Corporation)

458
Another approach to apply estimating factors utilizes the estimated task hours of
direct labor as the unity. For example, estimating will use actual hours, standard hours,
or some other approach to estimate the amount of touched labor hours required to
manufacture a part or component. Then, estimating will apply factors to estimate the
number of labor hours required by other related categories. Lastly, estimating applies
labor rates to forecast the costs of the other labor categories, such as engineering or
quality assurance. (Younossi et al., 2001)
Table B.8 Cost Factors Example – Direct Labor Unity Factor R-Recurring NR-Non-Recurring R NR NR R R R Mfg. Engr. Tooling Engr. Tooling QA 1.0 2.3 2.3 0.1 0.1 0.1 Hours 100.0 230.0 230.0 10.0 10.0 10.0 Rate ($/hr) 23.25 62.78 58.13 56.50 51.15 25.58 Estimate ($) 2,325.00 14,438.25 13,368.75 564.98 511.50 255.75
B.17 OSD Escalation Rates
In military aircraft manufacturing, it is most often necessary to forecast program
costs for ten to fifteen years into the future. Hence, there is a basic procedure followed to
estimate all program costs in order to make sure reporting is done in equivalent units and

459
in a uniform fashion. Normally, a group of estimators works constantly to maintain the
most up to date escalation rates to make appropriate conversions.
First, a base year is normally stipulated. For example, the contract may stipulate
base year 2000 dollars. Next, the estimating rates and factors group will develop
appropriate factors to use in the out years of the forecast in the stipulated base year dollar.
These factors reflect projected increases or decreases in costs that are contractually
agreed upon by the customer. Lastly, the final escalation rates are obtained from the
Office of the Secretary of Defense and applied to create Then-Year dollar rates. (United
States Office of the Secretary of Defense, Inflation Guidance, 2005.)
Table B.9 OSD Escalation Rates Example
APN = Aircraft Procurement, Navy (1506) Base Year = 2005
Fiscal Year Inflation Rate % Raw Index
Weighted Index
Budget Year Index
Budget Year
Inflation Rate %
2005 2.00% 1.0000 1.0267 1.0000 2.04% 2006 2.00% 1.0200 1.0480 1.0208 2.08% 2007 2.10% 1.0414 1.0700 1.0422 2.10% 2008 2.10% 1.0633 1.0925 1.0641 2.10% 2009 2.10% 1.0856 1.1154 1.0864 2.10% 2010 2.10% 1.1084 1.1388 1.1093 2.10% 2011 2.10% 1.1317 1.1628 1.1325 2.10% 2012 2.10% 1.1555 1.1872 1.1563 2.10% 2013 2.10% 1.1797 1.2121 1.1806 2.10% 2014 2.10% 1.2045 1.2376 1.2054 2.10% 2015 2.10% 1.2298 1.2635 1.2307 2.10%

460
B.18 Performance and Efficiency Factors
Standards are offer a consistent baseline of measurement for a manufacturing
operation. Tasks are rarely completed in the hours allotted as the standard time. Since
estimators strive to project realistic estimates, they utilize performance, or efficiency,
factors to estimate actual labor hours. In some literature, this factor is also referred to as
a realization factor. (United States Office of the Undersecretary of Defense for
Acquisition Technology and Logistics, 2007; United States Office of the Undersecretary
of Defense for Acquisition Technology and Logistics, Realization, 2005.)
The equation below illustrates the meaning of the factor:
PE = AT ST
Where:
PE = Performance (Efficiency) Factor AT = Actual time to perform the task ST = Standard time to perform the task
Most manufacturing organizations maintain monthly and yearly reports on
performance. For example, if an assembly department had an average performance of
75%, then its estimating performance factor, PE, would be 1/0.75 = 1.34. Hence, if a job
is determined to have a standard hour content of 15 hours, then the estimated actual hours
would be determined as follows:

461
PE = AT ST
PE x ST = AT
(1/0.75) x 15 = 20 actual hours
B.19 Learning Curves
Learning curves are used in the defense industry to predict the amount of actual
hours reduction that can be expected over a given amount of production. In basic terms,
learning curve theory puts forth that the percentage reduction in actual hours will be
constant over successively doubled unit quantities produced. The constant percentage is
the rate of learning. The slope of the learning curve is 100% - rate of the learning
percentage. For example, if a process is said to have a learning curve slope of 90%, that
that means that the rate of learning is 10%. The hours between doubled quantities will be
reduced by 10%. (United States Department of the Air Force, 2002.) Quite often,
learning curves are applied using standard values as the basis. (Defense Contract Audit
Agency, 2007.)
B.19.1 Learning Curve Methodologies
There are various methodologies under the heading of “learning curve.” Two of
the more common approaches are:
1) Unit Learning
2) Cumulative Average Learning

462
For simplicity, only one method is going to be illustrated. The following is the
equation for Unit Learning:
YX= T1 * Xb
Where:
Yx = the labor hours required to produce the Xth unit T1 = the theoretical or actual labor hours of the first production unit X = the sequential number of the unit for which the labor hours are being computer b = the constant for the rate decrease from unit to unit
The logarithm transformation of the Unit Learning equation is as follows:
ln(YX) = T1 +b * ln (X) Where:
ln = The natural logarithm
The value of b is expressed in equation form as follows:
b = ln S / ln 2
Where:
S = the (cost or unit hours)/quantity slope expressed as a decimal value.
For example, if the first unit took 100 actual hours and the second unit took 88
actual hours, then the unit curve would have an 88% slope, and the value of S would be
0.88.
The value of b would then be equal to the following:

463
b = ln (0.88) / ln (2)
b = -0.12783 / ln (0.69315)
b = -0.18442
The equation to determine the slope from b is as follows:
ln Slope = b * ln 2
e b*ln2 = Slope
B.19.2 Learning Curve Application
One of the more common applications of learning curve theory is the use of
standard hours to project theoretical T1 values. The Unit Learning equation is a follows
from above:
YX= T1 * Xb
In order to project theoretical T1 values, the format of the equation is changed as
follows:
YX / Xb = T1
When this approach is utilized, the estimator must determine three important pieces
of historical information:
1) The historical learning curve slope for the type of task being estimated.
2) The historical unit break point for standard value attainability. For example, if it
historically took 100 units of production before the standard value was attainable,

464
then the value of X=100. (Some refer to this as the expected point to “bottom
out” on the learning curve.)
3) The current average performance factor for the type of task.
Typical learning curve slopes for aerospace are as follows: Fabrication 90%,
Assembly 75%, and Material 98%. (In the case of material, the above unit learning
equation is converted to dollars as a basis.) (Wilcox, 2002.)
The calculations that follow illustrate typical theoretical T1 calculation procedures:
YX / Xb = T1
Assembly Slope, S = 75%
b = ln(S)/ln(2)
b = -0.41504
Assume projected standard hours = 100.00
Assume performance factor = 1.34
Estimated production actual hours = 134.00
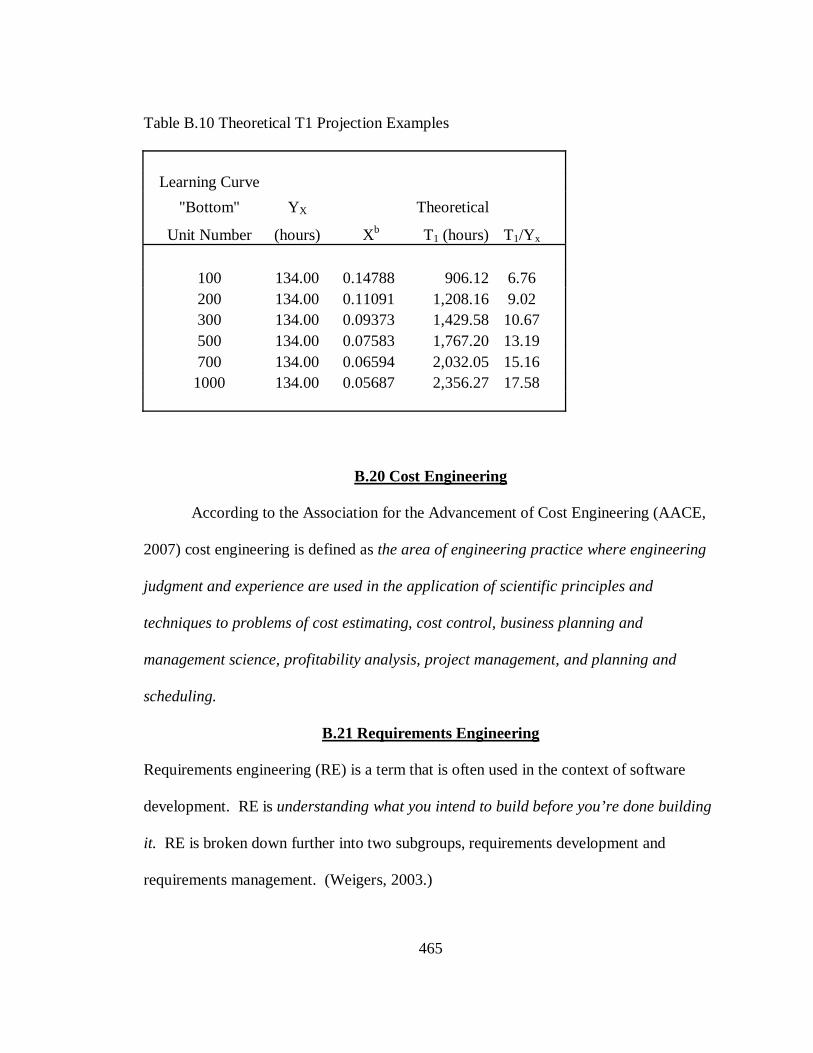
465
Table B.10 Theoretical T1 Projection Examples
Learning Curve
"Bottom" YX Theoretical
Unit Number (hours) Xb T1 (hours) T1/Yx
100 134.00 0.14788 906.12 6.76
200 134.00 0.11091 1,208.16 9.02
300 134.00 0.09373 1,429.58 10.67
500 134.00 0.07583 1,767.20 13.19
700 134.00 0.06594 2,032.05 15.16
1000 134.00 0.05687 2,356.27 17.58
B.20 Cost Engineering
According to the Association for the Advancement of Cost Engineering (AACE,
2007) cost engineering is defined as the area of engineering practice where engineering
judgment and experience are used in the application of scientific principles and
techniques to problems of cost estimating, cost control, business planning and
management science, profitability analysis, project management, and planning and
scheduling.
B.21 Requirements Engineering
Requirements engineering (RE) is a term that is often used in the context of software
development. RE is understanding what you intend to build before you’re done building
it. RE is broken down further into two subgroups, requirements development and
requirements management. (Weigers, 2003.)

466
In recent years, a lot of effort has gone into creating computer systems to
management requirements. These included material requirements planning (MRP) and
capacity requirements planning (CRP). However, the “requirements development”
activity has not been given as much emphasis in aircraft manufacturing. Requirements
development is accomplished by IPTs or not done until after engineering release.
B.22 Process Engineering
Process engineering is the application of knowledge, tools, and techniques to
define, visualize, measure, control, and improve processes in a way that meets business
objectives, i.e., customer requirements and profitability goals. (Melan, 2002.)