Concentration-dependent antagonistic persuasion of SDS and naphthalene derivatives on the...
16
Concentration-dependent antagonistic persuasion of SDS and naphthalene derivatives on the fibrillation of stem bromelain Atiyatul Qadeer a , Ejaz Ahmad a , Masihuz Zaman a , Mohd Wasif Khan b , Javed Masood Khan a , Gulam Rabbani a , Khaja Faisal Tarique c , Gaurav Sharma d , Samudrala Gourinath c , Sajid Nadeem a , Gamal Badr e,f , Rizwan Hasan Khan a,⇑ a Interdisciplinary Biotechnology Unit, Aligarh Muslim University, Aligarh 202002, India b Department of Bioscience & Bioengineering, Indian Institute of Technology Bombay, Powai, Mumbai 400076, India c School of Life Sciences, Jawaharlal Nehru University, New Delhi 110067, India d Department of Chemistry, Aligarh Muslim University, Aligarh 202002, India e Princess Al-Johara Al-Ibrahim Center for Cancer Research, Prostate Cancer Research Chair, College of Medicine, King Saud University, Riyadh, Saudi Arabia f Zoology Department, Faculty of Science, Assiut University, 71516 Assiut, Egypt article info Article history: Received 7 June 2013 and in revised form 11 October 2013 Available online 31 October 2013 Keywords: Amyloid inhibition ANS Bis-ANS SDS Stem bromelain p–p Interactions abstract Sodium dodecyl sulfate, a biological membrane mimetic, can be used to study the conversion of globular proteins into amyloid fibrils in vitro. Using multiple approaches, the effect of SDS was examined on stem bromelain (SB), a widely recognized therapeutic protein. SB is known to exist as a partially folded inter- mediate at pH 2.0, situation also encountered in the gastrointestinal tract (its site of absorption). In the presence of sub-micellar SDS concentration (500–1000 lM), this intermediate was found to exhibit great propensity to form large-sized b-sheeted aggregates with fibrillar morphology, the hall marks of amyloid structure. We also observed inhibition of fibrillation by two naphthalene-based compounds, ANS and bis-ANS. While bis-ANS significantly inhibited fibril formation at 50 lM, ANS did so at relatively higher concentration (400 lM). Alcohols, but not salts, were found to weaken the inhibitory action of these compounds suggesting the possible involvement of hydrophobic interactions in their binding to protein. Besides, isothermal titration calorimetry and molecular docking studies suggested that inhibition of fibrillation by these naphthalene derivatives is mediated not just through hydrophobic forces, but also by disruption of p–p interactions between the aromatic residues together with the inter-polypeptide chain repulsion among negatively charged ANS/bis-ANS bound SB. Ó 2013 Elsevier Inc. All rights reserved. Introduction The self-assembly of proteins caused by their aberrant misfold- ing and subsequent aggregation into amyloid fibrils is associated with several clinical disorders including Alzheimer’s, Parkinson’s, Type II diabetes and many others [1,2]. In addition to their in vivo formation, the amyloid fibrils can also be generated from many different unrelated peptides and proteins under carefully chosen condition. This observation suggests that fibril formation is an inherent property of polypeptide chain, though individual propensity may vary with the amino acid sequence as well as envi- ronmental conditions [3]. In past, there has been intense discussion on how a normally soluble protein spontaneously converts into pathogenic amyloid structure. A number of structurally unrelated compounds have been probed for their ability to weaken the inter- molecular interactions that stabilize the fibrils and to inhibit the self-assembly of protein [4]. However despite immense investiga- tion the comprehensive details of the mechanism underlying pro- tein aggregation is yet not clear and currently there is no real cure available for treating the devastating diseases. Stem bromelain (SB) 1 [EC 3.4.22.32], a member of C1A family of proteolytic enzymes is obtained from Ananas comosus [5]. SB is widely accepted as a potential phytotherapeutic drug due to its broad medicinal applications such as inhibition of platelet aggrega- tion, angina pectoris, bronchitis, sinusitis, surgical traumas, throm- bophlebitis, pyelonephritis and enhanced absorption of drugs particularly antibiotics, analgesic, anti-inflammatory, antitumoral 0003-9861/$ - see front matter Ó 2013 Elsevier Inc. All rights reserved. http://dx.doi.org/10.1016/j.abb.2013.10.015 ⇑ Corresponding author. Address: Interdisciplinary Biotechnology Unit, Aligarh Muslim University, Aligarh 202002, U.P, India. Fax: +91 571 2721776. E-mail addresses: [email protected], [email protected] (R.H. Khan). 1 Abbreviations used: ANS, 1-anilino-8-napthalene sulfonate; bis-ANS, 4,4 0 -dianili- no-1,1 0 -binaphthyl-5,5 0 -sulfonate; CD, circular dichroism; CMC, critical micellar concentration; ITC, isothermal titration calorimetry; PFI, partially folded intermedi- ate; RLS, Rayleigh light scattering; SDS, sodium dodecyl sulfate; SB, stem bromelain; TEM, transmission electron microscopy; ThT, thioflavin T. Archives of Biochemistry and Biophysics 540 (2013) 101–116 Contents lists available at ScienceDirect Archives of Biochemistry and Biophysics journal homepage: www.elsevier.com/locate/yabbi
-
Upload
independent -
Category
Documents
-
view
1 -
download
0
Transcript of Concentration-dependent antagonistic persuasion of SDS and naphthalene derivatives on the...

Archives of Biochemistry and Biophysics 540 (2013) 101–116
Contents lists available at ScienceDirect
Archives of Biochemistry and Biophysics
journal homepage: www.elsevier .com/ locate/yabbi
Concentration-dependent antagonistic persuasion of SDS andnaphthalene derivatives on the fibrillation of stem bromelain
0003-9861/$ - see front matter � 2013 Elsevier Inc. All rights reserved.http://dx.doi.org/10.1016/j.abb.2013.10.015
⇑ Corresponding author. Address: Interdisciplinary Biotechnology Unit, AligarhMuslim University, Aligarh 202002, U.P, India. Fax: +91 571 2721776.
E-mail addresses: [email protected], [email protected](R.H. Khan).
1 Abbreviations used: ANS, 1-anilino-8-napthalene sulfonate; bis-ANS, 4,4no-1,10-binaphthyl-5,50-sulfonate; CD, circular dichroism; CMC, criticalconcentration; ITC, isothermal titration calorimetry; PFI, partially folded inate; RLS, Rayleigh light scattering; SDS, sodium dodecyl sulfate; SB, stem brTEM, transmission electron microscopy; ThT, thioflavin T.
Atiyatul Qadeer a, Ejaz Ahmad a, Masihuz Zaman a, Mohd Wasif Khan b, Javed Masood Khan a,Gulam Rabbani a, Khaja Faisal Tarique c, Gaurav Sharma d, Samudrala Gourinath c, Sajid Nadeem a,Gamal Badr e,f, Rizwan Hasan Khan a,⇑a Interdisciplinary Biotechnology Unit, Aligarh Muslim University, Aligarh 202002, Indiab Department of Bioscience & Bioengineering, Indian Institute of Technology Bombay, Powai, Mumbai 400076, Indiac School of Life Sciences, Jawaharlal Nehru University, New Delhi 110067, Indiad Department of Chemistry, Aligarh Muslim University, Aligarh 202002, Indiae Princess Al-Johara Al-Ibrahim Center for Cancer Research, Prostate Cancer Research Chair, College of Medicine, King Saud University, Riyadh, Saudi Arabiaf Zoology Department, Faculty of Science, Assiut University, 71516 Assiut, Egypt
a r t i c l e i n f o a b s t r a c t
Article history:Received 7 June 2013and in revised form 11 October 2013Available online 31 October 2013
Keywords:Amyloid inhibitionANSBis-ANSSDSStem bromelainp–p Interactions
Sodium dodecyl sulfate, a biological membrane mimetic, can be used to study the conversion of globularproteins into amyloid fibrils in vitro. Using multiple approaches, the effect of SDS was examined on stembromelain (SB), a widely recognized therapeutic protein. SB is known to exist as a partially folded inter-mediate at pH 2.0, situation also encountered in the gastrointestinal tract (its site of absorption). In thepresence of sub-micellar SDS concentration (500–1000 lM), this intermediate was found to exhibit greatpropensity to form large-sized b-sheeted aggregates with fibrillar morphology, the hall marks of amyloidstructure. We also observed inhibition of fibrillation by two naphthalene-based compounds, ANS andbis-ANS. While bis-ANS significantly inhibited fibril formation at 50 lM, ANS did so at relatively higherconcentration (400 lM). Alcohols, but not salts, were found to weaken the inhibitory action of thesecompounds suggesting the possible involvement of hydrophobic interactions in their binding to protein.Besides, isothermal titration calorimetry and molecular docking studies suggested that inhibition offibrillation by these naphthalene derivatives is mediated not just through hydrophobic forces, but alsoby disruption of p–p interactions between the aromatic residues together with the inter-polypeptidechain repulsion among negatively charged ANS/bis-ANS bound SB.
� 2013 Elsevier Inc. All rights reserved.
Introduction
The self-assembly of proteins caused by their aberrant misfold-ing and subsequent aggregation into amyloid fibrils is associatedwith several clinical disorders including Alzheimer’s, Parkinson’s,Type II diabetes and many others [1,2]. In addition to theirin vivo formation, the amyloid fibrils can also be generated frommany different unrelated peptides and proteins under carefullychosen condition. This observation suggests that fibril formationis an inherent property of polypeptide chain, though individualpropensity may vary with the amino acid sequence as well as envi-ronmental conditions [3]. In past, there has been intense discussionon how a normally soluble protein spontaneously converts intopathogenic amyloid structure. A number of structurally unrelated
compounds have been probed for their ability to weaken the inter-molecular interactions that stabilize the fibrils and to inhibit theself-assembly of protein [4]. However despite immense investiga-tion the comprehensive details of the mechanism underlying pro-tein aggregation is yet not clear and currently there is no real cureavailable for treating the devastating diseases.
Stem bromelain (SB)1 [EC 3.4.22.32], a member of C1A family ofproteolytic enzymes is obtained from Ananas comosus [5]. SB iswidely accepted as a potential phytotherapeutic drug due to itsbroad medicinal applications such as inhibition of platelet aggrega-tion, angina pectoris, bronchitis, sinusitis, surgical traumas, throm-bophlebitis, pyelonephritis and enhanced absorption of drugsparticularly antibiotics, analgesic, anti-inflammatory, antitumoral
0-dianili-micellar
termedi-omelain;
SO3-NH
A
-O3S
NH
SO3-
NH
B
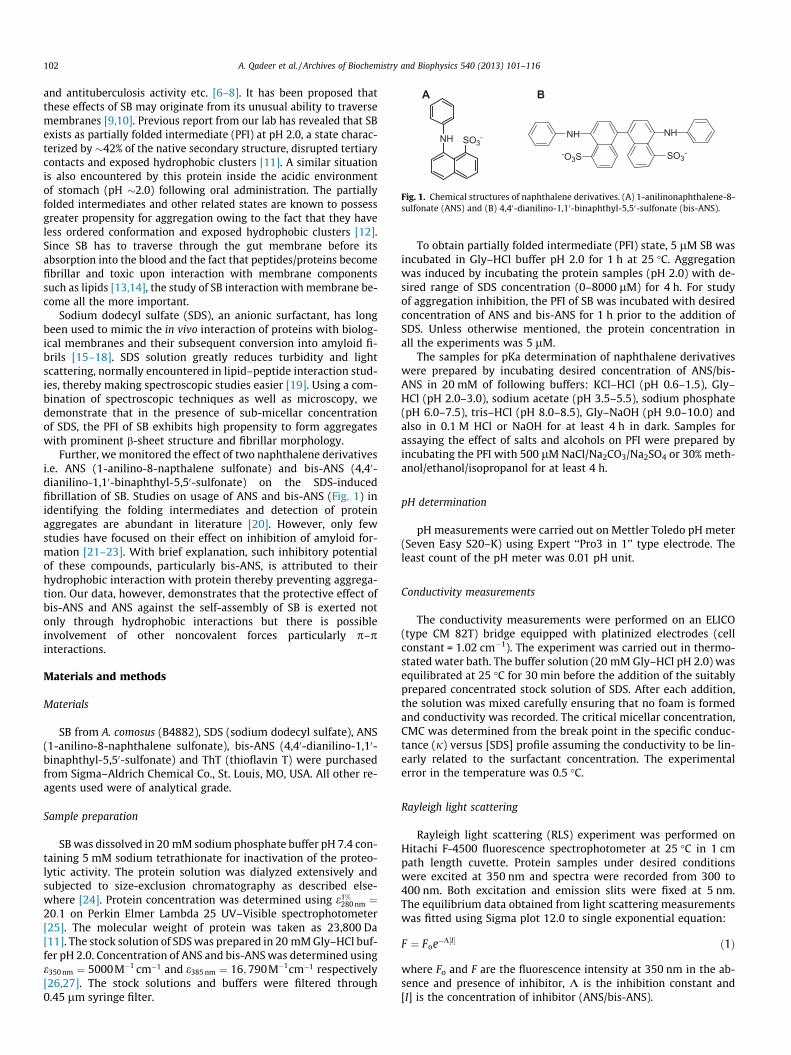
Fig. 1. Chemical structures of naphthalene derivatives. (A) 1-anilinonaphthalene-8-sulfonate (ANS) and (B) 4,40-dianilino-1,10-binaphthyl-5,50-sulfonate (bis-ANS).
102 A. Qadeer et al. / Archives of Biochemistry and Biophysics 540 (2013) 101–116
and antituberculosis activity etc. [6–8]. It has been proposed thatthese effects of SB may originate from its unusual ability to traversemembranes [9,10]. Previous report from our lab has revealed that SBexists as partially folded intermediate (PFI) at pH 2.0, a state charac-terized by �42% of the native secondary structure, disrupted tertiarycontacts and exposed hydrophobic clusters [11]. A similar situationis also encountered by this protein inside the acidic environmentof stomach (pH �2.0) following oral administration. The partiallyfolded intermediates and other related states are known to possessgreater propensity for aggregation owing to the fact that they haveless ordered conformation and exposed hydrophobic clusters [12].Since SB has to traverse through the gut membrane before itsabsorption into the blood and the fact that peptides/proteins becomefibrillar and toxic upon interaction with membrane componentssuch as lipids [13,14], the study of SB interaction with membrane be-come all the more important.
Sodium dodecyl sulfate (SDS), an anionic surfactant, has longbeen used to mimic the in vivo interaction of proteins with biolog-ical membranes and their subsequent conversion into amyloid fi-brils [15–18]. SDS solution greatly reduces turbidity and lightscattering, normally encountered in lipid–peptide interaction stud-ies, thereby making spectroscopic studies easier [19]. Using a com-bination of spectroscopic techniques as well as microscopy, wedemonstrate that in the presence of sub-micellar concentrationof SDS, the PFI of SB exhibits high propensity to form aggregateswith prominent b-sheet structure and fibrillar morphology.
Further, we monitored the effect of two naphthalene derivativesi.e. ANS (1-anilino-8-napthalene sulfonate) and bis-ANS (4,40-dianilino-1,10-binaphthyl-5,50-sulfonate) on the SDS-inducedfibrillation of SB. Studies on usage of ANS and bis-ANS (Fig. 1) inidentifying the folding intermediates and detection of proteinaggregates are abundant in literature [20]. However, only fewstudies have focused on their effect on inhibition of amyloid for-mation [21–23]. With brief explanation, such inhibitory potentialof these compounds, particularly bis-ANS, is attributed to theirhydrophobic interaction with protein thereby preventing aggrega-tion. Our data, however, demonstrates that the protective effect ofbis-ANS and ANS against the self-assembly of SB is exerted notonly through hydrophobic interactions but there is possibleinvolvement of other noncovalent forces particularly p–pinteractions.
Materials and methods
Materials
SB from A. comosus (B4882), SDS (sodium dodecyl sulfate), ANS(1-anilino-8-naphthalene sulfonate), bis-ANS (4,40-dianilino-1,10-binaphthyl-5,50-sulfonate) and ThT (thioflavin T) were purchasedfrom Sigma–Aldrich Chemical Co., St. Louis, MO, USA. All other re-agents used were of analytical grade.
Sample preparation
SB was dissolved in 20 mM sodium phosphate buffer pH 7.4 con-taining 5 mM sodium tetrathionate for inactivation of the proteo-lytic activity. The protein solution was dialyzed extensively andsubjected to size-exclusion chromatography as described else-where [24]. Protein concentration was determined using e1%
280 nm ¼20:1 on Perkin Elmer Lambda 25 UV–Visible spectrophotometer[25]. The molecular weight of protein was taken as 23,800 Da[11]. The stock solution of SDS was prepared in 20 mM Gly–HCl buf-fer pH 2.0. Concentration of ANS and bis-ANS was determined usinge350 nm ¼ 5000M�1 cm�1 and e385 nm ¼ 16;790M�1cm�1 respectively[26,27]. The stock solutions and buffers were filtered through0.45 lm syringe filter.
To obtain partially folded intermediate (PFI) state, 5 lM SB wasincubated in Gly–HCl buffer pH 2.0 for 1 h at 25 �C. Aggregationwas induced by incubating the protein samples (pH 2.0) with de-sired range of SDS concentration (0–8000 lM) for 4 h. For studyof aggregation inhibition, the PFI of SB was incubated with desiredconcentration of ANS and bis-ANS for 1 h prior to the addition ofSDS. Unless otherwise mentioned, the protein concentration inall the experiments was 5 lM.
The samples for pKa determination of naphthalene derivativeswere prepared by incubating desired concentration of ANS/bis-ANS in 20 mM of following buffers: KCl–HCl (pH 0.6–1.5), Gly–HCl (pH 2.0–3.0), sodium acetate (pH 3.5–5.5), sodium phosphate(pH 6.0–7.5), tris–HCl (pH 8.0–8.5), Gly–NaOH (pH 9.0–10.0) andalso in 0.1 M HCl or NaOH for at least 4 h in dark. Samples forassaying the effect of salts and alcohols on PFI were prepared byincubating the PFI with 500 lM NaCl/Na2CO3/Na2SO4 or 30% meth-anol/ethanol/isopropanol for at least 4 h.
pH determination
pH measurements were carried out on Mettler Toledo pH meter(Seven Easy S20–K) using Expert ‘‘Pro3 in 1’’ type electrode. Theleast count of the pH meter was 0.01 pH unit.
Conductivity measurements
The conductivity measurements were performed on an ELICO(type CM 82T) bridge equipped with platinized electrodes (cellconstant = 1.02 cm�1). The experiment was carried out in thermo-stated water bath. The buffer solution (20 mM Gly–HCl pH 2.0) wasequilibrated at 25 �C for 30 min before the addition of the suitablyprepared concentrated stock solution of SDS. After each addition,the solution was mixed carefully ensuring that no foam is formedand conductivity was recorded. The critical micellar concentration,CMC was determined from the break point in the specific conduc-tance (j) versus [SDS] profile assuming the conductivity to be lin-early related to the surfactant concentration. The experimentalerror in the temperature was 0.5 �C.
Rayleigh light scattering
Rayleigh light scattering (RLS) experiment was performed onHitachi F-4500 fluorescence spectrophotometer at 25 �C in 1 cmpath length cuvette. Protein samples under desired conditionswere excited at 350 nm and spectra were recorded from 300 to400 nm. Both excitation and emission slits were fixed at 5 nm.The equilibrium data obtained from light scattering measurementswas fitted using Sigma plot 12.0 to single exponential equation:
F ¼ Foe�K½I� ð1Þ
where Fo and F are the fluorescence intensity at 350 nm in the ab-sence and presence of inhibitor, K is the inhibition constant and[I] is the concentration of inhibitor (ANS/bis-ANS).

A. Qadeer et al. / Archives of Biochemistry and Biophysics 540 (2013) 101–116 103
For studying time-dependent changes in aggregation reaction indifferent conditions, RLS was performed by setting identical excitationand emission wavelengths (350/350 nm). The reaction was carried outat 25 �C for 900 s at acquisition rate of 0.08 s. The time-dependentchanges in light scattering intensity were fitted to double exponentialequation using Sigma plot 12.0 as reported elsewhere [28].
Turbidity measurements
The turbidity of protein samples under different conditions wasmeasured by recording absorbance at 350 nm on Perkin-ElmerLambda 25 double beam UV–Vis spectrophotometer. The measure-ments were carried out at 25 �C in a cuvette of 1 cm path length.
Circular dichroism spectroscopy
Circular dichroic (CD) measurements were performed on JASCOspectropolarimeter (J-815). The instrument was calibrated with d-10-camphorsulfonic acid. All measurements were taken at 25 �Cwith a thermostatically controlled cell holder attached to a peltierwith Multitech water circulator. Far-UV CD spectra (190–250 nm)were taken in cuvette of 0.1 cm path length. For near-UV CD(250–320 nm) spectral measurements, the protein concentrationwas 40 lM and the path length of the cuvette used was 1 cm. Spec-tra were collected with 100 nm/min scan speed and response timeof 1 s. Each spectrum was average of two scans. All spectra weresmoothed by the Savitzky–Golay method with 25 convolutionwidth. The MRE (Mean Residue Ellipticity) in deg cm2 dmol�1
was calculated using the following equation:
MRE ¼ hobsðm degÞ10� n� l� Cp
ð2Þ
where hobs is CD in millidegree, n is the number of amino acid res-idues, l is the path length of the cell in cm and Cp is the molar con-centration of protein. The % a-helical content was calculated usingthe following equation [29]:
%a-helix ¼ ð�MRE208 nm � 400033;000� 4000
Þ � 100 ð3Þ
where MRE208 nm corresponds to the observed MRE values, 4000 isthe MRE of b-form and random coil at 208 nm while 33,000 is theMRE of pure a-helix at 208 nm.
Fluorescence spectroscopy
The intrinsic fluorescence measurements were performed onHitachi spectrofluorometer (F-4500). The measurements were ta-ken at 25 �C in 1 cm path length cuvette. The fluorescence of Trpwas excited at 295 nm and the emission spectra were recordedfrom 300 to 400 nm. Both excitation and emission slits were setat 5 nm.
Fluorescence experiments were also performed to obtain Job’splot for determination of ligand (ANS/bis-ANS) stoichiometrywhere the total concentration of protein and ligand was fixed(25 lM) while the mole fractions of the ligand was varied. Thefluorescence of ANS and bis-ANS was excited at 380 and 385 nmrespectively and the emission spectra were collected from 400 to600 nm. The normalized fluorescence intensity of ANS/bis-ANScontaining samples obtained at respective emission maximum(480/485 nm) was plotted against their mole fractions.
ThT fluorescence assay
A stock solution of thioflavin T (ThT) was prepared in distilledwater. The concentration of ThT was determined using
e412 nm ¼ 36;000M�1cm�1. Protein samples (5 lM) under desiredconditions were incubated with 10 lM ThT for 30 min at 25 �C indark. The fluorescence of ThT was excited at 440 nm and emissionspectra were recorded from 450 to 600 nm. The spectra were cor-rected by subtracting the fluorescence intensity of controls (sam-ples without protein).
For the determination of the apparent competitive inhibitionconstant (Kiapp), 5 lM SB (pH 2.0) was incubated with 0–1000 lM SDS in the absence and presence of desired concentrationof ANS and bis-ANS followed by incubation with 10 lM ThT. TheThT fluorescence of protein samples at 485 nm was plotted versusSDS concentration. The data was globally fitted to competitiveinhibition model using Graph-Pad Prism, version 5.0, software forthe determination of Kiapp.
Transmission electron microscopy
The morphology of aggregates in different conditions wasexamined on JEOL 2100F transmission electron microscope (TEM)operating at an accelerating voltage of 200 kV. Protein sample(6 lL), incubated under different conditions, was applied on 200mesh copper grid covered by carbon-coated formvar film. Excessof fluid was removed after 2 min, unbound protein was washedwith miliQ water and the samples were negatively stained with2% (w/v) uranyl acetate. The grids then were air-dried and viewedunder electron microscope.
Isothermal titration calorimetry
The ITC measurements were performed on VP-ITC titration cal-orimeter from Microcal (Northampton, MA). The samples werethoroughly degassed under vacuum in the Thermovac unit sup-plied with the instrument. The titrations were performed at 25,30 and 37 �C. The sample cell was loaded with 25 lM SB preparedin 20 mM Gly–HCl buffer, pH 2.0 and the reference cell containedrespective buffer. The titration was performed with 2000 lM ANSor 250 lM bis-ANS solution (also prepared in 20 mM Gly–HCl buf-fer) that was loaded in the injection syringe. The concentration ofprotein and ligand was same in all ITC experiments. Each experi-ment consisted of 28 consecutive injections of 10 lL aliquots.Duration of each injection was 20 s and the time delay to allowequilibration between successive injections was 180 s. Stirringspeed was 307 rpm and reference power was 16 lcal/s. Controlexperiments were performed to correct the data for the heats ofdilution of ANS/bis-ANS and buffer mixing. The net enthalpy forSB-ANS and SB-bisANS association was determined by subtractionof the component heats of dilution from each injection heat pulse.The heat signals obtained from ITC were integrated using Origin7.0 software supplied by Micro Cal Inc. The titration data weredeconvoluted based on a binding model containing either one ortwo sets of non-interacting binding sites as described below.
Single set of identical binding siteThis model defines association constant, K as:
K ¼ Hð1�HÞ½L� ð4Þ
Total heat content contained in active cell volume, Vo at frac-tional saturation H is given by:
Q ¼ nHMtDHVo ð5Þ
where n is the number of binding sites in the macromolecule, Mt isthe total concentration of the macromolecule and DH is the molarheat of ligand binding. The heat released DQ(i) from the ith injec-tion for an injection volume dVi is given by:
104 A. Qadeer et al. / Archives of Biochemistry and Biophysics 540 (2013) 101–116
DQðiÞ ¼ QðiÞ þ dVi
Vo
QðiÞ þ Qði� 1Þ2
� �� Qði� 1Þ ð6Þ
Two sets of independent binding siteThis binding model defines association constants as:
K1 ¼H1
ð1�H1Þ½L�ð7Þ
K2 ¼H2
ð1�H2Þ½L�ð8Þ
The total heat content of the solution is given by:
Q ¼ MtV0ðn1H1DH1 þ n2H2DH2Þ ð9Þ
Here also heat released DQ(i) from the ith injection is given byEq. (6) which is then used in the Marquardt minimization algo-rithm to obtain best fitting values until constant v2 values wereachieved. The heat capacity values of the binding process weredetermined from temperature dependence of enthalpy change ofmolecular association using the equation [30]:
DCP ¼DHT
0 1000 2000 3000 4000
0.00
0.05
0.10
0.15
κ (m
S cm
-1)
[SDS] μM
CMC = 1250 μΜ
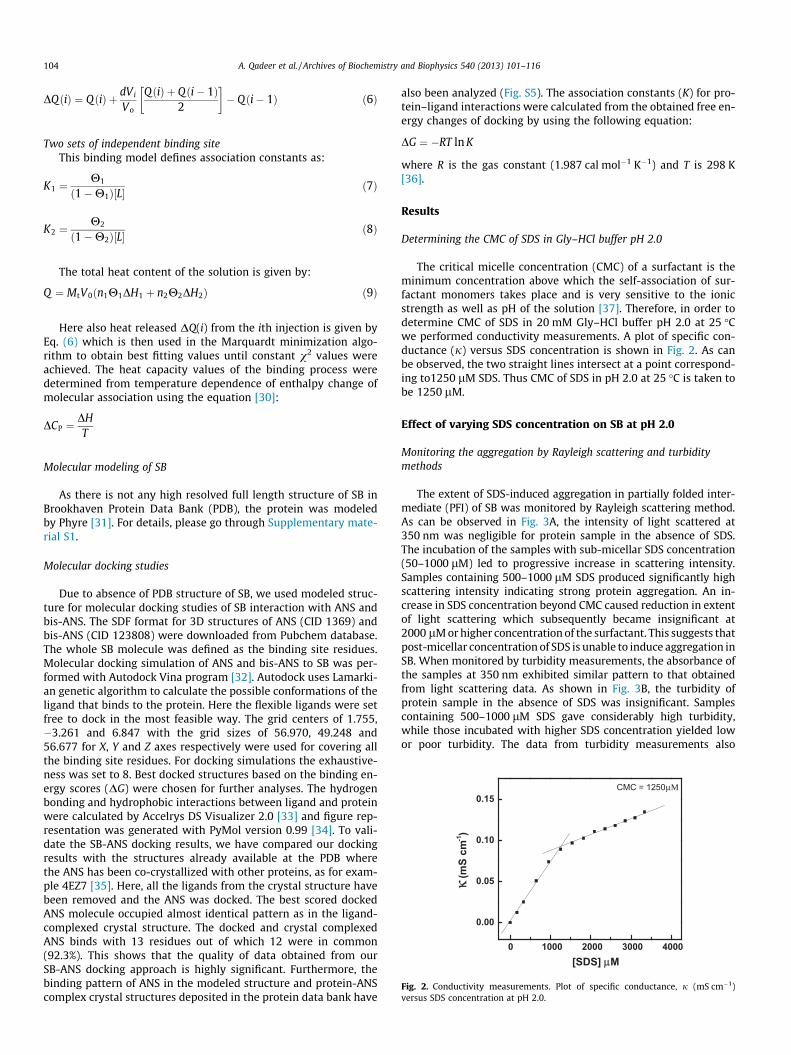
Fig. 2. Conductivity measurements. Plot of specific conductance, j (mS cm�1)versus SDS concentration at pH 2.0.
Molecular modeling of SB
As there is not any high resolved full length structure of SB inBrookhaven Protein Data Bank (PDB), the protein was modeledby Phyre [31]. For details, please go through Supplementary mate-rial S1.
Molecular docking studies
Due to absence of PDB structure of SB, we used modeled struc-ture for molecular docking studies of SB interaction with ANS andbis-ANS. The SDF format for 3D structures of ANS (CID 1369) andbis-ANS (CID 123808) were downloaded from Pubchem database.The whole SB molecule was defined as the binding site residues.Molecular docking simulation of ANS and bis-ANS to SB was per-formed with Autodock Vina program [32]. Autodock uses Lamarki-an genetic algorithm to calculate the possible conformations of theligand that binds to the protein. Here the flexible ligands were setfree to dock in the most feasible way. The grid centers of 1.755,�3.261 and 6.847 with the grid sizes of 56.970, 49.248 and56.677 for X, Y and Z axes respectively were used for covering allthe binding site residues. For docking simulations the exhaustive-ness was set to 8. Best docked structures based on the binding en-ergy scores (DG) were chosen for further analyses. The hydrogenbonding and hydrophobic interactions between ligand and proteinwere calculated by Accelrys DS Visualizer 2.0 [33] and figure rep-resentation was generated with PyMol version 0.99 [34]. To vali-date the SB-ANS docking results, we have compared our dockingresults with the structures already available at the PDB wherethe ANS has been co-crystallized with other proteins, as for exam-ple 4EZ7 [35]. Here, all the ligands from the crystal structure havebeen removed and the ANS was docked. The best scored dockedANS molecule occupied almost identical pattern as in the ligand-complexed crystal structure. The docked and crystal complexedANS binds with 13 residues out of which 12 were in common(92.3%). This shows that the quality of data obtained from ourSB-ANS docking approach is highly significant. Furthermore, thebinding pattern of ANS in the modeled structure and protein-ANScomplex crystal structures deposited in the protein data bank have
also been analyzed (Fig. S5). The association constants (K) for pro-tein–ligand interactions were calculated from the obtained free en-ergy changes of docking by using the following equation:
DG ¼ �RT ln K
where R is the gas constant (1.987 cal mol�1 K�1) and T is 298 K[36].
Results
Determining the CMC of SDS in Gly–HCl buffer pH 2.0
The critical micelle concentration (CMC) of a surfactant is theminimum concentration above which the self-association of sur-factant monomers takes place and is very sensitive to the ionicstrength as well as pH of the solution [37]. Therefore, in order todetermine CMC of SDS in 20 mM Gly–HCl buffer pH 2.0 at 25 �Cwe performed conductivity measurements. A plot of specific con-ductance (j) versus SDS concentration is shown in Fig. 2. As canbe observed, the two straight lines intersect at a point correspond-ing to1250 lM SDS. Thus CMC of SDS in pH 2.0 at 25 �C is taken tobe 1250 lM.
Effect of varying SDS concentration on SB at pH 2.0
Monitoring the aggregation by Rayleigh scattering and turbiditymethods
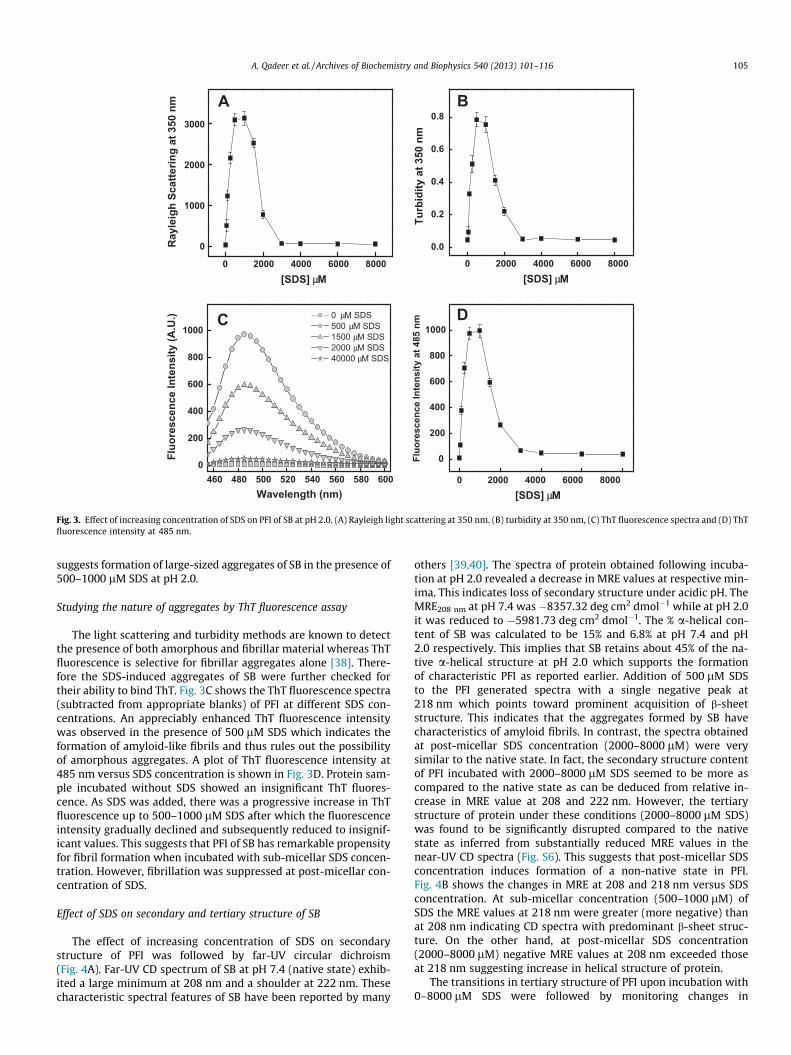
The extent of SDS-induced aggregation in partially folded inter-mediate (PFI) of SB was monitored by Rayleigh scattering method.As can be observed in Fig. 3A, the intensity of light scattered at350 nm was negligible for protein sample in the absence of SDS.The incubation of the samples with sub-micellar SDS concentration(50–1000 lM) led to progressive increase in scattering intensity.Samples containing 500–1000 lM SDS produced significantly highscattering intensity indicating strong protein aggregation. An in-crease in SDS concentration beyond CMC caused reduction in extentof light scattering which subsequently became insignificant at2000 lM or higher concentration of the surfactant. This suggests thatpost-micellar concentration of SDS is unable to induce aggregation inSB. When monitored by turbidity measurements, the absorbance ofthe samples at 350 nm exhibited similar pattern to that obtainedfrom light scattering data. As shown in Fig. 3B, the turbidity ofprotein sample in the absence of SDS was insignificant. Samplescontaining 500–1000 lM SDS gave considerably high turbidity,while those incubated with higher SDS concentration yielded lowor poor turbidity. The data from turbidity measurements also
A
0 2000 4000 6000 8000
0
1000
2000
3000
Ray
leig
h Sc
atte
ring
at 3
50 n
m
[SDS] μM
D
0
200
400
600
800
1000
Fluo
resc
ence
Inte
nsity
at 4
85 n
m
460 480 500 520 540 560 580 6000
200
400
600
800
1000
Fluo
resc
ence
Inte
nsity
(A.U
.)
Wavelength (nm)
0 μM SDS 500 μM SDS 1500 μM SDS 2000 μM SDS 40000 μM SDS
C
0.0
0.2
0.4
0.6
0.8
Turb
idity
at 3
50 n
m
B
0 2000 4000 6000 8000[SDS] μM
0 2000 4000 6000 8000[SDS] μM
Fig. 3. Effect of increasing concentration of SDS on PFI of SB at pH 2.0. (A) Rayleigh light scattering at 350 nm. (B) turbidity at 350 nm, (C) ThT fluorescence spectra and (D) ThTfluorescence intensity at 485 nm.
A. Qadeer et al. / Archives of Biochemistry and Biophysics 540 (2013) 101–116 105
suggests formation of large-sized aggregates of SB in the presence of500–1000 lM SDS at pH 2.0.
Studying the nature of aggregates by ThT fluorescence assay
The light scattering and turbidity methods are known to detectthe presence of both amorphous and fibrillar material whereas ThTfluorescence is selective for fibrillar aggregates alone [38]. There-fore the SDS-induced aggregates of SB were further checked fortheir ability to bind ThT. Fig. 3C shows the ThT fluorescence spectra(subtracted from appropriate blanks) of PFI at different SDS con-centrations. An appreciably enhanced ThT fluorescence intensitywas observed in the presence of 500 lM SDS which indicates theformation of amyloid-like fibrils and thus rules out the possibilityof amorphous aggregates. A plot of ThT fluorescence intensity at485 nm versus SDS concentration is shown in Fig. 3D. Protein sam-ple incubated without SDS showed an insignificant ThT fluores-cence. As SDS was added, there was a progressive increase in ThTfluorescence up to 500–1000 lM SDS after which the fluorescenceintensity gradually declined and subsequently reduced to insignif-icant values. This suggests that PFI of SB has remarkable propensityfor fibril formation when incubated with sub-micellar SDS concen-tration. However, fibrillation was suppressed at post-micellar con-centration of SDS.
Effect of SDS on secondary and tertiary structure of SB
The effect of increasing concentration of SDS on secondarystructure of PFI was followed by far-UV circular dichroism(Fig. 4A). Far-UV CD spectrum of SB at pH 7.4 (native state) exhib-ited a large minimum at 208 nm and a shoulder at 222 nm. Thesecharacteristic spectral features of SB have been reported by many
others [39,40]. The spectra of protein obtained following incuba-tion at pH 2.0 revealed a decrease in MRE values at respective min-ima. This indicates loss of secondary structure under acidic pH. TheMRE208 nm at pH 7.4 was �8357.32 deg cm2 dmol�1 while at pH 2.0it was reduced to �5981.73 deg cm2 dmol�1. The % a-helical con-tent of SB was calculated to be 15% and 6.8% at pH 7.4 and pH2.0 respectively. This implies that SB retains about 45% of the na-tive a-helical structure at pH 2.0 which supports the formationof characteristic PFI as reported earlier. Addition of 500 lM SDSto the PFI generated spectra with a single negative peak at218 nm which points toward prominent acquisition of b-sheetstructure. This indicates that the aggregates formed by SB havecharacteristics of amyloid fibrils. In contrast, the spectra obtainedat post-micellar SDS concentration (2000–8000 lM) were verysimilar to the native state. In fact, the secondary structure contentof PFI incubated with 2000–8000 lM SDS seemed to be more ascompared to the native state as can be deduced from relative in-crease in MRE value at 208 and 222 nm. However, the tertiarystructure of protein under these conditions (2000–8000 lM SDS)was found to be significantly disrupted compared to the nativestate as inferred from substantially reduced MRE values in thenear-UV CD spectra (Fig. S6). This suggests that post-micellar SDSconcentration induces formation of a non-native state in PFI.Fig. 4B shows the changes in MRE at 208 and 218 nm versus SDSconcentration. At sub-micellar concentration (500–1000 lM) ofSDS the MRE values at 218 nm were greater (more negative) thanat 208 nm indicating CD spectra with predominant b-sheet struc-ture. On the other hand, at post-micellar SDS concentration(2000–8000 lM) negative MRE values at 208 nm exceeded thoseat 218 nm suggesting increase in helical structure of protein.
The transitions in tertiary structure of PFI upon incubation with0–8000 lM SDS were followed by monitoring changes in

40
60
80
100
RFI
at 3
47 n
m
pH 7.4 pH 2.0
190 200 210 220 230 240 250
-10000
0
10000
20000
MR
E (d
eg c
m2 dm
ol-1)
Wavelength (nm)
pH 7.4 pH 2.0 pH 2.0+500 μΜ SDS pH 2.0+2000 μΜ SDS pH 2.0+8000 μΜ SDS
A B
C D
0 2000 4000 6000 8000
-12000
-9000
-6000
-3000
MRE218 nm MRE208 nm
MR
E (d
eg c
m2 dm
ol-1)
[SDS] μM
335
340
345
350
λ max
(nm
)
pH 7.4 pH 2.0
0 2000 4000 6000 8000[SDS] μM
0 2000 4000 6000 8000[SDS] μM
Fig. 4. SDS-induced alterations in secondary and tertiary structure of SB. (A) Far-UV CD spectra of SB at different conditions, (B) changes in MRE208 nm and MRE218 nm as afunction of SDS concentration and (C) changes in Trp emission maxima (kmax) of SB at pH 7.4 (native state) and its PFI at pH 2.0 as a function of SDS concentration. (D) Changesin fluorescence intensity of SB at pH 7.4 and at pH 2.0 as a function of SDS concentration.
106 A. Qadeer et al. / Archives of Biochemistry and Biophysics 540 (2013) 101–116
fluorescence emission maxima (kmax). SB contains five Trp residues[41]. As shown in Fig. 4C, native state of protein exhibited maxi-mum fluorescence emission at 347 nm suggesting that most ofthe Trp residues are exposed to the solvent. The accessibility orderof Trp residues is explained in Supplementary material S1. At pH2.0, the kmax was blue shifted by 2 nm accompanied by decreasein fluorescence intensity as reported previously [11], thus suggeststhe formation of characteristic PFI. The concentration-dependenteffects of SDS on PFI were also evident in the intrinsic fluorescenceparameters. The sub-micellar SDS concentration (500–1000 lM)produced a sharp blue shift of 8–10 nm accompanied by pro-nounced increase in fluorescence intensity (Fig. 4D). A sharp dipin emission maxima (kmax) indicates that Trp residues are consid-erably shielded from solvent. This may be due to strong aggrega-tion of SB whereby Trp residues that were relatively exposed inPFI might have got buried in the non-polar environment insidethe aggregates. Above CMC, the kmax began to rise and becamemore or less constant at 2000–8000 lM SDS with simultaneous de-crease in fluorescence intensity. This suggests that suppression offibrillation at post-micellar SDS concentration has facilitated thesolvent re-exposure of Trp residues. It is worth noticing that emis-sion maxima in the presence of 4000–8000 lM SDS was slightlylower (341–343 nm) than in the PFI state (345 nm). This suggeststhat some of Trp residues might have been sequestered in non-po-lar environment around the newly formed secondary structureswhich are induced upon incubation with post-micellar SDS con-centration (as noticed in the far-UV CD spectra). This further sup-ports the fact that tertiary environment of SB in native state andPFI incubated with post-micellar SDS concentration are different.
The above-mentioned concentration-dependent effects of SDSon SB conformation i.e. induction of fibrillation at sub-micellar
concentration and its suppression at post-micellar concentrationare in agreement with previous reports [15,42].
Morphology of fibrils as examined by transmission electronmicroscopy
Since the morphology of the fibrils is greatly influenced by thesolvent conditions, therefore we examined the same for SDS-in-duced fibrils of SB. As observed in Fig. 5A and B, the sample incu-bated with 500 lM SDS revealed a network of large number ofneedle-like unbranched fibrils. Similar type of fibril morphologyhas been examined for several different proteins incubated withsub-micellar SDS concentration below their respective isoelectricpoints [18].
Effect of naphthalene derivatives on fibrillation of SB
Due to the strong absorbance in UV region by ANS and bis-ANSmolecules (data not shown), we were unable to carry out far-UVCD and turbidity measurements to probe their action on fibril for-mation. Therefore the experiments in this section of the study werelimited to Rayleigh light scattering, ThT fluorescence assay andTEM. The inhibitory effect of ANS and bis-ANS on fibrillation ofSB (5 lM) was examined at SDS concentration of 500 lM to setthe protein and SDS molar ratio at 1:100.
Inhibition of fibril formation as monitored by Rayleigh light scattering
The effect of increasing concentrations of ANS and bis-ANS onextent of light scattering of PFI in the presence of 500 lM SDS is
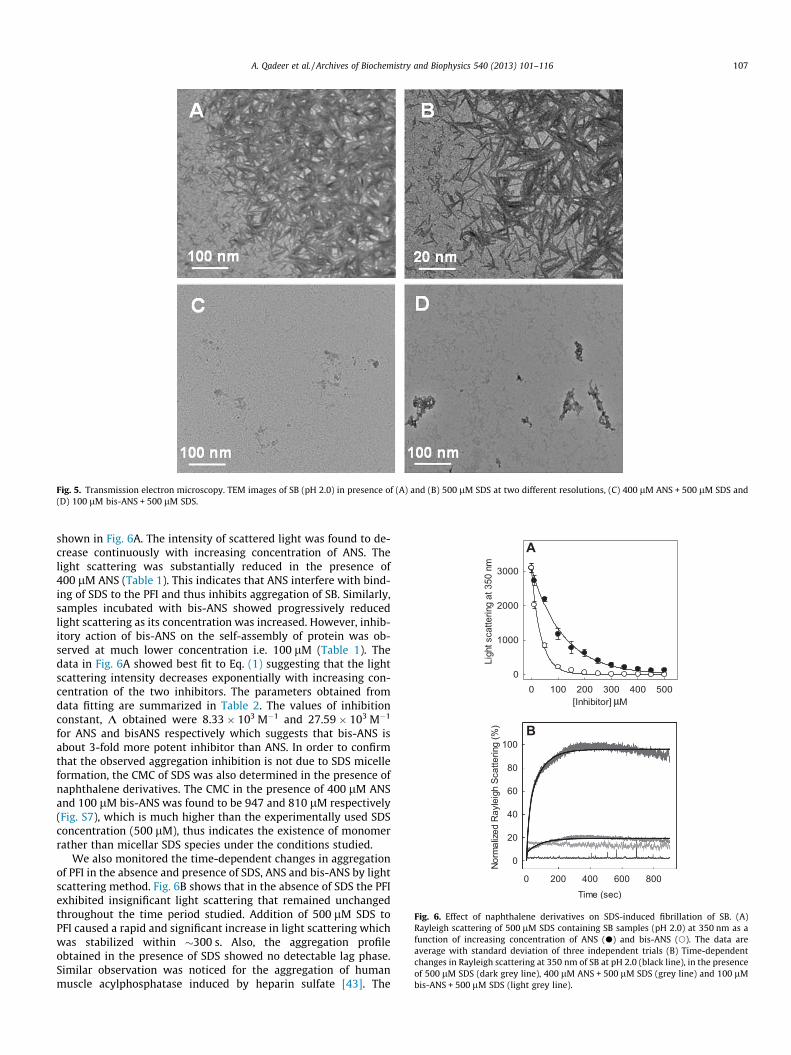
Fig. 5. Transmission electron microscopy. TEM images of SB (pH 2.0) in presence of (A) and (B) 500 lM SDS at two different resolutions, (C) 400 lM ANS + 500 lM SDS and(D) 100 lM bis-ANS + 500 lM SDS.
μ
A
B
Fig. 6. Effect of naphthalene derivatives on SDS-induced fibrillation of SB. (A)Rayleigh scattering of 500 lM SDS containing SB samples (pH 2.0) at 350 nm as afunction of increasing concentration of ANS (d) and bis-ANS (s). The data areaverage with standard deviation of three independent trials (B) Time-dependentchanges in Rayleigh scattering at 350 nm of SB at pH 2.0 (black line), in the presenceof 500 lM SDS (dark grey line), 400 lM ANS + 500 lM SDS (grey line) and 100 lMbis-ANS + 500 lM SDS (light grey line).
A. Qadeer et al. / Archives of Biochemistry and Biophysics 540 (2013) 101–116 107
shown in Fig. 6A. The intensity of scattered light was found to de-crease continuously with increasing concentration of ANS. Thelight scattering was substantially reduced in the presence of400 lM ANS (Table 1). This indicates that ANS interfere with bind-ing of SDS to the PFI and thus inhibits aggregation of SB. Similarly,samples incubated with bis-ANS showed progressively reducedlight scattering as its concentration was increased. However, inhib-itory action of bis-ANS on the self-assembly of protein was ob-served at much lower concentration i.e. 100 lM (Table 1). Thedata in Fig. 6A showed best fit to Eq. (1) suggesting that the lightscattering intensity decreases exponentially with increasing con-centration of the two inhibitors. The parameters obtained fromdata fitting are summarized in Table 2. The values of inhibitionconstant, K obtained were 8.33 � 103 M�1 and 27.59 � 103 M�1
for ANS and bisANS respectively which suggests that bis-ANS isabout 3-fold more potent inhibitor than ANS. In order to confirmthat the observed aggregation inhibition is not due to SDS micelleformation, the CMC of SDS was also determined in the presence ofnaphthalene derivatives. The CMC in the presence of 400 lM ANSand 100 lM bis-ANS was found to be 947 and 810 lM respectively(Fig. S7), which is much higher than the experimentally used SDSconcentration (500 lM), thus indicates the existence of monomerrather than micellar SDS species under the conditions studied.
We also monitored the time-dependent changes in aggregationof PFI in the absence and presence of SDS, ANS and bis-ANS by lightscattering method. Fig. 6B shows that in the absence of SDS the PFIexhibited insignificant light scattering that remained unchangedthroughout the time period studied. Addition of 500 lM SDS toPFI caused a rapid and significant increase in light scattering whichwas stabilized within �300 s. Also, the aggregation profileobtained in the presence of SDS showed no detectable lag phase.Similar observation was noticed for the aggregation of humanmuscle acylphosphatase induced by heparin sulfate [43]. The

Table 1Spectroscopic properties of SB under different conditions.a
Condition RLS350 nmb FI485 nm Turbidity350 nm
SB (pH 2.0) 25.65 ± 3.54 9.31 ± 1.36 0.05 ± 0.01SB (pH 2.0) + 500 lM SDS 3100 ± 150 973.45 ± 45.48 0.78 ± 0.04SB (pH 2.0) + 400 lM ANS + 500 lM SDS 165.20 ± 39.14 239.90 ± 16.06 –SB (pH 2.0)+ 100 lM bis-ANS + 500 lM SDS 221.80 ± 53.59 106.25 ± 11.84 –
a The data are average with standard deviation of three independent trials.b Rayleigh light scattering.
Table 2Parameters obtained from fitting the Rayleigh scattering data obtained for inhibitionof SB aggregation by ANS and bis-ANS.
Inhibitor Fo K (M�1) R2
ANS 3059.85 ± 67.25 8.33 ± 0.38 � 103 0.9931Bis-ANS 2959.70 ± 81.70 27.59 ± 2.18 � 103 0.9921
108 A. Qadeer et al. / Archives of Biochemistry and Biophysics 540 (2013) 101–116
time-dependent changes in light scattering intensity were satisfac-torily described by double exponential kinetics. This suggests thatSDS-induced aggregation of SB is a biphasic process constituting arapid initial increase followed by a slow phase. Similar behaviorhas been noticed for SDS-induced aggregation of lysozyme [28].The rate constants that were recovered from data fitting werekfast � 72 � 10�3 s�1 and kslow � 12 � 10�3 s�1 which are compara-ble to that obtained for lysozyme aggregation (�10�3 s�1). Theextent of light scattering was considerably reduced when 500 lMSDS was added to the PFI samples pre-incubated with 400 lMANS or 100 lM bis-ANS. The rate constants obtained in presenceof ANS were kfast � 501 � 10�3 s�1 and kslow � 12 � 10�3 s�1 whichindicates that ANS affects the rapid phase of SB aggregation. Thelight scattering data obtained in presence of bis-ANS could notbe fitted as the PFI sample containing bis-ANS exhibited a slightdegree of light scattering even at the 0 s. This may be attributedto the presence of very small amount of oligomers (formed possi-bly by bis-ANS) prior to the addition of SDS as reported elsewhere[22]. No such oligomers were detected in samples pre-incubatedwith ANS.
Fibrillation inhibition followed by ThT fluorescence
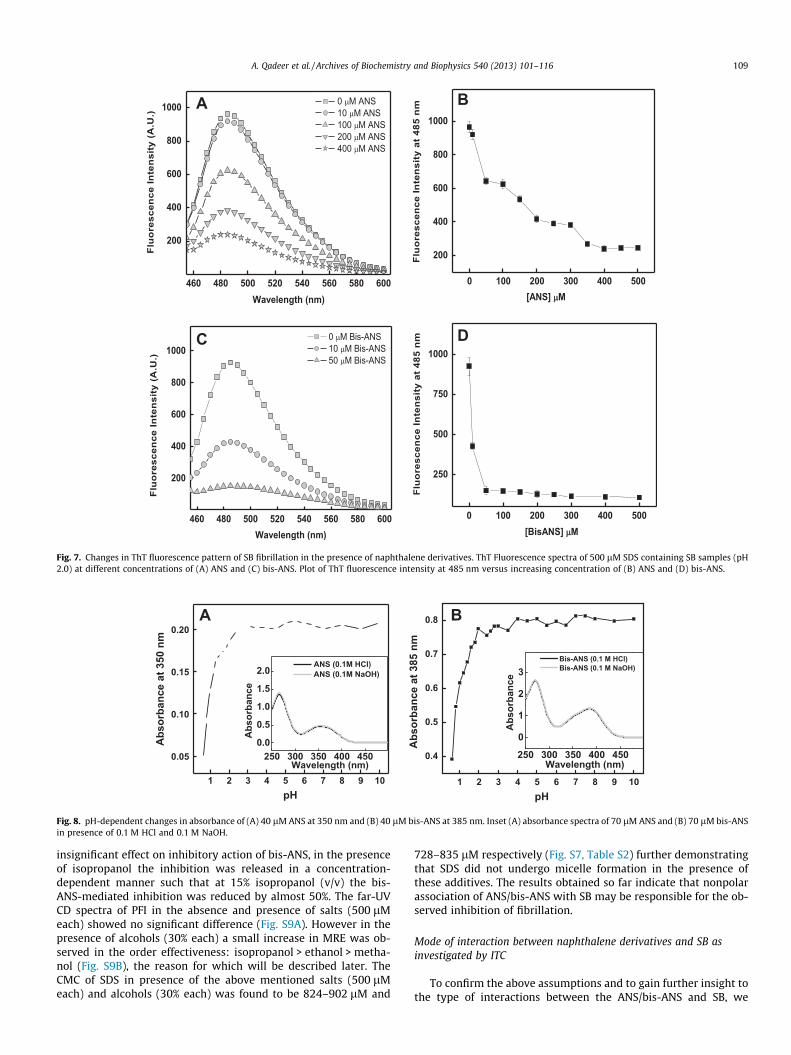
We also employed ThT fluorescence assay for studying the ef-fect of both ANS and bis-ANS on SDS-induced fibrillation of SB.The results were in good agreement with the light scattering data(Table 1). The ThT fluorescence intensity decreased continuouslywith increasing concentration of ANS (Fig. 7A) and bis-ANS(Fig. 7C). Fig. 7B and D shows plot of ThT fluorescence at 485 nmversus ANS and bis-ANS concentration respectively. It was foundthat maximum reduction in fluorescence intensity was achievedat 400 lM or higher ANS concentration. In case of bis-ANS, thefluorescence intensity was markedly abolished at 50 lM or higherconcentration. The discrepancy in the inhibitory concentration ofbis-ANS in light scattering (100 lM) and ThT fluorescence data(50 lM) may be due to the amorphous nature of the small amountof oligomers formed by bis-ANS (Fig. 6B) that might not be de-tected through fibril-specific ThT dye. Nevertheless, the resultsfrom ThT fluorescence assay also demonstrate the greater effi-ciency of bis-ANS compared to ANS in inhibiting the fibrillationof SB. Since both inhibitors are competing with the self-assemblyof polypeptide, so an apparent competitive inhibition constant(Kiapp) was also determined (Fig. S8). The Kiapp for ANS and bis-ANS were determined to be 35.05 and 1.33 lM respectively whichalso indicate that bis-ANS is a very strong competitive inhibitorcompared to ANS. The Kiapp values are comparable to that reportedelsewhere [44].
It should be noted that we have subtracted the ThT fluorescencespectra of protein samples from appropriate controls (sampleswithout protein) in order to rule out the possibility of reductionin fluorescence signals arising from quenching of ThT fluorescenceby ANS or bis-ANS molecules themselves rather than the actualinhibition of fibrillation. However, there may still be chances ofinterference between the dye molecules as reported previously[45]. Therefore, SDS containing PFI samples incubated with ANS/bis-ANS were also examined by TEM.
Morphology of the fibrils in presence of naphthalene derivatives
While TEM images of the PFI samples incubated with SDS re-vealed formation of well-defined fibrils (Fig. 5A and B), the samplespre-incubated with 400 lM ANS (Fig. 5C) and 100 lM bis-ANS(Fig. 5D) followed by addition of 500 lM SDS clearly showed sub-stantially reduced amount of fibrillar structures. Also, traces ofaggregated material with amorphous appearance could be seenin bis-ANS containing samples as already mentioned. Takentogether, the above experiments clearly demonstrate strong inhibi-tion of SDS-induced fibrillation of SB by low concentration ofbis-ANS and relatively higher concentration of ANS.
Effect of salts and alcohols on fibrillation of SB
ANS and bis-ANS are the aromatic compounds attached to sul-fonate moiety (Fig. 1). The pH-dependent changes in absorbance ofANS (Fig. 8A) and bis-ANS (Fig. 8B) at 350 and 385 nm respectivelyrevealed a marked increase in absorbance from pH 0.6 to 2.0 whichis due to the deprotonation of sulfonate moiety as the pKa of sul-fonate group is reported to be pH < 2.0 [46]. However, very insig-nificant changes in absorbance were observed above pH 2.0 (andalso in the presence of 0.1 M HCl and 0.1 M NaOH as shown inFig. 8A and B; inset) which indicates that pKa of amino grouphas probably decreased on becoming part of the aromatic com-pound such that it also undergoes deprotonation below pH 2.0.This implies that the two naphthalene derivatives acquire a netnegative charge at pH 2.0 and therefore may be assumed to exertinhibitory effect on fibrillation through polar and/or nonpolarinteractions [26]. To assess the possible contribution of these inter-actions towards inhibition, we proceeded to check different saltsand alcohols for their ability to interfere with the SDS–SB interac-tion. The final ThT fluorescence intensity at 485 nm obtained in thepresence of SB (pH 2.0) and 500 lM SDS incubated with and with-out salts or alcoholic cosolvents were compared. As can be ob-served in Fig. 9A, addition of 0–500 lM NaCl, Na2SO4 and Na2CO3
could not appreciably rescue the PFI from undergoing fibril forma-tion by SDS. On the other hand, incubation with 0–30% v/v of meth-anol, ethanol and isopropanol successfully inhibited fibrillation ofprotein in a concentration-dependent manner (Fig. 9B), with iso-propanol being the most efficient among the used alcohols. InFig. 9C and D, the normalized ThT fluorescence intensity of thesamples containing SB, 500 lM SDS and increasing concentrationof Na2SO4 and isopropanol respectively, incubated with and with-out 50 lM bis-ANS is shown. While Na2SO4 was found to have
A
C
B
D
Fig. 7. Changes in ThT fluorescence pattern of SB fibrillation in the presence of naphthalene derivatives. ThT Fluorescence spectra of 500 lM SDS containing SB samples (pH2.0) at different concentrations of (A) ANS and (C) bis-ANS. Plot of ThT fluorescence intensity at 485 nm versus increasing concentration of (B) ANS and (D) bis-ANS.
1 2 3 4 5 6 7 8 9 10
0.05
0.10
0.15
0.20
Abs
orba
nce
at 3
50 n
m
pH
250 300 350 400 4500.0
0.5
1.0
1.5
2.0
Abs
orba
nce
Wavelength (nm)
ANS (0.1M HCl) ANS (0.1M NaOH)
A B
1 2 3 4 5 6 7 8 9 10
0.4
0.5
0.6
0.7
0.8
Abs
orba
nce
at 3
85 n
m
pH
250 300 350 400 450
0
1
2
3
Abs
orba
nce
Wavelength (nm)
Bis-ANS (0.1 M HCl) Bis-ANS (0.1 M NaOH)
Fig. 8. pH-dependent changes in absorbance of (A) 40 lM ANS at 350 nm and (B) 40 lM bis-ANS at 385 nm. Inset (A) absorbance spectra of 70 lM ANS and (B) 70 lM bis-ANSin presence of 0.1 M HCl and 0.1 M NaOH.
A. Qadeer et al. / Archives of Biochemistry and Biophysics 540 (2013) 101–116 109
insignificant effect on inhibitory action of bis-ANS, in the presenceof isopropanol the inhibition was released in a concentration-dependent manner such that at 15% isopropanol (v/v) the bis-ANS-mediated inhibition was reduced by almost 50%. The far-UVCD spectra of PFI in the absence and presence of salts (500 lMeach) showed no significant difference (Fig. S9A). However in thepresence of alcohols (30% each) a small increase in MRE was ob-served in the order effectiveness: isopropanol > ethanol > metha-nol (Fig. S9B), the reason for which will be described later. TheCMC of SDS in presence of the above mentioned salts (500 lMeach) and alcohols (30% each) was found to be 824–902 lM and
728–835 lM respectively (Fig. S7, Table S2) further demonstratingthat SDS did not undergo micelle formation in the presence ofthese additives. The results obtained so far indicate that nonpolarassociation of ANS/bis-ANS with SB may be responsible for the ob-served inhibition of fibrillation.
Mode of interaction between naphthalene derivatives and SB asinvestigated by ITC
To confirm the above assumptions and to gain further insight tothe type of interactions between the ANS/bis-ANS and SB, we

0 100 200 300 400 500
50
100
Nor
mal
ized
ThT
fluo
resc
ence
(%)
[NaSO4] M
With Bis-ANS Without Bis-ANS
C
0 10 20 30
50
100
Nor
mal
ized
ThT
fluo
resc
ence
% Alcohol (v/v)
Methanol Ethanol Isopropanol
B
0 100 200 300 400 500
50
100N
orm
aliz
ed T
hT fl
uore
scen
ce
[Salt] M
NaCl Na2SO4
Na2CO3
A
D
0 5 10 150
50
100
With Bis-ANS Without Bis-ANS
Nor
mal
ized
ThT
fluo
resc
ence
(%)
%Isopropanol (v/v)
μ
μ
Fig. 9. Effect of salts and alcohols on fibrillation of SB (pH 2.0). (A and B) Normalized ThT fluorescence emission at 485 nm of 500 lM SDS containing SB samples incubatedwith increasing concentrations of (A) different salts and (B) alcohols. (C and D) Normalized ThT fluorescence emission of 500 lM SDS containing SB samples incubated in theabsence and presence of 50 lM bis-ANS with increasing concentrations of (C) Na2SO4 and (D) isopropanol.
110 A. Qadeer et al. / Archives of Biochemistry and Biophysics 540 (2013) 101–116
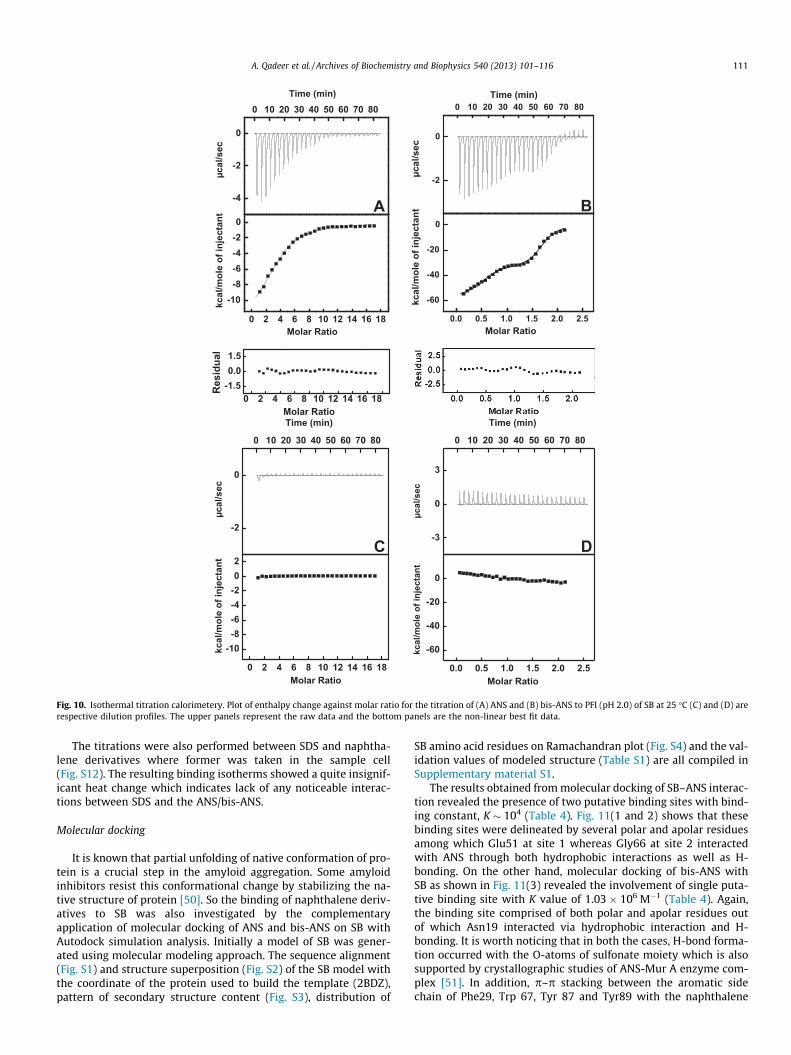
performed ITC experiments. The isothermal titration thermogramswere obtained by titration of SB in partially folded condition (pH2.0) with ANS/bis-ANS (protein and ligand being in the same molarratio as in the other experiments). Fig. 10A and B show the ANS andbis-ANS binding isotherms respectively obtained at 25 �C. The ITCprofiles obtained at 30 and 37 �C are shown in Fig. S10. The upperpanel of each ITC profile represents the thermogram of raw signalsobtained from titration of ANS or bis-ANS with SB where each peakcorresponds to a single injection of the ligand solution. The lowerpanel shows an integrated plot of the amount of heat liberatedper injection as a function of the molar ratio of ligand to protein.The insignificant heat changes as observed in the respective dilu-tion experiments (Fig. 10 C and D) rule out the possibility of liganddimerization. All the thermodynamic parameters are compiled inTable 3. The negative value of interaction free energy change (DG)in each case of PFI-naphthalene derivative association suggests thatbinding occurred spontaneously. The ANS binding isotherm ob-tained at each temperature showed negative heat deflections indi-cating that binding process was purely exothermic. The bindingisotherms were fit to single binding site model resulting in bindingconstant, K � 104 M�1 which is comparable to that obtained for ANSbinding to different partially folded intermediates of a-lactalbumin[47,48]. The heat changes accompanying binding of bis-ANS to PFIshowed best fit to two-independent binding sites model resultingin K1 � 107–108 M�1 and K2 � 106 M�1. To justify the fitting modelsused, the corresponding residual plots are also shown in Fig. 10. Forbis-ANS-SB interaction at 25 �C, the heat flow changes to slightlyendothermic peaks during the last injections which is possiblydue to relatively high hydrophobicity of bis-ANS. However, the
resultant integrated heat changes are still negative and it is evidentfrom Table 3 that binding of both ANS and bis-ANS to SB is enthalp-ically favored (DH < 0) but entropically opposed (DS < 0) at all thetemperatures studied. Except for bis-ANS binding at site 1, the neg-ative enthalpy of reaction was observed to increase with increase intemperature suggesting that the interactions were enthalpy-driven.The heat capacity (DCP) values as calculated from the slope of plotof DH versus temperature were �0.164 ± 0.03 kcal mol�1 K�1
(ANS), 0.129 ± 0.04 kcal mol�1 K�1 (bis-ANS at site 1) and�0.07 ± 0.01 kcal mol�1 K�1 (bis-ANS at site 2).
The lower stoichiometry of bis-ANS binding to SB (1–2 mole-cules) as compared to ANS (3–4 molecules) can be attributed tothe presence of extended aromatic rings in the former which arelikely to cover greater surface of protein and thus may accountfor the inhibitory effect of bis-ANS being observed at far less con-centration than ANS. The stoichiometry of ligand binding was alsodetermined by Job’s plot using fluorescence experiment (Fig. S11).The analysis of the plots showed that two slopes intersected atmole fraction, x � 0.5 for ANS and at �0.62 for bis-ANS. Thecorresponding stoichiometry is 1:1.1 and 1:1.6 respectively. For bis-ANS, a binding stoichiometry of 1:1.6 agreed well with the ITCresults. However in case of ANS, the obtained stoichiometry did notconform to the ITC data. This is due to the fact that the dissociationconstant, Kd (inverse of binding constant) of ANS (�100 lM as ob-tained from ITC data) was too high than the total concentration ofprotein and ligand (Ct) used in fluorescence experiment (25 lM),but the success of Job’s plot analysis requires Kd� Ct [49]. Wecould not perform experiment at Ct� 100 lM for ANS due to theaggregation of protein itself at such a high concentration.
0.0 0.5 1.0 1.5 2.0 2.5
-60
-40
-20
0
-3
0
3
0 10 20 30 40 50 60 70 80
Time (min)µc
al/s
ec
Molar Ratio
kcal
/mol
e of
inje
ctan
t
D
0.0 0.5 1.0 1.5 2.0 2.5
-60
-40
-20
0
-2
0
0 10 20 30 40 50 60 70 80Time (min)
µcal
/sec
Molar Ratio
kcal
/mol
e of
inje
ctan
t B
0 2 4 6 8 10 12 14 16 18
-10-8-6-4-202
-2
0
0 10 20 30 40 50 60 70 80
Time (min)
µcal
/sec
Molar Ratio
kcal
/mol
e of
inje
ctan
t
C
0 2 4 6 8 10 12 14 16 18
-10-8-6-4-20
-4
-2
0
0 10 20 30 40 50 60 70 80Time (min)
µcal
/sec
Molar Ratio
kcal
/mol
e of
inje
ctan
t A
0 2 4 6 8 10 12 14 16 18-1.50.01.5
Res
idua
l
Molar Ratio
Fig. 10. Isothermal titration calorimetery. Plot of enthalpy change against molar ratio for the titration of (A) ANS and (B) bis-ANS to PFI (pH 2.0) of SB at 25 �C (C) and (D) arerespective dilution profiles. The upper panels represent the raw data and the bottom panels are the non-linear best fit data.
A. Qadeer et al. / Archives of Biochemistry and Biophysics 540 (2013) 101–116 111
The titrations were also performed between SDS and naphtha-lene derivatives where former was taken in the sample cell(Fig. S12). The resulting binding isotherms showed a quite insignif-icant heat change which indicates lack of any noticeable interac-tions between SDS and the ANS/bis-ANS.
Molecular docking
It is known that partial unfolding of native conformation of pro-tein is a crucial step in the amyloid aggregation. Some amyloidinhibitors resist this conformational change by stabilizing the na-tive structure of protein [50]. So the binding of naphthalene deriv-atives to SB was also investigated by the complementaryapplication of molecular docking of ANS and bis-ANS on SB withAutodock simulation analysis. Initially a model of SB was gener-ated using molecular modeling approach. The sequence alignment(Fig. S1) and structure superposition (Fig. S2) of the SB model withthe coordinate of the protein used to build the template (2BDZ),pattern of secondary structure content (Fig. S3), distribution of
SB amino acid residues on Ramachandran plot (Fig. S4) and the val-idation values of modeled structure (Table S1) are all compiled inSupplementary material S1.
The results obtained from molecular docking of SB–ANS interac-tion revealed the presence of two putative binding sites with bind-ing constant, K � 104 (Table 4). Fig. 11(1 and 2) shows that thesebinding sites were delineated by several polar and apolar residuesamong which Glu51 at site 1 whereas Gly66 at site 2 interactedwith ANS through both hydrophobic interactions as well as H-bonding. On the other hand, molecular docking of bis-ANS withSB as shown in Fig. 11(3) revealed the involvement of single puta-tive binding site with K value of 1.03 � 106 M�1 (Table 4). Again,the binding site comprised of both polar and apolar residues outof which Asn19 interacted via hydrophobic interaction and H-bonding. It is worth noticing that in both the cases, H-bond forma-tion occurred with the O-atoms of sulfonate moiety which is alsosupported by crystallographic studies of ANS-Mur A enzyme com-plex [51]. In addition, p–p stacking between the aromatic sidechain of Phe29, Trp 67, Tyr 87 and Tyr89 with the naphthalene
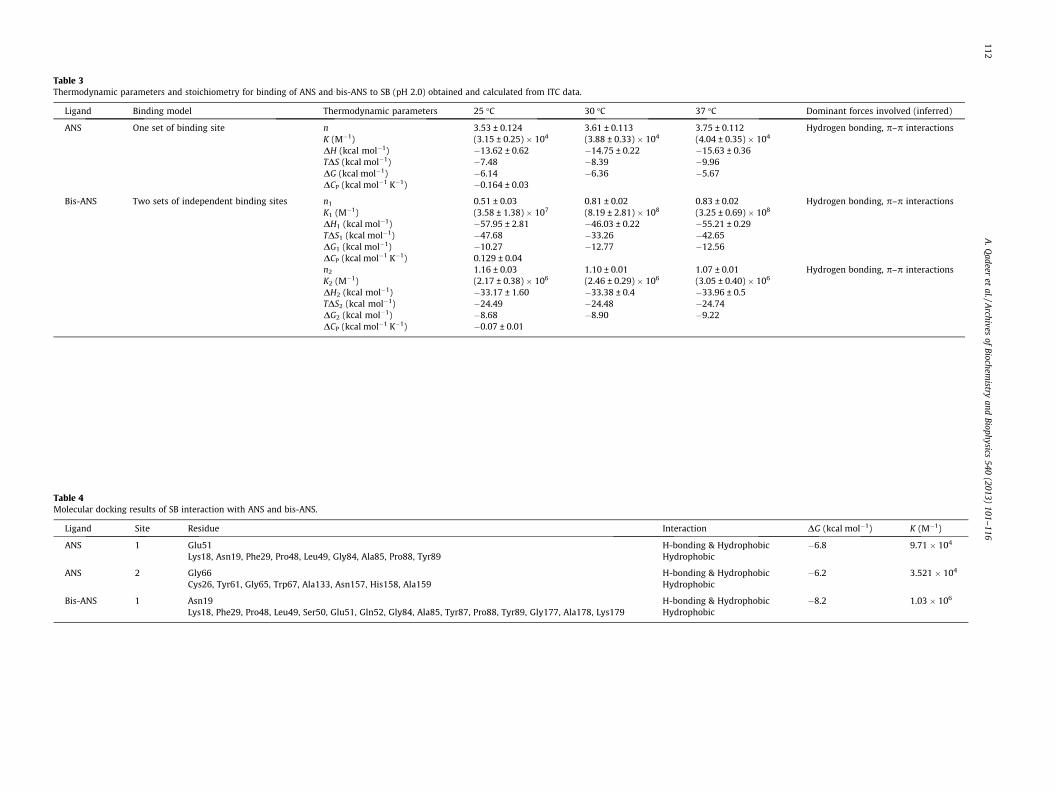
Table 3Thermodynamic parameters and stoichiometry for binding of ANS and bis-ANS to SB (pH 2.0) obtained and calculated from ITC data.
Ligand Binding model Thermodynamic parameters 25 �C 30 �C 37 �C Dominant forces involved (inferred)
ANS One set of binding site n 3.53 ± 0.124 3.61 ± 0.113 3.75 ± 0.112 Hydrogen bonding, p–p interactionsK (M�1) (3.15 ± 0.25) � 104 (3.88 ± 0.33) � 104 (4.04 ± 0.35) � 104
DH (kcal mol�1) �13.62 ± 0.62 �14.75 ± 0.22 �15.63 ± 0.36TDS (kcal mol�1) �7.48 �8.39 �9.96DG (kcal mol�1) �6.14 �6.36 �5.67DCP (kcal mol�1 K�1) �0.164 ± 0.03
Bis-ANS Two sets of independent binding sites n1 0.51 ± 0.03 0.81 ± 0.02 0.83 ± 0.02 Hydrogen bonding, p–p interactionsK1 (M�1) (3.58 ± 1.38) � 107 (8.19 ± 2.81) � 108 (3.25 ± 0.69) � 108
DH1 (kcal mol�1) �57.95 ± 2.81 �46.03 ± 0.22 �55.21 ± 0.29TDS1 (kcal mol�1) �47.68 �33.26 �42.65DG1 (kcal mol�1) �10.27 �12.77 �12.56DCP (kcal mol�1 K�1) 0.129 ± 0.04n2 1.16 ± 0.03 1.10 ± 0.01 1.07 ± 0.01 Hydrogen bonding, p–p interactionsK2 (M�1) (2.17 ± 0.38) � 106 (2.46 ± 0.29) � 106 (3.05 ± 0.40) � 106
DH2 (kcal mol�1) �33.17 ± 1.60 �33.38 ± 0.4 �33.96 ± 0.5TDS2 (kcal mol�1) �24.49 �24.48 �24.74DG2 (kcal mol�1) �8.68 �8.90 �9.22DCP (kcal mol�1 K�1) �0.07 ± 0.01
Table 4Molecular docking results of SB interaction with ANS and bis-ANS.
Ligand Site Residue Interaction DG (kcal mol�1) K (M�1)
ANS 1 Glu51Lys18, Asn19, Phe29, Pro48, Leu49, Gly84, Ala85, Pro88, Tyr89
H-bonding & HydrophobicHydrophobic
�6.8 9.71 � 104
ANS 2 Gly66Cys26, Tyr61, Gly65, Trp67, Ala133, Asn157, His158, Ala159
H-bonding & HydrophobicHydrophobic
�6.2 3.521 � 104
Bis-ANS 1 Asn19Lys18, Phe29, Pro48, Leu49, Ser50, Glu51, Gln52, Gly84, Ala85, Tyr87, Pro88, Tyr89, Gly177, Ala178, Lys179
H-bonding & HydrophobicHydrophobic
�8.2 1.03 � 106
112A
.Qadeer
etal./A
rchivesof
Biochemistry
andBiophysics
540(2013)
101–116
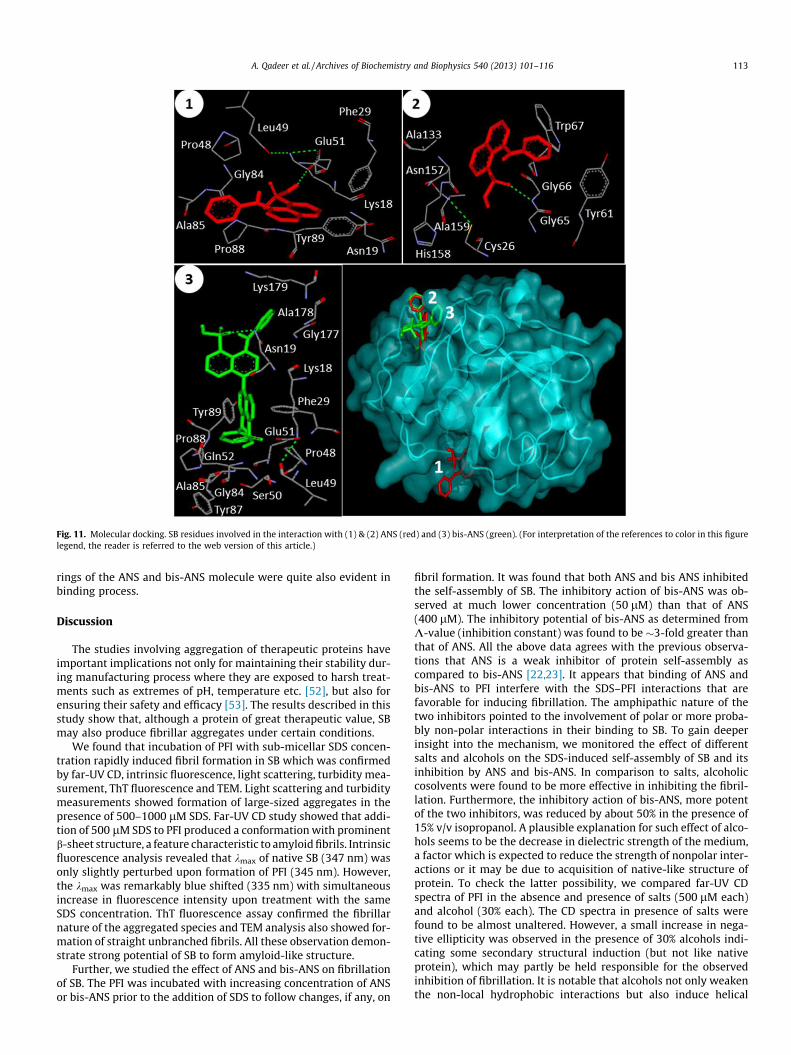
Fig. 11. Molecular docking. SB residues involved in the interaction with (1) & (2) ANS (red) and (3) bis-ANS (green). (For interpretation of the references to color in this figurelegend, the reader is referred to the web version of this article.)
A. Qadeer et al. / Archives of Biochemistry and Biophysics 540 (2013) 101–116 113
rings of the ANS and bis-ANS molecule were quite also evident inbinding process.
Discussion
The studies involving aggregation of therapeutic proteins haveimportant implications not only for maintaining their stability dur-ing manufacturing process where they are exposed to harsh treat-ments such as extremes of pH, temperature etc. [52], but also forensuring their safety and efficacy [53]. The results described in thisstudy show that, although a protein of great therapeutic value, SBmay also produce fibrillar aggregates under certain conditions.
We found that incubation of PFI with sub-micellar SDS concen-tration rapidly induced fibril formation in SB which was confirmedby far-UV CD, intrinsic fluorescence, light scattering, turbidity mea-surement, ThT fluorescence and TEM. Light scattering and turbiditymeasurements showed formation of large-sized aggregates in thepresence of 500–1000 lM SDS. Far-UV CD study showed that addi-tion of 500 lM SDS to PFI produced a conformation with prominentb-sheet structure, a feature characteristic to amyloid fibrils. Intrinsicfluorescence analysis revealed that kmax of native SB (347 nm) wasonly slightly perturbed upon formation of PFI (345 nm). However,the kmax was remarkably blue shifted (335 nm) with simultaneousincrease in fluorescence intensity upon treatment with the sameSDS concentration. ThT fluorescence assay confirmed the fibrillarnature of the aggregated species and TEM analysis also showed for-mation of straight unbranched fibrils. All these observation demon-strate strong potential of SB to form amyloid-like structure.
Further, we studied the effect of ANS and bis-ANS on fibrillationof SB. The PFI was incubated with increasing concentration of ANSor bis-ANS prior to the addition of SDS to follow changes, if any, on
fibril formation. It was found that both ANS and bis ANS inhibitedthe self-assembly of SB. The inhibitory action of bis-ANS was ob-served at much lower concentration (50 lM) than that of ANS(400 lM). The inhibitory potential of bis-ANS as determined fromK-value (inhibition constant) was found to be �3-fold greater thanthat of ANS. All the above data agrees with the previous observa-tions that ANS is a weak inhibitor of protein self-assembly ascompared to bis-ANS [22,23]. It appears that binding of ANS andbis-ANS to PFI interfere with the SDS–PFI interactions that arefavorable for inducing fibrillation. The amphipathic nature of thetwo inhibitors pointed to the involvement of polar or more proba-bly non-polar interactions in their binding to SB. To gain deeperinsight into the mechanism, we monitored the effect of differentsalts and alcohols on the SDS-induced self-assembly of SB and itsinhibition by ANS and bis-ANS. In comparison to salts, alcoholiccosolvents were found to be more effective in inhibiting the fibril-lation. Furthermore, the inhibitory action of bis-ANS, more potentof the two inhibitors, was reduced by about 50% in the presence of15% v/v isopropanol. A plausible explanation for such effect of alco-hols seems to be the decrease in dielectric strength of the medium,a factor which is expected to reduce the strength of nonpolar inter-actions or it may be due to acquisition of native-like structure ofprotein. To check the latter possibility, we compared far-UV CDspectra of PFI in the absence and presence of salts (500 lM each)and alcohol (30% each). The CD spectra in presence of salts werefound to be almost unaltered. However, a small increase in nega-tive ellipticity was observed in the presence of 30% alcohols indi-cating some secondary structural induction (but not like nativeprotein), which may partly be held responsible for the observedinhibition of fibrillation. It is notable that alcohols not only weakenthe non-local hydrophobic interactions but also induce helical

Fig. 12. Schematic illustration of the SDS-induced fibrillation of stem bromeialin and its inhibition by naphthalene derivatives.
114 A. Qadeer et al. / Archives of Biochemistry and Biophysics 540 (2013) 101–116
structure in protein by facilitating intra-chain H-bonding [54] thusmay interfere with inter-polypeptide backbone interactions thatare essential for amyloid formation. This is also supported by theobservation that at post-micellar SDS concentration, the helicity(intra-chain H-bonding) of SB is considerably enhanced whilefibrillation does not occur (Fig. 4A). Nevertheless, the small degreeof structural induction in the presence of alcohols cannot be con-sidered to completely mask the contribution of other factors infibrillation inhibition, such as reduced strength of nonpolar inter-actions between SB and naphthalene derivatives.
In order to acquire knowledge of the mode of interactions be-tween ANS and bis-ANS with SB, we carried out ITC measurements.The ITC binding isotherms obtained for ANS and bis-ANS were fit tosingle and two-independent binding sites respectively. It should benoted that ANS binding to different PFI of a-lactalbumin were re-ported to fit to two-independent binding site model [47,48]. Thisdiscrepancy may be due to the difference in conditions used togenerate the partially folded intermediates as well as variation intheir secondary structure content and tertiary environments. Thethermodynamic parameters extracted from calorimetric studiesrevealed that bis-ANS bound to SB with greater affinity than thatof ANS. Further, binding of both naphthalene derivatives to SB atall temperature studied was accompanied by favorable enthalpicchange (DH < 0) and unfavorable entropic change (DS < 0). This isa usual observation in protein–ligand interaction as a favorablebinding enthalpy essentially results in greater entropic constraintleading to more unfavorable contribution to binding free energy[55]. From the thermodynamic signatures of protein–ligand inter-actions one can determine the type of forces responsible for ligandassociation. It is well described that the uptake/release of waterand ion molecules, the restriction of degrees of freedom, burial ofwater-accessible surface area and hydrophobic interactions sumup to give net entropy contribution. On the other hand, H-bond for-mation and van der Waals interactions sum up to provide net en-thalpy contribution to free energy of association [36,55]. Based onthese findings, we have inferred the forces responsible for corre-sponding PFI-naphthalene derivative interactions as shown in Ta-ble 3. The negative sign in the value of DH and DS suggestsinvolvement of H-bonding and/or p–p stacking since the interac-tions involving delocalized electron cloud of aromatic rings areknown to make significant contribution of negative sign to both
DH and DS [55]. The low dielectric interior of PFI is well suitedfor both hydrogen bond formation as well as aromatic ring stackingbetween ANS/bis-ANS and protein thereby producing significantincrease in enthalpy. The negative DCP values obtained for PFI–ANS and PFI–bisANS (site 2) interactions (Table 3) indicate burialof small amount of non-polar surface upon ligand binding, thoughthe temperature-induced changes in protein conformation willalso contribute to its value [56] while a positive DCP value at site1 for bis-ANS binding suggests a slight exposure of the non-polargroups [47].
We also investigated the binding of ANS and bis-ANS to SBthrough molecular docking studies. The results showed that inaddition to hydrophobic interactions and H-bonding, stacking orp–p interactions between the aromatic rings of ANS/bis-ANS andthose of aromatic amino acid residues of SB were also involvedto a noticeable extent in the binding of ANS and bis-ANS to SB. Ta-ken together, the above results clearly demonstrate binding of ANSand bis-ANS to SB through multiple interactions including hydro-phobic interactions, H-bonding and p–p stacking. The results alsoimply that some or all of these forces may be responsible for theobserved inhibition of fibrillation of SB.
Proposed mechanism of SB fibrillation inhibition by ANS and bis-ANS
Based on the remarkable presence of aromatic residues in sev-eral amyloid-related peptides and proteins, it is hypothesized thatp–p stacking between the aromatic amino acid residues facilitatesmolecular recognition and self-assembly of the polypeptide chainswhich results in amyloid formation [57]. Besides, the frequentoccurrence of aromatic compounds such as polyphenols among po-tential inhibitors of amyloid formation also implies the role of p–pinteractions in the self-assembly of various aggregation pronepolypeptides including Ab, a-synuclein, IAPP etc. [58,59]. Theinhibitors with aromatic rings are likely to interfere with p–pinteractions between the polypeptide chains and cause steric hin-drance that might block the self-assembly process. Additionally, itis proposed that if such inhibitors also contain a charged moietythen, upon binding to the polypeptide, formation of large-sizedaggregates could be inhibited by additional charge–charge repul-sion [60].
A. Qadeer et al. / Archives of Biochemistry and Biophysics 540 (2013) 101–116 115
On the basis of these findings, we propose the plausible mech-anism of inhibition of SB fibrillation by ANS and bis-ANS both ofwhich contain both the aromatic ring structure and carry net neg-ative charge at pH 2.0. The binding of ANS and bis-ANS to SB occursthrough multiple forces including p–p interactions with the ringsof aromatic amino acids. Also, our data demonstrates that ionic-interactions do not have any significant contribution in the bindingprocess which implies that the sulfonate groups of these naphtha-lene derivatives may possibly impart an overall negative charge tothe polypeptide. Thus, the observed inhibition of self-assembly ofSB by these naphthalene derivatives may be a consequence of dis-ruption of p–p interactions between the polypeptide chains, to-gether with anionic electrostatic repulsion among the ANS/bis-ANS bound polypeptide chains. The similar mechanism may alsohold true for ANS/bis-ANS-mediated inhibition of self-assemblyof proteins studied earlier. Furthermore, in case of SDS-inducedfibrillation as in the present study, additional electrostatic repul-sion between (negatively charged) SDS molecules and ANS/bis-ANS bound polypeptide chains may also contribute to the overallinhibition.
Fig. 12 summarizes the major findings of the present study in aschematic form. Native state of SB (pH 7.4) undergoes conforma-tional changes under acidic conditions and acquires partiallyfolded state at pH 2.0. Addition of sub-micellar concentration ofSDS to this PFI induces formation of fibrillar aggregates in protein.The process of fibrillation is inhibited upon pre-incubation of thePFI with naphthalene derivatives. ANS is a weak inhibitor of SBself-assembly compared to bis-ANS. The overall inhibition of fibril-lation occurs through interference with the p–p interactions thatare crucial for fibrillation, along with inter-polypeptide chainrepulsion.
Conclusion
We studied the effect of increasing concentration of SDS on PFIof SB, a phytotherapeutic protein. Whereas sub-micellar SDS con-centration induced formation of amyloid-like fibrils in SB, thepost-micellar SDS concentration could not generate such effect. Gi-ven the formation of PFI at pH 2.0 (as in the gastrointestinal tract)and its potential to form fibrillar aggregates upon interaction withSDS, a membrane mimetic, the study described herein suggeststhat SB should be examined for its in vivo aggregation and influ-ences of such behavior, if any, on host. Besides, care should beexercised in the use of excipients while preparing pharmaceuticalformulation of SB. Furthermore, we observed that addition of50 lM bis-ANS or 400 lM ANS significantly inhibited the self-assembly of protein. The study also highlights the fact that hydro-phobic interactions are not the sole determinant of fibrillationinhibition exerted by ANS and bis-ANS. In fact, p–p interactionsalso play an important role in inhibiting the self-assembly of SBby these naphthalene derivative.
Acknowledgments
Facilities provided by Interdisciplinary Biotechnology Unit,AMU, Aligarh are gratefully acknowledged. We are thankful toCouncil of Scientific and Industrial Research (CSIR) for providingSenior Research Fellowship to A.Q. The G.B. is also thankful toKSU for project number RGP-VPP-078. RHK is thankful to DBTand DST for project numbers BT/PR 13194/10/742/2009 and SR/SO/BB-0018/2011 respectively.
Appendix A. Supplementary data
Description of molecular modeling of SB (Supplementary Mate-rial S1), multiple sequence alignment of SB with its templates
(Fig. S1), superimposed structures of SB model with the corre-sponding templates (Fig. S2), pattern of secondary structure con-tent (Fig. S3), distribution of SB amino acid residues onRamachandran plot (Fig. S4), validation values of modeled struc-ture (Table S1), comparison of ANS binding with modeled andPDB structures (FigS5), near-UV CD spectra of SB at post-micellarSDS concentration (Fig. S6), CMC determination in presence ofadditives (Fig. S7, Table S2), determination of Kiapp for ANS andbis-ANS (Fig. S8), far-UV CD spectra of PFI in presence of saltsand alcohols (Fig. S9), ITC thermograms for ANS and bis-ANS(Fig. S10), Job’s plot (Fig. S11), Calorimetric titration of SDS withANS/bis-ANS (Fig. S12). Supplementary data associated with thisarticle can be found, in the online version, at http://dx.doi.org/10.1016/j.abb.2013.10.015.
References
[1] W.E. Balch, R.I. Morimoto, A. Dillin, J.W. Kelly, Science 319 (2008) 916–919.[2] A. Aguzzi, T. O’Connor, Nat. Rev. Drug Discov. 9 (2010) 237–248.[3] C.M. Dobson, Nature 426 (2003) 884–890.[4] E. De Lorenzi, S. Giorgetti, S. Grossi, G. Merlini, G. Caccialanza, V. Bellotti, Curr.
Med. Chem. 11 (2004) 1065–1084.[5] A.J. Barrett, N.D. Rawlings, J.F. Woessner, Handbook of Proteolytic Enzymes,
second ed., Academic Press, London, 2004. p. 1136.[6] S. Mahajan, V. Chandra, S. Dave, R. Nanduri, P. Gupta, J. Infect. Dis. 206 (2012)
366–376.[7] R. Baez, M.T. Lopes, C.E. Salas, M. Hernandez, Planta Med. 73 (2007) 1377–
1383.[8] H.R. Maurer, Cell. Mol. Life Sci. 58 (2001) 1234–1245.[9] J. Seifert, R. Ganser, W. Brendel, Z. Gastroenterol. 17 (1979) 1–8.
[10] V. Grabovac, A. Bernkop-Schnurch, Int. J. Pharm. 326 (2006) 153–159.[11] S.K. Haq, S. Rasheedi, R.H. Khan, Eur. J. Biochem. 269 (2002) 47–52.[12] R. Khurana, J.R. Gillespie, A. Talapatra, L.J. Minert, C. Ionescu-Zanetti, I. Millett,
A.L. Fink, Biochemistry 40 (2001) 3525–3535.[13] K. Matsuzaki, Int. J. Alzheimers Dis. 2011 (2011) 956104.[14] M. Bucciantini, D. Nosi, M. Forzan, E. Russo, M. Calamai, L. Pieri, L. Formigli, F.
Quercioli, S. Soria, F. Pavone, J. Savistchenko, R. Melki, M. Stefani, FASEB J. 26(2012) 818–831.
[15] T.A. Pertinhez, M. Bouchard, R.A. Smith, C.M. Dobson, L.J. Smith, FEBS Lett. 529(2002) 193–197.
[16] V. Rangachari, B.D. Moore, D.K. Reed, L.K. Sonoda, A.W. Bridges, E. Conboy, D.Hartigan, T.L. Rosenberry, Biochemistry 46 (2007) 12451–12462.
[17] L. Giehm, C.L. Oliveira, G. Christiansen, J.S. Pedersen, D.E. Otzen, J. Mol. Biol.401 (2010) 115–133.
[18] J.M. Khan, A. Qadeer, S.K. Chaturvedi, E. Ahmad, S.A. Rehman, S. Gourinath, R.H.Khan, PLoS One 7 (2012) e29694.
[19] R.M. Garavito, S. Ferguson-Miller, J. Biol. Chem. 276 (2001) 32403–32406.[20] A. Hawe, M. Sutter, W. Jiskoot, Pharm. Res. 25 (2008) 1487–1499.[21] Y. Cordeiro, L.M. Lima, M.P. Gomes, D. Foguel, J.L. Silva, J. Biol. Chem. 279
(2004) 5346–5352.[22] X. Fu, X. Zhang, Z. Chang, Biochem. Biophys. Res. Commun. 329 (2005) 1087–
1093.[23] B. Kundu, P. Guptasarma, Proteins 37 (1999) 321–324.[24] S. Dave, S. Mahajan, V. Chandra, H.K. Dkhar, H.K. Sambhavi, P. Gupta, Arch.
Biochem. Biophys. 499 (2010) 26–31.[25] T. Murachi, Methods Enzymol. 19 (1970) 273–284.[26] A. Qadeer, G. Rabbani, N. Zaidi, E. Ahmad, J.M. Khan, R.H. Khan, PLoS One 7
(2012) e50633.[27] K. Sudhakar, P.J. Fay, J. Biol. Chem. 271 (1996) 23015–23021.[28] N. Jain, M. Bhattacharya, S. Mukhopadhyay, J. Fluoresc. 21 (2011) 615–625.[29] Q. Xiao, S. Huang, Z.D. Qi, B. Zhou, Z.K. He, Y. Liu, Biochim. Biophys. Acta 1784
(2008) 1020–1027.[30] P.L. Privalov, S.A. Potekhin, Methods Enzymol. 131 (1986) 4–51.[31] L.A. Kelley, M.J. Sternberg, Nat. Protoc. 4 (2009) 363–371.[32] O. Trott, A.J. Olson, J. Comput. Chem. 31 (2010) 455–461.[33] D.S.M.E. Accelrys Software Inc., Release 3.5, San Diego: Accelrys Software Inc.,
2012.[34] D. Wl, The PyMOL Molecular Graphics System, DeLano Scientific, San Carlos,
CA, USA, 2002.[35] M.P. Martin, R. Alam, S. Betzi, D.J. Ingles, J.Y. Zhu, E. Schonbrunn,
ChemBioChem 13 (2012) 2128–2136.[36] E. Ahmad, G. Rabbani, N. Zaidi, S. Singh, M. Rehan, M.M. Khan, S.K. Rahman, Z.
Quadri, M. Shadab, M.T. Ashraf, N. Subbarao, R. Bhat, R.H. Khan, PLoS ONE 6(2011) e26186.
[37] D. Otzen, Biochim. Biophys. Acta 1814 (2011) 562–591.[38] M.R. Krebs, E.H. Bromley, A.M. Donald, J. Struct. Biol. 149 (2005) 30–37.[39] R. Bhattacharya, D. Bhattacharyya, Biochim. Biophys. Acta 1794 (2009) 698–
708.[40] S. Dave, H.K. Dkhar, M.P. Singh, G. Gupta, V. Chandra, S. Mahajan, P. Gupta, Int.
J. Biochem. Cell Biol. 42 (2010) 938–947.
116 A. Qadeer et al. / Archives of Biochemistry and Biophysics 540 (2013) 101–116
[41] A. Ritonja, A.D. Rowan, D.J. Buttle, N.D. Rawlings, V. Turk, A.J. Barrett, FEBS Lett.247 (1989) 419–424.
[42] Y.T. Hung, M.S. Lin, W.Y. Chen, S.S. Wang, Colloids Surf. B Biointerfaces 81(2010) 141–151.
[43] N. Motamedi-Shad, T. Garfagnini, A. Penco, A. Relini, F. Fogolari, A. Corazza, G.Esposito, F. Bemporad, F. Chiti, Nat. Struct. Mol. Biol. 19 (547–554) (2012)S541–542.
[44] K. Ito, K. Chiba, M. Horikawa, M. Ishigami, N. Mizuno, J. Aoki, Y. Gotoh, T.Iwatsubo, S. Kanamitsu, M. Kato, I. Kawahara, K. Niinuma, A. Nishino, N. Sato,Y. Tsukamoto, K. Ueda, T. Itoh, Y. Sugiyama, AAPS PharmSci 4 (2002) E25.
[45] A. Abelein, B. Bolognesi, C.M. Dobson, A. Graslund, C. Lendel, Biochemistry 51(2012) 126–137.
[46] O.K. Gasymov, B.J. Glasgow, Biochim. Biophys. Acta 1774 (2007) 403–411.[47] N.K. Ruchika Sharma, J. Chem. Thermodynamics 40 (2008) 1141–1151.[48] P.P. Misra, N. Kishore, J. Colloid Interface Sci. 354 (2011) 234–247.
[49] H. Bisswanger, WILEY-VCH Verlag GmbH, Weinheim, 2002.[50] G. Soldi, G. Plakoutsi, N. Taddei, F. Chiti, J. Med. Chem. 49 (2006) 6057–6064.[51] E. Schonbrunn, S. Eschenburg, K. Luger, W. Kabsch, N. Amrhein, Proc. Natl.
Acad. Sci. USA 97 (2000) 6345–6349.[52] W. Wang, S. Nema, D. Teagarden, Int. J. Pharm. 390 (2010) 89–99.[53] B. Demeule, C. Palais, G. Machaidze, R. Gurny, T. Arvinte, MAbs 1 (2009) 142–
150.[54] S. Fatima, B. Ahmad, R.H. Khan, Arch. Biochem. Biophys. 454 (2006) 170–180.[55] P.D. Ross, S. Subramanian, Biochemistry 20 (1981) 3096–3102.[56] S.K. Singh, N. Kishore, Biopolymers 83 (2006) 205–212.[57] E. Gazit, FASEB J. 16 (2002) 77–83.[58] Y. Porat, A. Abramowitz, E. Gazit, Chem. Biol. Drug Des. 67 (2006) 27–37.[59] S. Bastianetto, S. Krantic, R. Quirion, Mini Rev. Med. Chem. 8 (2008) 429–435.[60] E. Ahmad, A. Ahmad, S. Singh, M. Arshad, A.H. Khan, R.H. Khan, Biochimie 93
(2011) 793–805.