Computer aided-diagnosis of prostate cancer on multiparametric MRI: a technical review of current...
12
Review Article Computer Aided-Diagnosis of Prostate Cancer on Multiparametric MRI: A Technical Review of Current Research Shijun Wang, 1 Karen Burtt, 1 Baris Turkbey, 2 Peter Choyke, 2 and Ronald M. Summers 1 1 Imaging Biomarkers and Computer-Aided Diagnosis Laboratory, Radiology and Imaging Sciences, Clinical Center, National Institutes of Health, Building 10, Room 1C224, Bethesda, MD 20892-1182, USA 2 Molecular Imaging Program, National Cancer Institute, National Institutes of Health, Building 10, Room B3B69F, Bethesda, MD 20892-1088, USA Correspondence should be addressed to Ronald M. Summers; [email protected] Received 27 May 2014; Accepted 28 August 2014; Published 1 December 2014 Academic Editor: Tarık Esen Copyright © 2014 Shijun Wang et al. is is an open access article distributed under the Creative Commons Attribution License, which permits unrestricted use, distribution, and reproduction in any medium, provided the original work is properly cited. Prostate cancer (PCa) is the most commonly diagnosed cancer among men in the United States. In this paper, we survey computer aided-diagnosis (CADx) systems that use multiparametric magnetic resonance imaging (MP-MRI) for detection and diagnosis of prostate cancer. We review and list mainstream techniques that are commonly utilized in image segmentation, registration, feature extraction, and classification. e performances of 15 state-of-the-art prostate CADx systems are compared through the area under their receiver operating characteristic curves (AUC). Challenges and potential directions to further the research of prostate CADx are discussed in this paper. Further improvements should be investigated to make prostate CADx systems useful in clinical practice. 1. Introduction Twenty-eight percent of cancers in men occur in the prostate, making prostate cancer (PCa) and its detection a priority in cancer research [1]. Approximately 16% of men will be diagnosed with PCa within their lifetime [1]. Despite a steady and consistent increase in five-year survival rates from 66.0% (1975) to 99.6% (2005), PCa remains a major healthcare problem in the United States [2]. e reduction in mortality is widely attributed to early cancer detection and improvements in treatment. Because digital rectal examination (DRE) is only effective for iden- tifying posterior peripheral zone tumors, it failed to detect many tumors that originated in the anterior peripheral zone, central zone, and transitional zones [3] as well as tumors that were too small to be palpated. Prostate-specific antigen (PSA) testing became a com- mon method of screening in the early 1990s and has since proven to be very controversial. Several large PSA screening trials have shown reduction in the risk of death due to PCa [4–6]. However, other large studies found conflicting results, reporting that PSA screening had no significant effect on PCa death rate [7, 8]. e United States Preventive Services Task Force (USPSTF) awarded PSA screening the letter grade of “D.” is has resulted in a trend away from its use in the USA. Random systematic (sextant) biopsies under transrectal ultrasound (TRUS) guidance of the prostate are prone to discovering small, low grade cancers that may ultimately lead to treatment even though they are unlikely to result in death. Moreover, the random biopsy method is prone to low sensitivity in detecting clinically significant tumors [9–12]. Although TRUS is more convenient than MP-MRI and has a lower cost, its low sensitivity makes it unsuitable for screening a large patient population [13]. As a result of these limits, endorectal magnetic resonance (MR) imaging contributes significant value to PSA, DRE, and biopsy findings by localizing cancer and by assessing its size and extension [14, 15]. e ROC curve for localization of cancer is higher for endorectal imaging than for DRE in the apex, midgland, and base. Likewise, endorectal MR imaging is more accurate than TRUS-guided biopsy in tumor localization in the midgland and base of the prostate [16]. However, MRI is insensitive to whether the cancer has metas- tasized to the lymph nodes and is only somewhat accurate in Hindawi Publishing Corporation BioMed Research International Volume 2014, Article ID 789561, 11 pages http://dx.doi.org/10.1155/2014/789561
-
Upload
independent -
Category
Documents
-
view
0 -
download
0
Transcript of Computer aided-diagnosis of prostate cancer on multiparametric MRI: a technical review of current...

Review ArticleComputer Aided-Diagnosis of Prostate Cancer onMultiparametric MRI: A Technical Review of Current Research
Shijun Wang,1 Karen Burtt,1 Baris Turkbey,2 Peter Choyke,2 and Ronald M. Summers1
1 Imaging Biomarkers and Computer-Aided Diagnosis Laboratory, Radiology and Imaging Sciences, Clinical Center,National Institutes of Health, Building 10, Room 1C224, Bethesda, MD 20892-1182, USA
2Molecular Imaging Program, National Cancer Institute, National Institutes of Health, Building 10, Room B3B69F, Bethesda,MD 20892-1088, USA
Correspondence should be addressed to Ronald M. Summers; [email protected]
Received 27 May 2014; Accepted 28 August 2014; Published 1 December 2014
Academic Editor: Tarık Esen
Copyright © 2014 Shijun Wang et al. This is an open access article distributed under the Creative Commons Attribution License,which permits unrestricted use, distribution, and reproduction in any medium, provided the original work is properly cited.
Prostate cancer (PCa) is the most commonly diagnosed cancer among men in the United States. In this paper, we survey computeraided-diagnosis (CADx) systems that use multiparametric magnetic resonance imaging (MP-MRI) for detection and diagnosis ofprostate cancer. We review and list mainstream techniques that are commonly utilized in image segmentation, registration, featureextraction, and classification.The performances of 15 state-of-the-art prostate CADx systems are compared through the area undertheir receiver operating characteristic curves (AUC). Challenges and potential directions to further the research of prostate CADxare discussed in this paper. Further improvements should be investigated tomake prostate CADx systems useful in clinical practice.
1. Introduction
Twenty-eight percent of cancers inmen occur in the prostate,making prostate cancer (PCa) and its detection a priorityin cancer research [1]. Approximately 16% of men will bediagnosed with PCa within their lifetime [1]. Despite a steadyand consistent increase in five-year survival rates from 66.0%(1975) to 99.6% (2005), PCa remains a major healthcareproblem in the United States [2].
The reduction in mortality is widely attributed to earlycancer detection and improvements in treatment. Becausedigital rectal examination (DRE) is only effective for iden-tifying posterior peripheral zone tumors, it failed to detectmany tumors that originated in the anterior peripheral zone,central zone, and transitional zones [3] as well as tumors thatwere too small to be palpated.
Prostate-specific antigen (PSA) testing became a com-mon method of screening in the early 1990s and has sinceproven to be very controversial. Several large PSA screeningtrials have shown reduction in the risk of death due to PCa[4–6]. However, other large studies found conflicting results,reporting that PSA screening had no significant effect on PCa
death rate [7, 8]. The United States Preventive Services TaskForce (USPSTF) awarded PSA screening the letter grade of“D.”This has resulted in a trend away from its use in the USA.
Random systematic (sextant) biopsies under transrectalultrasound (TRUS) guidance of the prostate are prone todiscovering small, low grade cancers that may ultimatelylead to treatment even though they are unlikely to result indeath. Moreover, the random biopsy method is prone to lowsensitivity in detecting clinically significant tumors [9–12].Although TRUS is more convenient than MP-MRI and has alower cost, its low sensitivitymakes it unsuitable for screeninga large patient population [13].
As a result of these limits, endorectal magnetic resonance(MR) imaging contributes significant value to PSA, DRE,and biopsy findings by localizing cancer and by assessing itssize and extension [14, 15]. The ROC curve for localizationof cancer is higher for endorectal imaging than for DREin the apex, midgland, and base. Likewise, endorectal MRimaging is more accurate than TRUS-guided biopsy in tumorlocalization in the midgland and base of the prostate [16].However,MRI is insensitive to whether the cancer hasmetas-tasized to the lymph nodes and is only somewhat accurate in
Hindawi Publishing CorporationBioMed Research InternationalVolume 2014, Article ID 789561, 11 pageshttp://dx.doi.org/10.1155/2014/789561
2 BioMed Research International
predicting if the cancer has penetrated the prostate capsule[17]. A number of structures and conditions—includingBPH nodules, prostatitis, and hemorrhage—show similarenhancement patterns to PCa on dynamic contrast-enhanced(DCE) MR images and therefore compromise the specificityof image analysis [18].
2. Clinical Advances in Multiparametric MRIfor Prostate Cancer Diagnosis
Multiparametric (MP) magnetic resonance imaging (MRI)may improve the diagnosis and the care of PCa patientsby providing morphological and functional informationabout the prostate. MRI sequences shown to correlatewith properties associated with PCa include T2-weightedimaging (T2WI), diffusion-weighted imaging (DWI), MRspectroscopy, and dynamic contrast-enhanced (DCE) MRI[19–25]. MP-MRI is especially effective in revealing anteriorprostate cancer in men with negative random transrectal 12-core biopsy [26]. In such cases, MP-MRI is beneficial forselecting men who should undergo anterior biopsy. Suchan approach increases the positive predictive power of PCadiagnosis [27]. It is therefore highly recommended thatMP-MRI is used rather than a single MRI modality whenassessing a patient for prostate lesions.
By fusing endorectal coil MR images to a preprocedureTRUS using electromagnetic needle tracking, biopsies maybe directed to suspicious lesions and the location of biopsiesmay be documented [28]. Targeted prostate biopsy with MP-MRI guidance has been shown to improve the sensitivityof prostate cancer detection when compared with randombiopsy [29, 30]. MP-MRI/ultrasound image fusion reducesthe number of required biopsies while also reducing thediagnosis of clinically insignificant cancer [31]. Initially,endorectal coils were used during MP-MRI to increasethe signal-to-noise ratio (SNR). However, as MP-MRI hasbecome more widespread and technology has improved,endorectal coils are no longer consistently used and the costsassociated with them are avoided [32]. Futterer et al. foundAUC to be significantly higher when endorectal coils wereusedwhen comparedwith pelvic coils [33]. Similarly, Turkbeyet al. found that more cancer foci were detected using dual-coil prostate MRI than when nonendorectal coil MRI wasused at 3T [34]. However, Bratan et al. contends this claimwith findings that the field strength and the type of imagingcoils used have no significant influence on the detection rateof tumors [35]. As technology evolves it is likely that there willbe a decreasing need for endorectal coils.
3. Computer Aided-Diagnosis forProstate Cancer
InterpretingMRI requires a high level of expertise and is timeconsuming. Significant interobserver variation and a lack ofsensitivity, specificity, and accuracy exist for radiologists ininterpreting the volume and stage of lesions in prostate MRI[36–38].
MultiparametricMRI
T2WI ADC Ktrans· · ·
Registration
Prostate CADx workflow
Diagnosis results
Classification
Feature extraction
Candidate generation
Segmentation(prostate, central gland)
Preprocessing
(T2WI, ADC, Ktrans, etc.)
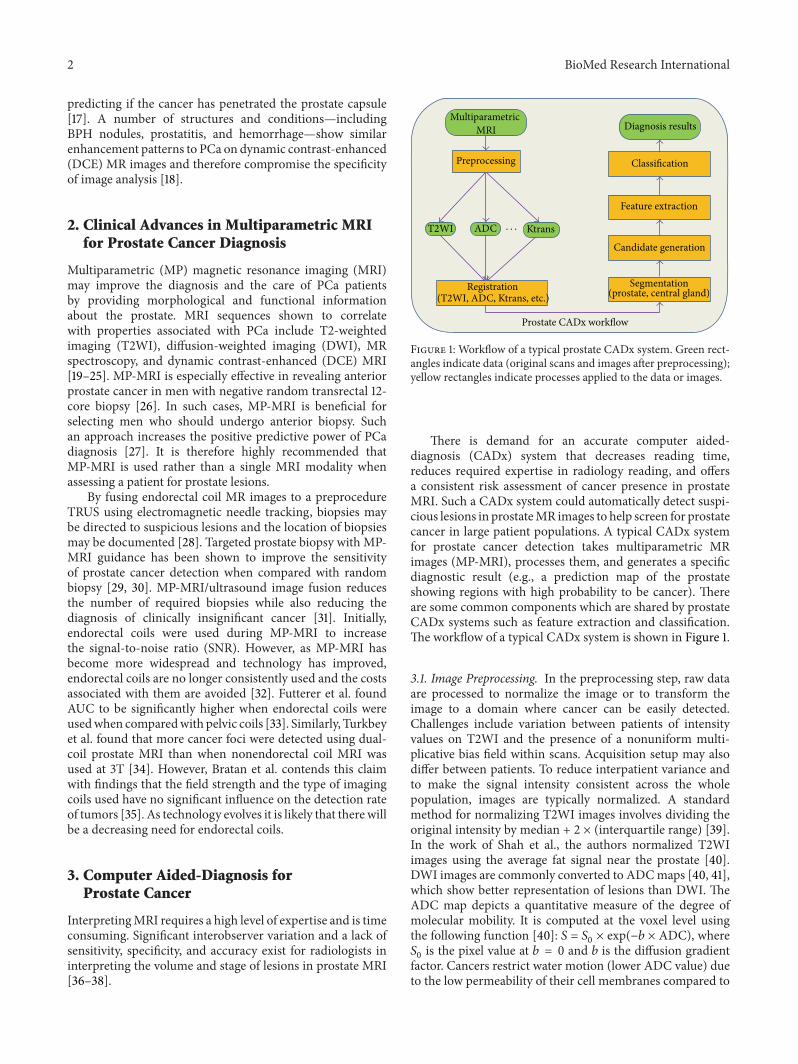
Figure 1: Workflow of a typical prostate CADx system. Green rect-angles indicate data (original scans and images after preprocessing);yellow rectangles indicate processes applied to the data or images.
There is demand for an accurate computer aided-diagnosis (CADx) system that decreases reading time,reduces required expertise in radiology reading, and offersa consistent risk assessment of cancer presence in prostateMRI. Such a CADx system could automatically detect suspi-cious lesions in prostateMR images to help screen for prostatecancer in large patient populations. A typical CADx systemfor prostate cancer detection takes multiparametric MRimages (MP-MRI), processes them, and generates a specificdiagnostic result (e.g., a prediction map of the prostateshowing regions with high probability to be cancer). Thereare some common components which are shared by prostateCADx systems such as feature extraction and classification.The workflow of a typical CADx system is shown in Figure 1.
3.1. Image Preprocessing. In the preprocessing step, raw dataare processed to normalize the image or to transform theimage to a domain where cancer can be easily detected.Challenges include variation between patients of intensityvalues on T2WI and the presence of a nonuniform multi-plicative bias field within scans. Acquisition setup may alsodiffer between patients. To reduce interpatient variance andto make the signal intensity consistent across the wholepopulation, images are typically normalized. A standardmethod for normalizing T2WI images involves dividing theoriginal intensity by median + 2 × (interquartile range) [39].In the work of Shah et al., the authors normalized T2WIimages using the average fat signal near the prostate [40].DWI images are commonly converted to ADCmaps [40, 41],which show better representation of lesions than DWI. TheADC map depicts a quantitative measure of the degree ofmolecular mobility. It is computed at the voxel level usingthe following function [40]: 𝑆 = 𝑆
0× exp(−𝑏 × ADC), where
𝑆0is the pixel value at 𝑏 = 0 and 𝑏 is the diffusion gradient
factor. Cancers restrict water motion (lower ADC value) dueto the low permeability of their cell membranes compared to

BioMed Research International 3
normal tissue where water motion is relatively higher (highADC value).
3.2. Segmentation. The prostate must be segmented fromthe image prior to further analysis. An accurate prostatesegmentation may assist in guiding radiotherapy, biopsy,and focal therapy in addition to its application in diagnosis.Because T2WI shows more detailed anatomical structures ofthe prostate than other MR sequences, it is widely used forsegmentation of the prostate. After registration, the prostatesegmentation can be applied to other image sequences.
Segmenting the prostate from T2WI is a challengingproblem. The boundary between the prostate and the sur-rounding tissues can be difficult to locate. Even for expe-rienced radiologists, the interobserver variability of manualprostate segmentation is large. MR scans from different med-ical centers or institutes may have considerable differencesbased on the imaging protocols employed. For instance,endorectal coils induce deformations that cause scans toappear different than those using no such coil.
Atlas-based registration is a mainstream method forsegmenting the prostate on MRI. Klein et al. proposeda segmentation method based on nonrigid registration ofa set of 3D labeled atlas images using localized mutualinformation [42]. Martin et al. proposed a two-step approachfor automated prostate segmentation [43]. In the first stage,a probabilistic prostate atlas was employed to estimate arough localization of the prostate; in the second stage, aspatially constrained deformable model was refined towardthe prostate boundary. To evaluate atlas-based automaticand semiautomatic segmentation strategies for prostate MRI,Martin et al. conducted a multiphase validation study whichassessed both segmentation time and accuracy [44]. A Dicesimilarity coefficient, comparing the spatial overlap of voxelsin two volumes, was reported as 0.94 for the autosegmentedcontours with pre- and postmanual edits. Using the N pointsstrategy reduced segmentation time by 49% when comparedwith manual segmentation.
Deformable models segment the prostate through theinfluence of internal forces which smooth the boundary andexternal forces which move the model toward the objectboundary. Chandra et al. proposed a fast segmentationmethod based on a case specific deformable model for MRprostate scans without an endorectal coil [45]. Yin et al.employed a two-step approach for fully automated and robustprostate segmentation: first, the prostate region is detectedbased on the cross correlation of normalized gradient fields;second, a prostate mean shape model is refined by means of agraph-search framework [46]. Deformable models are usefulwhen noise and sampling artifacts result in invalid objectboundaries.
The graph-cut algorithm may be used to find a globallyoptimal solution to a segmentation problem. Mahapatra andBuhmann proposed a prostate MRI segmentation algorithmusing learned semantic knowledge and graph cuts [47]. Toidentify volume of interest (VOI), they employed supervoxelsegmentation and used random forest to estimate the locationof the prostate. A second set of random forest classifiers wastrained and applied based on image and context features to
refine VOI probability at the voxel level. A Markov randomfield was built and optimized using graph cuts to get the finalsegmentation of the prostate. A Dice metric of 81.2 ± 4.5%indicates that using the graph-cut algorithm with semanticknowledge is an effective segmentation technique, althoughthis value was lower than for equivalent segmentation sys-tems that were cited.
To compare state-of-the-art prostate segmentation meth-ods, a prostate segmentation challenge workshop was setup and hosted by the MICCAI 2012 conference [48]. Thischallenge provided a dataset of 100 prostate MR cases from4 different centers, with differences in scanner manufac-turer, field strength, and protocol. 11 teams with academicresearch or industry backgrounds participated in the chal-lenge. The Imorphics and ScrAutoProstate teams achievedthe highest overall scores of 85.72 and 84.29, respectively.The overall score is a mapping function which incorporatescompletely different but equally important metrics like Dicecoefficient and average boundary distance, defined as themean minimum distance between the manually segmentedground truth and automatically segmented boundary. Imor-phics’ algorithm is based on the active appearance model;ScrAutoProstate’s algorithm is a region-specific hierarchicalsegmentation method using discriminative learning. Algo-rithms of both teams showed significantly better results whencompared with other teams’ algorithms. The final results,although promising, showed that the prostate segmentationproblem is still unresolved.
3.3. Registration. Image registration methods have becomean essential part of radiological imaging in the last decade.Because prostate cancer shows different characteristics onmultiparametric MRI, ultrasound and whole mount histol-ogy, analyzing a fusion of all modalities, lead to a betterdiagnosis of prostate cancer. Patient movement during MRIresults in translation and distortion of the prostate, whichmust be corrected for by registering MRI sequences toeach other before feature extraction and classification. 3Dimages must be registered before information from differentmodalities/sequences is fused.
Currently, pathological analysis of prostatectomy speci-mens is the reference standard for determining the groundtruth of prostate cancer. In order to transfer the labelsfrom pathology to MP-MRI, MR images must be registeredwith pathological sections of the prostate. The nature of thepathological sections is quite different from that of the MRIsections. For instance, the MRI section is typically 3mmthick whereas the pathologic section represents a 5𝜇m thicksubsample of the larger 3–5mm thick slice. This contributesto the difficulty of designing accurate registration algorithms.Mazaheri et al. proposed a free-form deformation algorithmbased on B-splines for registration of prostate MR images topathological slices [49]. As a result of registration, Dice valuesincreased from 0.86, 0.65, and 0.89 to 0.99, 0.89, and 0.97for the WP, PZ, and TZ, respectively. While this method wassuccessful for in-slice registration of the T2WI imagewith thepathological slice, slices had to be matched manually.
To register T2WI, ADC, DCE, and whole mounthistology (WMH) images, Chappelow et al. proposed an

4 BioMed Research International
automated elastic registrationmethod utilizing amultivariateformulation of mutual information of data from all modal-ities [50]. Their technique improved the accuracy of register-ing in vivo MP-MRI and ex vivo WMH of the prostate whencompared to prior approaches based on mutual information.
In the work of Liu et al., T2WI, ADC images, andKtrans maps were registered using coordinate informationstored in the DICOM image headers [39]. Each image slicewas considered as a plane with an origin and orientationgiven in the header information. To match correspondingvoxels, voxels in the most highly resolved series (T2WI)were projected onto the closest slice of the other imagingmodalities. This is a simple registration method which iseffective when deformation of the prostate is minor enoughto not warrant a registration algorithm.
The optimal registration method for MR images dependslargely on the imaging protocol. A simple registrationmethod, such as that used in Liu et al. [39], is often adequatewhen patient motion is minimal. However, uncomfortableprotocols (i.e., endorectal coil use) or protocols with a longtime frame (i.e., DCE imaging) increase the likelihood thatconsiderable patient movement will occur and result in thetranslation of the prostate. This necessitates the use of moreadvanced registration techniques.
3.4. Feature Extraction. Extracting distinctive features fromtargets of interest is a key characteristic of a successfulCADx system. Typical features for medical images includevolume, shape, texture, intensity, and various statistics. Manyadvanced classification techniques have been developedfor machine learning. In theory, support vector machines(SVMs) could achieve the highest performance (global opti-mal) based on the maximization of the margin betweenpositive and negative training samples. In practice, however,choosing which features are fed into the classifier is moreimportant than choosing the classifier itself.
Designing an effective image feature set plays an impor-tant role in a CADx system. Because ADC maps detectprostate cancer better than other multiparametric MRimages, research in the use of these maps is on the rise. Penget al. studied ADC maps and used the 10th percentile andaverage ADC values as features [51]. Experimental resultsshowed that when these features were combined with theT2WI signal intensity histogram skewness and the Tofts𝐾
transmap, theCADsystemachieved anAUCof 0.95±0.02 inthe differentiation of prostate cancer from normal foci. Thisoutcome is currently the highest performance reported in theliterature.
Diffusion tensor MR imaging (DTI) is a useful toolfor prostate cancer detection. DWI and DTI characterizethe dephasing of the MR signal as it relates to moleculardiffusion. Pathological changes such as increases in cellulardensity caused by the prostate cancer can decrease the signalintensity in ADC and the average diffusivity ⟨𝐷⟩ valuesin DTI. In DTI, structural changes caused by the prostatecancer can be shown by fractional anisotropy (FA). Moradiet al. conducted research on the detection and grading ofdominant prostate tumors using DCE and DTI scans [52].They employed 5 features: 𝐾trans, V
𝑒and V
𝑝extracted from
DCE, and ⟨𝐷⟩ and FA extracted from DTI. An AUC of0.96 for this work indicates that DTI may offer informationwith high diagnostic quality for feature selection. However,in their experiment, ROIs were selected manually which maybias the performance. Systems relying on manual ROIs orbiopsy locations for candidate generation are semiautomaticCADx systems. Candidate generation, or the process ofidentifying potentially suspicious regions for analysis, mustbe accomplished algorithmically for the CADx system tobe considered fully automated. Developing a fully automaticCADx system with minimal radiologist intervention is akey factor in the successful deployment of a prostate CADxsystem.
When feature selection and dimensionality reduction isutilized, classification performance improves asmore featuresare extracted from lesion candidates. In the work of Niafet al., the authors extensively studied feature extraction forPZ cancer diagnosis on T2WI, DWI, and DCE images [53].140 features were extracted from lesion candidates on MP-MR images. These features were split into two groups: imagefeatures and functional features. Image features includedgrey-level, texture, and gradient features. Intensity values ofthree MP-MR images were directly used as grey-level fea-tures. First-order texture features—mean, median, standarddeviation, and average deviation—were computed from alocal 9 × 9 window. 19 second-order texture features werederived from the grey-level cooccurrence matrix (GLCM).These texture features characterized homogeneity, grey-leveltransitions, and anatomical structures. Gradient featureswerecomputed by using three gradient operators: Sobel filter,Kirsch filter, and a numerical gradient. Function featureswere solely extracted from DCE sequences and includedsemiquantitative and quantitative features. Semiquantitativefeatures including wash-in (WI) and wash-out (WO) rate,SI peak (absolute maximum enhancement), SI max (95%of maximum enhancement), onset time, time-to-peak, timeto max (Tmax), and the area under the gadolinium curve(AUGC) were derived from the enhancement curves. Quan-titative features were computed based on a kinetic model ofthe enhancement curve. These features included the forwardvolume transfer constant (𝐾trans), the fractional volume ofextracellular space per unit volume of tissue (V
𝑒), and the
reverse reflux rate constant between extracellular space andplasma (𝑘ep).The arterial input function (AIF) was measuredby using regions of interest (ROI) drawn in the commonfemoral artery.
Vos et al. extracted first-order statistics such as the 25%and 75% percentiles from ROIs on Ktrans maps and T1images [54]. Accuracy of 0.83 (c.i. [0.75–0.92]) was reportedfor discriminating malignant lesions from nonmalignantsuspicious enhancing areas located in the normal PZ of theprostate. Similarly, Artan et al. utilized only intensities ofT2, ADC, and 𝑘ep images for prostate cancer localization[55]. The proposed system achieved 79% AUC, which was adecent percentage considering that only basic features wereutilized.
Chan et al. employed two types of second-order fea-tures: texture features and anatomical features [56]. Intheir research, texture features were extracted from lesion
BioMed Research International 5
candidates by using a cooccurrence matrix (CM) and adiscrete cosine transform (DCT). The anatomical locationof voxels was described by a cylindrical coordinate sys-tem. Litjens et al. used intensity, texture, shape (blobness),anatomy, and pharmacokinetic features on T2, proton-density weighted, diffusion weighted, and DCE images [57].The peripheral zone probability feature determined whethera voxel belonged to the peripheral zone or the centralgland using a pattern recognition framework that utilizedtexture, intensity, and anatomical features. DCE images wereanalyzed by fitting a biexponential curve to the time data;the parameters tau and LateWash, corresponding to time-to-peak and the slope of the last portion of the enhancementcurve, respectively, were incorporated as features. Thesefeatures were selected based on PI-RADS guidelines forreading prostate MR images. Using second-order featurescontributed to the ability of this system to achieve anequivalent performance to radiologists.
Another approach to feature extraction utilizes fractalgeometry, which is capable of characterizing heterogeneitieswithin an image. To detect prostate cancer on T2WI, Lopeset al. employed fractal and multifractal features to analyzetextural properties of images [58].These two types of featureswere computed using the variancemethod and themultifrac-tional Brownian motion model, respectively. The use of frac-tal and multifractal features improved classification accuracyand reduced the influence of signal intensity variations whencompared to textural features.
Wavelet transformations are widely used in signal pro-cessing for noise reduction, compression, digital encryption(e.g. digital watermark), and reconstruction [59–62]. Becausethey have applications in extracting representative signaturesfrommultifrequency channels at various resolutions, wavelettransformations are also used in image analysis for featureextraction. Tiwari et al. proposed a multimodal waveletembedding representation for feature extraction from MP-MRI [63]. The authors extracted 171 Haar wavelet featuresfrom magnetic resonance spectroscopy (MRS) and 54 Gaborfeatures fromT2WI.They then applied dimensionality reduc-tion to each of the two groups of wavelet features andprojected them to a common reduced eigenvector space.Tiwari et al. showed that the wavelet embedding systemproduced the most accurate prediction and highest AUCwhen compared with the T2WI or MRS feature vectors aloneand other state-of-the-art combination-of-data systems.
The central gland (CG) and the peripheral zone (PZ)are used as anatomical coordinates in prostate biopsiesto report the location of a cancer. Because cancer showsdifferent characteristics in different regions of the prostate,incorporating anatomical structural information in a CADxsystem may improve the performance. Manual segmentationof the PZ and CG is time consuming; so it would be ideal ifanatomical features could be extracted from ROIs. Liu andYetik proposed a new feature called the location map, whichis constructed by applying a nonlinear transformation to thespatial position coordinates of each pixel [64]. The locationmap could differentiate the transition zone (TZ) and PZ.Experimental results show that the detection sensitivity was
improved when the new anatomical feature was combinedwith other nonanatomical features.
The work described above shows that while statisticalfeatures (i.e., Intensity features, histogram of gradients, etc.)have been commonly included in classification systems,features which capture geometric information have beenless widely used. This trend would indicate that while workon statistical features is comprehensive and sufficient, theinclusion of features describing shape and symmetry withinthe prostate would greatly contribute to advancing the fieldof feature selection and extraction as it applies to machinelearning.
3.5. Classification. The final step of a CADx system involvestraining and testing with features extracted from images andlabels. A classifier is usually trained based on the labeledtraining set and applied to test cases without knowledge oftrue labels.
In the past two decades, SVMs have shown their effective-ness onmany real-life classification problems [65].The stronggeneralization ability of SVMs comes from the margin-maximization criterion. Vos et al. employed SVM for ana-lyzing prostate lesions in the PZ using DCE MRI [54]. Later,Vos et al. applied SVM to the same problem using T2WIand DCE MRI [66]. Traditional SVMs treat errors withuniform cost. For prostate cancer diagnosis, detecting falsenegatives is vital as their cost to patient health is much higherthan the cost of false positives. In the work of Artan etal., the authors applied the cost-sensitive SVM to prostatecancer localization and compared it with classical SVM [55].Moreover, they combined conditional random fields (CRF)with a cost-sensitive framework for segmenting the lesionand found that this method improved cost-sensitive SVMresults by incorporating spatial information. Liu and Yetikfed SVM with a location map and with multiparametric MRimages to segment prostate cancer [64]. They found that it isfeasible to detect tumors without PZ extraction by fusing thespatial map. Shah et al. employed SVM to localize prostatecancer based on multiparametric MRI [40]. To find optimalhyperparameters for SVM, they used a genetic algorithm inwhich each SVM hyperparameter was treated as a “gene”in a “chromosome” encoding. In this evolutionary strategyapproach, the 𝐹-measure was used as the metric for theevaluation of individual fitness. Chan et al. compared a single-channel maximum likelihood classifier based solely on imageintensities to a support vector machine (SVM) and Fisherlinear discriminant (FLD) which utilized five different sets ofderived features [56]. FLD showed the highest performancewhen compared with the other two classifiers. In a later study[53], Niaf et al. compared the performance of SVM, lineardiscriminant analysis (LDA), a Naıve Bayes classifier, and thek-nearest neighbors algorithm on the diagnosis of prostatecancer in the peripheral zone using T2WI, DWI, and DCEimages. SVM achieved the highest performance in this study.LDA was also employed by Peng et al. in the development oftexture features on T2WI and ADC features on DWI [51, 67].Other works utilizing SVM for classifying prostate canceron multiparametric MRI include Liu et al. and Moradi et al.

6 BioMed Research International
T2WI ADC (DWI)
Ktrans (DCE) CAD prediction map
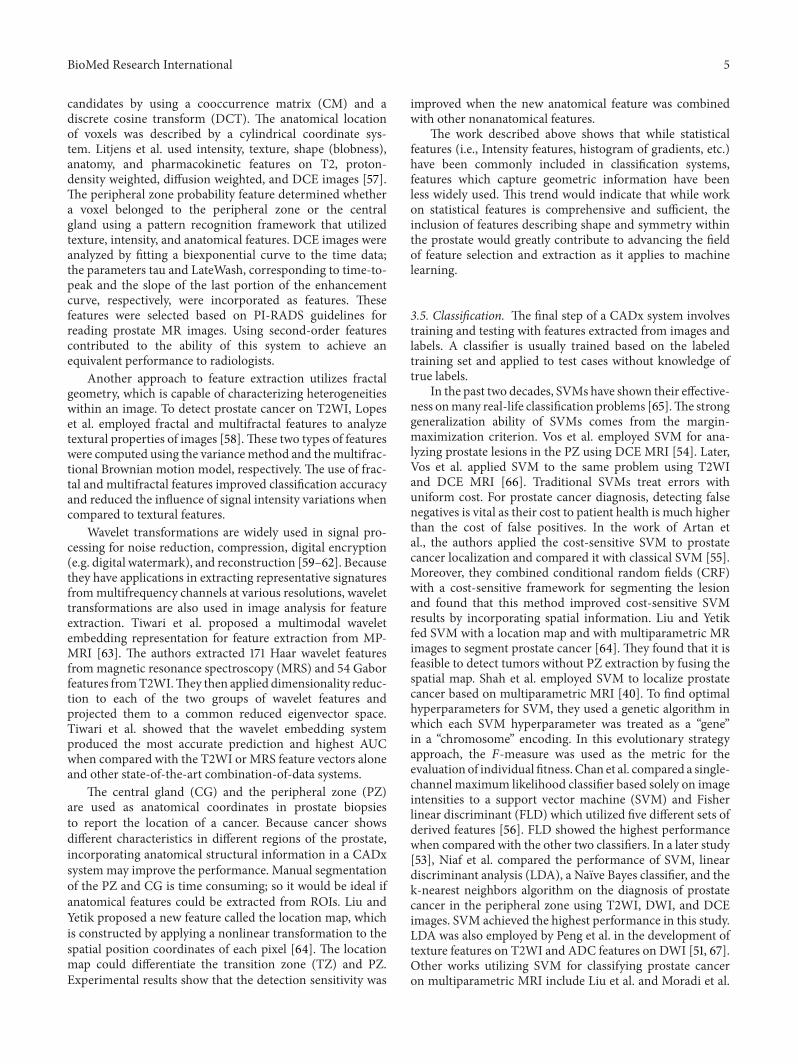
Figure 2: Illustration of a prostate CAD prediction map showing true positive cancer classified correctly by SVM.The red rectangle indicatesan image patch within the cancer in which local image features are extracted from T2WI, ADC, and Ktrans map. The green contour denotesthe boundary of the prostate. Bright regions in the CAD prediction map correspond to a high probability of cancer and coincide with thecorrect location of the cancer.
[39, 52]. In Figure 2, we show an exemplar prediction mapgenerated by a prostate CAD system developed by Liu et al.[39].
In recent years, random forests were introduced to thearea of medical image analysis and achieved very promisingresults in some medical applications [68]. Random forestsare an ensemble learning classification method [69, 70].Theybuild decision trees with random perturbations of trainingsamples and features to ensure high generalization ability.Random forest is one type of random subspace learningmethod which builds an ensemble of classifiers by exploringpartial feature spaces (also called subspaces) of the input data[69]. Tiwari et al. employed random forests in the task ofprostate cancer classification based on the combined eigen-vector representation of T2WI,MRI, andMRS channels [63].Experimental results showed that random forest has a strongcapability for integrating any combination of heterogeneousdata modalities with various scales and dimensions.
Since kernel-based learning methods (e.g., SVMs) arecommonly used to classify prostate cancer on multiparamet-ric MRI, developing more specific kernel-based classifiersand adapting them to the prostate MRI domain may leadto further improvement of prostate CADx systems. In theCADx system developed by Tiwari et al., there are three main
modules: multikernel learning, semisupervised learning, anddimensionality reduction [71]. Experimental results showedthat this elaborately developed kernel-based learning systemis a powerful diagnostic and prognostic tool for prostatecancer diagnosis on MRI/MRS.
In the work discussed in this section, classification wasachieved automatically by employing different forms ofstatistical classifiers. To simulate the diagnostic process ofradiologists, Puech et al. proposed a semiquantitative rule-based classification method for prostate cancer diagnosis onDCE MRI [72]. In this method, a scoring algorithm wasdesigned based on thewash-out slope (Wo),maximumwash-out rate (Max Wo PCa), minimum wash-in rate (Min WiPCa), median wash-out rate (Med Wo PCa), and medianwash-in rate (Med Wi PCa) in the area of the lesion asmeasured on DCE MR images. This method is unique inthat it directly encodes reading experience of radiologistswithout resorting to a statistical classifier to implicitly extractclassification rules from labeled data.
With well-registered images and informative featureextraction, prior work indicates that SVM and random forestwork well on the problem of classifying prostate tumors onMP-MRI.
BioMed Research International 7
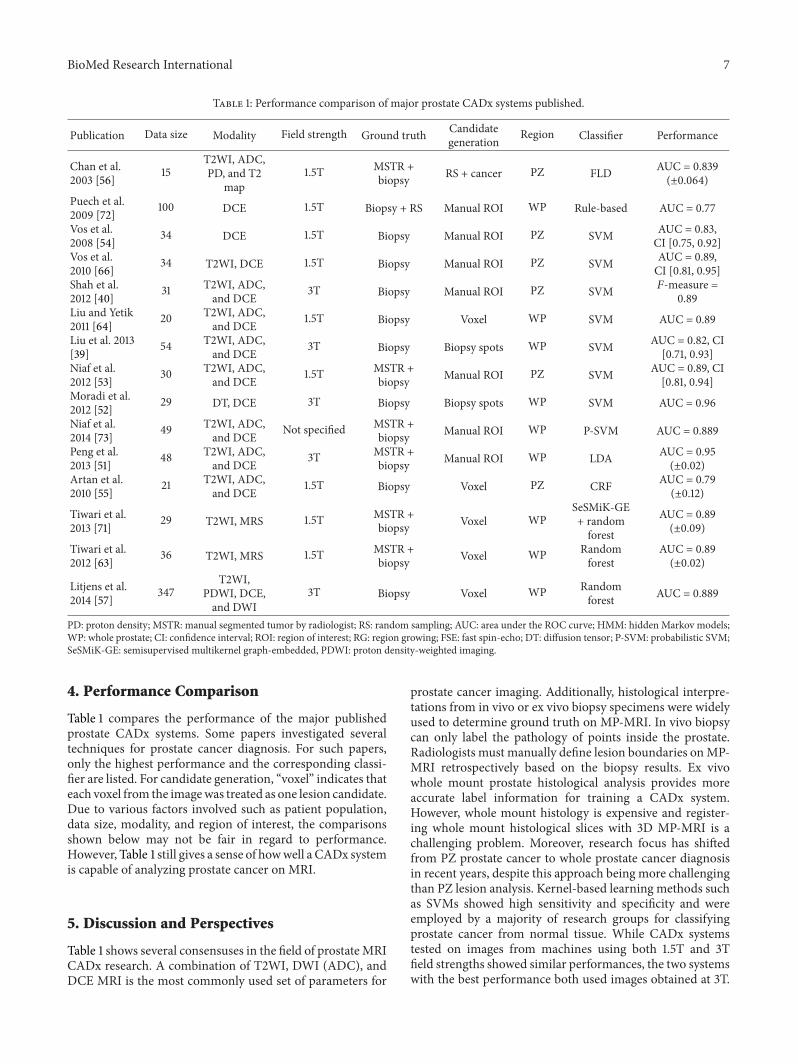
Table 1: Performance comparison of major prostate CADx systems published.
Publication Data size Modality Field strength Ground truth Candidategeneration Region Classifier Performance
Chan et al.2003 [56] 15
T2WI, ADC,PD, and T2
map1.5T MSTR +
biopsy RS + cancer PZ FLD AUC = 0.839(±0.064)
Puech et al.2009 [72] 100 DCE 1.5T Biopsy + RS Manual ROI WP Rule-based AUC = 0.77
Vos et al.2008 [54] 34 DCE 1.5T Biopsy Manual ROI PZ SVM AUC = 0.83,
CI [0.75, 0.92]Vos et al.2010 [66] 34 T2WI, DCE 1.5T Biopsy Manual ROI PZ SVM AUC = 0.89,
CI [0.81, 0.95]Shah et al.2012 [40] 31 T2WI, ADC,
and DCE 3T Biopsy Manual ROI PZ SVM 𝐹-measure =0.89
Liu and Yetik2011 [64] 20 T2WI, ADC,
and DCE 1.5T Biopsy Voxel WP SVM AUC = 0.89
Liu et al. 2013[39] 54 T2WI, ADC,
and DCE 3T Biopsy Biopsy spots WP SVM AUC = 0.82, CI[0.71, 0.93]
Niaf et al.2012 [53] 30 T2WI, ADC,
and DCE 1.5T MSTR +biopsy Manual ROI PZ SVM AUC = 0.89, CI
[0.81, 0.94]Moradi et al.2012 [52] 29 DT, DCE 3T Biopsy Biopsy spots WP SVM AUC = 0.96
Niaf et al.2014 [73] 49 T2WI, ADC,
and DCE Not specified MSTR +biopsy Manual ROI WP P-SVM AUC = 0.889
Peng et al.2013 [51] 48 T2WI, ADC,
and DCE 3T MSTR +biopsy Manual ROI WP LDA AUC = 0.95
(±0.02)Artan et al.2010 [55] 21 T2WI, ADC,
and DCE 1.5T Biopsy Voxel PZ CRF AUC = 0.79(±0.12)
Tiwari et al.2013 [71] 29 T2WI, MRS 1.5T MSTR +
biopsy Voxel WPSeSMiK-GE+ randomforest
AUC = 0.89(±0.09)
Tiwari et al.2012 [63] 36 T2WI, MRS 1.5T MSTR +
biopsy Voxel WP Randomforest
AUC = 0.89(±0.02)
Litjens et al.2014 [57] 347
T2WI,PDWI, DCE,and DWI
3T Biopsy Voxel WP Randomforest AUC = 0.889
PD: proton density; MSTR: manual segmented tumor by radiologist; RS: random sampling; AUC: area under the ROC curve; HMM: hidden Markov models;WP: whole prostate; CI: confidence interval; ROI: region of interest; RG: region growing; FSE: fast spin-echo; DT: diffusion tensor; P-SVM: probabilistic SVM;SeSMiK-GE: semisupervised multikernel graph-embedded, PDWI: proton density-weighted imaging.
4. Performance Comparison
Table 1 compares the performance of the major publishedprostate CADx systems. Some papers investigated severaltechniques for prostate cancer diagnosis. For such papers,only the highest performance and the corresponding classi-fier are listed. For candidate generation, “voxel” indicates thateach voxel from the imagewas treated as one lesion candidate.Due to various factors involved such as patient population,data size, modality, and region of interest, the comparisonsshown below may not be fair in regard to performance.However, Table 1 still gives a sense of howwell a CADx systemis capable of analyzing prostate cancer on MRI.
5. Discussion and Perspectives
Table 1 shows several consensuses in the field of prostateMRICADx research. A combination of T2WI, DWI (ADC), andDCE MRI is the most commonly used set of parameters for
prostate cancer imaging. Additionally, histological interpre-tations from in vivo or ex vivo biopsy specimens were widelyused to determine ground truth on MP-MRI. In vivo biopsycan only label the pathology of points inside the prostate.Radiologists must manually define lesion boundaries onMP-MRI retrospectively based on the biopsy results. Ex vivowhole mount prostate histological analysis provides moreaccurate label information for training a CADx system.However, whole mount histology is expensive and register-ing whole mount histological slices with 3D MP-MRI is achallenging problem. Moreover, research focus has shiftedfrom PZ prostate cancer to whole prostate cancer diagnosisin recent years, despite this approach being more challengingthan PZ lesion analysis. Kernel-based learning methods suchas SVMs showed high sensitivity and specificity and wereemployed by a majority of research groups for classifyingprostate cancer from normal tissue. While CADx systemstested on images from machines using both 1.5T and 3Tfield strengths showed similar performances, the two systemswith the best performance both used images obtained at 3T.

8 BioMed Research International
This may be in part because of an improved signal-to-noiseratio resulting in greater resolution of the images. Regardingdata size, the majority of prostate CADx systems employeda relatively small data set with no more than 50 patients.Validation on a large-scale data set with several hundredpatients is required to make the systems usable in clinicalsettings.
There are challenges facing the field of prostate CADxresearch. The majority of the prostate CADx systems listedin Table 1 reported AUC in the range from 0.80 to 0.89.Moradi et al. and Peng et al. reported AUCs of 0.96 and0.95, respectively, which represent the highest performancein the group [51, 52]. However, their systems generated lesioncandidates based on biopsy locations or manually selectedROIs which may be data set dependent. The generalizationof this system to other unseen test sets needs to be validated.
Reducing the false positive rate is vital to improving theperformance of a prostate CADx system. In Liu et al. [39],many false positives were from benign prostatic hyperplasia(BPH) nodules. BPH nodules show similar enhancementpatterns to prostate cancer on MP-MRI. Like PCa, BPHnodules also show early enhancement at wash-in phase andtheir intensity drops more quickly at wash-out phase thannormal prostate tissue on a DCE sequence. Detecting BPHnodules onMP-MRI is a key factor in reducing false positivesfor a prostate CADx system.
While the MP-MRI combination of T2WI, DWI, andDCE images is becoming mainstream for prostate CADxsystems, the exploration of imagemodalities such asMRS andDT has also been observed.The introduction of new imagingmodalities or new modality combinations for MP-MRI maylead to better CADx systems. Because images or signals arethe information source of all CADx systems, the developmentand adoption of more accurate scanning methods will allevi-ate the burden imposed on the postprocessingCADx systems.
To compare state-of-the-art CADx systems for prostatecancer diagnosis on MP-MRI, a publicly available datasetis necessary to provide a fair comparison for differenttechniques. The public dataset should include major MRImodalities such as T2WI, DWI, and DCE from various MRIvendors. The patient population in the data set should belarge enough to include anatomical and pathological patientvariations. To develop supervised learning techniques forprostate cancer diagnosis, it is necessary that accurate labelsof the cancer exist for MP-MRI images. Such labels shouldbe confirmed by histological analysis. Ideally, these labels orcancer contours should be registered to the whole mountprostate histology images.
In the field of prostate segmentation for MRI, we arepleased to see the PROMISE12 challenge has been success-fully organized [48]. Challenges and publicly available datasets such as PROMISE12 support the advancement of prostatesegmentation for MRI though motivation and consistency.
6. Conclusion
In this paper, we surveyed computer aided-diagnosis systemsfor detection and diagnosis of prostate cancer on MP-MRI.
From the survey it was determined that current major CADxsystems recorded AUC performance below 0.90.This findingindicates that there is still room for improvement throughfuture research in this field. Prostate cancerCADx systems area complicated composition of image normalization, prepro-cessing, segmentation, registration, feature extraction, andclassification modules. It is therefore expected that develop-ment and progress in one or more of these modules shouldlead to a better diagnostic system with higher sensitivity andlower false positive rate, as has been observed from previousresearch efforts. It is likely that more improvements will bemade in the next decade and wide deployment of prostateCADx systems in the clinical environment will eventuallyoccur.
Conflict of Interests
The authors declare that there is no conflict of interestsregarding the publication of this paper.
Acknowledgments
This work was supported by the Intramural Research Pro-grams of the NIHClinical Center.The authors thank KristineEvers for her help on the writing of the paper.
References
[1] R. Siegel, D.Naishadham, andA. Jemal, “Cancer statistics, 2013,”Cancer Journal for Clinicians, vol. 63, no. 1, pp. 11–30, 2013.
[2] NCI, http://seer.cancer.gov/statfacts/html/prost.html.[3] J. E. McNeal, E. A. Redwine, F. S. Freiha, and T. A. Stamey,
“Zonal distribution of prostatic adenocarcinoma. Correlationwith histologic pattern and direction of spread,” The AmericanJournal of Surgical Pathology, vol. 12, no. 12, pp. 897–906, 1988.
[4] F. H. Schroder, J. Hugosson,M. J. Roobol et al., “Prostate-cancermortality at 11 years of follow-up,” The New England Journal ofMedicine, vol. 366, no. 11, pp. 981–990, 2012.
[5] J. Hugosson, S. Carlsson, G. Aus et al., “Mortality results fromthe Goteborg randomised population-based prostate-cancerscreening trial,”The Lancet Oncology, vol. 11, no. 8, pp. 725–732,2010.
[6] C. Neppl-Huber, M. Zappa, J. W. Coebergh et al., “Changes inincidence, survival and mortality of prostate cancer in Europeand the United States in the PSA era: additional diagnoses andavoided deaths,” Annals of Oncology, vol. 23, no. 5, pp. 1325–1334, 2012.
[7] G. L. Andriole et al., “Mortality results from a randomizedprostate-cancer screening trial,” The New England Journal ofMedicine, vol. 360, no. 13, pp. 1310–1319, 2009.
[8] G. L. Andriole, E. D. Crawford, R. L. Grubb III et al., “Prostatecancer screening in the randomized prostate, lung, colorectal,and ovarian cancer screening trial: mortality results after 13years of follow-up,” Journal of the National Cancer Institute, vol.104, no. 2, pp. 125–132, 2012.
[9] M. Norberg, L. Egevad, L. Holmberg, P. Sparen, B. J. Norlen,and C. Busch, “The sextant protocol for ultrasound-guided corebiopsies of the prostate underestimates the presence of cancer,”Urology, vol. 50, no. 4, pp. 562–566, 1997.

BioMed Research International 9
[10] J. C. Presti Jr., J. J. Chang, V. Bhargava, and K. Shinohara, “Theoptimal systematic prostate biopsy scheme should include 8rather than 6 biopsies: results of a prospective clinical trial,”Journal of Urology, vol. 163, no. 1, pp. 163–167, 2000.
[11] N. E. Fleshner, M. O’Sullivan, and W. R. Fair, “Prevalence andpredictors of a positive repeat transrectal ultrasound guidedneedle biopsy of the prostate,” Journal of Urology, vol. 158, no.2, pp. 505–509, 1997.
[12] E. C. Serefoglu, S. Altinova, N. S. Ugras, E. Akincioglu, E.Asil, and M. D. Balbay, “How reliable is 12-core prostate biopsyprocedure in the detection of prostate cancer?” Journal of theCanadian Urological Association, vol. 7, no. 5-6, pp. E293–E298,2013.
[13] R. Llobet, J. C. Perez-Cortes, A. H. Toselli, and A. Juan,“Computer-aided detection of prostate cancer,” InternationalJournal of Medical Informatics, vol. 76, no. 7, pp. 547–556, 2007.
[14] J. Nakashima, A. Tanimoto, Y. Imai et al., “Endorectal MRIfor prediction of tumor site, tumor size, and local extension ofprostate cancer,” Urology, vol. 64, no. 1, pp. 101–105, 2004.
[15] M. Mullerad, H. Hricak, K. Kuroiwa et al., “Comparison ofendorectalmagnetic resonance imaging, guided prostate biopsyand digital rectal examination in the preoperative anatomicallocalization of prostate cancer,”The Journal of Urology, vol. 174,no. 6, pp. 2158–2163, 2005.
[16] A. E. Wefer, H. Hricak, D. B. Vigneron et al., “Sextant local-ization of prostate cancer: Comparison of sextant biopsy, mag-netic resonance imaging andmagnetic resonance spectroscopicimagingwith step section histology,” Journal of Urology, vol. 164,no. 2, pp. 400–404, 2000.
[17] K. G. Nepple, H. M. Rosevear, A. H. Stolpen, J. A. Brown,and R. D. Williams, “Concordance of preoperative prostateendorectal MRI with subsequent prostatectomy specimen inhigh-risk prostate cancer patients,”Urologic Oncology: Seminarsand Original Investigations, vol. 31, no. 5, pp. 601–606, 2013.
[18] M. L. Schiebler, M. D. Schnall, H. M. Pollack et al., “Currentrole of MR imaging in the staging of adenocarcinoma of theprostate,” Radiology, vol. 189, no. 2, pp. 339–352, 1993.
[19] M. A. Haider, T. H. van Der Kwast, J. Tanguay et al., “CombinedT2-weighted and diffusion-weighted MRI for localization ofprostate cancer,”American Journal of Roentgenology, vol. 189, no.2, pp. 323–328, 2007.
[20] A. R. Padhani, C. J. Gapinski, D. A. Macvicar et al., “Dynamiccontrast enhanced MRI of prostate cancer: correlation withmorphology and tumour stage, histological grade and PSA,”Clinical Radiology, vol. 55, no. 2, pp. 99–109, 2000.
[21] P. Kozlowski, S. D. Chang, E. C. Jones, K. W. Berean, H. Chen,and S. L. Goldenberg, “Combined diffusion-weighted anddynamic contrast-enhanced MRI for prostate cancer diagnosis:correlationwith biopsy andhistopathology,” Journal ofMagneticResonance Imaging, vol. 24, no. 1, pp. 108–113, 2006.
[22] J. Kurhanewicz,M.G. Swanson, S. J. Nelson, andD. B.Vigneron,“Combined magnetic resonance imaging and spectroscopicimaging approach to molecular imaging of prostate cancer,”Journal of Magnetic Resonance Imaging, vol. 16, no. 4, pp. 451–463, 2002.
[23] A. P. S. Kirkham,M. Emberton, andC.Allen, “Howgood isMRIat detecting and characterising cancer within the prostate?”European Urology, vol. 50, no. 6, pp. 1163–1175, 2006.
[24] N. Hara, M. Okuizumi, H. Koike, M. Kawaguchi, and V.Bilim, “Dynamic contrast-enhanced magnetic resonance imag-ing (DCE-MRI) is a useful modality for the precise detection
and staging of early prostate cancer,” Prostate, vol. 62, no. 2, pp.140–147, 2005.
[25] T. S. Bates, D. A. Gillatt, P. M. Cavanagh, and M. Speakman,“A comparison of endorectal magnetic resonance imaging andtransrectal ultrasonography in the local staging of prostatecancer with histopathological correlation,” British Journal ofUrology, vol. 79, no. 6, pp. 927–932, 1997.
[26] Y.Komai,N.Numao, S. Yoshida et al., “Highdiagnostic ability ofmultiparametric magnetic resonance imaging to detect anteriorprostate cancer missed by transrectal 12-core biopsy,” Journal ofUrology, vol. 190, no. 3, pp. 867–873, 2013.
[27] B. Turkbey, P. A. Pinto, H. Mani et al., “Prostate cancer:value of multiparametric MR imaging at 3 T for detection—histopathologic correlation,” Radiology, vol. 255, no. 1, pp. 89–99, 2010.
[28] B. Turkbey, S. Xu, J. Kruecker et al., “Documenting the locationof prostate biopsies with image fusion,” BJU International, vol.107, no. 1, pp. 53–57, 2011.
[29] S. Xu, J. Kruecker, B. Turkbey et al., “Real-time MRI-TRUSfusion for guidance of targeted prostate biopsies,” ComputerAided Surgery, vol. 13, no. 5, pp. 255–264, 2008.
[30] S. Vourganti, A. Rastinehad, N. K. Yerram et al., “Multiparamet-ric magnetic resonance imaging and ultrasound fusion biopsydetect prostate cancer in patients with prior negative transrectalultrasound biopsies,” Journal of Urology, vol. 188, no. 6, pp. 2152–2157, 2012.
[31] C. M. Moore, N. L. Robertson, N. Arsanious et al., “Image-guided prostate biopsy using magnetic resonance imaging-derived targets: a systematic review,” European Urology, vol. 63,no. 1, pp. 125–140, 2013.
[32] S. W. T. P. J. Heijmink, J. J. Futterer, T. Hambrock et al.,“Prostate cancer: Body array versus endorectal coilMR imagingat 3T - Comparison of image quality, localization, and stagingperformance,” Radiology, vol. 244, no. 1, pp. 184–195, 2007.
[33] J. J. Futterer, M. R. Engelbrecht, G. J. Jager et al., “Prostatecancer: Comparison of local staging accuracy of pelvic phased-array coil alone versus integrated endorectal-pelvic phased-array coils,” European Radiology, vol. 17, no. 4, pp. 1055–1065,2007.
[34] B. Turkbey, M. J. Merino, E. C. Gallardo et al., “Comparisonof endorectal coil and nonendorectal coil T2W and diffusion-weighted MRI at 3 Tesla for localizing prostate cancer: corre-lation with whole-mount histopathology,” Journal of MagneticResonance Imaging, vol. 39, no. 6, pp. 1443–1448, 2014.
[35] F. Bratan, E. Niaf, C. Melodelima et al., “Influence of imagingand histological factors on prostate cancer detection and locali-sation on multiparametric MRI: a prospective study,” EuropeanRadiology, vol. 23, no. 7, pp. 2019–2029, 2013.
[36] F. May, T. Treumann, P. Dettmar, R. Hartung, and J. Breul,“Limited value of endorectal magnetic resonance imaging andtransrectal ultrasonography in the staging of clinically localizedprostate cancer,”BJU International, vol. 87, no. 1, pp. 66–69, 2001.
[37] C. Rasch, I. Barillot, P. Remeijer, A. Touw,M. vanHerk, and J. V.Lebesque, “Definition of the prostate in CT and MRI: a multi-observer study,” International Journal of Radiation OncologyBiology Physics, vol. 43, no. 1, pp. 57–66, 1999.
[38] O. Ruprecht, P. Weisser, B. Bodelle, H. Ackermann, and T. J.Vogl, “MRI of the prostate: Interobserver agreement comparedwith histopathologic outcome after radical prostatectomy,”European Journal of Radiology, vol. 81, no. 3, pp. 456–460, 2012.
[39] P. Liu, S. Wang, B. Turkbey et al., “A prostate cancer computer-aided diagnosis system using multimodal magnetic resonance

10 BioMed Research International
imaging and targeted biopsy labels,” in Medical Imaging 2013:Computer-Aided Diagnosis, 86701G, vol. 8670 of Proceedings ofSPIE, Orlando, Fla, USA, February 2013.
[40] V. Shah, B. Turkbey, H.Mani et al., “Decision support system forlocalizing prostate cancer based on multiparametric magneticresonance imaging,” Medical Physics, vol. 39, no. 7, pp. 4093–4103, 2012.
[41] R. Woodhams, K. Matsunaga, K. Iwabuchi et al., “Diffusion-weighted imaging of malignant breast tumors: the usefulnessof apparent diffusion coefficient (ADC) value and ADC mapfor the detection of malignant breast tumors and evaluationof cancer extension,” Journal of Computer Assisted Tomography,vol. 29, no. 5, pp. 644–649, 2005.
[42] S. Klein, U. A. van Der Heide, I. M. Lips, M. van Vulpen, M.Staring, and J. P. W. Pluim, “Automatic segmentation of theprostate in 3D MR images by atlas matching using localizedmutual information,” Medical Physics, vol. 35, no. 4, pp. 1407–1417, 2008.
[43] S. Martin, J. Troccaz, and V. Daanen, “Automated segmentationof the prostate in 3D MR images using a probabilistic atlas anda spatially constrained deformable model,”Medical Physics, vol.37, no. 4, pp. 1579–1590, 2010.
[44] S. Martin, G. Rodrigues, N. Patil et al., “A multiphase valida-tion of atlas-based automatic and semiautomatic segmentationstrategies for prostate MRI,” International Journal of RadiationOncology Biology Physics, vol. 85, no. 1, pp. 95–100, 2013.
[45] S. S. Chandra, J. A. Dowling, K.-K. Shen et al., “Patient specificprostate segmentation in 3-Dmagnetic resonance images,” IEEETransactions on Medical Imaging, vol. 31, no. 10, pp. 1955–1964,2012.
[46] Y. Yin, S. V. Fotin, S. Periaswamy et al., “Fully automatedprostate segmentation in 3DMR based on normalized gradientfields cross-correlation initialization and LOGISMOS refine-ment,” in Proceedings of the SPIE Medical Imaging, 2012.
[47] D.Mahapatra and J. M. Buhmann, “ProstateMRI segmentationusing learned semantic knowledge and graph cuts,” IEEETransactions on Biomedical Engineering, vol. 61, no. 3, pp. 756–764, 2014.
[48] G. Litjens, R. Toth, W. van de Ven et al., “Evaluation of prostatesegmentation algorithms for MRI: the PROMISE12 challenge,”Medical Image Analysis, vol. 18, no. 2, pp. 359–373, 2014.
[49] Y. Mazaheri, L. Bokacheva, D. J. Kroon et al., “Semi-automaticdeformable registration of prostate MR images to pathologicalslices,” Journal of Magnetic Resonance Imaging, vol. 32, no. 5, pp.1149–1157, 2010.
[50] J. Chappelow, B. N. Bloch, N. Rofsky et al., “Elastic registrationof multimodal prostate MRI and histology via multiattributecombined mutual information,” Medical Physics, vol. 38, no. 4,pp. 2005–2018, 2011.
[51] Y. Peng, Y. Jiang, C. Yang et al., “Quantitative analysis ofmultiparametric prostate MR images: differentiation betweenprostate cancer and normal tissue and correlation with Gleasonscore—a computer-aided diagnosis development study,” Radi-ology, vol. 267, no. 3, pp. 787–796, 2013.
[52] M.Moradi, S. E. Salcudean, S. D. Chang et al., “MultiparametricMRI maps for detection and grading of dominant prostatetumors,” Journal of Magnetic Resonance Imaging, vol. 35, no. 6,pp. 1403–1413, 2012.
[53] E. Niaf, O. Rouviere, F. Mege-Lechevallier, F. Bratan, and C.Lartizien, “Computer-aided diagnosis of prostate cancer inthe peripheral zone using multiparametric MRI,” Physics inMedicine and Biology, vol. 57, no. 12, pp. 3833–3851, 2012.
[54] P. C. Vos, T. Hambrock, C. A. H. van de Kaa, J. J. Futterer,J. O. Barentsz, and H. J. Huisman, “Computerized analysis ofprostate lesions in the peripheral zone using dynamic contrastenhanced MRI,” Medical Physics, vol. 35, no. 3, pp. 888–899,2008.
[55] Y. Artan, M. A. Haider, D. L. Langer et al., “Prostate cancerlocalization with multispectral MRI using cost-sensitive sup-port vector machines and conditional random fields,” IEEETransactions on Image Processing, vol. 19, no. 9, pp. 2444–2455,2010.
[56] I. Chan,W.Wells III, R. V.Mulkern et al., “Detection of prostatecancer by integration of line-scan diffusion, T2-mapping andT2-weighted magnetic resonance imaging; a multichannel sta-tistical classifier,”Medical Physics, vol. 30, no. 9, pp. 2390–2398,2003.
[57] G. Litjens, O. Debats, J. Barentsz, N. Karssemeijer, and H.Huisman, “Computer-aided detection of prostate cancer inMRI,” IEEE Transactions on Medical Imaging, vol. 33, no. 5, pp.1083–1092, 2014.
[58] R. Lopes, A. Ayache, N. Makni et al., “Prostate cancer charac-terization onMR images using fractal features,”Medical Physics,vol. 38, no. 1, pp. 83–95, 2011.
[59] I. Daubechies, “The wavelet transform, time-frequency local-ization and signal analysis,” IEEE Transactions on InformationTheory, vol. 36, no. 5, pp. 961–1005, 1990.
[60] R. Guido, P. Addison, and J. Walker, “Introducing wavelets andtime—frequency analysis,” IEEE Engineering in Medicine andBiology Magazine, vol. 28, no. 5, p. 13, 2009.
[61] O. Rioul andM.Vetterli, “Wavelets and signal processing,” IEEESignal Processing Magazine, vol. 8, no. 4, pp. 14–38, 1991.
[62] I. W. Selesnick, “Wavelets, a modern tool for signal processing,”Physics Today, vol. 60, no. 10, pp. 78–79, 2007.
[63] P. Tiwari, S. Viswanath, J. Kurhanewicz, A. Sridhar, andA.Mad-abhushi, “Multimodal wavelet embedding representation fordata combination (MaWERiC): integratingmagnetic resonanceimaging and spectroscopy for prostate cancer detection,” NMRin Biomedicine, vol. 25, no. 4, pp. 607–619, 2012.
[64] X. Liu and I. S. Yetik, “Automated prostate cancer localizationwithout the need for peripheral zone extraction using multi-parametric MRI,”Medical Physics, vol. 38, no. 6, pp. 2986–2994,2011.
[65] C. J. C. Burges, “A tutorial on support vector machines forpattern recognition,” Data Mining and Knowledge Discovery,vol. 2, no. 2, pp. 121–167, 1998.
[66] P. C. Vos, T. Hambrock, J. O. Barenstz, and H. J. Huis-man, “Computer-assisted analysis of peripheral zone prostatelesions using T2-weighted and dynamic contrast enhanced T1-weighted MRI,” Physics in Medicine and Biology, vol. 55, no. 6,pp. 1719–1734, 2010.
[67] Y. Peng, Y. Jiang, T. Antic et al., “A study of T2-weightedMR image texture features and diffusion-weighted MR imagefeatures for computer-aided diagnosis of prostate cancer,” inMedical Imaging, vol. 8670 of Proceedings of SPIE, Orlando, Fla,USA, 2013.
[68] A. Criminisi, J. Shotton, and E. Konukoglu, “Decision forests:a unified framework for classification, regression, densityestimation, manifold learning and semi-supervised learning,”Foundations and Trends in Computer Graphics and Vision, vol.7, no. 2-3, pp. 81–227, 2011.
[69] T. K. Ho, “The random subspace method for constructingdecision forests,” IEEE Transactions on Pattern Analysis andMachine Intelligence, vol. 20, no. 8, pp. 832–844, 1998.

BioMed Research International 11
[70] L. Breiman, “Random forests,”Machine Learning, vol. 45, no. 1,pp. 5–32, 2001.
[71] P. Tiwari, J. Kurhanewicz, and A. Madabhushi, “Multi-kernelgraph embedding for detection, Gleason grading of prostatecancer via MRI/MRS,”Medical Image Analysis, vol. 17, no. 2, pp.219–235, 2013.
[72] P. Puech, N. Betrouni, N. Makni, A.-S. Dewalle, A. Villers, andL. Lemaitre, “Computer-assisted diagnosis of prostate cancerusing DCE-MRI data: design, implementation and preliminaryresults,” International Journal of Computer Assisted Radiologyand Surgery, vol. 4, no. 1, pp. 1–10, 2009.
[73] E. Niaf, R. Flamary, O. Rouviere, C. Lartizien, and S. Canu,“Kernel-based learning from both qualitative and quantita-tive labels: application to prostate cancer diagnosis based onmultiparametric MR imaging,” IEEE Transactions on ImageProcessing, vol. 23, no. 3, pp. 979–991, 2014.

Submit your manuscripts athttp://www.hindawi.com
Stem CellsInternational
Hindawi Publishing Corporationhttp://www.hindawi.com Volume 2014
Hindawi Publishing Corporationhttp://www.hindawi.com Volume 2014
MEDIATORSINFLAMMATION
of
Hindawi Publishing Corporationhttp://www.hindawi.com Volume 2014
Behavioural Neurology
EndocrinologyInternational Journal of
Hindawi Publishing Corporationhttp://www.hindawi.com Volume 2014
Hindawi Publishing Corporationhttp://www.hindawi.com Volume 2014
Disease Markers
Hindawi Publishing Corporationhttp://www.hindawi.com Volume 2014
BioMed Research International
OncologyJournal of
Hindawi Publishing Corporationhttp://www.hindawi.com Volume 2014
Hindawi Publishing Corporationhttp://www.hindawi.com Volume 2014
Oxidative Medicine and Cellular Longevity
Hindawi Publishing Corporationhttp://www.hindawi.com Volume 2014
PPAR Research
The Scientific World JournalHindawi Publishing Corporation http://www.hindawi.com Volume 2014
Immunology ResearchHindawi Publishing Corporationhttp://www.hindawi.com Volume 2014
Journal of
ObesityJournal of
Hindawi Publishing Corporationhttp://www.hindawi.com Volume 2014
Hindawi Publishing Corporationhttp://www.hindawi.com Volume 2014
Computational and Mathematical Methods in Medicine
OphthalmologyJournal of
Hindawi Publishing Corporationhttp://www.hindawi.com Volume 2014
Diabetes ResearchJournal of
Hindawi Publishing Corporationhttp://www.hindawi.com Volume 2014
Hindawi Publishing Corporationhttp://www.hindawi.com Volume 2014
Research and TreatmentAIDS
Hindawi Publishing Corporationhttp://www.hindawi.com Volume 2014
Gastroenterology Research and Practice
Hindawi Publishing Corporationhttp://www.hindawi.com Volume 2014
Parkinson’s Disease
Evidence-Based Complementary and Alternative Medicine
Volume 2014Hindawi Publishing Corporationhttp://www.hindawi.com