The extent to which organisations in Zimbabwe ... - CiteSeerX

Predicting Final Extent of Ischemic Infarction UsingArtificial Neural Network Analysis of Multi-ParametricMRI in Patients with StrokeHassan Bagher-Ebadian1,2*, Kourosh Jafari-Khouzani3, Panayiotis D. Mitsias1, Mei Lu4, Hamid Soltanian-
Zadeh3,5, Michael Chopp1,2, James R. Ewing1,2,6,7
1 Department of Neurology, Henry Ford Hospital, Detroit, Michigan, United States of America, 2 Department of Physics, Oakland University, Rochester, Michigan, United
States of America, 3 Department of Diagnostic Radiology, Henry Ford Hospital, Detroit, Michigan, United States of America, 4 Department of Biostatistics and Research
Epidemiology, Henry Ford Hospital, Detroit, Michigan, United States of America, 5 Control and Intelligent Processing Center of Excellence (CIPCE), School of Electrical and
Computer Engineering, University of Tehran, Tehran, Iran, 6 Department of Physiology, Wayne State University, Detroit, Michigan, United States of America, 7 Department
of Neurology, Wayne State University, Detroit, Michigan, United States of America
Abstract
In hemispheric ischemic stroke, the final size of the ischemic lesion is the most important correlate of clinical functionaloutcome. Using a set of acute-phase MR images (Diffusion-weighted - DWI, T1-weighted – T1WI, T2-weighted-T2WI, andproton density weighted - PDWI) for inputs, and the chronic T2WI at 3 months as an outcome measure, an Artificial NeuralNetwork (ANN) was trained to predict the 3-month outcome in the form of a voxel-by-voxel forecast of the chronic T2WI.The ANN was trained and tested using 12 subjects (with 83 slices and 140218 voxels) using a leave-one-out cross-validationmethod with calculation of the Area Under the Receiver Operator Characteristic Curve (AUROC) for training, testing andoptimization of the ANN. After training and optimization, the ANN produced maps of predicted outcome that were wellcorrelated (r = 0.80, p,0.0001) with the T2WI at 3 months for all 12 patients. This result implies that the trained ANN canprovide an estimate of 3-month ischemic lesion on T2WI in a stable and accurate manner (AUROC = 0.89).
Citation: Bagher-Ebadian H, Jafari-Khouzani K, Mitsias PD, Lu M, Soltanian-Zadeh H, et al. (2011) Predicting Final Extent of Ischemic Infarction Using ArtificialNeural Network Analysis of Multi-Parametric MRI in Patients with Stroke. PLoS ONE 6(8): e22626. doi:10.1371/journal.pone.0022626
Editor: Yong He, Beijing Normal University, China
Received April 15, 2011; Accepted June 27, 2011; Published August 10, 2011
Copyright: � 2011 Bagher-Ebadian et al. This is an open-access article distributed under the terms of the Creative Commons Attribution License, which permitsunrestricted use, distribution, and reproduction in any medium, provided the original author and source are credited.
Funding: This work is supported by National Institutes of Health grant 1-R03-NS061170. The funders had no role in study design, data collection and analysis,decision to publish, or preparation of the manuscript.
Competing Interests: The authors have declared that no competing interests exist.
* E-mail: [email protected]
Introduction
In hemispheric ischemic stroke which is caused by blockage of a
blood vessel, the clinical outcome is strongly related to the final
size of the ischemic infarct [1,2,3]; generally speaking the more
extensive the damage to the brain parenchyma, the worse the
patient’s clinical outcome is likely to be, although this is of course
also dependent on location. As a measure of tissue recovery, and
strongly related to patient outcome, MRI T2-weighted imaging at
3 months post-ictus is generally accepted as the gold-standard [4].
Consequently, during the acute phase of ischemic stroke, a fast
and reliable identification of the ischemic lesion, its extent, and a
prediction as to its fate, might aid clinical decision-making and
help to maximize benefit and minimize side effects of a therapeutic
intervention [5,6]. Many studies, by correlating with follow-up
imaging or neurological status, have shown the potential for
diffusion weighted imaging (DWI), perfusion weighted imaging
(PWI), and/or T2-weighted (T2WI) magnetic resonance imaging
(MRI) used together for staging stroke outcome [3,7,8]. Most of
these analyses were performed using as an outcome metric the
volume of a region-of-interest (ROI) defined by the difference
between an acute data set and the outcome image [9,10,11]. For
instance, it has been shown that an unsupervised clustering
technique such as ISODATA (Iterative Self-Organizing Data
Analysis) can utilize combined MRI data sets from the acute phase
[2,12] and the subacute phase [5] post-stroke to predict final
infarct volume and thus produce a time-independent surrogate
MRI outcome predictor [13,14,15,16,17]. However ISODATA
has some significant drawbacks.
Maps produced in ISODATA are sharply delineated, and not
approximately continuous as in the outcome measure, the T2WI
[18]. Furthermore, to a large extent, ISODATA mapping and
standardization does not produce an easily visualized association
between the map and the outcome measure. Additional problems
in the ISODATA technique include: ISODATA’s instability in the
presence of image artifacts and noise, its sensitivity to initial
conditions, uncertainty as to the underlying variances of the
clusters, and its dependence on the assumption of normality for the
distribution of clustered data [19]. Thus, ISODATA and related
approaches, while useful, do not provide a voxel-by-voxel
judgment as to the potential for eventual infarction; finding a
continuous predictor for infarction remains an open problem
[20,21].
Statistical approaches such as Probability-of-Infarct Profile (PIP)
and Generalized Linear Model (GLM) algorithms constructed
based on ADC and CBF maps (in animal models of acute stroke),
or combining DWI and PWI MRI (in patients), have shown good
sensitivity and specificity in predicting the outcome in brain
PLoS ONE | www.plosone.org 1 August 2011 | Volume 6 | Issue 8 | e22626

parenchyma after stroke [22,23]. The success of these methods
suggests that probabilistic voxel-based approaches may have a
significant predictive ability, and therefore may be useful in
predicting response to therapies administered in the immediate
aftermath of a catastrophic cerebral ischemic event.
Combining GLM and Spatial Auto Regressive (SAR) models
may help improve the predictive ability as to the fate of infracted
parenchyma [24,25]. However, this process is not fully automated,
since it requires the acute stroke area to be identified by a
neurologist. In terms of establishing its coefficients, the GLM-SAR
methods demand a large sample size to generate a reliable
estimate of model parameters.
In a recent study [26], the final infarct volume in patients
treated with IV rt-PA (recombinant Tissue Plasminogen Activator)
was predicted by an artificial neural network (ANN) model that
combined both clinical and imaging variables [National Institutes
of Health Stroke Scale (NIHSS) and DWI images]. Although this
study demonstrated that an ANN was capable of predicting tissue
fate using acute information, there was no voxel-by-voxel
prediction of outcome; rather this study focused on prediction of
chronic lesion size regardless of its pattern, location and
distribution.
This paper presents an ANN model that incorporates an easily
obtained data set, and one that is not strongly technique-
dependent, to predict the stroke outcome with a power of
prediction that approaches the methods discussed above. While
the paper does not explicitly address the matter of the minimal
MRI data set required for prediction of tissue outcome, it is
notable that a reasonably strong predictive power was achieved in
a data set that did not include an acute PWI set. The ANN
technique thus provides a very fast (essentially real-time),
approximately continuous, and intuitive mapping of the predicted
outcome, while preserving the time-independent and multi-
parametric strengths of clustering approaches.
Materials and Methods
Ethics StatementThis research has been approved by the Henry Ford Health
System Institutional Review Board. We obtained written informed
consent from all participants in the study.
HypothesisWe hypothesized that, given a T2WI at the chronic stage of
stroke (3 months post-stroke), an ANN might be trained to directly
predict the size and pattern of the tissue recovery from the
information available in acute phase MR images.
Patients and MRI studiesTwelve patients (with a total of 83 slices) with acute neurological
deficit consistent with ischemic stroke, and MRI studies within
24 hours of onset (defined as the last time the patient was known to
be without neurological deficit), were selected. The severity of
neurological deficit was assessed at the time of the MRI study
using the NIHSS score. MRI studies were performed at the acute
time point (,24 h post-ictus), and at outcome (3 months post-
ictus). Patients with cerebral hemorrhage, a history of prior stroke
or other neurological disorders hampering interpretation of the
neurological outcome were excluded. The study was approved by
the Institutional Review Board.
An acute-phase MR image set consisting of a T1-weighted
(T1WI), T2WI, DWI and proton density (PDWI) was selected as
the input set to the ANN. The co-registered three month T2WI,
considered to be the gold standard for final infarct size (and
estimation of the tissue recovery), was employed as the training set.
MRI studies were acquired on a 1.5-Tesla GE Signa MR
scanner with echo-planar capability (GE, Milwaukee, WI). Each
MRI study consisted of axial multispin echo T2WI, and DWI with
slice thickness 6 mm. The field of view (FOV) was 2406240 mm.
For T1WI and T2WI, the matrix was 2566192 and for DWI
1286128. Additional parameters for each study were: (a) T1WI:
TR/TE = 600/14 ms; (b) T2WI: TR/TE = 2,800/30, 60, 90,
120 ms; (c) axial DWI was performed using an echo-planar
sequence, TR/TE = 10,000/101 ms, b-values = 1,000, 600, 300,
0 s/mm2, sequential application of three separate diffusion-
sensitizing gradients in perpendicular directions, 1 NEX.
For each patient, four image sets (T1WI, T2WI, DWI and
PDWI) at the acute time point were selected to provide input
features to the ANN. All acute- and chronic phase images were
registered to the acute T2WI using Eigentool software [27]. To
reduce mis-registration effects, images were smoothed using a
unity filter with a 363 window, and the smoothed images were
then normalized to their mean value, thus creating a feature set
insensitive to the MR system gain.
ROIs were defined by thresholding the 3-month T2WI to
outline the region of infarction. This region was reflected around
the midline and adjusted so that the resultant region selected a
visually normal contralateral area of tissue, so as to approximately
balance normal and infarcted tissue. Prevalence which refers to the
ratio of number of samples from the lesion area divided by the
total number of samples from the lesion and normal areas was
about 57%. The selected infarcted and normal regions were used
together as inputs to the ANN.
Input and Training Set for the ANNUsing the normalized data from the selected ROIs (83 slices,
and 140218 voxels, representing total number of the training
samples for all subjects) drawn by the study neurologist (PDM), a
feature set was generated from the four selected acute-phase
images and presented to a feed-forward multilayer perceptron
(MLP) with back propagation training algorithm as an input
vector. In this type of ANN, as shown in Figure 1, the nodes are
organized in the input layer, hidden layers, and the output layer.
Nodes are interconnected by weights in such a way that
information propagates from one layer to the next through a
sigmoid (bipolar) activation function. Learning rate and momen-
tum factors control the internode weight adjustment during the
training. A back propagation learning strategy [28,29,30] was
employed for training the ANN in a supervised mode. In this
strategy, a trial set of weights (the weight vectors, one vector for
each layer of the ANN) is proposed. The input vectors (a set of 4
voxels extracted from 4 normalized modalities such as DWI,
T1WI, T2WI and PDWI) are presented to the ANN, and the
output result compared to the class identifier (in our case, this was
the co-registered T2WI image at three month study). The weight
vectors are then adjusted to minimize some measure of error, i.e.,
the Mean Square Error (MSE) between the output of the ANN
and the normalized T2WI at three months (training set). This
procedure is performed iteratively across the entire data set.
Batch processing was used to improve the convergence rate and
the stability of training. The weight changes obtained from each
training case were accumulated, and the weights updated after the
entire set of training cases was evaluated. Batch processing
improves stability, but with a tradeoff in the convergence rate
[30,31]. A leave-one-out cross-validation method was employed
for training, testing, and network optimization [31,32] where the
Predicting Final Extent of Ischemic Infarction
PLoS ONE | www.plosone.org 2 August 2011 | Volume 6 | Issue 8 | e22626

one in the leave-one-out was all data, i.e., all multiple voxel image
sets in an entire patient study.
The leave-one-out validation method is a member of the set of
cross validation methods, where all data are used for fitting (but
not at the same time, of course). Its prediction is based on a large
data set, which leads to small prediction errors, and is superior for
small data sets, compared to data split-sample validation [33].
ANN Optimization and Calculation of the ANNGeneralization Error
To generalize the ANN, i.e., to allow its application to a wide
range of inputs, we needed to avoid both under-fitting of the
training data (which generates a high variance in the output
estimate) and over-fitting of the training data (which produces
biased outputs). There are a number of strategies for assuring
generalization:
1. Optimize the number of free parameters (independent
connection weights) in the model (e.g., the number of neurons
in each layer and the number of layers).
2. Stop the gradient descent training at an appropriate point.
3. Add noise to the training patterns to smooth out the data
points.
Strategy number 3 is employed in cases where local minima
‘‘trap’’ the ANN optimization process. Since no trapping was
observed, strategy number 3 was not employed in this study. To
employ strategies number 1 and 2, we must estimate from our
training data what the generalization error is likely be. A leave-
one-out method was employed for training, testing, and network
optimization [30,31,32,34]. To characterize the generalization
error, we trained and validated the ANN by the leave-one-out
method, which is a special case of the K-Fold Cross Validation
(KFCV) method, using the area under the receiver operating curve
(AUROC) as a cost function [31,32,35,36].
In this study, each fold consisted of one full case (patient), thus
the K folding cross-validation (KFCV) method was that of leave-
one-out. The leave-one-out method is one of the most powerful
versions of the KFCV method; it has been shown that the Correct
Classification Fraction (CCF) of the leave-one-out method is an
important statistical estimator of the performance of a learning
algorithm [37]. The performance of the leave-one-out method is
frequently used for estimation of the generalization error [38,39].
In KFCV, the training data are divided into K distinct subsets
(K = 12, one case in each fold); the network is then trained using K-
1 subsets, and tested on the remaining subset (the left out case).
The process of training and testing is then repeated for each of the
K possible choices of the subset omitted from the training. The
average Correct Classification Fraction (CCF) versus different
epochs (epoch refers to each trial and error for decreasing the
MSE of the ANN in the batch processing mode) for the K omitted
subsets was plotted and the epoch corresponding to 10% of its
plateau was taken to be the stopping epoch. The MSE of the ANN
for all K subsets at different stopping epochs was calculated and its
average value was taken as the ‘stopping error’ for the optimal
ANN.
This procedure has the advantage that it allows us to use a high
proportion of the available training data, a fraction (1–1/K), for
training, while making use of all the data points in estimating the
generalization error or agreement. The cost is that the process can
be lengthy, since we need to train and evaluate the network K times.
Typically, K<10 is considered reasonable [32,36]. In this study, K
was set to 12 for 12 patients (one case in each fold) and the ANN had
a single output, to predict a T2WI at the chronic time point.
To measure how accurately this ANN matched the whole input
dataset (each set of MR modalities for all voxels) with the entire
Figure 1. ANN diagram for phase of training and prediction. As shown in this figure, 4 MR image modalities are input to the ANN to predictT2WI at three month. Note that the MR modalities are normalized to their brain mean values before feeding to the ANN.doi:10.1371/journal.pone.0022626.g001
Predicting Final Extent of Ischemic Infarction
PLoS ONE | www.plosone.org 3 August 2011 | Volume 6 | Issue 8 | e22626

outcome set (each voxel in all 3-month T2WI studies), as shown in
Figure 2-A, the ANN’s CCF which is the ratio of the accumulated
number of voxels successfully classified by the ANN, divided by the
number of all voxels shown to the ANN at specific epoch was
generated at different levels of epochs during the leave-one-out
validation procedure.
True-Positive-Fraction (TPF), sensitivity, is the fraction of voxels
that actually are lesion and are correctly predicted as lesion. True-
Negative-Fraction (TNF), specificity, is the fraction of voxels that
actually are normal and are correctly predicted as normal. False-
Positive-Fraction (FPF) is equal to (1-specificity) and is considered
as the confidence level (CL). Thus at each confidence level (1-
specificity), the AUROC is proportional to the TPF which is
proportional to the Correct Classification Fraction Each [36,40].
The Area Under the Correct Classification Fraction (AUCCF),
which is proportional to the AUROC (Az) value, was used as an
index to compare the ANN’s performance, to determine the
optimal architecture of the ANN, and to find the ANN
termination error [36,40]. True-Positive-Fraction (TPF), sensitiv-
ity, is the fraction of voxels that actually are lesion and are
correctly predicted as lesion. KFCV (leave-one-out) set was trained
until its error was below a defined termination error (i.e., the point
at which the training procedure was stopped). The termination
error was set by determining the error at the 10% point of the
CCF’s plateau.
The number of hidden layer nodes may affect the performance
of the ANN classifier [32,35]. Since the ANN could not be trained
by less than 3 neurons in its first hidden layer, layer and node
optimization were done by maximizing the AUCCF value for its
second hidden layer as a function of the number of nodes.
Internally, in the ANN, the activation function of the ANN
neurons is a sigmoid function that is most easily programmed to
work in a polar mode between 21 and 1; the output of the single
output neuron is a continuous function with a mean of 1 (range 0–
3), since the training set T2WIs were normalized to their mean
value (mean value of the brain). To test, optimize and validate the
ANN using the CCF, the minimum acceptable interval for the
T2WI signal intensity change was calculated and then the values
of the ANN output and the gold standard maps of training (T2WI)
both were broken down into discrete fragments using a small
window (0.05). In order to present an easily understood
comparison, the response of the trained ANN was compared to
the chronic T2WI (gold standard) by calculating a correlation
coefficient using all of the voxel comparisons (with 0.05 windows)
available and ROC curve of the optimal ANN.
To study the early prediction of ANN MRI at acute phase to the
chronic ischemic infarction at 3 months after stroke, the linear
regression model was used based on voxel data (n = 140218),
adjusted for cluster (patient, N = 12) using PROC SURVEYREG
in SAS [41]. The analysis tested significant correlation of the acute
ANN MRI to 3-month infraction; followed by calculation of the
correlation coefficient, r for predictive ability.
Results
The demographic and clinical characteristics of the patients
included in the study are summarized in table 1. The mean age
was 56.25611.56 years. The ischemic stroke subtype was:
cardioembolsim (n = 2), large vessel atherosclerosis (n = 3), small
vessel disease (n = 3), cryptogenic (n = 4). The time interval from
symptom onset to acute-phase MRI study was 11.3264.36 hours,
and from symptom onset to outcome MRI study was 95.75622.54
days.
Training and validation objectives of the ANN were accom-
plished in the KFCV (leave-one-out) method. As in Figure 1, a set
of 4 feature vectors extracted from DWI, T1WI, T2WI and PDWI
were presented to the ANN and the performance of the ANN with
respect to its number of second hidden layer nodes was examined
by considering the AUCCF value at a Leave-One-Out termina-
tion error (MSE) of (MSE = 0.06,35 epochs).
Figure 2. A Correct Classification Fraction versus epochs for the optimal ANN (4:3:3:1) using 83 slices of twelve patients with 12folds. Note the termination epoch is around 35, which is corresponding to 10% of CCF curve plateau. 2-B: Area Under Correct Classification Fraction(AUCCF) curve versus number of neurons in the second hidden layer. As shown in this figure, AUCCF is maximum for three neurons in the secondhidden layer.doi:10.1371/journal.pone.0022626.g002
Predicting Final Extent of Ischemic Infarction
PLoS ONE | www.plosone.org 4 August 2011 | Volume 6 | Issue 8 | e22626

The ANN was trained and tested for a set of normal and lesion
ROIs. For a statistically reliable comparison, and to increase the
ANN’s accuracy for lesion detection, map sampling was done at a
prevalence of about 57% by choosing regions of interest (ROIs)
from normal tissue with about the same area of the lesion. The
optimal ANN ([4+1 bias] : [3+1 bias] : [3+1 bias], [1]) was found
by maximization of the AUCCF value for one hidden layer. In
Figure 2-A, a plot of the CCF curve (for the optimal ANN; 4:3:3:1)
and in Figure 2-B the AUCCF vs. the number of neurons in the
hidden layer for a stopping error of 0.06, learning rate of 0.01 and
momentum of 0, are shown. As Figure 2-B demonstrates, the
maximum value of the AUCCF (,0.80) gives the optimal number
of neurons (three neurons plus one bias) in the second hidden
layer.
Using all 12 patients (83 slices, and 140218 voxels), the trained
and optimal ANN ([4+1 bias] : [3+1 bias] : [3+1 bias],[1])
generated maps that were well correlated (r = 0.80, p,0.0001)
with the chronic T2WI. Figure 3 contains twelve exemplary (from
9 different patients) whole-brain voxel-wise results, generated by
the trained ANN, showing the acute DWI study (left-hand
column), the chronic T2WI (middle column), and the ANN
outcome predicted by the acute image set (right-hand column).
As Figure 3 demonstrates, the whole-brain voxel-wise predic-
tions generated in seconds by the trained and optimal ANN, are
visually similar to their corresponding chronic T2WI; the pattern
of the lesion predicted by the ANN are well matched with their
three-month lesion in both training and test examples. Note that
the continuity of the ANN output provides a more graded
prediction regarding the outcome tissue viability compared to
other statistical techniques such as ISODATA. Although the ANN
predictions in most of the cases shown in Figure 3 are highly
correlated with their corresponding T2WI, the ANN predictions
in the last two cases of both columns are not strongly in agreement
with their corresponding T2WI. The possible sources of these
errors are discussed below.
Figure 4 presents scatter plots of the ANN response versus
T2WI image at three months for lesion and control areas for all 12
patients. Note that in the normal scatter plot, there is a cluster
which is formed below 1.0 with a less scattered pattern. However,
in the lesion scatter plot, a cluster is formed above 1.0 with more
scattering and less density compared to the normal area.
More scattering pattern in the lesion plot represents the
capability of the ANN for estimating different levels of lesion with
different classes or intensity. The small values observed in the
lesion scatter plot are associated with the mis-registration errors
and the large values are associated with CSF area since the ANN is
forced to classify the CSF and lesion at the same time.
As noted, the ANN prediction for all 12 patients was highly
correlated (r = 0.80, p,0.0001) with the T2WI outcome measure
at three month. To estimate the overall performance of the trained
ANN, the ROC curve of the trained ANN (4:3:3:1) was generated
for all training samples and the Area Under ROC
(AUROC = 0.89, Average error = 0.11) was considered as the
performance of the trained ANN (see Figure 5). As shown in
Figure 5, the optimal sensitivity and specificity of the ANN were
calculated at the half angle and ROC curve intercept point
(SpecificityOptimal = 0.84, SensitivityOptimal = 0.85) which indicates
that the ANN can predict lesions with a sensitivity of 85% at a
specificity of 84%.
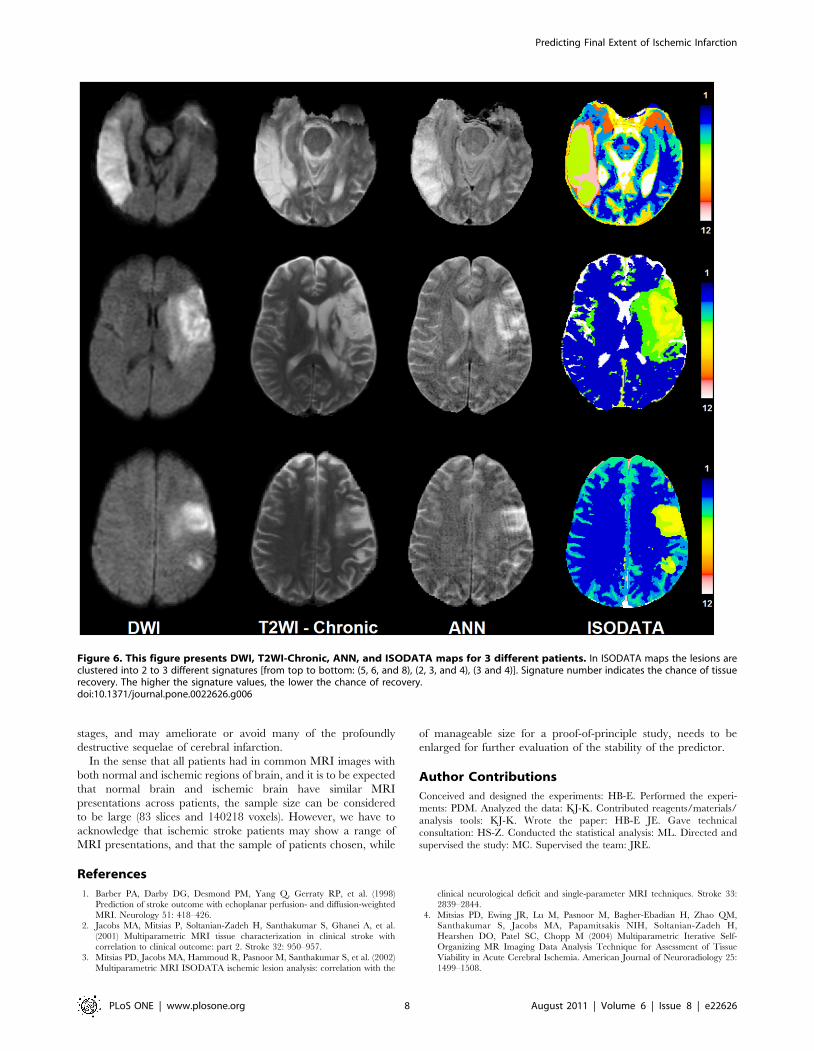
Figure 6 compares the results of the ISODATA technique with
those of the ANN. As shown in this figure the lesion areas in the
ISODATA maps are clustered to different signatures (1–12).
Signatures range between one (corresponding to normal tissue) to
twelve (corresponding to CSF or cavitated tissue). While the ANN
demonstrates a continuous map for the status of the tissue at risk in
the lesion area, the ISODATA shows just a few indices related to
tissue recovery after three months. Both techniques are in
agreement in the CSF area or dead tissue.
Discussion
Using a relatively small set of acute-phase MR images, an ANN
was trained and tested to directly predict the size and pattern of
the eventual tissue damage, as judged by T2WI at the chronic
stage of stroke (3 months after stroke onset). Since the predictor
produced by the ANN provides a visual estimate of the outcome,
such modeling may play an important role in the assessment of
therapeutic interventions applied within extended therapeutic
windows, currently of great interest in the treatment of stroke.
It must be noted that the training set was small (12 cases) in the
number of patients; that is why the leave-one-out method was used
for training and evaluation. However, even this small pilot study
demonstrates a robust and sensitive predictor of infarct outcome,
Table 1. Demographic table.
Pt Age/Gender Stroke Location Ischemic Stroke SubtypeOnset-Acute MRI(hours)
Onset-Outcome MRI(days)
1 42/M Left frontal Large vessel atherosclerosis 11.8 90
2 68/M Left basal ganglia-internal capsule Small vessel disease 9.3 95
3 42/M Left corona radiata - internal capsule Small vessel disease 10.6 103
4 59/M Left corona radiata-thalamus Cryptogenic 13.4 93
5 45/M Right frontal-parietal-temporal Cardioembolism 8.2 93
6 59/F Left internal capsule-thalamus Small vessel disease 8.2 104
7 68/M Right frontal-parietal Large vessel atherosclerosis 10.9 82
8 45/M Right parietal Cryptogenic 10.1 102
9 64/F Left frontal-parietal Cryptogenic 18.4 130
10 71/F Right frontal-parietal Large vessel atherosclerosis 5.4 39
11 67/F Right frontal-parietal Cardioembolism 20.7 124
12 45/M Right occipital-temporal Cryptogenic 8.9 94
doi:10.1371/journal.pone.0022626.t001
Predicting Final Extent of Ischemic Infarction
PLoS ONE | www.plosone.org 5 August 2011 | Volume 6 | Issue 8 | e22626

and because it can be produced almost as quickly as the image sets
emerge from the MRI scanner, this approach shows great
potential as a tool that may eventually influence clinical practice.
Although the ANN in this study was trained and validated with a
small sample size, the values of the AUROC (0.89), the optimal
specificity and sensitivity (0.84 and 0.85), and the average error
(0.11) achieved with the leave-one-out technique supports the
hypothesis that the ANN can reasonably predict lesions if it is
applied to a new dataset.
Since the ANN uses acute-phase information, any processing
errors due to mis-registration, image deformation due to edema
created by the lesion between different time points, image quality,
partial volume effects, image artifacts, and image uniformity are
potential sources of errors that can affect ANN results.
The results of the ANN implies that the trained ANN is a robust
discriminator between CSF and lesion areas since the intensities of
the CSF (dark) and lesion (bright) areas appear oppositely in DW
images but the same in the maps predicted by the ANN. However,
this might be a problem for the closely located lesions to the CSF
areas which can be easily confused in the interpretation phase by
means of a non-expert user (not the ANN).
The GLM-SAR study [24][25]showed that, compared to
algorithms using DWI or PWI separately, algorithms combining
acute DWI and PWI were superior in predicting the extent of final
tissue infarction. GLM models have the drawback of assuming
class boundaries to be hyperplanes in feature space. This
fundamentally linear model of response may not suffice to account
for the complex dependency of infarct risk upon the combined
metabolic and structural derangement reflected in the MR
perfusion and diffusion indices in ischemic tissue.
Clinical neurological recovery, as measured by the change in
NIHSS, can also be used as additional information for training the
ANN in acute to chronic time point [26]. The model presented by
Luby et al., was generated by a generalized regression neural
Figure 3. Examples of ANN-produced images in 12 exemplary MRI slices from 9 patients. Left column: DWI in acute study. Middle:outcome T2WI. Right: ANN predicted outcome from acute image set. The last slices in both columns present the least reliable prediction of the ANN.doi:10.1371/journal.pone.0022626.g003
Predicting Final Extent of Ischemic Infarction
PLoS ONE | www.plosone.org 6 August 2011 | Volume 6 | Issue 8 | e22626

network (GRNN) trained using such baseline information as sex,
age, NIHSS, stroke onset time to MRI scan time, and
corresponding values for follow-up: modified Rankin Score
(mRS), follow-up NIHSS, baseline lesion volume on diffusion
weighted MRI, baseline hypoperfusion volume (on MTT map),
follow-up reperfusion (reduction of MTT volume by at least 30%),
and final infarct volume on FLAIR MRI. The GRNN approach
offers the possibility that our study, focused as it was on the
estimation of the lesion volume regardless of its pattern and
location in the brain, could further benefit from additional clinical
and imaging information; it may be possible to form a more
clinically relevant prediction of outcome by including the NIHSS
score as an input to the ANN, in addition to the feature set
currently in use.
Most of multi-parametric analysis techniques such as ISO-
DATA, Fuzzy clustering, and Kohonen’s Multi-Parametric Self-
Organizing Map (KMP-SOM), employ the theory of information
extraction for predicting tissue fate at three months using MR
acute information, regardless of chronic information. The chronic
information is used just for validation and assessment of these
techniques. To date the only method that we know of that has
used chronic information for segmentation prediction is the GLM-
SAR [24]. As we have noted, there is still a remaining question as
to whether a linear model is inherently the correct model for stroke
outcome prediction. Unlike the GLM-SAR, the ANN combines
acute information with no prior assumption about the linearity of
information in its combination.
A fast, robust, and time-independent predictor of stroke
outcome raises the possibility of real-time evaluation of evolving
stroke in the acute and subacute phase. We will assess the
possibility that the ANN predictor of outcome T2WI is essentially
time-independent, because the acute/subacute T2WI image, with
its increasing contrast with time post-ictus, can independently
provide a measure of the post-stroke duration.
This study used untreated patients to train an adaptive ANN for
predicting the tissue fate in absence of any drug or treatment. Its
performance in treated patient populations remains to be assessed.
We speculate that if, the trained ANN uses the MR information of
treated patients before and after the course of treatment,
differences between the predicted outcome lesions (prior to, and
after, treatment) might be a measure of treatment efficacy. Thus,
given effective treatments, a real-time predictor of outcome can
produce a paradigm shift in the treatment of stroke in all its early
Figure 4. Scatter plots of the optimized ANN (4:3:3:1) for predicting lesion and normal areas of 83 slices in 12 patients compare totheir T2WI at chronic (gold standard). As shown in these figures, the ANN prediction is highly correlated (Total voxels: 140218, r = 0.80, p,0.0001) with the T2WI at three month.doi:10.1371/journal.pone.0022626.g004
Figure 5. ROC curve (AUROC = 0.89) for the trained ANN(4:3:3:1). As shown in this Figure, the optimal sensitivity and specificityof the ANN are calculated at the half angle and ROC curve interceptpoint (Point Opt.; Specificity Optimal = 0.84, Sensitivity Optimal = 0.85)which implies that the ANN can predict lesion and tissue with asensitivity of 85% and a specificity of the 84%.doi:10.1371/journal.pone.0022626.g005
Predicting Final Extent of Ischemic Infarction
PLoS ONE | www.plosone.org 7 August 2011 | Volume 6 | Issue 8 | e22626
stages, and may ameliorate or avoid many of the profoundly
destructive sequelae of cerebral infarction.
In the sense that all patients had in common MRI images with
both normal and ischemic regions of brain, and it is to be expected
that normal brain and ischemic brain have similar MRI
presentations across patients, the sample size can be considered
to be large (83 slices and 140218 voxels). However, we have to
acknowledge that ischemic stroke patients may show a range of
MRI presentations, and that the sample of patients chosen, while
of manageable size for a proof-of-principle study, needs to be
enlarged for further evaluation of the stability of the predictor.
Author Contributions
Conceived and designed the experiments: HB-E. Performed the experi-
ments: PDM. Analyzed the data: KJ-K. Contributed reagents/materials/
analysis tools: KJ-K. Wrote the paper: HB-E JE. Gave technical
consultation: HS-Z. Conducted the statistical analysis: ML. Directed and
supervised the study: MC. Supervised the team: JRE.
References
1. Barber PA, Darby DG, Desmond PM, Yang Q, Gerraty RP, et al. (1998)
Prediction of stroke outcome with echoplanar perfusion- and diffusion-weighted
MRI. Neurology 51: 418–426.2. Jacobs MA, Mitsias P, Soltanian-Zadeh H, Santhakumar S, Ghanei A, et al.
(2001) Multiparametric MRI tissue characterization in clinical stroke withcorrelation to clinical outcome: part 2. Stroke 32: 950–957.
3. Mitsias PD, Jacobs MA, Hammoud R, Pasnoor M, Santhakumar S, et al. (2002)
Multiparametric MRI ISODATA ischemic lesion analysis: correlation with the
clinical neurological deficit and single-parameter MRI techniques. Stroke 33:
2839–2844.
4. Mitsias PD, Ewing JR, Lu M, Pasnoor M, Bagher-Ebadian H, Zhao QM,Santhakumar S, Jacobs MA, Papamitsakis NIH, Soltanian-Zadeh H,
Hearshen DO, Patel SC, Chopp M (2004) Multiparametric Iterative Self-Organizing MR Imaging Data Analysis Technique for Assessment of Tissue
Viability in Acute Cerebral Ischemia. American Journal of Neuroradiology 25:
1499–1508.
Figure 6. This figure presents DWI, T2WI-Chronic, ANN, and ISODATA maps for 3 different patients. In ISODATA maps the lesions areclustered into 2 to 3 different signatures [from top to bottom: (5, 6, and 8), (2, 3, and 4), (3 and 4)]. Signature number indicates the chance of tissuerecovery. The higher the signature values, the lower the chance of recovery.doi:10.1371/journal.pone.0022626.g006
Predicting Final Extent of Ischemic Infarction
PLoS ONE | www.plosone.org 8 August 2011 | Volume 6 | Issue 8 | e22626

5. Lu M, Mitsias PD, Ewing JR, Soltanian-Zadeh H, Bagher-Ebadian H, et al.
(2005) Predicting final infarct size using acute and subacute multiparametricMRI measurements in patients with ischemic stroke. J Magn Reson Imaging 21:
495–502.
6. Albers GW (1999) Expanding the window for thrombolytic therapy in acutestroke. The potential role of acute MRI for patient selection. Stroke 30:
2230–2237.7. Oppenheim C, Grandin C, Samson Y, Smith A, Duprez T, et al. (2001) Is there
an apparent diffusion coefficient threshold in predicting tissue viability in
hyperacute stroke? Stroke 32: 2486–2491.8. Arenillas JF, Rovira A, Molina CA, Grive E, Montaner J, et al. (2002) Prediction
of early neurological deterioration using diffusion- and perfusion-weightedimaging in hyperacute middle cerebral artery ischemic stroke. Stroke 33:
2197–2203.9. Grandin CB, Duprez TP, Smith AM, Oppenheim C, Peeters A, et al. (2002)
Which MR-derived perfusion parameters are the best predictors of infarct
growth in hyperacute stroke? Comparative study between relative andquantitative measurements. Radiology 223: 361–370.
10. Montalescot G, Barragan P, Wittenberg O, Ecollan P, Elhadad S, et al. (2001)Platelet glycoprotein IIb/IIIa inhibition with coronary stenting for acute
myocardial infarction. N Engl J Med 344: 1895–1903.
11. Baird AE, Benfield A, Schlaug G, Siewert B, Lovblad KO, et al. (1997)Enlargement of human cerebral ischemic lesion volumes measured by diffusion-
weighted magnetic resonance imaging. Ann Neurol 41: 581–589.12. Schaefer PW, Hunter GJ, He J, Hamberg LM, Sorensen AG, et al. (2002)
Predicting cerebral ischemic infarct volume with diffusion and perfusion MRimaging. AJNR Am J Neuroradiol 23: 1785–1794.
13. Butcher KS, Parsons M, MacGregor L, Barber PA, Chalk J, et al. (2005)
Refining the perfusion-diffusion mismatch hypothesis. Stroke 36: 1153–1159.14. Eckert B, Koch C, Thomalla G, Kucinski T, Grzyska U, et al. (2005) Aggressive
therapy with intravenous abciximab and intra-arterial rtPA and additionalPTA/stenting improves clinical outcome in acute vertebrobasilar occlusion:
combined local fibrinolysis and intravenous abciximab in acute vertebrobasilar
stroke treatment (FAST): results of a multicenter study. Stroke 36: 1160–1165.15. Koga M, Reutens DC, Wright P, Phan T, Markus R, et al. (2005) The existence
and evolution of diffusion-perfusion mismatched tissue in white and gray matterafter acute stroke. Stroke 36: 2132–2137.
16. The Abciximab in Ischemic Stroke Investigators (2000) Abciximab in acuteischemic stroke: a randomized, double-blind, placebo-controlled, dose-escalation
study. The Abciximab in Ischemic Stroke Investigators. Stroke 31: 601–609.
17. Abciximab Emergent Stroke Treatment Trial (AbESTT) Investigators (2005)Emergency administration of abciximab for treatment of patients with acute
ischemic stroke: results of a randomized phase 2 trial. Stroke 36: 880–890.18. Mitsias PD, Ewing JR, Lu M, Khalighi MM, Pasnoor M, et al. (2004)
Multiparametric iterative self-organizing MR imaging data analysis technique
for assessment of tissue viability in acute cerebral ischemia. AJNRAm J Neuroradiol 25: 1499–1508.
19. Soltanian-Zadeh H, Bagher-Ebadian H, Ewing JR, Mitsias PD, Kapke A, et al.(2007) Multiparametric iterative self-organizing data analysis of ischemic lesions
using pre- or post-Gd T1 MRI. Cerebrovasc Dis 23: 91–102.20. Thijs VN, Lansberg MG, Beaulieu C, Marks MP, Moseley ME, et al. (2000) Is
early ischemic lesion volume on diffusion-weighted imaging an independent
predictor of stroke outcome? A multivariable analysis. Stroke 31: 2597–2602.
21. Menezes NM, Ay H, Wang Zhu M, Lopez CJ, Singhal AB, et al. (2007) The real
estate factor: quantifying the impact of infarct location on stroke severity. Stroke38: 194–197.
22. Shen Q, Ren H, Fisher M, Duong TQ (2005) Statistical prediction of tissue fate
in acute ischemic brain injury. J Cereb Blood Flow Metab 25: 1336–1345.23. Wu O, Sumii T, Asahi M, Sasamata M, Ostergaard L, et al. (2007) Infarct
prediction and treatment assessment with MRI-based algorithms in experimen-tal stroke models. J Cereb Blood Flow Metab 27: 196–204.
24. Nguyen VH, Cooperman G, Menenzes N, Lopez CJ, Melinosky C, et al. (2008)
Stroke tissue outcome prediction using a spatially-correlated model. Programand Proceedings of PPIC ’08,Tokyo:Pan-Pacific Imaging Conference ’08.
Tokyo, Japan: Imaging Society of Japan. pp 238–241.25. Nguyen VH, Cooperman G, Menenzes N, Lopez CJ, Melinosky C, et al. (2008)
The Imaging Society of Japan. pp 238–241.26. Luby M, Jothen LJ, Jose GM, Bykowski JL, Bethesda MD, et al. (2008) Neural
Network Model for Prediction of Final Infarct Volume in Treated versus Untreated
Stroke Patients. Storke-Neurologische Klinik. Erlangen, Germany. 588 p.27. Windham JP, Abd-Allah MA, Reimann DA, Froelich JW, Haggar AM (1988)
Eigenimage filtering in MR imaging. J Comput Assist Tomogr 12: 1–9.28. McCulloch WS, Pitts W (1990) A logical calculus of the ideas immanent in
nervous activity. 1943. Bull Math Biol 52: 99–115; discussion 173–197.
29. Gurney K (1997) An Introduction to Neural Networks. London: Routlege. 288p.
30. Freeman J, Skapura D (1991) Neural Network-Algorithms, Applications andProgramming Techniques. Reading, MA: Addison-Wesley. 401 p.
31. Looney C (1997) Pattern recognition using neural networks: theory andalgorithms for engineers and scientists. New York: Oxford University Press. 458
p.
32. Bishop C (1997) Neural Networks for Pattern Recognition. London-UnitedKingdom: Oxford University Press. 504 p.
33. Goutte C (1997) Note on free lunches and cross-validation. Neural Computation9: 1245–1249.
34. Buscema M (2002) A brief overview and introduction to artificial neural
networks. Subst Use Misuse 37: 1093–1148.35. Bagher-Ebadian H, Soltanian-Zadeh H, Seayeshi S, Smith ST (2004) Neural
Network and Fuzzy Clustering Approach for Automatic Diagnosis of CoronaryArtery Disease in Nuclear Medicine. IEEE Transactions on Nuclear Science 51:
184–192.36. Bagher-Ebadian H, Nagaraja TN, Paudyal R, Whitton P, Panda S, et al. (2007)
MRI estimation of contrast agent concentration in tissue using a neural network
approach. Magn Reson Med 58: 290–297.37. Elisseeff A, Pontil M (2005) Leave-one-out error and stability of learning
algorithms with applications Stability of Randomized Learning AlgorithmsSource. Journal of Machine Learning Research 6: 55–79.
38. Stone M (1974) Cross-validatory choice and assessment of statistical predictions
(with discussion). Journal of the Royal Statistical Society B 36: 111–147.39. Scholkopf B, Smola AJ (2002) Learning with Kernels. Cambridge, MA: The
MIT Press.40. Hosseini-Ashrafi ME, Bagherebadian H, Yahaqi E (1999) Pre-optimization of
radiotherapy treatment planning: an artificial neural network classification aidedtechnique. Phys Med Biol 44: 1513–1528.
41. SAS Institute I (2004) SAS/STATH 9.1 User’s Guide. CaryNorth Carolina: SAS
Institute Inc. 2004.
Predicting Final Extent of Ischemic Infarction
PLoS ONE | www.plosone.org 9 August 2011 | Volume 6 | Issue 8 | e22626
Copyright © 2022 FDOKUMEN