
Multiparametric display of spin‐echo data from MR studies of brain
9
Multiparametric Display of Spin-Echo Data from MR Studies of Brainl Bruno Alfano, MS . Arturo Brunetti, MD . Margherita Arpaia, MS . Andrea Ciarmiello, MD Eugenio M. Covelli, MD . Marco Salvatore, MD A magnetic resonance (MR) lmage processing technique that uses a single color image for si- multaneous presentation of spin-echo informa- tion and lts application to MR studies of the brain is described. Relaxation rate and proton-density maps were calculated from 16O brain MR studies performed at 1.5 and 1.O î \Fith standard spin- echo sequences. Maps were fused into single color imeefes, with Rl, R2, and proton density coded, respectlvely, by red, green, and blue. The possibil- ity of standardizing the technique was evaluated. Comparative analysis of color and conventional MR images of white matter disease and brain tu- mors was performed to assess intra- and interob- server variability. Unequivocal and reproducible chromatic characterization of normal brain struc- tures and a varlety of lesions was obtained. Intra- and interobsenrer analysis showed that color im- ages can be used as a diagnostic tool. îhe tech- nique may provide a slmplified and timesaving approach for interpretation and presentation of brain MR studies. Index ter:rrs: Brain. diseases. 10.36. 10.871 . Brain. MR. lO. 121411 . Brain neoplasms, MR, 10. 121411 . Image display . Image processing JMRI 1995; 5:217-225 Abbreviations: CSF = cerebrospinal fluid, N(H) = proton density, OMCI = quantitative magnetic color imaging. I From the Institute of Radiological Science, Centro CNR per la Medicina Nucleare, University Federico II, Naples, Italy (El.A., A.B., M.A., M.S.); and the Cancer Institute G. Pascale, Naples, Itafy @.C., E.M.C., M.S.). Received May 5, 1994; revision requested July 13; revision received and accepted August 9. Supported in part by Consiglio Nazionale delle Ricerche (CNR) and Associazione Italiana Ricerca sul Cancro. CNR has filed international patent application PCî/1T92/OO1 12 for the QMCI technique described herein. Address reprint requests to 8.A., Via Manzoni 2I3,l-8O122 Napoli, Italy o sMR, 1995 Original Research SPIN-ECHO SEQUENCES provide magnetic reso- nance (MR) images weighted with different param- eters (ie, relaxation times and proton density). From spin-echo data, relaxation maps can be obtained. The possibility of simultaneous presentation of mul- tiple signal intensity images (1-3) and relaxation time maps (4) with colors has been reported. Re- cently, the fusion of relaxation rate maps with hy- brid color images (5) and combined presentation of relaxation rates and proton density (NIHI) in a single full-color image (6) have been described as quantita- tive magnetic color imaging (QMCD. The aim of the present work was the optimization of this technique, allowing a global display of spin- echo information and application of this information to the study of the normal brain and of different brain diseases, \Mith an inter- and intraobserver analysis. O MATERIALS AND METHODS MR htstrumentation Three-component OMCI images, based on calcula- tion of Rl (1 /TL), R2 (1 /T2), and N(H) maps (Fig t), were obtained from 160 MR studies performed at 1.5 T (Magnetom SP 63; Siemens, Erlangen, Germany) and from 15 additional studies at f .O T (SP 42; Sie- mens Medical Systems). We obtain the QMCI images with a spin-echo se- quence with a TR of 400-600 msec and a TE of L5-2O msec, and a double-echo sequence with a TR of L,8OO-2,5OO msec and with the first TE equal to that of the single-echo sequence and the second TE equal to 8O-90 msec. Relaxation rate and N(H) maps are calculated and combined into OMCI images with a Microvax 31OO computer (DEC, Maynard, Mass). The color images are displayed on a Macintosh II si computer with a 24-bit graphic board. The software needed for calculation of maps and their display was written entirely by the authors. Recently, Adobe Photoshop (Adobe Systems, Mountain View, Calif) has been used for multiple image display and pre- sentation. Calculation of relaxation rate and N(H) maps is described in the Appendix. ChromotÍc Scotes Three linear monochromatic (red, green, and blue) scales are used to simultaneously display MR pa- 217
Transcript of Multiparametric display of spin‐echo data from MR studies of brain

Multiparametric Display of Spin-EchoData from MR Studies of Brainl
Bruno Alfano, MS . Arturo Brunetti, MD . Margherita Arpaia, MS . Andrea Ciarmiello, MDEugenio M. Covelli, MD . Marco Salvatore, MD
A magnetic resonance (MR) lmage processingtechnique that uses a single color image for si-multaneous presentation of spin-echo informa-tion and lts application to MR studies of the brainis described. Relaxation rate and proton-densitymaps were calculated from 16O brain MR studiesperformed at 1.5 and 1.O î \Fith standard spin-echo sequences. Maps were fused into single colorimeefes, with Rl, R2, and proton density coded,respectlvely, by red, green, and blue. The possibil-ity of standardizing the technique was evaluated.Comparative analysis of color and conventionalMR images of white matter disease and brain tu-mors was performed to assess intra- and interob-server variability. Unequivocal and reproduciblechromatic characterization of normal brain struc-tures and a varlety of lesions was obtained. Intra-and interobsenrer analysis showed that color im-ages can be used as a diagnostic tool. îhe tech-nique may provide a slmplified and timesavingapproach for interpretation and presentation ofbrain MR studies.
Index ter:rrs: Brain. diseases. 10.36. 10.871 . Brain. MR. lO. 121411 .
Brain neoplasms, MR, 10. 121411 . Image display . Image processing
JMRI 1995; 5:217-225
Abbreviations: CSF = cerebrospinal fluid, N(H) = proton density,
OMCI = quantitative magnetic color imaging.
I From the Institute of Radiological Science, Centro CNR per la Medicina
Nucleare, University Federico II, Naples, Italy (El.A., A.B., M.A., M.S.);
and the Cancer Institute G. Pascale, Naples, Itafy @.C., E.M.C., M.S.).
Received May 5, 1994; revision requested July 13; revision received and
accepted August 9. Supported in part by Consiglio Nazionale delle
Ricerche (CNR) and Associazione Italiana Ricerca sul Cancro. CNR has
filed international patent application PCî/1T92/OO1 12 for the QMCItechnique described herein. Address reprint requests to 8.A., Via
Manzoni 2I3,l-8O122 Napoli, Italy
o sMR, 1995
Original Research
SPIN-ECHO SEQUENCES provide magnetic reso-nance (MR) images weighted with different param-eters (ie, relaxation times and proton density). Fromspin-echo data, relaxation maps can be obtained.The possibility of simultaneous presentation of mul-tiple signal intensity images (1-3) and relaxationtime maps (4) with colors has been reported. Re-cently, the fusion of relaxation rate maps with hy-brid color images (5) and combined presentation ofrelaxation rates and proton density (NIHI) in a singlefull-color image (6) have been described as quantita-tive magnetic color imaging (QMCD.
The aim of the present work was the optimizationof this technique, allowing a global display of spin-echo information and application of this informationto the study of the normal brain and of differentbrain diseases, \Mith an inter- and intraobserveranalysis.
O MATERIALS AND METHODS
MR htstrumentationThree-component OMCI images, based on calcula-
tion of Rl (1 /TL), R2 (1 /T2), and N(H) maps (Fig t),were obtained from 160 MR studies performed at 1.5T (Magnetom SP 63; Siemens, Erlangen, Germany)and from 15 additional studies at f .O T (SP 42; Sie-mens Medical Systems).
We obtain the QMCI images with a spin-echo se-quence with a TR of 400-600 msec and a TE ofL5-2O msec, and a double-echo sequence with a TRof L,8OO-2,5OO msec and with the first TE equal tothat of the single-echo sequence and the second TEequal to 8O-90 msec. Relaxation rate and N(H) mapsare calculated and combined into OMCI images witha Microvax 31OO computer (DEC, Maynard, Mass).The color images are displayed on a Macintosh II sicomputer with a 24-bit graphic board. The softwareneeded for calculation of maps and their display waswritten entirely by the authors. Recently, AdobePhotoshop (Adobe Systems, Mountain View, Calif)has been used for multiple image display and pre-sentation. Calculation of relaxation rate and N(H)maps is described in the Appendix.
ChromotÍc ScotesThree linear monochromatic (red, green, and blue)
scales are used to simultaneously display MR pa-
217

Figure 1. Rl lal, R2 lb), andN(H) tcl maps at the level of thebasal ganglia obtained in ahealthy volunteer at 1.5 T. Onthe Rl map, the contrast be-tween gray and white matter issimilar to that observed on an in-version-recovery image. The R2map has a reversed contrastcompared with that of a conven-tional'T2-weighted" image. TheN(H) map appears similar to con-ventional spin-density maps.Each map displays the effects ofa single parameter and is unaf-fected by other parameters, un-like conventional signal intensityimages.
Figure 2. The six possible per-mutations of the three primarycolors, red (R), green (G), andblue (B), representing the param-eters Rl, R2, and N(H) from leftto right, are indicated in the up-per left corrrer of each image.
rameters with a full-color approach. The six possiblepermutations of three parameters (Rl , R2, and N[H])on the three primary colors are presented in Figure2. Thirty-five observers who were not color blind (30diagnostic Ímaging specialists and five neurologistsand neurosurgeons) were shown Figure 2 and askedto rate the six scales. The representation of Rl , R2,and N(H) with red, green, and blue, respectively, wasselected as the preferred one by 25 observers. Thatscale seemed to provide the best results in terms ofanatomic and diagnostic information, with a"pseudonatural" representation of brain structures.In addition, the scale appeared to be effective in rep-resenting different brain diseases.
The three colors define a three-dimensional colorscale (Fig 3). Since each chromatic component has256 available color levels. the three-dimensionalscale has 2563 colors. Once the red, green, and blue
components representing Rl, R2, and N(H) havebeen assigned, tissue "colors" on QMCI images de-pend on the ranges of parameter values representedwith available levels of red, green, and blue.
Parameter r€rnges were scaled so that gray matterwould appear gray, with an intensity equal to one-third that of the maximum (gray is obtained by com-bining the three primary colors at the same inten-sity). Because we have not observed marked changesin the relaxation rate of normal gray matter, a singlescale was applied to all studies. This approach couldrepresent a standardization criterion of the scale. Infact, in all our studies, normal gray matter in youngadults showed a constzrnt chromatic appearance.
Patient PopulationSince this was a feasibility study, I4O consecutive
MR studies performed at 1.5 T in patients with dif-
I
218 . JMRI . March/Apr i l 1995

Figure 3. Representation of the three central orthogonalplanes of the cubic three-dimensional color scale used in thepresent study. The slanted straight line from the origin("black point") of the three axes to the opposite corner of thecube ("white point") corresponds to the gray scale.
Figure 4. Image obtained at the level of the basalganglia (axial plane) illustrates the normal appearanceof different brain structures with the QMCI represen-tation. Arrows indicate color artifacts (red on the rightand green on the left) due to misalignment of the twosequences.
ferent brain diseases (87 with tumors, 2l with mul-tiple sclerosis, 15 with chronic cerebrovascular dis-ease, an.d 17 \rith negative findings [patients referredto rule out white matter diseaseì) during January-July f 993 were evaluated. Fifteen young (age range,25-31 years) and five elderly (age range, 65-89years) healthy subjects were also studied. In all sub-jects, transverse multiparametric images were ob-tained; in selected cases, coronal and/or sagittalmultiparametric images were also obtained.
Image EualuatíonTwo readers (a resident [E.M.C.] \Mith 2 years' ex-
perience [observer 1] and an experienced neuroradi-ologist [A.8.] lobserver 2]) evaluated, in two separatesessions I month apart, the original conventionalT\-, T2-, and N(H)-weighted axial images and the cor-responding QMCI images displayed on the colormonitor with the standardized scale. Before the im-age analysis sessions, the observers were allowed tobecome familiar \Mith the appearance of the multi-parametric maps, observing an available database of50 cases involving different diseases.
In both sessions, the observers were required toidentiSr the site and number of all focal abnormali-ties. In the analysis of white matter disease, the ob-servers were asked to indicate the position of all de-tectable abnormal spots (regardless of their size) ontwo separate drawings of the axial sections (one foreach session). Drawings were subsequently analyzedto evaluate concordance and discordance betweenblack and white versus color analysis for each ob-server and between the two observers.
In the analysis of tumors, the readers were askedto describe the lesions in terms of evidence (excellent,good, fair, and poor), margins (well and poorly de-fined), presence or absence of necrosis/heterogeneity,and presence or absence of edema. In the evaluationof evidence, the readers were required to report thediagnostic quality of the color images with regard topossible movement and misalignment artifacts. Inter-observer agreement concerning evidence of lesions onconventional and QMCI images was evaluated (7).
O RESULTS
Appeoronce oJ Color MapsWith use of the above-described color display with
simultaneous mapping of Rl , R2, and N(H), QMCIimages permitted recognition of all normal brainstructures evident on the conventional images (Fig 4).The color of each structure depends on the combina-tion of its Rl, R2, and N(H) values. In healthy youngsubjects, brain cortex has an intermediate gray coloron all images and can be clearly differentiated fromunderlying white matter at all anatomic locations.White matter-because of the combination of higherRl and lower N(H) values relative to gray matter-ap-pears pink, w'ith different shades at different loca-tions: Frontal white matter has a lighter color due toa higher R2; darker areas can be observed at thelevel of the posterior limb of the internal capsule andin the occipital area. Fat appears light pink becauseof the combined effect of very high Rl and intermedi-ately high R2. Muscle appears green because of highR2 and low Rl. Cerebrospinal fluid (CSF) appearsbluish because of the predominant effect of very lowRl and R2.
The globus pallidus, red nucleus, substantia ni-gra, and dentate nucleus all have a shining greencolor due to high R2-more evident at higher fieldstrength (Fig 4). The putamen and caudate nucleushave a chromatic appearance similar to that of cor-tex. Vessels appear with different colors, dependingon flow velocity and direction.
In elderly subjects, the color of gray matter doesnot appear significantly different; however, whitematter shows inhomogeneities, with frequent obser-vation of punctate areas of a dark purplish color cor-responding to the hyperintense spots observed on
V o f u m e 5 . N u m b e r 2 . J M R I . 2 1 9
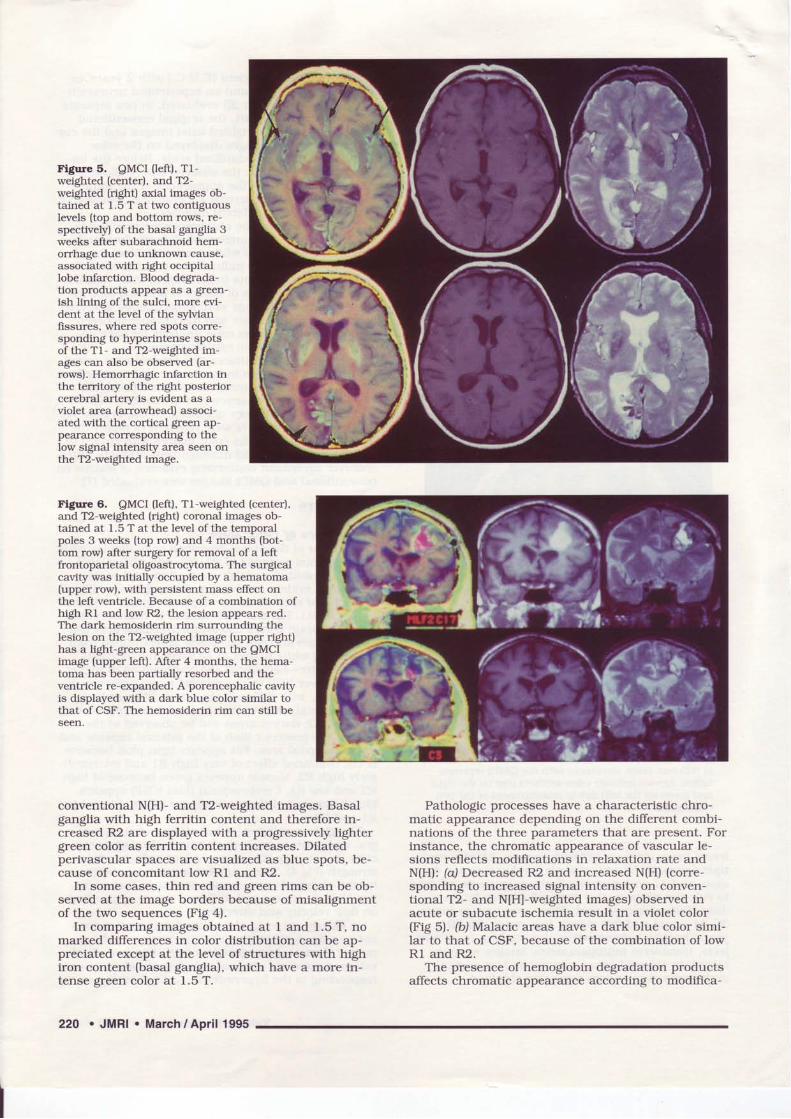
Figure 5. QMCI (left), T1-weighted (center), and T2-weighted (right) axial images ob-tained at 1.5 T at two contiguouslevels (top and bottom rows, re-spectively) of the basal ganglia 3weeks after subarachnoid hem-orrhage due to unknown cause,associated vrith right occipitallobe infarction. Blood degrada-tion products appear as a green-ish lining of the sulci, more evi-dent at the level of the sylvianfìssures, where red spots corre-sponding to hyperintense spotsof the Tl- and T2-weighted im-ages can also be observed (ar-rows). Hemorrhagic infarction inthe territory of the right posteriorcerebral artery is evident as aviolet area (arrowhead) associ-ated with the cortical green ap-pearance corresponding to thelow signal intensity area seen onthe T2-weighted image.
Figure 6. QMCI (left), Tl-weighted (center),and T2-weighted (right) coronal images ob-tained at 1.5 T at the level of the temporalpoles 3 weeks (top row) and 4 months (bot-tom row) after surgery for removal of a leftfrontoparietal oligoastrocytoma. The surgicalcavity was initially occupied by a hematoma(upper row), with persistent mass effect onthe left ventricle. Because of a combination ofhigh Rf and low R2, the lesion appears red.The dark hemosiderin rim surrounding thelesion on the T2-weighted image (upper right)has a light-green appearance on the QMCIimage (upper left). After 4 months, the hema-toma has been partiatly resorbed and theventricle re-expanded. A porencephalic cavityis displayed with a dark blue color similar tothat of CSF. The hemosiderin rim can still beseen.
conventional N(H)- and T2-weighted images. Basalganglia with high ferritin content and therefore in-creased R2 are displayed with a progressively lightergreen color as ferritin content increases. Dilatedperivascular spaces are visualized as blue spots, be-cause of concomitant low Rl and R2.
In some cases, thin red and green rims can be ob-serwed at the image borders because of misalignmentof the two sequences (Fig 4).
In comparing images obtained at I and 1.5 T, nomarked differences in color distribution can be ap-preciated except at the level of structures with highiron content (basal ganglia), which have a more in-tense green color at 1.5 T.
Pathologic processes have a characteristic chro-matic appearance depending on the different combi-nations of the three parameters that are present. Forinstance, the chromatic appearance of vascular le-sions reflects modifications in relaxation rate andN(H): (a) Decreased R2 and increased N(H) (corre-sponding to increased signal intensity on conven-tional T2- and NlH]-weighted images) observed inacute or subacute ischemia result in a violet color(Fig 5). (b) Malacic areas have a dark blue color simi-lar to that of CSF, because of the combination of lowRl and R2.
The presence of hemoglobin degradation productsaffects chromatic appearance according to modifica-
220 . JMRI . March/Apr i l 1995

tions seen in hemorrhage and hemorrhagic infarc-tion. Hemosiderin has a light green color (Figs 5, 6).Recent hemorrhage tends to appear yellowish, pre-sumably because of the presence of deoxyhemoglobin(very high Rl and R2); subacute hemorrhage appearsred because of the combined effect of increased Rland decreased R2, corresponding to the hyperintensepattern seen on both conventional T1- andT2-weighted images; a progressive decrease in Rl asso-ciated with natural evolution of the hemorrhagic le-sion tends to modiflr the appearance of the clot to aprogressively darker color, while the surrounding he-mosiderin ring appears light green (Fig 6).
Multiple sclerosis lesions can appear as homoge-neous dark spots of a predominantly violet-gray coloror as inhomogeneous areas \Mith different color huesreflecting the presence of different structural compo-nents (Fig 7). Small subcortical and periventriculardemyelinating areas can be easily recognized onQMCI images, even when they can be misinterpretedon conventional images because of their location.
With color representation, meningiomas with Rland R2 values slightly lower than those of normal pa-renchyma present a mildly or markedly inhomogene-ous appearance, with mixed gray, blue, and green ar-eas, and tumor margins can be clearly delineated (Fig8). After contrast enhancement with gadopentetatedimeglumine, QMCI maps show enhancing areaswith a pink-red color due to increased Rl.
In intraaxial tumors, different components can be
Figure 7. Comparative evaluation ofconventional and color images at thelevel of the lateral ventricles in a pa-tient with multiple sclerosis (study per-formed at 1.5 T). T2-weighted (a) andN(H)-weighted (c) images, QMCI map(b), and schematics (d) of possible le-sions marked on the conventional im-age (left) and the QMCI image (right) byobserver I (C and observer 2 (+); ab-normal spots reported by both readersare indicated by @. A subcortical lesion(black arrow) clearly visible on the colormap was misinterpreted as CSF on theT2-weighted image by both observers.The lesion mirrors exactly a contralat-eral hyperintense area (white arrow)corresponding to a sulcus, which isbetter appreciated as such on the colormap. Three areas marked by observer 1on the conventional image (arrowheads)were interpreted by both observers aspart of diffuse white matter abnormal-rty on the color image.
differentiated with color representation. Hemorrhagicareas appear as described above; necrotic areas ap-pear similar to CSF (Fig 9); cystic lesions have differ-ent colors, depending on their content; calcificationstend to be green because of their predominantly highR2. An interesting feature of most malignant tumorsis the characteristic violet appearance of perilesionaledematous areas that seem to clearly delineate thegrowing tumor area (Fig 9), usually corresponding tothe enhancing rim observed on conventional T1-weighted images after gadolinium administration.
Some tumor types can be almost unequivocallyrecognized; lipomas for instance usually have thesame color as subcutaneous fat.
Quantitatiue Ano,lysúsThe results of comparing conventional and QMCI
images are summarrzed in Tables l-4.The images of the healthy subjects were equiva-
lent on conventional and QMCI images. One unde-termined hyperintense lesion on N(H)- and T2-weighted images was noted in the left frontal whitematter in one case. A corresponding dark brown spotwas observed on the color maps. In both cases, thereader reported the finding as probably normal.
The results from patients with multiple sclerosisand chronic cerebrovascular disease €rre reported inTables I and 2.
Both observers tended to see more focal lesions onthe color maps; the more exlrerienced reader had
Vofume 5 . Number 2 . JMRI . 221

Figure 8. Precontrast (a) and post-contrast (b) coronal images of a patientwith a meningioma of the left tento-rium. The lesion has regular marginsand inhomogeneous color, with light-green areas on the precontrast imagecorresponding to the calcifications seenat computed tomography.After con-trast agent administration, the color ofthe lesion becomes pink because of theincreased Rl. Enhancement of the cor-responding tentorium can be seen aftercontrast agent administration.
a.
Figure 9. QMCI (left), Tt-weighted (center),
and T2-weighted (right) images obtained at1.O T at the level of the lateral ventricles(axial images, upper row) and temporal poles(coronal images, lower row) in a patient witha glioblastoma multiforme. The tumor is sur-rounded by a gray-violet area of edema andshows a central dark, necrotic region. Themargins of the lesion appear clearly defìnedon the color maps.
greater concordance in the detection of lesions withthe two display methods (Table 1). The concordancebetween the two observers was greater with the colorimages (Table 2). A representative example of theanalysis performed on an image obtained at the levelof the lateral ventricles in a patient urith multiplesclerosis is presented in Figure 7.
In the evaluation of tumors. differences betweenthe observers in rating the evidence of the lesionswere found in five cases, while evaluation of marginsand determination of the presence of necrosis/het-erogeneity and edema were always concordant.
Analysis of interobserver agreement for the twoobservers showed a k value of .836 + .066 for con-ventional images and .826 t .064 for QMCI (7). Com-parative ratings (ie, OMCI images better than con-ventional images or vice versa) were always concor-dant between the observers: the results are thereforepresented together in Table 3. Among the 12 cases inwhich conventional images were considered superior
to color images, color maps in eight cases were ratedas having suboptimal quality due to patient move-ment between the two sequences required to calcu-late the maps. In the remaining four cases, lesionswere reported as more evident on N(H)- and T2-weighted images. Among the 10 cases in whichQMCI images were reported as superior to conven-tional images, three involved multiple lesions (metas-tases) and some small lesions not detected by bothobservers on conventional images. In the remainingseven cases, the definition of the lesion and particu-larly of tumor margins was rated superior on thecolor images.
In the evaluation of tumors, some necrotic/het-erogeneous areas and thin rims of edema were recog-nized only on QMCI images (Table 4).
DISCUSSIONApproaches with pseudocolor representation are
frequently used in different diagnostic imaging mo-
222 . JMRI . March/Apr i l 1995

îable INumber of Lesions Reported by Each Obsenzer onthe T\ro îypes of Ima$es in the Evaluation of WhiteMatter Disease
Images
Conventional Conventional
Observer Only* and QMCI QMCI OntY
1 343 1,172 4982 94 1,304 312
xTl,T2, and N(H) weighted.
îable 2Number of White Matter Lesions Reported on theT\llo Tvpes of Images by Observer I Only, by BothObseríérs, and by-Obsènrer 2 OnlY
Observer I Observer I Observer 2Image Only and 2 OnlY
Conventional 4O2 1,1 13 285gMcr 284 1,386 23O
Table 3Comparison of Evidence of Lesions on Conventionaland $UCI Images in 87 Patients with Brain Tumors(97 Lesions)
Comparison No. of Cases
Conventional > QMCI L2
Conventional = QMCI 65
Convent ional<QMCI f0
Note.-Numbers are number of cases in which one t5rpeof image was rated superior or equal to the other' Rat-ings were always concordant between the two observers.
Table 4Detectlon of Necrotic Areas and Perilesional Edemaln Patients with Brain Tumors
Images
QMCI QMCI and Conventional
Finding Only Conventional OnlY
Necrosis I 32Edema 7 62
Note.-Numbers are number of areas of necrosis or
edema detected.
0o
dalities to enhance contrast. With these techniques,diagnostic interpretation is mediated by the chro-matic scale, and the scale itself must be displayedtogether with the image to permit image interpreta-tion. In contrast, image representation with linearscales, such as the conventionally used gray scale orour three-dimensional linear scale, can be easily in-terpreted. Linear scales and quantitative parametricmaps are the basis of chromatic characterizationwith a full-color approach.
Because we have three different color receptors inthe retina, the combination of three monochromaticcolor scales represents the best possibility of provid-ing integrated information from multiple parameterswith use of colors. It is possible to display up tothree different parameters without theoretical loss ofcontrast. This potentiality could be helpful for distin-guishing different tissues that may be displayed withthe same gray level on conventional spin-echo im-ages, owing to the opposite effects of Tl and T2 onsignal intensity. In fact, on color images, contrastcan be due to differences in hue, saturation, or lumi-nance (8). On QMCI images, if two tissues have con-cordant changes in Rl , R2, and N(H), they show onlydifferent luminance. If they have randomly differentvalues for these parameters, their hue and satura-tion are also modified.
In practice, the use of hybrid color maps can over-come the intrinsic limitation of images dependent onsignal intensity, on which the opposite effects of Tland T2, depending on selected spin-echo sequenceparameters, could actually decrease or even elimi-nate contrast between two different structures.
Several authors have described color fusion forsignal intensity images. Kamman et al (4) reportedan approach with parametric maps for obtaining adiagnostic characterization with colors. However,their chromatic characterization was different, sincethey used Tl and T2 maps to define the hue and
saturation of each pixel. Proton density was usedonly to define a mask that would keep luminanceconstant in all important areas of the image and thatwould be equal to zero in low-proton-density areas.In our technique, we use parametric relaxation-ratemaps and a proton-density map to separately codethe three primary colors-red, green, and blue. Fig-ure lO compares pixel distribution in the R1-R2 do-main and the Tl-T2 domain of a normal brain sec-tion. The Rl-R2 domain provides superior contrastdistribution, with recognition of separate clusters ofpixels representing different brain tissues. In con-trast, since CSF has very long Tl and T2 values,large ranges of relaxation times must be used to si-multaneously display normal brain tissues, CSF,and pathologic tissues (which usually have interme-diate Tl and T2 values) on Tl and T2 maps. There-fore, contrast between normal brain tissues is lowercompared with that on Rl and R2 maps.
As a simple standardization criterion for QMCIbrain images, we suggest that gray matter be dis-played as gray. The definition of gray as the presenceof equal levels of the three primary colors permitsuse of a simple fixed setting of the chromatic scalewith digital data. However, the sensitivity of our eyeto the absence of color (gray), makes it easier to usegray as a subjective reference setting even for analogdevices (eg, printers, photographic reproduction sys-tems).
One of the issues associated with color presenta-tion is reproduction of the images on photographicprints. High-quality color reproduction can be ob-tained with a series of dye transfer thermal printers,both on transparencies and paper. Paper reproduc-tion is optimal when using a standard color scale asin QMCI, and it has a lower cost compared with la-ser printing of conventional gray-level images. In thefuture, color reproduction with laser printers couldalso become commercially available.
Our initial clinical experience with the techniquehas indicated that simultaneous display of the infor-mation usually represented on multiple images canbe a simplified approach to the interpretation of
V o l u m e 5 . N u m b e r 2 . J M R I . 2 2 3

Figure 1O. Pixel distributions in theRl-R2 domain (left) and the Tl-T2 do-main (right) of a coronal section of anormal brain. Rl and R2 ranges are,respectively, O-2.55 sec-r and 0-25.5sec-t. Tl and T2 ranges are, respec-tively, O-3,48O arfi 0-272 rrlS€c. ! =gray matter, LD = white matter; c = CSF,m = f[uscle, andJ= fa1.
brain MR data. The major limitation of the tech-nique is the possibility of patient movement be-tween the two spin-echo sequences required to cal-culate the parametric maps. That limitation couldbe overcome by eliminating the time interval be-tween the two sequences or by volumetric realign-ment of the two data sets with appropriate soft-ware. An additional possible cause of minor misreg-istration could be a frequency shift between the twosequences that could be minimized with frequencylock.
The results of the comparison of the evaluationof white matter lesions reported in Table I and par-ticularly the fact that both observers tended to seemore lesions on color maps suggest that QMCI im-ages may be more sensitive and/or less specificthan conventional images. However, the greaterconcordance between the two observers in theevaluation of color maps may indicate a higher ac-curacy in detecting white matter lesions (Table 2).Finally, the results of the less experienced observerwere closer to those of the more experienced ob-server in the evaluation of color maps.
In the example shown in Figure 7, it is seen howthe combined multiparametric information of theQMCI map can help in detecting subcortical areasof abnormal signal intensity that, because of im-proper spatial matching, can be misinterpreted asCSF or partial-volume averaging on different seriesof conventional images.
Although time saving in the diagnostic processwould be difficult to quantiSr at present because ofthe different instruments used, we expect that a re-duction in clinical analysis time may result fromamalgamation of different sequences into the QMCIformat. In contrast, the increased postprocessingtime needed to create the color maps is limited to afew minutes for each patient and represents ma-chine time rather than radiologist time.
In conclusion, QMCI images maintain the diag-nostic information present on conventional spin-echo images, with potential advantages in the de-tection of white matter lesions and in the diagnosisand characterrzation of different tissue componentsof brain tumors. A combination of detailed ana-tomic description and chromatic characterizationcould augment diagnostic accuracy with this ap-proach.
o APPENDf,KThe steady-state spin-echo and double-echo sig-
nal intensity expressions have been reported in theliterature (9-11). For a single echo, we have
S = K.N(H) .l - 2e-(m-TE/2)'Rl + e-TR'Rl . " - f f i 'P
1*. -TR.(R2+Rr)(A1)
where S is signal intensity and K is a constant de-pending on total imager performance and gain.
For a double echo. we have
S = K.N(H) .
l _ 2"- [TR-(TEr+TEz)/2] 'Rr * 2.- (TR-TEr/2) 'Rl _,-TR'RI .
1* " -TR.(R2+Rl)
r - D ' P .
w)where TE, and TE, are first and second TE values.
The denominator in these equations can usuallybe ignored, since the exponential term is negligibleexcept for very small R2 or TR values (1O). In addi-tion, Equations (Af) and (A2) do not take into ac-count the gradient used to destroy the residualtransverse magnetization (1O).
Lee and Riederer (12) suggested an approximateequation for multiecho sequences with s5rmmetricechoes. Applyrng the same procedure to the singleecho and to the as',rmmetric double echo. we have
S = K N(H).lt _ "-to-TEne).Rt
l.e-re nz, (Ag). . 1 J
where TE'" is the time of the second echo. Anequivalent equation was subsequently used in thestudy of precision in the measurement of relaxationtimes (13).
The signal intensity ratio in a double-echo se-quence, using either Equation (A2) or (A3), is
s2 e-TE2,R2
sl
224 . JMRI . March/Apr i l 1995
a - T E 1 . R 2 '(A4)

where, S, is the signal intensity of the first echo andS, is the signal intensity of the second echo. Equa-tion (A4) permits calculation of R2.
Interpolative computation of Tl has been sug-gested (fa). The author of that study created alookup table of the ratio of two spin-echo signal in-tensities at 94 Tl values and calculated by interpo-lation Tl values not included in the table. Sincef -byte precision is adequate for the representation ofRl on a map, we created, once for each section, alookup table of the signal intensity ratios at differentTR values corresponding to the 256 Rl values in therange 0-2.55 sec-r. For each pixel, the signal inten-sity ratio is looked up in the table, and Rl values aredirectly assigned.
By using Equation (A3) instead of (Al) and l,A2)-with the denominator equal to l-to create thelookup table, the maximum change for Rl is lessthan O.0l sec-r. On the other hand, with the satura-tion-recovery expression, in the TR range that weused, we have a maximum change of O.09 sec-r cor-responding to the largest Rl values. This error canbe seen on the QMCI maps only by careful inspec-tion of two corresponding images that are simulta-neously displayed and calculated with the two differ-ent approximations.
Since the use of Equations (Al) and (A2) or Equa-tion (A3) affects only the calculation of the lookuptable, the two calculation times are not markedly dif-ferent. The images in the present study were calcu-lated with Equation (A3).
Once Rl and R2 have been calculated, K.N(H) canbe obtained from an N(H)-weighted image and fromthe same equation used to create the lookup table.Since K varies from study to study, N(H) and K canbe determined only if a sample with a known protondensity (ie, water) is included in the studied volume.Therefore, we performed this measurement in eightpatients (age range, 28-63 years) and found themean value (+standard deviation) of relative N(H) ofwater in gray matter, 0.660 + .026. Image N(H) couldbe normalized by assuming that its mean value isconstant in human gray matter.
We found that most gray matter relaxation rateswere in the following ranges in healthy young sub-jects: 0.61 sec-r < Rl < 1.29 sec-r and 10.6 sec-r <R2 < 17.3 sec-r. In these ranges, a negligible fractionof pixels not corresponding to gray matter can befound. In five healthy volunteers, after segmentationof the images with the above-mentioned ranges, thefraction of pixels outside gray matter found by twoexperienced observers was 2.8o/o + 1.3 (mean * stan-dard deviation).
By measuring the mean l(.N(H) of the selectedpixels and assuming N(H) = .66 x N(H)","t.., we obtainK. Within the limits of coil homogeneity, K can beconsidered constant within the imaged volume.
Since Rl depends on magnetic field intensity, acorrection factor must be applied to 1.5 T data to ob-tain a similar chromatic appearance and therefore
comparable images with those obtained at a lowerfield strength. By comparing gray and white matterRl values obtained at I and at 1.5 T, a correctionfactor of 1.13 was found and applied. It is equal to1.50'3, which is in agreement with the expressionTl = AvB proposed by Bottomley et al (15), where v isthe MR frequency and A and B are constants. Usingliterature data, Bottomley et al fitted a B value ofO.3O82 for gray matter and 0.3477 for white matter.The correction factors affect Rl but not R2; there-fore, intrinsic R2 contrast due to magnetic suscepti-bility effects in the substantia nigra, red nucleus,and globus pallidus is superior on maps obtained athigher field strengths, while R2 values in all otherstructures are essentially unaffected. O
References1. Weiss KL, Stiving SO, Herderick EH, Cornhill JF, Cha-
keres DW. Hybrid color MR imaging display. AJR 1987;149:825-829.
2. Vannier MW, Rickman D. Multispectral and color-aideddisplays. Invest Radiol 1989; 24:88-9L.
3. Brown }lK, Hazelton TR, Silbiger ML. Generation of colorcomposites for enhanced tissue differentiation in magneticresona.nce imaging of the brain. Am J Anat 1991: 192:23-24 .
4. Kamman RL, Stomp GP, Berendsen HJC. Unified mul-tiple feature color display for MR images. Magn ResonMed 1989; 9:240-253.
5. Alfano B, Brunetti A, Ciarmiello A, Salvatore M. Simul-taneous display of multiple MR parameters with "quanti-
tative magnetic color imaging." J Comput Assist Tomogr1992; 16:634-640.
6. Brunetti A, Alfano B, Ciarmiello A, Salvatore M. Quanti-tative magnetic color imaging: preliminary clinical experi-ence (abstr). In: Book of abstracts: Society of MagneticResonance in Medicine 1992. Berkeley, Calil Society ofMagnetic Resonance in Medicine, 1992; 4246.
7. Fleiss JL. The measurement of interrater agreement. In:Statistical methods for rates and proportions. 2nd ed.New York, NY: Wiley, 1989; 212-225.
8. Boynton P. Human color perception. In: Liebovic KN, ed.Science of vision, New York, NY: Springer-Verlag, f 989;2rr-253.
9. Bakker CJG, de Graaf CN, van Dijk P. Derivation ofquantitative information in NMR imaging: a phantomstudy. Phys Med Biol 1984; 29:1511-1525.
10. Lin MS. Measurement of spin-lattice relaxation times indouble spin-echo imaging. Magn Reson Med 1984; 1:361-369.
I l. Ortendahl DA, Hylton N, Kaufman B, et al. Analytic toolsfor magnetic resonance imaging. Radiologr 1984;153:479-488.
12. Lee JN, Riederer JS. Modified saturation-recovery ap-proximation for multiple spin-echo pulse sequences. MagnReson Med 1986; 3: I32-I34.
13. Bakker CJG. de Graaf CN. Precision in calculated p, Tland T2 images as a function of data analysis method.Magn Reson Imaging 1988; 6:3-8.
14. Lin MS. Interpolative computation of spin-lattice relax-ation times from signal ratios. Magn Reson Med 1985;2:234-244.
15. Bottomley PA, Foster TH, Argersinger RE, Pfeifer LM.A review of normal tissue hydrogen NMR relaxation timesand relaxation mechanisms from 1-1OO MHz: dependenceon tissue type, NMR frequency, temperature, species, ex-cision, and age. Med Phys 1984; lI:425-448.
V o l u m e 5 . N u m b e r 2 . J M R I . 2 2 5