Computational Intelligence in Early Diabetes Diagnosis: A Review
11
REVIEW www.The-RDS.org 248 DOI 10.1900/RDS.2010.7.248 DIABETIC STUDIES The Review of Computational Intelligence in Early Diabetes Diagnosis: A Review Shankaracharya 1 , Devang Odedra 1 , Subir Samanta 2 , and Ambarish S. Vidyarthi 1 1 Department of Biotechnology, Birla Institute of Technology, Mesra, Ranchi 835215, India. 2 Department of Pharmaceutical Sciences, Birla Institute of Technology, Mesra, Ranchi 835215, India. Address correspondence to: Shankaracharya, e-mail: [email protected] Manuscript submitted December 8, 2010; resubmitted January 17, 2011; accepted January 19, 2011 ■ Abstract The development of an effective diabetes diagnosis system by taking advantage of computational intelligence is re- garded as a primary goal nowadays. Many approaches based on artificial network and machine learning algorithms have been developed and tested against diabetes datasets, which were mostly related to individuals of Pima Indian origin. Yet, despite high accuracies of up to 99% in predicting the correct diabetes diagnosis, none of these approaches have reached clinical application so far. One reason for this failure may be that diabetologists or clinical investigators are sparsely in- formed about, or trained in the use of, computational diag- nosis tools. Therefore, this article aims at sketching out an outline of the wide range of options, recent developments, and potentials in machine learning algorithms as diabetes diagnosis tools. One focus is on supervised and unsuper- vised methods, which have made significant impacts in the detection and diagnosis of diabetes at primary and advanced stages. Particular attention is paid to algorithms that show promise in improving diabetes diagnosis. A key advance has been the development of a more in-depth understanding and theoretical analysis of critical issues related to algorithmic construction and learning theory. These include trade-offs for maximizing generalization performance, use of physi- cally realistic constraints, and incorporation of prior knowl- edge and uncertainty. The review presents and explains the most accurate algorithms, and discusses advantages and pit- falls of methodologies. This should provide a good resource for researchers from all backgrounds interested in computa- tional intelligence-based diabetes diagnosis methods, and allows them to extend their knowledge into this kind of re- search. Keywords: diabetes diagnosis · computational · algorithm · artificial neural network · learning · logistic regression Introduction iabetes has been recognized as a continuing health challenge for the twenty-first cen- tury, both in developed and developing countries. It is understood that diabetes preva- lence is increased because of modern lifestyles, ur- banization, and economic development [1]. It is a global problem with devastating human, social, and economic impact, affecting around 300 million people worldwide [2]. Type 2 diabetes is a chronic disease that oc- curs either when the pancreas does not produce enough insulin, or when the body cannot effec- tively use the insulin it produces. It is frequently asymptomatic [3]. Although detection is improv- ing, the delay from disease onset to diagnosis may exceed 10 years [4]. To diagnose diabetes, a physi- cian has to analyze many factors. Undoubtedly, the evaluations of data obtained from patients and expert decisions are critical for diagnosis. How- ever, factors such as lack of experience by the ex- Reprint from The Review of DIABETIC STUDIES Vol 7 No 4 2010
-
Upload
independent -
Category
Documents
-
view
1 -
download
0
Transcript of Computational Intelligence in Early Diabetes Diagnosis: A Review
REVIEW
www.The-RDS.org 248 DOI 10.1900/RDS.2010.7.248
DIABETICSTUDIES
The Review of
Computational Intelligence in Early Diabetes Diagnosis: A Review
Shankaracharya1, Devang Odedra1, Subir Samanta2, and Ambarish S. Vidyarthi1
1 Department of Biotechnology, Birla Institute of Technology, Mesra, Ranchi 835215, India. 2 Department of Pharmaceutical Sciences,
Birla Institute of Technology, Mesra, Ranchi 835215, India. Address correspondence to: Shankaracharya, e-mail: [email protected]
Manuscript submitted December 8, 2010; resubmitted January 17, 2011; accepted January 19, 2011
■ Abstract The development of an effective diabetes diagnosis system by taking advantage of computational intelligence is re-garded as a primary goal nowadays. Many approaches based on artificial network and machine learning algorithms have been developed and tested against diabetes datasets, which were mostly related to individuals of Pima Indian origin. Yet, despite high accuracies of up to 99% in predicting the correct diabetes diagnosis, none of these approaches have reached clinical application so far. One reason for this failure may be that diabetologists or clinical investigators are sparsely in-formed about, or trained in the use of, computational diag-nosis tools. Therefore, this article aims at sketching out an outline of the wide range of options, recent developments, and potentials in machine learning algorithms as diabetes diagnosis tools. One focus is on supervised and unsuper-vised methods, which have made significant impacts in the
detection and diagnosis of diabetes at primary and advanced stages. Particular attention is paid to algorithms that show promise in improving diabetes diagnosis. A key advance has been the development of a more in-depth understanding and theoretical analysis of critical issues related to algorithmic construction and learning theory. These include trade-offs for maximizing generalization performance, use of physi-cally realistic constraints, and incorporation of prior knowl-edge and uncertainty. The review presents and explains the most accurate algorithms, and discusses advantages and pit-falls of methodologies. This should provide a good resource for researchers from all backgrounds interested in computa-tional intelligence-based diabetes diagnosis methods, and allows them to extend their knowledge into this kind of re-search.
Keywords: diabetes diagnosis · computational · algorithm · artificial neural network · learning · logistic regression
Introduction
iabetes has been recognized as a continuing health challenge for the twenty-first cen- tury, both in developed and developing
countries. It is understood that diabetes preva-lence is increased because of modern lifestyles, ur-banization, and economic development [1]. It is a global problem with devastating human, social, and economic impact, affecting around 300 million people worldwide [2].
Type 2 diabetes is a chronic disease that oc-curs either when the pancreas does not produce enough insulin, or when the body cannot effec-tively use the insulin it produces. It is frequently asymptomatic [3]. Although detection is improv-ing, the delay from disease onset to diagnosis may exceed 10 years [4]. To diagnose diabetes, a physi-cian has to analyze many factors. Undoubtedly, the evaluations of data obtained from patients and expert decisions are critical for diagnosis. How-ever, factors such as lack of experience by the ex-
Rep
rint
from
The
Rev
iew
ofD
IAB
ET
IC S
TU
DIE
SV
ol 7
N
o 4
2010
Computer-Based Diabetes Diagnosis The Review of DIABETIC STUDIES 249 Vol. 7 ⋅ No. 4 ⋅ 2010
www.The-RDS.org Rev Diabet Stud (2010) 7:248-258
perts, or their fatigue, may lead to erroneous di-agnosis. Early intervention with lifestyle modifica-tions or pharmacotherapy has been shown to effec-tively delay or prevent type 2 diabetes and its complications in adults [5].
For prevention of type 2 diabetes, a compre-
hensive guideline was issued specifying lifestyle changes [6]. Various strategies have also been put forward to reduce diabetes risk [7]. Naturally, pre-vention is preferable, but current treatment meth-ods are not yet fully adequate to reach this goal. Hence, there is a growing need for early detection of diabetes. To address this need, and to provide more detailed and rapid analysis of medical data,
risk assessment tools and their various algorithms have been widely investigated.
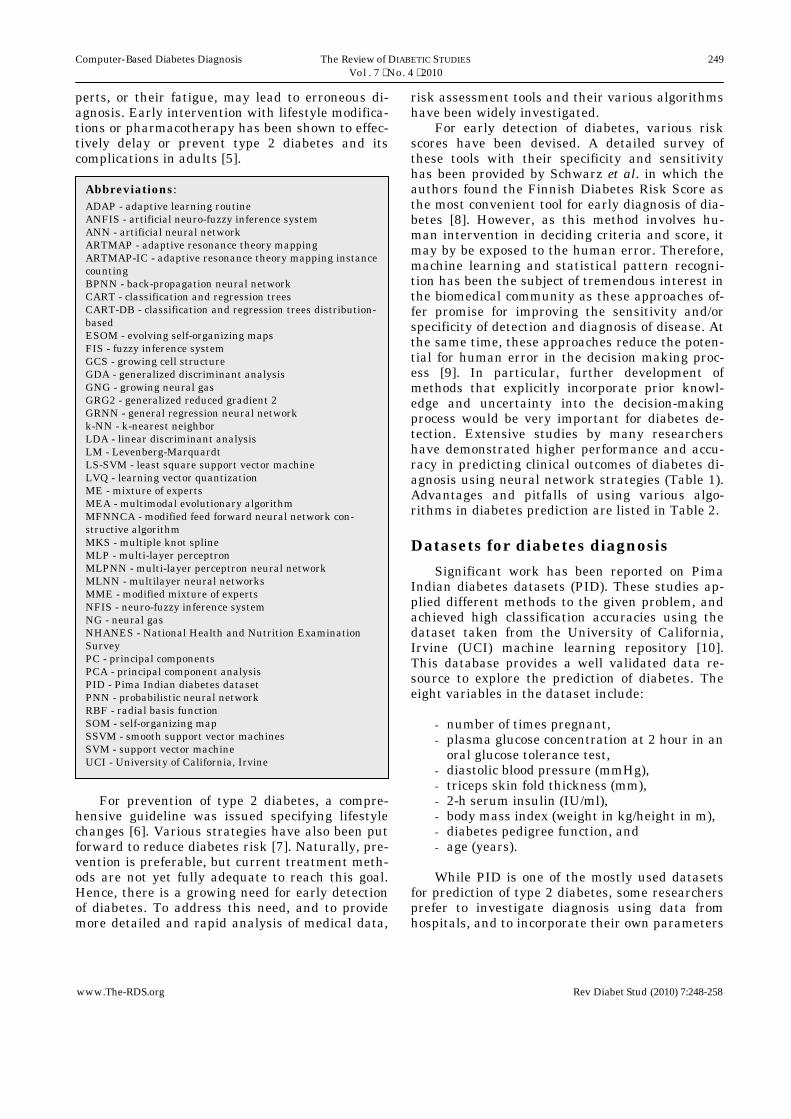
For early detection of diabetes, various risk scores have been devised. A detailed survey of these tools with their specificity and sensitivity has been provided by Schwarz et al. in which the authors found the Finnish Diabetes Risk Score as the most convenient tool for early diagnosis of dia-betes [8]. However, as this method involves hu-man intervention in deciding criteria and score, it may by be exposed to the human error. Therefore, machine learning and statistical pattern recogni-tion has been the subject of tremendous interest in the biomedical community as these approaches of-fer promise for improving the sensitivity and/or specificity of detection and diagnosis of disease. At the same time, these approaches reduce the poten-tial for human error in the decision making proc-ess [9]. In particular, further development of methods that explicitly incorporate prior knowl-edge and uncertainty into the decision-making process would be very important for diabetes de-tection. Extensive studies by many researchers have demonstrated higher performance and accu-racy in predicting clinical outcomes of diabetes di-agnosis using neural network strategies (Table 1). Advantages and pitfalls of using various algo-rithms in diabetes prediction are listed in Table 2.
Datasets for diabetes diagnosis
Significant work has been reported on Pima Indian diabetes datasets (PID). These studies ap-plied different methods to the given problem, and achieved high classification accuracies using the dataset taken from the University of California, Irvine (UCI) machine learning repository [10]. This database provides a well validated data re-source to explore the prediction of diabetes. The eight variables in the dataset include:
- number of times pregnant, - plasma glucose concentration at 2 hour in an
oral glucose tolerance test, - diastolic blood pressure (mmHg), - triceps skin fold thickness (mm), - 2-h serum insulin (IU/ml), - body mass index (weight in kg/height in m), - diabetes pedigree function, and - age (years). While PID is one of the mostly used datasets
for prediction of type 2 diabetes, some researchers prefer to investigate diagnosis using data from hospitals, and to incorporate their own parameters
Abbreviations:
ADAP - adaptive learning routine ANFIS - artificial neuro-fuzzy inference system ANN - artificial neural network ARTMAP - adaptive resonance theory mapping ARTMAP-IC - adaptive resonance theory mapping instance counting BPNN - back-propagation neural network CART - classification and regression trees CART-DB - classification and regression trees distribution-based ESOM - evolving self-organizing maps FIS - fuzzy inference system GCS - growing cell structure GDA - generalized discriminant analysis GNG - growing neural gas GRG2 - generalized reduced gradient 2 GRNN - general regression neural network k-NN - k-nearest neighbor LDA - linear discriminant analysis LM - Levenberg-Marquardt LS-SVM - least square support vector machine LVQ - learning vector quantization ME - mixture of experts MEA - multimodal evolutionary algorithm MFNNCA - modified feed forward neural network con-structive algorithm MKS - multiple knot spline MLP - multi-layer perceptron MLPNN - multi-layer perceptron neural network MLNN - multilayer neural networks MME - modified mixture of experts NFIS - neuro-fuzzy inference system NG - neural gas NHANES - National Health and Nutrition Examination Survey PC - principal components PCA - principal component analysis PID - Pima Indian diabetes dataset PNN - probabilistic neural network RBF - radial basis function SOM - self-organizing map SSVM - smooth support vector machines SVM - support vector machine UCI - University of California, Irvine
250 The Review of DIABETIC STUDIES Shankaracharya, Odedra, et al. Vol. 7 ⋅ No. 4 ⋅ 2010
Rev Diabet Stud (2010) 7:248-258 Copyright © by Lab & Life Press/SBDR
of interest. Kazemnejad et al. used the Tehran Lipid and Glucose Study dataset which consists of variables like age, body mass index, waist-to-hip ratio, gender, history of hyperlipidemia, and his-tory of hypertension [11]. In another study con-ducted by Dey et al. on data of 530 patients from Sikkim Manipal Institute of Medical Sciences, risk factors such as random blood sugar test results, fasting blood sugar test results, post plasma blood
sugar tests, age, sex, and occupation were taken into account [12].
The third National Health and Nutrition Ex-amination Survey (NHANES III, http://www. cdc.gov/diabetes/) dataset resulted from a survey conducted on a US population. The eighteen vari-ables identified as important for diabetes risk pre-diction include body mass index, height, weight, waist circumference, waist-to-hip ratio, age, sex,
Table 1. Artificial intelligence approaches for early diabetes detection
Algorithm
Dataset
Accuracy (%)
Specificity (%)
Sensitivity (%)
Reference
MFNNCA
PID
80.07
84.38
74.00
Kamaruzzaman et al. [51]
GRG2
PID
81.25
-
-
Shanker et al. [15]
ANFIS
PID
98.14
98.58
96.97
Ubeyli [52]
GRNN
PID
80.21
-
-
Kayaer, Yildirim [38]
MLP
PID
77.08
-
-
Kayaer, Yildirim [38]
RBF
PID
68.23
-
-
Kayaer, Yildirim [38]
ARTMAP-IC
PID
81.00
-
-
Carpenter, Markuzon [47]
MEA
PID
80.07
-
-
Stoean et al. [53]
ESOM
PID
78.40
-
-
Deng, Kasabov [23]
GNG
PID
74.60
-
-
Deng, Kasabov [23]
GCS
PID
73.80
-
-
Deng, Kasabov [23]
k-NN
PID
77.00
-
-
Kordos et al. [16]
k-NN
PID
71.90
-
-
Ster, Dobnikar [17]
CART
PID
72.80
-
-
Ster, Dobnikar [17]
MLP
PID
75.20
-
-
Ster, Dobnikar [17]
LVQ
PID
75.80
-
-
Ster, Dobnikar [17]
LDA
PID
77.50
-
-
Ster, Dobnikar [17]
CART-DB
PID
74.40
-
-
Shang, Breiman [54]
SVM
Questionnaire
94.00
94.00
93.00
Barakat et al. [25]
SSVM
PID
76.73
-
-
Purnami et al. [27]
MKS-SSVM
PID
93.20
-
-
Purnami et al. [27]
GDA and LS-SVM
PID
78.21
-
-
Polat et al. [44]
PCA-ANFIS
PID
89.47
-
-
Polat, Gunes [55]
LDA-ANFIS
PID
84.61
85.18
83.33
Dogantekin et al. [44]
Naive Bayes
PID
74.50
-
-
Friedman [56]
Semi-naive Bayes
PID
76.00
-
-
Friedman [56]
C4.5
PID
76.00
-
-
Friedman [56]
MLPNN
PID
91.53
91.19
92.42
Ubeyli [49]
ME
PID
97.93
98.01
97.73
Ubeyli [49]
MME
PID
99.17
99.43
98.48
Ubeyli [49]
Legend: PID: Pima Indian dataset. MFNNCA: modified feed forward neural network constructive algorithm. GRG2: genera-lized reduced gradient 2. ANFIS: adaptive neuro-fuzzy inference system. GRNN: general regression neural network. MLP: multi-layer perceptron. RBF: radial basis function. ARTMAP-IC: adaptive resonance theory mapping instance counting. MEA: multimodal evolutionary algorithm. ESOM: evolving self-organizing maps. GNG: growing neural gas. GCS: growing cell structure. k-NN: k-nearest-neighbor. CART: classification and regression trees. LVQ: learning vector quantization. LDA: linear discriminant analysis. CART-DB: classification and regression trees distribution-based. SVM: support vector machine. SSVM: smooth support vector machine. MKS-SSVM: multiple knot spline smooth support vector machine. GDA: general-ized discriminant analysis. LS-SVM: least square support vector machine. PCA-ANFIS: principal component analysis and adaptive neuro-fuzzy inference system. LDA-ANFIS: linear discriminant analysis and adaptive network based fuzzy inference system. C4.5: sample class 4.5 algorithm. MLPNN: multi-layer perceptron neural network. ME: mixture of experts. MME: modified mixture of experts.

Computer-Based Diabetes Diagnosis The Review of DIABETIC STUDIES 251 Vol. 7 ⋅ No. 4 ⋅ 2010
www.The-RDS.org Rev Diabet Stud (2010) 7:248-258
race/ethnicity, taking blood pressure medica-tion, taking cholesterol medication, gestational diabetes, high blood pressure, high choles-terol, history of diabe-tes (any blood rela-tive), history of diabe-tes (parent or sibling), history of diabetes (parent), history of diabetes (sibling), and exercise [13].
Data analysis through logistic regression
Logistic regression can be applied when the data consist of a binary response and a set of explanatory variables [14]. At first, the maximum likeli-hood estimates for the parameters of the lo-gistic regression model are estimated using an iteratively reweighted least squares algo-rithm. Then, it is pos-sible to calculate the predicted probability of an individual having diabetes by using the following logistic func-tion:
( )nnxxxe ββββθ +++++= ...- 221101
1
Here X is a vector of variables and β is the re-
gression coefficient estimated by using maximum likelihood methods. Shanker applied logistic re-gression on eight variables in PID and obtained a significant accuracy of 79.17% [15]. Statistically least significant (at 0.05 level) variables were de-leted sequentially in the training sample. Logistic regression with the remaining four statistically significant parameters, e.g. number of times preg-nant, glucose tolerance test, body mass index, and
diabetes pedigree function, resulted in an overall classification accuracy of 80.21%. Heikes et al. have developed a diabetes risk calculator tool based on logistic regression function to identify people at high risk of diabetes [13]. It was built upon NHANES III dataset with a sensitivity of 75%.
Clustering techniques
Most quality prediction models are based on clustering techniques that make use of k-means, mixture-of-Gaussians, self-organizing map (SOM) and neural gas (NG) for diagnosis. According to
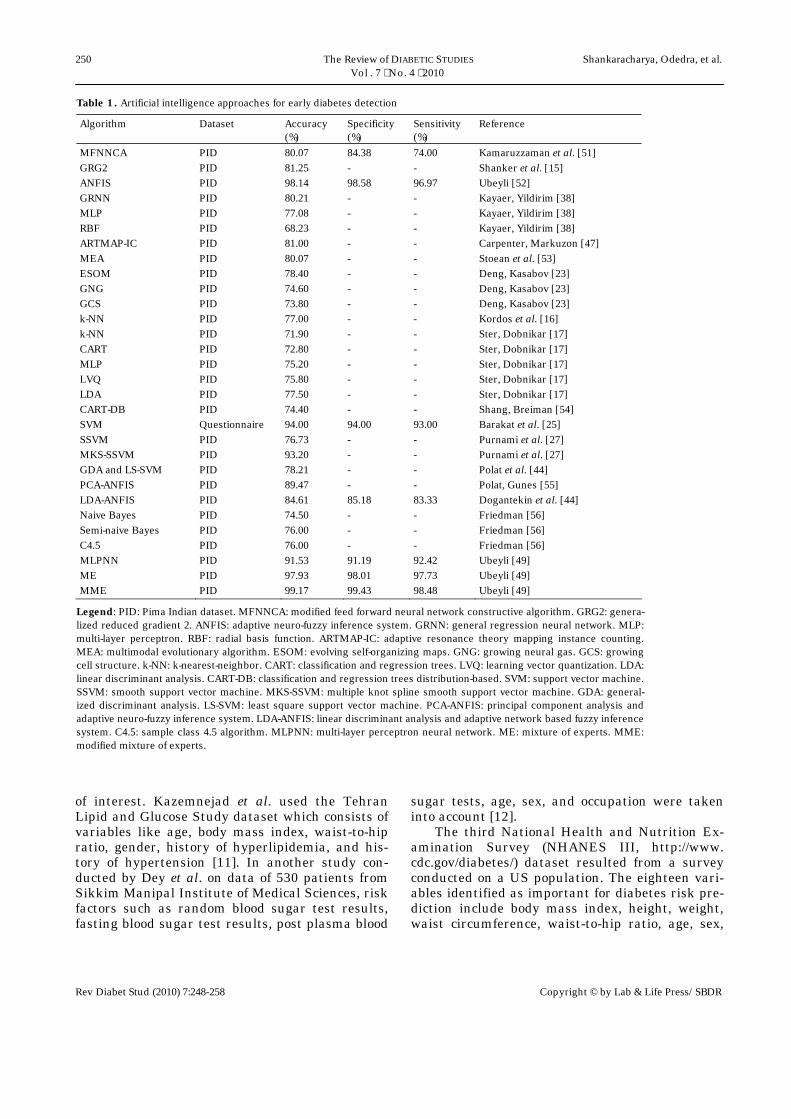
Table 2. Advantages and disadvantages of algorithms commonly used in diabetes prediction
Algorithm
Advatages
Disadvantages
Back propagation
Better error minimization
Slow convergence rate
LM
Fast convergence rate
Memorization effect on over-training
SVM
Guaranteed global minimum
No specific rule to choose a kernel that will give better classification
ANFIS
Fast convergence rate
Low interpretability of learned in-formation, computationally expen-sive
RBF
Uses small numbers of locally tuned units and is adaptive in na-ture
Sensitive to dimensionality of data
ARTMAP-IC
Fast convergence rate
Tends to be conservative which reduces sensitivity
SOM
Little computational and memory requirements
Topology mismatch leads to poor classification
ESOM
Shorter learning process than SOM
Poor adaptability to input data
GNG
Can adaptively determine the num-ber of connections
Poor response to changing inputs
k-NN
Good choice when there is no prior knowledge of data distribution
Requires rigorous tuning to opti-mally fit the real world data
LVQ
Little computational and memory requirements
Less accurate with high dimen-sional data
LDA
Works best when class has Gaus-sian density
Less accurate with small sample size
ME
Requires only small number of connections in neural network
Learns only static input-output mappings (i.e. no feedback)
MME
Requires only small number of connections in neural network. Faster than ME
Learns only static input-output mappings
Legend: SVM: support vector machine. ANFIS: adaptive neuro-fuzzy inference system. RBF: radial basis function. ARTMAP-IC: adaptive resonance theory mapping instance counting. SOM: self-organizing maps. ESOM: evolving self-organizing maps. GNG: growing neural gas. k-NN: k-nearest-neighbor. LVQ: learning vector quantization. LDA: linear discriminant analysis. ME: mix-ture of experts. MME: modified mixture of experts.
252 The Review of DIABETIC STUDIES Shankaracharya, Odedra, et al. Vol. 7 ⋅ No. 4 ⋅ 2010
Rev Diabet Stud (2010) 7:248-258 Copyright © by Lab & Life Press/SBDR
the k-nearest neighbor (k-NN) algorithm, a new input pattern x is assigned to the class voted by the majority of its k-nearest training patterns [16]. The weight change in k-NN is given by:
( )( ) ( )=
==∆otherwise , 0
if ,- XijWXxfW
jj
γ
where γ is the learning rate and i(x) is the win-
ning node. While the accuracy of k-NN on diabetes detection problem ranges between 71-78% [16, 17], a more sensitive performance with accuracy of 92.38% was achieved with a hybrid model of k-NN and C4.5 algorithms [18, 19].
SOM is a sheet-like artificial neural network (ANN). Cells of this ANN become specifically tuned to input patterns [20]. In order to overcome the topology mismatches that occur with the origi-nal SOM algorithm, and to achieve an optimal use of the neurons, the geometry of the lattice has to match with the data manifold. For this purpose, several so-called growing (incremental) SOM algo-rithms have been developed. The growing neural gas (GNG) algorithms start with two randomly placed, connected neurons [21]. After a fixed num-ber of time steps, the neuron i with the largest ac-cumulated error is determined, and a new neuron inserted between i and one of its neighbors. It does not require predetermination of the neuron quan-tity or topology of structure to be used. It starts with a minimal neuron structure that is incre-mented during training until it reaches a maxi-mum number limit for clusters defined by the user.
The growing cell structure (GCS) algorithm assumes a fixed dimensionality for the lattice [22]. It is well suited for generating a dimensionality-reducing mapping from the input space to the lat-tice space. Deng and Kasabov applied GNG and GCS algorithms to the diabetes diagnosis problem, and reported accuracies of 74.6% and 73.8%, re-spectively [23]. Both GNG and GCS need to calcu-late local resources for prototypes, which intro-duces extra computational effort and reduces their efficiency. Deng and Kasabov proposed the evolv-ing self-organizing maps (ESOM) network struc-ture, which is similar to that of GNG [21]. When applied to diabetes diagnosis, they obtained 78.4% classification accuracy using ESOM.
Support vector machine (SVM) Support vector machine (SVM) operates by
finding a linear hyperplane that separates the
positive and negative examples with a maximum interclass distance [24]. We can define zi as an in-dicator variable which specifies whether a data vector xi is in class diabetics or non-diabetics (e.g., zi = -1 if xi is in the diabetic class and zi = 1 if xi is in the non-diabetic class). The distance of a hyper-plane w to a (transformed) data vector y is defined as | f (y)|/||w||. Together with the fact that the separating hyperplane ensures zi f(yi) ≥ 1 for all n data vectors i, we can express the condition on the margin m as:
( )
nimfzi ,...,1 where, =≥w
y
The goal of SVM training is to find the weight
vector w that maximizes the margin m. Barakat et al. employed SVM to process the inputs, and ex-tracted the rules using an electic approach [25]. This approach was then used to predict the diag-nosis of diabetes using a questionnaire based on demographic, historic, and anthropometric meas-ures. The authors achieved a prediction accuracy of 94%.
A cascade learning system based on general-ized discriminant analysis (GDA) and least square support vector machine (LS-SVM) has been pro-posed for early diagnosis of Pima Indian diabetes disease [26]. The accuracy reported in this study was 78.21% with 10-fold cross-validation. Purnami et al. applied smooth support vector machines (SSVM) to the diabetes detection problem [27]. SSVM, developed by Lee et al., is an extension to SVM in which smoothing function is applied to solve the problem [28]. With SSVM, the investiga-tors achieved a 76.73% accuracy. To improve effi-ciency, they proposed a new multiple knot spline (MKS) smoothing function for SSVM. Replacing the default-plus function of SSVM by MKS, they enhanced the automated diagnosis performance of SSVM with an accuracy of 93.2%.
Neural networks
Multi-layer neural networks
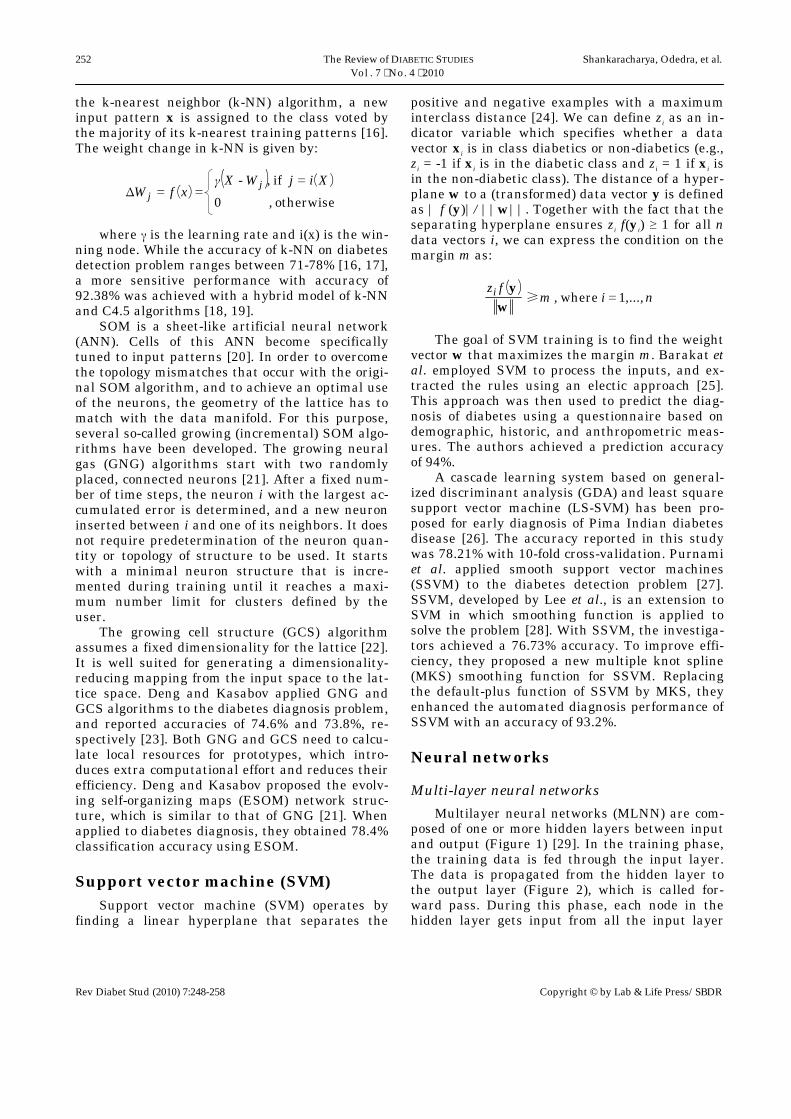
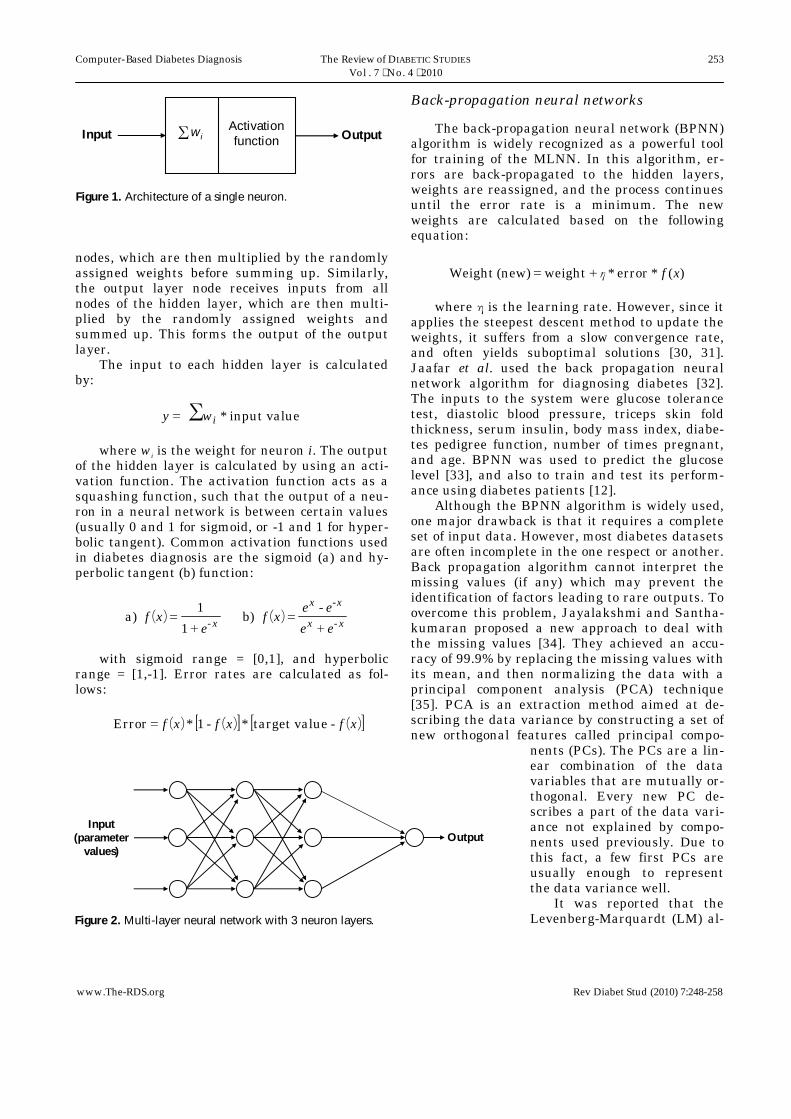
Multilayer neural networks (MLNN) are com-posed of one or more hidden layers between input and output (Figure 1) [29]. In the training phase, the training data is fed through the input layer. The data is propagated from the hidden layer to the output layer (Figure 2), which is called for-ward pass. During this phase, each node in the hidden layer gets input from all the input layer
Computer-Based Diabetes Diagnosis The Review of DIABETIC STUDIES 253 Vol. 7 ⋅ No. 4 ⋅ 2010
www.The-RDS.org Rev Diabet Stud (2010) 7:248-258
nodes, which are then multiplied by the randomly assigned weights before summing up. Similarly, the output layer node receives inputs from all nodes of the hidden layer, which are then multi-plied by the randomly assigned weights and summed up. This forms the output of the output layer.
The input to each hidden layer is calculated by:
valueinput *∑= iwy
where wi is the weight for neuron i. The output
of the hidden layer is calculated by using an acti-vation function. The activation function acts as a squashing function, such that the output of a neu-ron in a neural network is between certain values (usually 0 and 1 for sigmoid, or -1 and 1 for hyper-bolic tangent). Common activation functions used in diabetes diagnosis are the sigmoid (a) and hy-perbolic tangent (b) function:
( ) ( )xx
xx
x ee
eexf
exf -
-
--
b)1
1 a)
+=
+=
with sigmoid range = [0,1], and hyperbolic
range = [1,-1]. Error rates are calculated as fol-lows:
( ) ( )[ ] ( )[ ]xfxfxf - valuetarget*-1* Error =
Back-propagation neural networks
The back-propagation neural network (BPNN) algorithm is widely recognized as a powerful tool for training of the MLNN. In this algorithm, er-rors are back-propagated to the hidden layers, weights are reassigned, and the process continues until the error rate is a minimum. The new weights are calculated based on the following equation:
)( *error * weight (new) Weight xfη+=
where η is the learning rate. However, since it
applies the steepest descent method to update the weights, it suffers from a slow convergence rate, and often yields suboptimal solutions [30, 31]. Jaafar et al. used the back propagation neural network algorithm for diagnosing diabetes [32]. The inputs to the system were glucose tolerance test, diastolic blood pressure, triceps skin fold thickness, serum insulin, body mass index, diabe-tes pedigree function, number of times pregnant, and age. BPNN was used to predict the glucose level [33], and also to train and test its perform-ance using diabetes patients [12].
Although the BPNN algorithm is widely used, one major drawback is that it requires a complete set of input data. However, most diabetes datasets are often incomplete in the one respect or another. Back propagation algorithm cannot interpret the missing values (if any) which may prevent the identification of factors leading to rare outputs. To overcome this problem, Jayalakshmi and Santha-kumaran proposed a new approach to deal with the missing values [34]. They achieved an accu-racy of 99.9% by replacing the missing values with its mean, and then normalizing the data with a principal component analysis (PCA) technique [35]. PCA is an extraction method aimed at de-scribing the data variance by constructing a set of new orthogonal features called principal compo-
nents (PCs). The PCs are a lin-ear combination of the data variables that are mutually or-thogonal. Every new PC de-scribes a part of the data vari-ance not explained by compo-nents used previously. Due to this fact, a few first PCs are usually enough to represent the data variance well.
It was reported that the Levenberg-Marquardt (LM) al-
Activationfunction∑wiInput Output
Figure 1. Architecture of a single neuron.
Input(parameter
values)Output
Figure 2. Multi-layer neural network with 3 neuron layers.

254 The Review of DIABETIC STUDIES Shankaracharya, Odedra, et al. Vol. 7 ⋅ No. 4 ⋅ 2010
Rev Diabet Stud (2010) 7:248-258 Copyright © by Lab & Life Press/SBDR
gorithm [36] provides generally faster convergence and better estimation results than other training algorithms [37]. However, this method can cause a memorization effect when overtraining occurs. If a neural network starts to memorize the training set, its generalization starts to decrease, and its performance may not be improved for untrained test sets. Kayaer and Yildirim used the LM algo-rithm on a Pima Indian dataset, and achieved an accuracy of 77.08% [38], which was lower than other algorithms. Temurtas et al. trained the neu-ral network optimally with a probabilistic neural network (PNN) along with a LM algorithm [39, 40]. They achieved an 82.37% accuracy with this approach.
Radial basis function (RBF)
In neural networks, radial basis functions (RBFs) are used as a replacement for the sigmoi-dal hidden layer transfer function in multi-layer perceptrons (MLP) [41]. The only parameters ad-justed in the learning process are the linear map-ping from the hidden layer to the output layer. Hence, RBF networks have the advantage of not suffering from local minima.
RBF shows good performance in regression applications where the input space dimension is relatively small. However, in prediction problems like diabetes diagnosis, only 68.23% efficiency has been reported, which is far less than other algo-rithms. RBF networks have the disadvantage of requiring good coverage of the input space by ra-dial basis functions. Determination of RBF centers is heavily dependent on the distribution of the in-put data without reference to the prediction task.
General regression neural network (GRNN)
The general regression neural network (GRNN) is related to the radial basis function network and is based on a standard statistical technique called Kernel regression [42]. It ap-proximates any arbitrary function between input and output vectors, and draws the function esti-mate directly from the training data. It does not require an iterative training procedure, as in MLP. For an input estimator ‘x’, corresponding to diabetes risk factor variables, GRNN produces an output estimator ‘y’ which minimizes the estima-tion error. GRNN works on following formula:
( ) dyyxfdyyxyfxyE ),(/),(--
∫∫∞
∞
∞
∞
=
where E[y|x] is the expected value of output y, given the input vector x, and f(x, y) the joint prob-ability density function of x and y.
GRNNs produce a real-valued prediction be-tween 0 and 1. A cut-off value decides the criteria to identify positive prediction. The best result achieved by GRNN on PID is 80.21% using 0.5 as cut-off value for the decision [38].
Neuro-fuzzy inference systems (NFIS)
A neuro-fuzzy network is a fuzzy inference system in an artificial neural network [43]. De-pending on the fuzzy inference system (FIS) type, there are several layers that simulate the proc-esses involved in a fuzzy inference like fuzzifica-tion, inference, aggregation, and defuzzification. Embedding a FIS in the general structure of an artificial neural network (ANN) has the benefit of using ANN training methods to find the parame-ters of a fuzzy system. Linear discriminant analy-sis (LDA) is used to separate the two types of fea-ture variables in a given dataset [44]. Dogantekin et al. used LDA along with artificial neuro FIS (ANFIS) for the detection of diabetes [45]. In this method, LDA is used to separate feature variables between healthy and diabetes data. In the second phase, both the healthy and diabetes features ob-tained in the first phase are given to inputs of the ANFIS classifier. They achieved an 84.61% accu-racy with this approach.
Smith et al. used the PID data set to evaluate the perceptron-like adaptive learning routine (ADAP), and achieved a prediction accuracy of 76% [46]. The performance of fuzzy adaptive reso-nance theory mapping (ARTMAP) on the same da-tabase was 66% [47]. ARTMAP is a supervised learning algorithm for input binary vectors. How-ever, the ARTMAP algorithm required fewer rules and was comparatively faster. Carpenter and Markuzon have presented an instance counting algorithm (ARTMAP-IC) and obtained an 81% ac-curacy against the test set [47].
Expert systems
In real world problems like diabetes detection, a simple classifier is too weak for accurate predic-tion. The use of expert systems and different arti-ficial intelligence techniques for classification sys-tems in medical diagnosis is increasing gradually. Mixture of experts and modified mixture of ex-perts have been successfully implemented to the problem of diabetes diagnosis prediction.

Computer-Based Diabetes Diagnosis The Review of DIABETIC STUDIES 255 Vol. 7 ⋅ No. 4 ⋅ 2010
www.The-RDS.org Rev Diabet Stud (2010) 7:248-258
Mixture of experts
The new supervised learning algorithm called mixture of experts (ME) was proposed by Jacobs et al. [48]. This algorithm divides a learning task into appropriate subtasks, each of which can be solved by simple expert network. The global out-put of the ME system is derived as a convex com-bination of the outputs from a set of N experts, in which the overall predictive performance of the system is generally superior to any of the individ-ual experts.
ME architecture is composed of several expert networks and a gating network (Figure 3). The gating network produces a scalar output from a vector input X. The gating network operates on a generalized linear function where the output for ith input variable is given by:
( )∑=
= n
k
i
k
i
e
evxg
1
,ξ
ξ
where ξi = Vi
T x, and Vi is the weight vector. Each expert network produces an output vector for an input vector based on the following general-ized linear equation:
)()( xWfx ii =σ
where Wi is a weight matrix. The final output
of ME is the sum of multiplications of the outputs from gating and expert networks:
∑=
=n
kkk xvxgx
1
)(),()( σσ
Ubeyli presented an approach to test the per-
formance of ME on PID with a classification accu-racy of 97.93% [49], which was better than conven-tional MLNN. Moreover, the computational time required for classification using ME was compara-tively small.
Modified mixture of experts (MME)
Ubeyli [49] employed a new, fast, and effective modified mixture of experts (MME) approach pro-posed by Chen [50] to further improve the classifi-cation accuracy of ME.
The MME architecture is composed of an as-sembly of N expert networks and a gate-bank (Figure 4). For k different features, expert net-works are divided into k groups, each comprising of N expert networks. Similarly, the gate-bank is composed of k gating networks. The resultant out-put of the gate-bank is a convex weighted sum of outputs produced by all the gating networks. Fi-nally, the overall output of MME is obtained by linear combination of outputs of all N expert net-works weighted by the output of the gate-bank.
)(xσ
Expertnetwork 1
Expertnetwork 2
Expertnetwork n
Gatingnetwork
x x x Figure 3. General architecture of mixture of experts.
σ
Expertnetwork (1,1)
Expertnetwork (1,n1)
Expertnetwork (k,1)
Gatingnetwork 1
Gatingnetwork 2
Gate bank
x1 xk
x1
Expertnetwork (k,nk)
xk
Figure 4. General architecture of modified mixture of experts.

256 The Review of DIABETIC STUDIES Shankaracharya, Odedra, et al. Vol. 7 ⋅ No. 4 ⋅ 2010
Rev Diabet Stud (2010) 7:248-258 Copyright © by Lab & Life Press/SBDR
Ubeyli applied the MME algorithm to the dia-betes diagnosis problem and achieved an accuracy of 99.17% [49]. Apart from outperforming all other algorithms, the computational time required for classification was very small.
Conclusions Despite of the rapid development of theories
for computational intelligence, application to dia-betes diagnosis remains a challenge. This is due to specific problems of data use. These problems arise when statistical models of data are unknown or time-dependent, or when the parameters of the learning system need to be updated incrementally, while only a partial glimpse of incoming data is available. Based on the promising outcomes of studies applying computational algorithms to the problem of diabetes diagnosis, it is clear that a more sophisticated risk score could be developed. This would significantly decrease healthcare costs via early prediction and diagnosis of type 2 diabe-tes.
Some algorithms work better on the diabetes diagnosis problem than others. It will be impor-tant to compare outcomes further to find the most reliable algorithm for clinical application. Neural network methodology has outperformed classical statistical methods in cases where input variables are interrelated. Because clinical measurements are usually derived from multiple interrelated sys-tems, it is evident that neural networks might be more accurate than classical methods in multi-variate analysis of clinical data.
Trained models of diabetes risk factors should be incorporated into easy-to-use software solutions such that medical practitioners, who are not ex-perts in artificial intelligence and computational techniques, may apply them easily. For this pur-pose, graphical user interface-enabled tools need to be developed by which medical practitioners can simply enter health profiles of their patients and receive an instant diabetes prediction with an ac-ceptable degree of confidence. If the ANN-based prediction approach shows improved medical di-agnosis, then it may become more widely accepted as a means to assist patient care in more hospitals and clinics.
Though the PID dataset provides a well vali-dated data for predicting diabetes diagnosis, it is possible that models trained on such a dataset may not perform equally well on profiles of pa-tients from other ethnic group. Therefore, it is rec-ommended that models of choice must be trained on a dataset that closely represents patient pro-files of medical practitioners within specific geo-graphic regions.
Acknowledgements: The authors are grateful to the Sub-Distributed Information Center (BTISnet SubDIC), Department of Biotechnology (No. BT/BI/04/065/04), New Delhi, India, and to the Department of Biotechnol-ogy, Birla Institute of Technology, Mesra, Ranchi, for providing access to software and infrastructure facility for the present study. Disclosures (conflict of interests statement): The authors report no conflict of interests.
■ References 1. Lieberman LS. Dietary, evolutionary, and modernizing
influences on the prevalence of type 2 diabetes. Annu Rev Nutr 2003. 23:345-377.
2. Zhang Y, Dall T, Mann SE, Chen Y, Martin J, Moore V, Baldwin A, Reidel VA, Quick WW. The economic costs of undiagnosed diabetes. Popul Health Manag 2009. 12(2):95-101.
3. Jackson DM, Wills R, Davies J, Meadows K, Singh BM, Wise PH. Public awareness of the symptoms of diabe-tes mellitus. Diabet Med 1991. 8:971-972.
4. Harris MI, Klein R, Wellborn TA, Knuiman MW. Onset of NIDDM occurs at least 4-7 yr before clinical diag-nosis. Diabetes Care 1992. 15:815-819.
5. Knowler WC, Barrett-Connor E, Fowler SE, Ham-man RF, Lachin JM, Walker EA, Nathan DM. Reduc-tion in the incidence of type 2 diabetes with lifestyle inter-vention or metformin. N Engl J Med 2002. 346(6):393-403.
6. Paulweber B, Valensi P, Lindström J Lalic NM, Greaves CJ, McKee M, Kissimova-Skarbek K, Liatis S, Cosson E, Szendroedi J, et al. A European evidence-
based guideline for the prevention of type 2 diabetes. Horm Metab Res 2010. 42(Suppl 1):S3-S36.
7. Lindstrom J, Neumann A, Sheppard KE, Gilis-Januszewska A, Greaves CJ, Handke U, Pajunen P, Puhl S, Pölönen A, Rissanen A, et al. Take action to prevent diabetes - the IMAGE toolkit for the prevention of type 2 diabetes in Europe. Horm Metab Res 2010. 42 (Suppl 1):S37-S55.
8. Schwarz PE, Li J, Lindstorm J, Tuomilehto J. Tools for predicting the risk of type 2 diabetes in daily practice. Horm Metab Res 2009. 41(2):86-97.
9. Sajda P. Machine learning for detection and diagnosis of disease. Annu Rev Biomed Eng 2006. 8:537-565.
10. Frank A, Asuncion A. UCI machine learning repository. Irvine, CA, University of California, School of Information and Computer Science, 2010.
11. Kazemnejad A, Batvandi Z, Faradmal J. Comparison of artificial neural network and binary logistic regression for determination of impaired glucose tolerance/diabetes. East Mediterr Health J 2010. 16(6):615-620.
12. Dey R, Bajpai V, Gandhi G, et al. Application of artifi-cial neural network technique for diagnosing diabetes melli-

Computer-Based Diabetes Diagnosis The Review of DIABETIC STUDIES 257 Vol. 7 ⋅ No. 4 ⋅ 2010
www.The-RDS.org Rev Diabet Stud (2010) 7:248-258
tus. IEEE Third International Conference on Industrial and Information Systems, Kharagpur, India, 2008, 1-4.
13. Heikes KE, Eddy DM, Arondekar B, Schlessinger L. Diabetes risk calculator: a simple tool for detecting undiag-nosed diabetes and pre-diabetes. Diabetes Care 2008. 31:1040-1045.
14. Abbot RD. Logistic regression in survival analysis. Am J Epidemiol 1985. 121(3):465-471.
15. Shanker MS. Using neural networks to predict the onset of diabetes mellitus. J Chem Inf Comput Sci 1996. 36:35-41.
16. Kordos M, Blachnik M, Strzempa D. Do we need whatever more than k-NN? In: Proceedings of the 10th In-ternational Conference on Artificial Intelligence and Soft Computing, Part I, Springer-Verlag Berlin, 2010, 414-421.
17. Ster B, Dobnikar A. Neural networks in medical diagno-sis: comparison with other methods. In: Proceedings of the International Conference on Engineering Applications with Neural Networks, London, 1996, 427-430.
18. Patil BM, Joshi RC, Toshniwal D. Hybrid prediction model for type-2 diabetic patients. Exp Syst Appl 2010. 37:8102-8108.
19. Jantan H, Hamdan AR, Othman ZA. Human talent prediction in HRM using C4.5 classification algorithm. Int J Comp Sci Engin 2010. 2:2526-2534.
20. Kohonen T. Self-organizing formation of topologically correct feature maps. Biol Cybern 1982. 43:59-69.
21. Fritzke B. A growing neural gas network learns topologies. Adv Neural Inf Process Syst 1995. 7:625-632.
22. Fritzke B. Growing cell structures - a self-organizing net-work for unsupervised and supervised learning. Neural Netw 1994. 7:1441-1460.
23. Deng D, Kasabov N. On-line pattern analysis by evolving self-organizing maps. Proceedings of the 5th Biannual Con-ference on Aritificial Neural Networks and Expert Systems (ANNES), Dunedin, 2001, 46-51.
24. Ali S, Abraham A. An empirical comparison of kernel selection for support vector machines. 2nd International Conference on Hybrid Intelligent Systems, Soft Computing systems: Design, Management and Applications, IOS Press, The Netherlands, 2002, 321-330.
25. Barakat NH, Bradley AP, Barakat MB. Intelligible sup-port vector machines for diagnosis of diabetes mellitus. Trans Inf Technol Biomed 2010. 14:1114-1120.
26. Gunes PK, Aslan A. A cascade learning system for classifi-cation of diabetes disease: generalized discriminant analysis and least square support vector machine. Exp Syst Appl 2008. 34:214-221.
27. Purnami SW, Embong A, Zain JM. A New smooth support vector machine and its applications in diabetes dis-ease diagnosis. J Comp Sci 2009. 5:1006-1011.
28. Lee YJ, Mangasarian OL. A smooth support vector ma-chine. J Comp Optim Appl 2001. 20:5-22.
29. Basheer IA, Hajmeer M. Artificial neural networks: fun-damentals, computing, design, and application. J Microbiol Meth 2000. 43:3-31.
30. Brent RP. Fast training algorithms for multi-layer neural nets. IEEE Trans Neural Netw 1991. 2(3):346-354.
31. Gori M, Tesi A. On the problem of local minima in back-propagation. IEEE Trans Pattern Anal Mach Intell 1992. 14:76-85.
32. Jaafar, SF, Ali DM. Diabetes mellitus forecast using artifi-cial neural networks. Asian conference of paramedical re-search proceedings, Kuala Lumpur, Malaysia, 2005, 5-7.
33. Eskaf EK, Badawi O, Ritchings T. Predicting blood glucose levels in diabetes using feature extraction and artifi-cial neural networks. Third ICTTA conference, Damascus, 2008, 1-6.
34. Jayalakshmi T, Santhakumaran A. A novel classification method for classification of diabetes mellitus using artificial neural networks. International Conference on Data Storage and Data Engineering, Bangalore, 2010, 159-163.
35. Chen LH, Chang S. An adaptive learning algorithm for principal component analysis. IEEE Trans Neural Netw 1995. 6:1255-1263.
36. Hagan MT, Menhaj M. Training feed forward networks with the Marquardt algorithm. IEEE Trans Neural Netw 1994. 5:989-993.
37. Gulbag A, Temurtas F. A study on quantitative classifica-tion of binary gas mixture using neural networks and adap-tive neuro fuzzy inference systems. Sens Actuators B Chem 2006. 115:252-262.
38. Kayaer K, Yildirim T. Medical diagnosis on Pima Indian diabetes using general regression neural networks. Proceed-ings of the international conference on artificial neural net-works and neural information processing, Istanbul, 2003, 181-184.
39. Temurtas H, Yumusak N, Temurtas F. A comparative study on diabetes disease diagnosis using neural networks. Expert Syst Appl 2009. 36:8610-8615.
40. Specht DF. Probabilistic neural networks. Neural Netw 1990. 3:109-118.
41. Buhmann, Martin D. Radial basis functions: theory and implementations. Cambridge University Press, 2003. pp 54-78.
42. Hagan MT, Demuth HB, Beale M. Neural network de-sign. PWS Publishing Company, 1996. pp 102-108.
43. Bart K. Neural networks and fuzzy systems: a dynamical systems approach to machine intelligence. Prentice Hall, 1992. pp 36-49.
44. Polat K, Gunes S, Arslan A. A cascade learning system for classification of diabetes disease: Generalized discriminant analysis and least square support vector machine. Exp Syst Appl 2008. 34:482-487.
45. Dogantekin E, Dogantekin A, Avci D, et al. An intel-ligent diagnosis system for diabetes on Linear Discriminant Analysis and Adaptive Network Based Fuzzy Inference Sys-tem: LDA-ANFIS. Digit Signal Process 2009. 20:1248-1255.
46. Smith JW, Everhart JE, Dickson WC, et al. Using the ADAP learning algorithm to forecast the onset of diabetes mellitus. Proceedings of the Symposium on Computer Ap-plications and Medical Care, IEEE Computer Society Press, 1988, 261-265.
47. Carpenter GA, Markuzon N. ARTMAP-IC and medical diagnosis: instance counting and inconsistent cases. Neural Netw 1998. 11:323-336.
48. Jacobs RA, Jordan MI, Nowlan SJ, et al. Adaptive mix-tures of local experts. Neural Comput 1991. 3:79-87.
49. Ubeyli ED. Modified mixture of experts for diabetes diag-nosis. J Med Syst 2009. 33:299-305.
50. Chen K. A connectionist method for pattern classification with diverse features. Pattern Recognit Lett 1998. 19:7545-558.
51. Kamruzzaman SM, Hasan AR, Siddiquee AB, et al. Medical diagnosis using neural network. Proceedings of the 3rd International Conference on Electrical and Computer Engineering, Dhaka, Bangladesh, 2004. 537-540.
258 The Review of DIABETIC STUDIES Shankaracharya, Odedra, et al. Vol. 7 ⋅ No. 4 ⋅ 2010
Rev Diabet Stud (2010) 7:248-258 Copyright © by Lab & Life Press/SBDR
52. Ubeyli ED. Automatic diagnosis of diabetes using adaptive neuro-fuzzy inference systems. Expert Syst 2010. 27:259-266.
53. Stoean C, Stoean R, Preuss M, et al. Diabetes diagnosis through the means of a multimodal evolutionary algorithm. Proceedings of the 1st East European Conference on Health Care Modelling and Computation, Craiova, Romania, Craiova, Medical University Press, 2005, 277-289.
54. Shang N, Breiman L. Distribution based trees are more
accurate. Proceedings of ICONIP 96, Springer, Hong Kong, 1996, 133-138.
55. Polat K, Gunes S. An expert system approach based on principal component analysis and adaptive neuro-fuzzy in-ference system to diagnosis of diabetes disease. Digit Sign Proc 2007. 17:702-710.
56. Friedman N, Geiger D, Goldszmit M. Bayesian net-works classifiers. Mach Learn 1997. 29:131-163.