modeling, analysis and optimization of cylindrical stiffened
Upload
khangminh22Category
view
0download
0
USAFA-TR-2005-4
Compression Buckling of Z-Stiffened Aluminum
Panels, with and without Corrosion Grindouts
James M. Greer, Jr., Daniel W. Hill, and Scott A. FawazCenter for Aircraft Structural Life Extension
U.S. Air Force Academy CO 80840(719) 333-3618, DSN 333-3618
Ron LoganNorthrop Grumman Corporation Integrated Systems
AGS & BMS, Melbourne FL(321) 951-6803
Center for Aircraft Structural Life ExtensionDepartment of Engineering Mechanics
United States Air Force AcademyColorado Springs, Colorado 80840
January 2005
APPROVED FOR PUBLIC RELEASE; DISTRIBUTION UNLIMITED
DEAN OF THE FACULTYUNITED STATES AIR FORCE ACADEMY
COLORADO 80840

USAFA-TR-2005-4
USAFA-TR-2005-4
This article, “Compression Buckling of Z-Stiffened Aluminum Panels, with and with-out Corrosion Grindouts,” is presented as a competent treatment of the subject, wor-thy of publication. The United States Air Force Academy vouches for the quality ofthe research, without necessarily endorsing the opinions and conclusions of the authors.Therefore, the views expressed in this article are those of the authors and do not reflectthe official policy or position of the United States Air Force, Department of Defense, orthe US Government.
This report has been cleared for open publication and public release by the appropriateOffice of Information in accordance with AFI 61-202 and USAFA FOI 190-1. This reportmay have unlimited distribution.
i
USAFA-TR-2005-4
EXECUTIVE SUMMARY
This effort is funded by the Aging Aircraft Squadron of the Aeronautical EnterpriseProgram Office (ASC/AAA, Col P.J. Clark). The prime contractor for the Air VehicleHealth Management program, of which this effort is a part, is S&K Technologies, Inc.,Dayton, OH (Mr. Kevin Boyd).
Twenty-seven Z-stiffened panels, intended to simulate upper wing skin panels of theBoeing 707, were tested to failure in compression to determine buckling strength. Pristinepanels and panels with machined grindouts (with various depths up to 62.6% of thepanel skin thickness) were tested to failure. Nine panels each of three configurationswere fabricated for testing. The results showed a degradation of buckling strength withgrindout depth that could be modeled with a modified Johnson-Euler method and amodified Gerard’s method for long and short panels respectively. The panels with thelower slenderness ratio (short panels) were degraded more by a given grindout depth thanwere their more slender counterparts. However, it was found that span-wise grindoutsalong the center stiffener—even deep ones—do not have a severe effect on strength.Even at over 60% grindout depth, the worst degradation was less than a 12% reductionin strength.
A small number of panels were tested with deep chord-wise grindouts. These testsshowed that the strength of the panel was dramatically reduced by these grindouts, whichwere transverse to the loading direction.
ii
USAFA-TR-2005-4
Table of Contents
Executive Summary ii
List of Figures iv
List of Tables v
List of Symbols vi
1 Introduction 1
2 Background 12.1 The Problem . . . . . . . . . . . . . . . . . . . . . . . . . . . . . . . . . 12.2 Approach . . . . . . . . . . . . . . . . . . . . . . . . . . . . . . . . . . . 12.3 Previous Experimental Work . . . . . . . . . . . . . . . . . . . . . . . . . 1
3 Specimen Fabrication and Instrumentation 53.1 Fabrication . . . . . . . . . . . . . . . . . . . . . . . . . . . . . . . . . . 53.2 Instrumentation . . . . . . . . . . . . . . . . . . . . . . . . . . . . . . . . 6
4 Experimental Results 94.1 Test Set-Up . . . . . . . . . . . . . . . . . . . . . . . . . . . . . . . . . . 94.2 Test Procedure . . . . . . . . . . . . . . . . . . . . . . . . . . . . . . . . 94.3 Test Results . . . . . . . . . . . . . . . . . . . . . . . . . . . . . . . . . . 10
4.3.1 Span-Wise Grindouts . . . . . . . . . . . . . . . . . . . . . . . . . 124.3.2 Chord-Wise Grindouts . . . . . . . . . . . . . . . . . . . . . . . . 12
4.4 Errors in Experimental Values . . . . . . . . . . . . . . . . . . . . . . . . 13
5 Modeling Panel Behavior 145.1 Long Panels (C1 and C2) . . . . . . . . . . . . . . . . . . . . . . . . . . . 145.2 Short Panels (C3) . . . . . . . . . . . . . . . . . . . . . . . . . . . . . . . 155.3 Modeling Summary . . . . . . . . . . . . . . . . . . . . . . . . . . . . . . 17
6 Conclusions 18
Acknowledgements 19
Appendix: Sample Calculations A–1
A.1 Johnson-Euler Method A–1A.1.1 Damaged Panels . . . . . . . . . . . . . . . . . . . . . . . . . . . . . . . A–3
A.2 Method of Gerard A–3A.2.1 Damaged Panels . . . . . . . . . . . . . . . . . . . . . . . . . . . . . . . A–4
iii
USAFA-TR-2005-4
List of Figures
1 Approximate gage locations of Hickman and Dow. . . . . . . . . . . . . . 22 Gage locations of Friedman. . . . . . . . . . . . . . . . . . . . . . . . . . 33 Gage locations of Butler, et al. . . . . . . . . . . . . . . . . . . . . . . . . 44 Cross section of stiffened panels. . . . . . . . . . . . . . . . . . . . . . . . 55 Step-tapered grindout geometry. . . . . . . . . . . . . . . . . . . . . . . . 66 Typical linear buckling analysis of panel. . . . . . . . . . . . . . . . . . . 77 Initial and final strain gage locations. . . . . . . . . . . . . . . . . . . . . 88 Typical long panel behavior of a gage pair. . . . . . . . . . . . . . . . . . 89 Set up for panel buckling experiments. . . . . . . . . . . . . . . . . . . . 910 Typical damage progression with load. . . . . . . . . . . . . . . . . . . . 1011 Panel strength as a function of grindout depth for 3 configurations with
span-wise grindouts. . . . . . . . . . . . . . . . . . . . . . . . . . . . . . 1212 Comparison of C1 panel results with modified Johnson-Euler method. . . 1513 Comparison of C2 panel results with modified Johnson-Euler method. . . 1514 Comparison of C3 panel results with modified method of Gerard. Dotted
line indicates Johnson-Euler model for this panel. . . . . . . . . . . . . . 17
iv

USAFA-TR-2005-4
List of Tables
1 Properties of panel materials. . . . . . . . . . . . . . . . . . . . . . . . . 52 Panel specifications. . . . . . . . . . . . . . . . . . . . . . . . . . . . . . . 63 Buckling test results for three panel configurations. . . . . . . . . . . . . 114 Buckling test results for chord-wise grindout panels. . . . . . . . . . . . . 13A.1 Calculation of stiffener crippling load using the Johnson-Euler method. . A–1A.2 Calculation of segment section properties. . . . . . . . . . . . . . . . . . A–2A.3 Calculation of new segment section properties. . . . . . . . . . . . . . . . A–3
v
USAFA-TR-2005-4
List of Symbols
Aeff . . . . . . . . . . . . . . . . . . . . . . . . . . . . . . . . . . . . . . . . . . . . . . . . . . . . . . . . . . . . . . . . . effective skin areaAs . . . . . . . . . . . . . . . . . . . . . . . . . . . . . . . . . . . . . . . . . . . . . . . . . . . skin segment cross-sectional areaAtot . . . . . . . . . . . . . . . . . . . . . . . . . . . . . . . . . . . . . . . . . . . . . . section cross-sectional area, As + Aw
Aw . . . . . . . . . . . . . . . . . . . . . . . . . . . . . . . . . . . . . . . . . . . . . . . . . single stiffener cross-sectional areab . . . . . . . . . . . . . . . . . . . . . . . . . . . . . . . . . . . . . . . . . . . . . . . . . . . . . . . . . . . . . . . . . . . . . stiffener spacingC1 . . . . . . . . . . . . . . . . . . . . . . . . . . . . . . . . . . . . . . . . . . . . . . . . . . . . . . . . . . . . panel configuration #1C2 . . . . . . . . . . . . . . . . . . . . . . . . . . . . . . . . . . . . . . . . . . . . . . . . . . . . . . . . . . . . panel configuration #2C3 . . . . . . . . . . . . . . . . . . . . . . . . . . . . . . . . . . . . . . . . . . . . . . . . . . . . . . . . . . . . panel configuration #3c . . . . . . . . . . . . . . . . . . . . . . . . . . . . . . . . . . . . . . . . . . . . . . . . . . . . . . . . . . . . . . . . . . end-fixity conditiond . . . . . . . . . . . . . . . . . . . . . . . . . . . . . . . . . . . . . . . . . . . . . . . . . . . . . . . . . . . . . . crosshead displacementE . . . . . . . . . . . . . . . . . . . . . . . . . . . . . . . . . . . . . . . . . . . . . . . . . . . . . . . . . . . . . . . . . . . Young’s modulusEc . . . . . . . . . . . . . . . . . . . . . . . . . . . . . . . . . . . . . . . . . . . . . . . . . . . . Young’s modulus (compressive)Hw . . . . . . . . . . . . . . . . . . . . . . . . . . . . . . . . . . . . . . . . . . . . . . . . . . . . . . . . . . . . . . . . . . . . stiffener heightIox . . . . . . . . . . . . . . . . . . . . . . . . stiffener section second area moment about its own centroidK . . . . . . . . . . . . . . . . . . . . . . . . . . . . . . . . . . . . . . . . . . . . . . . . . . . . . . . . . . . . . . . . . . . . slenderness ratioL . . . . . . . . . . . . . . . . . . . . . . . . . . . . . . . . . . . . . . . . . . . . . . . . . . . . . . . . . . . . . . . . original panel lengthL′ . . . . . . . . . . . . . . . . . . . . . . . . . . . . . . . . . . . . . equivalent length based on end-fixity conditionm . . . . . . . . . . . . . . . . . . . . . . . . . . . . . . . . . . . . . . . . . . . . . . . . . . . . . . . . . Gerard equation parameterPcc . . . . . . . . . . . . . . . . . . . . . . . . . . . . . . . . . . . . . . . . . . . . . . . . . . . . . . . . . . . . . stiffener crippling loadPco . . . . . . . . . . . . . . . . . . . . . . . . . . . . . . . . . . . . . . . . . . . . . segment Johnson-Euler allowable loadPmax . . . . . . . . . . . . . . . . . . . . . . . . . . . . . . . . . . . . . . . . . . . . . . . . . . . max recorded load during testPs . . . . . . . . . . . . . . . . . . . . . . . . . . . . . . . . . . . . . . . . . . . . . . . . . . . . . . . . . . . . . . . load at skin bucklingts . . . . . . . . . . . . . . . . . . . . . . . . . . . . . . . . . . . . . . . . . . . . . . . . . . . . . . . . . . . . . . . . . . . . . . . skin thicknesstw . . . . . . . . . . . . . . . . . . . . . . . . . . . . . . . . . . . . . . . . . . . . . . . . . . . . . . . . . . . . . . . . . . stiffener thicknesst̄ . . . . . . . . . . . . . . . . . . . . . . . . . . . . . . . . . . . . . . . . . . . . . . . . . . . . . equivalent skin thickness, Atot/bWe . . . . . . . . . . . . . . . . . . . . . . . . . . . . . . . . . . . . . . . . . . . . . . . . . . . . . . . . . . . . . . . . effective skin widthWfi . . . . . . . . . . . . . . . . . . . . . . . . . . . . . . . . . . . . . . . . . . . . . . . . . . . . . . . . . . . . . . inboard flange widthWfo . . . . . . . . . . . . . . . . . . . . . . . . . . . . . . . . . . . . . . . . . . . . . . . . . . . . . . . . . . . . outboard flange widthYc . . . . . . . . . . . . . . . . . . . . . . . . . . . . . . . . . . . . . . . . . . . . . . . . . . . . . . . . . . . . . . . . . . . . section centroidy . . . . . . . . . . . . . . . . . . . . . . . . distance referenced from outboard surface of outboard flangeβ . . . . . . . . . . . . . . . . . . . . . . . . . . . . . . . . . . . . . . . . . . . . . . . . . . . . . . . . . . Gerard equation parameterδg . . . . . . . . . . . . . . . . . . . . . . . . . . . . . . . . . . . . . . . . . . . depth of grindout as pct of skin thickness∆L/L . . . . . . . . . . . . . . . . . . . . . . . . . . . . . . . . . . . . . . . . change in length per unit length at Pmax
∆Pmax . . . . . . . . . . . . . . . . . . . . . . . . . change in max load carrying capability due to damageεi . . . . . . . . . . . . . . . . . . . . . . . . . . . . . . . . . . . . . . . . . . . . . . . . . . . . . . . . . . . . axial strain in stiffener iρ . . . . . . . . . . . . . . . . . . . . . . . . . . . . . . . . . . . . . . . . . . . . . . . . . . . . . . . . . . . . . . . . . . . radius of gyrationσcc . . . . . . . . . . . . . . . . . . . . . . . . . . . . . . . . . . . . . . . . . . . . . . . . . . . . . . . . . . . . stiffener crippling stressσco . . . . . . . . . . . . . . . . . . . . . . . . . . . . . . . . . . . . . . . . . . . . segment Johnson-Euler allowable stressσcys . . . . . . . . . . . . . . . . . . . . . . . . . . . . . . . . . . . . compressive yield strength of the skin materialσcyw . . . . . . . . . . . . . . . . . . . . . . . . . . . . . . . . compressive yield strength of the stiffener materialσU . . . . . . . . . . . . . . . . . . . . . . . . . . . . . . . . . . . . . . . . . . . . . . . . . . material tensile ultimate strengthσY . . . . . . . . . . . . . . . . . . . . . . . . . . . . . . . . . . . . . . . . . . . . . . . . . . . . . . material tensile yield strength
vi
USAFA-TR-2005-4
1 Introduction
The objective of this investigation was to determine the effect of corrosion grindouts onthe compressive strength of B-707 upper wing skin panels. Three representative geome-tries were considered. One configuration represented the minimum strength wing panel(40 ksi, Configuration #1, or C1), and one represented the maximum strength wing panel(64 ksi, Configuration #3, or C3). A third configuration was also tested. These panels,denoted Configuration #2 (C2), were mistakenly manufactured with thicker stiffeners,but were tested nonetheless to provide additional data for this study. Two pristine pan-els in each configuration were tested, and damage was introduced into each of the otherpanels in the form of uniform spanwise grindouts. These grindouts ranged from 35% to63% of the panel skin thickness, and were meant to simulate severe in-service corrosiongrindouts.
2 Background
2.1 The Problem
Current guidance for corrosion repairs to USAF aircraft includes the requirement toremove the visible products of corrosion. Removal of these products is often accomplishedby grinding the surface of the material until pristine material is exposed. If the depth ofthe grindout exceeds a certain percentage of the thickness of the material, the materialmust be replaced. The limits specified in the Technical Orders for a particular aircraft arebased on engineering judgement and analysis. The current effort attempts to quantify,through experiment, the degradation in buckling strength caused by a uniform grindout.
2.2 Approach
In this study, grindouts of known depth were made along the length of a panel stiffener,and the panel was tested to failure. Panels with no grindouts were are also testedfor reference. The panels were manufactured by Valco Manufacturing, Inc. of Duncan,Oklahoma. Panels were received with four of five stiffeners attached (riveted) to the skin,with the center stiffener drilled, but not attached. These center stiffeners were attachedafter surface grindouts were machined into the specimen. The few panels meant forbaseline testing (pristine panels) were received with all five stiffeners attached.
2.3 Previous Experimental Work
Significant relevant work has been done in the area of buckling of rib-stiffened panels ashas some analytical work on corroded plates by Lakhote, Pandey, and Sherbourne [1],and by Roorda, Srivastava, Maslouhi, and Sherbourne [2]. However, none of this workhas involved the sort of simulated grindout damage applied in the current effort. Still, itshould be mentioned that Lakhote, et al. [1], in their analytical work on flat, unstiffenedpanels with deep, centrally-located square grindouts, found that a correct assessment ofthe pre-buckling redistribution of stresses is required to avoid seriously overestimating thereduction in buckling strength. As will be shown in the current work, even deep grindouts
1
USAFA-TR-2005-4
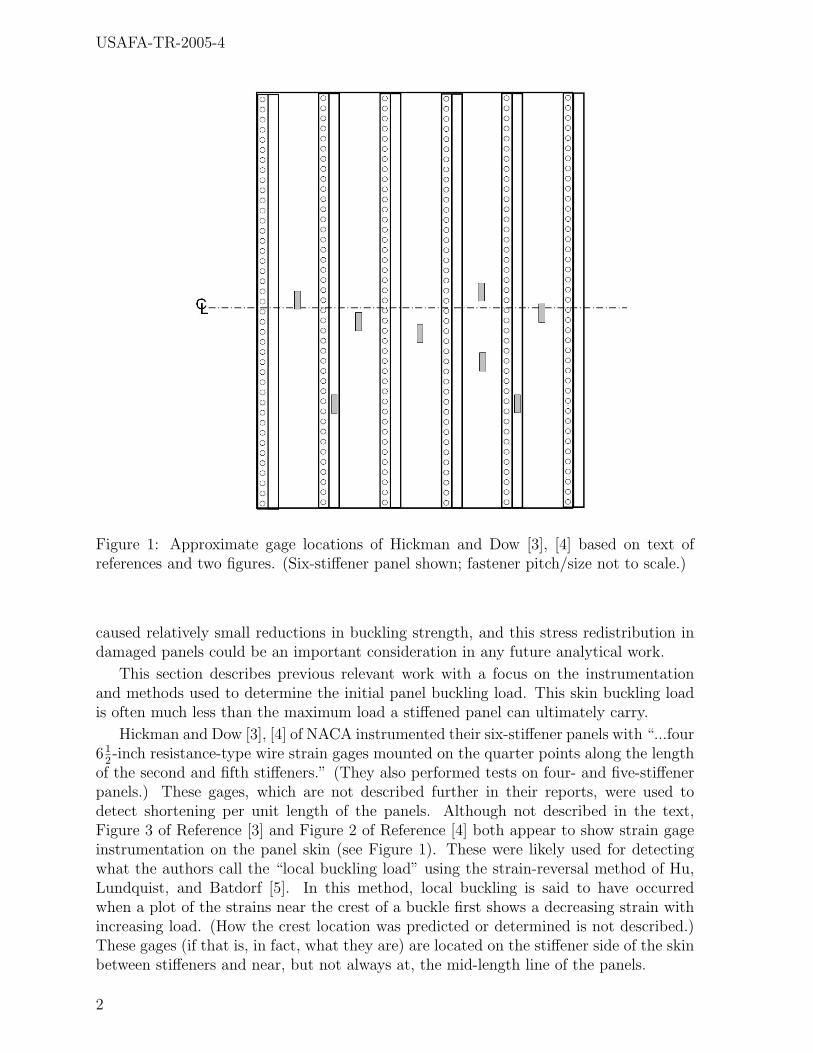
Figure 1: Approximate gage locations of Hickman and Dow [3], [4] based on text ofreferences and two figures. (Six-stiffener panel shown; fastener pitch/size not to scale.)
caused relatively small reductions in buckling strength, and this stress redistribution indamaged panels could be an important consideration in any future analytical work.
This section describes previous relevant work with a focus on the instrumentationand methods used to determine the initial panel buckling load. This skin buckling loadis often much less than the maximum load a stiffened panel can ultimately carry.
Hickman and Dow [3], [4] of NACA instrumented their six-stiffener panels with “...four61
2-inch resistance-type wire strain gages mounted on the quarter points along the length
of the second and fifth stiffeners.” (They also performed tests on four- and five-stiffenerpanels.) These gages, which are not described further in their reports, were used todetect shortening per unit length of the panels. Although not described in the text,Figure 3 of Reference [3] and Figure 2 of Reference [4] both appear to show strain gageinstrumentation on the panel skin (see Figure 1). These were likely used for detectingwhat the authors call the “local buckling load” using the strain-reversal method of Hu,Lundquist, and Batdorf [5]. In this method, local buckling is said to have occurredwhen a plot of the strains near the crest of a buckle first shows a decreasing strain withincreasing load. (How the crest location was predicted or determined is not described.)These gages (if that is, in fact, what they are) are located on the stiffener side of the skinbetween stiffeners and near, but not always at, the mid-length line of the panels.
2

USAFA-TR-2005-4
Figure 2: Gage locations from Figure 2 of Reference [7]. White boxes indicate gagesmounted on outer-most surface of Z-stiffener. Black boxes indicate gages mounted onflat side of panel. “(2)” indicates two gages in this location, one on each side of the skin.Fastener pitch/size not to scale.
Rothwell [6] measured the test panels for imperfections prior to testing, but collectedno data other than maximum load carried during the displacement-controlled tests.
Friedman, et al. [7] took strain and displacement measurements on their four-stiffener,Z-stiffened aluminum panels. Two strain gages were placed opposite each other on eachside of the skin half-way between rivet rows and centered along the length. A strain gagewas also placed on the top (outer-most) surface of each Z-stiffener, and these were alsocentered along the length (aligned with the skin gages). An additional gage was placedon the non-stiffener side of the skin, centered along the length, and directly underneaththe vertical part of each Z-stiffener. Finally, two more gages were placed opposite eachother on each side of the skin half-way between the central row of gages and the panelend1, centered on the width of the panel. Therefore, a total of 16 gages were used toinstrument a four-stiffener panel (see Figure 2).
In their book, Singer, Arbocz, and Weller [8] suggest a number of methods to deter-mine critical (buckling) load in plates under compression, including the aforementioned
1Actually, these two gages were placed half-way between the central row of gages and the beginningof the potting for the panel end.
3

USAFA-TR-2005-4
Figure 3: Gage locations from Figures 2 and 3 of Reference [9]. Stiffener gages are locatedon the vertical flange of the L-stiffeners. Fastener pitch/size not to scale.
technique of Hu, et al. [5]. They also describe a method of detecting buckling by observingthe inflection in the curve of the algebraic compressive strain average, εA = 1
2(ε1 + ε2),
versus axial load, where ε1 and ε2 are strains at the same location on opposite sides ofthe skin. Again, these strains are taken at a “crest” of a buckle.
Butler, et al. [9] instrumented their panels at mid-length, with one gage on each stiff-ener and one gage centered on the stiffener side of the skin between stiffeners. Additionalgages were placed to detect skin buckling (see Figure 3). The stiffeners were L-shaped,and the stiffener gages were placed 10 mm and 3 mm from the edge of the stiffener forthe three-stiffener and four-stiffener panels, respectively. The gages served two purposes:(1) comparison with the optimization code used in their study and (2) monitoring the on-set and advance of buckling. They found the strain gage information to be more accuratethan load versus end displacement plots.
Aalberg, et al. [10] did not use strain gages in their tests, but chose instead to monitorload versus displacement. They also measured out-of-plane displacement continuouslythroughout their displacement-controlled tests (displacement was approximately 1 mmper minute).
After this review of the relevant literature, it was decided to instrument the panelsas described in Section 3.2.
4
USAFA-TR-2005-4
3 Specimen Fabrication and Instrumentation
3.1 Fabrication
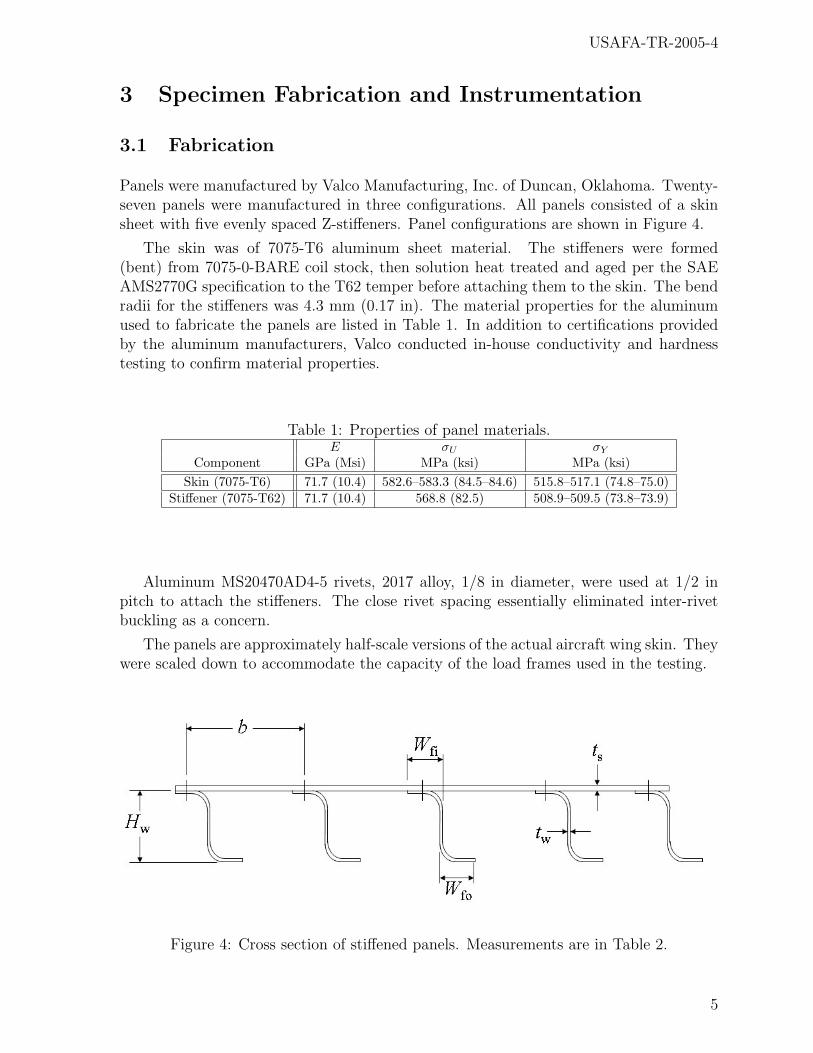
Panels were manufactured by Valco Manufacturing, Inc. of Duncan, Oklahoma. Twenty-seven panels were manufactured in three configurations. All panels consisted of a skinsheet with five evenly spaced Z-stiffeners. Panel configurations are shown in Figure 4.
The skin was of 7075-T6 aluminum sheet material. The stiffeners were formed(bent) from 7075-0-BARE coil stock, then solution heat treated and aged per the SAEAMS2770G specification to the T62 temper before attaching them to the skin. The bendradii for the stiffeners was 4.3 mm (0.17 in). The material properties for the aluminumused to fabricate the panels are listed in Table 1. In addition to certifications providedby the aluminum manufacturers, Valco conducted in-house conductivity and hardnesstesting to confirm material properties.
Table 1: Properties of panel materials.E σU σY
Component GPa (Msi) MPa (ksi) MPa (ksi)Skin (7075-T6) 71.7 (10.4) 582.6–583.3 (84.5–84.6) 515.8–517.1 (74.8–75.0)
Stiffener (7075-T62) 71.7 (10.4) 568.8 (82.5) 508.9–509.5 (73.8–73.9)
Aluminum MS20470AD4-5 rivets, 2017 alloy, 1/8 in diameter, were used at 1/2 inpitch to attach the stiffeners. The close rivet spacing essentially eliminated inter-rivetbuckling as a concern.
The panels are approximately half-scale versions of the actual aircraft wing skin. Theywere scaled down to accommodate the capacity of the load frames used in the testing.
Figure 4: Cross section of stiffened panels. Measurements are in Table 2.
5

USAFA-TR-2005-4
Table 2: Panel specifications for Figure 4. Dimensions are mm (in).
Config ts tw Wfi Wfo Hw b L
1 2.03 (0.080) 1.78 (0.070) 16.3 (0.64) 16.3 (0.64) 37.1 (1.46) 106 (4.19) 531 (20.9)2 2.03 (0.080) 2.03 (0.080) 16.3 (0.64) 16.3 (0.64) 37.1 (1.46) 106 (4.19) 531 (20.9)3 2.03 (0.080) 2.03 (0.080) 15.2 (0.60) 15.2 (0.60) 28.2 (1.11) 54.4 (2.14) 279 (11.0)
Panels were received assembled, except for those panels that were to receive grindouts.For these panels, the manufacturer drilled the skin and stiffeners with rivet holes, but didnot attach the stiffeners. The grindouts were accomplished on the non-stiffener side in theform of a channel along the center rivet row. The center stiffener was then attached withthe rivets. The grindouts and attachments were made using a flat end mill. The targetgrindout channel depths were of 30% and 50% skin thickness. The grindout edges werestep-tapered on a slope of 25:1 (per Northrop-Grumman criterion) as shown in Figure 5.The actual depths of the grindouts are presented with the results in Section 4.
Figure 5: Step-tapered grindout geometry for simulated corrosion grindout. The grindoutruns the entire length of the panel.
3.2 Instrumentation
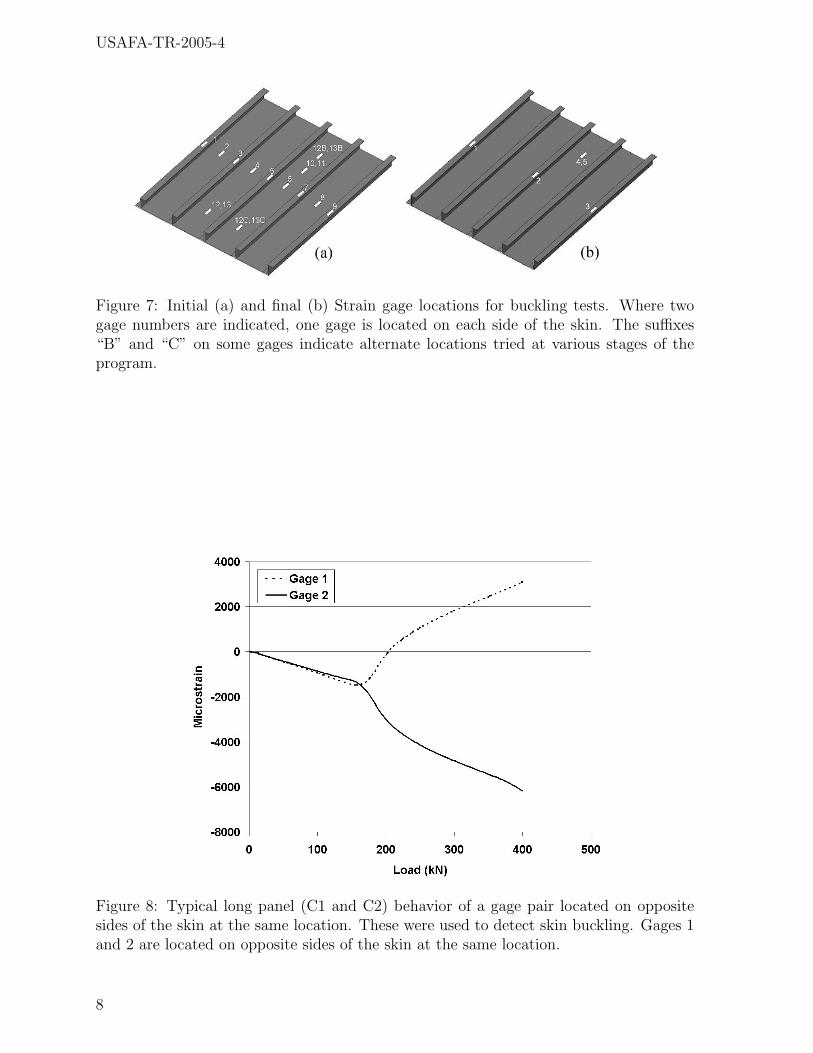
Instrumentation for initial tests involved 13 strain gages: one on each of the five stiffen-ers, four between stiffeners, and four located in pairs at predicted skin buckling locations.After gaining some confidence in the loading scheme, the number of gages was reducedto five, applied to the panels as shown in Figure 7. For the short panels, skin buck-ling was more difficult to detect, so one additional pair of skin gages was used. Themicromeasurements CEA-13-250UN-120 gages were used in this effort.
The three stiffener gages were used to determine whether the loading on the panelwas being evenly applied. Agreement of strains within 10% was taken as the criterion:
max {|ε1 − ε2|, |ε1 − ε3|, |ε2 − ε3|}(ε1 + ε2 + ε3) /3
× 100 ≤ 10 (1)
Typically, this check was performed at low load levels (< 25% of the failure load), thenminor adjustments were made to the fixed crosshead when necessary. Minor adjustmentswere made for almost every panel test.
6
USAFA-TR-2005-4
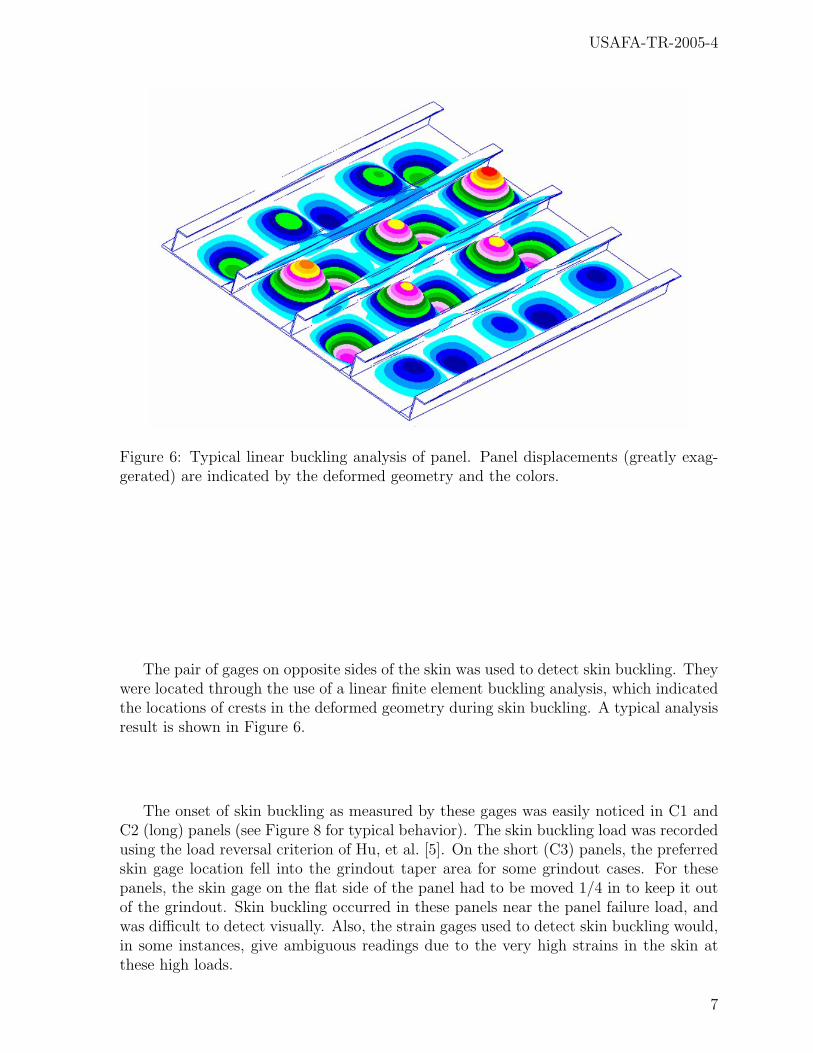
Figure 6: Typical linear buckling analysis of panel. Panel displacements (greatly exag-gerated) are indicated by the deformed geometry and the colors.
The pair of gages on opposite sides of the skin was used to detect skin buckling. Theywere located through the use of a linear finite element buckling analysis, which indicatedthe locations of crests in the deformed geometry during skin buckling. A typical analysisresult is shown in Figure 6.
The onset of skin buckling as measured by these gages was easily noticed in C1 andC2 (long) panels (see Figure 8 for typical behavior). The skin buckling load was recordedusing the load reversal criterion of Hu, et al. [5]. On the short (C3) panels, the preferredskin gage location fell into the grindout taper area for some grindout cases. For thesepanels, the skin gage on the flat side of the panel had to be moved 1/4 in to keep it outof the grindout. Skin buckling occurred in these panels near the panel failure load, andwas difficult to detect visually. Also, the strain gages used to detect skin buckling would,in some instances, give ambiguous readings due to the very high strains in the skin atthese high loads.
7
USAFA-TR-2005-4
Figure 7: Initial (a) and final (b) Strain gage locations for buckling tests. Where twogage numbers are indicated, one gage is located on each side of the skin. The suffixes“B” and “C” on some gages indicate alternate locations tried at various stages of theprogram.
Figure 8: Typical long panel (C1 and C2) behavior of a gage pair located on oppositesides of the skin at the same location. These were used to detect skin buckling. Gages 1and 2 are located on opposite sides of the skin at the same location.
8
USAFA-TR-2005-4
4 Experimental Results
4.1 Test Set-Up
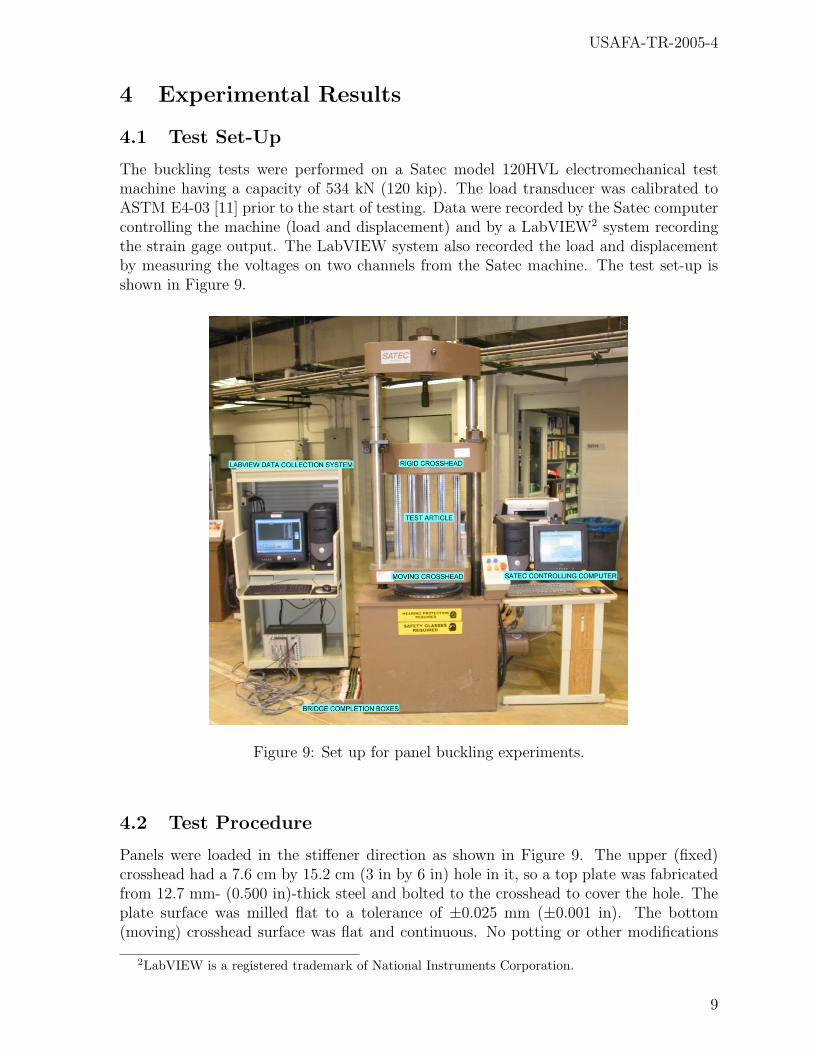
The buckling tests were performed on a Satec model 120HVL electromechanical testmachine having a capacity of 534 kN (120 kip). The load transducer was calibrated toASTM E4-03 [11] prior to the start of testing. Data were recorded by the Satec computercontrolling the machine (load and displacement) and by a LabVIEW2 system recordingthe strain gage output. The LabVIEW system also recorded the load and displacementby measuring the voltages on two channels from the Satec machine. The test set-up isshown in Figure 9.
Figure 9: Set up for panel buckling experiments.
4.2 Test Procedure
Panels were loaded in the stiffener direction as shown in Figure 9. The upper (fixed)crosshead had a 7.6 cm by 15.2 cm (3 in by 6 in) hole in it, so a top plate was fabricatedfrom 12.7 mm- (0.500 in)-thick steel and bolted to the crosshead to cover the hole. Theplate surface was milled flat to a tolerance of ±0.025 mm (±0.001 in). The bottom(moving) crosshead surface was flat and continuous. No potting or other modifications
2LabVIEW is a registered trademark of National Instruments Corporation.
9
USAFA-TR-2005-4
to the panel ends (beyond milling flat) were performed. The panel ends rested directlyon the flat metal supports (as in References [3] and [4]).
The tests were run under displacement-controlled conditions at a commanded rateof 3.0 mm/min (0.12 in/min) to 10 kN, then 1.5 mm/min (0.06 in/min) to failure forC1 and C2 panels. For C3 panels, the loading rates were 1.5 mm/min (0.06 in/min)and 0.7 mm/min (0.028 in/min), respectively. These strain-rate based rates were chosenbased on guidance in ASTM E9–89a [12]. Loading of the specimen was occasionallypaused to inspect the specimen under load.
4.3 Test Results
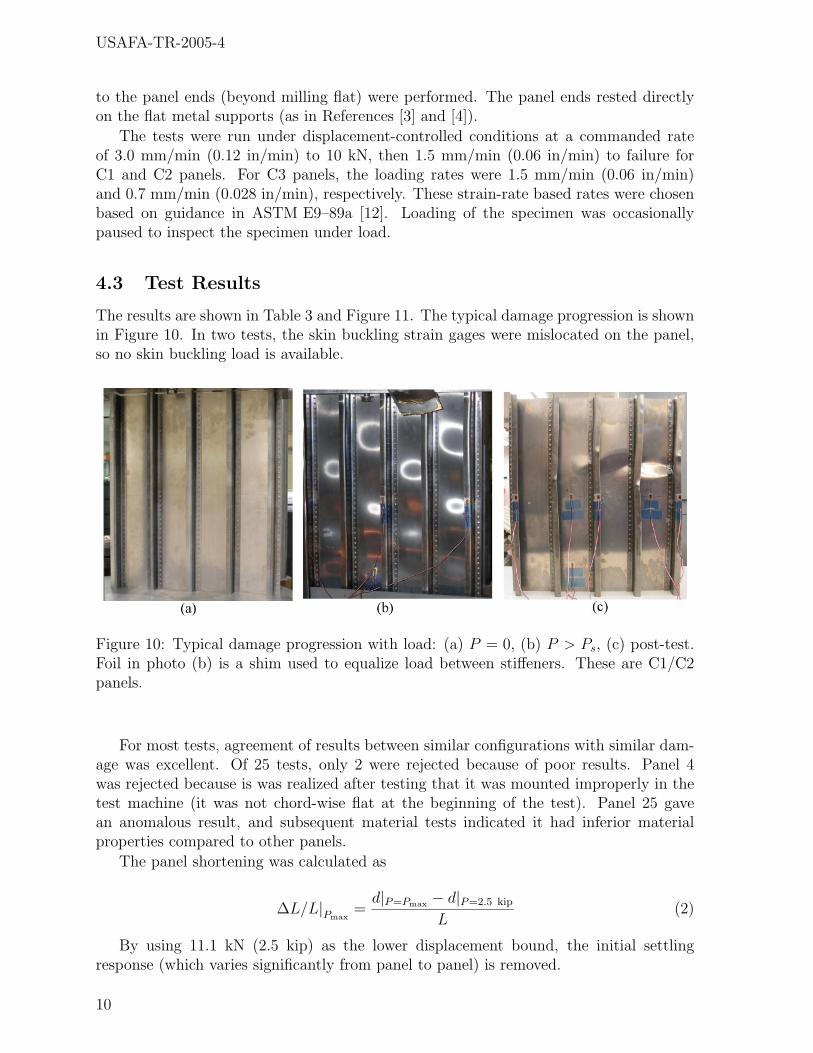
The results are shown in Table 3 and Figure 11. The typical damage progression is shownin Figure 10. In two tests, the skin buckling strain gages were mislocated on the panel,so no skin buckling load is available.
Figure 10: Typical damage progression with load: (a) P = 0, (b) P > Ps, (c) post-test.Foil in photo (b) is a shim used to equalize load between stiffeners. These are C1/C2panels.
For most tests, agreement of results between similar configurations with similar dam-age was excellent. Of 25 tests, only 2 were rejected because of poor results. Panel 4was rejected because is was realized after testing that it was mounted improperly in thetest machine (it was not chord-wise flat at the beginning of the test). Panel 25 gavean anomalous result, and subsequent material tests indicated it had inferior materialproperties compared to other panels.
The panel shortening was calculated as
∆L/L|Pmax=
d|P=Pmax − d|P=2.5 kip
L(2)
By using 11.1 kN (2.5 kip) as the lower displacement bound, the initial settlingresponse (which varies significantly from panel to panel) is removed.
10

USAFA-TR-2005-4
Table 3: Buckling test results for three panel configurations. All grindouts are span-wise.Panel Config δg Ps Pmax ∆L/L|Pmax
Strength Chga
No. No. Pct kN (kip) kN (kip) µstrain Pct
1 1 0% 154 (35) 405.7 (91.21) 71202 1 0% 166 (37) 412.5 (92.73) 77004b 1 37.4% 139 (31) 354.9 (79.80) 82735 1 34.8% 154 (35) 395.4 (88.90) 6885 −3%7 1 56.1% 118 (27) 376.7 (84.70) 7062 −8%8 1 57.4% 119 (27) 382.4 (85.97) 7316 −7%9 1 34.8% 150c (34) 396.6 (89.16) 7234 −3%
10 2 Fixture Failure11 2 0% 184 (41) 445.1 (100.07) 818012 2 0% 167 (38) 444.7 (99.97) 827013 2 36.1% 144 (32) 420.7 (94.58) 7750 −5%14 2 41.9% 148 (33) 425.2 (95.59) 7870 −4%15 2 36.4% NRd 437.6 (98.38) 7860 −2%16 2 40.6% 163 (37) 432.7 (97.28) 7710 −3%17 2 52.9% NR 423.4 (95.20) 7820 −5%18 2 Fixture Failure
19 3 0% 388 (87) 422.2 (94.93) 11,03020 3 0% 409 (92) 425.8 (95.73) 10,43022 3 41.3% 326 (73) 384.9 (86.53) 10,210 −9%23 3 41.3% 302 (68) 383.8 (86.29) 9640 −9%
25b,e 3 56.1% 245 (55) 358.2 (80.52) 9782 −16%26 3 62.6% 251 (56) 375.7 (84.47) 10,680 −11%27 3 60.0% 234 (53) 370.1 (83.20) 10,227 −13%
aCompared to average of pristine resultsbResult discarded. See text.cApproximated“Not Recorded” (see text)eThis panel had an unusual surface finish. Hardness testing revealed a lower strength (about 10%) than
other panels.
11

USAFA-TR-2005-4
Figure 11: Panel strength as a function of grindout depth for 3 configurations withspan-wise grindouts.
4.3.1 Span-Wise Grindouts
Pristine C1, C2, and C3 panels were tested to establish baseline strength values. Pan-els with grindouts of various depths were then tested to determine the degradation instrength due to these grindouts. It must be remembered that this result assumes theseimportant conditions: (1) the grindout runs parallel to and directly over the center stiff-ener and is symmetric with respect to the fastener row, (2) the loading is uniaxial andparallel to the stiffener, (3) the stiffener is securely reattached to the panel after thegrindout is applied (i.e., no loose rivets), and (4) the stiffener is undamaged.
The results indicate a slight degradation in buckling strength due to the grindouts,with the C3 panels being the most affected.
4.3.2 Chord-Wise Grindouts
A small number of extra panels were available for testing, and these were used to makean assessment of chord-wise grindouts on panel strength.
The chord-wise grindouts were much more damaging to the panels than were thespan-wise. Three reasons for this are (1) the span-wise grindout affects the integrity ofonly one stiffener bay, while the chord-wise grindout affects all stiffener bays, (2) thechord-wise grindout admits another failure mode, namely inter-rivet buckling, which can
12
USAFA-TR-2005-4
fail the rivets locally leading to zero effective skin width in that area, and (3) the chord-wise damage has the effect of creating a hinge that leads to low-load out-of-plane skinbuckling along the grindout, which helps destabilize the stiffeners.
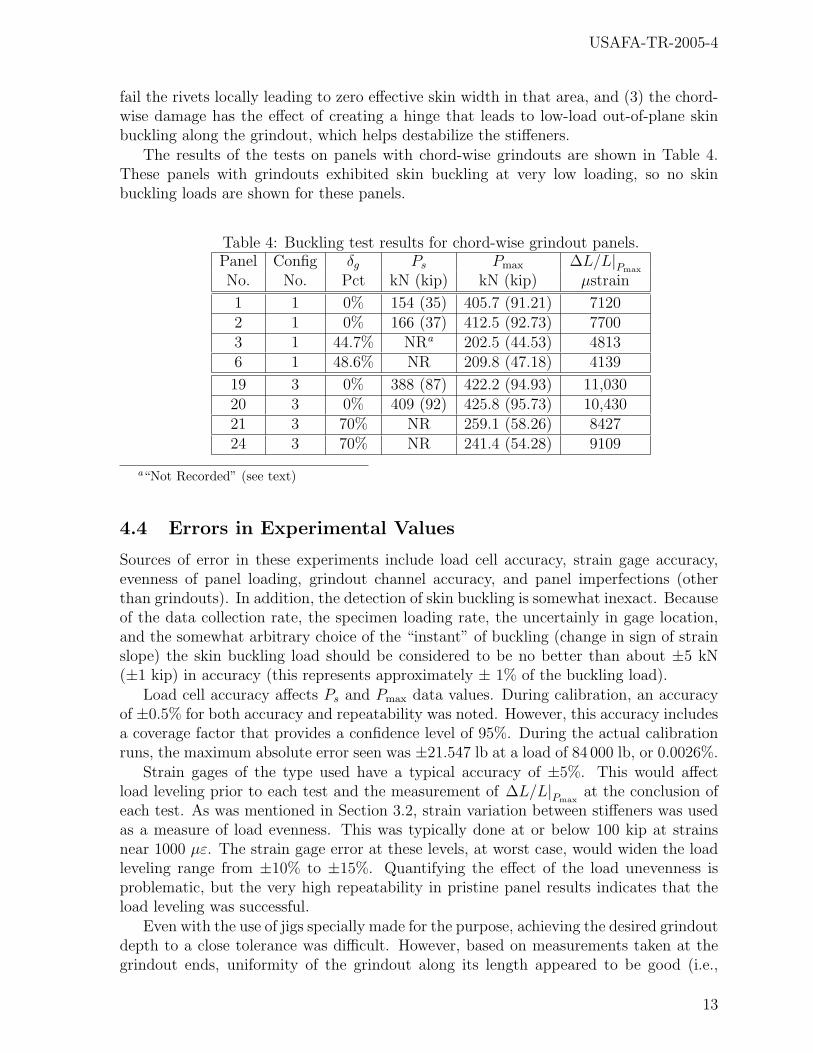
The results of the tests on panels with chord-wise grindouts are shown in Table 4.These panels with grindouts exhibited skin buckling at very low loading, so no skinbuckling loads are shown for these panels.
Table 4: Buckling test results for chord-wise grindout panels.Panel Config δg Ps Pmax ∆L/L|Pmax
No. No. Pct kN (kip) kN (kip) µstrain
1 1 0% 154 (35) 405.7 (91.21) 71202 1 0% 166 (37) 412.5 (92.73) 77003 1 44.7% NRa 202.5 (44.53) 48136 1 48.6% NR 209.8 (47.18) 4139
19 3 0% 388 (87) 422.2 (94.93) 11,03020 3 0% 409 (92) 425.8 (95.73) 10,43021 3 70% NR 259.1 (58.26) 842724 3 70% NR 241.4 (54.28) 9109
a“Not Recorded” (see text)
4.4 Errors in Experimental Values
Sources of error in these experiments include load cell accuracy, strain gage accuracy,evenness of panel loading, grindout channel accuracy, and panel imperfections (otherthan grindouts). In addition, the detection of skin buckling is somewhat inexact. Becauseof the data collection rate, the specimen loading rate, the uncertainly in gage location,and the somewhat arbitrary choice of the “instant” of buckling (change in sign of strainslope) the skin buckling load should be considered to be no better than about ±5 kN(±1 kip) in accuracy (this represents approximately ± 1% of the buckling load).
Load cell accuracy affects Ps and Pmax data values. During calibration, an accuracyof ±0.5% for both accuracy and repeatability was noted. However, this accuracy includesa coverage factor that provides a confidence level of 95%. During the actual calibrationruns, the maximum absolute error seen was ±21.547 lb at a load of 84 000 lb, or 0.0026%.
Strain gages of the type used have a typical accuracy of ±5%. This would affectload leveling prior to each test and the measurement of ∆L/L|Pmax
at the conclusion ofeach test. As was mentioned in Section 3.2, strain variation between stiffeners was usedas a measure of load evenness. This was typically done at or below 100 kip at strainsnear 1000 µε. The strain gage error at these levels, at worst case, would widen the loadleveling range from ±10% to ±15%. Quantifying the effect of the load unevenness isproblematic, but the very high repeatability in pristine panel results indicates that theload leveling was successful.
Even with the use of jigs specially made for the purpose, achieving the desired grindoutdepth to a close tolerance was difficult. However, based on measurements taken at thegrindout ends, uniformity of the grindout along its length appeared to be good (i.e.,
13
USAFA-TR-2005-4
within typical machine shop tolerance of 0.003 in). Future plans include using an NDItechnique to better assess the uniformity of the grindout along its length.
The panel specifications provided to Valco included requirements for sheet flatness(≤ 3/16 in), lateral bow (≤ 1/16 in), squareness (≤ 3/32 in), thickness variation(±0.0025 in), width and length (±1/16 in), and perpendicularity of stiffeners to thesheet surface (±1◦). Panels were spot checked for compliance with these specificationsand were found to be of very high quality and consistency (it was clear that they weremanufactured on computer-controlled equipment). Furthermore, since parallel panel endswere of paramount importance, the panels were milled (in house) on the ends to ensurethey were parallel prior to testing (0.003 in vs. the 1/16 in specified). Panel imperfectionswere, therefore, probably a small contributor to experimental errors.
To summarize, the errors in load measurement were extremely small, and so theultimate strength of each panel is very likely within ±20 lb of that indicated in the results.Because these results are reported based on the actual measured grindout depths, thefact that the originally planned grindout depths of 30% and 50% of the skin thicknesswere not achieved introduces no error in the results. Since the evenness of loading (asdetermined by strain readings) could be off by as much as 15%, this becomes the mostsignificant potential source of error in the results. However, the magnitude of this erroris impossible to quantify without significant analytical or experimental work, and therepeatability of the process and the results indicates that this error is likely small as well.
5 Modeling Panel Behavior
The ultimate strength of the pristine (no grindout) panels was calculated using stan-dard analysis techniques. The Johnson-Euler method was used for C1 and C2 (long)panels, and the method of Gerard was used for C3 (short) panels. The Johnson-Eulermethod requires an end-fixity condition to be assumed for the calculation of a slender-ness ratio. For the panels in this study, an end-fixity coefficient of 3.75 was used. Forflat-ended specimens tested between rigid flat anvils, this value has been shown to beappropriate [13].
5.1 Long Panels (C1 and C2)
The Johnson-Euler method was used for the longer (C1 and C2) panels (for a descriptionof this method, see, e.g., Ref [14]). This method calculates an allowable column stress,σco, as a function of the column cross sectional crippling strength, σcc, as
σco = σcc
[1− σcc (L′/ρ)2
4π2E
](3)
For C1 and C2 panels, the J-E strength is calculated to be 406.5 kN (91.4 kip) and456.8 kN (102.7 kip), respectively. The actual strengths were found to be 409.2 kN(92.0 kip) and 444.8 kN (100.0 kip) for respective errors of +0.7% and −2.6%.
For panels with grindouts, the analysis was identical, except that the skin thicknessfor the entire center section was reduced to the minimum skin thickness in the bottomof the grind-out. See Appendix 6 for some worked examples.
14

USAFA-TR-2005-4
Comparisons of these analyses to the experimental data are in Figures 12 and 13.
Figure 12: Comparison of C1 panel results with modified Johnson-Euler method.
Figure 13: Comparison of C2 panel results with modified Johnson-Euler method.
15
USAFA-TR-2005-4
5.2 Short Panels (C3)
The method of Gerard was used for the short (C3) panels (for a description of thismethod, see, e.g., Ref [15] or Ref [16]). This method calculates the stiffener yieldingstress, σcy, as
σ̄cy =[σcys + σcyw (t̄/ts − 1)]
t̄/ts(4)
and the section failure stress as
σ̄f = σ̄cy β
[g ts twAtot
√E
σ̄cy
]m
(5)
and therefore the section failure load as
Pf = σ̄fAtot (6)
For the short panel, this leads to a failure strength of 478.2 kN (107.5 kip). The actualfailure strength of this configuration was 424.0 kN (95.32 kip), so the error in this methodfor the pristine panel is +12.8%3.
For C3 panels with grindouts, the Gerard method was used again, except (as in thelong panel case) that the skin thickness for the entire center section was reduced to theminimum skin thickness in the bottom of the grind-out. See Appendix 6 for some workedexamples.
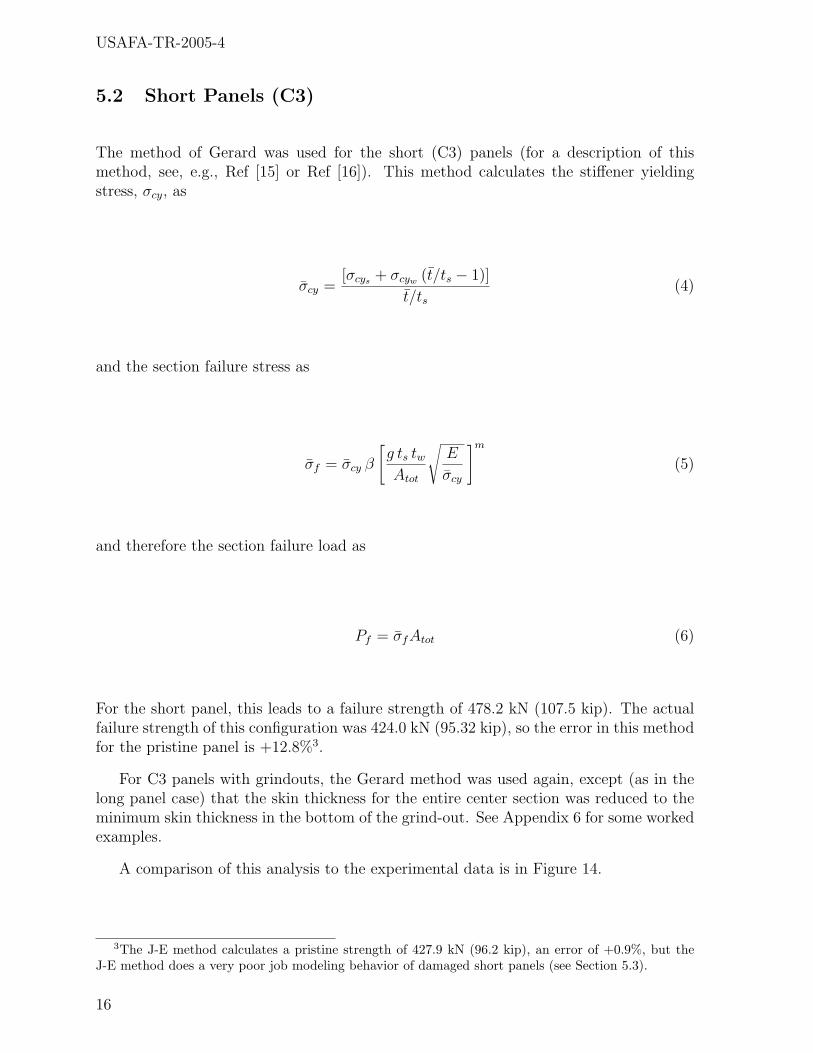
A comparison of this analysis to the experimental data is in Figure 14.
3The J-E method calculates a pristine strength of 427.9 kN (96.2 kip), an error of +0.9%, but theJ-E method does a very poor job modeling behavior of damaged short panels (see Section 5.3).
16
USAFA-TR-2005-4
Figure 14: Comparison of C3 panel results with modified method of Gerard. Dotted lineindicates Johnson-Euler model for this panel.
5.3 Modeling Summary
The slenderness ratios for panel configurations 1, 2, and 3 are 22, 22, and 17, respec-tively. The behavior of the damaged longer panels (C1 and C2) is well described byJohnson-Euler theory, while the method of Gerard does a much better job describingthe shorter panels’ behavior. Gerard’s method for stiffened panels is a modified versionof his method for predicting the crippling stress of plates and is applicable when theinterfastener buckling and wrinkling stresses are greater than the crippling stress [15, p.488] (as is the case for all the panel configurations with span-wise grindouts tested inthis study). Gerard’s method is for panels that buckle in the inelastic range. The C3panels exhibit considerably more plastic deformation than do either the C1 or C2 panels(see column 6 in Table 3).
This limited test program did not attempt to find where the “crossover point” is, thatis, to find the slenderness ratio at which one theory describes the behavior better thanthe other.
No attempt was made to model the behavior of panels with chord-wise grindouts.
17
USAFA-TR-2005-4
6 Conclusions
The test results indicate that uniform grindouts along the stiffener length, provided themiddle stiffener (only) is affected, and the fastener is reattached snugly with new rivets,caused only minor degradation in panel buckling strength. (Assessing degradation tofatigue properties is the topic of ongoing work, but is not addressed here.) Moreover, bymodifying the analysis methods of Johnson, Euler, and Gerard, curves can be generatedthat depict strength degradation as a function of grindout depth for these panels. Theshorter (C3) panels experienced significantly more plasticity prior to collapse than didthe longer (C1 and C2 panels). It is for this reason that the Gerard method was moreappropriate, and better at modeling, the C3 panels. These curves give the structuralengineer a new tool for assessing the degradation in strength to B-707 upper wing skinpanels due to grindouts.
18
USAFA-TR-2005-4
Acknowledgements
The authors would like to thank Lt Col P. J. Clark of ASC/AAA and Mr. Kevin Boydof S&K Technologies, Inc. for their sponsorship of this effort. We also thank Mr. StephanVerhoeven, Mr. Cornelis Guijt (Engineers), Mr. Chad Moon, and Mr. Jonathan Ingram(technicians) for their invaluable assistance on this project. Finally, we are indebtedto Mr. John Lobdell and MSgt Michael Nero (Department of Civil and EnvironmentalEngineering) for the generous use of their facilities for these tests.
19
USAFA-TR-2005-4
References
[1] R. Lakhote, M. Pandy, and A. Sherbourne, “Buckling Behavior of Corroded Plates,”in Proceedings of the Fourteenth ASCE Engineering Mechanics Conference, (Austin,TX), May 2000.
[2] J. Roorda, N. Srivastava, A. Maslouhi, and A. Sherbourne, “Residual Strength ofShip Structures with Corrosion-Induced Damage,” Technical Report, Defense Re-search Establishment Atlantic, Halifax, NS, Mar. 1996.
[3] W. A. Hickman and N. F. Dow, “Data on the Compressive Strength of 75S-T6Aluminum-Alloy Flat Panels with Longitudinal Extruded Z-Section Stiffeners,”Technical Note 1829, National Advisory Committee for Aeronautics, Langley AirForce Base, VA, Mar. 1949.
[4] W. A. Hickman and N. F. Dow, “Data on the Compressive Strength of 75S-T6Aluminum-Alloy Flat Panels Having Small, Thin, Widely Spaced, Longitudinal Ex-truded Z-Section Stiffeners,” Technical Note 1978, National Advisory Committee forAeronautics, Langley Air Force Base, VA, Nov. 1949.
[5] P. C. Hu, E. E. Lundquist, and S. Batdorf, “Effect of Small Deviations from Flatnesson Effective Width and Buckling of Plates in Compression,” Technical Note 1124,National Advisory Committee for Aeronautics, Langley Air Force Base, VA, 1946.
[6] A. Rothwell, “An Experimental Investigation of the Post-Buckled Efficiency of Z-Section Stringer-Skin Panels,” Aeronautical Journal, pp. 29–33, Jan. 1981.
[7] R. Friedman, J. Kennedy, and D. Royster, “Analysis and Compression Testing of2024 and 8009 Aluminum Alloy Zee-Stiffened Panels,” Transactions of the ASME:Journal of Engineering Materials and Technology, vol. 116, pp. 238–243, Apr. 1994.
[8] J. Singer, J. Arbocz, and T. Weller, Buckling Experiments: Experimental Methods inBuckling of Thin-Walled Structures; Basic Concepts, Columns, Beams, and Plates- Volume I. West Sussex, England: John Wiley & Sons, 1998.
[9] R. Butler, M. Lillico, H. G.W., and N. McDonald, “Experiments on InteractiveBuckling in Optimized Stiffened Pnels,” Struct Multidisc Optim, vol. 23, pp. 40–48,2001.
[10] A. Aalberg, M. Langseth, and P. Larsen, “Stiffened Aluminum Panels Subjected toAxial Compression,” Thin-Walled Structures, vol. 39, pp. 861–885, 2001.
[11] ASTM, “Standard Practices for Force Verification of Testing Machines,” StandardE4–03, American Society for Testing and Materials, West Conshohocken, PA, 2003.
[12] ASTM, “Standard Test Methods of Compression Testing of Metallic Materials atRoom Temperature,” Standard E9–89a, American Society for Testing and Materials,West Conshohocken, PA, 2000.
20
USAFA-TR-2005-4
[13] R. Papirno, “Inelastic Buckling of ASTM Standard E 9 Compression Specimens,”Journal of Testing and Evaluation, JTEVA, vol. 15, pp. 133–135, May 1987.
[14] M. C.-Y. Niu, Airframe Structural Design. Hong Kong: Conmilit Press LTD, 1998.
[15] R. M. Rivello, Theory of Analysis of Flight Structures. New York: McGraw-Hill,1969.
[16] G. Gerard, “Handbook of Structural Stability: Part V - Compressive Strength ofFlat Stiffened Panels,” Technical Note 3785, National Advisory Committee for Aero-nautics, Washington, Aug. 1957.
[17] D. J. Peery and J. J. Azar, Aircraft Structures. New York: McGraw-Hill, second ed.,1982.
21

USAFA-TR-2005-4
This PageIntentionallyLeft Blank
22
USAFA-TR-2005-4
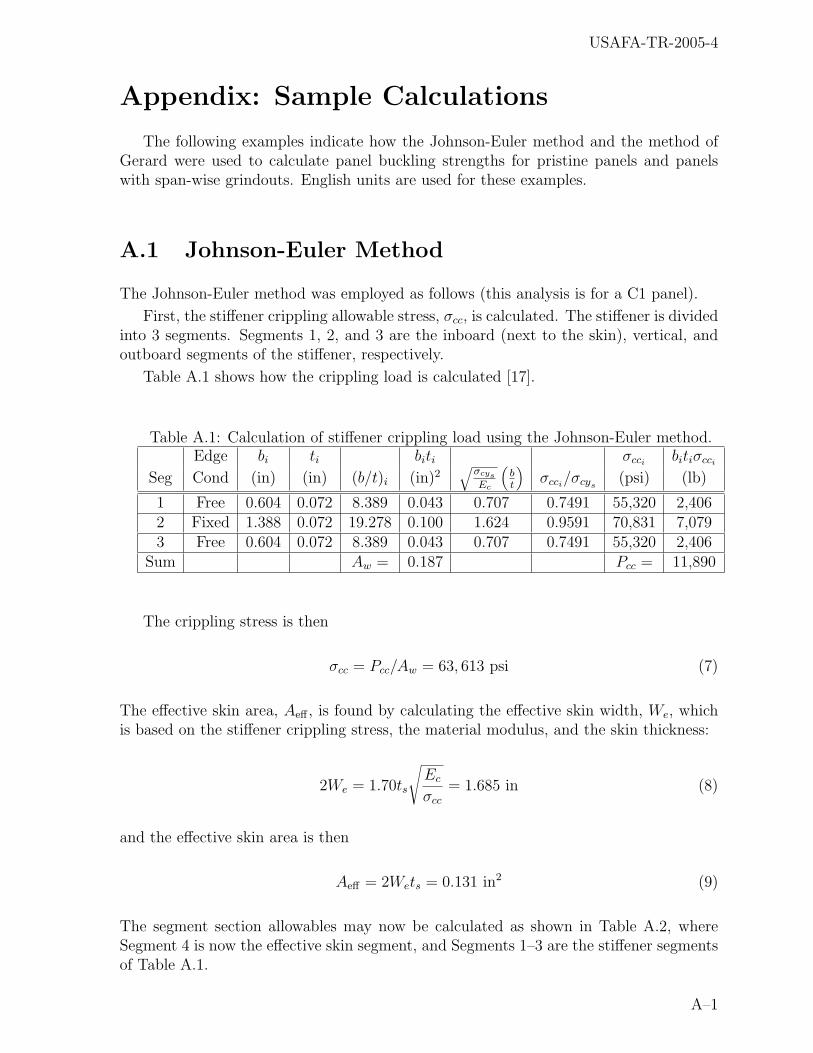
Appendix: Sample Calculations
The following examples indicate how the Johnson-Euler method and the method ofGerard were used to calculate panel buckling strengths for pristine panels and panelswith span-wise grindouts. English units are used for these examples.
A.1 Johnson-Euler Method
The Johnson-Euler method was employed as follows (this analysis is for a C1 panel).
First, the stiffener crippling allowable stress, σcc, is calculated. The stiffener is dividedinto 3 segments. Segments 1, 2, and 3 are the inboard (next to the skin), vertical, andoutboard segments of the stiffener, respectively.
Table A.1 shows how the crippling load is calculated [17].
Table A.1: Calculation of stiffener crippling load using the Johnson-Euler method.Edge bi ti biti σcci
bitiσcci
Seg Cond (in) (in) (b/t)i (in)2√
σcys
Ec
(bt
)σcci
/σcys(psi) (lb)
1 Free 0.604 0.072 8.389 0.043 0.707 0.7491 55,320 2,4062 Fixed 1.388 0.072 19.278 0.100 1.624 0.9591 70,831 7,0793 Free 0.604 0.072 8.389 0.043 0.707 0.7491 55,320 2,406
Sum Aw = 0.187 Pcc = 11,890
The crippling stress is then
σcc = Pcc/Aw = 63, 613 psi (7)
The effective skin area, Aeff , is found by calculating the effective skin width, We, whichis based on the stiffener crippling stress, the material modulus, and the skin thickness:
2We = 1.70ts
√Ec
σcc
= 1.685 in (8)
and the effective skin area is then
Aeff = 2Wets = 0.131 in2 (9)
The segment section allowables may now be calculated as shown in Table A.2, whereSegment 4 is now the effective skin segment, and Segments 1–3 are the stiffener segmentsof Table A.1.
A–1
USAFA-TR-2005-4
Table A.2: Calculation of segment section properties.Width Height A y Ay Ayy Iox
Seg (in) (in) (in)2 (in) (in)3 (in)4 (in)4
1 0.640 0.072 0.0461 0.0360 0.0017 0.0001 0.00002 0.072 1.316 0.0948 0.7300 0.0692 0.0505 0.01373 0.640 0.072 0.0461 1.4240 0.0656 0.0934 0.00004 1.685 0.078 0.1306 1.4988 0.1957 0.2933 0.0001
Totals 0.3175 0.3321 0.4373 0.0138Σ() ΣA ΣAy ΣAyy ΣIox
The segment section centroid is Yc = ΣAy/ΣA = 1.046 in, and the segment areamoment is I = ΣIox + ΣAyy − Y 2
c ΣA = 0.104 in4. To complete the segment allowablestress, we need the slenderness ratio, K, of the segment
K =L′
ρ=
L
ρ√
c= 18.89 (10)
where L = 20.9 in, ρ =√
I/A = 0.571 in, and c, the end fixity coefficient, is 3.75. TheJohnson-Euler stress, σco, and strength, Pco, allowables are then given by
recall σcc = 63, 613 psi (11)
σco = σcc
[1− σcc (L′/ρ)2
4π2Ec
]= 60, 095 psi (12)
Pco = σcoA = 19, 078 lb (13)
This leads to a panel allowable of
(Pco)panel = σcoApanel = 90, 526 lb (14)
where Apanel = (N − 1)A + Aw + tsWfo = 1.506 in2.
This answer can be iterated upon by using σco as σcc in Eq (8), creating a refined We:
2We = 1.70ts
√Ec
σco
= 1.733 in (15)
and the new effective skin area is then
Aeff = 2Wets = 0.134 in2 (16)
a 2.9% increase. The new segment section allowables may now be calculated as above(Table A.3).
A–2
USAFA-TR-2005-4
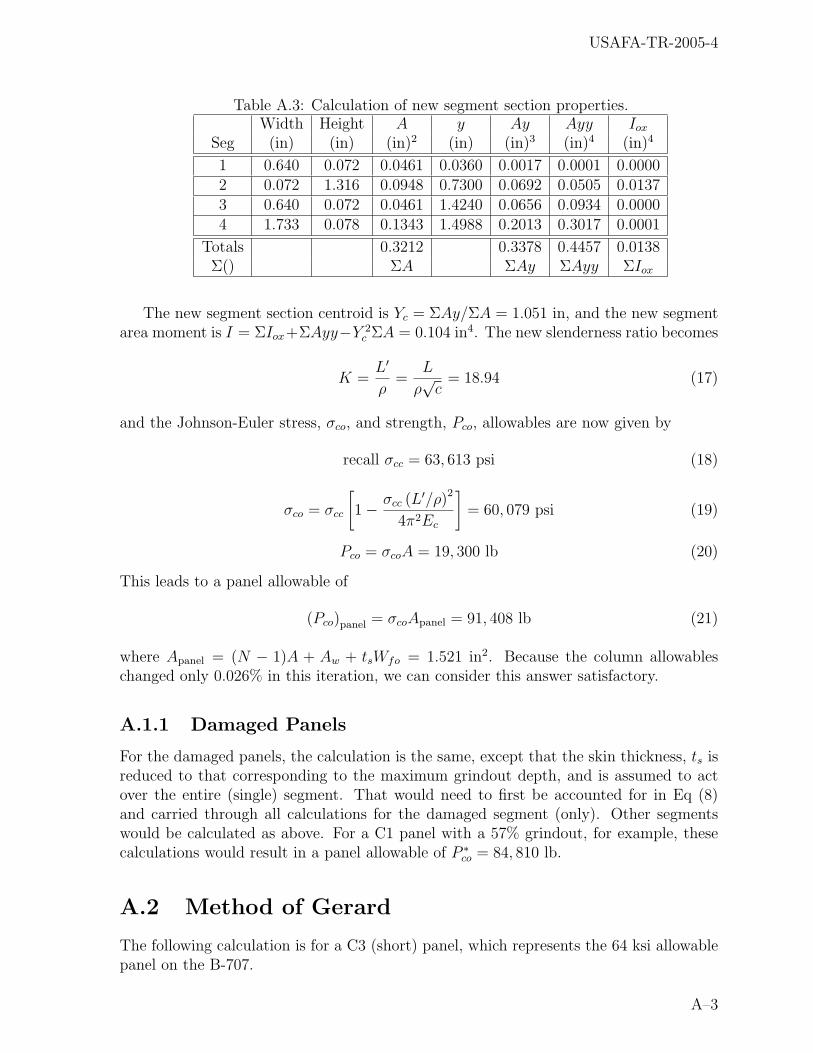
Table A.3: Calculation of new segment section properties.Width Height A y Ay Ayy Iox
Seg (in) (in) (in)2 (in) (in)3 (in)4 (in)4
1 0.640 0.072 0.0461 0.0360 0.0017 0.0001 0.00002 0.072 1.316 0.0948 0.7300 0.0692 0.0505 0.01373 0.640 0.072 0.0461 1.4240 0.0656 0.0934 0.00004 1.733 0.078 0.1343 1.4988 0.2013 0.3017 0.0001
Totals 0.3212 0.3378 0.4457 0.0138Σ() ΣA ΣAy ΣAyy ΣIox
The new segment section centroid is Yc = ΣAy/ΣA = 1.051 in, and the new segmentarea moment is I = ΣIox+ΣAyy−Y 2
c ΣA = 0.104 in4. The new slenderness ratio becomes
K =L′
ρ=
L
ρ√
c= 18.94 (17)
and the Johnson-Euler stress, σco, and strength, Pco, allowables are now given by
recall σcc = 63, 613 psi (18)
σco = σcc
[1− σcc (L′/ρ)2
4π2Ec
]= 60, 079 psi (19)
Pco = σcoA = 19, 300 lb (20)
This leads to a panel allowable of
(Pco)panel = σcoApanel = 91, 408 lb (21)
where Apanel = (N − 1)A + Aw + tsWfo = 1.521 in2. Because the column allowableschanged only 0.026% in this iteration, we can consider this answer satisfactory.
A.1.1 Damaged Panels
For the damaged panels, the calculation is the same, except that the skin thickness, ts isreduced to that corresponding to the maximum grindout depth, and is assumed to actover the entire (single) segment. That would need to first be accounted for in Eq (8)and carried through all calculations for the damaged segment (only). Other segmentswould be calculated as above. For a C1 panel with a 57% grindout, for example, thesecalculations would result in a panel allowable of P ∗
co = 84, 810 lb.
A.2 Method of Gerard
The following calculation is for a C3 (short) panel, which represents the 64 ksi allowablepanel on the B-707.
A–3

USAFA-TR-2005-4
Recall that the stiffener yielding stress is given by
σ̄cy =[σcys + σcyw (t̄/ts − 1)]
t̄/ts(22)
where σcys = σcyw = 73.85 ksi and ts = 0.0775 in. The area of the skin for one bayis b ts = (2.14)(0.0775) = 0.1659 in2. The area of the stringer cross section is tw =0.1975 in2, so Atot = ts + tw = 0.3634 in2. The average thickness of the panel, t̄, isgiven by Atot/b = 0.3634/2.14 = 0.1698 in. These values give a stiffener yielding stressof σ̄cy = 73.850 ksi. (In these panels, the skin and stiffener materials have the sameproperties, so σ̄cy = σcys = σcyw).
This value allows the calculation of the section failure stress
σ̄f = σ̄cy β
[g ts twAtot
√E
σ̄cy
]m
(23)
where β = 0.56 (Gerard parameter for formed Z stiffeners), g = 8 (Gerard parameter forZ-stiffened panel), E = 10.4 Msi, m = 0.85 (Gerard parameter for formed Z-stiffener).These values yield a result of σ̄f = 63.31 ksi, and a section failure load of
Pf = σ̄fAtot = 23 ksi (24)
The panel failure load is then calculated as
Pmax = 5Pf − (b−Wfi)tsσ̄f = 107.5 kip (25)
where the term (b−Wfi)tsσ̄f accounts for the fact that this panel does not consist of 5complete bays.
A.2.1 Damaged Panels
For the panels with grindouts, the method is the same, with the following modifications.Eq (22) becomes
σ̄∗cy =[σcys + σcyw (t̄∗/t∗s − 1)]
t̄∗/t∗s(26)
where the asterisk (*) indicates the impact of changing the skin thickness to t∗s = (1−G)ts,where G is the fraction of skin removed at the bottom of the grindout. Similarly, Eq (23)becomes
σ̄∗f = σ̄∗cy β
g t∗s tw
A∗tot
√√√√ E
σ̄∗cy
m
(27)
and Eqs (24) and (25) becomeP ∗
f = σ̄∗fA∗tot (28)
P ∗max = 4Pf − (b−Wfi)tsσ̄fP
∗f (29)
where P ∗max is the strength of the damaged section. This strength is used with the
strength of the undamaged sections to calculate the new strength for the entire panel.A C3 panel with a 50% grindout, for example, would have a strength of
P ∗max = 4Pf − (b−Wfi)tsσ̄fP
∗f = 97.2 kip (30)
where t∗s = (1− 0.5)(ts), Pf = 23 kip (as before), and P ∗f = 12.8 kip.
A–4
Copyright © 2022 FDOKUMEN