Whole-Exome Sequencing Identifies Mutated C12orf57 in Recessive Corpus Callosum Hypoplasia
INTERNATIONAL JOURNAL OF ONCOLOGY 44: 211-221, 2014
Abstract. We performed whole exome sequencing and gene expression analysis on a metastatic colon cancer to the lung, along with the adjacent normal tissue of the lung. Whole exome sequencing uncovered 71 high-confidence non-synonymous mutations. We selected 16 mutation candidates, and 13 out of 16 mutations were validated by targeted deep sequencing using the Ion Torrent PGM customized AmpliSeq panel. By integrating mutation, copy number and gene expression micro-array data, we identified a JAZF1 mutation with a gain-of-copy, suggesting its oncogenic potential for the lung metastasis from colon cancer. Our pathway analyses showed that the identified mutations closely reflected characteristics of the metastatic site (lung) while mRNA gene expression patterns kept genetic information of its primary tumor (colon). The most significant gene expression network was the ‘Colorectal Cancer Metastasis Signaling’, containing 6 (ADCY2, ADCY9, APC, GNB5, K-ras and LRP6) out of the 71 mutated genes. Some of these mutated genes (ADCY9, ADCY2, GNB5, K-ras, HDAC6 and ARHGEF17) also belong to the ‘Phospholipase C Signaling’ network, which suggests that this pathway and its mutated genes may contribute to a lung metastasis from colon cancer.
Introduction
Metastasis to distant organs is an acquired characteristic of cancer cells (1) and is a major cause of deaths from various human cancers. Metastatic progression from the primary tumor site involves multiple factors such as accumulation of
genetic and epigenetic events and aquiring ability to colonize at the distant host organs (2). Although understanding the biology of primary tumors have been a main strategy to treat metastatic tumors, how these primary tumor cells evolve in the course of spreading to the mestatic organ is poorly understood.
Lung and colorectal cancer are the top and third most common cancers in the world, with over 1.6 million and 1.2 million new cases each year, respectively (3). Mutation status of EGFR, K-ras and EML4-ALK are important factors determining therapeutic regimens in non-small cell lung cancer (NSCLC) patients (4-5). Colon cancer is a genetically well-characterized human cancer. Since the multi-step carci-nogenesis model was suggested, sequential genetic alterations such as mutations of APC, K-ras, Mismatch repair (MMRs), TP53 and loss of 18q have been reported in colorectal cancers (6,7). Genotype-phenotype correlations are also well-characterized in colorectal cancer. Notwithstanding these well-established genetic characteristics of colorectal cancer, the genetic mechanism causing metastasis to other organs is unclear. Liver and lung are the most common metastatic sites from colorectal cancer. Although metastasis to the lung from different primary tumors is a frequent event considering its dense connectivity with lymph nodes and blood vessels and its physical location, genetic alterations and underlying mechanisms would also affect its frequency and biological characteristics.
In this study, we describe a comprehensive genomic analysis of a metastatic colon cancer to the lung. Mutation analysis targeting whole exome is becoming prevalent and several papers describing somatic mutations at exome level have been published in primary lung and colorectal cancers (8-10). Nontheless, mutation or genetic information underlying metastatic colorectal cancer to the lung is very limited. To gain insights into genetic alterations associated with lung metastasis from colon cancer, we performed whole exome sequencing and genome-wide expression analysis in a patient with metastatic colon cancer to the lung. Among the identified mutation candidates, we chose 16 mutations for further valida-tion using Ion Torrent PGM customized panel. Our pathway analyses identified that most of mutations were related with
Comprehensive genomic analyses of a metastatic colon cancer to the lung by whole exome sequencing
and gene expression analysisLI TAI FANG1, SHARON LEE1, HELEN CHOI1, HONG KWAN KIM1,3, GREGORY JEW1,
HIO CHUNG KANG1, LIN CHEN4, DAVID JABLONS1,2 and IL-JIN KIM1,2
1Thoracic Oncology Laboratory, Department of Surgery; 2Comprehensive Cancer Center, University of California San Francisco, San Francisco, CA, USA; 3Department of Thoracic and Cardiovascular Surgery, Samsung Medical Center,
Sungkyunkwan University School of Medicine, Seoul, Republic of Korea; 4Life Technologies, Seattle, WA, USA
Received August 19, 2013; Accepted September 16, 2013
DOI: 10.3892/ijo.2013.2150
Correspondence to: Dr Il-Jin Kim or Dr David Jablons, Department of Surgery, University of California San Francisco, 2340 Sutter St., Room N219, San Francisco, CA 94115, USAE-mail: [email protected]: [email protected]
Key words: metastatic colon cancer, lung, NGS, exome, microarray
FANG et al: COMPREHENSIVE GENOMIC ANALYSES OF A METASTATIC COLON CANCER TO THE LUNG212
lung caner pathogenesis rather than a primary colon cancer, while gene expression signatures of the metastatic tumor were more correlated with the primary colon cancer. Undiscovered potential tumor supressor and oncogenes were also identified by combined exome sequencing and copy number analysis.
Materials and methods
Patient information. Samples were collected under the IRB approval (11-06107) granted by the CHR of the University of California San Francisco (UCSF) along with written informed consent from the patient. The tumor and matched normal lung tissue studied came from a 74-year-old Asian female never-smoker who had colorectal cancer 4 years prior to this incident. She visited the hospital for chest discomfort. A chest X-ray revealed a mass-like lesion in the right lung. Chest computed tomography (CT) scan showed a 2 cm sized tumor in the right upper lobe. A positron emission tomography (PET) scan showed hypermetabolic fluorodeoxyglucose uptake with no evidence of other metastasis. She was suspected to have a lung metastasis, because of her history of colon cancer. She underwent a wedge resection of the right upper lobe via thora-cotomy and had an uneventful recovery after the operation. The pathologic examination confirmed the lesion was metastatic adenocarcinoma originating from the primary colon cancer. She lived for 1 1/2 years after the lung metastasis operation.
Whole exome sequencing. Whole exome sequencing was done on SOLiD 5500 (Life Technologies). Samples were prepared according to protocols suggested by the manufac-turer. Fragment library preparation began with 3 µg DNA and sheared with the Covaris S220 system. Resulting DNA fragments were end repaired, size selected with Agencourt Ampure XP reagent, dA-tailed, adaptor and barcode ligated, and then amplified with 6 PCR cycles. The library was then quantified with Agilent Technologies High Sensitivity DNA chip. A total of 500 ng of DNA was used to capture the exome regions using TargetSeq Exome Enrichment kit, for about 72 h. Exome DNA was amplified and then quantified with the SOLiD Library TaqMan Quantitation kit. The final exome library was diluted to 500 pM, templated to beads, ampli-fied through emulsion PCR and enriched using the SOLiD EZ Bead Emulsifier, Amplifier and Enricher. The resulting libraries were then loaded onto the Flow Chip with a total of 6 multiplexed samples in 6 lanes.
Ion Torrent AmpliSeq sequencing for validation. Sixteen mutation candidates from the exome sequencing were vali-dated by deep sequencing (more than 1,000 x coverage) using the Ion Torrent PGM AmpliSeq Custom Panel for the selected targets. In brief, the 200 bp Standard DNA option was used for the AmpliSeq primer design. Sample DNA was diluted to a concentration of 10 ng/µl. A total of 1 µl of the diluted DNA was used for amplicon library preparation according to the Ion Torrent protocol. Target sequences were amplified using the custom primers, followed by a partial digestion of the primers. Adapters and barcodes were ligated to the amplicons and purified using Agencourt AMPure XP reagent. The library was quantified by qPCR using the Ion Library Quantitation kit according to the protocol. The libraries were combined,
templated onto beads and run through emulsion PCR using the OneTouch2 and ES machines. Samples were loaded into the 318 chips and run on the Ion Torrent PGM.
Microarray gene expression analysis. We also measured the mRNA expression level of samples using Affymetrix GeneTitan Gene ST 1.1 array. The detailed protocol has been previously described (11). In short, total RNA was extracted from the matched tumor and normal tissues, amplified into cRNA, and then made into cDNA. The cDNA was then fragmented and labeled. The labeled cDNA was added into the hybridization cocktail. The samples were then put onto hybridization trays and loaded into the Affymetrix GeneTitan MC for hybridiza-tion, washing and scanning. The Log2-scale expression data were extracted using the built-in Robust Multi-array Average (RMA) algorithm in the Affymetrix software (12).
Data analysis: somatic mutation detections. For the whole exome sequencing performed by SOLiD 5500, the color space raw data (XSQ) were converted to sequences and aligned to reference human genome hg19 using LifeScope Genomic Analysis Software v2.5.1, creating a BAM file for each barcode in each lane. The paired-end targeted resequencing workflow of the software was used for the task, which also includes the DiBayes algorithm for Single Nucleotide Variation (SNV) detection. In the tumor tissue, 40,314 SNPs and 2,287 InDels were called, of which 37,456 and 1,990 were in concordance with dbSNP132 (92.91 and 80.03%, respectively). The transi-tion/transversion ratio of the SNPs in the tumor was 2.60. In the adjacent normal tissue, 41,738 SNPs and 2,570 InDels were called, of which 39,069 and 2,096 were in concordance with dbSNP132 (93.61 and 81.56%, respectively). The transition/transversion ratio of the SNPs in the matched normal was 2.61.
BAM files for each barcode and each lane were merged into a single BAM file for every sample (the tumor and the matched normal) using Picard 1.87 (http://picard.sourceforge.net). We used Strelka (13) and MuTect (14) for small somatic mutation detections. Both algorithms adopt a Bayesian prob-ability model comparing the tumor with its matched normal data, taken into consideration that tumor samples are often heterogeneous and impure. Default configurations were kept when using both software, e.g., prior probability of somatic mutation is 10-6. The mutation calls were output in a VCF (variant calling format) file. Each variant was annotated by ANNOVAR, which annotates the gene symbol, chromosome position and the type of variant (e.g., synonymous, missense, nonsense, etc.) (15).
Ion Torrent PGM generated fastq files were aligned to hg19 using the MAP2 alignment algorithm of Torrent Mapping Alignment Program (TMAP 3.4.0). The number of reference and novel allele counts for the 16 sites were tallied using the Samtools 0.1.18 mpileup function (16).
Copy number analysis. We used ExomeCNV, an R package, to conduct a copy number variation (CNV) analysis to the exome sequencing data (17). ExomeCNV infers copy number alteration based on the normalized Log2 ratio of the depth of coverage between the tumor and its matched normal tissue (17). The highest novel-to-reference (i.e., mutant to wild-type) allele ratio in our mutation data was about 1:2. If we assume
INTERNATIONAL JOURNAL OF ONCOLOGY 44: 211-221, 2014 213
that a mutation occurs in all tumor cells and none in normal cells, then in the tumor tissue, we expect a 50-50 ratio of novel/reference counts for heterozygous mutations. The extra reference counts would come from normal cell contamina-tion, contributing for a total of 1/3 of the coverage. Hence, we estimated a normal contamination of 1/3 in this tumor sample. The estimated normal contamination value 0.3 was applied to the copy number analysis.
Copy number of the JAZF1 gene, identified as being amplified in whole exome sequencing data was chosen for further individual validation by TaqMan Copy Number assay (Life Technologies). Genomic DNAs from matched tumor and normal were amplified in ABI 7900HT according to the manufacturer's instruction and analyzed by copy number analysis algorithm as previously described (18). Copy number of RNase P gene was simultaneously analyzed to use as an endogenous normalization contol. Additional genomic DNAs from 8 matched primary lung tumors and normal tissues were included.
Results
Identification of somatic mutations: a comparison of Strelka and MuTect. To retrieve somatic mutation calls from the whole exome sequencing data, Strelka (13) and MuTect (14) software was used. Strelka is a more stringent somatic muta-tion caller, identifying a total of 310 somatic variants including 135 non-synonymous variants. MuTect is more permissive, having identified a total of 7,341 somatic variants including 1,393 non-synonymous variants. Among the 135 identified non-synonymous candidate sites by Strelka, 100 of those non-synonymous variants were overlapped with MuTect's calls (74.1% of concordance rate). Among the 310 total Strelka identified candidate sites, 221 of them were in common with MuTect's calls (71.3% of the Strelka findings). On the other hand, well under 10% of MuTect calls were in common with Strelka. The mutation calls in common were much more likely to be true mutations, with an average novel allele (i.e., mutant) frequency of nearly 0.30, and novel allele counts of about 15. There was also no statistically significant difference between the variant and non-synonymous variants.
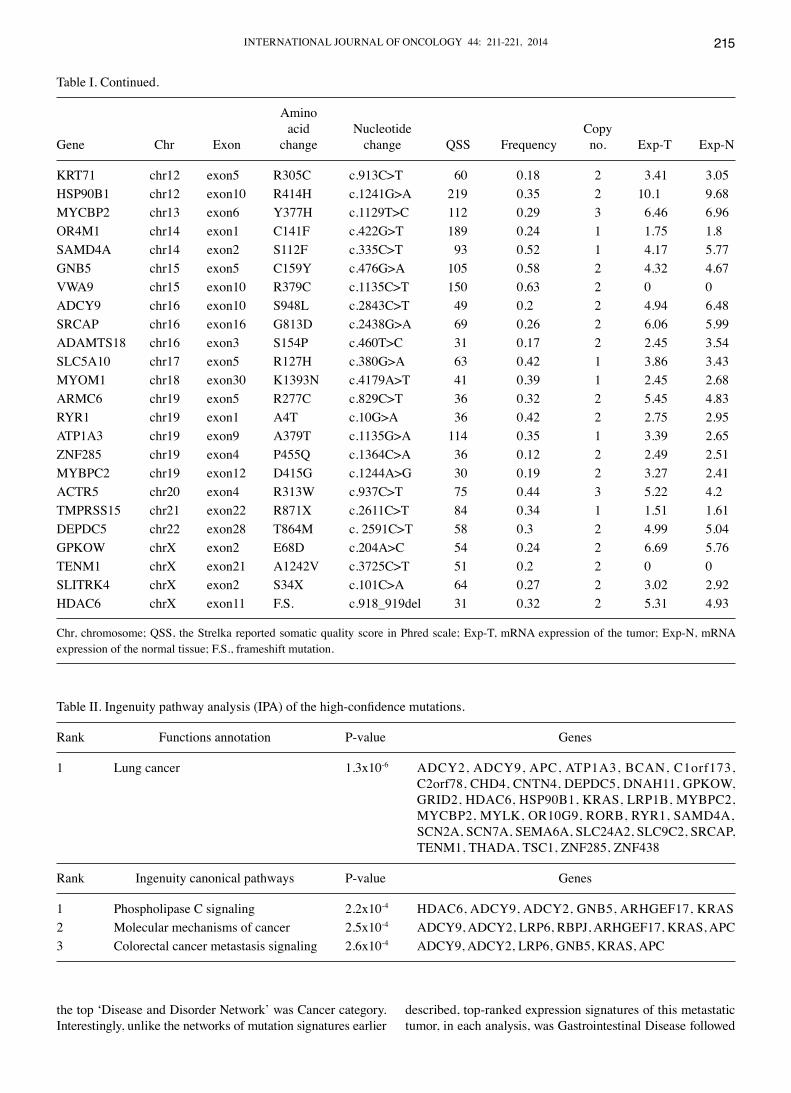
Pathway analysis using 71 high-confidence somatic muta-tions. Among 135 non-synonymous somatic mutation calls by Strelka, there were 70 mutation candidates with a somatic quality score (QSS) greater than 30, and a mutant allele frequency greater than 10% (Table I). We defined those 70 mutation calls as high-confidence mutations. In addition to those 70 high-confidence mutations, JAZF1 was a validated mutation with a QSS of 27 and mutant allele frequency of 25.2%, so a total of 71 genes were used for pathway analysis (Ingenuity Pathway Analysis, IPA) to get a general overview of their genetic pathways and functions (Table I). Perhaps unsur-prisingly, due to the fact that those are somatic mutations from a metastatic colon cancer to the lung, the top two ‘Diseases and Disorders Networks’ were cancer and respiratory disease. The top 3 functional networks within Cancer were lung cancer (p=1.3x10⁻⁶, 35 genes), lung adenocarcinoma (p=5.4x10⁻⁶), and carcinoma in lung (p=7.7x10⁻⁶). Colon-related cancer network was not included in the top 10 networks (Table II).
The top 3 IPA Canonical Networks were ‘Phospholipase C Signaling’ (a total of 263 genes in this network, 6 of which are our somatic mutation submissions, or 6/263, p=2.2x10⁻⁴), ‘Molecular Mechanisms of Cancer’ (7/381, p=2.5x10⁻⁴), and ‘Colorectal Cancer Metastasis Signaling’ (6/262, p=2.6x10⁻⁴) (Table II). Knowing this tumor was a metastatic colon cancer, the Colorectal Cancer Metastasis Signaling network was of particular interest. The 6 genes (with somatic mutations in our sample) involved in Colorectal Cancer Metastasis Signaling were ADCY2, ADCY9, APC, GNB5, K-ras and LRP6. Aside from APC and K-ras which are known cancer markers, ADCY2, ADCY9, GNB5 and LRP6 also appear in Phospholipase C Signaling and Molecular Mechanisms of Cancer networks, indicating their potential role in colon cancer metastasis to the lung.
Mutation validation by targeted high coverage deep sequencing. We selected 16 candidates for deep sequencing validation by Ion Torrent PGM. Out of 16 candidates, 9 were either kinases or genes identified in the COSMIC (Catalog of Somatic Mutations in Cancer) Cancer Gene Census (http://cancer.sanger.ac.uk/cancergenome/projects/census/). For the remaining 7, all but 1 mutation calls were identified by both Strelka and MuTect.
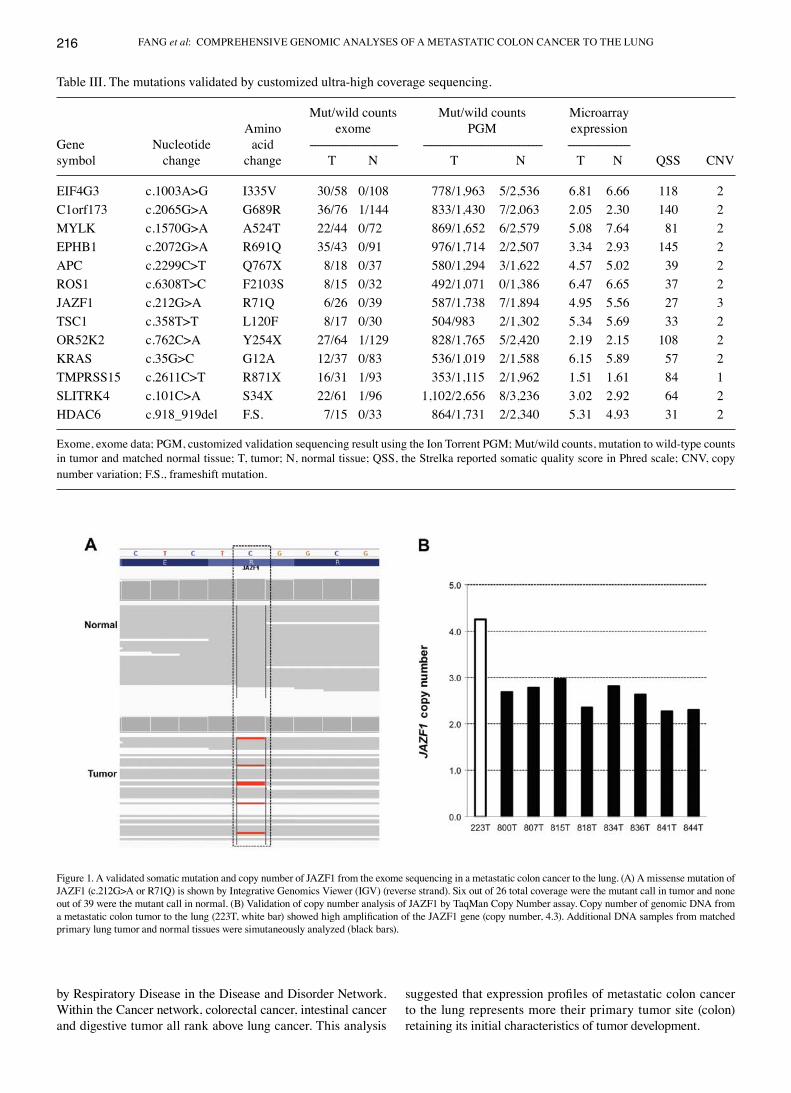
Out of 16 mutation candidates, 15 were sucessfully ampli-fied by targeted ampliseq panel (Ion Torrent PGM) and 13 out of 15 (87%) were validated as true mutations (Table III). For the validated mutations, the mutant allele counts ranged from several hundreds to over a thousand in the tumor, and less than 10 in the matched normal tissue (average coverage >2,000X). The 13 validated mutations include two mutations in APC and K-ras, well-known genes frequently mutated in colon cancers, three nonsense mutations in OR52K2, TMPRSS15, and SLITRK4, one frameshift deletion in HDAC6, and seven missense mutations in EIF4G3, MYLK, EPHB1, ROS1, JAZF1, TSC1 and C1orf173.
Copy number analysis of genes mutated in metastatic colon cancer to the lung. We performed a copy number analysis using whole exome sequencing data in order to have addi-tional information on the genes mutated in metastastic colon cancer to the lung. The Copy Number Variation (CNV) calls for the 71 high-confidence and 13 validated mutation genes are shown in Tables I and III, respectively. Among the genes mutated and either amplified or deleted, copy number of JAZF1 harboring a missense mutation and being amplified in a metastatic colon tumor was further validated by TaqMan copy number assay. In accordance with the CNV informa-tion from whole exome sequencing data, the validation assay confirmed that JAZF1 was highly amplified in a metastastic colon cancer to the lung (Fig. 1).
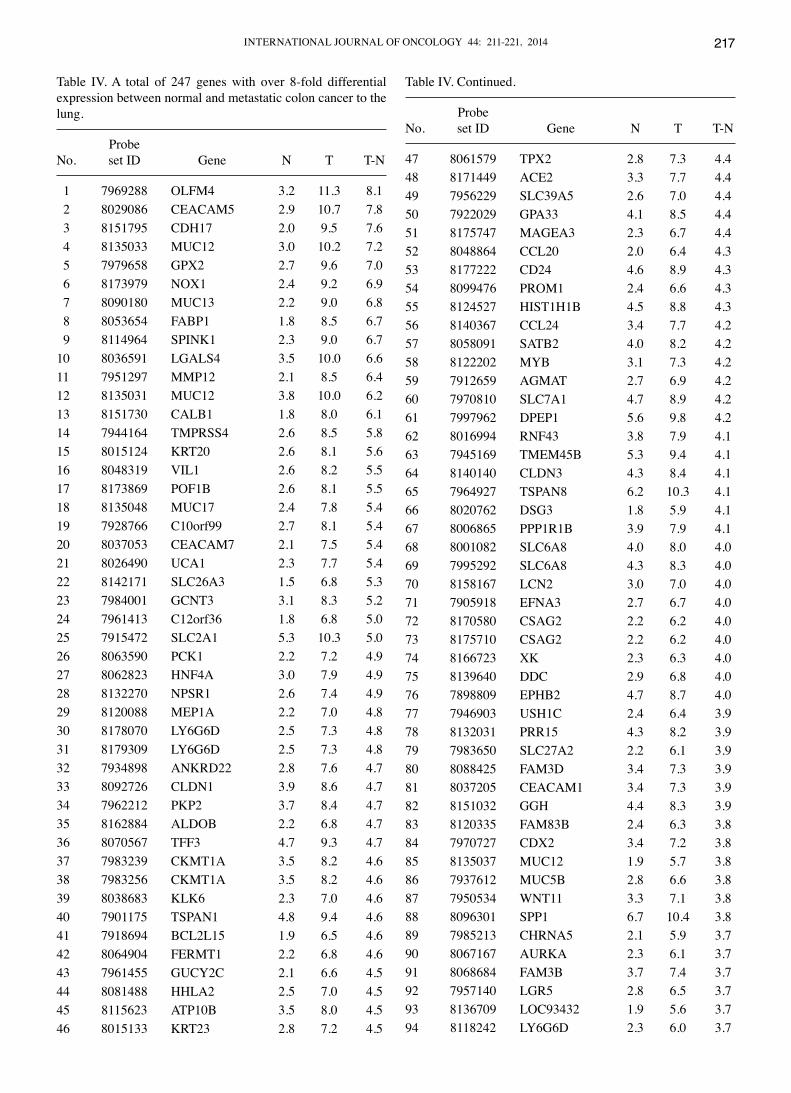
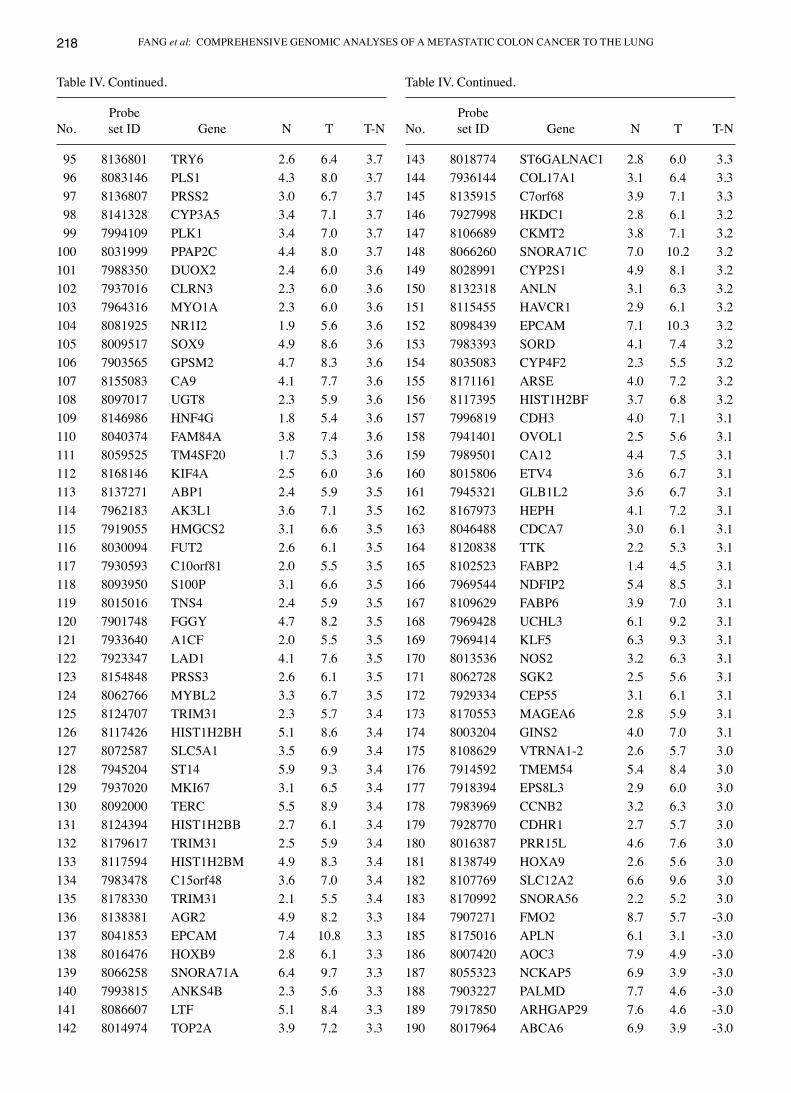
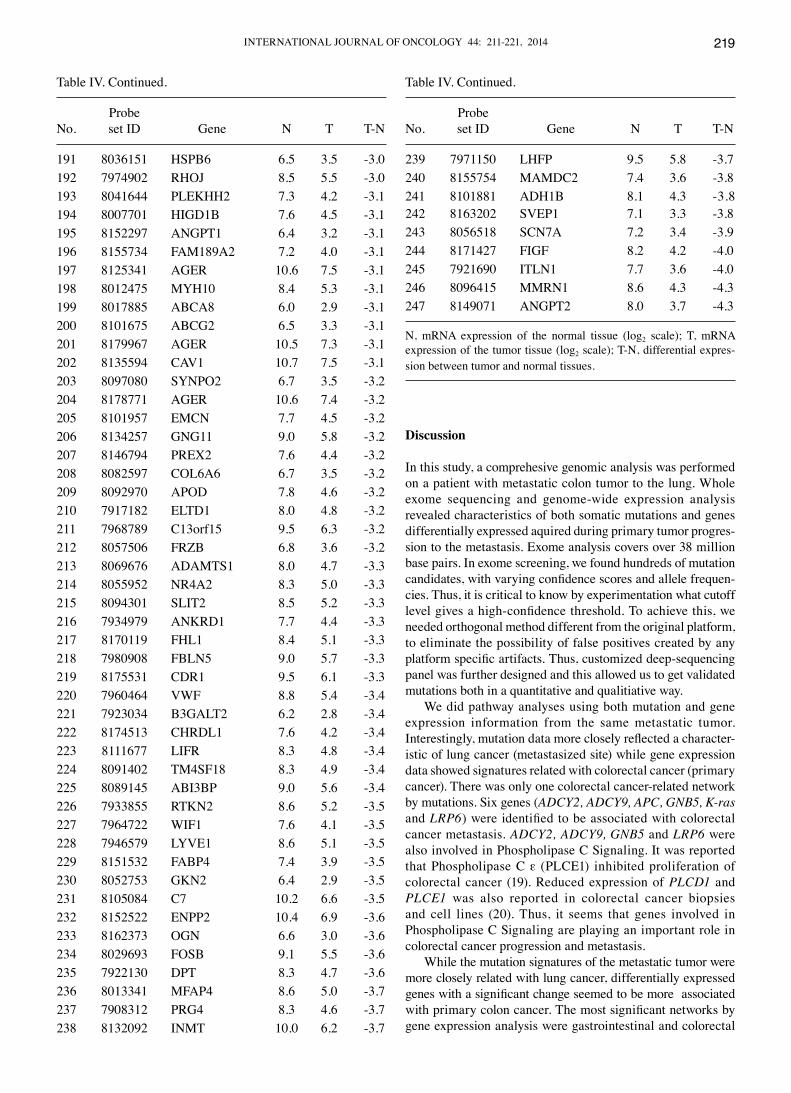
Genes differentially expressed in metastatic colon cancer to the lung and their network analysis. Of more than 20,000 genes in the Gene ST 1.1 array, 3,231 genes showed 2-fold differen-tial expression between the metastatic tumor and the matched normal tissues. There were 786 genes with at least a 4-fold differ-ence, and 247 genes with at least an 8-fold difference (Table IV). We entered these genes in 3 separate IPA analyses (analysis with the 3,231, 786 and 247 genes, respectively). In each case,
FANG et al: COMPREHENSIVE GENOMIC ANALYSES OF A METASTATIC COLON CANCER TO THE LUNG214
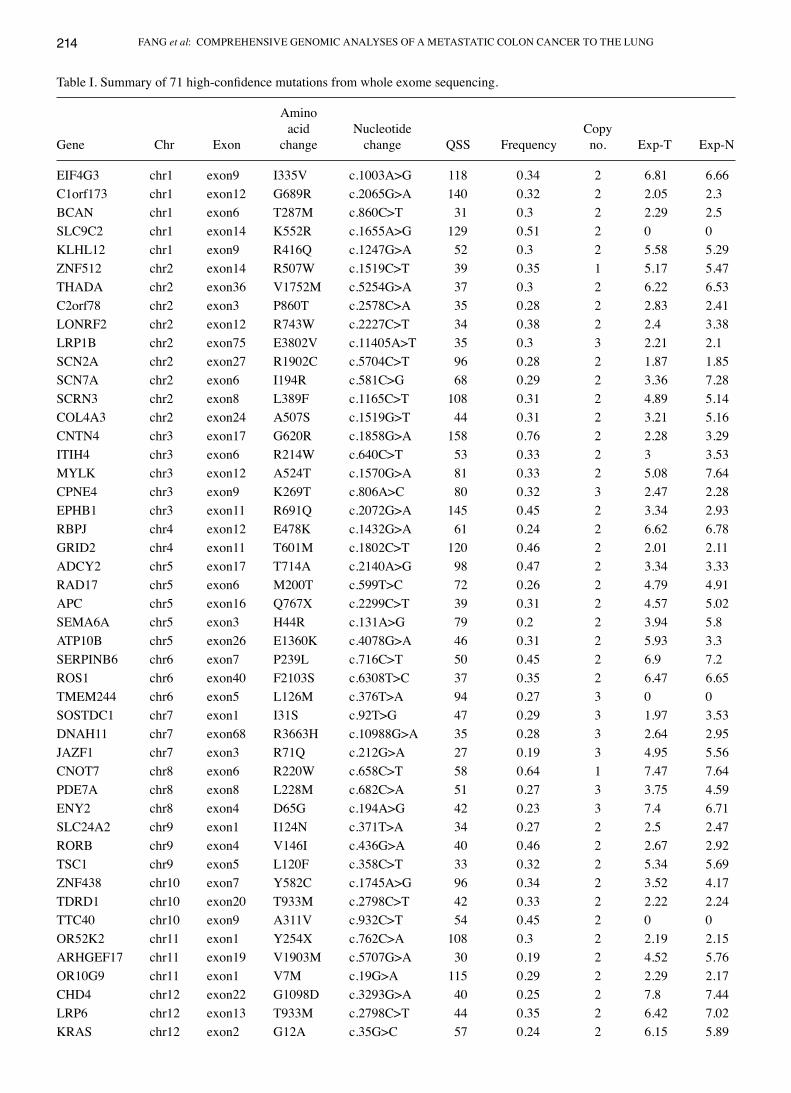
Table I. Summary of 71 high-confidence mutations from whole exome sequencing.
Amino acid Nucleotide CopyGene Chr Exon change change QSS Frequency no. Exp-T Exp-N
EIF4G3 chr1 exon9 I335V c.1003A>G 118 0.34 2 6.81 6.66C1orf173 chr1 exon12 G689R c.2065G>A 140 0.32 2 2.05 2.3BCAN chr1 exon6 T287M c.860C>T 31 0.3 2 2.29 2.5SLC9C2 chr1 exon14 K552R c.1655A>G 129 0.51 2 0 0KLHL12 chr1 exon9 R416Q c.1247G>A 52 0.3 2 5.58 5.29ZNF512 chr2 exon14 R507W c.1519C>T 39 0.35 1 5.17 5.47THADA chr2 exon36 V1752M c.5254G>A 37 0.3 2 6.22 6.53C2orf78 chr2 exon3 P860T c.2578C>A 35 0.28 2 2.83 2.41LONRF2 chr2 exon12 R743W c.2227C>T 34 0.38 2 2.4 3.38LRP1B chr2 exon75 E3802V c.11405A>T 35 0.3 3 2.21 2.1SCN2A chr2 exon27 R1902C c.5704C>T 96 0.28 2 1.87 1.85SCN7A chr2 exon6 I194R c.581C>G 68 0.29 2 3.36 7.28SCRN3 chr2 exon8 L389F c.1165C>T 108 0.31 2 4.89 5.14COL4A3 chr2 exon24 A507S c.1519G>T 44 0.31 2 3.21 5.16CNTN4 chr3 exon17 G620R c.1858G>A 158 0.76 2 2.28 3.29ITIH4 chr3 exon6 R214W c.640C>T 53 0.33 2 3 3.53MYLK chr3 exon12 A524T c.1570G>A 81 0.33 2 5.08 7.64CPNE4 chr3 exon9 K269T c.806A>C 80 0.32 3 2.47 2.28EPHB1 chr3 exon11 R691Q c.2072G>A 145 0.45 2 3.34 2.93RBPJ chr4 exon12 E478K c.1432G>A 61 0.24 2 6.62 6.78GRID2 chr4 exon11 T601M c.1802C>T 120 0.46 2 2.01 2.11ADCY2 chr5 exon17 T714A c.2140A>G 98 0.47 2 3.34 3.33RAD17 chr5 exon6 M200T c.599T>C 72 0.26 2 4.79 4.91APC chr5 exon16 Q767X c.2299C>T 39 0.31 2 4.57 5.02SEMA6A chr5 exon3 H44R c.131A>G 79 0.2 2 3.94 5.8ATP10B chr5 exon26 E1360K c.4078G>A 46 0.31 2 5.93 3.3SERPINB6 chr6 exon7 P239L c.716C>T 50 0.45 2 6.9 7.2ROS1 chr6 exon40 F2103S c.6308T>C 37 0.35 2 6.47 6.65TMEM244 chr6 exon5 L126M c.376T>A 94 0.27 3 0 0SOSTDC1 chr7 exon1 I31S c.92T>G 47 0.29 3 1.97 3.53DNAH11 chr7 exon68 R3663H c.10988G>A 35 0.28 3 2.64 2.95JAZF1 chr7 exon3 R71Q c.212G>A 27 0.19 3 4.95 5.56CNOT7 chr8 exon6 R220W c.658C>T 58 0.64 1 7.47 7.64PDE7A chr8 exon8 L228M c.682C>A 51 0.27 3 3.75 4.59ENY2 chr8 exon4 D65G c.194A>G 42 0.23 3 7.4 6.71SLC24A2 chr9 exon1 I124N c.371T>A 34 0.27 2 2.5 2.47RORB chr9 exon4 V146I c.436G>A 40 0.46 2 2.67 2.92TSC1 chr9 exon5 L120F c.358C>T 33 0.32 2 5.34 5.69ZNF438 chr10 exon7 Y582C c.1745A>G 96 0.34 2 3.52 4.17TDRD1 chr10 exon20 T933M c.2798C>T 42 0.33 2 2.22 2.24TTC40 chr10 exon9 A311V c.932C>T 54 0.45 2 0 0OR52K2 chr11 exon1 Y254X c.762C>A 108 0.3 2 2.19 2.15ARHGEF17 chr11 exon19 V1903M c.5707G>A 30 0.19 2 4.52 5.76OR10G9 chr11 exon1 V7M c.19G>A 115 0.29 2 2.29 2.17CHD4 chr12 exon22 G1098D c.3293G>A 40 0.25 2 7.8 7.44LRP6 chr12 exon13 T933M c.2798C>T 44 0.35 2 6.42 7.02KRAS chr12 exon2 G12A c.35G>C 57 0.24 2 6.15 5.89
INTERNATIONAL JOURNAL OF ONCOLOGY 44: 211-221, 2014 215
the top ‘Disease and Disorder Network’ was Cancer category. Interestingly, unlike the networks of mutation signatures earlier
described, top-ranked expression signatures of this metastatic tumor, in each analysis, was Gastrointestinal Disease followed
Table I. Continued.
Amino acid Nucleotide CopyGene Chr Exon change change QSS Frequency no. Exp-T Exp-N
KRT71 chr12 exon5 R305C c.913C>T 60 0.18 2 3.41 3.05HSP90B1 chr12 exon10 R414H c.1241G>A 219 0.35 2 10.1 9.68MYCBP2 chr13 exon6 Y377H c.1129T>C 112 0.29 3 6.46 6.96OR4M1 chr14 exon1 C141F c.422G>T 189 0.24 1 1.75 1.8SAMD4A chr14 exon2 S112F c.335C>T 93 0.52 1 4.17 5.77GNB5 chr15 exon5 C159Y c.476G>A 105 0.58 2 4.32 4.67VWA9 chr15 exon10 R379C c.1135C>T 150 0.63 2 0 0ADCY9 chr16 exon10 S948L c.2843C>T 49 0.2 2 4.94 6.48SRCAP chr16 exon16 G813D c.2438G>A 69 0.26 2 6.06 5.99ADAMTS18 chr16 exon3 S154P c.460T>C 31 0.17 2 2.45 3.54SLC5A10 chr17 exon5 R127H c.380G>A 63 0.42 1 3.86 3.43MYOM1 chr18 exon30 K1393N c.4179A>T 41 0.39 1 2.45 2.68ARMC6 chr19 exon5 R277C c.829C>T 36 0.32 2 5.45 4.83RYR1 chr19 exon1 A4T c.10G>A 36 0.42 2 2.75 2.95ATP1A3 chr19 exon9 A379T c.1135G>A 114 0.35 1 3.39 2.65ZNF285 chr19 exon4 P455Q c.1364C>A 36 0.12 2 2.49 2.51MYBPC2 chr19 exon12 D415G c.1244A>G 30 0.19 2 3.27 2.41ACTR5 chr20 exon4 R313W c.937C>T 75 0.44 3 5.22 4.2TMPRSS15 chr21 exon22 R871X c.2611C>T 84 0.34 1 1.51 1.61DEPDC5 chr22 exon28 T864M c. 2591C>T 58 0.3 2 4.99 5.04GPKOW chrX exon2 E68D c.204A>C 54 0.24 2 6.69 5.76TENM1 chrX exon21 A1242V c.3725C>T 51 0.2 2 0 0SLITRK4 chrX exon2 S34X c.101C>A 64 0.27 2 3.02 2.92HDAC6 chrX exon11 F.S. c.918_919del 31 0.32 2 5.31 4.93
Chr, chromosome; QSS, the Strelka reported somatic quality score in Phred scale; Exp-T, mRNA expression of the tumor; Exp-N, mRNA expression of the normal tissue; F.S., frameshift mutation.
Table II. Ingenuity pathway analysis (IPA) of the high-confidence mutations.
Rank Functions annotation P-value Genes
1 Lung cancer 1.3x10⁻⁶ ADCY2, ADCY9, APC, ATP1A3, BCAN, C1orf173, C2orf78, CHD4, CNTN4, DEPDC5, DNAH11, GPKOW, GRID2, HDAC6, HSP90B1, KRAS, LRP1B, MYBPC2, MYCBP2, MYLK, OR10G9, RORB, RYR1, SAMD4A, SCN2A, SCN7A, SEMA6A, SLC24A2, SLC9C2, SRCAP, TENM1, THADA, TSC1, ZNF285, ZNF438
Rank Ingenuity canonical pathways P-value Genes
1 Phospholipase C signaling 2.2x10⁻⁴ HDAC6, ADCY9, ADCY2, GNB5, ARHGEF17, KRAS2 Molecular mechanisms of cancer 2.5x10⁻⁴ ADCY9, ADCY2, LRP6, RBPJ, ARHGEF17, KRAS, APC3 Colorectal cancer metastasis signaling 2.6x10⁻⁴ ADCY9, ADCY2, LRP6, GNB5, KRAS, APC
FANG et al: COMPREHENSIVE GENOMIC ANALYSES OF A METASTATIC COLON CANCER TO THE LUNG216
by Respiratory Disease in the Disease and Disorder Network. Within the Cancer network, colorectal cancer, intestinal cancer and digestive tumor all rank above lung cancer. This analysis
suggested that expression profiles of metastatic colon cancer to the lung represents more their primary tumor site (colon) retaining its initial characteristics of tumor development.
Table III. The mutations validated by customized ultra-high coverage sequencing.
Mut/wild counts Mut/wild counts Microarray Amino exome PGM expressionGene Nucleotide acid ------------------------------- ------------------------------------------ ----------------------symbol change change T N T N T N QSS CNV
EIF4G3 c.1003A>G I335V 30/58 0/108 778/1,963 5/2,536 6.81 6.66 118 2C1orf173 c.2065G>A G689R 36/76 1/144 833/1,430 7/2,063 2.05 2.30 140 2MYLK c.1570G>A A524T 22/44 0/72 869/1,652 6/2,579 5.08 7.64 81 2EPHB1 c.2072G>A R691Q 35/43 0/91 976/1,714 2/2,507 3.34 2.93 145 2APC c.2299C>T Q767X 8/18 0/37 580/1,294 3/1,622 4.57 5.02 39 2ROS1 c.6308T>C F2103S 8/15 0/32 492/1,071 0/1,386 6.47 6.65 37 2JAZF1 c.212G>A R71Q 6/26 0/39 587/1,738 7/1,894 4.95 5.56 27 3TSC1 c.358T>T L120F 8/17 0/30 504/983 2/1,302 5.34 5.69 33 2OR52K2 c.762C>A Y254X 27/64 1/129 828/1,765 5/2,420 2.19 2.15 108 2KRAS c.35G>C G12A 12/37 0/83 536/1,019 2/1,588 6.15 5.89 57 2TMPRSS15 c.2611C>T R871X 16/31 1/93 353/1,115 2/1,962 1.51 1.61 84 1SLITRK4 c.101C>A S34X 22/61 1/96 1,102/2,656 8/3,236 3.02 2.92 64 2HDAC6 c.918_919del F.S. 7/15 0/33 864/1,731 2/2,340 5.31 4.93 31 2
Exome, exome data; PGM, customized validation sequencing result using the Ion Torrent PGM; Mut/wild counts, mutation to wild-type counts in tumor and matched normal tissue; T, tumor; N, normal tissue; QSS, the Strelka reported somatic quality score in Phred scale; CNV, copy number variation; F.S., frameshift mutation.
Figure 1. A validated somatic mutation and copy number of JAZF1 from the exome sequencing in a metastatic colon cancer to the lung. (A) A missense mutation of JAZF1 (c.212G>A or R71Q) is shown by Integrative Genomics Viewer (IGV) (reverse strand). Six out of 26 total coverage were the mutant call in tumor and none out of 39 were the mutant call in normal. (B) Validation of copy number analysis of JAZF1 by TaqMan Copy Number assay. Copy number of genomic DNA from a metastatic colon tumor to the lung (223T, white bar) showed high amplification of the JAZF1 gene (copy number, 4.3). Additional DNA samples from matched primary lung tumor and normal tissues were simutaneously analyzed (black bars).
INTERNATIONAL JOURNAL OF ONCOLOGY 44: 211-221, 2014 217
Table IV. A total of 247 genes with over 8-fold differential expression between normal and metastatic colon cancer to the lung.
ProbeNo. set ID Gene N T T-N
1 7969288 OLFM4 3.2 11.3 8.1 2 8029086 CEACAM5 2.9 10.7 7.8 3 8151795 CDH17 2.0 9.5 7.6 4 8135033 MUC12 3.0 10.2 7.2 5 7979658 GPX2 2.7 9.6 7.0 6 8173979 NOX1 2.4 9.2 6.9 7 8090180 MUC13 2.2 9.0 6.8 8 8053654 FABP1 1.8 8.5 6.7 9 8114964 SPINK1 2.3 9.0 6.710 8036591 LGALS4 3.5 10.0 6.611 7951297 MMP12 2.1 8.5 6.412 8135031 MUC12 3.8 10.0 6.213 8151730 CALB1 1.8 8.0 6.114 7944164 TMPRSS4 2.6 8.5 5.815 8015124 KRT20 2.6 8.1 5.616 8048319 VIL1 2.6 8.2 5.517 8173869 POF1B 2.6 8.1 5.518 8135048 MUC17 2.4 7.8 5.419 7928766 C10orf99 2.7 8.1 5.420 8037053 CEACAM7 2.1 7.5 5.421 8026490 UCA1 2.3 7.7 5.422 8142171 SLC26A3 1.5 6.8 5.323 7984001 GCNT3 3.1 8.3 5.224 7961413 C12orf36 1.8 6.8 5.025 7915472 SLC2A1 5.3 10.3 5.026 8063590 PCK1 2.2 7.2 4.927 8062823 HNF4A 3.0 7.9 4.928 8132270 NPSR1 2.6 7.4 4.929 8120088 MEP1A 2.2 7.0 4.830 8178070 LY6G6D 2.5 7.3 4.831 8179309 LY6G6D 2.5 7.3 4.832 7934898 ANKRD22 2.8 7.6 4.733 8092726 CLDN1 3.9 8.6 4.734 7962212 PKP2 3.7 8.4 4.735 8162884 ALDOB 2.2 6.8 4.736 8070567 TFF3 4.7 9.3 4.737 7983239 CKMT1A 3.5 8.2 4.638 7983256 CKMT1A 3.5 8.2 4.639 8038683 KLK6 2.3 7.0 4.640 7901175 TSPAN1 4.8 9.4 4.641 7918694 BCL2L15 1.9 6.5 4.642 8064904 FERMT1 2.2 6.8 4.643 7961455 GUCY2C 2.1 6.6 4.544 8081488 HHLA2 2.5 7.0 4.545 8115623 ATP10B 3.5 8.0 4.546 8015133 KRT23 2.8 7.2 4.5
Table IV. Continued.
ProbeNo. set ID Gene N T T-N
47 8061579 TPX2 2.8 7.3 4.448 8171449 ACE2 3.3 7.7 4.449 7956229 SLC39A5 2.6 7.0 4.450 7922029 GPA33 4.1 8.5 4.451 8175747 MAGEA3 2.3 6.7 4.452 8048864 CCL20 2.0 6.4 4.353 8177222 CD24 4.6 8.9 4.354 8099476 PROM1 2.4 6.6 4.355 8124527 HIST1H1B 4.5 8.8 4.356 8140367 CCL24 3.4 7.7 4.257 8058091 SATB2 4.0 8.2 4.258 8122202 MYB 3.1 7.3 4.259 7912659 AGMAT 2.7 6.9 4.260 7970810 SLC7A1 4.7 8.9 4.261 7997962 DPEP1 5.6 9.8 4.262 8016994 RNF43 3.8 7.9 4.163 7945169 TMEM45B 5.3 9.4 4.164 8140140 CLDN3 4.3 8.4 4.165 7964927 TSPAN8 6.2 10.3 4.166 8020762 DSG3 1.8 5.9 4.167 8006865 PPP1R1B 3.9 7.9 4.168 8001082 SLC6A8 4.0 8.0 4.069 7995292 SLC6A8 4.3 8.3 4.070 8158167 LCN2 3.0 7.0 4.071 7905918 EFNA3 2.7 6.7 4.072 8170580 CSAG2 2.2 6.2 4.073 8175710 CSAG2 2.2 6.2 4.074 8166723 XK 2.3 6.3 4.075 8139640 DDC 2.9 6.8 4.076 7898809 EPHB2 4.7 8.7 4.077 7946903 USH1C 2.4 6.4 3.978 8132031 PRR15 4.3 8.2 3.979 7983650 SLC27A2 2.2 6.1 3.980 8088425 FAM3D 3.4 7.3 3.981 8037205 CEACAM1 3.4 7.3 3.982 8151032 GGH 4.4 8.3 3.983 8120335 FAM83B 2.4 6.3 3.884 7970727 CDX2 3.4 7.2 3.885 8135037 MUC12 1.9 5.7 3.886 7937612 MUC5B 2.8 6.6 3.887 7950534 WNT11 3.3 7.1 3.888 8096301 SPP1 6.7 10.4 3.889 7985213 CHRNA5 2.1 5.9 3.790 8067167 AURKA 2.3 6.1 3.791 8068684 FAM3B 3.7 7.4 3.792 7957140 LGR5 2.8 6.5 3.793 8136709 LOC93432 1.9 5.6 3.794 8118242 LY6G6D 2.3 6.0 3.7
FANG et al: COMPREHENSIVE GENOMIC ANALYSES OF A METASTATIC COLON CANCER TO THE LUNG218
Table IV. Continued.
ProbeNo. set ID Gene N T T-N
95 8136801 TRY6 2.6 6.4 3.7 96 8083146 PLS1 4.3 8.0 3.7 97 8136807 PRSS2 3.0 6.7 3.7 98 8141328 CYP3A5 3.4 7.1 3.7 99 7994109 PLK1 3.4 7.0 3.7100 8031999 PPAP2C 4.4 8.0 3.7101 7988350 DUOX2 2.4 6.0 3.6102 7937016 CLRN3 2.3 6.0 3.6103 7964316 MYO1A 2.3 6.0 3.6104 8081925 NR1I2 1.9 5.6 3.6105 8009517 SOX9 4.9 8.6 3.6106 7903565 GPSM2 4.7 8.3 3.6107 8155083 CA9 4.1 7.7 3.6108 8097017 UGT8 2.3 5.9 3.6109 8146986 HNF4G 1.8 5.4 3.6110 8040374 FAM84A 3.8 7.4 3.6111 8059525 TM4SF20 1.7 5.3 3.6112 8168146 KIF4A 2.5 6.0 3.6113 8137271 ABP1 2.4 5.9 3.5114 7962183 AK3L1 3.6 7.1 3.5115 7919055 HMGCS2 3.1 6.6 3.5116 8030094 FUT2 2.6 6.1 3.5117 7930593 C10orf81 2.0 5.5 3.5118 8093950 S100P 3.1 6.6 3.5119 8015016 TNS4 2.4 5.9 3.5120 7901748 FGGY 4.7 8.2 3.5121 7933640 A1CF 2.0 5.5 3.5122 7923347 LAD1 4.1 7.6 3.5123 8154848 PRSS3 2.6 6.1 3.5124 8062766 MYBL2 3.3 6.7 3.5125 8124707 TRIM31 2.3 5.7 3.4126 8117426 HIST1H2BH 5.1 8.6 3.4127 8072587 SLC5A1 3.5 6.9 3.4128 7945204 ST14 5.9 9.3 3.4129 7937020 MKI67 3.1 6.5 3.4130 8092000 TERC 5.5 8.9 3.4131 8124394 HIST1H2BB 2.7 6.1 3.4132 8179617 TRIM31 2.5 5.9 3.4133 8117594 HIST1H2BM 4.9 8.3 3.4134 7983478 C15orf48 3.6 7.0 3.4135 8178330 TRIM31 2.1 5.5 3.4136 8138381 AGR2 4.9 8.2 3.3137 8041853 EPCAM 7.4 10.8 3.3138 8016476 HOXB9 2.8 6.1 3.3139 8066258 SNORA71A 6.4 9.7 3.3140 7993815 ANKS4B 2.3 5.6 3.3141 8086607 LTF 5.1 8.4 3.3142 8014974 TOP2A 3.9 7.2 3.3
Table IV. Continued.
ProbeNo. set ID Gene N T T-N
143 8018774 ST6GALNAC1 2.8 6.0 3.3144 7936144 COL17A1 3.1 6.4 3.3145 8135915 C7orf68 3.9 7.1 3.3146 7927998 HKDC1 2.8 6.1 3.2147 8106689 CKMT2 3.8 7.1 3.2148 8066260 SNORA71C 7.0 10.2 3.2149 8028991 CYP2S1 4.9 8.1 3.2150 8132318 ANLN 3.1 6.3 3.2151 8115455 HAVCR1 2.9 6.1 3.2152 8098439 EPCAM 7.1 10.3 3.2153 7983393 SORD 4.1 7.4 3.2154 8035083 CYP4F2 2.3 5.5 3.2155 8171161 ARSE 4.0 7.2 3.2156 8117395 HIST1H2BF 3.7 6.8 3.2157 7996819 CDH3 4.0 7.1 3.1158 7941401 OVOL1 2.5 5.6 3.1159 7989501 CA12 4.4 7.5 3.1160 8015806 ETV4 3.6 6.7 3.1161 7945321 GLB1L2 3.6 6.7 3.1162 8167973 HEPH 4.1 7.2 3.1163 8046488 CDCA7 3.0 6.1 3.1164 8120838 TTK 2.2 5.3 3.1165 8102523 FABP2 1.4 4.5 3.1166 7969544 NDFIP2 5.4 8.5 3.1167 8109629 FABP6 3.9 7.0 3.1168 7969428 UCHL3 6.1 9.2 3.1169 7969414 KLF5 6.3 9.3 3.1170 8013536 NOS2 3.2 6.3 3.1171 8062728 SGK2 2.5 5.6 3.1172 7929334 CEP55 3.1 6.1 3.1173 8170553 MAGEA6 2.8 5.9 3.1174 8003204 GINS2 4.0 7.0 3.1175 8108629 VTRNA1-2 2.6 5.7 3.0176 7914592 TMEM54 5.4 8.4 3.0177 7918394 EPS8L3 2.9 6.0 3.0178 7983969 CCNB2 3.2 6.3 3.0179 7928770 CDHR1 2.7 5.7 3.0180 8016387 PRR15L 4.6 7.6 3.0181 8138749 HOXA9 2.6 5.6 3.0182 8107769 SLC12A2 6.6 9.6 3.0183 8170992 SNORA56 2.2 5.2 3.0184 7907271 FMO2 8.7 5.7 -3.0185 8175016 APLN 6.1 3.1 -3.0186 8007420 AOC3 7.9 4.9 -3.0187 8055323 NCKAP5 6.9 3.9 -3.0188 7903227 PALMD 7.7 4.6 -3.0189 7917850 ARHGAP29 7.6 4.6 -3.0190 8017964 ABCA6 6.9 3.9 -3.0
INTERNATIONAL JOURNAL OF ONCOLOGY 44: 211-221, 2014 219
Discussion
In this study, a comprehesive genomic analysis was performed on a patient with metastatic colon tumor to the lung. Whole exome sequencing and genome-wide expression analysis revealed characteristics of both somatic mutations and genes differentially expressed aquired during primary tumor progres-sion to the metastasis. Exome analysis covers over 38 million base pairs. In exome screening, we found hundreds of mutation candidates, with varying confidence scores and allele frequen-cies. Thus, it is critical to know by experimentation what cutoff level gives a high-confidence threshold. To achieve this, we needed orthogonal method different from the original platform, to eliminate the possibility of false positives created by any platform specific artifacts. Thus, customized deep-sequencing panel was further designed and this allowed us to get validated mutations both in a quantitative and qualitiative way.
We did pathway analyses using both mutation and gene expression information from the same metastatic tumor. Interestingly, mutation data more closely reflected a character-istic of lung cancer (metastasized site) while gene expression data showed signatures related with colorectal cancer (primary cancer). There was only one colorectal cancer-related network by mutations. Six genes (ADCY2, ADCY9, APC, GNB5, K-ras and LRP6) were identified to be associated with colorectal cancer metastasis. ADCY2, ADCY9, GNB5 and LRP6 were also involved in Phospholipase C Signaling. It was reported that Phospholipase C ε (PLCE1) inhibited proliferation of colorectal cancer (19). Reduced expression of PLCD1 and PLCE1 was also reported in colorectal cancer biopsies and cell lines (20). Thus, it seems that genes involved in Phospholipase C Signaling are playing an important role in colorectal cancer progression and metastasis.
While the mutation signatures of the metastatic tumor were more closely related with lung cancer, differentially expressed genes with a significant change seemed to be more associated with primary colon cancer. The most significant networks by gene expression analysis were gastrointestinal and colorectal
Table IV. Continued.
ProbeNo. set ID Gene N T T-N
191 8036151 HSPB6 6.5 3.5 -3.0192 7974902 RHOJ 8.5 5.5 -3.0193 8041644 PLEKHH2 7.3 4.2 -3.1194 8007701 HIGD1B 7.6 4.5 -3.1195 8152297 ANGPT1 6.4 3.2 -3.1196 8155734 FAM189A2 7.2 4.0 -3.1197 8125341 AGER 10.6 7.5 -3.1198 8012475 MYH10 8.4 5.3 -3.1199 8017885 ABCA8 6.0 2.9 -3.1200 8101675 ABCG2 6.5 3.3 -3.1201 8179967 AGER 10.5 7.3 -3.1202 8135594 CAV1 10.7 7.5 -3.1203 8097080 SYNPO2 6.7 3.5 -3.2204 8178771 AGER 10.6 7.4 -3.2205 8101957 EMCN 7.7 4.5 -3.2206 8134257 GNG11 9.0 5.8 -3.2207 8146794 PREX2 7.6 4.4 -3.2208 8082597 COL6A6 6.7 3.5 -3.2209 8092970 APOD 7.8 4.6 -3.2210 7917182 ELTD1 8.0 4.8 -3.2211 7968789 C13orf15 9.5 6.3 -3.2212 8057506 FRZB 6.8 3.6 -3.2213 8069676 ADAMTS1 8.0 4.7 -3.3214 8055952 NR4A2 8.3 5.0 -3.3215 8094301 SLIT2 8.5 5.2 -3.3216 7934979 ANKRD1 7.7 4.4 -3.3217 8170119 FHL1 8.4 5.1 -3.3218 7980908 FBLN5 9.0 5.7 -3.3219 8175531 CDR1 9.5 6.1 -3.3220 7960464 VWF 8.8 5.4 -3.4221 7923034 B3GALT2 6.2 2.8 -3.4222 8174513 CHRDL1 7.6 4.2 -3.4223 8111677 LIFR 8.3 4.8 -3.4224 8091402 TM4SF18 8.3 4.9 -3.4225 8089145 ABI3BP 9.0 5.6 -3.4226 7933855 RTKN2 8.6 5.2 -3.5227 7964722 WIF1 7.6 4.1 -3.5228 7946579 LYVE1 8.6 5.1 -3.5229 8151532 FABP4 7.4 3.9 -3.5230 8052753 GKN2 6.4 2.9 -3.5231 8105084 C7 10.2 6.6 -3.5232 8152522 ENPP2 10.4 6.9 -3.6233 8162373 OGN 6.6 3.0 -3.6234 8029693 FOSB 9.1 5.5 -3.6235 7922130 DPT 8.3 4.7 -3.6236 8013341 MFAP4 8.6 5.0 -3.7237 7908312 PRG4 8.3 4.6 -3.7238 8132092 INMT 10.0 6.2 -3.7
Table IV. Continued.
ProbeNo. set ID Gene N T T-N
239 7971150 LHFP 9.5 5.8 -3.7240 8155754 MAMDC2 7.4 3.6 -3.8241 8101881 ADH1B 8.1 4.3 -3.8 242 8163202 SVEP1 7.1 3.3 -3.8243 8056518 SCN7A 7.2 3.4 -3.9244 8171427 FIGF 8.2 4.2 -4.0245 7921690 ITLN1 7.7 3.6 -4.0246 8096415 MMRN1 8.6 4.3 -4.3247 8149071 ANGPT2 8.0 3.7 -4.3
N, mRNA expression of the normal tissue (log2 scale); T, mRNA expression of the tumor tissue (log2 scale); T-N, differential expres-sion between tumor and normal tissues.

FANG et al: COMPREHENSIVE GENOMIC ANALYSES OF A METASTATIC COLON CANCER TO THE LUNG220
cancer groups (8.78x10⁻²⁶<p<1.37x10⁻²⁰). This suggests that metastatic tumors still preserved its original mRNA gene expression pattern while tumor cells acquired new mutations in a metastatic site. Out of 13 validated mutations, only APC seemed to be clearly related with colon cancer development. We could not investigate further due to unavailability of the primary tumor samples whether the identified K-ras mutation came from its primary colon cancer or metastatic tumor to the lung.
In addition to mutation and gene expression analysis, we also performed copy number analysis from the exome data. Copy number alteration is a common genetic varia-tion in the human genome (21). Traditionally, it has been difficult to estimate the copy number of a gene based on the regional coverage in exome sequencing, because different exome regions have different capture efficiencies, leading to different base coverage in different chromosome regions. However, the ExomeCNV model (17) assumes that the same region of two different samples, due to their similarity (nearly identical) in sequences, have the same capture efficiency. However, the results would be different if the tumor tissue is mixed with normal cells. The specificity for CNV calls inevitably decreases if the tumor tissue is contaminated with a large portion of normal cells. In our case, we have rela-tively low normal tissue contamination rate, 0.3. Validation assay of the JAZF1 gene using TaqMan copy number assay showed a good correlation between the exome copy number analysis and Taqman data. This suggests that whole exome sequencing data can be used to generate mutation as well as copy number information.
We identified a missense mutation at codon 71 (R71Q) in JAZF1, its gain-of-copy being validated. JAZF1 encoding a nuclear protein with three zinc finger domains is a well-characterized genetic susceptibility gene for type II diabetes (22-23) and lupus erythematosus (24). Various types of fusions such as JAZF1-SUZ12, JAZF1-JJAZ1 and JAZF1-PHF1 have been reported in ESS (endometrial stromal sarcoma) (25). Although variations of JAZF1 have been involved in many diseases, mutations in the JAZF1 gene have barely been described in the literature. Our copy number analysis showed that this gene was amplified in the tumor. In lung cancer, EML4-ALK oncogenic fusion was first identified in 2007 (26), and its inhibitor targeting MET-ALK (crizotinib) was approved for treatment of patients with EML4-ALK. Based on the high frequency of JAZF1 fusions in another type of cancer and our amplification data in a metastatic tumor to the lung, JAZF1 may function as an oncogene leading to lung metastasis from colon cancer. Further functional studies are required to validate roles of JAZF1 in tumor progression and a lung metastasis from colon cancer.
TMPRSS15 (transmembrane protease, serine 15) had a nonsense mutation (R871X). TMPRSS15 is an enteropeptidase or an enterokinase activating pancreatic trypsin for releasing digestive enzyme (27). Interestingly, nonsense and frameshift mutations of TMPRSS15 (enteropeptidase/enterokinase) were found in families with congenital enteropeptidase deficiency (27). One of the reported nonsense mutations occurred at codon 857 (R857X), which is close to the nonsense mutation site (R871X) of our patient. This suggests that the region containing codons 857 and 871 may be susceptible for stop-causing mutation.
ACTR5 [ARP5 actin-related protein 5 homolog (yeast)] is another noteworthy gene (Table I). There are scarce data on the function of this gene in human cancer. In our data, ACTR5 has a missense mutation and an amplification. The mRNA expression was also higher by more than 2-fold in tumor (log2 value = 5.22) than normal (log2 value = 4.2). Although no information is available for this gene in either lung or colon cancers at this time, a novel missense mutation that is highly expressed and amplified suggests that this gene could also be important in either colon or lung cancer development and progression.
Like ALK and JAZF1, a rearrangement or a fusion is common in ROS1 ranging from 1 to 3% of NSCLC (28,29). It was recenlty reported that a secondary missense mutation at codon 2032 (G2032R) of ROS1 was involved in a resistance to crizotinib in a lung cancer patient with CD74-ROS1 (30). Our mutation (F2103S) is located near the identified G2032R and the L2026 gatekeeper residue of ROS1. Moreover, based on the crystal structure model by Awad et al (30), the F2103 seems to be a critical residue for crizotinib binding. We confirmed that our patient did not receive crizotinib treament. Thus, it will be meaningful to investigate the characteristics of the ROS1 mutations in lung or colon cancer patients with and without crizotinib treatment.
Taken together, we performed whole exome analysis in addition to the copy number and genome-wide expres-sion analysis in a metastatic tumor. Pathway analyses of the genomic information identified different enrichment of muta-tion and gene expression levels in a metastatic colon cancer to the lung. Furthermore, ultra-high coverage NGS sequencing (>1,000X) confirmed the accuracy of exome sequencing, and have led to potentially novel cancer-associated genes which may lead to a metastasis from a primary organ.
Acknowledgements
This study was supported by the Barbara Isackson Lung Cancer Research Fund (D.J.), the Eileen D. Ludwig Endowed Fund for Thoracic Oncology Research (D.J.), Uniting Against Lung Cancer (UALC) (I.-J.K.), and Mesothelioma Applied Research Foundation (MARF) (I.-J.K.).
References
1. Hanahan D and Weinberg RA: The hallmarks of cancer. Cell 100: 57-70, 2000.
2. Nguyen DX, Bos PD and Massagué J: Metastasis: from dissemination to organ-specific colonization. Nat Rev Cancer 9: 274-284, 2009.
3. Jemal A, Bray F, Center MM, et al: Global cancer statistics. CA Cancer J Clin 61: 69-90, 2011.
4. Pao W and Girard N: New driver mutations in non-small-cell lung cancer. Lancet Oncol 12: 175-180, 2011.
5. Choi H, Kratz J, Pham P, et al: Development of a rapid and practical mutation screening assay for human lung adenocarci-noma. Int J Oncol 40: 1900-1906, 2012.
6. Vogelstein B, Fearon ER, Hamilton SR, et al: Genetic altera-tions during colorectal-tumor development. N Engl J Med 319: 525-532, 1988.
7. Barrett JC: Mechanisms of multistep carcinogenesis and carcinogen risk assessment. Environ Health Perspect 100: 9-20, 1993.
8. Rudin CM, Durinck S, Stawiski EW, et al: Comprehensive genomic analysis identifies SOX2 as a frequently amplified gene in small-cell lung cancer. Nat Genet 44: 1111-1116, 2012.
INTERNATIONAL JOURNAL OF ONCOLOGY 44: 211-221, 2014 221
9. Imielinski M, Berger AH, Hammerman PS, et al: Mapping the hallmarks of lung adenocarcinoma with massively parallel sequencing. Cell 150: 1107-1120, 2012.
10. Cancer Genome Atlas Network: Comprehensive molecular characterization of human colon and rectal cancer. Nature 487: 330-337, 2012.
11. Bosco-Clément G, Zhang F, Chen Z, et al: Targeting gli transcription activation by small molecule suppresses tumor growth. Oncogene: May 20, 2013 (Epub ahead of print).
12. Irizarry RA, Hobbs B, Collin F, et al: Exploration, normaliza-tion, and summaries of high density oligonucleotide array probe level data. Biostatistics 4: 249-264, 2003.
13. Saunders CT, Wong WS, Swamy S, et al: Strelka: accurate somatic small-variant calling from sequenced tumor-normal sample pairs. Bioinformatics 28: 1811-1817, 2012.
14. Cibulskis K, Lawrence MS, Carter SL, et al: Sensitive detection of somatic point mutations in impure and heterogeneous cancer samples. Nat Biotechnol 31: 213-219, 2013.
15. Wang K, Li M and Hakonarson H: ANNOVAR: functional annotation of genetic variants from high-throughput sequencing data. Nucleic Acids Res 38: e164, 2010.
16. Li H, Handsaker B, Wysoker A, et al: The sequence alignment/map format and samtools. Bioinformatics 25: 2078-2079, 2009.
17. Sathirapongsasuti JF, Lee H, Horst BA, et al: Exome sequencing-based copy-number variation and loss of heterozygosity detection: ExomeCNV. Bioinformatics 27:2648-2654, 2011.
18. Mao JH, Kim IJ, Wu D, et al: FBXW7 targets mTOR for degradation and cooperates with PTEN in tumor suppression. Science 321: 1499-1502, 2008.
19. Wang X, Zhou C, Qiu G, et al: Phospholipase c epsilon plays a suppressive role in incidence of colorectal cancer. Med Oncol 29: 1051-1058, 2012.
20. Danielsen SA, Cekaite L, Ågesen TH, et al: Phospholipase c isozymes are deregulated in colorectal cancer-insights gained from gene set enrichment analysis of the transcriptome. PLoS One 6: e24419, 2011.
21. Redon R, Ishikawa S, Fitch KR, et al: Global variation in copy number in the human genome. Nature 444: 444-454, 2006.
22. Grarup N, Andersen G, Krarup NT, et al: Association testing of novel type 2 diabetes risk alleles in the jazf1, cdc123/camk1d, tspan8, thada, adamts9, and notch2 loci with insulin release, insulin sensitivity, and obesity in a population-based sample of 4,516 glucose-tolerant middle-aged Danes. Diabetes 57: 2534-2540, 2008.
23. Zeggini E, Scott LJ, Saxena R, et al: Meta-analysis of genome-wide association data and large-scale replication identifies additional susceptibility loci for type 2 diabetes. Nat Genet 40: 638-645, 2008.
24. Gateva V, Sandling JK, Hom G, et al: A large-scale replication study identifies tnip1, prdm1, jazf1, uhrf1bp1 and il10 as risk loci for systemic lupus erythematosus. Nat Genet 41: 1228-1233, 2009.
25. Chiang S, Ali R, Melnyk N, et al: Frequency of known gene rearrangements in endometrial stromal tumors. Am J Surg Pathol 35: 1364-1372, 2011.
26. Soda M, Choi YL, Enomoto M, et al: Identification of the transforming EML4-ALK fusion gene in non-small-cell lung cancer. Nature 448:561-566, 2007.
27. Holzinger A, Maier EM, Bück C, et al: Mutations in the proenteropeptidase gene are the molecular cause of congenital enteropeptidase deficiency. Am J Hum Genet 70: 20-25, 2002.
28. Bergethon K, Shaw AT, Ou SH, et al: ROS1 rearrangements define a unique molecular class of lung cancers. J Clin Oncol 30: 863-870, 2012.
29. Oxnard GR, Binder A and Jänne PA: New targetable oncogenes in non-small-cell lung cancer. J Clin Oncol 31: 1097-1104, 2013.
30. Awad MM, Katayama R, McTigue M, et al: Acquired resistance to crizotinib from a mutation in CD74-ROS1. N Engl J Med 368: 2395-2401, 2013.
Copyright © 2022 FDOKUMEN