Mutation discovery in mice by whole exome sequencing
38
This Provisional PDF corresponds to the article as it appeared upon acceptance. Copyedited and fully formatted PDF and full text (HTML) versions will be made available soon. Mutation discovery in mice by whole exome sequencing Genome Biology 2011, 12:R86 doi:10.1186/gb-2011-12-9-r86 Heather Fairfield ([email protected]) Griffith J Gilbert ([email protected]) Mary Barter ([email protected]) Rebecca R Corrigan ([email protected]) Michelle Curtain ([email protected]) Yueming Ding ([email protected]) Mark D'Ascenzo ([email protected]) Daniel J Gerhardt ([email protected]) Chao He ([email protected]) Wenhui Huang ([email protected]) Todd Richmond ([email protected]) Lucy Rowe ([email protected]) Frank J Probst ([email protected]) David E Bergstrom ([email protected]) Stephen A Murray ([email protected]) Carol Bult ([email protected]) Joel Richardson ([email protected]) Benjamin Kile ([email protected]) Ivo Gut ([email protected]) Jorg Hager ([email protected]) Snaevar Sigurdsson ([email protected]) Evan Mauceli ([email protected]) Federica Di Palma ([email protected]) Kerstin Lindblad-Toh ([email protected]) Michael L Cunningham ([email protected]) Timothy C Cox ([email protected]) Monica J Justice ([email protected]) Mona S Spector ([email protected]) Scott W Lowe ([email protected]) Thomas Albert ([email protected]) Leah Rae Donahue ([email protected]) Jeffrey Jeddeloh ([email protected]) Jay Shendure ([email protected]) Laura G Reinholdt ([email protected]) ISSN 1465-6906 Genome Biology © 2011 Fairfield et al. ; licensee BioMed Central Ltd. This is an open access article distributed under the terms of the Creative Commons Attribution License ( http://creativecommons.org/licenses/by/2.0), which permits unrestricted use, distribution, and reproduction in any medium, provided the original work is properly cited.
Transcript of Mutation discovery in mice by whole exome sequencing
This Provisional PDF corresponds to the article as it appeared upon acceptance. Copyedited andfully formatted PDF and full text (HTML) versions will be made available soon.
Mutation discovery in mice by whole exome sequencing
Genome Biology 2011, 12:R86 doi:10.1186/gb-2011-12-9-r86
Heather Fairfield ([email protected])Griffith J Gilbert ([email protected])
Mary Barter ([email protected])Rebecca R Corrigan ([email protected])Michelle Curtain ([email protected])
Yueming Ding ([email protected])Mark D'Ascenzo ([email protected])Daniel J Gerhardt ([email protected])
Chao He ([email protected])Wenhui Huang ([email protected])
Todd Richmond ([email protected])Lucy Rowe ([email protected])
Frank J Probst ([email protected])David E Bergstrom ([email protected])
Stephen A Murray ([email protected])Carol Bult ([email protected])
Joel Richardson ([email protected])Benjamin Kile ([email protected])
Ivo Gut ([email protected])Jorg Hager ([email protected])
Snaevar Sigurdsson ([email protected])Evan Mauceli ([email protected])
Federica Di Palma ([email protected])Kerstin Lindblad-Toh ([email protected])
Michael L Cunningham ([email protected])Timothy C Cox ([email protected])
Monica J Justice ([email protected])Mona S Spector ([email protected])
Scott W Lowe ([email protected])Thomas Albert ([email protected])
Leah Rae Donahue ([email protected])Jeffrey Jeddeloh ([email protected])
Jay Shendure ([email protected])Laura G Reinholdt ([email protected])
ISSN 1465-6906
Genome Biology
© 2011 Fairfield et al. ; licensee BioMed Central Ltd.This is an open access article distributed under the terms of the Creative Commons Attribution License (http://creativecommons.org/licenses/by/2.0),
which permits unrestricted use, distribution, and reproduction in any medium, provided the original work is properly cited.
Article type Method
Submission date 27 May 2011
Acceptance date 14 September 2011
Publication date 14 September 2011
Article URL http://genomebiology.com/2011/12/9/R86
This peer-reviewed article was published immediately upon acceptance. It can be downloaded,printed and distributed freely for any purposes (see copyright notice below).
Articles in Genome Biology are listed in PubMed and archived at PubMed Central.
For information about publishing your research in Genome Biology go to
http://genomebiology.com/authors/instructions/
Genome Biology
© 2011 Fairfield et al. ; licensee BioMed Central Ltd.This is an open access article distributed under the terms of the Creative Commons Attribution License (http://creativecommons.org/licenses/by/2.0),
which permits unrestricted use, distribution, and reproduction in any medium, provided the original work is properly cited.
Mutation discovery in mice by whole exome sequencing
Heather Fairfield1, Griffith J Gilbert1, Mary Barter1, Rebecca R Corrigan2, Michelle
Curtain1, Yueming Ding3, Mark D’Ascenzo4, Daniel J Gerhardt4, Chao He5, Wenhui
Huang6, Todd Richmond4, Lucy Rowe1, Frank J Probst2, David E Bergstrom1, Stephen A
Murray1, Carol Bult1, Joel Richardson1, Benjamin Kile7, Ivo Gut8, Jorg Hager8, Snaevar
Sigurdsson9, Evan Mauceli9, Federica Di Palma9, Kerstin Lindblad-Toh9, Michael L
Cunningham10, Timothy C Cox10, Monica J Justice2, Mona S Spector5, Scott W Lowe5,
Thomas Albert4, Leah Rae Donahue1, Jeffrey Jeddeloh4, Jay Shendure10 and Laura G
Reinholdt1*
1) The Jackson Laboratory, 600 Main St., Bar Harbor, ME 04609, USA
2) Baylor College of Medicine, Department of Molecular and Human Genetics, One
Baylor Plaza R804: Houston, Texas 77030, USA
3) Cold Spring Harbor Laboratory, One Bungtown Road, Cold Spring Harbor, NY
11724, USA
4) Roche NimbleGen, Inc. Madison, WI 53719, USA
5) National Center for Genome Analysis (CNAG), Parc Científic de Barcelona, Torre
I, Baldiri Reixac 408028 Barcelona, Spain
6) Walter and Eliza Hall Institute, 1G Royal Parade, Parkville Victoria 3052, Australia
7) University of Washington, Department of Pediatrics, Division of Craniofacial
Medicine and Seattle Children’s Craniofacial Center, 4800 Sand Point Way NE,
Seattle Washington 98105, USA
8) Regeneron Pharmaceuticals Inc., 777 Old Saw Mill River Road, Tarrytown, NY 10591, USA
9) Broad Institute of Massachusetts Institute of Technology and Harvard, 5
Cambridge Center, Cambridge, Massachusetts, 02142, USA
10) University of Washington, Department of Genome Sciences, Foege Building S-
250, Box 355065, 3720 15th Ave NE, Seattle WA 98195-5065, USA
*corresponding author: [email protected]
Abstract
We report the development and optimization of reagents for in-solution,
hybridization based capture of the mouse exome. By validating this approach in a
multiple inbred strains and in novel mutant strains, we show that whole exome
sequencing is a robust approach discovery of putative mutations, irrespective of strain
background. We found strong candidate mutations for the majority of mutant exomes
sequenced, including new models of orofacial clefting, urogenital dysmorphology,
kyphosis and autoimmune hepatitis.
Keywords: mouse exome, high throughput sequencing, spontaneous mutations, induced mutations, mouse models of human disease
Background
Phenotype-driven approaches in model organisms, including spontaneous
mutation discovery, standard N-ethyl-N-nitrosourea (ENU) mutagenesis screens,
sensitized screens and modifier screens, are established approaches in functional
genomics for the discovery of novel genes and / or novel gene functions. As over 90%
of mouse genes have an ortholog in the human genome [1], the identification of
causative mutations in mice with clinical phenotypes can directly lead to the discovery of
human disease genes. However, mouse mutants with clinically relevant phenotypes are
not maximally useful as disease models until the underlying causative mutation is
identified. Until recently, the gene discovery process in mice has been straightforward,
but greatly hindered by the time and expense incurred by high-resolution recombination
mapping. Now, the widespread availability of massively parallel sequencing [2] has
brought about a paradigm shift in forward genetics by closing the gap between
phenotype and genotype.
Both selective sequencing and whole genome sequencing are robust methods
for mutation discovery in the mouse genome [3-5]. Nonetheless, the sequencing and
analysis of whole mammalian genomes remains computationally burdensome and
expensive for many laboratories. Targeted sequencing approaches are less expensive
and the data are accordingly more manageable, but this technique requires substantial
genetic mapping and the design and purchase of custom capture tools (i.e. arrays or
probe pools) [4]. Targeted sequencing of the coding portion of the genome, i.e. the
‘exome’, provides an opportunity to sequence mouse mutants with minimal mapping
data and alleviates the need for a custom array / probe pool for each mutant. This
approach, proven to be highly effective for the discovery of coding mutations underlying
single gene disorders in humans [6-12], is particularly relevant to large mutant
collections, where high throughput gene discovery methods are desirable.
Currently, there are nearly 5,000 spontaneous and induced mouse mutant
alleles with clinically relevant phenotypes catalogued in the Mouse Genome Informatics
(MGI) database [13]. The molecular basis of the lesions underlying two-thirds of these
phenotypes is currently unknown. For the remaining one-third that have been
characterized, the Mouse Genome Informatics database indicates that 92% occur in
coding sequence or are within 20 base pairs (bp) of intron / exon boundaries; regions
that are purposefully covered by exome targeted re-sequencing. While this estimate is
impacted by an unknown degree of ascertainment bias (since coding or splice site
mutations are easier to find and hence reported and since many uncharacterized
mutations remain so because they are understudied), we anticipated that exome
sequencing would still be likely to capture a considerable percentage of spontaneous
and induced mouse mutations. Therefore, to significantly reduce the time, effort, and
cost of forward genetic screens, we developed a sequence capture probe pool
representing the mouse exome. Here, we describe the utility of this tool for exome
sequencing in both wild type inbred and mutant strain backgrounds, and demonstrate
success in discovering both spontaneous and induced mutations.
Results and discussion
Mouse exome content and capture probe design
The coding sequence selected for the mouse exome probe pool design includes
203,225 exonic regions, including miRNAs, and collectively comprises over 54.3 Mb of
target sequence (C57BL/6J, NCBI37/mm9). The design was based on a unified, Mouse
Genome Database-curated gene set, consisting of non-redundant gene predictions from
the National Center for Biotechnology Information (NCBI), Ensembl and The Vertebrate
Genome Annotation database (Vega) [13]. The gene list is available by file transfer
protocol (FTP) [14]. To manage the size of the probe pool and to avoid non-uniquely

mappable regions, we excluded olfactory receptors and pseudogenes from the target
sequence. In cases where an exon contained both untranslated region (UTR) and
coding sequence, the UTR sequence was included in the design. Two DNA probe pools,
alpha and beta prototypes, were ultimately designed and tested. To maximize the
uniformity of the sequencing libraries after capture, re-sequencing data from the alpha
prototype design were empirically studied and used to inform a coverage re-balancing
algorithm. That algorithm altered the probe coverage target ratio of a second design
(beta prototype) in an attempt to decrease over-represented sequence coverage, and
increase under-represented sequence coverage. The target (primary design)
coordinates and the coordinates of the capture probes in the beta design are available
by FTP [15]. The summary statistics for each probe pool are shown in Additional file 1.
Exome capture performance and optimization
To test the alpha and beta exome probe pools and to determine whether strain
background adversely influenced performance, exomes from 4 commonly used inbred
strains (C57BL/6J, 129S1/SvImJ, BALB/cJ and C3H/HeJ) were captured and re-
sequenced (Table 2). Overall, capture sensitivity was high, with just one lane of 2 x 40
bp paired end sequencing (2 x 40 bp PE) resulting in >96% of the targeted bases
covered. The capture specificity was also high with >75% reads mapping to targeted
bases. Importantly, the sequencing data were significantly enriched, not only for coding
sequence, but also for flanking splice acceptor and donor sites, where deleterious
mutations are frequently found (Figure 1). Genetic background only modestly impacted
the sensitivity and specificity of the capture probe pools. The variation between strains
was greater than within a strain (Table 2). However, the scale of the inter-strain
differences observed suggests that a pool based upon exclusively the mm9 reference
would be functional with any Mus musculus background.
The beta design was made using a proprietary rebalancing algorithm from Roche
NimbleGen (Madison, WI) that removes probes from targets with high coverage and
adds probes to low coverage targets; in order to maximize coverage across targets. In
addition to testing the beta design by exome capture and 2 x 40 bp PE Illumina
sequencing of four different inbred strains, the beta design was also tested with 4
independent captures of C57BL/6J female DNA and sequenced on the Illumina GAII
platform, 2 x 76 bp PE. The most dramatic improvement was observed in the fraction of
targeted bases covered at 20X or more where the increase in uniformity resulted in 12%
improvement (Additional file 2).
Sequencing of mutant exomes
To determine the efficacy of the probe pools for mutant exome re-sequencing
and mutation discovery, 15 novel mouse mutant exomes and 3 controls were captured
and sequenced at multiple sites using different Illumina platforms (Illumina GAIIx,
Illumina HiSeq, and both 2 x 76 bp and 2 x 100 bp paired end libraries). The mutants
were selected based on several parameters including research area, mode of
inheritance (dominant and recessive), strain background, and mutation type (induced
and spontaneous). Where appropriate, homozygous samples were captured and
sequenced (Additional file 3). In all cases, the beta exome pools provided improved
capture uniformity. In the majority of cases, >97% of targeted bases were covered by at
least one read (1X). Approximately 45 million, 100 bp paired end reads were sufficient,
on average, to provide at least 5 reads coverage of 95% of target bases (Table 3,
Additional file 4), which is sufficient for detection of recessive mutations in homozygous
samples. To confidently call heterozygous alleles, at least 15X coverage is preferable
[4], and these data show that more than 58 million, 100 bp paired end reads are likely
required to obtain a minimum of 15 reads across 95% of target bases. Therefore, we
anticipate that sample indexing schemes may soon enable as many as 4 exomes to be
multiplexed per lane of an Illumina HiSeq run using the most current reagents. The raw
sequencing data for mutant and inbred strains are available from the NCBI Sequence
Read Archive (Accession# SRP007328).
Mapping and variant calling
Mapping to the mouse reference sequence (C57BL/6J, NCBI37/mm9) and
subsequent variant calling resulted in a number of single nucleotide variants (SNVs) and
insertions / deletions (INDELs) ranging from ~8,000 (C57BL/6J background) to over
200,000 (for more divergent strain backgrounds) variant calls per mutant exome,
depending on strain background and depth of coverage. Generally, ~2/3 of the variants
called were SNVs, rather than INDELS. However, in mutants on the C57BL/6J
background, this ratio was closer to ~1/2 (Additional file 3). This is not surprising given
that a large proportion of false positive calls from reference guided assembly are INDELs
and the number of true variants in any C57BL/6J exome is expected to be low because
the mouse reference strain is, primarily, C57BL/6J. The one exception was mutant
12860 (nert), which was reported to be on a C57BL/6J background, however the
relatively large number of variants detected in this mutant exome could indicate that the
reported strain background is likely incorrect.
Variant annotation and nomination of candidate mutations
The variant data were fully annotated according to genomic position, SNV
quality, allele ratio (number of reads containing variant allele/number of reads containing
reference allele), and overlap with current genome annotations including NCBI

Reference Sequence (RefSeq)/ Ensembl genes, exons, introns, splice sites, and known
SNVs, INDELs (The Single Nucleotide Polymorphism database, dbSNP). In each case,
existing linkage data were used to determine map positions and the analysis was then
limited to those regions. The existing linkage data ranged from coarse (chromosomal
linkage) to fine (regions of <10-20 Mb) (Additional file 3). The most likely causative
mutations for each mutant sample and for a control C57BL/6J exome were nominated
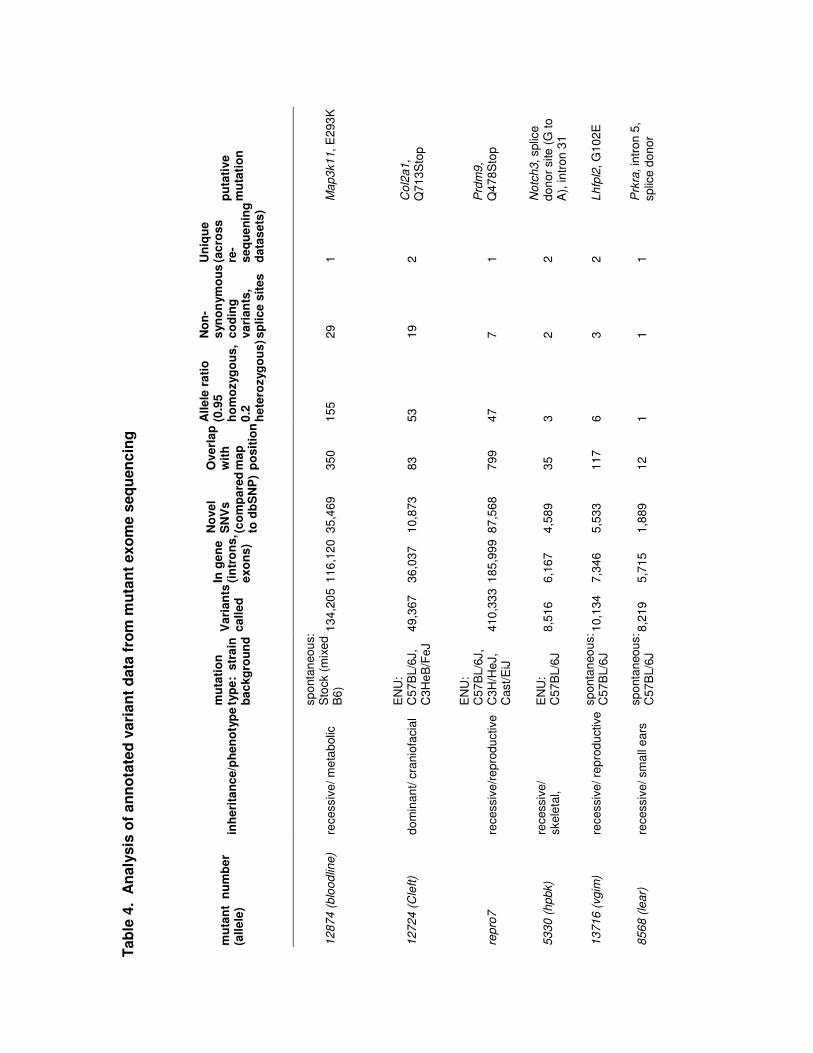
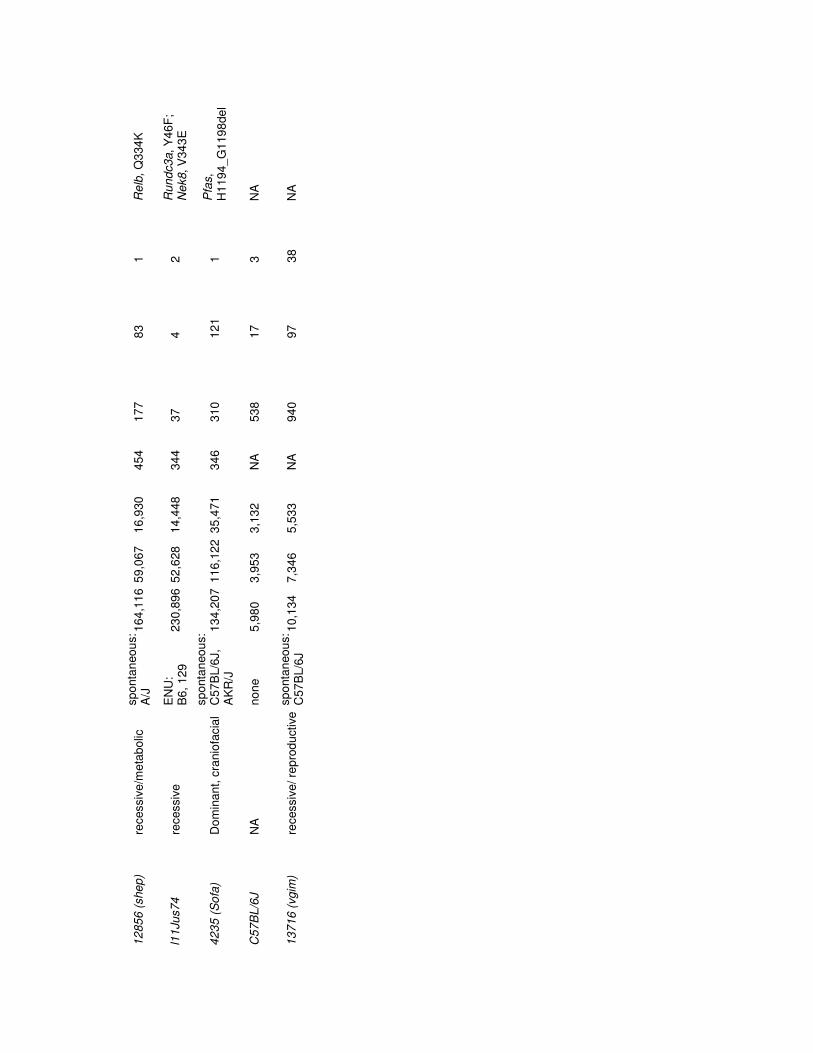
using the annotations as shown in Table 4. Specifically, novel (when compared to
dbSNP) protein coding or splice site variants falling within mapped regions, with
expected allele ratios (>0.95 for homozygous variants and >0.2 for heterozygous
variants) were given priority for validation by re-sequencing of additional mutant and
unaffected samples. To further reduce the validation burden, we found that comparison
of unrelated exome sequencing data sets and comparison to the Sanger Institute Mouse
Genomes data [16] allowed for significant reduction in validation burden, as any variants
common between these data sets represent common variants that are shared between
related strains or systematic false positives arising from mapping the data back to the
reference sequence. Similar to what has been observed in human exome sequencing,
the latter can be caused by repetitive or closely related sequences (paralogs) or
underlying deficiencies in the reference sequence. For comparison, the alignment data
from the C57BL/6J beta exome shown in Table 2 was subjected to variant calling and
annotation. Interestingly, 17 variants passed filters in a C57BL/6J exome (Table 4),
expected to be most similar to the reference genome, which is also primarily C57BL/6J.
Comparison of these variants with the high throughput sequencing data for 17 inbred
strains available from Sanger Mouse Genomes Project revealed 3 exonic SNVs unique
to the C57BL/6J exome. We predict that the remaining 14 variants calls are false
positive calls due to mapping errors, which can arise in regions where there is underlying
deficiency in the reference sequence or in regions that share sequence similarity (i.e.
paralogs). These regions are apparent when viewing alignments as regions that contain
a preponderance of non-uniquely mapped reads, gaps, or regions that contain apparent
heterozygosity in samples that are known to be homozygous (as is the case with the
inbred strain data from the Sanger Mouse Genomes project, where each strain was
subjected to at least 200 generations of brother x sister intercrossing prior to
sequencing) (Additional file 5).
Validation of putative causative mutations
Using this approach, only one or two variants were nominated for validation in
each of 9 mutant exomes. Four of these mutants represented ENU-generated lines,
while 5 were spontaneous mutants. In a few cases, the single variant nominated for
validation proved to be the likely causative mutation. For example, the single SNV
nominated for validation in the bloodline mutant, correlated with the phenotype when
additional affected and unaffected samples were tested (Figure 2a). The SNV is a
missense mutation causing an amino acid change (E293K) in Map3K11, a gene that
encodes a mitogen-activated protein kinase kinase kinase that is involved in a variety of
cellular signaling cascades. Importantly, mice homozygous for a targeted null mutation
in Map3k11 have the characteristic epidermal midline defect that is also observed in
bloodline homozygotes [17], further implicating the missense mutation found is the
causative mutation. Unlike bloodline homozygotes, Map3K11-/- mice are viable and
tooth pulp necrosis has not been reported [17]; indicating that the spontaneous mutation
may be sensitive to strain background effects. However, further work is needed to
establish the underlying mechanisms influencing these phenotypic differences.
In some cases, more than one potentially damaging variant was found to
correlate with the phenotype when additional affected and unaffected animals from the
pedigree were genotyped (Table 4). In two cases, hpbk and vgim, where more than one
variant was found, only one variant could be validated while the other variants were false
positives. In two cases where more than one potentially damaging variant was found,
both were validated. Not surprisingly, these cases were ENU-induced mutant exomes
(Cleft and l11Jus74) and ENU is known to cause mutations at a rate of greater than
1/750 per locus per gamete [18] at doses of 85 mg/kg. Cleft is a dominant craniofacial
ENU mutation that causes cleft palate. Of the two variants that were nominated for
validation, both were SNVs residing in Col2a1, a gene coding for type II procollagen.
Both SNVs reside within 10 kb of each other (Chr15:97815207 and Chr15:97825743) in
Col2a1, a gene coding for type II procollagen, and not surprisingly were found to be
concordant with the phenotype when multiple animals from the pedigree were
genotyped. The most likely causative lesion (G to A at Chr15:97815207) is a nonsense
mutation that introduces a premature stop codon at amino acid 645. The second closely
linked variant is an A to T transversion in intron 12 that could potentially act as a cryptic
splice site. However, since RT-PCR did not reveal splicing abnormalities, it is more
likely that the nonsense mutation is the causative lesion (Figure 2b). Mice homozygous
for targeted deletions in Col2a1 and mice homozygous for a previously characterized,
spontaneous mis-sense mutation, Col2a1sedc, share similar defects in cartilage
development to Cleft mutants, including recessive peri-natal lethality and orofacial
clefting [19, 20], providing further support that the Cleft phenotype is the result of a
mutation in Col2a1.
The l11Jus74 mutation was isolated in a screen for recessive lethal alleles on
mouse chromosome 11 using a 129.Inv(11)8BrdTrp53-Wnt3 balancer chromosome [21, 22].
The screen was performed as described previously using C57BL/6J ENU-treated males,
mated to the balancer, which was generated in 129S5SvEv embryonic stem cells.
Embryos from the l11Jus74 line were analyzed from timed matings, as previously
described [23], to determine that homozygotes die perinatally. Two potentially causative
missense mutations were found in NIMA (never in mitosis gene a)-related expressed
kinase 8 (Nek8; V343E) and Run domain containing 3a (Rundc3a; Y46F). Mutations in
Nek8 cause polycystic kidney disease, but no phenotypes have been ascribed to
mutations in Rundc3a. Although the cause of death of l11Jus74 homozygotes has not
been determined, polycystic kidneys have not been observed, making the most likely
lesion to result in perinatal death Rundc3a, although the Nek8 mutation may cause a
delayed onset phenotype.
For all 4 of the ENU induced mutant exomes sequenced, putative causative
mutations were nominated and validated. Mutations induced by ENU are usually single
nucleotide substitutions. The high sensitivity of current analytical pipelines for detecting
single nucleotide substitutions (and particularly homozygous substitutions), combined
with the propensity of damaging single nucleotide substitutions to occur in coding
sequences, likely explains the high success rate of exome sequencing for detecting
induced lesions. Similarly, Boles et al. showed that targeted sequencing of exons and
highly conserved sequences from ENU mutants mapping to Chromosome 11 yielded a
high success rate with candidate mutations nominated in nearly 75% of mutants [24].
While mutations induced by mutagens like ENU are known to cause single
nucleotide substitutions, spontaneous mutations are the result of a variety of lesions,
including single nucleotide substitutions, small insertions / deletions and larger deletions
or insertions of mobile DNA elements. Of the 9 potentially damaging coding or splicing
mutations discovered in this set of mutant exomes, the spontaneous Sofa mutant was
the only one for which a single nucleotide substitution was not discovered. Instead, a 15
bp deletion in Pfas (Table 4, Figure 2D and E) was found demonstrating that small
deletions in coding sequence can be discovered using this approach.
Interestingly, the allele ratio for the Sofa deletion was 0.2, which is lower than
expected for a heterozygote, therefore a stringent cutoff of 0.5 or even 0.35, which we
previously found was sufficient for calling heterozygous variants at ~80% confidence [4],
would have eliminated this variant from consideration. The lower allele ratio is likely the
result of bias in either the capture of the INDEL containing fragments, and/or the ability
to appropriately map some of the INDEL bearing reads. Since the library fragments are
larger than both the probes and the exons they target and because each target is tiled
with multiple probes, there are expected to be perfect match probes somewhere within
an exon for nearly every allele despite the presence of an INDEL. Consequently, we
favor a mapping problem as the major driver for the lower than expected allele ratio
observed (Figure 2E). Longer reads may alleviate some systematic issues associated
with discovering relevant deletions or insertions. A 15bp deletion would maximally
comprise a mismatch of nearly 38% along a 40bp read, but only 20% within a 76 bp
read. Large gaps (20% or more of the read) would impose a stiff mapping penalty on
that end of read-pairs. Presumably, longer reads, 100bp or longer, would incur lower
penalties, thereby moderating adverse mapping effects.
Approximately 10% of known deleterious mutations in the mouse genome affect
the conserved splice acceptor or donor sites (Table 1), which include the two intronic
nucleotides immediately flanking each exon. Of the putative mutations discovered in this
set of 15 mutant exomes, three candidates were found in or immediately adjacent to the
conserved splice acceptor or donor sites (Cleft, lear, and hpbk), demonstrating that
exome sequencing provides sufficient coverage of flanking intron sequence to positively
identify potentially damaging, non-coding mutations in the intron sequences immediately
flanking target exons.
Traditional genetic mapping and exome sequencing
In all cases, either coarse mapping data (chromosomal linkage) or a fine map
position (< 20 Mb) was available to guide analysis and ease validation burden
(Additional file 3). For example, the shep mutation was previously linked to Chr 7 (~152
Mb), while the repro7 was fine mapped to a 4.5 Mb region on Chr 17. The mapping of
shep to Chr 7 was accomplished using a group of 20 affected animals, while the fine
mapping of repro7 to a 4.5 Mb region on Chr 17 required the generation of 524 F2
animals, requiring over a year of breeding in limited vivarium space. In both cases, the
mapping data coupled with the additional filtering of annotated data as shown in Table 4,
significantly reduced the validation burden to a single variant. Therefore, high
throughput sequencing (exome or whole genome) represents a cost efficient alternative
to fine mapping by recombination, especially in cases where vivarium space and time
are limited resources.
In the absence of chromosomal linkage, the validation burden is significantly
larger. For example, the vgim mutant exome was reanalyzed without utilizing mapping
information (Table 4, last row) and 38 variants were nominated for validation. Addition of
just the chromosomal linkage data for vgim (Chr 13), but not the fine mapping data
(chr13:85473357-96594659) reduces the validation burden to 2 candidates. Therefore,
coarse mapping to establish chromosomal linkage provides significant reduction in
validation burden at minimal additional animal husbandry cost and time. In the absence
of mapping data and/or when mutations arise on unusual genetic backgrounds, exome
sequencing of additional samples (affected animal and parents) would similarly reduce
the validation burden to just one or a few variants.
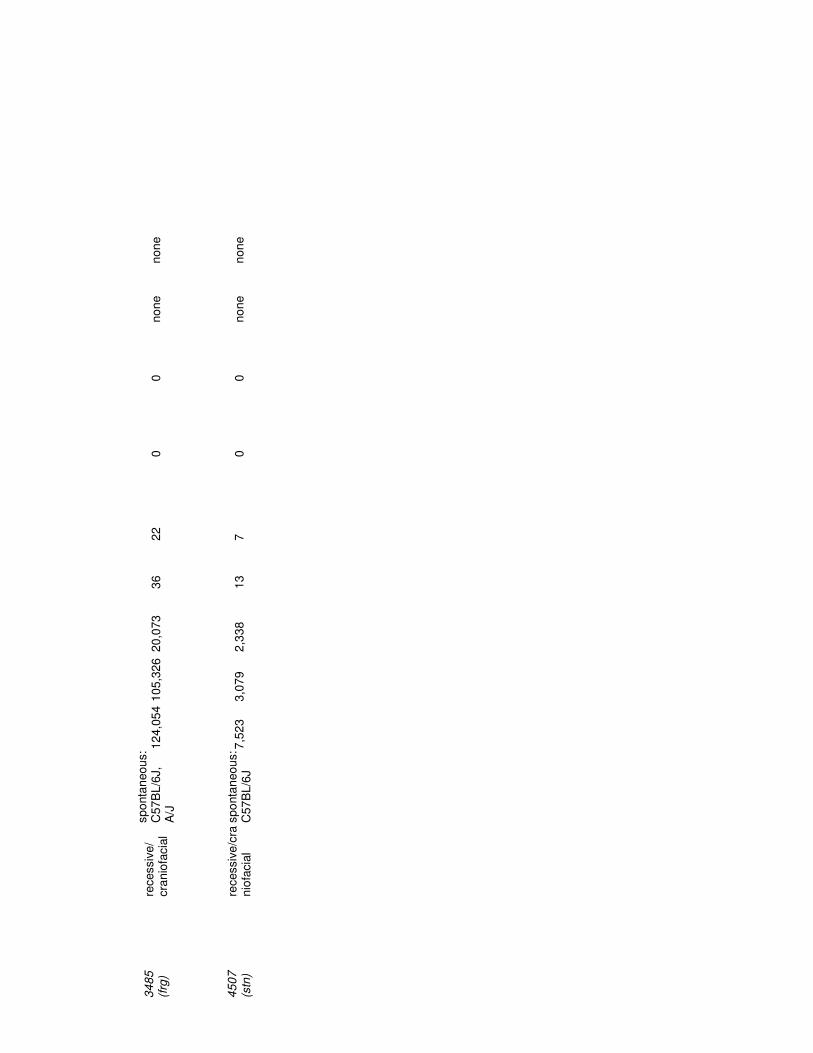
Limitations of exome sequencing for mutation discovery
Using this technology, we validated putative causative coding mutations in 9 of
the 15 mutant exomes examined. For the remaining 6 mutants, candidate mutations
were found in untranslated regions or were not found at all (Table 5). For Alf, nert and
aphl, candidate mutations were found in untranslated regions, and interestingly, in nearly
every case, these candidate mutations are in genes not currently associated with any
mouse phenotype. For the other 3 mutants, frg, stn and sunk, no candidate mutations
were found in protein coding sequence, splice sites or in UTRs. Failure to identify the
candidate causative mutations most likely indicates that these mutations reside in non-
coding, regulatory regions or unannotated coding sequence that is not included in the
current exome capture design. An additional possibility is that the underlying mutations
do reside in the targeted regions, but are simply not revealed using standard mapping
and SNP calling, which is clearly biased towards the discovery of single nucleotide
substitutions and small insertions / deletions. Robust computational methods for finding
larger insertions and deletions and/or translocations via high throughput sequencing
data are not widely available and the absence of these tools limits spontaneous mutation
discovery by any means, whether exome or whole genome sequencing. In a parallel
effort, we used targeted sequencing of contiguous regions to discover spontaneous
mutations that have been mapped to regions of 10 Mb or less. Interestingly, the success
rate for nominating putative mutations via targeted sequencing of contiguous regions
was comparable to that of exome sequencing (at ~60%), demonstrating that despite the
availability of sequence data representing the entire candidate region, existing analysis
pipelines are not sufficient for discovery of all disease-causative genetic lesions.
Moreover, systematic errors in the mm9 reference sequence or insufficient gene
annotation [24] are also likely to contribute to failed mutation discovery, since current
analytical approaches rely upon reference and contemporary gene annotation as
assumed underlying truth.
In this context, it is notable that the exome based analysis of human phenotypes
that are presumed to be monogenic is also frequently unsuccessful, although such
negative results are generally not reported in the literature. Consequently, we anticipate
that deeper analysis of the mouse mutants that fail discovery by exome sequencing may
also shed light on the nature of both non-coding and cryptic coding mutations that
contribute to Mendelian phenotypes in humans.
Conclusions
Whole exome sequencing is a robust method for mutation discovery in the
mouse genome and will be particularly useful for high-throughput genetic analyses of
large mutant collections. Due to the nature of the underlying mutations and the current
methods available for massively parallel sequence data analysis, ENU mutation
discovery via exome sequencing is more successful than spontaneous mutation
discovery. In all cases, coarse mapping data (chromosomal linkage) significantly eased
validation burden (Table 4), however fine mapping to chromosomal regions <10-20Mb,
while useful, did not provide significant added value (Table 4 and Additional file 3). A
similar conclusion was drawn by, Arnold et al. for mutation discovery via whole genome
sequencing [5]. In addition, since the data shown here includes mutations on a variety
of strain backgrounds, comparison across unrelated exome data sets and to whole
genome sequencing data from the Mouse Genomes Project [16] proved critical in
reducing the validation burden, especially where mapping data were not available to
guide analysis.
Although we are ten years past the assembly of both the human and mouse
genomes, the biological function of the vast majority of mammalian genes remains
unknown. We anticipate that the application of exome sequencing to the thousands of
immediately available mutant mouse lines exhibiting clinically relevant phenotypes will
make a large and highly valuable contribution to filling this knowledge gap.
Materials and methods
Exome capture and sequencing.
The following protocol for exome capture and sequencing is the standard protocol
generally followed by all sites providing data for the proof-of-concept experiment. Site-
specific deviations in the standard protocol can be provided upon request. The mouse
exome probe pools developed in this study, SeqCap EZ Mouse Exome SR, are
commercially available on request from Roche NimbleGen.
DNA extraction
DNA for high throughput sequencing was isolated from spleen using a Qiagen DNeasy
Blood and Tissue kit (Qiagen) or by phenol / chloroform extraction of nuclear pellets.
Briefly, spleen samples were homogenized in ice-cold Tris lysis buffer (0.02 M Tris,
pH=7.5, 0.01M NaCl, 3mM MgCl2). Homogenates were then incubated in 1% sucrose,
1% NP40 to release nuclei, which were subsequently pelleted by centrifugation at 1000
rpm, 4°C. Isolated nuclei were then extracted by phenol chloroform in the presence of
1% SDS. DNA for PCR was extracted from small (1-2 mm) tail biopsies by lysing in 200
ml of 50 mM NaOH at 95°C for 10 min. Samples were neutralized by adding 20 ml of
1M Tris HCl, pH=8.0 and used directly for PCR amplification.
Capture Library Preparation and Hybridization Amplification
Illumina Paired End (PE) libraries, (Illumina) were constructed using Illumina’s
Multiplexing Kit (Part # PE-400-1001) with the a few modifications. Size selection was
done using the Pippin Prep from Sage Science, Inc. (http://www.sagescience.com). The
target bp selection size was set at 430 bp. The entire 40 ul recovery product was used
as template in the pre-hybridization library amplification (i.e. LMPCR). Pre-hybridization
LMPCR consisted of one reaction containing 50 µl Phusion High Fidelity PCR Master
Mix (New England BioLabs, Ipswich, MA, Part # F-531L), 0.5 µM of Illumina Multiplexing
PCR Primer 1.0: 5'
AATGATACGGCGACCACCGAGATCTACACTCTTTCCCTACACGACGCTCTTCCGAT
CT 3’, 0.001 µM of Illumina Multiplexing PCR Primer 2.0: 5'
GTGACTGGAGTTCAGACGTGTGCTCTTCCGATCT 3’, and 0.5 µM of Illumina PCR
Primer, Index 1(or other index at bases 25-31): 5’
CAAGCAGAAGACGGCATACGAGAT(CGTGATG)TGACTGGAGTTC 3’, 40µl DNA,
and water up to 100µl. PCR cycling conditions were as follows: 98 degrees C for 30
seconds, followed by 8 cycles of 98 degrees C for 10 seconds, 65 degrees C for 30
seconds, and 72 degrees C for 30 seconds. The last step was an extension at 72
degrees C for 5 minutes. The reaction was then kept at 4 degrees C until further
processing. The amplified material was cleaned with a Qiagen Qiaquick PCR Purification
Kit (Part # 28104) according to the manufacturers instructions, except the DNA were
eluted in 50µl water. The DNA were quantified using the NanoDrop-1000 (Wilmington,
DE) and the library was evaluated electrophoretically with an Agilent Bioanalyzer 2100
(Santa Clara, CA) using a DNA1000 chip (Part # 5067-1504). Sample multiplexing was
performed in some cases, after capture and prior to sequencing.
Liquid Phase Sequence Capture and Processing
Prior to hybridization the following components were added to a 1.5ml tube: 1.0 µg of
library material, 1 µl of 1000 µM oligo 5'-
AATGATACGGCGACCACCGAGATCTACACTCTT TCCCTACACGACGCTCTT CCG
ATC* T (asterisk denotes phosphorothioate bond), 1 µl of 100 µM oligo 5’
CAAGCAGAAGACGGCATACGAGATCGTGATGTGACTGGAGTTCAGACGTGTGCTC
TTCCGATC*T 3’ (bases 25-31 correspond to index primer 1), and 5µg of Mouse COT-1
DNA (Part # 18440-016) from Invitrogen, Inc. (Carlsbad, CA). Samples were dried down
by puncturing a hole in the 1.5ml tube cap with a 20 gauge needle and processing in an
Eppendorf Vacufuge (San Diego, CA) set to 60 degrees C for 20 minutes. To each
sample 7.5µl NimbleGen SC Hybridization Buffer (Part # 05340721001) and 3.0µl
NimbleGen Hybridization component A (Part # 05340721001) was added, sample was
vortexed for 30 seconds, centrifuged, and placed in a heating block at 95 degrees C for
10 minutes. The samples were again mixed for 10 seconds, and spun down. This
mixture was then transferred to a 0.2ml PCR tube containing 4.5µl of Mouse Exome
Solution Phase probes and mixed by pipetting up and down 10 times. The 0.2ml PCR
tubes were placed in a thermocylcer with heated lid on for 47 degrees C for 64-72 hours.
Washing and recovery of captured DNA was performed as described in Chapter 6 of
NimbleGen SeqCap EZ Exome SR Protocol Version 2.2 (available from Roche
NimbleGen website) [11]. Samples were then quality checked using quantitative PCR
as described in Chapter 8 of SR Protocol Version 2.2 [10]. Sample enrichment is
calculated and used as a means of judging capture success. Mean fold enrichment
greater than 50 was considered successful and sequenced. NimbleGen Sequence
Capture Control (NSC) qPCR assay NSC-0272 was not used to evaluate captures in
these experiments.
Post Hybridization LMPCR
Post hybridization amplification (e.g. LMPCR via Illumina adapters) consisted of 2
reactions for each sample using the same enzyme concentration as the pre-capture
amplification, but a modified concentration, 2 uM, and version of the Illumina Multiplexing
1.0 and 2.0 primers were employed: Forward primer 5’-
AATGATACGGCGACCACCGAGA and reverse primer 5’-
CAAGCAGAAGACGGCATACGAG. Post hybridization amplification consisted of 16
cycles of PCR with identical cycling conditions as used in the pre-hybridization LMPCR
(above), with the exception of the annealing temperature was lowered to 60 degrees C.
After completion of the amplification reaction, the samples were purified using a Qiagen
Qiaquick column following the manufacturer recommended protocol. DNA was quantified
spectrophotometrically, and electrophoretically evaluated with an Agilent Bioanalyzer
2100 using a DNA1000 chip (Agilent). The resulting post capture enriched sequencing
libraries were diluted to 10nM and used in cluster formation on an Illumina (San Diego,
CA) cBot and paired end sequencing was done using Illumina’s Genome Analyzer IIX or
Illumina HiSeq. Both cluster formation and paired-end sequencing were performed using
the Illumina provided protocols.
High Throughput Sequencing Data Analysis
Mapping, SNP calling and annotation
The sequencing data were mapped using Maq, BWA (Burrows-Wheeler aligment
tool) and/or GASST (global alignment short sequence search tool) and SNP calling was
performed SAMtools [25] and/or GenomeQuest [26]. SNP annotation was performed
using GenomeQuest, custom scripts and Galaxy tools. Alignments were visualized with
the UCSC genome browser, Integrated Genomics Viewer (Broad Institute) and/or
SignalMap (Roche NimbleGen).
Validation
Candidate mutations were validated by PCR amplification and sequencing of
affected and unaffected samples if available from the mutant colony or from archived
samples. Sequencing data was analyzed using Sequencher, 4.9 (Gene Codes Corp.).
Primers were designed using Primer 3 software [27].
RT-PCR
Total RNA was isolated from heterozygous and homozygous tail biopsies and /
or embryos using the RNeasy Mini Kit (Qiagen) according to the manufacturer’s
protocols. 1 µg of total RNA was reverse transcribed into cDNA using the SuperScript III
First-Strand Synthesis SuperMix for qRT-PCR (Invitrogen) according to the
manufacturers protocols. 3 µl of cDNA were used as template in a 30 µl PCR with the
following cycling conditions for all primers (0.4 µM final concentration): 94°C (45 s), 56°C
(45 s), 72°C (45 s) for 30 cycles. Primers used for Cleft were Cleft_11-14f (5’-
CTGGAAAACCTGGTGACGAC) and Cleft_11-14R (5’-ACCAGCTTCCCCCTTAGC).
Abbreviations
1/NC80, fold 80 penalty; BWA, Burrows-Wheeler aligment tool; bp, base pairs; dbSNP,
The Single Nucleotide Polymorphism Database; ENU, N-ethyl-N-nitrosourea; FTP, file
transfer protocol; GASST, global alignment short sequence search tool; INDEL,
insertions/deletions; LMPCR, pre-hybridization library amplification; MGI, Mouse
Genome Informatics; NCBI, National Center for Biotechnology Information; PE, paired
end; RefSeq, NCBI Reference Sequence; RT-PCR, reverse transcriptase polymerase
chain reaction; SNV, single nucleotide variant; UTR, untranslated region; VEGA, The
Vertebrate Genome Annotation database.
Competing interests
The authors from Roche NimbleGen recognize a competing interest in this publication as
employees of the company. The other authors declare that they have no competing
interests.
Author contributions
JJ, LGR, JS, BK, IG, JH, SWL participated in the conception of the mouse exome
design. CB and JR created and provided the gene list that was the basis for the exome
design. JS, SS, EM, FDP, KLT provided sequencing support. MSS, LGR, SAM, LRD,
DEB, MLC, TCC, and SWL provided mutant samples. WH, CH, DG, HF, GG, MB, LR,
RRC, FJP, and MC performed sample preparation, exome capture, PCR and RT-PCR
validation. YD, MD, DG, and TR provided sequence analysis and bioinformatics
support. LGR, JS and JJ conceived of the study, and participated in its design and
coordination and drafted the manuscript. All authors read and approved the final
manuscript.
Acknowledgements
We are grateful to the Mouse Genome Informatics team at The Jackson Laboratory for
providing custom queries of the Mouse Genome Database. We would also like to thank
Belinda Harris, Son Yong Karst, Louise Dionne, Pat Ward-Bailey and Coleen Kane for
technical assistance. We also thank Lindsay Felker, Alexandra MacKenzie, and Choli
Lee at the University of Washington for analytical and technical assistance. We are
grateful to the Illumina High Throughput Sequencing Service and the DNA Resource at
The Jackson Laboratory for providing sequencing support and archived DNA samples.
The repro7 mutant was obtained from The Reproductive Genomics program at The
Jackson Laboratory (NICHD P01 HD42137) and it was sequenced at the Broad Institute
under the Mouse Mutant Re-sequencing Project [28]. This work was supported in part
by The Mouse Mutant Resource and the Craniofacial Resource at The Jackson
Laboratory, NIH-NCRR RR001183, NEI EY015073. M.S.S was supported by a generous
contribution from The Don Monti Memorial Research Foundation. S.W.L. is a Howard
Hughes Medical Institute Investigator and is also supported in part by the Mouse Models
of Human Cancer Consortium grant, 5U01 CA105388.
References
1. Mouse Genome Informatics
[http://www.informatics.jax.org/mgihome/homepages/stats/all_stats.shtml
]
2. Shendure J, Ji H: Next-generation DNA sequencing. Nat Biotechnol 2008,
26:1135-1145.
3. Zhang Z, Alpert D, Francis R, Chatterjee B, Yu Q, Tansey T, Sabol SL, Cui C, Bai
Y, Koriabine M, Yoshinaga Y, Cheng JF, Chen F, Martin J, Schackwitz W, Gunn
TM, Kramer KL, De Jong PJ, Pennacchio LA, Lo CW: Massively parallel
sequencing identifies the gene Megf8 with ENU-induced mutation
causing heterotaxy. Proceedings of the National Academy of Sciences of the
United States of America 2009, 106:3219-3224.
4. D'Ascenzo M, Meacham C, Kitzman J, Middle C, Knight J, Winer R, Kukricar M,
Richmond T, Albert TJ, Czechanski A, Donahue LR, Affourtit J, Jeddeloh JA,
Reinholdt L: Mutation discovery in the mouse using genetically guided
array capture and resequencing. Mamm Genome 2009, 20:424-436.
5. Arnold CN, Xia Y, Lin P, Ross C, Schwander M, Smart NG, Muller U, Beutler B:
Rapid identification of a disease allele in mouse through whole genome
sequencing and bulk segregation analysis. Genetics 2011, 187:633-641.
6. Ng SB, Bigham AW, Buckingham KJ, Hannibal MC, McMillin MJ, Gildersleeve
HI, Beck AE, Tabor HK, Cooper GM, Mefford HC, Lee C, Turner EH, Smith JD,
Rieder MJ, Yoshiura K, Matsumoto N, Ohta T, Niikawa N, Nickerson DA,
Bamshad MJ, Shendure J: Exome sequencing identifies MLL2 mutations as
a cause of Kabuki syndrome. Nature genetics 2010, 42:790-793.
7. Ng SB, Buckingham KJ, Lee C, Bigham AW, Tabor HK, Dent KM, Huff CD,
Shannon PT, Jabs EW, Nickerson DA, Shendure J, Bamshad MJ: Exome
sequencing identifies the cause of a mendelian disorder. Nature genetics
2010, 42:30-35.
8. Zuchner S, Dallman J, Wen R, Beecham G, Naj A, Farooq A, Kohli MA,
Whitehead PL, Hulme W, Konidari I, Edwards YJ, Cai G, Peter I, Seo D,
Buxbaum JD, Haines JL, Blanton S, Young J, Alfonso E, Vance JM, Lam BL,
Pericak-Vance MA: Whole-Exome Sequencing Links a Variant in DHDDS
to Retinitis Pigmentosa. Am J Hum Genet 2011, 88:201-206.
9. Ostergaard P, Simpson MA, Brice G, Mansour S, Connell FC, Onoufriadis A,
Child AH, Hwang J, Kalidas K, Mortimer PS, Trembath R, Jeffery S: Rapid
identification of mutations in GJC2 in primary lymphoedema using
whole exome sequencing combined with linkage analysis with
delineation of the phenotype. J Med Genet 2011.
10. Walsh T, Shahin H, Elkan-Miller T, Lee MK, Thornton AM, Roeb W, Abu
Rayyan A, Loulus S, Avraham KB, King MC, Kanaan M: Whole exome
sequencing and homozygosity mapping identify mutation in the cell
polarity protein GPSM2 as the cause of nonsyndromic hearing loss
DFNB82. Am J Hum Genet 2010, 87:90-94.
11. Bainbridge MN, Wang M, Burgess DL, Kovar C, Rodesch MJ, D'Ascenzo M,
Kitzman J, Wu YQ, Newsham I, Richmond TA, Jeddeloh JA, Muzny D, Albert TJ,
Gibbs RA: Whole exome capture in solution with 3 Gbp of data. Genome
Biol 2010, 11:R62.
12. Choi M, Scholl UI, Ji W, Liu T, Tikhonova IR, Zumbo P, Nayir A, Bakkaloglu A,
Ozen S, Sanjad S, Nelson-Williams C, Farhi A, Mane S, Lifton RP: Genetic
diagnosis by whole exome capture and massively parallel DNA
sequencing. Proceedings of the National Academy of Sciences of the United
States of America 2009, 106:19096-19101.
13. Blake JA, Bult CJ, Kadin JA, Richardson JE, Eppig JT: The Mouse Genome
Database (MGD): premier model organism resource for mammalian
genomics and genetics. Nucleic Acids Res 2011, 39:D842-848.
14. Mouse Exome Gene List
[ftp://ftp.jax.org/Genome_Biology_mouse_exomes/mouse_exome_genes.xls.z
ip]
15. Mouse Exome Design
[ftp://ftp.jax.org/Genome_Biology_mouse_exomes/100803_MM9_exome_reb
al_2_EZ_HX1.gff.bz2.]
16. Mouse Genomes Project
[http://www.sanger.ac.uk/resources/mouse/genomes/]
17. Brancho D, Ventura JJ, Jaeschke A, Doran B, Flavell RA, Davis RJ: Role of
MLK3 in the regulation of mitogen-activated protein kinase signaling
cascades. Mol Cell Biol 2005, 25:3670-3681.
18. Hitotsumachi S, Carpenter DA, Russell WL: Dose-repetition increases the
mutagenic effectiveness of N-ethyl-N-nitrosourea in mouse
spermatogonia. Proceedings of the National Academy of Sciences of the
United States of America 1985, 82:6619-6621.
19. Leung AW, Wong SY, Chan D, Tam PP, Cheah KS: Loss of procollagen IIA
from the anterior mesendoderm disrupts the development of mouse
embryonic forebrain. Dev Dyn 2010, 239:2319-2329.
20. Donahue LR, Chang B, Mohan S, Miyakoshi N, Wergedal JE, Baylink DJ, Hawes
NL, Rosen CJ, Ward-Bailey P, Zheng QY, Bronson RT, Johnson KR, Davisson
MT: A missense mutation in the mouse Col2a1 gene causes
spondyloepiphyseal dysplasia congenita, hearing loss, and
retinoschisis. J Bone Miner Res 2003, 18:1612-1621.
21. Kile BT, Hentges KE, Clark AT, Nakamura H, Salinger AP, Liu B, Box N,
Stockton DW, Johnson RL, Behringer RR, Bradley A, Justice MJ: Functional
genetic analysis of mouse chromosome 11. Nature 2003, 425:81-86.
22. Zheng B, Sage M, Cai WW, Thompson DM, Tavsanli BC, Cheah YC, Bradley A:
Engineering a mouse balancer chromosome. Nature genetics 1999,
22:375-378.
23. Hentges KE, Nakamura H, Furuta Y, Yu Y, Thompson DM, O'Brien W, Bradley
A, Justice MJ: Novel lethal mouse mutants produced in balancer
chromosome screens. Gene Expr Patterns 2006, 6:653-665.
24. Boles MK, Wilkinson BM, Wilming LG, Liu B, Probst FJ, Harrow J, Grafham D,
Hentges KE, Woodward LP, Maxwell A, Mitchell K, Risley MD, Johnson R,
Hirschi K, Lupski JR, Funato Y, Miki H, Marin-Garcia P, Matthews L, Coffey AJ,
Parker A, Hubbard TJ, Rogers J, Bradley A, Adams DJ, Justice MJ: Discovery of
candidate disease genes in ENU-induced mouse mutants by large-scale
sequencing, including a splice-site mutation in nucleoredoxin. PLoS
Genet 2009, 5:e1000759.
25. Galaxy [http://main.g2.bx.psu.edu]
26. GenomeQuest [http://www.genomequest.com/]
27. Primer 3 [http://frodo.wi.mit.edu/primer3/]
28. Mouse Mutant Re-sequencing Project
[http://www.broadinstitute.org/scientific-
community/science/projects/mammals-models/mouse/mouse-mutant-
resequencing]
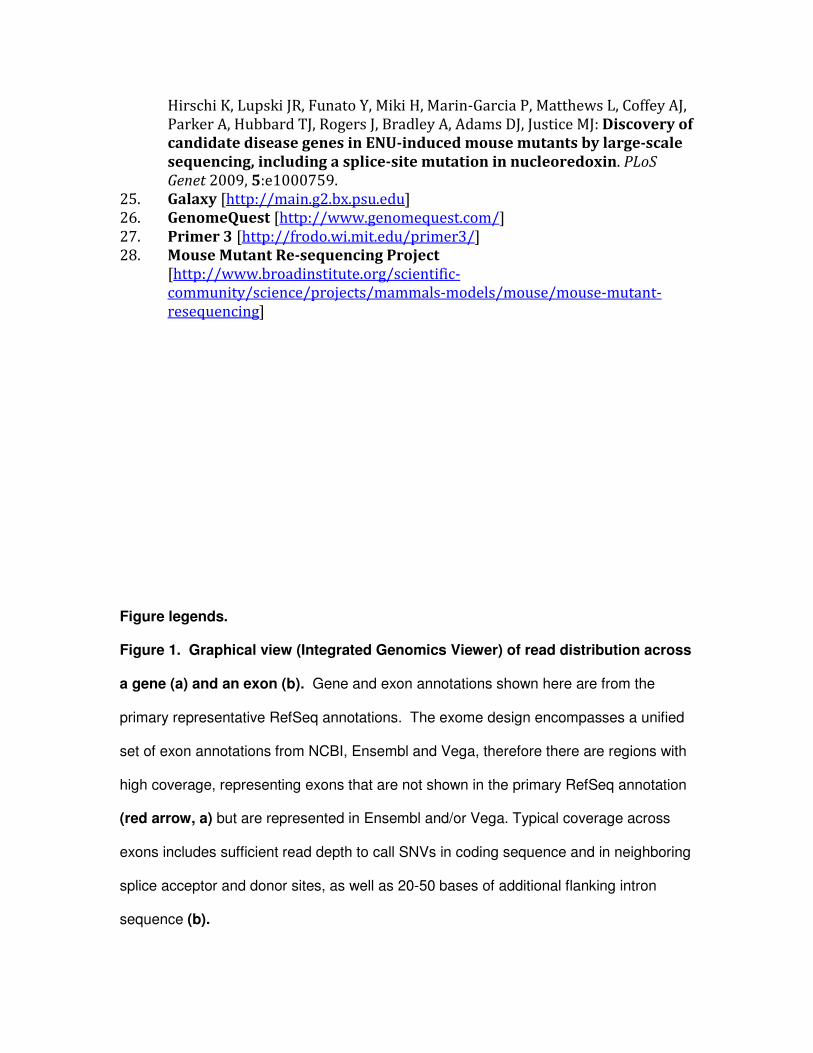
Figure legends.
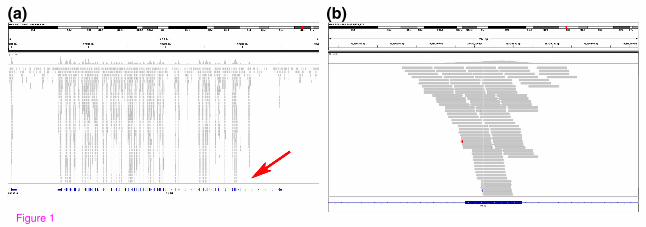
Figure 1. Graphical view (Integrated Genomics Viewer) of read distribution across
a gene (a) and an exon (b). Gene and exon annotations shown here are from the
primary representative RefSeq annotations. The exome design encompasses a unified
set of exon annotations from NCBI, Ensembl and Vega, therefore there are regions with
high coverage, representing exons that are not shown in the primary RefSeq annotation
(red arrow, a) but are represented in Ensembl and/or Vega. Typical coverage across
exons includes sufficient read depth to call SNVs in coding sequence and in neighboring
splice acceptor and donor sites, as well as 20-50 bases of additional flanking intron
sequence (b).

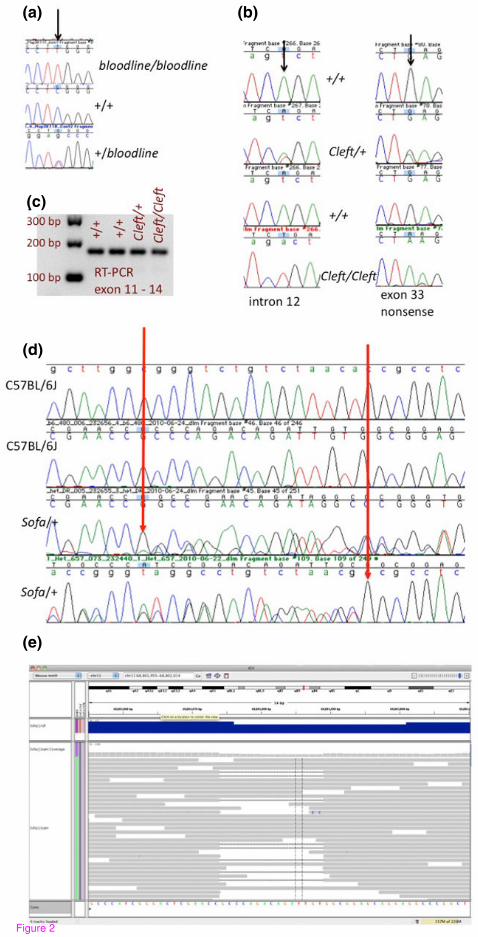
Figure 2. Examples of validated mutations discovered in mutant exome data. The
bloodline mutation is a recessive mutation that causes a distinctive dorsal epidermal
defect and tooth pulp necrosis. Exome sequencing revealed a G to A mutation in
Map3K11, mitogen-activated protein kinase kinase kinase 11. PCR and sequencing of
additional mutant (bloodline/bloodline) and unaffected (+/+ or +/-) animals provided
additional support for this putative mutation (a). The ‘Cleft’ mutation is an ENU mutation
that arose on C57BL/6J. The mutation causes a dominant craniofacial phenotype and
recessive perinatal lethality with characteristic cleft palate. Sanger sequencing
confirmed the presence of two closely linked mutations in multiple cleft/+ and cleft/cleft
samples and the absence of these mutations in +/+ littermate samples (b). Of the two
mutations found, the intron mutation has the potential to cause splicing defects, however
it is less likely to contribute to the phenotype since RT-PCR shows no indication of
defective splicing mutant samples (c). The ‘Sofa’ mutation is spontaneous mutation that
arose on C57BL/6J, causing a dominant craniofacial phenotype and recessive perinatal
lethality. Sanger sequencing of heterozygous and control samples confirmed the
presence of a 15 bp deletion in Pfas, FGAR amidotransferase (D). Reads from the
mutant, deletion bearing allele successfully mapped to Pfas using BWA and the deletion
was called using SAM tools with an allele ratio of 0.2 (E).
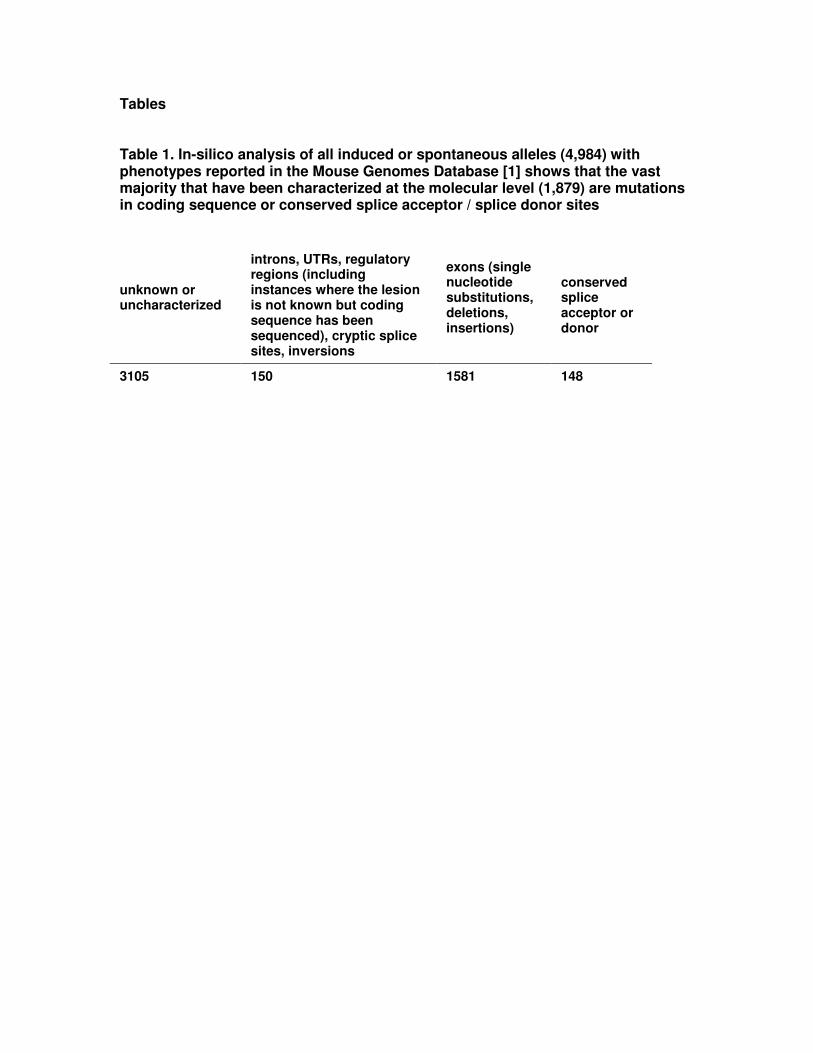
Tables
Table 1. In-silico analysis of all induced or spontaneous alleles (4,984) with phenotypes reported in the Mouse Genomes Database [1] shows that the vast majority that have been characterized at the molecular level (1,879) are mutations in coding sequence or conserved splice acceptor / splice donor sites
unknown or uncharacterized
introns, UTRs, regulatory regions (including instances where the lesion is not known but coding sequence has been sequenced), cryptic splice sites, inversions
exons (single nucleotide substitutions, deletions, insertions)
conserved splice acceptor or donor
3105
150 1581
148
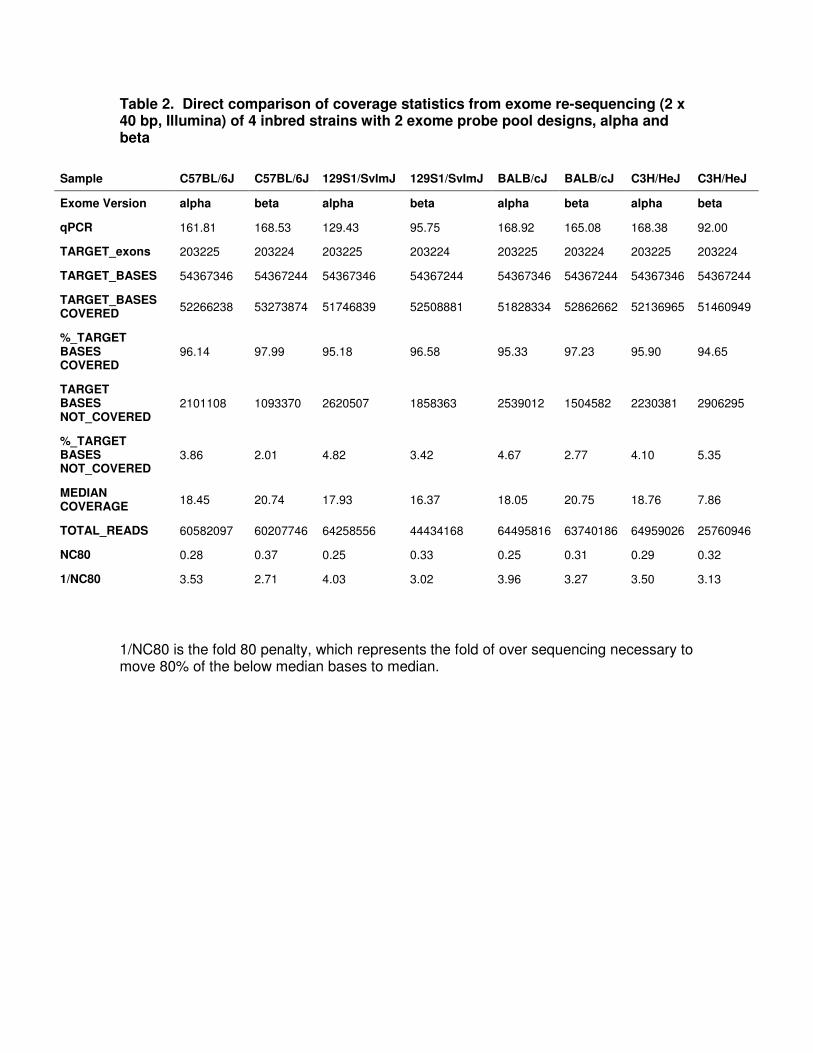
Table 2. Direct comparison of coverage statistics from exome re-sequencing (2 x 40 bp, Illumina) of 4 inbred strains with 2 exome probe pool designs, alpha and beta
1/NC80 is the fold 80 penalty, which represents the fold of over sequencing necessary to move 80% of the below median bases to median.
Sample C57BL/6J C57BL/6J 129S1/SvImJ 129S1/SvImJ BALB/cJ BALB/cJ C3H/HeJ C3H/HeJ
Exome Version alpha beta alpha beta alpha beta alpha beta
qPCR 161.81 168.53 129.43 95.75 168.92 165.08 168.38 92.00
TARGET_exons 203225 203224 203225 203224 203225 203224 203225 203224
TARGET_BASES 54367346 54367244 54367346 54367244 54367346 54367244 54367346 54367244
TARGET_BASES COVERED
52266238 53273874 51746839 52508881 51828334 52862662 52136965 51460949
%_TARGET BASES COVERED
96.14 97.99 95.18 96.58 95.33 97.23 95.90 94.65
TARGET BASES NOT_COVERED
2101108 1093370 2620507 1858363 2539012 1504582 2230381 2906295
%_TARGET BASES NOT_COVERED
3.86 2.01 4.82 3.42 4.67 2.77 4.10 5.35
MEDIAN COVERAGE
18.45 20.74 17.93 16.37 18.05 20.75 18.76 7.86
TOTAL_READS 60582097 60207746 64258556 44434168 64495816 63740186 64959026 25760946
NC80 0.28 0.37 0.25 0.33 0.25 0.31 0.29 0.32
1/NC80 3.53 2.71 4.03 3.02 3.96 3.27 3.50 3.13
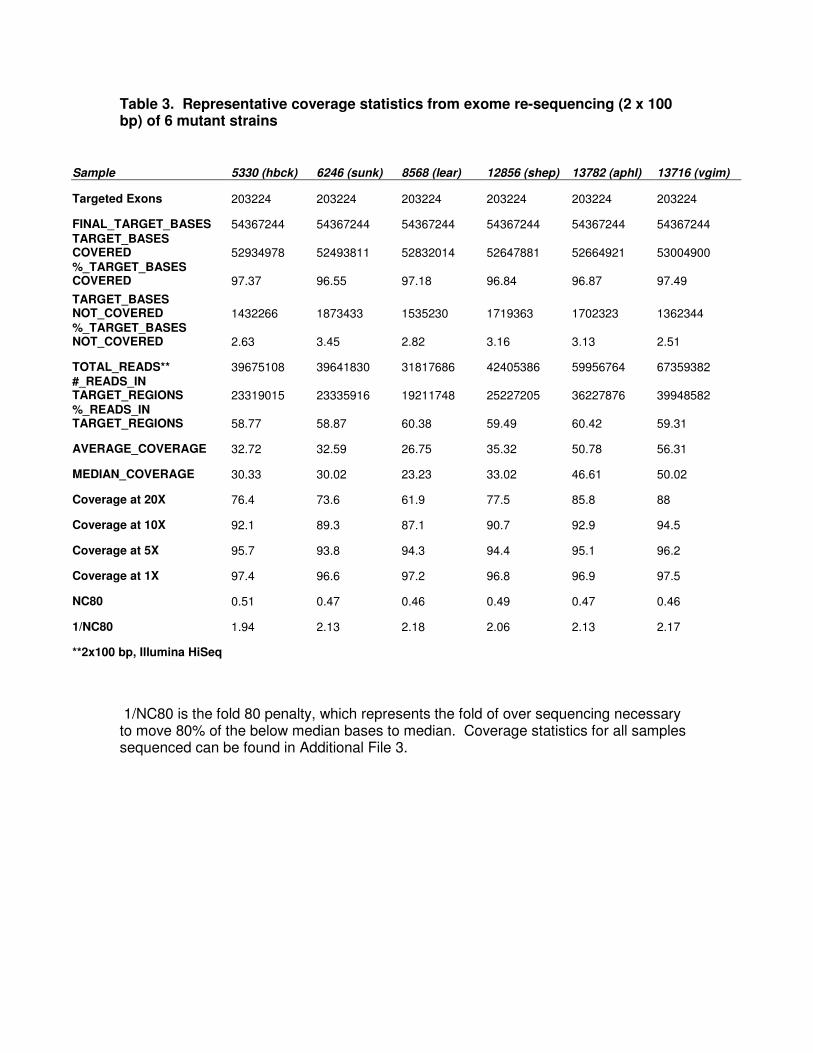
Table 3. Representative coverage statistics from exome re-sequencing (2 x 100 bp) of 6 mutant strains
Sample 5330 (hbck) 6246 (sunk) 8568 (lear) 12856 (shep) 13782 (aphl) 13716 (vgim)
Targeted Exons 203224 203224 203224 203224 203224 203224
FINAL_TARGET_BASES 54367244 54367244 54367244 54367244 54367244 54367244 TARGET_BASES COVERED 52934978 52493811 52832014 52647881 52664921 53004900 %_TARGET_BASES COVERED 97.37 96.55 97.18 96.84 96.87 97.49
TARGET_BASES NOT_COVERED 1432266 1873433 1535230 1719363 1702323 1362344 %_TARGET_BASES NOT_COVERED 2.63 3.45 2.82 3.16 3.13 2.51
TOTAL_READS** 39675108 39641830 31817686 42405386 59956764 67359382 #_READS_IN TARGET_REGIONS 23319015 23335916 19211748 25227205 36227876 39948582 %_READS_IN TARGET_REGIONS 58.77 58.87 60.38 59.49 60.42 59.31
AVERAGE_COVERAGE 32.72 32.59 26.75 35.32 50.78 56.31
MEDIAN_COVERAGE 30.33 30.02 23.23 33.02 46.61 50.02
Coverage at 20X 76.4 73.6 61.9 77.5 85.8 88
Coverage at 10X 92.1 89.3 87.1 90.7 92.9 94.5
Coverage at 5X 95.7 93.8 94.3 94.4 95.1 96.2
Coverage at 1X 97.4 96.6 97.2 96.8 96.9 97.5
NC80 0.51 0.47 0.46 0.49 0.47 0.46
1/NC80 1.94 2.13 2.18 2.06 2.13 2.17
**2x100 bp, Illumina HiSeq
1/NC80 is the fold 80 penalty, which represents the fold of over sequencing necessary to move 80% of the below median bases to median. Coverage statistics for all samples sequenced can be found in Additional File 3.
Tab
le 4
. A
naly
sis
of
an
no
tate
d v
ari
an
t d
ata
fro
m m
uta
nt
exo
me s
eq
uen
cin
g
mu
tan
t n
um
be
r (a
lle
le)
inh
eri
tan
ce
/ph
en
oty
pe
mu
tati
on
ty
pe
: s
tra
in
ba
ck
gro
un
d V
ari
an
ts
ca
lle
d
In g
en
e
(in
tro
ns
, e
xo
ns
)
No
ve
l S
NV
s
(co
mp
are
d
to d
bS
NP
) O
ve
rla
p
wit
h
ma
p
po
sit
ion
All
ele
ra
tio
(0
.95
h
om
ozyg
ou
s,
0.2
h
ete
rozyg
ou
s)
No
n-
syn
on
ym
ou
s
co
din
g
va
ria
nts
, s
pli
ce s
ites
Un
iqu
e
(ac
ros
s
re-
se
qu
en
ing
d
ata
se
ts)
pu
tati
ve
m
uta
tio
n
12
87
4 (
blo
od
line
) re
cessiv
e/ m
eta
bolic
sp
onta
neo
us:
Sto
ck (
mix
ed
B
6)
13
4,2
05
11
6,1
20
3
5,4
69
3
50
1
55
2
9
1
Ma
p3
k1
1,
E2
93
K
12
72
4 (
Cle
ft)
d
om
ina
nt/ c
ran
iofa
cia
l E
NU
: C
57
BL
/6J,
C3
He
B/F
eJ
49
,367
3
6,0
37
1
0,8
73
8
3
53
1
9
2
Co
l2a
1,
Q7
13
Sto
p
rep
ro7
re
cessiv
e/r
ep
rod
uctive
EN
U:
C5
7B
L/6
J,
C3
H/H
eJ,
Ca
st/
EiJ
41
0,3
33
18
5,9
99
8
7,5
68
7
99
4
7
7
1
Prd
m9
, Q
47
8S
top
53
30
(h
pbk)
re
cessiv
e/
skele
tal,
EN
U:
C5
7B
L/6
J
8,5
16
6
,16
7
4,5
89
3
5
3
2
2
No
tch
3,
splic
e
do
no
r site
(G
to
A
), in
tron
31
13
71
6 (
vgim
) re
cessiv
e/ re
pro
du
ctive
sp
onta
neo
us:
C5
7B
L/6
J
10
,134
7
,34
6
5,5
33
1
17
6
3
2
L
hfp
l2,
G1
02
E
85
68
(le
ar)
re
cessiv
e/ sm
all
ea
rs
sp
onta
neo
us:
C5
7B
L/6
J
8,2
19
5
,71
5
1,8
89
1
2
1
1
1
Prk
ra,
intr
on 5
, sp
lice
do
no
r
12
85
6 (
she
p)
recessiv
e/m
eta
bolic
sp
onta
neo
us:
A/J
1
64
,11
6 5
9,0
67
1
6,9
30
4
54
1
77
8
3
1
Re
lb,
Q3
34
K
l11
Ju
s74
re
cessiv
e
EN
U:
B6
, 1
29
2
30
,89
6 5
2,6
28
1
4,4
48
3
44
3
7
4
2
Ru
nd
c3a
, Y
46
F;
Ne
k8
, V
34
3E
42
35
(S
ofa
) D
om
ina
nt,
cra
nio
facia
l sp
onta
neo
us:
C5
7B
L/6
J,
AK
R/J
1
34
,20
7 1
16
,12
2 3
5,4
71
3
46
3
10
1
21
1
P
fas,
H1
19
4_
G1
19
8de
l
C5
7B
L/6
J
NA
n
on
e
5,9
80
3
,95
3
3,1
32
N
A
53
8
17
3
N
A
13
71
6 (
vgim
) re
cessiv
e/ re
pro
du
ctive
sp
onta
neo
us:
C5
7B
L/6
J
10
,134
7
,34
6
5,5
33
N
A
94
0
97
3
8
NA

Tab
le 5
. I
n 6
of
the 1
5 m
uta
nt
exo
mes s
eq
uen
ced
, can
did
ate
mu
tati
on
s i
n p
rote
in c
od
ing
seq
uen
ce o
r sp
lice s
ites w
ere
eit
her
no
t fo
un
d o
r co
uld
no
t b
e v
ali
date
d i
n a
dd
itio
nal sam
ple
s. H
ow
ever,
fo
r th
ree o
f th
ese,
can
did
ate
mu
tati
on
s in
re
gio
ns a
nn
ota
ted
at
UT
Rs w
ere
id
en
tifi
ed
mu
tan
t n
um
be
r a
nd
alle
le n
am
e
inh
eri
tan
ce
/p
he
no
typ
e
str
ain
b
ac
kg
rou
nd
va
ria
nts
c
all
ed
in g
en
e
(in
tro
ns
, e
xo
ns
)
No
ve
l S
NV
s
(co
mp
are
d
to d
bS
NP
) O
ve
rla
p
wit
h
ma
p
po
sit
ion
All
ele
ra
tio
(0
.9
ho
mo
zyg
ou
s,
0.2
h
ete
rozyg
ou
s)
No
n-
syn
on
ym
ou
s
co
din
g
va
ria
nts
, s
pli
ce s
ites
Un
iqu
e
wh
en
c
om
pa
red
to
oth
er
ex
om
e
da
ta s
ets
Va
lid
ati
on
o
f c
od
ing
/
sp
lice
va
ria
nts
va
ria
nts
in
U
TR
s
54
13
(P
lps)
do
min
an
t/
cra
nio
facia
l
sp
onta
neo
us:
C5
7B
L/6
J,
12
9S
1/S
vIm
J
13
,453
3
,27
1
1,8
21
2
00
1
29
5
5
3
no
ne
3:
Kcn
ab
3,
Pig
s,
Accn
1
12
86
0 (
ne
rt)
recessiv
e/
cra
nio
facia
l
sp
onta
neo
us:
C5
7B
L/6
J
12
1,1
09
10
5,9
64
3
0,2
75
1
,44
1
63
9
94
3
n
on
e
4:
49
31
40
6P
16
Rik
, S
his
a7
, N
ipa
1,
Alp
k3
13
78
2 (
ap
hl)
re
cessiv
e/
skin
, ha
ri
sp
onta
neo
us:
MR
L/M
pJ
18
2,5
64
15
6,8
02
5
7,3
17
5
54
3
66
3
3
1
no
ne
4
: E
if2
ak3
, M
rpl3
5,
Usp
39
(2
)
62
46
(su
nk)
recessiv
e /
siz
e
sp
onta
neo
us:
A/J
1
64
,05
3 6
0,0
51
1
6,5
08
6
93
3
03
2
5
0
no
ne
n
on
e
34
85
(f
rg)
recessiv
e/
cra
nio
facia
l
sp
onta
neo
us:
C5
7B
L/6
J,
A/J
1
24
,05
4 1
05
,32
6 2
0,0
73
3
6
22
0
0
n
on
e
no
ne
45
07
(s
tn)
recessiv
e/c
ran
iofa
cia
l sp
onta
neo
us:
C5
7B
L/6
J
7,5
23
3
,07
9
2,3
38
1
3
7
0
0
no
ne
n
on
e
Additional file 1. Summary statistics for the alpha and beta exome probe pools. Additional file 2. Comparison of 2 x 76 bp datasets from four independent captures of female C56BL/6J DNA and one capture of male C57BL/6J compared to alpha data from one capture of male C57BL/6J. Additional file 3. Additional data on mutant exomes sequenced in this study. Genetic background, size of mapped intervals, genotype of sequenced sample and % SNVs identified are provided. Additional file 4. Data generated from exome sequencing of mutant and control exomes (2 x 40 bp, 2 x 76 Illumina or 2 x 100 HiSeq). Additional file 5. 17 variants passing filter in a C57BL/6J exome. The genome coordinate and gene annotation for each variant are provided. Comparison of these variants with the high throughput sequencing data for 17 inbred strains available from Sanger Mouse Genomes Project revealed 3 exonic SNVs that are likely unique to the C57BL/6J exome.
(a) (b)
Figure 1
(a) (b)
(c)
(d)
(e)
Figure 2
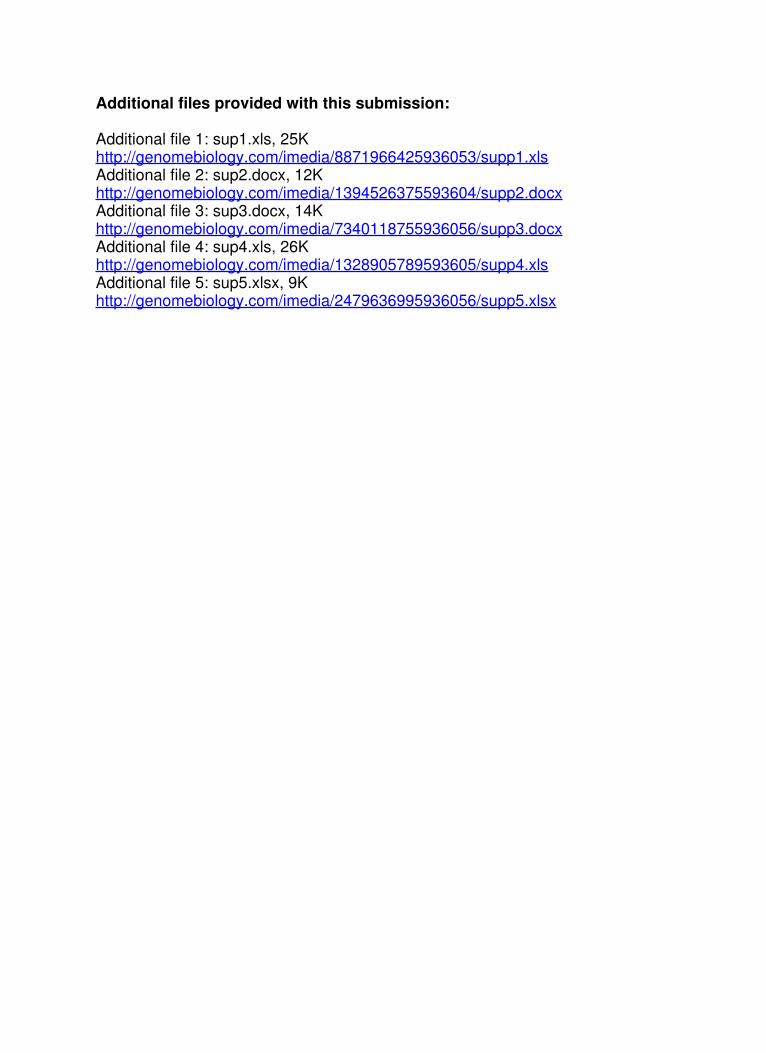
Additional files provided with this submission:
Additional file 1: sup1.xls, 25Khttp://genomebiology.com/imedia/8871966425936053/supp1.xlsAdditional file 2: sup2.docx, 12Khttp://genomebiology.com/imedia/1394526375593604/supp2.docxAdditional file 3: sup3.docx, 14Khttp://genomebiology.com/imedia/7340118755936056/supp3.docxAdditional file 4: sup4.xls, 26Khttp://genomebiology.com/imedia/1328905789593605/supp4.xlsAdditional file 5: sup5.xlsx, 9Khttp://genomebiology.com/imedia/2479636995936056/supp5.xlsx