Experimental evolution, genetic analysis and genome re-sequencing reveal the mutation conferring...
13
RESEARCH ARTICLE Open Access Experimental evolution, genetic analysis and genome re-sequencing reveal the mutation conferring artemisinin resistance in an isogenic lineage of malaria parasites Paul Hunt 1,2* , Axel Martinelli 1,3 , Katarzyna Modrzynska 1 , Sofia Borges 4 , Alison Creasey 1 , Louise Rodrigues 3 , Dario Beraldi 5,10 , Laurence Loewe 6 , Richard Fawcett 1 , Sujai Kumar 7 , Marian Thomson 7 , Urmi Trivedi 7 , Thomas D Otto 8 , Arnab Pain 8,9 , Mark Blaxter 5,7 , Pedro Cravo 3 Abstract Background: Classical and quantitative linkage analyses of genetic crosses have traditionally been used to map genes of interest, such as those conferring chloroquine or quinine resistance in malaria parasites. Next-generation sequencing technologies now present the possibility of determining genome-wide genetic variation at single base- pair resolution. Here, we combine in vivo experimental evolution, a rapid genetic strategy and whole genome re-sequencing to identify the precise genetic basis of artemisinin resistance in a lineage of the rodent malaria parasite, Plasmodium chabaudi. Such genetic markers will further the investigation of resistance and its control in natural infections of the human malaria, P. falciparum. Results: A lineage of isogenic in vivo drug-selected mutant P. chabaudi parasites was investigated. By measuring the artemisinin responses of these clones, the appearance of an in vivo artemisinin resistance phenotype within the lineage was defined. The underlying genetic locus was mapped to a region of chromosome 2 by Linkage Group Selection in two different genetic crosses. Whole-genome deep coverage short-read re-sequencing (Illumina® Solexa) defined the point mutations, insertions, deletions and copy-number variations arising in the lineage. Eight point mutations arise within the mutant lineage, only one of which appears on chromosome 2. This missense mutation arises contemporaneously with artemisinin resistance and maps to a gene encoding a de-ubiquitinating enzyme. Conclusions: This integrated approach facilitates the rapid identification of mutations conferring selectable phenotypes, without prior knowledge of biological and molecular mechanisms. For malaria, this model can identify candidate genes before resistant parasites are commonly observed in natural human malaria populations. Background The molecular basis of drug resistance in malaria para- sites and its evolution in time and space can be investi- gated, and possibly controlled, once the genes and specific mutations involved have been identified. How- ever, despite intense investigations of human malaria parasites, few mutations have been unambiguously linked to drug resistance phenotypes. The most direct evidence for novel genetic markers comes from classical genetic studies that require no prior knowledge regard- ing mode of action or resistance [1]. For example, link- age analysis of a genetic cross in Plasmodium falciparum identified the locus containing pfcrt [2,3], the determinant of chloroquine resistance. This facilitated the characterisation of selective sweeps [4] driven by the world-wide use of chloroquine, and generated insights into the molecular basis of resistance [5,6]. Genetic stu- dies have been extended to consider smaller gene * Correspondence: [email protected] 1 Institute for Immunology and Infection Research, School of Biological Sciences, University of Edinburgh, Edinburgh, UK Full list of author information is available at the end of the article Hunt et al. BMC Genomics 2010, 11:499 http://www.biomedcentral.com/1471-2164/11/499 © 2010 Hunt et al; licensee BioMed Central Ltd. This is an Open Access article distributed under the terms of the Creative Commons Attribution License (http://creativecommons.org/licenses/by/2.0), which permits unrestricted use, distribution, and reproduction in any medium, provided the original work is properly cited.
Transcript of Experimental evolution, genetic analysis and genome re-sequencing reveal the mutation conferring...
RESEARCH ARTICLE Open Access
Experimental evolution, genetic analysis andgenome re-sequencing reveal the mutationconferring artemisinin resistance in an isogeniclineage of malaria parasitesPaul Hunt1,2*, Axel Martinelli1,3, Katarzyna Modrzynska1, Sofia Borges4, Alison Creasey1, Louise Rodrigues3,Dario Beraldi5,10, Laurence Loewe6, Richard Fawcett1, Sujai Kumar7, Marian Thomson7, Urmi Trivedi7,Thomas D Otto8, Arnab Pain8,9, Mark Blaxter5,7, Pedro Cravo3
Abstract
Background: Classical and quantitative linkage analyses of genetic crosses have traditionally been used to mapgenes of interest, such as those conferring chloroquine or quinine resistance in malaria parasites. Next-generationsequencing technologies now present the possibility of determining genome-wide genetic variation at single base-pair resolution. Here, we combine in vivo experimental evolution, a rapid genetic strategy and whole genomere-sequencing to identify the precise genetic basis of artemisinin resistance in a lineage of the rodent malariaparasite, Plasmodium chabaudi. Such genetic markers will further the investigation of resistance and its control innatural infections of the human malaria, P. falciparum.
Results: A lineage of isogenic in vivo drug-selected mutant P. chabaudi parasites was investigated. By measuringthe artemisinin responses of these clones, the appearance of an in vivo artemisinin resistance phenotype within thelineage was defined. The underlying genetic locus was mapped to a region of chromosome 2 by Linkage GroupSelection in two different genetic crosses. Whole-genome deep coverage short-read re-sequencing (Illumina®Solexa) defined the point mutations, insertions, deletions and copy-number variations arising in the lineage. Eightpoint mutations arise within the mutant lineage, only one of which appears on chromosome 2. This missensemutation arises contemporaneously with artemisinin resistance and maps to a gene encoding a de-ubiquitinatingenzyme.
Conclusions: This integrated approach facilitates the rapid identification of mutations conferring selectablephenotypes, without prior knowledge of biological and molecular mechanisms. For malaria, this model can identifycandidate genes before resistant parasites are commonly observed in natural human malaria populations.
BackgroundThe molecular basis of drug resistance in malaria para-sites and its evolution in time and space can be investi-gated, and possibly controlled, once the genes andspecific mutations involved have been identified. How-ever, despite intense investigations of human malariaparasites, few mutations have been unambiguously
linked to drug resistance phenotypes. The most directevidence for novel genetic markers comes from classicalgenetic studies that require no prior knowledge regard-ing mode of action or resistance [1]. For example, link-age analysis of a genetic cross in Plasmodiumfalciparum identified the locus containing pfcrt [2,3], thedeterminant of chloroquine resistance. This facilitatedthe characterisation of selective sweeps [4] driven by theworld-wide use of chloroquine, and generated insightsinto the molecular basis of resistance [5,6]. Genetic stu-dies have been extended to consider smaller gene
* Correspondence: [email protected] for Immunology and Infection Research, School of BiologicalSciences, University of Edinburgh, Edinburgh, UKFull list of author information is available at the end of the article
Hunt et al. BMC Genomics 2010, 11:499http://www.biomedcentral.com/1471-2164/11/499
© 2010 Hunt et al; licensee BioMed Central Ltd. This is an Open Access article distributed under the terms of the Creative CommonsAttribution License (http://creativecommons.org/licenses/by/2.0), which permits unrestricted use, distribution, and reproduction inany medium, provided the original work is properly cited.
effects, such as those underlying quinine susceptibility,by quantitative trait loci analysis [7]. However, there areexperimental and ethical factors that constrain the useof P. falciparum for genetic studies. For example, it hassometimes proved difficult to generate drug-resistant P.falciparum mutant clones in vitro [8] and in these casesit has been necessary to await the appearance of resis-tant parasites in field samples. Also, although threegenetic crosses between P. falciparum parasites havebeen performed and analysed [9-11] for genes involvedin drug resistance or erythrocyte invasion, these requireprimate hosts and are therefore expensive and demandstringent ethical approval. Fortunately, the experimentaltractability of the rodent malaria P. chabaudi presents anumber of advantages, as follows.Experimental evolution of the rodent malaria P. cha-
baudi [12] previously produced an isogenic lineage
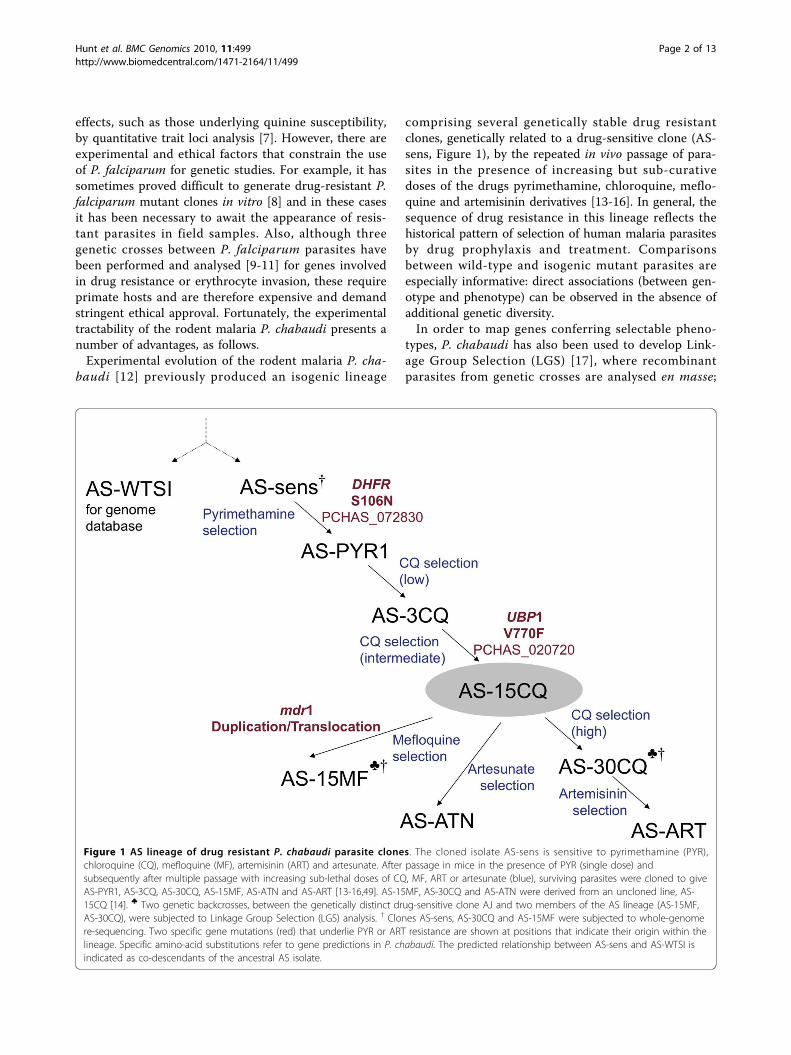
comprising several genetically stable drug resistantclones, genetically related to a drug-sensitive clone (AS-sens, Figure 1), by the repeated in vivo passage of para-sites in the presence of increasing but sub-curativedoses of the drugs pyrimethamine, chloroquine, meflo-quine and artemisinin derivatives [13-16]. In general, thesequence of drug resistance in this lineage reflects thehistorical pattern of selection of human malaria parasitesby drug prophylaxis and treatment. Comparisonsbetween wild-type and isogenic mutant parasites areespecially informative: direct associations (between gen-otype and phenotype) can be observed in the absence ofadditional genetic diversity.In order to map genes conferring selectable pheno-
types, P. chabaudi has also been used to develop Link-age Group Selection (LGS) [17], where recombinantparasites from genetic crosses are analysed en masse;
Figure 1 AS lineage of drug resistant P. chabaudi parasite clones. The cloned isolate AS-sens is sensitive to pyrimethamine (PYR),chloroquine (CQ), mefloquine (MF), artemisinin (ART) and artesunate. After passage in mice in the presence of PYR (single dose) andsubsequently after multiple passage with increasing sub-lethal doses of CQ, MF, ART or artesunate (blue), surviving parasites were cloned to giveAS-PYR1, AS-3CQ, AS-30CQ, AS-15MF, AS-ATN and AS-ART [13-16,49]. AS-15MF, AS-30CQ and AS-ATN were derived from an uncloned line, AS-15CQ [14]. ♣ Two genetic backcrosses, between the genetically distinct drug-sensitive clone AJ and two members of the AS lineage (AS-15MF,AS-30CQ), were subjected to Linkage Group Selection (LGS) analysis. † Clones AS-sens, AS-30CQ and AS-15MF were subjected to whole-genomere-sequencing. Two specific gene mutations (red) that underlie PYR or ART resistance are shown at positions that indicate their origin within thelineage. Specific amino-acid substitutions refer to gene predictions in P. chabaudi. The predicted relationship between AS-sens and AS-WTSI isindicated as co-descendants of the ancestral AS isolate.
Hunt et al. BMC Genomics 2010, 11:499http://www.biomedcentral.com/1471-2164/11/499
Page 2 of 13

i.e. without the need to investigate the genotypes andphenotypes of individually cloned recombinant parasites.LGS scans the genome for ‘selection valleys’; regions ofselection where the proportion of alleles from a drug-sensitive parent are reduced in the uncloned drug-trea-ted progeny of a genetic cross, relative to those in anuntreated population. This approach has been used tomap genes underlying pyrimethamine resistance [18]and strain-specific immunity [19,20] in P. chabaudi, andgrowth rate in P. yoelii [21].Now, the advent of next-generation sequencing tech-
nology [22] makes possible whole-genome re-sequencingof mutant clones [23,24]. Because an annotated P. cha-baudi AS-sens whole-genome assembly has recentlybeen made available [25], a comprehensive whole gen-ome re-sequencing of clones of the AS-lineage (Figure1) will define all of the genetic variation arising withinthe lineage, identify mutations in selection valleys and,thereby, advance our understanding of the relationshipsbetween genetic mutation, drug response and selection.This paper integrates these evolutionary, genetic and
genomic approaches to specify the specific mutationunderlying in vivo resistance to artemisinin. We demon-strate the evolution of artemisinin resistance in theP. chabaudi AS lineage, use LGS to map an underlyinggene in two independent genetic crosses and re-sequence the complete genomes of the wild-type ASparasite and two artemisinin resistant mutants. We con-clude that a single point mutation in the gene ubp1,encoding a de-ubiquitinating enzyme, confers artemisi-nin resistance in this P. chabaudi lineage.
ResultsExperimental evolution of artemisinin resistance inP. chabaudiThe strategy presented here exploits a comprehensivelineage of genetically related parasites (Figure 1),
comprising drug-resistant mutants previously generated[13-16] by the sequential passage of parasites in micetreated with individual drugs (including artemisinin andartesunate) and the intermittent fixation of mutations bycloning. We determined the artemisinin responses ofthe genetically distinct cloned isolate AJ, and sevenclones of the AS lineage when grown in vivo in mice(Figure 2). AS-sens, AS-PYR1, AS-3CQ and AJ all failedto establish detectable parasitaemias after ART treat-ment (100 mg kg-1 for 3 days) whereas AS-30CQ, AS-15MF, and AS-ART gave detectable parasitaemias onday 8 or 9 post infection and peak parasitaemias ofabout 20% at some point between days 12 to 15. AS-ATN gave detectable parasitaemias on day 12, peakingat 10% during days 16 to 17. AJ, AS-sens, AS-PYR-1and AS-3CQ were deemed artemisinin-sensitive becauseno parasites were detected at any time during post-treatment follow-up. Conversely, because artemisinintreatment failed for AS-30CQ, AS-15MF, AS-ART andAS-ATN, these parasites were classified as artemisinin-resistant. It was therefore predicted that mutations con-ferring artemisinin resistance were selected between AS-3CQ and AS-30CQ, AS-ATN or AS-15MF; interestingly,before parasites were ever exposed to artemisinin deriva-tives. AS-30CQ parasites had only been exposed to pyri-methamine and chloroquine, while AS-15MF had alsobeen exposed to mefloquine. These data suggest thatthe gene mutations underlying artemisinin resistancemay have pleiotropic effects. For example they mayaffect responses to other drugs such as chloroquine andmefloquine.
Whole-genome genetic analysis of artemisinin resistanceIn order to map the genetic loci underlying artemisininresistance, we analysed genetic crosses between eitherAS-30CQ (or AS-15MF) (both resistant parasites) andthe genetically distinct drug-sensitive cloned isolate AJ,
Figure 2 Artemisinin resistance phenotype. Artemisinin responses of four resistant and three susceptible AS clones (Figure 1) and AJ, mean of3 mice. AS-30CQ, AS-ART, AS-ATN and AS-15MF showed artemisinin resistance. AS-3CQ, AS-PYR1, AS-sens and AJ are sensitive.
Hunt et al. BMC Genomics 2010, 11:499http://www.biomedcentral.com/1471-2164/11/499
Page 3 of 13

using LGS. The uncloned progeny of a genetic backcross(see Methods) between AS-30CQ and AJ (AS-30CQ ×AJ) were treated with artemisinin (100 mg kg-1, 3 days).A genome-wide library of ~100 pyrosequencing assays[26] was then used to measure the proportions of AJand AS alleles (single nucleotide polymorphisms, SNPs)at pre-mapped loci dispersed across the genome (Addi-tional File 1) in both the drug-treated and the untreatedpopulations. A single dominant selection valley was
obtained on chr02 (Figure 3A). For instance, the AJallele of the pcpf01-0197 marker here was reduced from92.1% in the untreated population to 10.1% in the drug-treated population as shown in a detailed profile ofselection on chr02 (Figure 3B). Except for loci on chr02,the proportions of AJ alleles of most markers in boththe selected and unselected populations of parasiteswere generally high, possibly reflecting the predomi-nance of AJ alleles in the backcross, the small
Figure 3 Artemisinin resistance genetics. A, Genome-wide scans of LGS of AS-30CQ × AJ backcross (under ART treatment) with quantitationof parental alleles by pyrosequencing [26]. Comparative Index (AJ) is the proportion of alleles in the population from sensitive parent AJ, afterdrug-selection, relative to the proportion measured in untreated hosts. Absence of selection would be represented by a Comparative Index of 1.Genome position indicates the mapped position (kb) of ~90 markers in the genome of P. chabaudi (Additional File 1). Data points (open greensquares) are each mean of 3 independent determinations. Horizontal line (blue) indicates the threshold for rejecting null hypothesis in simulationanalysis (p < 0.05, Additional File 2). Positions of mutations appearing in both AS-30CQ and AS-15MF as defined by Solexa genome re-sequencing are indicated at the bottom (x = point mutation; circle = indel). Note one sole point mutation on chr02 (ubp1) and one pointmutation on chr07 (dhfr). Chromosome numbers are indicated (top). B, Position of ART-selection valley on chr02 as determined from twoindependent LGS scans of two genetic crosses (AS-30CQ × AJ, red; AS-15MF, × AJ blue) and the position of the mutated gene (ubp1,PCHAS_020720, green arrow). Pyrosequencing assays shown for whole chromosome (pcpfxx-yyyy, denotes P. chabaudi-specific assays at locihomologous to P. falciparum chrxx, location yyyy Kbp).
Hunt et al. BMC Genomics 2010, 11:499http://www.biomedcentral.com/1471-2164/11/499
Page 4 of 13
proportion of parental AJ genotypes (drug-sensitive)and/or the existence of many AJ loci contributing smallfitness effects in this experimental system. Factors suchas these render the selection of AS alleles on chr02 evenmore striking.Because apparent genetic associations can arise bychance, we used two statistical approaches to test thesignificance of this selection valley (Methods, AdditionalFile 2). Firstly, the deepest selection valley from each of500 simulations (Additional File 3) of the experimentaldesign were used to estimate the probability (nullhypothesis) that the depth of an observed selection val-ley was the result of random processes working in com-bination with selection at minor loci for resistance (p-value for no major gene = 0.026, Figure 3A, AdditionalFiles 4, 5). Secondly, the non-parametric Mann-WhitneyU-test was used to evaluate the probability that theallele frequency observed under drugs is significantlydifferent from the random scatter of allele frequenciesobserved in the absence of drugs. The stringency of thestatistical analysis was increased incrementally by redu-cing the AJ allele frequencies (AF-reduction) inuntreated parasites (p < 0.001 at 50% AF-reduction,Additional File 6). Even so, the Mann-Whitney U-testunderestimates the significance of the chr02 selectionvalley because the selection valley extended beyond the5 consecutive loci used to compute significance (7 linkedassays gave low AJ proportions, 4 of which give p <0.05). Also, chr02 was the most dominant selection val-ley when a different genetic cross (AS-15MF × AJ) wasselected with 100 mg kg-1 ART (data not shown) andthe profile of selection on chr02 was similar to that ofthe AS-30CQ × AJ cross (Figure 3B). In this case, theAJ frequency of marker pcpf01-0197 was reduced from54.2% to 1.0% (Mann-Whitney, p < 0.001 at 25%AF-reduction).
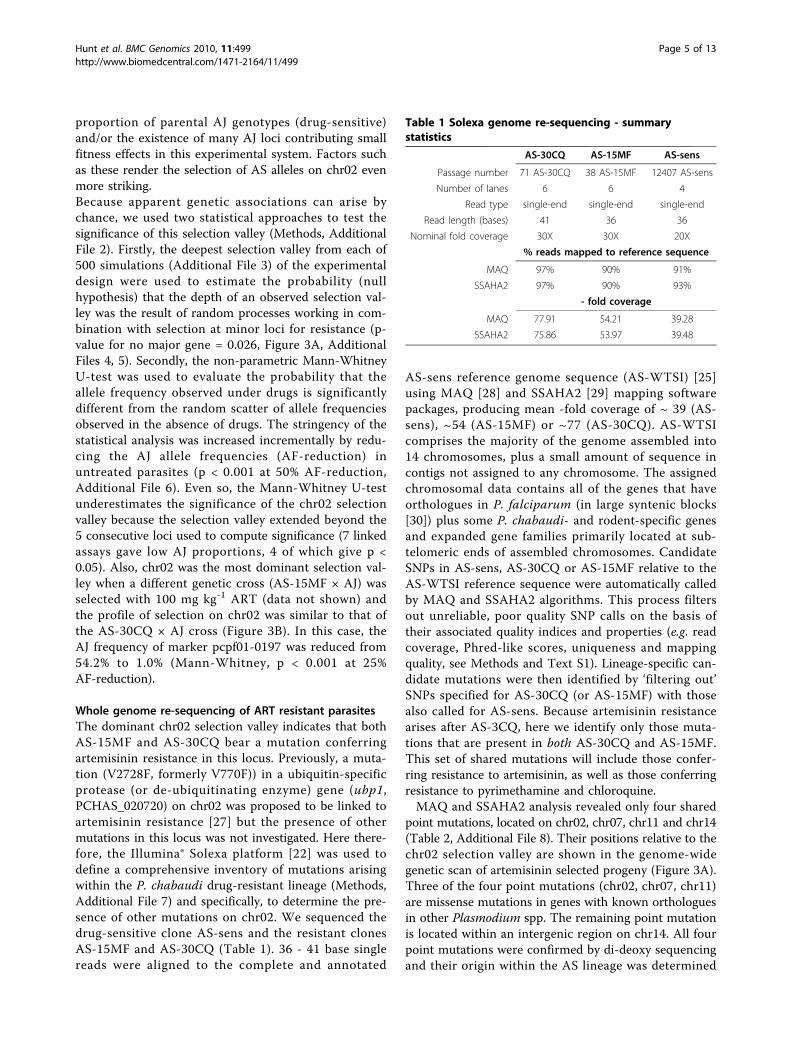
Whole genome re-sequencing of ART resistant parasitesThe dominant chr02 selection valley indicates that bothAS-15MF and AS-30CQ bear a mutation conferringartemisinin resistance in this locus. Previously, a muta-tion (V2728F, formerly V770F)) in a ubiquitin-specificprotease (or de-ubiquitinating enzyme) gene (ubp1,PCHAS_020720) on chr02 was proposed to be linked toartemisinin resistance [27] but the presence of othermutations in this locus was not investigated. Here there-fore, the Illumina® Solexa platform [22] was used todefine a comprehensive inventory of mutations arisingwithin the P. chabaudi drug-resistant lineage (Methods,Additional File 7) and specifically, to determine the pre-sence of other mutations on chr02. We sequenced thedrug-sensitive clone AS-sens and the resistant clonesAS-15MF and AS-30CQ (Table 1). 36 - 41 base singlereads were aligned to the complete and annotated
AS-sens reference genome sequence (AS-WTSI) [25]using MAQ [28] and SSAHA2 [29] mapping softwarepackages, producing mean -fold coverage of ~ 39 (AS-sens), ~54 (AS-15MF) or ~77 (AS-30CQ). AS-WTSIcomprises the majority of the genome assembled into14 chromosomes, plus a small amount of sequence incontigs not assigned to any chromosome. The assignedchromosomal data contains all of the genes that haveorthologues in P. falciparum (in large syntenic blocks[30]) plus some P. chabaudi- and rodent-specific genesand expanded gene families primarily located at sub-telomeric ends of assembled chromosomes. CandidateSNPs in AS-sens, AS-30CQ or AS-15MF relative to theAS-WTSI reference sequence were automatically calledby MAQ and SSAHA2 algorithms. This process filtersout unreliable, poor quality SNP calls on the basis oftheir associated quality indices and properties (e.g. readcoverage, Phred-like scores, uniqueness and mappingquality, see Methods and Text S1). Lineage-specific can-didate mutations were then identified by ‘filtering out’SNPs specified for AS-30CQ (or AS-15MF) with thosealso called for AS-sens. Because artemisinin resistancearises after AS-3CQ, here we identify only those muta-tions that are present in both AS-30CQ and AS-15MF.This set of shared mutations will include those confer-ring resistance to artemisinin, as well as those conferringresistance to pyrimethamine and chloroquine.MAQ and SSAHA2 analysis revealed only four shared
point mutations, located on chr02, chr07, chr11 and chr14(Table 2, Additional File 8). Their positions relative to thechr02 selection valley are shown in the genome-widegenetic scan of artemisinin selected progeny (Figure 3A).Three of the four point mutations (chr02, chr07, chr11)are missense mutations in genes with known orthologuesin other Plasmodium spp. The remaining point mutationis located within an intergenic region on chr14. All fourpoint mutations were confirmed by di-deoxy sequencingand their origin within the AS lineage was determined
Table 1 Solexa genome re-sequencing - summarystatistics
AS-30CQ AS-15MF AS-sens
Passage number 71 AS-30CQ 38 AS-15MF 12407 AS-sens
Number of lanes 6 6 4
Read type single-end single-end single-end
Read length (bases) 41 36 36
Nominal fold coverage 30X 30X 20X
% reads mapped to reference sequence
MAQ 97% 90% 91%
SSAHA2 97% 90% 93%
- fold coverage
MAQ 77.91 54.21 39.28
SSAHA2 75.86 53.97 39.48
Hunt et al. BMC Genomics 2010, 11:499http://www.biomedcentral.com/1471-2164/11/499
Page 5 of 13
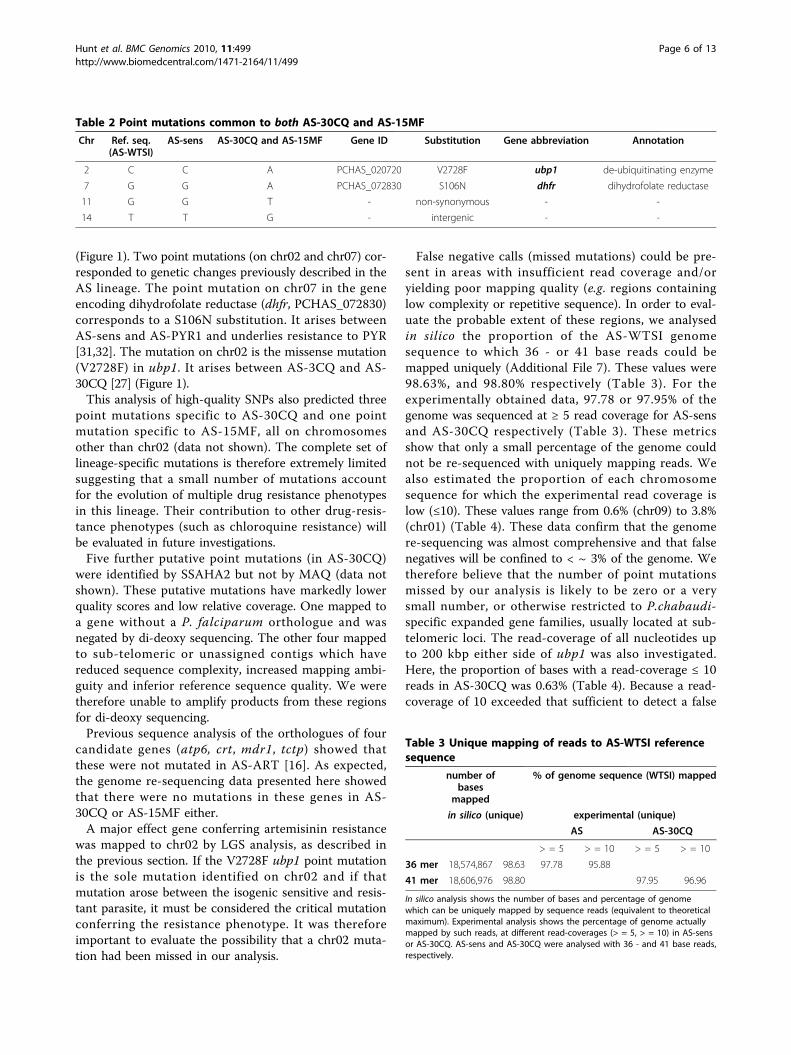
(Figure 1). Two point mutations (on chr02 and chr07) cor-responded to genetic changes previously described in theAS lineage. The point mutation on chr07 in the geneencoding dihydrofolate reductase (dhfr, PCHAS_072830)corresponds to a S106N substitution. It arises betweenAS-sens and AS-PYR1 and underlies resistance to PYR[31,32]. The mutation on chr02 is the missense mutation(V2728F) in ubp1. It arises between AS-3CQ and AS-30CQ [27] (Figure 1).This analysis of high-quality SNPs also predicted three
point mutations specific to AS-30CQ and one pointmutation specific to AS-15MF, all on chromosomesother than chr02 (data not shown). The complete set oflineage-specific mutations is therefore extremely limitedsuggesting that a small number of mutations accountfor the evolution of multiple drug resistance phenotypesin this lineage. Their contribution to other drug-resis-tance phenotypes (such as chloroquine resistance) willbe evaluated in future investigations.Five further putative point mutations (in AS-30CQ)
were identified by SSAHA2 but not by MAQ (data notshown). These putative mutations have markedly lowerquality scores and low relative coverage. One mapped toa gene without a P. falciparum orthologue and wasnegated by di-deoxy sequencing. The other four mappedto sub-telomeric or unassigned contigs which havereduced sequence complexity, increased mapping ambi-guity and inferior reference sequence quality. We weretherefore unable to amplify products from these regionsfor di-deoxy sequencing.Previous sequence analysis of the orthologues of four
candidate genes (atp6, crt, mdr1, tctp) showed thatthese were not mutated in AS-ART [16]. As expected,the genome re-sequencing data presented here showedthat there were no mutations in these genes in AS-30CQ or AS-15MF either.A major effect gene conferring artemisinin resistance
was mapped to chr02 by LGS analysis, as described inthe previous section. If the V2728F ubp1 point mutationis the sole mutation identified on chr02 and if thatmutation arose between the isogenic sensitive and resis-tant parasite, it must be considered the critical mutationconferring the resistance phenotype. It was thereforeimportant to evaluate the possibility that a chr02 muta-tion had been missed in our analysis.
False negative calls (missed mutations) could be pre-sent in areas with insufficient read coverage and/oryielding poor mapping quality (e.g. regions containinglow complexity or repetitive sequence). In order to eval-uate the probable extent of these regions, we analysedin silico the proportion of the AS-WTSI genomesequence to which 36 - or 41 base reads could bemapped uniquely (Additional File 7). These values were98.63%, and 98.80% respectively (Table 3). For theexperimentally obtained data, 97.78 or 97.95% of thegenome was sequenced at ≥ 5 read coverage for AS-sensand AS-30CQ respectively (Table 3). These metricsshow that only a small percentage of the genome couldnot be re-sequenced with uniquely mapping reads. Wealso estimated the proportion of each chromosomesequence for which the experimental read coverage islow (≤10). These values range from 0.6% (chr09) to 3.8%(chr01) (Table 4). These data confirm that the genomere-sequencing was almost comprehensive and that falsenegatives will be confined to < ~ 3% of the genome. Wetherefore believe that the number of point mutationsmissed by our analysis is likely to be zero or a verysmall number, or otherwise restricted to P.chabaudi-specific expanded gene families, usually located at sub-telomeric loci. The read-coverage of all nucleotides upto 200 kbp either side of ubp1 was also investigated.Here, the proportion of bases with a read-coverage ≤ 10reads in AS-30CQ was 0.63% (Table 4). Because a read-coverage of 10 exceeded that sufficient to detect a false
Table 2 Point mutations common to both AS-30CQ and AS-15MF
Chr Ref. seq.(AS-WTSI)
AS-sens AS-30CQ and AS-15MF Gene ID Substitution Gene abbreviation Annotation
2 C C A PCHAS_020720 V2728F ubp1 de-ubiquitinating enzyme
7 G G A PCHAS_072830 S106N dhfr dihydrofolate reductase
11 G G T - non-synonymous - -
14 T T G - intergenic - -
Table 3 Unique mapping of reads to AS-WTSI referencesequence
number ofbases
mapped
% of genome sequence (WTSI) mapped
in silico (unique) experimental (unique)
AS AS-30CQ
> = 5 > = 10 > = 5 > = 10
36 mer 18,574,867 98.63 97.78 95.88
41 mer 18,606,976 98.80 97.95 96.96
In silico analysis shows the number of bases and percentage of genomewhich can be uniquely mapped by sequence reads (equivalent to theoreticalmaximum). Experimental analysis shows the percentage of genome actuallymapped by such reads, at different read-coverages (> = 5, > = 10) in AS-sensor AS-30CQ. AS-sens and AS-30CQ were analysed with 36 - and 41 base reads,respectively.
Hunt et al. BMC Genomics 2010, 11:499http://www.biomedcentral.com/1471-2164/11/499
Page 6 of 13
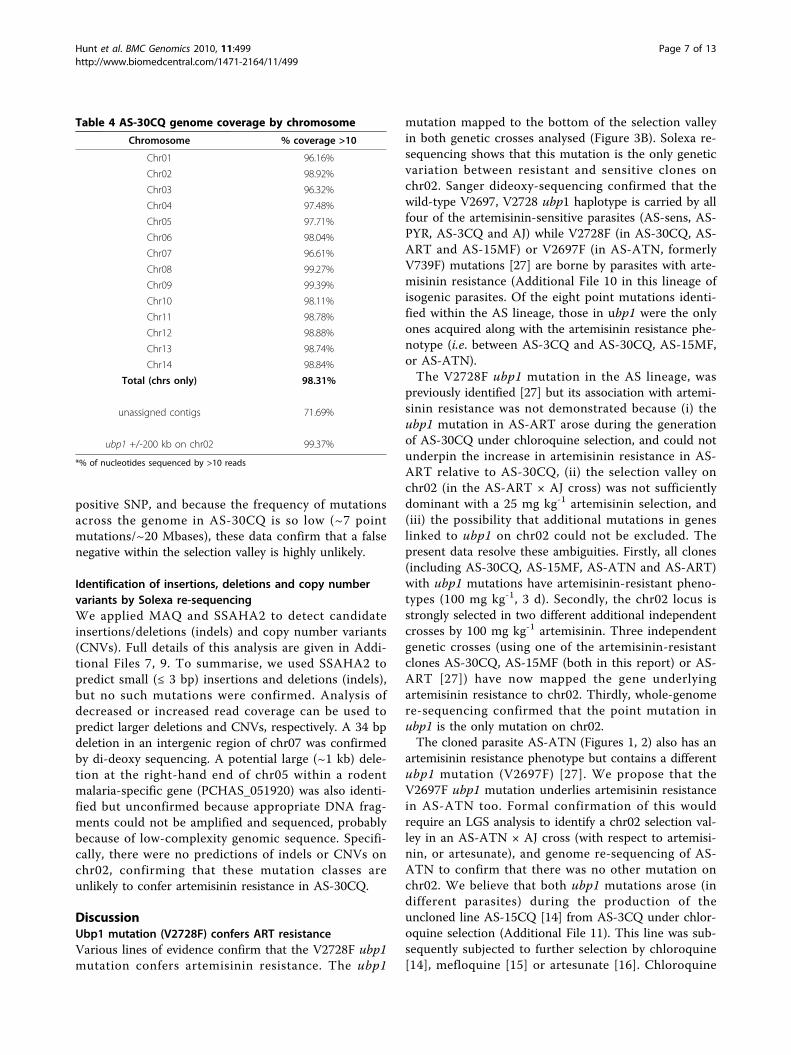
positive SNP, and because the frequency of mutationsacross the genome in AS-30CQ is so low (~7 pointmutations/~20 Mbases), these data confirm that a falsenegative within the selection valley is highly unlikely.
Identification of insertions, deletions and copy numbervariants by Solexa re-sequencingWe applied MAQ and SSAHA2 to detect candidateinsertions/deletions (indels) and copy number variants(CNVs). Full details of this analysis are given in Addi-tional Files 7, 9. To summarise, we used SSAHA2 topredict small (≤ 3 bp) insertions and deletions (indels),but no such mutations were confirmed. Analysis ofdecreased or increased read coverage can be used topredict larger deletions and CNVs, respectively. A 34 bpdeletion in an intergenic region of chr07 was confirmedby di-deoxy sequencing. A potential large (~1 kb) dele-tion at the right-hand end of chr05 within a rodentmalaria-specific gene (PCHAS_051920) was also identi-fied but unconfirmed because appropriate DNA frag-ments could not be amplified and sequenced, probablybecause of low-complexity genomic sequence. Specifi-cally, there were no predictions of indels or CNVs onchr02, confirming that these mutation classes areunlikely to confer artemisinin resistance in AS-30CQ.
DiscussionUbp1 mutation (V2728F) confers ART resistanceVarious lines of evidence confirm that the V2728F ubp1mutation confers artemisinin resistance. The ubp1
mutation mapped to the bottom of the selection valleyin both genetic crosses analysed (Figure 3B). Solexa re-sequencing shows that this mutation is the only geneticvariation between resistant and sensitive clones onchr02. Sanger dideoxy-sequencing confirmed that thewild-type V2697, V2728 ubp1 haplotype is carried by allfour of the artemisinin-sensitive parasites (AS-sens, AS-PYR, AS-3CQ and AJ) while V2728F (in AS-30CQ, AS-ART and AS-15MF) or V2697F (in AS-ATN, formerlyV739F) mutations [27] are borne by parasites with arte-misinin resistance (Additional File 10 in this lineage ofisogenic parasites. Of the eight point mutations identi-fied within the AS lineage, those in ubp1 were the onlyones acquired along with the artemisinin resistance phe-notype (i.e. between AS-3CQ and AS-30CQ, AS-15MF,or AS-ATN).The V2728F ubp1 mutation in the AS lineage, was
previously identified [27] but its association with artemi-sinin resistance was not demonstrated because (i) theubp1 mutation in AS-ART arose during the generationof AS-30CQ under chloroquine selection, and could notunderpin the increase in artemisinin resistance in AS-ART relative to AS-30CQ, (ii) the selection valley onchr02 (in the AS-ART × AJ cross) was not sufficientlydominant with a 25 mg kg-1 artemisinin selection, and(iii) the possibility that additional mutations in geneslinked to ubp1 on chr02 could not be excluded. Thepresent data resolve these ambiguities. Firstly, all clones(including AS-30CQ, AS-15MF, AS-ATN and AS-ART)with ubp1 mutations have artemisinin-resistant pheno-types (100 mg kg-1, 3 d). Secondly, the chr02 locus isstrongly selected in two different additional independentcrosses by 100 mg kg-1 artemisinin. Three independentgenetic crosses (using one of the artemisinin-resistantclones AS-30CQ, AS-15MF (both in this report) or AS-ART [27]) have now mapped the gene underlyingartemisinin resistance to chr02. Thirdly, whole-genomere-sequencing confirmed that the point mutation inubp1 is the only mutation on chr02.The cloned parasite AS-ATN (Figures 1, 2) also has an
artemisinin resistance phenotype but contains a differentubp1 mutation (V2697F) [27]. We propose that theV2697F ubp1 mutation underlies artemisinin resistancein AS-ATN too. Formal confirmation of this wouldrequire an LGS analysis to identify a chr02 selection val-ley in an AS-ATN × AJ cross (with respect to artemisi-nin, or artesunate), and genome re-sequencing of AS-ATN to confirm that there was no other mutation onchr02. We believe that both ubp1 mutations arose (indifferent parasites) during the production of theuncloned line AS-15CQ [14] from AS-3CQ under chlor-oquine selection (Additional File 11). This line was sub-sequently subjected to further selection by chloroquine[14], mefloquine [15] or artesunate [16]. Chloroquine
Table 4 AS-30CQ genome coverage by chromosome
Chromosome % coverage >10
Chr01 96.16%
Chr02 98.92%
Chr03 96.32%
Chr04 97.48%
Chr05 97.71%
Chr06 98.04%
Chr07 96.61%
Chr08 99.27%
Chr09 99.39%
Chr10 98.11%
Chr11 98.78%
Chr12 98.88%
Chr13 98.74%
Chr14 98.84%
Total (chrs only) 98.31%
unassigned contigs 71.69%
ubp1 +/-200 kb on chr02 99.37%
*% of nucleotides sequenced by >10 reads
Hunt et al. BMC Genomics 2010, 11:499http://www.biomedcentral.com/1471-2164/11/499
Page 7 of 13

and mefloquine are thought to have selected (to fixation,or near fixation) V2728F ubp1 parasites, while artesu-nate is thought to have selected V2697F ubp1 parasites.A full discussion of these issues is included elsewhere(Additional File 11)The structural consequences of the V2728F ubp1
mutation in AS-30CQ (and V2697F ubp1 in AS-ATN)were predicted to be a reduction in de-ubiquitinatingactivity [27]. This would increase the proportion of ubi-quitinated substrate, which may be destined for degrada-tion through the 26 S proteasome. We suggest thatreduced parasite susceptibility to artemisinin mayinvolve increased turnover or altered trafficking of aspecific protein or class of proteins (such as membranetransporters like MDR1, regulators of cell cycle etc.), ornon-specific effects such as a general increased turnoverof proteins damaged by oxidative stress
The model - its generality, application and futuredevelopmentThe experimental integration of mutant selection,genetic linkage analysis using LGS, and genome re-sequencing is a powerful framework for the elucidationof genetic determinants without prior knowledge of theunderlying biology of the phenotype. The model exploitsthe co-incidence between genetically defined selectionvalleys and isolated mutations identified by deep gen-ome re-sequencing. Importantly, it may also confirm thelack of dominant contributions from additional geneselsewhere in the genome. The approach complementsreverse genetic validation (transfection) of gene candi-dates which may be restricted to limited numbers ofpre-defined genes and gene mutations (allelic replace-ments). Unfortunately, a well-developed transfectionsystem is currently not available in P. chabaudi.The approach is applicable to many recombining
organisms for which genome sequence data and experi-mentally tractable selectable phenotypes are available. InP. falciparum, there remain difficulties in reliably gener-ating genetically stable drug-resistant mutants and thepracticality of performing genetic crosses [12]. Neverthe-less, the approach described here may find applicationsin the study of human malaria. For example, a whole-genome tiling array was used to identify a large amplifi-cation event in an in vitro selected fosmidomycin-resis-tant P. falciparum mutant clone [33]. The amplifiedfragment included the gene encoding 1-deoxy-D-xylu-lose-5-phosphate reductoisomerase, the putative targetof fosmidomycin. Deep re-sequencing technologies canadd further resolution to such investigations. Impor-tantly, in addition, genetic analyses such as LGS alsomap the functional relationship between gene locus andphenotype; critical when elucidating resistance to drugsfor which the mode of action is not well understood.
Pyrosequencing assays were used here to estimate theproportions of AS and AJ parental alleles and to detectloci under selection. However, we envisage the futureexploitation of deep short-read sequencing to rapidlydefine and quantitate parental SNPs in pooled recombi-nant parasites (from genetic crosses) before and afterselection. We expect this to improve the detection andresolution of selection valleys in LGS experiments. Itwill also avoid the time required to develop pre-mappedquantitative parental markers, and permit the use of agreater range of species and strains.
The genetic basis of multi-drug resistanceThe comprehensive genome re-sequencing describedhere identified a small number of (mainly non-synon-ymous) mutations arising in the drug-resistance lineageof P. chabaudi. These data suggest that complex multi-drug resistant phenotypes evolved with the accumula-tion of a relatively small number of mutations, contraryto some previous speculations [14]. The question arises:are all of these mutations selected (to fixation or nearfixation) by drugs, or are some mutations neutral andrandomly fixed during cloning by stochastic processes?Future studies will address this question and evaluatethe extent to which ubp1 and other mutations affect theresponses of these parasites to other drugs such aschloroquine.
Public health implicationsThe prediction of genes involved in drug resistance phe-notypes has important public health implications, espe-cially when candidate markers are proposed beforeresistance is commonly observed in the field, as is thecase for the current study. For example, moleculargenetic markers of resistance are required to monitorstrategies used to contain the spread of resistant para-sites. At present, we are vulnerable to the evolution ofartemisinin resistance. Indeed, although artemisinincombination therapies continue to be widely effective,there have been a number of recent reports document-ing reduced susceptibilities of malaria parasites to arte-misinin derivatives in vivo and in vitro, especially inparts of South-east Asia, such as Western Cambodia[34-36]. Although genes such as the multi-drug resis-tance locus, mdr1 [37,38], or pfatp6 [39], encoding anATP-ase (SERCA-type), have been proposed to contri-bute to artemisinin resistance, either these markers haveyet to be confirmed or it is generally believed that theymediate small effects or reflect responses to the non-artemisinin partner drug [40,41]. At present therefore,there are no generally accepted validated markers forartemisinin resistance-mediated treatment failure.The ubp1 mutations are the first genetic determinants
to be shown to underlie a distinct change in in vivo
Hunt et al. BMC Genomics 2010, 11:499http://www.biomedcentral.com/1471-2164/11/499
Page 8 of 13
artemisinin responses. The relevance of mutations orpolymorphisms in the ubp1 orthologue (PFA0220w onP. falciparum chr01) to in vivo and in vitro artemisininresponses of P. falciparum parasites can now beaddressed by characterising natural infections and bytransfection studies in the laboratory. For example, arecent study of parasites from Western Cambodia [42]showed that there were no corresponding mutations inubp1 in artemisinin-resistant P. falciparum parasites.The data presented here show that, in P. chabaudi, a
single point mutation confers a distinct shift in artemisi-nin responses. However, whether further mutations inubp1 or other genes may confer additional shifts in arte-misinin response is still uncertain. These possibilitiescan be addressed by the generation of multiple indepen-dently selected resistant clones of P. chabaudi, or byselecting mutants with higher levels of resistance.Interestingly, artemisinin-resistance and V2728F ubp1
mutations arose in the P. chabaudi isogenic lineagebefore the parasites were exposed to artemisinin itself.Thus, ubp1 mutations may prove to play a role inmulti-drug resistance, as is the case for mdr1 [43].These relationships are the subject of ongoing investiga-tions. Although a distinct change in artemisininresponse is described here, observations that in vitroIC50s of artemisinin derivatives in P. falciparum areoften correlated with those of structurally unrelatedaminoquinolines [44-46] may indicate that similar pro-cesses occur in human malaria parasites.The identification of ubp1 mutations will augment our
understanding of artemisinin-resistance mechanisms byopening up new experimental approaches, such as theidentification of proteins interacting with ubp1. Thismay clarify whether artemisinin resistance is mediatedby the modulation of pre-existing drug resistancemechanisms or by interference with the pathway of arte-misinin action.Combination therapies have been proposed to reduce
the probability of selecting (multi-) resistant parasites[47,48]. This rationale depends upon choosing compo-nent drugs with different mechanisms of resistance, andupon the absence of pre-existing resistance to one (orboth) components. The future choice of optimal combi-nations may be guided by knowledge delivered using apredictive model such as that presented here.
ConclusionExperimental evolution of drug resistance, a genome-wide genetic linkage analysis (LGS) and whole genomedeep re-sequencing have been used to define the muta-tion conferring artemisinin resistance in the malariaparasite, P. chabaudi. This system can be used for therapid identification of candidate genetic markers of invivo drug resistance, before resistance arises in the field.
These data may be used to monitor, understand andprevent the evolution of drug resistance in the field andto choose component drugs in combination treatmentsdesigned to maximise drug longevity.
MethodsParasite lines, maintenance, parasite preparation andDNA extractionA number of P. chabaudi clones of the AS-lineage(Figure 1) were used [12-16]. They were routinely inocu-lated, passaged in CBA mice (4-6 weeks) and cryopre-served as previously described [49]. Parasites wereprepared and DNA extracted as previously described[50], ensuring that host white cells were removed byCF11 cellulose (Whatman, UK) and Plasmodipur filters(Eurodiagnostica, Netherlands).
Phenotyping, drug testsArtemisinin drug tests for P. chabaudi parasites havebeen previously described [16,27]. Here we used 3 daytreatments on day 1-3 post-inoculation (p.i.) (1 × 10⁶
parasites) at the defined doses in CBA mice. Parasitae-mias were estimated from a drop of blood from thetail in Giemsa stained thin blood smears as follows.Infected and uninfected RBCs were counted in up to aminimum of 2 representative microscope fields (approx100 RBC/field). Counting of additional fields wasstopped when > 20 infected RBCs had been counted(maximum 5 fields).
Genetic crossesThe generation of recombinant progeny arising fromgenetic crosses between drug-sensitive (AJ) and drug-resistant (AS lineage) parasites has been previouslydescribed [13,15,18,27]. In the present experiments,back crosses of both AS-30CQ × AJ and AS-15MF ×AJ against the sensitive AJ background were performedin order to maximise the numbers of independentrecombinant parasites and to optimise the resolutionof selection valleys. Previously generated cryopreservedcross progeny [14,15] were selected with different drugconcentrations (including untreated) and the survivingparasites at day 5 to day 11 p.i. mixed in approximatelyequal proportion with sensitive (AJ) parasites prior tothe genetic backcross procedure. 1 × 10⁵ mixed para-sites were inoculated into C57 mice for production ofgametocytes. Parasites were transmitted on day 5 p.i.or day 6 p.i. through Anopheles stephensi mosquitoes,maintained as described previously [49]. Sporozoitesarising in the mosquitoes were recovered by intraperi-toneal injection, as previously described [13,15,18,27].Asexual red blood cell forms were collected, pooledand used to inoculate CBA mice used for drug selec-tion (LGS) experiments.
Hunt et al. BMC Genomics 2010, 11:499http://www.biomedcentral.com/1471-2164/11/499
Page 9 of 13

Quantitative analysis of genetic crossesWe used pyrosequencing (Biotage) to determine the pro-portions of parental alleles at many polymorphic sitesacross the genome as previously described [26] andaccording to the manufacturer’s methodology. In thisstudy, which pre-dated the release of the full genomeassembly and annotation, the position of individual mar-kers within the P. chabaudi genome was defined as fol-lows. The required position of markers within the P.chabaudi genome was mapped to orthologous genes inthe P. falciparum genome using the rodent malaria syn-teny maps [30]. Suitable P. falciparum protein sequenceswere used to define P. chabaudi sequences in orthologousgenes by TBLASTN analysis, with validation of adjacentgenes in both species. SNPs between AS and AJ parasiteswere identified by amplification of nucleotide sequencesfrom AS and AJ parasites, and assays developed usinghigh-quality sequence from both clones. Details of thegenome-wide set of assays are given in Additional File 1.
Statistical analysis of genome-wide scansOverview We developed and used two independentapproaches to assess the statistical significance of puta-tive selection valleys. The first is based on simulations ofthe experimental design and tests the null-hypothesisthat resistance is caused by many loci of small effects andcan therefore not be attributed to one or a few dominantselection valleys. The second approach comparesobserved and corrected allele frequencies in experimentswith and without drug treatment using the non-para-metric Mann-Whitney U-test. Both approaches havecomplementary strengths and weaknesses. Our main goalis to identify a statistically significant selection valley.The principles, methodologies, results, model and valida-tions are detailed in Additional Files 2, 3, 4, 5, 6, 12.
Genome re-sequencing analysis by the Illumina® (Solexa)platformClones AS-sens, AS-15MF and AS-30CQ were re-sequenced by the Illumina® (Solexa) platform with 36 -(AS-sens, AS-15MF) or 50 base (AS-30CQ) single reads(nominal coverage x20, x30, x30 fold respectively) (Table1). For AS-30CQ, the final 9 base calls were universallyof poor quality and were removed before mapping theremaining 41 base sequence strings. Individual sequencestrings (reads) from each clone were aligned against anisogenic AS reference sequence (AS-WTSI, September2009 assembly, obtained from the publicly available ftpsite of the P. chabaudi AS genome sequencing projectwebsite at the Wellcome Trust Sanger Institute; ftp://ftp.sanger.ac.uk/pub/pathogens/P_chabaudi/) using two dif-ferent software packages; MAQ (Mapping and Assemblywith Quality) [28] and SSAHA2 (Sequence Search andAlignment by Hashing Algorithm) [29].
For SSAHA2 analysis, Solexa reads were mappedagainst AS-WTSI using the “pileup” command for singleend reads with the appropriate options as described inftp://ftp.sanger.ac.uk/pub/zn1/ssaha_pileup/ssaha_pileup-readme. Three output files (*.snp, *.ins and *.del) callingSNPs, insertions or deletions were combined into a singleArtemis [51] - compatible file (*.gff) using a customscript that further selected SNPs based on a minimumread coverage that was set at “3” for all the clones, in thisstudy. A second script was developed to compare the *.gff files of either of the two mutant clones against theoutput obtained for AS-sens. In this way, only mutationsappearing within the AS-lineage were retained. Further-more, a third custom script was used to filter out all theremaining SNPs that had ambiguous (or heterozygous)base calls, where the ‘minority’ base was represented in≥20% of the total number of reads. The filtered files werethen imported into Artemis which allowed the inspec-tion, identification and evaluation of these mutations onthe fully annotated genome. For example, mutationscould be immediately identifed as intergenic or intra-genic, synonymous or non-synonymous etc.MAQ was used to call point mutations and compared
to those made by SSAHA2. MAQ analysis was performedusing the “easyrun” command in the MAQ software suitewith default parameters, as described in http://maq.sour-ceforge.net. This generates a list of candidate SNPs foreach clone as a ‘cns.final.snp’ file. These SNPs were sub-sequently filtered using custom scripts, as follows (seealso Additional File 7). A minimum coverage of 3 readswas applied to call SNPs in all clones. Proposed SNPswith ambiguous calls were removed. The SNPs obtainedfor mutant clones were then filtered to remove thoseSNPs defined for AS-sens. The remaining SNPs are can-didates for mutations within the AS lineage.The identification of insertion/deletion mutations
(indels) and CNVs was performed with SSAHA2 usingtwo approaches, namely SSAHA2’s internal algorithmfor the identification of small indels (≤ 3bp) and a “com-parative coverage” analysis, both described in detail inthe Additional File 7. Visualisation of individual readsand coverage which is available in MAQ was used toconfirm indels and CNVs identified by SSAHA2, givingincreased confidence.
Additional material
Additional file 1: Inventory of pyrosequencing assays. Theapproximate genome position (column M) of pyrosequencing assays(columns B-G) are based upon mapping to a previous assembly andannotation of AS-WTSI, using estimated lengths for telomeres, gapsbetween contigs etc. The locus designation pcxxpfyy-zzzz indicates thatthe marker maps approximately to P. chabaudi chromosome xx andhomologous to a locus in P. falciparum zzzz kb along chromosome yy
Hunt et al. BMC Genomics 2010, 11:499http://www.biomedcentral.com/1471-2164/11/499
Page 10 of 13
Additional file 2: Statistics: methods, analysis and evaluation. Thisfile describes the statistical methods developed for evaluating whetherselection at given loci is significant. Two methods are described andevaluated.
Additional file 3: Simulations - examples. Four independent examples(#1, 9, 10, 12) of simulated genome scans of comparative index (marker(AJ, drug-sensitive parent) proportion in drug-treated population/ markerproportion in untreated population) v. genome positions of markers on14 chromosomes (numbers at top) assuming null hypothesis of 10resistance (AS advantage, red dots) and 10 fitness (AJ advantage, bluedots) loci are shown. The z-score (Additional File 2) of the deepest valleyis calculated (bottom left). Additional File 4 plots the frequency of thesez-scores after 500 such simulations. Note that, in contrast to experimentalscans (Figure 3A), many simulations show multiple valleys, includingminor valleys containing only neutral markers.
Additional file 4: Simulations - null distribution histogram. Thedistribution of the lowest z-scores was observed in 500 simulations ofselection of the AS-30CQ × AJ cross, using experimental markerpositions. The null hypothesis assumed 10 loci for artemisinin resistanceand 10 minor fitness alleles. The red point indicates the experimentallyobserved z-score (-2.364) for chr2 under artemisinin selection (Figure 3A)corresponding to a p-value of 0.0263. See Additional File 2 for details.
Additional file 5: Simulations - the inferred significance of observeddeepest selection valleys. These data are derived from the simulationapproach. See Additional File 2 for full details. 1 z-score observed in theexperiments; 2 p-value corresponding to the minimum z-score obtainedexperimentally; 3 simulations for ART reproduce the experiment that ledto the genome-wide scan in Figure 3A.
Additional file 6: Mann-Whitney analysis of genome-wide LGS. Scanshowing allele frequencies (proportion of AJ allele) from pyrosequencingafter untreated infection (control, black triangles) and treated infection(artemisinin 100 mg/kg/day, 3 days, red diamonds) (n.b Figure 3A inmain text uses Comparative Index (y-axis, defined in legend Figure 3)rather than allele proportion used here). Treatment is expected to bias AJallele frequencies downward by removing the sensitive parent, AJ andrecombinants free from resistance mutations. To correct for this andother factors (Text S1), control allele frequencies were reduced beforetesting potential selection valleys. Significant valleys are highlighted byblue circles (P < 0.001 in Mann-Whitney U-tests comparing a slidingwindow of 3-5 markers on the same chromosome (treated) with alluntreated markers reduced by the percentage (R) indicated (AF-reduction); grey triangles show untreated frequencies resulting from a-25% shift). Positions of this strain’s new mutations found by genomecomparisons are indicated at the bottom (x = SNP; circle = indel).Chromosome numbers are given at the top. Genome position indicatesphysical mapping (Kbp) of 92 markers in the genome of P. chabaudi(Additional File 1). Data points are each the mean of 3 independentdeterminations.
Additional file 7: Solexa whole-genome re-sequencing - extendedmethods, results, analysis, evaluation and quality control. This fileincludes an extended description of the analysis of the Solexa Illuminadata.
Additional file 8: Point Mutations (shared by AS-30CQ and AS-15MFwrt AS-sens). This table specifies details of point mutations predicted tobe common to AS-30CQ and AS-15MF.
Additional file 9: Indels and CNVs (shared by AS-30CQ and AS-15MFwrt AS-sens). This table specifies details of indels and CNVs predicted tobe common to AS-30CQ and AS-15MF.
Additional file 10: Artemisinin, pyrimethamine responses and ubp1,dhfr mutations in clones of the AS lineage of P. chabaudi. This tablesummarises the pyrimethamine and artemisinin responses of variousclones of the lineage and their genotype, with respect to dhfr and ubp1.
Additional file 11: AS-15CQ genotype and the origin of alternativeubp1 V2697F mutation in AS-ATN. This file discusses a number ofissues regarding AS-15CQ, its non-clonality and the origins of twomutations in ubp1.
Additional file 12: Validation of simulation - comparing simulationdata and experimental data. This file summarises data which validatesthe simulation approach to statistical analysis.
AcknowledgementsWe thank Richard Carter and the late David Walliker for their contributionsto malaria genetic and drug-resistance analysis upon which the presentwork depends, Sandie Cheesman, Kathryn Degnan for pyrosequencingassistance and Gisela Henriques for technical support. We thank members ofthe Pathogen Genomics group at the Wellcome Trust Sanger Institute andWTSI core sequencing and informatics groups for making the P. chabaudigenome sequence, assembly and annotation data publicly available. Wethank the Wellcome Trust for funding the P. chabaudi genome sequencingproject. Artemisinin was a generous gift of Dafra Pharma.The research was supported by funding from the Medical Research Council(MRC), UK (G0400476) and the Fundacao para a Ciencia e a Tecnologia(FCT), Portugal. For personal support, we thank the MRC (PH, AC, RF), FCT(AM, SB, LR, PC), the Darwin Trust (KM), the Natural Environment ResearchCouncil (DB, SK), European Union 6th Framework Program grant to theBioMalPar Consortium (TDO), the Wellcome Trust (AP), the ScottishUniversities’ Life Science Alliance (UT) and the School of Biological Sciences,University of Edinburgh (MB, MT). LL was supported by The Centre forSystems Biology at Edinburgh is a Centre for Integrative Systems Biology(CISB) funded by BBSRC and EPSRC, reference BB/D019621/1. PH wasadditionally supported by the Wellcome Trust (Centre in Development inImmunity, Infection and Evolution, 082611/Z/07/Z).
Author details1Institute for Immunology and Infection Research, School of BiologicalSciences, University of Edinburgh, Edinburgh, UK. 2Centre for Immunity,Infection and Evolution, School of Biological Sciences, University ofEdinburgh, Edinburgh, UK. 3Centro de Malaria e Outras Doenças Tropicais/IHMT/UEI Biologia Molecular, Universidade Nova de Lisboa, Lisbon, Portugal.4Centro de Malaria e Outras Doenças Tropicais/IHMT/UEI Malaria,Universidade Nova de Lisboa, Lisbon, Portugal. 5Institute for EvolutionaryBiology, School of Biological Sciences, University of Edinburgh, Edinburgh,UK. 6Centre for Systems Biology at Edinburgh, School of Biological Sciences,University of Edinburgh, Edinburgh, UK. 7The GenePool, School of BiologicalSciences, University of Edinburgh, Edinburgh, UK. 8Pathogen GenomicsGroup, Wellcome Trust Sanger Institute, Hinxton, Cambridgeshire, UK.9Computational Bioscience Research Center, Chemical and Life Sciences andEngineering Division, King Abdullah University of Science and Technology,Thuwal 23955-6900, Kingdom of Saudi Arabia. 10Division of Genetics andGenomics, The Roslin Institute and R(D)SVS, University of Edinburgh, Roslin,UK.
Authors’ contributionsKM, SB, AC, LR, RF, MT performed phenotype, genetic or genomicexperiments and analysed data. AM, SK, UT, TO analysed Solexa data. DB, LLdeveloped and performed statistical analysis. MB, AP supported genomicanalysis. PH, PC conceived, designed, co-ordinated study, analysed andinterpreted data. PH wrote the manuscript with assistance from otherauthors. All authors have read and approved the final manuscript.
Competing interestsThe authors declare that they have no competing interests.
Received: 10 March 2010 Accepted: 16 September 2010Published: 16 September 2010
References1. Su X, Hayton K, Wellems T: Genetic linkage and association analyses for
trait mapping in Plasmodium falciparum. Nature Rev Genet 2007,8:497-506.
2. Su X, Kirkman L, Fujioka H, Wellems T: Complex polymorphisms in an~330kDa protein are linked to chloroquine-resistant P. falciparum inSoutheast Asia and Africa. Cell 1997, 91:593-603.
Hunt et al. BMC Genomics 2010, 11:499http://www.biomedcentral.com/1471-2164/11/499
Page 11 of 13
3. Fidock D, Nomura T, Talley A, Cooper R, Dzekunov S, Ferdig MT, Ursos LM,Sidhu AB, Naudé B, Deitsch KW, Su XZ, Wootton JC, Roepe PD, Wellems TE:Mutations in the P. falciparum digestive vacuole transmembrane proteinPfCRT and evidence for their role in chloroquine resistance. Mol Cell2000, 6:861-871.
4. Wootton J, Feng X, Ferdig M, Cooper R, Mu J, Baruch DI, Magill AJ, Su XZ:Genetic diversity and chloroquine selective sweeps in Plasmodiumfalciparum. Nature 2002, 418:320-322.
5. Lehane A, Kirk K: Chloroquine resistance-conferring mutations in pfcrtgive rise to a chloroquine-associated H+ leak from the malaria parasite’sdigestive vacuole. Antimicrob Ag Chemother 2008, 52:4374-4380.
6. Martin RE, Marchetti RV, Cowan AI, Howitt SM, Bröer S, Kirk K: Chloroquinetransport via the malaria parasite’s chloroquine resistance transporter.Science 2009, 325:1680-1682.
7. Ferdig MT, Cooper RA, Mu J, Deng B, Joy DA, Su XZ, Wellems TE:Dissecting the loci of low-level quinine resistance in malaria parasites.Mol Microbiol 2004, 52:985-997.
8. Nzila A, Mwai L: In vitro selection of Plasmodium falciparum drug-resistant parasite lines. J Antimicrob Chemother 2010, 65:390-398.
9. Walliker D, Quakyi IA, Wellems TE, McCutchan TF, Szarfman A, London WT,Corcoran LM, Burkot TR, Carter R: Genetic analysis of the human malariaparasite Plasmodium falciparum. Science 1987, 236:1661-1666.
10. Wellems TE, Panton LJ, Gluzman IY, do Rosario VE, Gwadz RW, Walker-Jonah A, Krogstad DJ: Chloroquine resistance not linked to mdr-likegenes in a Plasmodium falciparum cross. Nature 1990, 253:253-255.
11. Hayton K, Gaur D, Liu A, Takahashi J, Henschen B, Singh S, Lambert L,Furuya T, Bouttenot R, Doll M, Nawaz F, Mu J, Jiang L, Miller LH,Wellems TE: Erythrocyte binding protein PfRH5 polymorphismsdetermine species-specific pathways of Plasmodium falciparum invasion.Cell Host Microbe 2008, 4:40-51.
12. Carlton J, Hayton K, Cravo P, Walliker D: Of mice and malaria mutants:unravelling the genetics of drug resistance using rodent malaria models.Trends Parasitol 2001, 17:236-242.
13. Rosario V: Genetics of chloroquine resistance in malaria parasites. Nature1976, 261:585-586.
14. Padua R: Plasmodium chabaudi: genetics of resistance to chloroquine.Exp Parasitol 1981, 52:419-426.
15. Cravo PV, Carlton JM, Hunt P, Bisoni L, Padua RA, Walliker D: Genetics ofmefloquine resistance in the rodent malaria parasite Plasmodiumchabaudi. Antimicrob Agents Chemother 2003, 47:709-718.
16. Afonso A, Hunt P, Cheesman S, Alves AC, Cunha CV, do Rosário V, Cravo P:Malaria parasites can develop stable resistance to artemisinin but lackmutations in candidate genes atp6 (encoding the sarcoplasmic andendoplasmic reticutlum Ca2+ ATPase), tctp, mdr1 and cg10. AntimicrobAgents Chemother 2006, 50:480-489.
17. Carter R, Hunt P, Cheesman S: Linkage group selection - a fast approachto the genetic analysis of malaria parasites. Int J Parasitol 2007,37:285-293.
18. Culleton R, Martinelli A, Hunt P, Carter R: Linkage Group Selection: rapidgene discovery in malaria parasites. Genome Research 2005, 15:92-97.
19. Martinelli A, Cheesman S, Hunt P, Culleton R, Raza A, Mackinnon M,Carter R: A genetic approach to the de novo identification of targets ofstrain-specific immunity in malaria parasites. Proc Natl Acad Sci 2005,102:814-819.
20. Pattaradilokrat S, Cheesman S, Carter R: Linkage group selection: towardsidentifying genes controlling strain-specific protective immunity inmalaria. PLoS One 2007, 12:e857.
21. Pattaradilokrat S, Culleton R, Cheesman S, Carter R: Gene encodingerythrocyte binding ligand linked to blood stage multiplication ratephenotype in Plasmodium yoelii yoelii. Proc Natl Acad Sci 2009,106:7161-7166.
22. Bentley D: Whole-genome resequencing. Curr Opin Genet Dev 2006,16:545-552.
23. Hillier LW, Marth GT, Quinlan AR, Dooling D, Fewell G, Barnett D, Fox P,Glasscock JI, Hickenbotham M, Huang W, Magrini VJ, Richt RJ, Sander SN,Stewart DA, Stromberg M, Tsung EF, Wylie T, Schedl T, Wilson RK,Mardis ER: Whole-genome sequencing and variant discovery in C.elegans. Nat Methods 2008, 5:183-188.
24. Srivatsan A, Han Y, Peng J, Tehranchi AK, Gibbs R, Wang JD, Chen R: High-precision, whole-genome sequencing of laboratory strains facilitatesgenetic studies. PLoS Genet 2008, 4:e1000139.
25. The Plasmodium chabaudi genome project (Sept 2009 assembly).[http://www.sanger.ac.uk/Projects/P_chabaudi/].
26. Cheesman S, Creasey A, Degnan K, Kooij T, Afonso A, Cravo P, Carter R,Hunt P: Validation of pyrosequencing for accurate and high throughputestimation of allele frequencies in malaria parasites. Mol BiochemParasitol 2007, 152:213-219.
27. Hunt P, Afonso A, Creasey A, Culleton R, Sidhu AB, Logan J,Valderramos SG, McNae I, Cheesman S, do Rosario V, Carter R, Fidock DA,Cravo P: Gene encoding a deubiquitinating enzyme is mutated inartesunate- and chloroquine-resistant rodent malaria parasites. MolMicrobiol 2007, 65:27-40.
28. Maq: Mapping and Assembly with Qualities. [http://maq.sourceforge.net/].29. SSAHA2: Sequence Search and Alignment by Hashing Algorithm. [http://
www.sanger.ac.uk/resources/software/ssaha2/].30. Kooij TW, Carlton JM, Bidwell SL, Hall N, Ramesar J, Janse CJ, Waters AP: A
Plasmodium whole-genome synteny map: indels and syntenybreakpoints as foci for species-specific genes. PLoS Pathogens 2005, 1:e44.
31. Cheng Q, Saul A: The dihydrofolate reductase domain of rodent malarias:point mutations and pyrimethamine resistance. Mol Biochem Parasitol1994, 65:361-363.
32. Cowman AF, Lew AM: Chromosomal rearrangements and pointmutations in the DHFR-TS gene of Plasmodium chabaudi underantifolate selection. Mol Biochem Parasitol 1990, 42:21-30.
33. Dharia NV, Sidhu AB, Cassera MB, Westenberger SJ, Bopp SE, Eastman RT,Plouffe D, Batalov S, Park DJ, Volkman SK, Wirth DF, Zhou Y, Fidock DA,Winzeler EA: Use of high-density tiling microarrays to identify mutationsglobally and elucidate mechanisms of drug resistance in Plasmodiumfalciparum. Genome Biology 2009, 10(R21):1-13.
34. Noedl H, Se Y, Schaecher K, Smith BL, Socheat D, Fukuda MM, ArtemisininResistance in Cambodia 1 (ARC1) Study Consortium: Evidence ofartemisinin-resistant malaria in Western Cambodia. N Engl J Med 2008,359:2619-2620.
35. Denis MB, Tsuyuoka R, Poravuth Y, Narann TS, Seila S, Lim C, Incardona S,Lim P, Sem R, Socheat D, Christophel EM, Ringwald P: Surveillance of theefficacy of artesunate and mefloquine combination for the treatment ofuncomplicated falciparum malaria in Cambodia. Trop Med Int Health 2006,11:211-219.
36. Dondorp AM, Nosten F, Yi P, Das D, Phyo AP, Tarning J, Lwin KM, Ariey F,Hanpithakpong W, Lee SJ, Ringwald P, Silamut K, Imwong M, Chotivanich K,Lim P, Herdman T, An SS, Yeung S, Singhasivanon P, Day NP, Lindegardh N,Socheat D, White NJ: Artemisinin resistance in Plasmodium falciparummalaria. N Engl J Med 2009, 361:455-467.
37. Reed M, Saliba K, Caruana S, Kirk K, Cowman A: Pgh1 modulates sensitivityand resistance to multiple antimalarials in Plasmodium falciparum. Nature2000, 403:906-909.
38. Sidhu AB, Uhlemann AC, Valderramos SG, Valderramos JC, Krishna S,Fidock DA: Decreasing pfmdr1 copy number in Plasmodium falciparummalaria heightens susceptibility to mefloquine, lumefantrine,halofantrine, quinine and artemisinin. J Infect Dis 2006, 194:528-535.
39. Uhlemann AC, Cameron A, Eckstein-Ludwig U, Fischbarg J, Iserovich P,Zuniga FA, East M, Lee A, Brady L, Haynes RK, Krishna S: A single aminoacid residue can determine the sensitivity of SERCAs to artemisinins. NatStruct Mol Biol 2005, 12:628-629.
40. Price RN, Uhlemann AC, van Vugt M, Brockman A, Hutagalung R, Nair S,Nash D, Singhasivanon P, Anderson TJ, Krishna S, White NJ, Nosten F:Molecular and pharmacological determinants of the therapeuticresponse to artemether-lumefantrine in multidrug-resistant Plasmodiumfalciparum malaria. Clin Inf Dis 2006, 42:1570-1577.
41. Rogers WO, Sem R, Tero T, Chim P, Lim P, Muth S, Socheat D, Ariey F,Wongsrichanalai C: Failure of artesunate-mefloquine combination therapyfor uncomplicated Plasmodium falciparum malaria in southernCambodia. Malaria J 2009, 8:10.
42. Imwong M, Dondorp AM, Nosten F, Yi P, Mungthin M, Hanchana S, Das D,Phyo AP, Lwin KM, Pukrittayakamee S, Lee SJ, Koecharoen K, Nguon C,Day NPJ, Socheat D, White NJ: Exploring the contribution of candidategenes to artemisinin resistance in Plasmodium falciparum. AntimicrobAgents Chemother 2010, 54:2886-2892.
43. Valderammos S, Fidock D: Transporters involved in resistance toantimalarial drugs. Trends Pharmacol Sci 2006, 27:594-601.
44. Lim P, Chim P, Sem R, Nemh S, Poravuth Y, Lim C, Seila S, Tsuyuoka R,Denis MB, Socheat D, Fandeur T: vitro monitoring of Plasmodium
Hunt et al. BMC Genomics 2010, 11:499http://www.biomedcentral.com/1471-2164/11/499
Page 12 of 13

falciparum susceptibility to artesunate, mefloquine, quinine andchloroquine in Cambodia 2001-2002. Acta Trop 2005, 93:31-40.
45. Tinto H, Rwagacondo C, Karema C, Mupfasoni D, Vandoren W,Rusanganwa E, Erhart A, Van Overmeir C, Van Marck E, D’Alessandro U: In-vitro susceptibility of Plasmodium falciparum tomonodesethylamodiaquine, dihydroartemisinin and quinine in an areaof high chloroquine resistance in Rwanda. Trans R Soc Trop Med Hyg2006, 100:509-14.
46. Ferreira ID, Lopes D, Martinelli A, Ferreira C, do Rosário VE, Cravo P: In vitroassessment of artesunate, artemether and amodiaquine susceptibilityand molecular analysis of putative resistance-associated mutations ofPlasmodium falciparum from São Tomé & Príncipe. Trop Med Int Health2007, 12:353-62.
47. White N, Olliaro P: Strategies for the prevention of anitmalarial drugresistance: rationale for combination chemotherapy for malaria. ParasitolToday 1996, 12:399-401.
48. White N: Preventing antimalarial drug resistance through combinations.Drug Resist Update 1998, 1:3-9.
49. Walliker D, Carter R, Sanderson A: Genetic studies on Plasmodiumchabaudi: recombination between enzyme markers. Parasitology 1975,70:19-24.
50. Grech K, Martinelli A, Pathirana S, Walliker D, Hunt P, Carter R: Numerous,robust genetic markers for Plasmodium chabaudi by the method ofamplified fragment length polymorphism. Mol Biochem Parasitol 2002,123:95-104.
51. Rutherford K, Parkhill J, Crook J, Horsnell T, Rice P, Rajandream MA, Barrell B:Artemis: sequence visualisation and annotation. Bioinformatics 2000,16:944-945.
doi:10.1186/1471-2164-11-499Cite this article as: Hunt et al.: Experimental evolution, genetic analysisand genome re-sequencing reveal the mutation conferring artemisininresistance in an isogenic lineage of malaria parasites. BMC Genomics2010 11:499.
Submit your next manuscript to BioMed Centraland take full advantage of:
• Convenient online submission
• Thorough peer review
• No space constraints or color figure charges
• Immediate publication on acceptance
• Inclusion in PubMed, CAS, Scopus and Google Scholar
• Research which is freely available for redistribution
Submit your manuscript at www.biomedcentral.com/submit
Hunt et al. BMC Genomics 2010, 11:499http://www.biomedcentral.com/1471-2164/11/499
Page 13 of 13