Comprehensive gene expression analysis by transcript profiling
23
Plant Molecular Biology 48: 75–97, 2002. © 2002 Kluwer Academic Publishers. Printed in the Netherlands. 75 Comprehensive gene expression analysis by transcript profiling Jonathan Donson ∗ , Yiwen Fang, Gregg Espiritu-Santo, Weimei Xing, Andres Salazar, Susie Miyamoto,Veronica Armendarez and Wayne Volkmuth Ceres, Inc., 3007 Malibu Canyon Road., Malibu, CA 90265, USA ( ∗ author for correspondence; e-mail [email protected]) Key words: cDNA-AFLP, gene expression, microarray, oligonucleotide-based array, SAGE, transcript profiling Abstract After the completion of the genomic sequence of Arabidopsis thaliana, it is now a priority to identify all the genes, their patterns of expression and functions. Transcript profiling is playing a substantial role in annotating and deter- mining gene functions, having advanced from one-gene-at-a-time methods to technologies that provide a holistic view of the genome. In this review, comprehensive transcript profiling methodologies are described, including two that are used extensively by the authors, cDNA-AFLP and cDNA microarraying. Both these technologies illustrate the requirement to integrate molecular biology, automation, LIMS and data analysis. With so much uncharted territory in the Arabidopsis genome, and the desire to tackle complex biological traits, such integrated systems will provide a rich source of data for the correlative, functional annotation of genes. Abbreviations: cDNA-AFLP, cDNA amplified fragment length polymorphism; EST, expressed sequence tag; LIMS, laboratory information management system; MPSS, massively parallel signature sequencing; PCR, poly- merase chain reaction; RDA, representational difference analysis; SAGE, serial analysis of gene expression; SSH, suppression subtractive hybridization Introduction The publication of the ‘complete’ nuclear chromoso- mal sequence of Arabidopsis thaliana, following on from publication of the plant chloroplast and mito- chondrial genome sequences (Unseld et al., 1997; Sato et al., 1999), has equipped biologists with the oppor- tunity to describe a plant’s basic genetic determinants (Arabidopsis Genome Initiative, 2000). This monu- mental achievement begs the question, ‘How does this arrangement of nuclear chromosomal nucleotide sequences provide for the making and survival of a plant?’ Bioinformatic analysis allows the theoretical discrimination of open reading frames and genetic control elements; however, such studies by their na- ture carry inaccuracies (Pavy et al., 1999; Guigó et al., 2000; Cho and Walbot, 2001). Even where our knowledge of genomic structure allows us to infer the AFLP is a registered trademark of Keygene N.V. The AFLP technology is covered by patents owned by Keygene N.V. presence of genes, we can say little about the func- tioning or control of these transcriptional units. While 69% of publicly annotated Arabidopsis genes have some sequence similarity to those with known func- tions in other organisms, only 9% of genes have been characterized experimentally (Arabidopsis Genome Initiative, 2000). Information on both the physical and functional annotation of the genome can be gained through tran- script profiling (Hughes et al., 2001; Shoemaker et al., 2001). In recent years, transcript profiling has become synonymous with gene expression analysis, largely because of the technical difficulties and greater mole- cular complexity of proteomics and metabolomics (Smith, 2000; see other papers in this issue). Such correlations are acceptable in many cases (Celis et al., 2000), even though the term ‘gene expression’ is of- ten used to refer more directly to the compendium of gene products that ultimately cause cellular responses, and these are more often than not proteins. In some
-
Upload
independent -
Category
Documents
-
view
2 -
download
0
Transcript of Comprehensive gene expression analysis by transcript profiling
Plant Molecular Biology 48: 75–97, 2002.© 2002 Kluwer Academic Publishers. Printed in the Netherlands.
75
Comprehensive gene expression analysis by transcript profiling
Jonathan Donson∗, Yiwen Fang, Gregg Espiritu-Santo, Weimei Xing, Andres Salazar, SusieMiyamoto, Veronica Armendarez and Wayne VolkmuthCeres, Inc., 3007 Malibu Canyon Road., Malibu, CA 90265, USA (∗author for correspondence; [email protected])
Key words: cDNA-AFLP, gene expression, microarray, oligonucleotide-based array, SAGE, transcript profiling
Abstract
After the completion of the genomic sequence of Arabidopsis thaliana, it is now a priority to identify all the genes,their patterns of expression and functions. Transcript profiling is playing a substantial role in annotating and deter-mining gene functions, having advanced from one-gene-at-a-time methods to technologies that provide a holisticview of the genome. In this review, comprehensive transcript profiling methodologies are described, including twothat are used extensively by the authors, cDNA-AFLP and cDNA microarraying. Both these technologies illustratethe requirement to integrate molecular biology, automation, LIMS and data analysis. With so much unchartedterritory in the Arabidopsis genome, and the desire to tackle complex biological traits, such integrated systems willprovide a rich source of data for the correlative, functional annotation of genes.
Abbreviations: cDNA-AFLP, cDNA amplified fragment length polymorphism; EST, expressed sequence tag;LIMS, laboratory information management system; MPSS, massively parallel signature sequencing; PCR, poly-merase chain reaction; RDA, representational difference analysis; SAGE, serial analysis of gene expression; SSH,suppression subtractive hybridization
Introduction
The publication of the ‘complete’ nuclear chromoso-mal sequence of Arabidopsis thaliana, following onfrom publication of the plant chloroplast and mito-chondrial genome sequences (Unseld et al., 1997; Satoet al., 1999), has equipped biologists with the oppor-tunity to describe a plant’s basic genetic determinants(Arabidopsis Genome Initiative, 2000). This monu-mental achievement begs the question, ‘How doesthis arrangement of nuclear chromosomal nucleotidesequences provide for the making and survival of aplant?’ Bioinformatic analysis allows the theoreticaldiscrimination of open reading frames and geneticcontrol elements; however, such studies by their na-ture carry inaccuracies (Pavy et al., 1999; Guigóet al., 2000; Cho and Walbot, 2001). Even where ourknowledge of genomic structure allows us to infer the
AFLP� is a registered trademark of Keygene N.V. TheAFLP� technology is covered by patents owned by Keygene N.V.
presence of genes, we can say little about the func-tioning or control of these transcriptional units. While69% of publicly annotated Arabidopsis genes havesome sequence similarity to those with known func-tions in other organisms, only 9% of genes have beencharacterized experimentally (Arabidopsis GenomeInitiative, 2000).
Information on both the physical and functionalannotation of the genome can be gained through tran-script profiling (Hughes et al., 2001; Shoemaker et al.,2001). In recent years, transcript profiling has becomesynonymous with gene expression analysis, largelybecause of the technical difficulties and greater mole-cular complexity of proteomics and metabolomics(Smith, 2000; see other papers in this issue). Suchcorrelations are acceptable in many cases (Celis et al.,2000), even though the term ‘gene expression’ is of-ten used to refer more directly to the compendium ofgene products that ultimately cause cellular responses,and these are more often than not proteins. In some
76
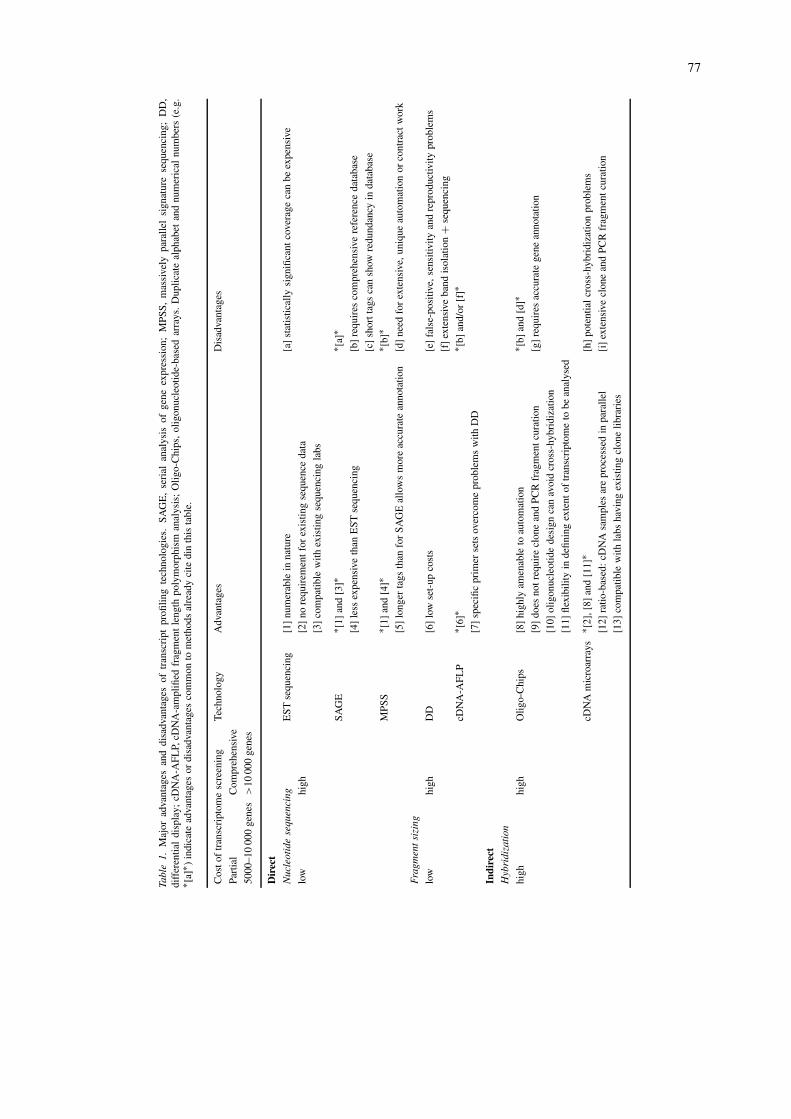
instances protein levels are not reflected by alterationsin mRNA level, and their activities are often con-trolled by post-translational modifications (Gygi et al.,1999). This means one has to take care with both ex-perimental design and interpretation if one wishes toextrapolate transcript levels to those of protein (pro-teomics) or protein activity (metabolomics). Even so,it is generally accepted and there is much experimentalevidence to support the statement that while post-transcriptional events play a role in modulating geneexpression the primary level of control is at transcrip-tion. In this framework, the accessibility of transcriptprofiling in recent years has allowed the establishmentof various high-throughput methodologies of gene ex-pression analysis. These methodologies differ in theirconvenience, expense, number of transcripts assayedand sensitivity (Table 1; Kuhn, 2001). However, asrevealed by the genomic sequencing projects, full au-tomation and data management are essential factors inall comprehensive transcript profiling.
Methods of transcript profiling
Transcript profiling has been going on in one form oranother for over 25 years (Bishop et al., 1974; Al-wine et al., 1977; for review, see Goldberg, 2001).This period has spawned techniques such as northerntransfer hybridization, S1 nuclease analysis and in situhybridization. While these methods are characterizedby good, well-defined sensitivities, they are time-consuming, and therefore best suited for the in-depthanalysis of a small number of genes. By comparison,current high-throughput transcript profiling technolo-gies have relatively poorly defined sensitivities, sothese early methods provide both a valuable meansof confirming and extending results obtained with themore global approaches. Such ‘single-gene’ methodsare part of the lexicon of most molecular biologylabs (Ausubel et al., 2001; Sambrook and Russell,2001), and have been extensively reviewed, and assuch will not be considered further in this article. In-stead, we will confine discussion to high-throughputapproaches that allow for a global view of transcriptlevels, and where possible we will reference workwith plants. These methods can be divided into twoclasses: (1) Direct Analysis, including procedures in-volving nucleotide sequencing and fragment sizing;and (2) Indirect Analysis, involving nucleic acid hy-bridization of mRNA or cDNA fragments. We haveused two methods extensively, cDNA microarraying
and cDNA-amplified restriction fragment polymor-phism (cDNA-AFLP), as representative technologiesfrom each of these groups. All global methods of geneexpression analysis demand good Laboratory Informa-tion Management Systems (LIMS), automation, andpowerful data management and mining systems. Be-cause these aspects have been introduced most widelyin conjunction with cDNA microarraying, we willreview them together with this technology.
Direct analysis – nucleotide sequencing
Large-scale expressed sequence tag (EST) sequencing
Generating sequences from cDNA fragments servestwo purposes, the discovery of new genes and theassessment of their expression levels in the represen-tative tissue (Ewing et al., 1999; Mekhedov et al.,2000; White et al., 2000). The basis of the approachis that the level of an mRNA species in a specific tis-sue is reflected by the frequency of occurrence of itscorresponding EST in a cDNA library. In this respectthe technology is distinct from ratio-based method-ologies, such as microarraying, in being immediatelyquantitative (Bohnert et al., 2001). EST technologiesare attractive because they do not rely on establishedsequence data from the organism under study, andthey also fit well with labs already equipped to carryout high-throughput DNA sequencing (Adams et al.,1991). However, even at a few dollars per sequencethe process can be expensive if one desires to progressbeyond cursory screening of abundant mRNAs to in-depth analysis (Ohlrogge and Benning, 2000). Inaddition to the statistical problems in sampling smallnumbers from a large population (Audic and Claverie,1997), there are also problems of bias in cloning andcDNA synthesis, though this last problem and oth-ers associated with data normalization are not specificto this technology. Auxiliary techniques are availablethat reduce the amount of sequencing. These includesubtraction hybridization (Sargent, 1987) and relatedmethods, representational difference analysis (RDA;Hubank and Schatz, 1994) and suppression subtractivehybridization (SSH; Diatchenko et al., 1996). Nu-merous variants on these technology themes are alsoavailable (Bonaldo et al., 1996; Sagerstrom et al.,1997).
77
Tabl
e1.
Maj
orad
vant
ages
and
disa
dvan
tage
sof
tran
scri
ptpr
ofilin
gte
chno
logi
es.
SAG
E,
seri
alan
alys
isof
gene
expr
essi
on;
MPS
S,m
assi
vely
para
llel
sign
atur
ese
quen
cing
;D
D,
diff
eren
tial
disp
lay;
cDN
A-A
FLP,
cDN
A-a
mpl
ified
frag
men
tle
ngth
poly
mor
phis
man
alys
is;
Olig
o-C
hips
,ol
igon
ucle
otid
e-ba
sed
arra
ys.
Dup
licat
eal
phab
etan
dnu
mer
ical
num
bers
(e.g
.∗ [a
]∗ )in
dica
tead
vant
ages
ordi
sadv
anta
ges
com
mon
tom
etho
dsal
read
yci
tedi
nth
ista
ble.
Cos
tof
tran
scri
ptom
esc
reen
ing
Tech
nolo
gyA
dvan
tage
sD
isad
vant
ages
Part
ial
Com
preh
ensi
ve
5000
–10
000
gene
s>
1000
0ge
nes
Dir
ect
Nuc
leot
ide
sequ
enci
ngE
STse
quen
cing
[1]nu
mer
able
inna
ture
[a]st
atis
tical
lysi
gnifi
cant
cove
rage
can
beex
pens
ive
low
high
[2]no
requ
irem
entf
orex
istin
gse
quen
ceda
ta
[3]co
mpa
tible
with
exis
ting
sequ
enci
ngla
bs
SAG
E∗ [1
]and
[3]∗
∗ [a]∗
[4]le
ssex
pens
ive
than
EST
sequ
enci
ng[b]
requ
ires
com
preh
ensi
vere
fere
nce
data
base
[c]sh
ortt
ags
can
show
redu
ndan
cyin
data
base
MPS
S∗ [1
]and
[4]∗
∗ [b]∗
[5]lo
nger
tags
than
for
SAG
Eal
low
sm
ore
accu
rate
anno
tatio
n[d]
need
for
exte
nsiv
e,un
ique
auto
mat
ion
orco
ntra
ctw
ork
Fra
gmen
tsiz
ing
low
high
DD
[6]lo
wse
t-up
cost
s[e]
fals
e-po
sitiv
e,se
nsiti
vity
and
repr
oduc
tivity
prob
lem
s
[f]ex
tens
ive
band
isol
atio
n+
sequ
enci
ng
cDN
A-A
FLP
∗ [6]∗
∗ [b]a
nd/o
r[f]
∗[7]
spec
ific
prim
erse
tsov
erco
me
prob
lem
sw
ithD
D
Indi
rect
Hyb
ridi
zatio
n
high
high
Olig
o-C
hips
[8]hi
ghly
amen
able
toau
tom
atio
n∗ [b
]and
[d]∗
[9]do
esno
treq
uire
clon
ean
dPC
Rfr
agm
entc
urat
ion
[g]re
quir
esac
cura
tege
nean
nota
tion
[10]o
ligon
ucle
otid
ede
sign
can
avoi
dcr
oss-
hybr
idiz
atio
n
[11]fl
exib
ility
inde
finin
gex
tent
oftr
ansc
ript
ome
tobe
anal
ysed
cDN
Am
icro
arra
ys∗ [2
],[8]
and
[11]∗
[h]po
tent
ial
cros
s-hy
brid
izat
ion
prob
lem
s
[12]ra
tio-b
ased
:cD
NA
sam
ples
are
proc
esse
din
para
llel
[i]ex
tens
ive
clon
ean
dPC
Rfr
agm
entc
urat
ion
[13]c
ompa
tible
with
labs
havi
ngex
istin
gcl
one
libra
ries
78
Serial analysis of gene expression (SAGE)
By developing SAGE, Velculescu et al. (1995) inge-niously addressed the problem of reducing the costs oftraditional EST sequencing, and further modificationshave allowed this procedure to handle small amountsof tissue (<105 brain cells; Datson et al., 1999) (Pe-ters et al., 1999). Though a similar sequence-basedmethod to EST analysis, SAGE achieves a cost-savingby the concatenation and punctuation of multiple se-quence tags of 10–14 bp, prior to cloning. By the sizeselection of inserts containing 25–50 tags, a compara-ble reduction of cost or increase in depth of analysiscan be achieved over the sequencing of single ESTs.However, this increased efficiency comes at the priceof more extensive sequence reads. Consequently, thistechnology is best applied to organisms whose ge-nomic sequences are known or that have a substantialcDNA sequence database. Because SAGE tags tend tooriginate from the 3′ portion of transcripts, they areless effectively screened against most cDNA libraries,which are generally sequenced only from their 5′ ends.Even with a reference database, because the tags areso short, there can be a redundancy of matches. De-spite these caveats, the technique does not precludea ‘blind’ analysis of gene expression followed by thefurther characterization of tags that show interestingexpression patterns (Matsumura et al., 1999; van denBerg et al., 1999; Chen et al., 2000).
SAGE has been used sparingly in plant research,in contrast to the numerous human and yeast studies(http://www.sagenet.org/). A study in rice seedlingsconsisted of a sample of 10 122 tags for untreatedplants and about 2000 tags of both anaerobicallytreated and untreated plants (Matsumura et al., 1999).Although a small sample, 76.9% of the 10 122 tagsfrom the untreated rice seedlings did not match therice cDNA or EST database at the time, demonstratingthe validity of this method as a means of gene discov-ery. Other on-going SAGE analyses of plants includestudies on soybean root tissues, with or without Rhi-zobium inoculation and Arabidopsis plants transgenicfor tomato Pti4 (Schupp et al., 2001; Mysore et al.,2001).
Massively parallel signature sequencing (MPSS)
As the name suggests, MPSS has effectively tackledthe problems of EST sequencing with regard to speedand depth of analysis, both through refined molecularbiology and, equally importantly, good quality au-tomation and data management (Brenner et al., 2000a,
b). The method, developed at Lynx Therapeutics,Inc., California, is based on the in vitro cloning onmicrobeads of cDNA fragments from a mRNA popu-lation. To achieve this, a collection of oligonucleotidetags is synthesized from a defined set of 4-mers. Thiscollection is so large that when attached to 3′ cDNArestriction fragments, tag-cDNA conjugates are ob-tained with virtually every polynucleotide having aunique tag. These conjugates are then amplified andhybridized to anti-tag sequences specific to separatemicrobeads. As a result, each microbead hybridizesabout 100 000 copies of a single species from theinterrogating cDNA. The cDNA fragments can thenbe sequenced in a flow cell by a method involvingtype IIs restriction endonucleases and the tandem lig-ation of differential adapters, one set of which arefluorescently labeled. A CCD camera with imageprocessing software tracks the florescence of individ-ual beads through the multiple hybridization, ligation,and cleavage steps. Sequences of 16–20 bases areroutinely obtained, which are longer than those fromSAGE analysis, thus helping to resolve redundancyof matches to cDNA databases. With this method, amRNA in high abundance in a population will have itssequence found on a large number of microbeads. Assuch, the technology retains the digital nature of EST-based gene expression profiling, with a throughput thatis vastly superior, allowing for the identification ofhundreds of thousands of mRNAs in the matter of afew days. In describing their method, Brenner et al.(2000a) reported a pilot study in which they obtained1619 000 sequence tags from a human acute mono-cytic leukemia cell line. Statistically, this volume oftags provides the method with an advantage over othergene expression methods, both direct and indirect, inthat it has a high degree of redundancy, making dataanalysis more reliable. In addition, the large samplingallows for the identification of rare mRNAs, thoughthe PCR step is a potential source of transcript profiledistortion.
At the moment, MPSS may appear inaccessibleto the broad scientific community, except throughservice work by Lynx Therapentics, Inc. However,traditional high-throughput nucleotide sequencing andparticularly cDNA microarraying seemed similarlyunavailable when they were first developed. In bothcases, academic and commercial interests promptedthe dissemination of these technologies.
79
Direct analysis - fragment sizing-based methods
Differential display (DD)
The second grouping of direct analysis methods in-volve the discrimination of mRNAs by differentialseparation of representative cDNA fragments on ma-trices; invariably, these methods are PCR-based. Theirfirst application in 1992, through differential display(DD) (Liang and Pardee, 1992) and the related RNAarbitrarily primed PCR (RAP-PCR) (Welsh et al.,1992), gave a unique perspective to gene expressionanalysis by providing a convenient bi-directional viewof the up and down regulation of mRNAs between twoor more samples. Differential display is a four-stepprocess: (1) reverse transcription of mRNA with an-chored oligo dTV primers; (2) amplification of cDNAwith arbitrary primers; (3) resolution of amplifiedcDNA by polyacrylamide gel electrophoresis; and, (4)isolation of resolved fragments from the gel, followedby amplification and sequencing. RAP-PCR differsonly in Step 1, in that arbitrary primers are used. Since1992, there has been a veritable cornucopia of pub-lished variations on this theme of differential display(Matz and Lukyanov, 1998). At the time, these meth-ods provided a far more cost-effective approach toidentifying differentially expressed genes compared toexisting subtractive methods. Consequently, they havebeen used extensively in plant research (Visioli et al.,1997; Sablowski and Meyerowitz, 1998). However,a survey of such studies shows that while differentialdisplay has been an effective means of gene discoveryit has had less value as a means of gene expressionprofiling (Sambrook and Russell, 2001). This stemsfrom the inherent nature of the PCR processes used inthis and associated methods (McClelland et al., 1995).Because arbitrary primers are used at low annealingtemperatures to allow for priming at multiple sites,the amplified products are not solely dependent onthe initial concentration of a particular cDNA, but arealso a function of the quality of match of the primersto the template. Predictably, under such conditionsprofiles are highly influenced by the PCR conditionsas well as the sample quality (Matz and Lukyanov,1998). This problem manifests itself in a high per-centage of false-positive bands (Sun et al., 1994;Sompayrac et al., 1995), lack of sensitivity (Berti-oli et al., 1995), and difficulties with reproducibility(Haag and Raman, 1994; Zhang et al., 1998). The useof longer primers has reduced but not fully alleviatedproblems of false-positive bands (Zhao et al., 1995;
Martin and Pardee, 1999). Similar modifications havebeen employed to address sensitivity (Ikonomov andJacob, 1996) and reproducibility problems (Linskenset al., 1995). However, these changes represent mod-ifications that do not change the inherent problemof arbitrarily primed PCR reactions. In conclusion,differential display methods are relatively cheap andsimple means of screening for differentially expressedgenes, and are particularly good where the availabilityof RNA is limited (Renner et al., 1998; Bosch et al.,2000). However, they are not very accurate in quanti-tatively profiling global levels of gene expression, asillustrated by the number of false-positives generated.
Selective fragment amplification
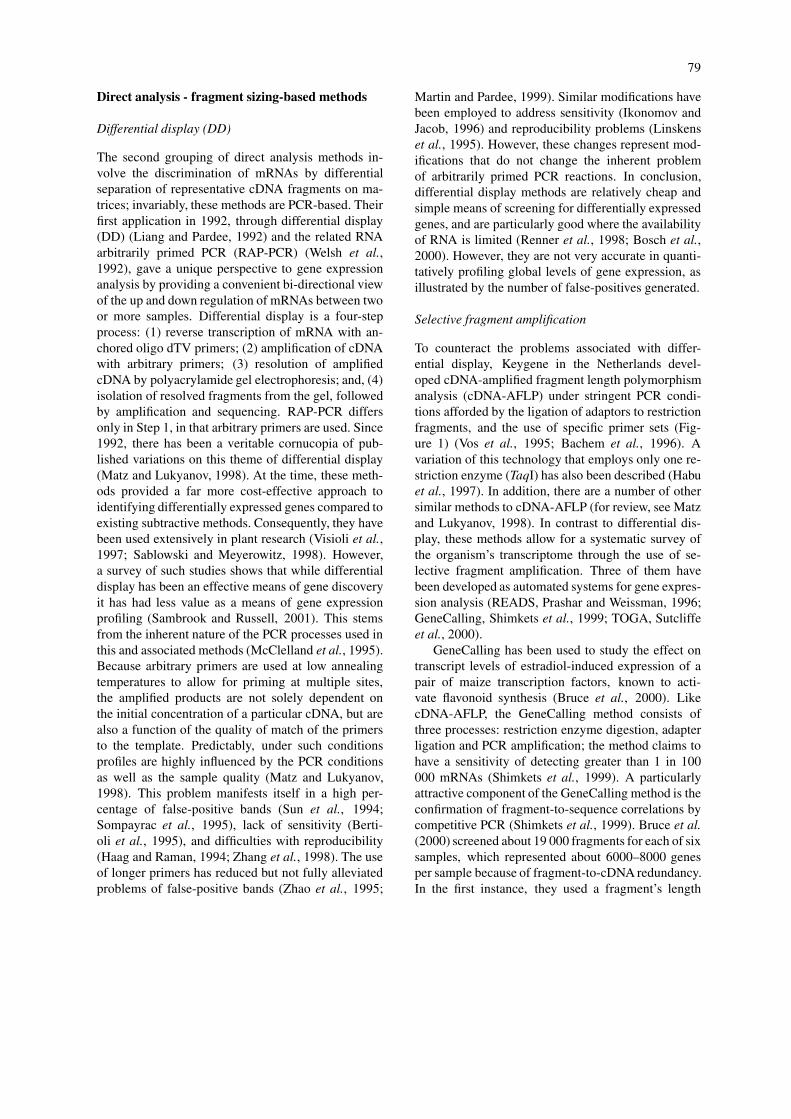
To counteract the problems associated with differ-ential display, Keygene in the Netherlands devel-oped cDNA-amplified fragment length polymorphismanalysis (cDNA-AFLP) under stringent PCR condi-tions afforded by the ligation of adaptors to restrictionfragments, and the use of specific primer sets (Fig-ure 1) (Vos et al., 1995; Bachem et al., 1996). Avariation of this technology that employs only one re-striction enzyme (TaqI) has also been described (Habuet al., 1997). In addition, there are a number of othersimilar methods to cDNA-AFLP (for review, see Matzand Lukyanov, 1998). In contrast to differential dis-play, these methods allow for a systematic survey ofthe organism’s transcriptome through the use of se-lective fragment amplification. Three of them havebeen developed as automated systems for gene expres-sion analysis (READS, Prashar and Weissman, 1996;GeneCalling, Shimkets et al., 1999; TOGA, Sutcliffeet al., 2000).
GeneCalling has been used to study the effect ontranscript levels of estradiol-induced expression of apair of maize transcription factors, known to acti-vate flavonoid synthesis (Bruce et al., 2000). LikecDNA-AFLP, the GeneCalling method consists ofthree processes: restriction enzyme digestion, adapterligation and PCR amplification; the method claims tohave a sensitivity of detecting greater than 1 in 100000 mRNAs (Shimkets et al., 1999). A particularlyattractive component of the GeneCalling method is theconfirmation of fragment-to-sequence correlations bycompetitive PCR (Shimkets et al., 1999). Bruce et al.(2000) screened about 19 000 fragments for each of sixsamples, which represented about 6000–8000 genesper sample because of fragment-to-cDNA redundancy.In the first instance, they used a fragment’s length
80
Figure 1. The cDNA-AFLP protocol. This procedure consists of six steps: 1, the reverse transcription of mRNA using an oligo-dT primer toproduce cDNA; 2, digestion of double-stranded cDNA with a pair of restriction enzymes (in this case, MseI and TaqI); 3, ligation of adaptersspecific for the two restriction sites; 4, pre-amplification of fragments with primers specific to the two adapter sequences, but with a singlenucleotide extension to reduce mismatching at the selective amplification stage; 5, selective amplification with adapter-specific primers withnucleotide extensions at their 3′ ends (2 nucleotides for the TaqI primer, 3 nucleotides for the MseI primer); and 6, visualization of individualTaqI/MseI fragments on a polyacrylamide gel, as the TaqI primer is end labeled with 33P. See the paper of Vos et al. (1995) for hypotheses onthe nature of the selective amplification. AFLP� is a registered trademark of Keygene N.V. The AFLP� technology is covered by patentsowned by Keygene N.V.
and bordering restriction sites to search a databaseof maize sequences. This provided new informationabout the action of the transcription factors, as theydetected both known and novel gene responses. Theyalso demonstrated that there was a good correlationof profiling results with northern analyses, though thiswas not always the case. This aberrant behavior waspossibly due to genes cross-hybridizing on RNA gelblots that could be differentiated by GeneCalling.
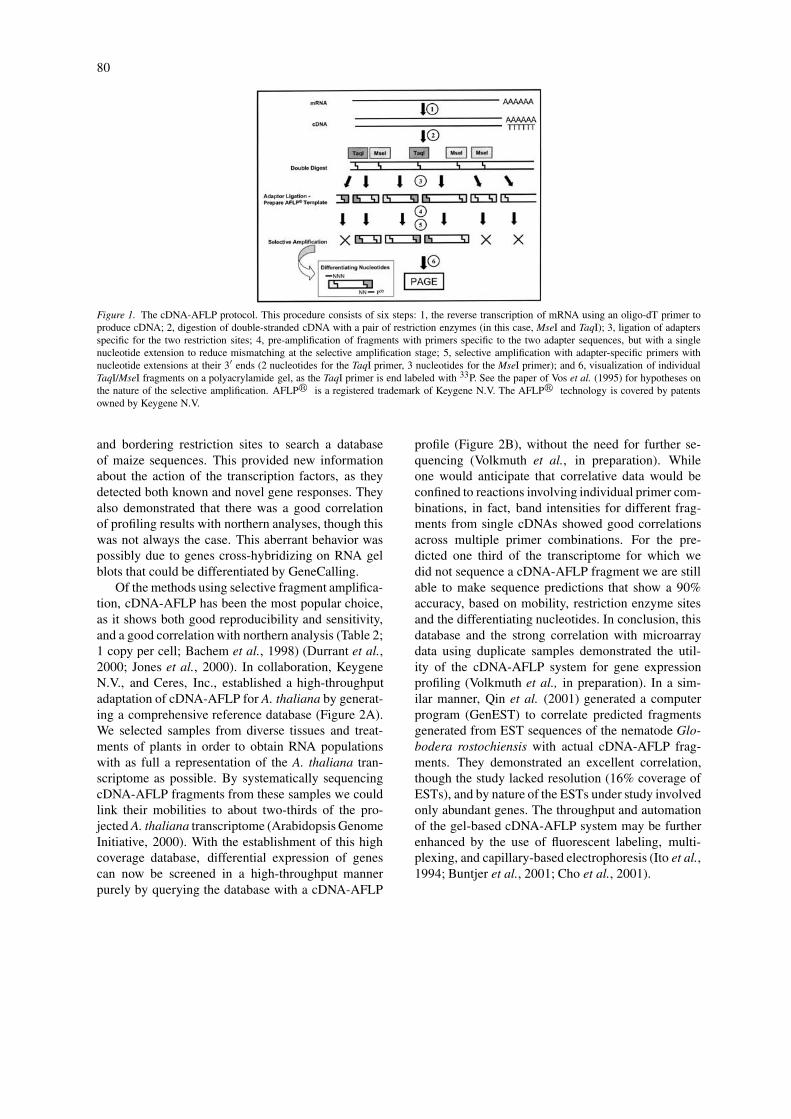
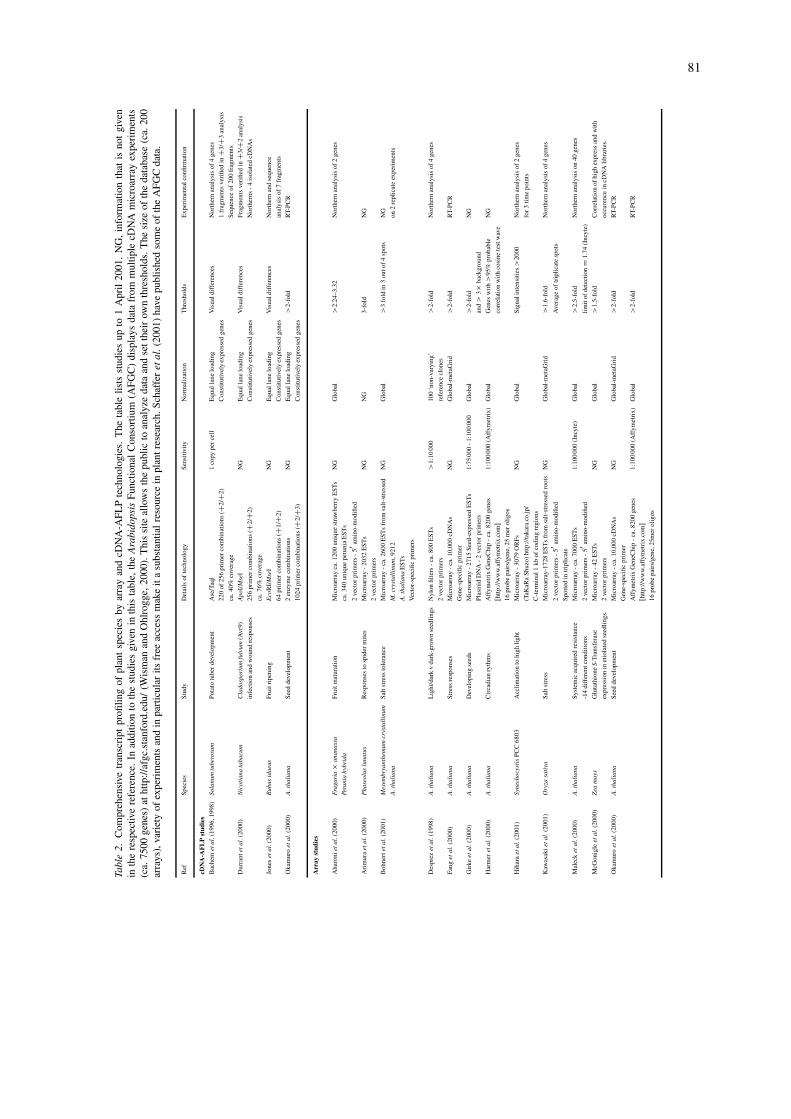
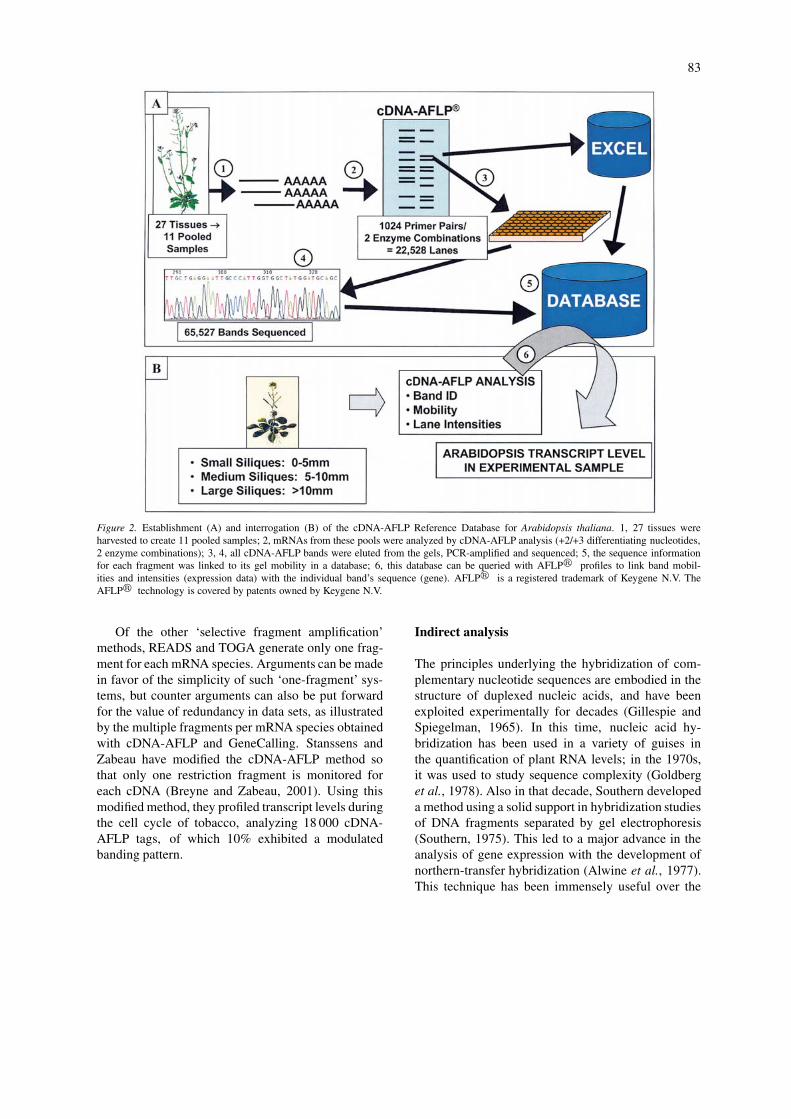
Of the methods using selective fragment amplifica-tion, cDNA-AFLP has been the most popular choice,as it shows both good reproducibility and sensitivity,and a good correlation with northern analysis (Table 2;1 copy per cell; Bachem et al., 1998) (Durrant et al.,2000; Jones et al., 2000). In collaboration, KeygeneN.V., and Ceres, Inc., established a high-throughputadaptation of cDNA-AFLP for A. thaliana by generat-ing a comprehensive reference database (Figure 2A).We selected samples from diverse tissues and treat-ments of plants in order to obtain RNA populationswith as full a representation of the A. thaliana tran-scriptome as possible. By systematically sequencingcDNA-AFLP fragments from these samples we couldlink their mobilities to about two-thirds of the pro-jected A. thaliana transcriptome (Arabidopsis GenomeInitiative, 2000). With the establishment of this highcoverage database, differential expression of genescan now be screened in a high-throughput mannerpurely by querying the database with a cDNA-AFLP
profile (Figure 2B), without the need for further se-quencing (Volkmuth et al., in preparation). Whileone would anticipate that correlative data would beconfined to reactions involving individual primer com-binations, in fact, band intensities for different frag-ments from single cDNAs showed good correlationsacross multiple primer combinations. For the pre-dicted one third of the transcriptome for which wedid not sequence a cDNA-AFLP fragment we are stillable to make sequence predictions that show a 90%accuracy, based on mobility, restriction enzyme sitesand the differentiating nucleotides. In conclusion, thisdatabase and the strong correlation with microarraydata using duplicate samples demonstrated the util-ity of the cDNA-AFLP system for gene expressionprofiling (Volkmuth et al., in preparation). In a sim-ilar manner, Qin et al. (2001) generated a computerprogram (GenEST) to correlate predicted fragmentsgenerated from EST sequences of the nematode Glo-bodera rostochiensis with actual cDNA-AFLP frag-ments. They demonstrated an excellent correlation,though the study lacked resolution (16% coverage ofESTs), and by nature of the ESTs under study involvedonly abundant genes. The throughput and automationof the gel-based cDNA-AFLP system may be furtherenhanced by the use of fluorescent labeling, multi-plexing, and capillary-based electrophoresis (Ito et al.,1994; Buntjer et al., 2001; Cho et al., 2001).
81
Tabl
e2.
Com
preh
ensi
vetr
ansc
ript
profi
ling
ofpl
ant
spec
ies
byar
ray
and
cDN
A-A
FLP
tech
nolo
gies
.T
heta
ble
lists
stud
ies
upto
1A
pril
2001
.N
G,i
nfor
mat
ion
that
isno
tgi
ven
inth
ere
spec
tive
refe
renc
e.In
addi
tion
toth
est
udie
sgi
ven
inth
ista
ble,
the
Ara
bido
psis
Func
tiona
lC
onso
rtiu
m(A
FGC
)di
spla
ysda
tafr
omm
ultip
lecD
NA
mic
roar
ray
expe
rim
ents
(ca.
7500
gene
s)at
http
://af
gc.s
tanf
ord.
edu/
(Wis
man
and
Ohl
rogg
e,20
00).
Thi
ssi
teal
low
sth
epu
blic
toan
alyz
eda
taan
dse
tthe
irow
nth
resh
olds
.The
size
ofth
eda
taba
se(c
a.20
0ar
rays
),va
riet
yof
expe
rim
ents
and
inpa
rtic
ular
itsfr
eeac
cess
mak
eit
asu
bsta
ntia
lre
sour
cein
plan
tres
earc
h.Sc
haff
eret
al.(
2001
)ha
vepu
blis
hed
som
eof
the
AFG
Cda
ta.
Ref
Spec
ies
Stud
yD
etai
lsof
tech
nolo
gySe
nsit
ivit
yN
orm
aliz
atio
nT
hres
hold
sE
xper
imen
talc
onfir
mat
ion
cDN
A-A
FL
Pst
udie
s
Bac
hem
etal
.(19
96,1
998)
Sola
num
tube
rosu
mPo
tato
tube
rde
velo
pmen
tA
se/T
aql
1co
pype
rce
llE
qual
lane
load
ing
Vis
uald
iffe
renc
esN
orth
ern
anal
ysis
of4
gene
s
220
of25
6pr
imer
com
bina
tion
s( +
2/+2
)C
onst
itut
ivel
yex
pres
sed
gene
s1
frag
men
tsve
rifie
din
+3/+
3an
alys
is
ca.4
0%co
vera
geSe
quen
ceof
200
frag
men
ts
Dur
rant
etal
.(20
00)
Nic
otia
nata
bacu
mC
lado
spor
ium
fulv
um(A
vr9)
Apo
I/M
seI
NG
Equ
alla
nelo
adin
gV
isua
ldif
fere
nces
Frag
men
tsve
rifie
din
+3/+
2an
alys
is
infe
ctio
nan
dw
ound
resp
onse
s25
6pr
imer
com
bina
tion
s( +
2/+2
)C
onst
itut
ivel
yex
pres
sed
gene
sN
orth
erns
-4
isol
ated
cDN
As
ca.7
6%co
vera
ge
Jone
set
al.(
2000
)R
ubus
idae
usFr
uitr
ipen
ing
Eco
RI/
Mse
IN
GE
qual
lane
load
ing
Vis
uald
iffe
renc
esN
orth
ern
and
sequ
ence
64pr
imer
com
bina
tion
s( +
1/+2
)C
onst
itut
ivel
yex
pres
sed
gene
san
alys
isof
7fr
agm
ents
Oka
mur
oet
al.(
2000
)A
.tha
lian
aSe
edde
velo
pmen
t2
enzy
me
com
bina
tion
sN
GE
qual
lane
load
ing
>2-
fold
RT-
PCR
1024
prim
erco
mbi
nati
ons
( +2/+3
)C
onst
itut
ivel
yex
pres
sed
gene
s
Arr
ayst
udie
s
Aha
roni
etal
.(20
00)
Fra
gari
a×
anan
assa
Frui
tmat
urat
ion
Mic
roar
ray
ca.1
200
uniq
uest
raw
berr
yE
STs
NG
Glo
bal
>2.
24–3
.32
Nor
ther
nan
alys
isof
2ge
nes
Petu
nia
hybr
ida
ca.3
40un
ique
petu
nia
EST
s
2ve
ctor
prim
ers
-5′
amin
o-m
odifi
ed
Ari
mur
aet
al.(
2000
)P
hase
olus
luna
tus
Res
pons
esto
spid
erm
ites
Mic
roar
ray
-20
32E
STs
NG
NG
3-fo
ldN
G
2ve
ctor
prim
ers
Boh
nert
etal
.(20
01)
Mes
embr
yant
hem
umcr
ysta
llin
umSa
ltst
ress
tole
ranc
eM
icro
arra
y-
ca.2
600
EST
sfr
omsa
lt-s
tres
sed
NG
Glo
bal
>3
fold
in3
outo
f4
spot
sN
G
A.t
hali
ana
M.c
ryst
alli
num
,921
2on
2re
plic
ate
expe
rim
ents
A.t
hali
ana
EST
s
Vec
tor-
spec
ific
prim
ers
Des
prez
etal
.(19
98)
A.t
hali
ana
Lig
ht/d
ark
vda
rk-g
row
nse
edli
ngs
Nyl
onfil
ters
-ca
.800
EST
s>
1:10
000
100
‘non
-var
ying
’>
2-fo
ldN
orth
ern
anal
ysis
of4
gene
s
2ve
ctor
prim
ers
refe
renc
ecl
ones
Fang
etal
.(20
00)
A.t
hali
ana
Stre
ssre
spon
ses
Mic
roar
ray
-ca
.10,
000
cDN
As
NG
Glo
bal-
met
aGri
d>
2-fo
ldR
T-PC
R
Gen
e-sp
ecifi
cpr
imer
Gir
keet
al.(
2000
)A
.tha
lian
aD
evel
opin
gse
eds
Mic
roar
ray
-27
15Se
ed-e
xpre
ssed
EST
s1:
7500
0-
1:10
000
0G
loba
l>
2-fo
ldN
G
Plas
mid
DN
A-
2ve
ctor
prim
ers
and>
3×ba
ckgr
ound
Har
mer
etal
.(20
00)
A.t
hali
ana
Cir
cadi
anry
thm
sA
ffym
etri
xG
eneC
hip
-ca
.820
0ge
nes
1:10
000
0(A
ffym
etri
x)G
loba
lG
enes
wit
h>
95%
prob
able
NG
[http
://w
ww
.aff
ymet
rix.
com]
corr
elat
ion
wit
hco
sine
test
wav
e
16pr
obe
pair
s/ge
ne,2
5m
erol
igos
Hih
ara
etal
.(20
01)
Syne
choc
ysti
sPC
C68
03A
ccli
mat
ion
tohi
ghli
ght
Mic
roar
ray
-30
79O
RFs
NG
Glo
bal
Sign
alin
tens
itie
s>
2000
Nor
ther
nan
alys
isof
2ge
nes
(TaK
aRa
Shuz
o)ht
tp:/
/tak
ara.
co.jp
/fo
r3
tim
epo
ints
C-t
erm
inal
1kb
ofco
ding
regi
ons
Kaw
asak
iet
al.(
2001
)O
ryza
sati
vaSa
ltst
ress
Mic
roar
ray-
1728
EST
sfr
omsa
lt-s
tres
sed
root
sN
GG
loba
l-m
etaG
rid
>1.
6-fo
ldN
orth
ern
anal
ysis
of4
gene
s
2ve
ctor
prim
ers
-5′
amin
o-m
odifi
edA
vera
geof
trip
lica
tesp
ots
Spot
ted
intr
ipli
cate
Mal
eck
etal
.(20
00)
A.t
hali
ana
Syst
emic
acqu
ired
resi
stan
ceM
icro
arra
y-
ca.7
000
EST
s1:
100
000
(Inc
yte)
Glo
bal
>2.
5-fo
ldN
orth
ern
anal
ysis
on40
gene
s
-14
diff
eren
tcon
diti
ons
2ve
ctor
prim
ers
-5′
amin
o-m
odifi
edli
mit
ofde
tect
ion=
1.74
(Inc
yte)
McG
onig
leet
al.(
2000
)Z
eam
ays
Glu
tath
ione
S-T
rans
fera
seM
icro
arra
y-
42E
STs
NG
Glo
bal
>1.
5-fo
ldC
orre
lati
onof
high
expr
ess
and
wit
h
expr
essi
onin
etio
late
dse
edli
ngs.
2ve
ctor
prim
ers
occu
renc
ein
cDN
Ali
brar
ies.
Oka
mur
oet
al.(
2000
)A
.tha
lian
aSe
edde
velo
pmen
tM
icro
arra
y-
ca.1
0,00
0cD
NA
sN
GG
loba
l-m
etaG
rid
>2-
fold
RT-
PCR
Gen
e-sp
ecifi
cpr
imer
Aff
ymet
rix
Gen
eChi
p-
ca.8
200
gene
s1:
100
000
(Aff
ymet
rix)
Glo
bal
>2-
fold
RT-
PCR
[http
://w
ww
.aff
ymet
rix.
com]
16pr
obe
pair
s/ge
ne,2
5mer
olig
os

82
Tabl
e2
cont
inue
d.
Ref
Spec
ies
Stud
yD
etai
lsof
tech
nolo
gySe
nsit
ivit
yN
orm
aliz
atio
nT
hres
hold
sE
xper
imen
talc
onfir
mat
ion
Pete
rsen
etal
.(20
00)
A.t
hali
ana
Syst
emic
acqu
ired
resi
stan
ceM
icro
arra
y-
9861
cDN
As
NG
Glo
bal
>2-
fold
Nor
ther
nan
alys
isof
3ge
nes
2ve
ctor
prim
ers
-5′
amin
o-m
odifi
ed
Rey
mon
det
al.(
2000
)A
.tha
lian
aW
ound
ing
and
inse
ctfe
edin
gM
icro
arra
y-
150
defe
nse-
rela
ted
EST
sN
G16
cont
rolg
enes
>2-
fold
Nor
ther
nan
alys
isof
3ge
nes
2ve
ctor
prim
ers
and>
2×ba
ckgr
ound
Rua
net
al.(
1998
)A
.tha
lian
aL
eaf,
root
s,M
icro
arra
y-
1443
EST
s≥1
:100
000
Inte
rnal
cont
rols
>2-
fold
Nor
ther
nan
alys
isof
6ge
nes
flow
erbu
ds,o
pen
Flow
ers
2ve
ctor
prim
ers
-5′
amin
o-m
odifi
ed
Scha
ffer
etal
.(20
01)
A.t
hali
ana
Cir
cadi
anan
ddi
urna
lrhy
thm
sM
icro
arra
y-
ca.7
800
uniq
ueE
STs
(AFG
C)
1:50
000
Glo
bal
>2-
fold
NG
2ve
ctor
prim
ers,
http
://a
fgc.
stan
ford
.edu
/an
d>
3×ba
ckgr
ound
Sche
naet
al.(
1995
)A
.tha
lian
aL
eave
sv
root
s.M
icro
arra
y-
45E
STs
1:50
000
Equ
alam
ount
sof
mR
NA
dose
dN
GN
orth
ern
anal
ysis
of3
gene
s
HA
T-tr
ansg
enic
vw
tw
ith
equa
lam
ount
sof
hum
an
acet
ylch
olin
ere
cept
orm
RN
A
Sche
nket
al.(
2000
)A
.tha
lian
aD
efen
sere
spon
ses
toA
lter
nari
aM
icro
arra
y-
2375
defe
nse-
asso
c.N
GG
loba
l>
2.5-
fold
NG
bras
sici
cola
,Sal
icyl
icac
id,m
ethy
lan
dre
gula
tory
EST
s2
stan
dard
devs
>ba
ckgr
ound
jasm
onat
ean
det
hyle
netr
eatm
ents
2ve
ctor
prim
ers
-5′
amin
o-m
odifi
ed
Seki
etal
.(20
01)
A.t
hali
ana
Dro
ught
and
cold
stre
ssM
icro
arra
y-
ca.1
300
full
-len
gth
cDN
As
1:30
000
0A
lpha
-tub
ulin
cont
rol
>2-
fold
Nor
ther
nan
alys
isof
80ge
nes
2ve
ctor
prim
ers
Wan
get
al.(
2000
b)A
.tha
lian
aN
itra
tein
duct
ion
Mic
roar
ray
-55
24un
ique
gene
EST
s(I
ncyt
e)1:
100
000
(Inc
yte)
Glo
bal
>2-
fold
Nor
ther
nan
alys
isof
mul
tipl
ege
nes
http
://w
ww
.incy
te.c
omL
imit
ofde
tect
ion=
1.74
(Inc
yte)
2ve
ctor
prim
ers
-5′
amin
o-m
odifi
ed
Yaz
akie
tal
.(20
00)
Ory
zasa
tiva
Pani
cle,
call
us,l
eaf
and
root
Mic
roar
ray
-12
65E
STs
1:20
000
Glo
bal
>2–
3-fo
ldN
G
Full
inse
rt-
vect
orpr
imer
s
3′ -unt
rans
late
dre
gion
-ge
ne-s
peci
ficpr
imer
s
83
Figure 2. Establishment (A) and interrogation (B) of the cDNA-AFLP Reference Database for Arabidopsis thaliana. 1, 27 tissues wereharvested to create 11 pooled samples; 2, mRNAs from these pools were analyzed by cDNA-AFLP analysis (+2/+3 differentiating nucleotides,2 enzyme combinations); 3, 4, all cDNA-AFLP bands were eluted from the gels, PCR-amplified and sequenced; 5, the sequence informationfor each fragment was linked to its gel mobility in a database; 6, this database can be queried with AFLP� profiles to link band mobil-ities and intensities (expression data) with the individual band’s sequence (gene). AFLP� is a registered trademark of Keygene N.V. TheAFLP� technology is covered by patents owned by Keygene N.V.
Of the other ‘selective fragment amplification’methods, READS and TOGA generate only one frag-ment for each mRNA species. Arguments can be madein favor of the simplicity of such ‘one-fragment’ sys-tems, but counter arguments can also be put forwardfor the value of redundancy in data sets, as illustratedby the multiple fragments per mRNA species obtainedwith cDNA-AFLP and GeneCalling. Stanssens andZabeau have modified the cDNA-AFLP method sothat only one restriction fragment is monitored foreach cDNA (Breyne and Zabeau, 2001). Using thismodified method, they profiled transcript levels duringthe cell cycle of tobacco, analyzing 18 000 cDNA-AFLP tags, of which 10% exhibited a modulatedbanding pattern.
Indirect analysis
The principles underlying the hybridization of com-plementary nucleotide sequences are embodied in thestructure of duplexed nucleic acids, and have beenexploited experimentally for decades (Gillespie andSpiegelman, 1965). In this time, nucleic acid hy-bridization has been used in a variety of guises inthe quantification of plant RNA levels; in the 1970s,it was used to study sequence complexity (Goldberget al., 1978). Also in that decade, Southern developeda method using a solid support in hybridization studiesof DNA fragments separated by gel electrophoresis(Southern, 1975). This led to a major advance in theanalysis of gene expression with the development ofnorthern-transfer hybridization (Alwine et al., 1977).This technique has been immensely useful over the

84
years, though ironically the approach is less globaland the method less genomic in nature than preced-ing solution-based systems. With the availability ofnucleotide sequences and clones as physical reagents,hybridization-based approaches now allow for the si-multaneous analysis of tens of thousands of genes;quite literally one can globally survey the transcriptionof a plant by hybridization. The interest in this form oftranscript profiling has been spurred by the develop-ment of two parallel microarray-based technologies,one based on spotting cDNA fragments (cDNA mi-croarrays; Schena et al., 1995), the other, the arrayedsynthesis of oligonucleotides (GeneChips; Lockhartet al., 1996). These two methods have been exten-sively reviewed in recent years (Duggan et al., 1999;Lipshutz et al., 1999).
Oligonucleotide-based arrays
GeneChips, oligonucleotide-based arrays produced byAffymetrix, have been made to about 8200 differ-ent Arabidopsis ESTs (Zhu and Wang, 2000; Harmeret al., 2000) and 1500 maize ESTs (Baldwin et al.,1999); a full transcriptome Arabidopsis GeneChipis also under development (Zhu and Wang, 2000;Cho and Walbot, 2001). These arrays are producedby the synthesis of oligonucleotides directly onto asolid matrix using photolithographic masks to deter-mine the correct sequence (Lockhart et al., 1996;Warrington et al., 2000). For the commercially avail-able Arabidopsis GeneChips, 16 ‘probe pairs’ weresynthesized per gene. One set of 16 consisted of‘mismatch oligonucleotides’ that were identical to a‘perfect match’ set except for the 13th nucleotidein each 25-mer. These mismatched oligonucleotidesare used to assess cross-hybridization and local back-ground signals. Affymetrix GeneChips are expensiveto make, not least because of the need to manufac-ture the glass masks. However, digital micromirrorarrays that form virtual masks may provide a cheaperand more accessible alternative (Singh-Gasson et al.,1999).
There are other promising oligonucleotide-basedtechnologies, including those that array 5′-terminallymodified oligonucleotides (Kane et al., 2000;Okamoto et al., 2000), unmodified oligonucleotides(Ten Bosch et al., 2000), and phosphoamidites forthe in situ synthesis of oligonucleotides (Shoemakeret al., 2001). In this latter example, exon arrays wereconstructed spanning 50 slides, containing 1090 40860-mer probes representing 442 785 exons (Shoe-
maker et al., 2001). This system could reliably detecttranscripts at one copy per cell and the results corre-lated closely with comparable cDNA arrays (Hugheset al., 2001). Where they found discrepancies, theseinvolved genes that were members of multi-gene fam-ilies. Shoemaker et al. (2001) also produced tilingarrays consisting of overlapping oligonucleotides cov-ering an entire genomic region. Such arrays are ableto define gene structure because exons of the sametranscript show identical expression patterns across allexperimental treatments. Similar tiling arrays are pro-posed for the annotation of A. thaliana (Cho and Wal-bot, 2001). Although such arrays are high-throughputin nature, full-length cDNAs still have a role to play inannotation because of the reliability and precision oftheir sequences.
Two forms of ink-jet printer (bubble-jet and piezo-electric) have been used for producing oligonucleotidearrays, and these systems promise reduced spot sizes.The delivery of phosphoamidite monomers (Blan-chard et al., 1996; Shoemaker et al., 2001) has ob-vious advantages over the dispensing of synthesizedoligonucleotides (Okamoto et al., 2000; Ansubel etal., 2001), as problems of washing and carry-over aregreatly simplified. In a comparison of the sensitivityof detection of 50-mer amino-linker modified oligonu-cleotides over PCR products about 360 bp in length,no significant difference was found provided appropri-ate design criteria were followed (Kane et al., 2000).Ten Bosch et al. (2000) came to a similar conclusion,but also presented evidence for the differentiation ofoverlapping yeast genes. Using this technology, theyhave synthesized a full transcriptome oligonucleotidearray for yeast.
cDNA-microarrays
The basic idea of spotted nucleic acid arrays for geneexpression analysis is not new and has been used insome form for over twenty years (Kafatos et al., 1979).Recently, cDNA microarraying has caused a revolu-tion in molecular biology, invited by the availability ofgenomic sequences. Its rapid incorporation into plantresearch labs is testament to the immediacy of geneexpression studies and the demand for a more holis-tic approach throughout plant molecular biology. Theencouragement of this global view of biology throughthe marriage of automation to the pertinent protocolshas benefited from the altruistic behavior of its devel-opers, who have actively dispensed their knowledge(http://cmgm.stanford.edu/pbrown/).
85
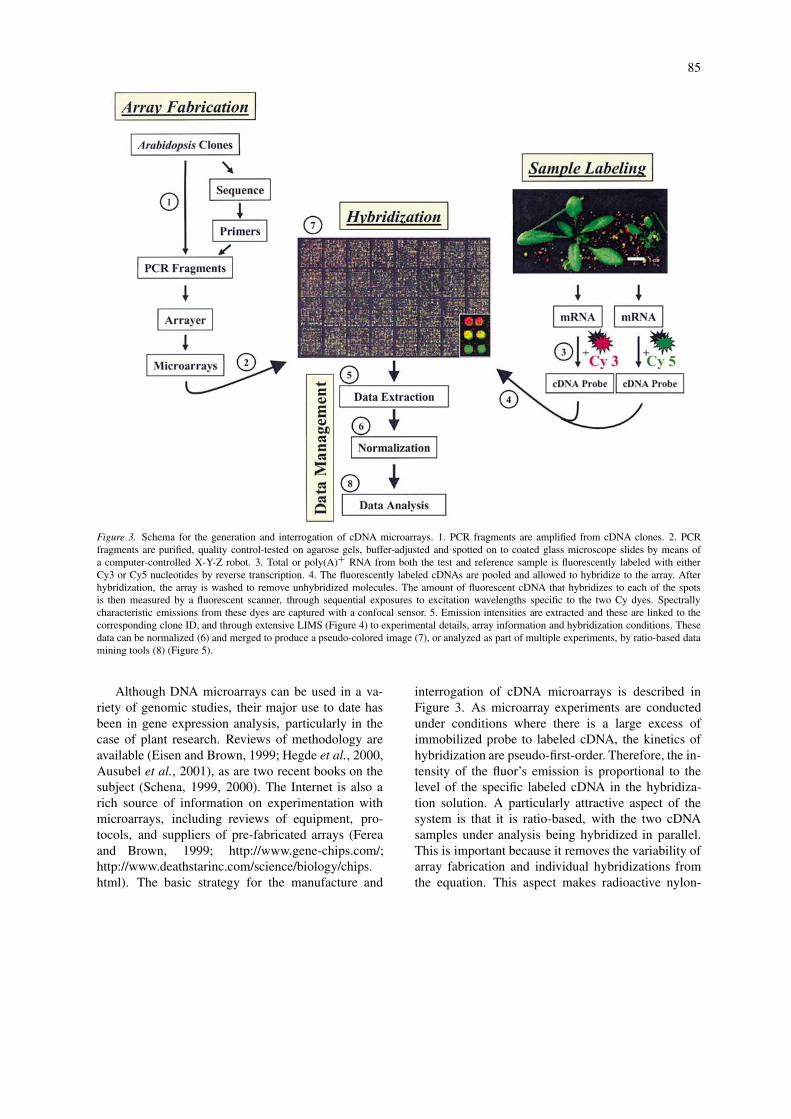
Figure 3. Schema for the generation and interrogation of cDNA microarrays. 1. PCR fragments are amplified from cDNA clones. 2. PCRfragments are purified, quality control-tested on agarose gels, buffer-adjusted and spotted on to coated glass microscope slides by means ofa computer-controlled X-Y-Z robot. 3. Total or poly(A)+ RNA from both the test and reference sample is fluorescently labeled with eitherCy3 or Cy5 nucleotides by reverse transcription. 4. The fluorescently labeled cDNAs are pooled and allowed to hybridize to the array. Afterhybridization, the array is washed to remove unhybridized molecules. The amount of fluorescent cDNA that hybridizes to each of the spotsis then measured by a fluorescent scanner, through sequential exposures to excitation wavelengths specific to the two Cy dyes. Spectrallycharacteristic emissions from these dyes are captured with a confocal sensor. 5. Emission intensities are extracted and these are linked to thecorresponding clone ID, and through extensive LIMS (Figure 4) to experimental details, array information and hybridization conditions. Thesedata can be normalized (6) and merged to produce a pseudo-colored image (7), or analyzed as part of multiple experiments, by ratio-based datamining tools (8) (Figure 5).
Although DNA microarrays can be used in a va-riety of genomic studies, their major use to date hasbeen in gene expression analysis, particularly in thecase of plant research. Reviews of methodology areavailable (Eisen and Brown, 1999; Hegde et al., 2000,Ausubel et al., 2001), as are two recent books on thesubject (Schena, 1999, 2000). The Internet is also arich source of information on experimentation withmicroarrays, including reviews of equipment, pro-tocols, and suppliers of pre-fabricated arrays (Fereaand Brown, 1999; http://www.gene-chips.com/;http://www.deathstarinc.com/science/biology/chips.html). The basic strategy for the manufacture and
interrogation of cDNA microarrays is described inFigure 3. As microarray experiments are conductedunder conditions where there is a large excess ofimmobilized probe to labeled cDNA, the kinetics ofhybridization are pseudo-first-order. Therefore, the in-tensity of the fluor’s emission is proportional to thelevel of the specific labeled cDNA in the hybridiza-tion solution. A particularly attractive aspect of thesystem is that it is ratio-based, with the two cDNAsamples under analysis being hybridized in parallel.This is important because it removes the variability ofarray fabrication and individual hybridizations fromthe equation. This aspect makes radioactive nylon-
86
or nitrocellulose-based arrays less attractive (Desprezet al., 1998). Indeed, while absolute quantification ofRNA levels can be inferred by incorporating appropri-ate dosing controls, generally it is the relative increaseof a mRNA between different treatments or tissues thatis of interest. For mRNA copy-number calculations,the highly optimized kinetics of olignucleotide arraysoffers the better solution.
Because spots can be arrayed at distances as lowas 150 µm center-to-center, it is self-evident thatrepresentative PCR fragments from the complete tran-scriptome of A. thaliana can be deposited on a singleslide. Full transcriptome arrays hold a huge attrac-tion (DeRisi et al., 1997; Hihara et al., 2001), asone can assay traits without preconceived ideas. Evenso, judiciously selected gene subsets can also be usedeffectively (Aharoni et al., 2000; Girke et al., 2000;Reymond et al., 2000; Schenk et al., 2000; Kawasakiet al., 2001). RDA (Welford et al., 1998; Nelson andDenny, 1999), SSH (Yang et al., 1999) and differentialdisplay-based methods (Display Systems, Vista, CA)have all been used to refine the complexity of probeson microarrays. Indeed, as microarraying becomesa standard laboratory technology emphasis may shiftfrom full transcriptome coverage to systems that allowfor more rapid screening of gene subsets. Then, fulltranscriptome arrays may be used largely as a meansof refining candidate probes for smaller arrays. In thisvein, Genometrix produces slides (VistaArrays) whichcontain 96 miniarrays, each of 256 probes, which canbe used to process samples in parallel (Eggers, 2000).
Automation and laboratory information managementsystems (LIMS)
Although the first published report on cDNA microar-rays in 1995 included 48 Arabidopsis ESTs (Schenaet al., 1995), it is only in the last year that there hasbeen an explosion of plant related microarray stud-ies (Table 2). This suggests that the revolution goingon in plant molecular biology labs has less to dowith microarraying than with the introduction of au-tomation. Up to 1 April 2001, there have been 18published plant microarray papers (17 cDNA microar-ray, 1 GeneChip), of which 12 have involved analysisof A. thaliana. In addition, work has been reportedon rice, maize, strawberry, petunia, ice plant, limabean and the cyanobacterium Synechocystis. We haveused cDNA microarraying to study the Arabidopsistranscriptome (Fang et al., 2000; Okamuro et al.,2000). As of the end of the millennium, these mi-
croarrays allowed profiling of greater than 40% of thetranscriptome (Fang et al., 2000). To achieve this pref-erentially large coverage at the time, we made use ofthe A. thaliana full-length cDNA-sequencing programat Ceres, Inc. From our collection of cDNA clones,a set of about 10,000 was selected and gene-specificprimers were designed close to the 3′ end of eachindividual cDNA. To ensure the quality of the PCRproduct from these clones we instigated a highly auto-mated system that tracks samples, including clones,PCR fragments and tissues, from the start of theprocess to final data analysis (Figure 4). While sucha LIMS system might seem a luxury, it is in fact a sub-stantial time-saver, as it reduces the number of qualitycontrol assays one has to perform with a more manualprocess. Automation, LIMS and effective data man-agement are essential components of comprehensivetranscript profiling (Ermolaeva et al., 1998; Bassettet al., 1999). We made several conscious decisionswith regard to the generation of PCR fragments. Onour robotics we use disposable tips for liquid dis-pensing to avoid cross-contamination of reagents andtemplates. To further ensure the specificity of theprobes on the microarrays we also use gene specificprimers. For anyone running high-throughput roboticprocedures such as microarraying, assays to check forcross contamination are a constant concern, thoughwith planning some of these issues can be addressedas part of data collected from every array hybridiza-tion. Contamination of microarrays can be insidiousif through ill fortune low-expressing gene probes be-come contaminated with DNA complementary to highexpressing genes. Sequencing or any other commonassay method would not readily detect such contami-nations. Consequently, preventative action is the bestpolicy. It is interesting that apart from the work per-formed at Ceres, Inc., most current plant studies do notuse gene-specific primers (Fang et al., 2000; Okamuroet al., 2000). Also, in contrast to the arrays we haveproduced, only Seki et al. (2001) have used full-lengthcDNAs.
There are a large number of robots and spottingpins sold commercially for the printing of arrays (Mel-drum, 2000; Mittal, 2001), as well as the option tobuild your own robot (http://cmgm.stanford.edu/pbrown/), adapt existing robotics (Macas et al.,1998), or resort to a hand-held device (www.vp-scientific.com). Commercial robots invariably comewith good software for designing arrays and trackingclones, or it can be purchased separately (Zhou et al.,2000).
87
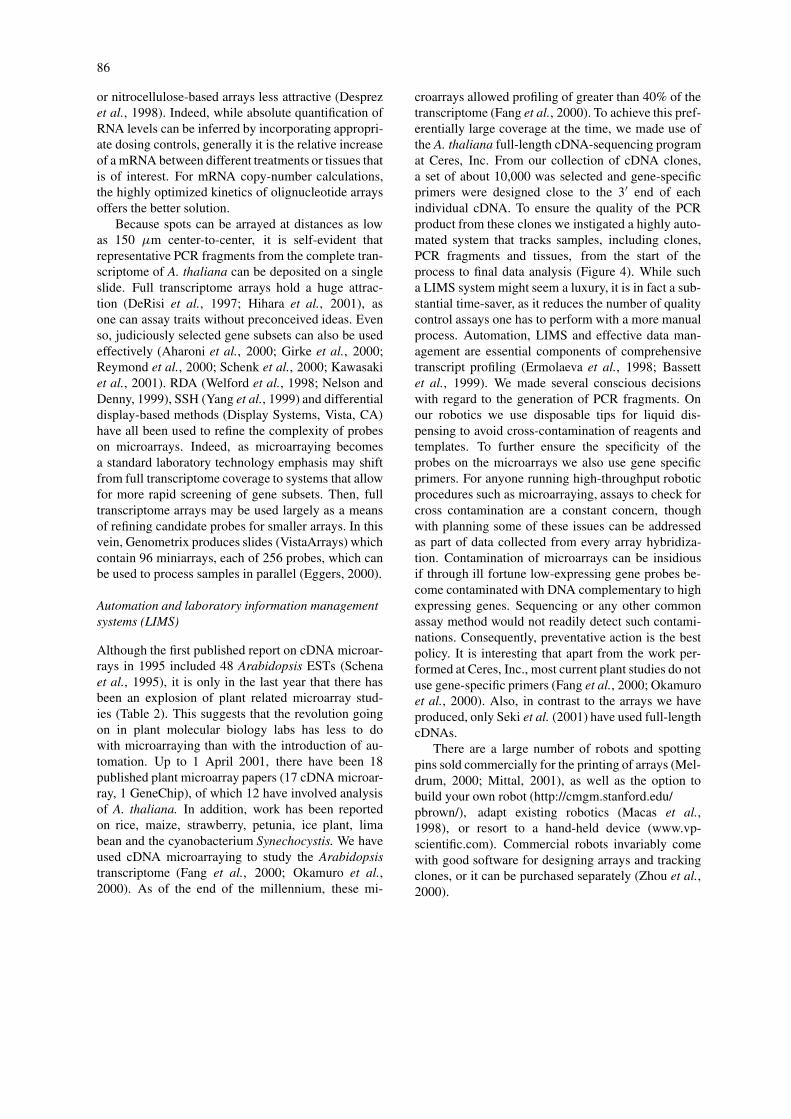
Figure 4. Laboratory Information Management System for cDNA microarray analysis. Arrows indicate the flow of materials and processes.Data flow in the facility is automated through the use of multiple robots including automated plate handling, bar codes and specialized software,except at instances where manual input is need. In these cases, stations have been set up with web interfaces to provided easy database input.Data reports are sent to and retrieved from specific groups of tables in the appropriate database by the individual processes and stations (indicatedby common shading).
Microscope slides are the popular choice as an ar-ray support because they are non-porous and show lowautofluorescence. There is now a large selection ofcommercially available coated microscope slides withamine or aldehyde surface chemistries, that have goodhydrophobicity and that enhance the binding of DNA(Celis et al., 2000; Mittal, 2001). Even so, the originaloption, polylysine coated slides, is still widely used(Eisen and Brown, 1999; Fang et al., 2000; Kawasakiet al., 2001). In some instances amino-linked PCRfragments are preferred (Ruan et al., 1998; Aharoniet al., 2000; Maleck et al., 2000; Wang et al., 2000b),on the basis that this enhances the sensitivity of thesystem (Schena et al., 1996; Aharoni et al., 2000;Kawasaki et al., 2001). Sensitivities in the range 1:20000 (Yazaki et al., 2000) to 1:300 000 (Seki et al.,
2001) have been reported in plant studies, thoughwithout any clear correlation with slide chemistry.
Cross-hybridization
During the analysis of experimental data particular at-tention has to be given to whether probes spotted on tothe glass slide cross-hybridize to heterologous cDNAs.A discovery from the genomic sequencing project wasthat 65% of the genes in Arabidopsis are members ofgene families, and the proportion of gene families withmore than two members is considerably higher thanin other sequenced eukaryotes (Arabidopsis GenomeInitiative, 2000; Bevan et al., 2001). Indeed, the evo-lution of Arabidopsis is thought to have involved anumber of large-scale duplications, followed by sub-sequent gene loss (Blanc et al., 2000; Vision et al.,2000). Even greater gene duplication is likely to be
88
found with other plant species. However, duplicationof sequence, does not necessarily mean duplication offunction (Cho and Walbot, 2001), so for comprehen-sive transcript profiling one might still wish to assayall genes. Two plant-based studies have attemptedan assessment of this problem (Girke et al., 2000;McGonigle et al., 2000). In a study by Girke et al.(2000) a FAD2 gene from Arabidopsis was arrayed inthree different forms of identical length and GC con-tent, but with nucleotide similarities to the native geneof 100%, 90% and 80%, respectively. The fragmentof 80% similarity showed no detectable hybridiza-tion. In the same paper, four ferredoxin sequencesand three acyl-ACP-desaturase sequences from otherspecies with more variable clusters of similarity tothe Arabidopsis sequences showed cross hybridizationthresholds between 60–70%. On this basis the au-thors estimated that cross-hybridization occurred withtheir system if related genes have greater than 70–80% sequence identity. Similarly, in a study of themaize glutathione S-transferase gene family, McGo-nigle et al. (2000) found that gene expression databehaved independently for genes below ca. 80% sim-ilarity. Studies on yeast estimate that cross hybridiza-tion becomes significant at or above 75% sequencesimilarity (Spellman et al., 1998). Given that cross-hybridization will occur, solutions include a morejudicial choice of probes, representing 3′-UTR re-gions of mRNAs (Yazaki et al., 2000), or the use ofoligonucleotide-based microarrays that can discrimi-nate between nucleotide sequences of less than 93%similarity (Lipshutz et al., 1999). However, evenif oligonucleotide arrays eventually become the pre-dominate microarray platform, one area where cDNAmicroarrays, with their longer probes, may have an ad-vantage is in experiments with heterologous species;for example, Arabidopsis microarrays might be usedin parallel experiments with Brassica species (Girkeet al., 2000).
Sample preparation
The choice of samples and the quality of labeled cD-NAs are major factors in determining the sensitivityof microarraying. When it comes to sampling of tis-sues, studies on plant microarrays and GeneChipshave illustrated how genes show diurnal and circa-dian responses (Harmer et al., 2000; Schaffer et al.,2001). These phenomena are not new observations(Kreps and Kay, 1997), though the data do providean estimate of the number of similarly affected genes
in Arabidopsis. However, these studies, and an ex-ample of sample-to-sample variation in the paper ofKawasaki et al. (2001), illustrate at a molecular levelthe importance of good experimental and samplingdesign, if one aspires to assay a single variable. In-evitably, selection of tissues must be as sophisticatedas the methods used for transcript profiling, as ulti-mately one wishes to profile transcripts in one or asmall cluster of cells. To date, published plant mi-croarray experiments have involved the analysis ofheterogeneous samples, either whole plants or tissues,each of which consists of multiple cell types, spatiallydistinct from one another. Differences in mRNA lev-els in a small number of cells may be swamped bythe dilution effect of RNA from millions of differentcells. There is no universal answer to this problem,and possible solutions include cell culturing, cell sort-ing, ablation experiments and the judicious use ofmutants (Sheen et al., 1995; McCabe et al., 1997;Liu et al., 1999; Reymond et al., 2000; Bohnert et al.,2001). Laser capture microdissection (LCM) has beenused in animal systems for the procurement of micro-scopic and pure subpopulations of cells from tissues(Emmert-Buck et al., 1996), but its use in plant tissuesmay be complicated by the cell walls. Ultimately, allmodern profiling methods will be at their most power-ful in understanding mechanisms of development anddifferentiation when combined with classical geneticand cytological approaches.
Conclusions from expression profiling are influ-enced by the ability to make comparisons across alarge number of diverse and precisely executed experi-ments. In designing an experiment one must decide onthe most appropriate control samples to use in suchcomparisons. For pairwise analysis this is generallya simple matter, but for experiments with multiplesamples universal controls might be desirable to al-low comparison across different data sets (Eisen andBrown, 1999). Care must also be taken in the choiceof controls spiked into the hybridization solution tomonitor microarray performance and to facilitate nor-malization. The experimental design process extendsto the seemingly obvious repetition of experiments inorder to assess variability, though this is not alwaysfollowed (Lee et al., 2000).
Having sampled your tissue, one needs to decidewhat RNA fraction should be analyzed. Differentialtranscript levels between similar samples, perhapstreated and untreated, can be determined by measuringmRNA levels in total cell RNA. This allows a cor-relation to be drawn between a change in level of a

89
particular transcript and the treatment. However, sincemRNA levels do not always correlate with protein lev-els the extrapolation to measuring translation is lesseasily made (Gygi et al., 1999). The correlation ofdifferential transcript levels with the translationally ac-tive versus the translationally inactive pools of mRNAis particularly difficult if the samples are disparatein nature. A solution to this is through the labelingof polysome-associated RNA (translationally activemRNA) as against mRNAs associated with ribonu-cleoprotein particles or monosomes (translationallyinactive mRNA) (Zong et al., 1999). Plant polysomefractions can be readily separated by sucrose gradi-ent centrifugation (Jackson and Larkins, 1976). Thisprocess can be taken a step further in that purificationof membrane-bound polysomes will afford a selectionof mRNAs of proteins destined for membranes and se-cretion (Diehn et al., 2000). Similar strategies mightalso be envisaged for the study of other subcellularlocalization.
cDNA microarray analysis traditionally uses arelatively large amount of mRNA (1–2 µg). Thisis usually labeled by the incorporation of fluores-cently labeled nucleotides into first-strand cDNA or bythe cross linking of N-hydroxysuccinimide-activatedfluorescent dyes to aminoallyl groups incorporatedinto the cDNA (http://cmgm.stanford.edu/pbrown/). Aconsequence of the need to work with more refinedtissues is that these levels of mRNA may not beavailable. In conjunction with LCM, an amplificationmethod based on cyclical rounds of T7 polymerasein vitro transcription has been developed (Luo et al.,1999; Salunga et al., 1999; Wang et al., 2000a). Thismethod makes use of the linear amplification of T7polymerase, and has been shown to produce resultsthat correlate well with original mRNA levels, in con-trast to the exponential nature of PCR-based methods(Lockhart and Winzeler, 2000). Luo et al. (1999) re-port the amplification of mRNA from 500–1000 braincells for microarray analysis. Alternative strategies in-clude increasing the effective concentration of a subsetof the RNA population under study, by reducing itscomplexity. This can be done by generating probesfrom differential display or cDNA-AFLP fragments(Trenkle et al., 1998). Other than the amplificationof the labeled sample, there are also procedures thatallow for kinetically more efficient hybridizations andthe amplification of fluorescent signals (Stears et al.,2000).
Hybridization conditions
Microarray hybridizations are performed for a periodof 4–16 h in either formamide or SSC-based solutions(Eisen and Brown, 1999; Hegde et al., 2000). Volumesare kept to a minimum (ca. 0.033 µl per mm2 of cover-slip) under a floating coverslip. To allow the process-ing of twelve microarrays at one time, Genomic Solu-tions, Michigan, (www.genomicsolutions.com), sellsan automated hybridization and washing station. How-ever, one area that sets current cDNA-microarraysapart from membrane-based arrays is that they arenot generally reusable (Desprez et al., 1998; Bald-win et al., 1999), though a newer slide derivatizationpurports to make this possible (Beier and Hoheisel,1999). Nanogen and Illumina are two companiesthat have experimented with alternative technologiesthat reduce hybridization times and allow for arrayreuse. Nanogen has produced a chip where the probesare independently, electronically activated (Sosnowskiet al., 1997; Edman et al., 1997). Current models haveonly 99 probe sites, making them more suitable forsmall-scale expression profile studies. Even so, theelectronics allow the labeled DNA interrogating thechip to be effectively concentrated, thus speeding hy-bridization times dramatically. Controlled reversal ofthe electric field can also achieve a defined washingstringency. With the independently controlled probes,this raises the prospect of having highly defined hy-bridization and washing conditions, for what is tradi-tionally a passive process controlled by salt concen-trations and temperature. The electronic process alsofacilitates the effective removal of all labeled cDNA,so that the chips can be re-used. Such a system couldallow multiple hybridization experiments to be per-formed extremely quickly. The system is currentlybeing beta tested as a gene expression system.
By contrast, Illumina produces self-assembledbead arrays on bundles of individual, selectivelyetched optical fibers (Ferguson et al., 1996; Walt,2000). Oligonucleotides can be either synthesized di-rectly on to these beads or pre-synthesized moleculescan be attached. The sequences on the beads areregistered by fluorescent tagging of the beads or bydecoding secondary DNA tags by hybridization. Thissystem is reported to assay very small volumes andto be highly sensitive, allowing for potentially fasterhybridizations. In addition, multiple hybridization cy-cles can be performed with the same array (Steemerset al., 2000). Other systems in development for im-proving hybridization kinetics and signal detection
90
have been recently reviewed (Steel et al., 2000; Blohmand Guiseppi-Elie, 2001).
The parallel hybridization of two cDNA samples,a major factor in the efficiency of microarraying, isafforded by the dual detection of fluorescent moieties,typically Cy3 and Cy5. The fluorescent signals fromcDNA bound to probes on a microarray are monitoredby scanning systems that are mostly confocal in nature(http://cmgm.stanford.edu/pbrown/) (Schermer, 1999;Basarsky et al., 2000; Mittal, 2001). Some commer-cial models now allow the use of multiple absorptionand emission wavelengths, facilitating third-channelnormalization of hybridizations and more than twosamples to be hybridized to each microarray. Datafrom these machines is typically captured as two 16-bit TIFF images, one for each fluor. Commercial andpublic programs are available for extracting data fromthese image files, and these also include features forspot finding and the flagging of physical artifacts, suchas dust (Bassett et al., 1999; Mittal, 2001).
Data analysis
Transcript profiling produces extremely large datasets, and even relatively simple studies can run intomillions of data points (e.g. Arabidopsis FunctionalConsortium (AFGC; http://afgc.stanford.edu/) (Wis-man and Ohlrogge, 2000). It is self-evident that suchdata sets cannot be organized on simple spreadsheets,but instead requires effective database resources formanagement and analysis (Bassett et al., 1999; Zhouet al., 2000). Molecular biology and computationare inexorably entwined in the science of transcriptprofiling (Figures 4 and 5).
Normalization of extracted data is a requirementfor all gene expression profiling. This is because,irrespective of the method, part of the processing of bi-ological material and data extraction is inevitably doneseparately for each sample. A number of normaliza-tion approaches can be employed, including the use of‘housekeeping genes’, that are hypothesized to showa constant expression between samples, and globalapproaches, where the total level of gene expressionfor a large portion of the total genes under study isconsidered to stay constant (Table 2). Where samplesare similar, global normalization works well. For moredivergent samples, normalization with a designatedsubset of genes may have an advantage.
Because of the nature of cDNA-microarraying themost useful data output is the ratio of transcript levelsbetween two samples. The first task on being faced
with these data is to decide what is ‘significant’. Forplant microarray studies, ratios of 1.5 (McGonigleet al., 2000) to 3.32 (Aharoni et al., 2000) have beenchosen, with provision for signals to be above a certainbackground threshold (Table 2). In some cases thesevalues have been based on experiments where variabil-ity was assessed between duplicate RNA preparations(Wang et al., 2000b; Kawasaki et al., 2001), or in moreadvanced studies, between two duplicate experiments(Schenk et al., 2000; Kawasaki et al., 2001). Hugheset al. (2000) clearly illustrated the importance of suchcontrol experiments by establishing a gene-specificerror model, conducting 63 control experiments com-pared to 300 compendium experiments in yeast. Inthis way, the effect of intrinsically fluctuating mRNAspecies can be considered. This is particularly impor-tant for GeneChip experiments where each array isinterrogated with only a single labeled cDNA popu-lation (Harmer et al., 2000; Zhu and Wang, 2000).Alternative strategies have involved assessments frommultiple repetitions of the same experiment and statis-tical analysis of variance (Aharoni et al., 2000; Sekiet al., 2001).
Correlative analysis
An analysis of ratios provides a valuable means oflooking at pair-wise comparisons (Arimura et al.,2000; Wang et al., 2000b; Seki et al., 2001). How-ever, particularly for associating gene function, greaterinsights can be obtained when one draws correlationsbetween the coordinated responses of genes (Figure 5;Fang et al., 2000) (Okamuro et al., 2000; Malecket al., 2000; Schaffer et al., 2001; Kawasaki et al.,2001). Hughes et al. (2000) present a compellingcase for functionally annotating yeast by creating acompendium of transcript profiles from 300 diversemutations and chemical treatments. The principle isa simple one – ‘guilt by association’, genes whoseexpression profiles cluster together over a range ofexperimental treatments are more likely to be func-tionally linked than those that do not (Chu et al.,1998). As such, the functions of uncharacterized genesmight be defined by their clustering with genes ofknown function over a diverse range of experiments(Chu et al., 1998) (Figure 5; Fang et al., 2000). Ofthe many clustering methods, the pairwise average-linkage cluster analysis of Eisen et al. (1998), withits visually pleasing graphical representation, has beenthe most popular in plant microarray studies (Figure 5;Fang et al., 2000) (Maleck et al., 2000; Schaffer
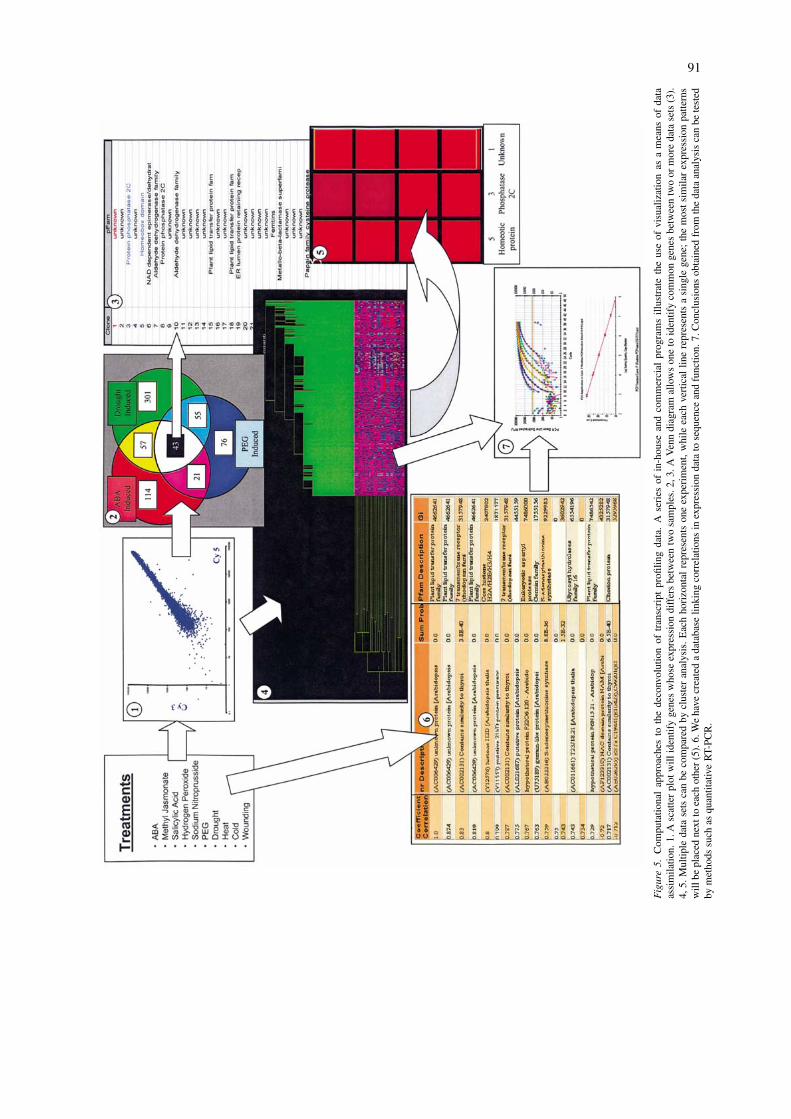
91
Fig
ure
5.C
ompu
tatio
nal
appr
oach
esto
the
deco
nvol
utio
nof
tran
scri
ptpr
ofilin
gda
ta.
Ase
ries
ofin
-hou
sean
dco
mm
erci
alpr
ogra
ms
illus
trat
eth
eus
eof
visu
aliz
atio
nas
am
eans
ofda
taas
sim
ilatio
n.1.
Asc
atte
rpl
otw
illid
entif
yge
nes
who
seex
pres
sion
diff
ers
betw
een
two
sam
ples
.2,3
.AV
enn
diag
ram
allo
ws
one
toid
entif
yco
mm
onge
nes
betw
een
two
orm
ore
data
sets
(3).
4,5.
Mul
tiple
data
sets
can
beco
mpa
red
bycl
uste
ran
alys
is.
Eac
hho
rizo
ntal
repr
esen
tson
eex
peri
men
t,w
hile
each
vert
ical
line
repr
esen
tsa
sing
lege
ne;
the
mos
tsim
ilar
expr
essi
onpa
ttern
sw
illbe
plac
edne
xtto
each
othe
r(5
).6.
We
have
crea
ted
ada
taba
selin
king
corr
elat
ions
inex
pres
sion
data
tose
quen
cean
dfu
nctio
n.7.
Con
clus
ions
obta
ined
from
the
data
anal
ysis
can
bete
sted
bym
etho
dssu
chas
quan
titat
ive
RT-
PCR
.
92
et al., 2001; Kawasaki et al., 2001). Even so, its re-placement of actual data with averaged data at eachiteration, the use of similarity measures as opposedto Euclidean distance, and the creation of a hierar-chical format where one does not naturally exist, arefactors to consider when evaluating the results (Tava-zoie et al., 1999). To alleviate some of these problems,data can be first partitioned into preliminary groupingsusing methods such as self-organizing maps (SOMs;Tamayo et al., 1999) and k-means clustering (Tava-zoie et al., 1999). However, these methods requirea decision on how many clusters you wish to define,although there are other methods where this is not nec-essary (Heyer et al., 1999). Needless to say, all thesemethods have prejudices, and the similarity metrics inthemselves are not an indication of the significanceof clusters. We have set up an expression databaselinking correlations in expression data to sequenceand function (Volkmuth, unpublished data; Figure 5;Fang et al., 2000). Recently, a number of commer-cial software packages have become available that leadthe user through expression data analysis with visu-ally pleasing normalization, correlation and clusteringfeatures (Figure 5) (Richmond and Somerville, 2000;Goodman, 2001; Mittal, 2001).
Downstream analysis
Nobody handling large gene expression data setswould question the importance of computationallybased organization and analysis (Figures 4 and 5). Ul-timately, however, because of a number of technicalissues, such as sample tracking, cross-hybridizationand contamination, one should independently confirmimportant results obtained by expression profiling.The favorite method for plant microarray studies hasbeen northern analysis, though as an automated systemreal-time RT-PCR is an attractive alternative (Table 2,Figure 5; Sambrook and Russell, 2001). Plant expres-sion studies have shown good qualitative agreementbetween northern and microarray data (Ruan et al.,1998; Maleck et al., 2000; Wang et al., 2000b).
The value of clustering genes within and betweenexperiments can be enhanced immensely by link-age of the expression database to other informationstockpiles (Ermolaeva et al., 1998; Marcotte et al.,1999; Burks, 1999). Such databases include the Na-tional Center for Biotechnology Information (NCBI;Wheeler et al., 2001) which provides a source ofgene annotations, protein domain databases (Pfam;Bateman et al., 2000) and the Kyoto Encyclopedia
of Genes and Genomes (KEGG; Kanehisa and Goto,2000), a database of metabolic pathways. In addi-tion, transcript profiles are informative for genomeannotation, as they facilitate characterization of genesand help identify promoter elements (Spellman et al.,1998; Harmer et al., 2000). At Ceres, Inc., we are ableto link expression data to our full-length cDNA collec-tion, providing correlations with superior annotation.Part of this collection of full-length cDNA sequenceshas been provided to TIGR in order to help with theirgenomic annotation of Arabidopsis.
In another expression-based genome study, Cohenet al. (2000) showed that genes near each other onyeast chromosomes show correlated expression, sug-gesting a positional influence of chromosome struc-ture on gene expression. As one can see, multifar-ious genomic characteristics can be integrated withtranscriptional profiling. Likewise, this can be ex-tended to include information from proteomics (e.g.protein profiles and protein interaction analysis) andmetabolomics, indeed all genomic platforms, as partof a well-organized data management system. Pheno-typic data are perhaps best integrated with expressiondata by cross-reference to plant insertional mutants,noting also when and where mRNAs are expressed(Azpiroz-Leehan and Feldmann, 1997; Parinov andSundaresan, 2000; Hughes et al., 2000; Petersen et al.,2000). The net result of this data organization shouldbe a multi-dimensional representation of a plant, bothbioinformatically (Vidal, 2001) and visually (Streicheret al., 2000). This is surely the aspiration of plantgenomics, a truly holistic view of biology where dis-ciplines such as genetics, anatomy and biochemistrymerge in one vision and model of a plant. Such aplan will also provide for more insightful reductionistapproaches. In an effort to reach that goal, transcriptprofiling has now joined nucleotide sequencing as atruly global means of plant analysis.
Acknowledgements
We wish to thank our colleagues at Cenes, Inc., andKeygene N.V. The authors are grateful to Dick Flanellfor comments on the text and to Amy Hunt for help inpreparing the manuscript.
References
Adams, M.D., Kelley, J.M., Gocayne, J.D., Dubnick, M., Poly-meropoulos, M.H., Xiao, H., Merril, C.R., Wu, A., Olde, B.,
93
Moreno, R.F., Kerlavage, A.R., McCombie, W.R. and Ven-ter, J.C. 1991. Complementary DNA sequencing: expressedsequence tags and human genome project. Science 252: 1651–1656.
Aharoni, A., Keizer, L.C.P., Bouwmeester, H.J., Sun, Z., Alvarez-Huerta, M., Verhoeven, H.A., Blaas, J., van Houwelingen,A.M.M.L., de Vos, R.C.H., van der Voet, H., Jansen, R.C., Guis,M., Mol, J., Davis, R.W., Schena, M., van Tunen, A.J. andO’Connell, A.P. 2000. Identification of the SAAT gene involvedin strawberry flavor biogenesis by use of DNA microarrays. PlantCell 12: 647–661.
Alwine, J.C., Kemp, D.J. and Stark, G.R. 1977. Methodfor detection of specific RNAs in agarose gels by transferto diazobenzyloxymethyl-paper and hybridization with DNAprobes. Proc. Natl. Acad. Sci. USA 74: 5350–5354.
Arabidopsis Genome Initiative. 2000. Analysis of the genome se-quence of the flowering plant Arabidopsis thaliana. Nature 408:796–815.
Arimura, G.I., Tashiro, K., Kuhara, S., Nishioka, T., Ozawa, R.and Takabayashi, J. 2000. Gene responses in bean leaves inducedby herbivory and by herbivore-induced volatiles. Biochem. Bio-phys. Res. Commun. 277: 305–310.
Audic, S. and Claverie, J.M. 1997. The significance of digital geneexpression profiles. Genome Res. 7: 986–995.
Ausubel, F.M., Brent, R., Kingston, R.E., Moore, D.D., Seidman,J.G., Smith, J.A., Struhl, K., Albright, L.M., Coen, D.M. andVarki, A. 2001. Current Protocols in Molecular Biology. JohnWiley, New York.
Azpiroz-Leehan, R. and Feldmann, K.A. 1997. T-DNA insertionmutagenesis in Arabidopsis: going back and forth. Trends Genet.13: 152–156.
Bachem, C.W.B., van der Hoeven, R.S., de Bruijn, S.M., Vreug-denhil, D., Zabeau, M. and Visser, R.G.F. 1996. Visualization ofdifferential gene expression using a novel method of RNA fin-gerprinting based on AFLP: Analysis of gene expression duringpotato tuber development. Plant J. 9: 745–753.
Bachem, C.W.B., Oomen, R.J.F.J. and Visser, R.G.F. 1998. Tran-script imaging with cDNA-AFLP: a step-by-step protocol. PlantMol. Biol. Rep. 16: 157–173.
Baldwin, D., Crane, V. and Rice, D. 1999. A comparison ofgel-based, nylon filter and microarray techniques to detect dif-ferential RNA expression in plants. Curr. Opin. Plant Biol. 2:96–103.
Basarsky, T., Verdnik, D., Zhai, J.Y. and Wellis, D. 2000. Overviewof a microarray scanner: design essentials for an integratedacquisition and analysis platform. In: M. Schena (Ed.) Mi-croarray Biochip Technology, Eaton Publishing, Natick, MA,pp. 265–284.
Bassett, D.E. Jr., Eisen, M.B. and Boguski, M.S. 1999. Gene ex-pression informatics – it’s all in your mine. Nature Genet. Suppl.21: 51–55.
Bateman, A., Birney, E., Durbin, R., Eddy, S.R., Howe, K.L. andSonnhammer, E.L.L. 2000. The Pfam protein families database.Nucl. Acids Res. 28: 263–266.
Beier, M. and Hoheisel, J.D. 1999. Versatile derivatisation of solidsupport media for covalent bonding on DNA-microchips. Nucl.Acids Res. 27: 1970–1977.
Bertioli, D.J., Schlichter, U.H., Adams, M.J., Burrows, P.R., Stein-biss, H.H. and Antoniw, J.F. 1995. An analysis of differentialdisplay shows a strong bias towards high copy number mRNAs.Nucl. Acids Res. 23: 4520–4523.
Bevan, M., Mayer, K., White, O., Eisen, J.A., Preuss, D., Bureau,T., Salzberg, S.L. and Mewes, H.W. 2001. Sequence and analysisof the Arabidopsis genome. Curr. Opin. Plant Biol. 4: 105–110.
Bishop, J.O., Morton, J.G., Robash, M. and Richardson, M. 1974.Three abundance classes in HeLa cell messenger RNA. Nature463: 199–204.
Blanc, G., Barakat, A., Guyot, R., Cooke, R. and Delseny, M. 2000.Extensive duplication and reshuffling in the Arabidopsis genome.Plant Cell 12: 1093–1101.
Blanchard, A.P., Kaiser, R.J. and Hood, L.E. 1996. High-densityoligonucleotide arrays. Biosensors Bioelectronics 11: 687–690.
Blohm, D.H. and Guiseppi-Elie, A. 2001. New developments inmicroarray technology. Curr. Opin. Biotechnol. 12: 41–47.
Bohnert, H.J., Ayoubi, P., Borchert, C., Bressan, R.A., Burnap,R.L., Cushman, J.C., Cushman, M.A., Deyholos, M., Fischer,R., Galbraith, D.W., Hasegawa, P.M., Jenks, M., Kawasaki, S.,Koiwa, H., Kore-eda, S., Lee, B.H., Michalowski, C.B., Misawa,E., Nomura, M., Ozturk, N., Postier, B., Prade, R., Song, C.P.,Tanaka, Y., Wang, H. and Zhu, J.K. 2001. A genomics approachtowards salt stress tolerance. Plant Physiol. Biochem. 39: 1–17.
Bonaldo, M.F., Lennon, G. and Soares, M.B. 1996. Normaliza-tion and subtraction: two approaches to facilitate gene discovery.Genome Res. 6: 791–806.
Bosch, I., Melichar, H. and Pardee, A.B. 2000. Identification of dif-ferentially expressed genes from limited amounts of RNA. Nucl.Acids Res. 28: e27.
Brenner, S., Johnson, M., Bridgham, J., Golda, G., Lloyd, D.H.,Johnson, D., Luo, S., McCurdy, S., Foy, M., Ewan, M., Roth, R.,George, D., Eletr, S., Albrecht, G., Vermaas, E., Williams, S.R.,Moon, K., Burcham, T., Pallas, M., DuBridge, R.B., Kirchner, J.,Fearon, K., Mao, J.I. and Corcoran, K. 2000a. Gene expressionanalysis by massively parallel signature sequencing (MPSS) onmicrobead arrays. Nature Biotechnol. 18: 630–634.
Brenner, S., Williams, S.R., Vermass, E.H., Storck, T., Moon,K., McCollum, C., Mao, J.I., Luo, S., Kirchner, J.J., Eletr, S.,DuBridge, R.B., Burcham, T. and Albrecht, G. 2000b. In vitrocloning of complex mixtures of DNA on microbeads: physicalseparation of differentially expressed cDNAs. Proc. Natl. Acad.Sci. USA 97: 1665–1670.
Breyne, P. and Zabeau, M. 2001. Genome-wide expression analysisof plant cell cycle modulated genes. Curr. Opin. Plant Biol. 4:136–142.
Bruce, W., Folkerts, O., Garnaat, C., Crasta, O., Roth, B. andBowen, B. 2000. Expression profiling of the maize flavonoidpathway genes controlled by estradiol-inducible transcriptionfactors CRC and P. Plant Cell 12: 65–79.
Buntjer, J., de Ruiter, M., Vallins, B., Minarik, M., Mahtani, M.,van Schaik, R., Vos, P. and van Eijk, M. 1999. High through-put analysis of AFLP fragments on the MegaBACE capillarysequencer. In: Plant & Animal Genome IX, January 13–17, 2001,San Diego, CA.
Burks, C. 1999. Molecular biology database list. Nucl. Acids Res.27: 1–9.
Celis, J.E., Kruhoffer, M., Gromova, I., Frederiksen, C., Ostergaard,M., Thykjaer, T., Gromov, P., Yu, J., Palsdottir, H., Magnusson,N. and Orntoft, T.F. 2000. Gene expression profiling: monitoringtranscription and translation products using DNA microarraysand proteomics. FEBS Lett. 480: 2–16.
Chen, J.J., Rowley, J.D. and Wang, S.M. 2000. Generation of longercDNA fragments from serial analysis of gene expression tags forgene identification. Proc. Natl. Acad. Sci. USA 97: 349–353.
Cho, Y. and Walbot, V. 2001. Computational methods for gene an-notation: the Arabidopsis genome. Curr. Opin. Biotechnol. 12:126–130.
Cho, Y.J., Meade, J.D., Walde, J.C., Chen, X., Gui, Z. and Liang, P.2001. Multicolor fluorescent differential display. Biotechniques30: 562–572.
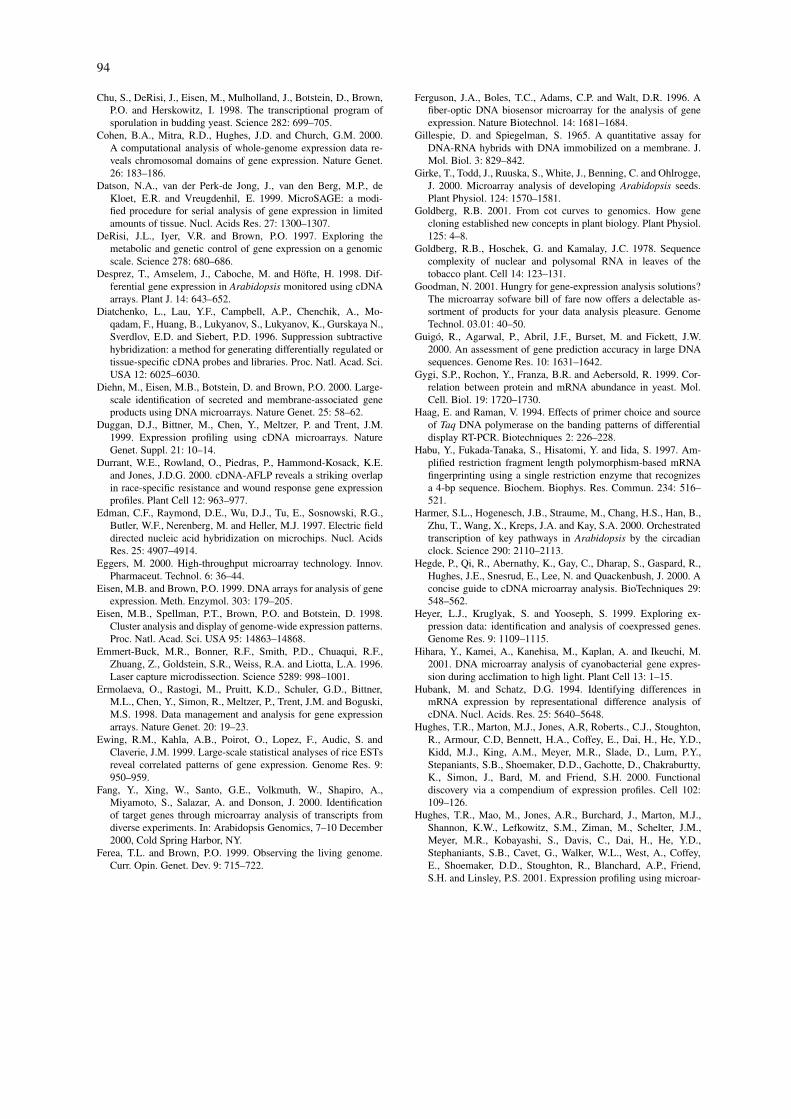
94
Chu, S., DeRisi, J., Eisen, M., Mulholland, J., Botstein, D., Brown,P.O. and Herskowitz, I. 1998. The transcriptional program ofsporulation in budding yeast. Science 282: 699–705.
Cohen, B.A., Mitra, R.D., Hughes, J.D. and Church, G.M. 2000.A computational analysis of whole-genome expression data re-veals chromosomal domains of gene expression. Nature Genet.26: 183–186.
Datson, N.A., van der Perk-de Jong, J., van den Berg, M.P., deKloet, E.R. and Vreugdenhil, E. 1999. MicroSAGE: a modi-fied procedure for serial analysis of gene expression in limitedamounts of tissue. Nucl. Acids Res. 27: 1300–1307.
DeRisi, J.L., Iyer, V.R. and Brown, P.O. 1997. Exploring themetabolic and genetic control of gene expression on a genomicscale. Science 278: 680–686.
Desprez, T., Amselem, J., Caboche, M. and Höfte, H. 1998. Dif-ferential gene expression in Arabidopsis monitored using cDNAarrays. Plant J. 14: 643–652.
Diatchenko, L., Lau, Y.F., Campbell, A.P., Chenchik, A., Mo-qadam, F., Huang, B., Lukyanov, S., Lukyanov, K., Gurskaya N.,Sverdlov, E.D. and Siebert, P.D. 1996. Suppression subtractivehybridization: a method for generating differentially regulated ortissue-specific cDNA probes and libraries. Proc. Natl. Acad. Sci.USA 12: 6025–6030.
Diehn, M., Eisen, M.B., Botstein, D. and Brown, P.O. 2000. Large-scale identification of secreted and membrane-associated geneproducts using DNA microarrays. Nature Genet. 25: 58–62.
Duggan, D.J., Bittner, M., Chen, Y., Meltzer, P. and Trent, J.M.1999. Expression profiling using cDNA microarrays. NatureGenet. Suppl. 21: 10–14.
Durrant, W.E., Rowland, O., Piedras, P., Hammond-Kosack, K.E.and Jones, J.D.G. 2000. cDNA-AFLP reveals a striking overlapin race-specific resistance and wound response gene expressionprofiles. Plant Cell 12: 963–977.
Edman, C.F., Raymond, D.E., Wu, D.J., Tu, E., Sosnowski, R.G.,Butler, W.F., Nerenberg, M. and Heller, M.J. 1997. Electric fielddirected nucleic acid hybridization on microchips. Nucl. AcidsRes. 25: 4907–4914.
Eggers, M. 2000. High-throughput microarray technology. Innov.Pharmaceut. Technol. 6: 36–44.
Eisen, M.B. and Brown, P.O. 1999. DNA arrays for analysis of geneexpression. Meth. Enzymol. 303: 179–205.
Eisen, M.B., Spellman, P.T., Brown, P.O. and Botstein, D. 1998.Cluster analysis and display of genome-wide expression patterns.Proc. Natl. Acad. Sci. USA 95: 14863–14868.
Emmert-Buck, M.R., Bonner, R.F., Smith, P.D., Chuaqui, R.F.,Zhuang, Z., Goldstein, S.R., Weiss, R.A. and Liotta, L.A. 1996.Laser capture microdissection. Science 5289: 998–1001.
Ermolaeva, O., Rastogi, M., Pruitt, K.D., Schuler, G.D., Bittner,M.L., Chen, Y., Simon, R., Meltzer, P., Trent, J.M. and Boguski,M.S. 1998. Data management and analysis for gene expressionarrays. Nature Genet. 20: 19–23.
Ewing, R.M., Kahla, A.B., Poirot, O., Lopez, F., Audic, S. andClaverie, J.M. 1999. Large-scale statistical analyses of rice ESTsreveal correlated patterns of gene expression. Genome Res. 9:950–959.
Fang, Y., Xing, W., Santo, G.E., Volkmuth, W., Shapiro, A.,Miyamoto, S., Salazar, A. and Donson, J. 2000. Identificationof target genes through microarray analysis of transcripts fromdiverse experiments. In: Arabidopsis Genomics, 7–10 December2000, Cold Spring Harbor, NY.
Ferea, T.L. and Brown, P.O. 1999. Observing the living genome.Curr. Opin. Genet. Dev. 9: 715–722.
Ferguson, J.A., Boles, T.C., Adams, C.P. and Walt, D.R. 1996. Afiber-optic DNA biosensor microarray for the analysis of geneexpression. Nature Biotechnol. 14: 1681–1684.
Gillespie, D. and Spiegelman, S. 1965. A quantitative assay forDNA-RNA hybrids with DNA immobilized on a membrane. J.Mol. Biol. 3: 829–842.
Girke, T., Todd, J., Ruuska, S., White, J., Benning, C. and Ohlrogge,J. 2000. Microarray analysis of developing Arabidopsis seeds.Plant Physiol. 124: 1570–1581.
Goldberg, R.B. 2001. From cot curves to genomics. How genecloning established new concepts in plant biology. Plant Physiol.125: 4–8.
Goldberg, R.B., Hoschek, G. and Kamalay, J.C. 1978. Sequencecomplexity of nuclear and polysomal RNA in leaves of thetobacco plant. Cell 14: 123–131.
Goodman, N. 2001. Hungry for gene-expression analysis solutions?The microarray sofware bill of fare now offers a delectable as-sortment of products for your data analysis pleasure. GenomeTechnol. 03.01: 40–50.
Guigó, R., Agarwal, P., Abril, J.F., Burset, M. and Fickett, J.W.2000. An assessment of gene prediction accuracy in large DNAsequences. Genome Res. 10: 1631–1642.
Gygi, S.P., Rochon, Y., Franza, B.R. and Aebersold, R. 1999. Cor-relation between protein and mRNA abundance in yeast. Mol.Cell. Biol. 19: 1720–1730.
Haag, E. and Raman, V. 1994. Effects of primer choice and sourceof Taq DNA polymerase on the banding patterns of differentialdisplay RT-PCR. Biotechniques 2: 226–228.
Habu, Y., Fukada-Tanaka, S., Hisatomi, Y. and Iida, S. 1997. Am-plified restriction fragment length polymorphism-based mRNAfingerprinting using a single restriction enzyme that recognizesa 4-bp sequence. Biochem. Biophys. Res. Commun. 234: 516–521.
Harmer, S.L., Hogenesch, J.B., Straume, M., Chang, H.S., Han, B.,Zhu, T., Wang, X., Kreps, J.A. and Kay, S.A. 2000. Orchestratedtranscription of key pathways in Arabidopsis by the circadianclock. Science 290: 2110–2113.
Hegde, P., Qi, R., Abernathy, K., Gay, C., Dharap, S., Gaspard, R.,Hughes, J.E., Snesrud, E., Lee, N. and Quackenbush, J. 2000. Aconcise guide to cDNA microarray analysis. BioTechniques 29:548–562.
Heyer, L.J., Kruglyak, S. and Yooseph, S. 1999. Exploring ex-pression data: identification and analysis of coexpressed genes.Genome Res. 9: 1109–1115.
Hihara, Y., Kamei, A., Kanehisa, M., Kaplan, A. and Ikeuchi, M.2001. DNA microarray analysis of cyanobacterial gene expres-sion during acclimation to high light. Plant Cell 13: 1–15.
Hubank, M. and Schatz, D.G. 1994. Identifying differences inmRNA expression by representational difference analysis ofcDNA. Nucl. Acids. Res. 25: 5640–5648.
Hughes, T.R., Marton, M.J., Jones, A.R, Roberts., C.J., Stoughton,R., Armour, C.D, Bennett, H.A., Coffey, E., Dai, H., He, Y.D.,Kidd, M.J., King, A.M., Meyer, M.R., Slade, D., Lum, P.Y.,Stepaniants, S.B., Shoemaker, D.D., Gachotte, D., Chakraburtty,K., Simon, J., Bard, M. and Friend, S.H. 2000. Functionaldiscovery via a compendium of expression profiles. Cell 102:109–126.
Hughes, T.R., Mao, M., Jones, A.R., Burchard, J., Marton, M.J.,Shannon, K.W., Lefkowitz, S.M., Ziman, M., Schelter, J.M.,Meyer, M.R., Kobayashi, S., Davis, C., Dai, H., He, Y.D.,Stephaniants, S.B., Cavet, G., Walker, W.L., West, A., Coffey,E., Shoemaker, D.D., Stoughton, R., Blanchard, A.P., Friend,S.H. and Linsley, P.S. 2001. Expression profiling using microar-
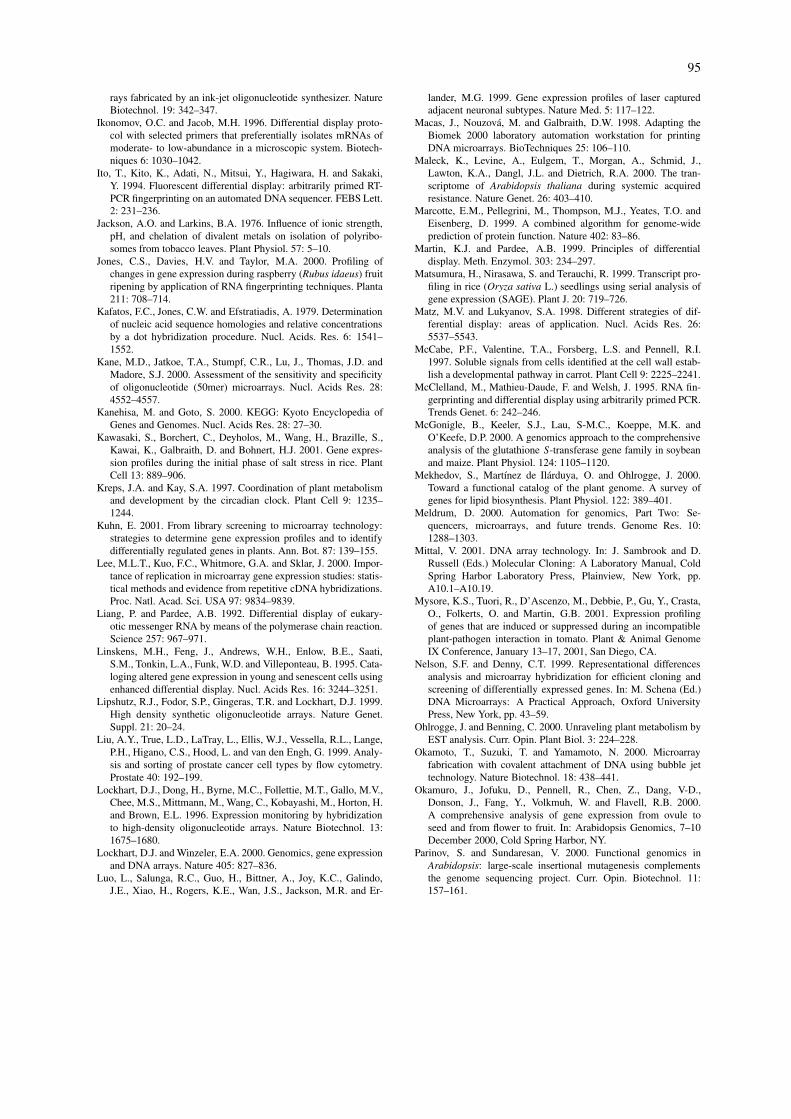
95
rays fabricated by an ink-jet oligonucleotide synthesizer. NatureBiotechnol. 19: 342–347.
Ikonomov, O.C. and Jacob, M.H. 1996. Differential display proto-col with selected primers that preferentially isolates mRNAs ofmoderate- to low-abundance in a microscopic system. Biotech-niques 6: 1030–1042.
Ito, T., Kito, K., Adati, N., Mitsui, Y., Hagiwara, H. and Sakaki,Y. 1994. Fluorescent differential display: arbitrarily primed RT-PCR fingerprinting on an automated DNA sequencer. FEBS Lett.2: 231–236.
Jackson, A.O. and Larkins, B.A. 1976. Influence of ionic strength,pH, and chelation of divalent metals on isolation of polyribo-somes from tobacco leaves. Plant Physiol. 57: 5–10.
Jones, C.S., Davies, H.V. and Taylor, M.A. 2000. Profiling ofchanges in gene expression during raspberry (Rubus idaeus) fruitripening by application of RNA fingerprinting techniques. Planta211: 708–714.
Kafatos, F.C., Jones, C.W. and Efstratiadis, A. 1979. Determinationof nucleic acid sequence homologies and relative concentrationsby a dot hybridization procedure. Nucl. Acids. Res. 6: 1541–1552.
Kane, M.D., Jatkoe, T.A., Stumpf, C.R., Lu, J., Thomas, J.D. andMadore, S.J. 2000. Assessment of the sensitivity and specificityof oligonucleotide (50mer) microarrays. Nucl. Acids Res. 28:4552–4557.
Kanehisa, M. and Goto, S. 2000. KEGG: Kyoto Encyclopedia ofGenes and Genomes. Nucl. Acids Res. 28: 27–30.
Kawasaki, S., Borchert, C., Deyholos, M., Wang, H., Brazille, S.,Kawai, K., Galbraith, D. and Bohnert, H.J. 2001. Gene expres-sion profiles during the initial phase of salt stress in rice. PlantCell 13: 889–906.
Kreps, J.A. and Kay, S.A. 1997. Coordination of plant metabolismand development by the circadian clock. Plant Cell 9: 1235–1244.
Kuhn, E. 2001. From library screening to microarray technology:strategies to determine gene expression profiles and to identifydifferentially regulated genes in plants. Ann. Bot. 87: 139–155.
Lee, M.L.T., Kuo, F.C., Whitmore, G.A. and Sklar, J. 2000. Impor-tance of replication in microarray gene expression studies: statis-tical methods and evidence from repetitive cDNA hybridizations.Proc. Natl. Acad. Sci. USA 97: 9834–9839.
Liang, P. and Pardee, A.B. 1992. Differential display of eukary-otic messenger RNA by means of the polymerase chain reaction.Science 257: 967–971.
Linskens, M.H., Feng, J., Andrews, W.H., Enlow, B.E., Saati,S.M., Tonkin, L.A., Funk, W.D. and Villeponteau, B. 1995. Cata-loging altered gene expression in young and senescent cells usingenhanced differential display. Nucl. Acids Res. 16: 3244–3251.
Lipshutz, R.J., Fodor, S.P., Gingeras, T.R. and Lockhart, D.J. 1999.High density synthetic oligonucleotide arrays. Nature Genet.Suppl. 21: 20–24.
Liu, A.Y., True, L.D., LaTray, L., Ellis, W.J., Vessella, R.L., Lange,P.H., Higano, C.S., Hood, L. and van den Engh, G. 1999. Analy-sis and sorting of prostate cancer cell types by flow cytometry.Prostate 40: 192–199.
Lockhart, D.J., Dong, H., Byrne, M.C., Follettie, M.T., Gallo, M.V.,Chee, M.S., Mittmann, M., Wang, C., Kobayashi, M., Horton, H.and Brown, E.L. 1996. Expression monitoring by hybridizationto high-density oligonucleotide arrays. Nature Biotechnol. 13:1675–1680.
Lockhart, D.J. and Winzeler, E.A. 2000. Genomics, gene expressionand DNA arrays. Nature 405: 827–836.
Luo, L., Salunga, R.C., Guo, H., Bittner, A., Joy, K.C., Galindo,J.E., Xiao, H., Rogers, K.E., Wan, J.S., Jackson, M.R. and Er-
lander, M.G. 1999. Gene expression profiles of laser capturedadjacent neuronal subtypes. Nature Med. 5: 117–122.
Macas, J., Nouzová, M. and Galbraith, D.W. 1998. Adapting theBiomek 2000 laboratory automation workstation for printingDNA microarrays. BioTechniques 25: 106–110.
Maleck, K., Levine, A., Eulgem, T., Morgan, A., Schmid, J.,Lawton, K.A., Dangl, J.L. and Dietrich, R.A. 2000. The tran-scriptome of Arabidopsis thaliana during systemic acquiredresistance. Nature Genet. 26: 403–410.
Marcotte, E.M., Pellegrini, M., Thompson, M.J., Yeates, T.O. andEisenberg, D. 1999. A combined algorithm for genome-wideprediction of protein function. Nature 402: 83–86.
Martin, K.J. and Pardee, A.B. 1999. Principles of differentialdisplay. Meth. Enzymol. 303: 234–297.
Matsumura, H., Nirasawa, S. and Terauchi, R. 1999. Transcript pro-filing in rice (Oryza sativa L.) seedlings using serial analysis ofgene expression (SAGE). Plant J. 20: 719–726.
Matz, M.V. and Lukyanov, S.A. 1998. Different strategies of dif-ferential display: areas of application. Nucl. Acids Res. 26:5537–5543.
McCabe, P.F., Valentine, T.A., Forsberg, L.S. and Pennell, R.I.1997. Soluble signals from cells identified at the cell wall estab-lish a developmental pathway in carrot. Plant Cell 9: 2225–2241.
McClelland, M., Mathieu-Daude, F. and Welsh, J. 1995. RNA fin-gerprinting and differential display using arbitrarily primed PCR.Trends Genet. 6: 242–246.
McGonigle, B., Keeler, S.J., Lau, S-M.C., Koeppe, M.K. andO’Keefe, D.P. 2000. A genomics approach to the comprehensiveanalysis of the glutathione S-transferase gene family in soybeanand maize. Plant Physiol. 124: 1105–1120.
Mekhedov, S., Martínez de Ilárduya, O. and Ohlrogge, J. 2000.Toward a functional catalog of the plant genome. A survey ofgenes for lipid biosynthesis. Plant Physiol. 122: 389–401.
Meldrum, D. 2000. Automation for genomics, Part Two: Se-quencers, microarrays, and future trends. Genome Res. 10:1288–1303.
Mittal, V. 2001. DNA array technology. In: J. Sambrook and D.Russell (Eds.) Molecular Cloning: A Laboratory Manual, ColdSpring Harbor Laboratory Press, Plainview, New York, pp.A10.1–A10.19.
Mysore, K.S., Tuori, R., D’Ascenzo, M., Debbie, P., Gu, Y., Crasta,O., Folkerts, O. and Martin, G.B. 2001. Expression profilingof genes that are induced or suppressed during an incompatibleplant-pathogen interaction in tomato. Plant & Animal GenomeIX Conference, January 13–17, 2001, San Diego, CA.
Nelson, S.F. and Denny, C.T. 1999. Representational differencesanalysis and microarray hybridization for efficient cloning andscreening of differentially expressed genes. In: M. Schena (Ed.)DNA Microarrays: A Practical Approach, Oxford UniversityPress, New York, pp. 43–59.
Ohlrogge, J. and Benning, C. 2000. Unraveling plant metabolism byEST analysis. Curr. Opin. Plant Biol. 3: 224–228.
Okamoto, T., Suzuki, T. and Yamamoto, N. 2000. Microarrayfabrication with covalent attachment of DNA using bubble jettechnology. Nature Biotechnol. 18: 438–441.
Okamuro, J., Jofuku, D., Pennell, R., Chen, Z., Dang, V-D.,Donson, J., Fang, Y., Volkmuh, W. and Flavell, R.B. 2000.A comprehensive analysis of gene expression from ovule toseed and from flower to fruit. In: Arabidopsis Genomics, 7–10December 2000, Cold Spring Harbor, NY.
Parinov, S. and Sundaresan, V. 2000. Functional genomics inArabidopsis: large-scale insertional mutagenesis complementsthe genome sequencing project. Curr. Opin. Biotechnol. 11:157–161.
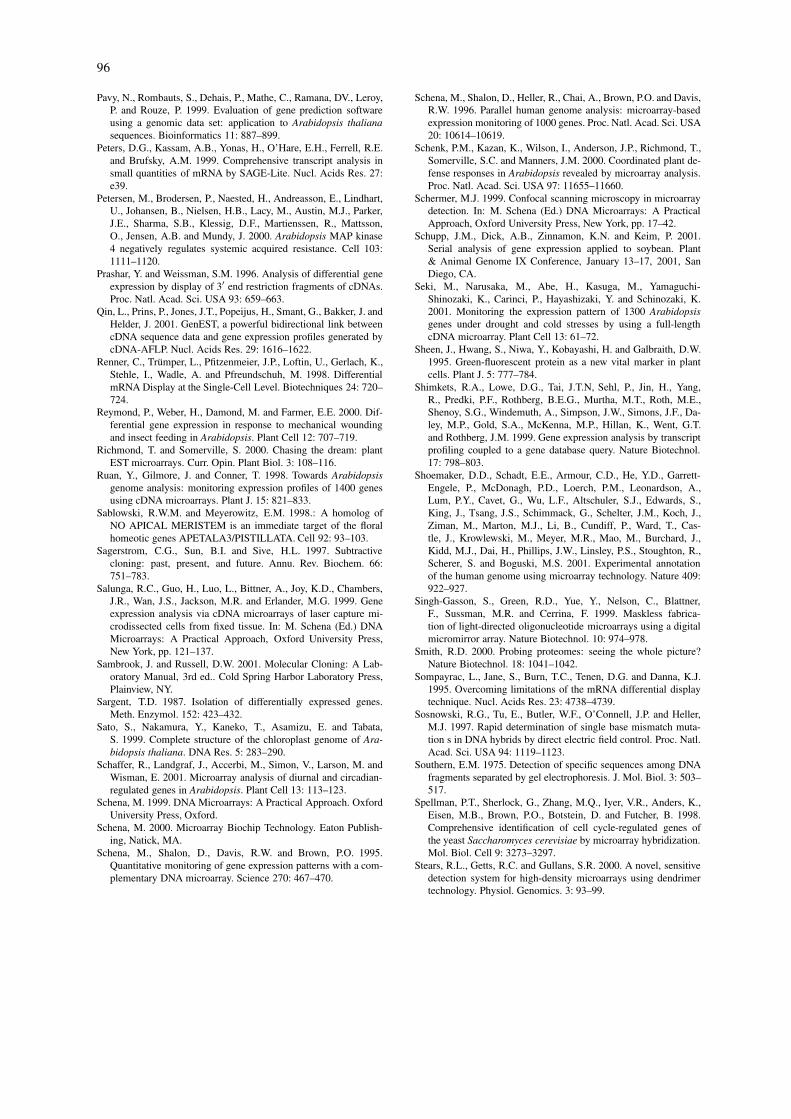
96
Pavy, N., Rombauts, S., Dehais, P., Mathe, C., Ramana, DV., Leroy,P. and Rouze, P. 1999. Evaluation of gene prediction softwareusing a genomic data set: application to Arabidopsis thalianasequences. Bioinformatics 11: 887–899.
Peters, D.G., Kassam, A.B., Yonas, H., O’Hare, E.H., Ferrell, R.E.and Brufsky, A.M. 1999. Comprehensive transcript analysis insmall quantities of mRNA by SAGE-Lite. Nucl. Acids Res. 27:e39.
Petersen, M., Brodersen, P., Naested, H., Andreasson, E., Lindhart,U., Johansen, B., Nielsen, H.B., Lacy, M., Austin, M.J., Parker,J.E., Sharma, S.B., Klessig, D.F., Martienssen, R., Mattsson,O., Jensen, A.B. and Mundy, J. 2000. Arabidopsis MAP kinase4 negatively regulates systemic acquired resistance. Cell 103:1111–1120.
Prashar, Y. and Weissman, S.M. 1996. Analysis of differential geneexpression by display of 3′ end restriction fragments of cDNAs.Proc. Natl. Acad. Sci. USA 93: 659–663.
Qin, L., Prins, P., Jones, J.T., Popeijus, H., Smant, G., Bakker, J. andHelder, J. 2001. GenEST, a powerful bidirectional link betweencDNA sequence data and gene expression profiles generated bycDNA-AFLP. Nucl. Acids Res. 29: 1616–1622.
Renner, C., Trümper, L., Pfitzenmeier, J.P., Loftin, U., Gerlach, K.,Stehle, I., Wadle, A. and Pfreundschuh, M. 1998. DifferentialmRNA Display at the Single-Cell Level. Biotechniques 24: 720–724.
Reymond, P., Weber, H., Damond, M. and Farmer, E.E. 2000. Dif-ferential gene expression in response to mechanical woundingand insect feeding in Arabidopsis. Plant Cell 12: 707–719.
Richmond, T. and Somerville, S. 2000. Chasing the dream: plantEST microarrays. Curr. Opin. Plant Biol. 3: 108–116.
Ruan, Y., Gilmore, J. and Conner, T. 1998. Towards Arabidopsisgenome analysis: monitoring expression profiles of 1400 genesusing cDNA microarrays. Plant J. 15: 821–833.
Sablowski, R.W.M. and Meyerowitz, E.M. 1998.: A homolog ofNO APICAL MERISTEM is an immediate target of the floralhomeotic genes APETALA3/PISTILLATA. Cell 92: 93–103.
Sagerstrom, C.G., Sun, B.I. and Sive, H.L. 1997. Subtractivecloning: past, present, and future. Annu. Rev. Biochem. 66:751–783.
Salunga, R.C., Guo, H., Luo, L., Bittner, A., Joy, K.D., Chambers,J.R., Wan, J.S., Jackson, M.R. and Erlander, M.G. 1999. Geneexpression analysis via cDNA microarrays of laser capture mi-crodissected cells from fixed tissue. In: M. Schena (Ed.) DNAMicroarrays: A Practical Approach, Oxford University Press,New York, pp. 121–137.
Sambrook, J. and Russell, D.W. 2001. Molecular Cloning: A Lab-oratory Manual, 3rd ed.. Cold Spring Harbor Laboratory Press,Plainview, NY.
Sargent, T.D. 1987. Isolation of differentially expressed genes.Meth. Enzymol. 152: 423–432.
Sato, S., Nakamura, Y., Kaneko, T., Asamizu, E. and Tabata,S. 1999. Complete structure of the chloroplast genome of Ara-bidopsis thaliana. DNA Res. 5: 283–290.
Schaffer, R., Landgraf, J., Accerbi, M., Simon, V., Larson, M. andWisman, E. 2001. Microarray analysis of diurnal and circadian-regulated genes in Arabidopsis. Plant Cell 13: 113–123.
Schena, M. 1999. DNA Microarrays: A Practical Approach. OxfordUniversity Press, Oxford.
Schena, M. 2000. Microarray Biochip Technology. Eaton Publish-ing, Natick, MA.
Schena, M., Shalon, D., Davis, R.W. and Brown, P.O. 1995.Quantitative monitoring of gene expression patterns with a com-plementary DNA microarray. Science 270: 467–470.
Schena, M., Shalon, D., Heller, R., Chai, A., Brown, P.O. and Davis,R.W. 1996. Parallel human genome analysis: microarray-basedexpression monitoring of 1000 genes. Proc. Natl. Acad. Sci. USA20: 10614–10619.
Schenk, P.M., Kazan, K., Wilson, I., Anderson, J.P., Richmond, T.,Somerville, S.C. and Manners, J.M. 2000. Coordinated plant de-fense responses in Arabidopsis revealed by microarray analysis.Proc. Natl. Acad. Sci. USA 97: 11655–11660.
Schermer, M.J. 1999. Confocal scanning microscopy in microarraydetection. In: M. Schena (Ed.) DNA Microarrays: A PracticalApproach, Oxford University Press, New York, pp. 17–42.
Schupp, J.M., Dick, A.B., Zinnamon, K.N. and Keim, P. 2001.Serial analysis of gene expression applied to soybean. Plant& Animal Genome IX Conference, January 13–17, 2001, SanDiego, CA.
Seki, M., Narusaka, M., Abe, H., Kasuga, M., Yamaguchi-Shinozaki, K., Carinci, P., Hayashizaki, Y. and Schinozaki, K.2001. Monitoring the expression pattern of 1300 Arabidopsisgenes under drought and cold stresses by using a full-lengthcDNA microarray. Plant Cell 13: 61–72.
Sheen, J., Hwang, S., Niwa, Y., Kobayashi, H. and Galbraith, D.W.1995. Green-fluorescent protein as a new vital marker in plantcells. Plant J. 5: 777–784.
Shimkets, R.A., Lowe, D.G., Tai, J.T.N, Sehl, P., Jin, H., Yang,R., Predki, P.F., Rothberg, B.E.G., Murtha, M.T., Roth, M.E.,Shenoy, S.G., Windemuth, A., Simpson, J.W., Simons, J.F., Da-ley, M.P., Gold, S.A., McKenna, M.P., Hillan, K., Went, G.T.and Rothberg, J.M. 1999. Gene expression analysis by transcriptprofiling coupled to a gene database query. Nature Biotechnol.17: 798–803.
Shoemaker, D.D., Schadt, E.E., Armour, C.D., He, Y.D., Garrett-Engele, P., McDonagh, P.D., Loerch, P.M., Leonardson, A.,Lum, P.Y., Cavet, G., Wu, L.F., Altschuler, S.J., Edwards, S.,King, J., Tsang, J.S., Schimmack, G., Schelter, J.M., Koch, J.,Ziman, M., Marton, M.J., Li, B., Cundiff, P., Ward, T., Cas-tle, J., Krowlewski, M., Meyer, M.R., Mao, M., Burchard, J.,Kidd, M.J., Dai, H., Phillips, J.W., Linsley, P.S., Stoughton, R.,Scherer, S. and Boguski, M.S. 2001. Experimental annotationof the human genome using microarray technology. Nature 409:922–927.
Singh-Gasson, S., Green, R.D., Yue, Y., Nelson, C., Blattner,F., Sussman, M.R. and Cerrina, F. 1999. Maskless fabrica-tion of light-directed oligonucleotide microarrays using a digitalmicromirror array. Nature Biotechnol. 10: 974–978.
Smith, R.D. 2000. Probing proteomes: seeing the whole picture?Nature Biotechnol. 18: 1041–1042.
Sompayrac, L., Jane, S., Burn, T.C., Tenen, D.G. and Danna, K.J.1995. Overcoming limitations of the mRNA differential displaytechnique. Nucl. Acids Res. 23: 4738–4739.
Sosnowski, R.G., Tu, E., Butler, W.F., O’Connell, J.P. and Heller,M.J. 1997. Rapid determination of single base mismatch muta-tion s in DNA hybrids by direct electric field control. Proc. Natl.Acad. Sci. USA 94: 1119–1123.
Southern, E.M. 1975. Detection of specific sequences among DNAfragments separated by gel electrophoresis. J. Mol. Biol. 3: 503–517.
Spellman, P.T., Sherlock, G., Zhang, M.Q., Iyer, V.R., Anders, K.,Eisen, M.B., Brown, P.O., Botstein, D. and Futcher, B. 1998.Comprehensive identification of cell cycle-regulated genes ofthe yeast Saccharomyces cerevisiae by microarray hybridization.Mol. Biol. Cell 9: 3273–3297.
Stears, R.L., Getts, R.C. and Gullans, S.R. 2000. A novel, sensitivedetection system for high-density microarrays using dendrimertechnology. Physiol. Genomics. 3: 93–99.
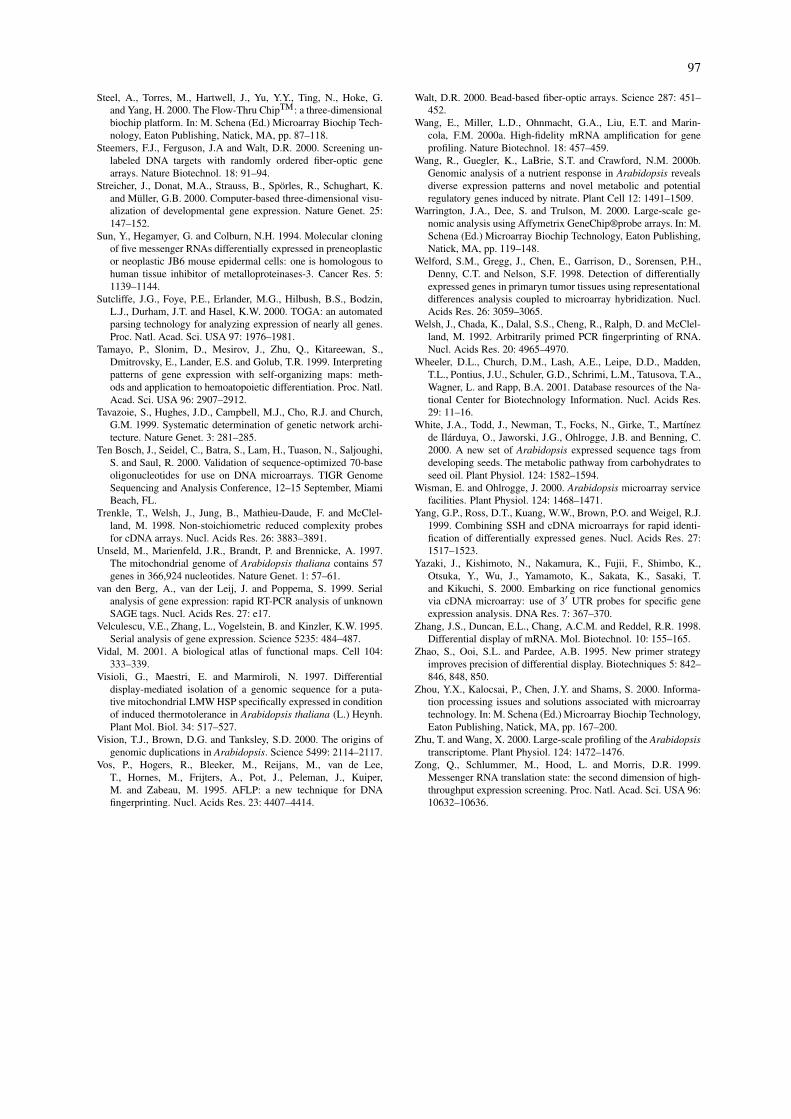
97
Steel, A., Torres, M., Hartwell, J., Yu, Y.Y., Ting, N., Hoke, G.and Yang, H. 2000. The Flow-Thru ChipTM: a three-dimensionalbiochip platform. In: M. Schena (Ed.) Microarray Biochip Tech-nology, Eaton Publishing, Natick, MA, pp. 87–118.
Steemers, F.J., Ferguson, J.A and Walt, D.R. 2000. Screening un-labeled DNA targets with randomly ordered fiber-optic genearrays. Nature Biotechnol. 18: 91–94.
Streicher, J., Donat, M.A., Strauss, B., Spörles, R., Schughart, K.and Müller, G.B. 2000. Computer-based three-dimensional visu-alization of developmental gene expression. Nature Genet. 25:147–152.
Sun, Y., Hegamyer, G. and Colburn, N.H. 1994. Molecular cloningof five messenger RNAs differentially expressed in preneoplasticor neoplastic JB6 mouse epidermal cells: one is homologous tohuman tissue inhibitor of metalloproteinases-3. Cancer Res. 5:1139–1144.
Sutcliffe, J.G., Foye, P.E., Erlander, M.G., Hilbush, B.S., Bodzin,L.J., Durham, J.T. and Hasel, K.W. 2000. TOGA: an automatedparsing technology for analyzing expression of nearly all genes.Proc. Natl. Acad. Sci. USA 97: 1976–1981.
Tamayo, P., Slonim, D., Mesirov, J., Zhu, Q., Kitareewan, S.,Dmitrovsky, E., Lander, E.S. and Golub, T.R. 1999. Interpretingpatterns of gene expression with self-organizing maps: meth-ods and application to hemoatopoietic differentiation. Proc. Natl.Acad. Sci. USA 96: 2907–2912.
Tavazoie, S., Hughes, J.D., Campbell, M.J., Cho, R.J. and Church,G.M. 1999. Systematic determination of genetic network archi-tecture. Nature Genet. 3: 281–285.
Ten Bosch, J., Seidel, C., Batra, S., Lam, H., Tuason, N., Saljoughi,S. and Saul, R. 2000. Validation of sequence-optimized 70-baseoligonucleotides for use on DNA microarrays. TIGR GenomeSequencing and Analysis Conference, 12–15 September, MiamiBeach, FL.
Trenkle, T., Welsh, J., Jung, B., Mathieu-Daude, F. and McClel-land, M. 1998. Non-stoichiometric reduced complexity probesfor cDNA arrays. Nucl. Acids Res. 26: 3883–3891.
Unseld, M., Marienfeld, J.R., Brandt, P. and Brennicke, A. 1997.The mitochondrial genome of Arabidopsis thaliana contains 57genes in 366,924 nucleotides. Nature Genet. 1: 57–61.
van den Berg, A., van der Leij, J. and Poppema, S. 1999. Serialanalysis of gene expression: rapid RT-PCR analysis of unknownSAGE tags. Nucl. Acids Res. 27: e17.
Velculescu, V.E., Zhang, L., Vogelstein, B. and Kinzler, K.W. 1995.Serial analysis of gene expression. Science 5235: 484–487.
Vidal, M. 2001. A biological atlas of functional maps. Cell 104:333–339.
Visioli, G., Maestri, E. and Marmiroli, N. 1997. Differentialdisplay-mediated isolation of a genomic sequence for a puta-tive mitochondrial LMW HSP specifically expressed in conditionof induced thermotolerance in Arabidopsis thaliana (L.) Heynh.Plant Mol. Biol. 34: 517–527.
Vision, T.J., Brown, D.G. and Tanksley, S.D. 2000. The origins ofgenomic duplications in Arabidopsis. Science 5499: 2114–2117.
Vos, P., Hogers, R., Bleeker, M., Reijans, M., van de Lee,T., Hornes, M., Frijters, A., Pot, J., Peleman, J., Kuiper,M. and Zabeau, M. 1995. AFLP: a new technique for DNAfingerprinting. Nucl. Acids Res. 23: 4407–4414.
Walt, D.R. 2000. Bead-based fiber-optic arrays. Science 287: 451–452.
Wang, E., Miller, L.D., Ohnmacht, G.A., Liu, E.T. and Marin-cola, F.M. 2000a. High-fidelity mRNA amplification for geneprofiling. Nature Biotechnol. 18: 457–459.
Wang, R., Guegler, K., LaBrie, S.T. and Crawford, N.M. 2000b.Genomic analysis of a nutrient response in Arabidopsis revealsdiverse expression patterns and novel metabolic and potentialregulatory genes induced by nitrate. Plant Cell 12: 1491–1509.
Warrington, J.A., Dee, S. and Trulson, M. 2000. Large-scale ge-nomic analysis using Affymetrix GeneChip®probe arrays. In: M.Schena (Ed.) Microarray Biochip Technology, Eaton Publishing,Natick, MA, pp. 119–148.
Welford, S.M., Gregg, J., Chen, E., Garrison, D., Sorensen, P.H.,Denny, C.T. and Nelson, S.F. 1998. Detection of differentiallyexpressed genes in primaryn tumor tissues using representationaldifferences analysis coupled to microarray hybridization. Nucl.Acids Res. 26: 3059–3065.
Welsh, J., Chada, K., Dalal, S.S., Cheng, R., Ralph, D. and McClel-land, M. 1992. Arbitrarily primed PCR fingerprinting of RNA.Nucl. Acids Res. 20: 4965–4970.
Wheeler, D.L., Church, D.M., Lash, A.E., Leipe, D.D., Madden,T.L., Pontius, J.U., Schuler, G.D., Schrimi, L.M., Tatusova, T.A.,Wagner, L. and Rapp, B.A. 2001. Database resources of the Na-tional Center for Biotechnology Information. Nucl. Acids Res.29: 11–16.
White, J.A., Todd, J., Newman, T., Focks, N., Girke, T., Martínezde Ilárduya, O., Jaworski, J.G., Ohlrogge, J.B. and Benning, C.2000. A new set of Arabidopsis expressed sequence tags fromdeveloping seeds. The metabolic pathway from carbohydrates toseed oil. Plant Physiol. 124: 1582–1594.
Wisman, E. and Ohlrogge, J. 2000. Arabidopsis microarray servicefacilities. Plant Physiol. 124: 1468–1471.
Yang, G.P., Ross, D.T., Kuang, W.W., Brown, P.O. and Weigel, R.J.1999. Combining SSH and cDNA microarrays for rapid identi-fication of differentially expressed genes. Nucl. Acids Res. 27:1517–1523.
Yazaki, J., Kishimoto, N., Nakamura, K., Fujii, F., Shimbo, K.,Otsuka, Y., Wu, J., Yamamoto, K., Sakata, K., Sasaki, T.and Kikuchi, S. 2000. Embarking on rice functional genomicsvia cDNA microarray: use of 3′ UTR probes for specific geneexpression analysis. DNA Res. 7: 367–370.
Zhang, J.S., Duncan, E.L., Chang, A.C.M. and Reddel, R.R. 1998.Differential display of mRNA. Mol. Biotechnol. 10: 155–165.
Zhao, S., Ooi, S.L. and Pardee, A.B. 1995. New primer strategyimproves precision of differential display. Biotechniques 5: 842–846, 848, 850.
Zhou, Y.X., Kalocsai, P., Chen, J.Y. and Shams, S. 2000. Informa-tion processing issues and solutions associated with microarraytechnology. In: M. Schena (Ed.) Microarray Biochip Technology,Eaton Publishing, Natick, MA, pp. 167–200.
Zhu, T. and Wang, X. 2000. Large-scale profiling of the Arabidopsistranscriptome. Plant Physiol. 124: 1472–1476.
Zong, Q., Schlummer, M., Hood, L. and Morris, D.R. 1999.Messenger RNA translation state: the second dimension of high-throughput expression screening. Proc. Natl. Acad. Sci. USA 96:10632–10636.