Energy profiling profiling of large of large scale applications ...
Upload
khangminh22Category
view
2download
0
2014
Maharashtra Pollution Control Board, Mumbai
COMPREHENSIVE STUDY/ PROFILING OF MITHI RIVER
Foreword
After the deluge disaster of flood occurred in Mumbai in the year of 2005, Mithi River has got prime importance from its environmental degradation and pollution loading point of view. Government of Maharashtra has constituted Mithi River Development and Protection Authority (MRDPA) on 19th August, 2005. MRDPA awarded the work of environmental improvement and technical feasibility study to IIT, Powai which was published in June, 2006. Similar work on extended scope has been undertaken by Maharashtra Pollution Control Board in order to assess the pollution sources and to strategize the abatement measures oriented to fill gaps in research and strategy development found in earlier studies through a long period of time. As per the studies carried out by MPCB in July, 2004 covering monsoon and post monsoon pollution levels in Mithi River, short term and long term measures were recommended for control of pollution. Short term measures included immediate closure of unauthorized activities such as discharge of industrial effluents, oils, chemicals and chemical sludge in river along with proper system development of garbage collection system to avoid solid waste dumping in river. Long term measures comprised provision of Sewage Treatment Plants and interceptor sewer plan on both banks of the river. It also emphasized on dredging along entire length of Mithi River bed so as to improve its carrying capacity. Extending the continuous efforts of MPCB rejuvenate Mithi River water close to desirable characteristics to the extent of at least achieving suitability of end use for contact purpose and wildlife propagation as a short term and long term vision, it gives me a great pleasure to present this report incorporating innovative and scientific methodology with advanced tools such as development of criticality indices represented as color code through simplicity of access of information to aid decision making process and source receptor modeling for understanding industrial vis a vis domestic source contributions to Mithi River. The report as it is includes enormous details of physico–chemical and part of biological characterization for more than 250 odd samples and almost equivalent surveys throughout an RoW of 200m across the length of 15kms of Mithi and 3.5kms of Vakola nallah supported by extensive QA/QC protocols. Finally, I believe that the comprehensive management plan described in the report that not only aims at direct discharge sources but touches upon allied sources such as open defecation, solid waste dumping and others that are equally quintessential to be addressed along with multiple hierarchy of permutation and combination of options for at source, in path and end of the pipe treatments. Finally, the approach of prioritizing management options through planning for achieving designated end use based targets summarizing site specific, nallah specific and generic industrial sources shall come as a extremely handy tool for decision makers in the near future. Rajeev Kumar Mital Member Secretary, MPCB

Acknowledgements
Technogreen Environmental Solutions on the onset would like to extend its heartiest gratitude to Shri. Rajeev Kumar Mital, Member Secretary, MPCB for giving us this opportunity to be part of such an extremely important and socially relevant project and his keen involvement in form of continuous follow-ups, updates suggestions and comments helped us orient this study in a way which otherwise would have not happened and probably may have been never realized in the present form.
Our sincere thanks to the Chairman, MPCB for extending his affirmative say that made us be part of the project along with Shri. P. K. Mirashe’s equally persistent and visionary insight and confidence interested in us. One person in particular i.e. Shri. R. Vasave and his team of officials in general Shri. Y. Gore, U. Kulkarni, S. Nimbalkar and S. Kavare needs special mention for their immense knowledge, awareness and intent of the subject of this report which has come as a absolute blessing in disguise
We would like to extend appreciation to our partners of the study headed by Shri. Apte, and his equally supportive and understanding members Mrs. U. Kelkar & Mrs. P. Bhide from Goldfinch Engineering systems Pvt. Ltd. who have extremely sensitively and responsibly co-supported us throughout the study.
Last but not the least our mentors and critics as well as those from BMC, MMRDA and MPCB involved in earlier studies and have provided extensive ready reference material along with industry representatives, local people who contributed in surveys needs to be sincerely regarded for their selfless support.
Technogreen acknowledges hard work and sincere efforts of all its team members who have selflessly gone beyond personal miles to make this study achieve a form which we are sure would be appreciated by one and all.

Comprehensive Study of Mithi River Polluted Stretches Chapter I Introduction
INDEX
Chapter I
1.0 Background ........................................................................................................................ 1
1.1 Introduction ..................................................................................................................... 2
1.2 Probable Sources of Water Pollution in Mithi River ........................................................ 2
1.2.1 Urban development ................................................................................................. 2
1.2.2 Industrial Wastewater .............................................................................................. 4
1.2.3 Resurfacing of Previously Deposited Pollutants ...................................................... 4
1.2.4 Solid Waste Dumping Scenario in Mithi River ......................................................... 4
1.3 Literature Review ............................................................................................................ 5
1.4 Organization of the report ............................................................................................... 5
List of Tables
Table 1.1 Summary of Studies and Recommendations regarding Mithi River............................ 7
List of Figures
Figure 1.1 Location of Mithi River and Land Use base adopted from MCGM Report, 2006 .... 3
Figure 1.2 Solid Waste dumping at various locations along Mithi River ................................... 6

Comprehensive Study of Mithi River Polluted Stretches Chapter I Introduction
1
Chapter I Introduction
1.0 Background Mumbai, the economic capital of Maharashtra, stands at the 1st rank being highly populated city
in the India. It is union of seven islands, which make up the Mumbai city. Urban development,
modernization, public utilities, employment, infrastructure, education, technology; Mumbai is the
most developed city in all sectors, offering tremendous scope of job opportunities and high living
standards.
Along with the high rise infrastructure, slums are also the vital part of Mumbai. As per the 2001
census, about half of the population in Mumbai lives in slums (5.93 million out of total population
of 11.91 million). It is believed that there are about 1,959 slum settlements. Out of those, around
47% slums are located on private lands, about 42% on public lands, 10% on other lands and
about 1% on railway lands (www.mcgm.gov.in)
Industrial growth of Mumbai has attained tremendous pace in all of the industrial sectors
including media, chemical factories, textile, pharmaceutical, automobile tanneries, oil refineries,
engineering clusters, and so on.
MCGM is the agency which has control over the water supply in the city. The storm water
drainage system in Mumbai comprises of a hierarchical network of roadside surface drains
which are about 2000 km mainly in suburbs, underground drains and laterals( about 440km in
the island city area, major and minor nallahs (200km and 87km respectively), and 186 outfalls,
which discharge all the surface runoff into rivers and Arabian sea. The present storm water
drainage system in Mumbai is about 70 years old, comprising of about 400km of underground
drains and laterals built on the basis of population and weather conditions. This system is
known to be capable of handling rain intensity of 25mm per hour at low tide per hour and when
high tide occurs, there is always a possibility of water logging which disturbs all the traffic and
day to day chores (www.mcgm.gov.in).
MCGM is formally responsible for the management of waste in the city. Around 5800 community
garbage bins have been provided in the city where the collected garbage is dumped. In
southern Mumbai, the garbage is transported to transfer station located at Mahalakshmi. In
north part of Mumbai, dumping grounds are provided. Many schemes such as Slum Adoption
Scheme, Advanced Locality Management, Parisar Vikas Scheme, has been adopted under the
guidance of MCGM so as to manage and effective disposal of the collected solid waste.
Comprehensive Study of Mithi River Polluted Stretches Chapter I Introduction
2
1.1 Introduction
Maharashtra Pollution Control Board has undertaken the project of Comprehensive profiling of
Mithi River. Mithi serves as one of the major rivers in Mumbai flowing from Vihar Lake to
Arabian Sea. Mithi has been treated as an open nallah by the nearby residents as well as
industries. Though the river water is seldom used as a source of drinking water, after the 26th
July 2006 floods, major concern were given to Mithi River and its environmental degradation.
For this project, the methodology includes assessment of pollution sources and estimation of
pollution load around the catchment area along with suitable conservation and management
strategies. In past, several studies has been carried out and published data available across
various reliable institutes are referred in order to give an insight to the approach of assessing
the pollution potential across the pre-defined domain of Mithi River. Figure 1.1 shows the
stretch of Mithi from Origin at Vihar Lake to Mahim Bay.
1.2 Probable Sources of Water Pollution in Mithi River Though there have been several studies in the past regarding conservation and rehabilitation of
Mithi River, efforts regarding understanding the sources and characteristics of inputs to Mithi
River has been very limited. In fact the source profiling of all pollution points have been recently
studied and elaborated by IIT, Mumbai which identifies about 9 major nallahs contributing to
pollution of Mithi. However, it is prerogative of this study to go beyond the contributing nallahs
up to the level of land and source surveys to understand the potential factors of contribution of
pollution. Based on the baseline surveys, following are the prominent pollution sources
observed by the surveyors which are generically elaborated as under.
1.2.1 Urban development With the increasing scope of job opportunities and education in the city as well as its industrial
growth especially in industrial sector causing in-migration and leading to exponential growth of
population, demand for water supply has increased exponentially. About 70-80% of this water is
disposed as wastewater (sewage). This sewage is partially treated and the untreated part of this

Comprehensive Study of Mithi River Polluted Stretches Chapter I Introduction
3
Figure 1.1 Location of Mithi River and Land Use base adopted from MCGM Report, 2006
Comprehensive Study of Mithi River Polluted Stretches Chapter I Introduction
4
Wastewater is being disposed as it is in rivers harming the ecology and degradation of the river
water quality. It was observed that there are about 5-6 lakh residential tenants around 200m
RoW stretch of Mithi without any sewage treatment facilities that might contribute to direct
discharges.
1.2.2 Industrial Wastewater Mithi River stretch has been in discussion for habituating hitherto of industrial activities most of
which are small scale enterprises and many of them are probably illegal and not listed in any of
the departmental documents comprising from oil recycling / refining, dyes, tanning to barrel
cleaning, etc. Most of the industries are known to consume the surface water in process and for
domestic use and are not fully equipped with wastewater treatment facilities and thereby it
cannot be ruled out that there may be several incidences that these wastewater forms one of
the reasons for water pollution across the River though mostly mixed with domestic wastewater.
To assess the ground reality of their existence and extent of water consumption and disposal,
survey of industrial sectors along the stretch of Mithi was carried out. Out of the numerous
industries located alongside the banks of Mithi, about 80 representative industries were
identified &surveyed.
1.2.3 Resurfacing of Previously Deposited Pollutants All the small scale unauthorized oil recycling units located in downstream of CST, MTNL
&Kalina and leather tanning units that were once situated in Dharavi slums were known to be
disposing raw wastewater generated from these activities in Mithi. Attempts have been made to
control the pollution through shifting of certain activities, closure of several illegal establishments
and regulation through policy and technology intervention since 2006. However, it is anticipated
that the extent of accumulated pollution might have traversed through the banks to the waters
and ultimately piled up in the sediments mainly via runoffs. The inherent property of these
pollutants to resurface under the influence of phenomena of nature either physical or chemical
may also be one of the sources of pollutant load in these sections of Mithi.
1.2.4 Solid Waste Dumping Scenario in Mithi River In most of the stretches occupied by slum areas and few of the residential areas along the river
stretches like those near Filterpada, Gautam Nagar, Dharavi slums, and others, people tend to
dump the solid waste in the river practically treating it as an open dump. Situation is much worst
during precipitation with the probability of leachate getting mixed with river water. Survey has
Comprehensive Study of Mithi River Polluted Stretches Chapter I Introduction
5
revealed excessive dumping of solid waste in few stretches obstructing the river flow or
bifurcating it into smaller streams within the wide width of the river bed also affecting overall
aesthetics as presented in Figure 1.2.
1.3 Literature Review Mithi River has been in the limelight of discussions and review since July 2005 cloud burst of
Mumbai leading to massive disruption of life and property. Though MMRDA has been taking
efforts every year through dredging and de-silting of river basin in certain stretches of known
threat, rejuvenation of Mithi has not been upto desirable extent probably due to overcrowding
and haphazard development / urbanization around the basin has been exponential. Numerous
organizations have been working towards rejuvenation and several committees have been
formed and requested to study the situation and suggest recommendations.
Table 1.1 represents a précis of all earlier major studies and the relevant portions of actions &
recommendations to give a better insight of the problems of Mithi River and the thoughtful
approach by strategists in terms of interventions proposed. The status of those findings and
recommendations are beyond scope of this report but may as well form an important part of
study.
1.4 Organization of the report Chapter II details the methodology adopted while carrying out assessment and measurement of
pollution sources. It outlines steps involved in reconnaissance by MPCB during and Post –
Monsoon in-house studies as well as those adopted during Pre-Monsoon survey which enabled
to identify probable sampling locations in Mithi River as well as all the nallahs entering Mithi as
well as detailed survey for source identification. During sampling along the entire stretch of
Mithi, about 243 samples were collected out of which 77 samples represent those from Mithi
River, 73 nallahs were identified and sampled, 79 samples were collected from the identified
industries along with 14 Blanks to be used for QA/QC protocol.
It also describes the selection of parameters and their environmental significance in order to
determine the pollution levels. A brief outline to evaluate the relative criticality of the stretches
through developing the criticality indices for each stretch is also defined. The chapter also briefs
about the Receptor Modeling that was carried out to understand the correlation in different
parameters under consideration.

Comprehensive Study of Mithi River Polluted Stretches Chapter I Introduction
6
Chapter III describes detailed physical & environmental setting of Mithi River which has been
classified into 16 virtual stretches of 1km each for ease of representation and prioritizing
management needs. From the point of Origin as an overflow of Vihar Lake to Mahim Creek
where it meets the Arabian Sea, the entire stretch of river has been surveyed within an RoW of
about 200m on either sides. Various features observed such as land use, physical environment,
aesthetics, nallahs discharging into Mithi along with the physical measurements such as
average width, depth of the river, etc. are delineated in chapter III.
Figure 1.2 Solid Waste dumping at various locations along Mithi River
Chapter IV deals with the assessment of Flow of Mithi River and all the identified and physically
approachable nallahs. Flow in river as well as sources of pollution contributing the river were
determined using conventional process of manually measuring velocity of water flow and
dimensions of nallah / river.

Comprehensive Study of Mithi River Polluted Stretches Chapter II Introduction
7
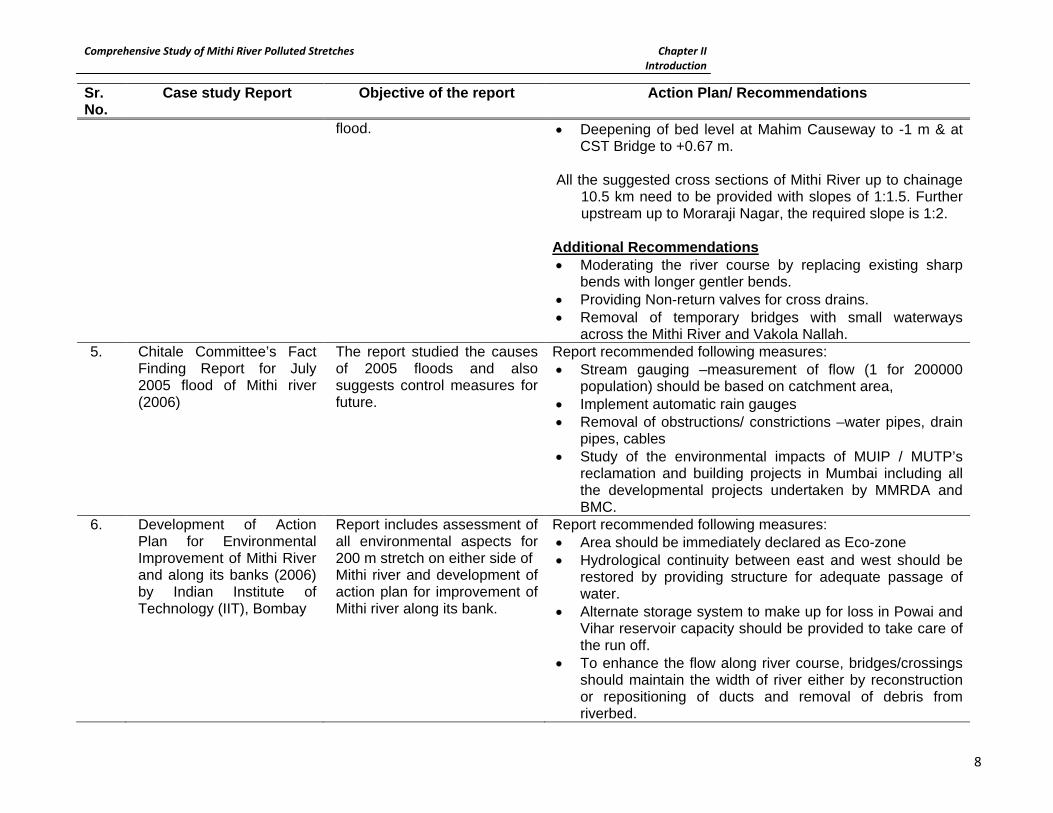
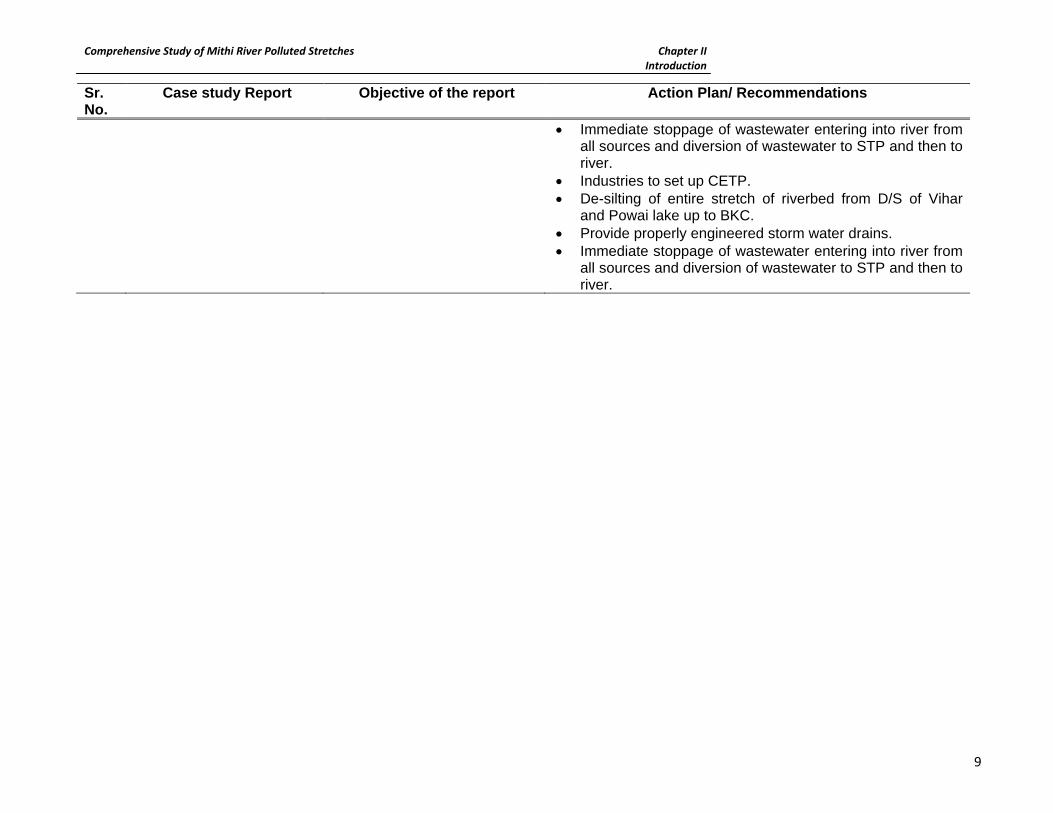
Table 1.1 Summary of Studies and Recommendations regarding Mithi River
Sr. No.
Case study Report Objective of the report Action Plan/ Recommendations
1. Model Studies on the Effect of Proposed Reclamation in Mahim Creek Report (1978) by Central Water and Power Research Station (CPWRS), Pune
Report pertaining to Bandra-Kurla Complex area studied the effect of reclamation in Mahim Creek and changes in drain system for development of Bandra Kurla Complex (BKC)
• The report recommended widening and deepening of the Mithi, sluice gates at Mahim Causeway and pumping of floodwater into creeks.
2. Report of NEERI , 1996, Supreme Court Case (PIL)
Report delineated the impact of mangrove removal and reclamation of land in BKC area
• Report concluded that the mangrove removal in BKC area (based on satellite maps) will lead to flooding in the region.
• Further, it was suggested that an environmental assessment of the area development should be carried out.
3. MPCB Report on Mithi River Water Pollution and Recommendations for its Control (2004)
Mithi river water quality was studied to assess the pollution load
Short Term Measures include: • Immediate closure of all the unauthorized activities, which
discharge industrial effluents, sludge, oil and chemicals. • Provision of proper garbage collection system to prevent
citizens from dumping the same into the river. Long Term Measures include: • Plan for interceptor sewers on both the banks and provide
Sewage treatment plants at various locations. • Dredge the entire length of Mithi river bed to improve its
carrying capacity. • Provide proper garbage collection stations for the benefit
of hutment dwellers. 4. Report of CWPRS, Pune:
1-D Mathematical Model and Desk Studies for mitigating floods of the Mithi River (2006)
report suggests that the first two segments, (origin to Jogeshwari) and (Vikhroli Link Road to Sir MV Road) have steep slopes, which provide a swift discharge of water eliminating the chances of flooding. The downstream segments, however, have flat slopes and hence may cause
Report recommends following measures: Bandra Kurla Complex (BKC) Area • Providing a dredged channel of 60 m width from -2 m (with
respect to Mean Sea Level or MSL) contour in the sea to Mahim Causeway bed level (dredged to -1 m) and removing existing rock over-crops.
• Widening of the waterway from Mahim Causeway to Dharavi Bridge to 100 m.
• Widening of Vakola Nallah from the earlier designed width of 40 m to 60 m.
Comprehensive Study of Mithi River Polluted Stretches Chapter II Introduction
8
Sr. No.
Case study Report Objective of the report Action Plan/ Recommendations
flood. • Deepening of bed level at Mahim Causeway to -1 m & at CST Bridge to +0.67 m.
All the suggested cross sections of Mithi River up to chainage
10.5 km need to be provided with slopes of 1:1.5. Further upstream up to Moraraji Nagar, the required slope is 1:2.
Additional Recommendations • Moderating the river course by replacing existing sharp
bends with longer gentler bends. • Providing Non-return valves for cross drains. • Removal of temporary bridges with small waterways
across the Mithi River and Vakola Nallah. 5. Chitale Committee’s Fact
Finding Report for July 2005 flood of Mithi river (2006)
The report studied the causes of 2005 floods and also suggests control measures for future.
Report recommended following measures: • Stream gauging –measurement of flow (1 for 200000
population) should be based on catchment area, • Implement automatic rain gauges • Removal of obstructions/ constrictions –water pipes, drain
pipes, cables • Study of the environmental impacts of MUIP / MUTP’s
reclamation and building projects in Mumbai including all the developmental projects undertaken by MMRDA and BMC.
6. Development of Action Plan for Environmental Improvement of Mithi River and along its banks (2006) by Indian Institute of Technology (IIT), Bombay
Report includes assessment of all environmental aspects for 200 m stretch on either side of Mithi river and development of action plan for improvement of Mithi river along its bank.
Report recommended following measures: • Area should be immediately declared as Eco-zone • Hydrological continuity between east and west should be
restored by providing structure for adequate passage of water.
• Alternate storage system to make up for loss in Powai and Vihar reservoir capacity should be provided to take care of the run off.
• To enhance the flow along river course, bridges/crossings should maintain the width of river either by reconstruction or repositioning of ducts and removal of debris from riverbed.
Comprehensive Study of Mithi River Polluted Stretches Chapter II Introduction
9
Sr. No.
Case study Report Objective of the report Action Plan/ Recommendations
• Immediate stoppage of wastewater entering into river from all sources and diversion of wastewater to STP and then to river.
• Industries to set up CETP. • De-silting of entire stretch of riverbed from D/S of Vihar
and Powai lake up to BKC. • Provide properly engineered storm water drains. • Immediate stoppage of wastewater entering into river from
all sources and diversion of wastewater to STP and then to river.

Comprehensive Study of Mithi River Polluted Stretches Chapter II Introduction
10
Chapter V elaborates the variations in the organic loads in Mithi River and that in nallahs. The
survey carried out revealed various pollutant bearing inputs into river, hence it was essential to
analyze the organic load in river and the identified nallahs. Major emphasis is given on the COD to
BOD ratio which helps in predicting the pollution source; either sewage or industrial.
Chapter VI explains the trends observed in the physico-chemical parameters considered for the
analysis of samples. These include Chlorides, sulfates, phosphates, nitrates along with the heavy
metals such as Lead, Cadmium, Zinc, Iron, Manganese, etc. Along with these parameters, chapter
briefs the variation in the concentrations of Phenols and MPN values analyzed for the samples.
Chapter VII outlines the criticality indices developed for each river stretch as well as for all of the
identified nallahs. Color code is developed to represent the relative criticality of the stretches &
nallahs; Red is indicative of highly / critically polluted and Green being the cleanest stretch in terms
of parameter vis a vis prescribed Standards wherever applicable. Color map is developed on the
basis of obtained results which is self-explanatory and elaborates the prioritized need of mitigation.
Chapter VIII briefs the adopted methodology and the consequent outputs of the Source Receptor
Modeling carried out for various categories of analysis data i.e. river, nallah for organics and metals
aimed at identifying components that are responsible for particular traits of independent or
dependent variables that ultimately represent sources thereby achieving the main overlooked
objective of previous studies i.e. understanding industrial v/s domestic wastewater contribution to
Mithi River.
Chapter IX of the report deals with the conservation management strategies proposed based on
the analytical data and criticality indices. In developing the management strategies, various aspects
such as flow to be treated, land availability, extent of treatment required are taken into account. The
principles of mitigation / management conservation are centered in 3 verticals i.e. At Source, In the
path & End of Pipe either singly or in combination of each other. Citing of successful technologies
that could be tailored and adopted for Mithi along with details of designs for industrial source
effluent treatment is also outlined.
References Adopted from website of MCGM citing Urban basic services in slums
Adopted from website of MCGM citing Strom Water Drainage
Adopted from website of MCGM citing Solid Waste Management

Comprehensive Study of Mithi River Polluted Stretches Chapter II Methodology
Chapter II 2.0 Background ...................................................................................................................... 11
2.1 Baseline Survey of the Mithi Basin and RoW ............................................................... 11
2.2 Baseline Monitoring ...................................................................................................... 12
2.2.1 Sampling ............................................................................................................... 12
2.2.1.1 Sampling Frequency and Duration ................................................................. 13
2.2.1.2 Sample Containers ......................................................................................... 13
2.2.1.3 Number of Samples ....................................................................................... 13
2.2.1.4 Sample Preservation ...................................................................................... 14
2.3 Analysis ........................................................................................................................ 15
2.3.1 Sample Coding ...................................................................................................... 15
2.3.1.1 Labeling of River Water Samples ................................................................... 15
2.3.1.2 Labeling of Confluencing Nallahs ................................................................... 15
2.3.1.3 Labeling of Industrial Wastewater .................................................................. 16
2.3.2 Parameters of Analysis ......................................................................................... 16
2.3.3 Reagents ............................................................................................................... 18
2.3.4 Methodologies ....................................................................................................... 18
2.3.4.1 pH ................................................................................................................... 19
2.3.4.2 Total Solids, TS (ppm) ................................................................................... 19
2.3.4.3 Conductivity .................................................................................................... 19
2.3.4.4 Dissolved Oxygen (ppm) ................................................................................ 19
2.3.4.5 Biochemical Oxygen Demand, BOD (ppm) .................................................... 20
2.3.4.6 Chemical Oxygen Demand, COD (ppm) ........................................................ 20
2.3.4.7 Heavy Metals ................................................................................................. 21
2.4 Data Collation ............................................................................................................... 21
2.5 Data Processing ........................................................................................................... 21
2.6 Criticality of Mithi River ................................................................................................. 22
2.7 Source Receptor Modeling ........................................................................................... 22
List of Tables
Table 2.1 Sampling Domain and Numbers ............................................................................... 14
Table 2.2 Significance of the physico-chemical parameters selected for characterization ....... 16
Table 2.3 Significance of heavy metals selected for characterization ...................................... 17
Comprehensive Study of Mithi River Polluted Stretches Chapter II Methodology
11
Chapter II Methodology
2.0 Background This report is a compilation of the overall action plan for conservation of river Mithi. Some of the
data represented have been previously studied by MPCB through baseline information
gathering exercise regarding river pollution status during monsoon & post monsoon season. It
has to be borne in mind that this report only forms a guideline for the methodology to be
adopted in such cases and shall never be interpreted as standalone method for river
conservation.
Ideally for a detailed cross-sectional study of the entire river stretch, the 15kms of river is to be
virtually divided into 15 stretches, each of about 1 km length in order to effectively represent the
cross-sectional data considering land-use patterns in RoW of about 200m on either sides of
river, ease of interpretation and with the view of micro-level conservation planning which has
also been attempted in the pre-monsoon studies carried out recently under the supervision and
guidance of MPCB.
2.1 Baseline Survey of the Mithi Basin and RoW In order to make the sampling convenient, two distinct and individual teams each for survey and
sampling were deployed with sufficient manpower. Survey team carried out detailed information
collection, sketching of sources, inventory, etc in each of the stretch and the nearby catchment
areas, land-use, industries, etc. along with questionnaire administration whereas sampling team
collected samples as well as prepared sketches of each sections to be used later for
understanding specific issues of particular location and parallel transporting samples to
laboratory.
Firstly, a survey team investigated and recorded data from catchment area (RoW), the land use
(residential/commercial/industrial), pollution sources, their types, contribution and extent of
potential impact on the river in that particular stretch finally leading to the sources. A
questionnaire circulated to the survey team for the preliminary data collection is presented in
Annexure II -1. This questionnaire will be used to obtain data from all the residing industries,
residential areas as well as commercial areas. The survey also rendered identification of
probable, accessible sampling points. Additionally, these sampling locations were compared
with those identified by using Google Imaging for a more effective and complete strategy of
deciding monitoring network.
Comprehensive Study of Mithi River Polluted Stretches Chapter II Methodology
12
2.2 Baseline Monitoring MPCB has carried out monitoring of stretch of river at 12 different locations during the period of
June 5 to 7 i.e. Monsoon of 2013 in order to assess the preliminary pollution potential of Mithi
River using Grab sampling technique. Same has been repeated in January 2014 in order to
compile seasonal variations during post Monsoon season. These sampling locations were
approximately 2.5kms apart throughout the stretch of Mithi from origin to its convergence into
Arabian Sea. Results of the same are discussed in subsequent Chapters.
Though these monitoring data helps understand the overall status of river pollution to some
extent, a more rigorous sampling network needed to be established for cross-sectional studies
that would help elaborate not only pollution in the river but also the source profiling, contribution
of industrial vis-a-vis domestic wastes, dilution/flushing impacts in terms of tidal influence and
thereby ultimately help prioritize stretches that need immediate interventions. The details of
these studies are discussed in the following sections.
2.2.1 Sampling Grab samples were collected using manual sampling method. Although the sample is from
varied sources, it was envisaged that the composition of the samples would not vary over space
and time due to monotonous & consistent source. Samples were collected for understanding
diurnal variations wherever possible and also to accommodate working and non-working days of
especially around industries in critical areas.
Several of the river stretches had bifurcated / split flows that do not cover the entire width of
river and thereby it was essential to understand the flow dynamics in each of the stretches for
desired measurements and sampling. Thereby a capped approach to sample both banks of
river including bifurcated / split streams upstream as well as downstream was adopted
essentially attempting representativeness of river in each stretch.
Though there were input nallahs in several stretches which were underground, piped,
inaccessible or carrying miniscule wastewater, attempt has been made to overlook the
characters of such nallahs and all those that were possibly within the reach of sampling were
considered in this study. Several of those where flow measurements were impossible, samples
were still collected for analysis purposes.

Comprehensive Study of Mithi River Polluted Stretches Chapter II Methodology
13
With regards to industrial samples in critical stretches, attempts were made to identify polluting
industries with the help of MPCB officials on ground and selecting representative industries in
each of these areas. Most of the samples were collected from outlets of ETP/STP wherever
available in industries whereas raw samples for nallahs emanating near individual or cluster of
industries especially those in unorganized industrial sectors such as those in Dharavi area were
also collected.
2.2.1.1 Sampling Frequency and Duration Further to already existing monitored data, a more thorough and detailed sampling was carried
out for a fortnight during May,2014 in order to include pre- Monsoon seasonal variability thereby
accommodating all the seasons during 2013 to 2014. During each of the season, sampling was
carried out minimum twice or more at each location of river. Some locations which were not
included as part of earlier sampling was also added in the latest one following exactly similar
protocol of frequency.
2.2.1.2 Sample Containers Polyurethane cans of 2-lit capacity were used for collection of samples. However, for the oil and
grease samples, separate wide mouth glass bottles of 1-lit capacity were used. Samples for
dissolved oxygen were collected in DO bottles during the earlier sampling whereas onsite
measurements of DO, pH, TDS and conductivity were done during the latest sampling.
2.2.1.3 Number of Samples Primarily, a three-fold sampling needs were identified i.e. first for analyzing pollution load in river
stretch, second for understanding pollution inputs through nallahs entering river at various
locations and third source categorization. However, a more elaborate objective of sampling &
this study was to understand the contribution from various sources especially percentage
contribution from industrial vis a vis domestic ones and thereby number of samples were also
aligned with the needs of source receptor modeling which were computed as follows.
Taking into consideration a random variation in both the analytical procedure and the
occurrence of a constituent at a point of sampling, the following formulae (Her majesty’s
Stationary Off. London, 1980) shall be used to calculate the number of samples.
N ≥ (ts / U)2

Comprehensive Study of Mithi River Polluted Stretches Chapter II Methodology
14
Where:
N = Number of samples t = student t- statistic for a given confidence level s = overall standard deviation U = acceptable level of uncertainty Approximately 80-85 samples are required to be collected for statistically valid and
representatively acceptable reporting with 95% confidence level and SD values of ±3 and
acceptable uncertainty of 10%. The total number of samples collected during Monsoon of June
2013 was 18 whereas that during post monsoon of January 2014 were 14 @ approximately
2.5km stretch and that during the pre-monsoon study period of May 2014 is 243 as represented
in Table 2.1.
Since the stretch of River is virtually divided in to 1km components, minimum of 5 samples were
collected in each stretch depending upon the pollution sources in that particular stretch so as to
incorporate status of upstream, downstream, confluence of entry of effluent, source potential,
etc.). This formed the basis of Kaiser Meyer Olkin [KMO] test of sampling adequacy with a value
>0.5 as acceptable & Bartlett’s Test of Sphericity that are discussed in subsequent chapters.
Table 2.1 Sampling Domain and Numbers
Domain Number of Samples Frequency Characteristics of Domain
River June 2013 - 18
January 2014 - 14 May 2014 – 77
4 - 6 times @ each location
Up & Downstream, confluence points of major nallahs & visible industrial source discharges
Nallahs June 2013 - 2
January 2014 - 2 May 2014 – 41
Once Only major ones especially those contributing approachable and those that could be easily traced to sources
Vakola Nallah May 2014 – 32 Once Major domestic ones contributing to Vakola
At Source May 2014 – 79 Once Random Industrial Samples
2.2.1.4 Sample Preservation Parameters such as DO, pH, TDS, conductivity and temperature were analyzed on site itself.
However, secondary analysis of all these above mentioned parameters in laboratory was also
done to support and quality check performance of on-site measurement equipments. DO
samples were subsequently fixed by adding manganous sulphate and alkali azide iodide when
onsite measurements were not done whereas for others, DO fixing was done in laboratory
wherein all samples were ice-preserved. All samples were transferred to laboratory within
6hrsafter collection and subjected to analysis for the parameters known to vary with time.

Comprehensive Study of Mithi River Polluted Stretches Chapter II Methodology
15
However, the for heavy metal analysis, the samples were preserved by adding H2SO4 to make
pH < 2.
All efforts were made to follow standard APHA/IS [APHA, 1998] methods for collection and
preservation of samples.
2.3 Analysis Collected and well-preserved samples were sent to MoEF approved Goldfinch Laboratory in
Thane on daily basis whereas one co-locational sample from every stretch of river were
transferred to MPCB laboratory for further analysis to characterize each of stretch. About 5%
field blanks were also used as QA/QC check during the study period.
2.3.1 Sample Coding For easy identification of sample in order to analyze it for its characteristics, a standard labeling
system was established for water samples collected from river water, confluencing nallahs as
well as the samples collected from industries visited during surveys.
2.3.1.1 Labeling of River Water Samples
River water samples were collected from each of the defined stretches and on either of the
banks of river. Hence in order to specify the bank as well as stretch from where the sample is
collected, it has also been incorporated in sample code as follows
i. For the samples being collected from bank 1 of the river, the sample codes will start from R1
where “1” is the first sample taken and so on.
ii. For the samples being collected from bank 2, the sample codes will start from R501 where
“501” stands for the first sample taken from bank 2 and so on
2.3.1.2 Labeling of Confluencing Nallahs
Sampling of the nallahs entering into the river water was also carried out to understand the
characteristics of incoming effluent.
For the samples taken from nallah on Bank 1, the sample code will be N1 where “1” refers to the
first sample taken from the nallah on Bank 1 and so on. And for the nallah samples taken from
Bank 2, the code will be N501 where “501” refers to the first sample taken from the nallah from
Bank 2 and so on.

Comprehensive Study of Mithi River Polluted Stretches Chapter II Methodology
16
2.3.1.3 Labeling of Industrial Wastewater
For samples collected from industry situated on Bank 1 of the river, I1 will be the code where
“I1” will refer to the first sample taken and so on. For samples taken from an industry situated on
Bank 2, the code will be I2 and so on.
To record the details of sampling at each of the location and of each sample collection,
“Sample Description sheet” was provided to the Sampling Team. This sheet served as a
detailed information sheet regarding sample locations, sample code and other parameters that
were to be observed and recorded by the sampling team at the time of sampling itself as
presented in Annexure II – 2.
2.3.2 Parameters of Analysis The selection of parameters for characterization is equally important and mainly depends upon
the type of activity. In the present study, since it may involve industrial effluents, the parameters
shall be selected depending upon their significance to the environment, toxicity levels, Pollution
Control Board Standards for discharge of effluents, etc.
Table 2.2represents the parameters selected for characterization of the effluents with respect to
their significance.
Table 2.2 Significance of the physico-chemical parameters selected for
characterization
Parameters Significance
pH Affects dissolution of gases, existence of life forms
Suspended Solids Affects treatment systems, blocks gills, reduces dissolution of gases
Dissolved Solids Affects dissolution of gases, may be toxic depending upon the content
COD Measure of Pollution load
BOD Measure of biologically degradable pollutants
DO Essential for the survival of life forms and degradation of the
organic waste
Oil and Grease Reduce sunlight and oxygen dissolution, toxic to biota
MPN Represents fecal contamination from human excreta & thereby
source of bacteriological related diseases

Comprehensive Study of Mithi River Polluted Stretches Chapter II Methodology
17
Along with the above-mentioned physico-chemical parameters, some heavy metals would be
also selected for effective inorganic categorization of the effluents. The significance of heavy
metals selected is given in Table 2.3 [Krishna M., et. al., 1991].
Table 2.3 Significance of heavy metals selected for characterization
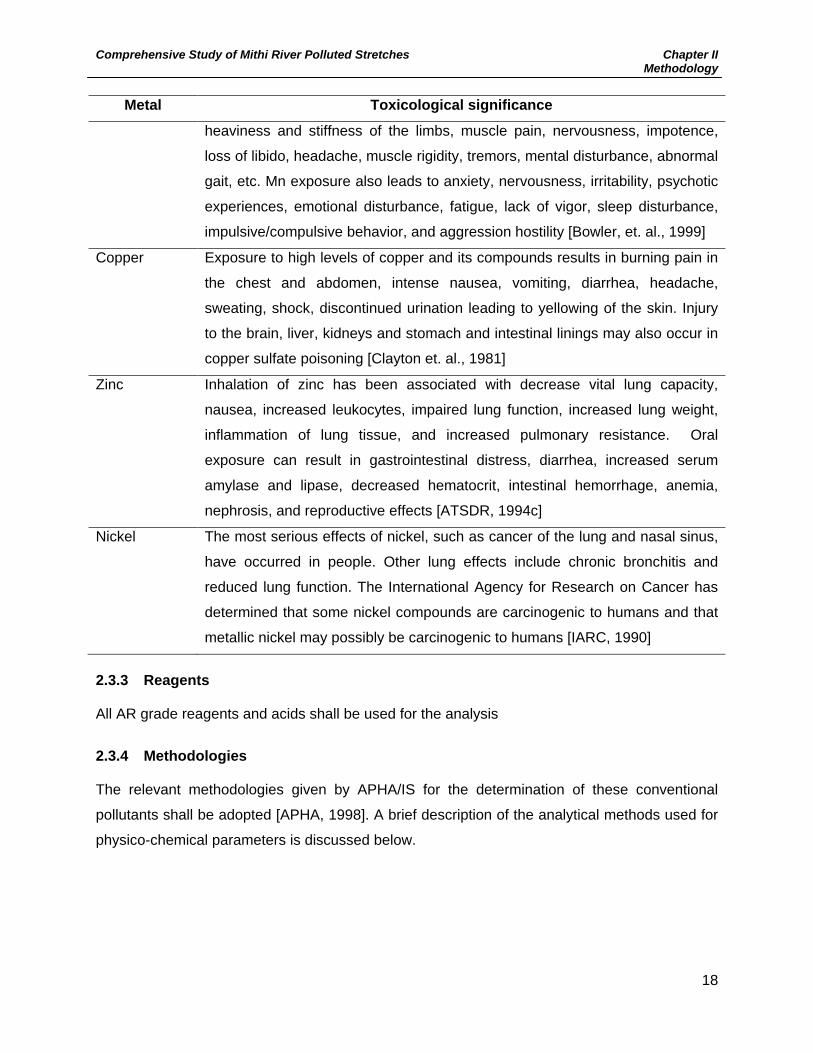
Metal Toxicological significance
Cadmium Chemical Cadmium may interfere with the metallothionein's ability to regulate
zinc and copper concentrations in the body. Metallothionein is a protein that
binds to excess essential metals to render them unavailable When cadmium
induces metallothionein activity; it binds to copper and zinc, disrupting the
homeostasis levels [Kennish, 1992]
Cobalt Cobalt has been associated with inflammation of the larynx, cardiomyopathy,
decreased body weight, and emphysema. Oral exposure can cause vomiting,
cardiomyopathy, increased lung, and heart weight, renal tubule necrosis, and
testicular degeneration [ATSDR, 2001b]
Chromium The chronic adverse health effects are respiratory and dermatologic [Viessman
and Hammer, 1985]. Effects that have been observed in humans are chronic
tonsillitis, chronic pharyngitis, minor renal impacts, runny nose, and ulceration
of nasal septum, stomach pains, cramps, ulcers, and lung cancer [ATSDR,
2001a]
Iron Chronic exposure results in mottling of the lungs and benign pneumoconiosis.
Some research is being done on the hypothesis that high iron stores (a genetic
predisposition – hemochromatosis) may increase the risk of chronic disease
including cancer and heart disease through oxidative mechanisms. Exposure
to higher doses of iron resulted in interference with testosterone production in
vitro [Goyer, et. al., 1995], stupor, shock, acidosis, hematemesis, bloody
diarrhea, or coma [HSDB, 1999]. Iron plays a critical role in generating
oxidative radicals that can ultimately damage the liver. Mild to moderate
toxicity has been observed at blood serum levels above 350 µg/dl, and greater
than 500 µg/dl was associated with coma, intestinal radiopacities, leukocytosis,
and a high risk of liver failure [Fuortes, 1999; Goyer, et. al., 1995]
Manganese Exposure to excess manganese may result in pulmonary inflammation
following inhalation of particulates, Parkinson’s-like symptoms, weakness,
Comprehensive Study of Mithi River Polluted Stretches Chapter II Methodology
18
Metal Toxicological significance
heaviness and stiffness of the limbs, muscle pain, nervousness, impotence,
loss of libido, headache, muscle rigidity, tremors, mental disturbance, abnormal
gait, etc. Mn exposure also leads to anxiety, nervousness, irritability, psychotic
experiences, emotional disturbance, fatigue, lack of vigor, sleep disturbance,
impulsive/compulsive behavior, and aggression hostility [Bowler, et. al., 1999]
Copper Exposure to high levels of copper and its compounds results in burning pain in
the chest and abdomen, intense nausea, vomiting, diarrhea, headache,
sweating, shock, discontinued urination leading to yellowing of the skin. Injury
to the brain, liver, kidneys and stomach and intestinal linings may also occur in
copper sulfate poisoning [Clayton et. al., 1981]
Zinc Inhalation of zinc has been associated with decrease vital lung capacity,
nausea, increased leukocytes, impaired lung function, increased lung weight,
inflammation of lung tissue, and increased pulmonary resistance. Oral
exposure can result in gastrointestinal distress, diarrhea, increased serum
amylase and lipase, decreased hematocrit, intestinal hemorrhage, anemia,
nephrosis, and reproductive effects [ATSDR, 1994c]
Nickel The most serious effects of nickel, such as cancer of the lung and nasal sinus,
have occurred in people. Other lung effects include chronic bronchitis and
reduced lung function. The International Agency for Research on Cancer has
determined that some nickel compounds are carcinogenic to humans and that
metallic nickel may possibly be carcinogenic to humans [IARC, 1990]
2.3.3 Reagents All AR grade reagents and acids shall be used for the analysis
2.3.4 Methodologies The relevant methodologies given by APHA/IS for the determination of these conventional
pollutants shall be adopted [APHA, 1998]. A brief description of the analytical methods used for
physico-chemical parameters is discussed below.

Comprehensive Study of Mithi River Polluted Stretches Chapter II Methodology
19
2.3.4.1 pH This is a measure of the intensity of the acid or alkaline condition of the solution. It is a way of
expressing the hydrogen ion concentration" It is important not only in the fields of water
supplies, disinfection, chemical coagulation, water softening and corrosion control, but also in
water treatments employing biological processes, and dewatering of sludges. They all require
pH control within narrow limits. Because of the fundamental relationship that exists between
acidity- alkalinity, a very high or a very low pH is injurious to the ecosystems. pH measurements
will be done by using standardized pH meter (ELICO make) [APHA pp 4-86]. On-site
measurement was done using Portable battery operated & calibrated pH Meter of Aquasol
Digital make.
2.3.4.2 Total Solids, TS (ppm) This is total of the suspended solids and Total dissolved solids as mentioned below.
I] Total Dissolved Solids, TDS (ppm) After separation of the suspended solids, the filtrate was evaporated, dried at 100°C and
weighed in a dish of known weight [APHA pp 2-56]. Also online sensor based TDS Meter was
used in later part of study.
II] Total Suspended Solids, TSS (ppm) Suspended solids were estimated after passing a known amount of thoroughly mixed sample
through a pre weighed filter paper (Whatman 42). After thoroughly washing the residue and
drying at 100°c, the solids will be weighed [APHA pp 2-57].
2.3.4.3 Conductivity For measurement of water sample’s conductivity, portable and calibrated conductivity with
range of 0 to 1999 µSof Aquasol Digital make was used.
2.3.4.4 Dissolved Oxygen (ppm) When organic load of an effluent is very high, the dissolved oxygen content of the receiving
water falls down very rapidly and consequently affects the aquatic organisms, which need
oxygen for survival. Depletion of dissolved oxygen may also result from individual wastes
containing inorganic reducing agents. When DO become NIL, septic conditions set in a foul
odour starts emanating. For water in equilibrium with ambient air, saturation concentration of

Comprehensive Study of Mithi River Polluted Stretches Chapter II Methodology
20
DO decreases with temperature (e.g.; 14.6 ppm at 00C to 6.2 ppm at 400C). The analysis of DO
is a key test for control activities and water treatment process control. APHA describes two
methods for DO determinations, the Winkler Iodometric and the Electrometric method using
membrane electrode. In the present work, the Winkler Iodometric method was followed. In this
method, the DO was fixed in the presence of alkaline manganese sulphate solution containing
potassium iodide, which on acidification liberated an equivalent amount of iodine. The
estimation will be carried out by the titration with sodium thiosulphate using starch as indicator
[APHA pp 4-129]. On-site measurements were carried out using the DO meter of Aquasol
Digital make.
2.3.4.5 Biochemical Oxygen Demand, BOD (ppm) BOD is amount of oxygen required by bacteria while stabilizing decomposable organic matter
(interpreted as bacterial organic food) under aerobic conditions. What is generally determined
as BOD at 20 °c and for 5 days represents about 70-80% of total BOD [Sawyer C. N., 1978].
Care is taken to preserve the changes in oxygen demand that would occur between sampling
and testing by preserving all the samples at 4°c in a refrigerator at the earliest after the
collection. The samples will be suitably diluted with aerated water, seeded and finally incubated
for 5 days at 20°c in an incubator. The oxygen depletion at the end of this period will be
measured as described under the method of DO determination. From the oxygen depletion
value thereby obtained, BOD values will be calculated [APHA pp5-3].
2.3.4.6 Chemical Oxygen Demand, COD (ppm) The COD determination is a measure of the oxygen equivalent of that portion of organic matter
that is susceptible to oxidation by an oxidant. It also includes oxidizable inorganic substances. In
this work, 0.25N potassium dichromate in acidic medium was used under reflux conditions for
two hours. When the sample contains significant amount of chlorides, mercuric chloride to be
added in excess to encounter the interference's of chlorides. From the amount of unreacted
potassium dichromate estimated using by back titration with standard ferrous ammonium
sulphate, COD value is estimated [APHA pp 5-14].COD is a measure of the oxygen equivalent
of the organic content the sample. Most type of the organic matter is oxidized byrefluxing the
sample with dichromate sulphuric acid mixture. Although relatively all the organic matter can be
oxidized from the sample, some amount of the oxidizing agent is also used for oxidizing the
chloride content of the sample This introduces uncertainty in the measurement of COD
especially when the concentration of chloride is very high in the samples to be analyzed.

Comprehensive Study of Mithi River Polluted Stretches Chapter II Methodology
21
2.3.4.7 Heavy Metals In case of the heavy metals, WET DIGESTION method has been adopted [Sawant A. D., 1995]
using closed dissolution system. 250ml effluent sample is to be pre-concentrated through
evaporation using conc. HNO3 on a hotplate. When the volume was reduced to about 10 ml, it
was treated with 5ml + 5ml + 5ml concentrated aqua regia. These treated samples were
evaporated to dryness avoiding charring. The samples were evaporated to dryness by adding
1ml concentrated perchloric acid to remove the traces of bound organic residues. Samples were
then extracted with 2M HNO3. An acid blank was prepared simultaneously and the samples
were analyzed using AAS against the blank.
2.4 Data Collation Information from various local and regional sources / agencies has been gathered and collated
in the present report.
Literature survey and references already gathered from various reports available with
government agencies and internet has been represented with most important outcomes in
previous section. It is proposed to survey surrounding areas of Mithi RoW via administering a
Questionnaire to all locals to collect information/data on water supply, wastewater generation,
collection, treatment and disposal. Similar exercise was carried out to collect information from all
the concerned departments, BMC, MPCB, industries, residential and commercial complex
surrounding the area, etc.
Equally interesting, advanced method of surveying using satellite support through Google Earth
Imaging has been adopted to study land-use patterns and discharge points into Mithi River
through virtually dividing Mithi into 16 components of 1km each. Data collated from the same is
discussed in the subsequent Chapters of this report.
2.5 Data Processing The collected data is scrutinized, compiled and processed to adjust for inconsistencies and to
obtain area-wise status of water supply, wastewater generation, pollution sources, treatment
and disposal including short term & long term measures to be adopted by all the concerned so
as to improve river water quality.

Comprehensive Study of Mithi River Polluted Stretches Chapter II Methodology
22
2.6 Criticality of Mithi River Attempt has been made to develop Mithi specific Criticality Indices to be applied to each stretch
to represent relative & in comparison to Discharge Standards within the 15km river along with
providing significant environmental determinants of every stretch. Weights are assigned to each
parameter depending on its environmental significance in terms of pollution potential, toxicity,
background concentration, Desirable Standards and other such review characteristics using
Analytical Hierarchical Process. These weights are extrapolation of best engineering judgment
based on experience of authors and can be surely challenged. Though the absolute numbers
can be questioned by one and all, the concept and finality of such index needs to be considered
in holistic way for assessment of relative pollution in Mithi River’s virtually classified stretches.
Chapter VII describes entire process of Criticality in much more details along with interpretation
of outputs of such attempt.
2.7 Source Receptor Modeling One of the most important facets of this particular study is to evaluate the contribution of
domestic and industrial wastewater into Mithi River. Conventional methods of COD/BOD ratios
may not be a universally accepted & standalone function of wastewater characterization
especially in dynamic surface water body conditions especially those under geologic leaching,
high turbulence and extensive tidal influence such as Mithi River. On the other hand, similar
known methods such as ground truthing through physical surveys may also not be possible in
this particular case due to the vast area of influence, enormous wastewater entry points / inputs
to Mithi River, many of them being piped and underground. Physical surveys would be
extensively resource consuming and difficult knowing the extent of areas connected to Mithi
River.
Realizing these facts about Mithi, the authors of this report have resorted to non-conventional
yet globally trending & scientifically acceptable method of Receptor Modeling. Though the best
approach of use of receptor models would be Mass Balance Studies, the authors are aware that
within the limited resources and time & also that only major source classification of domestic v/s
industrial needs to be evaluated, attempt has been made to use Principal Component Analysis
[PCA] through Data Reduction with aid of Statistical Package for Social Studies [SPSS] as a
source receptor model. The detailed methodology and concepts used in interpretation of the
model outputs is discussed in Chapter VIII of this report.

Comprehensive Study of Mithi River Polluted Stretches Chapter III Environmental – Physical Setting of Mithi River
Chapter III
3.0 Background ...................................................................................................................... 23
3.1 Physical Setup of Mithi ................................................................................................. 24
3.2 Stretch-wise Setup of Mithi ........................................................................................... 24
3.2.1 Stretch I – Vihar Lake to Filterpada ....................................................................... 24
3.2.2 Stretch II – Filterpada to Gautam Nagar ............................................................... 25
3.2.3 Stretch III - Gautam Nagar to JVLR Bridge ........................................................... 27
3.2.4 Stretch IV – JVLR Bridge to BamandayaPada ...................................................... 28
3.2.5 Stretch V – BamandayaPada to KBM Compound ................................................. 30
3.2.6 Stretch VI - KBM Compound to Marol ................................................................... 31
3.2.7 Stretch VII - Marol to Sakhinaka ............................................................................ 32
3.2.8 Stretch VIII - Sakhinaka to Domestic Airport ......................................................... 33
3.2.9 Stretch IX - Airport to Safed Pool .......................................................................... 34
3.2.10 Stretch X - Safed Pool to BMK Compound ........................................................... 35
3.2.11 Stretch XI - BMK Compound to CST Bridge ......................................................... 36
3.2.12 Stretch XII - CST Bridge to MTNL Bridge .............................................................. 38
3.2.13 Stretch XIII - MTNL Bridge to Bandra - Kurla Complex ......................................... 39
3.2.14 Stretch XIV –VakolaNallah .................................................................................... 40
3.2.15 Stretch XV- BKC to Kalanagar .............................................................................. 41
3.2.16 Stretch XVI - Kalanagar to Mahim ......................................................................... 42
List of Figures
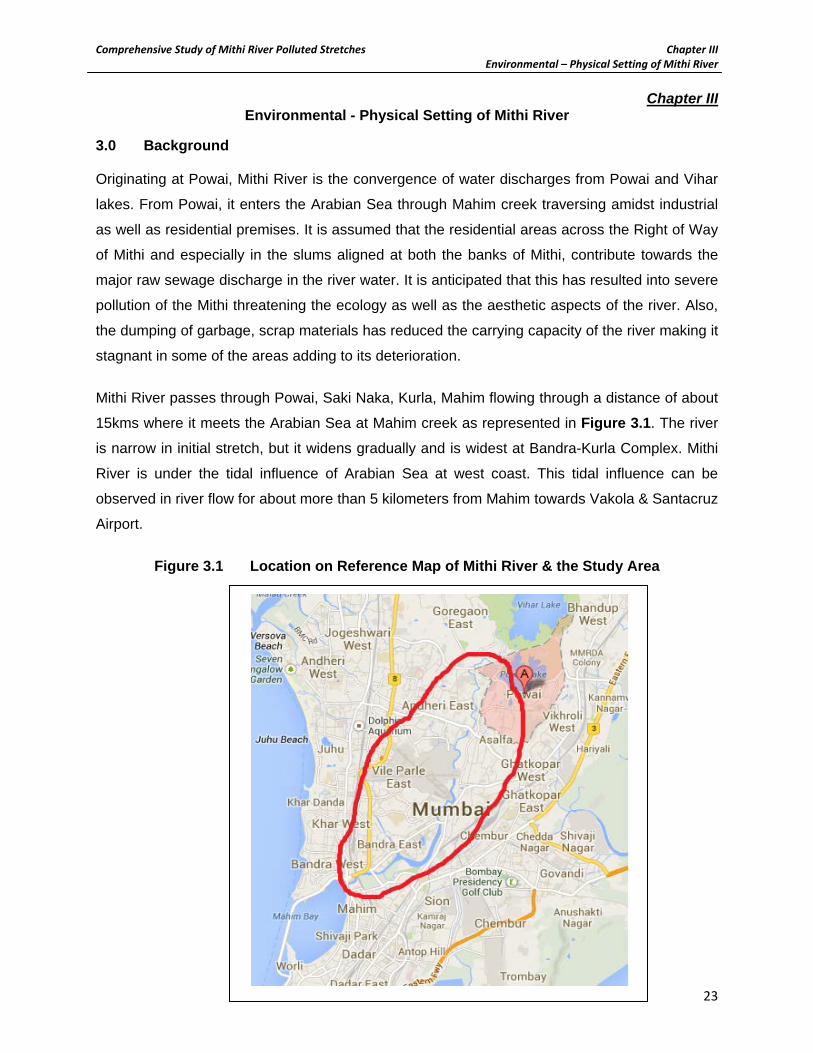
Figure 3.1 Location on Reference Map of Mithi River & the Study Area ................................ 23
Figure 3.2 Stretch I Vihar Lake to Filterpada .......................................................................... 25
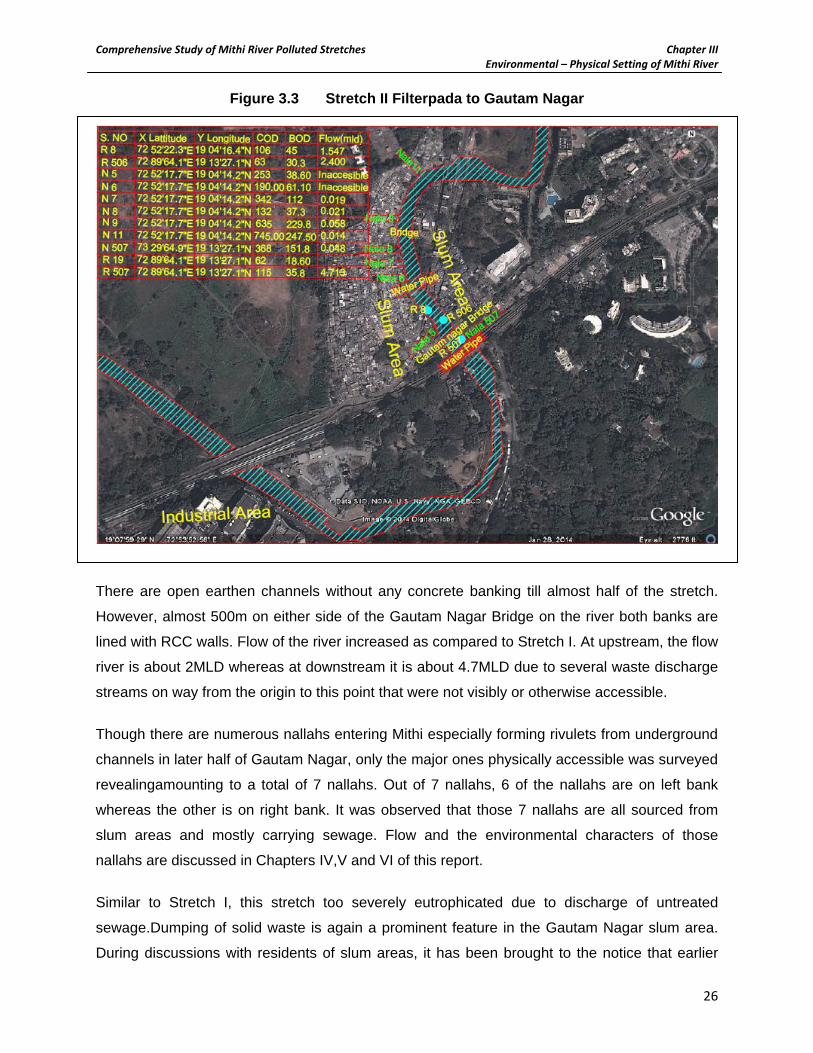
Figure 3.3 Stretch II Filterpada to Gautam Nagar .................................................................. 26
Figure 3.4 Stretch III Gautam Nagar to JVLR Bridge ............................................................. 27
Figure 3.5 Stretch IV - JVLR Bridge to BamandayaPada ....................................................... 29
Figure 3.6 Stretch V –BamandayaPada to KBM Compound .................................................. 30
Figure 3.7 Stretch VI - KBM Compound to Marol ................................................................... 31
Figure 3.8 Stretch VII - Marol to Sakhinaka ............................................................................ 32
Figure 3.9 StretchVIII - Sakhinaka to Airport .......................................................................... 34
Figure 3.10 Stretch IX - Airport to Safed Pool .......................................................................... 35
Figure 3.11 Stretch X Safed Pool to BMK Compound .............................................................. 36
Figure 3.12 Stretch XI - BMK Compound to CST Bridge ......................................................... 37
Figure 3.13 Stretch XII - CST Bridge to MTNL Bridge .............................................................. 38

Comprehensive Study of Mithi River Polluted Stretches Chapter III Environmental – Physical Setting of Mithi River
Figure 3.14 Stretch XIII CST Bridge to MTNL Bridge ............................................................... 39
Figure 3.15 Stretch XIV VakolaNallah ...................................................................................... 40
Figure 3.16 Stretch XV BKC to Kalanagar ............................................................................... 42
Figure 3.17 Stretch XVI - kalanagar to Mahim ......................................................................... 43
Comprehensive Study of Mithi River Polluted Stretches Chapter III Environmental – Physical Setting of Mithi River
23
Chapter III Environmental - Physical Setting of Mithi River
3.0 Background Originating at Powai, Mithi River is the convergence of water discharges from Powai and Vihar
lakes. From Powai, it enters the Arabian Sea through Mahim creek traversing amidst industrial
as well as residential premises. It is assumed that the residential areas across the Right of Way
of Mithi and especially in the slums aligned at both the banks of Mithi, contribute towards the
major raw sewage discharge in the river water. It is anticipated that this has resulted into severe
pollution of the Mithi threatening the ecology as well as the aesthetic aspects of the river. Also,
the dumping of garbage, scrap materials has reduced the carrying capacity of the river making it
stagnant in some of the areas adding to its deterioration.
Mithi River passes through Powai, Saki Naka, Kurla, Mahim flowing through a distance of about
15kms where it meets the Arabian Sea at Mahim creek as represented in Figure 3.1. The river
is narrow in initial stretch, but it widens gradually and is widest at Bandra-Kurla Complex. Mithi
River is under the tidal influence of Arabian Sea at west coast. This tidal influence can be
observed in river flow for about more than 5 kilometers from Mahim towards Vakola & Santacruz
Airport.
Figure 3.1 Location on Reference Map of Mithi River & the Study Area

Comprehensive Study of Mithi River Polluted Stretches Chapter III Environmental – Physical Setting of Mithi River
24
3.1 Physical Setup of Mithi For the detailed study, whole course of Mithi was virtually classified in 1km stretches. Initiating
from Vihar Lake, where the origin of Mithi is located, virtual stretches have been marked up to
Mahim where Mithi converges into Arabian Sea. At Vihar Lake, latitude is 72°53’57.97” E and
longitude is 19°08’26”N. Annexure III - Ipresent the setup of Mithi from point of origin to Mahim.
As presented Annexure III - I, the width of Mithi River is very narrow at origin at Vihar Lake and
it increases gradually as the river flows towards Mahim. A baseline survey was carried out
which enabled the sampling team in identifying the probable sampling locations along the river
stretch as well as in locating the industries in all the stretches as discussed in subsequent
Chapters.
3.2 Stretch-wise Setup of Mithi Virtually, in all 16 stretches were made and survey was conducted in each of the stretch. Survey
included detailed observations so as to identify major pollution source and critical parameters
those require more emphasis from pollution mitigation aspects. Information gathered through
the surveys is briefed stretch-wise in the following discussionsthis chapter.
3.2.1 Stretch I – Vihar Lake to Filterpada Stretch I define the origin of Mithi as the overflow of Vihar Lake and Powai Lake. In the stretch,
the width of river is very narrow and it gradually increases as the river flows. Average width of
the river is found to be about 20 m. Figure 3.2 represents Google image of Stretch I
Along the RoW of 200 m along the river stretch, three thickly populated slum habitations are
observed. According to the survey, about 2000-3000 is the population in those three slum
habitations. In this particular stretch, the river flows as an open nallahwithout channeling as
seen in some parts of Mithi. Flow of the river is so miniscule that flow could not be measured at
the sampling location due to miniscule levels.Along the river stretch, direct discharge of sewage
in river water has resulted into severe eutrophication, which in turn has made the river flow
marginal & inappropriate for measurements as seen from Photoplate III – 1. Dumping of solid
waste is another issueprominent in this section. Residents of the nearby slums dump the solid
waste into river that causingflow obstructions.

Comprehensive Study of Mithi River Polluted Stretches Chapter III Environmental – Physical Setting of Mithi River
25
Figure 3.2 Stretch I Vihar Lake to Filterpada
According to the preliminary survey, the discharge of sewage from the slum areas is not
properly channelized in the slum area that forms the only source of pollution here.There are no
industrial activities observed in this stretch. Along with solid waste dumping and discharge of
sewage, open defecation along the river banks is also one of the prominent features observed.
Wash the cloths (laundry), open bathing are other sources of grey water discharge contributing
towards potential pollution load.
3.2.2 Stretch II – Filterpada to Gautam Nagar Stretch II begins from Filterpada slums and extends up to the downstream of the Gautam Nagar
Bridge. Compared to Stretch I the width of river is increased in stretch II averaging to about 24m
though varies from about 14 m to 35 m.Several water pipelines are a prominent physical feature
of this section as shown in Photoplate III - 2.Gauatm Nagar essentially inhabits slum area with
about 500 tenements harboring about 2000 to 3000 residents.
Comprehensive Study of Mithi River Polluted Stretches Chapter III Environmental – Physical Setting of Mithi River
26
Figure 3.3 Stretch II Filterpada to Gautam Nagar
There are open earthen channels without any concrete banking till almost half of the stretch.
However, almost 500m on either side of the Gautam Nagar Bridge on the river both banks are
lined with RCC walls. Flow of the river increased as compared to Stretch I. At upstream, the flow
river is about 2MLD whereas at downstream it is about 4.7MLD due to several waste discharge
streams on way from the origin to this point that were not visibly or otherwise accessible.
Though there are numerous nallahs entering Mithi especially forming rivulets from underground
channels in later half of Gautam Nagar, only the major ones physically accessible was surveyed
revealingamounting to a total of 7 nallahs. Out of 7 nallahs, 6 of the nallahs are on left bank
whereas the other is on right bank. It was observed that those 7 nallahs are all sourced from
slum areas and mostly carrying sewage. Flow and the environmental characters of those
nallahs are discussed in Chapters IV,V and VI of this report.
Similar to Stretch I, this stretch too severely eutrophicated due to discharge of untreated
sewage.Dumping of solid waste is again a prominent feature in the Gautam Nagar slum area.
During discussions with residents of slum areas, it has been brought to the notice that earlier

Comprehensive Study of Mithi River Polluted Stretches Chapter III Environmental – Physical Setting of Mithi River
27
there were separate community toilet facilities provided by Municipal Corporation in this area for
men and women dwellers. However, over a period of time those for Women have been
tampered and thereby only one of it remains used thereby leading to open defecations.
Similarly, survey reveals that door to door solid waste collection system which is no more
functional and thereby dwellers are left with no other options but to dispose of the same into
river.
There is a prominently located and activelarge scale batching plant downstream of the right
bank beyond Gautam Nagar Bridge which was observed discharging raw effluents directly into
Mithi.
3.2.3 Stretch III - Gautam Nagar to JVLR Bridge From Gautam Nagar, the river flows through the JVLR area withan average width of river being
25m. The river is narrow upstream and gradually increases downstream ranging from 18 to 31m
whereas water flow is restricted only about 15m on the left bank section. Figure 3.4shows the
path of river in Stretch III.
Figure 3.4 Stretch III Gautam Nagar to JVLR Bridge

Comprehensive Study of Mithi River Polluted Stretches Chapter III Environmental – Physical Setting of Mithi River
28
As seen in most of the river stretches till now, slums form prominent habitation on one of the
banks of JVLR Bridge and Vettar Patta slum. Discussions with locals reveal 350 tenements in 2
prominent slums with approximate population amounting to be around 2500. Both banks of the
river are prominently walled with RCC and several underground pipes discharge effluents into
the river as shown in Photoplate III - 3.
Flow of the river gradually increases from upstream to downstream as 4 major nallahs identified
add up from the nearby residing areas. Three of them are on left bank whereas the fourth is on
right bank of the river. This area is prominently connected by discharge from nearby SEEPZ
industrial area. There is also a large scale RMC plant which is continuously discharging ample
volume of raw wastewater into Mithi. Buffalo harboring sheds(Gothas) discharging raw cow
dung waste from 3 such prominent ones are mixed with flow from MIDC area and directly
discharged into right bank of downstream of Mithi in this section. It seems that the nallahson left
bank carried sewage from nearby dwelling slums. This stretch being connected to the huge
MIDC area of SEEPZ, representative industries of MIDC along with common STP was identified
and monitored. Though most of the large scale industries had effluent treatment plants, it was
observed that several of the small & medium scale ones especially jewellery manufacturers
lacked wastewater management infrastructure and some of those which had ETP were not in
operation.
Comparatively only few patches of this Stretchwere found to be eutrophicated though open
defecation is again an underlying feature. Solid waste dumping resulting into heaps segregating
/ bifurcatingriver flow especially near the JVLR Bridge into effective streams of 15m each.
3.2.4 Stretch IV – JVLR Bridge to BamandayaPada Stretch IV originatesfrom downstream of JVLR Bridge and traverses up to the residential area of
BamandayaPada with width ranging from 17m to 37m, averaging about 32m.Figure 3.5
represents the Google Imagery of Stretch IV.
BamandayaPada is a mostly residential area with several housing complexes surrounding the
500m stretch across the bridge where sampling was carried out as presented in Photoplate III – 4where there are two prominent residential complexes viz. Nilgiri Towers and Customs colony
both having septic tank and discharging domestic sewage through underground pipeline into
Mithi on either banks of the river. Along with those complexes, Shankar Nagar Aadiwasi slumis
located in this area downstream of the bridge. Customs colony comprise of 126 tenements with
Comprehensive Study of Mithi River Polluted Stretches Chapter III Environmental – Physical Setting of Mithi River
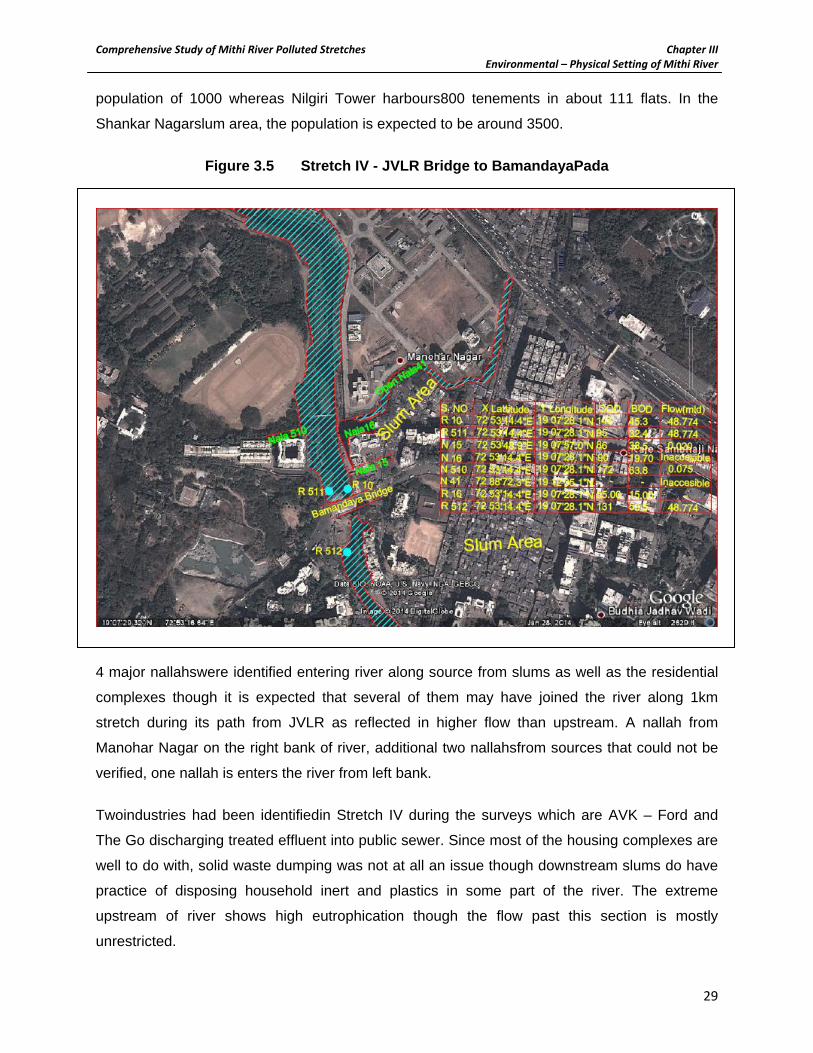
29
population of 1000 whereas Nilgiri Tower harbours800 tenements in about 111 flats. In the
Shankar Nagarslum area, the population is expected to be around 3500.
Figure 3.5 Stretch IV - JVLR Bridge to BamandayaPada
4 major nallahswere identified entering river along source from slums as well as the residential
complexes though it is expected that several of them may have joined the river along 1km
stretch during its path from JVLR as reflected in higher flow than upstream. A nallah from
Manohar Nagar on the right bank of river, additional two nallahsfrom sources that could not be
verified, one nallah is enters the river from left bank.
Twoindustries had been identifiedin Stretch IV during the surveys which are AVK – Ford and
The Go discharging treated effluent into public sewer. Since most of the housing complexes are
well to do with, solid waste dumping was not at all an issue though downstream slums do have
practice of disposing household inert and plastics in some part of the river. The extreme
upstream of river shows high eutrophication though the flow past this section is mostly
unrestricted.
Comprehensive Study of Mithi River Polluted Stretches Chapter III Environmental – Physical Setting of Mithi River
30
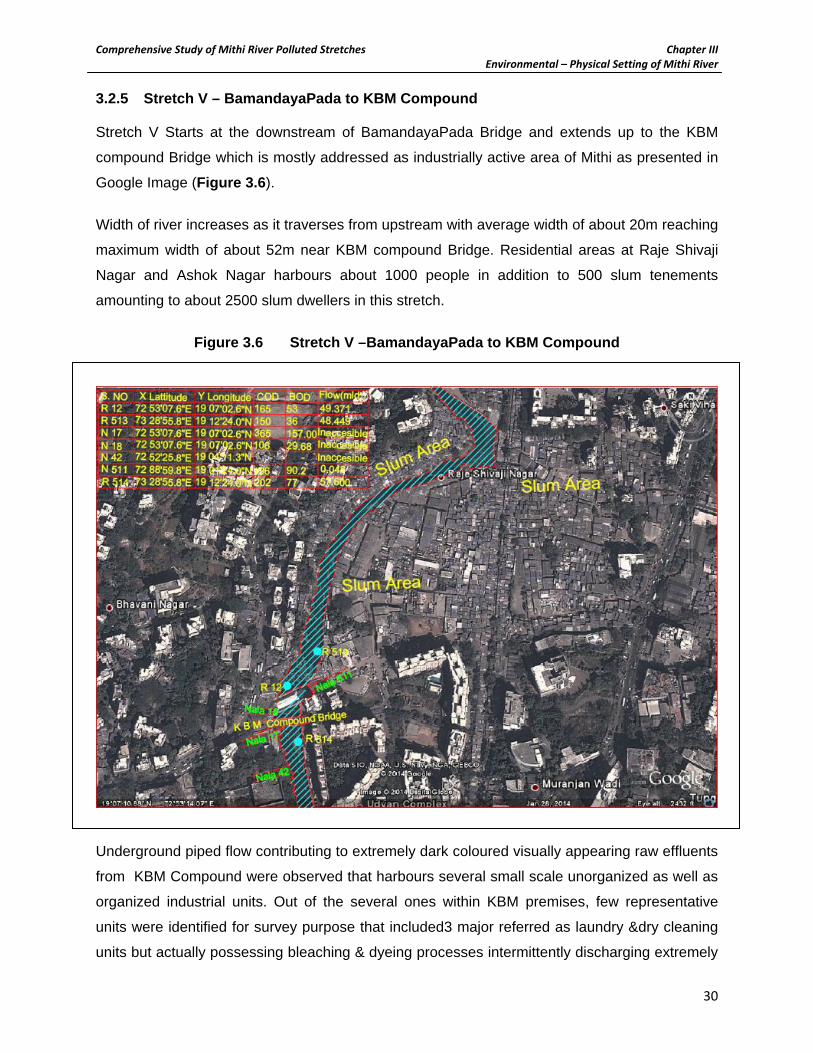
3.2.5 Stretch V – BamandayaPada to KBM Compound Stretch V Starts at the downstream of BamandayaPada Bridge and extends up to the KBM
compound Bridge which is mostly addressed as industrially active area of Mithi as presented in
Google Image (Figure 3.6).
Width of river increases as it traverses from upstream with average width of about 20m reaching
maximum width of about 52m near KBM compound Bridge. Residential areas at Raje Shivaji
Nagar and Ashok Nagar harbours about 1000 people in addition to 500 slum tenements
amounting to about 2500 slum dwellers in this stretch.
Figure 3.6 Stretch V –BamandayaPada to KBM Compound
Underground piped flow contributing to extremely dark coloured visually appearing raw effluents
from KBM Compound were observed that harbours several small scale unorganized as well as
organized industrial units. Out of the several ones within KBM premises, few representative
units were identified for survey purpose that included3 major referred as laundry &dry cleaning
units but actually possessing bleaching & dyeing processes intermittently discharging extremely

Comprehensive Study of Mithi River Polluted Stretches Chapter III Environmental – Physical Setting of Mithi River
31
dark coloured visually appearing raw effluents into the right bank of river through underground
pipelines in addition to wastewater being discharged from surrounding restaurants on to the left
bank of river. The downstream of KBM Compound had several water discharges through open
and closed pipelines mainly contributing to the domestic wastewater as shown in Photoplate III – 5. There were several other sources contributing in various sections of upstream of KBM
Compound such as L&T, Pepsi Aquafina, 21 Honda – 2 Wheeler Washing, Gen Next – 4
Wheeler Washing centre, Chandra Cleaners, Appat Chandrat, Super Cleaners, M.J Chemicals
&Jayshree Metals that were also identified and surveyed revealing extreme variety of industrial
activities around this stretch.
3.2.6 Stretch VI - KBM Compound to Marol Stretch VI virtually originates downstream of KBM compound and terminates at Marol. Marol is
known to be an industrial area also comprising of several residential clusters. The industrial
area is mostly situated at the downstream of the stretch near the Marol Bridge. As shown in
Figure 3.7, the river in this stretch has average width of about 10m to maximum width is
measured to be 20m along the river path.Flow of the river is increasing at the downstream
mainly due to underground discharge sources entering the river as shown in Photoplate III - 6.
Figure 3.7 Stretch VI - KBM Compound to Marol

Comprehensive Study of Mithi River Polluted Stretches Chapter III Environmental – Physical Setting of Mithi River
32
Limited survey in the area of upstream of the stretch revealed residential area with about 2000
population in approximately 300 slum tenements.In the stretch, only one major nallah was
visually identified on the right bank of the river though it is surely anticipated that there would be
several other underground nallahsthat are contributing to river flow. In the Marol area, 10 out of
the many existing industries were surveyed as representative units comprising of automobile
units, jewellery, Pidillite, Seven Hills Hospital, Wah Bakery and others for understanding flows
and contribution into Mithi River. Though several of them had ETP units such as Wah Bakery
&Pidilite, other small scale unit’s especially automobile washing centre & jewellery discharged
raw effluents into the river. Very limited eutrophication was observed along with walled banks
restricting solid waste dumping and open defecation in this section of river.
3.2.7 Stretch VII - Marol to Sakhinaka The Stretch VII starts at downstream of Marol Bridge and terminates at Sakhinaka. Figure 3.8shows width of river decreasing from upstream to downstream ranging from 20m to 10m &
an average of about 15m.
Figure 3.8 Stretch VII - Marol to Sakhinaka

Comprehensive Study of Mithi River Polluted Stretches Chapter III Environmental – Physical Setting of Mithi River
33
Flow of the river increases from upstream to downstream mainly due to 6 major nallahsidentified
& surveyed entering the river. Out of 6, four nallahs are located on right bank of the river
whereas two are on left bank.
Sakhinaka area represents mixed land use withresidential, commercial and industrial areas
identified.Few major industrial units located upstream of the river on the left bank while the
residential area is situated at the downstream of stretch. Around 400 slum housing is also
witnessed in the residential area harbouring population of about 4000-5000. In the industrial
area, 5 industrial units have been identified during surveys which include automobile unit, a
chemical industry unit and dry cleaning / laundry. Hotel Five Spice and Mittal complex – a small
IT park were identified as commercial units& surveyed along with sampling.
No prominent eutrophication was observed though the flow of river was again segregated due to
mounds of soil & vegetation downstream Sakhinaka Bridge. Dumping of solid waste is minimal
&river flows without any obstructions in the path. Being majorly an industrial and commercial
area, open defecation is not observed in this stretch as presented in Photoplate III –7.
3.2.8 Stretch VIII - Sakhinaka to Domestic Airport From downstream of the Sakhinaka, the Stretch VIII extends up to the downstream of Domestic
Airport.Figure 3.9reveals that width of river decreases from upstream of 40m to downstream of
25m. Flow of the river is found to be decreased a bit from upstream to downstream probably
due to crude method of measurement.
Very limited eutrophication was observed in this stretch and the river flow is continuous without
any obstacles. One prominent nallah sourced from outlet of STP of Airport enters Mithi in this
region. It is an area with mixed land use harbouring many residential and several unorganized
industrial clusters on either banks of river. Industrial area is mainly represented by logistics
including mega units of movers and packers.
In the RoW of 200m in this stretch, neither open solid waste dumping nor Open defecation was
observed. Some of the important features of this stretch is presented in Photoplate III –8.
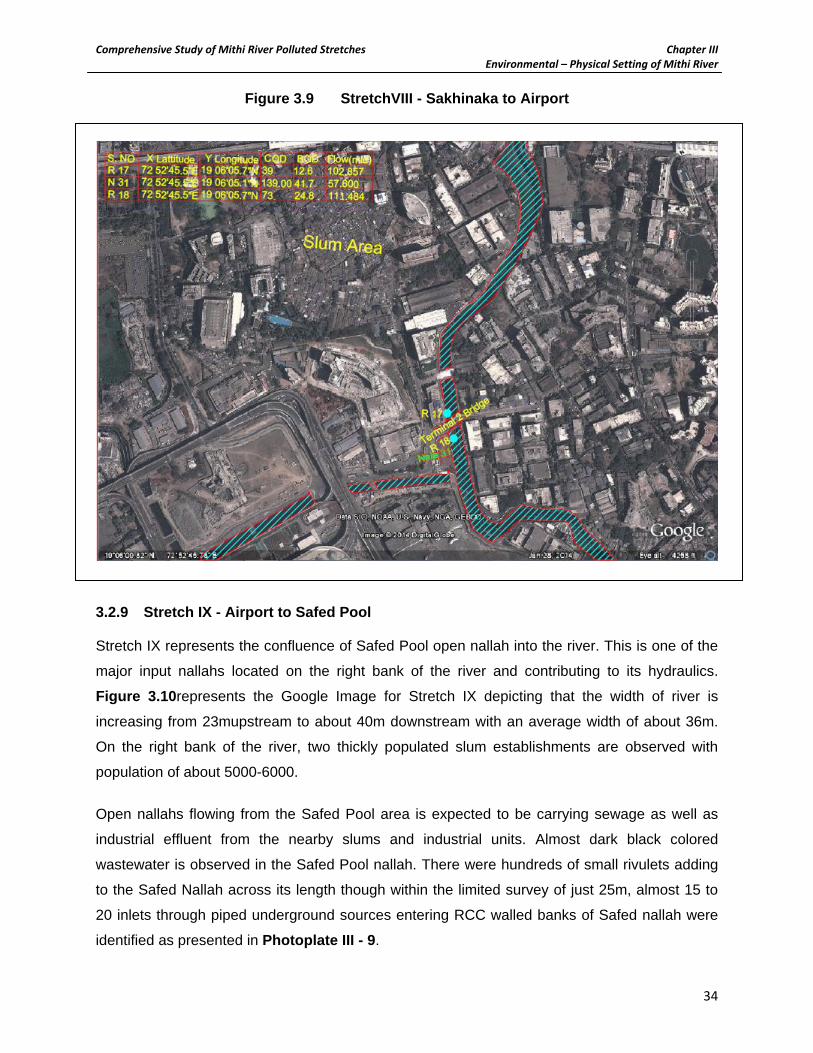
Comprehensive Study of Mithi River Polluted Stretches Chapter III Environmental – Physical Setting of Mithi River
34
Figure 3.9 StretchVIII - Sakhinaka to Airport
3.2.9 Stretch IX - Airport to Safed Pool Stretch IX represents the confluence of Safed Pool open nallah into the river. This is one of the
major input nallahs located on the right bank of the river and contributing to its hydraulics.
Figure 3.10represents the Google Image for Stretch IX depicting that the width of river is
increasing from 23mupstream to about 40m downstream with an average width of about 36m.
On the right bank of the river, two thickly populated slum establishments are observed with
population of about 5000-6000.
Open nallahs flowing from the Safed Pool area is expected to be carrying sewage as well as
industrial effluent from the nearby slums and industrial units. Almost dark black colored
wastewater is observed in the Safed Pool nallah. There were hundreds of small rivulets adding
to the Safed Nallah across its length though within the limited survey of just 25m, almost 15 to
20 inlets through piped underground sources entering RCC walled banks of Safed nallah were
identified as presented in Photoplate III - 9.

Comprehensive Study of Mithi River Polluted Stretches Chapter III Environmental – Physical Setting of Mithi River
35
Figure 3.10 Stretch IX - Airport to Safed Pool
In Stretch IX, two representative industries were identifies during the survey which include
engineering unit named Pentex Engineering and a Soap Manufacturing unit.
This nallahwas influenced heavily with flow ranging from depth of 0.3m or more in several part
of the nallahthereby causing turbulences within itself and also at convergence into the river
thereby restricting eutrophication in the centre of river whereas patches of vegetation were
observed on either of the banks that are RCC walled. The slums dwellers were provided with
toilets and solid waste collection facility in this area thereby the river seemed to be free of such
mal-practices as observed in the earlier stretches of river.
3.2.10 Stretch X - Safed Pool to BMK Compound Stretch X virtually starts from downstream of Safed Pool and ends at BMK Compound Bridge as
shown inFigure 3.11.The average width of river in this stretch is about 20m and is consistent
throughout the 1km stretch. Visually it was observed that the flow increases from upstream to
downstream.Approximate depth of the river was observed to be approximately 0.3m and this is

Comprehensive Study of Mithi River Polluted Stretches Chapter III Environmental – Physical Setting of Mithi River
36
probably the most uniformly distributed stretch of river across its width (Photoplate III –10).Thickly populated slum establishments, Sandesh Nagar and Kranti Nagar are located on
either sides of river. In all about 5000 slum tenements are expected to be housed amounting to
a population of approximately 35000. This is a purely residential area with no signs of industries
as confirmed during survey.
Three prominent nallahsenter into the river out of which 2 of them are located on the right bank.
Being a residential zone, it is believed that these nallahswould carry the sewage from the
slums.All nallahswere open earthen ones though the river embankment is completely RCC walls
along both its banks.
Figure 3.11 Stretch X Safed Pool to BMK Compound
3.2.11 Stretch XI - BMK Compound to CST Bridge Stretch of Mithi from downstream of the BMK Compound to the CST Bridge is referred as the
Stretch XI. Figure 3.12shows the Stretch XI indicating width of the river to increase from
42mupstream to 53m downstream of river. Average width of the river is approximately48m.
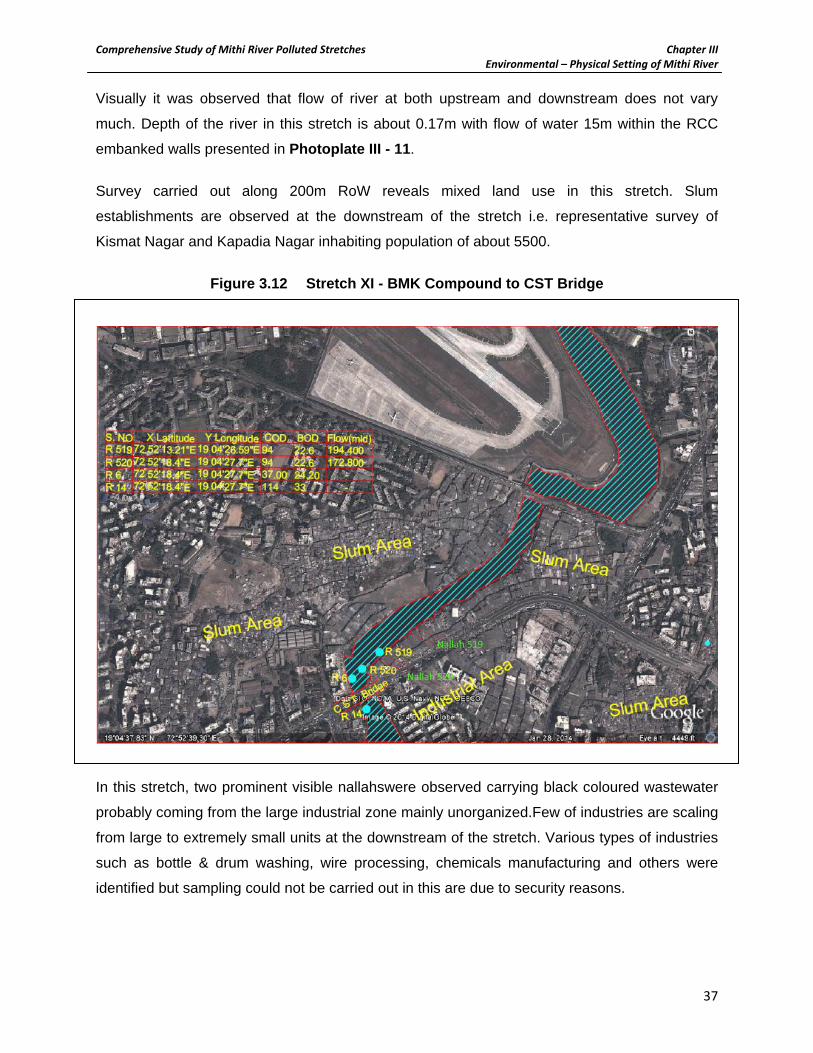
Comprehensive Study of Mithi River Polluted Stretches Chapter III Environmental – Physical Setting of Mithi River
37
Visually it was observed that flow of river at both upstream and downstream does not vary
much. Depth of the river in this stretch is about 0.17m with flow of water 15m within the RCC
embanked walls presented in Photoplate III - 11.
Survey carried out along 200m RoW reveals mixed land use in this stretch. Slum
establishments are observed at the downstream of the stretch i.e. representative survey of
Kismat Nagar and Kapadia Nagar inhabiting population of about 5500.
Figure 3.12 Stretch XI - BMK Compound to CST Bridge
In this stretch, two prominent visible nallahswere observed carrying black coloured wastewater
probably coming from the large industrial zone mainly unorganized.Few of industries are scaling
from large to extremely small units at the downstream of the stretch. Various types of industries
such as bottle & drum washing, wire processing, chemicals manufacturing and others were
identified but sampling could not be carried out in this are due to security reasons.
Nallah 519
Nallah 520
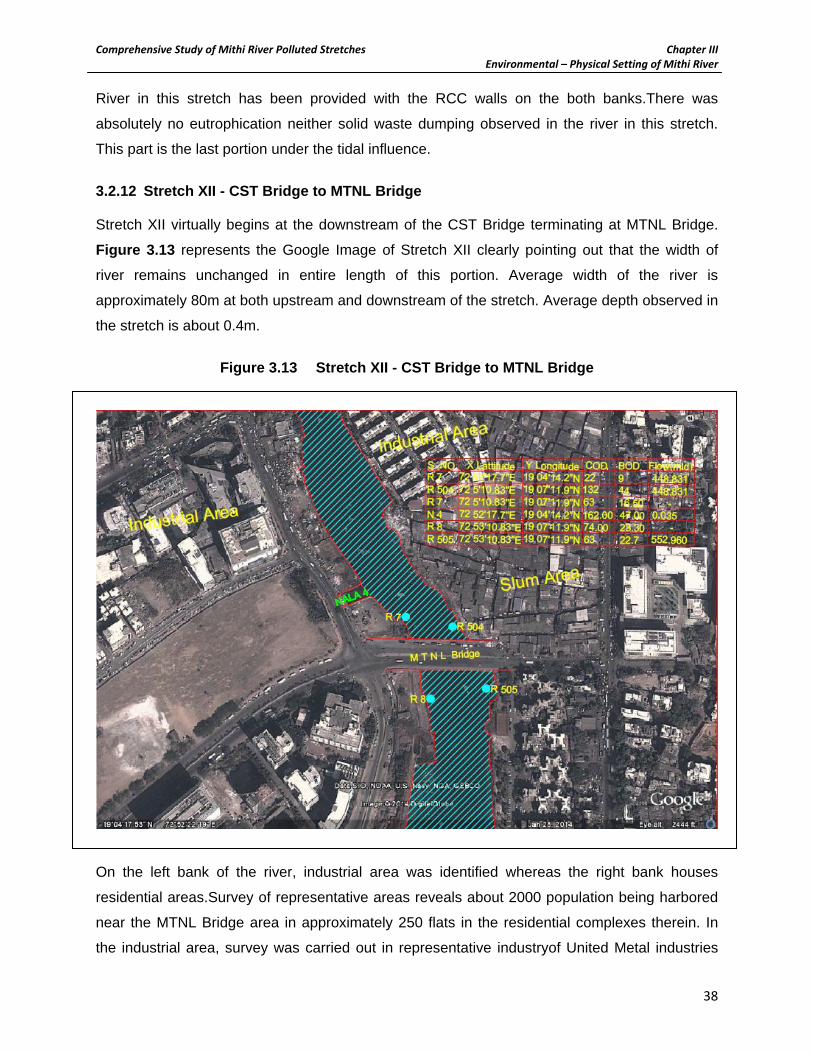
Comprehensive Study of Mithi River Polluted Stretches Chapter III Environmental – Physical Setting of Mithi River
38
River in this stretch has been provided with the RCC walls on the both banks.There was
absolutely no eutrophication neither solid waste dumping observed in the river in this stretch.
This part is the last portion under the tidal influence.
3.2.12 Stretch XII - CST Bridge to MTNL Bridge Stretch XII virtually begins at the downstream of the CST Bridge terminating at MTNL Bridge.
Figure 3.13 represents the Google Image of Stretch XII clearly pointing out that the width of
river remains unchanged in entire length of this portion. Average width of the river is
approximately 80m at both upstream and downstream of the stretch. Average depth observed in
the stretch is about 0.4m.
Figure 3.13 Stretch XII - CST Bridge to MTNL Bridge
On the left bank of the river, industrial area was identified whereas the right bank houses
residential areas.Survey of representative areas reveals about 2000 population being harbored
near the MTNL Bridge area in approximately 250 flats in the residential complexes therein. In
the industrial area, survey was carried out in representative industryof United Metal industries

Comprehensive Study of Mithi River Polluted Stretches Chapter III Environmental – Physical Setting of Mithi River
39
dealing in scrap activity. Several other manufacturing units such as cement boards, resale of
furniture and others mainly housing dry processes were observed in this section.
RCC wall embankment is provided only on the left bank.Due of the tidal influence, high salinity
&turbulencesno eutrophication was observed. Solid waste dumping and open defecation are not
carried out in this stretch which makes the river flow unrestricted as shown in Photoplate III - 12.
3.2.13 Stretch XIII - MTNL Bridge to Bandra - Kurla Complex The stretch of Mithi from MTNL Bridge to BKC area is referred as the Stretch XIII as shown in
Figure 3.14. It can be observed that width of the river is increases from 156m upstream to
426m downstream computed from Google Image. However, severe eutrophication is observed
downstream of the river where the flow gets fragmented near the eutrophicated area. Hence, it
can be inferred that even if the width of river visually looks large the effective width through
which the river water actually flows is about 80m as presented in Photoplate III – 13.
Figure 3.14 Stretch XIII CST Bridge to MTNL Bridge

Comprehensive Study of Mithi River Polluted Stretches Chapter III Environmental – Physical Setting of Mithi River
40
Flow of the river increases tremendously from upstream to downstream as Vakolanallahenters
in the river in this stretch. Other than Vakolanallah, two small nallahsenters the river from left
and right bank.On the right bank of the river, Ambedkar Nagar residential area is situated where
the population is about 35000 inhabitedin 7000 slum houses. Along the Sion-BandraLink Road,
residential establishments with population of approximately 5000 was identified.Prem Nagar an
industrial area housing numerous unorganized small scale activities such as Bottle washing,
Scrap merchants, tile cutting, etc. was also surveyed.
Eutrophication levels in this stretch werevery prominent segregating flow of river into several
streams within the width of river. RCC wall is provided on the left bank of the river only and this
stretch is not witnessed with solid waste dumping practices.
3.2.14 Stretch XIV –VakolaNallah Though not direct part of the Mithi River, but being one of the most exclusive source of
wastewater from the left bank of the river near BKC, Vakolanallahenters the river. Vakolais
essentially a 3.5km nallahwherein numerous small sources enter as it merges into Mithi.
Figure 3.15 Stretch XIV VakolaNallah
VakolaNallah

Comprehensive Study of Mithi River Polluted Stretches Chapter III Environmental – Physical Setting of Mithi River
41
From origin of the Vakola to the confluencing point at Mithi, the width of nallahincreases
gradually withaverage being about 60m. During survey, it was observed that about hundreds of
small nallahsenters in the Vakolanallah as it propagates from the origin though many of them
were inaccessible being underground and entering at various depths through punctured inlets of
the RCC lined banks. There were 32 such major nallahs that were surveyed.
Slum establishments observed along the banks of Vakolaserved to a population of about 5000
and more. Maharashtra Colony located on the left bank about 1km from convergence of it with
Mithi housed about 22,000 people in about 4500 tenements. No prominent industrial units were
identified though discussions with individuals during survey did mention some bakeries and
small scale food processing units.
Eutrophication along the Vakola is very much limited but yet observed at some patches along its
path.The zone of Vakola is literally free of solid waste dumping though sporadic instances of
plastic and paper materials in the nallah were observed.
3.2.15 Stretch XV- BKC to Kalanagar From BKC, river flows through Kalanagar area which is referred as the Stretch XV of river.
Average width of the river in this stretch is approximately 60m however, because of the extreme
eutrophication in the stretch, the actual width of river flowis only 600m as computed from
Google Image presented in Figure 3.16though the actual flow of water is restricted only in the
central most 60m portion of this width as evident from Photoplate III – 15.
Flow of the river increases from upstream to downstream as the stretch is under tidal influence.
Along the river, thickly populated slums were observed with estimated population of about
20,000. Dharavi slums are located on the right bank of the river which is expected to house a
population of more than 50,000. Though Dharavi is anticipated to be one of the most active
industrial zones of Mumbai, detailed survey of the area and discussions with residents revealed
the fact that most of the industries have been closed down and only secondary processing in
form of tailoring of leather is operation now. Tanning is totally closed and few small slaughter
houses along with bakeries catering to the needs to residents were present in this area.
In all about 30 to 40units majority of them involved in dyeing, few chemical Drum & Bottle
washing, and very limited soap manufacturing industries were located in entire Dharavi area.
Being sensitive area, information gathering was extremely difficult and few samples from
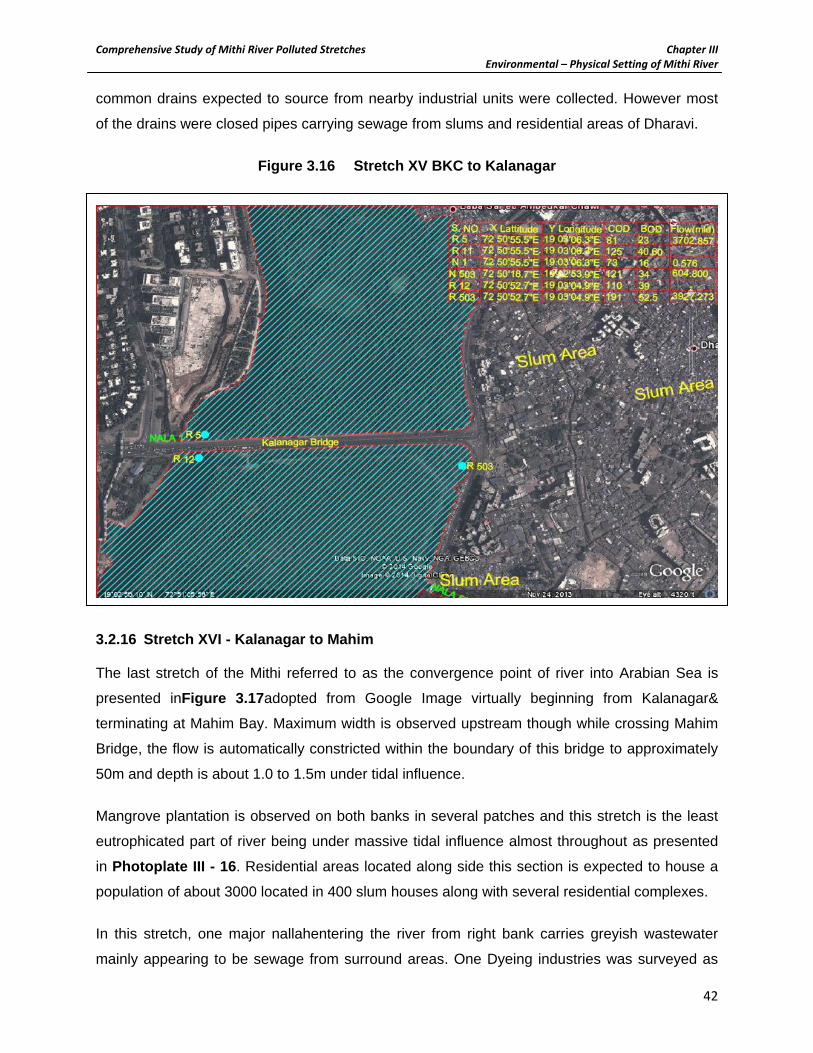
Comprehensive Study of Mithi River Polluted Stretches Chapter III Environmental – Physical Setting of Mithi River
42
common drains expected to source from nearby industrial units were collected. However most
of the drains were closed pipes carrying sewage from slums and residential areas of Dharavi.
Figure 3.16 Stretch XV BKC to Kalanagar
3.2.16 Stretch XVI - Kalanagar to Mahim The last stretch of the Mithi referred to as the convergence point of river into Arabian Sea is
presented inFigure 3.17adopted from Google Image virtually beginning from Kalanagar&
terminating at Mahim Bay. Maximum width is observed upstream though while crossing Mahim
Bridge, the flow is automatically constricted within the boundary of this bridge to approximately
50m and depth is about 1.0 to 1.5m under tidal influence.
Mangrove plantation is observed on both banks in several patches and this stretch is the least
eutrophicated part of river being under massive tidal influence almost throughout as presented
in Photoplate III - 16. Residential areas located along side this section is expected to house a
population of about 3000 located in 400 slum houses along with several residential complexes.
In this stretch, one major nallahentering the river from right bank carries greyish wastewater
mainly appearing to be sewage from surround areas. One Dyeing industries was surveyed as

Comprehensive Study of Mithi River Polluted Stretches Chapter III Environmental – Physical Setting of Mithi River
43
representative industrial activity though this portion is devoid of any known such sources. This
part of river is naturally low lying and do not have artificial embankments as done for rest of the
Mithi River. Most prominent issue in this area is open defecation alongside both the banks and
people were found to be having contact with this water especially during low tides for fishing
activity.
Figure 3.17 Stretch XVI - kalanagar to Mahim

Comprehensive Study of Mithi River Polluted Stretches Chapter IV Flow Assessment in Mithi River
Chapter IV
4.0 Background ................................................................................................................................... 44
4.1 Flow Measurement Methodology ........................................................................................... 44
4.2 Flow in VakolaNallah ............................................................................................................... 53
List of Figures
Figure 4.1 Flow Variations Across Mithi River ..................................................................................... 46 Figure 4.2 Flow at tide influenced locations ........................................................................................ 47 Figure 4.3 Flows in MLD of Nallahs along Gautam Nagar Stretch ....................................................... 48 Figure 4.4 Flows in MLD of Nallahs along JVLR Stretch ....................................................................... 48 Figure 4.5 Flows in MLD of Nallahs along Bamandaya Pada Stretch ................................................... 49 Figure 4.6 Flows in MLD of Nallahs along KBM Compound Stretch .................................................... 50 Figure 4.7 Flows in MLD of Nallahs along Sakhinaka Stretch .............................................................. 50 Figure 4.8 Flows in MLD of Nallahs along KBM Compound Stretch .................................................... 51 Figure 4.9 Flows in MLD of Nallahs along BKC Stretch ........................................................................ 52 Figure 4.10 Flows in MLD of Nallahs along Kalanagar Stretch ............................................................... 53 Figure 4.11 Flow variations n Vakola Nallah .......................................................................................... 55
Comprehensive Study of Mithi River Polluted Stretches Chapter IV Flow Assessment in Mithi River
44
Chapter IV Flow Assessment in Mithi River
4.0 Background In the assessment of river pollution, flow measurement forms a major part with a view to
determine pollution load entering into the river.It is the most essential part of any monitoring or
pollution status identification. Though there are several inlets to the River, it is essential to
classify the sources and river water stretches based on flow of nallahs into the river as well as
the existing river water flows in order to assess the potential of impacts in terms of pollutant
loading as well as the extent of carrying capacity and/or dilution potential. Flow in river as well
as sources of pollution contributing the river were measured using simple manual process of
velocity of water flow and dimensions of nallah.
Though a crude method, several earlier studies have also been carried out by MCGM &
MMRDA / IIT to assess flow of major inlets based on which recommendations of citing STP’s
are in consideration. Nevertheless, this study essentially considers flow as a measure of
pollution load potential measurement rather than just a way of deciding capacities of treatment
units and thereby conventonal method justifies it. Furthermore, the natural cleansing property of
Mithi due to tidal influence reuslting in high dilution potential is also studied through flow
analysis. Along with the river, flow measurements of all possible major confluencing nallah
along both the banks were studied. All major nallahs contributing to Mithi are discussed in one
section whereas wastewater contributors to Vakola Nallah on the other hand is considered as a
separate section as outlined in this Chapter. The previous studies carried out by MPCB though
did not include this part and thereby it makes it even more essential to take into account various
aspects of flow here.
4.1 Flow Measurement Methodology For measuring the flow rate in the river as well as in the confluence points of individual open or
otherwise nallahs, a piece of light weight material (Floatable) was allowed to flow in the river for
a known distance. Time required by that material to travel that distance was measured with the
help of stopwatch and the flow rate was calculated using following mathematical formula
q = Distance/Time (m/s)
Total flow was computed using width of active water flow x depth of flow x flow rate. However,
for those locations where floatables could not be used i.e. in case of closed pipeline discharging
Comprehensive Study of Mithi River Polluted Stretches Chapter IV Flow Assessment in Mithi River
45
wastewater, a vessel (mostly graduated bucket or otherwise) of known volume was allowed to
fill and the time required to fill the bucket to desired known volume was determined using
stopwatch. Thereby, the flow rate was calculated as
q = Volume of the bucket/ Time (m3/s) Figure 4.1 delineates the flow variations across different stretches of Mithi River as measured
during the month of May 2014 i.e. pre-Monsoon studies. Mithi River originally was supposed to
be fed by overflow from Vihar and Powai lakes although this is not the case as of now. The river
is mostly fed with wastewater from several residential and many slum dwelling units located in
the vicinity of Mithi and directly discharging wastewater either through open nallahs or recently
developed closed pipelines. Three or four sections of the river also receives industrial
wastewater which either flows directly through closed pipelines or mixes with sewage from other
areas and drains into Mithi.
The physical survey along banks of Mithi prominently showed discharges from hotels and
restaurants, the large scale ones having full-fledged wastewater treatment units whereas the
smaller ones directly discharging effluents. Flow measurement was also critical since along the
origin to almost half of the stretch of Mithi, the flow was affected by solid waste open dumping
restricting smooth and uniform passage of water throughout the width and also most of the initial
part of Mithi having low flow formed central or peripheral streams within the width of river.
Mithi entails about 2MLD wastewater from its origin at Filterpada / Gautam Nagar and ends up
carrying about 450MLD wastewater near MTNL Bridge after convergence of Vakola Nallah into
it as shown in Figure 4.1. From downstream of Bandra-Kurla Complex [BKC] stretch, the river
under influence of tides carries a maximum of 4600MLD as measured at downstream of Mahim
stretch as presented in Figure 4.2.
Tidal influence most importantly seems to be the heart of Mithi’s natural cleansing process
wherein the high tide from Arabian Sea through Mahin Creek results into high dilution to almost
5 to 6kms inland affecting the major Vakola Stretch and the low tide in turn tends to carry the
waste loads into sea thereby adding to the carrying capacity of Mithi River. Thereby, Figure 4.2
is earmarked as those under flushing effect of tides carrying almost 4000 - 5000MLD of sea
water into Mithi every day.

Comprehensive Study of Mithi River Polluted Stretches Chapter IV Flow Assessment in Mithi River
46
Figure 4.1 Flow Variations Across Mithi River without tidal influence
0.0
100.0
200.0
300.0
400.0
500.0
600.0
UP DN UP DN UP DN UP DN UP DN UP DN UP DN UP UP DN UP UP DN
Gautam Nagar JVLR Bamandaya KBM Compund Marol Sakhinaka Airport Safed Pool BMK Compound CST Bridge MTNL Bridge
Flow
(MLD
)
Location
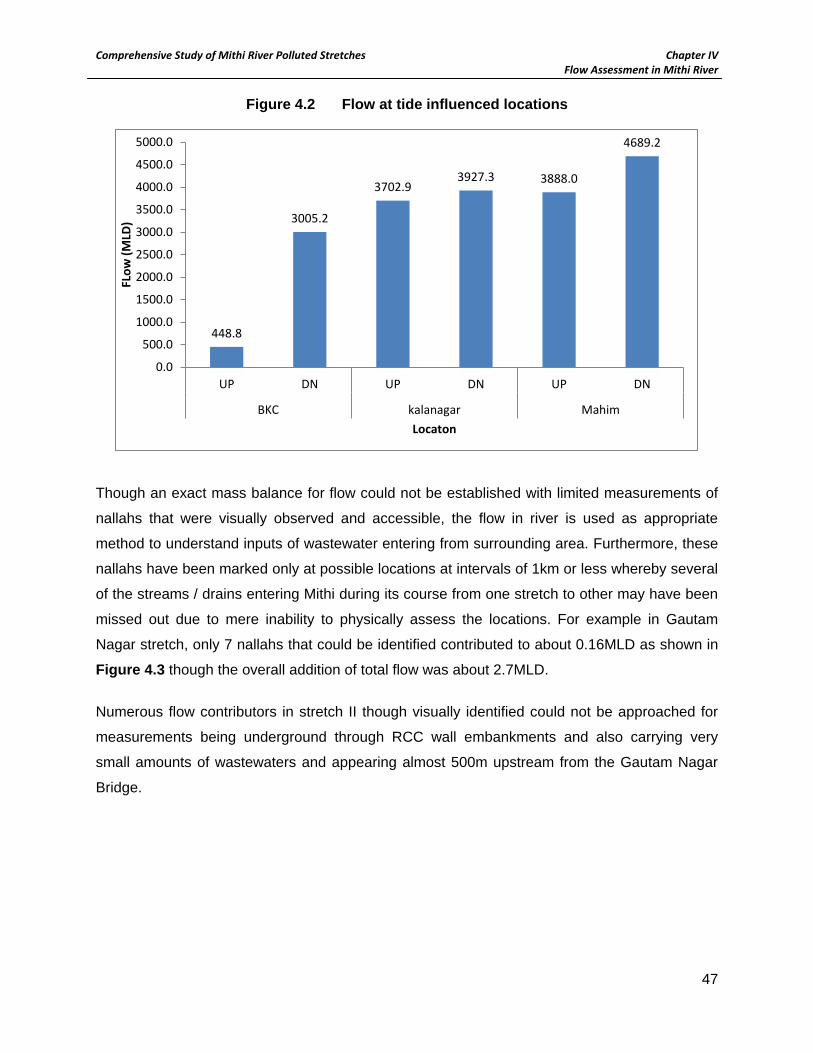
Comprehensive Study of Mithi River Polluted Stretches Chapter IV Flow Assessment in Mithi River
47
Figure 4.2 Flow at tide influenced locations
Though an exact mass balance for flow could not be established with limited measurements of
nallahs that were visually observed and accessible, the flow in river is used as appropriate
method to understand inputs of wastewater entering from surrounding area. Furthermore, these
nallahs have been marked only at possible locations at intervals of 1km or less whereby several
of the streams / drains entering Mithi during its course from one stretch to other may have been
missed out due to mere inability to physically assess the locations. For example in Gautam
Nagar stretch, only 7 nallahs that could be identified contributed to about 0.16MLD as shown in
Figure 4.3 though the overall addition of total flow was about 2.7MLD.
Numerous flow contributors in stretch II though visually identified could not be approached for
measurements being underground through RCC wall embankments and also carrying very
small amounts of wastewaters and appearing almost 500m upstream from the Gautam Nagar
Bridge.
448.8
3005.2
3702.9 3927.3 3888.0
4689.2
0.0
500.0
1000.0
1500.0
2000.0
2500.0
3000.0
3500.0
4000.0
4500.0
5000.0
UP DN UP DN UP DN
BKC kalanagar Mahim
FLow
(MLD
)
Locaton
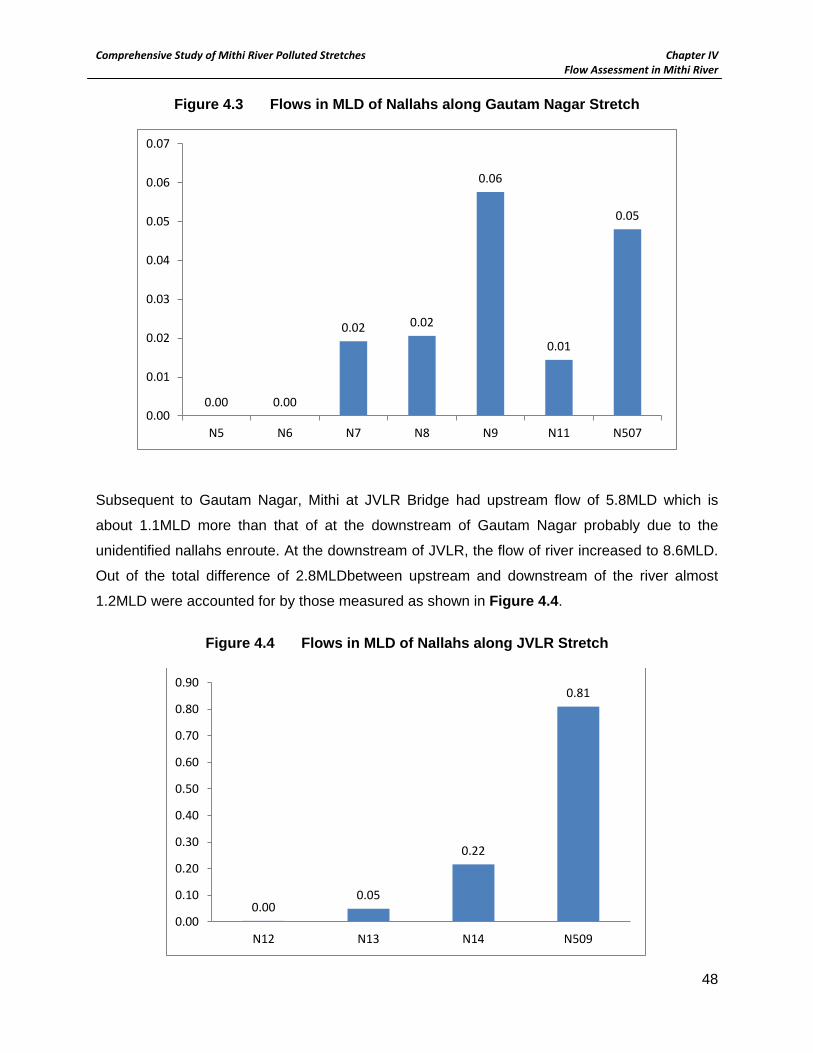
Comprehensive Study of Mithi River Polluted Stretches Chapter IV Flow Assessment in Mithi River
48
Figure 4.3 Flows in MLD of Nallahs along Gautam Nagar Stretch
Subsequent to Gautam Nagar, Mithi at JVLR Bridge had upstream flow of 5.8MLD which is
about 1.1MLD more than that of at the downstream of Gautam Nagar probably due to the
unidentified nallahs enroute. At the downstream of JVLR, the flow of river increased to 8.6MLD.
Out of the total difference of 2.8MLDbetween upstream and downstream of the river almost
1.2MLD were accounted for by those measured as shown in Figure 4.4.
Figure 4.4 Flows in MLD of Nallahs along JVLR Stretch
0.00 0.00
0.02 0.02
0.06
0.01
0.05
0.00
0.01
0.02
0.03
0.04
0.05
0.06
0.07
N5 N6 N7 N8 N9 N11 N507
0.00 0.05
0.22
0.81
0.00
0.10
0.20
0.30
0.40
0.50
0.60
0.70
0.80
0.90
N12 N13 N14 N509

Comprehensive Study of Mithi River Polluted Stretches Chapter IV Flow Assessment in Mithi River
49
Figure 4.5 presents that the flow upstream & downstream of Bamandaya Pada is 48.8MLD i.e.
constant. Most of the flow is added enroute of the river from JVLR to Bamandaya Pada which
was practically impossible to be surveyed. However, only 2 nallahs with minimal flow from
upstream to downstream were identified adding to about 0.1MLD of wastewater from adjoining
residential complexes.
Figure 4.5 Flows in MLD of Nallahs along Bamandaya Pada Stretch
Followed by Bamandaya Pada, at upstream of KBM Compound marginal addition of about
0.1MLD is observed making the flow to 48.9MLD while additional contribution of about 7MLD in
the downstream of river amounting to 57.6MLD was measured probably due to the some of the
identified and several enroute non-identified nallahs ultimately entering Mithi. In this particular
stretch four nallahs as depicted in Figure 4.6 adds about 0.05MLD wastewater.
Traversing to next location i.e. at Marol, river has upstream flow of there seems to be an
addition of about 8.1MLD flow making downstream flow to 67.8MLD. Though there is only one
identified nallah in this area located on the right bank of the river, whose flow was measured to
be 0.19MLD.
The flow upstream of the Sakhinaka is 69.1MLD & that downstream was found to be 103.7MLD.
Contributed by 6 identified nallahs the difference in the flow of upstream and downstream
locations is of 34.6MLD. Figure 4.7 indicates the flows of nallahs here near Sakhinaka.
0.02
0.00
0.08
0.00 0.00
0.01
0.02
0.03
0.04
0.05
0.06
0.07
0.08
N15 N16 N510 N41

Comprehensive Study of Mithi River Polluted Stretches Chapter IV Flow Assessment in Mithi River
50
Figure 4.6 Flows in MLD of Nallahs along KBM Compound Stretch
Almost entire flow in the river is totally accounted by the 6 nallahs in Sakhinaka which is about
39.4MLD .Two of the nallahs i.e.N516 and N20 have comparatively high values of flow i.e.
beyond 10MLD. It is inferred that the river bed sees some seepage along this stretch or due to
cross-sectional difference in depths of river bed the flow needs to be considered in accordance
with those balanced by nallahs and to be computed as 108MLD instead of 103MLD.
Figure 4.7 Flows in MLD of Nallahs along Sakhinaka Stretch
0.00 0.00 0.00
0.05
0.00
0.01
0.02
0.03
0.04
0.05
0.06
N17 N18 N42 N511
0.86 0.02 0.02
15.84
0.00
22.68
0.00
5.00
10.00
15.00
20.00
25.00
N513 N514 N515 N516 N19 N20

Comprehensive Study of Mithi River Polluted Stretches Chapter IV Flow Assessment in Mithi River
51
Subsequent to Sakhinaka, the next location of river analyzed for flow was near Domestic Airport
having an upstream flow of 111.5MLD & downstream flow of the same was about 102.9MLD.
Nallah from the sewage treatment facility of airport enters the river from left bank. Flow of this is
found to be about 57.6MLD. However, as shown in Figure 4.1, there is decrease of 8.6MLD in
the river flow from upstream to downstream flow which might be due errors in measurement of
cross-sectional depth of river.
As represented in Figure 4.1, the upstream flow of the Safed Pool stretch was measured to be
100.1MLD though the downstream of the same couldn’t be estimated due to the approach
constraints. In this stretch, the open Safed pool nallah from nearby residential area is mixing in
the river with a flow of about 13.5MLD and is identified as the only major nallah adding to river
flow in this stretch thereby amounting to downstream flow of 113.6MLD.
Followed by Safed Pool, the flow of river measured at BMK Compound was 113.4MLD and that
of downstream found to be 140.6MLD. Though addition of about 27MLD wastewater is
observed from along this stretch, only 3 nallahs could be identified adding about 0.63MLD as
shown in Figure 4.8. There were several drains entering into the river stretch through piped
sources that were visually inferred to carry sewage but could not be approached for
measurements.
Figure 4.8 Flows in MLD of Nallahs along BMK Compound Stretch
Reverse flow suggesting peripheral impacts of tide was also observed in this section that may
be responsible for such high flow.
0.29
0.17 0.17
0.00
0.05
0.10
0.15
0.20
0.25
0.30
0.35
N32 N34 N35

Comprehensive Study of Mithi River Polluted Stretches Chapter IV Flow Assessment in Mithi River
52
As the Figure 4.1 indicates the upstream flow of CST Bridge was found to be 183.6MLD
whereas downstream flow was not measured due to the limited approach. At CST Bridge, the
tidal impact was prominently observed causing exponential increase in the flow. Though two
nallahs were identified in this section of the river, flow of those nallahs could not be measured. It
is supposed that additions of wastewater from unidentified sources may not be ruled out.
Followed by CST bridge, flow measured at downstream of MTNL Bridge was 448.8MLD. This
section is under constant tidal influence and the irregularity in flow of up & downstream in this
section is merely due to the cross-sectional variations in depths across the large width of river.
Only one nallah carrying wastewater with flow of about 0.03MLD adjoins the river from left bank
of the river.
The flow does not change from MTNL to upstream of BKC though there is a drastic tidal
influence with time of measurements at these two locations prominently marked by exponential
flow of 3005.2MLD downstream of the river. Also, two nallahs adding into the river from left bank
of the river at BKC area contributes to about 0.3MLD as depicted in Figure 4.9.
Figure 4.9 Flows in MLD of Nallahs along BKC Stretch
Similarly, being under tidal influence the flow of the river at upstream of Kalanagar is about
3702MLD which increases upto 3927MLD at the downstream only due to the time lag of
measurements. Along with the tidal influence that contributes to high volume of water to mix in
the river, two nallahs that enter the river, one from left and other from right bank of the river as
shown in Figure 4.10 contributes about 605MLD that may also have sea water intrusion inland.
0.29
0.00 0.00
0.05
0.10
0.15
0.20
0.25
0.30
0.35
N36 N40

Comprehensive Study of Mithi River Polluted Stretches Chapter IV Flow Assessment in Mithi River
53
Figure 4.10 Flows in MLD of Nallahs along Kalanagar Stretch
Flow of river at Mahim where it meets the Arabian Sea is about 3888MLD upstream and about
4689MLD downstream and is under the highest impact of tides being the convergence point of
river with Arabian Sea through Mahim Creek. Small rivulets in form of 2-3nallahs identified in
Mahim area adds to about 0.02MLD flow from nearby residential areas though the expected
flow from nearby slums in this area is about 0.3 – 0.5MLD.
4.2 Flow in Vakola Nallah Vakola nallah has been presented separately in this section of the chapter for its flow
characteristics. Though there are numerous nallahs that enter Vakola adding to the overall
volume, only 32nallahswere sampled though only about 21 had proper approach &could be
monitored for flow as outlined here. These small nallahs are sourced from adjoining slum areas
and mostly carrying domestic wastewater as shown in Figure 4.11. The average upstream flow measured at 4 different locations almost 2 to 2.5kms inland from
MTNL Bridge shows flow of 72.7MLD whereas downstream flow just before MTNL Bridge is
found to be 89.6MLD.Thereby overall about 90MLD flow is contributed into Vakola Nallah by
drains / rivulets measured for flow in Vakola Nallah section whereas there were few others very
small ones too adding into it that ultimately leads Vakola to Mithi and indeed to Arabian Sea.
Vakola is also impacted by tidal influence and this may also be one of the major reasons for
such high flow measured in this section though most of the nallahs connected from slum areas
were directly carrying sewage.
0.58
604.80
0.00
100.00
200.00
300.00
400.00
500.00
600.00
700.00
N1 N503

Comprehensive Study of Mithi River Polluted Stretches Chapter IV Flow Assessment in Mithi River
54
From mere hydraulics of Mithi River point of view, it is clearly evident that the entire stretch can
be classified into 2 sections wherein the first from origin to upstream of KBM Compound carries
direct wastewater either from residential or industrial sources and the other from downstream of
KBM to Mahim Bay including Vakola sections that along with the majority of domestic and few
industrial contributors is highly influenced by tides. The overall flow of sewage into Mithi before
sea water intrusion is about 450MLD whereas Vakola adds to another 89MLD thereby
amounting to a total of about 540MLD of wastewater. Additionally the stretch from MTNL to
Mahim based on the nearby areas and especially Dharavi pouring domestic wastewater seems
to amount for additional 100MLD in its course till entering Arabian Sea thereby leading to about
640MLD of wastewater from varied sources being carried by Mithi River in its course of about
15km from origin to Mahim in addition to the 3.5km of Vakola Nallah.

Comprehensive Study of Mithi River Polluted Stretches Chapter IV Flow Assessment in Mithi River
55
Figure 4.11 Flow variations n Vakola Nallah
*0.00 represents those nallahs that were unapproachable
0.00 0.00 0.00 0.00 0.00
5.69
0.00 0.00 0.00
1.54
0.00 0.00 0.00 0.00 0.00 0.14 0.19
0.08 0.05 0.00 0.00 0.00 0.00 0.00 0.00 0.00
1.00
2.00
3.00
4.00
5.00
6.00
N21 N22 N23 N24 N25 N2 N27 N28 N29 N506 N522 N523 N524 N525 N526 N528 N529 N530 N531 N532 N534 N540 N37 N38 N39
Comprehensive Study of Mithi River Polluted Stretches Chapter V Organic Load in Mithi River, Nallahs& Sources
Chapter V
5.0 Background ................................................................................................................................... 55
5.1 Baseline Monitoring During Monsoon [June 2013] ............................................................. 55
5.2 Baseline Monitoring During Post-Monsoon [January 2014] .............................................. 56
5.3 Baseline Monitoring During Pre-Monsoon [May 2014] ....................................................... 58
5.3.1 Organics Load in River Water .............................................................................................. 58
5.3.2 Organics Load in Nallah Water ............................................................................................ 61
5.3.3 Organics Load in Industrial Wastewaters ........................................................................... 66
5.3.4 Comparative Account of Organics Load .............................................................................. 67
5.4 Dissolved Oxygen Content in Mithi River ............................................................................. 68
List of Tables
Table 5.1 Statistical Analysis of Organic Parameters of Mithi River during Monsoon .............. 55
Table 5.2 Statistical Analysis of Organic Parameters of Mithi River during Post Monsoon ...... 57
Table 5.3 Statistical Analysis of Organic Parameters of Mithi River during Pre Monsoon ........ 60
Table 5.4 Organic Loads in Each Stretch of Mithi River ........................................................... 61
Table 5.5 Statistical Analysis of Organic Parameters of Nallahs during Pre Monsoon ............. 63
Table 5.6 Statistical Analysis of Organic Parameters of VakolaNallah during Pre Monsoon .... 64
Table 5.7 Statistical Analysis of Organic Parameters in Industries ........................................... 66
Table 5.8 Comparative Account of Parameters Contributing and Representing Organics ....... 68

Comprehensive Study of Mithi River Polluted Stretches Chapter V Organic Load in Mithi River, Nallahs & Sources
55
Chapter V Organic Load in Mithi River & Nallahs
5.0 Background This chapter is essentially one of the most important since it attempts at understanding the
organic load in Mithi River which would not only help evaluate the extent of pollution but also
provide foundation for the subsequent chapters in terms of criticality of river stretches and
receptor modeling. It has been established that COD and BOD are interrelated and dependent
variables and that the part of COD concentration is actually BOD. Since the surveys carried out
throughout Mithi River reveal enormous raw sewage inputs in almost every section whereas
sporadic inputs from industrial wastewater, it would be interesting to elaborate on the extent of
variability in organic loads in terms of both COD and BOD.
5.1 Baseline Monitoring During Monsoon [June 2013] The preliminary survey of 12 such potentially polluted and known impacted locations of Mithi
were sampled and analyzed for concerned parameters during 2 different seasons by MPCB.
The sampling has also objectively helped to get better understanding of the present status of
pollution in Mithi River as well as strategize the need for further sampling. Sampling Locations
for Monsoon & Post Monsoon carried out by MPCB is represented in Annexure V – I whereas
Table 5.1 depicts statistical analysis of same.
Table 5.1 Statistical Analysis of Organic Parameters of Mithi River during Monsoon
Parameters Minimum Maximum Average SD Std. (ISF - a)
BOD (mg/l) 15 130 56 34.7 30 COD (mg/l) 90 280 148 62.1 250 BOD to COD ratio 0.07 0.47 0.36 0.11 NA
It is interesting to note that the organics in form of biodegradable BOD shows a minimum of
15mg/lit to maximum of 130mg/lit whereas COD that represents the entire organics section of
both degradable and non-biodegradable ranges from 90 to 280mg/lit. Interestingly the values
observed averages at 56mg/lit and 148mg/lit for BOD & COD respectively and are well within
Schedule VI - General Discharge Standards (Designated Use) as presented in Annexure V - II. Though there is a possibility of precipitation accounting for low values of organics in water, the
interesting point is the measurement of BOD to COD ratio ranging from about 0.07 which
reveals definite intermediate sources of industrial wastewater to 0.47 representing peculiar
domestic sewage inputs. Standard Deviation values are found to be very high vis-à-vis
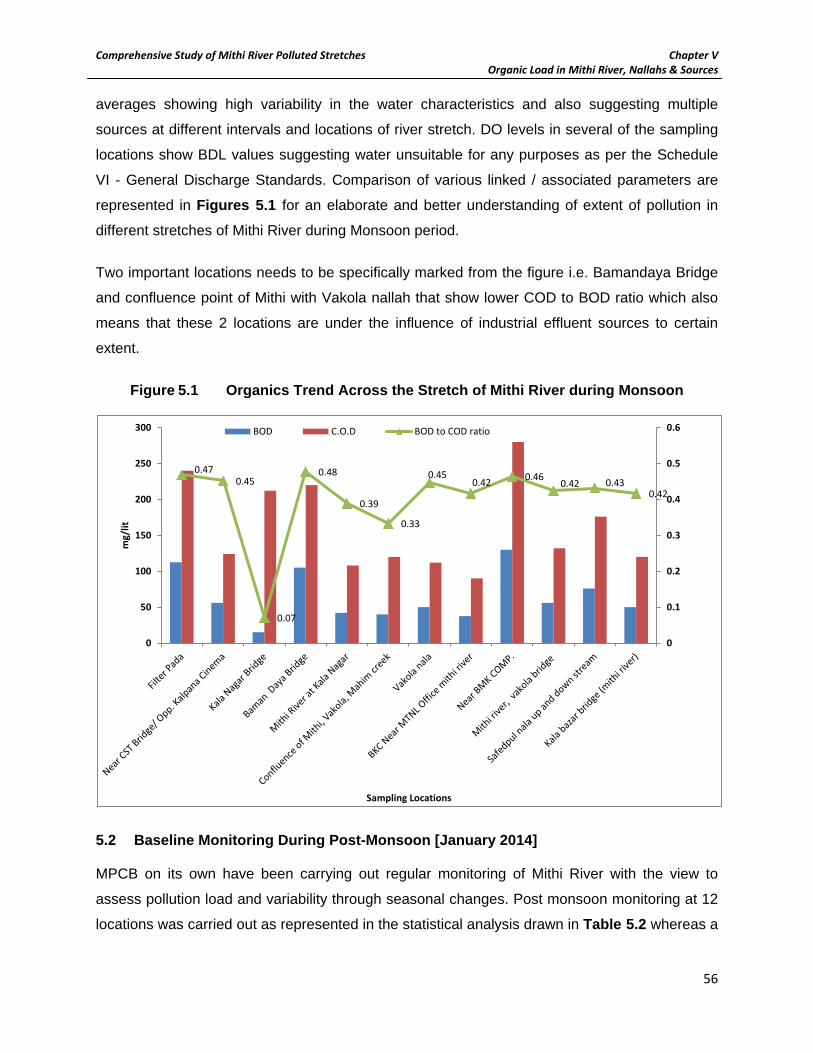
Comprehensive Study of Mithi River Polluted Stretches Chapter V Organic Load in Mithi River, Nallahs & Sources
56
averages showing high variability in the water characteristics and also suggesting multiple
sources at different intervals and locations of river stretch. DO levels in several of the sampling
locations show BDL values suggesting water unsuitable for any purposes as per the Schedule
VI - General Discharge Standards. Comparison of various linked / associated parameters are
represented in Figures 5.1 for an elaborate and better understanding of extent of pollution in
different stretches of Mithi River during Monsoon period.
Two important locations needs to be specifically marked from the figure i.e. Bamandaya Bridge
and confluence point of Mithi with Vakola nallah that show lower COD to BOD ratio which also
means that these 2 locations are under the influence of industrial effluent sources to certain
extent.
Figure 5.1 Organics Trend Across the Stretch of Mithi River during Monsoon
5.2 Baseline Monitoring During Post-Monsoon [January 2014] MPCB on its own have been carrying out regular monitoring of Mithi River with the view to
assess pollution load and variability through seasonal changes. Post monsoon monitoring at 12
locations was carried out as represented in the statistical analysis drawn in Table 5.2 whereas a
0.47 0.45
0.07
0.48
0.39
0.33
0.45 0.42 0.46
0.42 0.43 0.42
0
0.1
0.2
0.3
0.4
0.5
0.6
0
50
100
150
200
250
300
mg/
lit
Sampling Locations
BOD C.O.D BOD to COD ratio

Comprehensive Study of Mithi River Polluted Stretches Chapter V Organic Load in Mithi River, Nallahs & Sources
57
more elaborate view of individual sampling locations for organic content is represented in
Figure 5.2. Organic load seems to have shifted its ratios during post monsoon season which is
quite expected and this also confirms influence of precipitation observed during the monsoon
season.
Table 5.2 Statistical Analysis of Organic Parameters of Mithi River during Post
Monsoon
Parameters Minimum Maximum Average SD Std. (ISF - a)
BOD (mg/l) 24.0 140.0 92.4 66.4 30 COD (mg/l) 84.0 288.0 203.0 118.5 250 BOD to COD ratio 0.29 0.54 0.45 0.07 NA
During the post monsoon season, BOD concentrations range from minimum of 24.0mg/l to
maximum of 140mg/l averaging about 92.4mg/l again well within the Schedule VI - General
Discharge Standards of 250mg/l for Inland Water Discharges.
Figure 5.2 Organics Trend Across the Stretch of Mithi River during Post Monsoon
Similar is the COD concentration which varies from 84mg/l to 288mg/l with average of 203mg/l
well within the criteria standards of 350mg/l. Other than one sample located at Vakola
confluence point of Mithi which represent industrial influence as per the ratio of BOD to COD, all
0.54
0.45 0.46 0.49 0.49 0.50
0.45 0.46
0.29
0.44 0.43 0.38
0.00
0.10
0.20
0.30
0.40
0.50
0.60
0
50
100
150
200
250
300
350
mg/
l
Sampling Locations
BOD C.O.D BOD:COD Ratio

Comprehensive Study of Mithi River Polluted Stretches Chapter V Organic Load in Mithi River, Nallahs & Sources
58
other locations depict major influence of domestic wastewater inputs. High Standard Deviation
also reveal the fact that the variations in characters of sources are extremely high though they
represent mostly domestic waste that may be due to dilution impacts based on the quantity of
water supply in particular areas.
Influence of precipitation at these locations on an average can be accounted for by using simple
empirical calculations during these two seasons which reveals BOD being affected by
incremental factor of 1.6 whereas COD by a factor of 1.4 post monsoon. Since sampling was
carried out in the early months of monsoon, the impacts can be accounted for about 30 to 40%
on the organic load.
Since flow measurements were not carried out during these periods, the loads of organics may
not be computed. However, attempt to calculate the same is done in next sampling season.
5.3 Baseline Monitoring During Pre-Monsoon [May 2014] A more elaborate & scientifically chalked out comprehensive monitoring network plan was
prepared to compliment the already existing studies of MPCB. A thorough investigation of
existing locations of sampling along with the parameters of analysis and missing links was
established following dialogue with concerned officials & consensus was brought out regarding
additional sampling locations to be considered during this particular study. Limitations of past
studies, data gaps and interpretation needs were identified and thereby the whole exercise of
network to include nallahs and source sampling was formulated with a view to evolve framework
and processes that would ultimately lead to resolving main issue of determining source
contribution to Mithi River. The previous chapter already enumerates flow measurements and
influence of tides in Mithi whereas this chapter attempts to evaluate organic content in form of
BOD and COD.
5.3.1 Organics Load in River Water In all 77 samples of river water were collected during the pre-monsoon period of May 2014, the
sampling map for same is presented in Annexure V – III. Thereby overall 4 to 5 times samples
have been collected from each of the locations in various seasons to assess the variability not
only during the season but also during different seasons. Statistical analysis for sampling
adequacy as discussed in Chapter VIII of this report also reflects ample evidence of validity of
overall numbers of samples as also substantiated in Chapter II.
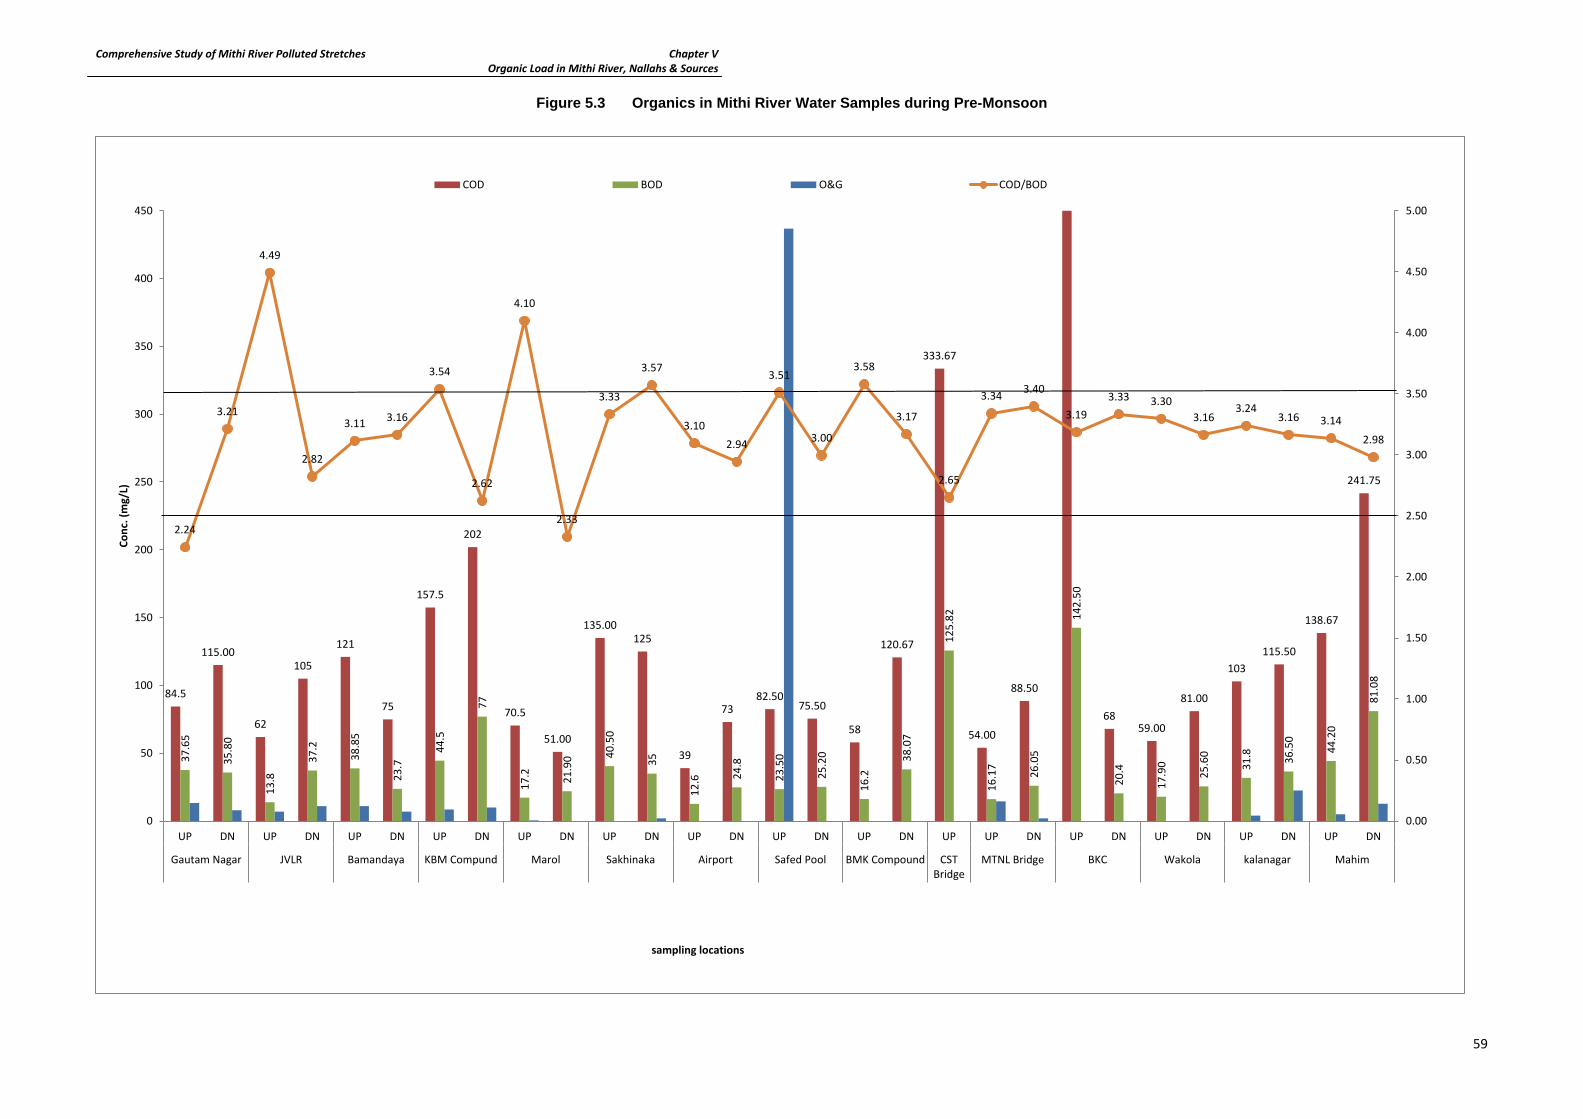
Comprehensive Study of Mithi River Polluted Stretches Chapter V Organic Load in Mithi River, Nallahs & Sources
59
Figure 5.3 Organics in Mithi River Water Samples during Pre-Monsoon
84.5
115.00
62
105
121
75
157.5
202
70.5
51.00
135.00 125
39
73 82.50
75.50
58
120.67
333.67
54.00
88.50
68 59.00
81.00
103 115.50
138.67
241.75
37.6
5
35.8
0
13.8
37.2
38.8
5
23.7
44.5
77
17.2
21.9
0 40.5
0
35
12.6
24.8
23.5
0
25.2
0
16.2
38.0
7
125.
82
16.1
7
26.0
5
142.
50
20.4
17.9
0
25.6
0
31.8
36.5
0
44.2
0
81.0
8
2.24
3.21
4.49
2.82
3.11 3.16
3.54
2.62
4.10
2.33
3.33
3.57
3.10 2.94
3.51
3.00
3.58
3.17
2.65
3.34 3.40
3.19 3.33 3.30
3.16 3.24
3.16 3.14
2.98
0.00
0.50
1.00
1.50
2.00
2.50
3.00
3.50
4.00
4.50
5.00
0
50
100
150
200
250
300
350
400
450
UP DN UP DN UP DN UP DN UP DN UP DN UP DN UP DN UP DN UP UP DN UP DN UP DN UP DN UP DN
Gautam Nagar JVLR Bamandaya KBM Compund Marol Sakhinaka Airport Safed Pool BMK Compound CSTBridge
MTNL Bridge BKC Wakola kalanagar Mahim
Conc
. (m
g/L)
sampling locations
COD BOD O&G COD/BOD

Comprehensive Study of Mithi River Polluted Stretches Chapter V Organic Load in Mithi River, Nallahs & Sources
60
Figure 5.3 represents organics in river water classified by presence of COD, BOD and O&G
which are known to be the responsible parameters of organic origin along with ratio of COD to
BOD. Except for 2 of the samples that show values of COD/BOD ratio in range of >3.5 i.e. at
JVLR & Marol, all other samples range between values of 2.5 to 3.5 suggesting domestic
wastewater sources other than those two wherein influence is clearly evident of industrial
sources and is also substantiated by survey details of industrial discharges, in these 2 areas of
Mithi. Prominent O&G peak is observed at Safed Pool may be due to accidental discharge
which otherwise has not been the trends in any of the earlier studies. However, O&G are found
to be present in almost all the samples and several of them are found to be critically high above
the Schedule VI - General Discharge Standards.
Table 5.3 depicts statistical analysis of river water data for organics which reveals that BOD &
COD ranges from minimum of 12.6mg/l & 39.0mg/l at Upstream of Airport to maximum of
142.5mg/l & 454mg/l at Upstream of Bandra-Kurla Complex (BKC) averaging about 39mg/l &
120.3mg/l respectively. The standard deviations once again show very high values suggesting
high variability in the contents of inputs entering Mithi River. O&G on the other hand shows
minimal concentrations Below Detection levels (BDL) to maximum of 436.9mg/l at Safed Pool
with average of 19.7mg/l. Extremely high Standard Deviation (SD) values even more than the
average suggest outlier in this case as only one of the samples actually reflect such high O&G
concentration.
Table 5.3 Statistical Analysis of Organic Parameters of Mithi River during Pre
Monsoon
Parameters Minimum Maximum Average SD Std. (ISF - a)
BOD (mg/l) 12.6 142.5 39.0 30.9 30 COD (mg/l) 39.0 454.0 120.3 89.5 250 O&G (mg/l) 0 436.9 19.7 80.4 10 COD to BOD ratio 2.24 4.49 3.20 0.45 NA
When computed for organic loads based on the flow in river, Table 5.4 delineates average COD
load in each stretch. The sections having prominent tidal influence are not included in order to
avoid redundancy in data and mis-representation of loads. Thereby, maximum load of 109
tons/day for COD and 63.9 for BOD is observed at Upstream of BKC whereas minimal load is
observed at Gautam Nagar i.e. 0.12tons/day for COD and 0.07tons/day for BOD which is
virtually the first point since flow measurements at Filterpada was not possible.
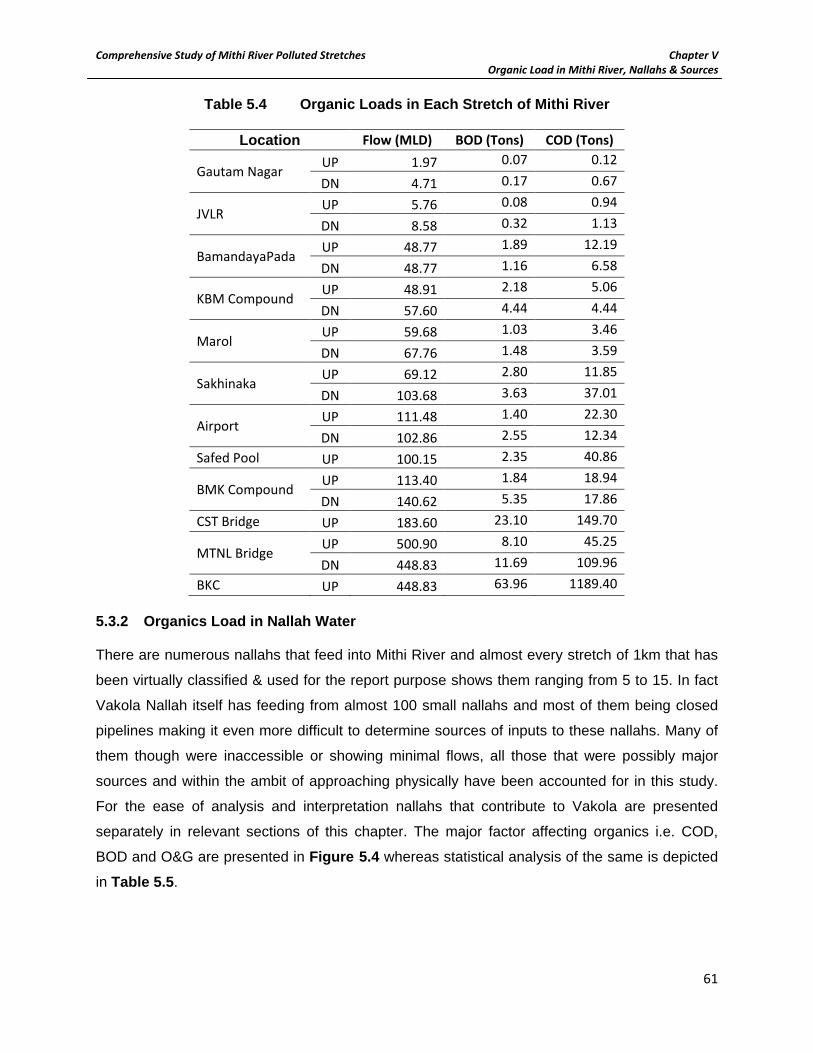
Comprehensive Study of Mithi River Polluted Stretches Chapter V Organic Load in Mithi River, Nallahs & Sources
61
Table 5.4 Organic Loads in Each Stretch of Mithi River
Location Flow (MLD) BOD (Tons) COD (Tons)
Gautam Nagar UP 1.97 0.07 0.12
DN 4.71 0.17 0.67
JVLR UP 5.76 0.08 0.94
DN 8.58 0.32 1.13
BamandayaPada UP 48.77 1.89 12.19
DN 48.77 1.16 6.58
KBM Compound UP 48.91 2.18 5.06
DN 57.60 4.44 4.44
Marol UP 59.68 1.03 3.46
DN 67.76 1.48 3.59
Sakhinaka UP 69.12 2.80 11.85
DN 103.68 3.63 37.01
Airport UP 111.48 1.40 22.30
DN 102.86 2.55 12.34 Safed Pool UP 100.15 2.35 40.86
BMK Compound UP 113.40 1.84 18.94
DN 140.62 5.35 17.86 CST Bridge UP 183.60 23.10 149.70
MTNL Bridge UP 500.90 8.10 45.25
DN 448.83 11.69 109.96 BKC UP 448.83 63.96 1189.40
5.3.2 Organics Load in Nallah Water There are numerous nallahs that feed into Mithi River and almost every stretch of 1km that has
been virtually classified & used for the report purpose shows them ranging from 5 to 15. In fact
Vakola Nallah itself has feeding from almost 100 small nallahs and most of them being closed
pipelines making it even more difficult to determine sources of inputs to these nallahs. Many of
them though were inaccessible or showing minimal flows, all those that were possibly major
sources and within the ambit of approaching physically have been accounted for in this study.
For the ease of analysis and interpretation nallahs that contribute to Vakola are presented
separately in relevant sections of this chapter. The major factor affecting organics i.e. COD,
BOD and O&G are presented in Figure 5.4 whereas statistical analysis of the same is depicted
in Table 5.5.
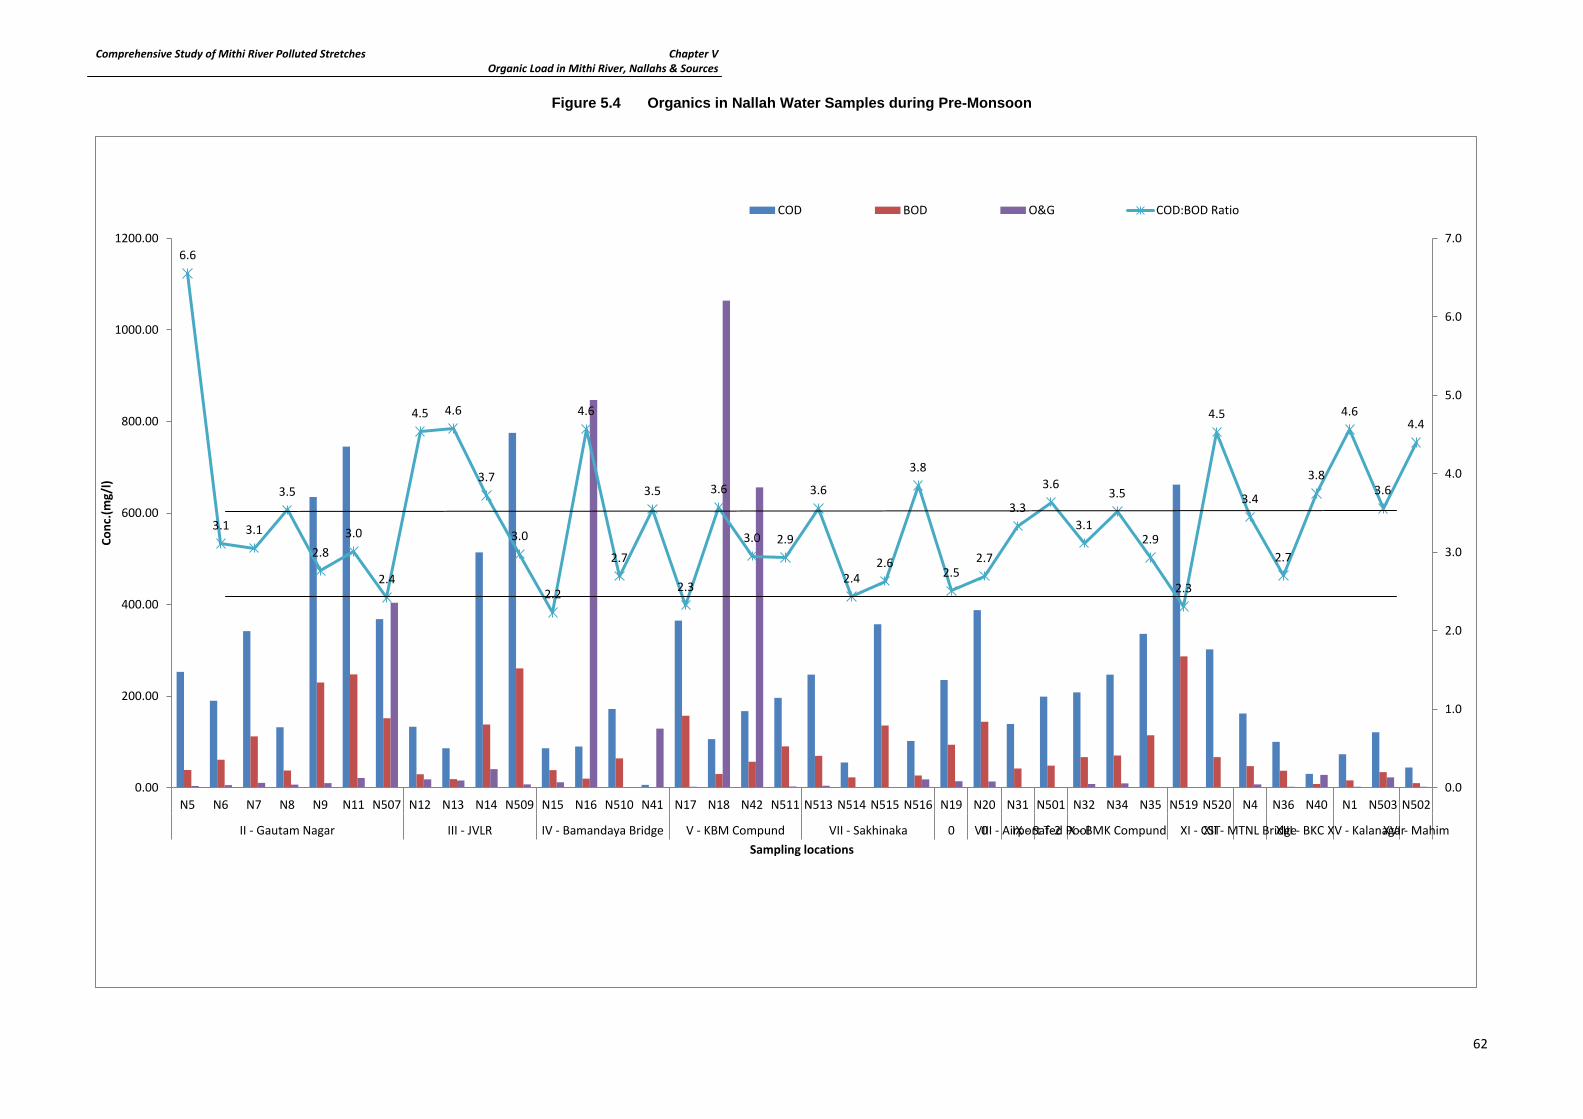
Comprehensive Study of Mithi River Polluted Stretches Chapter V Organic Load in Mithi River, Nallahs & Sources
62
Figure 5.4 Organics in Nallah Water Samples during Pre-Monsoon
6.6
3.1 3.1
3.5
2.8 3.0
2.4
4.5 4.6
3.7
3.0
2.2
4.6
2.7
3.5
2.3
3.6
3.0 2.9
3.6
2.4 2.6
3.8
2.5 2.7
3.3
3.6
3.1
3.5
2.9
2.3
4.5
3.4
2.7
3.8
4.6
3.6
4.4
0.0
1.0
2.0
3.0
4.0
5.0
6.0
7.0
0.00
200.00
400.00
600.00
800.00
1000.00
1200.00
N5 N6 N7 N8 N9 N11 N507 N12 N13 N14 N509 N15 N16 N510 N41 N17 N18 N42 N511 N513 N514 N515 N516 N19 N20 N31 N501 N32 N34 N35 N519 N520 N4 N36 N40 N1 N503 N502
II - Gautam Nagar III - JVLR IV - Bamandaya Bridge V - KBM Compund VII - Sakhinaka 0 0VIII - Airport T-2IX - Safed PoolX - BMK Compund XI - CSTXII - MTNL BridgeXIII - BKC XV - KalanagarXVI - Mahim
Conc
.(mg/
l)
Sampling locations
COD BOD O&G COD:BOD Ratio

Comprehensive Study of Mithi River Polluted Stretches Chapter V Organic Load in Mithi River, Nallahs & Sources
63
Similar to river water characteristics, Nallahs too show interesting trends with COD to BOD ratio
during Pre-monsoon season. Out of the 41 nallahs that were monitored directly discharging into
Mithi, almost 90% of them show values between 2.5 to 3.5 with several of them marginally
above or below the mark. However there are 5 to 6 such nallahs 2 located in JVLR, 1 each in
BamandayaPada, Sakhinaka, Kalanagar & Mahim that show >4.4 values thereby suggesting
industrial source influence in them. This also is reflected very clearly in river water quality as
described in earlier sections. BOD values range from minimal of 8mg/l to maximum of
286.65mg/l averaging about 84.9mg/l whereas COD varies from 30mg/l to 775mg/l averaging
about 253.2mg/l. The average BOD & COD concentrations in nallahs is almost 2 times than that
observed in river.
Oil and grease shows important trends that shall form the basis of several assumptions and
interpretation in subsequent chapter on receptor modeling wherein extremely high values are
observed at several locations such as KBM Compound, Bamandaya Bridge and Upstream of
JVLR which are known to be industrially active zones around Mithi River. Though the lowest
concentrations vary from BDL to highest being 1064mg/l, the average concentrations of O&G
are observed to be 80.4mg/l. Extremely high variations in SD values almost equal to averages
for BOD and COD whereas higher than average in case of O&G reveals the fact that these
nallahs are highly source dependent and each one of them are characterized by variable
concentrations of these parameters. Since O&G shows only 3 such values that are extremely
high, the SD too is marked by higher values.
COD to BOD ratio in case of nallahs entering Mithi show vast variations though most of them
are representative is sewage. The ratio varies from 2.2 representing domestic wastewater to
6.6representing industrial source. Average ratio of 3.3 substantiates the fact that most of nallahs
other than those 6 mentioned above carry domestic wastewater. SD values though about 20%
of average further support the say that most of nallahs have common source with minimal
variability in terms of ratio.
Table 5.5 Statistical Analysis of Organic Parameters of Nallahs during Pre Monsoon
Parameters Minimum Maximum Average SD
BOD (mg/l) 8.0 286.6 84.9 71.4 COD (mg/l) 30.0 775.0 253.2 187.0 O&G (mg/l) 0.0 1064.0 80.4 233.6 COD to BOD ratio 2.2 6.6 3.3 0.9

Comprehensive Study of Mithi River Polluted Stretches Chapter V Organic Load in Mithi River, Nallahs & Sources
64
Statistical details of organic characters for Vakola nallah is presented in Table 5.6 showing that
BOD concentrations range from 4mg/l to 438mg/l with average of 103.5mg/l. COD on other
hand show concentrations ranging between 11mg/l to 935mg/l with average of 268mg/l. O&G
shows concentration ranging from BDL to 35mg/l with average of 8mg/l which also reveals the
fact that the 3.5km of Vakola nallah do not harbor vehicle washing centre as seen in case of
nallahs that contribute to Mithi River. As seen in all earlier cases, SD values are very high and
almost surpassing the average concentrations for all 3 organic parameters in this case marking
the very fact of extremely high variability in sources of these nallahs though most of them are
domestic in nature.
Table 5.6 Statistical Analysis of Organic Parameters of Vakola Nallah during Pre
Monsoon
Parameters Minimum Maximum Average SD
BOD (mg/l) 4.0 438.0 103.5 123.7 COD (mg/l) 11.0 935.0 267.3 277.5 O&G (mg/l) 0.0 34.9 8.1 10.4 COD to BOD ratio 2.1 3.9 2.9 0.5
Only 2 of the 32 nallahs entering Vakola shows COD to BOD ratio of >3.5 thereby
substantiating the fact that industrial source contribution to Vakola nallah is minimal. Though
COD to BOD ratio is considered as universal indicator of industrial sources, absolute
concentrations of these organics need to be also assessed in order to confirm the assumption.
In case of Vakola, there are almost 3 such nallahs which show very high COD>500mg/l &
BOD>250mg/l concentrations thereby also pointing to the fact that there might be industrial
sources in form of food processing / bakeries etc that are forming entry into these nallahs and
ultimately contributing to Vakola nallah. Details of the individual nallahs and their organics loads
are presented in Figure 5.5.
In conclusion, only about 5 to 6% of the nallahs in case of river concentrated in regions of
industrial activities as per the survey details are contributing to high COD to BOD ratios as well
as 3 to 4 nallahs that contribute to prominent sources of O&G whereas only 3 sources in Vakola
that seem to be from industrial origin. In case of river too, only about 4 to 5 nallahs show
resemblance of industrial sources whereas majority of all other source contributions are
domestic in nature.

Comprehensive Study of Mithi River Polluted Stretches Chapter V Organic Load in Mithi River, Nallahs & Sources
65
Figure 5.5 Organics in Vakola Nallah Water Samples during Pre-Monsoon
3.3
3.7
2.7
3.2 3.2
3.9
3.3
2.8
2.5
3.3
3.0 2.8
3.3
2.6 2.8
3.0 2.9
2.1 2.3
2.7
3.0
2.4
2.9
2.3 2.5
2.8 3.0
3.4
2.7 2.8
2.9 3.1
0.0
0.5
1.0
1.5
2.0
2.5
3.0
3.5
4.0
4.5
0.00
100.00
200.00
300.00
400.00
500.00
600.00
700.00
800.00
900.00
1000.00N
21
N22
N23
N24
N25 N
2
N26
N27
N28
N29
N50
4
N50
5
N50
6
N52
2
N52
3
N52
4
N52
5
N52
6
N52
7
N52
8
N52
9
N53
0
N53
1
N53
2
N53
3
N53
4
N53
5
N53
9
N54
0
N37
N38
N39
Conc
.(mg/
l)
Nallahs in Vakola
COD BOD O&G COD:BOD Ratio
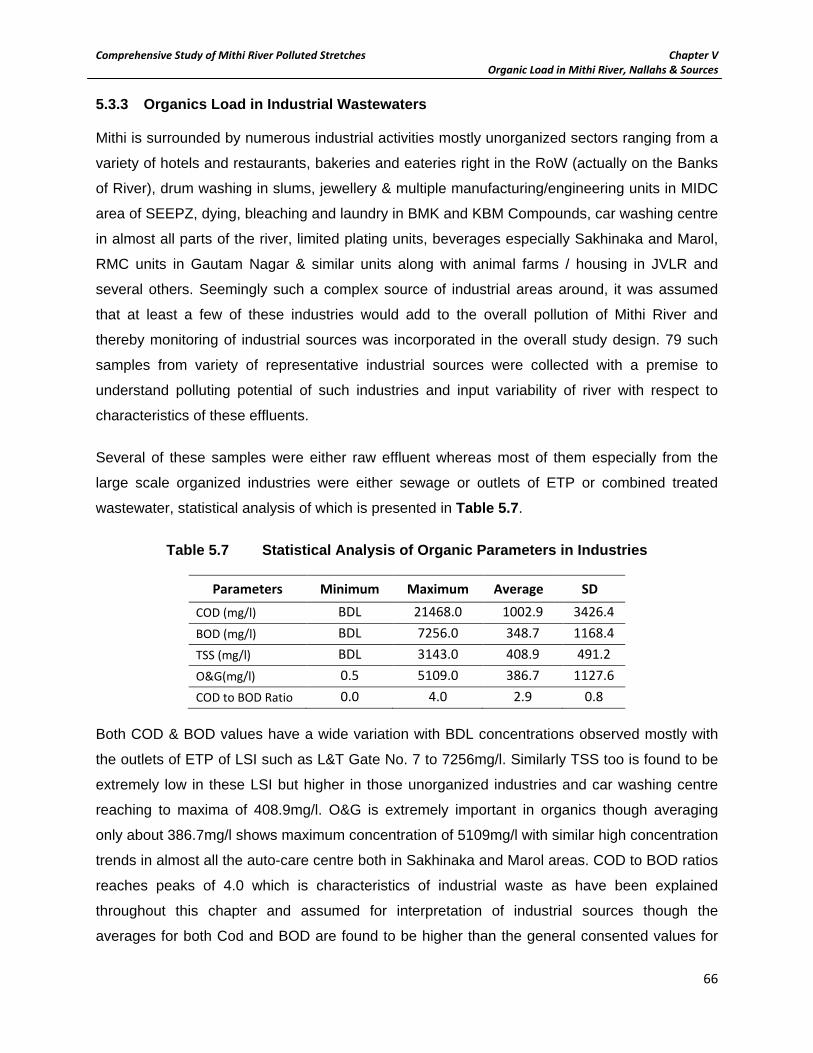
Comprehensive Study of Mithi River Polluted Stretches Chapter V Organic Load in Mithi River, Nallahs & Sources
66
5.3.3 Organics Load in Industrial Wastewaters Mithi is surrounded by numerous industrial activities mostly unorganized sectors ranging from a
variety of hotels and restaurants, bakeries and eateries right in the RoW (actually on the Banks
of River), drum washing in slums, jewellery & multiple manufacturing/engineering units in MIDC
area of SEEPZ, dying, bleaching and laundry in BMK and KBM Compounds, car washing centre
in almost all parts of the river, limited plating units, beverages especially Sakhinaka and Marol,
RMC units in Gautam Nagar & similar units along with animal farms / housing in JVLR and
several others. Seemingly such a complex source of industrial areas around, it was assumed
that at least a few of these industries would add to the overall pollution of Mithi River and
thereby monitoring of industrial sources was incorporated in the overall study design. 79 such
samples from variety of representative industrial sources were collected with a premise to
understand polluting potential of such industries and input variability of river with respect to
characteristics of these effluents.
Several of these samples were either raw effluent whereas most of them especially from the
large scale organized industries were either sewage or outlets of ETP or combined treated
wastewater, statistical analysis of which is presented in Table 5.7.
Table 5.7 Statistical Analysis of Organic Parameters in Industries
Parameters Minimum Maximum Average SD
COD (mg/l) BDL 21468.0 1002.9 3426.4 BOD (mg/l) BDL 7256.0 348.7 1168.4 TSS (mg/l) BDL 3143.0 408.9 491.2 O&G(mg/l) 0.5 5109.0 386.7 1127.6 COD to BOD Ratio 0.0 4.0 2.9 0.8
Both COD & BOD values have a wide variation with BDL concentrations observed mostly with
the outlets of ETP of LSI such as L&T Gate No. 7 to 7256mg/l. Similarly TSS too is found to be
extremely low in these LSI but higher in those unorganized industries and car washing centre
reaching to maxima of 408.9mg/l. O&G is extremely important in organics though averaging
only about 386.7mg/l shows maximum concentration of 5109mg/l with similar high concentration
trends in almost all the auto-care centre both in Sakhinaka and Marol areas. COD to BOD ratios
reaches peaks of 4.0 which is characteristics of industrial waste as have been explained
throughout this chapter and assumed for interpretation of industrial sources though the
averages for both Cod and BOD are found to be higher than the general consented values for

Comprehensive Study of Mithi River Polluted Stretches Chapter V Organic Load in Mithi River, Nallahs & Sources
67
industries in coastal areas i.e. 475mg/l and 180mg/l respectively. Though the average ratio
seems to be around 2.9, it is to be considered in relation with the types of samples used for
such averaging. The authors would like to put forth that when analysis of industrial wastewater
samples pertaining to only effluents from industrial areas are considered, the COD to BOD
ratios seem to be >3.5 as is also evident from nallah wastewater analysis from those areas
connected to industrial activities.
The other 2 parameters representing organics too show concentrations higher than the General
Standards prescribed in Coastal region industries though the conditions may be much more
stringent for such industries located on the banks of Mithi River being classified as RRZ II.
Average concentration of TSS and O&G are found to be 408.9mg/l and 386.7mg/l respectively
which seem to pose critical cause of concern. Extremely high concentrations of O&G in case of
auto-care related industries which are about 8 out of the 79 samples and can be extrapolated to
be representative of almost all similar units around Mithi.
5.3.4 Comparative Account of Organics Load A unconventional concept of using cluster / association of various parameters through
computing ratio in various samples of River : Nallah : Vakola Nallah : Industries is used to
understand proximity and probable source determinants into Mithi River as presented in Table 5.8and illustrated as base of proximity pyramid. It is also important that this concept need not be
considered in isolation but shall be used as just another way of interpreting data and be
approached in accordance with all other computations described earlier. Thereby COD & BOD
appears nearest to Nallahs with a factor of 2 v/s factor of 4 for industries. TSS shows its
relevant proximity to nallah as well as industrial sources with almost similar factor or 0.7.
O&G possess a very unique feature contrary to the fact that most of it remains floating and
unchanged under influence of other sources which is not the case with other outlined organics
in this comparison. A ratio of 25 times to 1 represented by Industries v/s River water seems to
only suggest that the major contributor of O&G in river is industry. Conductivity too shows
varying facts with respect to both nallahs and industries and thereby in itself may be contributed
by sources within the river itself.
The most prominent relationship established by this method is of COD to BOD ratio for river and
nallahs exactly coinciding to 1.0 which shows maximum proximity whereas industries are a bit

Comprehensive Study of Mithi River Polluted Stretches Chapter V Organic Load in Mithi River, Nallahs & Sources
68
lower to 0.81 though may not be overruled for its proximity especially also further demonstrates
the fact that certain part of the industrial samples were obtained from sewage water.
Table 5.8 Comparative Account of Parameters Contributing and Representing
Organics
Parameters River Nallahs into Mithi Nallah into Vakola Industries COD (mg/l) 120.3 233.4 211.0 475.4
COD Ratio of River:Nallah:Vakola:Industry 1.00 : 1.94 : 1.75 : 3.95 BOD (mg/l) 39.0 76.2 78.0 179.8
BOD Ratio of River:Nallah:Vakola:Industry 1.00 : 1.95 : 2.00 : 4.60 TSS (mg/l) 402.8 306.4 143.3 289.4
TSS Ratio of River:Nallah:Vakola:Industry 1.00 : 0.76 : 0.36 : 0.71 O&G (mg/l) 19.9 71.1 7.2 498.7
O&G Ratio of River:Nallah:Vakola:Industry 1.00 : 3.57 : 0.36 : 25.06 Conductivity (mS/cm) 3689.0 1110.0 1285.3 7390.9
Conductivity Ratio of River:Nallah:Vakola:Industry 1.00 : 0.30 0.34 : 2.00 COD to BOD Ratio 3.1 3.1 2.7 2.9
COD/BOD Ratio of River:Nallah:Vakola:Industry 1.00 : 1.00 :0.87 : 0.93
5.4 Dissolved Oxygen Content in Mithi River Dissolved oxygen in the water plays a vital role in the degradation of organic load present in the
water as well as is very much essential for the survival of all life forms. Though DO forms an
essential part of the organics behavior especially BOD, it was essentially one of the aspects that
do not form essential part of the Water Quality Standards for Discharge Schedule VI (Part A)
though it is part of the Designated Base Use Limits prescribed i.e. Class C or D, by competent
authority which is considered in this case as 4mg/l being either drinking water source after
conventional treatment or propagation of wildlife fisheries which rather should be the adopted
concentration for Mithi. Thereby since it is the most important aspect to show health of the river
water in terms of supporting life forms, all the samples collected during study were measured for
DO variations both by Online Meters and also in laboratory by conventional method.
Figure 5.6outlines variations in the DO concentrations observed in the river wherein all the DO
values are less than the 4mg/l mark thereby raising concerns of serious nature and also
reflecting that most of DO is already consumed due to BOD load. The maximum concentration
of DO is observed at the upstream of the Sakhinaka which is 3.3mg/l whereas the minimum of
2.2mg/l observed at upstream of KBM Compound &downstream of the Safed Pool.

Comprehensive Study of Mithi River Polluted Stretches Chapter V Organic Load in Mithi River, Nallahs & Sources
69
Figure 5.7 represents the DO concentrations in the nallahs adjoining river in each of the
stretches revealing that the maximum concentration of DO is 4.8mg/l which is observed at
Safed Pool. The minimum concentration of 2.2mg/l is observed at the three of the nallahs, two
near BamandayaPada and one in Sakhinaka. Interestingly Safed Pool nallah which carries one
of the high hydraulic loads into river seems to have the highest DO levels. The main reason for
this kind of behavior is not only the highly diluted organics load in this section but also due to
extremely high turbulence that in inherent in the path of this nallah which probably contributes to
natural oxygen replenishment process leading to reduction in BOD as well as increase in DO
levels.
Dissolved Oxygen levels in Vakola Nallah are shown in Figure 5.8revealing that the maximum
concentration observed was of 3.5mg/l in N23 whereas the minimum is 2.2mg/l observed in N39
that represent small nallahs entering Vakola. Though there is no specifically prescribed
standard limit for public sewer discharge, it is assumed that these low oxygen concentrations
would aggravate the already deteriorating conditions of Mithi at least in certain portion of the
river. The only savior to this low oxygen content is sea water intrusion that helps aid the natural
rejuvenation process of the nallah to a certain extent.

Comprehensive Study of Mithi River Polluted Stretches Chapter V Organic Load in Mithi River, Nallahs & Sources
70
Figure 5.6 Dissolved Oxygen Concentrations in Mithi River Samples
0
0.5
1
1.5
2
2.5
3
3.5
UP DN UP DN UP DN UP DN UP DN UP DN UP DN UP DN UP DN UP UP DN UP DN UP DN UP DN UP DN
Gautam Nagar JVLR Bamandaya KBM Compund Marol Sakhinaka Airport Safed Pool BMKCompound
CSTBridge
MTNL Bridge BKC Wakola kalanagar Mahim
CON
C.(m
g/l)
Sampling LOoations

Comprehensive Study of Mithi River Polluted Stretches Chapter V Organic Load in Mithi River, Nallahs & Sources
71
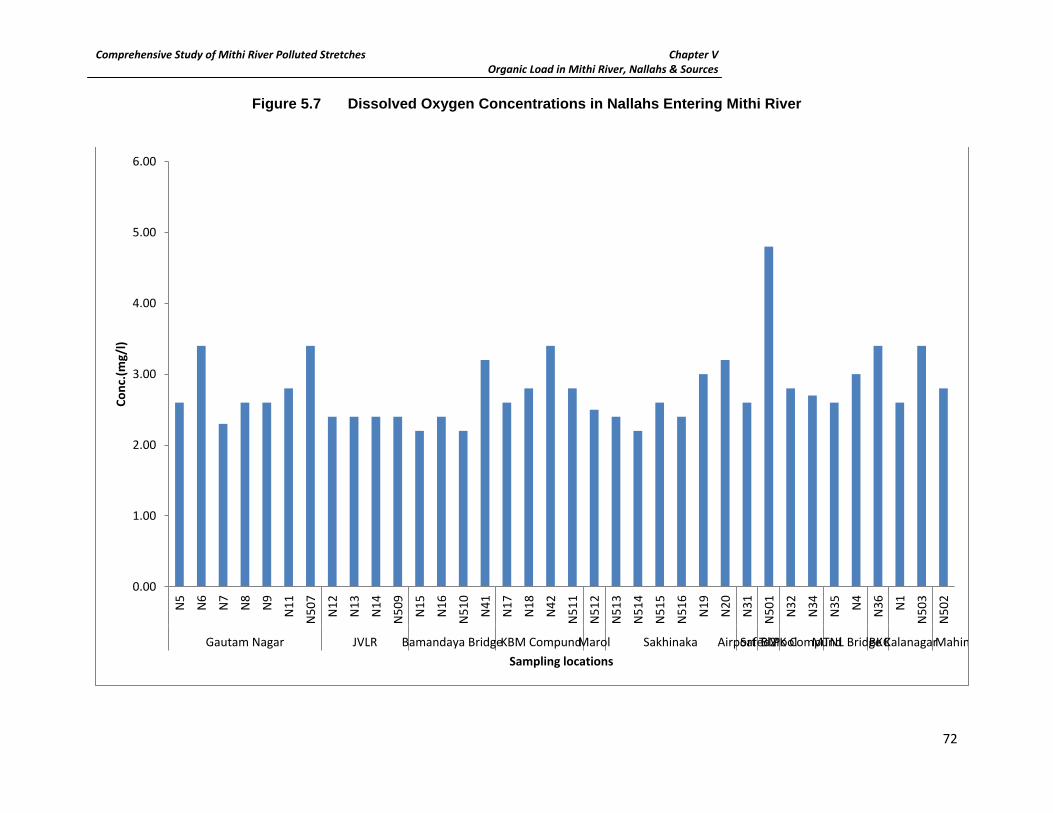
Comprehensive Study of Mithi River Polluted Stretches Chapter V Organic Load in Mithi River, Nallahs & Sources
72
Figure 5.7 Dissolved Oxygen Concentrations in Nallahs Entering Mithi River
0.00
1.00
2.00
3.00
4.00
5.00
6.00N
5
N6
N7
N8
N9
N11
N50
7
N12
N13
N14
N50
9
N15
N16
N51
0
N41
N17
N18
N42
N51
1
N51
2
N51
3
N51
4
N51
5
N51
6
N19
N20
N31
N50
1
N32
N34
N35 N
4
N36 N
1
N50
3
N50
2
Gautam Nagar JVLR Bamandaya Bridge KBM CompundMarol Sakhinaka Airport T-2Safed PoolBMK Compund MTNL Bridge BKCKalanagarMahim
Conc
.(mg/
l)
Sampling locations

Comprehensive Study of Mithi River Polluted Stretches Chapter V Organic Load in Mithi River, Nallahs & Sources
73
Figure 5.8 Dissolved Oxygen Concentrations in Vakola Nallah Samples
0.00
0.50
1.00
1.50
2.00
2.50
3.00
3.50
4.00Co
nc.(m
g/l)
Sampling locations
Comprehensive Study of Mithi River Polluted Stretches Chapter VI Physico-chemical Characterization of Mithi River, Nallahs & Sources
Chapter VI
6.0 Background ...................................................................................................................... 73
6.1 Physico-chemical Characterization of Mithi River ........................................................ 73
6.1.1 Major Parameters Contributing &Representing Conductivityin Mithi River ........... 73
6.1.2 Major Parameters Contributing & Representing Anions in Mithi River .................. 75
6.1.3 Major Parameters Contributing & Representing Cations in Mithi River ................. 78
6.1.4 Special Parameters Representing Characters of Mithi River ................................ 78
6.2 Physico-chemical Characterization of Nallahs Contributing to Mithi River ................... 80
6.2.1 Major Parameters Contributing & Representing Conductivity in Nallahs .............. 80
6.2.2 Major Parameters Contributing & Representing Anions in Nallahs ....................... 82
6.2.3 Major Parameters Contributing & Representing Cations in Nallahs ...................... 84
6.2.4 Special Parameters Representing Characters of Nallahs ..................................... 84
6.3 Physico-chemical Characterization of Vakola Nallah ................................................... 87
6.3.1 Major Parameters Contributing & Representing Conductivity in Vakola Nallah .... 87
6.3.2 Major Parameters Contributing & Representing Anions in Vakola Nallah ............. 89
6.3.3 Major Parameters Contributing & Representing Cations in Vakola Nallah ............ 90
6.3.4 Special Parameters Representing Characters of Vakola Nallah ........................... 90
6.4 Industrial Source Wastewater Characterization ........................................................... 95
6.4.1 Major Parameters Contributing & Representing Conductivity in Industries ........... 95
6.4.2 Major Parameters Contributing & Representing Anionic Parameters in Industries ... .............................................................................................................................. 96
6.4.3 Major Parameters Contributing & Representing Cationic Parameters in Industries .. .............................................................................................................................. 96
6.4.4 Major Parameters Contributing & Representing Special Parameters in Industries ... .............................................................................................................................. 97
6.5 Comparative Account of ParametersAcross River and Nallahs ................................... 97
List of Tables
Table 6.1 Statistical Analysis of Major Parameters of Mithi River Contributing TDS during
Monsoon ................................................................................................................... 75
Table 6.2 Statistical Analysis of Anionic Parameters of Mithi River during Monsoon ............... 75
Table 6.3 Statistical Analysis of Cationic Parameters of Mithi River during Monsoon .............. 78
Table 6.4 Statistical Analysis of Special Parameters of Mithi River during Monsoon ............... 80

Comprehensive Study of Mithi River Polluted Stretches Chapter VI Physico-chemical Characterization of Mithi River, Nallahs & Sources
Table 6.5 Statistical Analysis of Major Parameters of Nallahs Contributing TDS during
Monsoon ................................................................................................................... 82
Table 6.6 Statistical Analysis of Anionic Parameters of Mithi River during Monsoon ............... 82
Table 6.7 Statistical Analysis of Cationic Parameters of Nallahs during Monsoon ................... 84
Table 6.8 Statistical Analysis of Special Parameters of Nallahs during Monsoon .................... 87
Table 6.9 Statistical Analysis of Major Parameters of Vakola Nallah Contributing TDS during
Monsoon ................................................................................................................... 89
Table 6.10 Statistical Analysis of Anionic Parameters of Vakola Nallah during Monsoon ...... 89
Table 6.11 Statistical Analysis of Cationic Parameters of Vakola Nallah during Monsoon ..... 90
Table 6.12 Statistical Analysis of Special Parameters of Vakola Nallah during Monsoon ...... 90
Table 6.13 Statistical Analysis of Major Parameters of Industries Contributing Conductivity .. 95
Table 6.14 Statistical Analysis of Anionic Parameters of Industries ........................................ 96
Table 6.15 Statistical Analysis of Cationic Parameters of Industries ...................................... 97
Table 6.16 Statistical Analysis of Special Parameters of Mithi River during Monsoon ............ 97
List of Figures
Figure 6.1 Major Parameters Contributing and Representing Conductivity in Mithi River ....... 74
Figure 6.2 Parameters Contributing and Representing Anions in Mithi River ......................... 76
Figure 6.3 Parameters Contributing and Representing Cations in Mithi River ........................ 77
Figure 6.4 Special Parameters Representing Characters of Mithi River ................................. 79
Figure 6.5 Major Parameters Contributing and Representing Conductivity in Mithi River ....... 81
Figure 6.6 Parameters Contributing and Representing Anions in Nallahs .............................. 83
Figure 6.7 Parameters Contributing and Representing Cations in Nallahs ............................. 85
Figure 6.8 Special Parameters Representing Characters of Nallahs ...................................... 86
Figure 6.9 Major Parameters Contributing and Representing Conductivity in Vakola Nallah .. 88
Figure 6.10 Parameters Contributing and Representing Anions in Vakola Nallah .................. 92
Figure 6.11 Parameters Contributing and Representing Cations in Vakola Nallah ................. 93
Figure 6.12 Special Parameters Representing Characters of Vakola Nallah .......................... 94

Comprehensive Study of Mithi River Polluted Stretches Chapter VI Physico-chemical Characterization of Mithi River, Nallahs & Sources
73
Chapter VI Physico-Chemical Characterization of Mithi River& Nallahs
6.0 Background The previous chapter outlined parameters that add to the organic content of Mithi River along
with description of probable sources responsible. As also described in earlier chapters, there
are 19 other parameters that were measured during the pre-monsoon period of study. In
previous schedule of monitoring, very few parameters other than organics were measured and
such as TDS, chlorides, O&G, nitrates, phosphates during Monsoon whereas still fewer such as
MPN, Suspended solids, O&G thereby making it inconsistent to compare & report the same.
6.1 Physico-chemical Characterization of Mithi River Thereby this chapter describes all such physico-chemical parameters of interest and
accountable to pollution potential in Mithi as well as their probable source contributions through
nallahs entering the river only for monitoring period of pre-monsoon i.e. May 2014. For the ease
of interpretation, these parameters are classified into those that contribute and represent
conductivity, cations, anions or nutrients and special parameter of interest such as MPN and
phenols.
6.1.1 Major Parameters Contributing &Representing Conductivityin Mithi River Conductivity is a direct measure of ionic content and thereby in relation to Mithi River the major
reflection of Total Dissolved Solids [TDS]. Extremely high conductivity is observed in some parts
of the river due to tidal influence with maxima reaching to 18297.2mS/cm as a prominent mark
of sea water intrusion which is mainly constituted by TDS as evident from very high
concentration of maxima at 35506.3mg/l and majorly contributed by chlorides @ maxima of
19919.3mg/l. This trend is observed almost 5 to 6kms inland from the last point where Mithi
converges into the Arabian Sea through Mahim Creek. The variability of these parameters at
individual monitoring locations is presented in Figure 6.1.
Locations where sea water is not impacting Mithi shows low conductivity of 0.7mS/cm with
equally low TDS of 245mg/l and mainly contributed in these sections by hardness @ 180mg/l.
There is a wide variation in characteristics of these parameters due to prominent differentiation
based on sea water intrusion as depicted in Table 6.1.

Comprehensive Study of Mithi River Polluted Stretches Chapter VI Physico-chemical Characterization of Mithi River, Nallahs & Sources
74
Figure 6.1 Major Parameters Contributing and Representing Conductivity in Mithi River
0
50
100
150
200
250
300
350
0
7000
14000
21000
28000
35000
UP DN UP DN UP DN UP DN UP DN UP DN UP DN UP DN UP DN UP UP DN UP DN UP DN UP DN UP DN
GautamNagar
JVLR Bamandaya KBMCompund
Marol Sakhinaka Airport Safed Pool BMKCompound
CSTBridge
MTNL Bridge BKC Wakola kalanagar Mahim
mg/
l
mg/
l or m
S/cm
Sampling Locations
Conductivity ms/cm TDS Chloride Hardness Alkalinity

Comprehensive Study of Mithi River Polluted Stretches Chapter VI Physico-chemical Characterization of Mithi River, Nallahs & Sources
75
Standard deviations equally reflect the same being higher than the averages itself which for
conductivity is 3688.9ms/cm, TDS is 5303.4mg/l, Chlorides is 2880.0mg/l and hardness is
845.5mg/l. Alkalinity which is a measure of capacity to equate acidity ranges from ranges from
180mg/l to 300mg/l with average of 230.7mg/l and may also be contributed mainly due to sea
water impacts.
Table 6.1 Statistical Analysis of Major Parameters of Mithi River Contributing TDS
during Monsoon
Parameters Minimum Maximum Average SD Std. (ISW - a) Conductivity (mS/cm) 0.70 18297.2 3688.9 5813.6 NA
TDS (mg/l) 245.0 34506.3 5303.4 9963.3 2100
Chloride (mg/l) 59.0 19919.3 2880.0 6078.3 1000
Alkalinity (mg/l) 180.0 300.0 230.7 31.7 NA
Hardness (mg/l) 146.0 5392.3 845.5 1532.6 NA
6.1.2 Major Parameters Contributing & Representing Anions in Mithi River On the other hand sea water does impact concentrations of sulphates bringing it inland via tidal
impacts which range from 13.4mg/l to 4279.4mg/l with average of 917.7mg/l as delineated in
Table 6.2. The minimum values are observed mainly in regions in upper half of the river starting
from origins which are mostly dominated by sewage sources and few industrial ones. It is quite
evident through univariate analysis that hardness is mainly represented in SO4 form and that is
brought by sea water since no other domestic or industrial sources account for such high SO4
concentration.Nutrients in form of nitrates and phosphates are minimal in concentrations
ranging from BDL to 24.6mg/l and 1.3mg/l averaging about 12.1mg/l and 0.2mg/l respectively as
presented in Figure 6.2. Interestingly, all those parameters such as nutrients where sources are
consistent show low SD values whereas those where variability is inherent due to sea water
intrusion show very high SD values much beyond averages as seen in both cases discussed
here.
Table 6.2 Statistical Analysis of Anionic Parameters of Mithi River during Monsoon
Parameters Minimum Maximum Average SD Std. (ISW - a)
SO4(mg/l) 13.4 4279.4 917.7 1267.4 1000
PO4(mg/l) BDL 24.6 12.1 6.0 NA
NO3(mg/l) BDL 1.3 0.2 0.3 NA

Comprehensive Study of Mithi River Polluted Stretches Chapter VI Physico-chemical Characterization of Mithi River, Nallahs & Sources
76
Figure 6.2 Parameters Contributing and Representing Anions in Mithi River
0
5
10
15
20
25
0
500
1000
1500
2000
2500
3000
3500
4000
4500
UP DN UP DN UP DN UP DN UP DN UP DN UP DN UP DN UP DN UP UP DN UP DN UP DN UP DN UP DN
Gautam Nagar JVLR Bamandaya KBMCompund
Marol Sakhinaka Airport Safed Pool BMKCompound
CSTBridge
MTNL Bridge BKC Wakola kalanagar Mahim
mg/
l
Conc
.(mg/
l)
Sampling Locations
SO4 PO4 NO3

Comprehensive Study of Mithi River Polluted Stretches Chapter VI Physico-chemical Characterization of Mithi River, Nallahs & Sources
77
Figure 6.3 Parameters Contributing and Representing Cations in Mithi River
0
5
10
15
20
25
30
35
40
45
50
0
50
100
150
200
250
UP DN UP DN UP DN UP DN UP DN UP DN UP DN UP DN UP DN UP UP DN UP DN UP DN UP DN UP DN
Gautam Nagar JVLR Bamandaya KBM Compund Marol Sakhinaka Airport Safed Pool BMKCompound
CSTBridge
MTNL Bridge BKC Wakola kalanagar Mahim
mg/
l
Conc
.(mg/
l)
Sampling Locations
Cr+6 Cu Pb Zn Fe Mn

Comprehensive Study of Mithi River Polluted Stretches Chapter VI Physico-chemical Characterization of Mithi River, Nallahs & Sources
78
When compared to Schedule VI - General Discharge Standards [Best Designated Use for
Inland Surface Water (a) classification] for available parameters, average values for TDS &
chlorides are extremely higher than 2100mg/l & 1000mg/l respectively whereas that for SO4 is
just lower than 1000mg/l prescribed limits.
6.1.3 Major Parameters Contributing & Representing Cations in Mithi River Metal concentrations (Figure 6.3) are found to be extremely lowthroughout the section of Mithi
River as presented in Table 6.3. All metals show minimum concentration BDL except Fe which
has minimum of 0.5mg/l concentration whereas Cr+6, Cd and Co are found to be BDL in all
sections of the river. Maximum concentrations of Cu, Fe Pb, Mn and Ni are found to be 0.3mg/l,
43.7mg/l, 0.6mg/l, 2.8mg/l and 1.3mg/l which are higher than the standards though almost all of
them show average concentrations below Inland Surface Water Standards. Zn is the only metal
that shows very high concentration in some parts of the river stretches with maxima reaching to
213.0mg/l and average of 7.5mg/l which is almost 1.5times higher than the standard of 5.0mg/l.
Table 6.3 Statistical Analysis of Cationic Parameters of Mithi River during Monsoon
Parameters Minimum Maximum Average SD
Cr+6(mg/l) BDL BDL BDL BDL Cu (mg/l) BDL 0.3 0.1 0.1 Fe (mg/l) 0.5 43.7 7.6 10.3 Pb (mg/l) BDL 0.6 0.1 0.2 Mn (mg/l) BDL 2.8 0.6 0.6 Ni (mg/l) BDL 1.3 0.1 0.3 Cd (mg/l) BDL BDL BDL BDL CO (mg/l) BDL BDL BDL BDL Zn (mg/l) BDL 213.0 7.5 39.5
6.1.4 Special Parameters Representing Characters of Mithi River Two such parameters the variability of which is presented in Figure 6.4i.e. MPN which
represents fecal contamination seems to be extremely high probably due to direct discharge of
raw sewage at several entry points into Mithi River as represented in Table 6.4 with values
ranging from 19col/100ml to 71,600col/100ml and average of 8028col/100ml probably due to
practices of open defecation directly adding to the fecal coliforms into river.
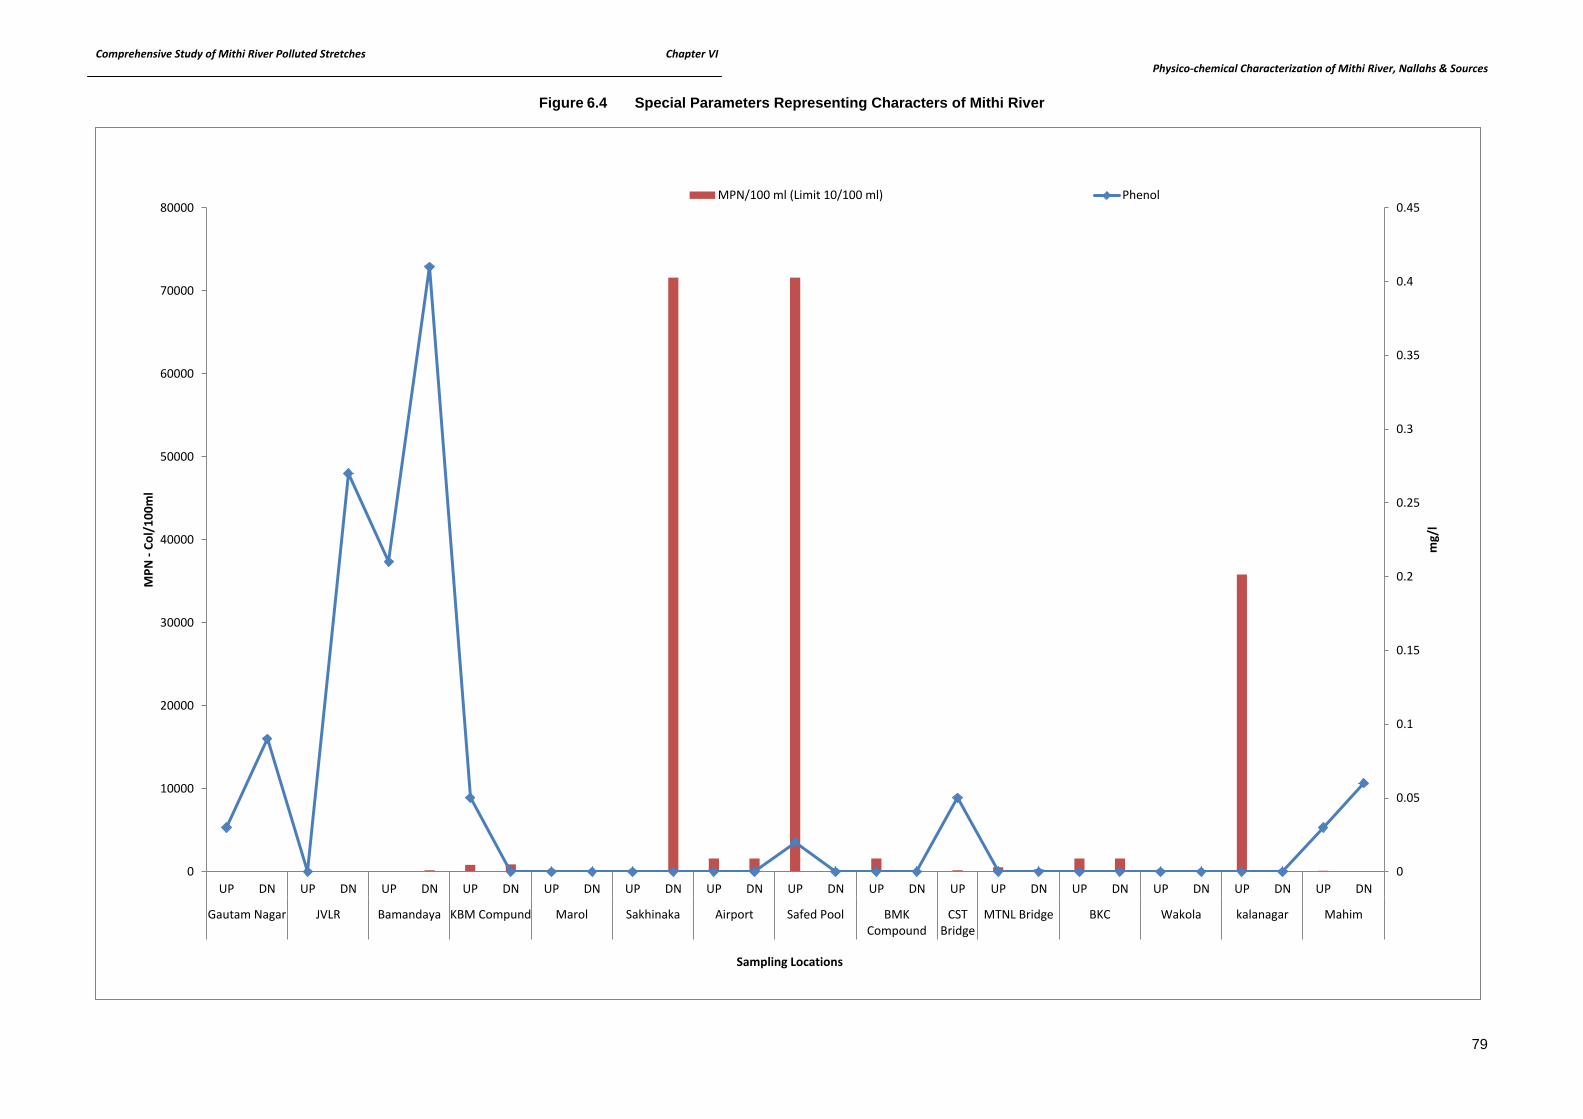
Comprehensive Study of Mithi River Polluted Stretches Chapter VI Physico-chemical Characterization of Mithi River, Nallahs & Sources
79
Figure 6.4 Special Parameters Representing Characters of Mithi River
0
0.05
0.1
0.15
0.2
0.25
0.3
0.35
0.4
0.45
0
10000
20000
30000
40000
50000
60000
70000
80000
UP DN UP DN UP DN UP DN UP DN UP DN UP DN UP DN UP DN UP UP DN UP DN UP DN UP DN UP DN
Gautam Nagar JVLR Bamandaya KBM Compund Marol Sakhinaka Airport Safed Pool BMKCompound
CSTBridge
MTNL Bridge BKC Wakola kalanagar Mahim
mg/
l
MPN
- Co
l/10
0ml
Sampling Locations
MPN/100 ml (Limit 10/100 ml) Phenol

Comprehensive Study of Mithi River Polluted Stretches Chapter VI Physico-chemical Characterization of Mithi River, Nallahs & Sources
80
In fact most of the domestic inputs to Mithi show values more >1600col/100ml and since Inland
Surface Water Standards do not specify limits for MPN and Mithi often being used for human
contact purpose when compared with IS10500, the average values are extremely critical though
may not be the ideal way of comparison.
Table 6.4 Statistical Analysis of Special Parameters of Mithi River during Monsoon
Parameters Minimum Maximum Average SD Std. (ISW - a)
Phenols (mg/l) BDL 0.41 0.04 0.09 1.0
MPN (Col/100ml) 19 71600 8028 21383 10 (IS10500)
And the second one i.e. phenols which may find its source from industrial discharges and also
many a times from raw sewage due to recent and exponential use of disinfectants containing
phenols, the presence of phenol is marked in several sections of Mithi thought eh
concentrations are much below the prescribed limits as defined by Schedule VI - General
Discharge Standardslimit of 1.0mg/l. The average concentration of phenols is found to be mere
0.04mg/l.
6.2 Physico-chemical Characterization of Nallahs Contributing to Mithi River The 41 major attributable nallahs discharging wastewater into Mithi River monitored during May
2014 are described already in earlier sections of this report. Most of them are found to be laden
with domestic wastewater, which are further substantiated with the description of physic-
chemical characterization outlined hereunder.
6.2.1 Major Parameters Contributing & Representing Conductivity in Nallahs As seen in case of river, under the influence of tides, many of the nallahs too show very high
concentrations of parameters that add to TDS and thereby resulting high conductivity though the
same are found to be much lower than those observed in river itself. Figure 6.5 presents
individual characteristics of nallahs that show marked variations in conductivity at the extreme
end of river i.e. towards Arabian Sea through the last 5kms of stretch from Vakola to Mahim
Creek i.e. in only 4 to 5 nallahs. Otherwise most of the other nallahs contribute to very little
conductivity and related parameters.
Conductivity reaches to maxima of 15210ms/cm averaging about 1110mS/cm whereas TDS
shows maxima of 39385mg/l mainly due to the contribution from chlorides to the extent of
11812mg/l and hardness of maximum concentrations reaching about 5813mg/l.

Comprehensive Study of Mithi River Polluted Stretches Chapter VI Physico-chemical Characterization of Mithi River, Nallahs & Sources
81
Figure 6.5 Major Parameters Contributing and Representing Conductivity in Mithi River
0.00
50.00
100.00
150.00
200.00
250.00
300.00
350.00
400.00
450.00
0.00
5000.00
10000.00
15000.00
20000.00
25000.00
30000.00
35000.00
40000.00
45000.00
1 2 3 4 5 6 7 8 9 10 11 12 13 14 15 16 17 18 19 20 21 22 23 24 25 26 27 28 29 30 31 32 33 34 35 36
mg/
l
mg/
l or m
s/cm
Nallah
Conductivity ms/cm TDS Hardness Chloride Alkalinity

Comprehensive Study of Mithi River Polluted Stretches Chapter VI Physico-chemical Characterization of Mithi River, Nallahs & Sources
82
Table 6.5 Statistical Analysis of Major Parameters of Nallahs Contributing TDS during Monsoon
Parameters Minimum Maximum Average SD Std. (PS - b)
Conductivity (mS/cm) 1.4 15210.0 1110.0 2446.9 NA
TDS (mg/l) 225.0 39385.0 2479.1 6902.9 2100
Chloride (mg/l) 41.0 11812.0 748.4 2178.9 1000
Alkalinity (mg/l) 130.0 400.0 249.6 67.4 NA
Hardness (mg/l) 29.0 5813.0 422.9 1020.8 NA
Average concentration of TDS is 2479.1mg/l which is equated with mainly average
chlorideconcentration of 2178.9mg/l and hardness of 1020.8mg/l all of which contribute to the
average conductivity observed as 1110mS/cm. Interestingly it is evident in nallahs too that only
a few of them as stated earlier are responsible for such high variations as well as higher values
of parameters as substantiated with extremely high SD values again beyond the averages itself.
Alkalinity however shows very limited concentration ranging from 130 to 400mg/l with an
average of 67.4mg/l. When compared to standards, since some of the nallahs contribute to the
extreme concentrations, the averages too are impacted in such a manner as to be beyond the
prescribed limits of Inland Surface Water for both TDS and chlorides under the influence of
tides.
6.2.2 Major Parameters Contributing & Representing Anions in Nallahs Statistical analysis of anions are depicted in Table 6.6 which shows that sulphate concentration
raging from 21.8mg/l to 8787.3mg/l with average of 771.4mg/l though well within the prescribed
limits of Inland Surface Water Criteria exceed by a factor of 8.7 at maxima values and probably
also mainly contributes to hardness. Nutrients on other hand are very limited in concentrations
with averages of NO3& PO4 found to be 16.2mg/l & 0.2mg/l respectively. This also reveals the
fact that these nutrients are contributed mainly through the raw sewage water and there are no
such prominent agricultural or other sources. Individual characteristics of each nallah are
represented in Figure 6.6.
Table 6.6 Statistical Analysis of Anionic Parameters of Mithi River during Monsoon
Parameters Minimum Maximum Average SD Std. (ISW - a)
SO4(mg/l) 21.8 8782.3 771.4 1705.7 1000
PO4(mg/l) BDL 56.9 16.2 15.4 NA
NO3(mg/l) BDL 2.4 0.2 0.4 NA

Comprehensive Study of Mithi River Polluted Stretches Chapter VI Physico-chemical Characterization of Mithi River, Nallahs & Sources
83
Figure 6.6 Parameters Contributing and Representing Anions in Nallahs
0.00
10.00
20.00
30.00
40.00
50.00
60.00
0.00
2000.00
4000.00
6000.00
8000.00
10000.00
12000.00
14000.00
N5 N6 N7 N8 N9 N11 N507 N12 N13 N14 N509 N15 N16 N510 N41 N17 N18 N42 N511 N513 N514 N515 N516 N19 N20 N31 N501 N32 N34 N35 N4 N36 N40 N1 N503 N502
II - Gautam Nagar III - JVLR IV - Bamandaya Bridge V - KBM Compund VII - Sakhinaka 0 0VIII - Airport T-2IX - Safed PoolX - BMK CompundXII - MTNL BridgeXIII - BKC XV - KalanagarXVI - Mahim
Conc
.(mg/
l)
Sampling Locations
Chloride SO4 PO4 NO3

Comprehensive Study of Mithi River Polluted Stretches Chapter VI Physico-chemical Characterization of Mithi River, Nallahs & Sources
84
6.2.3 Major Parameters Contributing & Representing Cations in Nallahs As observed in case of river samples, most of the nallah water samples reflect similar trends
wherein minimum concentrations are found to be BDL for almost all metals except Fe, Mn& Zn
which are found to be 0.6mg/l and 0.1mg/l as delineated in Table 6.7. On the other hand Cr+6,
Ni, Cd and Co are absent in any of the nallahs. The average concentrations of those that are
found to be present in small quantities in these nallahs are Cu @ 0.1mg/l, Fe @ 10.6mg/l, Pb @
0.1mg/l, Mn @ 1.0mg/l and Zn @ 0.4mg/l. Fe is found to be the highest probably originating
from nature and also from leaching of most plumbing materials commonly found in Indian
households. The variability of each of these metals in individual nallahs is presented in Figure 6.7. All those metals for which Schedule VI - General Discharge Standards for Inland Surface
Water are defined are found to be well within prescribed limits.
Table 6.7 Statistical Analysis of Cationic Parameters of Nallahs during Monsoon
Parameters Minimum Maximum Average SD Std. (PS - b)
Cr+6(mg/l) BDL BDL BDL BDL 0.1
Cu (mg/l) BDL 0.5 0.1 0.1 3.0
Fe (mg/l) 0.6 43.4 10.6 10.3 NA
Pb (mg/l) BDL 0.7 0.1 0.1 0.1
Mn (mg/l) 0.1 6.6 1.0 1.5 NA
Ni (mg/l) BDL BDL BDL BDL 3.0
Cd (mg/l) BDL BDL BDL BDL 2.0
CO (mg/l) BDL BDL BDL BDL NA
Zn (mg/l) BDL 9.2 0.4 1.5 5.0
6.2.4 Special Parameters Representing Characters of Nallahs Surprisingly the MPN values in most of the nallahs are found to be >1600 as represented in
Figure 6.8. Though the averages are found to be low compared to those in the river which is
probably because most of the slum areas surrounding Mithi Rivers are not equipped with toilet
facilities and thereby the nallahs that carry raw sewage are probably few of human excreta
which otherwise is expected to be transferred via closed pipelines in urban areas and for those
urban habitants connected to Mithi River have septic tanks that probably result in reducing such
coliform numbers in nallahs. Thereby MPN numbers range from 10 to 1600col/100ml with
average value of 817.9col/100ml as shown in Figure 6.8 whereas statistical analysis of same is
depicted in Table 6.8.
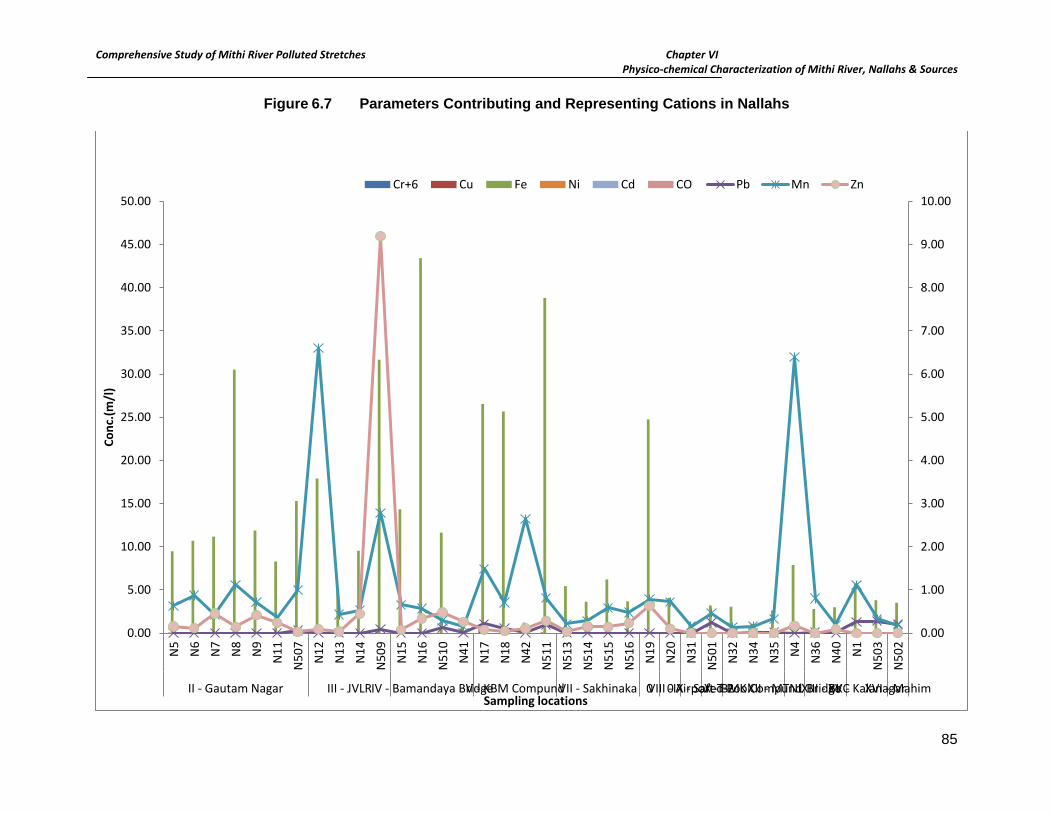
Comprehensive Study of Mithi River Polluted Stretches Chapter VI Physico-chemical Characterization of Mithi River, Nallahs & Sources
85
Figure 6.7 Parameters Contributing and Representing Cations in Nallahs
0.00
1.00
2.00
3.00
4.00
5.00
6.00
7.00
8.00
9.00
10.00
0.00
5.00
10.00
15.00
20.00
25.00
30.00
35.00
40.00
45.00
50.00
N5
N6
N7
N8
N9
N11
N50
7N
12N
13N
14N
509
N15
N16
N51
0N
41N
17N
18N
42N
511
N51
3N
514
N51
5N
516
N19
N20
N31
N50
1N
32N
34N
35 N4
N36
N40 N
1N
503
N50
2
II - Gautam Nagar III - JVLRIV - Bamandaya BridgeV - KBM CompundVII - Sakhinaka 0 0VIII - Airport T-2IX - Safed PoolX - BMK CompundXII - MTNL BridgeXIII - BKCXV - KalanagarXVI - Mahim
Conc
.(m/l
)
Sampling locations
Cr+6 Cu Fe Ni Cd CO Pb Mn Zn

Comprehensive Study of Mithi River Polluted Stretches Chapter VI Physico-chemical Characterization of Mithi River, Nallahs & Sources
86
Figure 6.8 Special Parameters Representing Characters of Nallahs
0
0.05
0.1
0.15
0.2
0.25
0.3
0.35
0
200
400
600
800
1000
1200
1400
1600
1800
1 2 3 4 5 6 7 8 9 10 11 12 13 14 15 16 17 18 19 20 21 22 23 24 25 26 27 28 29 30 31 32 33 34 35 36
Conc
.(mg/
l)
Sampling locations
MPN/100 ml
Phenol

Comprehensive Study of Mithi River Polluted Stretches Chapter VI Physico-chemical Characterization of Mithi River, Nallahs & Sources
87
Table 6.8 Statistical Analysis of Special Parameters of Nallahs during Monsoon
Parameters Minimum Maximum Average SD Std. (PS - b) Phenols (mg/l) BDL 0.4 0.1 0.1 1.0
MPN (Col/100ml) 10.0 1600.0 817.9 759.5 NA
Phenol concentrationsas shown in Table 6.8are almost similar to those found in river as
expected since the major source of these phenols are probably domestic in nature. The average
concentration is found to be 0.1mg/l whereas there are several nallahs showing BDL and
maxima of 0.4mg/l.
6.3 Physico-chemical Characterization of Vakola Nallah Vakola is one of the major nallahs that contributes to Mithi River and comprises of numerous
small nallahs entering into it. Most of the banks along the approximate 3.5kms of Vakola are
walled to a height of about 10 odd meters or more at most of the places and these numerous
small networks of nallahs forming rivulets entering it are mostly underground and closed piped.
Thereby flow determination of these though have been very difficult, 39 of the major accessible
nallahs contributing ultimately to Vakola are selected for sample collection and analysis.
Parameters similar to those for river and other major nallahs have been selected with the view
to reproduce comparative trends of all of them as discussed in following sections.
6.3.1 Major Parameters Contributing & Representing Conductivity in Vakola Nallah Vakola nallah falls within the ambit of tidal influence and is directly reflected in the values of
parameters as presented in Figure 6.9. High values of conductivity equating almost similar
trends in TDS concentrations reflect common source as they go hand in hand in almost all the
locations showing such trends. Vakola is surely under the influence of tidal intrusion inland
which extends surely beyond it and is prominently marked with peaks in the figure. Chlorides
too vary in line with TDS and conductivity thereby making it even more evident that sea water is
the source of such peaks. The nallahs are presented in numbers as described in Chapter II and
thereby peaks are reflected irregularly rather than in one section of the nallah, though single
digit series represent one of the banks while the other is presented via 3 digits numerical.
Almost 10 out of the 39 nallahs show high values of all dependent variables i.e. conductivity,
TDS, chlorides and hardness whereas alkalinity is independent and low in concentrations.
Statistical analysis of same is depicted in Table 6.9.

Comprehensive Study of Mithi River Polluted Stretches Chapter VI Physico-chemical Characterization of Mithi River, Nallahs & Sources
88
Figure 6.9 Major Parameters Contributing and Representing Conductivity in Vakola Nallah
0.00
50.00
100.00
150.00
200.00
250.00
300.00
350.00
400.00
0.00
1000.00
2000.00
3000.00
4000.00
5000.00
6000.00
7000.00
8000.00
mg/
l
mg/
l or m
S/cm
Sampling Locations
Conductivity ms/cm TDS Hardness Chloride Alkalinity
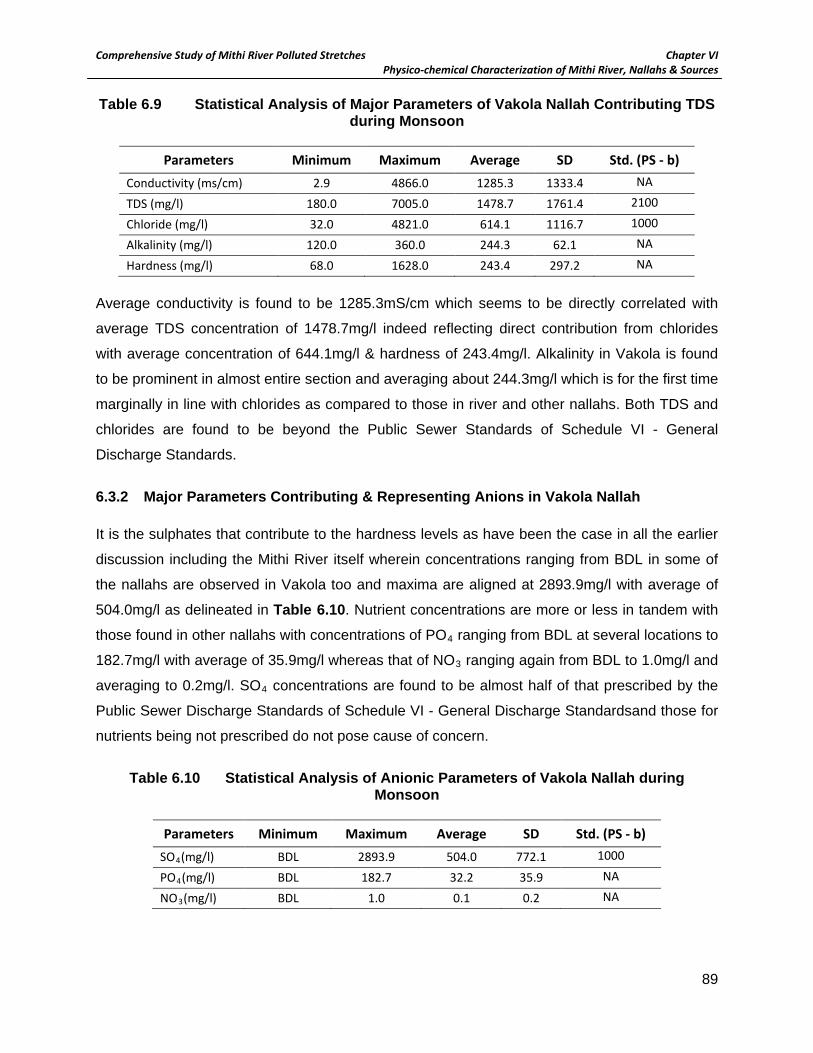
Comprehensive Study of Mithi River Polluted Stretches Chapter VI Physico-chemical Characterization of Mithi River, Nallahs & Sources
89
Table 6.9 Statistical Analysis of Major Parameters of Vakola Nallah Contributing TDS during Monsoon
Parameters Minimum Maximum Average SD Std. (PS - b)
Conductivity (ms/cm) 2.9 4866.0 1285.3 1333.4 NA
TDS (mg/l) 180.0 7005.0 1478.7 1761.4 2100
Chloride (mg/l) 32.0 4821.0 614.1 1116.7 1000
Alkalinity (mg/l) 120.0 360.0 244.3 62.1 NA
Hardness (mg/l) 68.0 1628.0 243.4 297.2 NA
Average conductivity is found to be 1285.3mS/cm which seems to be directly correlated with
average TDS concentration of 1478.7mg/l indeed reflecting direct contribution from chlorides
with average concentration of 644.1mg/l & hardness of 243.4mg/l. Alkalinity in Vakola is found
to be prominent in almost entire section and averaging about 244.3mg/l which is for the first time
marginally in line with chlorides as compared to those in river and other nallahs. Both TDS and
chlorides are found to be beyond the Public Sewer Standards of Schedule VI - General
Discharge Standards.
6.3.2 Major Parameters Contributing & Representing Anions in Vakola Nallah It is the sulphates that contribute to the hardness levels as have been the case in all the earlier
discussion including the Mithi River itself wherein concentrations ranging from BDL in some of
the nallahs are observed in Vakola too and maxima are aligned at 2893.9mg/l with average of
504.0mg/l as delineated in Table 6.10. Nutrient concentrations are more or less in tandem with
those found in other nallahs with concentrations of PO4 ranging from BDL at several locations to
182.7mg/l with average of 35.9mg/l whereas that of NO3 ranging again from BDL to 1.0mg/l and
averaging to 0.2mg/l. SO4 concentrations are found to be almost half of that prescribed by the
Public Sewer Discharge Standards of Schedule VI - General Discharge Standardsand those for
nutrients being not prescribed do not pose cause of concern.
Table 6.10 Statistical Analysis of Anionic Parameters of Vakola Nallah during
Monsoon
Parameters Minimum Maximum Average SD Std. (PS - b) SO4(mg/l) BDL 2893.9 504.0 772.1 1000
PO4(mg/l) BDL 182.7 32.2 35.9 NA
NO3(mg/l) BDL 1.0 0.1 0.2 NA

Comprehensive Study of Mithi River Polluted Stretches Chapter VI Physico-chemical Characterization of Mithi River, Nallahs & Sources
90
Details of individual nallahs contributing to Vakola in terms of major anions other than chlorides
are presented in Figure 6.10 for a more elaborate view.
6.3.3 Major Parameters Contributing & Representing Cations in Vakola Nallah It is interesting to note that most of the nallahs feeding into Vakola show trends of cations too
very similar to those of the nallahs entering Mithi River and thereby also revealing the probability
that sources to such nallahs are mostly similar in nature and extent with minimum metal
concentrations & several of them being BDL such as Cr+6, Cu, Ni, Cd and Co which further
validates the proposition that these nallahs have minimal industrial source contribution as
represented in Table 6.11. Other metals that do have presence are minimal in concentrations
with average values of 2.9mg/l for Fe, 0.3mg/l for Mn, 0.03mg/l for Pb and 0.8mg/l for Zn and as
in all other cases Fe is the maximum available metal in rivulets of Vakola nallahs too as
presented in Figure 6.11.Comparing to Public Sewer Discharge Standards, for prescribed
metals they are well within the limits and thereby do not pose any critical cause of concern.
Table 6.11 Statistical Analysis of Cationic Parameters of Vakola Nallah during
Monsoon
Parameters Minimum Maximum Average SD Std. (PS- b) Cr+6(mg/l) BDL BDL BDL BDL 2.0
Cu (mg/l) BDL 0.1 BDL BDL 3.0
Fe (mg/l) 0.5 7.9 2.9 2.0 NA
Pb (mg/l) BDL 0.3 0.03 0.1 1.0
Mn (mg/l) BDL 1.1 0.3 0.3 NA
Ni (mg/l) BDL BDL BDL BDL 3.0
Cd (mg/l) BDL BDL BDL BDL 1.0
CO (mg/l) BDL BDL BDL BDL NA
Zn (mg/l) BDL 0.8 0.1 0.2 15.0
6.3.4 Special Parameters Representing Characters of Vakola Nallah Statistical analysis of rivulets contributing to Vakola nallah are presented in Table 6.12 which
shows very high MPN counts only in one of the samples whereas averaging about
12408Col/100ml though not in all of the nallahs obviously due to the domestic wastewater
inputs. Phenols show average concentration of 0.01 much below the prescribed standards.
Trends in rivulets of Vakola are given in Figure 6.12. Table 6.12 Statistical Analysis of Special Parameters of Vakola Nallah during Monsoon

Comprehensive Study of Mithi River Polluted Stretches Chapter VI Physico-chemical Characterization of Mithi River, Nallahs & Sources
91
Parameters Minimum Maximum Average SD Std. (PS - b) Phenols (mg/l) BDL 0.1 BDL BDL 1.0
MPN (Col/100ml) 345.0 71600.0 3631.2 12408.8 10 (IS10500)

Comprehensive Study of Mithi River Polluted Stretches Chapter VI Physico-chemical Characterization of Mithi River, Nallahs & Sources
92
Figure 6.10 Parameters Contributing and Representing Anions in Vakola Nallah
0.00
20.00
40.00
60.00
80.00
100.00
120.00
140.00
160.00
180.00
200.00
0.00
500.00
1000.00
1500.00
2000.00
2500.00
3000.00
3500.00
1 2 3 4 5 6 7 8 9 10 11 12 13 14 15 16 17 18 19 20 21 22 23 24 25 26 27 28 29 30 31 32
mg/
l
Conc
.(mg/
l)
Nallahs in Vakola
SO4 PO4 NO3
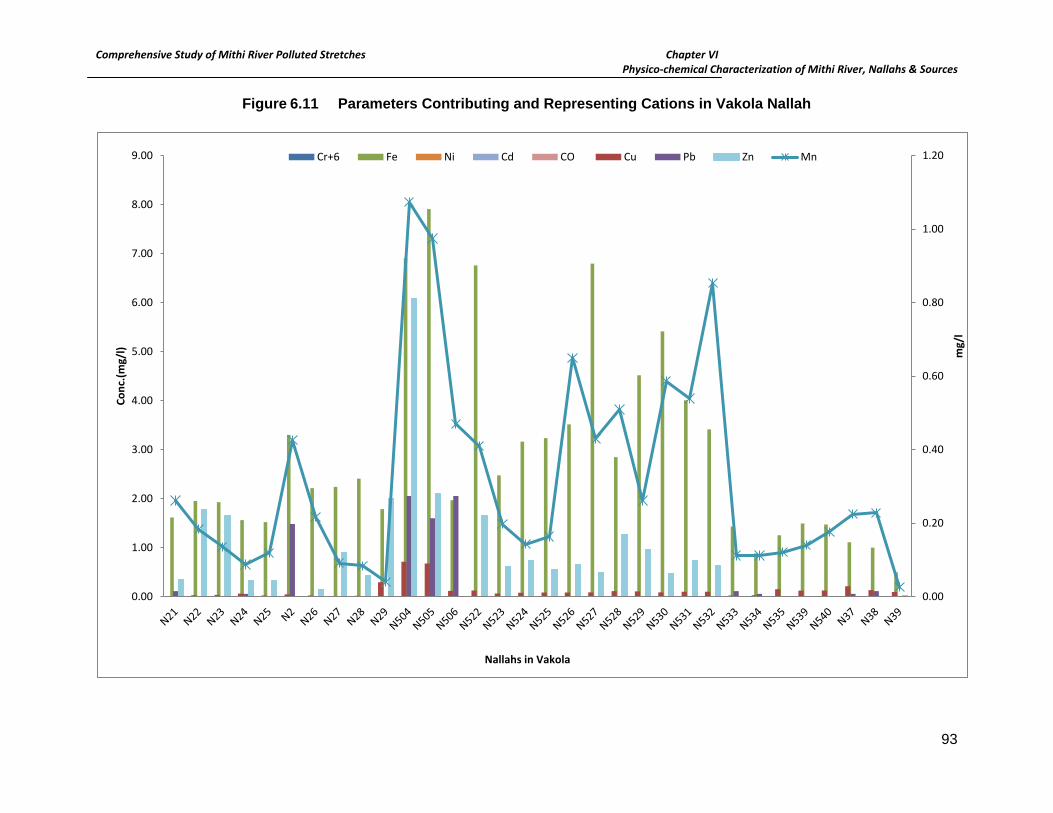
Comprehensive Study of Mithi River Polluted Stretches Chapter VI Physico-chemical Characterization of Mithi River, Nallahs & Sources
93
Figure 6.11 Parameters Contributing and Representing Cations in Vakola Nallah
0.00
0.20
0.40
0.60
0.80
1.00
1.20
0.00
1.00
2.00
3.00
4.00
5.00
6.00
7.00
8.00
9.00
mg/
l
Conc
.(mg/
l)
Nallahs in Vakola
Cr+6 Fe Ni Cd CO Cu Pb Zn Mn

Comprehensive Study of Mithi River Polluted Stretches Chapter VI Physico-chemical Characterization of Mithi River, Nallahs & Sources
94
Figure 6.12 Special Parameters Representing Characters of Vakola Nallah
0
0.02
0.04
0.06
0.08
0.1
0.12
0.14
0
10000
20000
30000
40000
50000
60000
70000
80000
1 2 3 4 5 6 7 8 9 10 11 12 13 14 15 16 17 18 19 20 21 22 23 24 25 26 27 28 29 30 31 32
Conc
.(mg/
l)
Nallahs in vakola
MPN/100 ml Phenol
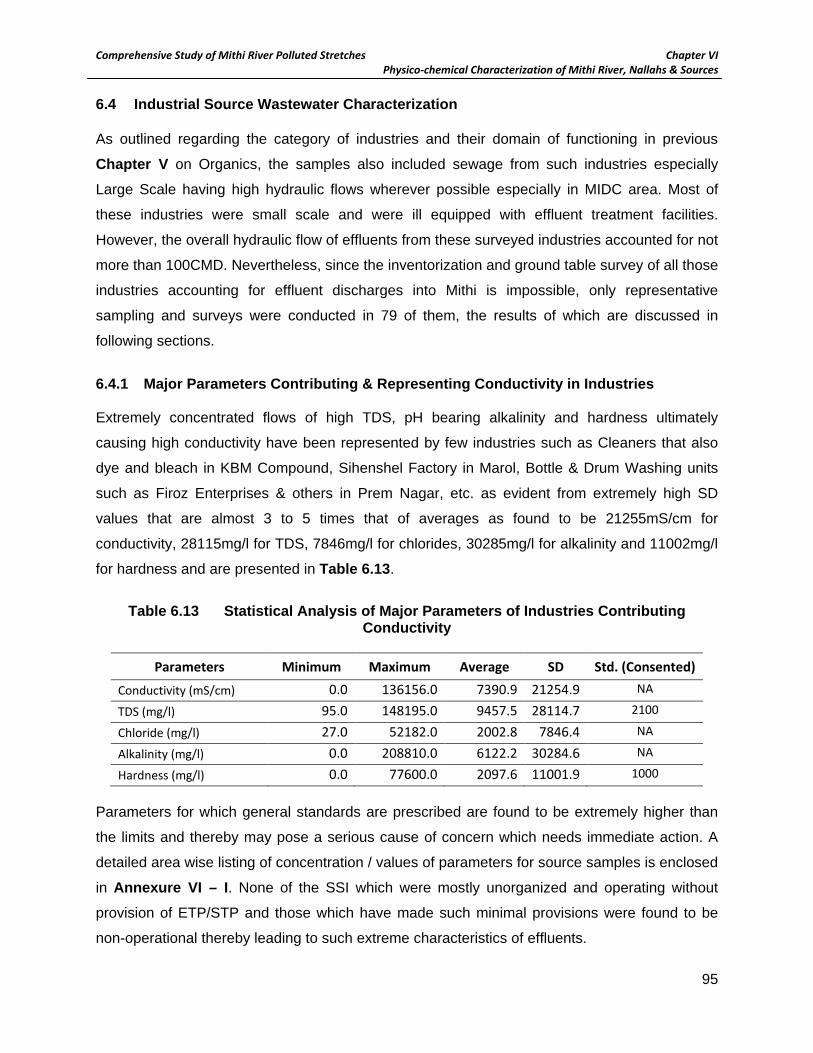
Comprehensive Study of Mithi River Polluted Stretches Chapter VI Physico-chemical Characterization of Mithi River, Nallahs & Sources
95
6.4 Industrial Source Wastewater Characterization As outlined regarding the category of industries and their domain of functioning in previous
Chapter V on Organics, the samples also included sewage from such industries especially
Large Scale having high hydraulic flows wherever possible especially in MIDC area. Most of
these industries were small scale and were ill equipped with effluent treatment facilities.
However, the overall hydraulic flow of effluents from these surveyed industries accounted for not
more than 100CMD. Nevertheless, since the inventorization and ground table survey of all those
industries accounting for effluent discharges into Mithi is impossible, only representative
sampling and surveys were conducted in 79 of them, the results of which are discussed in
following sections.
6.4.1 Major Parameters Contributing & Representing Conductivity in Industries Extremely concentrated flows of high TDS, pH bearing alkalinity and hardness ultimately
causing high conductivity have been represented by few industries such as Cleaners that also
dye and bleach in KBM Compound, Sihenshel Factory in Marol, Bottle & Drum Washing units
such as Firoz Enterprises & others in Prem Nagar, etc. as evident from extremely high SD
values that are almost 3 to 5 times that of averages as found to be 21255mS/cm for
conductivity, 28115mg/l for TDS, 7846mg/l for chlorides, 30285mg/l for alkalinity and 11002mg/l
for hardness and are presented in Table 6.13.
Table 6.13 Statistical Analysis of Major Parameters of Industries Contributing
Conductivity
Parameters Minimum Maximum Average SD Std. (Consented)
Conductivity (mS/cm) 0.0 136156.0 7390.9 21254.9 NA
TDS (mg/l) 95.0 148195.0 9457.5 28114.7 2100
Chloride (mg/l) 27.0 52182.0 2002.8 7846.4 NA
Alkalinity (mg/l) 0.0 208810.0 6122.2 30284.6 NA
Hardness (mg/l) 0.0 77600.0 2097.6 11001.9 1000
Parameters for which general standards are prescribed are found to be extremely higher than
the limits and thereby may pose a serious cause of concern which needs immediate action. A
detailed area wise listing of concentration / values of parameters for source samples is enclosed
in Annexure VI – I. None of the SSI which were mostly unorganized and operating without
provision of ETP/STP and those which have made such minimal provisions were found to be
non-operational thereby leading to such extreme characteristics of effluents.

Comprehensive Study of Mithi River Polluted Stretches Chapter VI Physico-chemical Characterization of Mithi River, Nallahs & Sources
96
6.4.2 Major Parameters Contributing & Representing Anionic Parameters in Industries In terms of sulphates the concentrations are found to be comparatively high averaging
3196.5mg/l though only 2 of the industrial units i.e. Sihenshel Factory with 48369mg/l in Marol
and Firoz Enterprises with 29990mg/l in Prem Nagar of BKC are responsible for most of the
high sulphate average values. All others show concentrations below 1000mg/l. Phosphates too
are found to be highest in Sihenshel Factory though the averages are aligned at 34.9mg/l.
Average concentration of Nitrates is found to be 7mg/l. It is evident that only 2 or 3 responsible
industries with extremely concentrated outlets and minimal hydraulic flows as seen from
extremely high SD values stated in Table 6.14 results in such extreme behavior of anions and
shall be considered in isolation since the low hydraulic flow gets highly diluted in the overall
4700MLD wastewater in Mithi River which are mostly fed by nallahs from adjoining area and
shall not be confused with the behavior and concentration of same in the river which mainly is
resembles tidal influence as discussed in Chapter VIII of this report.
Table 6.14 Statistical Analysis of Anionic Parameters of Industries
Parameters Minimum Maximum Average SD Std. (Consented)
SO4(mg/l) 0.0 48369.0 3196.5 8704.6 NA
PO4(mg/l) 0.0 224.0 13.7 34.9 NA NO3(mg/l) 0.0 141.0 7.0 25.1 NA
6.4.3 Major Parameters Contributing & Representing Cationic Parameters in Industries Though the consent conditions stipulated may vary from case to case, a generic concentration
standard as applicable for Inland Water Discharges are used to compare the industrial source
water. Ideally Load Based Standards are more applicable but being unorganized sector and
limited data sharing by these industries, the authors are left with no choice but to use the best
available information for such comparison. Interestingly as it is expected to be the case, Cr+6&
Co are absent even in those industrial samples analyzed from industries whereas Pb is found to
be above the prescribed limits of Inland Surface Water Criteria. Metal concentration presented
in Table 6.15 shows average values of 0.5mg/l for Cu, 5.4mg/l for Fe, 0.5mg/l for Mn, 0.6 for Ni,
0.01 for Cd and 0.5mg/l for Zn. All these metals are found to be lower than the selected
standards for comparison though sporadic instances of such metal discharges cannot be ruled
out as seen by their respective maxima which thereby also confirm the main source of these
metals into Mithi to be centered amongst industries especially surface cleaning, plating and
washing / cleaning.
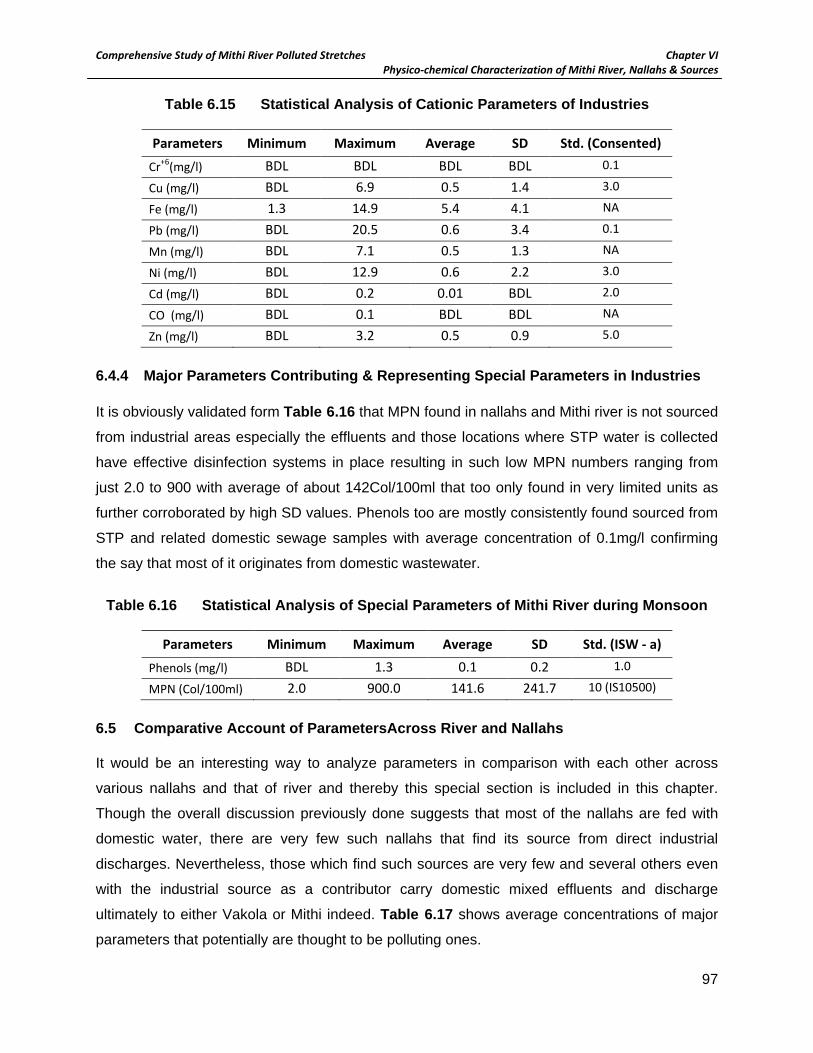
Comprehensive Study of Mithi River Polluted Stretches Chapter VI Physico-chemical Characterization of Mithi River, Nallahs & Sources
97
Table 6.15 Statistical Analysis of Cationic Parameters of Industries
Parameters Minimum Maximum Average SD Std. (Consented)
Cr+6(mg/l) BDL BDL BDL BDL 0.1
Cu (mg/l) BDL 6.9 0.5 1.4 3.0
Fe (mg/l) 1.3 14.9 5.4 4.1 NA
Pb (mg/l) BDL 20.5 0.6 3.4 0.1
Mn (mg/l) BDL 7.1 0.5 1.3 NA
Ni (mg/l) BDL 12.9 0.6 2.2 3.0
Cd (mg/l) BDL 0.2 0.01 BDL 2.0
CO (mg/l) BDL 0.1 BDL BDL NA
Zn (mg/l) BDL 3.2 0.5 0.9 5.0
6.4.4 Major Parameters Contributing & Representing Special Parameters in Industries It is obviously validated form Table 6.16 that MPN found in nallahs and Mithi river is not sourced
from industrial areas especially the effluents and those locations where STP water is collected
have effective disinfection systems in place resulting in such low MPN numbers ranging from
just 2.0 to 900 with average of about 142Col/100ml that too only found in very limited units as
further corroborated by high SD values. Phenols too are mostly consistently found sourced from
STP and related domestic sewage samples with average concentration of 0.1mg/l confirming
the say that most of it originates from domestic wastewater.
Table 6.16 Statistical Analysis of Special Parameters of Mithi River during Monsoon
Parameters Minimum Maximum Average SD Std. (ISW - a)
Phenols (mg/l) BDL 1.3 0.1 0.2 1.0
MPN (Col/100ml) 2.0 900.0 141.6 241.7 10 (IS10500)
6.5 Comparative Account of ParametersAcross River and Nallahs It would be an interesting way to analyze parameters in comparison with each other across
various nallahs and that of river and thereby this special section is included in this chapter.
Though the overall discussion previously done suggests that most of the nallahs are fed with
domestic water, there are very few such nallahs that find its source from direct industrial
discharges. Nevertheless, those which find such sources are very few and several others even
with the industrial source as a contributor carry domestic mixed effluents and discharge
ultimately to either Vakola or Mithi indeed. Table 6.17 shows average concentrations of major
parameters that potentially are thought to be polluting ones.

Comprehensive Study of Mithi River Polluted Stretches Chapter VI Physico-chemical Characterization of Mithi River, Nallahs & Sources
98
Taking ahead the discussion of Chapter V regarding use of unconventional concept of ratio of
River : Nallah : Vakola Nallah : industry to reflect proximities of parameters, Table 6.17 depicts
those that represent and/or contribute to conductivity sources across samples. Interestingly
none of the ratio shows direct proximity to river TDS & chlorides and thereby other such source
such as tidal influence has been considered as more appropriate contributor. However, alkalinity
finds its analytically proximate partner in both nallahs that directly enter Mithi as well as those
contributing to Vakola ultimately leading into Mithi River. Hardness on other hand similar to
chlorides and TDS shows other such source in river which probably can be attributed only to
tidal influence in this case.
Table 6.17 Comparative Account of Parameters Contributing and Representing
Conductivity
Parameters River Nallahs into Mithi Nallah into Vakola Industries TDS (mg/l) 5303.4 2479.1 1478.7 9457.5
TDSRatio of River:Nallah:Vakola:Industry 1.00 : 2.14 : 0.28: 0.56 Chloride (mg/l) 2880.0 748.4 614.1 2002.8
ChlorideRatio of River:Nallah:Vakola:Industry 1.00 : 3.85 : 0.21: 1.44 Alkalinity (mg/l) 230.7 249.6 244.3 6122.2
AlkalinityRatio of River:Nallah:Vakola:Industry 1.00 : 0.92 : 1.06 : 0.04 Hardness (mg/l) 845.5 422.9 243.4 2097.6
HardnessRatio of River:Nallah:Vakola:Industry 1.00 : 2.00 : 0.29 : 0.40 For anions, it seems that all the proximate source contribution comes from nallahs with almost
ratios ranging from 0.75 for PO4 to 1.12 & 1.19 for NO3 and SO4 in nallahs leading into Mithi
River though there is still some scope for inclusion of sources other than these direct ones as
have been discussed earlier especially to represent sulphates from sea water intrusion.
Industrial sources & nallahs leading to Vakola’s contribution seems to be minimal in case of
anions and are seem to be not even distantly correlated as seen from Table 6.18.
Table 6.18 Comparative Account of Anions
Parameters River Nallahs into Mithi Nallah into Vakola Industries
SO4 (mg/l) 917.7 771.4 504.0 3196.5
SO4 Ratio of River:Nallah:Vakola:Industry 1.00 : 1.19 : 0.55 : 0.29 PO4 (mg/l) 12.1 16.2 32.2 13.7
PO4Ratio of River:Nallah:Vakola:Industry 1.00 : 0.75 : 2.66 : 0.88 NO3 (mg/l) 0.19 0.17 0.06 7.0
NO3Ratio of River:Nallah:Vakola:Industry 1.00 : 1.12: 0.32 : 0.03

Comprehensive Study of Mithi River Polluted Stretches Chapter VI Physico-chemical Characterization of Mithi River, Nallahs & Sources
99
Since the concentration of metals is already pretty low and as discussed in the earlier sections
of this chapter the sources of metals are mainly from industries, it would not be appropriate to
apply the ratios method since metals are of recalcitrant nature and thereby may find its way to
persist through the sections from source to the end point of Mithi. Thereby in this case more the
concentration at source, more is the correlation established in terms of contribution. As
presented in Table 6.19 almost all the metals show higher concentration in industrial samples
than those compared to river, nallahs directly discharging to Mithi and those of Vakola except
for Fe which may have natural origins or are generated during transfer due to leaching.
Table 6.19 Comparative Account of Cations
Parameters River Nallahs into Mithi Nallah into Vakola Industries
Cr+6 (mg/l) BDL BDL BDL 0.01 Cu (mg/l) 0.05 0.06 0.02 1.40 Fe (mg/l) 7.60 10.64 2.89 4.14 Pb (mg/l) 0.13 0.06 0.03 3.36 Mn (mg/l) 0.59 0.98 0.31 1.28 Ni (mg/l) 0.06 BDL BDL 2.19 Cd (mg/l) BDL BDL BDL 0.04 CO (mg/l) BDL BDL BDL 0.01 Zn(mg/l) 7.53 0.44 0.10 0.91
Similar to the cations, phenols & MPN do not show proximity to their counterparts in any
possible way though the convention regarding same would be to have perfect proximities
between river and nallahs carrying raw sewage. However, the point has been already discussed
earlier describing open defecation finding its route to river water and thereby sources other than
nallahs contribute to MPN as seen from Table 6.20. Similarly phenols too do not find any
proximate source contributing to river though higher average concentration in industries may be
thought as one of the sources in terms of persistent nature of phenols though sewage water too
seems to be more proximate than industrial sources but since the concentrations are extremely
low it may not be a cause of concern.
Table 6.20 Comparative Account of Special Characteristics
Parameters River Nallahs into Mithi Nallah into Vakola Industries
Phenol (mg/l) 0.04 0.08 0.01 0.1 Phenol Ratio of River : Nallah : Vakola : Industry 1.00 : 2.00 : 0.25 : 2.50
MPN (Col/100 ml) 8027.6 817.9 3631.2 141.6 MPN Ratio of River : Nallah : Vakola : Industry 1.00 : 0.10 :0.45 : 0.01
Comprehensive Study of Mithi River Polluted Stretches Chapter VII Criticality Index for Mithi River Stretches
Chapter VII
7.0 Background .......................................................................................................................... 100
7.1 Assumptions and Baselines ............................................................................................. 101
7.1.1 Weights Assigned to Parameters .................................................................................. 102
7.1.2 Color coding .................................................................................................................. 103
7.2 Stretch-wise Criticality of Mithi .......................................................................................... 104
7.2.1 Stretch I - Vihar Lake to Filterpada ............................................................................ 104
7.2.2 Stretch II Filterpada to Gautam Nagar ...................................................................... 105
7.2.3 Stretch III Gautam Nagar to JVLR Bridge ................................................................. 106
7.2.4 Stretch IV - JVLR to Bamandaya Pada ..................................................................... 107
7.2.5 Stretch V –Bamandaya Pada to KBM Compound ..................................................... 108
7.2.6 Stretch VI - KBM Compound to Marol ....................................................................... 109
7.2.7 Stretch VII - Marol to Sakhinaka ................................................................................ 109
7.2.8 Stretch VIII - Sakhinaka to Domestic Airport ............................................................. 111
7.2.9 Stretch IX - Domestic Airport to Safed Pool .............................................................. 112
7.2.10 Stretch X - Safed Pool to BMK Compound ............................................................... 112
7.2.11 Stretch XI - BMK Compound to CST Bridge ............................................................. 113
7.2.12 Stretch XII - CST to MTNL Bridge ............................................................................. 114
7.2.13 Stretch XIII - MTNL Bridge to Bandra-Kurla Complex(BKC) ..................................... 114
7.2.14 Stretch XIV –Vakola Nallah ....................................................................................... 115
7.2.15 Stretch XV - BKC to Kalanagar ................................................................................. 117
7.2.16 Stretch XVI - Kalanagar to Mahim ............................................................................. 117
List of Tables
Table 7.1 Standard Limits for river ............................................................................................ 101 Table 7.2 Standard Limits for Nallahs ....................................................................................... 101 Table 7.3 Weights Assigned in Rating of Parameters using AHP ............................................. 103 Table 7.4 Color coding for criticality of the river stretches ......................................................... 104 Table 7.5 Summary of Criticality along Mithi River .................................................................... 119
List of Figures
Figure 7.1 Criticality of Stretch I Origin to Filterpada .................................................................. 105
Figure 7.2 Criticality of Stretch II – Filterpada to Gautam Nagar ................................................ 106
Figure 7.3 Criticality of Stretch III – Gautam Nagar to JVLR Bridge ........................................... 107
Figure 7.4 Criticality of Stretch IV – JVLR to BamandayaPada .................................................. 108
Figure 7.5 Criticality of Stretch V – BamandayaPada to KBM Compound ................................. 109
Figure 7.6 Criticality of Stretch VI – KBM Compound to Marol ................................................... 110

Comprehensive Study of Mithi River Polluted Stretches Chapter VII Criticality Index for Mithi River Stretches
Figure 7.7 Criticality of Stretch VII – Marol to Sakhinaka ........................................................... 110
Figure 7.8 Criticality of the Stretch VIII – Sakhinaka to Domestic Airport ................................... 111
Figure 7.9 Criticality in Stretch IX – Domestic Airport to Safed Pool .......................................... 112
Figure 7.10 Criticality in Stretch X – Safed Pool to BMK Compound ........................................ 113
Figure 7.11 Criticality of Stretch XI – BMK Compound to CST Bridge ..................................... 114
Figure 7.12 Criticality of Stretch XII – CST to MTNL Bridge ..................................................... 114
Figure 7.14 Criticality of Stretch XIV – Vakola Nallah ............................................................... 116
Figure 7.15 Criticality in stretch XV – BKC to Kalanagar .......................................................... 117
Figure 7.16 Criticality in stretch XVI – Kalanagar to Mahim ...................................................... 118
Comprehensive Study of Mithi River Polluted Stretches Chapter VII Criticality Index for Mithi River Stretches
100
Chapter VII Criticality Index for Mithi River Stretches
7.0 Background Physico-chemical and biological analysis for about 270 samples of river, nallahs and industrial /
domestic sources were carried out during the entire study of 3 seasons with maximum insight to
thorough investigation during per-monsoon period of May 2014. The results of the same are
outlined and discussed in detailed in various Chapters of this report. Nevertheless, the authors of
this report have resorted to interpreting analysis data in simpler form for making the decision
making process easier and for more effective communication of such enormous data in numerical
form to be used by even laymen and to further assess the extent of pollution and prioritize
conservation management plan for each individual stretches of Mithi based on criticality of that
particular region. An attempt has been made to develop Mithi specific criticality indices for each
stretch to represent relative pollution potential within the 15km river along with providing significant
environmental determinants of every stretch that are probably responsible for contribution to the
varying loads.
These criticality indices are representations of parameters responsible for pollution in each of the
stretch based on applicable / available standards of discharge, background information and
concentrations in similar studies of surface water bodies and toxicity of parameters. Though not all
the parameters have been considered in this particular study for the ease of representation &
computation, the criticality indices are categorized into 2 subsets viz. Organics that include BOD,
COD, Total suspended solids and oil & grease and Cations comprising of all heavy metals. Weights
are assigned to each parameter depending on its environmental significance in terms of pollution
potential, toxicity, background concentration, Desirable / Prescribed Standards wherever possible
and other such review characteristics using Analytical Hierarchical Process. Scaling of the
monitored value of particular parameter is then distributed within the appropriate weight resulting in
score of individual parameter. These are ultimately used to derive Indices that represent sum total
of overall rating of the stretch considering each analysis parameter and finally presented as color
codes set up to indicate the pollution extent in each stretch.
Ultimately this whole complex exercise is concluded in form of a simple & visually self-explanatory
Map of River indicating the color code based relative criticality in the virtual 1km classification
domain used throughout this chapter for representation of Mithi River thereby anticipated to provide
insight of critical patches of river and parameters responsible to prioritize management needs of a
particular stretch and significant pollutant / source in an elaborate way.

Comprehensive Study of Mithi River Polluted Stretches Chapter VII Criticality Index for Mithi River Stretches
101
7.1 Assumptions and Baselines In order to develop the criticality indices, the most important basis taken into account was Desirable
Standards as applicable. Criticality is simply dependent on the extent to which particular parameter
is exceeding from its desired concentrations. For the criticality indices of river, Inland Surface Water
Discharge Standards (a) were adopted from Schedule VI of EPA 1986. For nallahs, General
Discharge Standards for Public Sewers (b) have been referred. Table 7.1 indicates the
concentration limits for river while Table 7.2 shows the standards referred for developing indices for
nallahs. Though the General Discharge Standards for COD for Inland Surface Water discharges is
250mg/l, the same has been modified to 100mg/l considering the already existing load of organics
and probable load in future that could lead to causes of concern. All other parameters are used as it
is prescribed in Standards.
Table 7.1 Standard Limits for river
Parameter Standard Limits (mg/l)
Organics BOD 30 COD 100 Organic Load N.A. Oil and Grease 10 Phenols 1 TSS 100 Cations Chromium(Cr+6) 0.1 Copper(Cu) 3.0 Iron(Fe) 3.0 Lead(Pb) 0.1 Manganese(Mn) 2.0 Nickel(Ni) 3.0 Cadmium(Cd) 2.0 Zinc(Zn) 5.0
Table 7.2 Standard Limits for Nallahs
Parameter Standard Limits (mg/l)
Organics BOD 350 COD 250 Oil and Grease 20 Phenols 10 TSS 600 Cations Chromium(Cr+6) 2.0
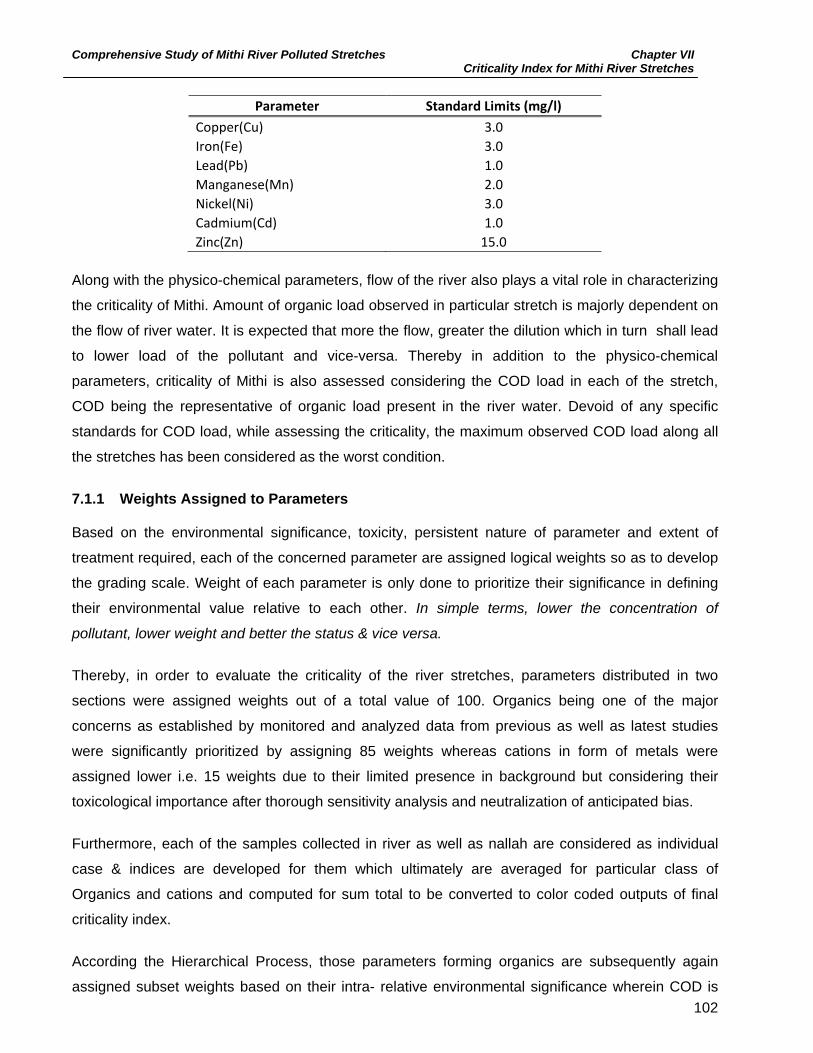
Comprehensive Study of Mithi River Polluted Stretches Chapter VII Criticality Index for Mithi River Stretches
102
Parameter Standard Limits (mg/l) Copper(Cu) 3.0 Iron(Fe) 3.0 Lead(Pb) 1.0 Manganese(Mn) 2.0 Nickel(Ni) 3.0 Cadmium(Cd) 1.0 Zinc(Zn) 15.0
Along with the physico-chemical parameters, flow of the river also plays a vital role in characterizing
the criticality of Mithi. Amount of organic load observed in particular stretch is majorly dependent on
the flow of river water. It is expected that more the flow, greater the dilution which in turn shall lead
to lower load of the pollutant and vice-versa. Thereby in addition to the physico-chemical
parameters, criticality of Mithi is also assessed considering the COD load in each of the stretch,
COD being the representative of organic load present in the river water. Devoid of any specific
standards for COD load, while assessing the criticality, the maximum observed COD load along all
the stretches has been considered as the worst condition.
7.1.1 Weights Assigned to Parameters Based on the environmental significance, toxicity, persistent nature of parameter and extent of
treatment required, each of the concerned parameter are assigned logical weights so as to develop
the grading scale. Weight of each parameter is only done to prioritize their significance in defining
their environmental value relative to each other. In simple terms, lower the concentration of
pollutant, lower weight and better the status & vice versa.
Thereby, in order to evaluate the criticality of the river stretches, parameters distributed in two
sections were assigned weights out of a total value of 100. Organics being one of the major
concerns as established by monitored and analyzed data from previous as well as latest studies
were significantly prioritized by assigning 85 weights whereas cations in form of metals were
assigned lower i.e. 15 weights due to their limited presence in background but considering their
toxicological importance after thorough sensitivity analysis and neutralization of anticipated bias.
Furthermore, each of the samples collected in river as well as nallah are considered as individual
case & indices are developed for them which ultimately are averaged for particular class of
Organics and cations and computed for sum total to be converted to color coded outputs of final
criticality index.
According the Hierarchical Process, those parameters forming organics are subsequently again
assigned subset weights based on their intra- relative environmental significance wherein COD is
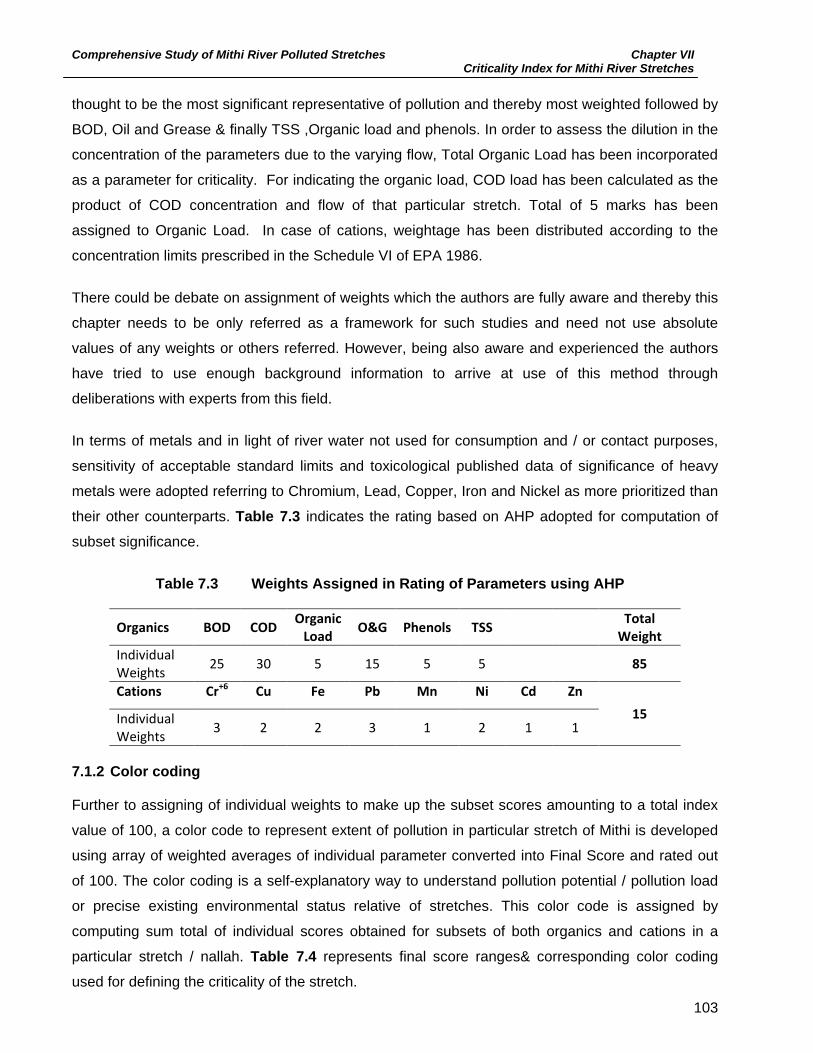
Comprehensive Study of Mithi River Polluted Stretches Chapter VII Criticality Index for Mithi River Stretches
103
thought to be the most significant representative of pollution and thereby most weighted followed by
BOD, Oil and Grease & finally TSS ,Organic load and phenols. In order to assess the dilution in the
concentration of the parameters due to the varying flow, Total Organic Load has been incorporated
as a parameter for criticality. For indicating the organic load, COD load has been calculated as the
product of COD concentration and flow of that particular stretch. Total of 5 marks has been
assigned to Organic Load. In case of cations, weightage has been distributed according to the
concentration limits prescribed in the Schedule VI of EPA 1986.
There could be debate on assignment of weights which the authors are fully aware and thereby this
chapter needs to be only referred as a framework for such studies and need not use absolute
values of any weights or others referred. However, being also aware and experienced the authors
have tried to use enough background information to arrive at use of this method through
deliberations with experts from this field.
In terms of metals and in light of river water not used for consumption and / or contact purposes,
sensitivity of acceptable standard limits and toxicological published data of significance of heavy
metals were adopted referring to Chromium, Lead, Copper, Iron and Nickel as more prioritized than
their other counterparts. Table 7.3 indicates the rating based on AHP adopted for computation of
subset significance.
Table 7.3 Weights Assigned in Rating of Parameters using AHP
Organics BOD COD Organic Load O&G Phenols TSS Total
Weight Individual Weights 25 30 5 15 5 5 85
Cations Cr+6 Cu Fe Pb Mn Ni Cd Zn 15 Individual
Weights 3 2 2 3 1 2 1 1
7.1.2 Color coding Further to assigning of individual weights to make up the subset scores amounting to a total index
value of 100, a color code to represent extent of pollution in particular stretch of Mithi is developed
using array of weighted averages of individual parameter converted into Final Score and rated out
of 100. The color coding is a self-explanatory way to understand pollution potential / pollution load
or precise existing environmental status relative of stretches. This color code is assigned by
computing sum total of individual scores obtained for subsets of both organics and cations in a
particular stretch / nallah. Table 7.4 represents final score ranges& corresponding color coding
used for defining the criticality of the stretch.

Comprehensive Study of Mithi River Polluted Stretches Chapter VII Criticality Index for Mithi River Stretches
104
Table 7.4 Color coding for criticality of the river stretches
Marking Out of 100 Color Interpretation
Good 0-20 Green When all parameters are below 30% of the standards
Average 21-40 Blue when BOD &COD between 30-60% of standards and all others within standards
Bad 41-60 Orange BOD & COD are 60-90% of the standards and few others may be beyond standards
Worst 61-80 Pink All beyond standards but below 1.2 times OR both BOD and COD are beyond 1.2 times and few others are just reaching the standards
Critical 81-100 Red All the parameters are beyond 1.2 times standards Red color indicates the critical pollution status of the stretch / nallah which has to be given major
priority in order to mitigate and control the pollution while green represents the least polluted
stretch. Blue, Orange and pink colors are representing the gradual degradation in the river water
and increase in the pollution load respectively. In simple terms, lower the final rating lower the
pollution and greener the colour of nallah/stretch. The colour also presents categorization of
pollution into 5 different aspects ranging from Good to Critical.
7.2 Stretch-wise Criticality of Mithi Assigning the weights, scoring & rating of individual nallah & river stretch was done, ultimately
leading to compilation of criticality indices for each of them accordingly and the corresponding color
coding is incorporated in the Google Images to visually represent the existing pollution status.
7.2.1 Stretch I - Vihar Lake to Filterpada As described in earlier chapters, only one sample of river was able to be collected in this stretch as
the flow was miniscule. For the collected sample, criticality indices calculated value of indices is
found to be 69.5 out of 100 which suggests that the Stretch I falls in the Worst category appearing
Pink coloured as represented in the Figure 7.1.

Comprehensive Study of Mithi River Polluted Stretches Chapter VII Criticality Index for Mithi River Stretches
105
Figure 7.1 Criticality of Stretch I Vihar Lake to Filterpada
7.2.2 Stretch II Filterpada to Gautam Nagar In the Stretch II, criticality indices were calculated for the 4 river samples with score of 61 upstream
and 80.9 downstream of the river. Accordingly stretch is appearing Light Pink which gets converted
in the lighter shade of Red/Dark Pink from upstream to downstream as shown in Figure 7.2. Total
of seven nallahs has been sampled in this stretch. Corresponding color coding of those nallahs is
shown in Figure 7.2.
Out of 7 nallahs, two nallahs have been indicated by Orange color and two are by Pink which need
immediate intervention. Three of these nallahs are indicated as Blue colored representing average
levels of pollution with one being extremely Light Blue coloured.

Comprehensive Study of Mithi River Polluted Stretches Chapter VII Criticality Index for Mithi River Stretches
106
Figure 7.2 Criticality of Stretch II – Filterpada to Gautam Nagar
Pollution levels downstream of the stretch, seems to be slightly increased as compared to the
upstream location.
7.2.3 Stretch III Gautam Nagar to JVLR Bridge Figure 7.3 depicts the color coding of the Stretch III depending on the criticality indices developed
suggesting pollution levels gradually changing from Average to Bad category.
Out of those four nallahs, two are represented as Pink colored being Worst polluted indicating
severely polluted wastewater discharges might be probably carrying industrial wastewater mixed
with domestic. Other one at the downstream of bridge is Blue colored suggesting Average pollution
load. Upstream of JVLR Bridge, one of the nallahs is seen as Blue colored revealing that it is
possibly carrying domestic wastewater representing characters well within the standards.

Comprehensive Study of Mithi River Polluted Stretches Chapter VII Criticality Index for Mithi River Stretches
107
Figure 7.3 Criticality of Stretch III – Gautam Nagar to JVLR Bridge
7.2.4 Stretch IV - JVLR to Bamandaya Pada From downstream of JVLR, pollution levels seem to be gradually decreasing towards the
downstream of Stretch IV i.e. at Bamandaya Pada Bridge represented in Dark Pink at upstream
gradually turning into Orange downstream probably due to excessively diluted streams of domestic
inputs as presented in Figure 7.4.
In this stretch, out of the four nallahs entering river, 2 are indicated by Blue color with moderate
pollution levels whereas 1 is Light Blue coloured indicating less pollution load. One open nallah
entering river from right bank probably carrying sewage from the nearby residential area is found
relatively less polluted than others in this stretch being “Good” in terms of index.
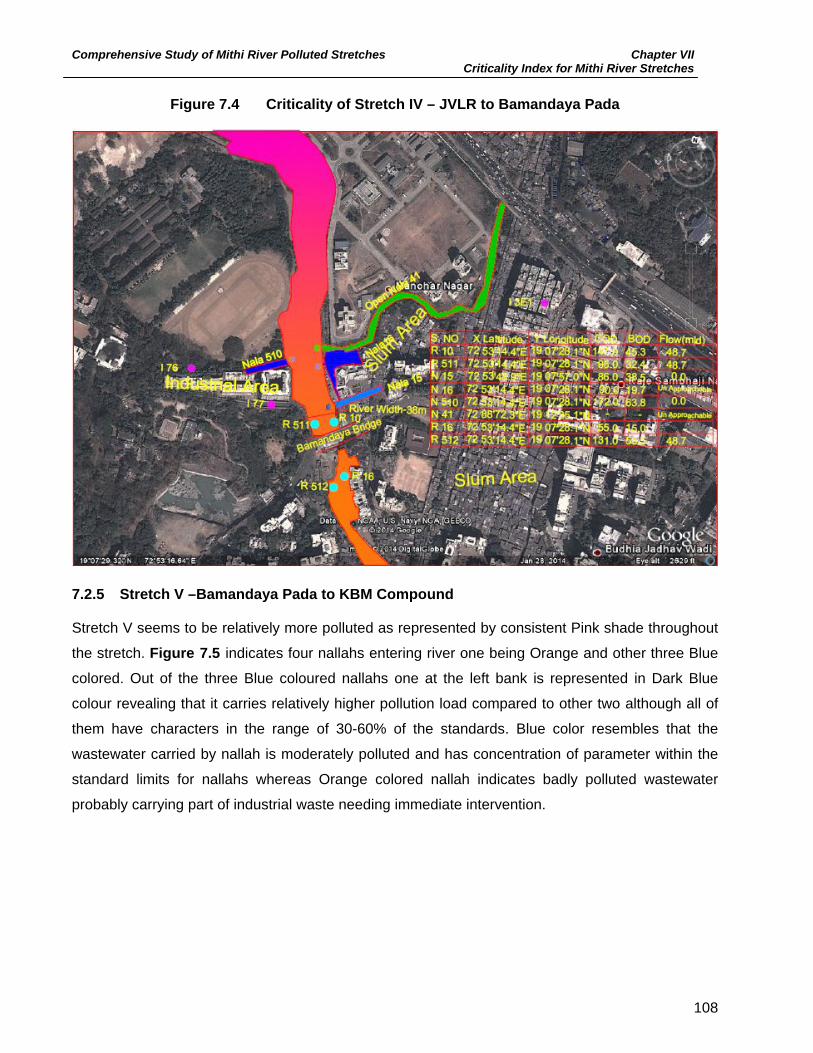
Comprehensive Study of Mithi River Polluted Stretches Chapter VII Criticality Index for Mithi River Stretches
108
Figure 7.4 Criticality of Stretch IV – JVLR to Bamandaya Pada
7.2.5 Stretch V –Bamandaya Pada to KBM Compound Stretch V seems to be relatively more polluted as represented by consistent Pink shade throughout
the stretch. Figure 7.5 indicates four nallahs entering river one being Orange and other three Blue
colored. Out of the three Blue coloured nallahs one at the left bank is represented in Dark Blue
colour revealing that it carries relatively higher pollution load compared to other two although all of
them have characters in the range of 30-60% of the standards. Blue color resembles that the
wastewater carried by nallah is moderately polluted and has concentration of parameter within the
standard limits for nallahs whereas Orange colored nallah indicates badly polluted wastewater
probably carrying part of industrial waste needing immediate intervention.

Comprehensive Study of Mithi River Polluted Stretches Chapter VII Criticality Index for Mithi River Stretches
109
Figure 7.5 Criticality of Stretch V – Bamandaya Pada to KBM Compound
7.2.6 Stretch VI - KBM Compound to Marol Stretch VI beginning from downstream of KBM Compound and extending upto Marol is indicated
with Dark Blue colour at upstream and Orange color shade at the downstream revealing that the
pollution levels in this stretch are increasing as the nallah entering into the river.
As seen from Figure 7.6 the nallah entering right bank of the river probably includes partial
discharges from industrial zones mixed with domestic wastewater as shown in Orange color is also
confirmed from the survey details of this area.
7.2.7 Stretch VII - Marol to Sakhinaka The Stretch VII of Mithi as shown in Figure 7.7 suggests gradual increase in pollution from
upstream to downstream. At the upstream of the stretch represented by Blue color reveals
existence of lower levels of pollution which probably is because of the extensive load of diluted
sewage entering from various sections of the upstream nallahs thereby leading to concentrations of
parameters ranging around half of the standards prescribed in the Table 7.1.

Comprehensive Study of Mithi River Polluted Stretches Chapter VII Criticality Index for Mithi River Stretches
110
Figure 7.6 Criticality of Stretch VI – KBM Compound to Marol
Figure 7.7 Criticality of Stretch VII – Marol to Sakhinaka

Comprehensive Study of Mithi River Polluted Stretches Chapter VII Criticality Index for Mithi River Stretches
111
At the downstream, the color is changed to Pink which indicates the increasing pollution load in the
stretch through nallahs joining river. Out of the 6 nallahs entering, two are indicated by Green color
suggesting least polluted effluent being carried by them & probably comprising of lower
concentrations of almost all the parameters. Two nallahs are seen as Orange colored suggests
industrial sources mixed wastewater polluted enough to further add to the pollution load in river
whereas remaining 2 seen as Blue colored probably carry sewage from the nearby slum areas and
has relatively low concentrations of organics and cations as compared to Orange coloured nallahs
in this stretch.
7.2.8 Stretch VIII - Sakhinaka to Domestic Airport As presented in Stretch VIII, pollution levels are Bad at upstream as represented with Orange color.
However, as the river flows towards downstream, it gets converted in Pink indicating addition of
pollution load in the river to the point of making it Worst, the precise sources of same could not be
identified. One nallah entering the river from its left bank carrying treated sewage from sewage
treatment facility of Airport as seen in Dark Green color indicating that the pollution load is minimal
as presented in Figure 7.8.
Figure 7.8 Criticality of the Stretch VIII – Sakhinaka to Domestic Airport

Comprehensive Study of Mithi River Polluted Stretches Chapter VII Criticality Index for Mithi River Stretches
112
7.2.9 Stretch IX - Domestic Airport to Safed Pool Stretch IX starts at the Airport and extends upto the downstream of Safed Pool Bridge. In this
stretch, open nallah of Safed Pool is adding considerable hydraulic load as represented in the
Figure 7.9. The entire stretch is indicated by Orange color suggesting that the concentrations of the
organics and cations are almost nearing the stipulated limits used for computing criticality. Although
the nallah adding into the river, located on the right bank shows Average pollution levels indicated
in Dark Blue colour, which is directly responsible for diluting the prevailing Worst condition carried
forward from earlier stretch and converted to Bad state.
Figure 7.9 Criticality in Stretch IX – Domestic Airport to Safed Pool
7.2.10 Stretch X - Safed Pool to BMK Compound The Stretch X initiates at the downstream of the Safed Pool and ends at the BMK Compound.
Figure 7.10 depicts the criticality of the stretch with adopted color coding system & as discussed in
the previous Stretch, the Bad condition of river downstream of Stretch IX indicated in Orange colour
changes to Average indicated in Blue colour upstream of Stretch X. However, as the river reaches
BMK compound, possibly there is certain addition of pollution load as indicated by change to

Comprehensive Study of Mithi River Polluted Stretches Chapter VII Criticality Index for Mithi River Stretches
113
Orange colour which however in terms of practically collected samples do not explain shifting of
condition of river.
Out of three nallahs sampled, 2 seen as Blue colored suggests Average pollution loads indicating
characteristics of some parameters marginally close to Prescribed Standards whereas the
remaining nallah is seen in Orange color that suggests relatively more pollution load.
Figure 7.10 Criticality in Stretch X – Safed Pool to BMK Compound
7.2.11 Stretch XI - BMK Compound to CST Bridge In the Stretch XI of the river, the pollution levels increases from upstream to downstream as shown
in Figure 7.11. The Orange color at upstream translates into Pink color at downstream of the
stretch probably indicating high organics load contributed by the nallahs that could not be
accounted for during the sampling. However, possibly there were discharges into the river through
underground piped sources that may include portions of industrial wastewater mixed with domestic
ones.
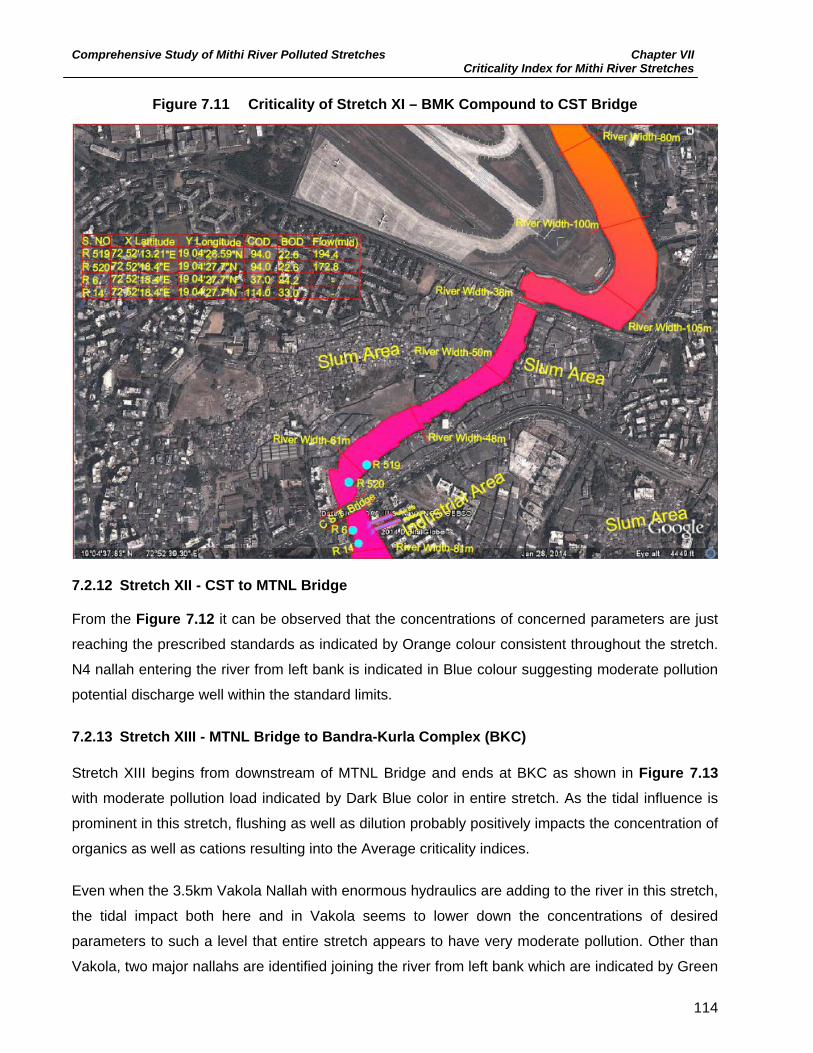
Comprehensive Study of Mithi River Polluted Stretches Chapter VII Criticality Index for Mithi River Stretches
114
Figure 7.11 Criticality of Stretch XI – BMK Compound to CST Bridge
7.2.12 Stretch XII - CST to MTNL Bridge From the Figure 7.12 it can be observed that the concentrations of concerned parameters are just
reaching the prescribed standards as indicated by Orange colour consistent throughout the stretch.
N4 nallah entering the river from left bank is indicated in Blue colour suggesting moderate pollution
potential discharge well within the standard limits.
7.2.13 Stretch XIII - MTNL Bridge to Bandra-Kurla Complex (BKC) Stretch XIII begins from downstream of MTNL Bridge and ends at BKC as shown in Figure 7.13
with moderate pollution load indicated by Dark Blue color in entire stretch. As the tidal influence is
prominent in this stretch, flushing as well as dilution probably positively impacts the concentration of
organics as well as cations resulting into the Average criticality indices.
Even when the 3.5km Vakola Nallah with enormous hydraulics are adding to the river in this stretch,
the tidal impact both here and in Vakola seems to lower down the concentrations of desired
parameters to such a level that entire stretch appears to have very moderate pollution. Other than
Vakola, two major nallahs are identified joining the river from left bank which are indicated by Green

Comprehensive Study of Mithi River Polluted Stretches Chapter VII Criticality Index for Mithi River Stretches
115
color. These nallahs probably carry sewage from the nearby areas that it shows lowest pollution
levels.
Figure 7.12 Criticality of Stretch XII – CST to MTNL Bridge
7.2.14 Stretch XIV –Vakola Nallah Vakola Nallah has been separately analyzed for its status of pollution and relative criticality. As
shown in Figure 7.14, out of the numerous nallahs that enter into the Vakola. Out of the 32 selected
ones,14nallahs represents Green color revealing minimal pollution load whereas 9 indicated by
Blue reveals concentrations of certain parameters to be almost half of the standards. 6 of the
nallahs seen as Orange colored suggests pollution load carried in Bad range i.e. concentration of
the parameters aligned to the standards whereas remaining 2 as indicated by Pink color indicate
high levels of pollution and probably industrial source discharges. Ultimately, Vakola is witnessed
by a variety of load bearing nallahs ranging from practically free from pollution ones to extremely
polluted drains. Vakola is indicated by Dark Blue color which remains unchanged upto the
downstream which is due to the varied pollution load added into it in its path.
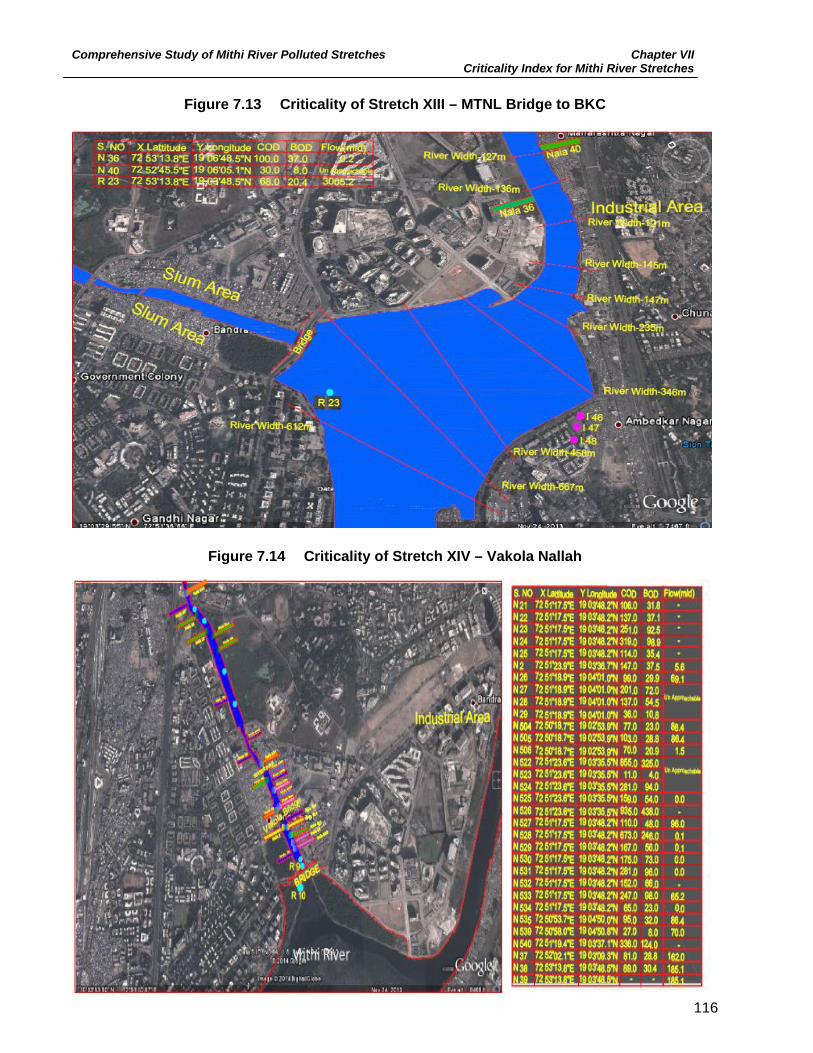
Comprehensive Study of Mithi River Polluted Stretches Chapter VII Criticality Index for Mithi River Stretches
116
Figure 7.13 Criticality of Stretch XIII – MTNL Bridge to BKC
Figure 7.14 Criticality of Stretch XIV – Vakola Nallah

Comprehensive Study of Mithi River Polluted Stretches Chapter VII Criticality Index for Mithi River Stretches
117
7.2.15 Stretch XV - BKC to Kalanagar Two nallahs entering river from left bank indicated by Blue color respectively suggests moderate
load of sewage being discharged in this stretch of the river though the river in itself seems to be
pretty Bad as per indices represented by Orange to Pink color transformation as presented in
Figure 7.15 suggesting increase in load at downstream of the stretch.
7.2.16 Stretch XVI - Kalanagar to Mahim The Pink colour at upstream gets changed into Orange in this Stretch XVI as shown in Figure 7.16
revealing pollution levels exceeding prescribed standards at the upstream which seems to get
diluted at the downstream because of the tidal influence. Only 1 nallah indicated by Dark Green
colour index enters river downstream with minimal pollution and the overall moderate pollution in
this stretch can also be accounted to tidal influence being the last part of river converging into Sea.
Figure 7.15 Criticality in stretch XV – BKC to Kalanagar
In conclusion, it can be interpreted that none of the stretches across the river falls within the index
of Critical nature to be represented by Red colour. Few of the stretches i.e. point of origin from
Vihar Lake to Filterpada with direct source of sewage and open defecation whereas Gautam Nagar,
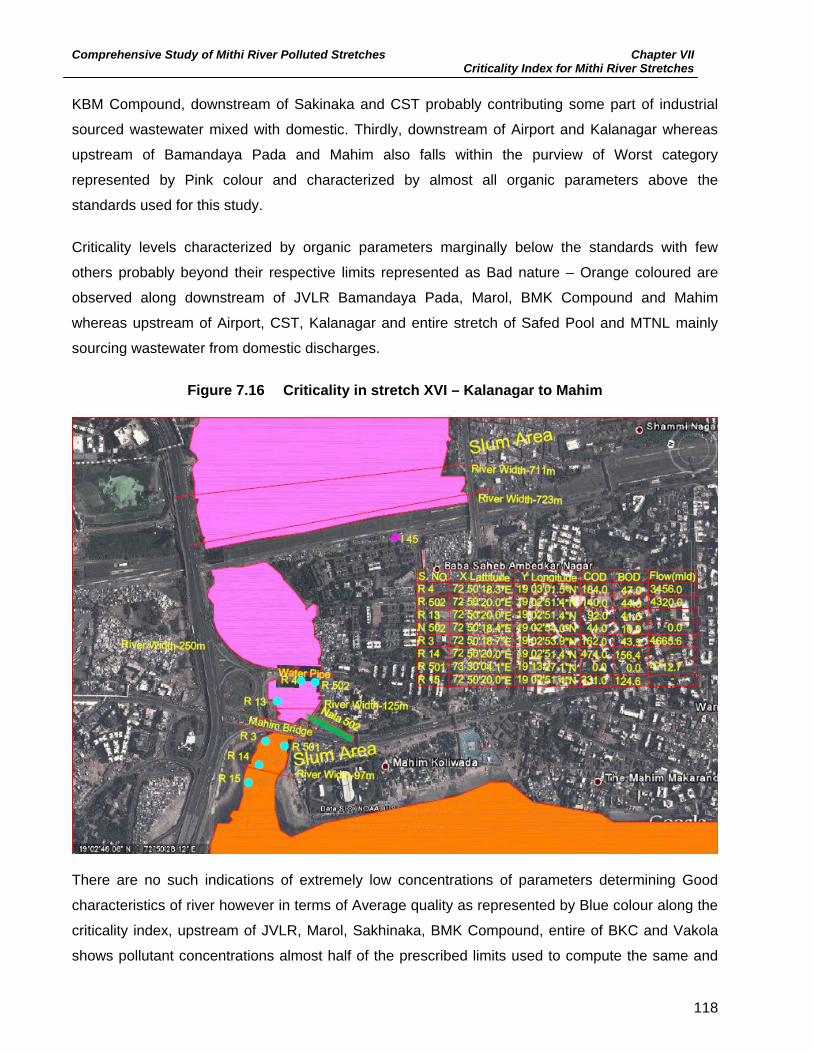
Comprehensive Study of Mithi River Polluted Stretches Chapter VII Criticality Index for Mithi River Stretches
118
KBM Compound, downstream of Sakinaka and CST probably contributing some part of industrial
sourced wastewater mixed with domestic. Thirdly, downstream of Airport and Kalanagar whereas
upstream of Bamandaya Pada and Mahim also falls within the purview of Worst category
represented by Pink colour and characterized by almost all organic parameters above the
standards used for this study.
Criticality levels characterized by organic parameters marginally below the standards with few
others probably beyond their respective limits represented as Bad nature – Orange coloured are
observed along downstream of JVLR Bamandaya Pada, Marol, BMK Compound and Mahim
whereas upstream of Airport, CST, Kalanagar and entire stretch of Safed Pool and MTNL mainly
sourcing wastewater from domestic discharges.
Figure 7.16 Criticality in stretch XVI – Kalanagar to Mahim
There are no such indications of extremely low concentrations of parameters determining Good
characteristics of river however in terms of Average quality as represented by Blue colour along the
criticality index, upstream of JVLR, Marol, Sakhinaka, BMK Compound, entire of BKC and Vakola
shows pollutant concentrations almost half of the prescribed limits used to compute the same and

Comprehensive Study of Mithi River Polluted Stretches Chapter VII Criticality Index for Mithi River Stretches
119
mostly incorporating diluted domestic wastewater discharge. Table 7.5 summarizes the color
coding obtained at upstream and downstream of the stretches along Mithi River.
Table 7.5 Summary of Criticality along Mithi River
Stretch of Mithi River Color at Upstream Color at Downstream
I Vihar Lake to Filterpada Pink Pink
II Filterpada to Gautam Nagar Light Pink Dark Pink
III Gautam Nagar to JVLR Bridge Dark Blue Orange
IV JVLR Bridge to Bamandaya Pada Pink Orange
V Bamandaya Pada to KBM Compound Pink Pink
VI KBM Compound to Marol Dark Blue Orange
VII Marol to Sakhinaka Dark Blue Pink
VIII Sakhinaka to Domestic Airport Orange Pink
IX Domestic Airport to Safed Pool Orange Orange
X Safed Pool to BMK Compound Blue Orange
XI BMK Compound to CST Bridge Orange Pink
XII CST Bridge to MTNL Bridge Orange Orange
XIII MTNL Bridge to Bandra-Kurla Complex Dark Blue Dark Blue
XIV Vakola Nallah Dark Blue Dark Blue
XV Bandra-Kurla Complex to Kalanagar Orange Pink
XVI Kalanagar to Mahim Pink Orange
The main purpose of this exercise was to make it convenient for decision makers to have an easy
and simple interpretable means of understanding of criticality of Mithi so that immediate intervention
can be planned and priority can be set for those sections of the river needing it the most. Thereby
nallahs that are marked from Orange to Pink to Red as indicated in Figure 7.17 & stretches of river
represented by similar colour range needs to be the prime centre’s of cause of concern pollution
mitigation point of view.
On the other hand long term plans to control and maintain pollution levels in Blue coloured sections
of river as well as those indicated similarly in nallahs need to be worked out. The framework can be
easily updated annually to indicate success of management implementation just by viewing time
scale maps of this kind putting in basic analysis data in future.

Comprehensive Study of Mithi River Polluted Stretches Chapter VIII Source Receptor Modeling
Chapter VIII
8.0 Background .................................................................................................................... 118
8.1 Factor Analysis Model ................................................................................................ 120
8.1.1 Experimental ....................................................................................................... 120
8.1.1.1 Steps Involved in Factor Analysis [FA] ......................................................... 121
8.1.1.1.1 Computation of Eigenvalues ..................................................................... 123
8.1.1.1.2 Computation of Eigenvectors .................................................................... 124
8.1.1.2 Correlation Coefficient .................................................................................. 125
8.1.1.2.1 Bartlett’s Test of Sphericity ....................................................................... 126
8.1.1.2.2 Kaiser – Meyer – OlkinMeasure of Sampling Adequacy ........................... 126
8.1.1.2.3 Measure of Sampling Adequacy ............................................................... 127
8.1.1.3 Factor Extraction by Principal Component Analysis .................................... 127
8.1.1.4 Principal Components in Multidimensional Case ......................................... 128
8.1.1.5 Number of Retained Factors ........................................................................ 128
8.1.1.6 Rotation ........................................................................................................ 129
8.1.1.7 Factor Scores ............................................................................................... 129
8.2 Data Outputs & Discussions ....................................................................................... 130
8.2.1 Correlation Matrices ............................................................................................ 130
8.2.2 KMO and Bartlett's Test ...................................................................................... 132
8.2.3 Communalities ..................................................................................................... 133
8.2.4 Total Variance ..................................................................................................... 134
8.2.5 Extraction of Components and Component Matrix .............................................. 136
8.2.6 Factor Scores ...................................................................................................... 139
8.2.7 Industrial Source Characterization using Receptor Model for Metal ................... 140
List of Tables
Table 8.1 Correlation Matrices for Physico-chemical &Organics in River ............................... 131
Table 8.2 Correlation Matrices for Physico-chemical &Organics in Nallahs ........................... 131
Table 8.3 KMO & Bartlett’s Test for River ............................................................................... 132
Table 8.4 KMO & Bartlett’s Test for Nallah ............................................................................. 132
Table 8.5 Communalities for River & Nallah Samples ............................................................ 133
Table 8.6 Total Variance of Explained for River ..................................................................... 135
Table 8.7 Total Variance of Explained for Nallah .................................................................... 135
Table 8.8 Component Matrix for Physico-chemical and Organic Variables for River ............. 136

Comprehensive Study of Mithi River Polluted Stretches Chapter VIII Source Receptor Modeling
Table 8.9 Component Matrix for Physico-chemical and Organic Variables for Nallahs .......... 138
Table 8.10 Component Score Coefficient Matrix for River .................................................... 139
Table 8.11 Component Score Coefficient Matrix for Nallah .................................................. 139
Table 8.12 Covariance Matrix for Metals from Industrial Sources ......................................... 140
Table 8.13 Total Variance Explained for Industrial Samples ................................................. 141

Comprehensive Study of Mithi River Polluted Stretches Chapter VIII Source Receptor Modeling
118
Chapter VIII Source Receptor Modeling
8.0 Background In the effluent Characterization studies, many variables are measured to typify the system.
However, it is an interesting fact that all of the variables are not independent of each other and
hence there is a need to develop mathematical techniques that permit the study of these
simultaneous variations of multiple variables. One such analysis i.e. the correlation is based on
identifying the relationships between pairs of variables.
Correlation analysis forms one such method but does not provide a clear view of multiple
interactions in the data. Thus, eigenvector analysis was used to convert the correlation data into
multivariate information. Factor Analysis is the name given to one of the variety of forms of
eigenvector analysis [Gupta A., et. al., 1997].
The varied application methods have resulted in different terminologies such as factor Analysis,
Principal Component Analysis, Principal Component Factor Analysis, Empirical Orthogonal
Function Analysis, etc. depending upon the way the data are scaled before analysis or how the
resulting vectors are treated after the eigenvector analysis is completed.
The major problem in environmental pollutant characterization is the resolution of environmental
mixtures to their source contributions. For example, a sample of air borne particulate matter
collected at a site is made up of particles of soil, motor vehicle exhaust, secondary sulphate
particles, and primary emissions from industrial point source, etc. It then forms a point of interest
to determine the contribution from each source to the total mass collected. It is then assumed
that the measured ambient concentration of some species Xi, where I = 1…m, is a linear sum of
elemental concentrations from P independent source of particles. Each Kth source emits
particles that have a profile of elemental concentrations, aik and a mass contribution per unit
volume of the Kth source is fk. When the compositions are measured for ‘n’ number of samples,
the equation is obtained. P
Xij = Σaikfkj K=1
This technique has been used by a number of researchers for the identification of various
sources.
Principal Component Analysis (PCA) is an important chemometric tool [Jolliffe I. T., 1996;
Jackson J.E., 1991] that can be used to establish combinations of variables, capable of

Comprehensive Study of Mithi River Polluted Stretches Chapter VIII Source Receptor Modeling
119
describing the principal data tendencies observed. This technique has been successfully used
to study coastal water contamination [Reisenholer E., 1996]receptor modeling of air [Bellheimer
D., 2001; Pinto J.P., 1998] as well as for characterization and determination of sources of
contamination and eutrophication in lake waters [Reisenhofer E., 1995].
In Environmental Impact Assessment, FA had played a very important role very recently.
An approach of objective weighting by using a procedure of PCFA, which suits specifically those
parameters measured directly by physical scales, has been proposed by Ying and Liu in 1995
[Ying L. G., 1995]. PCA has been applied to evaluate the effect of pollution on the ecosystems.
In a study to identify the possible effects of thermal pollution on the macro benthic communities
and to compare them with the main influencing factors PCA was found to be the most powerful
technique in evidencing the effect.
Factor analysis has also been applied by a number of researchers to interpret water quality
data. It has been used to classify the stretch of a river into pollution zones. It has been also
used to find out the dominating variables at different locations and to evaluate the sampling
network and frequency. As in air quality application, it helps in identifying the nature of the
sources in a broad sense with respect to mineralisation in and around a location. Mehloch first
applied this technique to interpret the water quality data in 1974 [Mehloch J. L., 1974].
As far as the study area is concerned, a need for the application of the Receptor model was felt
taking into consideration the following reasons:
Lack of precise information on water supply and sewage/effluent generated from the
sources entering Mithi river
Numerous intermediate, unknown & untreated discharges leading to extensive
anticipated pollution load as confirmed from the characterization studies of
nallah/industrial and domestic sources
There may be many synergistic and antagonistic effects among variables since the
effluent is a mixed type
The effluent /sewage characterization includes multiple variables and complex co-
existence of all parameters, which originate from altogether different sources
It was assumed that these parameters that come from different sources and characterize
the effluents are nothing but the variables, which may or may not be independent of one
another

Comprehensive Study of Mithi River Polluted Stretches Chapter VIII Source Receptor Modeling
120
Limitations of use of conventional physical ground truthing and other methods to
evaluate industrial v/s domestic wastewater contribution to Mithi river
8.1 Factor Analysis Model The mathematical model for factor analysis is similar to multiple regression analysis. Each
variable is expressed as combinations of factors that are not actually observed.
The model for ith standardized variable is:
Xi = Ai1F1 + Ai2F2 + …… + AikFk + Ui
Where:
Fi’s = common factors (all variables are expressed as functions of them) & Ui = unique factor (uncorrelated) These factors are common factors because all the variables are expressed as functions of
them. The unique factors are assumed to be uncorrelated with each other and with the common
factors.
The factors are labels for group of variables i.e. they are linear combinations of variables that
characterize these concepts. The factors are inferred from observed variables and can be
estimated as linear combinations of them. For example, the factor Fj can be expressed as:
Fi = ΣWji Xi = Wji Xi + Wj2 X2 +…+ WjpXp
Where: Wi’s = factor score coefficients and P = number of variables It is quite possible that all the variables might contribute to the factor Fj, but then by convention
it seems that only a few subsets of variables characterize Fj, as indicated by their large
coefficients.
8.1.1 Experimental The characterization of the river water from the study area was carried out by measuring 24
different parameters including 9 metals as discussed in the previous chapters. To identify the
sources of such varied characteristics, it was felt essential to utilize only some selected
parameters for receptor modeling since all the parameters may lead to erroneous results.

Comprehensive Study of Mithi River Polluted Stretches Chapter VIII Source Receptor Modeling
121
Receptor modeling was performed using SPSS 11.0, software termed as Statistical Package for
Social Sciences version 11.0.
Factor Analysis has been used to determine the sources of particular pollutant in the 2 different
regimes i.e. river & nallah each of which is further factored with special reference to the typical
characteristic parameters such as physical along with BOD, COD, oil, grease, nitrates and MPN
and heavy metals separately. The results of the analysis have been overlaid with the surveyed
data for discharges as well as categorized analysis data from industrial & domestic sources
whereby an attempt is made to establish correlation and authenticity of the Receptor model.
The authors feel that is would be of utmost importance to elucidate steps that are involved in
Factor Analysis and enlist all such necessary inputs that are used in this study for transparency
and QA/QC checks for all readers as discussed in following sections.
8.1.1.1 Steps Involved in Factor Analysis [FA] To put it simply, factor analysis basically involves data reduction in the form of matrices
involving the use of Eigen values and Eigenvectors. Thus, before discussing the steps involved
in FA, it is essential to understand these concepts, which is outlined here.
The eigenvalue problem is a problem of considerable theoretical interest and wide-ranging
application. For example, this problem is crucial in solving systems of differential equations,
analyzing population growth models, and calculating powers of matrices (in order to define the
exponential matrix). Other areas such as physics, sociology, biology, economics and statistics
have focused considerable attention on "eigenvalues" and "eigenvectors"-their applications and
their computations. Before we give the formal definition, let us introduce these concepts on an
example.
For Example, Consider the matrix
Consider the three column matrices
We have

Comprehensive Study of Mithi River Polluted Stretches Chapter VIII Source Receptor Modeling
122
In other words, we have
Next consider the matrix P for which the columns are C1, C2, and C3, i.e.,
We have det(P) = 84. So this matrix is invertible. Easy calculations give
Next we evaluate the matrix P-1AP. We leave the details to the reader to check that we have
In other words, we have
Using the matrix multiplication, we obtain
which implies that A is similar to a diagonal matrix. In particular, we have
for n= 1,2,…. It is worth noting that finding A75 directly from the original form of A is practically
impossible.
This example is so rich of conclusions that many questions impose themselves in a natural way.
For example, given a square matrix A, how do we find column matrices, which have similar
behaviors as the above ones? In other words, how do we find these column matrices, which will
help find the invertible matrix P such that P-1AP is a diagonal matrix?
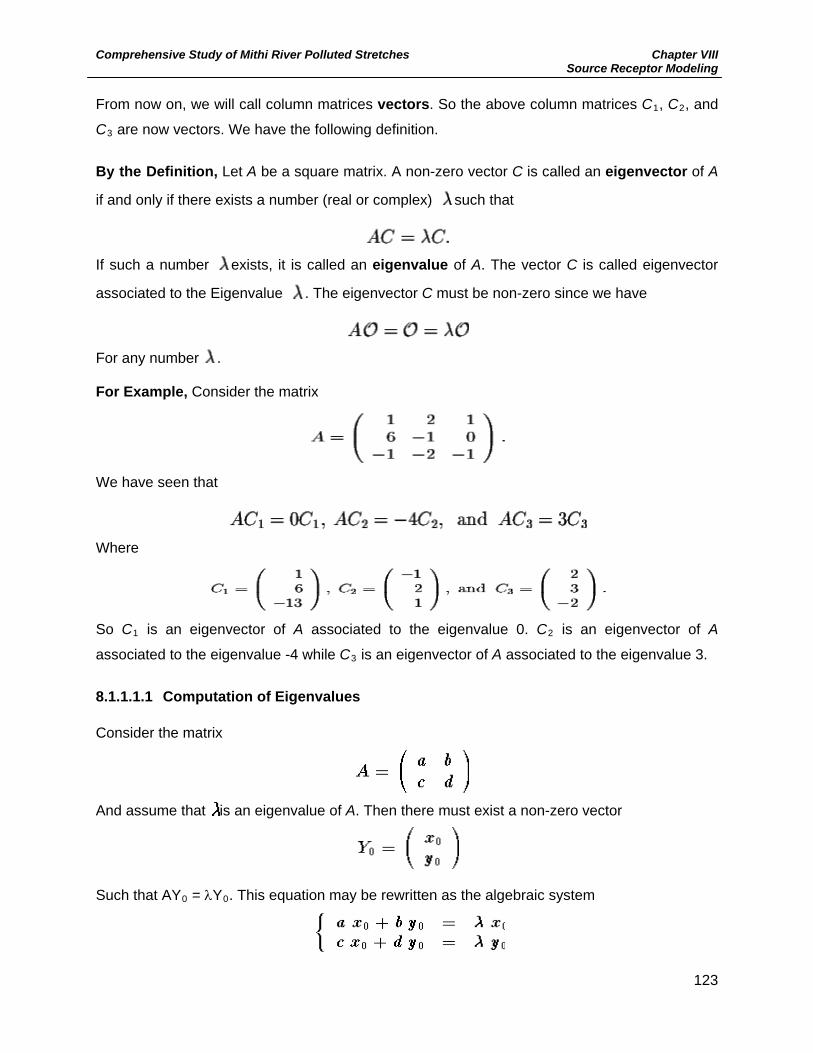
Comprehensive Study of Mithi River Polluted Stretches Chapter VIII Source Receptor Modeling
123
From now on, we will call column matrices vectors. So the above column matrices C1, C2, and
C3 are now vectors. We have the following definition.
By the Definition, Let A be a square matrix. A non-zero vector C is called an eigenvector of A
if and only if there exists a number (real or complex) such that
If such a number exists, it is called an eigenvalue of A. The vector C is called eigenvector
associated to the Eigenvalue . The eigenvector C must be non-zero since we have
For any number . For Example, Consider the matrix
We have seen that
Where
So C1 is an eigenvector of A associated to the eigenvalue 0. C2 is an eigenvector of A
associated to the eigenvalue -4 while C3 is an eigenvector of A associated to the eigenvalue 3.
8.1.1.1.1 Computation of Eigenvalues Consider the matrix
And assume that is an eigenvalue of A. Then there must exist a non-zero vector
Such that AY0 = λY0. This equation may be rewritten as the algebraic system

Comprehensive Study of Mithi River Polluted Stretches Chapter VIII Source Receptor Modeling
124
which is equivalent to the system
Since both χ0 and y0 cannot be equal to zero at the same time, we must have the determinant of
the system equal to zero. That is,
,
Which reduces to the algebraic equation
.
The above equation is independent of the vector Y0. This equation is called the Characteristic Polynomial of the system.
8.1.1.1.2 Computation of Eigenvectors Assume is an eigenvalue of the matrix A. An eigenvector Y0 associated to is given by the
matricial equation
.
Set .
Then, the above matricial equation reduces to the algebraic system
which is equivalent to the system
Since is known, this is now a system of two equations and two unknowns. It must be noted
that if Y0 is an eigenvector, then KY0 is also an eigenvector.
The factor analysis is carried out in four steps.
1. The first step in the analysis of the data involves calculation of a function that indicates
the degree of interrelationships, which exists within the data i.e. the product moment
correlation coefficient

Comprehensive Study of Mithi River Polluted Stretches Chapter VIII Source Receptor Modeling
125
2. The second step involves determination of the number of factors necessary to represent
the data and the method of calculating them. This step also ascertains the fitness of the
chosen model with the data
3. The third step is Rotation that focuses on transforming the factors to make them more
interpretable
4. At the fourth step, scores for each factor is computed for each sampling location in both
the river & nallahs
8.1.1.2 Correlation Coefficient Correlation coefficient between two variables xi and xj, over all n samples is:
n Rij = ∑(Xik –Xi) (Xjk – Xj)
k=1 nn
√{∑(Xik – Xi)2} √{∑(Xjk – Xk)2}
k=1 k=1 The original variables can be transformed by subtracting the mean value and dividing by the
standard deviation i.e.
Zik = Xik – Xi
σi
Hence, correlation coefficient can be simplified to:
rij = ∑Zik Zjk
n
The advantage of standardization is that each standardized variable has a mean value of zero
and a standard deviation of one. Each variable carries one unit of system variance and the total
variance for a set of measurements of m variables would be m.
Thus, the matrix of either the correlations or covariances, called the dispersion matrix, can be
obtained from the original or transformed data matrices. The choice of dispersion function
depends on the nature of the variables being measured. Another use of the correlation
coefficient is that it can be interpreted in a statistical sense to test the null hypothesis as to
whether a linear relationship exists between the pairs of variables being tested. It is important to
note that the existence of a correlation coefficient that is different from zero does not prove that

Comprehensive Study of Mithi River Polluted Stretches Chapter VIII Source Receptor Modeling
126
a cause and effect relationship exists. Also, it is important to note that the use of probabilities to
determine if correlation coefficients are significant is very questionable for environmental data.
In the development of those probability relationships, explicit assumptions are made that the
underlying distributions of the variables in the correlation analysis are normal. For most
environmental variables, normal distributions are uncommon. Generally, the distributions are
positively skewed and heavily tailed. Thus great care should be taken in making probability
arguments regarding the significance of pair wise correlation -coefficients between variables
measured in environmental samples.
It is then very important to examine the correlation matrix since the major aim of factor analysis
is to help explain the correlations, the factor model must be related to each other for the model
to be appropriate. If correlations between variables are small it is unlikely that they share
common factors. Thus, certain tests are performed to evaluate the correlation matrix such as
follows:
8.1.1.2.1 Bartlett’s Test of Sphericity This can be used to test the hypothesis that the correlation matrix is an identity matrix. The test
requires that the data be a sample from a multivariate normal population. If the value of the test
statistic for sphericity is large and the associated significance level is small, it appears unlikely
that the population correlation matrix is identity
8.1.1.2.2 Kaiser – Meyer – Olkin Measure of Sampling Adequacy It is an index for comparing the magnitudes of the observed correlation coefficients to the
magnitudes of the partial correlation coefficients. It is computed as
KMO = Σ rij
2
Σ rij2 + Σ aij
2
Where, the summation is for all values of i and j, i not equal to j; rij is the correlation coefficient
between variables i and j; aij is the partial correlation coefficient between variables i and j. If the
sum of the squared partial correlation coefficients between all pairs of variables is small when
compared to the sum of the squared correlation coefficients, the KMO measure is close to 1.
Small values of this measure indicate that a factor analysis of the variables may not be a good

Comprehensive Study of Mithi River Polluted Stretches Chapter VIII Source Receptor Modeling
127
idea, since correlations between pairs of variables cannot be explained by the other variables.
The measure in the 0.9's is characterized as marvelous, in the 0.8's as meritorious, in the O.7's
as middling, in the 0.6 as mediocre, in the 0.5's as miserable and below 0.5 as unacceptable.
8.1.1.2.3 Measure of Sampling Adequacy A measure of sampling adequacy can be computed for each individual variable in a similar
manner. Instead of including all pairs of variables in the summations, only coefficients involving
that variable are included. For the ith variable, the measure of sampling adequacy is given by the
equation
MSAi = Σ rij2
Σ rij2 + Σ aij
2
The summation is for all values of j not equal to i. For a good factor analysis large values are
needed.
8.1.1.3 Factor Extraction by Principal Component Analysis This section outlines the factor extraction based on principal component analysis, which is most
commonly used. Several different methods are used to obtain estimates of the factors which
include Maximum likelihood algorithm, Principal axis factoring etc. The first principal component
is the linear combination that accounts for the largest amount of variance in the sample. The
second principal component accounts for the ~next largest amount of variance and is
uncorrelated with the first. For example, consider the simplest case and try to understand
principal component analysis when only two variables are present.
Let x1 =10.530 x2= 11.133 and
s1 = 1.132 s2 – 0.636 r12 = -0.6809
Where: x1 and x2 are the means of two variable and s1 and s2 are the standard deviations We define a simple measure of simultaneous variability of all variables involved i.e., the sum of
the variances, called the total variance.
s2
total =s (X1) + s2 (X2) = 1.1322 + 0.6362 =1.686
Variable X1 has a proportion of 76.1% of the total variance. For the principal components Fl and
F2 one obtains the same sum of variances, that is
s2 (F1) + s2 (F2) =s (X1) + s (X2) =s2 total'

Comprehensive Study of Mithi River Polluted Stretches Chapter VIII Source Receptor Modeling
128
F1 has a proportion of 89% of the total variance. This proportion depends crucially on the
correlation between the variables under analysis, and approaches 100% if the, correlation lies
near 1 in absolute value. As a general rule we say that the first principal component reproduces
the data well if its proportion of the total variance is sufficiently large, e.g. larger than 80% or
90%.
Another important information about this type of analysis is that if there is perfect correlation
(one) between the variables the first principal component will account for 100% of the total
variance and determining the second principal component becomes unnecessary in this case.
On the other hand if the correlation is absent (zero), it results in the original variables being the
principal component.
8.1.1.4 Principal Components in Multidimensional Case The relationships developed in the two dimensional case are valid for P > 2. If P > 2 the p
principal components are linear combinations of the p variables.
F1= b12X1+ bj2X2 + ... + b1pXp F2=b21X1+ b22X2 + ... + b2PXp
… …
Fp=bp1X1+ bp2X2 + ... + bppXp
The transformation from the variables ~ to the principal components Fh can be viewed as
rotation of the p-dimensional coordinate system in such a way that the new variables
Fhare mutually uncorrelated.
8.1.1.5 Number of Retained Factors It is important to examine the percentage of total variance explained by each in order to decide
how many factors are needed to represent the data. For simplicity in most of the cases all
variables and factors are expressed in standardized form i.e. with a mean of 0 and a standard
deviation of 1. Percentage of total variance and cumulative percentage attributable to each
factor is calculated.
Several procedures have been proposed for determining the number of factors to use in a
model. One criterion suggests that only factors that account for variances greater than 1
(eigenvalue greater than 1) should be included.

Comprehensive Study of Mithi River Polluted Stretches Chapter VIII Source Receptor Modeling
129
8.1.1.6 Rotation Although the factor matrix obtained indicates the relationship between the factors and the
individual variables, it is usually difficult to identify meaningful factors based on this matrix. Often
the variables and factors do not appear correlated in any interpretable pattern. Most factors are
correlated with many variables. The rotation phase of factor analysis attempts to transform the
initial matrix into one that is easier to interpret.
8.1.1.7 Factor Scores Factor score is another important output of factor analysis. Factor score fjk for jth factor for case
k is computed by
p fjk = ∑Wji Xik i=1 Where, Xikis the standardized value of the ith variable for case k and WJI is the factor score
coefficient for the jthfactor and the ith variable. Mathematically, the relationship between the
matrix of factor scores and the rotated factor matrix is as follows:
B=R-1 S
Where, B is the factor score coefficient matrix; R is the correlation matrix; and S is the rotated
factor matrix.
Information on factor scores is useful if the factors could be well interpreted. Normally in
analyzing water quality data, the first factor is found to be a representative of most of the
important water quality parameters and is hence termed as the general factor. A computation
of factor scores thus enables to compress the implications of several variables into a single
number, very similar to Water Quality Index (WQI). A factor score is therefore referred as a
FAWQ1.
Similarly, if factor II is found to be dominated by the organic pollution for example reflecting
heavy factor loadings of TKN (Total Kjeldahl nitrogen), BOD. COD etc. then the factor scores
computed for factor II would indicate the overall behavior of the state of organic pollution in the
river.
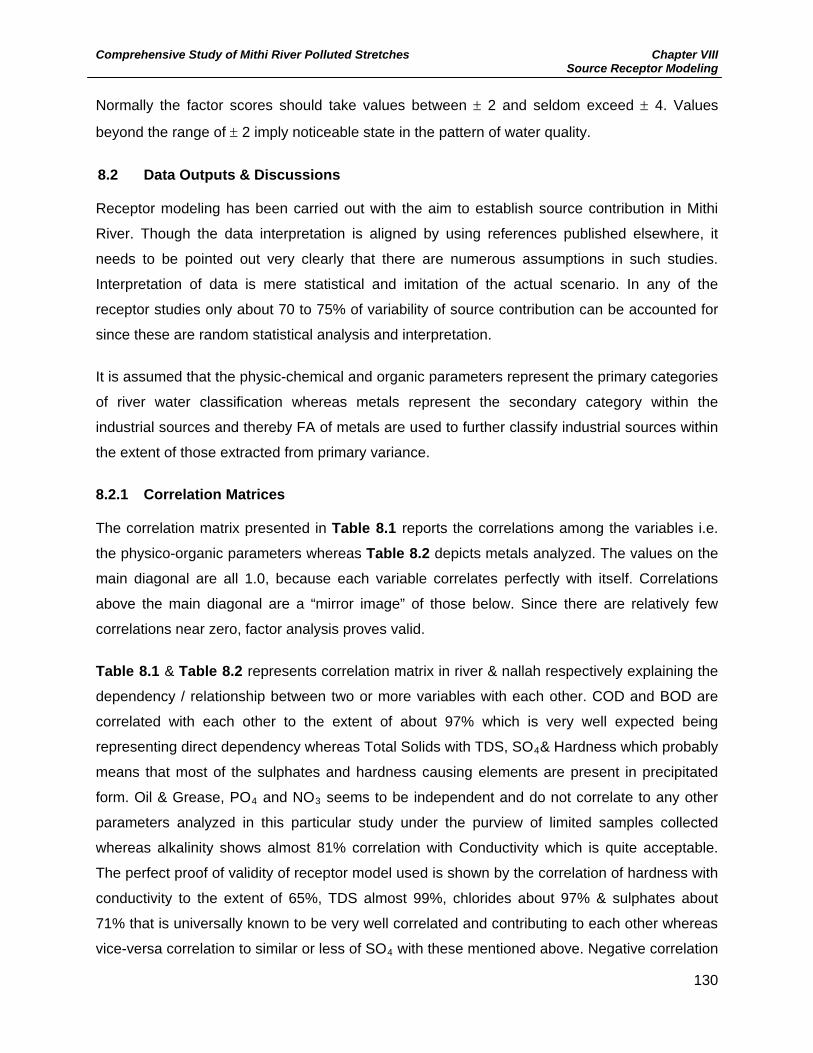
Comprehensive Study of Mithi River Polluted Stretches Chapter VIII Source Receptor Modeling
130
Normally the factor scores should take values between ± 2 and seldom exceed ± 4. Values
beyond the range of ± 2 imply noticeable state in the pattern of water quality.
8.2 Data Outputs & Discussions Receptor modeling has been carried out with the aim to establish source contribution in Mithi
River. Though the data interpretation is aligned by using references published elsewhere, it
needs to be pointed out very clearly that there are numerous assumptions in such studies.
Interpretation of data is mere statistical and imitation of the actual scenario. In any of the
receptor studies only about 70 to 75% of variability of source contribution can be accounted for
since these are random statistical analysis and interpretation.
It is assumed that the physic-chemical and organic parameters represent the primary categories
of river water classification whereas metals represent the secondary category within the
industrial sources and thereby FA of metals are used to further classify industrial sources within
the extent of those extracted from primary variance.
8.2.1 Correlation Matrices The correlation matrix presented in Table 8.1 reports the correlations among the variables i.e.
the physico-organic parameters whereas Table 8.2 depicts metals analyzed. The values on the
main diagonal are all 1.0, because each variable correlates perfectly with itself. Correlations
above the main diagonal are a “mirror image” of those below. Since there are relatively few
correlations near zero, factor analysis proves valid.
Table 8.1 & Table 8.2 represents correlation matrix in river & nallah respectively explaining the
dependency / relationship between two or more variables with each other. COD and BOD are
correlated with each other to the extent of about 97% which is very well expected being
representing direct dependency whereas Total Solids with TDS, SO4& Hardness which probably
means that most of the sulphates and hardness causing elements are present in precipitated
form. Oil & Grease, PO4 and NO3 seems to be independent and do not correlate to any other
parameters analyzed in this particular study under the purview of limited samples collected
whereas alkalinity shows almost 81% correlation with Conductivity which is quite acceptable.
The perfect proof of validity of receptor model used is shown by the correlation of hardness with
conductivity to the extent of 65%, TDS almost 99%, chlorides about 97% & sulphates about
71% that is universally known to be very well correlated and contributing to each other whereas
vice-versa correlation to similar or less of SO4 with these mentioned above. Negative correlation
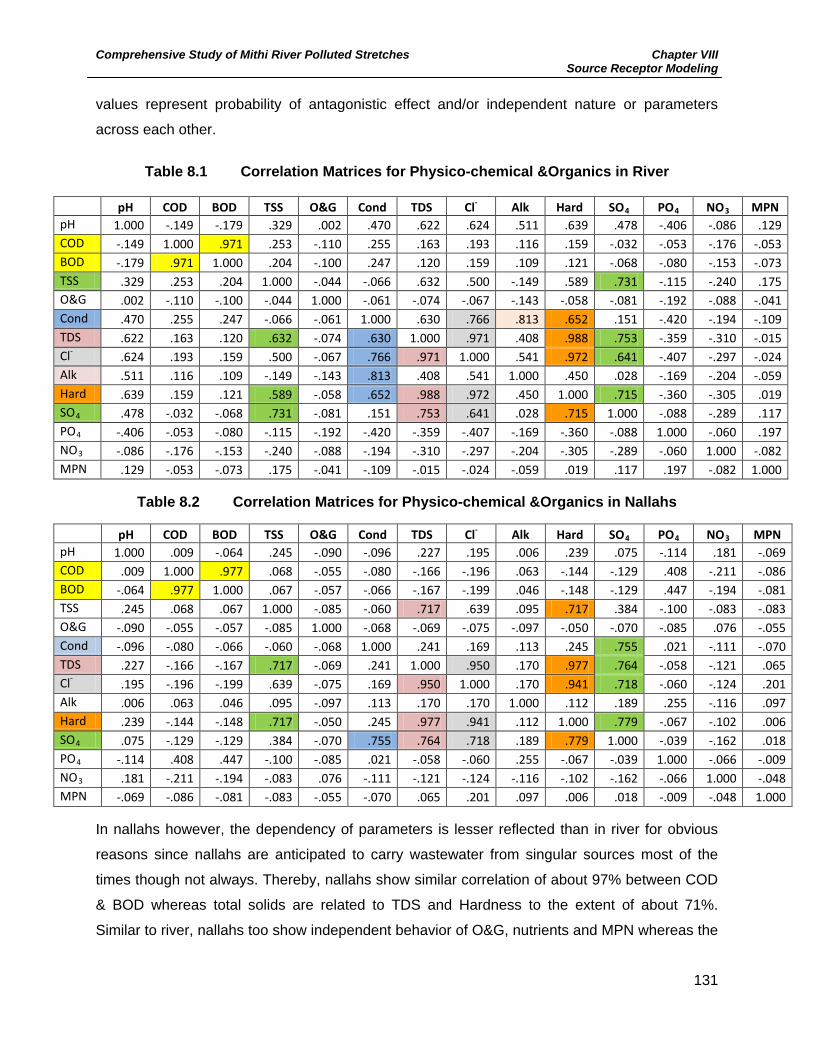
Comprehensive Study of Mithi River Polluted Stretches Chapter VIII Source Receptor Modeling
131
values represent probability of antagonistic effect and/or independent nature or parameters
across each other.
Table 8.1 Correlation Matrices for Physico-chemical &Organics in River
pH COD BOD TSS O&G Cond TDS Cl- Alk Hard SO4 PO4 NO3 MPN pH 1.000 -.149 -.179 .329 .002 .470 .622 .624 .511 .639 .478 -.406 -.086 .129 COD -.149 1.000 .971 .253 -.110 .255 .163 .193 .116 .159 -.032 -.053 -.176 -.053 BOD -.179 .971 1.000 .204 -.100 .247 .120 .159 .109 .121 -.068 -.080 -.153 -.073 TSS .329 .253 .204 1.000 -.044 -.066 .632 .500 -.149 .589 .731 -.115 -.240 .175 O&G .002 -.110 -.100 -.044 1.000 -.061 -.074 -.067 -.143 -.058 -.081 -.192 -.088 -.041 Cond .470 .255 .247 -.066 -.061 1.000 .630 .766 .813 .652 .151 -.420 -.194 -.109 TDS .622 .163 .120 .632 -.074 .630 1.000 .971 .408 .988 .753 -.359 -.310 -.015 Cl- .624 .193 .159 .500 -.067 .766 .971 1.000 .541 .972 .641 -.407 -.297 -.024 Alk .511 .116 .109 -.149 -.143 .813 .408 .541 1.000 .450 .028 -.169 -.204 -.059 Hard .639 .159 .121 .589 -.058 .652 .988 .972 .450 1.000 .715 -.360 -.305 .019 SO4 .478 -.032 -.068 .731 -.081 .151 .753 .641 .028 .715 1.000 -.088 -.289 .117 PO4 -.406 -.053 -.080 -.115 -.192 -.420 -.359 -.407 -.169 -.360 -.088 1.000 -.060 .197 NO3 -.086 -.176 -.153 -.240 -.088 -.194 -.310 -.297 -.204 -.305 -.289 -.060 1.000 -.082 MPN .129 -.053 -.073 .175 -.041 -.109 -.015 -.024 -.059 .019 .117 .197 -.082 1.000
Table 8.2 Correlation Matrices for Physico-chemical &Organics in Nallahs
pH COD BOD TSS O&G Cond TDS Cl- Alk Hard SO4 PO4 NO3 MPN pH 1.000 .009 -.064 .245 -.090 -.096 .227 .195 .006 .239 .075 -.114 .181 -.069 COD .009 1.000 .977 .068 -.055 -.080 -.166 -.196 .063 -.144 -.129 .408 -.211 -.086 BOD -.064 .977 1.000 .067 -.057 -.066 -.167 -.199 .046 -.148 -.129 .447 -.194 -.081 TSS .245 .068 .067 1.000 -.085 -.060 .717 .639 .095 .717 .384 -.100 -.083 -.083 O&G -.090 -.055 -.057 -.085 1.000 -.068 -.069 -.075 -.097 -.050 -.070 -.085 .076 -.055 Cond -.096 -.080 -.066 -.060 -.068 1.000 .241 .169 .113 .245 .755 .021 -.111 -.070 TDS .227 -.166 -.167 .717 -.069 .241 1.000 .950 .170 .977 .764 -.058 -.121 .065 Cl- .195 -.196 -.199 .639 -.075 .169 .950 1.000 .170 .941 .718 -.060 -.124 .201 Alk .006 .063 .046 .095 -.097 .113 .170 .170 1.000 .112 .189 .255 -.116 .097 Hard .239 -.144 -.148 .717 -.050 .245 .977 .941 .112 1.000 .779 -.067 -.102 .006 SO4 .075 -.129 -.129 .384 -.070 .755 .764 .718 .189 .779 1.000 -.039 -.162 .018 PO4 -.114 .408 .447 -.100 -.085 .021 -.058 -.060 .255 -.067 -.039 1.000 -.066 -.009 NO3 .181 -.211 -.194 -.083 .076 -.111 -.121 -.124 -.116 -.102 -.162 -.066 1.000 -.048 MPN -.069 -.086 -.081 -.083 -.055 -.070 .065 .201 .097 .006 .018 -.009 -.048 1.000
In nallahs however, the dependency of parameters is lesser reflected than in river for obvious
reasons since nallahs are anticipated to carry wastewater from singular sources most of the
times though not always. Thereby, nallahs show similar correlation of about 97% between COD
& BOD whereas total solids are related to TDS and Hardness to the extent of about 71%.
Similar to river, nallahs too show independent behavior of O&G, nutrients and MPN whereas the
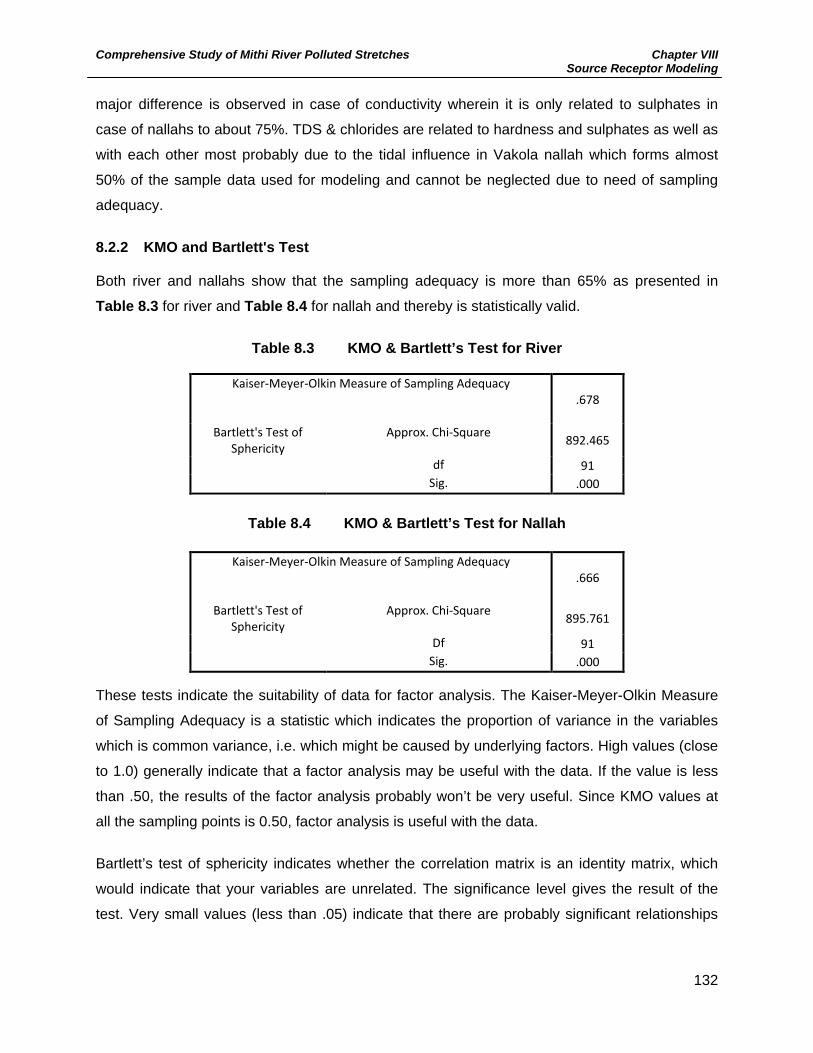
Comprehensive Study of Mithi River Polluted Stretches Chapter VIII Source Receptor Modeling
132
major difference is observed in case of conductivity wherein it is only related to sulphates in
case of nallahs to about 75%. TDS & chlorides are related to hardness and sulphates as well as
with each other most probably due to the tidal influence in Vakola nallah which forms almost
50% of the sample data used for modeling and cannot be neglected due to need of sampling
adequacy.
8.2.2 KMO and Bartlett's Test Both river and nallahs show that the sampling adequacy is more than 65% as presented in
Table 8.3 for river and Table 8.4 for nallah and thereby is statistically valid.
Table 8.3 KMO & Bartlett’s Test for River
Kaiser-Meyer-Olkin Measure of Sampling Adequacy
.678
Bartlett's Test of Sphericity
Approx. Chi-Square 892.465
df 91 Sig. .000
Table 8.4 KMO & Bartlett’s Test for Nallah
Kaiser-Meyer-Olkin Measure of Sampling Adequacy
.666
Bartlett's Test of Sphericity
Approx. Chi-Square 895.761
Df 91 Sig. .000
These tests indicate the suitability of data for factor analysis. The Kaiser-Meyer-Olkin Measure
of Sampling Adequacy is a statistic which indicates the proportion of variance in the variables
which is common variance, i.e. which might be caused by underlying factors. High values (close
to 1.0) generally indicate that a factor analysis may be useful with the data. If the value is less
than .50, the results of the factor analysis probably won’t be very useful. Since KMO values at
all the sampling points is 0.50, factor analysis is useful with the data.
Bartlett’s test of sphericity indicates whether the correlation matrix is an identity matrix, which
would indicate that your variables are unrelated. The significance level gives the result of the
test. Very small values (less than .05) indicate that there are probably significant relationships

Comprehensive Study of Mithi River Polluted Stretches Chapter VIII Source Receptor Modeling
133
among variables. A value higher than about 0.10 or so may indicate that your data are not
suitable for factor analysis.
Thus, the significance value obtained are all null, which indicate that there are significant
relationships among the various parameters analyzed at all the sampling points and probably
might have some common or related source contribution. 8.2.3 Communalities Communalities indicate the amount of variance in each variable that is accounted for. Initial
communalities are estimates of the variance in each variable accounted for by all components
or factors. For principal components analysis, this is always equal to 1.0 (for correlation
analyses) or the variance of the variable (for covariance analyses).
Extraction communalities are estimates of the variance in each variable accounted for by the
factors (or components) in the factor solution. Small values indicate variables that do not fit well
with the factor solution, and should possibly be dropped from the analysis. Values for
communalities range from 0 (completely unrelated) to 1 (completely determined).
Table 8.5 Communalities for River & Nallah Samples
Initial Extraction for River
Extraction for Nallah
pH 1.000 .691 .619 COD 1.000 .957 .919 BOD 1.000 .957 .928 TSS 1.000 .895 .769 O&G 1.000 .863 .415 Cond 1.000 .935 .898 TDS 1.000 .961 .963 Chloride 1.000 .953 .932 Alk 1.000 .892 .503 Hard 1.000 .947 .962 SO4 1.000 .853 .951 PO4 1.000 .702 .525 NO3 1.000 .722 .497 MPN 1.000 .447 .667
Extraction Method: Principal Component Analysis Thus from the Table 8.5, it can be very well stated that all the extracted communalities for both
river and nallahs for all parameters are well defined by the extracted factors, since the
communalities values are all higher than 0.5 except for MPN in river since several of the

Comprehensive Study of Mithi River Polluted Stretches Chapter VIII Source Receptor Modeling
134
analysis data is presented in form of >1600 values and not the absolute number of colonies
whereas O&G, NO3& Alkalinity in Nallahs. However, there exist a lot of variations among the
extracted communalities of the metals at different sampling locations as well as among the
samples collected from same locations, which in turn indicates the influence of different sources
for specific parameters. The communalities can be converted into percentage values that are
defined by the extracted factors.
8.2.4 Total Variance The Tables 8.6 & 8.7represents eigenvalues, variance explained, and cumulative variance
explained for the factor solution for river and nallah respectively. The first panel gives values
based on initial eigenvalues. For the initial solution, there are as many components or factors as
there are variables i.e. 14 factors for 14physico-chemical and organic parameters as variables.
The “Total” column gives the amount of variance in the observed variables accounted for by
each component or factor. The “% of Variance” column gives the percent of variance accounted
for by each specific factor or component, relative to the total variance in all the variables. The
“Cumulative %” column gives the percent of variance accounted for by all factors or components
up to and including the current one. For instance the Cumulative % for the second factor is the
sum of the % of Variance for the first and second factors. In a good factor analysis, there are a
few factors that explain majority of the variance and the rest of the factors explain relatively
small amounts of variance and are not used for interpretation. The Extraction Sums of Squared
Loadings group gives information regarding the extracted factors or components. For principal
components extraction, these values will be the same as those reported under Initial
Eigenvalues. The factor rotation results in the “Rotation Sums of Squared Loadings” group. The
variance accounted for by rotated factors or components are normally different from those
reported for the extraction but the Cumulative % for the set of factors or components will always
be the same. In the present study either of the initial or rotated values are considered though
both are depicted in the respective Tables, whichever are found to be more appropriate for ease
of representation.
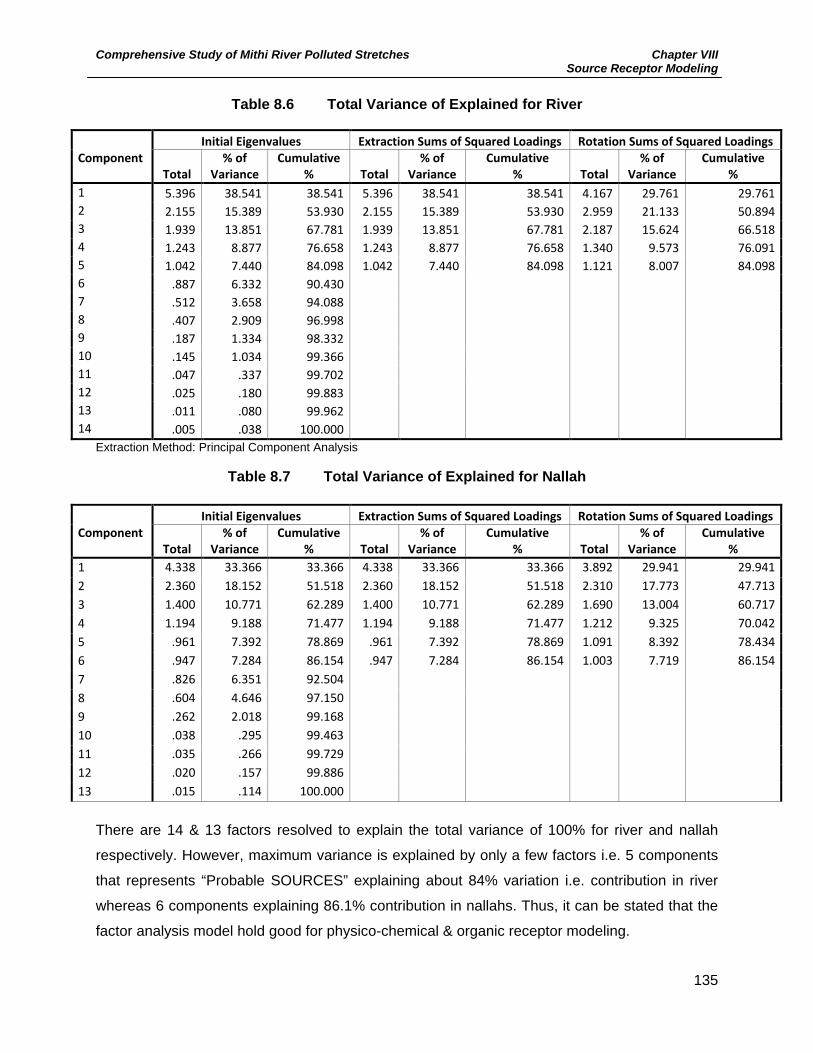
Comprehensive Study of Mithi River Polluted Stretches Chapter VIII Source Receptor Modeling
135
Table 8.6 Total Variance of Explained for River
Component
Initial Eigenvalues Extraction Sums of Squared Loadings Rotation Sums of Squared Loadings
Total % of
Variance Cumulative
% Total % of
Variance Cumulative
% Total % of
Variance Cumulative
% 1 5.396 38.541 38.541 5.396 38.541 38.541 4.167 29.761 29.761 2 2.155 15.389 53.930 2.155 15.389 53.930 2.959 21.133 50.894 3 1.939 13.851 67.781 1.939 13.851 67.781 2.187 15.624 66.518 4 1.243 8.877 76.658 1.243 8.877 76.658 1.340 9.573 76.091 5 1.042 7.440 84.098 1.042 7.440 84.098 1.121 8.007 84.098 6 .887 6.332 90.430 7 .512 3.658 94.088 8 .407 2.909 96.998 9 .187 1.334 98.332 10 .145 1.034 99.366 11 .047 .337 99.702 12 .025 .180 99.883 13 .011 .080 99.962 14 .005 .038 100.000
Extraction Method: Principal Component Analysis
Table 8.7 Total Variance of Explained for Nallah
Component
Initial Eigenvalues Extraction Sums of Squared Loadings Rotation Sums of Squared Loadings
Total % of
Variance Cumulative
% Total % of
Variance Cumulative
% Total % of
Variance Cumulative
% 1 4.338 33.366 33.366 4.338 33.366 33.366 3.892 29.941 29.941 2 2.360 18.152 51.518 2.360 18.152 51.518 2.310 17.773 47.713 3 1.400 10.771 62.289 1.400 10.771 62.289 1.690 13.004 60.717 4 1.194 9.188 71.477 1.194 9.188 71.477 1.212 9.325 70.042 5 .961 7.392 78.869 .961 7.392 78.869 1.091 8.392 78.434 6 .947 7.284 86.154 .947 7.284 86.154 1.003 7.719 86.154 7 .826 6.351 92.504 8 .604 4.646 97.150 9 .262 2.018 99.168 10 .038 .295 99.463 11 .035 .266 99.729 12 .020 .157 99.886 13 .015 .114 100.000
There are 14 & 13 factors resolved to explain the total variance of 100% for river and nallah
respectively. However, maximum variance is explained by only a few factors i.e. 5 components
that represents “Probable SOURCES” explaining about 84% variation i.e. contribution in river
whereas 6 components explaining 86.1% contribution in nallahs. Thus, it can be stated that the
factor analysis model hold good for physico-chemical & organic receptor modeling.
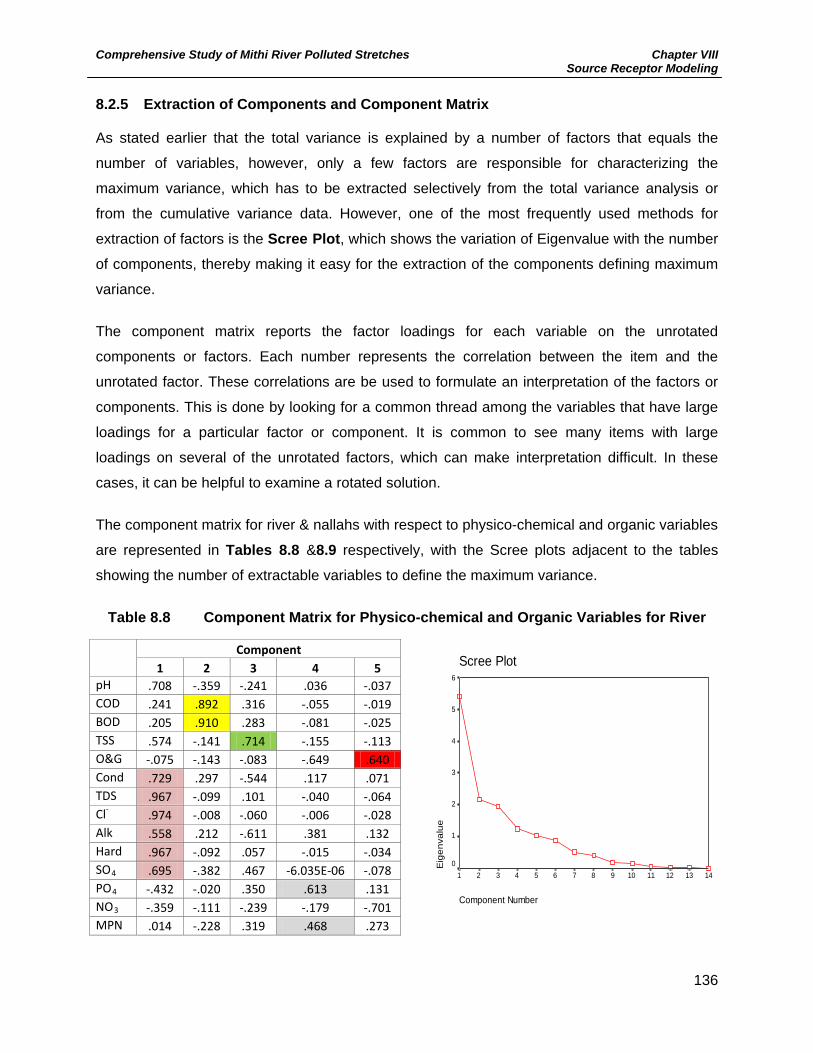
Comprehensive Study of Mithi River Polluted Stretches Chapter VIII Source Receptor Modeling
136
8.2.5 Extraction of Components and Component Matrix As stated earlier that the total variance is explained by a number of factors that equals the
number of variables, however, only a few factors are responsible for characterizing the
maximum variance, which has to be extracted selectively from the total variance analysis or
from the cumulative variance data. However, one of the most frequently used methods for
extraction of factors is the Scree Plot, which shows the variation of Eigenvalue with the number
of components, thereby making it easy for the extraction of the components defining maximum
variance.
The component matrix reports the factor loadings for each variable on the unrotated
components or factors. Each number represents the correlation between the item and the
unrotated factor. These correlations are be used to formulate an interpretation of the factors or
components. This is done by looking for a common thread among the variables that have large
loadings for a particular factor or component. It is common to see many items with large
loadings on several of the unrotated factors, which can make interpretation difficult. In these
cases, it can be helpful to examine a rotated solution.
The component matrix for river & nallahs with respect to physico-chemical and organic variables
are represented in Tables 8.8 &8.9 respectively, with the Scree plots adjacent to the tables
showing the number of extractable variables to define the maximum variance.
Table 8.8 Component Matrix for Physico-chemical and Organic Variables for River
Component 1 2 3 4 5
pH .708 -.359 -.241 .036 -.037 COD .241 .892 .316 -.055 -.019 BOD .205 .910 .283 -.081 -.025 TSS .574 -.141 .714 -.155 -.113 O&G -.075 -.143 -.083 -.649 .640 Cond .729 .297 -.544 .117 .071 TDS .967 -.099 .101 -.040 -.064 Cl- .974 -.008 -.060 -.006 -.028 Alk .558 .212 -.611 .381 .132 Hard .967 -.092 .057 -.015 -.034 SO4 .695 -.382 .467 -6.035E-06 -.078 PO4 -.432 -.020 .350 .613 .131 NO3 -.359 -.111 -.239 -.179 -.701 MPN .014 -.228 .319 .468 .273
Scree Plot
Component Number
1413121110987654321
Eig
enva
lue
6
5
4
3
2
1
0

Comprehensive Study of Mithi River Polluted Stretches Chapter VIII Source Receptor Modeling
137
The 5 components extracted through FA represent 5 different or combined sources contributing
to the river water characteristics. Those parameters that are dependent on each other and are
correlated to greater extent are highlighted by a common colour code which is almost in line
with those presented Correlation matrix. The first component representing Conductivity,
Chlorides, hardness, SO4, TDS & Alkalinity can be surely allocated to tidal influence i.e. sea
water. For almost half of the river, tidal influence is prominently observed and thereby very high
TDS and chloride contents ultimately resulting in higher conductivity. Thereby it can be
predicted that almost 30% of source characteristics in river is influenced by sea water intrusion.
It is important to note that it is not the volume of water which is represented by these figures but
only the characteristics.
The 2nd component which presents very highly correlated COD and BOD forms the source of
domestic water. It is further substantiated by sewage water characteristics of almost 90% of
nallahs showing consistent COD to BOD ratio of 2.5 to 3.5 which otherwise from industrial areas
seem to be highly variable. Research and publications across the globe have established COD
& BOD correlation and have assigned these variables to sewage sources and thereby in Mithi
River it can be stated that almost 21%of characteristics are directly from COD-BOD bearing
parameters i.e. sewage.
Sewage wastewater also reflects other characteristic features that are represented by the
components 3 & 4 in form of correlation for Total Suspended Solid load [TSS] & Most Probable
Number [MPN] & PO4. Interestingly enough TSS has been associated with raw sewage which is
known to be directly discharged into Mithi and thereby it would be more appropriate to assign
the same to sewage inputs. On the other hand MPN value is definitely associated with sewage
finding its way via human excreta whereas though PO4 can be associated with either sewage or
agricultural runoffs, in this particular case since there are not agricultural inputs around the Mithi
RoW area, it can be assumed to be aligning sewage sources. Thereby these two sources
representing domestic wastewater can be assumed to contribute about 15.6% & 9.5%
respectively.
The 5th component represents an independent source with single parameter i.e. Oil and Grease.
It is evident from the characteristics of source sampling carried out in industrial areas as well as
portions of nallahs from these industrially active zones around Mithi that several samples were
observed to have extremely high oil and grease content to the extent that it was impossible to
carryout some of the analysis associated with microbiology. Samples from KBM compound,

Comprehensive Study of Mithi River Polluted Stretches Chapter VIII Source Receptor Modeling
138
Bamandaya Pada representing industrial zones show maximum O&G concentrations
>1000mg/lit substantiating O&G to represent industrial sources. These assumptions are further
clarified by survey details that present automobile washing centre to be one of the most
prominent industrial activities around the banks of Mithi in almost all critical sections of the river.
Thereby, the 5th component contributing to almost 7 to 8% can be attributed to industrial
sources as far as characteristics of Mithi River are concerned.
In conclusion, within the ambit of 84% variations explained by 5 components presenting sources
of contribution to Mithi River as per the Correlation Matrix and computed using Component
Matrix, 7 to 8% is contributed by Industrial Sources whereas 30% by Sea Water under tidal
influence and almost 50% by domestic sewage. A more elaborate micro level analysis achieved
by extracting all 14 components further substantiates sewage water contributes to about 60% to
65% variations in Mithi.
Table 8.9 Component Matrix for Physico-chemical and Organic Variables for Nallahs
Component
1 2 3 4 5 6 COD -.250 .904 -.129 -.136 -.076 .057 BOD -.253 .909 -.120 -.139 -.056 .054 TSS .690 .216 -.519 -.078 .023 -.123 O&G -.098 -.180 -.140 -.339 .228 .873 Cond .392 .048 .814 -.321 -.044 .004 TDS .969 .070 -.153 .013 .044 .019 Cl- .939 .029 -.166 .148 .007 .069 Alk .204 .279 .303 .493 .432 .043 Hard .963 .075 -.169 -.068 .045 .011 SO4 .859 .087 .422 -.183 -.019 .050 PO4 -.125 .626 .192 .202 .425 .026 NO3 -.149 -.373 -.172 -.092 .680 -.197 MPN .079 -.081 .036 .762 -.252 .338
In order to ascertain the assumptions considered in assigning sources to component matrix and
correlation matrix, parameters of nallah effluents are too subjected to similar interpretation only
to reveal that TDS, chlorides, hardness & SO4 forms the 1st component resembling tidal
influence in nallahs too. This would be a subject of debate though as already stated most of the
confluence points of nallahs entering Vakola forming almost 50% of samples considered in the
nallah water receptor model are subjected to tidal intrusion and thereby resulting in such
behavior of component characteristics. This may not be of significant impact in this particular
discussion since nallah receptor modeling is used only to substantiate the industrial source
Scree Plot
Component Number
13121110987654321
Eig
enva
lue
5
4
3
2
1
0

Comprehensive Study of Mithi River Polluted Stretches Chapter VIII Source Receptor Modeling
139
characterization that is represented as 6th Component again contributing 7.7% similar to that
observed in case of river samples. On the other hand receptor model for nallah also supports
and signifies contribution of domestic wastewater through 4 of extracted components in form of
COD-BOD, TSS, MPN and NO3 attributing about 50% cumulative variance which again is in line
with those represented by receptor model of river water.
8.2.6 Factor Scores The Factor Score Coefficient Matrix shows values used to compute factor scores for each case.
For each case, the factor score is computed by multiplying variable values by factor score
coefficients. The Factor Score Coefficient Matrix shows values used to compute factor scores
for each case. For each case, the factor score is computed by multiplying variable values by
factor score coefficients. For principal component models, these give exact component scores
as depicted in Table 8.10for river& Table 8.11 for Nallahs.
Table 8.10 Component Score Coefficient Matrix for River
Component
1 2 3 4 5 pH .101 .130 -.182 -.040 -.025 COD -.008 -.023 .448 -.021 -.018 BOD -.020 -.022 .450 -.047 -.011 TSS .310 -.271 .092 .009 -.020 O&G -.030 -.049 -.025 -.074 .804 Cond -.087 .345 .041 -.038 .008 TDS .196 .034 .002 -.040 -.022 Cl- .137 .117 .011 -.041 -.010 Alk -.155 .426 -.025 .140 -.063 Hard .178 .063 -.003 -.020 -.010 SO4 .281 -.143 -.062 .074 -.051 PO4 -.066 .020 .011 .509 -.186 NO3 .026 -.144 -.107 -.497 -.465 MPN .019 .046 -.059 .493 .003
Table 8.11 Component Score Coefficient Matrix for Nallah
Component
1 2 3 4 5 6 COD .030 .422 -.013 -.032 .003 .033 BOD .028 .421 -.011 -.016 -.012 .035 TSS .298 .106 -.241 -.106 -.137 -.069 O&G .021 .041 .020 .009 .038 .999 Cond -.127 -.009 .632 .015 -.069 .000

Comprehensive Study of Mithi River Polluted Stretches Chapter VIII Source Receptor Modeling
140
Component
1 2 3 4 5 6 TDS .251 -.007 -.026 .027 -.005 .025 Cl- .242 -.035 -.071 .056 .112 .033 Alk -.007 -.086 -.011 .654 .046 -.004 Hard .256 .011 -.011 -.013 -.055 .039 SO4 .077 -.001 .387 .022 -.013 .041 PO4 -.024 .130 -.002 .529 -.123 .044 NO3 .028 -.235 -.215 .361 -.597 .056 MPN -.021 -.111 -.155 .182 .729 .065
Extraction Method: Principal Component Analysis. Rotation Method: Varimax with Kaiser Normalization. 8.2.7 Industrial Source Characterization using Receptor Model for Metal From the receptor model runs of river and nallah samples, it is amply clear that industrial
sources contribute about 7 to 8% variations in characteristics of Mithi River. However, further
attempt is made in order to assess which types of industries are responsible for such characters
within the 7 to 8% industrial source using metals are predominant parameters emerging from
industrial sources only. Though it is very preliminary, this could form a framework that could be
taken to its logical conclusions through more rigorous and extensive sampling and analysis of
industrial sources. Table 8.12 represents correlation matrix for metals from industrial source
sampling.
Table 8.12 Covariance Matrix for Metals from Industrial Sources
Component
1 2 3 Cr+6 .700 -.297 -.190 Cu .741 .578 .267 Fe -.083 .852 .023 Pb -.051 .592 -.047 Mn -.057 .899 .120 Ni -.031 -.070 .979 Cd -.115 -.705 .146 CO .980 .006 .001 Zn .980 .010 .005
Extraction Method: Principal Component Analysis. Rotation Method: Varimax with Kaiser Normalization. A Rotation converged in 4 iterations.
Co, Zn are almost perfectly correlated whereas Cr+6 too finds its way of significance in the 1st
source of industrial contamination that is assumed to influence overall industrial source
contribution whereas Fe and Mn forms 2nd source through extracted components in Varimax
rotation. The third component is independent and present Ni as the parameter of significance
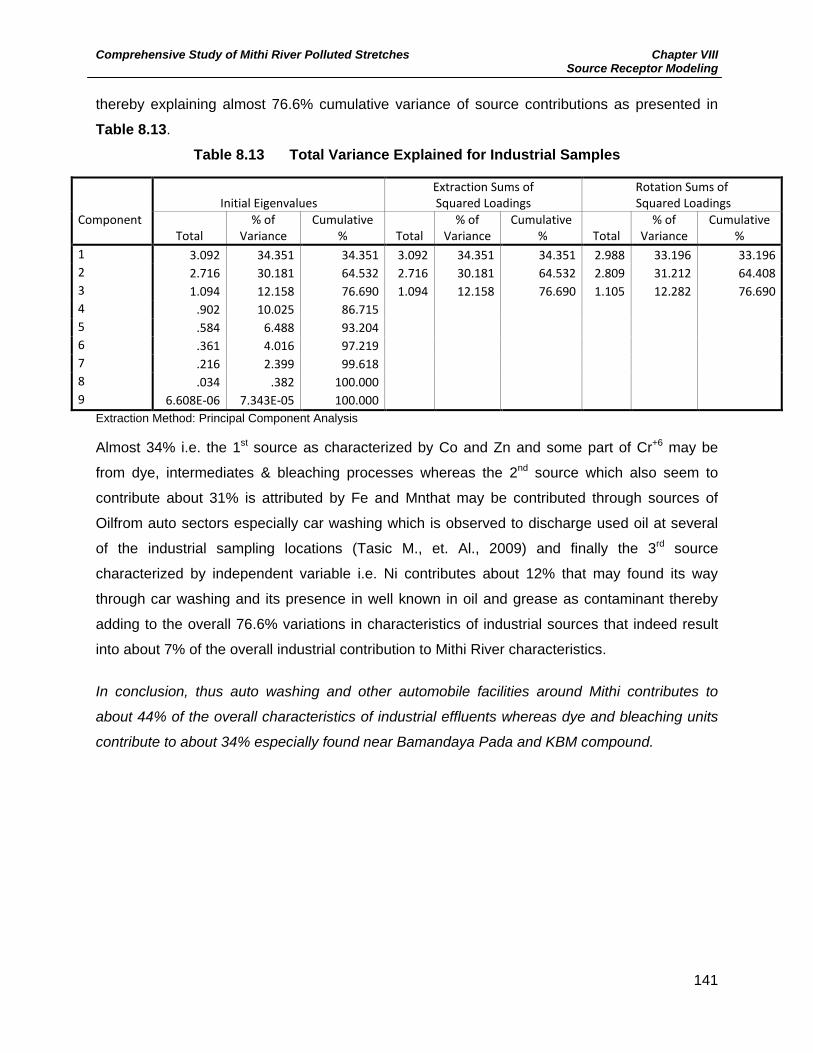
Comprehensive Study of Mithi River Polluted Stretches Chapter VIII Source Receptor Modeling
141
thereby explaining almost 76.6% cumulative variance of source contributions as presented in
Table 8.13.
Table 8.13 Total Variance Explained for Industrial Samples
Component
Initial Eigenvalues Extraction Sums of Squared Loadings
Rotation Sums of Squared Loadings
Total % of
Variance Cumulative
% Total % of
Variance Cumulative
% Total % of
Variance Cumulative
% 1 3.092 34.351 34.351 3.092 34.351 34.351 2.988 33.196 33.196 2 2.716 30.181 64.532 2.716 30.181 64.532 2.809 31.212 64.408 3 1.094 12.158 76.690 1.094 12.158 76.690 1.105 12.282 76.690 4 .902 10.025 86.715 5 .584 6.488 93.204 6 .361 4.016 97.219 7 .216 2.399 99.618 8 .034 .382 100.000 9 6.608E-06 7.343E-05 100.000
Extraction Method: Principal Component Analysis Almost 34% i.e. the 1st source as characterized by Co and Zn and some part of Cr+6 may be
from dye, intermediates & bleaching processes whereas the 2nd source which also seem to
contribute about 31% is attributed by Fe and Mnthat may be contributed through sources of
Oilfrom auto sectors especially car washing which is observed to discharge used oil at several
of the industrial sampling locations (Tasic M., et. Al., 2009) and finally the 3rd source
characterized by independent variable i.e. Ni contributes about 12% that may found its way
through car washing and its presence in well known in oil and grease as contaminant thereby
adding to the overall 76.6% variations in characteristics of industrial sources that indeed result
into about 7% of the overall industrial contribution to Mithi River characteristics.
In conclusion, thus auto washing and other automobile facilities around Mithi contributes to
about 44% of the overall characteristics of industrial effluents whereas dye and bleaching units
contribute to about 34% especially found near Bamandaya Pada and KBM compound.

Comprehensive Study of Mithi River Polluted Stretches Chapter VIII Source Receptor Modeling
142
References Gupta A., Gupta I., P Khanna, Application of Statistical Method in Environmental Science and Engineering, NEERI, (1997). Jolliffe I. T., Principal Component Analysis, Springer, New York, (1986). Jackson J.E., A User’s Guide to Principal Components, John., New York, (1991). Reisenholer E., Adami G., and Favretto A., J. Anal.Chem., 354, 729, (1996). Bellheimer D., Envirometrics, 12, 451-467, (2001). Pinto J.P., Stevens R. K., Willis R. D., Kellogg R., Mamane Y., Novak J., Santroch J., Benes I., Lenicek J. and Bures V., Czech Air Quality Monitoring and Receptor Modeling Study, Environ. Sci. Technol., 32, 843-854, (1998). Reisenhofer E., Picciotto A., and Li D., A factor analysis approach to the study of the eutrophication of a shallow, temperate lake (San Daniele, North Eastern Italy), Analytica Chemica Acta, 306, 99-106, (1995). Ying L. G. and Liu Y.C., A model of objective weighting for EIA, Environmental Monitoring and assessment, 36(2), 169-182, (1995). Mehloch J. L., Multivariate techniques for water quality analysis, J. of Env. Engg., Division, ASCE, 1119-1132, (1974). Tasic M., Mijic Z., Rasjic S., et. al., Source Apportionment of Atmospheric Bulk Deposition in Belgrade urban Area using Positive Matrix Factorization, J. of Physics: Conference Series 162 (2009) 012018.

Comprehensive Study of Mithi River Polluted Stretches Chapter IX Conservation Management Plan
Chapter IX
9.0 Background ................................................................................................................................. 143
9.1 Conservation Management Philosophy .............................................................................. 143
9.1.1 At the Source Mitigation / Management Plan .................................................................. 143
9.1.1.1 Open Defecation ..................................................................................................... 144
9.1.1.2 Open Dumping of Solid Waste ............................................................................. 144
9.1.1.3 Industrial Discharges ............................................................................................. 145
9.1.2 In The Path Mitigation / Management Plan ..................................................................... 149
9.1.3 End of Pipe Mitigation / Management Plan...................................................................... 151
9.1.4 Regulation Through Online/ Other Monitoring Mechanism ............................................ 153
9.1.5 Sensitization Program ....................................................................................................... 154
9.2 Priority Based Management ................................................................................................. 154
9.2.1 Short Term Mitigation Measures ...................................................................................... 155
9.2.2 Long Term Management Measure ................................................................................... 157
9.2.3 Strategies for Transforming River Water Quality Based on Designated Use .................... 157
List of Tables
Table 9.1 Representative Industrial Types and Hydraulics Surveyed alongside Mithi River
Banks ...................................................................................................................... 145
Table 9.2 Criticality Based Characteristics of Nallahs ............................................................ 149
Table 9.3 Prioritized Stretches of Mithi River Requiring End of Pipe Treatment..................... 152
Table 9.4 Source Based Categorization of the Stretches ....................................................... 154
Table 9.5 Transitional Designated End Use Based Management Strategy for Mithi .............. 158
List of Figures
Figure 9.1 2CMD Batch Type ETP Design for Chemical & Car Washing Centre ................. 147
Figure 9.2 1M3/Hour Continuous Type ETP Design especially for Car Washing Centre ..... 148
Figure 9.3 Visuals of Typical CWT Design for Open Nallahs Entering Mithi River ............... 151
Figure 9.4 Typical CWT Design for Open Nallahs ................................................................ 151

Comprehensive Study of Mithi River Polluted Stretches Chapter IX Conservation Management Plan
143
Chapter IX Conservation Management Plan
9.0 Background Chapter III of this report outlined environmental – physical setting of Mithi River providing insight
to the land-use details of areas within RoW and their probable influence in terms of wastewater
discharges leading to pollution potential which is further corroborated by Chapters V & VI
demonstrating physic-chemical and biological parameters that account for the pollution. Critical
stretches of Mithi that needs prioritized intervention delineated in Chapter VII further helps
describe aspects of Mithi that have been part of discussions by various authors and agencies
publishing data regarding pollution in Mithi which is attempted & confirmed through Source
Receptor Modeling to assess contribution of domestic v/s industrial inputs to Mithi that is yet to
be reported by others and had been practically impossible to evaluate by conventional means.
This chapter takes the discussions to a new level through conservation management planning
and outlines designing & implementation needs for particular priority areas from the outputs of
earlier chapters forming this report. Attempt is also made to put forth detailed site specific plans
with budgetary estimates in order for decision to be made from a holistic point of view.
9.1 Conservation Management Philosophy Conventionally environmental management of wastewater is proposed through evaluating
needs of installing and operating sewage treatment plants which has also been part of earlier
published reports for Mithi and though the authors fully endorse such measures, the philosophy
for conservation in this report is in line with criticality indices developed for Mithi & thoroughly
based 3 principles i.e. at source, in path and end of the pipe. The identification of particular
sources, its physic-chemical and biological characteristics, hydraulics and extent of impacts in
study domain are all taken into account for planning environmental management that are outline
in the following sections.
9.1.1 At the Source Mitigation / Management Plan The criticality indices supported by ground survey and discussions with locals have identified 3
main issues at source that probably have led to potential pollution in Mithi though restricted in
some of the stretches.

Comprehensive Study of Mithi River Polluted Stretches Chapter IX Conservation Management Plan
144
9.1.1.1 Open Defecation Stretches I, II, III i.e. Origin of Mithi to JVLR through Filterpada and Gautam Nagar & finally
Stretch 16 i.e. Kalanagar to Mahim witnesses prominent open defecation not only aesthetically
hampering Mithi but also leading to potential hazards. These areas include slum populations
ranging from 2000 to 4000 dwelling almost on the banks of the river in each stretch. Though
some of the areas were previously provided with toilet blocks, most of them are now non-
functional and tampered with. Limited or no water supply to such facilities has also led to abolish
its use for the desired purposes. Thereby it is essential that these Stretches be immediately
provided with toilet blocks in line with Sulabh Sauchalaya that should be manned continuously
to avoid tampering with infrastructure and malpractices thereby limiting the very foremost
potential source of pollution in the initial part of Mithi itself. These facilities shall also be
augmented with in-situ sewage treatment units requiring minimal or no operation and
maintenance.
Considering the maximum population and worst case scenario of trends of growth in Mumbai,
each of these 4 stretches would require about 80 toilet blocks according to MCGM guidelines
(www.mcgm.gov.in giving details of city development plan) generating about 80 to 100CMD of
wastewater but will help segregate grey water from these areas thereby making it of secondary
concern though surely needs to be addressed.
9.1.1.2 Open Dumping of Solid Waste Almost all the stretches which faced open defecation as a critical issue also had solid waste
dumping identified as another cause of concern. Regular dumping of solid waste into the river
was often citied during the survey. Interestingly solid waste in most of the stretches such as I, II,
III & V were observed to form heaps in the river bifurcating and obstructing flow. Most of the
solid waste appeared to be household in form of plastics, paper and green waste however, none
of the places had visual evidence of hazardous waste though the same cannot be ruled out
knowing industrial habitation along the banks of river.
The solid waste also must result in leaching thereby polluting river water to considerable extent
and thereby needs a full-fledged solid waste management plan. Thereby it is recommended that
collection system such as door to door / ghanta gadis as available in other parts of urban
Mumbai are in place for slums surrounding Mithi. BMC shall install community bins to
accommodate about 1.5 to 2tons of waste from each of these stretches every day and further
put in place transfer and treatment facilities. In-vessel treatment technologies such as Organic
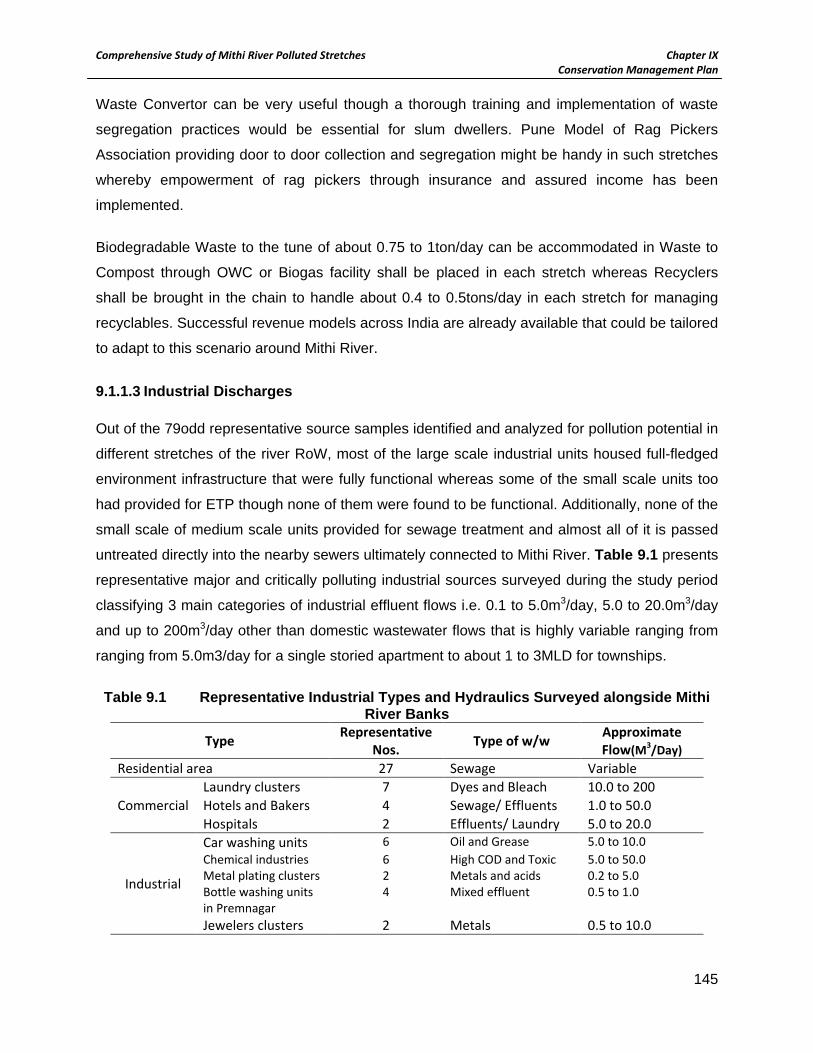
Comprehensive Study of Mithi River Polluted Stretches Chapter IX Conservation Management Plan
145
Waste Convertor can be very useful though a thorough training and implementation of waste
segregation practices would be essential for slum dwellers. Pune Model of Rag Pickers
Association providing door to door collection and segregation might be handy in such stretches
whereby empowerment of rag pickers through insurance and assured income has been
implemented.
Biodegradable Waste to the tune of about 0.75 to 1ton/day can be accommodated in Waste to
Compost through OWC or Biogas facility shall be placed in each stretch whereas Recyclers
shall be brought in the chain to handle about 0.4 to 0.5tons/day in each stretch for managing
recyclables. Successful revenue models across India are already available that could be tailored
to adapt to this scenario around Mithi River.
9.1.1.3 Industrial Discharges Out of the 79odd representative source samples identified and analyzed for pollution potential in
different stretches of the river RoW, most of the large scale industrial units housed full-fledged
environment infrastructure that were fully functional whereas some of the small scale units too
had provided for ETP though none of them were found to be functional. Additionally, none of the
small scale of medium scale units provided for sewage treatment and almost all of it is passed
untreated directly into the nearby sewers ultimately connected to Mithi River. Table 9.1 presents
representative major and critically polluting industrial sources surveyed during the study period
classifying 3 main categories of industrial effluent flows i.e. 0.1 to 5.0m3/day, 5.0 to 20.0m3/day
and up to 200m3/day other than domestic wastewater flows that is highly variable ranging from
ranging from 5.0m3/day for a single storied apartment to about 1 to 3MLD for townships. Table 9.1 Representative Industrial Types and Hydraulics Surveyed alongside Mithi
River Banks
Type Representative Nos. Type of w/w Approximate
Flow(M3/Day) Residential area 27 Sewage Variable
Commercial Laundry clusters 7 Dyes and Bleach 10.0 to 200 Hotels and Bakers 4 Sewage/ Effluents 1.0 to 50.0 Hospitals 2 Effluents/ Laundry 5.0 to 20.0
Industrial
Car washing units 6 Oil and Grease 5.0 to 10.0 Chemical industries 6 High COD and Toxic 5.0 to 50.0 Metal plating clusters 2 Metals and acids 0.2 to 5.0 Bottle washing units in Premnagar
4 Mixed effluent 0.5 to 1.0
Jewelers clusters 2 Metals 0.5 to 10.0
Comprehensive Study of Mithi River Polluted Stretches Chapter IX Conservation Management Plan
146
It is essential that at source effluent treatment facility be provided for those industries that are
letting out raw effluent of critical nature directly into the river and thereby leading to causes of
serious concern. In addition to the facility development, MPCB being the regulator of industrial
pollution, it is essential to first inventorize these industries through dialogue that would bring at
least identifiable and registered small and medium scale enterprises in the ambit of its pollution
control system. It is very well known that the Aurangabad Regional Office of MPCB in 2010-11
carried out one such successful mission of bringing in all car washing and automobile care
centre’s in the ambit of pollution control through Personal Hearing for each of those identified
ones and obtaining Bank Guarantees against submission of ETP design and implementation
within stipulated time of 2 to 3 months.
Similar mechanisms of deterrence through appropriate BG and timelines for implementation of
at source control for industries along river banks could be one of the most important
interventions that are expected to resolve industrial effluent discharge into river as an immediate
and top priority.
Discussions with owners of various such industries / vendors / hotel/restaurant have revealed
that there would be about 700 – 800 bakeries out of which 5 are large generating about
20m3/day of effluent whereas other may generate mere 0.2 to 0.5m3/day. Premnagar and
Dharavi areas house most of the bottle and drum washing activities with around 100 to 200 odd
such unorganized centre’s each generating between 0.1 to 0.2m3/day of effluent. There is
expected to be about 3000 to 5000 small Restaurants, hotels & eateries other than the street
vendors other than the Large Residential ones located on the banks of Mithi housing anywhere
between 10 to 50 seats with potential to generating 0.5 to 2.5m3/day.
In all, the hydraulic load of industrial effluents as computed from study or source receptor
modeling tends to be about 7 to 8% in worst case scenario which also includes those from
immediate sources of hotels and restaurants considered as part of industrial cluster represented
by oil and grease parameter as indicated by segregated independent source observed in the
modeling domain. Since the survey revealed numerous small eateries alongside river, it would
not be way off the mark to consider about 50% of the characteristics behavior of source to be
represented by these and therefore most conservative estimate of 18 to 20MLD from direct and
indirect industrial sources can be accounted for from industries that are outlined in Table 9.1&
described for their hydraulics above.
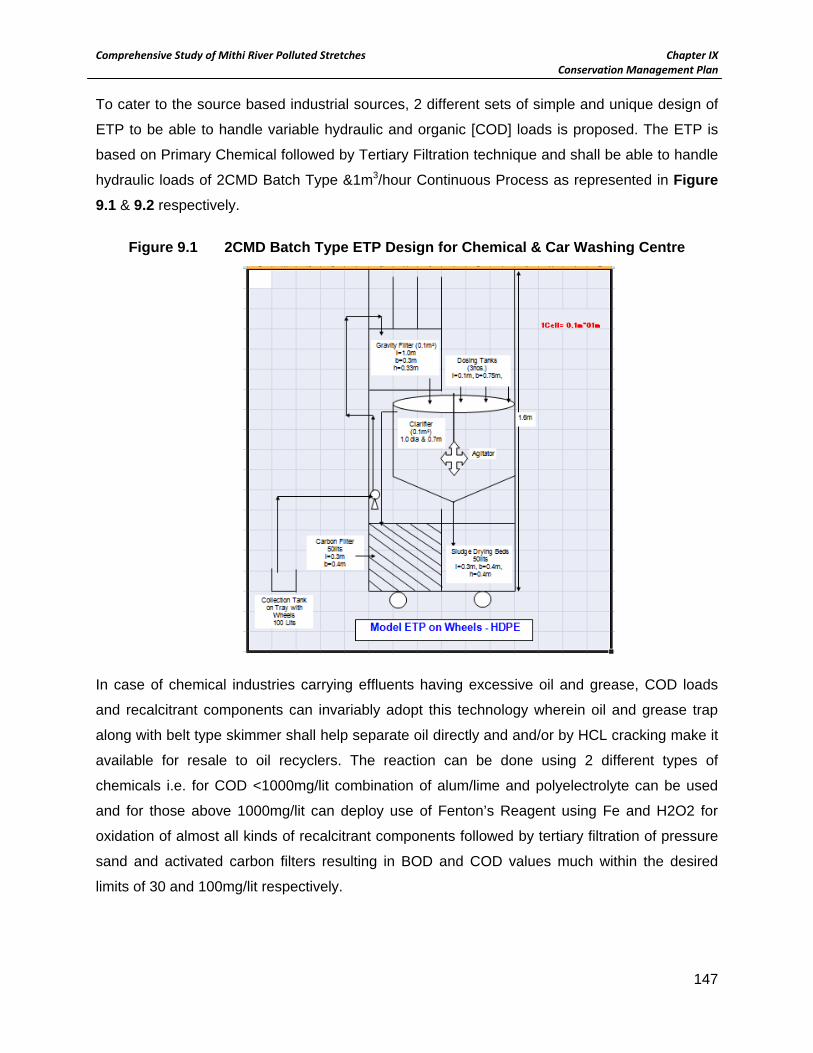
Comprehensive Study of Mithi River Polluted Stretches Chapter IX Conservation Management Plan
147
To cater to the source based industrial sources, 2 different sets of simple and unique design of
ETP to be able to handle variable hydraulic and organic [COD] loads is proposed. The ETP is
based on Primary Chemical followed by Tertiary Filtration technique and shall be able to handle
hydraulic loads of 2CMD Batch Type &1m3/hour Continuous Process as represented in Figure 9.1 & 9.2 respectively.
Figure 9.1 2CMD Batch Type ETP Design for Chemical & Car Washing Centre
In case of chemical industries carrying effluents having excessive oil and grease, COD loads
and recalcitrant components can invariably adopt this technology wherein oil and grease trap
along with belt type skimmer shall help separate oil directly and and/or by HCL cracking make it
available for resale to oil recyclers. The reaction can be done using 2 different types of
chemicals i.e. for COD <1000mg/lit combination of alum/lime and polyelectrolyte can be used
and for those above 1000mg/lit can deploy use of Fenton’s Reagent using Fe and H2O2 for
oxidation of almost all kinds of recalcitrant components followed by tertiary filtration of pressure
sand and activated carbon filters resulting in BOD and COD values much within the desired
limits of 30 and 100mg/lit respectively.

Comprehensive Study of Mithi River Polluted Stretches Chapter IX Conservation Management Plan
148
On the other hand for flows in the range of 20 to 25m3/day, though the treatment scheme shall
be restricted to alum/lime and polyelectrolyte, the hydraulic load handling design needs to be
altered accordingly.
Figure 9.2 1M3/Hour Continuous Type ETP Design especially for Car Washing Centre
Sludge generated through the primary process shall qualify as hazardous and need to be sent
to CHWTSDF. The units are designed to be Portable in nature and requires not more than
maximum area of 3m x 1.5m area which is quite affordable & available with most of the
industrial units. The unit details along with tentative financial estimates & pictures of
implemented systems are outlined in Annexure IX – I. For a better governance and monitoring needs in terms of successful implementation, these
units can be fitted with low cost online conventional parameters monitoring equipments such as
pH, TDS and conductivity and in certain cases organics as the case may be which could be
indeed connected to the online portal of MPCB generating data to support efficiency and
continuous operation of these units.
Feed Pump
Filter Feed Pump
Agitator
Final Collection Tank
ACF
Raw Water Tank
Oil Skimmer
Drying Beds
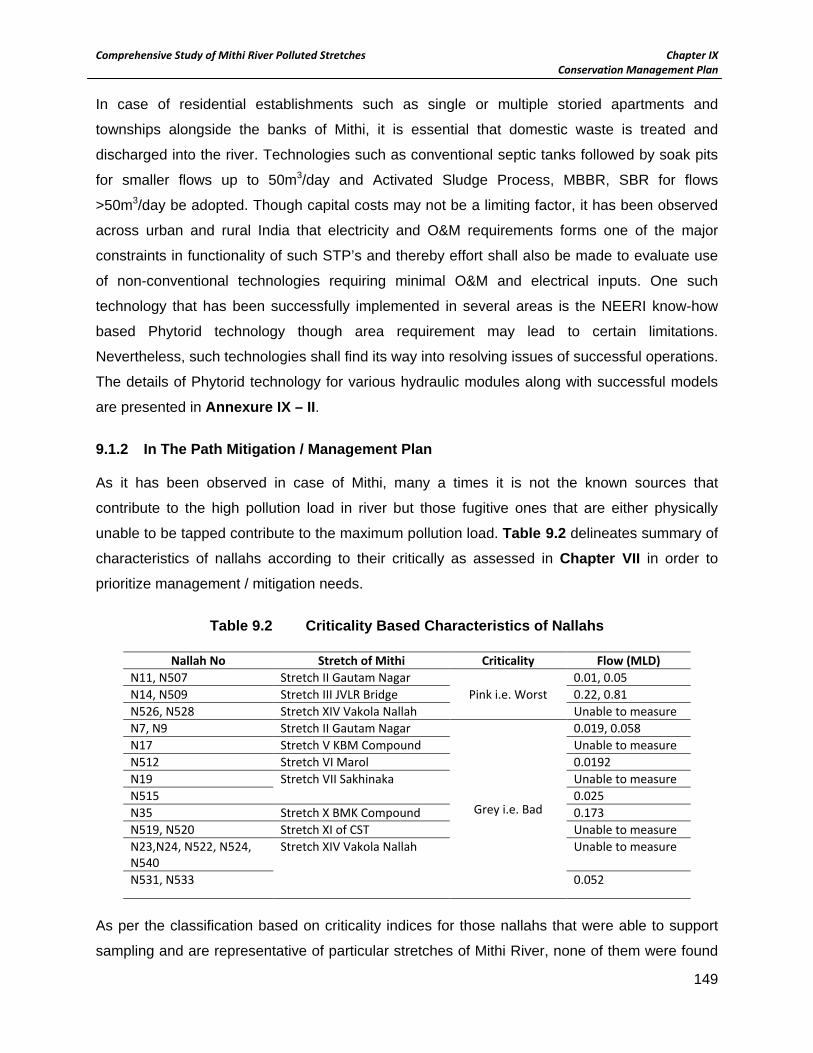
Comprehensive Study of Mithi River Polluted Stretches Chapter IX Conservation Management Plan
149
In case of residential establishments such as single or multiple storied apartments and
townships alongside the banks of Mithi, it is essential that domestic waste is treated and
discharged into the river. Technologies such as conventional septic tanks followed by soak pits
for smaller flows up to 50m3/day and Activated Sludge Process, MBBR, SBR for flows
>50m3/day be adopted. Though capital costs may not be a limiting factor, it has been observed
across urban and rural India that electricity and O&M requirements forms one of the major
constraints in functionality of such STP’s and thereby effort shall also be made to evaluate use
of non-conventional technologies requiring minimal O&M and electrical inputs. One such
technology that has been successfully implemented in several areas is the NEERI know-how
based Phytorid technology though area requirement may lead to certain limitations.
Nevertheless, such technologies shall find its way into resolving issues of successful operations.
The details of Phytorid technology for various hydraulic modules along with successful models
are presented in Annexure IX – II. 9.1.2 In The Path Mitigation / Management Plan As it has been observed in case of Mithi, many a times it is not the known sources that
contribute to the high pollution load in river but those fugitive ones that are either physically
unable to be tapped contribute to the maximum pollution load. Table 9.2 delineates summary of
characteristics of nallahs according to their critically as assessed in Chapter VII in order to
prioritize management / mitigation needs.
Table 9.2 Criticality Based Characteristics of Nallahs
Nallah No Stretch of Mithi Criticality Flow (MLD)
N11, N507 Stretch II Gautam Nagar Pink i.e. Worst
0.01, 0.05 N14, N509 Stretch III JVLR Bridge 0.22, 0.81 N526, N528 Stretch XIV Vakola Nallah Unable to measure N7, N9 Stretch II Gautam Nagar
Grey i.e. Bad
0.019, 0.058 N17 Stretch V KBM Compound Unable to measure N512 Stretch VI Marol 0.0192 N19 Stretch VII Sakhinaka Unable to measure N515 0.025 N35 Stretch X BMK Compound 0.173 N519, N520 Stretch XI of CST Unable to measure N23,N24, N522, N524, N540
Stretch XIV Vakola Nallah Unable to measure
N531, N533 0.052
As per the classification based on criticality indices for those nallahs that were able to support
sampling and are representative of particular stretches of Mithi River, none of them were found

Comprehensive Study of Mithi River Polluted Stretches Chapter IX Conservation Management Plan
150
to be critical as per the indices probably due to use of General Discharge Standards for Public
Sewer i.e. Schedule VI of EPA 1986, (b) category which stipulates extremely high limits for both
COD and BOD much beyond the general characteristics of sewage thereby even if small
hydraulic flows of industries add to the overall nallahs, the extremely high sewage content that
probably mixes in almost every such major nallah sampled makes it irrelevant in terms of
criticality.
However, 6 Pink coloured representing Worst and 14 Grey coloured representing Bad
characteristics needing priority of mitigation measures. Though 2 of Worst nature and 7 of Bad
nature are entering into Vakola which can be treated as a separate category from treatment
point of view, out of the other 27 nallahs identified & restricted along only 5 to 6 stretches of
Mithi requiring immediate intervention.
Most of these nallahs that were able to be approached physically and measured for hydraulics
showed extremely low flows ranging from 0.1 to 1.0MLD whereas N20 being an Open Nallah
located in Sakhinaka seemed to carry 22.6MLD wastewater and N503 that originated from
Dharavi and other surrounding areas also an Open Nallah entering Mithi in Kalanagar carried
604.8MLD other than the N2 nallah in Vakola carrying about 5.69MLD of wastewater also an
Open Nallah.
Being Open channels carrying either complex mixed effluents or sewage in entirety, these
nallahs require out of the box technology that can be implemented in-situ and thereby most rigid
in terms of accommodating highly variable hydraulic and organic load, requiring minimal or no
operation maintenance and mostly free from any electricity needs i.e. not even pumping or
pressure filtration. These nallahs being traversing through several residential habitations shall
also be welcomed if aesthetically pleasing in design and eco-friendly in nature. A typical visual
sketch of a design for open nallah like one in discussion can be use of using Constructed
Wetland Technology [CWT] option as depicted in Figure 9.3& 9.4 that tends to incorporate all
such features though it could be not very well adopted for extremely high flow like that of N503
which may also be under tidal influence.
CWT in these open channels shall have local species of semi-aquatic grasses such as
typhasps., canna sps., umbrella palm sps., etc and supported on metal or other appropriate
material grid / coconut husk / coir/ etc. whereby the roots of these grasses shall lead to effective
retention of wastewater thereby adding oxygen and reducing organics load also augmented by

Comprehensive Study of Mithi River Polluted Stretches Chapter IX Conservation Management Plan
151
turbulence creation through simple engineering means to lead to almost 80 – 90% pollution load
reduction.
Figure 9.3 Visuals of Typical CWT Design for Open Nallahs Entering Mithi River
Figure 9.4 Typical CWT Design for Open Nallahs
9.1.3 End of Pipe Mitigation / Management Plan

Comprehensive Study of Mithi River Polluted Stretches Chapter IX Conservation Management Plan
152
Even after thorough investigations of sources and in the path applications of technology for
wastewater treatment, it is inevitable that certain portions of wastewater shall find its way in to
the river since it is impossible that all the sources could be tapped and all those nallahs carrying
such waste loads be deployed with treatment technologies. Hence it would be essential that all
such remaining wastewater which in this case would be considerable in volume but mostly
devoid of critical characteristics of either industrial or direct toxic / recalcitrant load that would
find its way through major nallahs like the one from originating around Dharavi area described
earlier and could not be fitted with non-conventional / in-situ options shall require End of Pipe
facility such as Sewage Treatment Plant.
From the criticality point of view, these nallahs essentially carry only sewage and showed
parameters just within or marginally crossing the prescribed standards and thereby can be fitted
with simpler versions of technologies that can be easily & continuously operated. Although
MCGM and MMRDA through its recommendations as outlined in the summary of earlier studies
in Chapter I have already earmarked STP needs, a more elusive but complimentary
recommendation is discussed for end of pipe treatment.
Table 9.3outlines stretches of Mithi River which shall need intervention of varying degrees in
order to maintain the quality of Mithi waters to the desired standards of 30mg /lit BOD and TSS.
Since the river shows stretches mostly in the range of Bad to Worst based on Criticality Indices,
it would be appropriate that full-fledged technology intervention in terms of simple and
conventional technology shall be sufficient for desired purpose although hi-tech treatment
process shall surely be an added advantage provided they could be afforded in terms of
recurring expenditures.
Table 9.3 Prioritized Stretches of Mithi River Requiring End of Pipe Treatment
Stretch of Mithi River Colour
Index Cumulative Hydraulic
Flow (MLD) STP Capacity (MLD)
Filterpada
Pink i.e. Worst
2.0 2.0 Gautam Nagar 4.7 3.0 KBM Compound 57.6 10.0 Downstream of Sakhinaka 103.7 35.0 Downstream of CST 183.6 45.0 Downstream of Airport and 102.9 10.0 Downstream of Kalanagar 3927.3 Under tidal influence Upstream of BamandayaPada 48.8 40.0 Upstream of Mahim 3888.0 Under tidal influence Downstream of JVLR Grey i.e. 8.6 3.5

Comprehensive Study of Mithi River Polluted Stretches Chapter IX Conservation Management Plan
153
Stretch of Mithi River Colour Index
Cumulative Hydraulic Flow (MLD)
STP Capacity (MLD)
Downstream of BamandayaPada
Bad 48.8 Not required – already included in upstream
Downstream of BMK Compound
140.0 27.0
Downstream of Marol 67.8 9.0 Upstream of CST Bridge 183.6 Not required – already
included in downstream Upstream of Airport 111.5 Not required – already
included in downstream Safed Pool 100.1 15.0 MTNL Bridge 500.9 Under tidal influence
An interesting proposition is to directly have STP designed for equivalent hydraulic flows of
particular to a Stretch of Mithi through compensating for the earlier stretch and those that
represent Blue i.e. Average quality river water as per Criticality Index. Thereby as depicted in
Table 9.3 if at all STP’s to treat stretch specific hydraulic loads via disposing back the treated
water into river are proposed it would be much more beneficial in long run.
The same shall need to have a closed loop system of collection of wastewater and put in place
sewage treatment plant using appropriate technology in each stretch identified as above and
maintaining the minimum flow in river through disposal of treated waters into it. The only stretch
near MTNL Bridge needs further investigation since the flow of 448MLD seems to have tidal
influence. Vakola too can be separately treated which shows a flow of about 80 to 90MLD
though tidal influence is also witnessed here.
Thereby the 3 fold mitigation plan as proposed if applied complimentary to each other
appropriately at sources of criticality, in-situ nallahs wastewater treatment and end of pipe
application of STP by tapping nallahs fugitive and let out wastewater via earlier options
ultimately disposing treated water back into river in same stretch would not only reduce
synergistic pollution potential but would also reduce loads on hydraulic requirement in
subsequent stretches of river leading to desirable standards of Mithi.
9.1.4 Regulation Through Online/ Other Monitoring Mechanism In the process of management, monitoring plays crucial role for not only governance but also
helps better understanding of efficient implementation on one hand and operation / functioning
of treatment processes on the other. To achieve a win-win situation, it is proposed that each of
the virtual stretch upstream and downstream of management measures applied shall be

Comprehensive Study of Mithi River Polluted Stretches Chapter IX Conservation Management Plan
154
equipped with installations of online criteria pollutant monitors to analyze pH, TDS, Conductivity
& DO. It is also advisable to install monitors for TOC & BOD online in river. These can be
directly linked to MPCB portal and information is made public which shall not only help evaluate
efforts of MPCB but also help create sense of responsibility amongst those involved illegal
discharges as well as those who are implementing management measures.
It is also recommended to explore possible use of Bio-Assay Test to serve acceptability of
extent of pollution to common person and Sediment Analysis to substantiate re-surfacing of
pollutants in certain stretches as well as background pollution/ accumulation if any.
9.1.5 Sensitization Program It is highly recommended that MPCB along with other stakeholders should plan a sensitization
program for at least along RoW of Mithi for Rejuvenation and Conservation incorporating means
and measures to connect to people and carryout inclusive management.
9.2 Priority Based Management The existing use of Mithi River water does not have a pre-defined desirable end-use and
thereby it has been compared with the surface water discharge standards. It is equally
interesting to know that these discharge standards when translated into Criticality criteria
reflects certain stretches of river having marginally high concentration of few parameters.
Thereby, in accordance with the survey and discussions, since the existing use of Mithi River is
not aligned to any particular one and almost all part of the water in river ultimately flows to
Arabian Sea through Mahim Creek, it is recommended that preliminary treatment facilities at all
the sources especially industrial as mentioned in Table 9.1 above shall be necessary to achieve
minimum quality of river water in line with the desirable inland surface discharge standards in
the following manner so as to achieve BOD & COD concentration of 30mg/l & 100mg/l. All other
parameters shall be in line with desirable inland water discharge standards respectively. Table 9.4 summarizes the stretch-wise proposed management plan based on the observed sources of
pollution in each of the stretch.
Table 9.4 Source Based Categorization of the Stretches
Stretch Source of wastewater Proposed Management Plan
I- Filterpada Domestic STP with capacity of Approx. 2MLD II- Gautam Nagar Domestic STP with capacity of Approx. 3MLD III - JVLR Bridge Industrial Mixed with domestic CETP of capacity Approx.3.5MLD IV – Bamandaya Pada Domestic STP of capacity 40MLD at the upstream

Comprehensive Study of Mithi River Polluted Stretches Chapter IX Conservation Management Plan
155
Stretch Source of wastewater Proposed Management Plan V - KBM Compound Industrial Mixed with domestic CETP of capacity 10MLD at source for
industries and domestic wastewater VI - Marol Industrial Mixed with domestic CETP of capacity 9MLD VII - Sakhinaka Industrial Mixed with domestic CETP of capacity 35MLD at the downstream VIII - Domestic Airport Domestic STP of capacity 10MLD IX - Safed Pool Mostly Domestic STP of capacity 15MLD X - BMK Compound Domestic STP of capacity 27MLD at the downstream XI - CST Bridge Domestic STP of capacity 45MLD at the downstream XII - MTNL Bridge Domestic Under tidal influence XIII - BKC Domestic Under tidal influence XIV - Vakola Nallah Domestic Under tidal influence XV - Kalanagar Domestic Under tidal influence XVI - Mahim Domestic Under tidal influence *ETP to be installed as per recommended for industrial sources in all the stretches 9.2.1 Short Term Mitigation Measures 1. At The Source treatment facilities adopted as the first step for unorganized and small
clusters of industries such as auto-service centre, bakeries, laundries, bottle washing units,
etc.
2. Effective implementation of Operation and Maintenance of ETP/STP in Organized & large
scale industries including hotels & restaurants
3. Control over Open Defecation / solid waste dumping through installation of sulabh
sauchalaya concept and in-situ solid waste treatment facility in each stretch as described
earlier
4. Treatment facility to be installed for all designated Pink & Orange Colour coded Nallahs as
per Criticality Indices - either in-situ or ex-situ as defined in Table 9.2
5. All river stretches falling in the Pink colour indices shall be treated for equivalent flow and
disposing treated water back for maintaining minimum flow in the river
6. The treatment options shall all be confined mostly to those stretches of river with no tidal
influence whereas it shall be applicable to all nallahs and industrial source irrespective of its
location
7. Effective collection and transfer mechanism for sewage, industrial or otherwise source
wastewater shall be implemented and connected to proposed treatment facilities
8. Silt accumulation and removal though already an ongoing practice needs to be improved by
enhanced scientific & effective removal followed by scientific disposal especially silt
accumulated in the nallahs at the mouth of the river
9. Black coloured pigmentation observed on banks of river in certain stretches such as
downstream of confluence of Vakola Nallah on left bank of Mithi & downstream of CST

Comprehensive Study of Mithi River Polluted Stretches Chapter IX Conservation Management Plan
156
Bridge which may be probably resurfacing of historic pollutants needs to be scientifically
remediated

Comprehensive Study of Mithi River Polluted Stretches Chapter IX Conservation Management Plan
157
9.2.2 Long Term Management Measure Long term management plan for Mithi refers to achieving designated use of contact purpose
that shall be also desirable quality for Outdoor Bathing that could be termed as contact purpose
water i.e. 3mg/l of BOD as per Class B of the Primary Water Quality Standards that could also
be translated as approximately 10mg/l of COD though COD is not specified in the standards.
Tough not specified as standards, Metals shall be absent other than from crustal sources.
1. All those stretches of river represented by Pink colour code of Criticality as per indices shall
be equipped with tertiary and quaternary treatment facilities
2. The earlier fitted STP’s and treatment facilities for at source wastewater generators for short
term mitigations shall need up-gradation through installing polishing quaternary treatment
units
3. All nallahs that represent Orange & Blue colour code as per Criticality index shall require
full-fledged treatment facility to achieve stringent standard of 20mg/l BOD concentration
4. There might also be need for mechanical agitation / aeration through natural or other means
within the course of river especially in the first half of river stretches for effectively adding up
and maintaining DO levels above 6mg/l
5. Absolute vigilance and zero disposal of solid waste or entry of runoffs carrying open
defecated matter shall find its way into the river at any point of time
6. Cluster development based on typical / representative generator of particular type of waste
such as scrap dealers, bottle washing units, buffalo sheds (Gothas), electroplaters & laundry
through allotting locations that are equipped with environment infrastructure facilities
7. Eventually all automobile service / washing centre to adopt zero discharge policy 9.2.3 Strategies for Transforming River Water Quality Based on Designated Use Presently, the main source of river water which is overflow from Powai and Vihar lake are only
perennial fed thereby Mithi in fact actually is fed with wastewater sources except during
precipitation period. More so ever, being fully aware about the source of Mithi River during non-
monsoon period, there is no defined/ known designated use of this water which makes it more
or less difficult to either compare with the standards or classify as per the existing norms.
Nevertheless, for Mithi to have a successful management planning and implementation, it is
extremely important to designate some use in terms of space and time with a continual
improvement strategy. Thereby, Table 9.5 outlines a probable transition from present day use to
a more prominent futuristic end use and probable management measures for achieving the
same.
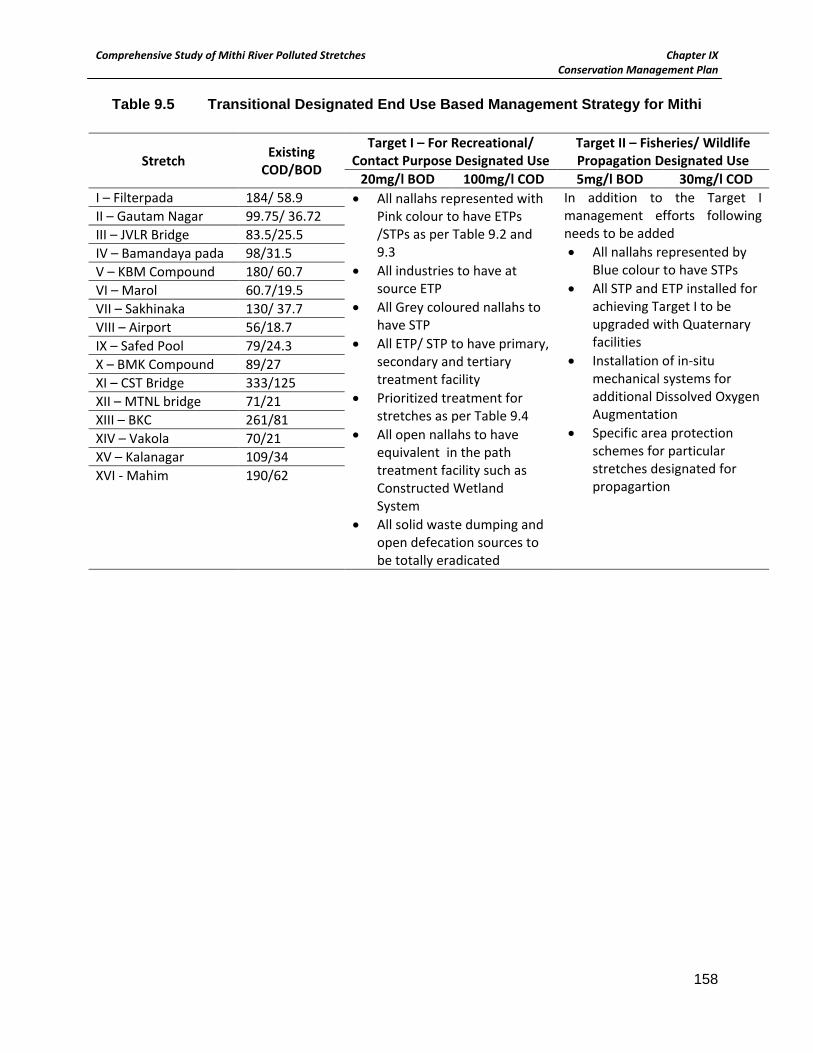
Comprehensive Study of Mithi River Polluted Stretches Chapter IX Conservation Management Plan
158
Table 9.5 Transitional Designated End Use Based Management Strategy for Mithi
Stretch Existing COD/BOD
Target I – For Recreational/ Contact Purpose Designated Use
Target II – Fisheries/ Wildlife Propagation Designated Use
20mg/l BOD 100mg/l COD 5mg/l BOD 30mg/l COD I – Filterpada 184/ 58.9 • All nallahs represented with
Pink colour to have ETPs /STPs as per Table 9.2 and 9.3
• All industries to have at source ETP
• All Grey coloured nallahs to have STP
• All ETP/ STP to have primary, secondary and tertiary treatment facility
• Prioritized treatment for stretches as per Table 9.4
• All open nallahs to have equivalent in the path treatment facility such as Constructed Wetland System
• All solid waste dumping and open defecation sources to be totally eradicated
In addition to the Target I management efforts following needs to be added • All nallahs represented by
Blue colour to have STPs • All STP and ETP installed for
achieving Target I to be upgraded with Quaternary facilities
• Installation of in-situ mechanical systems for additional Dissolved Oxygen Augmentation
• Specific area protection schemes for particular stretches designated for propagartion
II – Gautam Nagar 99.75/ 36.72 III – JVLR Bridge 83.5/25.5 IV – Bamandaya pada 98/31.5 V – KBM Compound 180/ 60.7 VI – Marol 60.7/19.5 VII – Sakhinaka 130/ 37.7 VIII – Airport 56/18.7 IX – Safed Pool 79/24.3 X – BMK Compound 89/27 XI – CST Bridge 333/125 XII – MTNL bridge 71/21 XIII – BKC 261/81 XIV – Vakola 70/21 XV – Kalanagar 109/34 XVI - Mahim 190/62
Copyright © 2022 FDOKUMEN