Identification of conserved core xylem gene sets: conifer cDNA microarray development, transcript...
21
766 www.newphytologist.org Research Blackwell Publishing Ltd Identification of conserved core xylem gene sets: conifer cDNA microarray development, transcript profiling and computational analyses Nathalie Pavy 1 , Brian Boyle 1 , Colleen Nelson 2 , Charles Paule 3 , Isabelle Giguère 1 , Sébastien Caron 1 , Lee S. Parsons 3 , Nancy Dallaire 1 , Frank Bedon 1 , Hugo Bérubé 1 , Janice Cooke 4 and John Mackay 1 1 Centre d’Étude de la Forêt, 1030 rue de la Médecine, Université Laval, Québec, Québec, Canada, G1K 7P4; 2 BC Array Laboratory Center 2660 Oak Street, Vancouver, BC, Canada V6H 3Z6; 3 Center for Computational Genomics and Bioinformatics, University of Minnesota, 420 Delaware St. S.E., MMC 43, Minneapolis, MN 55455, USA; 4 Department of Biological Sciences, University of Alberta, Edmonton, Alberta, Canada, T6G 2E9 Summary • One approach for investigating the molecular basis of wood formation is to integrate microarray profiling data sets and sequence analyses, comparing tree species with model plants such as Arabidopsis. Conifers may be included in comparative studies thanks to large-scale expressed sequence tag (EST) analyses, which enable the development of cDNA microarrays with very significant genome coverage. • A microarray of 10 400 low-redundancy sequences was designed starting from white spruce (Picea glauca (Moench.) Voss) cDNAs. Computational procedures that were developed to ensure broad transcriptome coverage and efficient PCR amplification were used to select cDNA clones, which were re-sequenced in the microarray manufacture process. • White spruce transcript profiling experiments that compared secondary xylem to phloem and needles identified 360 xylem-preferential gene sequences. The functional annotations of all differentially expressed sequences were highly consistent with the results of similar analyses carried out in angiosperm trees and herbaceous plants. • Computational analyses comparing the spruce microarray sequences and core xylem gene sets from Arabidopsis identified 31 transcripts that were highly con- served in angiosperms and gymnosperms, in terms of both sequence and xylem expression. Several other spruce sequences have not previously been linked to xylem differentiation (including genes encoding TUBBY-like domain proteins (TLPs) and a gibberellin insensitive (gai) gene sequence) or were shown to encode proteins of unknown function encompassing diverse conserved domains of unknown function. Key words: computational analysis, microarray design, transcript profiling, vascular tissues, white spruce (Picea glauca). New Phytologist (2008) 180: 766–786 © The Authors (2008). Journal compilation © New Phytologist (2008) doi: 10.1111/j.1469-8137.2008.02615.x Author for correspondence: John Mackay Tel: +1 418 656 2278 Fax: +1 418 656 7493 [email protected] Received: 13 June 2008 Accepted: 18 July 2008 Introduction Microarray analysis of RNA transcripts represents a powerful experimental approach to support investigations of genome function and regulation. Various types of microarrays developed by printing amplicons derived from complementary DNAs are now available for diverse plant species. For gymnosperm trees such as pine and spruce (Pinaceae), cDNA arrays have been produced with a few hundred (e.g. van Zyl et al., 2002; Yang et al., 2004; Egertsdotter et al., 2004) to several thousand
-
Upload
independent -
Category
Documents
-
view
1 -
download
0
Transcript of Identification of conserved core xylem gene sets: conifer cDNA microarray development, transcript...
766 www.newphytologist.org
Research
Blackwell Publishing Ltd
Identification of conserved core xylem gene sets: conifer cDNA microarray development, transcript profiling and computational analyses
Nathalie Pavy1, Brian Boyle1, Colleen Nelson2, Charles Paule3, Isabelle Giguère1, Sébastien Caron1, Lee S. Parsons3, Nancy Dallaire1, Frank Bedon1, Hugo Bérubé1, Janice Cooke4 and John Mackay1
1Centre d’Étude de la Forêt, 1030 rue de la Médecine, Université Laval, Québec, Québec, Canada, G1K 7P4; 2BC Array Laboratory Center 2660 Oak Street,
Vancouver, BC, Canada V6H 3Z6; 3Center for Computational Genomics and Bioinformatics, University of Minnesota, 420 Delaware St. S.E., MMC 43,
Minneapolis, MN 55455, USA; 4Department of Biological Sciences, University of Alberta, Edmonton, Alberta, Canada, T6G 2E9
Summary
• One approach for investigating the molecular basis of wood formation is tointegrate microarray profiling data sets and sequence analyses, comparing treespecies with model plants such as Arabidopsis. Conifers may be included in comparativestudies thanks to large-scale expressed sequence tag (EST) analyses, which enablethe development of cDNA microarrays with very significant genome coverage.• A microarray of 10 400 low-redundancy sequences was designed starting fromwhite spruce (Picea glauca (Moench.) Voss) cDNAs. Computational procedures thatwere developed to ensure broad transcriptome coverage and efficient PCRamplification were used to select cDNA clones, which were re-sequenced in themicroarray manufacture process.• White spruce transcript profiling experiments that compared secondary xylemto phloem and needles identified 360 xylem-preferential gene sequences. Thefunctional annotations of all differentially expressed sequences were highly consistentwith the results of similar analyses carried out in angiosperm trees and herbaceousplants.• Computational analyses comparing the spruce microarray sequences and corexylem gene sets from Arabidopsis identified 31 transcripts that were highly con-served in angiosperms and gymnosperms, in terms of both sequence and xylemexpression. Several other spruce sequences have not previously been linked to xylemdifferentiation (including genes encoding TUBBY-like domain proteins (TLPs)and a gibberellin insensitive (gai) gene sequence) or were shown to encode proteinsof unknown function encompassing diverse conserved domains of unknown function.
Key words: computational analysis, microarray design, transcript profiling, vasculartissues, white spruce (Picea glauca).
New Phytologist (2008) 180: 766–786
© The Authors (2008). Journal compilation © New Phytologist (2008) doi: 10.1111/j.1469-8137.2008.02615.x
Author for correspondence:John MackayTel: +1 418 656 2278 Fax: +1 418 656 [email protected]
Received: 13 June 2008Accepted: 18 July 2008
Introduction
Microarray analysis of RNA transcripts represents a powerfulexperimental approach to support investigations of genomefunction and regulation. Various types of microarrays developed
by printing amplicons derived from complementary DNAsare now available for diverse plant species. For gymnospermtrees such as pine and spruce (Pinaceae), cDNA arrays have beenproduced with a few hundred (e.g. van Zyl et al., 2002;Yang et al., 2004; Egertsdotter et al., 2004) to several thousand
© The Authors (2008). Journal compilation © New Phytologist (2008) www.newphytologist.org New Phytologist (2008) 180: 766–786
Research 767
sequences (e.g. Stasolla et al., 2004; Ralph et al., 2006;Friedmann et al., 2007; Holliday et al., 2008).
Transcript profiling in trees has specifically targeted woodformation (i.e. secondary xylem differentiation) because ofthe ecological significance of forest trees and the economicimportance of wood. For example, secondary xylem develop-ment was examined in Sitka spruce (Picea sitchensis (Bong.)Carr.) by comparing transcript profiles of apical and distalportions in newly formed terminal shoots (Friedmann et al.,2007). Transcript variations in pine secondary xylem at differenttimes during the season identified earlywood and latewoodpreferential sequences (Egertsdotter et al., 2004; Le Provostet al., 2003). Computational analyses of different pine cDNAlibraries also highlighted transcripts that accumulated prefer-entially at different stages of lignification and in the secondaryxylem of roots (Pavy et al., 2005a). A poplar wood formationroadmap that was described by Hertzberg et al. (2001) outlinedtranscriptome remodelling at different stages of differentiationin angiosperm trees. Subtractive hybridizations and macroarrayanalyses also identified genes preferentially expressed in vasculartissues from Eucalyptus gunnii (Paux et al., 2004; Foucart et al.,2006). Core xylem gene sets were also delineated by large-scalemicroarray analysis comparing different tissues and stages ofdifferentiation in the model angiosperm plant Arabidopsisthaliana (Zhao et al., 2005; Ko et al., 2006). Furthermore,conservation between gymnosperms and angiosperms forxylem-preferential genes may be anticipated, based on tissueprofiling in pine with a microarray comprised of 1500selected expressed sequence tags (ESTs) (Yang et al., 2004).
To enhance the outputs of microarray profiling studies,more and more sequences are being incorporated into conifermicroarrays; however, most microarrays still afford limitedgenome coverage. For example, Ralph et al. (2006) analysedthe transcriptome response to insect infestation and woundingwith spruce cDNA arrays comprised of c. 9000 features,which in turn were estimated to represent 5500 genes. Morerecently, a spruce cDNA microarray that was said to encompass21 800 unique sequences was utilized in a study of fallacclimation, but details regarding the composition of themicroarray were not presented (Holliday et al., 2008).
As hundreds of thousands of random cDNAs are beingsequenced in pine (Kirst et al., 2003; Cairney et al., 2006;Lorenz et al., 2006) and spruce (Pavy et al., 2005b; Ralph et al.,2006), expanded microarrays are indeed being developedwith more comprehensive coverage of conifer genomes. Inthis context, design issues such as the choice of sequencesmust be closely evaluated to achieve adequate transcriptomerepresentation, taking into account sequence redundancy andprobe specificity, as well as the maximum printing density andproduction costs. One approach, to manage these designconsiderations, which we explored, consists of restrictingthe number of amplicons spotted onto the microarray byminimizing the sequence redundancy. Because closely relatedRNA sequences can effectively cross-hybridize, a single probe
may detect several different transcripts. Conversely, spottingseveral highly similar probes is likely to dilute signal intensitiesfrom an RNA transcript. We also took into consideration theconditions needed for efficient PCR amplifications and probehybridization in order to ensure overall microarray quality,uniform hybridizations, and repeatability of results. Ourapproach was to target inserts within a selected size range inorder to meet these requirements.
This report describes the overall approach that we adopted forthe efficient development of a microarray comprised of 10 400nonredundant sequences, from a large set of ESTs representing16 600 unique contigs in white spruce (Picea glauca). Transcriptprofiling experiments, contrasting secondary xylem with needlesand secondary phloem in spruce, are presented to illustratethe quality of the data generated with this microarray. We alsoevaluated whether transcript profiles together with computa-tional analyses could uncover a core set of xylem-preferentialsequences conserved between angiosperms and gymnosperms.
Materials and Methods
Microarray manufacture and quality control
The sequences came from 17 different cDNA librariesrepresenting nearly all of the tissues and organs of whitespruce (Picea glauca (Moench.) Voss) at diverse stages ofdevelopment (from embryos to mature trees) and states ofdifferentiation (Pavy et al., 2005b). Detailed sequence analysesincluding quality data, genome comparisons, and diversefunctional annotations were described in Pavy et al. (2005b).The methods and criteria used to select the cDNA clones aredescribed in the Results section.
The cDNA clones were robotically re-arrayed from daughterglycerol stock 384-well plates into 96-well plates prefilled with7% glycerol in Luria Broth + ampicillin, incubated overnightat 37°C, and checked for uniform optical density. Each of there-arrayed clones was re-sequenced from the 5′ end only, asdescribed by Pavy et al. (2005b). Moreover, 22 Pinus taeda L.genes, as well as 27 positive, negative, and spike-in controls,were included. The cDNA inserts were PCR-amplified in aTetrad PTC-200 thermocycler (MJ Research, Waltham, MA,USA) using 1 µl of overnight culture, 0.2 µM M13/pUCforward primer (5′-CCCAGTCACGACGTTGTAAAACG-3′),0.2 µM M13/pUC reverse primer (5′-AGCGGATAACAA-TTTCACACAGG-3′), 2 mM MgCl2, 10 mM Tris-HCl,50 mM KCl, 250 µM dNTPs, 1U AmpliTaq (Perkin Elmer,Waltham, MA, USA), and nuclease-free H2O (Invitrogen,Carlsbad, CA, USA) to 100 µl. PCR conditions were asfollows: 2 min at 95°C for denaturation; 35 cycles of 30 s at95°C, 45 s at 60°C, and 3 min at 72°C; and 7 min at 72°C.Amplicon specificity and yield were analysed by capillaryelectrophoresis using the HT DNA SE 30 LabChip on CaliperAMS 90 system (Zymark-Caliper Life Sciences, Hopkinton,MA, USA). PCR products were robotically cleaned (Qiagen,
New Phytologist (2008) 180: 766–786 www.newphytologist.org © The Authors (2008). Journal compilation © New Phytologist (2008)
Research768
Missisauga, Ontario, Canada) and consolidated into 384-wellplates, lyophilized by speed-vac, and re-suspended in 15 µl of3 × saline sodium citrate (SSC). All cDNAs (average printingconcentration of 180 ng µl–1) were printed as double, side-by-sidespots on EZ-Rays™ aminosilane slides (Matrix Technologies,Hudson, NH, USA) with the Biorobotics Microgrid II micro-array printer (Genomic Solutions, Ann Harbor, MI, USA).Microspot 10K quill pins (Biorobotics Digilab, Ann Arbor,MI, USA) in a 48-pin tool were used to deposit < 0.5 nl(0.2 ng of cDNA) per spot onto the slide. The resultingmicroarrays have a 4 × 12 subgrid layout with 132 spots persubgrid, each spot having an approximate diameter and pitchof 100 µm and 250 µm, respectively. A 280-bp green fluorescentprotein (GFP) cDNA was amplified from a GFP clone(Clontech, Mountain View, CA, USA) using the primers5′-AAACATTCTTGGACACAAATTGG-3′ and 5′-CAGCTGTTACAAACTCAAGAAGG-3′, and printed insubgrid corners to assist in positioning of image analysis onthe grid. The slides were cross-linked in a UV Stratalinker2400 (Stratagene, Cedar Creek, TX, USA) at 120 mJ. Spotmorphology was assessed by visual inspection, SYBR Green 1(Invitrogen, Carlsbad, CA, USA) staining, or hybridizationwith labelled nonspecific probe. The slides were stored insealed plastic boxes and placed inside a desiccator in which therelative humidity was maintained at between 30 and 40%.
Plant material and RNA isolations
Transcript profiling experiments were carried out, as describedby Bedon et al. (2007), using 3-yr-old in vitro clonallypropagated white spruce seedlings of genotype PG653 thatwere raised in environmental growth chambers with a 12-hphotoperiod, and day and night temperatures of 18 and 24°C,respectively. The tissue samples were collected from synchronizedtrees, c. 3 wk after budburst, and were immersed in liquidnitrogen immediately after removal from the plant. Youngneedles were collected from the terminal portion of the mainstem. Xylem and phloem were isolated as described by Bedonet al. (2007). Briefly, the bark and phloem tissues were peeledfrom the stem, cut into 1-cm-long pieces and used as a singlebark-phloem sample. The surface of the stem exposed afterremoving the bark was then rapidly scraped with a scalpelblade to obtain the differentiating xylem. All samples werekept at −80°C until further use.
Total RNA was isolated from frozen tissues following themethod of Chang et al. (1993), with modifications. Needlesamples were ground using frozen mortars and pestles in liquidnitrogen, whereas frozen xylem and phloem were groundusing a MixerMill MM 300 (Retsch, Haan, Germany).RNA was extracted with 750 µl of extraction buffer (2% Cetyltrimethylammonium bromide (CTAB), 2% Polyvinylpyrro-lidone (PVP), 25 mM ethylenediaminetetraacetic acid (EDTA),2 M NaCl, 0.5 g l−1 spermidine, 100 mM Tris-HCl, pH 8.0,and 2% β-mercaptoethanol) that had been preheated to 65°C,
after which the samples were vigorously vortexed. Tissues wereincubated at 65°C in a water bath for 10 min with vortexingperiodically. A volume of 500 µl of chloroform:isoamyl alcohol(24 : 1 v/v) was added, and tubes were vortexed and centrifugedfor 5 min at 21 000 g at 4°C in an IEC Micromax/RF tabletopmicrocentrifuge (Thermo Scientific, Waltham, MA, USA).The supernatant was transferred to a new tube and was re-extracted with another 500 µl of chloroform:isoamyl alcohol,as described. The combined aqueous phases were transferredinto a new tube, an equal volume of LiCl-EDTA (7.5 M LiCland 50 mM EDTA) was added, and RNA was precipitatedat –20°C for 1 h. RNA was pelleted by centrifugation at21 000 g at 4°C. The pellet was rinsed with 500 µl of 80%ethanol, collected by 5 min of centrifugation at 21 000 g at20°C and re-suspended in autoclaved nanopure water. Thequality of total RNA was assessed using the Agilent 2100Bioanalyzer with RNA 6000 Nano LabChips (Agilent Tech-nologies Inc, Santa Clara, CA, USA) and RNA concentrationwas determined spectrophotometrically with a Multiskan®
spectrum (Thermo Scientific).
Probe labelling
RNA probes were prepared through RNA amplifications withthe Superscript™ Indirect RNA amplification kit, followingthe manufacturer’s instructions (Invitrogen), and labelled withAlexa Fluor® 555 and 647 (Molecular Probes Inc., Eugene,OR, USA). Briefly, cDNA synthesis was performed by reversetranscription using an anchored oligo d(T) primer, and startingwith 1 µg of RNA. The in vitro transcription step incorporatedaminoallyl-modified nucleotides for synthesis of amplifiedRNA (aRNA). For each probe, 5 µg of modified aRNA waslabelled with Alexa Fluor®. Separate aRNA probes were preparedfrom the same starting RNA for each dye swap. Couplingefficiency was evaluated by reading fluorescence on a Typhoon9400 fluorescence-phosphorimaging system (GE Healthcare,Fairfield, CT, USA). Labelled cDNAs that were to be hybridizedon the same slide were then combined.
Microarray hybridization and scanning
Slides were incubated for 2 h at 65°C in pre-hybridizationbuffer (5 × SSC, 0.1% sodium dodecyl sulphate (SDS),0.2 mg ml−1 bovine serum albumin (BSA), and 0.1 mg ml−1
herring sperm DNA) to prevent nonspecific binding. Slideswere washed twice in 0.1 × SSC and twice in water at roomtemperature, and were then transferred to a water bath at85°C for 90 s before drying by centrifugation for 2 min at480 g in an Allegra® 25R bench top centrifuge (BeckmanCoulter, Fullerton, CA, USA). Slides were stored away fromdust in a cabinet with controlled ambient humidity (set to50%) until hybridization.
Combined labelled cDNAs were denatured at 95°C for2 min, cooled on ice and centrifuged. For hybridization, 51 µl

© The Authors (2008). Journal compilation © New Phytologist (2008) www.newphytologist.org New Phytologist (2008) 180: 766–786
Research 769
of hybridization buffer (50% formamide, 5 × SSC, 0.1% SDSand 0.1 mg ml−1 herring sperm DNA) preheated to 46°C wasadded to the combined cDNAs, which were kept at 46°Cuntil they were ready to be added to the slide. Cover-slips (ErieScientific Company, Portsmouth, NH, USA) were placed onslides over the subarrays and combined aRNA probes wereadded to one edge of the cover-slip, which allowed the probeto wick underneath it. The slides were placed inside hybridi-zation chambers (Corning, New York, NY, USA), with a dropof water being added to dedicated wells to maintain humidity,and incubated for 18 h in a hybridization oven at 45°C.Cover-slips were removed by floating the slides in a Coplin jar(Bel-Art Products Inc, Pequannock, NJ, USA) containing 2 ×SSC and 0.5% SDS preheated to 45°C. The slides wereincubated for three periods of 15 min, with shaking every fewminutes, in the hybridization oven at 45°C, once in 2 × SSCand 0.5% SDS and twice in 0.5 × SSC and 0.1% SDS. Theslides were washed twice in 0.1 × SSC at room temperature for1 min and twice in water at room temperature for 20 s beforedrying by centrifugation for 2 min at 480 g in an Allegra®
25R bench top centrifuge (Beckman Coulter).Slides were scanned in a ScanArray Express (Perkin Elmer)
scanner at 5 µm resolution. Images were acquired the sameday and slides were kept away from light, dust and humidityuntil scanning. The same laser power (set at 90%) was usedfor both chromofluors and for each of the slides, but thephotomultiplier tube (PMT) settings were adjusted to balanceAlexa Fluor® 555 and Alexa Fluor® 647 channels on each slide.A total of 10 slides, including dye swaps to compensate forchromofluor effects, were hybridized for each tissue comparison.
Spot identification and quantification were performedwith QuantArray3.0 software (Packard Bioscience, Waltham,MA, USA), using the adaptative quantification method ofspot intensity. Bad spots that were a result of high localbackground values were flagged manually.
Statistical analysis and access to microarray data
Data analysis was carried out using bioconductor(www.bioconductor.org) in the r statistical environment(release 2.0). The spot intensity was calculated as the medianforeground intensity of the spot minus the median backgroundintensity surrounding the spot. The quality of the data wasassessed using graphical tools in the marray package availablein bioconductor. Pearson’s correlation coefficients werecalculated for log2-fold differences (M values) between adjacentspots (within slide) and between the same spots on differentslides (between slides) with raw intensities and with normalizedintensities, to check for data consistency. These correlationswere calculated and compared with normalized intensitiesobtained using several normalization procedures to select themost appropriate approach for our data. The compositemethod described by Yang et al. (2002) produced the bestglobal correlations within slides; therefore, the data were
normalized with this method before statistical analysis. Thisapproach addresses within-print tip group location and scalenormalization issues within a slide. It was applied using thetwo functions maNorm2D and maNormLoess in the marraypackage (Dudoit & Yang, 2002). The fold changes were thenestimated for the normalized data by fitting a linear model,using the limma package (release 2.0.7). To indicate whichRNA samples were applied to each array, we used the simpledesign matrix made of one row of 1 and −1 numbers (takinginto account the dye swaps). As each experiment is a simplecomparison of two tissues we only used the design matrix anddid not use the contrast matrix. For statistical analysis ofdifferential transcript abundance, limma uses an empiricalBayes method to moderate the standard errors of the estimatedlog-fold changes; thus the variance estimates used in the t-testsare computed in a more robust manner. To test the significanceof the differential expression, the statistic used is the moderatedt-statistic. This has the same interpretation as an ordinaryt-statistic except that the standard errors have been moderatedacross genes, that is, shrunk towards a common value, a simpleBayesian model. This has the effect of borrowing informationfrom the ensemble of genes to aid with inference about eachindividual gene. Moderated t-statistics lead to P-values as dot-statistics, except that the degrees of freedom are increased,reflecting the greater reliability associated with the smoothedstandard errors. The associated P-values were also adjustedfor multiple testing with Benjamini and Hochberg’s (1995)method to control the ‘false discovery rate’ (FDR). FDRadjusted P-values < 0.05 are expected to give < 5% falsepositives. A complete description of the method is availablein the limma user guide at www.bioconductor.org/packages/bioc/1.8/vignettes/limma/inst/doc/usersguide.pdf.
Data reported in this paper are log2 ratios of Alexa Fluor®
555/Alexa Fluor® 647, which are denoted M. Microarraydesign parameters, experimental methods, statistical methodsand results obtained from the two experiments described inthis manuscript are available through the ArrayExpress database(http://www.ebi.ac.uk/microarray-as/ae/; accession numbersfor the experiments: E-MEXP-1460 and E-MEXP-1489).The 11K microarray is available for distribution and may beordered through www.arborea.ulaval.ca.
Sequence comparisons with other expression data sets
The closest Arabidopsis homologues to xylem-preferentialspruce sequences were identified with blastx against TheArabidopsis Information Resource (TAIR 7.0) protein sequences,and their expression profiles were extracted for the 79 tissuesample types in the AtGenExpress (ATGE) database (Schmidet al., 2005). A log2 ratio of the expression was computed usingthe average stem data (first internode, sample ATGE_28; secondinternode, sample ATGE_27) divided by the expression ineach other tissue. A tree was obtained after hierarchicalclustering (Eisen et al., 1998) of the ratios across the genes and
New Phytologist (2008) 180: 766–786 www.newphytologist.org © The Authors (2008). Journal compilation © New Phytologist (2008)
Research770
the samples by using the Euclidean distance (average linkageclustering method) available in the tm4 software (Saeed et al.,2003). Tblastn searches were also conducted by comparingthe spruce nucleic sequences against the Arabidopsis data setsfrom Zhao et al. (2005) and Ko et al. (2006).
Phylogeny
Twenty-four cellulose synthase (CESA) protein sequences frompoplar (Populus trichocarpa), pine (Pinus taeda L.) and whitespruce were aligned with clustalw software (Thompsonet al., 1994). Among the overlapping sequences of these CESAproteins, a region including 212 sites (212 aa) was selected forphylogenetic analysis with the 3.65 release of phylip software(Felsenstein, 2005) (http://evolution.genetics.washington.edu/phylip.html). The robustness of tree topologies was assessed bymeans of 500 bootstrap replications conducted with seqboot.Distance matrices were calculated using the protdist programwith the JTT amino acid substitution matrix. A phylogenetictree was then constructed using the neighbour-joining methodavailable in the neighbor program. The majority ruleconsensus tree was generated with the consense program.
Transcript quantification by reverse transcription–quantitative polymerase chain reaction (RT-qPCR)
Independent verifications of microarray results were carriedout by RT-qPCR analysis using total RNA from mature treesas described by Bedon et al. (2007) as well as from the youngtrees used for the microarray experiment. Total RNA (500 ng)was reverse-transcribed using the SuperScriptII First-StrandSynthesis System for RT-PCR (Invitrogen), following themanufacturer’s instructions. The resulting first-strand cDNAmixture was diluted 1 : 5 in water before real-time PCRquantification. A cDNA equivalent of 10 ng of total RNAwas used per 15 µl of PCR reaction. Amplifications wereperformed in 1 × Quantitect SYBR Green mixture (Qiagen)with 0.3 µM of 5′ and 3′ primers. Primers were designedwith Primer3 (Rozen & Skaletsky, 2000), with a meltingtemperature (Tm) between 62 and 67°C, and producedamplicons of between 100 and 250 bp (sequences are listed inSupporting Information Table S1). Amplifications were carriedout with an LC480 thermal cycler (Roche, Indianapolis, IN,USA). After an initial 15-min activation step at 95°C, 45cycles (94°C for 10 s and 62°C for 2 min) were performed,and a single fluorescent reading was obtained after each cycleimmediately following the annealing/elongation step at 62°C.A melting curve analysis was performed at the end of cyclingto ensure that there was single amplification. Crossing point(Cp) values were determined with the LC480 softwaresupplied with the instrument. Standard curves were used totransform Cp values obtained from total RNA samples intonumbers of transcripts. Samples were normalized to thereference gene Elongation factor 1a.
Results
Microarray design and development
A white spruce cDNA microarray was developed starting witha set of over 9000 unique cDNAs that were selected, re-sequenced and amplified to produce a first version microarray(9K microarray). A second version was produced with thissame original set of amplicons by adding new sequencesto make up for amplicons rejected by our quality controlprocedures on the first array (11K microarray).
Selection of cDNAs, and quality analyses of clones and amplicons
The 9K microarray was designed from a contig assembly of14 225 consensus sequences, based on white spruce ESTsequencing from 13 cDNA libraries (described in Pavy et al.,2005b). In total, 38 400 quality reads (Phred score > 20 overat least 100 nt) were obtained from randomly selected cDNAclones sequenced from the 3′ end or from both the 3′ and the5′ ends, in c. 50% of cases.
We selected 9052 unique cDNA clones to re-rack and usein microarray production, based on the following procedure.First, we counter-selected against redundant sequences, asclosely related (whether allelic or paralogous) sequences maycross-hybridize with each other. Cross-hybridization poten-tially can result in decreased signal intensity as a result of RNAprobes hybridizing to several targets. Based on similarityanalysis (blastn), we formed groups of contigs (consensussequences) sharing greater than 95% identity over 100 bp,from which a single cDNA would be selected to create a target.In this process, nonoverlapping 5′ and 3′ reads from the samecDNA clone were also grouped. Secondly, we aimed to restrictinsert length to between 400 and 2000 bp for efficient PCRamplification and to obtain relatively uniform ampliconconcentrations. As cDNA insert sizes were unavailable a priori,we used a computational approach to predict the insert sizefor each cDNA clone, based on blast results for the consensussequence. A predicted insert size (PIS) was estimated forcDNA clones sequenced at the 5′ end, by alignment withfull-length Arabidopsis cDNA sequences showing significantsequence similarities. When it was available, the PIS was usedto select an insert of between 400 and 2000 bp per groupof contigs. When the PIS could not be estimated, the clonewith the most 5′ read or the longest 3′ read was selected foramplification.
The PCR products from the 9052 cDNA clones were ana-lysed by capillary electrophoresis to determine the number,size(s) and concentration(s) of amplicons. In total, 7086 distinctsequences gave a single high-quality amplicon (at least 5µg ml–1), which represented 78.2% of the PCR amplifications.We also found that 9.2% gave no detectable product, 6.5%had multiple bands, and 6.1% gave a detectable single band

© The Authors (2008). Journal compilation © New Phytologist (2008) www.newphytologist.org New Phytologist (2008) 180: 766–786
Research 771
with a concentration below 5 µg ml–1 (not shown). The cloneswith a PIS gave more inserts in the targeted size range,although the average length of amplicons from cDNA cloneswith and without a PIS differed by < 4% (Table 1). Thoseclones without a PIS had a broader size distribution, withmany more amplicons that were shorter than 400 bp orlonger than 2500 bp.
All of the clones that were re-racked for microarray manufac-ture were re-sequenced from the 5′ end for validation purposes(Table S2). Sequences were obtained for 8669 (96%) of theoriginal clones and were compared with our entire contigassembly (with blastn). A high level of validation was obtainedamong the reads that matched one of our original contigs, as92.5% gave the strongest match against the expected contigcontaining the targeted clone. However, 7.5% gave the strongestmatch against a different contig. These mismatches were flaggedand provided an estimate of the clone misidentification rateassociated with the microarray manufacture process. Also,25% of the reads gave no hits against any of our contigs (TableS2), probably as a result of a large proportion of very shortreads during re-sequencing and the lack of 5′ sequenceobtained in the first round.
We added c. 1900 amplicons to the previously developedamplicon bank to produce the second version 11K microarray.Working with a larger EST data set generated from the same13 libraries and four additional ones (total of 17 cDNA libraries),which represented > 16 600 contigs (Pavy et al., 2005b), thepreviously described analyses were repeated in their entirety.We identified 540 substitute cDNA clones for the multiple-banding and low-concentration amplicons, and 1360 new
sequences. The 11K array was based on 10 419 unique contigsand was estimated to encompass 8700 unique high-qualityamplicons. For each of the microarray versions, randomizationwas introduced into the manufacture process, by randomizingthe order of plates at the PCR amplifications step and thespotting pattern, in order to avoid spatial bias in the distribu-tion of the clones and cDNA libraries from different tissues.
Sequences represented on the arrays and their functional annotations
Functional annotations of the cDNA sequences were basedupon sequence similarity searches against several databases,as well as gene ontology assignment and classification intomultigene families. At the protein level, 87% of the sprucesequences gave matches in the Pinus Gene Index (PGI6.0, http://compbio.dfci.harvard.edu/tgi/cgi-bin/tgi/gimain.pl?gudb=pine);however, not all of these pine sequences have a functionalannotation. In contrast, 46% of the sequences gavematches with Uniprot_Swissprot (http://www.ebi.ac.uk/swissprot/), and 49% with Protein FAMilies (PFAM, http://pfam.sanger.ac.uk/) (Table 2). A total of 9191 (88.2%)nonredundant sequences on the 11K microarray gave a matchin at least one of these three databases (blast e-value < e-08).
Transcript profiling in spruce trees comparing secondary xylem to phloem and needles
Transcript profiles were analysed as a means of evaluating theoverall quality of the microarrays and to help to delineate
Table 1 Amplicon size in cDNA clones with and without predicted insert size (PIS)
cDNA clones Average amplicon length (SD)
Number of amplicons (%)
< 400 bp > 400, < 2000 bp > 2000 < 2500 bp > 2500 bp
With PIS (2471) 1512 (± 524) 31 (1.3%) 2083 (84%) 276 (11%) 81 (3%)No PIS (5181) 1569 (± 648) 138 (2.6%) 3890 (75%) 707 (14%) 446 (9%)
SD, standard deviation.
Table 2 Sequence similarities analyses of the 11K spruce microarray against public databases
PGI6.0 Uniprot_Swissprot PFAM
PGI6.0 9064 (87%)Uniprot_Swissprot 4690 (45%) 4800 (46%)PFAM 4952 (47.5%) 4084 (39.2%) 5069 (48.65%)
The table shows the number of the 10 419 nonredundant spruce sequences producing a match in one database (on the diagonal) (% of total) or in two databases (under the diagonal) (blastx or tblastn; e-value < 1e-08). Database targets were: Pinus Gene Index 6.0 (PGI6.0), 45 557 unique sequences; Uniprot_Swissprot, 270 778 sequences in June 2007; Protein FAMilies (PFAM), 1 559 418 sequences in June 2007. A total of 4006 sequences matched entries in all three databases.
New Phytologist (2008) 180: 766–786 www.newphytologist.org © The Authors (2008). Journal compilation © New Phytologist (2008)
Research772
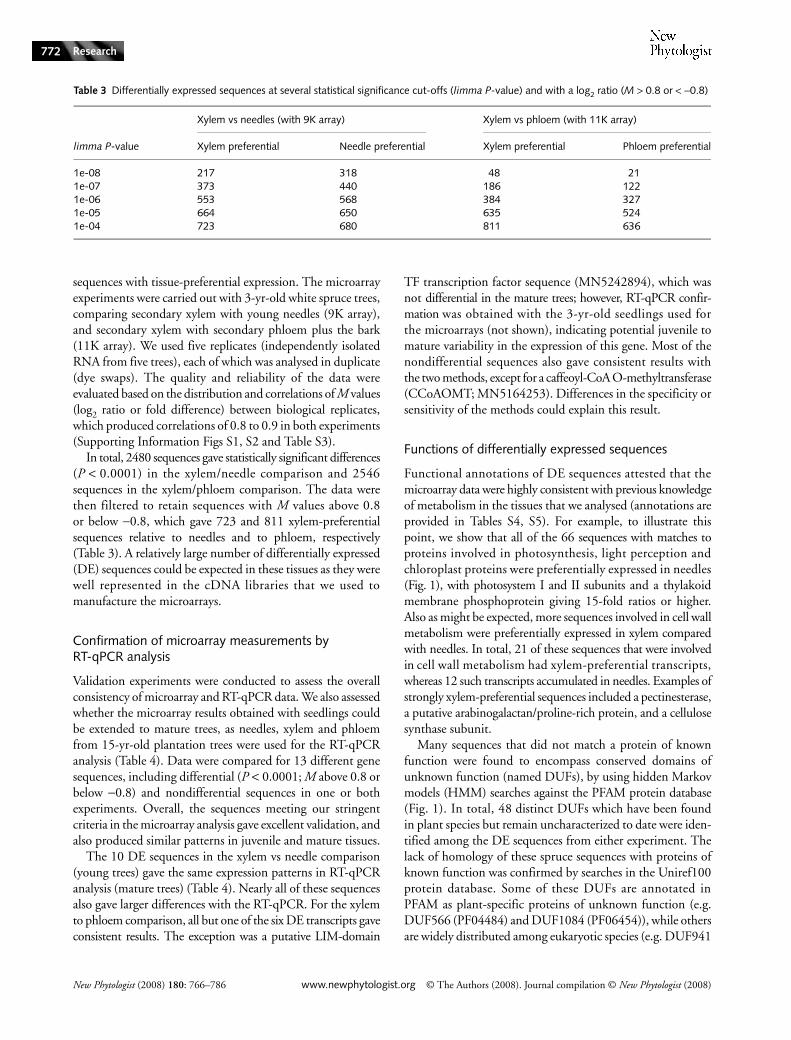
sequences with tissue-preferential expression. The microarrayexperiments were carried out with 3-yr-old white spruce trees,comparing secondary xylem with young needles (9K array),and secondary xylem with secondary phloem plus the bark(11K array). We used five replicates (independently isolatedRNA from five trees), each of which was analysed in duplicate(dye swaps). The quality and reliability of the data wereevaluated based on the distribution and correlations of M values(log2 ratio or fold difference) between biological replicates,which produced correlations of 0.8 to 0.9 in both experiments(Supporting Information Figs S1, S2 and Table S3).
In total, 2480 sequences gave statistically significant differences(P < 0.0001) in the xylem/needle comparison and 2546sequences in the xylem/phloem comparison. The data werethen filtered to retain sequences with M values above 0.8or below −0.8, which gave 723 and 811 xylem-preferentialsequences relative to needles and to phloem, respectively(Table 3). A relatively large number of differentially expressed(DE) sequences could be expected in these tissues as they werewell represented in the cDNA libraries that we used tomanufacture the microarrays.
Confirmation of microarray measurements by RT-qPCR analysis
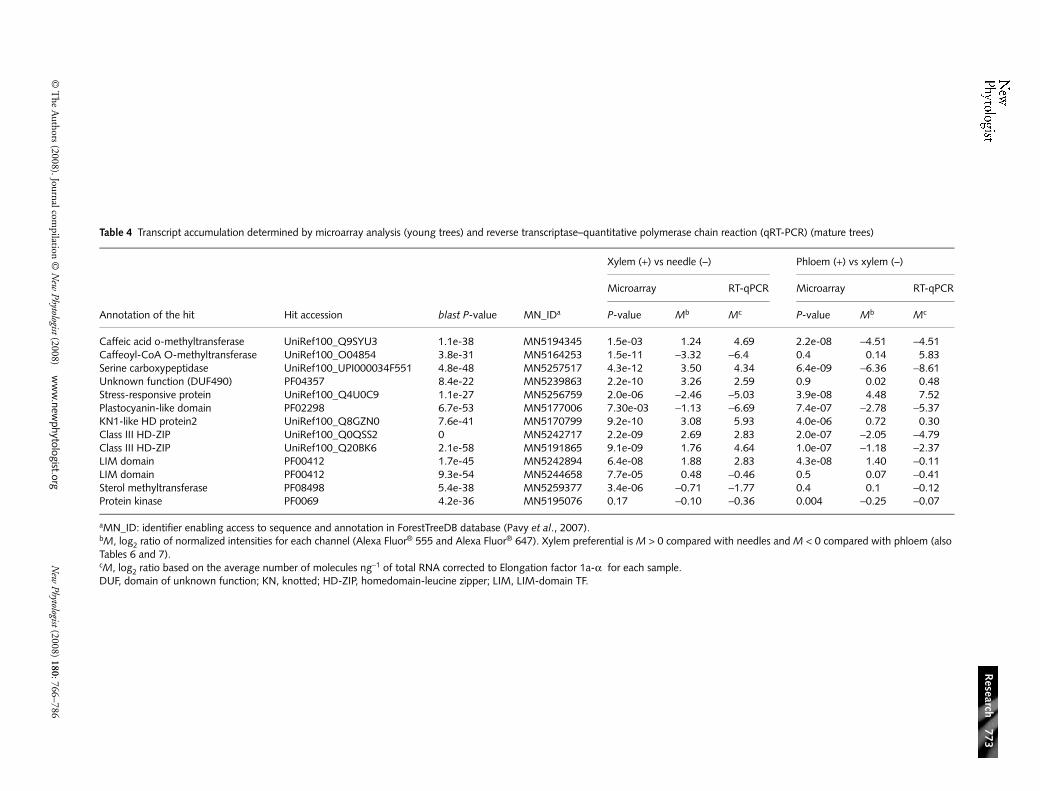
Validation experiments were conducted to assess the overallconsistency of microarray and RT-qPCR data. We also assessedwhether the microarray results obtained with seedlings couldbe extended to mature trees, as needles, xylem and phloemfrom 15-yr-old plantation trees were used for the RT-qPCRanalysis (Table 4). Data were compared for 13 different genesequences, including differential (P < 0.0001; M above 0.8 orbelow −0.8) and nondifferential sequences in one or bothexperiments. Overall, the sequences meeting our stringentcriteria in the microarray analysis gave excellent validation, andalso produced similar patterns in juvenile and mature tissues.
The 10 DE sequences in the xylem vs needle comparison(young trees) gave the same expression patterns in RT-qPCRanalysis (mature trees) (Table 4). Nearly all of these sequencesalso gave larger differences with the RT-qPCR. For the xylemto phloem comparison, all but one of the six DE transcripts gaveconsistent results. The exception was a putative LIM-domain
TF transcription factor sequence (MN5242894), which wasnot differential in the mature trees; however, RT-qPCR confir-mation was obtained with the 3-yr-old seedlings used forthe microarrays (not shown), indicating potential juvenile tomature variability in the expression of this gene. Most of thenondifferential sequences also gave consistent results withthe two methods, except for a caffeoyl-CoA O-methyltransferase(CCoAOMT; MN5164253). Differences in the specificity orsensitivity of the methods could explain this result.
Functions of differentially expressed sequences
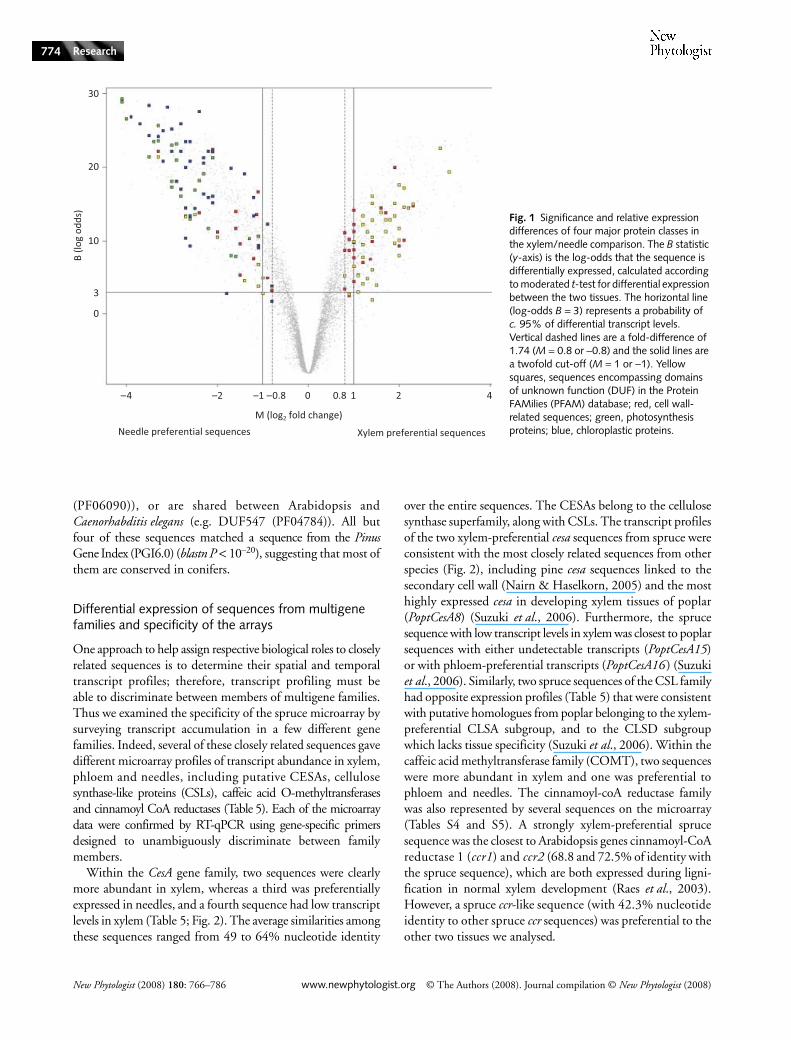
Functional annotations of DE sequences attested that themicroarray data were highly consistent with previous knowledgeof metabolism in the tissues that we analysed (annotations areprovided in Tables S4, S5). For example, to illustrate thispoint, we show that all of the 66 sequences with matches toproteins involved in photosynthesis, light perception andchloroplast proteins were preferentially expressed in needles(Fig. 1), with photosystem I and II subunits and a thylakoidmembrane phosphoprotein giving 15-fold ratios or higher.Also as might be expected, more sequences involved in cell wallmetabolism were preferentially expressed in xylem comparedwith needles. In total, 21 of these sequences that were involvedin cell wall metabolism had xylem-preferential transcripts,whereas 12 such transcripts accumulated in needles. Examples ofstrongly xylem-preferential sequences included a pectinesterase,a putative arabinogalactan/proline-rich protein, and a cellulosesynthase subunit.
Many sequences that did not match a protein of knownfunction were found to encompass conserved domains ofunknown function (named DUFs), by using hidden Markovmodels (HMM) searches against the PFAM protein database(Fig. 1). In total, 48 distinct DUFs which have been foundin plant species but remain uncharacterized to date were iden-tified among the DE sequences from either experiment. Thelack of homology of these spruce sequences with proteins ofknown function was confirmed by searches in the Uniref100protein database. Some of these DUFs are annotated inPFAM as plant-specific proteins of unknown function (e.g.DUF566 (PF04484) and DUF1084 (PF06454)), while othersare widely distributed among eukaryotic species (e.g. DUF941
Table 3 Differentially expressed sequences at several statistical significance cut-offs (limma P-value) and with a log2 ratio (M > 0.8 or < −0.8)
limma P-value
Xylem vs needles (with 9K array) Xylem vs phloem (with 11K array)
Xylem preferential Needle preferential Xylem preferential Phloem preferential
1e-08 217 318 48 211e-07 373 440 186 1221e-06 553 568 384 3271e-05 664 650 635 5241e-04 723 680 811 636
© T
he Authors (2008). Journal com
pilation © N
ew Phytologist (2008)
ww
w.new
phytologist.orgN
ew Phytologist (2008) 180: 766–786
Research
773
Table 4 Transcript accumulation determined by microarray analysis (young trees) and reverse transcriptase–quantitative polymerase chain reaction (qRT-PCR) (mature trees)
Annotation of the hit Hit accession blast P-value MN_IDa
Xylem (+) vs needle (–) Phloem (+) vs xylem (–)
Microarray RT-qPCR Microarray RT-qPCR
P-value Mb Mc P-value Mb Mc
Caffeic acid o-methyltransferase UniRef100_Q9SYU3 1.1e-38 MN5194345 1.5e-03 1.24 4.69 2.2e-08 −4.51 −4.51Caffeoyl-CoA O-methyltransferase UniRef100_O04854 3.8e-31 MN5164253 1.5e-11 −3.32 −6.4 0.4 0.14 5.83Serine carboxypeptidase UniRef100_UPI000034F551 4.8e-48 MN5257517 4.3e-12 3.50 4.34 6.4e-09 −6.36 −8.61Unknown function (DUF490) PF04357 8.4e-22 MN5239863 2.2e-10 3.26 2.59 0.9 0.02 0.48Stress-responsive protein UniRef100_Q4U0C9 1.1e-27 MN5256759 2.0e-06 −2.46 −5.03 3.9e-08 4.48 7.52Plastocyanin-like domain PF02298 6.7e-53 MN5177006 7.30e-03 −1.13 −6.69 7.4e-07 −2.78 −5.37KN1-like HD protein2 UniRef100_Q8GZN0 7.6e-41 MN5170799 9.2e-10 3.08 5.93 4.0e-06 0.72 0.30Class III HD-ZIP UniRef100_Q0QSS2 0 MN5242717 2.2e-09 2.69 2.83 2.0e-07 −2.05 −4.79Class III HD-ZIP UniRef100_Q20BK6 2.1e-58 MN5191865 9.1e-09 1.76 4.64 1.0e-07 −1.18 −2.37LIM domain PF00412 1.7e-45 MN5242894 6.4e-08 1.88 2.83 4.3e-08 1.40 −0.11LIM domain PF00412 9.3e-54 MN5244658 7.7e-05 0.48 −0.46 0.5 0.07 −0.41Sterol methyltransferase PF08498 5.4e-38 MN5259377 3.4e-06 −0.71 −1.77 0.4 0.1 −0.12Protein kinase PF0069 4.2e-36 MN5195076 0.17 −0.10 −0.36 0.004 −0.25 −0.07
aMN_ID: identifier enabling access to sequence and annotation in ForestTreeDB database (Pavy et al., 2007).bM, log2 ratio of normalized intensities for each channel (Alexa Fluor® 555 and Alexa Fluor® 647). Xylem preferential is M > 0 compared with needles and M < 0 compared with phloem (also Tables 6 and 7).cM, log2 ratio based on the average number of molecules ng−1 of total RNA corrected to Elongation factor 1a-α for each sample.DUF, domain of unknown function; KN, knotted; HD-ZIP, homedomain-leucine zipper; LIM, LIM-domain TF.
New Phytologist (2008) 180: 766–786 www.newphytologist.org © The Authors (2008). Journal compilation © New Phytologist (2008)
Research774
(PF06090)), or are shared between Arabidopsis andCaenorhabditis elegans (e.g. DUF547 (PF04784)). All butfour of these sequences matched a sequence from the PinusGene Index (PGI6.0) (blastn P < 10–20), suggesting that most ofthem are conserved in conifers.
Differential expression of sequences from multigene families and specificity of the arrays
One approach to help assign respective biological roles to closelyrelated sequences is to determine their spatial and temporaltranscript profiles; therefore, transcript profiling must beable to discriminate between members of multigene families.Thus we examined the specificity of the spruce microarray bysurveying transcript accumulation in a few different genefamilies. Indeed, several of these closely related sequences gavedifferent microarray profiles of transcript abundance in xylem,phloem and needles, including putative CESAs, cellulosesynthase-like proteins (CSLs), caffeic acid O-methyltransferasesand cinnamoyl CoA reductases (Table 5). Each of the microarraydata were confirmed by RT-qPCR using gene-specific primersdesigned to unambiguously discriminate between familymembers.
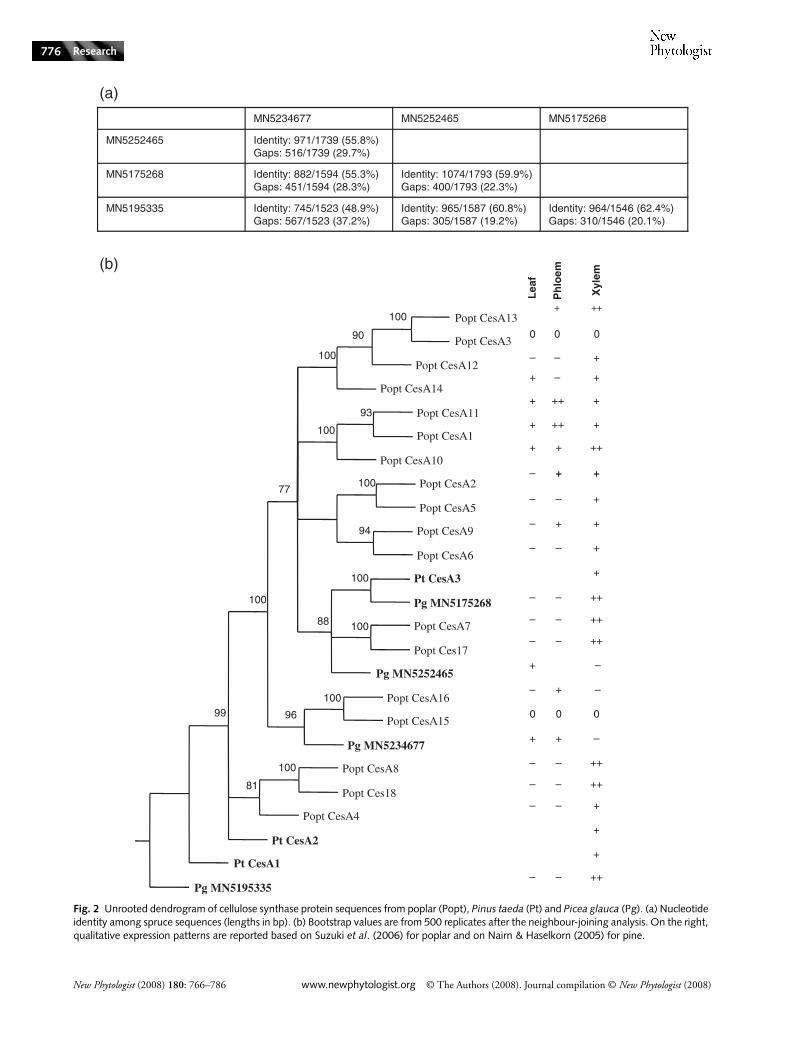
Within the CesA gene family, two sequences were clearlymore abundant in xylem, whereas a third was preferentiallyexpressed in needles, and a fourth sequence had low transcriptlevels in xylem (Table 5; Fig. 2). The average similarities amongthese sequences ranged from 49 to 64% nucleotide identity
over the entire sequences. The CESAs belong to the cellulosesynthase superfamily, along with CSLs. The transcript profilesof the two xylem-preferential cesa sequences from spruce wereconsistent with the most closely related sequences from otherspecies (Fig. 2), including pine cesa sequences linked to thesecondary cell wall (Nairn & Haselkorn, 2005) and the mosthighly expressed cesa in developing xylem tissues of poplar(PoptCesA8) (Suzuki et al., 2006). Furthermore, the sprucesequence with low transcript levels in xylem was closest to poplarsequences with either undetectable transcripts (PoptCesA15)or with phloem-preferential transcripts (PoptCesA16 ) (Suzukiet al., 2006). Similarly, two spruce sequences of the CSL familyhad opposite expression profiles (Table 5) that were consistentwith putative homologues from poplar belonging to the xylem-preferential CLSA subgroup, and to the CLSD subgroupwhich lacks tissue specificity (Suzuki et al., 2006). Within thecaffeic acid methyltransferase family (COMT), two sequenceswere more abundant in xylem and one was preferential tophloem and needles. The cinnamoyl-coA reductase familywas also represented by several sequences on the microarray(Tables S4 and S5). A strongly xylem-preferential sprucesequence was the closest to Arabidopsis genes cinnamoyl-CoAreductase 1 (ccr1) and ccr2 (68.8 and 72.5% of identity withthe spruce sequence), which are both expressed during ligni-fication in normal xylem development (Raes et al., 2003).However, a spruce ccr-like sequence (with 42.3% nucleotideidentity to other spruce ccr sequences) was preferential to theother two tissues we analysed.
Fig. 1 Significance and relative expression differences of four major protein classes in the xylem/needle comparison. The B statistic (y-axis) is the log-odds that the sequence is differentially expressed, calculated according to moderated t-test for differential expression between the two tissues. The horizontal line (log-odds B = 3) represents a probability of c. 95% of differential transcript levels. Vertical dashed lines are a fold-difference of 1.74 (M = 0.8 or −0.8) and the solid lines are a twofold cut-off (M = 1 or −1). Yellow squares, sequences encompassing domains of unknown function (DUF) in the Protein FAMilies (PFAM) database; red, cell wall-related sequences; green, photosynthesis proteins; blue, chloroplastic proteins.

© T
he Authors (2008). Journal com
pilation © N
ew Phytologist (2008)
ww
w.new
phytologist.orgN
ew Phytologist (2008) 180: 766–786
Research
775
Table 5 Annotation and differential expression of sequences belonging to multigene families
Contiga MN_ID Gene family SubfamilyBest blastx hit against NR protein database
Score (e-value) of best blastx hit
Microarray M value for xylem vs needlesb
qPCR M value for xylem vs needlesb
Microarray M value for phloem vs xylemc
qPCR M value for phloem vs xylemc
Contig10364 MN5176929 COMT emb|CAI30878.1| caffeate O-methyltransferase (Picea abies)
739 (0) 2.13 3.45 −2.86 −4.26
Contig6487 MN5194345 COMT gb|AAD24001.1|AF119225_1 caffeic acid O-methyl-transferase (Pinus radiata)
228 (5e-58) 1.24 4.17 −4.51 −2.71
Contig7787 MN5255308 COMT prf||2119166A caffeic acid O-methyltransferase
186 (1e-45) −2.72 −2.84 −0.08 −0.26
Contig10052 MN5164253 CCoAOMT emb|CAJ43712.1| caffeoyl-CoA O-methyltransferase (Plantago major)
194 (1e-47) −3.32 −6.25 0.14 3.89
Contig10388 MN5175268 Glycosyl-transferase
Cellulose synthase
gb|AAT57672.1| cellulose synthase catalytic sub. (Pinus radiata)
528 (3e-148) 1.92 3.15 −4.07 −5.62
Contig9669 MN5195335 Glycosyl-transferase
Cellulose synthase
gb|AAX18647.1| cellulose synthase catal. subun. (Pinus taeda)
749 (0) 1.97 3.13 −5.02 −6.95
Contig10028 MN5234677 Glycosyl-transferase
Cellulose synthase
gb|AAP40636.1| cellulose synthase 6 (Populus tremuloides)
392 (2e-107) −1.15 −2.39 1.05 0.59
Contig12982 MN5194187 Glycosyl-transferase
Cellulose synthase-like
gb|ABG34547.1| cellulose synthase-like A1 (Pinus taeda)
417 (3e-115) 1.19 2.75 −2.77 −3.58
Contig10968 MN5236143 Glycosyl-transferase
Cellulose synthase like
gb|AAZ32787.1| cellulose synthase-like prot. CslE [N. tabacum]
270 (9e-71) −2.73 −4.26 0.44 0.89
Contig7821 MN5259392 Cinnamoyl CoA reductase
emb|CAK18610.1| cinnamoyl CoA reductase (Picea abies)
506 (1e-141) 1.11 1.77 −3.08 −4.13
Contig5774 MN5234490 Cinnamoyl CoA reductase-like
gb|AAM62926.1| cinnamoyl CoA reductase-like protein (Arabidopsis thaliana)
268 (4e-67) −0.10 −0.44 1.35 1.75
Contig7840 MN5235414 Cinnamoyl CoA reductase-like
gb|AAN65066.1| cinnamoyl-CoA reductase-like protein (Arabidopsis thaliana)
171 (7e-41) −3.22 −7.13 0.76 1.56
aSequences and annotation can be retrieved from http://ForestTree.org with the query ‘Obtain unigeneIDs from contig names’ by using values like ‘spruce_contig_dir8:Contig10364’.bM > 0 for xylem-preferential genes; M < 0 for needle-preferential genes.cM > 0 for phloem-preferential genes; M < 0 for xylem-preferential genes.CCoAOMT, caffeoyl-CoA O-methyltransferase; COMT, caffeic acid methyltransferase; NR, non redundant.
New Phytologist (2008) 180: 766–786 www.newphytologist.org © The Authors (2008). Journal compilation © New Phytologist (2008)
Research776
Fig. 2 Unrooted dendrogram of cellulose synthase protein sequences from poplar (Popt), Pinus taeda (Pt) and Picea glauca (Pg). (a) Nucleotide identity among spruce sequences (lengths in bp). (b) Bootstrap values are from 500 replicates after the neighbour-joining analysis. On the right, qualitative expression patterns are reported based on Suzuki et al. (2006) for poplar and on Nairn & Haselkorn (2005) for pine.
© The Authors (2008). Journal compilation © New Phytologist (2008) www.newphytologist.org New Phytologist (2008) 180: 766–786
Research 777
Identification of a core xylem gene set
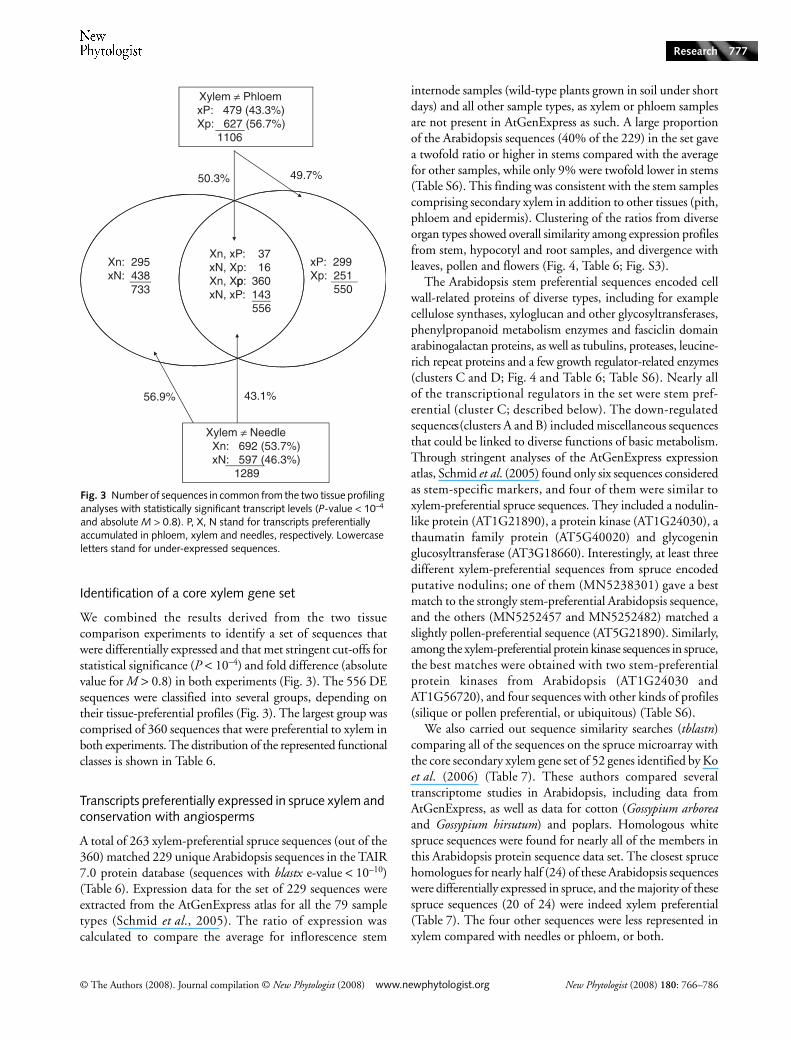
We combined the results derived from the two tissuecomparison experiments to identify a set of sequences thatwere differentially expressed and that met stringent cut-offs forstatistical significance (P < 10–4) and fold difference (absolutevalue for M > 0.8) in both experiments (Fig. 3). The 556 DEsequences were classified into several groups, depending ontheir tissue-preferential profiles (Fig. 3). The largest group wascomprised of 360 sequences that were preferential to xylem inboth experiments. The distribution of the represented functionalclasses is shown in Table 6.
Transcripts preferentially expressed in spruce xylem and conservation with angiosperms
A total of 263 xylem-preferential spruce sequences (out of the360) matched 229 unique Arabidopsis sequences in the TAIR7.0 protein database (sequences with blastx e-value < 10–10)(Table 6). Expression data for the set of 229 sequences wereextracted from the AtGenExpress atlas for all the 79 sampletypes (Schmid et al., 2005). The ratio of expression wascalculated to compare the average for inflorescence stem
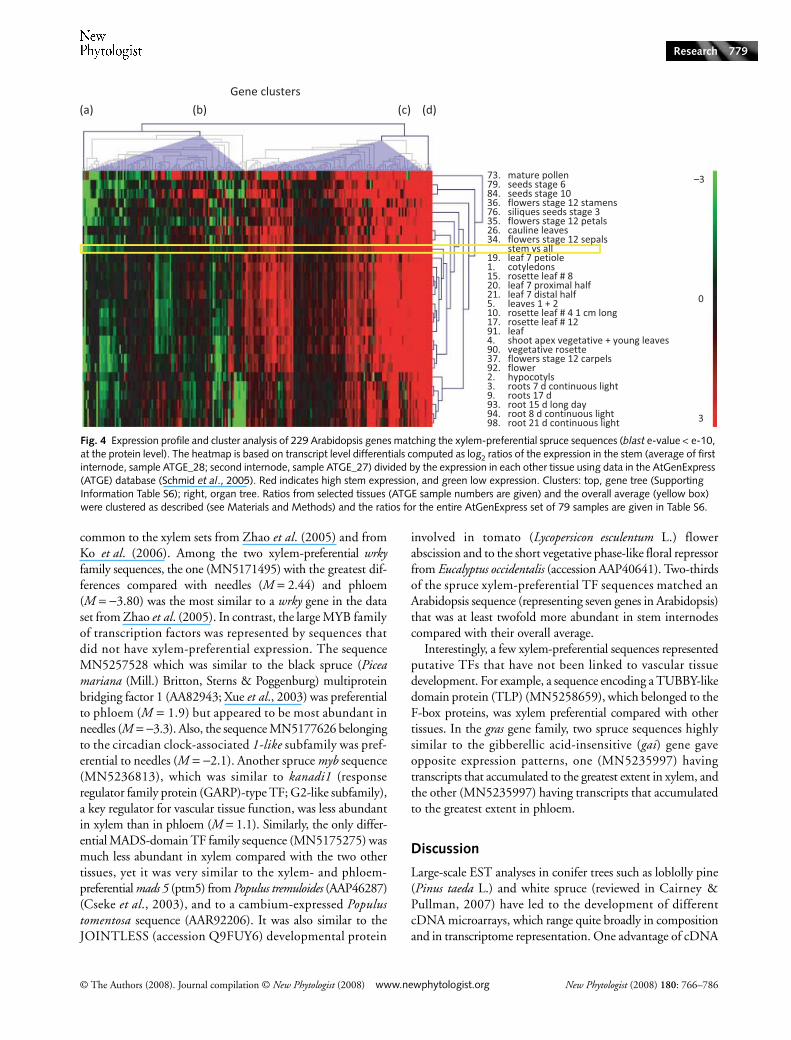
internode samples (wild-type plants grown in soil under shortdays) and all other sample types, as xylem or phloem samplesare not present in AtGenExpress as such. A large proportionof the Arabidopsis sequences (40% of the 229) in the set gavea twofold ratio or higher in stems compared with the averagefor other samples, while only 9% were twofold lower in stems(Table S6). This finding was consistent with the stem samplescomprising secondary xylem in addition to other tissues (pith,phloem and epidermis). Clustering of the ratios from diverseorgan types showed overall similarity among expression profilesfrom stem, hypocotyl and root samples, and divergence withleaves, pollen and flowers (Fig. 4, Table 6; Fig. S3).
The Arabidopsis stem preferential sequences encoded cellwall-related proteins of diverse types, including for examplecellulose synthases, xyloglucan and other glycosyltransferases,phenylpropanoid metabolism enzymes and fasciclin domainarabinogalactan proteins, as well as tubulins, proteases, leucine-rich repeat proteins and a few growth regulator-related enzymes(clusters C and D; Fig. 4 and Table 6; Table S6). Nearly allof the transcriptional regulators in the set were stem pref-erential (cluster C; described below). The down-regulatedsequences (clusters A and B) included miscellaneous sequencesthat could be linked to diverse functions of basic metabolism.Through stringent analyses of the AtGenExpress expressionatlas, Schmid et al. (2005) found only six sequences consideredas stem-specific markers, and four of them were similar toxylem-preferential spruce sequences. They included a nodulin-like protein (AT1G21890), a protein kinase (AT1G24030), athaumatin family protein (AT5G40020) and glycogeninglucosyltransferase (AT3G18660). Interestingly, at least threedifferent xylem-preferential sequences from spruce encodedputative nodulins; one of them (MN5238301) gave a bestmatch to the strongly stem-preferential Arabidopsis sequence,and the others (MN5252457 and MN5252482) matched aslightly pollen-preferential sequence (AT5G21890). Similarly,among the xylem-preferential protein kinase sequences in spruce,the best matches were obtained with two stem-preferentialprotein kinases from Arabidopsis (AT1G24030 andAT1G56720), and four sequences with other kinds of profiles(silique or pollen preferential, or ubiquitous) (Table S6).
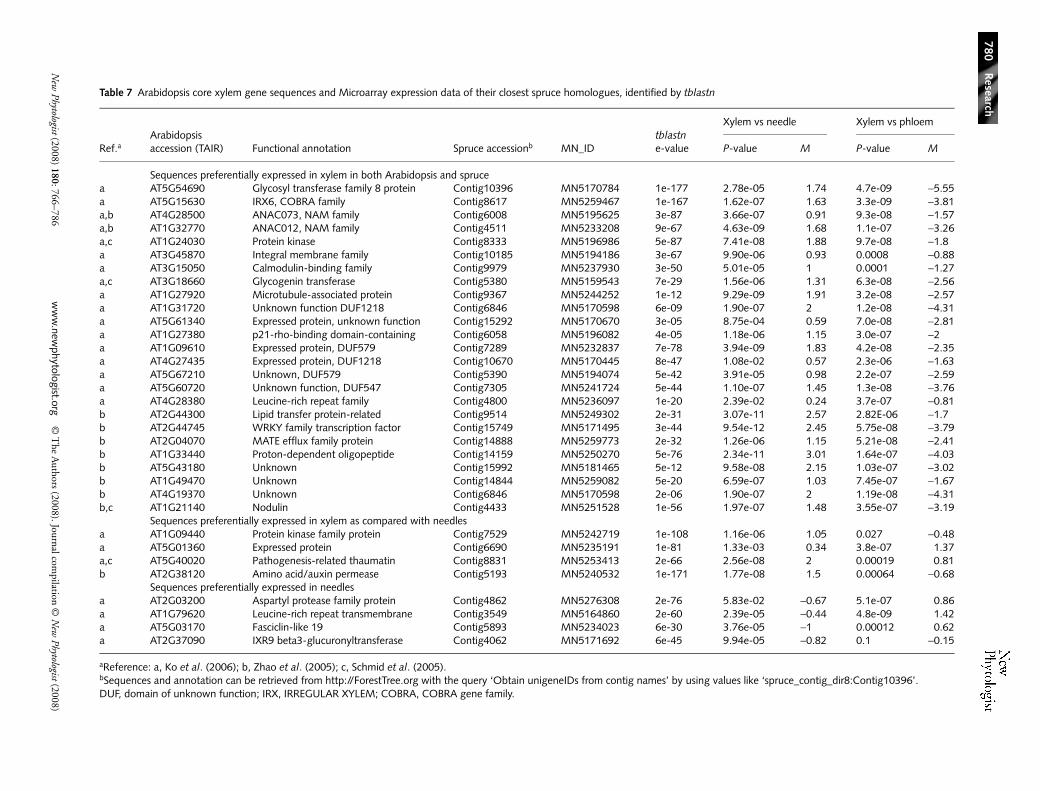
We also carried out sequence similarity searches (tblastn)comparing all of the sequences on the spruce microarray withthe core secondary xylem gene set of 52 genes identified by Koet al. (2006) (Table 7). These authors compared severaltranscriptome studies in Arabidopsis, including data fromAtGenExpress, as well as data for cotton (Gossypium arboreaand Gossypium hirsutum) and poplars. Homologous whitespruce sequences were found for nearly all of the members inthis Arabidopsis protein sequence data set. The closest sprucehomologues for nearly half (24) of these Arabidopsis sequenceswere differentially expressed in spruce, and the majority of thesespruce sequences (20 of 24) were indeed xylem preferential(Table 7). The four other sequences were less represented inxylem compared with needles or phloem, or both.
Fig. 3 Number of sequences in common from the two tissue profiling analyses with statistically significant transcript levels (P-value < 10–4 and absolute M > 0.8). P, X, N stand for transcripts preferentially accumulated in phloem, xylem and needles, respectively. Lowercase letters stand for under-expressed sequences.
New Phytologist (2008) 180: 766–786 www.newphytologist.org © The Authors (2008). Journal compilation © New Phytologist (2008)
Research778
We also compared the spruce sequences with a data setderived from the Arabidopsis root-hypocotyl, which contains319 sequences specifically regulated in xylem compared withphloem or nonvascular tissues (Zhao et al., 2005). We identified15 different Arabidopsis sequences from this data set forwhich the closest spruce homologue was over-expressed inxylem compared with phloem, needles, or both tissues (Table 7).The sequences included two NAC-domain sequences and twouncharacterized proteins containing DUFs, which were alsopresent in the set from Ko et al. (2006). The other sequencesincluded a lipid transfer protein, a WRKY transcription factor,a multidrug and toxic compound extrusion (MATE) effluxfamily protein, a proton-dependent oligopeptide transportprotein (POT), a glycosyl transferase family 43 protein, anodulin-like protein, a ser/thr protein kinase, an amino acid/auxin permease, and three sequences of unknown function.When combined, the two analyses on xylem core genesyielded 31 homologue sequences, which were xylem preferentialin Arabidopsis and in spruce.
Regulatory proteins expressed in secondary xylem
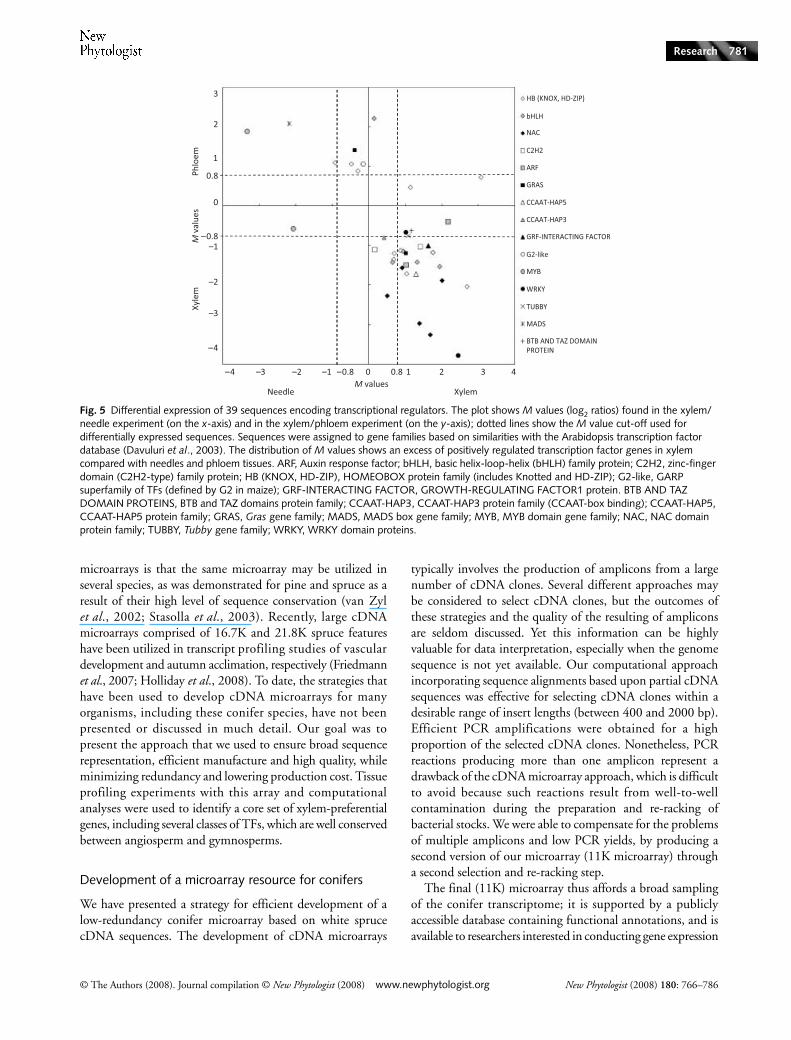
Putative transcriptional regulators were represented by 39sequences differentially expressed in at least one microarrayexperiment (M > 0.8 or M < −0.8; P < 0.0001) (Fig. 5). The
largest group of putative transcription factors included 18sequences that were more abundant in xylem compared withboth needles and phloem, whereas only three putative TFsequences were consistently less abundant in xylem. These DETFs represented 15 different families in the Arabidopsis TAIRdatabase. An additional set of 32 putative TF sequences hadstatistically significant differential transcript levels (P < 0.0001)but gave lower fold differences, that is, 0.8 > absolute Mvalue > 0.5 (Tables S4 and S5).
The functional annotations of xylem-preferential TFs wereconsistent with previous reports on transcriptional regulationof xylem differentiation and growth (reviewed by Demura &Fukuda, 2007). The homeobox (HB) family was stronglyrepresented, with three sequences from the KNOX subfamily(MN5170799, MN5243491 and MN5170213) and sevensequences from the homeodomain-leucine zipper (HD-ZIP)subfamily (MN5242717, MN5191865, MN5258589,MN5169141, MN5193600, MN5252602 and MN5196142).The xylem differentiation-related class III HD-ZIPs (Ohashi-Ito et al., 2005) were represented by four sequences overrep-resented in xylem, while one class IV and two class I HD-ZIPswere underrepresented in xylem (Fig. 5). Four nac sequenceswere also more abundant in xylem versus needles andphloem (MN5195909, MN5233208, MN5195625 andMN5181845). The nac/nam (no apical meristem) TFs were
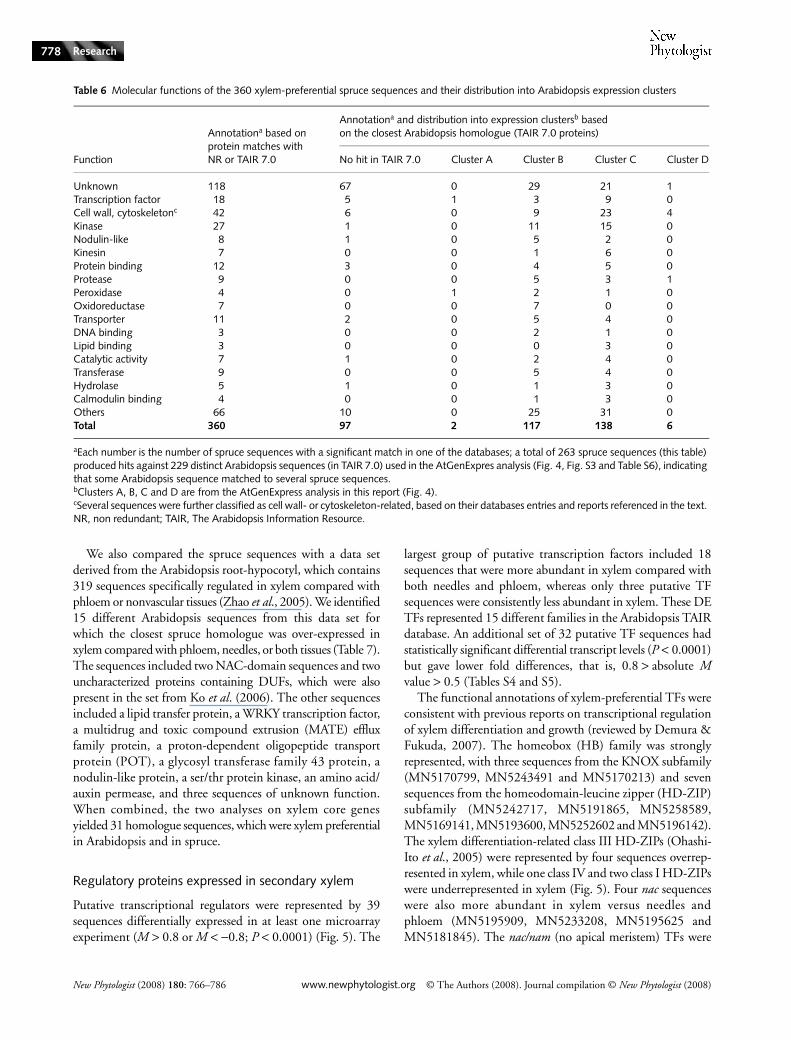
Table 6 Molecular functions of the 360 xylem-preferential spruce sequences and their distribution into Arabidopsis expression clusters
Function
Annotationa based on protein matches with NR or TAIR 7.0
Annotationa and distribution into expression clustersb based on the closest Arabidopsis homologue (TAIR 7.0 proteins)
No hit in TAIR 7.0 Cluster A Cluster B Cluster C Cluster D
Unknown 118 67 0 29 21 1Transcription factor 18 5 1 3 9 0Cell wall, cytoskeletonc 42 6 0 9 23 4Kinase 27 1 0 11 15 0Nodulin-like 8 1 0 5 2 0Kinesin 7 0 0 1 6 0Protein binding 12 3 0 4 5 0Protease 9 0 0 5 3 1Peroxidase 4 0 1 2 1 0Oxidoreductase 7 0 0 7 0 0Transporter 11 2 0 5 4 0DNA binding 3 0 0 2 1 0Lipid binding 3 0 0 0 3 0Catalytic activity 7 1 0 2 4 0Transferase 9 0 0 5 4 0Hydrolase 5 1 0 1 3 0Calmodulin binding 4 0 0 1 3 0Others 66 10 0 25 31 0Total 360 97 2 117 138 6
aEach number is the number of spruce sequences with a significant match in one of the databases; a total of 263 spruce sequences (this table) produced hits against 229 distinct Arabidopsis sequences (in TAIR 7.0) used in the AtGenExpres analysis (Fig. 4, Fig. S3 and Table S6), indicating that some Arabidopsis sequence matched to several spruce sequences.bClusters A, B, C and D are from the AtGenExpress analysis in this report (Fig. 4).cSeveral sequences were further classified as cell wall- or cytoskeleton-related, based on their databases entries and reports referenced in the text. NR, non redundant; TAIR, The Arabidopsis Information Resource.
© The Authors (2008). Journal compilation © New Phytologist (2008) www.newphytologist.org New Phytologist (2008) 180: 766–786
Research 779
common to the xylem sets from Zhao et al. (2005) and fromKo et al. (2006). Among the two xylem-preferential wrkyfamily sequences, the one (MN5171495) with the greatest dif-ferences compared with needles (M = 2.44) and phloem(M = −3.80) was the most similar to a wrky gene in the dataset from Zhao et al. (2005). In contrast, the large MYB familyof transcription factors was represented by sequences thatdid not have xylem-preferential expression. The sequenceMN5257528 which was similar to the black spruce (Piceamariana (Mill.) Britton, Sterns & Poggenburg) multiproteinbridging factor 1 (AA82943; Xue et al., 2003) was preferentialto phloem (M = 1.9) but appeared to be most abundant inneedles (M = −3.3). Also, the sequence MN5177626 belongingto the circadian clock-associated 1-like subfamily was pref-erential to needles (M = −2.1). Another spruce myb sequence(MN5236813), which was similar to kanadi1 (responseregulator family protein (GARP)-type TF; G2-like subfamily),a key regulator for vascular tissue function, was less abundantin xylem than in phloem (M = 1.1). Similarly, the only differ-ential MADS-domain TF family sequence (MN5175275) wasmuch less abundant in xylem compared with the two othertissues, yet it was very similar to the xylem- and phloem-preferential mads 5 (ptm5) from Populus tremuloides (AAP46287)(Cseke et al., 2003), and to a cambium-expressed Populustomentosa sequence (AAR92206). It was also similar to theJOINTLESS (accession Q9FUY6) developmental protein
involved in tomato (Lycopersicon esculentum L.) flowerabscission and to the short vegetative phase-like floral repressorfrom Eucalyptus occidentalis (accession AAP40641). Two-thirdsof the spruce xylem-preferential TF sequences matched anArabidopsis sequence (representing seven genes in Arabidopsis)that was at least twofold more abundant in stem internodescompared with their overall average.
Interestingly, a few xylem-preferential sequences representedputative TFs that have not been linked to vascular tissuedevelopment. For example, a sequence encoding a TUBBY-likedomain protein (TLP) (MN5258659), which belonged to theF-box proteins, was xylem preferential compared with othertissues. In the gras gene family, two spruce sequences highlysimilar to the gibberellic acid-insensitive (gai) gene gaveopposite expression patterns, one (MN5235997) havingtranscripts that accumulated to the greatest extent in xylem, andthe other (MN5235997) having transcripts that accumulatedto the greatest extent in phloem.
Discussion
Large-scale EST analyses in conifer trees such as loblolly pine(Pinus taeda L.) and white spruce (reviewed in Cairney &Pullman, 2007) have led to the development of differentcDNA microarrays, which range quite broadly in compositionand in transcriptome representation. One advantage of cDNA
Fig. 4 Expression profile and cluster analysis of 229 Arabidopsis genes matching the xylem-preferential spruce sequences (blast e-value < e-10, at the protein level). The heatmap is based on transcript level differentials computed as log2 ratios of the expression in the stem (average of first internode, sample ATGE_28; second internode, sample ATGE_27) divided by the expression in each other tissue using data in the AtGenExpress (ATGE) database (Schmid et al., 2005). Red indicates high stem expression, and green low expression. Clusters: top, gene tree (Supporting Information Table S6); right, organ tree. Ratios from selected tissues (ATGE sample numbers are given) and the overall average (yellow box) were clustered as described (see Materials and Methods) and the ratios for the entire AtGenExpress set of 79 samples are given in Table S6.
New
Phytologist (2008) 180: 766–786w
ww
.newphytologist.org
© T
he Authors (2008). Journal com
pilation © N
ew Phytologist (2008)
Research
780
Table 7 Arabidopsis core xylem gene sequences and Microarray expression data of their closest spruce homologues, identified by tblastn
Ref.aArabidopsis accession (TAIR) Functional annotation Spruce accessionb MN_ID
tblastn e-value
Xylem vs needle Xylem vs phloem
P-value M P-value M
Sequences preferentially expressed in xylem in both Arabidopsis and sprucea AT5G54690 Glycosyl transferase family 8 protein Contig10396 MN5170784 1e-177 2.78e-05 1.74 4.7e-09 −5.55a AT5G15630 IRX6, COBRA family Contig8617 MN5259467 1e-167 1.62e-07 1.63 3.3e-09 −3.81a,b AT4G28500 ANAC073, NAM family Contig6008 MN5195625 3e-87 3.66e-07 0.91 9.3e-08 −1.57a,b AT1G32770 ANAC012, NAM family Contig4511 MN5233208 9e-67 4.63e-09 1.68 1.1e-07 −3.26a,c AT1G24030 Protein kinase Contig8333 MN5196986 5e-87 7.41e-08 1.88 9.7e-08 −1.8a AT3G45870 Integral membrane family Contig10185 MN5194186 3e-67 9.90e-06 0.93 0.0008 −0.88a AT3G15050 Calmodulin-binding family Contig9979 MN5237930 3e-50 5.01e-05 1 0.0001 −1.27a,c AT3G18660 Glycogenin transferase Contig5380 MN5159543 7e-29 1.56e-06 1.31 6.3e-08 −2.56a AT1G27920 Microtubule-associated protein Contig9367 MN5244252 1e-12 9.29e-09 1.91 3.2e-08 −2.57a AT1G31720 Unknown function DUF1218 Contig6846 MN5170598 6e-09 1.90e-07 2 1.2e-08 −4.31a AT5G61340 Expressed protein, unknown function Contig15292 MN5170670 3e-05 8.75e-04 0.59 7.0e-08 −2.81a AT1G27380 p21-rho-binding domain-containing Contig6058 MN5196082 4e-05 1.18e-06 1.15 3.0e-07 −2a AT1G09610 Expressed protein, DUF579 Contig7289 MN5232837 7e-78 3.94e-09 1.83 4.2e-08 −2.35a AT4G27435 Expressed protein, DUF1218 Contig10670 MN5170445 8e-47 1.08e-02 0.57 2.3e-06 −1.63a AT5G67210 Unknown, DUF579 Contig5390 MN5194074 5e-42 3.91e-05 0.98 2.2e-07 −2.59a AT5G60720 Unknown function, DUF547 Contig7305 MN5241724 5e-44 1.10e-07 1.45 1.3e-08 −3.76a AT4G28380 Leucine-rich repeat family Contig4800 MN5236097 1e-20 2.39e-02 0.24 3.7e-07 −0.81b AT2G44300 Lipid transfer protein-related Contig9514 MN5249302 2e-31 3.07e-11 2.57 2.82E-06 −1.7b AT2G44745 WRKY family transcription factor Contig15749 MN5171495 3e-44 9.54e-12 2.45 5.75e-08 −3.79b AT2G04070 MATE efflux family protein Contig14888 MN5259773 2e-32 1.26e-06 1.15 5.21e-08 −2.41b AT1G33440 Proton-dependent oligopeptide Contig14159 MN5250270 5e-76 2.34e-11 3.01 1.64e-07 −4.03b AT5G43180 Unknown Contig15992 MN5181465 5e-12 9.58e-08 2.15 1.03e-07 −3.02b AT1G49470 Unknown Contig14844 MN5259082 5e-20 6.59e-07 1.03 7.45e-07 −1.67b AT4G19370 Unknown Contig6846 MN5170598 2e-06 1.90e-07 2 1.19e-08 −4.31b,c AT1G21140 Nodulin Contig4433 MN5251528 1e-56 1.97e-07 1.48 3.55e-07 −3.19
Sequences preferentially expressed in xylem as compared with needlesa AT1G09440 Protein kinase family protein Contig7529 MN5242719 1e-108 1.16e-06 1.05 0.027 −0.48a AT5G01360 Expressed protein Contig6690 MN5235191 1e-81 1.33e-03 0.34 3.8e-07 1.37a,c AT5G40020 Pathogenesis-related thaumatin Contig8831 MN5253413 2e-66 2.56e-08 2 0.00019 0.81b AT2G38120 Amino acid/auxin permease Contig5193 MN5240532 1e-171 1.77e-08 1.5 0.00064 −0.68
Sequences preferentially expressed in needlesa AT2G03200 Aspartyl protease family protein Contig4862 MN5276308 2e-76 5.83e-02 −0.67 5.1e-07 0.86a AT1G79620 Leucine-rich repeat transmembrane Contig3549 MN5164860 2e-60 2.39e-05 −0.44 4.8e-09 1.42a AT5G03170 Fasciclin-like 19 Contig5893 MN5234023 6e-30 3.76e-05 −1 0.00012 0.62a AT2G37090 IXR9 beta3-glucuronyltransferase Contig4062 MN5171692 6e-45 9.94e-05 −0.82 0.1 −0.15
aReference: a, Ko et al. (2006); b, Zhao et al. (2005); c, Schmid et al. (2005).bSequences and annotation can be retrieved from http://ForestTree.org with the query ‘Obtain unigeneIDs from contig names’ by using values like ‘spruce_contig_dir8:Contig10396’.DUF, domain of unknown function; IRX, IRREGULAR XYLEM; COBRA, COBRA gene family.
© The Authors (2008). Journal compilation © New Phytologist (2008) www.newphytologist.org New Phytologist (2008) 180: 766–786
Research 781
microarrays is that the same microarray may be utilized inseveral species, as was demonstrated for pine and spruce as aresult of their high level of sequence conservation (van Zylet al., 2002; Stasolla et al., 2003). Recently, large cDNAmicroarrays comprised of 16.7K and 21.8K spruce featureshave been utilized in transcript profiling studies of vasculardevelopment and autumn acclimation, respectively (Friedmannet al., 2007; Holliday et al., 2008). To date, the strategies thathave been used to develop cDNA microarrays for manyorganisms, including these conifer species, have not beenpresented or discussed in much detail. Our goal was topresent the approach that we used to ensure broad sequencerepresentation, efficient manufacture and high quality, whileminimizing redundancy and lowering production cost. Tissueprofiling experiments with this array and computationalanalyses were used to identify a core set of xylem-preferentialgenes, including several classes of TFs, which are well conservedbetween angiosperm and gymnosperms.
Development of a microarray resource for conifers
We have presented a strategy for efficient development of alow-redundancy conifer microarray based on white sprucecDNA sequences. The development of cDNA microarrays
typically involves the production of amplicons from a largenumber of cDNA clones. Several different approaches maybe considered to select cDNA clones, but the outcomes ofthese strategies and the quality of the resulting of ampliconsare seldom discussed. Yet this information can be highlyvaluable for data interpretation, especially when the genomesequence is not yet available. Our computational approachincorporating sequence alignments based upon partial cDNAsequences was effective for selecting cDNA clones within adesirable range of insert lengths (between 400 and 2000 bp).Efficient PCR amplifications were obtained for a highproportion of the selected cDNA clones. Nonetheless, PCRreactions producing more than one amplicon represent adrawback of the cDNA microarray approach, which is difficultto avoid because such reactions result from well-to-wellcontamination during the preparation and re-racking ofbacterial stocks. We were able to compensate for the problemsof multiple amplicons and low PCR yields, by producing asecond version of our microarray (11K microarray) througha second selection and re-racking step.
The final (11K) microarray thus affords a broad samplingof the conifer transcriptome; it is supported by a publiclyaccessible database containing functional annotations, and isavailable to researchers interested in conducting gene expression
Fig. 5 Differential expression of 39 sequences encoding transcriptional regulators. The plot shows M values (log2 ratios) found in the xylem/needle experiment (on the x-axis) and in the xylem/phloem experiment (on the y-axis); dotted lines show the M value cut-off used for differentially expressed sequences. Sequences were assigned to gene families based on similarities with the Arabidopsis transcription factor database (Davuluri et al., 2003). The distribution of M values shows an excess of positively regulated transcription factor genes in xylem compared with needles and phloem tissues. ARF, Auxin response factor; bHLH, basic helix-loop-helix (bHLH) family protein; C2H2, zinc-finger domain (C2H2-type) family protein; HB (KNOX, HD-ZIP), HOMEOBOX protein family (includes Knotted and HD-ZIP); G2-like, GARP superfamily of TFs (defined by G2 in maize); GRF-INTERACTING FACTOR, GROWTH-REGULATING FACTOR1 protein. BTB AND TAZ DOMAIN PROTEINS, BTB and TAZ domains protein family; CCAAT-HAP3, CCAAT-HAP3 protein family (CCAAT-box binding); CCAAT-HAP5, CCAAT-HAP5 protein family; GRAS, Gras gene family; MADS, MADS box gene family; MYB, MYB domain gene family; NAC, NAC domain protein family; TUBBY, Tubby gene family; WRKY, WRKY domain proteins.
New Phytologist (2008) 180: 766–786 www.newphytologist.org © The Authors (2008). Journal compilation © New Phytologist (2008)
Research782
analysis in conifers. Each amplicon on the microarray hasbeen the target of thorough analyses. Although the ESTsrepresent partial cDNA sequences, the cDNA clones wereselected based on an assembly of 16 600 unique contigs filteredto minimize sequence redundancy, which confers technicaladvantages and has decreased the cost for amplicon productionand for printing of arrays. A majority of the selected cDNAsare part of multi-clone contigs represented by a consensussequence utilized to assign putative functional annotations.
The data from two transcript profiling experiments wereanalysed as a means of evaluating the overall quality of themicroarrays and the functional annotations. The hybridizationsof several biological replicates gave high correlations betweenslides, and identified numerous xylem-preferential transcriptswith very strong statistical support and a high rate of RT-qPCR validation. Although the microarray was not designedto enable precise evaluation of probe specificity, an indicationof specificity was obtained from RT-qPCR confirmed data forfour protein families (Table 5). The distinct transcript profilesdetected among different gene family members in whitespruce were consistent with those of the most closely relatedsequences in other species; cellulose synthases from Populustrichocarpa (Suzuki et al., 2006) and P. taeda (Nairn & Haselkorn,2005), cellulose synthase-like proteins from P. trichocarpa andArabidopsis (Suzuki et al., 2006), coumaryl-CoA reductases(Raes et al., 2003) and caffeic acid methyltransferase.
Identification of spruce-specific and conserved xylem core gene sets
Investigations of the molecular mechanisms underlying vasculardevelopment and wood formation have employed transcriptprofiling in diverse experimental systems including Arabidopsis,poplars and conifer trees. One recent approach consisted ofdefining a core set of xylem genes based on developmentalseries and tissue comparisons. A core xylem gene set encom-passing 52 genes was identified by Ko et al. (2006), whocompared sets of genes derived from several transcriptomeanalyses of secondary xylem in Arabidopsis and poplar andcotton fibres. Another report targeting the Arabidopsisroot-hypocotyl defined a set of 319 genes specifically regulatedin secondary xylem compared with phloem or nonvasculartissues (Zhao et al., 2005). These analyses aimed to identifycandidate genes that were involved in the genetic control ofsecondary vascular growth, and thus provided a valuable basisfor identifying wood formation candidate genes in trees.Following a similar approach, we identified a spruce set of 360xylem-preferential sequences compared with those of bothneedles and phloem, based upon stringent significanceand fold difference thresholds that were shown to be robustaccording to our RT-qPCR validations.
We also conducted similarity searches that compared theentire set of sequences on our white spruce microarrays witheach of the two Arabidopsis data sets of Zhao et al. (2005) and
Ko et al. (2006) to search for conserved xylem-preferentialsequences. We identified a set of 31 xylem-preferential sequences,which are well conserved in sequence and expression patternsbetween angiosperms and gymnosperms. The two Arabidopsisdata sets were quite complementary and helped us to detecta broader set of putatively conserved xylem markers inArabidopsis and spruce, as only four sequences were in commonto both data sets. Large-scale analysis of sequence similaritiesamong microarray data sets probably represents a robustapproach to identifying genes whose biological role may beconserved among angiosperms and gymnosperms. The multigenefamilies implicated in these biological processes have memberswith diverse expression profiles, and so functional annotationsand Gene Ontology classifications alone do not seem sufficientto make such functional predictions. This was seen for cesa andother cell wall-related sequences (this study), lipid transferproteins (Friedmann et al., 2007), dirigent proteins (Ralphet al., 2006), and MYBs (Bedon et al., 2007), among others.Hence, the 31 xylem-preferential sequences that we identifiedmay turn out to be especially valuable markers in investigatingdevelopment conservation across wide-ranging taxa.
Further insights into the potential for functional conservationof genes from these distantly related plants (spruce andArabidopsis) were gained from the AtGenExpress profiles ofthe 229 Arabidopsis sequences that matched xylem-preferentialsequences from spruce. Interestingly, four of the six stem-specific markers from Arabidopsis were among these (thisreport) and were part of the 31 conserved secondary xylemsequences derived from Arabidopsis and other species (Zhaoet al., 2005; Ko et al., 2006). Among this set of Arabidopsissequences, the 40% that gave stem-preferential expression inAtGenExpress were strongly represented by cell wall-relatedproteins or TFs associated with xylogenesis. Furthermore, manyof those classified as unknown or hypothetical proteins werenot stem preferential in AtGenExpress, potentially allowingidentification of xylem-preferential sequences from spruce thatlacked conservation in terms of their expression profile ortheir sequence. The analysis also highlighted the relativeconservation of expression in stems, hypocotyls and roots.
These tissue-preferential profiles may be utilized to filterand mine results of experiments focused on genetic andphysiological control of transcription, as similar experimentswere shown to give good repeatability in Arabidopsis, as dem-onstrated by Zhao et al. (2005). These authors also discussed thelimitations of such profiles, most prominently the occurrenceof false negatives as a result of an apparent lack of sensitivityof microarray hybridization compared with RT-PCR methods.Developmental variation represents a further limitation thatmust be considered, especially in trees. The poplar woodformation roadmap, presented by Hertzberg et al. (2001), andseasonal profiling studies in pine (Egertsdotter et al., 2003; LeProvost et al., 2003) also showed that the transcripts of manyxylem-expressed sequences fluctuate with differentiation andover time during the growth season.

© The Authors (2008). Journal compilation © New Phytologist (2008) www.newphytologist.org New Phytologist (2008) 180: 766–786
Research 783
Functional conservation of xylem-preferential sequences
Several gene families that encode enzymes and structuralproteins of the cell wall, as well as signalling and regulatoryproteins, have been linked to secondary xylem developmentin both angiosperms and gymnosperms (e.g. Hertzberg et al.,2001; Demura et al., 2002; Oh et al., 2003; Yang et al., 2004;Nairn and Haselkorn, 2005; Friedmann et al., 2007). Cellwall-related transcripts that accumulate in secondary xyleminclude enzymes of cellulose, hemicellulose and ligninbiosynthesis or modification, arabinogalactan proteins, proline-and hydroxyproline-rich proteins, expansins, xyloglucanendotransglycosylases, glycosyl transferases (family 8, 43) andmany others, which will not be reviewed here. Friedman et al.(2007) compared different portions of the terminal stem ofSitka spruce (Picea sitchensis (Bong.) Carr) and showed thatthe base which produces secondary xylem indeed accumulatedhigher levels of many of these transcripts. Similarly, Yang et al.(2004) found that transcripts for several of the same genefamilies accumulated preferentially in pine xylem comparedwith the megagametophyte, needles and embryos. One ofthe xylem-preferential spruce sequences was similar to theArabidopsis cobra-like4 gene (also in Friedman et al., 2006;Ko et al., 2006). It codes for a protein involved in celluloseand pectin-containing secondary cell wall biogenesis. Membersof the cobra (cob) gene family have been shown to play a rolein specific types of cell expansion or cell wall biosynthesis(Roudier et al., 2005; Brady et al., 2007).
Classification of sequences according to GO terms alsohighlighted groups of sequences, which have differentialtranscript accumulation in the tissues that we investigated.Zhao et al. (2005) showed that transcripts linked to cellularcommunication/signal transduction as well as transportfacilitation were overrepresented in the secondary xylem ofthe Arabidopsis hypocotyl. In spruce, most of the receptor proteinkinases were xylem preferential, including several sequencesrelated to the protein serine/threonine kinase CLAVATAfamily. Similarly, the spruce xylem-preferential transportersincluded carbohydrate transporters, several major intrinsic proteins,such as aquaporins (compared with needles), peptide transporters(compared with phloem), patellins and others. A striking groupamong these were several nodulin-related sequences (e.g. MtN21),which have been linked to the facilitation of auxin transportin Arabidopsis. One of the few stem-specific expression markersin AtGenExpress is also a nodulin (Schmid et al., 2005);however, the xylem-expressed nodulins appeared to be morediversified in spruce. Our analysis also indicated that nearly allof the calcium-binding proteins as well as the ribosomal pro-teins were preferential to phloem compared with xylem.
Gymnosperms and angiosperms diverged over 300 millionyr ago (Savard et al., 1994). Although overall anatomical andgenomic similarity has been reported for pine and angiospermssuch as Arabidopsis (Kirst et al., 2003), xylem cell types differ
quite profoundly between these taxonomic groups. Evolutionwithin conserved gene families was also shown to have signific-antly diverged in families such as Knotted-I (e.g. Guillet-Claudeet al., 2004). Furthermore, many expressed sequences from con-ifer trees do not match proteins of known or predicted functionin other organisms (Kirst et al., 2003; Pavy et al., 2005b; Cairneyet al., 2006). Using HMM searches, we found that several suchproteins harboured conserved plant DUFs, and that 48 distinctDUFS were represented among xylem-preferential transcriptsfrom one or both experiments. Two of these DUFs, DUF547(AT5G60720) and DUF579 (AT5G67210), were also linkedto xylem in Arabidopsis (Ko et al., 2006). Taken together, theseexpression and sequence conservation data provided a basicannotation for future functional characterizations.
Transcriptional regulators in spruce xylem
The sequences encoding putative TFs that were differentiallyexpressed in at least one tissue comparison representedmost of the TF families known to be involved in vasculardifferentiation or wood formation which have been analysedin angiosperms, such as Auxin response factor (ARF), familyof auxin inducible transcriptional regulators (AUX/IAA),MYB, HD-ZIP, WRKY and NAM (Demura & Fukuda, 2007).The set of xylem-preferential TFs was similar to xylem- orstem-preferential sequences from spruce (Friedmann et al.,2007), Arabidopsis (Oh et al., 2003; Ohashi-Ito et al., 2005;Zhao et al., 2005; Schmid et al., 2005; Ko et al., 2006),poplar (Hertzberg et al., 2001), and Eucalyptus (Paux et al.,2004). Many of these TFs are part of large protein families(e.g. MYBs and WRKY), which had partial or incompleterepresentation on our microarray. Indeed, a targeted analysisof the R2R3-MYB family in white spruce showed that threesequences not on the microarray had clear xylem-preferentialtranscript accumulation (Bedon et al., 2007). We also found thatmany TFs sequences were just below our M threshold of±0.8 (although statistically significant). They included twophloem-preferential R2R3-MYB sequences, PgMyb7 (M = 0.7;National Center for Biotechnology Information (NCBI)accession EF601070) and PgMyb6 (M = 0.5; NCBI accessionEF601069), both of which were previously shown to havephloem-preferential expression by RT-qPCR (Bedon et al.,2007). Furthermore, a sequence encoding an AUX/IAA proteinwas strongly xylem preferential compared with phloem(M = −2.2; P-value = 6.37e-08) and only moderately xylempreferential when compared with needles (M = 0.6; P-value< 0.0001). Thus, these results indicated that the subset of 39sequences probably underestimate the number of DE TFsin these tissues. As relatively few TFs have been the target offunctional characterizations in woody species, this set could beappropriate to investigate the genetic control of woodformation in forest trees.
Xylem-preferential sequences also included putative TFs thathave not been previously linked to vascular tissue development,
New Phytologist (2008) 180: 766–786 www.newphytologist.org © The Authors (2008). Journal compilation © New Phytologist (2008)
Research784
namely two sequences encoding TUBBY-like proteins (TLP)belonging to the F-box proteins, and a gras family member.The TLP family was recently described in plants (Lai et al.,2004), but has not been extensively characterized. TheTUBBY domain is very well conserved across plant andanimal species (Lai et al., 2004). TLPs play a role in thesensitivity to various environmental factors, such as salt, chilling,oxidative stress, and water deficit (Jei-Fu & Chia-Ping, 2005).The six unique white spruce sequences with similarities toTLPs were represented by four or fewer ESTs, suggesting thatthey produce low-abundance transcripts (Pavy et al., 2005b).The ForestTreeDB database (http://ForestTreeDB.org) containsonly three tubby unigene sequences derived from pine xylemESTs and a large number derived from pine root ESTs. In thegras family, two sequences were highly similar to gai, but onewas xylem preferential and the other accumulated to higherlevels in phloem. Although gai is known as a repressor of thegibberellin (GA) signalling pathway, its role in secondaryxylem remains to be determined. It has been shown that gaiRNA transcripts are transported in the phloem where theywere proposed to play a role in regulating leaf development toensure optimal plant performance (Haywood et al., 2005).Together, these transcript accumulation data suggested furtherinvestigations of this gene family, in order to extend thediscovery of gene functions related to vascular development.
Concluding remarks
We have described the development of a microarray resourcebased on white spruce cDNA sequences; it is available toresearchers interested in studying conifer trees. Because of thehigh level of sequence similarity between conifers such asspruces and pines, such arrays may in fact be used in diverseconifer species (van Zyl et al., 2002; Stasolla et al., 2004).This is significant because microarray development has beenlimited to a few conifers as a result of the lack of large-scaleEST sequencing, which also severely restricts the developmentof oligonucleotide microarrays in these species. By combiningtranscript profiling and computational analyses, we identifieda core xylem gene set that is spruce-specific and a subsetof sequences that appear to be highly conserved betweenangiosperms and gymnosperms. The data provide a basis forfunctional annotation of sequences of unknown function andmay help to more precisely delineate the biological role ofsequences that are similar to proteins of known function.They also represent robust criteria with which to selectcandidate genes for functional analyses and association studies(Kirst et al., 2004).
Acknowledgements
Funding for this work was provided by Genome Canada andGenome Québec to JM for the Arborea project. The technicalassistance of P. Robichaud and P.-O. Nadeau (Université
Laval) is acknowledged. We thank Jérôme Laroche (UniversitéLaval) for his help with the analysis of the cellulose synthases.
References
Bedon F, Grima-Pettenati J, Mackay J. 2007. Conifer R2R3-MYB transcription factors: sequence analyses and gene expression in wood-forming tissues of white spruce (Picea glauca). BMC Plant Biology 7: 17.
Benjamini Y, Hochberg Y. 1995. Controlling the false discovery rate: a practical and powerful approach to multiple testing. Journal of the Royal Statistical Society B 57: 289–300.
Brady SM, Song S, Dhugga KS, Rafalski JA, Benfey PN. 2007. Combining expression and comparative evolutionary analysis. The COBRA gene family. Plant Physiology 143: 172–187.
Cairney J, Pullman GS. 2007. The cellular and molecular biology of conifer embryogenesis. New Phytologist 176: 511–536.
Cairney J, Zheng L, Cowels A, Hsiao J, Zismann V, Liu J, Ouyang S, Thibaud-Nissen F, Hamilton J, Childs K et al. 2006. Expressed sequence tags from loblolly pine embryos reveal similarities with angiosperm embryogenesis. Plant Molecular Biology 62: 485–501.
Chang S, Puryear J, Cairney J. 1993. Simple and efficient method for isolating RNA from pine trees. Plant Molecular Biology Reporter 11: 113–116.
Cseke LJ, Zheng J, Podila GK. 2003. Characterization of PTM5 in aspen trees: a MADS-box gene expressed during woody vascular development. Gene 30: 55–67.
Davuluri RV, Sun H, Palaniswamy SK, Matthews N, Molina C, Kurtz M, Grotewold E. 2003. AGRIS: Arabidopsis Gene Regulatory Information Server, an information resource of Arabidopsis cis-regulatory elements and transcription factors. BMC Bioinformatics 23: 25.
Demura T, Fukuda H. 2007. Transcriptional regulation in wood formation. Trends in Plant Science 12: 64–70.
Demura T, Tashiro G, Horiguchi G, Kishimoto N, Kubo M, Matsuoka N, Minami A, Nagata-Hiwatashi M, Nakamura K, Okamura Y et al. 2002. Visualisation by comprehensive microarray analysis of gene expression programs during transdifferentiation of mesophyll cells into xylem cells. Proceedings of the National Academy of Sciences, USA 99: 15794–15799.
Dudoit S, Yang YH. 2002. Bioconductor R packages for exploratory analysis and normalization of cDNA microarray data. In: Parmigiani G, Garrett ES, Irizarry RA, Zeger SL, eds. The analysis of gene expression data: methods and software. New York, NY, USA: Springer, 73–101.
Egertsdotter U, van Zyl L, Mackay J, Whetten R, Peter G, Sederoff R. 2004. Gene expression profiling during formation of earlywood and latewood in loblolly pine: expression profiles of 350 genes. Plant Biology 6: 654–663.
Eisen MB, Spellman PT, Brown PO, Botstein D. 1998. Cluster analysis and display of genome-wide expression patterns. Proceedings of the National Academy of Sciences, USA 95: 14863–14868.
Felsenstein J. 2005. PHYLIP (Phylogeny Inference Package) version 3.6. (Distributed by the author.) Department of Genome Sciences, University of Washington, Seattle, WA, USA.
Foucart C, Paux E, Ladouce N, San-Clemente H, Grima-Pettenati J, Sivadon P. 2006. Transcript profiling of a xylem vs phloem cDNA subtractive library identifies new genes expressed during xylogenesis in Eucalyptus. New Phytologist 170: 739–752.
Friedmann M, Ralph SG, Aeschliman D, Zhuang J, Ritland K, Ellis BE, Bohlmann J, Douglas CJ. 2007. Microarray gene expression profiling of developmental transitions in Sitka spruce (Picea sitchensis) apical shoots. Journal of Experimental Botany 58: 593–614.
Guillet-Claude C, Isabel N, Pelgas B, Bousquet J. 2004. The evolutionary implications of knox-I gene duplications in conifers: correlated evidence from phylogeny, gene mapping, and analysis of functional divergence. Molecular Biology Evolution 21: 2232–2245.

© The Authors (2008). Journal compilation © New Phytologist (2008) www.newphytologist.org New Phytologist (2008) 180: 766–786
Research 785
Haywood V, Yu TS, Huang NC, Lucas WJ. 2005. Phloem long-distance trafficking of GIBBERELLIC ACID-INSENSITIVE RNA regulates leaf development. Plant Journal 42: 49–68.
Hertzberg M, Aspeborg H, Schrader J, Andersson A, Erlandsson R, Blomqvist K, Bhalerao R, Uhlen M, Teeri TT, Lundeberg J et al. 2001. A transcriptional roadmap to wood formation. Proceedings of the National Academy of Sciences, USA 98: 14732–14737.
Holliday JA, Ralph SG, White R, Bohlmann J, Aitken SN. 2008. Global monitoring of autumn gene expression withi and among phenotypically divergent populations of Sitka spruce [Picea sitchensis (Bong.) Carr.]. New Phytologist 178: 103–122.
Jei-Fu S, Chia-Ping L 2005. Plant Tubby-like proteins. US Patent 7314756, Issued January 1, 2008.
Kirst M, Johnson AF, Baucom C, Ulrich E, Hubbard K, Staggs R, Paule C, Retzel E, Whetten R, Sederoff R. 2003. Apparent homology of expressed genes from wood-forming tissues of loblolly pine (Pinus taeda L.) with Arabidopsis thaliana. Proceedings of the National Academy of Sciences, USA 100: 7383–7388.
Kirst M, Myburg AA, Kirst ME, Scott J, Sederoff RR. 2004. Coordinated genetic regulation of growth and lignin content revealed by QTL analysis of cDNA microarray data in an interspecific cross of Eucalyptus. Plant Physiology 135: 2368–2378.
Ko JH, Beers EP, Han KH. 2006. Global comparative transcriptome analysis identifies gene network regulating secondary xylem development in Arabidopsis thaliana. Molecular Genetics Genomics 276: 517–531.
Lai CP, Lee CL, Chen PH, Wu SH, Yang CC, Shaw JF. 2004. Molecular analyses of the Arabidopsis TUBBY-like protein gene family. Plant Physiology 134: 1586–1597.
Le Provost G, Paiva J, Pot D, Brach J, Plomion C. 2003. Seasonal variation in transcript accumulation in wood forming tissues of maritime pine (Pinus pinaster Ait.) with emphasis on a cell wall glycine rich protein. Planta 217: 820–830.
Lorenz WW, Sun F, Liang C, Kolychev D, Wang H, Zhao X, Cordonnier-Pratt MM, Pratt LH, Dean JF. 2006. Water stress-responsive genes in loblolly pine (Pinus taeda) roots identified by analyses of expressed sequence tag libraries. Tree Physiology 26: 1–16.
Nairn CJ, Haselkorn T. 2005. Three loblolly pine CesA genes expressed in developing xylem are orthologous to secondary cell wall CesA genes of angiosperms. New Phytologist 166: 907–915.
Oh S, Park S, Han KH. 2003. Transcriptional regulation of secondary growth in Arabidopsis thaliana. Journal of Experimental Botany 54: 2709–2722.
Ohashi-Ito K, Kubo M, Demura T, Fukuda H. 2005. Class III homeodomain leucine-zipper proteins regulate xylem cell differentiation. Plant Cell Physiology 46: 1646–1656.
Paux E, Tamasloukht M, Ladouce N, Sivadon P, Grima-Pettenati J. 2004. Identification of genes preferentially expressed during wood formation in Eucalyptus. Plant Molecular Biology 55: 263–280.
Pavy N, Johnson JJ, Crow JA, Paule C, Kunau T, MacKay J, Retzel EF. 2007. ForestTreeDB: a database dedicated to the mining of tree transcriptomes. Nucleic Acids Research 35: D888–D894.
Pavy N, Laroche J, Bousquet J, Mackay J. 2005a. Large-scale statistical analysis of secondary xylem ESTs in pine. Plant Molecular Biology 57: 203–224.
Pavy N, Paule C, Parsons L, Crow J, Morency MJ, Cooke J, Johnson JE, Noumen E, Guillet-Claude C, Butterfield Y et al. 2005b. Generation, annotation, analysis and database integration of 16 500 white spruce EST clusters. BMC Genomics 6: 144.
Raes J, Rohde A, Christensen JH, Van de Peer Y, Boerjan W. 2003. Genome-wide characterization of the lignification toolbox in Arabidopsis. Plant Physiology 133: 1051–1071.
Ralph SG, Yueh H, Friedmann M, Aeschliman D, Zeznik JA, Nelson CC, Butterfield YS, Kirkpatrick R, Liu J, Jones SJ et al. 2006. Conifer defence against insects: microarray gene expression profiling of Sitka spruce (Picea
sitchensis) induced by mechanical wounding or feeding by spruce budworms (Choristoneura occidentalis) or white pine weevils (Pissodes strobi) reveals large-scale changes of the host transcriptome. Plant, Cell & Environnment 29: 1545–1570.
Roudier F, Fernandez AG, Fujita M, Himmelspach R, Borner GH, Schindelman G, Song S, Baskin TI, Dupree P, Wasteneys GO et al. 2005. COBRA, an Arabidopsis extracellular glycosyl-phosphatidyl inositol-anchored protein, specifically controls highly anisotropic expansion through its involvement in cellulose microfibril orientation. Plant Cell 7: 1749–1763.
Rozen S, Skaletsky H. 2000. Primer3 on the WWW for general users and for biologist programmers. In: Krawetz S, Misener S, eds. Bioinformatics methods and protocols: methods in molecular biology. Totowa, NJ, USA: Humana Press, 365–386.
Saeed AI, Sharov V, White J, Li J, Liang W, Bhagabati N, Braisted J, Klapa M, Currier T, Thiagarajan M et al. 2003. TM4: a free, open-source system for microarray data management and analysis. Biotechniques 34: 374–378.
Savard L, Li P, Strauss SH, Chase MW, Michaud M, Bousquet J. 1994. Chloroplast and nuclear gene sequences indicate late Pennsylvanian time for the last common ancestor of extant seed plants. Proceedings of the National Academy of Sciences, USA 91: 5163–5167.
Schmid M, Davison TS, Henz SR, Pape UJ, Demar M, Vingron M, Schölkopf B, Weigel D, Lohmann JU. 2005. A gene expression map of Arabidopsis thaliana development. Nature Genetics 37: 501–506.
Stasolla C, Belmonte MF, van Zyl L, Craig DL, Liu W, Yeung EC, Sederoff R. 2004. The effect of reduced glutathione on morphology and gene expression of white spruce (Picea glauca) somatic embryos. Journal of Experimental Botany 55: 695–709.
Stasolla C, van Zyl L, Egertsdotter U, Craig D, Liu W, Sederoff R. 2003. The effects of polyethylene glycol (PEG) on gene expression of developing white spruce somatic embryos. Plant Physiology 131: 1–12.
Suzuki S, Li L, Sun YH, Chiang VL. 2006. The cellulose synthase gene superfamily and biochemical functions of xylem-specific cellulose synthase-like genes in Populus trichocarpa. Plant Physiology 142: 1233–1245.
Thompson JD, Higgins DG, Gibson TJ. 1994. CLUSTALW: improving the sensitivity of progressive multiple sequence alignment through sequence weighting, positions-specific gap penalties and weight matrix choice. Nucleic Acids Research 22: 4673–4680.
Xue B, Charest PJ, Devantier Y, Rutledge RG. 2003. Characterization of a MYBR2R3 gene from black spruce (Picea mariana) that shares functional conservation with maize C1. Mol Genet Genomics 270: 78–86.
Yang SH, van Zyl L, No EG, Loopstra CA. 2004. Microarray analysis of genes preferentially expressed in differentiating xylem of loblolly pine (Pinus taeda). Plant Science 166: 1185–1195.
Yang YH, Dudoit S, Luu P, Lin DM, Peng V, Ngai J, Speed TP. 2002. Normalization for cDNA microarray data: a robust composite method addressing single and multiple slide systematic variation. Nucleic Acids Research 30: e15.
Zhao C, Craig JC, Petzold HE, Dickerman AW, Beers EP. 2005. The xylem and phloem transcriptomes from secondary tissues of the Arabidopsis root-hypocotyl. Plant Physiology 138: 803–818.
van Zyl L, von Arnold S, Bozhkov P, Chen Y, Egertsdotter U, MacKay J, Sederoff R, Shen J, Zelena L, Clapham D. 2002. Heterologous array analysis in Pinaceae: Hybridization of high density arrays of Pinus taeda cDNA with cDNA from needles and embryogenic cultures of P. taeda, P. sylvestris or Picea abies. Function Comparative Genomics 3: 306–318.
Supporting Information
Additional supporting information may be found in theonline version of this article.

New Phytologist (2008) 180: 766–786 www.newphytologist.org © The Authors (2008). Journal compilation © New Phytologist (2008)
Research786
Fig. S1 Box-plot displaying the log ratio for the 10 replicatesafter within-slide normalization.
Fig. S2 Plot of the normalized M values for the five biologicalreplicates.
Fig. S3 Expression graphs of the Arabidopsis genes belong-ing to each of the four clusters derived from the hierarchicalclustering analysis.
Table S1 Oligonucleotides used for transcript quantification
Table S2 Analysis of re-sequenced unigenes
Table S3 Between-slide correlation of M after normalizationfor each of the 45 pairs of slides. NX1 and XN1 designate dyeswap hybridization prepared with sample 1. The five biologi-cal replicates are numbered from 1 to 5. Correlations betweenthe technical replicates are in bold
Table S4 Differentially expressed (DE) sequences betweenneedles and xylem: sequence identifiers, annotation andmicroarray data
Table S5 Differentially expressed (DE) sequences betweenphloem and xylem: sequence identifiers, annotation andmicroarray data
Table S6 Annotation of the 229 Arabidopsis sequencesmatching the spruce xylem sequences; expression data for theseArabidopsis genes according to the AtGenExpress database
Please note: Wiley-Blackwell are not responsible for thecontent or functionality of any supporting information suppliedby the authors. Any queries (other than about missingmaterial) should be directed to the New Phytologist CentralOffice.
About New Phytologist
• New Phytologist is owned by a non-profit-making charitable trust dedicated to the promotion of plant science, facilitating projectsfrom symposia to open access for our Tansley reviews. Complete information is available at www.newphytologist.org.
• Regular papers, Letters, Research reviews, Rapid reports and both Modelling/Theory and Methods papers are encouraged.We are committed to rapid processing, from online submission through to publication ‘as-ready’ via Early View – our averagesubmission to decision time is just 29 days. Online-only colour is free, and essential print colour costs will be met if necessary.We also provide 25 offprints as well as a PDF for each article.
• For online summaries and ToC alerts, go to the website and click on ‘Journal online’. You can take out a personal subscription tothe journal for a fraction of the institutional price. Rates start at £135 in Europe/$251 in the USA & Canada for the online edition(click on ‘Subscribe’ at the website).
• If you have any questions, do get in touch with Central Office ([email protected]; tel +44 1524 594691) or, for a localcontact in North America, the US Office ([email protected]; tel +1 865 576 5261).