Metal Complexation and Isosteric Modifications in Drug Designs
Upload
khangminh22Category
view
3download
0
HAL Id: tel-02434726https://tel.archives-ouvertes.fr/tel-02434726
Submitted on 10 Jan 2020
HAL is a multi-disciplinary open accessarchive for the deposit and dissemination of sci-entific research documents, whether they are pub-lished or not. The documents may come fromteaching and research institutions in France orabroad, or from public or private research centers.
L’archive ouverte pluridisciplinaire HAL, estdestinée au dépôt et à la diffusion de documentsscientifiques de niveau recherche, publiés ou non,émanant des établissements d’enseignement et derecherche français ou étrangers, des laboratoirespublics ou privés.
Complexation of actinides and analogues withhydroxamate ligands
Mingjian He
To cite this version:Mingjian He. Complexation of actinides and analogues with hydroxamate ligands. Radiochemistry.Université Paris-Saclay, 2019. English. �NNT : 2019SACLS413�. �tel-02434726�

Complexation d'actinides et d'analogues par des ligands
hydroxamates
Thèse de doctorat de l'Université Paris-Saclay préparée à l’Université Paris-Sud
au sein de l’Institut de Physique Nucléaire d’Orsay
École doctorale n°576 Particules Hadrons Energie et Noyau : Instrumentation, Image, Cosmos et Simulation (PHENIICS)
Spécialité de doctorat : Aval du cycle nucléaire, radioprotection et radiochimie
Thèse présentée et soutenue à Orsay, le 14 novembre 2019, par
Mingjian HE Composition du Jury : Pedro DE OLIVEIRA Professeur, Université Paris Sud (LCP) Président
Christophe DEN AUWER Professeur, Université Nice Sophia Antipolis (ICN) Rapporteur
Philippe MOISY Directeur de Recherche CEA, CEA (Marcoule) Rapporteur
Julie CHAMPION Enseignant chercheur, SUBATECH, IMT Atlantique Examinatrice
Claire LE NAOUR Chargée de recherche, CNRS-IN2P3 (IPNO) Directrice de thèse
NN
T :
20
19
SA
CLS
413


Acknowledgement
First and foremost, I would like to express my deepest gratitude and appreciation to my super-
visor Dr. Claire LE NAOUR. I am very grateful that she accepted me to be her student three
years ago. There is no doubt that she is the best supervisor I have ever met. I am very happy
and lucky to obtain this opportunity to work with her for the unforgettable three years. Without
her help and support, I can never finish this PhD thesis. Her intelligence and attitude to science
and research will enlighten and guide my future career forever.
I would like to thank Dr. Vladimir SLADKOV for his helpful guidance. Although I just worked
with him for one year, I have still learnt a lot of things from him.
I would like to thank Dr. Melody MALOUBIER and Dr. Jérôme ROQUES for their help in this
work. I am very grateful that they helped me a lot to perform the EXAFS data adjustments and
the theoretical calculations. Especially I am very thankful to Dr. Melody MALOUBIER who
provided me with many valuable suggestions about dissertation writing and thesis presentation.
I would like to thank all the jury members of my defense, Prof. Pedro DE OLIVEIRA, Prof.
Christophe DEN AUWER, Prof. Philippe MOISY and Dr. Julie CHAMPION. I am very grate-
ful that they took much time to review my thesis very carefully and gave me many suggestions
to improve my dissertation.
I would like to thank all the members in Group PACS and Radiochimie. I am very grateful to
enjoy a happy life with them. I would also like to thank all my friends for their concern and
help at the hardest time in France. Moreover, I would like to thank and welcome Yang PEI and
Meng LUO to join radiochemistry. There is nothing more enjoyable to me than knowing some-
one continue our work in radiochemistry.
Last but not least, I would like to thank China Scholarship Council which financially supported
my life and work at IPNO in Paris-Saclay University. In addition, I would also like to thank
Harbin Engineering University for providing me with a faculty position in China.


Contents
List of Abbreviations ............................................................................................... 1
List of Figures ............................................................................................................. 2
List of Tables .............................................................................................................. 7
I. Introduction .................................................................................................... 9
II. Bibliographic Study ................................................................................... 12
II.1 Actinides ........................................................................................................................... 12
II.1.1. General points ................................................................................................................ 12
II.1.2. Actinides in solution ...................................................................................................... 16
II.1.3. Actinides in the environment ......................................................................................... 25
II.2 Hydroxamate siderophores ............................................................................................ 28
II.3 Interaction between actinides and hydroxamates ........................................................ 33
II.3.1 Interaction of actinides with monohydroxamates ........................................................... 33
II.3.2 Interaction of actinides with DFB................................................................................... 34
II.4 Summary .......................................................................................................................... 36
III. Methodology ................................................................................................. 37
III.1 Techniques for thermodynamic study ......................................................................... 38
III.1.1 Liquid-liquid extraction ................................................................................................. 38
III.1.2 Ultraviolet-visible absorption spectroscopy .................................................................. 41
III.1.3 Affinity capillary electrophoresis .................................................................................. 43
III.2 Techniques for structural study ................................................................................... 46
III.2.1 Attenuated total reflectance Fourier-transform infrared spectroscopy.......................... 46
III.2.2 X-ray absorption spectroscopy ...................................................................................... 48

III.3 Stock solution preparations of tetravalent actinides .................................................. 51
III.3.1 Preparation of 227Th(IV) stock solution ........................................................................ 51
III.3.2 Preparation of U(IV) stock solution .............................................................................. 53
III.4 Summary ........................................................................................................................ 54
IV. Results and Discussion ............................................................................. 55
IV.1 Trivalent lanthanides ..................................................................................................... 55
Thermodynamic study with trivalent lanthanides .............................................................. 55
IV.1.1 Complexation of Eu(III) with DFB studied by liquid-liquid extraction ....................... 55
IV.1.2 Complexation of Ln(III) with DFB studied by UV-visible spectrophotometry ........... 62
IV.1.3 Complexation of Ln(III) with DFB studied by affinity capillary electrophoresis ........ 67
Structural study with trivalent lanthanides ......................................................................... 71
IV.1.4 Structural study of the complexation of Eu(III) with DFB by ATR-FTIR ................... 71
IV.2 Tetravalent actinides ..................................................................................................... 76
Thermodynamic study with tetravalent actinides ............................................................... 76
IV.2.1 Complexation of Th(IV) with DFB studied by liquid-liquid extraction ....................... 76
IV.2.2 Complexation of U(IV) with BHA, AHA and DFB studied by UV-visible absorption
spectrophotometry ........................................................................................................ 85
Structural study with tetravalent actinides ......................................................................... 90
IV.2.3 Structural study of the complexation of Th(IV) with DFB by ATR-FTIR ................... 90
IV.2.4 Structural study of the complexation of An(IV) with DFB by theoretical calculations and
EXAFS ......................................................................................................................... 93
IV.3 Summary ....................................................................................................................... 104
V. Conclusion ................................................................................................... 106
Appendix ................................................................................................................. 109

Appendix A: Preparation of solutions ................................................................................ 109
Appendix B: Influence of γ-ray energy for counting ........................................................ 111
Appendix C: Determination of proton concentration ....................................................... 112
Appendix D: Back and direct extraction of Th(IV) .......................................................... 113
Appendix E: Study of DFB Stability .................................................................................. 115
Reference ................................................................................................................ 118

1
List of Abbreviations
AHA Acetohydroxamic acid
BHA Benzohydroxamic acid
DFB Desferrioxamine B
DFE Desferrioxamine E
DTPA Diethylenetriaminepentaacetic acid
EDTA Ethylenediaminetetraacetic acid
TTA Thenoyltrifluoroacetone
LLE Liquid-liquid extraction
SP / sp. UV-visible Absorption Spectroscopy
ATR-FTIR Attenuated Total Reflection – Fourier Transform Infrared spectroscopy
DFT Density Functional Theory
EXAFS Extended X-ray Absorption Fine Structure
ICP-MS Inductively Coupled Plasma Mass Spectrometry
XRD X-ray Diffraction
XANES X-ray Absorption Near Edge Structure
XAS X-ray Absorption Spectroscopy
PCA Principal Component Analysis
HSAB Hard Soft Acid Base Principle
ACE Affinity Capillary Electrophoresis
IR Infrared
em. Electromigration
pot. Potentiometry
M Metal
L Ligand

2
List of Figures
Figure I.1 Behavior of actinides in the environment [2018DEN]. ........................................... 10
Figure II.1 Periodic table of the elements [2019IUP]. ............................................................. 12
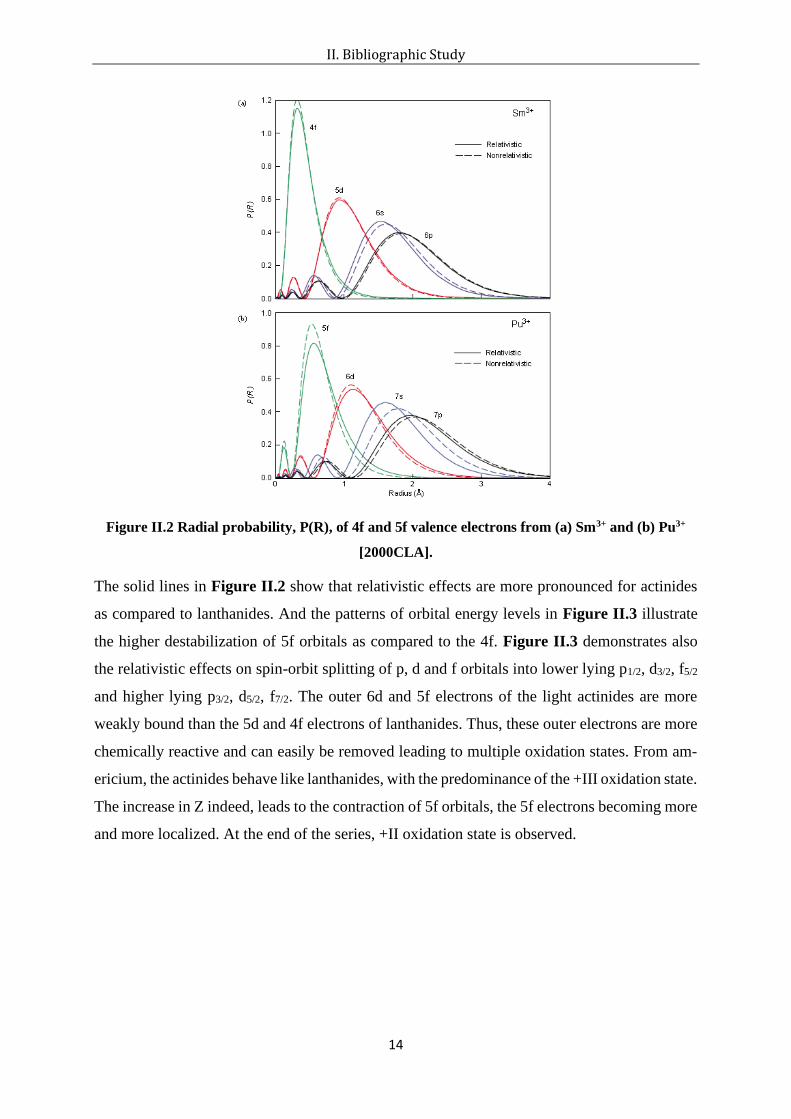
Figure II.2 Radial probability, P(R), of 4f and 5f valence electrons from (a) Sm3+ and (b) Pu3+
[2000CLA]. .................................................................................................................. 14
Figure II.3 Configuration orbital energies (in atomic units) of the lanthanides Sm, Eu, Gd, Tb
and the actinides Pu, Am, Cm, Bk (Quantum chemistry calculations based on Dirac-
Fock equations) [1978PYY]. ........................................................................................ 15
Figure II.4 Potential-pH diagram of uranium at 25 °C (Utot 10-10 M) using database from
OECD/NEA [2005TAK]. ............................................................................................. 17
Figure II.5 Latimer’s diagram of Pu in 1 M HClO4 [1970CLE]. ............................................. 18
Figure II.6 Possible molecular geometries for the plutonium aquo ions (a) with eight water
molecules for Pu(III) and Pu(IV) in three geometric arrangements; (b) Pu(III, IV) with
nine water molecules; (c) Pu(V) and Pu(VI), actinyl ions with five water molecules in
the equatorial plane and (d) Pu(VII) [2000CLA]. ........................................................ 19
Figure II.7 (a) The color of non-complexed plutonium at various oxidation states in 1 M
HClO4 from Pu(III) to Pu(VI) and in strong base for Pu(VII) (b) their corresponding
absorption spectra [2000CLA]. .................................................................................... 20
Figure II.8 Hydrolysis speciation diagram of mononuclear Th(IV), Cf(III) and Pu(IV) without
considering colloid or polymer species. ....................................................................... 22
Figure II.9 Common oxidation states of actinides in the environment under different
conditions. States mentioned in bracket (−) are unstable; and with a question mark (?)
were not confirmed. The oxidation states bolded correspond to the predominant states
[2013MAH]. ................................................................................................................. 26
Figure II.10 General structure of hydroxamate functional group. ........................................... 28
Figure II.11 Desferrioxamine B. .............................................................................................. 28
Figure II.12 Speciation diagram of desferrioxamine B (I = 0.7 M Na, HClO4, T = 25 °C). ... 30
Figure II.13 Benzohydroxamic acid (BHA) (left) and acetohydroxamic acid (AHA) (right). 30

3
Figure II.14 Speciation diagrams of benzohydroxamic acid (left) in 0.1 M NaClO4 at 25°C
and acetohydroxamic acid (right) in 1.0 M NaCl at 25°C. .......................................... 31
Figure II.15 Speciation diagram of Eu(III)-DFB (CEu(III) = CDFB = 2.5×10⁻² M ) plotted by
using the literature data [2011CHR]. ........................................................................... 36
Figure II.16 Speciation diagram of Th(IV)-DFB (CTh(IV) = CDFB = 2.5×10⁻² M ) plotted by
using the literature data [1996WHI]. ............................................................................ 36
Figure III.1 Schematic diagram of UV-visible spectrophotometer. ......................................... 42
Figure III.2 Schematic of electroosmotic flow. ........................................................................ 43
Figure III.3 Schematic process of affinity capillary electrophoresis........................................ 44
Figure III.4 Types of stretching and bending. .......................................................................... 46
Figure III.5 Principle of EXAFS. ............................................................................................. 49
Figure III.6 Percentage of 227Th and 231Pa in each fraction (upper) and the gamma spectra of
largest fraction of 227Th and 231Pa (lower).................................................................... 52
Figure III.7 α liquid scintillation spectrum of an aliquot of the mother solution of U(IV). ..... 53
Figure IV.1 Variations of 152Eu extracted as function of pCH (CTTA = 2.5×10⁻² M in toluene I =
0.7 M (Na, HClO4), T = 25°C). .................................................................................... 55
Figure IV.2 Variations of D as function of TTA concentration (CAcetate = 5×10⁻³ M, I = 0.7 M
(Na, HClO4), T = 25 °C, pCH = 4.75)........................................................................... 55
Figure IV.3 Variations of D as function of DFB concentration at different pCH (CTTA =
2.5×10⁻² M, I = 0.7 M (Na, HClO4), T = 25 °C, CAcetate = 5×10⁻³ M). ......................... 56
Figure IV.4 Variations of D0/D-1 as function of DFB concentration (CAcetate = 5×10⁻³ M, I =
0.7 M (Na, HClO4), T = 25°C, pCH = 4.75). ................................................................ 56
Figure IV.5 Variations of logK'cond as function of pCH. ........................................................... 60
Figure IV.6 Absorption spectra of Eu(III) at different concentrations (pH = 4.0 and I = 0.5 M
(Na, HClO4)). ............................................................................................................... 62
Figure IV.7 Absorption spectra of Pr(III) at different concentrations (pH = 4.0 and I = 0.5 M
(Na, HClO4)). ............................................................................................................... 62
Figure IV.8 Test of Lambert-Beer Law of Eu(III) at the concentration ranging from 10-3 to
4×10⁻² M at pH = 4.0 and I = 0.5 M (Na, HClO4) at the wavelength of 394 nm. ........ 63

4
Figure IV.9 Test of Lambert-Beer Law of Pr(III) at the concentration ranging from 6×10⁻⁴ M
to 6×10⁻³ M at pH = 4.0 and I = 0.5 M (H, NaClO4) at the wavelength of 444 nm. .... 63
Figure IV.10 Absorption spectra of Eu(III) at 10-2 M with increasing amount of DFB at pH =
3.7 (left) and 4.5 (right) (I = 0.5 M, 0 ≤ CDFB ≤ 5.6×10⁻² M). ................................... 63
Figure IV.11 Absorption spectra of Pr(III) at 6×10⁻³ M with increasing amount of DFB at pH
= 4.6 (left) and 5.5 (right) (I = 0.5 M 0 ≤ CDFB ≤ 5.6×10⁻² M). ................................... 64
Figure IV.12 Molar absorbance of Eu3+, EuH3DFB3+ and EuH2DFB2+. .................................. 66
Figure IV.13 Molar absorbance of Pr3+, PrH3DFB3+ and PrH2DFB2+. .................................... 66
Figure IV.14 Mobility of 1×10⁻⁴ M DFB as function of La(III) (black points) and Lu(III) (red
points) at I = 0.1 M (left) and 0.5 M (right) pH = 2.5, T = 25 °C. ............................... 67
Figure IV.15 IR spectrum of protonated desferrioxamine mesylate at pH=3.1. ...................... 71
Figure IV.16 Main functional groups of protonated DFB. ...................................................... 71
Figure IV.17 IR spectra of solutions containing either the mesylate form of DFB (5×10⁻² M)
at pH = 5.5 or methanesulfonate (5×10⁻² M) at pH = 4.0 [2009BOR]. ........................ 72
Figure IV.18 IR spectra of the dried DFB solution at 2.5×10⁻² M in absence of Eu(III) at pH
from 3.1 to 8.9. ............................................................................................................. 73
Figure IV.19 FTIR spectra of air-dried Eu(III)-DFB complexes as a function of pH (from 3.1
to 9.4). CEu(III) = CDFB = 2.5×10⁻² M at room temperature. ........................................... 74
Figure IV.20 Variations of the percentage of extraction of 227Th as function of pCH (CTTA =
0.08 M in toluene, I = 0.7 M (Na, HClO4), T = 25 °C). ............................................... 76
Figure IV.21 Variations of the distribution ratio D of 227Th as function of total TTA
concentration in toluene (I = 0.7 M (Na, HClO4), pCH = 1.0, T = 25 °C). .................. 76
Figure IV.22 Variations of D as a function of DFB concentration at different pCH (CTTA =
0.08 M, I = 0.7 M (Na, HClO4), T = 25 °C). ................................................................ 79
Figure IV.23 Variations of D0/D-1 as function of DFB concentration (I = 0.7 M (Na, HClO4),
T = 25 °C, pCH = 1.5) and associated linear fitting. ..................................................... 79
Figure IV.24 Variation of K’cond as function of proton concentration. .................................... 82
Figure IV.25 UV-visible absorption spectra of U(IV) at 4.8×10⁻³ M with increasing amount of
BHA from 0 to 5×10⁻² M in 0.5 M HCl at 25 °C. ........................................................ 85

5
Figure IV.26 UV-visible absorption spectra of U(IV) at 9.6×10⁻³ M with increasing amount of
AHA from 0 to 0.8 M in 0.5 M HCl at 25 °C. ............................................................. 85
Figure IV.27 Correlation of stability constants of Pu(IV), Th(IV) and U(IV) with BHA (left)
and AHA (right). .......................................................................................................... 87
Figure IV.28 Molar absorbance of U4+ and UBHA3+. ............................................................. 88
Figure IV.29 Molar absorbance of U4+, UAHA3+ and U(AHA)22+. ......................................... 88
Figure IV.30 Absorption spectra of U(IV) at 9.6×10⁻³ M with different ratio U:DFB at CHCl =
0.5 M in 0.5 M HCl. ..................................................................................................... 89
Figure IV.31 Variation of U(IV) absorption spectra as a function of pCH (pCH from 1.35 to
0.54, CU = 9.6×10⁻³ M, CDFB = 1.1×10⁻² M). ................................................................ 89
Figure IV.32 FTIR spectra of the air-dried Th(IV)-DFB complexes as a function of pH (from
1.3 to 9.1) CTh(IV) = CDFB = 2.5×10⁻² M at room temperature. ...................................... 90
Figure IV.33 Optimized structure of ligand DFB. ................................................................... 94
Figure IV.34 Optimized structures of ligand DFB with different deprotonation. .................... 94
Figure IV.35 Optimized structures of Th with one hydroxamate group at coordination number
= 8 (left) and 9 (right). .................................................................................................. 95
Figure IV.36 Optimized structures of the complex of Th with one hydroxamate group at Site 1
(first figure), Site 2 (second figure) and Site 3 (third figure). ...................................... 96
Figure IV.37 Optimized structure of Th(H2DFB) complex obtained by DFT calculation. ..... 98
Figure IV.38 Optimized structure of Th(HDFB) complex (three bidendate hydroxamates)
obtained by DFT calculations. ..................................................................................... 99
Figure IV.39 Optimized structure of Th(HDFB) complex (one bidentate and two monodentate
hydroxamates) obtained by DFT calculations. ........................................................... 100
Figure IV.40 k3-weighted EXAFS spectra and their corresponding Fourier transform at the Th
LIII edge of a solution of Th-DFB at pH = 5. Experimental spectrum (circles) and
adjustment (red line). .................................................................................................. 102
Figure IV.41 k3-weighted EXAFS spectra and their corresponding Fourier transform at the U
LIII edge of a solution of U(IV)-DFB at pH = 5. Experimental spectrum (circles) and
adjustment (red line). .................................................................................................. 103
6
Figure V.1 Structure of the complex Th(HDFB). .................................................................. 108
Figure A. 1 Distribution values (D0) of 152Eu at pCH = 4.0 and 4.2 as function of energy (γ-ray
characteristic peak of 152Eu). ...................................................................................... 111
Figure A. 2 Variation of D as function of contacting time. ................................................... 113
Figure A. 3 Experimental procedure of back and direct extraction of Th(IV) ....................... 114
Figure A. 4 Values of D in the back and direct extraction of Th(IV) at pCH = 1, I = 0.7 M (Na,
HClO4) without DFB (left) and at pCH = 2, I = 0.7 M (Na, HClO4) with 0.07 M DFB
(right). ......................................................................................................................... 114
Figure A. 5 Absorption spectra of DFB at different concentrations (pH = 4.0 and I = 0.5 M
(Na, HClO4)). ............................................................................................................. 115
Figure A. 6 Test of Lambert-Beer Law of DFB at the concentration ranging from 10-5 to 5×10-
6 M at pH = 4.0 and I = 0.5 M (Na, HClO4) at the wavelength of 200, 210 and 220 nm.
.................................................................................................................................... 115
Figure A. 7 Variation of UV absorbance of 1×10⁻⁵ M DFB solution at 200 nm as function of
time. ............................................................................................................................ 116

7
List of Tables
Table II.1 Electron ground-state configurations of lanthanides and actinides [2000CLA]. .... 13
Table II.2 Oxidation states of actinides in aqueous solution (the most common ones are
denoted in bold). ........................................................................................................... 16
Table II.3 Hydrolysis constants of Th(IV), U(IV), Pu(IV), Cf(IV) and Eu(III) at 25 °C. ....... 22
Table II.4 Classification of Bases [1997PEA]. ........................................................................ 23
Table II.5 Dissociation constants of H4DFB+ at 25 °C. ........................................................... 29
Table II.6 Dissociation Constants of Benzohydroxamic Acid (BHA). .................................... 31
Table II.7 Dissociation Constants of Acetohydroxamic Acid (AHA). .................................... 32
Table II.8 Stability constants of Th(IV), U(IV) and Pu(IV) with BHA. .................................. 33
Table II.9 Stability constants of Eu(III), Th(IV) and Pu(IV) with DFB. ................................. 34
Table III.1 Applied techniques and studied systems in this work. ........................................... 37
Table III.2 ATR-FTIR samples description. ............................................................................ 47
Table III.3 Description of EXAFS samples. ............................................................................ 49
Table III.4 Applied techniques and experimental conditions of each system in this work. ..... 54
Table IV.1 Conditional stability constants Kcond (Equation IV.3) between Eu(III) and DFB at
different pCH. ................................................................................................................ 57
Table IV.2 Corrected conditional stability constants logK'cond (Equation IV.12) between Eu3+
and DFB at different pCH and comparison with logKcond (Equation IV.3). ................. 59
Table IV.3 Obtained and published stability constants of Eu(H3DFB)3+ and Eu(H2DFB)2+. .. 61
Table IV.4 Obtained and published stability constants of Ln(H3DFB)3+ and Ln(H2DFB)2+ for
Eu(III) and Pr(III). ........................................................................................................ 65
Table IV.5 Obtained and published stability constants of Ln(H3DFB)3+ for La(III) and Lu(III).
...................................................................................................................................... 69
Table IV.6 Frequencies and assignments of the major bands in the IR spectra of H4DFB+ at
pH = 3 and Eu-DFB complex at pH = 9.1. ................................................................... 75
Table IV.7 Estimated values of HTTA and TTA- concentration and ThTTA3+ percentage. ... 78
8
Table IV.8 Conditional stability constants Kcond relative to the formation of Th-DFB at
different pCH. ................................................................................................................ 80
Table IV.9 Obtained conditional stability constants K'cond (Equation IV.47) between Th4+ and
DFB at different pCH and comparison with Kcond (Equation IV.44). ........................... 81
Table IV.10 Obtained and published apparent stability constants of Th(H3DFB)4+ and
Th(H2DFB)3+. ............................................................................................................... 83
Table IV.11 Stability constants β110 of AnIVL3+ (EquationIV.63) and β120 of AnIV(L)22+
(Equation IV.65). .......................................................................................................... 86
Table IV.12 Frequencies and assignments of the major bands in the IR spectra of H4DFB+ at
pH = 3 and Th-DFB complex at pH = 9.1 Comparison with Eu-DFB complex at pH =
9.4. ................................................................................................................................ 92
Table IV.13 Geometrical parameters associated with Figure IV.36 obtained by DFT
calculations. .................................................................................................................. 97
Table IV.14 Geometrical parameters associated with Figure IV.37 obtained by DFT
calculations. .................................................................................................................. 98
Table IV.15 Geometrical parameters associated with Figure IV.38 obtained by DFT
calculations. .................................................................................................................. 99
Table IV.16 Geometrical parameters associated with Figure IV.39 obtained by DFT
calculations. ................................................................................................................ 100
Table IV.17 EXAFS best fit parameters for the Th(IV) and U(IV)-DFB solutions at pH = 5.
s02 is the EXAFS global amplitude factor and is fixed to 1; ε is the average noise, Δχ2
is the quality factor and Rf(%) is the agreement factor of the fit. .............................. 102
Table IV.18 Formation constants obtained in this work and available in the literatures. ...... 104
Table V.1 Obtained formation constants between trivalent lanthanides and DFB ................ 107
Table A. 1 UV absorbance of 2×10⁻⁵ M DFB solution (pCH = 0.7) at 200, 210 and 220 nm as
function of time. ......................................................................................................... 117

I. Introduction
9
I. Introduction
The use of actinides for civilian as well as military purposes has led –and still leads- to their
environmental release. Atmospheric nuclear tests from 1945 to 1980 are the main source of
contamination of the terrestrial and marine environment. It is estimated that about 3.1 PBq of
241Am, 40 PBq of 237Np, 13 PBq of 239,240Pu and 170 PBq of 241Pu have been deposited on Earth
[1980PER] [1998BEA]. The contamination from underground nuclear tests is more localized
with actinides incorporated in rocks. But plutonium has been detected in groundwater at 1.3 km
from the Nevada Test Site where 826 tests were conducted between 1956 and 1992 [1999KER].
Accidental releases, such as the two B52 plane crashes in Palomares in 1966 (Spain) and Thule
in 1968 (Greenland), have also contaminated the environment locally. In the context of nuclear
energy production, all facilities related to the fuel cycle are likely to face to actinides release in
the geosphere and the biosphere, both in normal operation and in the event of an accident. The
processing of ore in uranium mines has led to an accumulation of U daughters in mine tailings
and pit waters. The fire in a reactor at Winscale in 1957, an explosion of a tank containing
radwaste at Kyshtym also in 1957, the explosion and fire of a reactor at Chernobyl in 1986, the
cores meltdown at Fukushima in 2011, have also led to actinides spreading but much less than
the nuclear weapons testing [1996AIH] [2004LAN] [2010HU] [2015GRA] [2018DEN]. In ad-
dition, some naturally occurring actinides with lifetimes comparable to the age of the earth are
also present in the environment: 232Th, 235U and 238U are the main primordial radionuclides. By
radioactive decay, they produce other actinide isotopes like 234U, 231Pa, 230Th.
Actinides from either natural or anthropogenic sources are of environmental and health con-
cerns due to their high toxicity, long half-life and the exposure risk of internal contamination
(accumulation in drinking water or in food). Modeling the behavior of actinides under environ-
mental conditions is therefore essential, but extremely challenging, because of the complexity
of the chemistry of actinides on one hand, and the complexity of the environmental medium on
the other hand:
- The light actinides ions exist in various oxidation states that exhibit their own reactiv-
ity. For example, Pu(IV) is rather insoluble (in the absence of strong complexing agent) whereas
Pu(V) is mobile.
- The environmental systems cover surface waters, groundwaters, rocks, clays… with
very diverse composition (inorganic and organic ligands, microbes, colloids…).

I. Introduction
10
The chemical interactions of actinides in the environment are summarized in Figure I.1. De-
pending on the pH, the redox potential, the presence of particulates or colloids, the presence of
ligands, the actinide ion can undergo a great variety of reactions: sorption, complexation, pre-
cipitation, colloid formation…[2010RUN] [2018DEN].
Figure I.1 Behavior of actinides in the environment [2018DEN].
The present work is limited to the study of one type of interaction: the complexation with a
naturally occurring organic ligand that belongs to the class of siderophores. Siderophores
(Greek: "iron carrier") are small, high-affinity iron-chelating compounds secreted by microor-
ganisms such as bacteria and fungi allowing iron to be transported into the cell [1995NEI].
Since Pu4+ and Fe3+ have similar charge/radius ratio, Pu4+ and other tetravalent actinides are
expected to form also strong complexes with siderophores, especially with desferrioxamine B
(DFB) [1992BRA]. This ligand possesses three hydroxamate groups (RC(O)N(OH)R') and can
therefore acts as a hexadentate ligand (which matches with Fe(III) maximum coordination).
Some data relative to the complexation of actinides (IV) with DFB are available in the literature.
Formation constants have been proposed by Boukhalfa et al. for Th(IV) [2007BOU] and by
Whisenhunt et al. for Pu(IV) [1996WHI]. Additionally, the structure of the complexation of
Pu(IV) with desferrioxamine E (similar to DFB) has been characterized by using X-ray dif-
fraction [2000NEU]. A dimer Pu(IV)-DFB has also been recently observed [2014BOG].
The aim of the present work is to develop suitable experimental protocols to collect fundamental
data on the complexation between actinides at the oxidation states +III and +IV with desferri-
oxamine B. For that purpose, trivalent actinides have been simulated by lanthanides and Pu(IV)

I. Introduction
11
by Th(IV) and U(IV). The study was conducting according to a twofold approach: thermody-
namic and structural. The thermodynamic study involved different concentrations of metal ions.
Liquid-liquid extraction experiments combined with γ-spectrometry were carried out with eu-
ropium and thorium at ultra-trace scale using the radionuclides 152Eu and 227Th. The complex-
ation of stable lanthanides in macroconcentration and of U(IV) was studied using affinity ca-
pillary electrophoresis and/or UV-Vis absorption spectrophotometry. Infrared and X-ray ab-
sorption spectroscopies combined with quantum chemistry calculations were the techniques
used for the structural study of Eu/Th/U-DFB complexes.
The present PhD thesis is divided in five chapters. The present (first) one is a general introduc-
tion in order to explain the context and the aim of the work. The second chapter is a biblio-
graphic study devoted to the chemical properties of actinides and of hydroxamate ligands. In
the third chapter, the methodology and the techniques used are described. The results and dis-
cussion on the complexation of lanthanides, Th(IV) and U(IV) with some hydroxamates are
presented in Chapter IV. Finally, Chapter V presents a general conclusion.

II. Bibliographic Study
12
II. Bibliographic Study
II.1 Actinides
II.1.1. General points
Actinides commonly refer to 15 elements from actinium (Z = 89) to lawrencium (Z = 103) as
shown in the periodic table presented in Figure II.1. However, the placement of Ac (and La)
and even Lr (and Lu) has been controversial for many years [1982JEN] [2008LAV]. The ele-
ments Ac and La are often placed in d-block below Y in group 3. In the following, actinium is
considered as the first member of the actinide series, similarly to lanthanum in the lanthanide
series [2010KIR].
Figure II.1 Periodic table of the elements [2019IUP].
The actinides correspond to the filling of the 5f electron shell as suggested by G.T. Seaborg in
1945 [1945SEA]. Their electron configuration is [Rn]5fn6dm7s2, similarly to lanthanides con-
figuration [Xe]4fn5dm6s2 [2000CLA] [2011EDE]. The ground–state electron configurations of
lanthanide and actinide atoms are reported in Table II.1. One could notice that the filling of 5f
shell is less homogeneous than the 4f and a special stability of Cm and Gd is observed due to
the half-filled 5f and 4f shells respectively. According to the electron configurations listed in
Table II.1, the 6d orbitals of the actinides appear energetically more accessible than the 5d
orbitals of the lanthanides.

II. Bibliographic Study
13
Table II.1 Electron ground-state configurations of lanthanides and actinides [2000CLA].
Moreover, 4f and 5f orbitals display a relatively small radial extension. They are shielded from
interactions with ligands by the 5s2, 5p6 and 6s2, 6p6 filled shells for lanthanides and actinides,
respectively. This means that the interaction of nf electrons with the electrons from ligands is
relatively weak. But the light actinides, from Pa to Am exhibit a more complex behavior since
5f orbitals are more spatially extended whereas 4f orbitals are localized. In addition, the 5f, 6d
and 7s orbitals are much closer in energy than the corresponding 4f, 5d and 6s. This is illustrated
by the variations of the radial probability of valence electrons (dotted lines) as function of the
distance nucleus-electron in Figure II.2. The overlap of valence orbitals is less significant in
the case of Sm3+ as compared to Pu3+. The multiplicity of oxidation states of the light actinides
(U, Np, Pu, Am) originates from this feature whereas lanthanide exhibit mainly the trivalent
oxidation state.
The electronic structures of lanthanides and especially actinides are also impacted by relativistic
effects [1988PYY] [1994BAL]. The increase in Z brings with it an increase in the electric field
produced by the bigger number of protons which leads to the increase of the speed of inner
electrons that approaches the speed of light. The general idea is that the relativistic increase in
the mass of the inner electrons leads to the contraction of s and p shells and to their energetic
stabilization. This contraction, in turn, allowing a strong screening of the d and f orbitals from
the nucleus charge, leads to relativistic expansion and destabilization of the f and d orbitals
[1988PYY] [1994BAL] [1995YAT].
2
II. Bibliographic Study
14
Figure II.2 Radial probability, P(R), of 4f and 5f valence electrons from (a) Sm3+ and (b) Pu3+
[2000CLA].
The solid lines in Figure II.2 show that relativistic effects are more pronounced for actinides
as compared to lanthanides. And the patterns of orbital energy levels in Figure II.3 illustrate
the higher destabilization of 5f orbitals as compared to the 4f. Figure II.3 demonstrates also
the relativistic effects on spin-orbit splitting of p, d and f orbitals into lower lying p1/2, d3/2, f5/2
and higher lying p3/2, d5/2, f7/2. The outer 6d and 5f electrons of the light actinides are more
weakly bound than the 5d and 4f electrons of lanthanides. Thus, these outer electrons are more
chemically reactive and can easily be removed leading to multiple oxidation states. From am-
ericium, the actinides behave like lanthanides, with the predominance of the +III oxidation state.
The increase in Z indeed, leads to the contraction of 5f orbitals, the 5f electrons becoming more
and more localized. At the end of the series, +II oxidation state is observed.

II. Bibliographic Study
15
Figure II.3 Configuration orbital energies (in atomic units) of the lanthanides Sm, Eu, Gd, Tb
and the actinides Pu, Am, Cm, Bk (Quantum chemistry calculations based on Dirac-Fock equa-
tions) [1978PYY].

II. Bibliographic Study
16
II.1.2. Actinides in solution
The speciation of actinides in solutions depends on several parameters such as the redox poten-
tial, pH, cations and anions concentrations. In this paragraph, essential properties of some acti-
nides in solution, which are necessary for a good understanding of this study, are described.
A) Oxidation states
Depending on the chemical and natural environment, the light actinides may exist in solution
under different oxidation states that are presented in Table II.2. Americium and curium will be
mainly found in the +III oxidation state. The actinides beyond Cm, except No, act as lanthanides
and exist in the +III oxidation state.
Table II.2 Oxidation states of actinides in aqueous solution (the most common ones are denoted
in bold).
Actinide Oxidation state
90Th IV
91Pa IV V
92U III IV V VI
93Np III IV V VI VII
94Pu II III IV V VI
95Am II III IV V VI
96Cm III IV
97Bk III IV
98Cf III
99Es III
100Fm II III
101Md II III
102No II III
103Lr II III
In aqueous solution, thorium has only one stable oxidation state, +IV. Uranium can be found in
+III to +VI oxidation states. The most stable is U(VI) as the linear uranyl ion, UO22+. The
stability area of U(III) lies outside of the stability limits of water: it is quickly oxidized in U(IV).
U4+ is also stable in solution if no oxidizing agents are present. The kinetics of redox transfor-
mations depends if there is a change in the chemical composition between the oxidized and

II. Bibliographic Study
17
reduced species. Thus, the reaction between UO22+ and UO2
+ and between U4+ and U3+ are fast
whereas the redox reaction between UO22+ and U4+ is slow [1959NEW] [2010CHO]. U(V) ex-
hibits a strong tendency to disproportionation and exists on a very narrow stability range that
cannot be represented in the Pourbaix diagram (Figure II.4).
Figure II.4 Potential-pH diagram of uranium at 25 °C (Utot 10-10 M) using database from
OECD/NEA [2005TAK].
Plutonium has not been used in this work because of handling difficulties (α-emitting isotopes,
complicated chemistry), but its redox properties will be briefly described. In solution, pluto-
nium might be present in the +III, +IV, +V and +VI oxidation states as Pu3+, Pu4+, PuO2+and
PuO22+ respectively. Pu(IV) is the most stable species in solution. Usually, Pu(III) and Pu(IV)
are more stable in acidic solutions whereas Pu(VI) and Pu(VII) are more stable in alkaline so-
lutions. Pu(V) will be mainly found as the main species in near-neutral solutions at low con-
centration. The complexity of plutonium chemistry is that all these oxidation states can coexist
in the same solution. In acidic media, the redox potentials relative to the couples involving the
oxidation states +III, +IV, +V and +VI are all close to 1 V as it can be shown in the Latimer’s
diagram in Figure II.5. It is a unique feature in the periodic table of elements [1970CLE]. This
ability to exist under multiple oxidation states in solution is due to the tendency of Pu(IV) and
Pu(V) to disproportionate. In acidic solution without complexing ligands, Pu(IV) dispropor-
tionate into Pu(III) and Pu(VI). The disproportionation of Pu(V) takes place in moderately
acidic solution leading to Pu(IV) and Pu(VI). Generally, those reactions involve two steps with

II. Bibliographic Study
18
different kinetics. As uranium, the reactions involving the formation or the breaking of Pu=O
bonds are slow, whereas reactions involving a simple electron exchange are fast [1959NEW].
Figure II.5 Latimer’s diagram of Pu in 1 M HClO4 [1970CLE].
B) Aqua ions
The hydration structure of actinide ions has been studied mainly by X-ray and neutron scatter-
ing, EXAFS and theoretical calculations. However, the exact number of H2O molecules Nw in
the first coordination sphere of An3+ and An4+ is still under debate: these ions are surrounded
by at least 8 water molecules. There is often a difference of 1 molecule between experimental
and theoretical values [2006SZA] [2013KNO]. An equilibrium between 8- and 9-coordinated
An3+, or between 9- and 10-coordinated An4+, may occur. For instance, the coordination number
of Cf(III) with water molecules is determined to be eight by combining EXAFS and Monte
Carlo simulation. Moreover, quantum chemistry calculations lead to too small difference in free
energy between the corresponding configurations [2010GAL].
The number of water molecules coordinated to Th4+ has been found to vary from 9 to 13
[1999MOL] [2002NEC] [2002ROT] [2007HEN] [2009TOR] [2012KNO]. The distance Th-Ow
was determined ranging from 2.45 to 2.46 Å at low pH using X-ray absorption spectroscopy.
By comparing experimental and theoretical XANES spectra calculated considering different
values of Nw and different coordination polyhedra, Chaboy et al. conclude that Th(IV), U(IV)
and Np(IV) are surrounded by 9 water molecules that form a tricapped trigonal prism like struc-
ture b in Figure II.6 [2011CHA]. This is consistent with the experimental data of Hennig et al.
(U(IV)) [2007HEN] and Antonio et al. (Np(IV)) [2001ANT], but not with Ikeda et al. who
found Nw = 10 for U(IV) [2009IKE]. The distances An(IV)-Ow were found equal to 2.41, 2.37
and 2.39 Å respectively for U, Np and Pu, the latter being surrounded by 8 or 9 water molecules
[1998CON].
At oxidation states +V and +VI, U, Pu, Np and Am exist as molecular ions. They exhibit a
linear trans-dioxo bond: the actinyl moiety (An-Oax between 1.75 and 1.82 Å). Due to the steric
hindrance produced by this bond, only 5 water molecules coordinate the metal in the equatorial
plane with An-Oeq distance ranging from 2.36 to 2.52 Å [2006SZA] [2010CHO]. Figure II.6

II. Bibliographic Study
19
summarizes the possible molecular geometries of aqua ions for plutonium at several oxidation
states (+III, +IV, +V, +VI and +VII) [2000CLA].
Figure II.6 Possible molecular geometries for the plutonium aquo ions (a) with eight water mole-
cules for Pu(III) and Pu(IV) in three geometric arrangements; (b) Pu(III, IV) with nine water
molecules; (c) Pu(V) and Pu(VI), actinyl ions with five water molecules in the equatorial plane
and (d) Pu(VII) [2000CLA].
Actinides aqua ions can exhibit a variety of colors depending on their oxidation states. For
example, the solutions containing plutonium ions at oxidation states from +III to +VII in non-
complexing media are presented in Figure II.7a. Each oxidation state exhibits a characteristic
absorption spectrum (Figure II.7b). The presence of f electrons leads to the presence of sharp
absorption bands in the spectrum. Thus, the spectrum of Pu(VII) is the only one without any
sharp band. Those sharp bands that can be observed in the visible and near-infrared range reflect
the internal 5f transitions [2000CLA].

II. Bibliographic Study
20
Figure II.7 (a) The color of non-complexed plutonium at various oxidation states in 1 M HClO4
from Pu(III) to Pu(VI) and in strong base for Pu(VII) (b) their corresponding absorption spectra
[2000CLA].
C) Hydrolysis
Hydrolysis can be regarded as a complexation with hydroxide in water. For a given actinide,
the tendency towards hydrolysis follows the sequence An4+ > AnO22+ > An3+ > AnO2
+
[1986KAT]. according to the effective charge on the metal ions: in the case of actinyl ions,
these charges are indeed 2.3 ± 0.2 and 3.3 ± 0.1 for AnVO2+ and AnVIO2
2+ respectively, because
of the covalent bond between actinide and oxygen [1983CHO]. For a given oxidation state (+III
or +IV) this tendency increases with Z.
The first step of hydrolysis corresponds to the transfer of a proton from the first coordination
sphere to the second. It is followed by the release of proton in the bulk. The hydrolysis equilibria
can be described by the following equation:
[𝑀(𝑂𝐻2)𝑚]𝑛+ + ℎ𝐻2𝑂 ⇌ [𝑀(𝑂𝐻)ℎ (𝑂𝐻2)𝑚−ℎ]
(𝑛−ℎ)+ + ℎ𝐻3𝑂+ II.1
Once formed, the hydrolyzed species can undergo condensation reaction according to olation
(Equation II.2) or oxolation (Equation II.3) mechanisms [1992HEN].
𝑀‒𝑂𝐻 +𝑀‒𝑂𝐻2 → 𝑀‒𝑂𝐻‒𝑀 + 𝐻2𝑂 II.2
𝑀‒𝑂𝐻 + 𝑂𝐻‒𝑀 → 𝑀‒𝑂‒𝑀 + 𝐻2𝑂 II.3
Hydrolyzed actinide ions tend to undergo mainly condensation by olation, leading to the for-
mation of hydroxo-bridged oligomers [2013KNO]. In the case of An(IV), polymer aging leads

II. Bibliographic Study
21
to oxo bridged species [1978JOH]. But a feature of An(IV) chemistry lies in the formation of
colloids, for which the first step is the formation of hydrolyzed monomeric species [2009WAL].
The hydrolysis behavior of actinides has been studied for many decades and a large amount of
hydrolysis constants (not always consistent) are available in the literature. Some critical reviews
devoted to the development of thermodynamic database on equilibria involving actinides in
aqueous solution include monomers and oligomers [2001LEM] [2003GUI] [2008RAN]. In the
present work, different concentration scales of lanthanides and actinides have been used. Liq-
uid-liquid extraction experiments were performed with metal at ultra-trace and at relative low
pH, allowing the condensation of hydrolyzed actinides to be neglected. Higher metal concen-
trations have been used in spectroscopic measurements, but the use of strongly acidic medium
may avoid the formation of colloidal species [2013KER].
In the following, only hydrolysis constants relative to mononuclear species have been consid-
ered. The general equilibrium of hydrolysis reaction for mononuclear species can be expressed
as:
𝑀𝑛+ +𝑚𝐻2𝑂 ⇌ 𝑀(𝑂𝐻)𝑚(𝑛−𝑚)+ +𝑚𝐻+ II.4
Thus, the cumulative hydrolysis constant expressed in concentration is:
𝛽𝑚 =[𝑀(𝑂𝐻)𝑚
(𝑛−𝑚)+][𝐻+]𝑚
[𝑀𝑛+] II.5
Without consideration of colloid and polymer species, the hydrolysis constants of An4+ (An =
Th, U, Pu), Cf3+and Eu3+ are presented in Table II.3. The speciation diagrams of Th(IV), Cf(III)
and Pu(IV) in non-complexing media using the values in Table II.3 are presented in Figure
II.8. For Th(IV), hydrolysis starts at pH = 1.0, while the first hydrolysis species of Cf(III) is
observed from pH = 5.5. The hydrolysis of Pu(IV) is much stronger than Th(IV): at pH around
0.5, the concentrations of Pu4+, Pu(OH)3+ and Pu(OH)22+ are almost the same. The validity of
using Th(IV) as model for Pu(IV) can therefore be limited because of the difference in hydro-
lytic behavior of Th(IV) and Pu(IV).

II. Bibliographic Study
22
Table II.3 Hydrolysis constants of Th(IV), U(IV), Pu(IV), Cf(IV) and Eu(III) at 25 °C.
Actinide β1 β2 β3 β4 Medium Method Reference
Cf(III) -7.8 0.1 M NaClO4 em. [1989ROS]
Eu(III) -7.3 0.7 M NaCl sol. [1983CAC]
Th(IV)a -3.35 -8.6 -14.2 -19.4 1.0 M NaClO4 sol. [2000EKB]
U(IV)a -1.56 0.5 M NH4Cl sp. [1975DAV]
Pu(IV) -0.45 -1.2 -4.5 -10.8 1.0 M LiClO4 sol. [1972MET]
a. Values are selected by OECD to estimate the hydrolysis constants at I = 0 [1992GRE] [2008RAN].
0 1 2 3 4 5 6 70.0
0.2
0.4
0.6
0.8
1.0
Ra
tio
pH
Th4+
Th(OH)3+
Th(OH)2+
2
Th(OH)+
3
Th(OH)4
0 1 2 3 4 5 6 70.0
0.2
0.4
0.6
0.8
1.0
Rati
o
pH
Cf3+
Cf(OH)2+
0 1 2 3 4 5 6 70.0
0.2
0.4
0.6
0.8
1.0
Rati
o
pH
Pu4+
Pu(OH)3+
Pu(OH)2+2
Pu(OH)+3
Pu(OH)4
Figure II.8 Hydrolysis speciation diagram of mononuclear Th(IV), Cf(III) and Pu(IV) without
considering colloid or polymer species.
D) Actinide complexation
Hard Soft Acid Base (HSAB) principle has been applied to explain qualitatively the interaction
between metal ions and inorganic or organic ligands for many years. Hard acids are character-
ized by small size and high positive charge whereas hard bases exhibit low polarizability and

II. Bibliographic Study
23
high electronegativity respectively. On the other hand, soft acids have large size and low posi-
tive charge; soft bases have high polarizability and low electronegativity. The general statement
of the HSAB principle is that hard acid prefers to coordinate with hard base, and soft acid with
soft base [1997PEA].
The common hard, soft and intermediate electron donors are shown in Table II.4. According
to HSAB principle, actinides ions, with relative high charges and small sizes belong to the class
of hard acids. In particular, they interact strongly with oxygen atoms of a great variety of or-
ganic compounds.
Table II.4 Classification of Bases [1997PEA].
Since the strength of the interaction between actinides and a given ligand depends on the effec-
tive charge of actinides in the ionic forms, regardless of steric hindrance, the order of the inter-
action strength should be:
AnO2+ < An3+ < AnO2
2+ < An4+
This rule can be commonly observed in aqueous solution without ligands or in the presence of
inorganic ligands in aqueous solution since the water molecule or inorganic ligand are small
enough to ignore the steric hindrance. Thus, the effective charge decides the strength of inter-
action in this case.
However, with consideration of steric hindrance, the reactivity order of An3+ and AnO22+ may
be reversed and the general tendency of actinides to form complexes follows the sequence:
AnO2+ < AnO2
2+ < An3+ < An4+
Thus, the complex with An(IV) should be most stable in solution due to its highest effective
charge. On the contrast, An(V) should normally form the weakest complex with ligands.

II. Bibliographic Study
24
At the same oxidation state, the stability of actinide complexes increases with atomic number
(decrease of the atomic radii). The effective ionic radii for An(IV) with a coordination number
of eight are 1.05, 1.00, 0.96, 0.95, 0.95 and 0.92 Å for thorium, uranium, plutonium, americium,
curium and californium, respectively [1976SHA]. Thus, the interaction of Pu4+ with ligand is
expected to be stronger than that of U4+ and Th4+.

II. Bibliographic Study
25
II.1.3. Actinides in the environment
Actinides released in the environment have several sources. The sources can be natural or an-
thropogenic. Most environmental contamination is anthropogenic.
The naturally occurring actinides are composed of primordial nuclides. They were created be-
fore our solar system. Among those primordial, 238U, 235U and 232Th can be listed. They were
produced from neutron capture reactions during supernova explosions. They are featured by a
half-life longer than the age of the Earth. By radioactive decay, primordial actinide nuclides can
produce other actinides, called radiogenic nuclides (decay chains). The last kind of naturally
occurring actinides are the nucleogenic nuclides. They are issued of natural terrestrial nuclear
reaction.
The second sources of actinides in the environment are the anthropogenic actinides. They are
mainly due to nuclear weapons fallout, from nuclear power plant activities and incidents. The
anthropogenic actinides are mainly composed of the transuranium elements. One of the main
sources of actinides in the environment is the weapon tests. From 1945 to 1980, 543 nuclear
tests have been conducted in the Northern hemisphere. After 1963, nuclear tests were mainly
underground tests to limit the release in the atmosphere. Those tests are equivalent to 0.1 tonne
of plutonium released in underground tests and 3.5 tonnes in atmospheric tests. Radionuclides
issued from nuclear tests remaining countable possess long half-lives and are mainly 241Am,
239,240Pu, 237Np, but also 137Cs and 90Sr. Accident with nuclear-powered satellites also intro-
duced plutonium in the environment. It was the case in 1964 with the SNAP-9A. Fallouts were
mainly located in the Sothern hemisphere and were evaluated to 100 TBq of 238Pu [2013ATW].
Another source is the release of actinides from nuclear plants during plutonium production or
reprocessing steps. Some intentional and accidental releases were observed as airborne and/or
liquid discharges. Some examples are Sellafield, in the United Kingdom, with the dissemination
from 1952 of 137Cs, 90Sr, 241Am, 237Np and 239,240Pu in the North Atlantic Ocean. Other nuclear
plants were concerned, such as La Hague in France, Hanford and Rocky Flat in the United
States. The last important source of radionuclides in the environment is incidents at nuclear
power plants with the most recent examples, Chernobyl in 1986 and Fukushima in 2011. The
Chernobyl accident is the most important accident involving a nuclear power plant. The inven-
tory is evaluated to 5.6 kg 239Pu, 48.5 kg of 236U, 0.136 kg of 237Np and 0.52 kg of 241Am (from
241Pu). The composition of the Chernobyl fallout was observed to vary with distance from the
accident site [2018DEN].

II. Bibliographic Study
26
The mobility and toxicity of actinides in the environment are mainly governed by their specia-
tion and depend on several parameters (pH, I, Eh, inorganic ligands and organic ligands con-
centrations, etc.). The oxidation state has a strong influence on the mobility of the actinide in
the environment. As mentioned previously, some of the light actinides can be present under
several oxidation states. Thus, U, Np and Pu can be present under subsurface conditions as An3+,
An4+, AnO2+ and AnO2
2+. This feature complicates the prediction of their behavior in the envi-
ronment. Other actinides of environmental interest are mainly present under one oxidation state,
which is the case for Th(IV) and Am(III) for instance (Figure II.9). Light actinides in the oxi-
dation states +III and +IV commonly exist in the environment according to the diverse condi-
tions. As regarding the elements used in the present work, Th and Eu (as chemical analog of
trivalent actinides) are at the +IV and +III oxidation states respectively. Generally, actinides in
the +III and +IV states have a lower solubility and a higher tendency to sorb on mineral surfaces,
whereas in the +V and +VI states, a higher solubility is observed enhancing their mobility.
Figure II.9 Common oxidation states of actinides in the environment under different conditions.
States mentioned in bracket (−) are unstable; and with a question mark (?) were not confirmed.
The oxidation states bolded correspond to the predominant states [2013MAH].
Thus, in reducing environment (anaerobic zone) uranium is mainly present as the low soluble
U(IV), whereas in groundwater and in the majority of natural waters, uranium is more soluble
in the +VI state. Plutonium speciation in the environment will be strongly dependent on Eh, pH,
I, the presence of organic and inorganic ligand, as well as the disproportionation. It may often
exist under several oxidation states, from +IV to +VI. Plutonium(III) is only observed in anaer-
obic environment or in very acidic waters. Pu(V) is the main species in most of natural waters

II. Bibliographic Study
27
(aerobic conditions at near-neutral pH) but in very low concentration. The main oxidation states
remains Pu(IV) in the environment. Indeed, because of the disproportionation and also because
of the low solubility of Pu(IV) the concentration of Pu(V) in natural waters is limited
[2007CHO] [2013MAH]. The low solubility of Pu(IV) can reduce its migration by precipitation.
Without complexing ligands, the main species observed in the environment and mainly in nat-
ural waters, are hydrolyzed species. In natural waters, the main ligands that can complex with
actinides are carbonates and hydroxides. Trivalent actinides form in natural waters mainly
An(OH)2+, An(CO3)2- and An(CO3)
+ [2007CHO]. However, hydrolysis remains the most im-
portant reaction and hydroxyl species have a high tendency to sorb onto colloids, sediments or
humic substances. Thorium(IV) species are composed of monomeric and polymeric hydrolysis
species according to the pH and the amount of thorium in solution. For instance, at low con-
centration, Th(OH)3+, Th(OH)3+ and Th(OH)4 will be formed [2007CHO]. For U, Np an Pu, at
near neutral pH, the main species are often carbonate species. In natural waters, in presence of
carbonate, U(VI) is mainly present as UO2(CO3)22- and often as CaUO2(CO3)2 [1996BER]
[2007CHO] [2009PRA] [2013MAH] [2015MAL].
The oxidation state is not the only factor that can influence the migration of actinides in the
environment. Another parameter is the sorption of some actinides onto mineral surfaces or col-
loids. Trivalent and tetravalent actinides are known to sorb readily to surfaces that can reduce
their mobility. However, the formation of intrinsic colloids but also the sorption of hydrolyzed
species onto colloids leads to further migration of those actinides, especially for plutonium
[2007CHO] [2013KER] [2013MAH]. Some studies have shown that Pu migration in the envi-
ronment could occur by transport on colloidal particles [1999KER] [2002SAN] [2006NOV]
[2013ABD] [2013KER].
Their mobility can also be affected by complexation with inorganic and organic ligands, which
limits the polymerization. Complexation with organic ligands, from simple carboxylic acids to
more complex organic molecules (humic substances) may also strongly influence the actinide
behaviors in the environment. The formation of stable complexes with a variety of organic lig-
ands can increase the mobility of the actinide by increasing their solubility. Several organic
ligands can be naturally found in the environment, such as humic substances or siderophores.

II. Bibliographic Study
28
II.2 Hydroxamate siderophores
The fate of actinides can be strongly affected by the presence of natural organic compounds
present in the environment that can modify their speciation and their solubility. Among the
relevant organic compounds present in the environment, siderophores are an interesting class
of organic complexing ligands. Siderophores are metal-chelating agents secreted by microor-
ganisms and plants [2014AHM]. For the moment, more than 500 different kinds of siderophores
are known and are divided into three main classes according to their characteristic functional
groups which are hydroxamates (Figure II.10), catecholates and carboxylates. As a member of
hydroxamate siderophores, desferrioxamine B (abbreviated name: DFB) was studied in this
work in particular because of its commercial availability. Moreover, DFB is estimated to be
found in soils at concentrations from 1.7×10⁻⁷ to 1.3×10⁻⁸ M [1980POW]. It has a strong ability
to bind with actinides owing to its three hydroxamate groups (Figure II.11). Collecting funda-
mental data on actinides-DFB interaction will improve our understanding of their migration
behavior in the environment and allow the development of remediation process of contaminated
soils and natural waters.
Figure II.10 General structure of hydroxamate functional group.
Desferrioxamine B is a bacterial siderophore containing three hydroxamate functional groups.
Figure II.11 presents the molecule formula of desferrioxamine B. According to HSAB princi-
ple, actinides ions are hard acids and hydroxamate group contains O atom donors, i.e hard bases
(N is considered as soft in ligands that bear only N atoms) [1983CHO]. Therefore, hydroxamate
functional group has a strong ability to coordinate with actinides and stabilize the actinide com-
plex in aqueous solution, and then influence their transport in the environment.
Figure II.11 Desferrioxamine B.

II. Bibliographic Study
29
Protonation and deprotonation reactions of organic ligands have a large influence on the formed
complexes. The successive dissociation constants available in the literature, starting from to-
tally protonated form of DFB are listed in Table II.5. In that case, the four functional groups
of DFB (3 hydroxamates and 1 amine) can be involved in protonation-deprotonation process.
The constants in Table II.5 are limited to data available at 25 °C or/and detailed acceptable
references.
Table II.5 Dissociation constants of H4DFB+ at 25 °C.
HnL⇌Hn-1L+H Ka(5-n)=[Hn-1L][H]/[HnL] pKa = - logKa
pKa4 pKa3 pKa2 pKa1 I, M Reference
10.87 9.57 8.97 8.35 0.1 (NaClO4) [1996HER]
10.89 9.55 8.98 8.32 0.1 (KNO3) [1996HER]
11.0±0.3 9.7±0.2 9.2±0.1 8.4±0.3 0.1 (NaCl) [2005DUC]
10.87 9.54 8.96 8.31 0.1 (KCl) [1996HER]
10.79 9.55 8.96 8.32 0.1 (KCl) [1989EVE]
10.84±0.01 9.49±0.02 8.96±0.01 8.26±0.03 0.2 (KCl) [2013TIR]
10.84±0.03 9.46±0.01 9.00±0.01 8.30±0.01 0.2 (KCl) [1999FAR]
10.85±0.01 9.52±0.01 8.96±0.01 8.33±0.01 0.2 (KCl) [2011SZA]
10.74±0.09 9.58±0.02 8.93±0.02 8.40±0.01 0.7 (NaCl) [2011CHR]
10.89±0.06 9.70±0.02 9.06±0.01 8.54±0.01 0.7 (NaClO4) [2011CHR]
10.89±0.02 9.61±0.01 9.05±0.01 8.51±0.01 1.0 (KCl) [1989BOR]
10.9±0.1 9.8±0.2 9.2±0.3 8.6±0.4 1.0 (NaCl) [2010SIM]
All the values were determined by pot. Except [2010SIM] determined by IR sp.
According to the collected data in the table, it can be seen that the dissociation constants at 0.1
M ionic strength do not depend significantly on the medium composition. A slight increase is
observed with increasing ionic strength. Most of the data have been determined by potentiom-
etric titration. The only different technique applied is infrared spectroscopy using a speciation-
modeling analysis [2010SIM].
The dissociation constants obtained by Christenson et al. [2011CHR] at I = 0.7 M NaClO4 have
been selected in this work since their experimental conditions are the closest to ours. According
to the selected dissociation constants [2011CHR], the speciation diagram of DFB is plotted and
presented in Figure II.12. It can be seen that many different species of DFB exist in a large
range of pH. In this work, the thermodynamic study has been conducted at a pH much lower
than 6.0. Thus, the predominant species of DFB was always H4DFB+ (fully protonated DFB).

II. Bibliographic Study
30
4 6 8 10 120.0
0.2
0.4
0.6
0.8
1.0
Ra
tio
pH
H4DFB
+
H3DFB
H2DFB
-
HDFB2-
DFB3-
Figure II.12 Speciation diagram of desferrioxamine B (I = 0.7 M Na, HClO4, T = 25 °C).
The available structural information of DFB has been mainly deduced from infra-red spectros-
copy measurements [2005EDW] [2005SIE] [2006COZ] [2009BOR]. The detailed discussion
and comparison with experimental results are illustrated in Section IV.1.4.
Besides desferrioxamine B (DFB), the hydroxamate compounds containing one hydroxamate
group such as acetohydroxamic acid (AHA) and benzohydroxamic acid (BHA) were also stud-
ied as the analogues of DFB. Figure II.13 presents the structural formula of BHA and AHA.
They can be considered as a model of ligands with multiple hydroxamate groups. In this work,
they have been used in the development of an experimental protocol basing on the analysis of
UV-Vis absorption spectra.
Figure II.13 Benzohydroxamic acid (BHA) (left) and acetohydroxamic acid (AHA) (right).
The dissociation constants of each acid are listed in Table II.6 and Table II.7. Most of the
dissociation constants were determined by potentiometric titration and just few dissociation
constants were determined by spectrophotometric titration. The used dissociation constants in
this study have been chosen according to the determination method and ionic strength. The aim
was to select the proper constants at the conditions close to those applied in this work (I = 0.7
M). Thus, for BHA, the constant pKa = 8.8 was selected. It was determined by Liu et al. at T =
25 °C and I = 0.1 M NaClO4 [1975LIU]. The speciation diagram of BHA obtained from this

II. Bibliographic Study
31
constant is depicted in Figure II.14 (left). With the same criteria, for AHA, the dissociation
constant pKa = 9.15 determined by Chung et al. at 25 °C and I = 1.0 M has been selected
[2011CHU] and the speciation diagram of AHA obtained from this constant is also depicted in
Figure II.14 (right). The pH in this work is controlled to be lower than 6.0. Thus, the species
of AHA and BHA should be the non-dissociated one.
Table II.6 Dissociation Constants of Benzohydroxamic Acid (BHA).
HL⇌L+H Ka=[L][H]/[HL] pKa = - logKa
pKa T, ℃ I, M Method Reference
8.54±0.05 22±1 0 (Davies) sp. [2007GLO]
8.79 20 0.1 (NaClO4) pot. [1963SCH]
8.76±0.05 22±1 0.1 (NaClO4) pot. [2007GLO]
8.8 25 0.1 (NaClO4) pot. [1975LIU]
8.757±0.005 25 0.1 (KNO3) pot. [1989KOI]
8.63±0.03 25 0.1 (NaNO3) pot. [2007KHA]
8.07±0.06 25 0.1 (KNO3) pot. [2010AKS]
8.10±0.05 25 0.1 (KNO3) pot. [2010AKS]
8.83±0.01 25 0.1 (NaCl) pot. [2011TUR]
8.71±0.03 25 0.2 (KCl) pot. [2000OBR]
8.65±0.01 25 0.2 (KCl) pot. [2005BUG]
8.69±0.02 25 0.2 (KCl) pot. [2011SZA]
2 4 6 8 10 120.0
0.2
0.4
0.6
0.8
1.0
Rati
o
pH
L- (Deprtonated BHA)
HL(Protonated BHA)
0 2 4 6 8 10 12
0.0
0.2
0.4
0.6
0.8
1.0
Ra
tio
pH
L- (Deprontated AHA)
HL (Protonated AHA)
Figure II.14 Speciation diagrams of benzohydroxamic acid (left) in 0.1 M NaClO4 at 25°C and
acetohydroxamic acid (right) in 1.0 M NaCl at 25°C.

II. Bibliographic Study
32
Table II.7 Dissociation Constants of Acetohydroxamic Acid (AHA).
HL⇌L+H Ka=[L][H]/[HL] pKa = - logKa
pKa T, ℃ I, M Method Reference
9.35 20 0.1 (NaNO3) pot. [1963AND]
9.37 20 0.1 (NaClO4) pot. [1963SCH]
9.29±0.06 25 0.1 (KNO3) pot. [2010AKS]
9.36±0.01 25 0.1 (NaCl) pot. [2011TUR]
9.328±0.006 25 0.1 (KNO3) pot. [1989KOI]
9.40±0.01 25 0.1 (NaNO3) pot. [2007KHA]
9.27 25 0.2 (KCl) pot. [1999FAR]
9.25±0.01 25 0.2 (KCl) pot. [2005BUG]
9.25±0.01 25 0.2 (KCl) pot. [2011SZA]
9.15 25 1.0 (NaClO4) sp. [2011CHU]
9.018±0.003 22±1 2.0 (NaClO4) sp. [2002SIN]
9.12±0.05 25 2.0 (NaClO4) pot. [2007SIN]
II. Bibliographic Study
33
II.3 Interaction between actinides and hydroxamates
II.3.1 Interaction of actinides with monohydroxamates
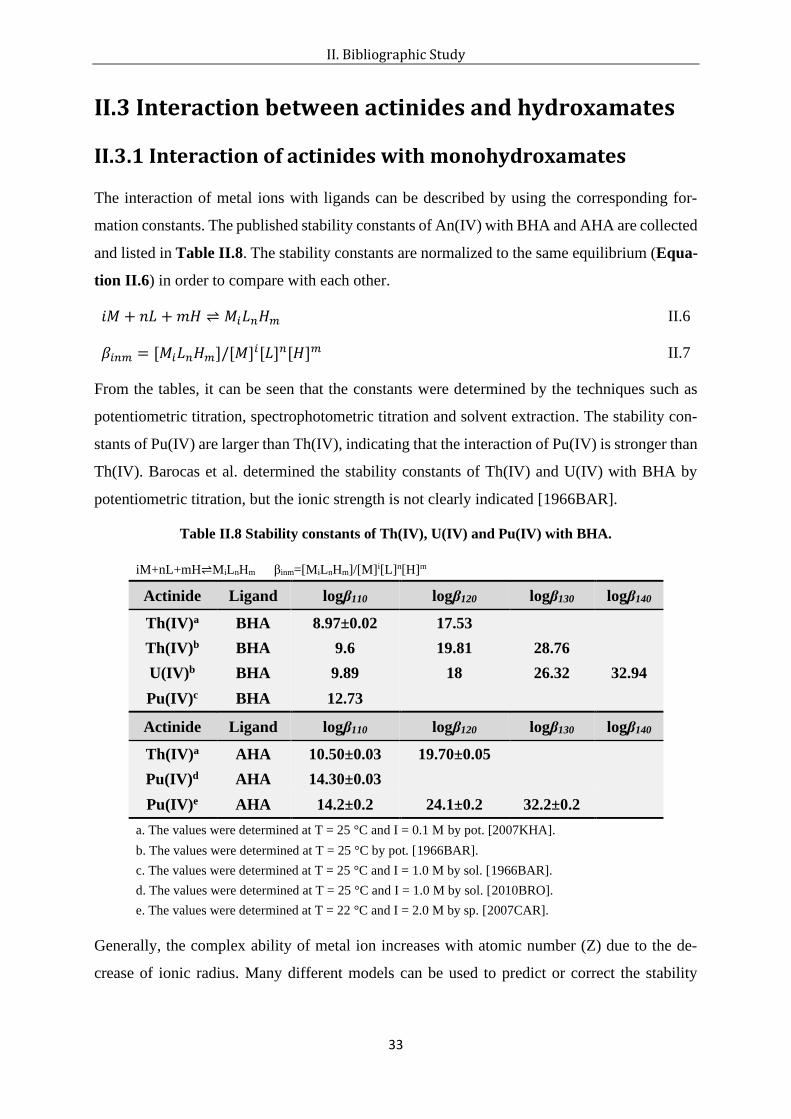
The interaction of metal ions with ligands can be described by using the corresponding for-
mation constants. The published stability constants of An(IV) with BHA and AHA are collected
and listed in Table II.8. The stability constants are normalized to the same equilibrium (Equa-
tion II.6) in order to compare with each other.
𝑖𝑀 + 𝑛𝐿 +𝑚𝐻 ⇌ 𝑀𝑖𝐿𝑛𝐻𝑚 II.6
𝛽𝑖𝑛𝑚 = [𝑀𝑖𝐿𝑛𝐻𝑚]/[𝑀]𝑖[𝐿]𝑛[𝐻]𝑚 II.7
From the tables, it can be seen that the constants were determined by the techniques such as
potentiometric titration, spectrophotometric titration and solvent extraction. The stability con-
stants of Pu(IV) are larger than Th(IV), indicating that the interaction of Pu(IV) is stronger than
Th(IV). Barocas et al. determined the stability constants of Th(IV) and U(IV) with BHA by
potentiometric titration, but the ionic strength is not clearly indicated [1966BAR].
Table II.8 Stability constants of Th(IV), U(IV) and Pu(IV) with BHA.
iM+nL+mH⇌MiLnHm βinm=[MiLnHm]/[M]i[L]n[H]m
Actinide Ligand logβ110 logβ120 logβ130 logβ140
Th(IV)a BHA 8.97±0.02 17.53
Th(IV)b BHA 9.6 19.81 28.76
U(IV)b BHA 9.89 18 26.32 32.94
Pu(IV)c BHA 12.73
Actinide Ligand logβ110 logβ120 logβ130 logβ140
Th(IV)a AHA 10.50±0.03 19.70±0.05
Pu(IV)d AHA 14.30±0.03
Pu(IV)e AHA 14.2±0.2 24.1±0.2 32.2±0.2
a. The values were determined at T = 25 °C and I = 0.1 M by pot. [2007KHA].
b. The values were determined at T = 25 °C by pot. [1966BAR].
c. The values were determined at T = 25 °C and I = 1.0 M by sol. [1966BAR].
d. The values were determined at T = 25 °C and I = 1.0 M by sol. [2010BRO]. e. The values were determined at T = 22 °C and I = 2.0 M by sp. [2007CAR].
Generally, the complex ability of metal ion increases with atomic number (Z) due to the de-
crease of ionic radius. Many different models can be used to predict or correct the stability

II. Bibliographic Study
34
constants [1999CHA]. Thus, by using the stability constants of Th(IV) and Pu(IV), the stability
constants of U(IV) may be estimated in the case of metal in ionic form.
II.3.2 Interaction of actinides with DFB
The complexation of several actinides with DFB has been previously studied. The stability con-
stants of DFB are summarized and listed in Table II.9. Because in the literature, equilibrium
can be expressed differently, all stability constants listed were normalized to the same equilib-
rium (Equation II.6) in order to compare with each other.
From the table, it can be seen that the interaction of Eu(III) with DFB (logβ113 = 35.72) is weaker
than with Th(IV) (logβ113 = 41.99). And Pu(IV) exhibit the largest interaction strength with
DFB (logβ113 = 46.37). Eu(III), Th(IV) and Pu(IV) can commonly form the 1:1 complex with
DFB and the formation of 1:2 complex was also reported with Pu(IV) [2007NEU] via spectro-
photometric titration. For the complex between Th(IV) and DFB, the stability constants with
successive deprotonation are determined and the complex involved in hydrolyzed Th(IV) was
also studied (logβ11-1 = 19.49) by Boukhalfa et al. [2007BOU].
Table II.9 Stability constants of Eu(III), Th(IV) and Pu(IV) with DFB.
iM+nL+mH⇌MiLnHm βinm=[MiLnHm]/[M]i[L]n[H]m
Actinide logβ113 logβ112 logβ111 logβ110 logβ11-1 logβ211
Eu(III)a 35.72 30.91 24.56
Th(IV)b 41.99 40.19 37.49 29.69 19.49
Pu(IV)c 46.37±0.5 45.76±0.30 44.87±0.9 84.08
a. The values were determined at T = 25 °C and I = 0.7 M NaClO4 by pot. [2011CHR].
b. The values were determined at T = 25 °C and I = 0.1 M KCl by sp. [1996WHI].
c. The values were determined at T = 25 °C and I = 0.1 M NaNO3 by sp. [2007BOU].
Besides the thermodynamic studies, many works have also been done to obtain structural in-
formation of free DFB and its complex. For example, Siebner-Freibach et al. studied the infra-
red spectra of free DFB and its complex with Fe as function of pH and temperature [2005SIE].
They reported that the presence of Fe makes C=O (hydroxamate) around 1624 cm-1 downshift
to lower frequencies around 1586 cm-1 according to the curve fitted analysis, which indicates
that Fe is complexed with hydroxamate group in DFB. Some other works using FTIR spectros-
copy also obtained close conclusions [2005EDW] [2006COZ] [2009BOR]. However, no infra-
red spectrum was found on actinides-DFB complexes. The work related to the structural study
of the complexation between actinides and DFB is also very scarce. In 1999, Neu et al. firstly

II. Bibliographic Study
35
characterized the structure of the complex Pu(IV)-DFE by single-crystal X-ray diffraction
[2000NEU]. They concluded that Pu(IV) is coordinated with three water molecules and three
bidentate hydroxamate groups of one DFE molecule. The ligand DFE (Desferrioxamine E) is
very similar to DFB in this work. Both of them have three hydroxamate functional groups and
the only difference is that DFE is a cyclic hydroxamate and DFB is a linear one.
Hydroxamates can also act as reducing agents. This property has been considered in nuclear
fuel reprocessing for controlling the oxidation states of actinides [1998TAY] [2007CAR]. In
the presence of formo- and aceto-hydroxamic acids, reductions of Pu(IV) into Pu(III) and
Np(VI) in Np(V) has been observed [1998TAY] [2008CAR]. Under the acidic conditions used
in the PUREX process, hydrolysis of hydroxamate moiety in the complex or of free hydroxamic
acid, leading to hydroxylamine, has to be taken into account. But in environmental conditions
(5.5 ≤ pH ≤ 8.2), where no hydroxylamine is expected to be formed, a rapid reduction of Pu(VI)
in Pu(V) was observed upon complexation with AHA and DFB, but Pu(IV) complex and fur-
ther reduction to Pu(III) were not observed: in environmental conditions hydroxamate groups
do not favour the reduction of Pu(V) into Pu(IV) [2018MOR]. Additionally, Boukhalfa et al.
also studied the redox properties of Pu(IV)-DFB complex, indicating that the reduction in Pu(III)
complex is unlikely to occur [2007BOU].

II. Bibliographic Study
36
II.4 Summary
The required knowledge about the complexation between actinides and hydroxamate ligands
has been reviewed in this section. The general chemical properties of actinides in aqueous so-
lution and in the environment have been described, including oxidation states, hydration struc-
tures, hydrolysis, condensation, complexation, etc. A state-of-the-art knowledge about the prop-
erties of desferrioxamine B, benzohydroxamic acid and acetohydroxamic acid, the interaction
between tetravalent actinides and trivalent lanthanides with these ligands was presented. The
complexation constants available in the literature have been collected, but structural studies are
rather scarce.
According to the literature data, speciation diagrams can be plotted using the software HYSS,
as illustrated in Figure II.15 and Figure II.16.
2 3 4 5 6 7 8 90.0
0.2
0.4
0.6
0.8
1.0
Ra
tio
pH
Free Eu3+
Eu(HDFB)+
Eu(H2DFB)
2+
Eu(H3DFB)
3+
0 2 4 6 80.0
0.2
0.4
0.6
0.8
1.0
Ra
tio
pH
Free Th4+
Th(H3DFB)
4+
Th(H2DFB)
3+
Th(HDFB)2+
Th(DFB)+
Figure II.15 Speciation diagram of Eu(III)-
DFB (CEu(III) = CDFB = 2.5×10⁻² M ) plotted by
using the literature data [2011CHR].
Figure II.16 Speciation diagram of Th(IV)-
DFB (CTh(IV) = CDFB = 2.5×10⁻² M ) plotted by
using the literature data [1996WHI].

III. Methodology
37
III. Methodology
This work is focusing on thermodynamic and structural studies of the complexation of trivalent
lanthanides (analogues of trivalent actinides) and tetravalent actinides with hydroxamate lig-
ands. The applied techniques, the studied systems and the corresponding experimental condi-
tions are summarized in Table III.1.
Table III.1 Applied techniques and studied systems in this work.
Objective Technique System Condition
Stability
constant
LLE
Combined with γ-
spectrometry
152Eu(III)-DFB T = 25 °C
I = 0.7 M (Na, HClO4) 227Th(IV)-DFB
SP
Pr(III)-DFB T ≈ 20 °C (uncontrolled)
I = 0.7 M (Na, HClO4) Eu(III)-DFB
U(IV)-AHA T = 25 °C
I = 0.5 M (HCl) U(IV)-BHA
U(IV)-DFB
ACE La(III)-DFB T = 25 °C
I = 0.5 M (Na, HClO4) Lu(III)-DFB
Structural
information
IR Eu(III)-DFB T = 25 °C
I ≈ 0.2 M (uncontrolled) Th(IV)-DFB
EXAFS U(IV)-DFB T = 25 °C
I ≈ 0.06 M (uncontrolled) Th(IV)-DFB
In the perspective of thermodynamic study, the techniques liquid-liquid extraction, UV-visible
absorption spectroscopy and affinity capillary electrophoresis were applied to determine the
stability constants of the complexes between metal ions and hydroxamate ligands. The tracer
scale radioactive metal ions were used in liquid-liquid extraction combined with gamma spec-
troscopy in order to statistically prevent tetravalent actinides against condensation and develop
the protocol for the future study on the scarce actinides. UV-visible absorption spectroscopy
was applied to study the metal ions having a good optical absorption property. Affinity capillary
electrophoresis was used in this work due to its advantage of homogeneous partition method.
In terms of structural study, the techniques ATR-FTIR spectroscopy and EXAFS combined
with theoretical calculation were employed to obtain the structural information of the complex-
ation in aqueous solution. The principles of the used techniques, the associated experimental
description and preparations of stock solutions of tetravalent actinides are illustrated in the fol-
lowing sections.

III. Methodology
38
III.1 Techniques for thermodynamic study
Radionuclides at tracer scale (10-15-10-10 M) are commonly used in radiochemistry, especially
with radioactive isotopes having high specific activity of stable elements or of radioelements,
(95Zr, 239Np) and with radionuclides not available in macro-amount (At, heavy actinides)
[1959ISH] [1969NOR] [1974SIL] [2018GUO].
At such low concentration, in situ species characterization is not feasible [1993ADL]. Partition
or transport methods based on radiation or mass detection can be used: for example, liquid-
liquid extraction or ion-exchange combined with γ or α spectrometries, capillary electrophoresis
combined with ICP-MS are currently used for actinide speciation studies [1996RYD]
[2009TOP]. With the radioelements in macro-concentration, conventional techniques of solu-
tion chemistry can be used, with caution and technical adaptation allowing handling of radio-
active material. In the present work, capillary electrophoresis combined with UV-vis detector
and UV-vis spectrophotometry have been used.
III.1.1 Liquid-liquid extraction
A) Principle
In liquid-liquid extraction, a solute is distributed between two immiscible solvents. One gener-
ally is an aqueous phase and the other one is an organic phase consisting of an extracting mol-
ecule and a diluent. This technique is used in industrial processes, particularly in the repro-
cessing of nuclear fuel (PUREX, SANEX, DIAMEX, ...) [2002MAD]. In this work, this tech-
nique is used as a tool to conduct the speciation study in aqueous phase [1996RYD].
The partition of a metal M is quantified by the distribution ratio D according to the following
equation:
𝐷 =𝐶𝑜𝑟𝑔 × 𝑉𝑜𝑟𝑔
𝐶𝑎𝑞 × 𝑉𝑎𝑞 III.1
where C refer to the concentration of metal (whatever its chemical form) in both phases.
In the present work, solvent extraction experiments have been performed with the metal at trace
scale, using an acidic extractant (β-diketone) that leads to the formation of a neutral chelate in
organic phase. In aqueous phase, according to the Rydberg’s formalism, the monomer can be
written as:
𝑀(𝐻𝑝𝐿)𝑙(𝐻𝐴)𝑥𝐻−𝑦(𝐻2𝑂)𝑧(𝑛−𝑦)+

III. Methodology
39
Where HpL and HA are the neutral forms of the ligand and of the extractant, respectively. y
stands for the number of group OH- (y > 0) or H+ (y < 0). This writing is valid at constant ionic
strength and temperature, with non-polar solvents (or low polarity like toluene). In the organic
phase, the complex is expected to be neutral. This leads to 𝑁 − 𝑦 = 0 (𝑦 = 𝑁). So the general
form of complex in the organic phase can be written as:
𝑀(𝐻𝑝𝐿)𝑙(𝐻𝐴)𝑥𝐻−𝑛(𝐻2𝑂)𝑧0̅̅ ̅̅ ̅̅ ̅̅ ̅̅ ̅̅ ̅̅ ̅̅ ̅̅ ̅̅ ̅̅ ̅̅ ̅̅ ̅̅ ̅̅ ̅̅ ̅̅ ̅̅
At constant ionic strength and temperature, thermodynamic activities can be regarded as con-
stant and water molecules do not affect complexation and partition equilibria.
Rydberg’s formalism leads to:
Nxl
py,x,l
y
0y
x
0x
l
0l
org
Nxl
pN,x,lN,x,l
x
0x
l
0l
]H[]HA[]LH[K
)]H[]HA[]LH[KP(
Dmaxmaxmax
maxmax
−
===
−
==
=
With ]H)HA()LH(M[
]H)HA()LH(M[P
yxlp
orgyxlp
N,x,l
−
−= the individual distribution ratio of M(HpL)l(HA)xH-y,
otherwise characterized by the formation constant Kl,x,y, in aqueous phase
𝐾𝑙,𝑥,𝑦 =[𝑀(𝐻𝑝𝐿)𝑙(𝐻𝐴)𝑥𝐻𝑦(𝑧
(𝑛−𝑦)+]
[𝑀][𝐻𝑝𝐿]𝑙[𝐻𝐴]𝑥[𝐻]−𝑦 III.2
A mathematical processing of D leads to the 3 following relationships that allow the determi-
nation of the mean composition and charge of species involved in extraction and complexation
equilibria.
𝜕𝑙𝑜𝑔𝐷
𝜕log [𝐻𝑝𝐿]= ⟨𝑙𝑜𝑟𝑔⟩ − ⟨𝑙𝑎𝑞⟩ III.3
𝜕𝑙𝑜𝑔𝐷
𝜕log [𝐻𝐴]= ⟨𝑥𝑜𝑟𝑔⟩ − ⟨𝑥𝑎𝑞⟩ III.4
𝜕𝑙𝑜𝑔𝐷
𝜕log [𝐻]= −𝑛 − (−𝑦) III.5

III. Methodology
40
B) Experimental
Organic phase was prepared by dissolving TTA (thenoyltrifluoroacetone) in toluene. Aqueous
phase consists of DFB, NaClO4, HClO4 and radionuclides (152Eu or 227Th). The preparations of
both phases are described in Appendix A.
1. System 152Eu-DFB
Direct extractions (Eu introduced in aqueous phase) were performed away from light in a tem-
perature-controlled water bath (25 °C) at 50 rpm stirring speed during 26 hours. This contact
time has been proven to be sufficient to reach equilibrium, the limiting step being partition of
the extractant [2003JAU]. Both phases were carefully separated and their activity wer deter-
mined by gamma spectrometry. The D values were determined according to the counts of each
phase at 121 keV. Additionally, it is verified that the values of D0 in absence of ligands were
not significantly influenced by the energy for counting (Appendix B). The determination
method of proton concentration is described in Appendix C.
2. System 227Th(IV)-DFB
Because of insufficient reproducibility in direct extraction experiments with Th, a new protocol
based on Sasaki’s work, has been developed [2008SAS]. 227Th(IV) was first quantitatively ex-
tracted into the organic phase, a TTA solution prepared by dissolution of TTA-hydrate in tol-
uene pre-equilibrated with an aqueous phase of a given pCH. Then aqueous phases with DFB
concentration ranging from 0 to 0.08 M at a given pCH were contacted during 3 hours with the
227Th-loaded TTA solution at 25 °C. This time was proved to be sufficient to reach equilibrium
(Appendix D). Then aliquots parts of same volume of each phase were withdrawn and their
activity determined by γ-spectrometry at 236 keV, allowing the distribution ratio to be calcu-
lated.
Experiments with 227Th have been performed in glass vials with walls protected by galxyl
parylene (Comelec) in order to prevent the adsorption of Th(IV) on glasses walls. Sorption of
Th as well as of the complex Th(TTA)4 from perchlorate solutions on glasses has namely al-
ready been observed [1969EDR].

III. Methodology
41
III.1.2 Ultraviolet-visible absorption spectroscopy
A) Principle
Ultraviolet–visible spectroscopy refers to absorption spectroscopy in the spectral region with
wavelength ranging from 200 to 800 nm. An atom or ion can absorb ultraviolet and visible light
(electromagnetic radiation), which can lead to excitation of electrons promoted to higher energy
levels [2017SKO].
Most of lanthanides and actinides (whatever their oxidation states) exhibit sharp characteristic
absorption bands in the ultraviolet-visible region due to f-f transition. For example, plutonium
at different oxidation states forms color ions as shown in Figure II.7. The color of substance
species depends on the wavelength of absorbed energy. Beer–Lambert law states that the ab-
sorbance of a solution is directly proportional to the concentration of the absorbing species in
the solution and the path length [2016WOR].
𝐴 = 𝑙𝑜𝑔10 ( 𝐼0𝐼𝑡) = 𝜀𝑐𝐿 III.6
where A is the measured absorbance, I0 is the intensity of the incident light at a given wave-
length, It is the transmitted intensity, L is the path length, and c is the concentration of the
absorbing species. For each species and wavelength, ε is a constant known as the molar absorp-
tivity or extinction coefficient. This constant is a fundamental molecular property in a given
solvent, at a particular temperature and pressure, and has units of L/M·cm.
In the case of a mixture of absorbing species, the total absorbance is the sum of the absorbance
of each individual species as shown in Equation III.7.
𝐴𝑡𝑜𝑡 =∑𝐴𝑖 =∑𝜀𝑖𝑐𝑖𝐿 III.7
where 𝜀𝑖 is the absorbance extinction coefficient of each species and 𝑐𝑖 is the concentration of
each species. 𝐴𝑡𝑜𝑡 is the total absorbance of all species. L is the light path length through the
sample.
According to Equation III.7, the stability constant can be deduced from the experimental var-
iation of the total absorbance as a function of ligand or metal concentration using non-linear
fitting programs [1993CLA].
Experimentally, absorbance was measured using an UV-visible spectrophotometer. Its sche-
matic diagram is shown in Figure III.1.

III. Methodology
42
Figure III.1 Schematic diagram of UV-visible spectrophotometer.
B) Experimental
The studied organic ligands AHA BHA and DFB possess broad and intense absorption bands
around 200 nm. Variation of the absorption of organic ligands in ultraviolet-visible spectral
region is therefore difficult to analyze. Alternatively, the spectral signal of lanthanide or acti-
nide metal ions is followed by UV-visible spectrophotometer. It is expected that the obtained
spectra can show the successive variation of the absorption spectra as the increase of the con-
centration of organic ligands.
The experiments of lanthanides were performed with Agilent Technologies Cary 60 UV-visible
spectrophotometer. The baseline was defined by deionized water (MilliQ). The same 1 cm path
length cuvette (QS) was used throughout the whole experiment. Before the measurement, the
cuvette was washed at least twice by the sample solution which was going to be measured. The
scan speed was 3 nm/s and the interval was 0.5 nm. The temperature was roughly estimated to
be 20 °C. The software HypSpec was used for spectral data processing [1996GAN].
The experiments of tetravalent with U(IV) were performed with SHIMADZU, UV-2501-PC
UV-visible spectrophotometer. The baseline was defined by deionized water (Millipore di-
rectQ3). The same cuvette was used throughout the whole experiment. Before the measurement,
the cuvette was washed at least twice by the sample solution which was going to be measured.
The scan speed was 3 nm/s and the interval was 1 nm. The measurements were conducted at
25 °C using a Peltier temperature controller.

III. Methodology
43
III.1.3 Affinity capillary electrophoresis
A) Principle
Electrophoresis refers to the migration of charged species under the influence of an electric
field. In capillary electrophoresis, a potential gap is applied between the ends of a capillary
dipping into a conductive solution called electrolyte allowing ions to be separated according to
their migration rate v. The electrophoretic mobility µ of the charged species represents the pro-
portionality factor between v and E. It depends on two opposite forces, electrostatic and friction,
and it is constant in a given medium [1993GUZ]. The electrophoretic mobility is expressed as:
µ𝑒𝑝 = 𝑞
6𝜋𝑟𝜂 III.8
where µ𝑒𝑝 is the electrophoretic mobility of a species in a given media. 𝑞 is the charge of ions
and 𝑟 represents the hydrodynamic radius of ions. 𝜂 is the dynamic viscosity of the electrolyte.
Due to the differences in charge/size ratio of ions in solution, the ions migrate through the
capillary at different speed. Smaller size and higher charge can facilitate the migration. In ad-
dition, electrolyte, ionic strength and temperature have an influence on viscosity η and further
influence on migration µ [1993GUZ]. Electroosmotic mobility µ𝑒𝑜𝑓 is an important phenome-
non in capillary electrophoresis, indicating the flow of electrolyte under an electric field. Figure
III.2 presents the schematic of electroosmotic flow. The deprotonation of SiOH groups on the
silica capillary leads to the formation of a double layer. The outer layer free ions can be moving
towards electrode, leading to the electroosmotic flow in an electrolyte-filled capillary under
high-voltage [2017SKO].
Figure III.2 Schematic of electroosmotic flow.
Thus, in the existence of electroosmotic flow, the migration velocity and time can be expressed
as:

III. Methodology
44
𝑣 =(µ𝑒𝑝 + µ𝑒𝑜𝑓)𝑉
𝐿 III.9
and
𝑡 =𝑙𝐿
(µ𝑒𝑝 + µ𝑒𝑜𝑓)𝑉 III.10
where 𝐿 is the length of the capillary, 𝑉 is the voltage applied across the capillary and 𝑙 is the
distance between the point of injection and the detector.
The schematic process of affinity capillary electrophoresis is shown in Figure III.3. The in-
jected sample travels through the capillary and interacts with ligands in the electrolyte to form
complex. The migration time of sample is varied as the variation of ligand concentration in the
electrolyte.
Figure III.3 Schematic process of affinity capillary electrophoresis.
If the kinetic of equilibrium is much faster than the separation time, the apparent electrophoretic
mobility is the integration of individual mobility of each species in the sample. In other words,
the individual mobility of all the species in the sample makes the contribution to the total elec-
trophoretic mobility [2008CHE]. Thus, the electrophoretic mobility can be described as:
µ𝑒𝑝 =∑µ𝑖𝐶𝑖𝐶𝑡𝑜𝑡
=∑µ𝑖𝛼𝑖 III.11
where µ𝑖 is the migration mobility of each species and 𝐶𝑖 is the concentration of each species.
𝐶𝑡𝑜𝑡 is the total concentration of all species. 𝛼𝑖 is the molar fraction of each species.
Thus, according to Equation III.11, the stability constant can be deduced from the experi-
mental variation of the global electrophoretic mobility as a function of ligand or metal concen-
tration using non-linear fitting programs [2016SLA].

III. Methodology
45
B) Experimental
The experiments were performed with the instrument P/ACE system MDQ capillary electro-
phoresis (Beckman Coulter, France). The system was equipped with a power supply at 0 - 30
kV high voltage and a UV-vis spectrophotometric diode array detector. UV direct detection at
200 nm was applied to record the mobility of analyst. A capillary (50 μm inner diameter and
363 μm outer diameter) made from fused silica was purchased from Beckman Instruments and
was used with a total length (Lt) of 31.2 cm and an effective separation length (Ld) of 21 cm.
The capillary was set up in an interchangeable cartridge with circulating liquid coolant. The
ambient temperature was maintained at 25 °C. Every single measurement was repeated at least
three times. Data acquisition and processing were carried out with Karat 32 software (Beckman
Coulter, France). Prior to using, the capillary was conditioned by successive washes with 0.1
M sodium hydroxide, deionized water and the prepared buffer solution, respectively. It was
rinsed for 2 minutes (at a pressure of 103.4 kPa) with the background electrolyte for study
before beginning the electrophoresis.

III. Methodology
46
III.2 Techniques for structural study
III.2.1 Attenuated total reflectance Fourier-transform infrared
spectroscopy
A) Principle
Infrared spectroscopy refers to absorption spectroscopy in infrared spectral region. The analysis
of the interaction of infrared light with molecules allows to determine functional groups in mol-
ecules (organic or inorganic) and to determine the structure of a complex. This is a vibrational
spectroscopy. Infrared spectra are from the different vibrational and rotational modes of a mol-
ecule. Thus, the absorption of infrared radiation leads to the excitation of those vibrations and
rotations. To observe a vibrational mode, it is necessary that the dipole moment change during
the vibration. For polyatomic molecules, there are many different modes of vibrations in which
bending and stretching are the simplest ones [2000STU]. Figure III.4 presents the possible
vibration types. From the figure, it can be seen that stretching vibrations are characterized by a
change of bond lengths and bending vibrations is featured by a modification of bond angles
[1989HAR].
Figure III.4 Types of stretching and bending.
The vibration frequency depends on the masses of the two bound atoms and on the bond
strength. The other atoms connected can also slightly influence the frequency. Generally, the
wavenumber cm-1 is used to indicate the absorption energy of bonds. The larger the wave-
number of the infrared energy absorbed to make resonance, the higher the frequency of vibra-
tion in the bonds of molecules. The infrared absorption spectrum can reflect the characteristic
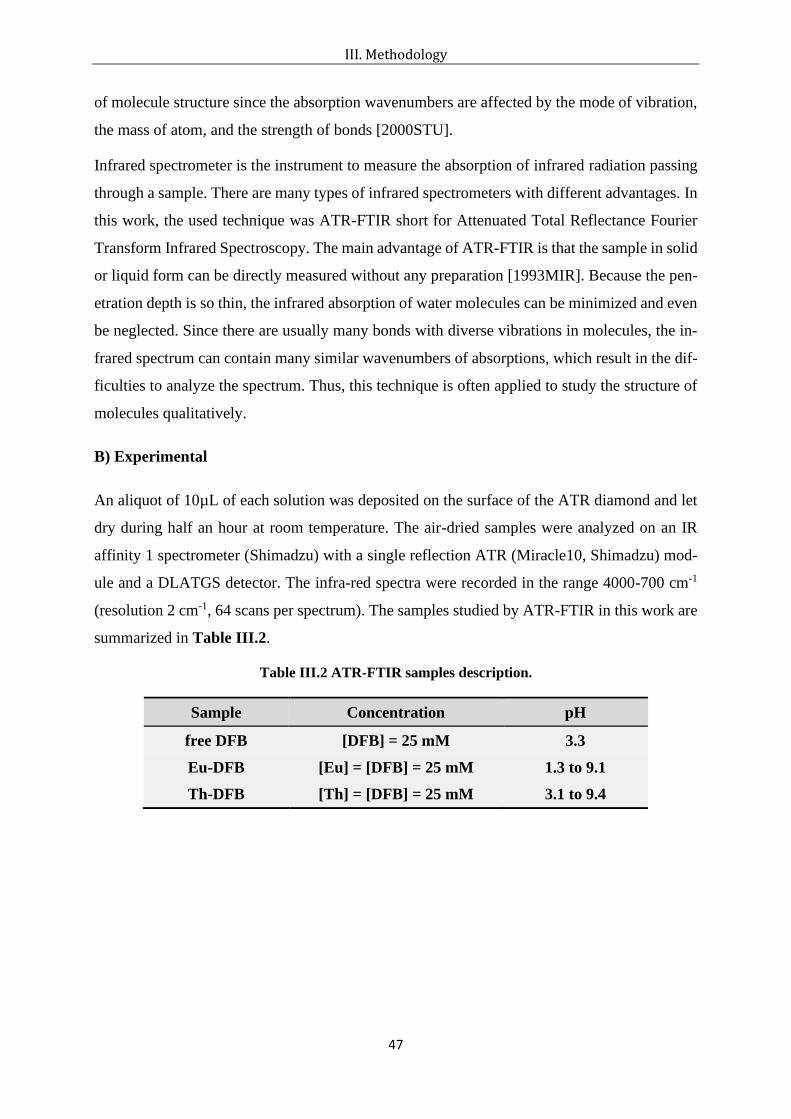
III. Methodology
47
of molecule structure since the absorption wavenumbers are affected by the mode of vibration,
the mass of atom, and the strength of bonds [2000STU].
Infrared spectrometer is the instrument to measure the absorption of infrared radiation passing
through a sample. There are many types of infrared spectrometers with different advantages. In
this work, the used technique was ATR-FTIR short for Attenuated Total Reflectance Fourier
Transform Infrared Spectroscopy. The main advantage of ATR-FTIR is that the sample in solid
or liquid form can be directly measured without any preparation [1993MIR]. Because the pen-
etration depth is so thin, the infrared absorption of water molecules can be minimized and even
be neglected. Since there are usually many bonds with diverse vibrations in molecules, the in-
frared spectrum can contain many similar wavenumbers of absorptions, which result in the dif-
ficulties to analyze the spectrum. Thus, this technique is often applied to study the structure of
molecules qualitatively.
B) Experimental
An aliquot of 10µL of each solution was deposited on the surface of the ATR diamond and let
dry during half an hour at room temperature. The air-dried samples were analyzed on an IR
affinity 1 spectrometer (Shimadzu) with a single reflection ATR (Miracle10, Shimadzu) mod-
ule and a DLATGS detector. The infra-red spectra were recorded in the range 4000-700 cm-1
(resolution 2 cm-1, 64 scans per spectrum). The samples studied by ATR-FTIR in this work are
summarized in Table III.2.
Table III.2 ATR-FTIR samples description.
Sample Concentration pH
free DFB [DFB] = 25 mM 3.3
Eu-DFB [Eu] = [DFB] = 25 mM 1.3 to 9.1
Th-DFB [Th] = [DFB] = 25 mM 3.1 to 9.4

III. Methodology
48
III.2.2 X-ray absorption spectroscopy
A) Principle
X-ray absorption spectroscopy (XAS) refers to absorption spectroscopy in X-ray spectral region
with energies ranging approximately from 500 eV to 500 keV (wavelength from 0.25 Å to 25
Å).
This is a powerful technique using synchrotron radiation and based on photoelectric effect.
XAS analysis provides information on the electronic properties (oxidation states) of an absorb-
ing atom, as well as, its local structural information (bond distances, neighboring atoms, coor-
dination number).
An incident X-ray photon is absorbed by an atom leading to the excitation or ejection of a core
electron. The photoelectron ejected can be considered as a wave emitted in all directions. This
wave can then be scattered by nearby atoms, returning to the absorbing atom. It can influence
the density of electrons and affect the absorption coefficient μ. Thus, as shown in Figure III.5,
if we suppose there would be no neighboring atom, the absorption spectrum should be the blue
ones. However, in fact, with the existence of neighboring atoms, the scattered photoelectrons
can modulate the amplitude of new-created photoelectron wave-function at the absorbing X-
ray atom and the actual absorption spectrum should be the red ones.
Electronic and structural information are obtained from the absorption spectrum (Figure III.5).
This spectrum can be divided in two parts: the XANES and the EXAFS oscillations. The pre-
edge and edge correspond to the XANES spectrum (X-ray Absorption Near Edge Structure).
This part of the spectrum allows to access to the charge of the absorbing atom. The oscillations
correspond to the EXAFS part of the spectrum (Extended X-ray absorption fine structure).
Those oscillations are from interferences that can be constructive or destructive between the
original wave and the scattered waves from the nearby atoms. The study of the EXAFS spec-
trum is essential to obtain information on the local structure around the absorbing atom.
XAS is often used to study the speciation of actinides. This is an element specific technique
that can be performed at large concentration range (down to 10-5 M). Generally, analyses are
performed at mM range. Moreover, XAS analyses may be carried out on different sample type
such as gas, solutions, amorphous solid, crystalline solid.

III. Methodology
49
Figure III.5 Principle of EXAFS.
XAS analysis has been used to study the local structure of thorium(IV) and uranium(IV) in the
Th(IV)-DFB and U(IV)-DFB complexes. Measurements were performed at the thorium and
uranium LIII edge corresponding to the excitation of 2p3/2 electrons to unfilled d orbitals.
B) Experimental
The samples studied by EXAFS are summarized in Table III.3.
Table III.3 Description of EXAFS samples.
Sample Concentration pH Edge
Th(IV)-DFB [Th] = 5 mM
5 LIII (16 300 eV) [DFB] = 6 mM
U(IV)-DFB [U] = 5 mM
5 LIII (17 166 eV) [DFB] = 6 mM
XAS at the thorium LIII edge (16300 eV) and uranium LIII edge (17 166 eV) were conducted on
the MARS beamline of the SOLEIL synchrotron facility. The monochromator was set with the
Si(220) crystal and the mirrors with the Pt strips. The optics of the beamline consist of a water-
cooled double-crystal monochromator (FMB Oxford), used to select the incident energy of the
X-ray beam and for horizontal focalization, and two large water-cooled reflecting mirrors (IRE-
LEC/SESO) that are used for rejecting the harmonics at high energy and vertical collimation
and focalization. Energy calibrations were conducted at the Y K edge at 17038 eV. EXAFS
measurements were conducted in fluorescence mode using a 13-element high purity germanium
detector (ORTEC). Due to the possibility of redox reactions under large photon flux, XANES

III. Methodology
50
of the uranium(IV) solutions were monitoring over time to verify the oxidation states (+IV and
+VI). The multiple scattering around 15 eV above the edge, featuring the presence of the trans-
dioxo from U(VI) was not observed during the acquisition.
Data processing was carried out using the Athena code [2005RAV]. The Eo energy was identi-
fied at the first inflection point. Fourier transformation (FT) in k3 was performed between 2.8
and 14 Å-1 with Hanning windows using the ARTEMIS code [2005RAV]. Spectral noise was
calculated using the CHEROKEE code [2009MIC] [2013MIC] by using the Fourier back trans-
form filter above 6 Å corresponding to the noise spectrum. The r factor (%) and the quality
factor (QF, reduced χ²) of the fits were provided from ARTEMIS. Phases and amplitudes were
calculated using the FEFF9 simulation code [2010REH] using the model structures obtained by
the DFT computational method as described in the dedicated section. Three simple scattering
paths were included in the fit. The first two simple paths corresponded to oxygen atom scatter-
ing, differentiating oxygen atoms from the hydroxamate groups, Th-ON/C, and oxygen atoms
from water molecules, Th-Owat. The last path corresponds to carbon and nitrogen (Th···C/N)
atoms scattering from the hydroxamate groups.

III. Methodology
51
III.3 Stock solution preparations of tetravalent acti-
nides
III.3.1 Preparation of 227Th(IV) stock solution
The isotope 227Th is one of the decay products of 231Pa. During the purification of 231Pa from
its daughters, performed by anion exchange chromatography in HCl medium, the isotopes that
were not fixed on the resin (227Ac, 227Th, 223Ra) have been stored for several years [1956KRA]
[2005LEN]. Since the solution of daughters still contains a small amount of 231Pa, an additional
purification was carried out in order to completely remove protactinium. This solution in 10 M
HCl was transferred to a column filled with the macroporous anion exchanger Bio-Rad AG-
MP1 (100-200 mesh). Then fresh solution of 10 M HCl was percolated on the column until
227Th was no longer detected by γ-spectrometry. Finally, the residual 231Pa was eluted with 10
M HCl / 1 M HF.
The progress of the purification was monitored by analysis each fraction (500 µL) by γ-spec-
trometry as illustrated in Figure III.6. The elution histogram (Figure III.6 upper) shows that
purified 227Th is obtained in the first 4 mL of 10 M HCl. Gamma spectra of the 227Th and 231Pa
fractions are illustrated in Figure III.6 lower. Obviously, the 227Th fraction does not contain
231Pa: the three characteristic peaks of 231Pa located at 284.4, 300.8 and 303.5 keV are not ob-
served. But the 227Th fractions still contains 231Pa daughters: 223Ra at 155.2 and 270.4 keV, 211Bi
at 351.9 keV and probably 227Ac. The isotope 227Ac cannot be observed (no γ emission).
The hydrochloric solution of 227Th was evaporated to dryness for medium change. The mother
solution was prepared in 4 M HClO4; at the time of its use, the 227Th concentration was 4.5
10-8 M.
Just prior to liquid-liquid extraction experiments, an aliquot of 227Th mother solution (10 to 50
µL) was evaporated to dryness in a PTFE crucible and the residue taken up in 0.1 M HClO4.
Depending on the pCH value used in experiments, an additional dilution was carried out. The
amount of Bi and Ra isotopes was too low to be detected by γ-spectrometry after distribution
between organic and aqueous phases.

III. Methodology
52
150 200 250 300 350
211Bi
223Ra
227Th
231Pa
Co
un
ts
Energy (keV)
Largest Fraction of 227
Th
Largest Fraction of 231
Pa
227Th
223Ra
Figure III.6 Percentage of 227Th and 231Pa in each fraction (upper) and the gamma spectra of
largest fraction of 227Th and 231Pa (lower).

III. Methodology
53
III.3.2 Preparation of U(IV) stock solution
A piece of the uranium metal was washed successively with acetone, concentrated nitric acid
and water, allowing the color of U piece to change from black to silver. Then it was quickly
contacted with ~12 M HCl to initialize the reaction and transfer to a beaker containing HCl at
about 2 M. The dissolution solution was centrifuged in order to eliminate the black solid residue.
The obtained U(IV) solution was characterized using PERALS (for determination of U concen-
tration) and acid-base titration (for determination of HCl concentration. The (IV) stock solution
is stored in a freezer compartment.
PERALS analysis has been performed by using ALPHAEX scintillation cocktail. An aliquot of
U(IV) solution was first oxidized in U(VI) by H2O2 and diluted in 0.5 M HNO3 in order to get
quantitative extraction of U(VI) [1997DAC]. The spectrum presented in Figure III.7 exhibits
two peaks: one associated to 238U, and the other to 234U, isotope in secular equilibrium with
238U. A deconvolution was carried out to determine the activity due to 238U. The analysis, car-
ried out four times, has led to:
𝐶𝑈 = 0.190 ± 0.007 𝑀
100 200 300 400
0
100
200
300
400
234U
Co
un
ts
Chanel
Experimental
Fit Peak 1
Fit Peak 2
Cumulative Fit Peak238
U
Figure III.7 α liquid scintillation spectrum of an aliquot of the mother solution of U(IV).
The determination of the proton concentration was conducted by titration with NaOH, after
addition of DTPA in order to avoid hydrolysis and precipitation of U(IV) [1968CAR]. The
titration, performed 3 times, led to:
𝐶𝐻𝐶𝑙 = 1.6 ± 0.1 𝑀

III. Methodology
54
III.4 Summary
This chapter was devoted to the presentation of the methodology used for the investigation of
the complexation of tri- and tetra-valent actinides with hydroxamates. The techniques used for
the thermodynamic study are liquid-liquid extraction with element at tracer scale, UV-visible
absorption spectrophotometry and affinity capillary electrophoresis. For the structural study,
ATR-FTIR and X-ray absorption spectroscopies combined with DFT calculations are going to
be used. The principle of each technique and its implementation have been described in this
part, as well as the preparation of stock solution of 227Th and U(IV). The applied techniques
and experimental conditions of each system in this work are summarized in Table III.4.
Table III.4 Applied techniques and experimental conditions of each system in this work.
Technique CM, Molar Metal CL, Molar Ligand Condition
LLE 10-8 152Eu(III) 0 to 0.07 DFB T = 25 °C
10-12 227Th(IV) 0 to 0.07 DFB I = 0.7 M
(Na, HClO4)
SP
6×10⁻³ Pr(III) 0 to 5.6×10⁻² DFB T ≈ 20 °C
(uncontrolled)
10-2 Eu(III) 0 to 5.6×10⁻² DFB I = 0.7 M
(Na, HClO4)
4.8×10⁻³ U(IV) 0 to 5×10⁻² BHA T = 25 °C
I = 0.5 M (HCl) 9.6×10⁻³ U(IV) 0 to 0.8 AHA
9.6×10⁻³ U(IV) 0 to 2×10⁻² DFB
ACE 0 to 4.5×10⁻² La(III) 10-4 DFB T = 25 °C
0 to 4.5×10⁻² Lu(III) 10-4 DFB I = 0.5 M
(Na, HClO4)
IR 2.5×10⁻² Eu(III) 0 to 2.5×10⁻² DFB T = 25 °C
2.5×10⁻² Th(IV) 0 to 2.5×10⁻² DFB I ≈ 0.2 M
(uncontrolled)
EXAFS 5×10⁻³ U(IV) 0 to 6×10⁻³ DFB T = 25 °C
5×10⁻³ Th(IV) 0 to 6×10⁻³ DFB I ≈ 0.06 M
(uncontrolled)
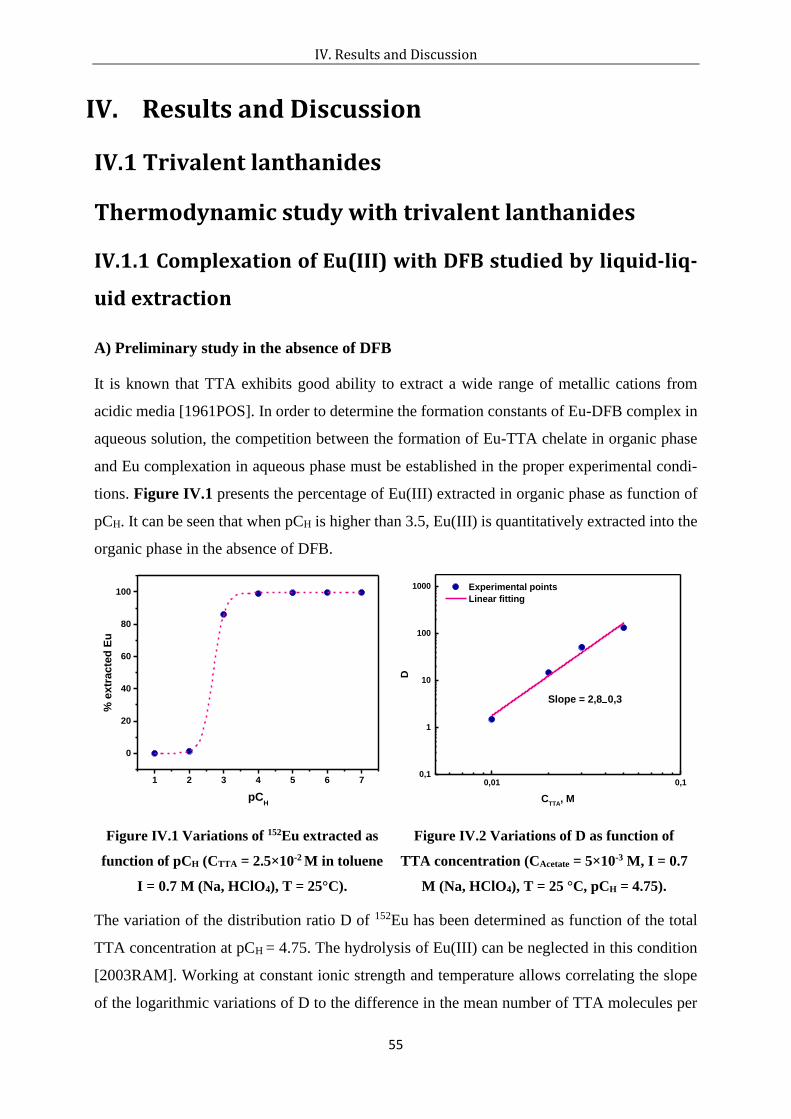
IV. Results and Discussion
55
IV. Results and Discussion
IV.1 Trivalent lanthanides
Thermodynamic study with trivalent lanthanides
IV.1.1 Complexation of Eu(III) with DFB studied by liquid-liq-
uid extraction
A) Preliminary study in the absence of DFB
It is known that TTA exhibits good ability to extract a wide range of metallic cations from
acidic media [1961POS]. In order to determine the formation constants of Eu-DFB complex in
aqueous solution, the competition between the formation of Eu-TTA chelate in organic phase
and Eu complexation in aqueous phase must be established in the proper experimental condi-
tions. Figure IV.1 presents the percentage of Eu(III) extracted in organic phase as function of
pCH. It can be seen that when pCH is higher than 3.5, Eu(III) is quantitatively extracted into the
organic phase in the absence of DFB.
1 2 3 4 5 6 7
0
20
40
60
80
100
% e
xtr
ac
ted
Eu
pCH
0,01 0,10,1
1
10
100
1000 Experimental points
Linear fitting
D
CTTA
, M
Slope = 2,8 0,3
Figure IV.1 Variations of 152Eu extracted as
function of pCH (CTTA = 2.5×10⁻² M in toluene
I = 0.7 M (Na, HClO4), T = 25°C).
Figure IV.2 Variations of D as function of
TTA concentration (CAcetate = 5×10⁻³ M, I = 0.7
M (Na, HClO4), T = 25 °C, pCH = 4.75).
The variation of the distribution ratio D of 152Eu has been determined as function of the total
TTA concentration at pCH = 4.75. The hydrolysis of Eu(III) can be neglected in this condition
[2003RAM]. Working at constant ionic strength and temperature allows correlating the slope
of the logarithmic variations of D to the difference in the mean number of TTA molecules per

IV. Results and Discussion
56
Eu atom between species in organic and aqueous phase. The variations in Figure IV.2 lead to
a slope equal to 2.8 ± 0.3. As mentioned in the literature [1970IKE] [1989MOH], the slope
decreases with increasing pH due to the formation of TTA complex in aqueous phase. The
extraction equilibrium in the system can be described as:
𝐸𝑢3+ + 3𝐻𝑇𝑇𝐴̅̅ ̅̅ ̅̅ ̅̅ 𝐾𝑒𝑥↔ 𝐸𝑢(𝑇𝑇𝐴)̅̅ ̅̅ ̅̅ ̅̅ ̅̅ ̅̅
3 + 3𝐻+ IV.1
B) Determination of conditional stability constants Kcond
Figure IV.3 presents the variation of distribution ratio (D) of 152Eu as function of DFB concen-
tration for different values of pCH. Error bars do not appear in Figure IV.3 since they have the
same size of the experimental points.
1E-9 1E-8 1E-7 1E-6 1E-5 1E-4 0,001 0,01 0,1 1
0,1
1
10
100
pCH = 4.75
pCH = 4.6
pCH = 4.2
D
CDFB
, M
Slope = -1
0,00 0,01 0,02 0,03 0,04 0,05 0,06 0,070
2
4
6
8
10
12
14
y=192x+5,12
R2=0,993
Experimental points
Linear fittingD
0/D
-1
CDFB
, M
Figure IV.3 Variations of D as function of
DFB concentration at different pCH (CTTA =
2.5×10⁻² M, I = 0.7 M (Na, HClO4), T = 25 °C,
CAcetate = 5×10⁻³ M).
Figure IV.4 Variations of D0/D-1 as function
of DFB concentration (CAcetate = 5×10⁻³ M, I =
0.7 M (Na, HClO4), T = 25°C, pCH = 4.75).
The values corresponding to CDFB = 0 (D0) have been arbitrarily drawn at CDFB = 10-8 M. What-
ever the acidity, the extraction curves display the same general shape: a plateau is first observed
at low DFB concentration. Then the D values decrease with the increase in DFB concentration,
reflecting the formation of complex in aqueous phase. The slope of the logarithmic variations
of D indicates that the maximum stoichiometry of the complex is one according to Equation
III.3. Thus, the equilibrium in the system can be described as:
𝐸𝑢(𝐼𝐼𝐼) + 𝐷𝐹𝐵𝐾𝑐𝑜𝑛𝑑↔ 𝐸𝑢 − 𝐷𝐹𝐵 IV.2
𝐾𝑐𝑜𝑛𝑑 =[𝐸𝑢 − 𝐷𝐹𝐵]
[𝐸𝑢(𝐼𝐼𝐼)][𝐷𝐹𝐵] IV.3
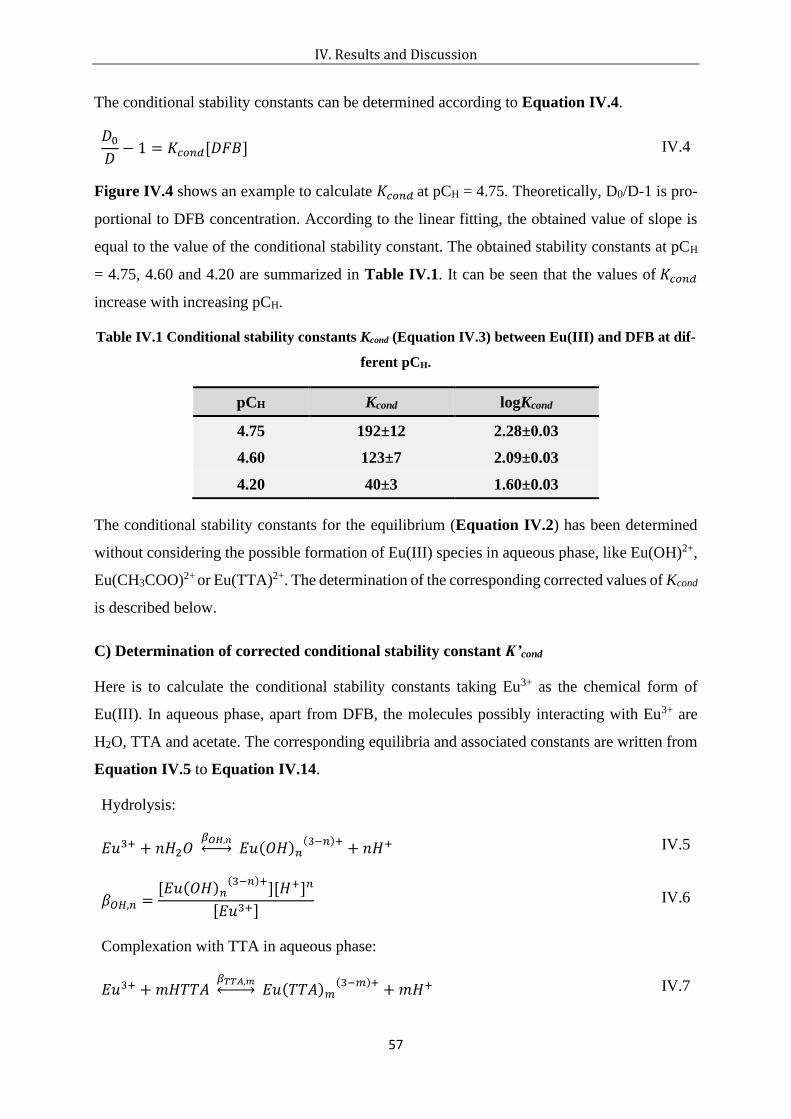
IV. Results and Discussion
57
The conditional stability constants can be determined according to Equation IV.4.
𝐷0𝐷− 1 = 𝐾𝑐𝑜𝑛𝑑[𝐷𝐹𝐵] IV.4
Figure IV.4 shows an example to calculate 𝐾𝑐𝑜𝑛𝑑 at pCH = 4.75. Theoretically, D0/D-1 is pro-
portional to DFB concentration. According to the linear fitting, the obtained value of slope is
equal to the value of the conditional stability constant. The obtained stability constants at pCH
= 4.75, 4.60 and 4.20 are summarized in Table IV.1. It can be seen that the values of 𝐾𝑐𝑜𝑛𝑑
increase with increasing pCH.
Table IV.1 Conditional stability constants Kcond (Equation IV.3) between Eu(III) and DFB at dif-
ferent pCH.
pCH Kcond logKcond
4.75 192±12 2.28±0.03
4.60 123±7 2.09±0.03
4.20 40±3 1.60±0.03
The conditional stability constants for the equilibrium (Equation IV.2) has been determined
without considering the possible formation of Eu(III) species in aqueous phase, like Eu(OH)2+,
Eu(CH3COO)2+ or Eu(TTA)2+. The determination of the corresponding corrected values of Kcond
is described below.
C) Determination of corrected conditional stability constant K’cond
Here is to calculate the conditional stability constants taking Eu3+ as the chemical form of
Eu(III). In aqueous phase, apart from DFB, the molecules possibly interacting with Eu3+ are
H2O, TTA and acetate. The corresponding equilibria and associated constants are written from
Equation IV.5 to Equation IV.14.
Hydrolysis:
𝐸𝑢3+ + 𝑛𝐻2𝑂 𝛽𝑂𝐻,𝑛↔ 𝐸𝑢(𝑂𝐻)𝑛
(3−𝑛)++ 𝑛𝐻+ IV.5
𝛽𝑂𝐻,𝑛 =[𝐸𝑢(𝑂𝐻)𝑛
(3−𝑛)+][𝐻+]𝑛
[𝐸𝑢3+] IV.6
Complexation with TTA in aqueous phase:
𝐸𝑢3+ +𝑚𝐻𝑇𝑇𝐴 𝛽𝑇𝑇𝐴,𝑚↔ 𝐸𝑢(𝑇𝑇𝐴)𝑚
(3−𝑚)++𝑚𝐻+ IV.7

IV. Results and Discussion
58
𝛽𝑇𝑇𝐴,𝑚 =[𝐸𝑢(𝑇𝑇𝐴)𝑚
(3−𝑚)+][𝐻+]𝑚
[𝐸𝑢3+][𝐻𝑇𝑇𝐴]𝑚 IV.8
Complexation with acetate:
𝐸𝑢3+ + 𝑖𝐶𝐻3𝐶𝑂𝑂𝐻 𝛽𝑎𝑐𝑒𝑡𝑎𝑡𝑒,𝑖↔ 𝐸𝑢(𝐶𝐻3𝐶𝑂𝑂)𝑖
(3−𝑖)++ 𝑖𝐻+ IV.9
𝛽𝑎𝑐𝑒𝑡𝑎𝑡𝑒,𝑖 =[𝐸𝑢(𝐶𝐻3𝐶𝑂𝑂)𝑖
(3−𝑖)+][𝐻+]𝑖
[𝐸𝑢3+][𝐶𝐻3𝐶𝑂𝑂𝐻]𝑖 IV.10
By definition, the corrected conditional stability constants K’cond correspond to:
𝐸𝑢3+ + 𝐷𝐹𝐵 𝐾𝑐𝑜𝑛𝑑′
↔ 𝐸𝑢 − 𝐷𝐹𝐵 IV.11
𝐾𝑐𝑜𝑛𝑑′ =
[𝐸𝑢 − 𝐷𝐹𝐵]
[𝐸𝑢3+][𝐷𝐹𝐵] IV.12
The distribution equilibrium of Eu3+ is described as:
𝐸𝑢3+ + 3𝐻𝑇𝑇𝐴̅̅ ̅̅ ̅̅ ̅̅ 𝐾𝑒𝑥↔ 𝐸𝑢(𝑇𝑇𝐴)̅̅ ̅̅ ̅̅ ̅̅ ̅̅ ̅̅
3 + 3𝐻+ IV.13
𝐾𝑒𝑥 =[𝐸𝑢(𝑇𝑇𝐴)̅̅ ̅̅ ̅̅ ̅̅ ̅̅ ̅̅
3][𝐻+]3
[𝐸𝑢3+][𝐻𝑇𝑇𝐴̅̅ ̅̅ ̅̅ ̅̅ ]3 IV.14
In the absence of DFB, D0 can be expressed as:
𝐷0 =[𝐸𝑢(𝑇𝑇𝐴)̅̅ ̅̅ ̅̅ ̅̅ ̅̅ ̅̅
3]
[𝐸𝑢3+] + ∑[𝐸 𝑢(𝑇𝑇𝐴)𝑚(3−𝑚)+
] + ∑[𝐸 𝑢(𝐶𝐻3𝐶𝑂𝑂)𝑖(3−𝑖)+
] + ∑[𝐸𝑢(𝑂𝐻)𝑛(3−𝑛)+
]
=𝐾𝑒𝑥[𝐻𝑇𝑇𝐴̅̅ ̅̅ ̅̅ ̅̅ ]3[𝐻+]−3
1 + ∑𝛽𝑇𝑇𝐴,𝑚[𝐻𝑇𝑇𝐴]𝑚[𝐻+]−𝑚 + ∑𝛽𝑎𝑐𝑒𝑡𝑎𝑡𝑒,𝑖[𝐶𝐻3𝐶𝑂𝑂𝐻]𝑖[𝐻+]−𝑖 + ∑𝛽𝑂𝐻,𝑛[𝐻+]−𝑛
In the presence of DFB, D can be expressed as:
𝐷 =
[𝐸𝑢(𝑇𝑇𝐴)̅̅ ̅̅ ̅̅ ̅̅ ̅̅ ̅̅3]
[𝐸𝑢3+] + ∑[𝐸 𝑢(𝑇𝑇𝐴)𝑚(3−𝑚)+
] + ∑[𝐸𝑢(𝐶𝐻3𝐶𝑂𝑂)𝑖(3−𝑖)+
] + ∑[𝐸𝑢(𝑂𝐻)𝑛(3−𝑛)+
] + [𝐸𝑢 − 𝐷𝐹𝐵]
=𝐾𝑒𝑥[𝐻𝑇𝑇𝐴̅̅ ̅̅ ̅̅ ̅̅ ]3[𝐻+]−3
1 + ∑𝛽𝑇𝑇𝐴,𝑚[𝐻𝑇𝑇𝐴]𝑚[𝐻+]−𝑚 +∑𝛽𝑎𝑐𝑒𝑡𝑎𝑡𝑒,𝑖[𝐶𝐻3𝐶𝑂𝑂𝐻]𝑖[𝐻+]−𝑖 + ∑𝛽𝑂𝐻,𝑛[𝐻+]−𝑛 + 𝐾𝑐𝑜𝑛𝑑′ [𝐷𝐹𝐵]
Thus,

IV. Results and Discussion
59
𝐷0𝐷− 1
=𝐾𝑐𝑜𝑛𝑑′ [𝐷𝐹𝐵]
1 + ∑𝛽𝑇𝑇𝐴,𝑚[𝐻𝑇𝑇𝐴]𝑚[𝐻+]−𝑚 + ∑𝛽𝑎𝑐𝑒𝑡𝑎𝑡𝑒,𝑖[𝐶𝐻3𝐶𝑂𝑂𝐻]𝑖[𝐻+]−𝑖 + ∑𝛽𝑂𝐻,𝑛[𝐻+]−𝑛
𝐾𝑐𝑜𝑛𝑑′ = 𝐾𝑐𝑜𝑛𝑑 × (1 +∑𝛽𝑇𝑇𝐴,𝑚[𝐻𝑇𝑇𝐴]
𝑚[𝐻+]−𝑚
+∑𝛽𝑎𝑐𝑒𝑡𝑎𝑡𝑒,𝑖[𝐶𝐻3𝐶𝑂𝑂𝐻]𝑖[𝐻+]−𝑖 +∑𝛽𝑂𝐻,𝑛[𝐻
+]−𝑛)
IV.15
In order to determine the stability constants for the equilibrium (Equation IV.11), 𝛽𝑂𝐻,𝑛 ,
𝛽𝑇𝑇𝐴,𝑚 and 𝛽𝑎𝑐𝑒𝑡𝑎𝑡𝑒,𝑖 can be used to correct the value of 𝐾𝑐𝑜𝑛𝑑 by Equation IV.15. However,
the unique values of 𝛽𝑇𝑇𝐴,𝑚 are found to be incorrect in the literature [1970IKE]. Thus, only
𝛽𝑂𝐻,𝑛 = −8.06 ± 0.08 and 𝐾𝑎𝑐𝑒𝑡𝑎𝑡𝑒,1 = 1.97 ± 0.03, 𝐾𝑎𝑐𝑒𝑡𝑎𝑡𝑒,2 = 1.41 ± 0.04 (pKa = 4.76)
were applied to calculate 𝐾𝑐𝑜𝑛𝑑′ [2003RAM] [2006KIT]. The calculated values of conditional
stability constants are shown in Table IV.2. During the calculation, considering the hydrolysis
of Eu(III) does not influence the speciation of Eu(III) in this pCH domain, but the presence of
acetate changes the species distribution of Eu(III) in aqueous phase and further makes the con-
stants decreased.
Table IV.2 Corrected conditional stability constants logK'cond (Equation IV.12) between Eu3+ and
DFB at different pCH and comparison with logKcond (Equation IV.3).
pCH logKcond logK'cond
4.75 2.28±0.03 2.5±0.1
4.6 2.09±0.03 2.2±0.1
4.2 1.60±0.03 1.7±0.1
D) Determination of apparent constant Ky
In the pH domain from 4 to 5, the predominant species of DFB is H4DFB+ (see Figure II.12)
and the complexation is expected to occur by the departure of at least one proton of hydrox-
amate group DFB to form a bond with Eu. Thus, it has been supposed that the overall equilib-
rium for the 1:1 complex can be described as:
𝐸𝑢3+ + 𝐻4𝐷𝐹𝐵+ 𝐾𝑦↔ 𝐸𝑢(𝐻4−𝑦𝐷𝐹𝐵)
(4−𝑦)++ 𝑦𝐻+ IV.16
with 𝐾𝑦 = [𝐸𝑢(𝐻4−𝑦𝐷𝐹𝐵)(4−𝑦)+
][𝐻+]𝑦 [𝐸𝑢3+][𝐻4𝐷𝐹𝐵+]⁄ IV.17

IV. Results and Discussion
60
where y means the average number of ligand deprotonations occurring during the formation of
Eu-DFB complex. It must be emphasized that although there are four possible deprotonations
of ligand H4DFB+, in fact just three hydrogens of hydroxamate groups can be replaced by
Eu(III), which means the maximum value of y is three in the equilibrium. Thus, Equation IV.17
can be written as:
𝑙𝑜𝑔𝐾𝑦 = 𝑙𝑜𝑔[𝐸𝑢(𝐻4−𝑦𝐷𝐹𝐵)(4−𝑦)+
] [𝐸𝑢3+][𝐻4𝐷𝐹𝐵+]⁄ + 𝑦𝑙𝑜𝑔[𝐻+] IV.18
Using Equation IV.12, the following relationship is obtained:
𝐾𝑐𝑜𝑛𝑑′ = [𝐸𝑢 − 𝐷𝐹𝐵]/[𝐸𝑢3+][𝐷𝐹𝐵] IV.19
Thus,
𝑙𝑜𝑔𝐾𝑐𝑜𝑛𝑑′ = 𝑙𝑜𝑔𝐾𝑦 − 𝑦𝑙𝑜𝑔[𝐻
+] IV.20
Figure IV.5 presents the variations of log K'cond as function of pCH. The linear fitting of the
data, according to Equation IV.20, leads to y = 1.4 ± 0.1. It means two types of Eu-DFB com-
plex are formed in the system. The corresponding equilibrium is shown below.
4,0 4,2 4,4 4,6 4,8 5,01,4
1,6
1,8
2,0
2,2
2,4
2,6
2,8
Experimental values
Linear fitting
log
K' c
on
d
pCH
Slope = 1.4 0.1
R2 = 0.99
Figure IV.5 Variations of logK'cond as function of pCH.
𝐸𝑢3+ + 𝐻4𝐷𝐹𝐵+ 𝐾1↔ 𝐸𝑢(𝐻3𝐷𝐹𝐵)
3+ + 𝐻+ IV.21
with 𝐾1 = [𝐸𝑢(𝐻3𝐷𝐹𝐵)3+][𝐻+] [𝐸𝑢3+][𝐻4𝐷𝐹𝐵
+]⁄ IV.22
𝐸𝑢3+ + 𝐻4𝐷𝐹𝐵+ 𝐾2↔ 𝐸𝑢(𝐻2𝐷𝐹𝐵)
2+ + 2𝐻+ IV.23
with 𝐾2 = [𝐸𝑢(𝐻2𝐷𝐹𝐵)2+][𝐻+]2 [𝐸𝑢3+][𝐻4𝐷𝐹𝐵
+]⁄ IV.24
Thus,
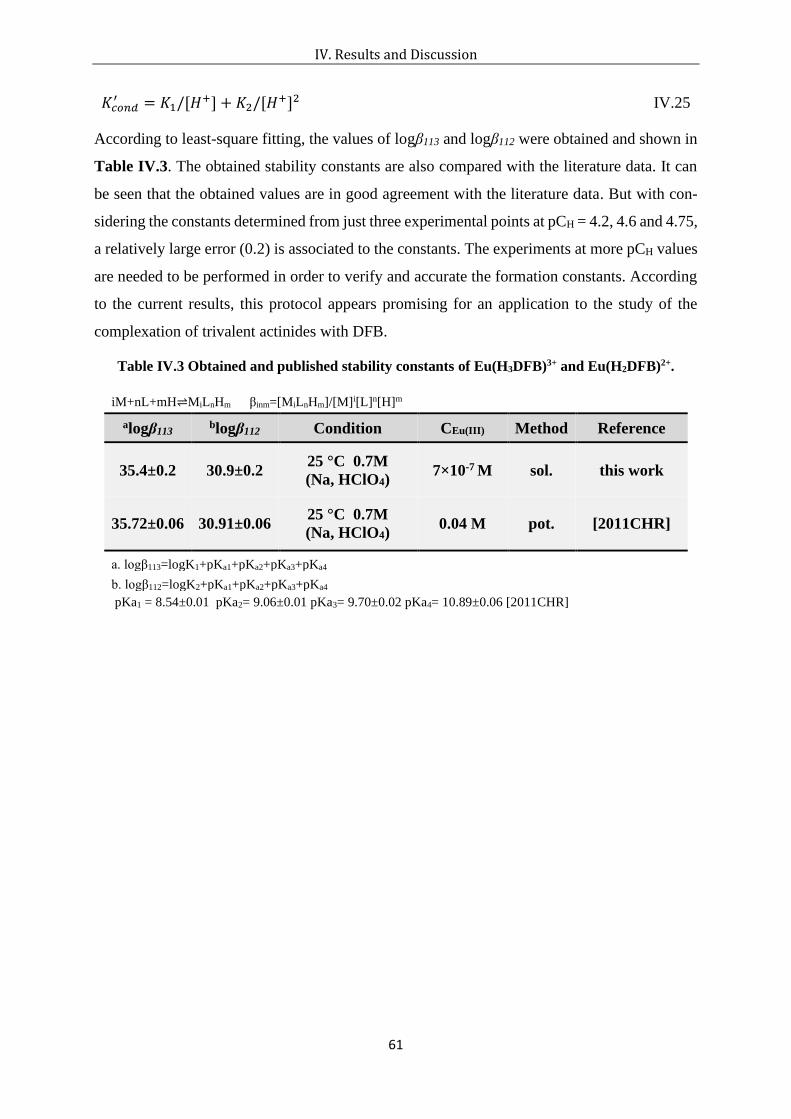
IV. Results and Discussion
61
𝐾𝑐𝑜𝑛𝑑′ = 𝐾1/[𝐻
+] + 𝐾2/[𝐻+]2 IV.25
According to least-square fitting, the values of logβ113 and logβ112 were obtained and shown in
Table IV.3. The obtained stability constants are also compared with the literature data. It can
be seen that the obtained values are in good agreement with the literature data. But with con-
sidering the constants determined from just three experimental points at pCH = 4.2, 4.6 and 4.75,
a relatively large error (0.2) is associated to the constants. The experiments at more pCH values
are needed to be performed in order to verify and accurate the formation constants. According
to the current results, this protocol appears promising for an application to the study of the
complexation of trivalent actinides with DFB.
Table IV.3 Obtained and published stability constants of Eu(H3DFB)3+ and Eu(H2DFB)2+.
iM+nL+mH⇌MiLnHm βinm=[MiLnHm]/[M]i[L]n[H]m
alogβ113 blogβ112 Condition CEu(III) Method Reference
35.4±0.2 30.9±0.2 25 °C 0.7M
(Na, HClO4) 7×10⁻⁷ M sol. this work
35.72±0.06 30.91±0.06 25 °C 0.7M
(Na, HClO4) 0.04 M pot. [2011CHR]
a. logβ113=logK1+pKa1+pKa2+pKa3+pKa4 b. logβ112=logK2+pKa1+pKa2+pKa3+pKa4 pKa1 = 8.54±0.01 pKa2= 9.06±0.01 pKa3= 9.70±0.02 pKa4= 10.89±0.06 [2011CHR]

IV. Results and Discussion
62
IV.1.2 Complexation of Ln(III) with DFB studied by UV-visible
spectrophotometry
The interaction of Eu(III) and Pr(III) with DFB has been studied by UV-visible absorption
spectrophotometry. Eu(III) and Pr(III) have been selected because they possess high molar ab-
sorption coefficient in UV-visible range.
First, the validity of Beer-Lambert law relative to Eu(III) and Pr(III) was checked: absorption
spectra have been registered at ambient temperature, pH = 4.0, I = 0.5 M with 10-3 M ≤ CEu ≤
4×10⁻² M and 6×10⁻⁴ M ≤ CPr ≤ 6×10⁻³ M. Figure IV.6 and Figure IV.7 presents the corre-
sponding absorption spectra. The absorption bands of DFB appear at the wavelength lower than
300 nm (Figure A. 5), which does not interfere with the absorbance of Eu(III) or Pr(III).
350 360 370 380 390 400 410
0,00
0,02
0,04
0,06
0,08
0,10
ab
so
rban
ce
Wavelength, nm
CEu(III)
= 0.001 M
CEu(III)
= 0.005 M
CEu(III)
= 0.02 M
CEu(III)
= 0.04 M
CEu(III)
= 0.01 M
420 430 440 450 460 470 480 490 500
0,00
0,02
0,04
0,06
Ab
so
rban
ce
Wavelength, nm
CPr(III)
= 0.0006 M
CPr(III)
= 0.0012 M
CPr(III)
= 0.0018 M
CPr(III)
= 0.0024 M
CPr(III)
= 0.0030 M
CPr(III)
= 0.0048 M
CPr(III)
= 0.0060 M
Figure IV.6 Absorption spectra of Eu(III) at
different concentrations (pH = 4.0 and I = 0.5
M (Na, HClO4)).
Figure IV.7 Absorption spectra of Pr(III) at
different concentrations (pH = 4.0 and I = 0.5
M (Na, HClO4)).
For Eu(III), the absorption maximum has been determined at 394 nm, and for Pr(III), at 444
nm. Figure IV.8 and Figure IV.9 present the experimental variations of Eu(III) and Pr(III)
absorbance with their concentration and their associated linear fittings. Whatever the element,
Beer-Lambert law appears to be valid over the investigated concentration range. The extinction
coefficient of Eu(NO3)3 at 394 nm and Pr(NO3)3 at 444 nm are calculated to be 2.2 ± 0.2 and
9.2 ± 0.3 M-1cm-1, respectively.

IV. Results and Discussion
63
0,00 0,01 0,02 0,03 0,04
0,00
0,02
0,04
0,06
0,08
0,10
Experimental points
Linear fitting
Ab
so
rba
nc
e
CEu(III)
, M
y=2,18x+0,004
R2=0,996
0,000 0,001 0,002 0,003 0,004 0,005 0,006
0,00
0,01
0,02
0,03
0,04
0,05
0,06
Experimental points
Linear fitting
Ab
so
rba
nc
e
CPr(III)
, M
y=9,246x-0,001
R2=0,998
Figure IV.8 Test of Lambert-Beer Law of
Eu(III) at the concentration ranging from 10-3
to 4×10⁻² M at pH = 4.0 and I = 0.5 M (Na,
HClO4) at the wavelength of 394 nm.
Figure IV.9 Test of Lambert-Beer Law of
Pr(III) at the concentration ranging from
6×10⁻⁴ M to 6×10⁻³ M at pH = 4.0 and I = 0.5
M (H, NaClO4) at the wavelength of 444 nm.
Experiments in the presence of DFB have been performed at pH = 3.7 and 4.5 in the case of
Eu(III), and at pH = 4.6 and 5.5 for Pr(III). The metal concentration was fixed at 10-2 M and
6×10⁻³ M for Eu(III) and Pr(III), respectively. DFB concentration was varied from 0 to 5.6×10-
2 M. The UV-Vis absorption spectra of Eu(III) and Pr(III) in the presence of an increasing
amount of DFB from 0 to 0.056 M are plotted in Figure IV.10 and Figure IV.11, respectively.
350 400 450 500 550 600
0,00
0,05
0,10
0,15
0,20
0,25
0
0.3 eq
0.7 eq
1.0 eq
1.4 eq
1.7 eq
2.4 eq
3.1 eq
4.2 eq
5.2 eq
5.6 eq
Ab
so
rban
ce
Wavelength, nm
0
5.610-2 M
CDFB
350 400 450 500 550 600
0,0
0,2
0,4
0,6
0
0.1 eq
0.3 eq
0.6 eq
0.7 eq
1.3 eq
1.7 eq
2.1 eq
3.5 eq
5.6 eq
Ab
so
rban
ce
Wavelength, nm
0
5.610-2 M
CDFB
Figure IV.10 Absorption spectra of Eu(III) at 10-2 M with increasing amount of DFB at pH = 3.7
(left) and 4.5 (right) (I = 0.5 M, 0 ≤ CDFB ≤ 5.6×10⁻² M).

IV. Results and Discussion
64
430 440 450 460 470 480 490 500
0,01
0,02
0,03
0,04
0,05
0,06
0
1.7 eq
2.3 eq
4.7 eq
5.2 eq
6.4 eq
Ab
so
rpti
on
Wavelength, nm
0
5.610-2 M
CDFB
430 440 450 460 470 480 490 500
0,01
0,02
0,03
0,04
0,05
0,06
0
0.2 eq
0.5 eq
0.6 eq
1.2 eq
2.3 eq
3.5 eq
9.3 eq
Ab
so
rpti
on
Wavelength, nm
0
5.610-2 M
CDFB
Figure IV.11 Absorption spectra of Pr(III) at 6×10⁻³ M with increasing amount of DFB at pH =
4.6 (left) and 5.5 (right) (I = 0.5 M 0 ≤ CDFB ≤ 5.6×10⁻² M).
For the study of Eu-DFB, at pH = 3.7 (Figure IV.10 left), it can be seen that as the increase of
DFB concentration, the absorption intensity of the broad band from 350 to 550 nm is increasing
due to the formation of Eu-DFB complex and a small band is constantly located around 390
nm. In addition, the absorption variation at pH = 4.5 (Figure IV.10 right) is more significant
than that at pH = 3.7. A larger amount of Eu-DFB complexes is formed at lower acidity with
the same Eu(III) concentration range.
For the study of Pr-DFB, at pH = 4.6 (Figure IV.11 left), the absorption intensities of the bands
at 440, 468 and 481 nm decrease with the increase of DFB concentration due to the formation
of Pr-DFB complex. In addition, the band at 468 nm is slightly shifted to the higher wavelength
with the increasing DFB concentration. At pH = 5.5 (Figure IV.11 right), it can be seen that
the band at 444 nm becomes smaller and broader. The band at 468 nm slightly moves to the
higher wavelength as the increase of DFB concentration. Additionally, the band at 481 nm dis-
appears and a new band grows up around 484 nm.
All the spectrophotometric data at both of pH were input into the software HypSpec to perform
the data analysis. The input protonation constants of DFB as well as complexation constants
were determined at I = 0.7 M by E.A. Christenson et al. [2011CHR]. According to their work,
the complex LnH3DFB3+ becomes predominant around pH = 3.7. With increasing pH to 4.5,
the LnH2DFB2+ complex appears in the solution. Data processing was therefore conducted by
assuming the presence of LnH3DFB3+ and LnH2DFB2+). The output data with HypSpec are the
stability constants and the individual spectra of each species. The obtained stability constants
are summarized in Table IV.4. The molar absorbance of each species in solution is shown in
Figure IV.12 and Figure IV.13.

IV. Results and Discussion
65
𝐷𝐹𝐵3− + 𝐿𝑛3+ + 3𝐻+ = 𝐿𝑛𝐻3𝐷𝐹𝐵3+ IV.26
𝛽113 =[𝐿𝑛𝐻3𝐷𝐹𝐵
3+]
[𝐷𝐹𝐵3−][𝐿𝑛3+][𝐻+]3 IV.27
𝐷𝐹𝐵3− + 𝐿𝑛3+ + 2𝐻+ = 𝐿𝑛𝐻2𝐷𝐹𝐵2+ IV.28
𝛽112 =[𝐿𝑛𝐻2𝐷𝐹𝐵
3+]
[𝐷𝐹𝐵3−][𝐿𝑛3+][𝐻+]2 IV.29
Table IV.4 Obtained and published stability constants of Ln(H3DFB)3+ and Ln(H2DFB)2+ for
Eu(III) and Pr(III).
iM+nL+mH⇌MiLnHm βinm=[MiLnHm]/[M]i[L]n[H]m
Actinide Ligand logβ113 logβ112 Conditionb Method Reference
Eu(III) DFBa 35.6±0.1 31.5±0.1 20 °C sp. this work
Eu(III) DFB 35.72±0.06 30.91±0.06 25 °C pot. [2011CHR]
Pr(III) DFBa 35.1±0.1 29.9±0.1 20 °C sp. this work
Pr(III) DFB 35.10 29.55 25 °C pot. [2011CHR]
a. Calculated with pKa1 = 8.54±0.01 pKa2= 9.06±0.01 pKa3= 9.70±0.02 pKa4= 10.89±0.06 [2011CHR]
b. Determined at I = 0.7 M (Na, HClO4)
It can be seen that the obtained stability constants are close to, but slightly different from the
literature data determined by potentiometry [2011CHR]. It is probably due to the differences of
experimental conditions and techniques. Since the nitrate salt of lanthanide is used in the solu-
tion preparation, the electrolyte contains nitrate apart from perchlorate. Additionally, the calcu-
lated results can be influenced by the DFB dissociation constants input into HypSpec, but there
is no published constants corresponding to the experimental conditions of this work. All the
constants in the literature [2011CHR] were used to initialize the calculation of HypSpec. Thus,
in spite of the slight difference between the determined constants and the literature data, it can
be concluded that the obtained values are in good agreement with the literature data [2011CHR]
and this is a useful protocol to determine the stability constant for the further study of trivalent
actinides.

IV. Results and Discussion
66
350 400 450 500 550 600
0
10
20
30
40
50
60
350 400
0
1
2
3
Mo
lar
abso
rban
ce
Wavelength, nm
Eu3+
Mo
lar
ab
so
rban
ce
Wavelength, nm
Eu3+
EuH2DFB
2+
EuH3DFB
3+
430 440 450 460 470 480 490 500
0
2
4
6
8
10
Mo
lar
ab
so
rban
ce
Wavelength, nm
Pr3+
PrH2DFB
2+
PrH3DFB
3+
Figure IV.12 Molar absorbance of Eu3+,
EuH3DFB3+ and EuH2DFB2+.
Figure IV.13 Molar absorbance of Pr3+,
PrH3DFB3+ and PrH2DFB2+.

IV. Results and Discussion
67
IV.1.3 Complexation of Ln(III) with DFB studied by affinity ca-
pillary electrophoresis
The complexation of La and Lu, the lightest and heaviest lanthanide, with DFB has been studied
by affinity capillary electrophoresis. By using UV detector to monitor the mobility, some com-
ponent in the injected sample must display a high extinction coefficient around the wavelength
of 200 nm. Instead of lanthanide ions, DFB solution exhibits a strong ultra-violet absorption
because of the presence of several absorbing groups [2016WOR]. That is why it was injected
into capillary as analyte and its mobility followed by its UV absorption thanks to the diode array
detector of the ACE instrument [2006SIM].
Experiments have been conducted at pH = 2.5 and T = 25 °C at two values of ionic strength,
0.1 and 0.5 M (Na, HClO4). The variations of the mobility of the analyte (DFB) as a function
of metal ions concentration are presented in Figure IV.14.
1E-4 0,001 0,01 0,1
0,8
0,9
1,0
1,1
1,2
1,3 DFB mobility in presence of La(III)
DFB mobility in presence of Ln(III)
10
8 m
2V
-1s
CLn(III)
, M
1E-4 0,001 0,01 0,1
0,55
0,60
0,65
0,70
0,75
0,80
DFB mobility in presence of La(III)
DFB mobility in presence of Lu(III)
10
8 m
2V
-1s
CLn(III)
, M
Figure IV.14 Mobility of 1×10⁻⁴ M DFB as function of La(III) (black points) and Lu(III) (red
points) at I = 0.1 M (left) and 0.5 M (right) pH = 2.5, T = 25 °C.
It can be seen that the mobility of injected analyte (DFB) increases with the increase of lantha-
nide concentration. This can be related to the formation of a complex Ln-DFB that leads to the
increase of the total charge of the analyte. Over the narrow range of Ln concentration investi-
gated, the variation of DFB mobility displays a similar tendency in the presence of La(III) and
Lu(III). The formed complex is likely to be MH3DFB3+ according to literature data [2011CHR].
Moreover, in this experimental condition (pH = 2.5), the hydrolysis of La3+ and Lu3+ has been
neglected [2000KLU].
The experiments performed at the higher ionic strength (I = 0.5 M), allowed the range of metal
concentration to be extended to 0.045 M. However, the high UV absorption of background

IV. Results and Discussion
68
electrolyte at the higher concentration of lanthanide ions has been found to interfere with the
signal of DMSO (the marker used for determination of electroosmotic migration). In that case,
the electroosmotic flow was indicated by H2O instead of DMSO in order to avoid the slight
influence of lanthanides ions on the mobility of DMSO.
The following equilibrium have been considered:
𝐻4𝐷𝐹𝐵+ +𝑀3+
𝐾1↔𝑀𝐻3𝐷𝐹𝐵
3+ + 𝐻+ IV.30
𝐾1 =[𝑀𝐻3𝐷𝐹𝐵
3+][𝐻+]
[𝐻4𝐷𝐹𝐵+][𝑀3+] IV.31
Another way to express the equilibrium is:
𝑀3+ + 𝐷𝐹𝐵3− + 3𝐻+𝛽113↔ 𝑀𝐻3𝐷𝐹𝐵
3+ IV.32
𝛽113 =[𝑀𝐻3𝐷𝐹𝐵
3+]
[𝑀3+][[𝐷𝐹𝐵3−][𝐻+]3 IV.33
In addition, the kinetic of the equilibrium should be fast enough compared to the separation
time since the mobility of free DFB and complexed DFB was not distinguished. Thus, the fol-
lowing equation has been used to calculate the equilibrium constant.
𝜇𝑜𝑣𝑒𝑟𝑎𝑙𝑙 = 𝜇𝐻4𝐷𝐹𝐵+ ×[𝐻4𝐷𝐹𝐵
+]
[𝐻4𝐷𝐹𝐵+] + [𝑀𝐻3𝐷𝐹𝐵3+]
+ 𝜇𝑀𝐻3𝐷𝐹𝐵3+ ×[𝑀𝐻3𝐷𝐹𝐵
3+]
[𝐻4𝐷𝐹𝐵+] + [𝑀𝐻3𝐷𝐹𝐵3+]
= 𝜇𝐻4𝐷𝐹𝐵+ ×1
1 + 𝐾[𝑀3+]/[𝐻+]+ 𝜇𝑀𝐻3𝐷𝐹𝐵3+ ×
𝐾1[𝑀3+]/[𝐻+]
1 + 𝐾[𝑀3+]/[𝐻+]
𝛼𝐻4𝐷𝐹𝐵+ =1
1 + 𝐾[𝑀3+]/[𝐻+]
𝜇𝑜𝑣𝑒𝑟𝑎𝑙𝑙 = 𝜇𝐻4𝐷𝐹𝐵+ × 𝛼𝐻4𝐷𝐹𝐵+
+ 𝜇𝑀𝐻3𝐷𝐹𝐵3+ × 𝐾1[𝑀3+]/[𝐻+] × 𝛼𝐻4𝐷𝐹𝐵+
IV.34
In Equation IV.34, 𝜇𝑜𝑣𝑒𝑟𝑎𝑙𝑙 can be determined experimentally and 𝜇𝐻4𝐷𝐹𝐵+ corresponds to the
measurements in the absence of lanthanide. The pH was fixed at 2.5. The value of 𝐾1 and
𝜇𝑀𝐻3𝐷𝐹𝐵3+ can be obtained by a non-linear fitting according to Equation IV.34.

IV. Results and Discussion
69
The calculation results at I = 0.1 M and T = 25 °C are shown in Table IV.5. In order to compare
with literature data [2011CHR], the complexation equilibrium constant β113 (Equation IV.33)
was calculated using Equation IV.35.
𝑙𝑜𝑔𝛽113 = 𝑙𝑜𝑔𝐾1 + 𝑝𝐾𝑎1 + 𝑝𝐾𝑎2 + 𝑝𝐾𝑎3 + 𝑝𝐾𝑎4 IV.35
Table IV.5 Obtained and published stability constants of Ln(H3DFB)3+ for La(III) and Lu(III).
Lanthanides La(III) Lu(III)
μH4DFB , m2/Vs 0.849 - 0.835 -
μMH3DFB, m2/Vs 2.11 - 2.32 -
K1 0.07±0.01 - 0.06±0.01 -
logβ113 36.5±0.1 34.13 36.4±0.1 35.73
T, °C 25 25 25 25
I, M 0.1 0.7 0.1 0.7
Method ACE. pot. ACE. pot.
Reference this work [2011CHR] this work [2011CHR]
The used protonation constants of DFB used for normalization of stability constants are the
values obtained in I = 0.7 M (Na, HClO4) [2011CHR]. The stability constant 𝐾1 is calculated
to be 0.07 ± 0.01 and 0.06 ± 0.01 at I = 0.1 M in the system with La3+ and Lu3+ respectively.
The difference of the interaction strength of DFB with La(III) and Lu(III) cannot be distin-
guished in this experiment. And the obtained values are much higher than the literature data
[2011CHR]. Fitting data at I = 0.5 M, using the same equilibrium (Equation IV.31) as I = 0.1
M did not allow to determine the stability constants.
Several reasons can be given to explain the absence of reliable results using ACE. The Ln sam-
ples have been prepared by dissolution of a nitrate salt in the electrolyte (Na, HClO4). Although
ionic strength has been maintained to 0.1 and 0.5 M, the composition (ratio between nitrate and
perchlorate) has continuously varied with increasing Ln concentration. The change in electro-
lyte composition may affect the viscosity of the buffer. In addition, given the ratio DFB/Ln, the
formation of bi- and tri-nuclear species cannot be ruled out. Indeed, the existence of di-nuclear
complexes of Ce(III), Nd(III) and Gd(III) have been deduced recently from potentiometric ti-
trations involving metal to ligand ratio equal 2:1 [2013TIR]. A tri-nuclear species of transition
element Pb(II) with DFB was also observed by potentiometric titration at 1.5 to 1 metal to
ligand ratio [2008FAR].
IV. Results and Discussion
70
Further use of capillary electrophoresis to study this system would require an increase of pH to
observe a more significant variation of mobility as function of metal concentration. However,
using UV-detector, the experiments have to be performed by varying metal concentration in
excess over ligand concentration, complicating the curve fitting to find out the proper equilib-
rium. Thus, it is better to use alternative detector like mass spectrometry to monitor the mobility,
so that metal ions can be allowed to be analyte.

IV. Results and Discussion
71
Structural study with trivalent lanthanides
IV.1.4 Structural study of the complexation of Eu(III) with DFB
by ATR-FTIR
A) IR spectra of free DFB
In order to better understand the complexation of Eu(III) with DFB, IR spectra of the free ligand
DFB have been recorded in different conditions. Figure IV.15 presents the infrared spectra of
the desferrioxamine mesylate at pH = 3.1.
4000 3600 3200 2800 2400 2000
T %
Wavenumber, cm-1
3100
3308
1800 1600 1400 1200 1000 800
T %
Wavenumber, cm-1
1620
1565
1190
1043
Figure IV.15 IR spectrum of protonated desferrioxamine mesylate at pH=3.1.
Figure IV.16 Main functional groups of protonated DFB.
The molecule of DFB is composed of several functional groups such as three hydroxamates,
two amides, an amine and some alkyl groups. The presence of those functions leads to a signif-
icant overlapping of absorption bands in the spectrum, complicating the assignment of each
absorption bands. However, DFB spectrum has already been studied and detailed using curve-
fitting analyses or calculations [2005EDW] [2005SIE] [2006COZ] [2009BOR]. The main func-
tional groups (hydroxamate groups and secondary amide groups) in DFB are indicated in Fig-
ure IV.16.

IV. Results and Discussion
72
Hydroxamate groups (R-C(=O)-N(OH)-R) are featured by an absorption band of the carbonyl
from the ternary amide between 1665-1640 cm-1. In this study, this characteristic band appears
at 1620 cm-1 (Figure IV.15 right). Hydroxamate groups are also featured by the N-OH stretch-
ing around 3450-3030 cm-1 when they are protonated, but also by the C-N stretching (1175-
1055 cm-1) and the bending vibration of N-OH (1420-1330 cm-1). The N-OH vibrations were
attributed to the broad band around 3100 cm-1 (stretching) (Figure IV.15 left) and 1396 cm-1
(bending). The band of N-O stretching vibration in hydroxamate groups should appear at
1051cm-1 [2006COZ], but it cannot be distinguished due to the interference of mesylate in this
case. Because since desferrioxamine mesylate salt powder is used to prepare the solutions, the
vibration bands observed at 1043 and 1190 cm-1 (Figure IV.15 right) correspond to the use of
the mesylate salts and prevent the observation of any change in this wavenumber range. The
characteristic symmetric and asymmetric bands of the SO3 functional group are known to be
strong stretching vibrations (Figure IV.17). They generally appear at 1058 and 1164 cm-1 re-
spectively using KBr pellets [2006COZ] or 1049 and 1185 cm-1 in solution with an ATR-FTIR
[2009BOR].
Figure IV.17 IR spectra of solutions containing either the mesylate form of DFB (5×10⁻² M) at
pH = 5.5 or methanesulfonate (5×10⁻² M) at pH = 4.0 [2009BOR].
Secondary amide group is usually featured by amide carbonyl band among 1695-1615 cm-1,
which is around 1651 cm-1 for dry samples [2005SIE]. In Figure IV.15, this band cannot be
distinguished due to the overlapping of the hydroxamate carbonyl band. The carbonyl absorp-
tion band from hydroxamate groups is generally sharper and stronger than that from secondary
amide groups. The bands from N-H bending and C-N stretching are also observed at 1565 cm-
1.
900100011001200130014001500160017001800
0
0.02
0.04
0.06
0.08
0.1
0.12
(cm-1
)
Ab
so
rban
ce
methanesulfonate
DFOB-mesylate
(desferal) 10491185

IV. Results and Discussion
73
Figure IV.18 presents the mid-infra-red spectra of desferrioxamine mesylate solution (air dried)
in absence of Eu(III) at pH from 3.1 to 8.9. Compared to the thermodynamic study, the ionic
strength was not fixed at 0.5 M or 0.7 M, preventing the strong influence of the electrolyte in
the analysis by drying the samples. In this case, solutions were prepared in pure water and ionic
strength was varied due to the pH adjustment. The ionic strength is roughly estimated to be
around 2.5×10⁻² M. In this experiment, the spectra variation due to the deprotonation of hydrox-
amate groups is expected to be observed, however, the locations of bonding vibrations of DFB
are not changed as the increase of pH. It is probably resulted by drying process before the
measurements. For the dried powder of DFB, the unique form is always the fully protonated
H4DFB•CH3SO3 and actually it is meaningless to condition the solid using pH or ionic strength.
1700 1600 1500 1400 1300 1200 1100 1000 900 800
8.9
6.4
5.3
4.4
T %
Wavenumber (cm-1)
1620
1565 1190 1043
pH
3.1
Figure IV.18 IR spectra of the dried DFB solution at 2.5×10⁻² M in absence of Eu(III) at pH from
3.1 to 8.9.
B) IR spectra of Eu-DFB complexes
Although many works has been done to study the infra-red spectra of DFB in presence of metal
ions [2005EDW] [2006COZ] [2009BOR] [2010SIM], it is still difficult to interpret all the bond-
ing vibrations due to the strong couplings of many methylene bridges in DFB and the interfer-
ence of mesylate in this case. Thus, this work is mainly focused on the bonding variations of
hydroxamate groups which possess a strong tendency to coordinate with Eu(III). In addition, it
is known that only hydroxamate groups are involved in the complexation [2000NEU], which
means the complexation should only affect the infrared absorption of hydroxamate groups.

IV. Results and Discussion
74
3800 3600 3400 3200 3000 2800 2600
Eu-DFB
T %
Wavenumber, cm-1
pH
DFB pH = 3
1700 1600 1500 1400 1300 1200 1100 1000 900 800 700
Eu-DFB
DFB pH = 3
T %
Wavenumber, cm-1
pH
Figure IV.19 FTIR spectra of air-dried Eu(III)-DFB complexes as a function of pH (from 3.1 to
9.4). CEu(III) = CDFB = 2.5×10⁻² M at room temperature.
Figure IV.19 shows the variation of infra-red transmittance spectra of the complexation be-
tween Eu(III) and DFB at the stoichiometric ratio 1:1 as function of pH. FTIR spectra have
been scaled and offset to facilitate their comparison. It can be seen that the carbonyl bands
mentioned above are affected by the complexation with Eu(III). The hydroxamate carbonyl
band at 1620 cm-1 downshifts to 1597 cm-1 due to the complexation with Eu(III) at pH = 3.1.
Furthermore, it gradually downshifts to 1589 cm-1 as increasing pH to 9.4. It is probably due to
the successive deprotonation of hydroxamate groups due to the complexation. Because hydrox-
amate carbonyl groups increasingly participate to the complexation of Eu(III) with the decreas-
ing acidity. It is very likely that the predominant species of Eu-DFB complex could be varied
from EuH3DFB3+ to EuHDFB+ as the increase of pH. This result is in agreement with the spe-
ciation diagram (Figure II.15) plotted using the stability constants from literature [2011CHR].
In addition, increasing the pH leads to the exposure of the amide carbonyl bands at 1637 cm-1,
which is assigned to be amide carbonyl bands.
At high frequencies, a broad peak appears at 3400-3500 cm-1 from the HOH stretching (water
molecules included in the complexes). The frequency of the N-H band of the secondary amide
at 3308 cm-1 is strongly decreased. However, secondary amine does not participate to the com-
plexation of DFB with Eu(III). This change could be due to intramolecular hydrogen bonds.
Finally, the intensity of the broad peak around 3100 cm-1 due to the O-H stretch from the hy-
droxamic groups decreases at lower pH until disappearance at higher pH. Instead, a very broad
weak peak slightly shift at 3085 cm-1 is seen. This peak can be the C-NH overtone band of the
secondary amide which was already reported at 3084 cm-1 in ferrioxamine [2005SIE]. The fre-
quencies and assignments of the major bands of H4DFB+ and Eu-DFB complexation are also
summarized in Table IV.6.
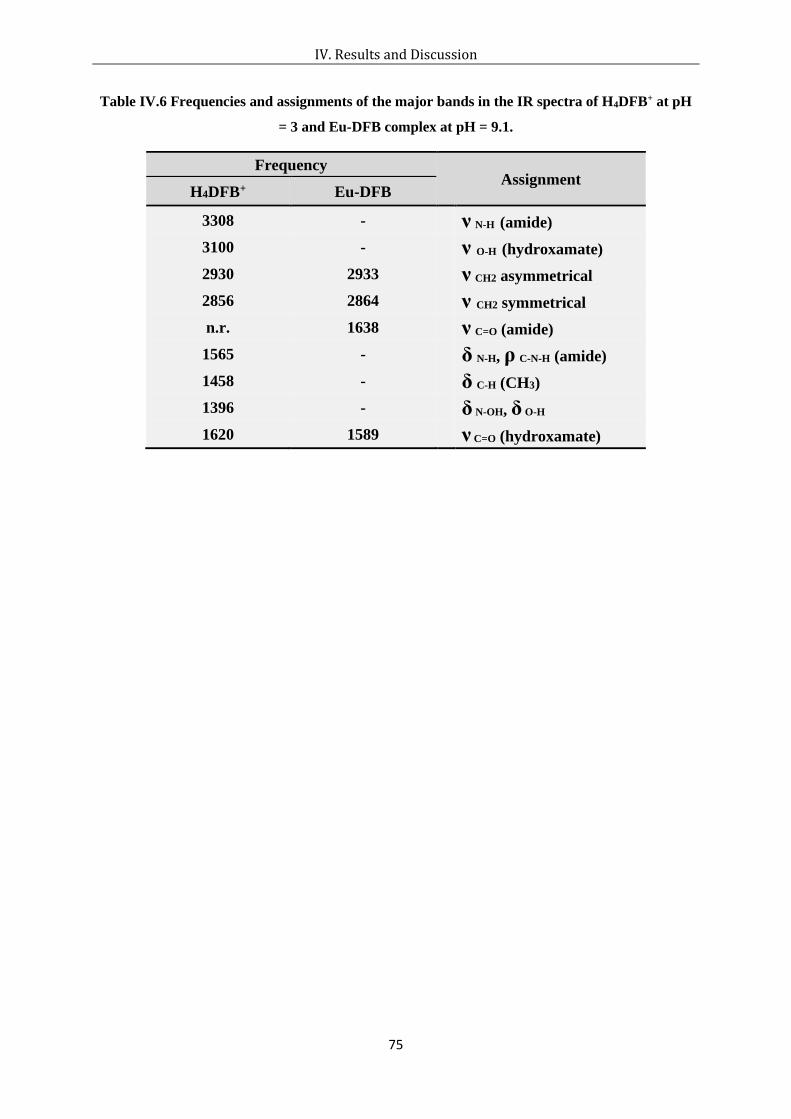
IV. Results and Discussion
75
Table IV.6 Frequencies and assignments of the major bands in the IR spectra of H4DFB+ at pH
= 3 and Eu-DFB complex at pH = 9.1.
Frequency Assignment
H4DFB+ Eu-DFB
3308 - ν N-H (amide)
3100 - ν O-H (hydroxamate)
2930 2933 ν CH2 asymmetrical
2856 2864 ν CH2 symmetrical
n.r. 1638 ν C=O (amide)
1565 - δ N-H, ρ C-N-H (amide)
1458 - δ C-H (CH3)
1396 - δ N-OH, δ O-H
1620 1589 ν C=O (hydroxamate)

IV. Results and Discussion
76
IV.2 Tetravalent actinides
This work is part of the ANR project PLUTON (ANR-17-CE08-0053).
Thermodynamic study with tetravalent actinides
IV.2.1 Complexation of Th(IV) with DFB studied by liquid-liq-
uid extraction
A) Preliminary study in the absence of DFB
TTA is known to extract a wide range of metallic cations from acidic media [1961POS]. With
the aim at the determination of the formation constant of Th-DFB in aqueous phase, experi-
mental conditions ensuring a competition between the formation of Th-TTA chelate in organic
phase and Th complexation in aqueous phase have to be found. Figure IV.20 presents the per-
centage of extracted Th as function of pCH. It can be seen that the quantitative extraction can
be observed at pCH higher than 1.5.
-1,0 -0,5 0,0 0,5 1,0 1,5 2,0 2,5 3,0 3,5
0
20
40
60
80
100
Co
eff
icie
nt
de
dis
trib
uti
on
D
pCH
0,01 0,1
0,001
0,01
0,1
1
10
Dis
trib
uti
on
ra
tio
CTTA
, M
Linear fitting
Slope = 3,7 0,2
Figure IV.20 Variations of the percentage of
extraction of 227Th as function of pCH (CTTA =
0.08 M in toluene, I = 0.7 M (Na, HClO4), T =
25 °C).
Figure IV.21 Variations of the distribution ra-
tio D of 227Th as function of total TTA concen-
tration in toluene (I = 0.7 M (Na, HClO4), pCH
= 1.0, T = 25 °C).
The variation of the distribution ratio D of 227Th has been determined as function of the total
TTA concentration at pCH = 1.0. In these conditions, Th hydrolysis can be neglected [2008SAS].
DFB solution at pCH = 1.0 has been proved to be stable within at least one day. The study of
DFB stability by UV-visible absorption spectroscopy is described in Appendix E. Working at
constant ionic strength and temperature allows one to use Equation III.4 that correlates the

IV. Results and Discussion
77
slope of the logarithmic variations of D to the difference in the mean number of TTA molecules
per Th atom between species in organic and aqueous phase. The variations in Figure IV.21
lead to a slope equal 3.7 ± 0.2. Like other tetravalent cations, Th(TTA)4 has been proved to be
the only Th-containing species extracted in aromatic diluent [1950DAY] [1951ZEB]
[2008SAS]. The value obtained in this work is slightly lower than 4: this could be related to the
formation of a small amount of Th(TTA)3+ in aqueous phase, as suggested in the literature
[1951ZEB] [1952WAG] [1996XIA].
The concentration of HTTA in aqueous phase can be deduced from the distribution ratio of
HTTA:
𝐷𝐻𝑇𝑇𝐴 = [𝐻𝑇𝑇𝐴̅̅ ̅̅ ̅̅ ̅̅ ]
[𝐻𝑇𝑇𝐴] IV.36
The value of [HTTA] corresponding to the experimental conditions of Figure IV.21 (I = 0.7
M, T = 25 °C) has been estimated by interpolation of the DHTTA values at I = 0.5 and 1.0 M
determined by Jaussaud in her systematic study of TTA distribution between toluene and an
aqueous solution (Na, HClO4) of fixed acidity (7×10⁻³ M) [2003JAU]. DHTTA does not depend
on the initial concentration of TTA since there is no strong interaction between the extractant
and the diluent [1992RYD]. Mean value of D for 5.10-3 M ≤ 𝐶𝑇𝑇𝐴𝑡𝑜𝑡 ≤ 0.1 M equal to 35.3 (I =
0.5 M) and 41.6 (I = 1.0 M) were taken from reference [2003JAU]. Moreover, DHTTA does not
depend on acidity as long as pH < 4. Thus, DHTTA (Figure IV.21) is estimated to be 37.8 ± 0.5.
As weak acid (pKa = 6.20) [1996RYD], HTTA in aqueous solution undergoes dissociation. Its
concentration in aqueous solution can be calculated according to the following equation:
[𝐻𝑇𝑇𝐴] =𝐶𝑇𝑇𝐴𝑡𝑜𝑡
1 + 𝐷𝐻𝑇𝑇𝐴 +𝐾𝑎 [𝐻+]⁄ IV.37
The values of HTTA and TTA- concentration in the aqueous phase corresponding to the extreme
values of total TTA concentration used in Figure IV.21 are presented in Table IV.7. The
amount of ThTTA3+ has been estimated using the constant determined by Waggener et al.
[1952WAG] according to Equation IV.38 and Equation IV.39. Indeed, in a more recent study,
Xia et al propose two values for the complexation of Th according to Equation IV.40, but their
study has been carried out in CNaCl = 5 M [1996XIA]. Moreover, the values of Waggener et al.
are consistent with those of U(IV) and Np(IV) : the affinity between An(IV) and TTA follows
the sequence Th< U < Np [1996RYD].

IV. Results and Discussion
78
𝑇ℎ4+ + 𝐻𝑇𝑇𝐴 ⇌ 𝑇ℎ(𝑇𝑇𝐴)3+ + 𝐻+ IV.38
K =[𝑇ℎ(𝑇𝑇𝐴)3+][𝐻+]
[𝑇ℎ4+][𝐻𝑇𝑇𝐴]= 6.6 ± 0.3 (𝐼 = 2 𝑀) IV.39
𝑇ℎ4+ + 𝑇𝑇𝐴− ⇌ 𝑇ℎ(𝑇𝑇𝐴)3+ IV.40
In our experimental conditions (I = 0.7 M, pCH = 1.0, T= 25 °C) the percentage of the complex
Th(TTA)3+ lies between 3 and 12 % of total Th(IV) in aqueous solution. This could explain the
value lower than 4 obtained in Figure IV.21.
Table IV.7 Estimated values of HTTA and TTA- concentration and ThTTA3+ percentage.
CTTA tot, M In aqueous phase
[HTTA], M [TTA-], M ThTTA3+, %
0.02 5.2×10⁻⁴ 3.3×10⁻⁹ 3
0.08 2.1×10⁻³ 1.3×10⁻⁸ 12
Concerning the experimental procedure, the extraction equilibrium can be described as:
𝑇ℎ(𝑇𝑇𝐴)̅̅ ̅̅ ̅̅ ̅̅ ̅̅ ̅̅4 + 4𝐻
+ 1/𝐾𝑒𝑥↔ 𝑇ℎ4+ + 4𝐻𝑇𝑇𝐴̅̅ ̅̅ ̅̅ ̅̅ IV.41
𝐾𝑒𝑥 =[𝑇ℎ(𝑇𝑇𝐴)̅̅ ̅̅ ̅̅ ̅̅ ̅̅ ̅̅
4][𝐻+]4
[𝑇ℎ4+][𝐻𝑇𝑇𝐴̅̅ ̅̅ ̅̅ ̅̅ ]4 IV.42
B) Determination of conditional stability constants Kcond
TTA concentration in toluene was fixed at 0.08 M and DFB concentration in aqueous phase
was varied between 0 and 0.07 M. The total concentration of Th(IV) was less than 10-12 M at
ultra-trace scale where the polymerization of Th(IV) should not take place, but the back-direct
extraction experiments were still performed to verify the non-occurrence of Th(IV) condensa-
tion in this experiment (Appendix D).The experiments have been performed at constant ionic
strength (I = 0.7 M, Na, HClO4) and at 25 °C. Figure IV.22 presents the variation of distribution
ratio (D) of 227Th(IV) as function of DFB concentration for different values of pCH.

IV. Results and Discussion
79
1E-8 1E-7 1E-6 1E-5 1E-4 0,001 0,01 0,1 1
0,001
0,01
0,1
1
10
100
1000
10000
Slope = -1
pCH=0.7
pCH=1.0
pCH=1.5
pCH=2.3
D
CDFB
, M
0,00 0,01 0,02 0,03 0,04 0,05 0,06 0,07 0,080
200
400
600
800
1000
Calculated values
Linear fitting
D0/D
-1
CDFB
, M
y=12320x-30,64
R2=0,996
Figure IV.22 Variations of D as a function of
DFB concentration at different pCH (CTTA =
0.08 M, I = 0.7 M (Na, HClO4), T = 25 °C).
Figure IV.23 Variations of D0/D-1 as function
of DFB concentration (I = 0.7 M (Na, HClO4),
T = 25 °C, pCH = 1.5) and associated linear
fitting.
In Figure IV.22, the values corresponding to CDFB = 0 (D0) have been arbitrarily chosen and
represented at CDFB = 10-7 M. Whatever the pCH value, the distribution curves exhibit the same
trend: at low DFB concentration, a plateau is observed (up to ~10-4 M DFB), then the distribu-
tion ratios D decrease with the increase in CDFB. This can be related to the formation of a Th-
DFB complex in the aqueous phase. The increase of pCH leads to the increase of D0. It is very
often observed in the work using TTA as the extractant [2003JAU] [2008SAS] [2012LEG].
According to Equation III.3, the derivative of logarithmic variations of D with CDFB can be
related to the maximum stoichiometry of the complex, equal to 1 in this case. Without consid-
ering the precise form of chemical species, the equilibrium in the aqueous phase can be written
as:
𝑇ℎ(𝐼𝑉) + 𝐷𝐹𝐵 𝐾𝑐𝑜𝑛𝑑↔ 𝑇ℎ − 𝐷𝐹𝐵 IV.43
with 𝐾𝑐𝑜𝑛𝑑 = [𝑇ℎ − 𝐷𝐹𝐵] [𝑇ℎ(𝐼𝑉)][𝐷𝐹𝐵]⁄ IV.44
And the conditional stability constants can be determined according to the following Equation
IV.45.
𝐷0𝐷− 1 = 𝐾𝑐𝑜𝑛𝑑[𝐷𝐹𝐵] IV.45
Figure IV.23 shows an example of calculation of Kcond at pCH = 1.5. According to Equation
IV.45, the obtained slope deduced from linear fitting represents the conditional stability

IV. Results and Discussion
80
constant. The obtained stability constants Kcond at pCH = 0.7, 1.0, 1.5 and 2.3 are summarized in
Table IV.8. It can be seen the values of Kcond increase with the increase of pCH from 0.7 to 1.5.
Table IV.8 Conditional stability constants Kcond relative to the formation of Th-DFB at different
pCH.
pCH Kcond logKcond
0.7 2027±186 3.31±0.04
1.0 5309±521 3.72±0.04
1.5 12320±1116 4.11±0.04
2.3 3821±356 3.58±0.04
C) Determination of corrected conditional stability constant K’cond
The aim here is to determine the corrected constant associated to:
𝑇ℎ4+ + 𝐷𝐹𝐵 𝐾𝑐𝑜𝑛𝑑′
↔ 𝑇ℎ − 𝐷𝐹𝐵 IV.46
with 𝐾𝑐𝑜𝑛𝑑′ = [𝑇ℎ − 𝐷𝐹𝐵]/[𝑇ℎ4+][𝐷𝐹𝐵] IV.47
As with Eu indeed, Th4+ is likely to undergo some reactions in aqueous phase, especially hy-
drolysis and complexation with TTA-. Although the hydrolytic behavior of Th4+ is characterized
by the formation of oligomers, these species have not been taken into account since Th was
present at tracer scale. The following equilibria have been considered:
𝑇ℎ4+ + 𝑛𝐻2𝑂 𝛽𝑂𝐻,𝑛↔ 𝑇ℎ(𝑂𝐻)𝑛
(4−𝑛)++ 𝑛𝐻+ IV.48
with 𝛽𝑂𝐻,𝑛 = [𝑇ℎ(𝑂𝐻)𝑛(3−𝑛)+
][𝐻+]𝑛 [𝑇ℎ4+]⁄ IV.49
𝑇ℎ4+ +𝑚𝐻𝑇𝑇𝐴 𝛽𝑇𝑇𝐴,𝑚↔ 𝑇ℎ(𝑇𝑇𝐴)𝑚
(4−𝑚)++𝑚𝐻+ IV.50
with 𝛽𝑇𝑇𝐴,𝑚 = [𝑇ℎ(𝑇𝑇𝐴)𝑚(3−𝑚)+
][𝐻+]𝑚 [𝑇ℎ4+][𝐻𝑇𝑇𝐴]𝑚⁄ IV.51
In the absence of DFB, D0 can be expressed as:
𝐷0 =[𝑇ℎ(𝑇𝑇𝐴)̅̅ ̅̅ ̅̅ ̅̅ ̅̅ ̅̅
4]
[𝑇ℎ4+] + ∑[𝑇ℎ (𝑇𝑇𝐴)𝑚(4−𝑚)+
] + ∑[𝑇ℎ(𝑂𝐻)𝑛(4−𝑛)+
]
=𝐾𝑒𝑥[𝐻𝑇𝑇𝐴̅̅ ̅̅ ̅̅ ̅̅ ]4[𝐻+]−4
1 + ∑𝛽𝑇𝑇𝐴,𝑚[𝐻𝑇𝑇𝐴]𝑚[𝐻+]−𝑚 +∑𝛽𝑂𝐻,𝑛[𝐻+]−𝑛
In the presence of DFB, D can be expressed as:

IV. Results and Discussion
81
𝐷 =[𝑇ℎ(𝑇𝑇𝐴)̅̅ ̅̅ ̅̅ ̅̅ ̅̅ ̅̅
4]
[𝑇ℎ3+] + ∑[𝑇ℎ (𝑇𝑇𝐴)𝑚(4−𝑚)+
] + ∑[𝑇ℎ(𝑂𝐻)𝑛(4−𝑛)+
] + [𝑇ℎ − 𝐷𝐹𝐵]
=𝐾𝑒𝑥[𝐻𝑇𝑇𝐴̅̅ ̅̅ ̅̅ ̅̅ ]4[𝐻+]−4
1 + ∑𝛽𝑇𝑇𝐴,𝑚[𝐻𝑇𝑇𝐴]𝑚[𝐻+]−𝑚 +∑𝛽𝑂𝐻,𝑛[𝐻+]−𝑛 + 𝐾𝑐𝑜𝑛𝑑′ [𝐷𝐹𝐵]
Thus,
𝐷0𝐷− 1 =
𝐾𝑐𝑜𝑛𝑑′ [𝐷𝐹𝐵]
1 + ∑𝛽𝑇𝑇𝐴,𝑚[𝐻𝑇𝑇𝐴]𝑚[𝐻+]−𝑚 + ∑𝛽𝑂𝐻,𝑛[𝐻+]−𝑛
𝐾𝑐𝑜𝑛𝑑′ = 𝐾𝑐𝑜𝑛𝑑 × (1 +∑𝛽𝑇𝑇𝐴,𝑚[𝐻𝑇𝑇𝐴]
𝑚[𝐻+]−𝑚 +∑𝛽𝑂𝐻,𝑛[𝐻+]−𝑛) IV.52
The selected hydrolysis constants to calculate 𝐾𝑐𝑜𝑛𝑑′ are from T. Sasaki et al. (𝑙𝑜𝑔𝛽𝑂𝐻,1 =
−2.6 ± 0.1) at the ionic strength (I = 0.1 M, NaClO4) by liquid-liquid extraction [2008SAS]. It
is the latest data and not included in OECD books. Some other hydrolysis constants were also
found in OECD books, but they were not used in this case because they were determined with
different techniques and conditions. Since only the stability constant of 1:1 Th-TTA complex
was found in the literatures, only 𝛽𝑇𝑇𝐴,1[𝐻𝑇𝑇𝐴][𝐻+] was calculated in this case (𝛽𝑇𝑇𝐴,1 =
6.6 ± 0.3 [1952WAG]). The obtained values of 𝐾𝑐𝑜𝑛𝑑′ are listed in Table IV.9. The impact of
taking into account the hydrolysis species of Th and Th(TTA)3+ complex becomes increasingly
significant with the increase of pCH from 0.7 to 2.3. After the correction, the value of 𝐾𝑐𝑜𝑛𝑑′ at
pCH = 2.3 is still unreasonably lower than, but closer to that at pCH = 1.5. If the formation
constants of 1:2, 1:3 and 1:4 Th-TTA complexes in aqueous phase are available, a better cor-
rection is expected to be conducted. Anyway, due to the seemingly inconsistent result at pCH =
2.3, this value has not been used in the following calculations.
Table IV.9 Obtained conditional stability constants K'cond (Equation IV.47) between Th4+ and
DFB at different pCH and comparison with Kcond (Equation IV.44).
pCH logKcond logK'cond
0.7 3.31±0.04 3.3±0.1
1.0 3.72±0.04 3.8±0.1
1.5 4.11±0.04 4.3±0.1
2.3 3.58±0.04 4.2±0.1

IV. Results and Discussion
82
D) Determination of apparent constant Ky
In the pCH domain from 0.7 to 1.5, the predominant species of DFB is H4DFB+. The complex-
ation is expected to occur by the departure at least of one proton of the DFB hydroxamate. It is
supposed that the overall equilibrium for the 1:1 complex can be described as:
𝑇ℎ4+ + 𝐻4𝐷𝐹𝐵+ 𝐾𝑦↔ 𝑇ℎ(𝐻4−𝑦𝐷𝐹𝐵)
(5−𝑦)+ + 𝑦𝐻+ IV.53
with 𝐾𝑦 = [𝑇ℎ(𝐻4−𝑦𝐷𝐹𝐵)][𝐻+]𝑦 [𝑇ℎ4+][𝐻4𝐷𝐹𝐵
+]⁄ IV.54
Equation IV.54 can be also written as:
𝑙𝑜𝑔𝐾𝑦 = 𝑙𝑜𝑔[𝑇ℎ(𝐻4−𝑦𝐷𝐹𝐵)] [𝑇ℎ4+][𝐻4𝐷𝐹𝐵
+]⁄ + 𝑦𝑙𝑜𝑔[𝐻+] IV.55
Using Equation IV.46, the following relationship is obtained:
𝑙𝑜𝑔𝐾𝑐𝑜𝑛𝑑′ = 𝑙𝑜𝑔𝐾𝑦 − 𝑦𝑙𝑜𝑔[𝐻
+] IV.56
The logarithmic variations of the corrected conditional constant as function of proton concen-
tration are plotted on Figure IV.24. The slope obtained allows to get y = 1.2 ± 0.2. It means
two types of the complexes Th(H3DFB)4+ and Th(H2DFB)3+ are formed in this pCH domain,
which is in good agreement with the literature [1996WHI].
0,01 0,1
1000
10000
K'
cond
Linear fitting
K' c
on
d
CH, M
slope = -1.2 ± 0.2
R2 = 0.98
Figure IV.24 Variation of K’cond as function of proton concentration.
Thus, the following complexation equilibria can be considered:
𝑇ℎ4+ + 𝐻4𝐷𝐹𝐵+ 𝐾1↔ 𝑇ℎ𝐻3𝐷𝐹𝐵
4+ + 𝐻+ IV.57
𝐾1 =[𝑇ℎ𝐻3𝐷𝐹𝐵
4+][𝐻+]
[𝑇ℎ4+][𝐻4𝐷𝐹𝐵+] IV.58

IV. Results and Discussion
83
𝑇ℎ4+ + 𝐻4𝐷𝐹𝐵+ 𝐾2↔ 𝑇ℎ𝐻2𝐷𝐹𝐵
3+ + 2𝐻+ IV.59
𝐾2 =[𝑇ℎ𝐻2𝐷𝐹𝐵
3+][𝐻+]2
[𝑇ℎ4+][𝐻4𝐷𝐹𝐵+] IV.60
Thus,
𝐾𝑐𝑜𝑛𝑑′ = 𝐾1/[𝐻
+] + 𝐾2/[𝐻+]2 IV.61
According to least-square fitting, the values of logβ113 and logβ112 were obtained and shown in
Table IV.10.
Table IV.10 Obtained and published apparent stability constants of Th(H3DFB)4+ and
Th(H2DFB)3+.
iM+nL+mH⇌MiLnHm βinm=[MiLnHm]/[M]i[L]n[H]m
alogβ113 blogβ112 Condition CTh(IV) Method Reference
40.9±0.2 38.2±0.2 25 °C 0.7 M
(Na, HClO4) 10-12 M sol. this work
42.0±0.1 40.2±0.1 25 °C 0.1 M
(KCl) 1.25×10⁻³ M pot. [1996WHI]
a. logβ113=logK1+pKa1+pKa2+pKa3+pKa4 b. logβ112=logK2+pKa1+pKa2+pKa3+pKa4 pKa1 = 8.54±0.01 pKa2= 9.06±0.01 pKa3= 9.70±0.02 pKa4= 10.89±0.06 [2011CHR]
The obtained stability constant of Th(H3DFB)4+ and Th(H2DFB)3+does not agree well with the
literature data [1996WHI]. D.W. Whisenhunt et al. determined this stability constant by poten-
tiometric titration from pH = 2.1 to 10.7. But they mentioned that the slight pH changes in the
low pH region related to the formation of Th(H2DFB)+ and Th(H3DFB)+ are difficult to extrap-
olate and they did not consider the first hydrolysis of Th even at pH = 2.1 where Th has been
beginning hydrolysis [2008SAS]. In addition, our experimental conditions including ionic
strength and its component are also different from the literature. And due to the lack of stability
constants of Th-TTA, the formations of 1:2, 1:3 and 1:4 Th-TTA complexes in aqueous phase
are not considered in the calculations. Moreover, instead of macro Th(IV) (1.25×10⁻³ M) used
in the literature, ultra-trace scale of Th(IV) (10-12 M) was applied in this work to avoid polymer-
ization. With considering the constants determined from just three experimental points at pCH
= 0.7, 1.0 and 1.5, a relatively large error (0.2) is associated to the constants. The experiments
at more pCH values are needed to be performed in order to verify and accurate the formation

IV. Results and Discussion
84
constants. Overall, this protocol is considered to be a promising protocol for an application to
the study of the complexation of other tetravalent actinides with DFB.

IV. Results and Discussion
85
IV.2.2 Complexation of U(IV) with BHA, AHA and DFB studied
by UV-visible absorption spectrophotometry
A) Complexation of U(IV) with benzohydroxamic acid (BHA) and acetohydroxamic acid
(AHA)
The experiments were performed at CHCl = 0.5 M in order to protect U(IV) against hydrolysis
or oxidation. The contribution of U(IV), BHA and AHA to the ionic strength has not been taken
into account since their concentrations were far lower than that of HCl.
Figure IV.25 and Figure IV.26 presents the UV-visible absorption spectra of U(IV) at 4.8×10-
3 M and 9.6×10⁻³ M with increasing amount of BHA from 0 to 5×10⁻² M and AHA from 0 to
0.8 M, respectively. It can be pointed out that BHA and AHA does not have any absorption in
the range from 450 to 700 nm. The variations of the spectra reflect therefore the formation of
U(IV)-BHA complex.
450 500 550 600 650 700
0,00
0,04
0,08
0,12
0,16
0
0.2 eq
0.4 eq
0.8 eq
2.1 eq
10.4 eq
510-2 MA
bso
rban
ce
Wavelength, nm
0
CBHA
450 500 550 600 650 700
0,0
0,1
0,2
0,3
0,4
0
0.2 eq
0.4 eq
0.8 eq
1.0 eq
2.1 eq
10.4 eq
41.7 eq
83.3 eq
Ab
so
rban
ce
Wavelength, nm
0
0.8 M
CAHA
Figure IV.25 UV-visible absorption spectra of
U(IV) at 4.8×10⁻³ M with increasing amount of
BHA from 0 to 5×10⁻² M in 0.5 M HCl at
25 °C.
Figure IV.26 UV-visible absorption spectra
of U(IV) at 9.6×10⁻³ M with increasing
amount of AHA from 0 to 0.8 M in 0.5 M
HCl at 25 °C.
On the two figures, the characteristic bands of U(IV) appears at 485, 550 and 650 nm respec-
tively in absence of BHA or AHA, which is in good agreement with the literature [1960COH].
In both cases of BHA and AHA, with the increasing concentration of ligands, the bands around
485, 550, 650 and 675 nm are decreasing. The band around 485 nm is shifted to higher wave-
length and the band at 670 nm almost disappears when BHA and AHA concentrations are in-
creased to 5×10⁻² M and 0.8 M, respectively.

IV. Results and Discussion
86
The spectra have been processed with the software HypSpec. In order to start calculation, input
parameters (acid dissociation constants of ligand, estimated complexation constants) were in-
troduced into the software. According to principal component analysis (PCA), the number of
species existing in solution can be identified. In our condition, one complex with BHA and two
complexes with AHA have been observed.
The determined stability constants associated to the equilibrium (Equation IV.62 and Equa-
tion IV.64) are summarized in Table IV.11.
𝑀4+ + 𝐿− = 𝑀𝐿3+ IV.62
𝛽110 =[𝑀𝐿3+]
[𝑀4+][𝐿−] IV.63
𝑀4+ + 2𝐿− = 𝑀(𝐿)22+
IV.64
𝛽120 =[𝑀(𝐿)2
2+]
[𝑀4+][𝐿−]2 IV.65
Table IV.11 Stability constants β110 of AnIVL3+ (EquationIV.63) and β120 of AnIV(L)22+ (Equation
IV.65).
Lig-
and
Acti-
nide logβ110 logβ120 T, °C I, M Method Reference
BHA
Th(IV) 8.97±0.02 17.53 25 0.1(NaNO3) pot. [2007KHA]
Th(IV) 9.6 19.81 25 0.1(KNO3) pot. [1966BAR]
U(IV) 9.89 18.0 25 1.0(KClO4) pot. [1966BAR]
U(IV) 11.0±0.1a 25 0.5(HCl) sp. this work
U(IV) 11.8±0.1b 25 0.5(HCl) sp. this work
Pu(IV) 12.73 25 1.0(HClO4) sol. [1966BAR]
AHA
Th(IV) 10.50±0.03 19.70 25 0.1(NaNO3) pot. [2007KHA]
U(IV) 12.0±0.1c 21.1±0.1c 25 0.5(HCl) sp. this work
Pu(IV) 14.3±0.03 25±3 1.0(HClO4) sol. [2010BRO]
Pu(IV) 14.2±0.2 24.1±0.2 22 2.0(NaNO3) sp. [2007CAR]
a. Calculated with pKa (BHA) = 8.07±0.06 [2010AKS]
b. Calculated with pKa (BHA) = 8.83±0.01 [2011TUR]
c. Calculated with pKa (AHA) = 9.15 [2011CHU]
Due to the absence of pKa(BHA) in the literature corresponding to our experimental conditions,
the minimum and maximum pKa(BHA) were used in the calculation of constants. Depending
on the pKa value used, up to 2 orders of magnitude are observed in comparison with Baroca’s
work [1966BAR]. A. Barocas et al. determined the constant of ThBHA3+ by potentiometric

IV. Results and Discussion
87
titration in the pH range from 2.11 to 5.77. They observed a brown precipitation at pH = 5.77,
but the hydrolysis of U(IV) was not mentioned or considered in their work. In the case of AHA,
it is failed to find any literature related to the stability constant between U(IV) and AHA.
For binding of electrostatic nature, the interaction strength between An(IV) and organic ligand
is known to depend on the ionic radius of metal ion. For the same coordination number, a cor-
relation can be made between the stability constants and the inverse of ionic radius of An(IV)
[1976SHA] [1999CHA]. The stability constants of Th(IV) and Pu(IV) available in the literature
(Table IV.11) were used to represent this correlation considering a coordination number equal
to 8 in Figure IV.27. The values relative to U(IV) appear fully consistent with those of Th(IV)
and Pu(IV).
0,90 0,95 1,00 1,05 1,10
8
9
10
11
12
13
14
UBHA3+
(log = 9.89)
[1966BAR]
UBHA3+
(log = 11.0)
this work
UBHA3+
(log = 11.8)
this work
ThBHA3+
(log = 8.97)
[2007KHA]
log
110
1/r, (CN = 8)
PuBHA3+
(log = 12.73)
[1966BAR]
0,92 0,96 1,00 1,04 1,08
8
12
16
20
24
28
PuAHA3+
(14.3) [2007CAR]
UAHA3+
(12.03) this work
ThAHA3+
(10.50) [2007KHA]
Th(AHA)2+
2
(19.70) [2007KHA]
U(AHA)2+
2
(21.07) this work
Pu(AHA)2+
2
(24.1) [2007CAR]
log
log
log
1/r, (CN = 8)
Figure IV.27 Correlation of stability constants of Pu(IV), Th(IV) and U(IV) with BHA (left)
and AHA (right).
The molar absorbance spectra of each component for the complex U(IV)-BHA and U(IV)-AHA
have also been extracted using HypSpec software and shown in Figure IV.28 and Figure IV.29.

IV. Results and Discussion
88
450 500 550 600 650 700 750
0
10
20
30
40M
ola
r ab
so
rban
ce
Wavelength, nm
U(IV)BHA
U(IV)
450 500 550 600 650 700
0
10
20
30
40
Mo
lar
ab
so
rban
ce
Wavelength, nm
U(IV)
U(IV)AHA
U(IV)(AHA)2
Figure IV.28 Molar absorbance of U4+ and
UBHA3+.
Figure IV.29 Molar absorbance of U4+, UAHA3+
and U(AHA)22+.
B) Complexation of U(IV) with DFB
Figure IV.30 presents the variation of U(IV) absorption spectra as a function of DFB concen-
tration. There is no absorption of DFB in the range from 400 to 700 nm. The variations observed
on the figure arise from the formation of the complexation of U(IV) with DFB. The solutions
were measured immediately after the preparation, in order to avoid the hydrolysis of DFB at
high proton concentration (Appendix E). However, when the ligand equivalence is increased
from one to two, no apparent variation of absorption was observed, similarly to the case of the
complex Pu(IV)-DFB [2007NEU]. Therefore, the complex U(IV)-DFB formed in acidic media
(CHCl = 0.5 M) is not significantly influenced by the U(IV)/DFB ratio.
Figure IV.31 presents the variation of U(IV) absorption spectra as function pCH. It can be seen
that as the increase of pCH, the absorption tends to be decreasing due to the formation of U(IV)-
DFB complex, exhibiting the similar tendency as the system U(IV) with AHA or BHA (Figure
IV.26 and Figure IV.25). Increasing either pCH or ligand concentration favor the formation of
complex, leading to the decrease of absorption.
Overall, it is failed to observe a gradual and significant variation of U(IV) absorption in the
presence of DFB. Because U(IV) is quantitatively complexed with DFB and no free U(IV) can
be detectable by UV-vis spectrophotometer. Additionally, due to the degradation of DFB in
acidic solution, it is not possible to increase the acidity over 0.5 M HCl to weaken the complex-
ing ability of DFB. Thus, it is impossible to determine the stability constant of U(IV) with DFB
by direct UV-vis spectrophotometric titration. Alternatively, competition UV-vis spectropho-
tometric titration can be applied in the future work. This technique has been ever applied to
study the interaction between Pu(IV) and DFB in the presence of EDTA by Boukhalfa et al.

IV. Results and Discussion
89
[2007BOU]. Moreover, D.W. Whisenhunt et al. have also determined the stability constants of
Th(IV) and Pu(IV) with DFB and its derivatives by using indirect UV-vis spectrophotometric
titration competing with EDTA [1996WHI].
400 450 500 550 600 650 700
0,0
0,1
0,2
0,3
0,4
U(IV) without DFB
U(IV):DFB 1:0.5
U(IV):DFB 1:1
U(IV):DFB 1:2
Ab
so
rba
nc
e
Wavelength, nm
Ratio
400 450 500 550 600 650 700
0,00
0,05
0,10
0,15
0,20
Ab
so
rban
ce
Wavelength, nm
pCH 0.54
pCH 0.64
pCH 0.73
pCH 0.84
pCH 1.08
pCH 1.35
pCH
Figure IV.30 Absorption spectra of U(IV) at
9.6×10⁻³ M with different ratio U:DFB at
CHCl = 0.5 M in 0.5 M HCl.
Figure IV.31 Variation of U(IV) absorption
spectra as a function of pCH (pCH from 1.35 to
0.54, CU = 9.6×10⁻³ M, CDFB = 1.1×10⁻² M).

IV. Results and Discussion
90
Structural study with tetravalent actinides
IV.2.3 Structural study of the complexation of Th(IV) with DFB
by ATR-FTIR
The IR spectra of free ligand has been investigated and illustrated in Section IV.1.2.1. Figure
IV.32 presents the variation of infra-red absorption spectra of the complexation between Th(IV)
and DFB at the stoichiometric ratio 1:1 as a function of pH. Spectra have been scaled and offset
to facilitate their comparison.
3800 3600 3400 3200 3000 2800 2600
T %
Wavenumber, cm-1
DFB pH = 3
Th-DFB
pH
1700 1600 1500 1400 1300 1200 1100 1000 900 800
pH
Th-DFB
DFB pH = 3
T %
Wavenumber, cm-1
Figure IV.32 FTIR spectra of the air-dried Th(IV)-DFB complexes as a function of pH (from 1.3
to 9.1) CTh(IV) = CDFB = 2.5×10⁻² M at room temperature.
The most noticeable effect upon complexation with thorium is the shift of the absorption band
from 1620 cm-1 to 1589 cm-1 due to the coordination of thorium with the hydroxamate groups.
The hydroxamate carbonyl bands are affected due to the complexation with Th(IV). This shift
is observed even at low pH and the same shift is also observed when DFB is deprotonated
[2005EDW] [2010SIM]. By increasing the pH, the shift to lower frequencies is more significant
and leads to the exposure of the amide carbonyl bands at 1643 cm-1 and a disappearance of N-
H band at 1565 cm-1. The same behavior has been observed with successive deprotonation of
DFB [2005EDW] [2010SIM]. The amide carbonyl bands are not well resolved for the H4DFB+
and H3DFB species due to the overlapping with the hydroxamate carbonyl bands. The IR spec-
tra variation of Th-DFB complex at high frequencies is almost same as Eu-DFB complex (Fig-
ure IV.19 left).
An evidence of the thorium chelation with the hydroxamate groups is also the disappearance of
the OH deformation band at 1396 cm-1 and the shift at higher frequencies of the N-O bands as
it can be observed in ferrioxamine spectra [2005SIE].

IV. Results and Discussion
91
From pH = 3, no significant change is observed in the FTIR spectra. The only difference is
between pH = 6.5 and 7.6 where the band of the amide carbonyl at 1643 cm-1 is better resolved.
From study on the deprotonation of DFB, it is known that spectra of DFB3- and HDFB2- are
nearly identical since the last deprotonation is from the terminal amine group. Indeed, the N-H
deformation bands related to this functional group is weak and broad [2005EDW] [2010SIM].
It seems that from pH = 3, Th(HDFB)2+ or/and Th(DFB)+ are the main species in solutions, and
that from pH = 7, Th(DFB)+ becomes the majority complex. This result is in agreement with
the speciation diagram (Figure II.16) plotted using the stability constants obtained by Whisen-
hunt et al.11 [1996WHI] that depicts the presence of more than 50% of Th(HDFB)2+ at pH = 3
and the appearance of Th(DFB)+ at pH = 7.
Unfortunately, all the bands could not be assigned. An intense band was observed at 1349 cm-
1. This band is present from pH = 1.3 but is shifted until pH = 3. This is also the case for the
band at 835 cm-1. Those bands were only observed in presence of thorium which was not the
case in presence of iron or other studied metals. More experiments or calculations would be
needed to better understand those vibration bands. Hydrolysis or formations of hydrogen bonds
due to the drying process were suspected. However, in the case of Th(OH)4, stretching bands
of Th-O and O-H were observed at 528 and 3750 cm-1 respectively [2005WAN]. The assigned
vibrations of Th-DFB complexation are also summarized in Table IV.12 and compared with
Eu-DFB complexation.
The noticeable differences between Th-DFB and Eu-DFB complexes are the frequencies of
CH2 symmetrical and amide carbonyl vibrations. For a given ligand DFB, the size of hexa-
dentate chelation ring can be different depending on the specific center metal atom. It can prob-
ably affect the length of the carbon chain and further lead to the variation of CH2 vibrations.
It is unreasonable to observe the difference of amide carbonyl vibrations between Th-DFB and
Eu-DFB complexes. The amide carbonyl groups should not be involved in the complexation,
which has been proved by XRD using a very similar ligand as DFB [2000NEU]. One possibility
is due to the interference of the stronger and sharper bands from hydroxamate carbonyl groups
nearby. Moreover, it can be probably explained by the formation of hydrogen bonds in the
secondary amide. The samples of Th-DFB and Eu-DFB complexes were measured at different
pH, 9.1 and 9.4, respectively. And the pH was not determined precisely without considering the
ionic strength.

IV. Results and Discussion
92
Table IV.12 Frequencies and assignments of the major bands in the IR spectra of H4DFB+ at pH
= 3 and Th-DFB complex at pH = 9.1 Comparison with Eu-DFB complex at pH = 9.4.
Frequency Assignment
H4DFB+ Th-DFB Eu-DFB
3308 - - ν N-H (amide)
3100 - - ν O-H (hydroxamate)
2930 2933 2933 ν CH2 asymmetrical
2856 2860 2864 ν CH2 symmetrical
n.r. 1643 1638 ν C=O (amide)
1565 - - δ N-H, ρ C-N-H (amide)
1458 - - δ C-H (CH3)
1396 - - δ N-OH, δ O-H
1620 1589 1589 ν C=O (hydroxamate)

IV. Results and Discussion
93
IV.2.4 Structural study of the complexation of An(IV) with DFB
by theoretical calculations and EXAFS
This work has been carried out in close cooperation with Melody MALOUBIER (IPNO-PACS)
and Jérôme ROQUES (IPNO-Radiochimie).
A) Complexation of Th(IV) with DFB studied by DFT calculations
A.1 Computational details
All structures were optimized using density functional theory (DFT) approach as implemented
in the Gaussian09 package [2009FRI]. Calculations were performed using the hybrid B3LYP
functional [1993BEC]. MWB60 Stuttgart relativistic effective core potentials were used to de-
scribe thorium atoms while the 6-31+G* basis set was used for others. To take into account part
of the solvent effect, solvation was introduced using a dielectric continuum model of permit-
tivity ɛ = 80. The conductor-like polarizable continuum model implemented in Gaussian09 was
used. Vibrational harmonic frequencies, corresponding to the optimized structures, were also
calculated and compared to the experimental ones.
A.2 Deprotonation of ligand DFB
Since one DFB molecule contains three geometrically different hydroxamate groups (Figure
IV.33), the deprotonation process of ligand DFB alone is expected to be known by theoretical
calculation. However, the overall energy of the optimized structures of ligand DFB deproto-
nated at Site 1, 2 and 3 (Figure IV.34) are the same, indicating that they exhibit the same
stability. The overall energy of the structure of ligand DFB deprotonated at amine (Figure
IV.34) is 0.4 eV higher than those deprotonated at hydroxamate groups. It means that the depro-
tonation at amine should take place lastly, which is in good agreement with the dissociation
constants of DFB that pKa (amine) is larger than pKa (hydroxamate) [2010SIM] [2011CHR]
[2013TIR].
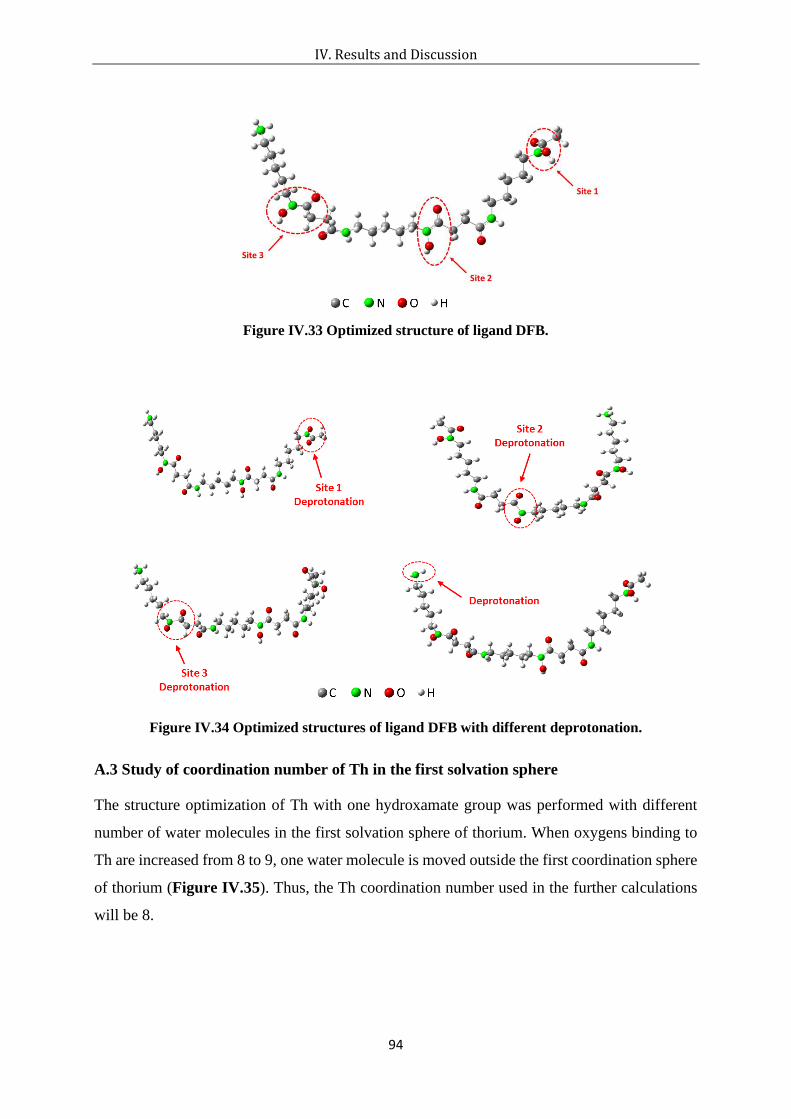
IV. Results and Discussion
94
Figure IV.33 Optimized structure of ligand DFB.
Figure IV.34 Optimized structures of ligand DFB with different deprotonation.
A.3 Study of coordination number of Th in the first solvation sphere
The structure optimization of Th with one hydroxamate group was performed with different
number of water molecules in the first solvation sphere of thorium. When oxygens binding to
Th are increased from 8 to 9, one water molecule is moved outside the first coordination sphere
of thorium (Figure IV.35). Thus, the Th coordination number used in the further calculations
will be 8.

IV. Results and Discussion
95
Figure IV.35 Optimized structures of Th with one hydroxamate group at coordination number =
8 (left) and 9 (right).
A.4 Stability investigation of the complex Th(H3DFB)
The optimized structures of the complex of Th with only one hydroxamate group (bidentate) at
different sites are presented in Figure IV.36 and the associated geometrical parameters are
summarized in Table IV.13. Whatever the one site coordinated to Th, the overall energy of the
complex Th(H3DFB) is the same. Additionally, the average bond distances Th-O (H2O) and
Th-O (hydroxamate) for different coordination sites are also very close. Thus, the complexes
of Th binding to one hydroxamate group (Site 1, 2 or 3) exhibit the approximately same stability
(E < 0.003 eV). The distances of Th-O (hydroxamate) are always larger than Th-O (H2O). It
is because Th displays higher interaction strength with hydroxamate groups than water mole-
cules.

IV. Results and Discussion
96
Figure IV.36 Optimized structures of the complex of Th with one hydroxamate group at Site 1
(first figure), Site 2 (second figure) and Site 3 (third figure).

IV. Results and Discussion
97
Table IV.13 Geometrical parameters associated with Figure IV.36 obtained by DFT calculations.
Distance Th(H3DFB)
Site 1, Å Site 2, Å Site3, Å
Th-O1 (H2O) 2.57 2.59 2.58
Th-O2 (H2O) 2.60 2.64 2.64
Th-O3 (H2O) 2.69 2.69 2.69
Th-O4 (H2O) 2.95 2.84 2.83
Th-O5 (H2O) 2.86 2.64 2.86
Th-O6 (H2O) 2.59 2.62 2.64
Average Th-O
(H2O) 2.71 2.67 2.71
Th-O7N 2.27 2.26 2.26
Th-O8C 2.40 2.38 2.37
Average Th-O (hy-
droxamate) 2.33 2.32 2.31
A.5 Stability investigation of the complex Th(H2DFB)
All the possibility of the complex of Th coordinated with two hydroxamate groups (bidentate)
were investigated. The most stable Th(H2DFB) complex is formed by binding to two bidentate
hydroxamate groups at Site 1 and Site 2. The optimized structure of the most stable Th(H2DFB)
complex is presented in Figure IV.37 and the associated geometrical parameters are summa-
rized in Table IV.14. It can be seen that the distances of Th-O (hydroxamate) for the same site
are increased. For instant, at Site 1, the distances of Th-O5N (2.28 Å) and Th-O6C (2.45 Å) in
the complexation with two bidentate hydroxamate groups are larger than those (2.27 Å and 2.40
Å) in the complexation with only one bidentate hydroxamate groups. It is led by the steric effect
in the complexation with two bidentate hydroxamate groups.

IV. Results and Discussion
98
Figure IV.37 Optimized structure of Th(H2DFB) complex obtained by DFT calculation.
Table IV.14 Geometrical parameters associated with Figure IV.37 obtained by DFT calculations.
Distance Th(H2DFB)
Distance Th(H2DFB)
Site 1 and Site 2, Å Site 1 and Site 2, Å
Th-O1 (H2O) 2.64 Th-O5N (Site 1) 2.28
Th-O2 (H2O) 2.79 Th-O6C (Site 1) 2.45
Th-O3 (H2O) 2.91 Th-O7N (Site 2) 2.35
Th-O4 (H2O) 2.77 Th-O8C (Site 2) 2.43
Average Th-O
(H2O) 2.78
Average Th-O (hy-
droxamate) 2.38
A.6 Stability investigation of the complex Th(HDFB)
The optimized structure of the most stable Th(HDFB) complex where Th is coordinated with
three hydroxamate groups (bidentate) is presented in Figure IV.38 and the associated geomet-
rical parameters are summarized in Table IV.15. It can be seen that the average distance of Th-
O (2.43 Å) (hydroxamate) in the complexation with three bidentate hydroxamate groups is
larger than that (2.38 Å) in the complexation with two bidentate hydroxamate gourps. Thus, the
distances are further increased due to the increasing steric constraint in the complexation with
three bidentate sites.

IV. Results and Discussion
99
Figure IV.38 Optimized structure of Th(HDFB) complex (three bidendate hydroxamates) ob-
tained by DFT calculations.
Table IV.15 Geometrical parameters associated with Figure IV.38 obtained by DFT calculations.
Distance Th(HDFB)
Site 1 Site 2 and Site 3 (bidentate)
Th-O1 (H2O) 2.73
Th-O2 (H2O) 2.65
Average Th-O (H2O) 2.69
Th-O3N (Site 1) 2.37
Th-O4C (Site 1) 2.51
Th-O5N (Site 2) 2.37
Th-O6C (Site 2) 2.46
Th-O7N (Site 3) 2.36
Th-O8C (Site 3) 2.49
Average Th-O (hydroxamate) 2.43
The complex structure of Th coordinated with three hydroxamate groups (monodentate and
bidentate) was also studied by DFB calculation. The optimized structure of the most stable
Th(HDFB) complex is presented in Figure IV.39 and the associated geometrical parameters
are summarized in Table IV.16. The distances of Th-O5N (2.26 Å) and Th-O8N (2.22 Å) at
monodentate sites (Site 1 and Site 3) are shorter than Th-O6N (2.36 Å) at bidentate Site 2,
indicating a higher coordination potential with monodentate sites. However, according to the

IV. Results and Discussion
100
EXAFS results, the use of monodentate coordination fashion did not allowed to obtain a better
fit.
Figure IV.39 Optimized structure of Th(HDFB) complex (one bidentate and two monodentate
hydroxamates) obtained by DFT calculations.
Table IV.16 Geometrical parameters associated with Figure IV.39 obtained by DFT calculations.
Distance
Th(HDFB)
Distance
Th(HDFB)
Site 1 and Site 3
(monondentate)
Site 2 (bidentate)
Site 1 and Site 3
(monondentate)
Site 2 (bidentate)
Th-O1 (H2O) 2.78 Th-O5N (Site 1) 2.26
Th-O2 (H2O) 2.70 Th-O6N (Site 2) 2.36
Th-O3 (H2O) 2.70 Th-O7C (Site 2) 2.44
Th-O4 (H2O) 2.71 Th-O8N (Site 3) 2.22
Average Th-O
(H2O) 2.72
Average Th-O (hy-
droxamate) 2.32
B) Complexation of Th(IV) and U(IV) with DFB studied by EXAFS
According to the speciation diagram (Figure II.16) plotted using literature data [1996WHI],
the species of Th(H3DFB)4+ and Th(HDFB)2+ are predominant at pH = 0.5 and 5, respectively.
Due to the instability of DFB at pH = 0.5, the structure of the Th(IV)-DFB complex has been
studied at pH = 5 using X-ray absorption fine structure. The EXAFS spectrum as well as its

IV. Results and Discussion
101
corresponding Fourier transform is presented in Figure IV.40. The experimental spectrum was
adjusted using the calculated structure (Figure IV.38) with the three hydroxamate sites (biden-
tate) coordinated to thorium. Indeed, both speciation diagrams and FTIR analysis seem to indi-
cate the formation of the deprotonated complex Th(HDFB)2+ at pH = 5. The EXAFS FT mod-
ulus exhibits an intense peak at R+ ≈ 1.9 Å (non phase shift corrected distance). This first peak
corresponds to a first oxygen shell around 2.3-2.5 Å. This oxygen contribution could not be
fitted with only one oxygen shell. Two distinct oxygen shells were observed, one at 2.36 Å with
3 oxygen atoms and a longer one at 2.45 Å with 5 oxygen atoms (Table IV.17). The total
coordination number of thorium was fixed at 8, according to the DFT calculations results. Un-
like the DFT calculations, the difference between Th-ON and Th-OC lengths (hydroxamate) is
due to the negative charge on ON atom, rather than due to the radial resolution (ΔR = π/2Δk =
0.13 Å). However, the average bond length (2.42 Å) is in agreement with the one calculated
from the DFT calculations (2.43 Å) (Table IV.15). The results obtained from the first coordi-
nation sphere seems to be in good agreement with the presence of the Th(HDFB)2+ with two
water molecules. However, the adjustment of the second coordination sphere (Th···C/N) leads
to a coordination number of 4. The distance Th···N/C was evaluated at 3.31 Å, which is in good
agreement with calculations (Th···C/N = 3.30 Å). Even if the quality factor seems to indicate a
good adjustment of the spectrum (Δχ 2 = 5.3), the number of carbon and nitrogen atoms around
the thorium does not indicate that the thorium is coordinated to three hydroxamate groups in
bidentate fashion. However, the uncertainty obtained on this coordination number is significant.
The observation of the EXAFS FT moduli pinpoints a contribution not well fitted around R+
≈ 3.2 Å. Gong et al. studied the speciation of U(VI) dioxo-diacetohydroxamate complex using
several techniques [2007GON]. They observed that in aqueous solution, according to the pH,
both binding fashion (monodentate and bidentate) were present. The Th-DFB spectrum was
also adjusted by considering at least one monodentate hydroxamate group. The use of mono-
dentate coordination fashion did not allow to obtain a better fit. In conclusion, the complex
configuration of Th with three bidentate hydroxamate groups in DFB well corresponds to the
experimental results of EXAFS.
It is important to notify that at the end of the EXAFS analyses, the thorium solution took a
bright orange color. The same coloration was not observed for the same solution not exposed
to the X-ray beam. However, no change was observed on the EXAFS spectra over time.

IV. Results and Discussion
102
Figure IV.40 k3-weighted EXAFS spectra and their corresponding Fourier transform at the Th
LIII edge of a solution of Th-DFB at pH = 5. Experimental spectrum (circles) and adjustment
(red line).
Table IV.17 EXAFS best fit parameters for the Th(IV) and U(IV)-DFB solutions at pH = 5. s02 is
the EXAFS global amplitude factor and is fixed to 1; ε is the average noise, Δχ2 is the quality fac-
tor and Rf(%) is the agreement factor of the fit.
Shell CN R(Å) σ2(Å2) Δe0(eV) ε(k) Rf(%) Δχ2
Th(IV)-DFB ON 3 2.36(1) 0.0084
3.1 0.00052 0.3 5.3 pH = 5, [Th(IV)]
= 5 mM, [DFB] =
6 mM
OC+OH2O 3+2 2.45(2) 0.0063
C/N 6 3.31(1) 0.0039
U(IV)-DFB O 6.2(2) 2.34(1) 0.0057
-2.9 0.00051 0.1 4.2 pH = 5, [U(IV)] =
5 mM, [DFB] = 6
mM
OH2O 1.8(2) 2.46(2) 0.0066
C/N 6.2(2) 3.25(1) 0.0030
The analogy with other tetravalent actinides was verified by studying the speciation of ura-
nium(IV) in presence of DFB at the same pH. In this way a solution of uranium(IV) with DFB
was prepared in the same conditions than the solution of Th(IV) with DFB ([U(IV)] = 5×10⁻³
M, [DFB] = 6×10⁻³ M, pH = 5). Because of the instability of U(IV), rongalite was introduced
in the solution to maintain the oxidation state to +IV. Possible redox reactions under large pho-
ton flux were expected, so the U(IV) samples were prepared at the last moment and analyzed
as soon as possible. The monitoring of the XANES spectra during the measurement did not
indicate the formation of significant amount of U(VI) under the beam (Supplementary figure
in Appendix E). The uranium sample does not show any U=O contribution from an oxo shell
around 1.80 Å. Figure IV.41 shows the EXAFS spectra of the U(IV)-DFB complex with its
0 2 4 6 8 10 12 14 16 18
-6
-4
-2
0
2
4
6
E
XA
FS
am
plit
ud
e in
k3.
(k)
Wave number k (Å-1)
0 2 4 6
0
1
2
3
4
5
6
7
FT
am
plit
ud
e in
k3.
(k)
Non phase shift corrected distance (Å)

IV. Results and Discussion
103
corresponding Fourier transforms (FT). The best fit parameters are reported in Table IV.17. As
the thorium sample, the spectrum was adjusted by considering a three bidentate coordination
configuration. A better adjustment was obtained with a coordination number set to nine instead
of eight. In this case, uranium(IV) has a similar behavior than plutonium(IV) with the sidero-
phore DFE [2000NEU]. DFE is a cyclic siderophore with functional groups to those in DFB.
0 2 4 6 8 10 12 14
-4
-2
0
2
4
EX
AF
S a
mp
litu
de in
k3.
(k)
Wave number k (Å-1)
0 1 2 3 4 5 6
0
1
2
3
4
5
6
7
8
FT
am
pli
tud
e i
n k
3.
(k)
Non phase shift corrected distance (Å)
Figure IV.41 k3-weighted EXAFS spectra and their corresponding Fourier transform at the U
LIII edge of a solution of U(IV)-DFB at pH = 5. Experimental spectrum (circles) and adjust-
ment (red line).
Thus, for uranium, the intense peak at R+ ≈ 1.9 Å was fitted by 6 oxygen atoms at 2.34 Å and
3 oxygen atoms at 2.46 Å characteristics of three water molecules. A better fit could be obtained
by using several U-O distances to distinguish oxygen atoms bonded to N or C; however, the
bond length resolution is also limited at 0.13 Å (ΔR = π/2Δk). The second coordination sphere
was fitted with 6 carbon and/or nitrogen atoms at 3.25 Å. Those values are in good agreement
with the distances determined by Neu et al. for the structure of Pu(IV)-desferrioxamine E
[2000NEU]. Three Pu-O bonds were isolated. The Pu-OH2O was evaluated at 2.46 Å, Pu-ON at
2.31 Å and Pu-OC at 2.36 Å leading to an average bond length for hydroxamates equal to 2.33
Å. The Pu-C and Pu-N distances were calculated at 3.21 Å.
The bond length difference between U-O, Pu-O and Th-O is mainly due to the difference of the
effective ionic radii. The effective ionic radii of those actinides are evaluated at 0.96, 1.00 and
1.05 for Pu4+, U4+ and Th4+ respectively [1976SHA].

IV. Results and Discussion
104
IV.3 Summary
The formation constants of Ln(H3DFB)3+ and Ln(H2DFB)2+ have been determined using two
different techniques (liquid-liquid extraction and UV-Vis absorption spectrophotometry) and
two different metal concentrations (tracer scale and macro-amount). The values obtained are
consistent and agree well with literature data. However, results from affinity capillary electro-
phoresis were found inconclusive. ATR-FTIR spectroscopy measurements were also performed
on solutions of equimolar Eu and DFB. The shift of the carbonyl band of hydroxamate group
with increasing pH has been correlated to the successive deprotonation of hydroxamate groups
due to the complexation, and thus to the successive formation of the complexes Eu(H3DFB)3+,
Eu(H2DFB)2+ and Eu(HDFB)+ in agreement with the speciation diagram.
The formation constants of Th(H3DFB)4+ and Th(H2DFB)3+ have been deduced from liquid-
liquid extraction experiments with 227Th. And those of U(BHA)3+, U(AHA)3+ and U(AHA)22+
have been deduced from UV-Vis absorption spectrophotometry measurements. The values ob-
tained are presented in Table IV.18 with the available literature data. The discrepancy observed
on the system Th-DFB could be explained not only by the difference in techniques, concentra-
tions and medium composition but also by the fact that several auxiliary data have been used
when calculating the stability constants.
Table IV.18 Formation constants obtained in this work and available in the literatures.
iM+nL+mH⇌MiLnHm βinm=[MiLnHm]/[M]i[L]n[H]m
Actinide Ligand logβ110 logβ120 Conditione Method Reference
227Th(IV) DFBa 40.9±0.1 38.2±0.1 0.7 M
(Na, HClO4) LLE this work
Th(IV) DFBa 42.0±0.1 40.2±0.1 0.1 M (KCl) pot. [1996WHI]
U(IV) BHAb 11.0±0.1 0.5 M (HCl) sp. this work
U(IV) BHAc 11.8±0.1 0.5 M (HCl) sp. this work
U(IV) AHAd 12.0±0.1 21.1±0.1 0.5 M (HCl) sp. this work
a. Calculated with pKa1 = 8.54±0.01 pKa2= 9.06±0.01 pKa3= 9.70±0.02 pKa4= 10.89±0.06 [2011CHR]
b. Calculated with pKa (BHA) = 8.07±0.06 [2010AKS]
c. Calculated with pKa (BHA) = 8.83±0.01 [2011TUR]
d. Calculated with pKa (AHA) = 9.15 [2011CHU]
e. Determined at T = 25 °C
EXAFS spectra have been registered on the complexes Th(IV)-DFB and U(IV)-DFB at pH =
5, where the species M(HDFB)+ is expected to be predominant. For Th(IV), the spectrum was
adjusted using optimized structures deduced from DFT calculations. The best fitting has been

IV. Results and Discussion
105
obtained by considering a bidendate coordination of 3 hydroxamate groups. The coordination
sphere was completed by 2 and 3 oxygen atoms of water molecules for Th(IV) and U(IV),
respectively.

V. Conclusion
106
V. Conclusion
The aim of this work was to determine thermodynamic and structural data on the complexation
of tri-and tetra-valent actinides with hydroxamate ligands, especially desferrioxamine B, a nat-
ural occurring organic ligand. These fundamental data indeed are essential to improve models
of actinides behavior in the environment.
Trivalent lanthanides were used to simulate trivalent actinides, whereas Th(IV) and U(IV) were
considered as Pu(IV) analogues. The thermodynamic study has been conducted using different
techniques and different metal concentration:
- Liquid-liquid extraction experiments combined with gamma spectroscopy were car-
ried out with 152Eu (commercial) and 227Th (purified at IPNO). In both cases, only complexes
of stoichiometry 1:1 have been identified, and the formation constants of two complexes
Eu(H3DFB)3+ / Eu(H2DFB)2+ and Th(H3DFB)4+ / Th(H2DFB)3+ have been determined.
- Affinity capillary electrophoresis with UV detector was used to investigate the com-
plexation of La and Lu with DFB. But no conclusive results were obtained. Since UV detector
can only monitor the mobility of DFB, experiments were performed with the metal in excess
over DFB. Multi-nuclear species can be probably formed, complicating data analysis.
- UV-Visible absorption spectrophotometry was used to study the complexation of
Eu(III), Pr(III), U(IV) with DFB and also aceto-and benzo-hydroxamate (AHA, BHA). The
constants of the complex Ln(H3DFB)3+ and Ln(H2DFB)2+ were obtained for two pH values
using HypSpec software. The stability constants of U(BHA)3+, U(AHA)3+ and U(AHA)22+ have
been determined in 0.5 M HCl. But the complexation constants of U(IV) with DFB could not
be determined because of their strong interaction.
The thermodynamic data obtained in the present work are in agreement with the scarce available
literature data (Table V.1) However, auxiliary data (hydrolysis constants, complexation con-
stants with acetate, TTA, acidity constants of DFB) and differences in the techniques and media
used are likely to increase sometimes discrepancies. Nevertheless, the protocols used in liquid-
liquid extraction and UV-Vis absorption spectrophotometry appear to be valid for further stud-
ies with trivalent actinides. Concerning Pu(IV), the use of UV-Vis spectrophotometry will re-
quire the development of a new method involving a competition with an organic ligand like
DTPA. Moreover, performing liquid-liquid extraction experiments with Pu at tracer scale
should include a step that ensure that Pu remains at the +IV oxidation state.

V. Conclusion
107
Table V.1 Obtained formation constants between trivalent lanthanides and DFB
iM+nL+mH⇌MiLnHm βinm=[MiLnHm]/[M]i[L]n[H]m
Actinide Ligand logβ113 logβ112 Conditionb Method Reference
152Eu(III) DFBa 35.4±0.2 30.9±0.2 25 °C LLE this work
Eu(III) DFBa 35.6±0.1 31.5±0.1 20 °C sp. this work
Eu(III) DFBa 35.72±0.06 30.91±0.06 25 °C pot. [2011CHR]
Pr(III) DFBa 35.1±0.1 29.9±0.1 20 °C sp. this work
Pr(III) DFBa 35.10 29.55 25 °C pot. [2011CHR]
Actinide Ligand logβ113 logβ112 Condition Method Reference
227Th(IV) DFBa 40.9±0.1 38.2±0.1 25 °C 0.7 M
(Na,HClO4) LLE this work
Th(IV) DFBa 42.0±0.1 40.2±0.1 25 °C
0.1 M (KCl) pot. [1996WHI]
Actinide Ligand logβ110 logβ120 Conditionf Method reference
U(IV) BHAc 11.0±0.1 0.5 M (HCl) sp. this work
U(IV) BHAd 11.8±0.1 0.5 M (HCl) sp. this work
U(IV) AHAe 12.0±0.1 21.1±0.1 0.5 M (HCl) sp. this work
a. Calculated with pKa1 = 8.54±0.01 pKa2= 9.06±0.01 pKa3= 9.70±0.02 pKa4= 10.89±0.06 [2011CHR]
b. Determined at I = 0.7 M (Na, HClO4)
c. Calculated with pKa (BHA) = 8.07±0.06 [2010AKS] d. Calculated with pKa (BHA) = 8.83±0.01 [2011TUR] e. Calculated with pKa (AHA) = 9.15 [2011CHU] f. Determined at T = 25 °C
The structural study has been carried out on DFB complexes of Eu(III), Th(IV) and U(IV) using
infrared and X-ray absorption spectroscopies combined with quantum chemistry calculations:
- By using ATR-FTIR spectroscopy, the main bands of DFB and its complex with Eu(III)
and Th(IV) have been assigned. In particular, the gradual shift of the hydroxamate carbonyl
band with increasing pH has been correlated to the successive deprotonation of hydroxamate
groups leading to the formation of Eu(H3DFB)3+ to Eu(HDFB)+, and Th(H3DFB)4+ to
Th(HDFB)2+.
- The structure of the possible Th-DFB complexes: Th(H3DFB), Th(H2DFB) and
Th(HDFB), have been optimized using DFT calculations, with a coordination number equal 8.
In the case of Th(HDFB) where the 3 hydroxamate groups are involved in bondings, bidentate
and monodentate have been considered.

V. Conclusion
108
- EXAFS measurements have been performed on samples of Th(IV) and U(IV) with
DFB at pH = 5 (predominance of Th(HDFB)2+). For Th(IV), EXAFS spectra were adjusted
using the calculated structure of of Th(HDFB). Th(IV) was shown to be coordinated by 3 biden-
date hydroxamates and 2 water molecules (Figure V.1). In the case of U(IV), a better adjust-
ment was obtained with a coordination number set to nine. The obtained distance are in good
agreement with the those of the complex Pu(IV)-desferrioxamine E [2000NEU].
Figure V.1 Structure of the complex Th(HDFB).
Microbial siderophores like DFB are strong chelating agents that are likely to influence the
mobility of actinides (IV) in the environment, otherwise rather characterized by their insolubil-
ity. Studying such systems remains challenging since on one hand, hydroxamates are not stable
in acidic media, and on the other hand, An(IV) exhibit a strong tendency towards hydrolysis
leading to polymers and colloids formation. Further thermodynamic studies should be per-
formed at higher pH than in the present work. For that purpose, new experimental protocols
have to be developed.

Appendix
109
Appendix
Appendix A: Preparation of solutions
1) HClO4 solution
A stock solution of perchloric acid (~3M) was prepared by dilution of concentrated perchloric
acid (70%, ACS Reagent, Sigma-Aldrich). Its concentration was determined by acid-base titra-
tion with fresh standard solution of 0.1 M NaOH.
2) NaClO4 solution
The stock solution of sodium perchlorate was prepared by dissolution of the monohydrate salt
NaClO4·H2O (≥ 99%, Fluka) in deionized water. The resulting solution was filtered on Milli-
pore Stericup Unit (0.2 µm). Its concentration was determined by gravimetry on 3 samples. The
error associated to the NaClO4 concentration was derived from the mean value of the 3 weighted
masses of the monohydrate salt obtained after drying of 500 µL of the stock solution.
3) TTA (2-Thenoyltrifluoroacetone) solution
The commercial TTA product (99%, Sigma-Aldrich) was contacted with deionized water for 7
days in order to get TTA in the hydrated form [1951KIN]. The hydrated TTA (P.M. 240.2 g/mol)
was recrystallized twice from diethyl ether [2003JAU]. The so-purified TTA was stored in a
glass bottle in a fridge at 8°C. The organic phases (TTA dissolved in toluene –Analytical Rea-
gent Grade, Fisher Chemical) were prepared just prior to use.
4) Ligand (AHA, BHA and DFB) solution
Acetohydroxamic acid (>98%, Sigma-Aldrich) and benzohydroxamic acid (> 98%, Alfa Aesar)
solutions have been prepared by solubilization of each reagent in electrolyte.
Desferriooxamine mesylate (>98.7%, Apollo Scientific) have been prepared in ionized water
or in electrolyte.
5) Stable lanthanide (La, Pr, Eu, Lu) solution
The stock solutions were prepared in deionized water or in electrolyte by dissolution of the salt
of La(NO3)3·6H2O, Pr(NO3)3·5H2O, Eu(NO3)3·5H2O and Lu(NO3)3·5H2O (>99%, ACS Rea-
gent, Sigma-Aldrich), respectively.

Appendix
110
6) Isotope 152Eu solution
The commercial solution of 152Eu (CERCA-LEA) is packaged in HCl in a sealed ampoule. In a
glove box, the whole solution has been evaporated and the residue taken up in 0.1 M HClO4.
At the time of its use, the 152Eu concentration was 7×10⁻⁷ M. Just prior to liquid-liquid extraction
experiments, a few µL of this stock solution was evaporated in a PTFE crucible and taken up
with 1300 µL of HClO4 solution which concentration corresponds to the pCH value under study.
This fresh solution was distributed over the twenty samples used for extraction and three refer-
ence for mass balance.
7) Organic and aqueous solutions for liquid-liquid extraction
Experiments of 152Eu(III)-DFB:
Organic phase: Toluene was used as the diluent and was pre-equilibrated with the electrolyte
for two days. The TTA stock solution was prepared by dissolution of TTA hydrate in pre-equil-
ibrated toluene and was filtered on WHATMAN filter (grade 3).
Aqueous phase: The electrolyte at I = 0.7 M was prepared with deionized water by dilution of
NaClO4 stock solution. The proton concentration of the electrolyte was adjusted to the desired
value with addition of 3 M HClO4 solution. The determination of proton concentration is de-
scribed in Appendix C. The DFB stock solution was prepared by dissolution of the salt in the
electrolyte of given ionic strength and pCH. Then dilution was carried out with same electrolyte.
Experiments of 227Th(IV)-DFB:
Organic phase: Toluene was used as the diluent and was pre-equilibrated with the electrolyte
for two days. The TTA stock solution was prepared by dissolution of TTA hydrate in pre-equil-
ibrated toluene. This organic phase was contacted with aqueous solution of 227Th(IV) (at a given
ionic strength and pCH) overnight away from light. After separation, 50 μL of this 227Th(IV)
loaded organic phase where introduced in samples for extraction experiments.
Aqueous phase: The electrolyte at I = 0.7 M was prepared with deionized water by dilution of
NaClO4 stock solution. The electrolyte was prepared at the desired value with addition of 3 M
HClO4 solution and 7 M NaClO4. The DFB stock solution was prepared by dissolution of the
salt in the electrolyte of given ionic strength and pCH. Then dilution was carried out with same
electrolyte.
Experiments were performed in glass vials covered by galxyl-parylene (Comelec).

Appendix
111
Appendix B: Influence of γ-ray energy for counting
The self-absorption (gamma-ray) is related to sample size, shape, density, chemical composi-
tion and emitted photon energy. In this work, 0.5 ml of aqueous solution or organic phase (TTA
in toluene) is measured with identical geometry by gamma-spectroscopy.
Figure A. 1 presents the distribution values (D0) of 152Eu between organic and aqueous phases
at pCH = 4.0 and 4.2 as function of energy (γ-ray characteristic peak of 152Eu).
0 200 400 600 800 1000 1200 1400 1600
0,1
1
10
D0 at pC
H = 4.2
D0 at pC
H = 4.0
D0
Energy, keV
Figure A. 1 Distribution values (D0) of 152Eu at pCH = 4.0 and 4.2 as function of energy (γ-ray
characteristic peak of 152Eu).
It can be seen that the distribution values (D0) are almost constant with the increase of counting
energy, indicating that the energy for counting in this work does not impact the distribution
value.

Appendix
112
Appendix C: Determination of proton concentration
The measurements of the proton concentration were carried out by a conventional assembly:
pH-meter and a glass electrode combined with a reference Ag/AgCl with saturated 3M NaCl
solution. However, the ionic strength of the studied solutions was different from commercial
buffer solutions. Thus, a range of buffer solution was prepared by mixing the stock solution of
NaClO4 and HClO4, in order to obtain the solutions at I = 0.7 M (Na, HClO4) with known proton
concentrations (CH = 0.1, 0.01 and 0.001 M). The potential (ΔE) was measured for each solution,
allowing plotting a calibration line. Thus, the value of pCH can be calculated by measuring ΔE
of the solution according to the calibration line [2012LEG].
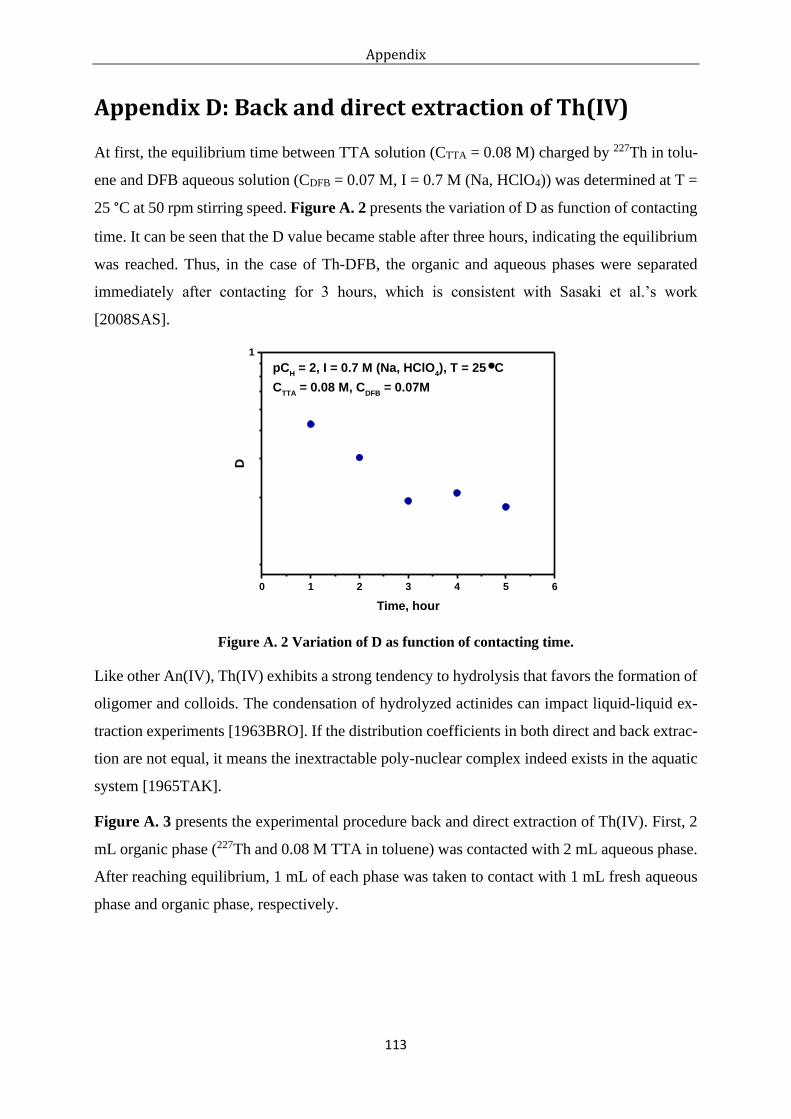
Appendix
113
Appendix D: Back and direct extraction of Th(IV)
At first, the equilibrium time between TTA solution (CTTA = 0.08 M) charged by 227Th in tolu-
ene and DFB aqueous solution (CDFB = 0.07 M, I = 0.7 M (Na, HClO4)) was determined at T =
25 °C at 50 rpm stirring speed. Figure A. 2 presents the variation of D as function of contacting
time. It can be seen that the D value became stable after three hours, indicating the equilibrium
was reached. Thus, in the case of Th-DFB, the organic and aqueous phases were separated
immediately after contacting for 3 hours, which is consistent with Sasaki et al.’s work
[2008SAS].
0 1 2 3 4 5 6
1
D
Time, hour
pCH = 2, I = 0.7 M (Na, HClO
4), T = 25 C
CTTA
= 0.08 M, CDFB
= 0.07M
Figure A. 2 Variation of D as function of contacting time.
Like other An(IV), Th(IV) exhibits a strong tendency to hydrolysis that favors the formation of
oligomer and colloids. The condensation of hydrolyzed actinides can impact liquid-liquid ex-
traction experiments [1963BRO]. If the distribution coefficients in both direct and back extrac-
tion are not equal, it means the inextractable poly-nuclear complex indeed exists in the aquatic
system [1965TAK].
Figure A. 3 presents the experimental procedure back and direct extraction of Th(IV). First, 2
mL organic phase (227Th and 0.08 M TTA in toluene) was contacted with 2 mL aqueous phase.
After reaching equilibrium, 1 mL of each phase was taken to contact with 1 mL fresh aqueous
phase and organic phase, respectively.

Appendix
114
Figure A. 3 Experimental procedure of back and direct extraction of Th(IV)
Figure A. 4 presents the values of D in the back and direct extraction of Th(IV) at pCH = 1, I =
0.7 M (Na, HClO4) without DFB and at pCH = 2, I = 0.7 M (Na, HClO4) with 0.07 M DFB. It
can be seen that the values of Dinitial, Ddirect and Dback are close to each other in the absence of
DFB, as well as in its presence. It is suggested that the inextractable poly-nuclear species of
Th(IV) is not significantly observed in this condition.
0,1
1
10
100
pCH = 1, T = 25 C, I = 0.7 M (Na, HClO
4)
without DFB
BackDirectD Initial
0,1
1
10
100
BackDirectInitial
pCH = 2, T = 25 C, I = 0.7 M (Na, HClO
4)
with 0.07 M DFB
D
Figure A. 4 Values of D in the back and direct extraction of Th(IV) at pCH = 1, I = 0.7 M (Na,
HClO4) without DFB (left) and at pCH = 2, I = 0.7 M (Na, HClO4) with 0.07 M DFB (right).

Appendix
115
Appendix E: Study of DFB Stability
In order to avoid the hydrolysis of tetravalent actinides, the solutions have been prepared in
acidic media. But DFB and hydroxamic acid are not stable [1959PLA]. The degradation of DFB
was studied in acidic media by UV-visible spectrophotometry.
First, the validity of Beer-Lambert law relative to DFB was checked: absorption spectra have
been registered at ambient temperature, pH = 4.0, I = 0.5 M with 10-5 M ≤ CDFB ≤ 5×10⁻⁶ M.
Figure A. 5 presents the corresponding absorption spectra. Figure A. 6 presents the experi-
mental variations of DFB absorbance at 200, 210 and 220 nm with its concentration and linear
fittings. Whatever the wavelength, Beer-Lambert law appears to be valid over the investigated
concentration.
200 220 240 260
0,0
0,1
0,2
0,3
0,4
Ab
so
rban
ce
Wavenumber, nm
CDFB
= 10-5 M
CDFB
= 910-6 M
CDFB
= 810-6 M
CDFB
= 710-6 M
CDFB
= 610-6 M
CDFB
= 510-6 M
4,0x10⁻⁶
6,0x10⁻⁶
8,0x10⁻⁶
1,0x10⁻⁵
1,2x10⁻⁵
0,0
0,1
0,2
0,3
0,4
0,5
200 nm R2 = 0.994
210 nm R2 = 0.992
220 nm R2 = 0.991
Ab
so
rba
nc
e
CDFB
, M
Figure A. 5 Absorption spectra of DFB at dif-
ferent concentrations (pH = 4.0 and I = 0.5 M
(Na, HClO4)).
Figure A. 6 Test of Lambert-Beer Law of
DFB at the concentration ranging from 10-5
to 5×10⁻⁶ M at pH = 4.0 and I = 0.5 M (Na,
HClO4) at the wavelength of 200, 210 and 220
nm.
The UV absorption of 1×10⁻⁵ M DFB solution at 200 nm was recorded as function of time at
the acidity 1 and 0.01 M as shown in Figure A. 7.

Appendix
116
10 100 1000 10000
0,05
0,10
0,15
0,20
0,25
0,30
0,35
CH = 1 M
CH = 0.01 M
Ab
so
rba
nc
e,
20
0 n
m
Time, min
Figure A. 7 Variation of UV absorbance of 1×10⁻⁵ M DFB solution at 200 nm as function of time.
It can be seen that DFB solution is almost stable at CH = 0.01 M (HClO4) and a visible degra-
dation at CH = 1.0 M (HClO4) can be observed after 40 min. The degradation of 1×10⁻⁵ M DFB
at CH = 0.1 M was also examined. The initial absorbance and the absorbance after one day
were compared and no significant difference is observed. Thus, it is not necessary to consider
the degradation of DFB at CH ≤ 0.1 M in this work.
The high acidities used in the experiments were 0.2 M (HClO4) for liquid-liquid extraction (Th-
DFB) and 0.5 M (HCl) for UV-vis absorption spectroscopy. The UV absorption of 2×10⁻⁵ M
DFB solution (pCH = 0.7) at 200, 210 and 220 nm was recorded as the increase of time. The
collected table is shown in Table A. 1.
The contacting time for liquid-liquid extraction (Th-DFB) is to be 3 hours. According to the
recorded values in the table, approximate 5 % of DFB is degraded at pCH = 0.7 from 3 to 4
hours. Thus, 5% degradation of DFB has been taken into account during the data treatment.

Appendix
117
Table A. 1 UV absorbance of 2×10⁻⁵ M DFB solution (pCH = 0.7) at 200, 210 and 220 nm as func-
tion of time.
Time,
min
Absorbance
200nm Degra-
dation 210nm
Degra-
dation 220nm
Degra-
dation
0 0.5268 0.00% 0.3280 0.00% 0.1451 0.00%
30 0.5195 1.39% 0.3226 1.65% 0.1422 2.00%
60 0.5165 1.96% 0.3194 2.62% 0.1419 2.21%
90 0.5137 2.49% 0.3160 3.66% 0.1411 2.76%
120 0.5125 2.71% 0.3136 4.39% 0.1410 2.83%
150 0.5090 3.38% 0.3126 4.70% 0.1400 3.51%
180 0.5043 4.27% 0.3098 5.55% 0.1393 4.00%
210 0.5033 4.46% 0.3085 5.95% 0.1369 5.65%
240 0.4963 5.79% 0.3073 6.31% 0.1369 5.65%
Supplementary figure for page 102:
17140 17160 17180 17200 17220
No
rma
lize
d a
bs
orb
an
ce
Energy, eV
U(IV)-DFB
1st scan
last scan
U(VI)-DFB
Supplementary figure for page 102: XANES spectra of U(IV)-DFB and U(VI)-DFB complexes.
In the XANES spectra of U(IV)-DFB, no significant variation between the first and last scans
is observed. The absorption edge and the dioxo shoulder band of UO22+ is not clearly observed
in the XANES spectra of U(IV)-DFB, which indicates that no significant amount of U(VI) was
formed under the beam.

118
Reference
[1945SEA] Seaborg, G. T. (1945). The chemical and radioactive properties of the heavy ele-
ments. Chemical & Engineering News Archive, 23(23), 2190-2193.
[1950DAY] Day, R. A., & Stoughton, R. W. (1950). Chemistry of thorium in aqueous solu-
tions. I. Some organic and inorganic complexes. Journal of the American Chem-
ical Society, 72(12), 5662-5666.
[1951KIN] King, E. L., & Reas, W. H. (1951). The hydration of thenoyltrifluoroacetone in
benzene solution. Journal of the American Chemical Society, 73(4), 1806-1808.
[1951ZEB] Zebroski, E. L., Alter, H. W., & Heumann, F. K. (1951). Thorium complexes with
chloride, fluoride, nitrate, phosphate and sulfate. Journal of the American Chem-
ical Society, 73(12), 5646-5650.
[1952WAG] Waggener, W. C., & Stoughton, R. W. (1952). Chemistry of Thorium in Aqueous
Solutions. II. Chloride Complexing as A Function of Ionic Strength. The Journal
of Physical Chemistry, 56(1), 1-5.
[1956KRA] Kraus, K. A., Moore, G. E., & Nelson, F. (1956). Anion-exchange Studies. XXI.
Th (IV) and U (IV) in hydrochloric acid. Separation of thorium, protactinium and
uranium. Journal of the American Chemical Society, 78(12), 2692-2695.
[1959ISH] Ishimori, T., & Nakamura, E. (1959). Distribution of neptunium between TBP
and some mineral acids. Bulletin of the Chemical Society of Japan, 32(7), 713-
720.
[1959NEW] Newton, T., & Rabideau, S. (1959). A review of the kinetics of the aqueous oxi-
dation–reduction reactions of uranium, neptunium, And plutonium. Journal of
Physical Chemistry, 63(3), 365-370.
[1959PLA] Plapinger, R. E. (1959). Ultraviolet absorption spectra of some hydroxamic acids
and hydroxamic acid derivatives. Journal of Organic Chemistry, 24(6), 802-804.
[1960COH] Cohen, D., & Carnall, W. T. (1960). Absorption spectra of uranium (iii) and ura-
nium (IV) in DClO4 solution. Journal of Physical Chemistry, 64(12), 1933-1936.
[1961POS] Poskanzer, A., & Foreman Jr, B. (1961). A summary of TTA extraction coeffi-
cients. Journal of Inorganic and Nuclear Chemistry, 16(3-4), 323-336.

119
[1963AND] Anderegg, G., Schwarzenbach, G., & Leplatte.F. (1963). Hydroxamatkom-
plexe .2. Die Anwendung der pH-Methode. Helvetica Chimica Acta, 46(4), 1400-
&.
[1963BRO] Brown, D., & Maddock, A. G. (1963). Protactinium. Quarterly Reviews, Chemi-
cal Society, 17(3), 289-341.
[1963SCH] Schwarzenbach, G., & Schwarzenbach, K. (1963). Hydroxamatkomplexe i. Die
Stabilität der Eisen(iii)-Komplexe einfacher Hydroxamsäuren und des Ferriox-
amins b. Helvetica Chimica Acta, 46(4).
[1965TAK] Takagi, J., & Shimojima, H. (1965). Studies on protactinium (V) in sulphuric acid
solution—I: Centrifugation study. Journal of Inorganic and Nuclear Chemistry,
27(2), 405-409.
[1966BAR] Barocas, A., Baroncelli, F., Biondi, G., & Grossi, G. (1966). The complexing
power of hydroxamic acids and its effect on behaviour of organic extractants in
the reprocessing of irradiated fuels—II: The complexes between benzohydrox-
amic acid and thorium, uranium (IV) and plutonium (IV). Journal of Inorganic
and Nuclear Chemistry, 28(12), 2961-2967.
[1968CAR] Carey, G. H., & Martell, A. E. (1968). Formation, hydrolysis, and olation of ura-
nium (IV) chelates. Journal of the American Chemical Society, 90(1), 32-38.
[1969EDR] Edroth, B. (1969). Adsorption of thorium and its TTA-complexes from aqueous
solutions. Acta Chem. Scand, 23(8), 6.
[1969NOR] Noren, B. (1969). Solvent extraction studies of the formation of fluoride and sul-
phate complexes of zirconium (IV). Acta Chem. Scand, 23(2).
[1970CLE] Cleveland, J. M. (1970). The Chemistry of Plutonium. Gordon and Beach. New
York, USA.
[1970IKE] Ikeda, N., Kimura, K., Asai, H., & Oshima, N. (1970). Extraction behavior of
europium with thenoyltrifluoroacetone (TTA). Radioisotopes, 19(1), 1-6.
[1972MET] Metivier, H., Guillaumont, R. (1972). Hydrolyse du plutonium tétravalent. Radi-
ochem. Radioanal. Lett., 10, 27-35.

120
[1974SIL] Silva, R., McDowell, W., Keller, O., & Tarrant, J. (1974). Comparative solution
chemistry, ionic radius, and single ion hydration energy of nobelium. Inorganic
Chemistry, 13(9), 2233-2237.
[1975DAV] Davydov, Yu.P., & Efremenkov, V.M. (1975). Investigation of the hydrolytic
properties of tetravalent uranium: II. Conditions of formation of mononuclear and
polynuclear hydroxo complexesof U(IV). Sov. Radiochem., 17, 160-164.
[1975LIU] Liu, C. Y., & Sun, P. J. (1975). Studies of rare-earth metal-complexes of hydrox-
amic acids. Journal of the Chinese Chemical Society, 22(4), 317-330.
[1976SHA] Shannon, R. D. (1976). Revised effective ionic-radii and systematic studies of
interatomic distances in halides and chalcogenides. Acta Crystallographica Sec-
tion A, 32, 751-767.
[1978JOH] Johnson, G. L., & Toth, L. M. (1978). Plutonium (IV) and thorium (IV) hydrous
polymer chemistry. Oak Ridge National Lab. Tennessee, USA.
[1978PYY] Pyykkö, P. (1978). Relativistic Quantum Chemistry. Advances in Quantum
Chemistry (Vol. 11, pp. 353-409). Academic Press.
[1980PER] Perkins, R. W., & Thomas, C. W. (1980). Worldwilde Fallout. In: Transuranic
Elements in the Environment Worldwide Fallout (ed. W. C. Hanson), Technical
Information Center, Department of Energy, Springfield, MO, pp. 53–82.
[1980POW] Powell, P. E., Cline, G. R., Reid, C. P. P., & Szaniszlo, P. J. (1980). Occurrence
of hydroxamate siderophore iron chelators in soils. Nature, 287(5785), 833-834.
[1982JEN] Jensen, W. B. (1982). The positions of lanthanum (actinium) and lutetium (law-
rencium) in the periodic table. Journal of Chemical Education, 59, 634, 1982.
[1983CAC] Caceci, M. S., & Choppin, G. R. (1983). The determination of the 1st hydrolysis
constant of Eu(III) and Am(III). Radiochimica Acta, 33(2-3), 101-104.
[1983CHO] Choppin, G. R. (1983). Solution chemistry of the actinides. Radiochimica Acta,
32(1-3), 43-53.
[1986KAT] Katz, J. J., Seaborg, G. T., & Morss, L. R. (1986). Summary and comparative
aspects of the actinide elements. The chemistry of the actinide elements. Springer
Netherlands. New York, USA.

121
[1988PYY] Pyykko, P. (1988). Relativistic effects in structural chemistry. Chemical Reviews,
88(3), 563-594.
[1989BOR] Borgias, B., Hugi, A. D., & Raymond, K. N. (1989). Isomerization and solution
structures of desferrioxamine B complexes of aluminum(3+) and gallium(3+).
Inorganic Chemistry, 28(18), 3538-3545.
[1989EVE] Evers, A., Hancock, R. D., Martell, A. E., & Motekaitis, R. J. (1989). Metal-ion
recognition in ligands with negatively charged oxygen donor groups - complexa-
tion of Fe(iii), Ga(iii), In(iii), Al(iii), and other highly charged metal-ions. Inor-
ganic Chemistry, 28(11), 2189-2195.
[1989HAR] Harris, D. C., & Bertolucci, M. D. (1989). Symmetry and spectroscopy: an intro-
duction to vibrational and electronic spectroscopy. Courier Corporation.
[1989KOI] Koide, Y., Uchino, M., Shosenji, H., & Yamada, K. (1989). Studies of collec-
tors .10. Complexing ability of amino hydroxamic acid ligands with dioxoura-
nium(IV) in aqueous-solution. Bulletin of the Chemical Society of Japan, 62(11),
3714-3715.
[1989MOH] Mohapatra, P., & Khopkar, P. (1989). Hydrolysis of actinides and lanthanides:
hydrolysis of some trivalent actinide and lanthanide ions studied by extraction
with thenoyltrifluoroacetone. Polyhedron, 8(16), 2071-2076.
[1989ROS] Rosch, F., Reimann, T., Buklanov, G. V., Milanov, M., & Khalkin, V. A. (1989).
Electromigration of carrier-free radionuclides .8. Hydrolysis of Cf-249(III) in
aqueous-solution. Radiochimica Acta, 47(4), 187-189.
[1992BRA] Brainard, J. R., Strietelmeier, B. A., Smith, P. H., Langstonunkefer, P. J., Barr,
M. E., & Ryan, R. R. (1992). Actinide binding and solubilization by microbial
siderophores. Radiochimica Acta, 58-9, 357-363.
[1992GRE] Grenthe, I., Wanner, H., Forest, I., & Agency, O. N. E. (1992). Chemical thermo-
dynamics of uranium. North-Holland. Amsterdam, Netherlands.
[1992HEN] Henry, M., Jolivet, J. P., & Livage, J. (1992). Aqueous chemistry of metal-cations
- hydrolysis, condensation and complexation. Structure and Bonding, 77, 153-
206.

122
[1992RYD] Rydberg, J., Cox, M., Musikas, C.& Choppin, G.R. (1992). Principles and prac-
tices of solvent extradction. Marcel Dekker. New York, USA.
[1993ADL] Adloff, J. P. (2018). Fundamentals of Radiochemistry. CRC Press. Boca Raton,
USA.
[1993BEC] Becke, A. D. (1993). Density‐functional thermochemistry. III. The role of exact
exchange. J. Chem. Phys. 98, 5648.
[1993CLA] Clark, B. J., Frost, T., & Russell, M. A. (1993). UV Spectroscopy: Techniques,
instrumentation and data handling (Vol. 4). Springer Science & Business Media.
Suffolk, UK.
[1993GUZ] Guzman, N. A. (1993). Capillary electrophoresis technology (Vol. 64). CRC
Press. New York, USA.
[1993MIR] Mirabella Jr, F. M. (1993). Practical spectroscopy series. Internal reflection spec-
troscopy: Theory and Applications, 17-52. Marcel Dekker. New York, USA.
[1994BAL] Balasubramanian, K. (1994). Relativistic effects and electronic structure of lan-
thanide and actinide molecules. In “Handbook on the physics and chemistry of
rare earths” (vol. 18, pp. 29-158): Elsevier. Online.
[1995NEI] Neilands, J. B. (1995). Siderophores - structure and function of microbial iron
transport compounds. Journal of Biological Chemistry, 270(45), 26723-26726.
[1995YAT] Yatsimirskii, K. B. (1995). Relativistic effects in chemistry. Theoretical and Ex-
perimental Chemistry, 31(3), 153-168.
[1996AIH] AlHashimi, A., Evans, G. J., & Cox, B. (1996). Aspects of the permanent storage
of uranium tailings. Water Air and Soil Pollution, 88(1-2), 83-92.
[1996BER] Bernhard, G., Geipel, G., Brendler, V., & Nitsche, H. (1996). Speciation of ura-
nium in seepage waters of a mine tailing pile studied by time-resolved laser-in-
duced fluorescence spectroscopy (TRLFS). Radiochimica Acta, 74(s1), 87-92.
[1996GAN] Gans, P., Sabatini, A., & Vacca, A. (1996). Investigation of equilibria in solution.
Determination of equilibrium constants with the HYPERQUAD suite of pro-
grams. Talanta, 43(10), 1739-1753.

123
[1996HER] Hernlem, B. J., Vane, L. M., & Sayles, G. D. (1996). Stability constants for com-
plexes of the siderophore desferrioxamine B with selected heavy metal cations.
Inorganica Chimica Acta, 244(2), 179-184.
[1996RYD] Rydberg, J. (1996). Hydrophilic actinide complexation studied by solvent extrac-
tion radiotracer technique. SKB Technical Report. SKB-TR-96-17.
[1996WHI] Whisenhunt, D. W., Neu, M. P., Hou, Z. G., Xu, J., Hoffman, D. C., & Raymond,
K. N. (1996). Specific sequestering agents for the actinides .29. Stability of the
thorium(IV) complexes of desferrioxamine B (DFO) and three octadentate cate-
cholate or hydroxypyridinonate DFO derivatives: DFOMTA, DFOCAMC, and
DFO-1,2-HOPO. Comparative stability of the plutonium(IV) DFOMTA com-
plex. Inorganic Chemistry, 35(14), 4128-4136.
[1996XIA] Xia, Y. X., Chen, J. F., & Choppin, G. R. (1996). Solubility, dissociation and
complexation with Nd(III) and Th(IV) of oxine, thenoyltrifluoroacetone and
1,10-phenanthroline in 5.0 m NaCl. Talanta, 43(12), 2073-2081.
[1997DAC] Dacheux, N., & Aupiais, J. (1997). Determination of uranium, thorium, pluto-
nium, americium, and curium ultratraces by photon electron rejecting α liquid
scintillation. Analytical Chemistry, 69(13), 2275-2282.
[1997MCN] McNaught, A. D., & McNaught, A. D. (1997). Compendium of chemical termi-
nology (Vol. 1669). Blackwell Science Oxford.
[1997PEA] Pearson, R.G. (1997). Chemical Hardness. Wiley-VCH. Weinheim, Germany.
[1998BEA] Beasley, T. M., Kelley, J. M., Maiti, T. C., & Bond, L. A. (1998). 237Np 239Pu
atom ratios in integrated global fallout: a reassessment of the production of
237Np. Journal of Environmental Radioactivity, 38(2), 133-146.
[1998CON] Conradson, S. D., AlMahamid, I., Clark, D. L., Hess, N. J., Hudson, E. A., Neu,
M. P., Palmer, P. D., Runde, W. H., & Tait, C. D. (1998). Oxidation state deter-
mination of plutonium aquo ions using X-ray absorption spectroscopy. Polyhe-
dron 17, 599-602.
[1998TAY] Taylor, R. J., May, I., Wallwork, A. L., Denniss, I. S., Hill, N. J., Galkin, B. Y., ...
& Fedorov, Y. S. (1998). The applications of formo-and aceto-hydroxamic acids
in nuclear fuel reprocessing. Journal of Alloys and Compounds, 271, 534-537.

124
[1999CHA] Chaudhuri, N. K., Sawant, R. M., & Sood, D. D. (1999). A critical review on the
stability constants of the fluoride complexes of actinides in aqueous solution and
their correlation with fundamental properties of the ions. Journal of Radioanalyt-
ical and Nuclear Chemistry, 240(3), 993-1011.
[1999FAR] Farkas, E., Enyedy, E. A., & Csoka, H. (1999). A comparison between the che-
lating properties of some dihydroxamic acids, desferrioxamine B and acetohy-
droxamic acid. Polyhedron, 18(18), 2391-2398.
[1999KER] Kersting, A. B., Efurd, D. W., Finnegan, D. L., Rokop, D. J., Smith, D. K., &
Thompson, J. L. (1999). Migration of plutonium in ground water at the Nevada
Test Site. Nature, 397(6714), 56-59.
[1999MOL] Moll, H., Denecke, M. A., Jalilehvand, F., Sandstrom, M., & Grenthe, I. (1999).
Structure of the aqua ions and fluoride complexes of uranium(IV) and tho-
rium(IV) in aqueous solution: an EXAFS study. Inorganic Chemistry, 38(8),
1795-1799.
[2000CLA] Clark, D. L. (2000). The chemical complexities of plutonium. Los Alamos Sci-
ence, 26, 364-381.
[2000EKB] Ekberg, C., Albinsson, Y., Comarmond, M. J., & Brown, P. L. (2000). Studies on
the complexation behavior of thorium(IV). 1. Hydrolysis equilibria. Journal of
Solution Chemistry, 29(1), 63-86.
[2000KLU] Klungness, G. D., & Byrne, R. H. (2000). Comparative hydrolysis behavior of
the rare earths and yttrium: the influence of temperature and ionic strength. Pol-
yhedron, 19(1), 99-107.
[2000NEU] Neu, M. P., Matonic, J. H., Ruggiero, C. E., & Scott, B. L. (2000). Structural
characterization of a plutonium (IV) siderophore complex: single‐crystal struc-
ture of pu‐desferrioxamine E. Angewandte Chemie International Edition, 39(8),
1442-1444.
[2000OBR] O'Brien, E. C., Farkas, E., Gil, M. J., Fitzgerald, D., Castineras, A., & Nolan, K.
B. (2000). Metal complexes of salicylhydroxamic acid (H(2)Sha), anthranilic hy-
droxamic acid and benzohydroxamic acid. Crystal and molecular structure of
Cu(phen)(2)(Cl) Cl center dot H(2)Sha, a model for a peroxidase-inhibitor com-
plex. Journal of Inorganic Biochemistry, 79(1-4), 47-51.

125
[2000STU] Stuart, B. (2000). Infrared spectroscopy. Kirk‐Othmer encyclopedia of chemical
technology. John Wiley & Sons. Online.
[2001ANT] Antonio, M. R., Soderholm, L., Williams, C. W., Blaudeau, J. P., & Bursten, B.
E. (2001). Neptunium redox speciation. Radiochimica Acta, 89(1), 17-25.
[2001LEM] Lemire, R. J. (2001). Chemical thermodynamics of neptunium and plutonium
(Vol. 4).
[2002MAD] Madic, C., Lecomte, M., Baron, P., & Boullis, B. (2002). Separation of long-lived
radionuclides from high active nuclear waste. Comptes Rendus Physique, 3(7-8),
797-811.
[2002NEC] Neck, V., Muller, R., Bouby, M., Altmaier, M., Rothe, J., Denecke, M. A., &
Kim, J. I. (2002). Solubility of amorphous Th(IV) hydroxide - application of
LIBD to determine the solubility product and EXAFS for aqueous speciation.
Radiochimica Acta, 90(9-11), 485-494.
[2002ROT] Rothe, J., Denecke, M. A., Neck, V., Muller, R., & Kim, J. I. (2002). XAFS in-
vestigation of the structure of aqueous thorium(IV) species, colloids, and solid
thorium(IV) oxide/hydroxide. Inorganic Chemistry, 41(2), 249-258.
[2002SAN] Santschi, P. H., Roberts, K. A., & Guo, L. D. (2002). Organic mature of colloidal
actinides transported in surface water environments. Environmental Science &
Technology, 36(17), 3711-3719.
[2002SIN] Sinkov, S., & Choppin, G. (2002). Acetohydroxamic acid complexes with triva-
lent f-block metal cations. Journal of Nuclear Science and Technology, 39, 359-
362.
[2003GUI] Guillaumont, R. et al. (2003). Update on the chemical thermodynamic of ura-
nium, neptunium, plutonium, americium and technetium, Elsevier, OCDE, Am-
sterdan
[2003JAU] Jaussaud, C. (2003). Contribution à l'étude thermodynamique de l'hydrolyse de
Pa (V) à l'échelle des traces par la technique d'extraction liquide-liquide avec la
thenoyltrifluoroacetone (TTA): caractérisation du partage de la thenoyltrifluoroa-
cetone dans le système TTA/H2O/toluène/Na+/H+/CIO4- (Doctoral dissertation,
Paris 11).
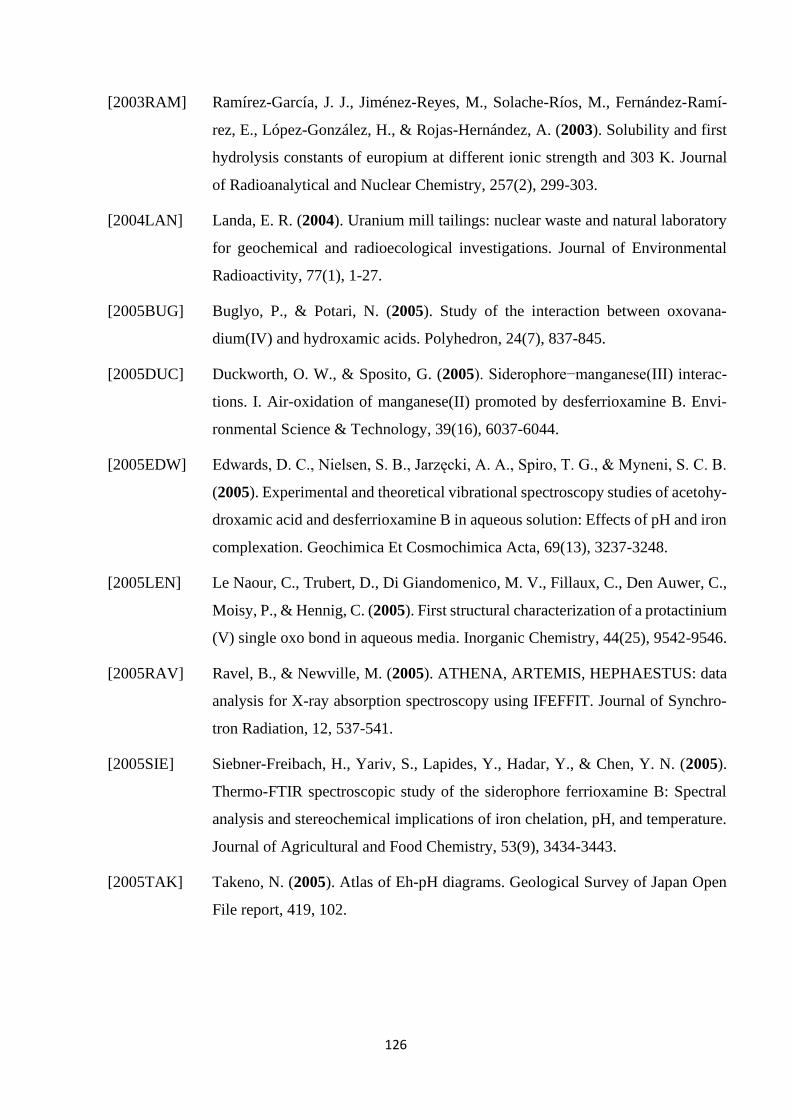
126
[2003RAM] Ramírez-García, J. J., Jiménez-Reyes, M., Solache-Ríos, M., Fernández-Ramí-
rez, E., López-González, H., & Rojas-Hernández, A. (2003). Solubility and first
hydrolysis constants of europium at different ionic strength and 303 K. Journal
of Radioanalytical and Nuclear Chemistry, 257(2), 299-303.
[2004LAN] Landa, E. R. (2004). Uranium mill tailings: nuclear waste and natural laboratory
for geochemical and radioecological investigations. Journal of Environmental
Radioactivity, 77(1), 1-27.
[2005BUG] Buglyo, P., & Potari, N. (2005). Study of the interaction between oxovana-
dium(IV) and hydroxamic acids. Polyhedron, 24(7), 837-845.
[2005DUC] Duckworth, O. W., & Sposito, G. (2005). Siderophore−manganese(III) interac-
tions. I. Air-oxidation of manganese(II) promoted by desferrioxamine B. Envi-
ronmental Science & Technology, 39(16), 6037-6044.
[2005EDW] Edwards, D. C., Nielsen, S. B., Jarzęcki, A. A., Spiro, T. G., & Myneni, S. C. B.
(2005). Experimental and theoretical vibrational spectroscopy studies of acetohy-
droxamic acid and desferrioxamine B in aqueous solution: Effects of pH and iron
complexation. Geochimica Et Cosmochimica Acta, 69(13), 3237-3248.
[2005LEN] Le Naour, C., Trubert, D., Di Giandomenico, M. V., Fillaux, C., Den Auwer, C.,
Moisy, P., & Hennig, C. (2005). First structural characterization of a protactinium
(V) single oxo bond in aqueous media. Inorganic Chemistry, 44(25), 9542-9546.
[2005RAV] Ravel, B., & Newville, M. (2005). ATHENA, ARTEMIS, HEPHAESTUS: data
analysis for X-ray absorption spectroscopy using IFEFFIT. Journal of Synchro-
tron Radiation, 12, 537-541.
[2005SIE] Siebner-Freibach, H., Yariv, S., Lapides, Y., Hadar, Y., & Chen, Y. N. (2005).
Thermo-FTIR spectroscopic study of the siderophore ferrioxamine B: Spectral
analysis and stereochemical implications of iron chelation, pH, and temperature.
Journal of Agricultural and Food Chemistry, 53(9), 3434-3443.
[2005TAK] Takeno, N. (2005). Atlas of Eh-pH diagrams. Geological Survey of Japan Open
File report, 419, 102.

127
[2005WAN] Wang, X. F., & Andrews, L. (2005). Infrared spectra and structures of the
Th(OH)(2) and Th(OH)(4) molecules. Physical Chemistry Chemical Physics,
7(22), 3834-3838.
[2006COZ] Cozar, O., Leopold, N., Jelic, C., Chiş, V., David, L., Mocanu, A., & Tomoaia-
Cotişel, M. (2006). IR, Raman and surface-enhanced Raman study of desferriox-
amine B and its Fe(III) complex, ferrioxamine B. Journal of Molecular Structure,
788(1), 1-6.
[2006KIT] Kitano, H., Onishi, Y., Kirishima, A., Sato, N., & Tochiyama, O. (2006). Deter-
mination of the thermodynamic quantities of complexation between Eu(III) and
carboxylic acids by microcalorimetry. Radiochimica Acta, 94(9-11), 541-547.
[2006NOV] Novikov, A. P., Kalmykov, S. N., Utsunomiya, S., Ewing, R. C., Horreard, F.,
Merkulov, A., Myasoedov, B. F. (2006). Colloid transport of plutonium in the
far-field of the Mayak production association. Russia. Science, 314(5799), 638-
641.
[2006SIM] Simionato, A. V. C., Cantú, M. D., & Carrilho, E. (2006). Characterization of
metal-deferoxamine complexes by continuous variation method: A new approach
using capillary zone electrophoresis. Microchemical Journal, 82(2), 214-219.
[2006SZA] Szabo, Z., Toraishi, T., Vallet, V., & Grenthe, I. (2006). Solution coordination
chemistry of actinides: Thermodynamics, structure and reaction mechanisms. Co-
ordination Chemistry Reviews, 250(7-8), 784-815.
[2007BOU] Boukhalfa, H., Reilly, S. D., & Neu, M. P. (2007). Complexation of Pu(IV) with
the natural siderophore desferrioxamine B and the redox properties of Pu(IV)(si-
derophore) complexes. Inorganic Chemistry, 46(3), 1018-1026.
[2007CAR] Carrott, M. J., Fox, O. D., Maher, C. J., Mason, C., & Taylor, R. J. (2007). Solvent
extraction behavior of plutonium (IV) ions in the presence of simple hydroxamic
acids. Solvent Extraction and Ion Exchange, 25(6), 723-745.
[2007CHO] Choppin, G. R. (2007). Actinide speciation in the environment. Journal of Radi-
oanalytical and Nuclear Chemistry, 273(3), 695-703.

128
[2007GLO] Glorius, M., Moll, H., & Bernhard, G. (2007). Complexation of uranium(VI) with
aromatic acids in aqueous solution - a comparison of hydroxamic acids and ben-
zoic acid. Radiochimica Acta, 95(3), 151-157.
[2007GON] Gong, C. M. S., Poineau, F., & Czerwinski, K. R. (2007). Synthesis and charac-
terization of the solid uranium(VI) dioxo-diacetohydroxamate complex. Radi-
ochimica Acta, 95(8), 439-450.
[2007HEN] Hennig, C., Schmeide, K., Brendler, V., Moll, H., Tsushima, S., & Scheinost, A.
C. (2007). EXAFS investigation of U(VI), U(IV), and Th(IV) sulfato complexes
in aqueous solution. Inorganic Chemistry, 46(15), 5882-5892.
[2007KHA] Khalil, M. M., El-Deeb, M. M., & Mahmoud, R. K. (2007). Equilibrium studies
of binary systems involving lanthanide and actinide metal ions and some selected
aliphatic and aromatic monohydroxamic acids. Journal of Chemical and Engi-
neering Data, 52(5), 1571-1579.
[2007SIN] Sinkov, S. I., Choppin, G. R., & Taylor, R. J. (2007). Spectrophotometry and
luminescence spectroscopy of acetohydroxamate complexes of trivalent lantha-
nide and actinide ions. Journal of Solution Chemistry, 36(6), 815-830.
[2008CHE] Chen, Z., & Weber, S. G. (2008). Determination of binding constants by affinity
capillary electrophoresis, electrospray ionization mass spectrometry and phase-
distribution methods. Trends in Analytical Chemistry, 27(9), 738-748.
[2008CAR] Carrott, M. J., Fox, O. D., LeGurun, G., Jones, C. J., Mason, C., Taylor, R. J., ...
& Boxall, C. (2008). Oxidation–reduction reactions of simple hydroxamic acids
and plutonium (IV) ions in nitric acid. Radiochimica Acta, 96(6), 333-343.
[2008FAR] Farkas, E., Batka, D., Kremper, G., & Pocsi, I. (2008). Structure-based differ-
ences between the metal ion selectivity of two siderophores desferrioxamine B
(DFB) and desferricoprogen (DFC): Why DFC is much better Pb(II) sequestering
agent than DFB? Journal of Inorganic Biochemistry, 102(8), 1654-1659.
[2008LAV] Lavelle, L. (2008). Lanthanum (La) and actinium (Ac) should remain in the d-
block. Journal of Chemical Education, 85(11), 1482.
[2008RAN] Rand, M. H., Mompean, F. J., Perrone, J., & Illemassène, M. (2008). Chemical
Thermodynamics of Thorium. OECD Publications, Paris, France.

129
[2008SAS] Sasaki, T., Takaoka, Y., Kobayashi, T., Fujii, T., Takagi, I., & Moriyama, H.
(2008). Hydrolysis constants and complexation of Th(IV) with carboxylates. Ra-
diochimica Acta, 96(12), 799-803.
[2009BOR] Borer, P., Hug, S. J., Sulzberger, B., Kraemer, S. M., & Kretzschmar, R. (2009).
ATR-FTIR spectroscopic study of the adsorption of desferrioxamine B and aero-
bactin to the surface of lepidocrocite (γ-FeOOH). Geochimica Et Cosmochimica
Acta, 73(16), 4661-4672.
[2009FRI] Frisch, M. J., Trucks, G. W., Schlegel, H. B., Scuseria, G. E., Robb, M.,
Cheeseman, J. R., ... & Nakatsuji, H. (2009). Gaussian 09, Revision D. 01, Gauss-
ian. Inc.: Wallingford, CT.
[2009IKE] Ikeda-Ohno, A., Hennig, C., Tsushima, S., Scheinost, A. C., Bernhard, G., &
Yaita, T. (2009). Speciation and structural study of U(IV) and -(VI) in perchloric
and nitric acid solutions. Inorganic Chemistry, 48(15), 7201-7210.
[2009MIC] Alain, M., Jacques, M., Diane, M. B., & Karine, P. (2009). MAX: Multiplatform
Applications for XAFS. In A. DiCicco & A. Filipponi (Eds.), 14th International
Conference on X-Ray Absorption Fine Structure (Vol. 190). Bristol: Iop Publish-
ing Ltd. Camerino, Italy.
[2009PRA] Prat, O., Vercouter, T., Ansoborlo, E., Fichet, P., Perret, P., Kurttio, P., & Salo-
nen, L. (2009). Uranium speciation in drinking water from drilled wells in south-
ern Finland and its potential links to health effects. Environmental science &
Technology, 43(10), 3941-3946.
[2009TOP] Topin, S., Aupiais, J., Baglan, N., Vercouter, T., Vitorge, P., & Moisy, P. (2009).
Trace metal speciation by capillary electrophoresis hyphenated to inductively
coupled plasma mass spectrometry: sulfate and chloride complexes of Np (V) and
Pu (V). Analytical Chemistry, 81(13), 5354-5363.
[2009TOR] Torapava, N., Persson, I., Eriksson, L., & Lundberg, D. (2009). Hydration and
hydrolysis of thorium(IV) in aqueous solution and the structures of two crystal-
line thorium(IV) hydrates. Inorganic Chemistry, 48(24), 11712-11723.
[2009WAL] Walther, C., Rothe, J., Brendebach, B., Fuss, M., Altmaier, M., Marquardt, C. M.,
Seibert, A. (2009). New insights in the formation processes of Pu(IV) colloids.
Radiochimica Acta, 97(4-5), 199-207.

130
[2010AKS] Aksoy, M. S. (2010). Study of the interaction between chromium(III) and hy-
droxamic acids. Journal of Chemical and Engineering Data, 55(6), 2252-2256.
[2010BRO] Brown, M. A., Paulenova, A., & Tkac, P. (2010). Investigation of Pu (IV)-aceto-
hydroxamic acid complex by solvent extraction with di (2-ethylhexyl) phosphoric
acid. Paper presented at the IOP Conference Series: Materials Science and Engi-
neering.
[2010CHO] Choppin, G.R., & Jensen, M.P. (2010). Actinides in Solution: Complexation and
Kinetics. The Chemistry of the Actinide and Transactinide Elements, 4th edition
L.R. Mors, N.M. Edelstein and J. Fuger Eds, Springer, Dordrecht, The Nether-
lands, pp. 2524-2611.
[2010GAL] Galbis, E., Hernandez-Cobos, J., den Auwer, C., Le Naour, C., Guillaumont, D.,
Simoni, E., Marcos, E. S. (2010). Solving the hydration structure of the heaviest
actinide aqua ion known: the californium(III) case. Angewandte Chemie-Interna-
tional Edition, 49(22), 3811-3815.
[2010HU] Hu, Q. H., Weng, J. Q., & Wang, J. S. (2010). Sources of anthropogenic radionu-
clides in the environment: a review. Journal of Environmental Radioactivity,
101(6), 426-437.
[2010KIR] Kirby, H.W. & Morss, L.R. (2010). Actinium. The chemistry of actinides and
transactinides elements. 4th edition, L.R. Mors, N.M. Edelstein and J. Fuger Eds,
Springer, Dordrecht; The Netherlands, pp. 18-51
[2010REH] Rehr, J. J., Kas, J. J., Vila, F. D., Prange, M. P., & Jorissen, K. (2010). Parameter-
free calculations of X-ray spectra with FEFF9. Physical Chemistry Chemical
Physics, 12(21), 5503-5513.
[2010RUN] Runde, W., & Neu, M. P. (2010). Actinides in the Geosphere. “The chemistry of
the actinide and transactinide elements” (pp. 3475-3593). Springer, Dordrecht.
[2010SIM] Simanova, A. A., Persson, P., & Loring, J. S. (2010). Evidence for ligand hydrol-
ysis and Fe(III) reduction in the dissolution of goethite by desferrioxamine-B.
Geochimica Et Cosmochimica Acta, 74(23), 6706-6720.

131
[2011CHA] Chaboy, J., & Díaz-Moreno, S. (2011). Ab initio X-ray absorption spectroscopy
study of the solvation structure of Th(IV), U(IV), and Np(IV) in aqueous solution.
The Journal of Physical Chemistry A, 115(11), 2345-2349.
[2011CHR] Christenson, E. A., & Schijf, J. (2011). Stability of YREE complexes with the
trihydroxamate siderophore desferrioxamine B at seawater ionic strength. Geo-
chimica Et Cosmochimica Acta, 75(22), 7047-7062.
[2011CHU] Chung, D. Y., Choi, E. K., Lee, E. H., & Kim, K. W. (2011). Complexation of
U(VI), Ce(III) and Nd(III) with acetohydroxamic acid in perchlorate aqueous so-
lution. Journal of Radioanalytical and Nuclear Chemistry, 289(2), 315-319.
[2011EDE] Edelstein, N. M., Fuger, J., Katz, J. J., & Morss, L. R. (2011). Summary and
comparison of properties of the actinide and transactinide elements. The chemis-
try of the Actinide and Transactinide Elements (pp. 1753-1835): Springer.
[2011SZA] Szabo, O., & Farkas, E. (2011). Characterization of Mn(II) and Mn(III) binding
capability of natural siderophores desferrioxamine B and desferricoprogen as
well as model hydroxamic acids. Inorganica Chimica Acta, 376(1), 500-508.
[2011TUR] Turkel, N. (2011). Stability of Metal Chelates of Some Hydroxamic Acid Lig-
ands. Journal of Chemical and Engineering Data, 56(5), 2337-2342.
[2012KNO] Knope, K. E., Vasiliu, M., Dixon, D. A., & Soderholm, L. (2012). Thorium(IV)-
selenate clusters containing an octanuclear Th(IV) hydroxide/oxide core. Inor-
ganic Chemistry, 51(7), 4239-4249.
[2012LEG] Leguay, S. (2012). Complexation of the actinides (III, IV and V) with organic
acids. (Doctoral dissertation, Paris 11).
[2013ABD] Abdel-Fattah, A. I., Zhou, D. X., Boukhalfa, H., Tarimala, S., Ware, S. D., &
Keller, A. A. (2013). Dispersion stability and electrokinetic properties of intrinsic
plutonium colloids: implications for subsurface transport. Environmental Science
& Technology, 47(11), 5626-5634.
[2013ATW] Atwood, D. A. (2013). Radionuclides in the Environment. John Wiley & Sons.
Chichester, UK.
[2013KER] Kersting, A. B. (2013). Plutonium transport in the environment. Inorganic Chem-
istry, 52(7), 3533-3546.

132
[2013KNO] Knope, K. E., & Soderholm, L. (2013). Solution and solid-state structural chem-
istry of actinide hydrates and their hydrolysis and condensation products. Chem-
ical Reviews, 113(2), 944-994.
[2013MAH] Maher, K., Bargar, J. R., & Brown, G. E. (2013). Environmental speciation of
actinides. Inorganic Chemistry, 52(7), 3510-3532.
[2013MIC] Michalowicz, A., Moscovici, J., Muller-Bouvet, D., & Provost, K. (2013). MAX
(multiplatform applications for XAFS) new features. Journal of Physics: Confer-
ence Series. Beijing, China.
[2013TIR] Tircso, G., Garda, Z., Kalman, F. K., Baranyai, Z., Pocsi, I., Balla, G., & Toth, I.
(2013). Lanthanide(III) complexes of some natural siderophores: A thermody-
namic, kinetic and relaxometric study. Journal of Inorganic Biochemistry, 127,
53-61.
[2014AHM] Ahmed, E., & Holmstrom, S. J. M. (2014). Siderophores in environmental re-
search: roles and applications. Microbial Biotechnology, 7(3), 196-208.
[2014BOG] Boggs, M. A., Mason, H., Arai, Y., Powell, B. A., Kersting, A. B., & Zavarin, M.
(2014). Nuclear magnetic resonance spectroscopy of aqueous plutonium (IV)
desferrioxamine B complexes. European Journal of Inorganic Chemistry, 21,
3312-3321.
[2015GRA] Gralla, F., Abson, D. J., Moller, A. P., Lang, D. J., Vilsmaier, U., Sovacool, B.
K., & von Wehrden, H. (2015). Nuclear accidents call for transdisciplinary nu-
clear energy research. Sustainability Science, 10(1), 179-183.
[2015MAL] Maloubier, M., Solari, P. L., Moisy, P., Monfort, M., Den Auwer, C., & Moulin,
C. (2015). XAS and TRLIF spectroscopy of uranium and neptunium in seawater.
Dalton Transactions, 44(12), 5417-5427.
[2016SLA] Sladkov, V. (2016). Affinity capillary electrophoresis in studying the complex
formation equilibria of radionuclides in aqueous solutions. Electrophoresis,
37(19), 2558-2566.
[2016WOR] Workman Jr, J. J. J. (2016). Concise Handbook Of Analytical Spectroscopy, The:
Theory, Applications, And Reference Materials. World Scientific. Singapore.
133
[2017SKO] Skoog, D. A., Holler, F. J., & Crouch, S. R. (2017). Principles of instrumental
analysis. Cengage learning. Boston, USA.
[2018DEN] Denecke, M., Bryan, N., Kalmykov, S., Morris, K., & Quinto, F. (2018). Sources
and Behaviour of Actinide Elements in the Environment. In “Experimental and
Theoretical Approaches to Actinide Chemistry”. John Wiley & Sons.
[2018GUO] Guo, N., Pottier, F., Aupiais, J., Alliot, C., Montavon, G., & Champion, J. (2018).
Evidence for the Heaviest Expected Halide Species in Aqueous Solution, At–, by
Electromobility Measurements. Inorganic Chemistry, 57(9), 4926-4933.
[2018MOR] Morrison, K. D., Jiao, Y., Kersting, A. B., & Zavarin, M. (2018). Reduction of
Plutonium (VI) to (V) by Hydroxamate Compounds at Environmentally Relevant
pH. Environmental Science & Technology, 52(11), 6448-6456.
[2019IUP] International Union of Pure and Applied Chemistry https://iupac.org/what-we-
do/periodic-table-of-elements/.

134
Résumé en français
Les applications civiles et militaires de l’énergie nucléaire sont à l’origine d’une dissémination
d’actinides dans l’environnement, principalement U, Np, Pu et Am. Ces éléments se caractéri-
sent par une toxicité chimique et radiologique élevée. Pour des raisons de sûreté, il est indis-
pensable de disposer de données thermodynamiques et structurales sur les complexes d’acti-
nides susceptibles d’être présents afin de disposer de modèles prédictifs de leur comportement
dans l’environnement. Par ailleurs, ces actinides du début de série se caractérisent par une chi-
mie complexe en raison de leur aptitude à exister sous différents degrés d’oxydation (+III à +VI)
en solution aqueuse, chacun présentant une réactivité spécifique, notamment vis-à-vis de li-
gands présents naturellement dans les eaux souterraines comme de surface et dans les sols.
La complexation des actinides par des ligands organiques en milieu aqueux a fait l’objet de
nombreuses études qui ont permis la création de bases de données thermodynamiques. Cepen-
dant, des incohérences peuvent être relevées, notamment lorsqu’il s’agit d’acides organiques
faibles pour lesquels il existe autant de formes complexantes que de constantes d’acidité.
Ce travail de thèse est axé sur l'étude de la complexation d’actinides tri- et tétra-valents avec un
ligand organique naturel appartenant à la classe des sidérophores. Ces composés, sécrétés par
des microorganismes tels que des bactéries et des levures, sont de puissants chélateurs du fer
qui, en permettant la solubilisation d’hydroxydes ferriques, assurent leur approvisionnement en
fer. Les sidérophores peuvent être divisés en trois classes principales selon leur groupe fonc-
tionnel : hydroxamate (figure 1a), catécholate et carboxylate. Les sidérophores hydroxamates
sont le plus souvent observés dans les eaux naturelles. Ils forment des complexes très stables
avec le fer(III), la complexation s’effectuant de manière bidentate. Le rapport charge/taille si-
milaire pour Fe3+ et Pu4+, et la réactivité des actinides tétravalents, laissent supposer une coor-
dination voisine pour les deux éléments et une stabilité élevée des complexes formés, en parti-
culier avec la desferrioxamine B (DFB, figure 1b). La DFB possède en effet trois groupes
hydroxamates pouvant se lier aux ions métalliques. La formation de ces chélates très stables
peut ainsi favoriser la migration des actinides dans la géosphère. Dans ce travail, nous avons
étudié la complexation des actinides aux états d'oxydation +III et +IV avec la desferrioxamine
B.

135
Figure 1a : Acide hydroxamique
Figure 1b : Desferrioxamine B
Des lanthanides d’une part, Th(IV) et U(IV) d’autre part, ont été utilisés en tant qu’analogues
des actinides trivalents et de Pu(IV) respectivement. L’étude de l’interaction entre ces éléments
et la DFB a été conduite selon une double approche, thermodynamique et structurale, en mettant
en jeu différentes échelles de concentration selon les techniques utilisées. Les constantes de
formation des complexes ont été déduites d’expériences d’extraction liquide-liquide avec l’élé-
ment à l’échelle des ultra-traces, de spectrophotométrie d'absorption UV-visible et d'électro-
phorèse capillaire d’affinité. Pour l’étude structurale, les données issues de spectroscopie infra-
rouge et d'absorption des rayons X, ont été complétées par des calculs de chimie quantique.
Complexation de lanthanides avec la DFB
Une étude systématique des variations du coefficient de distribution (D) de 152Eu en fonction
du pCH et de la concentration de ligand a été conduite dans le système TTA/to-
luène/(H,Na)ClO4/H2O à température constante (25°C) et à force ionique fixée (0,7 M). Les
courbes d’extraction, illustrées sur la figure 2 mettent en évidence la formation d’un complexe
de stoechiométrie 1:1 (pente 𝜕𝑙𝑜𝑔𝐷
𝜕log [𝐷𝐹𝐵] = −1), dont la constante de formation conditionnelle a pu
être déduite des variations de [D0/D-1], D0 étant la valeur du coefficient de distribution en ab-
sence de ligand (figure 3). Par suite, les constantes apparentes K1 et K2 (Eq. 1 et 2) ont été
déterminées et se sont avérées en très bon accord avec les données de la littérature. Le protocole
développé dans ce travail permet ainsi d’envisager l’étude directe de la complexation d’acti-
nides trivalents à l’échelle des ultra-traces, comme 241Am et 249Cf par exemple.
𝐸𝑢3+ + 𝐻4𝐷𝐹𝐵+ 𝐾1↔ 𝐸𝑢(𝐻3𝐷𝐹𝐵)
3+ + 𝐻+ (1)
𝐸𝑢3+ + 𝐻4𝐷𝐹𝐵+ 𝐾2↔ 𝐸𝑢(𝐻2𝐷𝐹𝐵)
2+ + 2𝐻+ (2)

136
1E-9 1E-8 1E-7 1E-6 1E-5 1E-4 0,001 0,01 0,1 1
0,1
1
10
100
pCH = 4.75
pCH = 4.6
pCH = 4.2
D
CDFB
, M
Slope = -1
0,00 0,01 0,02 0,03 0,04 0,05 0,06 0,070
2
4
6
8
10
12
14
16
y=192x+5,12
R2=0,993
Experimental points
Linear fitting
D0/D
-1
CDFB
, M
Figure 2 : Variations du coefficient de distribu-
tion de 152Eu en fonction de la concentration to-
tale de DFB (25°C, I = 0,7 M).
Figure 3 : Variations de [D0/D-1] en fonction
de la concentration totale de DFB (25°C, I =
0,7 M) et ajustement associé.
L’interaction entre La et Lu en macro-concentration, avec la DFB, a été étudiée par électropho-
rèse capillaire d’affinité couplée à un détecteur UV, en suivant la mobilité du ligand en présence
d’un excès de lanthanide. Malheureusement, les variations trop faibles de mobilité observées
n’ont pas permis la détermination de constantes de stabilité.
En revanche, par spectrophotométrie d’absorption UV-Vis, les variations des spectres de Eu(III)
et Pr(III) en fonction de la concentration de DFB ont pu être exploitées à l’aide du logiciel
Hypspec. La figure 4 illustre les variations du spectre d’absorption de Pr avec l’augmentation
de la concentration de DFB. L’analyse en composantes principales a permis de mettre en évi-
dence l’existence de 3 espèces : l’ion aquo et deux complexes, dont les spectres individuels sont
présentés sur la figure 5. Les constantes de formation de Ln(H3DFB)3+ et Ln(H2DFB)2+ ainsi
obtenues pour les deux lanthanides sont en très bon accord avec les données de la littérature. Il
faut souligner ici que dans le cas de l’europium, les données recueillies avec l’élément à
l’échelle des ultra-traces par extraction liquide-liquide et avec l’élément en macro-concentra-
tion par spectrophotométrie d’absorption sont parfaitement cohérentes (tableau 1).

137
430 440 450 460 470 480 490 500
0,01
0,02
0,03
0,04
0,05
0,06
CDFB
Ab
so
rpti
on
Wavelength, nm
0
5.610-2 M
0 5.610-2 M
CDFB
Figure 4 : Spectres d’absorption de Pr(III)
6×10⁻⁴M en présence de quantités croissantes
de DFB (pH = 5,5, I = 0,5 M 0 ≤ CDFB ≤
5,6×10⁻² M)
430 440 450 460 470 480 490 500
0
2
4
6
8
10
Mo
lar
ab
so
rban
ce
Wavelength, nm
Pr3+
PrH2DFB
2+
PrH3DFB
3+
Figure 5 : Coefficient d’extinction molaire de
Pr3+, PrH3DFB3+ et PrH2DFB2+.
Tableau 1 : Constantes de formations de complexes Eu et Pr avec la DFB (I = 0,7 M NaClO4).
Cation logβ13 logβ12 Température Méthode Référence
152Eu 35,4 ± 0,2 30,9 ± 0,2 25°C ELL ce travail
Eu 35,6 ± 0,1 31,5 ± 0,1 20°C sp ce travail
Eu 35,72 ± 0,06 30,91 ± 0,06 25°C pot. [1]
Pr 35,1 ± 0,1 29,9 ± 0,1 20°C sp. ce travail
Pr 35,1 29,55 25°C pot. [1]
M3++nDFB3- + mH+ ↔ M(DFB)nHm(3+m-3n)+ (βnm)
Complexation d’actinides (IV) : Th(IV) et U(IV)
L’étude thermodynamique de la complexation de Th par la DFB a été réalisée par extraction
liquide-liquide couplée à la spectrométrie gamma, avec le thorium à l’échelle des ultra-traces
sous forme de l’isotope 227Th. Comme pour l’europium, un complexe de stoechiométrie 1:1 est
observé (figures 6 et 7) et les constantes apparentes de formation des complexes Th(H3DFB)4+
et Th(H2DFB)3+ ont été déterminées. Les valeurs obtenues sont d’environ un ordre de grandeur
inférieur aux seules données disponibles dans la littérature, déterminées par potentiométrie en
présence de macro-concentration de Th.
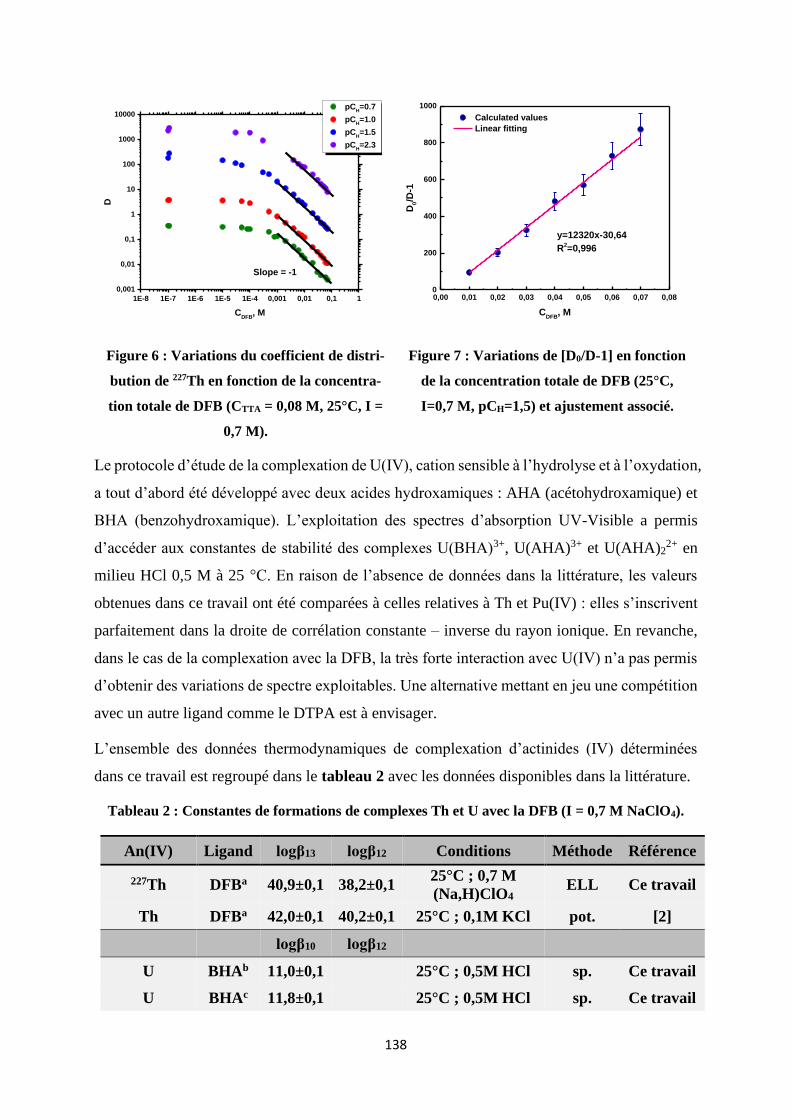
138
1E-8 1E-7 1E-6 1E-5 1E-4 0,001 0,01 0,1 1
0,001
0,01
0,1
1
10
100
1000
10000
Slope = -1
pCH=0.7
pCH=1.0
pCH=1.5
pCH=2.3
D
CDFB
, M
0,00 0,01 0,02 0,03 0,04 0,05 0,06 0,07 0,080
200
400
600
800
1000
Calculated values
Linear fitting
D0/D
-1
CDFB
, M
y=12320x-30,64
R2=0,996
Figure 6 : Variations du coefficient de distri-
bution de 227Th en fonction de la concentra-
tion totale de DFB (CTTA = 0,08 M, 25°C, I =
0,7 M).
Figure 7 : Variations de [D0/D-1] en fonction
de la concentration totale de DFB (25°C,
I=0,7 M, pCH=1,5) et ajustement associé.
Le protocole d’étude de la complexation de U(IV), cation sensible à l’hydrolyse et à l’oxydation,
a tout d’abord été développé avec deux acides hydroxamiques : AHA (acétohydroxamique) et
BHA (benzohydroxamique). L’exploitation des spectres d’absorption UV-Visible a permis
d’accéder aux constantes de stabilité des complexes U(BHA)3+, U(AHA)3+ et U(AHA)22+ en
milieu HCl 0,5 M à 25 °C. En raison de l’absence de données dans la littérature, les valeurs
obtenues dans ce travail ont été comparées à celles relatives à Th et Pu(IV) : elles s’inscrivent
parfaitement dans la droite de corrélation constante – inverse du rayon ionique. En revanche,
dans le cas de la complexation avec la DFB, la très forte interaction avec U(IV) n’a pas permis
d’obtenir des variations de spectre exploitables. Une alternative mettant en jeu une compétition
avec un autre ligand comme le DTPA est à envisager.
L’ensemble des données thermodynamiques de complexation d’actinides (IV) déterminées
dans ce travail est regroupé dans le tableau 2 avec les données disponibles dans la littérature.
Tableau 2 : Constantes de formations de complexes Th et U avec la DFB (I = 0,7 M NaClO4).
An(IV) Ligand logβ13 logβ12 Conditions Méthode Référence
227Th DFBa 40,9±0,1 38,2±0,1 25°C ; 0,7 M
(Na,H)ClO4 ELL Ce travail
Th DFBa 42,0±0,1 40,2±0,1 25°C ; 0,1M KCl pot. [2]
logβ10 logβ12
U BHAb 11,0±0,1 25°C ; 0,5M HCl sp. Ce travail
U BHAc 11,8±0,1 25°C ; 0,5M HCl sp. Ce travail
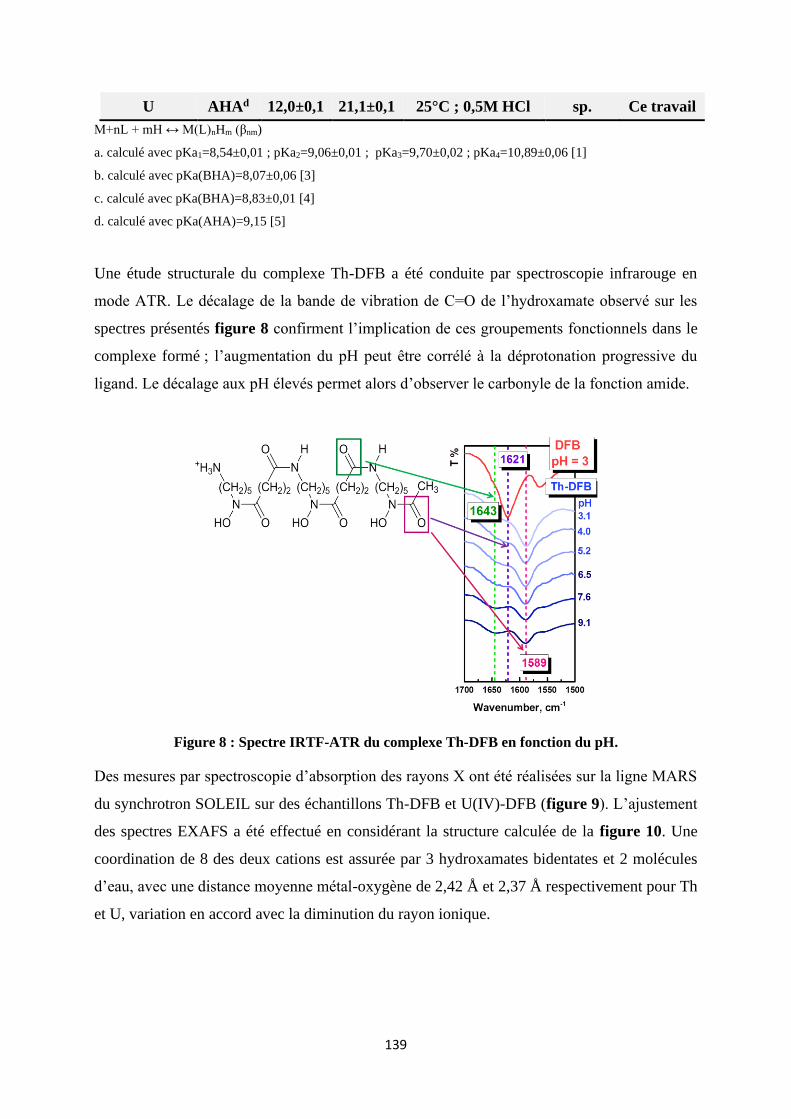
139
U AHAd 12,0±0,1 21,1±0,1 25°C ; 0,5M HCl sp. Ce travail
M+nL + mH ↔ M(L)nHm (βnm)
a. calculé avec pKa1=8,54±0,01 ; pKa2=9,06±0,01 ; pKa3=9,70±0,02 ; pKa4=10,89±0,06 [1]
b. calculé avec pKa(BHA)=8,07±0,06 [3]
c. calculé avec pKa(BHA)=8,83±0,01 [4]
d. calculé avec pKa(AHA)=9,15 [5]
Une étude structurale du complexe Th-DFB a été conduite par spectroscopie infrarouge en
mode ATR. Le décalage de la bande de vibration de C=O de l’hydroxamate observé sur les
spectres présentés figure 8 confirment l’implication de ces groupements fonctionnels dans le
complexe formé ; l’augmentation du pH peut être corrélé à la déprotonation progressive du
ligand. Le décalage aux pH élevés permet alors d’observer le carbonyle de la fonction amide.
Figure 8 : Spectre IRTF-ATR du complexe Th-DFB en fonction du pH.
Des mesures par spectroscopie d’absorption des rayons X ont été réalisées sur la ligne MARS
du synchrotron SOLEIL sur des échantillons Th-DFB et U(IV)-DFB (figure 9). L’ajustement
des spectres EXAFS a été effectué en considérant la structure calculée de la figure 10. Une
coordination de 8 des deux cations est assurée par 3 hydroxamates bidentates et 2 molécules
d’eau, avec une distance moyenne métal-oxygène de 2,42 Å et 2,37 Å respectivement pour Th
et U, variation en accord avec la diminution du rayon ionique.

140
0 2 4 6 8 10 12 14
-4
-2
0
2
4
EX
AF
S a
mp
litu
de in
k3.
(k)
Wave number k (Å-1)
0 1 2 3 4 5 6
0
1
2
3
4
5
6
7
8
FT
am
plitu
de in
k3.
(k)
Non phase shift corrected distance (Å)
Figure 9 : Spectres EXAFS (à gauche) et transformées de Fourrier correspondantes (à droite) au
seuil LIII de l’uranium de U(IV)-DFB à pH 5 (expérimental en noir, ajustement en rouge).
Figure 10 : Structure optimisée du complexe Th(HDFB) avec 3 hydroxamates bidentates obte-
nue par calculs DFT.
Références:
[1] Christenson, E. A. and Schijf, J. Stability of YREE complexes with the trihydroxamate si-
derophore desferrioxamine B at seawater ionic strength. Geochim. Cosmochim. Acta, 2011,
75(22), 7047-7062.
[2] Whisenhunt, D. W., Neu, M. P., Hou, Z. G., Xu, J., Hoffman, D. C., and Raymond, K. N.
Specific sequestering agents for the actinides .29. Stability of the thorium(IV) complexes of
desferrioxamine B (DFO) and three octadentate catecholate or hydroxypyridinonate DFO de-
rivatives: DFOMTA, DFOCAMC, and DFO-1,2-HOPO. Comparative stability of the pluto-
nium(IV) DFOMTA complex. Inorg. Chem., 1996, 35 4128-4136.

141
[3] Aksoy, M. S. Study of the interaction between chromium(III) and hydroxamic acids. J.
Chem. Eng. Data, 2010, 55(6), 2252-2256.
[4] Turkel, N. Stability of Metal Chelates of Some Hydroxamic Acid Ligands. J. Chem. Eng.
Data, 2011, 56(5), 2337-2342.
[5] Chung, D. Y., Choi, E. K., Lee, E. H., & Kim, K. W. Complexation of U(VI), Ce(III) and
Nd(III) with acetohydroxamic acid in perchlorate aqueous solution. J. Radioanal. Nucl.Chem.
2011, 289(2), 315-319.

Université Paris-Saclay Espace Technologique / Immeuble Discovery Route de l’Orme aux Merisiers RD 128 / 91190 Saint-Aubin, France
Title: Complexation of actinides and analogues with hydroxamate ligands
Keywords: actinides, lanthanides, complexation, hydroxamate
Due to the increasing human activities in the civilian nuclear fields, the actual and potential
release of radionuclides into the environment is a matter of concern. The mobility of radionu-
clides depends on several factors such as pH, ionic strength, oxidation state and the presence of
organic ligands. In order to guarantee the safety of radioactive waste storage sites and to develop
contaminated soil remediation processes, it is necessary to have fundamental data on actinides
and natural organic ligands interactions.
This study focuses on the interaction between Th(IV), U(IV,VI), Cf(III) and Eu(III) and hy-
droxamates derivatives, desferrioxamine B, a bacterial siderophore with three hydroxamic
functions. The stability constants of complexes are determined as function of acidity and ligand
concentration, at fixed ionic strength and temperature, using several techniques and metal con-
centrations ranging from 10-10 to 10-3 M (liquid-liquid extraction coupled with γ-spectrometry,
capillary electrophoresis with UV detection, UV-Vis absorption spectrophotometry).
The thermodynamic study is supplemented by a structural one using spectroscopic techniques
such as Fourier transform infrared spectroscopy and X-ray absorption spectroscopy. Experi-
mental measurements are compared with quantum chemistry calculations (DFT) in order to
determine the coordination geometry of the metal ion and the interatomic distances.

Université Paris-Saclay Espace Technologique / Immeuble Discovery Route de l’Orme aux Merisiers RD 128 / 91190 Saint-Aubin, France
Titre: Complexation d'actinides et d'analogues par des ligands hydroxamates
Mots clés: actinides, lanthanides, complexation, hydroxamate
L’augmentation des activités humaines dans le domaine nucléaire civil comme militaire est à
l’origine d’une dissémination effective ou potentielle de radionucléides dans l’environnement.
Leur mobilité dépend de plusieurs facteurs tels que le pH, la force ionique, le degré d’oxydation
et la présence de ligands organiques. Afin de garantir la sûreté de sites d’entreposage ou de
stockage, de développer des procédés de remédiation de sols contaminés, il est nécessaire de
disposer de données fondamentales sur les interactions entre actinides et ligands organiques
susceptibles d’être présents dans l’environnement, vecteurs de migration ou de piégeage de ces
radioéléments.
Dans ce contexte, l’étude s’est axée sur les interactions entre Th(IV), U(IV,VI), Cf(III) and
Eu(III) et des dérivés hydroxamates, en particulier, la desferrioxamine B, un sidérophore bac-
térien comportant trois fonctions hydroxamiques. Les constantes de formation des complexes
sont déterminées en fonction de l’acidité et de la concentration de ligand à force ionique et
température fixées en mettant en jeu plusieurs techniques expérimentales et des concentrations
en élément comprises entre 10-10 et 10-3 M (extraction liquide-liquide combinée à une détection
par spectrométrie γ, électrophorèse capillaire avec détection UV, spectrophotométrie d’absorp-
tion UV-visible).
L’approche thermodynamique de cette étude est complétée par une étude structurale à l’aide de
techniques spectroscopiques telles que la spectroscopie infrarouge à transformée de Fourier et
de la spectroscopie d’absorption des rayons X. Ces mesures expérimentales sont alors confron-
tées à des calculs théoriques (DFT), afin de déterminer l’arrangement structural du métal et les
distances interatomiques.
Copyright © 2022 FDOKUMEN