Sequence Specific Complexation of B DNA at Sites Containing G,C ...
354
Sequence Specific Complexation of B DNA at Sites Containing G,C Base Pairs Thesis by Warren Stanfield Wade In Partial Fulfillment of the Requirements for the Degree of Doctor of Philosophy California Institute of Technology Pasadena, California 1989 (Submitted February 2, 1989)
-
Upload
khangminh22 -
Category
Documents
-
view
0 -
download
0
Transcript of Sequence Specific Complexation of B DNA at Sites Containing G,C ...

Sequence Specific Complexation of B DNA
at Sites Containing G,C Base Pairs
Thesis by
Warren Stanfield Wade
In Partial Fulfillment of the Requirements
for the Degree of
Doctor of Philosophy
California Institute of Technology
Pasadena, California
1989
(Submitted February 2, 1989)

-ii-
© 1989
Warren Stanfield Wade
All Rights Reserved

-lll-
To Jesus

-lV-
Acknowledgements
I would like to thank my advisor, Peter Dervan, for the opportunities and
challenges of the past few years. His insight, enthusiasm, and insistence on excel
lence will always be appreciated. Many thanks go to the members of the Dervan
group who have made my sojourn both interesting and rewarding. Special thanks
are in order for the people who proofread this thesis: Dave Mack, Dr. Jim Reiss,
Dr. Jim Maher, Martha Oakley, Kevin Luebke, and Joy Scott. Your comments
and suggestions were greatly appreciated. The support of the National Science
Foundation for much of this work is gratefully acknowledged.
To my family and good christian friends, thank you for bearing with me
through ups and downs. Your support has meant a great deal to me. Lastly,
I thank the LORD my God for creating me as I am, and blessing me continually.
This thesis is yours in every sense of the word.

-v-
Abstract
A series of eight related analogs of distamycin A has been synthesized. Foot
printing and affinity cleaving reveal that only two of the analogs, pyridine-2-
car box amide-netropsin ( 2-Py N) and 1-me thy !imidazole-2-car boxamide-netrops in
(2-ImN), bind to DNA with a specificity different from that of the parent com
pound. A new class of sites, represented by a TGACT sequence, is a strong site
for 2-PyN binding, and the major recognition site for 2-ImN on DNA. Both com
pounds recognize the G·C bp specifically, although A's and T's in the site may
be interchanged without penalty. Additional A·T bp outside the binding site in
crease the binding affinity. The compounds bind in the minor groove of the DNA
sequence, but protect both grooves from dimethylsulfate. The binding evidence
suggests that 2-PyN or 2-ImN binding induces a DNA conformational change.
In order to understand this sequence specific complexation better, the Ackers
quantitative footprinting method for measuring individual site affinity constants
has been extended to small molecules. MPE·Fe(II) cleavage reactions over a 105
range of free ligand concentrations are analyzed by gel electrophoresis. The de
crease in cleavage is calculated by densitometry of a gel autoradiogram. The ap
parent fraction of DNA bound is then calculated from the amount of cleavage
protection. The data is fitted to a theoretical curve using non-linear least squares
techniques. Affinity constants at four individual sites are determined simultane
ously. The distamycin A analog binds solely at A·T rich sites. Affinities range from

-vi-
106- 107 M- 1• The data for parent compound D fit closely to a monomeric binding
curve. 2-PyN binds both A·T sites and the TGTCA site with an apparent affinity
constant of 105 M- 1 . 2-ImN binds A·T sites with affinities less than 5 x 10⁴ M- 1 .
The affinity of 2-ImN for the TGTCA site does not change significantly from the
2-PyN value. At the TGTCA site, the experimental data fit a dimeric binding
curve better than a monomeric curve. Both 2-PyN and 2-ImN have substantially
lower DNA affinities than closely related compounds.
In order to probe the requirements of this new binding site, fourteen other
derivatives have been synthesized and tested. All compounds that recognize the
TGTCA site have a heterocyclic aromatic nitrogen ortho to the N or C-terminal
amide of the netropsin subunit . Specificity is strongly affected by the overall length
of the small molecule. Only compounds that consist of at least three aromatic rings
linked by amides exhibit TGTCA site binding. Specificity is only weakly altered
by substitution on the pyridine ring, which correlates best with steric factors. A
model is proposed for TGTCA site binding that has as its key feature hydrogen
bonding to both G's by the small molecule. The specificity is determined by the
sequence dependence of the distance between G's.
One derivative of 2-PyN exhibits pH dependent sequence specificity. At
low pH, 4-dimethylam.inopyridine-2-carboxam.ide-netropsin binds tightly to A·T
sites . At high pH, 4-Me2 NPyN binds most tightly to the TGTCA site. In aque
ous solution, this compound protonates at the pyridine nitrogen at pH 6. Thus
presence of the protonated form correlates with A·T specificity.

- Vll-
The binding site of a class of eukaryotic transcriptional activators typified
by yeast protein GCN4 and the mammalian oncogene ;"un contains a strong 2-
ImN binding site. Specificity requirements for the protein and small molecule are
similar. GCN4 and 2-lmN bind simultaneously to the same binding site. GCN4
alters the cleavage pattern of 2-ImN-EDTA derivative at only one of its binding
sites . The details of the interaction suggest that GCN4 alters the conformation
of an AAAAAAA sequence adjacent to its binding site. The presence of a yeast
counterpart to ;"un partially blocks 2-lmN binding. The differences do not appear
to be caused by direct interactions between 2-lmN and the proteins, but by induced
conformational changes in the DNA protein complex. It is likely that the observed
differences in complexation are involved in the varying sequence specificity of these
proteins.
-viii-
Table of Contents
Acknowledgements ..... ...... ...... ..... ........................... . .. 1v
Abstract .............................................................. v
Chapter 1: Recognition of B DNA by Small Molecules ..... .. . . .... .. .. .... 2
Introduction ....................................................... 2
DNA structure .................................................... 2
Small Molecule DNA Complexes ..................................... 6
A,T Sequence Specificity ..................... ..... .............. 8
G,C Sequence Specificity ....................................... 16
Molecules Designed for Sequence Specificity . ..... . ........ .... . ..... . 19
A,T Sequences ............................................ .... 19
G, C Sequences . ......................................... . . .... 21
Conclusion ....................................................... 25
Chapter 2: Sequence Specific Complexation of Mixed A,T jG,C Sequences .. 27
Design of Potential G,C Binding Molecules . . ........ ............ ... . . 29
Synthesis . . . . . . . . . . . . . . . . . . . . . . . . . . . . . . . . . . . . . . . . . . . . . . . . . . . . 32
DNA Binding Assays .......................................... 35
TGTCA Site Structure . ... ...... ........ .. . .... .............. . 47
Double Stranded Cleavage of pBR322 ............................... 51
-IX-
Acetamide-distamycin-EDTA (ED) . ....... .... . ..... ... ......... 58
Pyridine 3- and 4-carboxamide-netropsin-EDTA (3-PyNE and 4-PyNE)59
1-Methylimidazole-2-carboxamide-netropsin-EDTA (2-lmNE) ....... 60
Pyridine-2-carboxamide-netropsin-EDTA (2-PyNE) . .... . ..... .. .. 64
A Model for the 2-lmN Complex Conformation . ....... . ........ ... ... 67
Summary .. .... ... . ................... .......... .. ........ .. .. ... 71
Chapter 3: Quantitative MPE·Fe(II) Footprinting ........................ 74
Theoretical Basis . . . . . . . . . . . . . . . . . . . . . . . . . . . . . . . . . . . . . . . . . . . . . . . . . 7 4
Modifications for Small Molecules .... . ..... ............... . ..... 79
The Footprinting Experiment ..................... ... . .. ............ 81
Analysis . . . . . . . . . . . . . . . . . . . . . . . . . . . . . . . . . . . . . . . . . . . . . . . . . . . . . 90
Fitting Procedure ............................................. 95
Affinity Constants . . ... ........ ... .... ....... . ............ ....... 104
Error Analysis ................................................... 105
Discussion ... ... ..... . ........ .. . .. ...... ... ... ....... .. . .... ... 108
Summary ............................... ... ......... . ... .... .. .. 112
Chapter 4: The Scope of WGWCW Sequence Specificity .......... . .... .. 115
Substituted Pyridine Derivatives ..... .. .... . ......... . ....... . ..... 115
Synthesis ..... .. . . ... .. ............................ ... ... ... 115
4-Chloropyridine-2-carboxamide-netropsin (4-ClPyN) ..... ........ 120
-x-
Pyrimidine-2-carboxamide-netropsin {2-PmN) .... .. .... .. ....... 127
4-Dimethylaminopyridine-2-carboxamide-netropsin ( 4-Me2 NPy N) .. 127
3-Methoxypyridine-2-carboxamide-netropsin {3-MeOPyN) ......... 128
Imidazo[1,2-a]pyrazinecarboxamide-netropsin (CycN) ....... .. ... . 128
Cleavage Specificity on pBR322 ... ... ......... . . ........ ... .... 128
Discussion ............. .. ............... .. .................. 132
Length Dependence of WGWCW Site Specificity ..................... 140
Carboxyterminal Derivatives ... . ................ . ....... . ......... 148
Chemical Evidence for a Binding Conformation . . . . . . . . . . . . . . . . . . . . . . 156
Summary ........................... ..... . ... ............. .... .. 160
Chapter 5: Biological Implications of WGWCW Sequence Binding .. ... ... 163
Background ..................................................... 163
GCN4 ...................................................... 163
AP-1 . ... .... .. .... ........... ... ... ........ ................ 164
A Cleavage Assay for Specific DNA Complexes ......... ...... ..... . . 166
GCN4 and AP-1 Structure .... ... ...... ..... ........ ........... .. . 177
Simple Binding Model for GCN4 ...... .. ....... . ................... 179
Conformationally Isomeric Complexes? ............ ........... . . 181
Summary ....................................................... 182
Chapter 6: Experimental Procedures .................................. 184

-Xl-
General DNA Procedures ......................................... 184
Reagents .................................................... 184
Ethanol Precipitation ............ .. ........................... 185
Ammonium Acetate Ethanol Precipitation .. .. . ................. 186
Electrophoresis .. . .......... .. ..... ... ..................... . .. ... 186
Agarose Gels ....... ......... ........ ........................ 186
Polyacrylamide Gels ........... .. . ........... .... .......... ... 187
Preparation of Labeled Restriction Fragments ....................... 188
Restriction Enzyme Digests ................................... 189
3' Endlabeling ............................................... 189
51 Endlabeling .................................. ........ ..... 190
G Reaction .... .. .. . ..... ...... .... ..... .. . .. .. .. ... ......... 191
A Reaction ... ... ... ........ ........... ... . ... .. ...... ....... 191
Labeling of Linear pBR322 ......... ... ......... .... ............ . .. 192
Molecular Weight Standards ................................... 192
DNA Binding Assays ............................................. 192
MPE·Fe(II) Footprinting ...................................... 192
MPE·Fe(II) Footprinting at pH 6.0-10.0 ........................ 193
EDTA·Fe(II) Footprinting ..................................... 194
Affinity Cleaving ............................................. 195
DN ase I Footprinting ......................................... 195

-Xll-
Dimethyl Sulfate Footprinting ................................. 196
Diethyl Pyrocarbonate Reactions ... ... . ... ........ . .. ... .. ... . 197
Potassium Permanganate Reactions .. ... . ... .... ... .... ...... .. 197
Cleavage of Linear pBR322 .... . . ..... ...... .. . ...... ........ .. 198
Quantitative Footprinting ... ......... .. ..... . .. ... ..... ... .. ...... 198
DNA Preparation ........ .. ........ ....... ...... . .. .......... 198
Footprinting Reactions ................ .. .................. ... 199
Densitometry .................................................... 200
Synthesis ..... ....... ..... . ......... . . ..... . ............. ... .. . . 203
Instruments . . . . . . . . . . . . . . . . . . . . . . . . . . . . . . . . . . . . . . . . . . . . . . . . . 203
Reagents . . . . . . . . . . . . . . . . . . . . . . . . . . . . . . . . . . . . . . . . . . . . . . . . . . . . 203
Methods . . . . . . . . . . . . . . . . . . . . . . . . . . . . . . . . . . . . . . . . . . . . . . . . . . . . 203
Procedures ... ... ... ...... ...... ... . . ...... ............... . .. 204
References .......................................................... 246
Appendix A: Summary of Gel Data ........... .. ............ .. .... .. .. 259
Appendix B: Summary of Quantitative Footprinting Data . .. .......... . . 278
Appendix C: Proposed G·C Binding Molecules .. ......... . .. ... ...... .. 289
Appendix D: Other Potential G·C Binding Molecules Synthesized ........ 292
Appendix E: Computer Programs . ................ .. . ... .... .... ... .. 294

-xiii-
List of Illustrations
Chapter 1: Recognition of B DNA by Small Molecules ..................... 2
Figure 1: Watson-Crick Base Pairs ... ............................. . 3
Figure 2: DNA Structure ......................................... 5
Figure 3: Netropsin and Distamycin A ............. .. ........ . ... .. . 7
Figure 4: Netropsin and Distamycin DNA Complexes ................. 9
Figure 5: Heterocyclic Analogs of Distamycin A ....... ..... ......... 12
Figure 6: Synthetic A,T Binding Molecules ......................... 14
Figure 7: The Aureolic Acids ........................... ..... ... . . 18
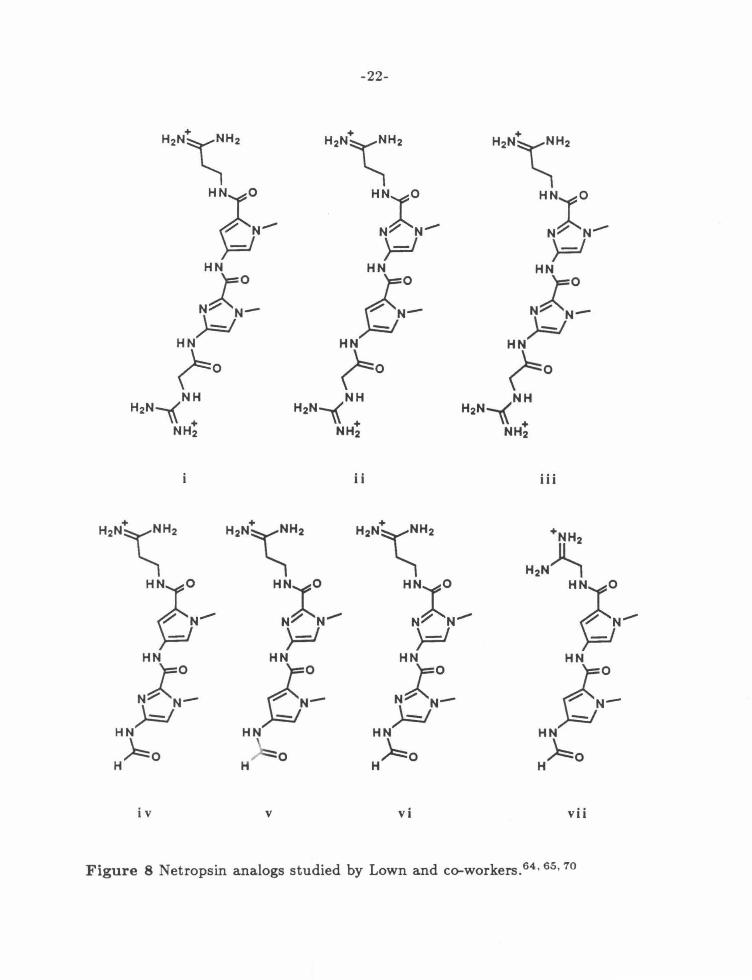
Figure 8: Imidazole-Containing Netropsin Analogs ....... ... ....... . 22
Chapter 2: Sequence Specific Complexation of Mixed A,T /G,C Sequences .. 27
Figure 1: Complementarity of Footprinting and Affinity Cleaving ..... 28
Figure 2: Design of G,C Binding Distamycin Analogs ....... . ...... .. 30
Scheme 1: Synthesis of ArN and ArNE ......... .. ...... ... ....... . 32
Scheme 2: Synthesis of 2-ImNE ............... ... ........... . ..... 33
Figure 3: Synthetic Compounds Tested ... . ... ............ ...... . . . 34
Figure 4: Footprinting of Furan and Thiophene Analogs ............. 36
Figure 5: Footprinting and Affinity Cleaving of Pyridine Analogs ...... 38
Figure 6: Footprinting and Affinity Cleaving of 2-PyN and 2-ImN ..... 40
Figure 7: FuN and ThN Footprinting Histograms ............... .... 42

-xiv-
Figure 8: PyN and 2-ImN Footprinting Histograms . . .... ....... . .... 43
Figure 9: PyNE and 2-ImNE Affinity Cleaving Histograms . .......... 45
Figure 10: Structural Features of 2-PyN and 2-ImN Complexes .... ... 48
Figure 11: Structural Features of TGTCA Site Complexes . ... .. . .. .. 50
Figure 12: Double Stranded Specificity Assay ...... .. . .. ... . ... ..... 52
Figure 13: Double Stranded Cleavage of pBR322 .................... 54
Figure 14: Cleavage Sites for the PyNE's and 2-ImNE on pBR322 ..... 56
Figure 15: Binding Site and Cleavage Band Correlation ... ...... ..... 61
Figure 16: Potentially Complexed Conformers of 2-ImN ...... ........ 68
Chapter 3: Quantitative MPE·Fe(II) Footprinting . .. . .. ....... .. ... ...... 74
Figure 1: Densitometry Method ............................... .... 78
Figure 2: D Footprinting Gel ................... ... ........... .... 83
Figure 3: 2-PyN Footprinting Gel ................................. 85
Figure 4: 2-ImN Footprinting Gel ................................. 87
Figure 5: 2-PyN Gel Densitometer Traces .......................... 89
Figure 6: Quantitative D Footprints ............................... 91
Figure 7: Quantitative 2-PyN Footprints ........................... 92
Figure 8: Quantitative 2-ImN Footprints ........................... 93
Figure 9: Best Fit D Isotherms . ....... .. ........ .... ... .. ... .. ... 98
Figure 10: Best Fit 2-PyN Isotherms ..................... .. ....... 99
Figure 11: Best Fit 2-ImN Isotherm . ....... ... ... .. . .... .. . ... ... 100
-xv-
Figure 12: Cooperative Curve Fitting for D . . . . ... . . ... ... .. .. . . .. 101
Figure 13: Cooperative Curve Fitting for 2-Py N 102
Figure 14: Cooperative Curve Fitting for 2-ImN 103
Figure 15: MPE·Fe{II) Dependence of 2-PyN Affinities .... . .... .. .. 106
Chapter 4: The Scope of WGWCW Sequence Specificity .... .... ........ . 115
Figure 1: Substituted Pyridine and Imidazole Compounds ... ..... . . . 116
Scheme 1: Synthesis of Substituted Pyridine Acids ..... . .. . . ... .. .. 117
Scheme 2: Synthesis of CycN and Model Compound 23 ........ ... . . 119
Figure 2: Footprinting of Substituted Pyridines .. ......... ...... .. . 121
Figure 3: Affinity Cleaving of Substituted Pyridines .... ...... ... ... 123
Figure 4: Substituted Pyridine Footprinting Histograms . .. .. .. .. . ... 125
Figure 5: Substituted Pyridine Affinity Cleaving Histograms . . . .. . ... 126
Figure 6: Double Stranded Cleavage of pBR322 ....... . ............ 129
Figure '1: Substituted Pyridine Cleavage Sites on pBR322 . .......... 131
Figure 8: pH Titration of 4-Me2 NPyN ........ .. . . .............. .. 135
Figure 9: pH Dependence of Footprints . . .... . . . ... . .. . ... .. ... ... 136
Figure 10: 4-ClPyN and 2-lmN pH Dependence Histograms .. ...... . 138
Figure 11: 2-PyN and 4-Me2 NPyN pH Dependence Histograms ... . . . 139
Figure 12: Variable Length Analogs of 2-ImN ..... . ... . . . .......... 142
Scheme 3: Synthesis of 1-Methylimidazole-2-carboxylic acids . ....... 143
Figure 13: Footprinting of Variable Length Compounds ... .. .. . . . . .. 144

-xvi-
Figure 14: Pyrrole Compounds Footprinting Histograms .. .. ........ 146
Figure 15: Imidazole Compounds Footprinting Histograms ... ....... 147
Figure 16: C-terminal 2-PyN and 2-ImN Analogs . ..... ... .... .... . 149
Scheme 4: Synthesis of C-terminal Analogs . .... .. . ......... .. .... . 150
Scheme 5: Synthesis of PyP+PPy ..... ........................... 151
Figure 17: Footprinting of C-terminal Analogs .................. . .. 153
Figure 18: C-Terminal Footprinting Histograms .. ............... ... 155
Scheme 6: Synthesis of ImP+P+Im .......... . .. . .. ... ......... . . 160
Chapter 5: Biological Implications of WGWCW Sequence Binding ...... . . 163
Figure 1: pAG Plasmid ... . ... . ........ . . ....... . ...... ... . ... . . 167
Figure 2: Interactions Between 2-lmN, GCN4, and yAP-1 ......... .. 169
Figure 3: 2-ImN, GCN4 and yAP-1 Footprinting Histograms ....... . 171
Figure 4: 2-ImNE Affinity Cleaving Histograms 172
Figure 5: GCN4 and AP-1 Sequence Homology 176
Figure 6: Proposed Leucine Zipper Structures .. ... .. .. ... .... ..... 178
Figure 7: GCN4 Binding Model ..... ... ..... ... ... .. ........ ..... 180

-1-
Chapter 1
Recognition of B DNA by Small Molecules

-2-
Introduction
It has become apparent over the last 20 years that specific binding to nucleic
acids is an important control point for biological processes. The complexation of
specific DNA sequences by regulatory molecules can control transfer of information
from DNA to RNA to proteins, with far reaching biological consequences. A central
challenge to chemists studying DNA is to understand the physical basis for such
specific interactions. The studies described here are aimed at designing synthetic
molecules that complex specifically to target DNA sequences containing G,C base
pairs.
DNA structure
Watson and Crick originally proposed a regular rod-like structure for DNA. 1
This double helix is characterized by flat purine-pyrimidine base pairs (bp) spaced
at regular intervals along a sugar phosphate backbone. Hydrogen bonding interac
tions between the bases on antiparallel strands produce two distinct grooves, which
spiral along the helix axis. Information is stored in the sequence of bases along a
particular strand. The array of functional groups on each base is such that both
the interactions between the strands and the pattern of hydrogen bond donors
and acceptors in the grooves are unique for each base. 2 ' 3 Selection of a particu
lar sequence could then be accomplished by maximizing the number of hydrogen
bonds and hydrophobic contacts with the edges of the bases. Thus the design of

-3-
MAJOR GROOVE MAJOR GROOVE
NCH3 O,
''H H "N,... Sugar,...N ............... N..._H , :.XN
II '•Nr To I I ")
~ N N \
A Sugar
MINOR GROOVE MINOR GROOVE
Figure 1 Effects of Watson-Crick base pairing on the availability of base functional groups. Triangles represent potential hydrogen bond interactions in the major and minor grooves.
DNA binding molecules might be reduced to the relatively straightforward task of
matching an array of DNA contacts with a complementary set on the ligand.
Discoveries in the past few years have both supported and refined this original
model. X-ray structures4 and solution studies of DNA itself have revealed many
sequence dependent variations in DNA structure. 5 In the crystals, base pairs are
neither flat nor perpendicular to the helix axis. Instead they are propeller twisted
as shown in figure 2, increasing the stacking interactions between the bases. From
the minor groove, each base is twisted towards the 5' end of its own DNA strand.
There is also a sequence dependence to the tilt (i.e., rotation about the short axis
of the base pair), roll (rotation about the long axis of the base pair) and twist

-4-
(rotation about the helix axis between consecutive bp). Instead of a rigid rod,
it appears that B DNA should be viewed as a series of local conformations with
varying elastic properties. These local structures blend into one another, with each
unique sequence having its own unique set of helix parameters.
This ensemble of conformations has important implications for DNA sequence
recognition. In addition to the pattern of potential hydrogen bonds and hydropho
bic contacts, the distance and orientation of the base functional groups are now
unique to a given sequence. Instead of matching all interactions with a given bp,
a ligand could select between sequences by requiring a specified distance between
interactions. This is especially important in the minor groove, where replacement
of A by Tor G by C produces only small changes in the functional group pattern.
This more sophisticated approach to sequence specific recognition requires a
knowledge of the structure of the target sequence. Recently, detailed models for
this sequence specific variation have been developed by Calladine6 and modified
and extended by Dickerson. 7 The authors propose that steric interactions pro
duced by the propeller twist are responsible for such structure variations. For a
51 purine-pyrimidine sequence, the fact that purines are significantly longer than
half a bp produces close van der Waals contacts in the major groove. For a 5'
pyrimidine-purine sequence, the close contacts occur in the minor groove, while for
a purine-purine sequence (- pyrimidine-pyrimidine) no unfavorable steric interac
tion occurs. In addition, the extra width of a G,C bp results in closer contacts
than A,T bp.

-5-
Figure 2 Implications of propeller twist for the sequence dependent structure of DNA, from reference 7. Atom positions of the AATT region of the dodecamer crystal structure are taken from the Brookhaven Protein Databank (only base atoms shown) . The major groove is to the left of the figure, and the minor groove is to the right. Propeller twisting towards the 51 terminus of each strand in the minor groove results in a stacked conformation for each strand.
Unfavorable contacts can be relieved by a number of mechanisms involving
the tilt, roll, and twist of the base pair. Significantly, application of the Calladine
model to the dodecamer structure determined by Dickerson et al. gives a good
correlation to the experimental data. 7 A recent paper proposes that this sequence
dependent structure is actually due to repulsion of partial charges on neighbor-

-6-
ing bases, rather than steric effects. 8 However the small number of independent
DNA crystal structures in the database makes the predictive value of these models
difficult to assess.
Small Molecule DNA Complexes
A number of test cases for distance dependent sequence recognition already
exist. A variety of small molecules {molecular weights less than 1500 daltons) have
been observed to bind specifically to DNA. These compounds appear to exert anti
tumor and antibiotic activities by forming tight complexes with their cognate DNA
sites, blocking transcription.9 On such a small molecule, the number of specific
contacts is limited. Thus the distance between contacts ought to be an important
determinant of specificity.
Three modes of interaction have been observed in the DNA complexes of such
small molecules. 10 A common mode involves the intercalation of a flat aromatic
molecule between two base pairs. In general this mode has a relatively low speci
ficity, presumably because a major interaction is the relatively nonspecific 7r - 7r
stacking interaction. Usually there is a slight preference for G,C bp because of the
increased width and flatter conformations of G,C sequences. Intercalation neces
sitates a change in DNA conformation, and experiments to date reveal no obvious
correspondence between the structure of a particular compound and the details of
the complex. 11 Because the relevant distances are drastically altered in the com
plex, distance matching would have to be done on the intercalated conformation.

-7-
The other two recognition modes involve interactions within one of the grooves
of the helix. Either the major or minor groove could serve as a complexation site ,
with the appropriate segregation of base recognition elements . G roove binding
small molecules examined to date form complexes in the minor groove, presumably
because of a closer match in size. The known binding characteristics of these
nonintercalative compounds have recently been exhaustively reviewed,9 and so
only the information pertaining to specificity will be repeated here.
Netropsin Distamycin A
Figure 3 Naturally occurring polypyrrole antitumor antibiotics.

-8-
A, T Sequence Specificity
Netropsin and distamycin A are well studied compounds that bind to A,T rich
DNA. As shown in figure 3, they consist of a poly-N-methylpyrroleamide backbone
capped with one or more delocalized positively charged groups. Both compounds
exhibit strong preferences for double stranded B DNA, with high specificity for
A,T bp.9 Footprinting studies reveal that the polypyrrole antibiotics bind in the
minor groove12 at sites containing 4-5 contiguous A,T bp. 13- 16 In general, the
binding constant increases with the number of AA dinucleotides present in the
bound sequence. 17 Neither netropsin nor distamycin A bind tightly to alternating
A,T sequences.9 • 14
Dodecamer-netropsin 18 • 19 and dodecamer-distamycin A 20 complexes have
been examined recently by X-ray crystallography (see figure 4). In both cases
the antibiotic is set deeply into the minor groove so that the pyrrole amide hydro
gens form bifurcated hydrogen bonds with the N3 of adenine and the 02 of thymine
on the floor of the groove. In the netropsin complex, the width of the minor groove
has increased by an average of 1.7 A. The adjustment allows the pyrrole rings to
fill the groove completely and to form extensive van der Waals contacts with the
groove sides. These close contacts require the pyrrole rings to be parallel to the
sides of the groove, increasing the overall screw sense of the antibiotic to match
that of the groove. The helix axis is bent away from the netropsin molecule by 8°,
increasing the distance between the outermost T carbonyls by about 0.5 A. These

NH2 B
T
T
0 T
\
' 7;
0
N-
N
" Figure 4 Structural features of the DNA complexes of netropsin and distamycin A.18 • 20 The small molecules are set deeply in the minor groove, in close van der Waals contact to the sugar phosphate backbones. Circles represent the lone pair electrons of the thymine 02 and the adenine N3. Dashed lines represent hydrogen bonds existing in the complex. The distance in A between donor and acceptor atoms is shown beside each interaction.
I <.0 I
-10-
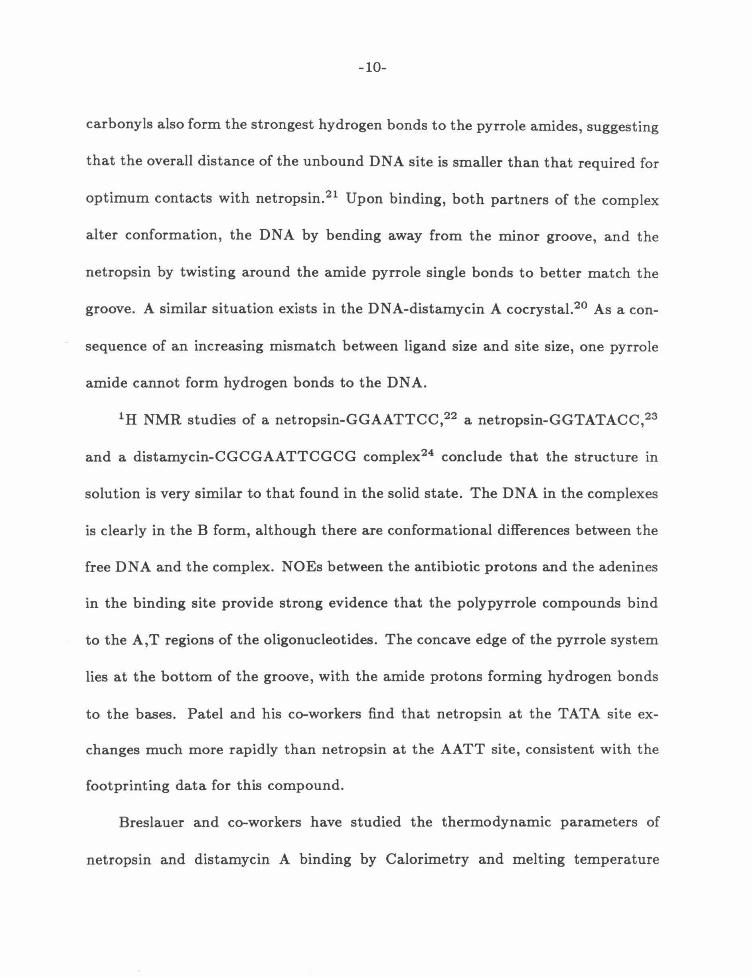
carbonyls also form the strongest hydrogen bonds to the pyrrole amides, suggesting
that the overall distance of the unbound DNA site is smaller than that required for
optimum contacts with netropsin.21 Upon binding, both partners of the complex
alter conformation, the DNA by bending away from the minor groove, and the
netropsin by twisting around the amide pyrrole single bonds to better match the
groove. A similar situation exists in the DNA-distamycin A cocrystal.20 As a con
sequence of an increasing mismatch between ligand size and site size, one pyrrole
amide cannot form hydrogen bonds to the DNA.
1 H NMR studies of a netropsin-GGAATTCC,22 a netropsin-GGTATACC,23
and a distamycin-CGCGAATTCGCG complex24 conclude that the structure in
solution is very similar to that found in the solid state. The DNA in the complexes
is clearly in the B form, although there are conformational differences between the
free DNA and the complex. NOEs between the antibiotic protons and the adenines
in the binding site provide strong evidence that the polypyrrole compounds bind
to the A,T regions of the oligonucleotides. The concave edge of the pyrrole system
lies at the bottom of the groove, with the amide protons forming hydrogen bonds
to the bases. Patel and his co-workers find that netropsin at the TATA site ex
changes much more rapidly than netropsin at the AATT site, consistent with the
footprinting data for this compound.
Breslauer and co-workers have studied the thermodynamic parameters of
netropsin and distamycin A binding by Calorimetry and melting temperature

-11-
shift studies. Excluding poly( dA) ·poly( dT), specific binding of netropsin and dis
tamycin A to A,T rich DNA is enthalpically driven.25--27 (Binding of most lig
ands, including intercalators, to poly( dA) ·poly( dT) is en tropically driven. 27) This
suggests that the ability to form strong hydrogen bonds at A,T sequences is an
important factor in the overall specificity of these compounds. A recent study of
the ionic strength dependence of netropsin complexation to poly d(AT) and poly
d(GC) shows no significant difference, although the free energy of complexation
differs by > 5 kcal / mol.25 This would seem to eliminate electrostatic interactions
as a major source of the A,T specificity. To date, no individual binding sites of
either compound have been studied by these techniques, so that the enthalpy and
entropy contributions to selectivity between A,T sequences are not known.
Taken together, the experimental evidence suggests that specificity for A, T bp
is determined by several interacting features . The requirement for hydrogen bond
ing in the complex means that close contacts are formed between the C2H of
adenine and the C3H on the pyrrole rings. The extra bulk of the guanine N2
would disrupt these interactions. The disparity in size between pyrrole compound
and the DNA binding site would also tend to select for taller, thinner sequences.
Because A,T rich DNA has fewer bp per turn than G,C rich DNA,28 • 29 such se
quences would provide hydrogen bonding more in register with the small molecule
and increase the Van der Waals interactions between the aromatic rings and the
side of the groove.

-12-
+ NH2
H,N~ 0 H,N~ 0
HNQ/ HNQ/ '/ N N ~ 'I
h
HN9 HN 0
/ ~/ ~ N '/ N
-- --HN HN
L.~ ~0
d HN ~HN 0 0
H N """ HN , ~ S
~0 0
NH2 H2N~ 0
HN~/ '~ HN-qO /
~ N A
HNTO
~N-
Figure 5 Strong binding heterocyclic analogs of distamycin A prepared by Arcamone and co-workers.30

-13-
Variations on the positively charged groups31 • 32 or the N-alkyl groups of the
pyrrole rings33 retain the A, T specificity of the parent compounds. A series of
analogs of distamycin A with pyrrole rings substituted by other heterocyclic rings
have also been prepared by Arcamone and co-workers.30 Shown in figure 5 are the
derivatives whose DNA binding properties have been studied. By CD measure
ments, these compounds show a distinct preference for A,T homopolymers, though
with lower overall specificity than distamycin A. As is observed for netropsin and
distamycin, longer derivatives have higher binding constants.
Many other synthetic compounds have been shown to bind preferentially to
A,T DNA.9 As shown in figure 6, these molecules are generally aromatic systems
with one or more positive charges. The compounds can be separated by their
ability to form a distamycin-like crescent conformation. Compounds in the top row
of figure 6 show a strong preference for homopolymer A, T bp over homopolymer
G,C bp of B DNA, while the bottom row shows much less specific behavior.9
The m.PD derivative shows intermediate behavior by CD, strongly preferring B
DNA of either sequence.34 Rao et al. conclude that the degree of bending in these
compounds is a major determinant of A,T specificity.34 All of these compounds
compete with netropsin for DNA sites.35- 37 At this time, it is not known whether
this is direct competition for common binding sites or conformational exclusion of
nearby sites.

-14-
NH2 '\+ OH
"'Q"' HN~NH~ Q q I
"Q NH
1-..::: p "P h '~ ~N
N oyNH HN
I Po yV"" ~C(" HN ~
H2N+ .& b" HN""N.....-;
NH2 ·s·H +H2N~NH2 -N eN r ~ HNV
/ -Berenil DOUG SN6999 Hoechst 33258
\..:~) ~
HN O
q HN O
( + '+
+NH2 p p H2N-'I... NH
¢ HN HN 90 90 HN
0 HN HN
0 0
6 HN
HN r ~ 0
........:: 0 --
·~ 0 .:.rj mPDD SN6136 NSC 101327 SN 16814
Figure 6 Other synthetic molecules that bind preferentially to A, T sequences. 9

-15-
Recently, the DNA specificity of Hoechst 33258 has been studied by footprint
ing38 and crystallography.39 • 40 Although Hoechst 33258 possesses only two poten
tial hydrogen bonding groups, it binds the same sites as distamycin A with the
same relative ordering of binding sites. 38 In the cocrystal solved by Dickerson and
co-workers, Hoechst 33258 is shifted one bp from the netropsin position on the same
oligonucleotide. The position of the piperazine ring is disordered, with equivalent
occupancies along the innermost G,C bp and pointing out of the groove.39 This
result has prompted Dickerson to conclude that the extra width of the piperazine
ring precludes its binding to an A,T bp. In the structure solved by Wang and co
workers,40 Hoechst 33258 is complexed to the same oligonucleotide, but the overall
complex is more similar to the netropsin complex. The small molecule is located in
the AATT region of the minor groove, with a bifurcated hydrogen bonding array
similar to netropsin. There is clearly only one orientation in the crystal and only
one position for the piperazine ring. Comparing the two complexes, the Wang
structure has no disorder in the small molecule and is more consistent with the
footprinting data. This complex also demonstrates that the width of the piper-
azine ring does not necessarily preclude binding in A,T regions. The reason for
such dissimilar complexes with the same components is not presently understood.
While no footprinting data has been published to date for the remaining com
pounds in figure 6, the evidence so far suggests that the key recognition motif for
A, T sequences is a positively charged crescent shape. This shape serves to present

-16-
hydrogen bond donors at regular intervals, and both X-ray and NMR experiments
show that these interactions are present in the complexes. The compounds are also
aromatic and fit tightly in the groove of A,T regions, implicating van der Waals
contacts as an important stabilizing factor . Clearly, the position of functional
groups on the ligands is important for the interaction with the DNA sequence.
Netropsin contains a regular array of contacts, each of which interacts with the
DNA. This allows the compound to discriminate between A,T sites through better
or worse matching to this array. However, the DNA conformation in the complex
is not that observed for the free sequence.
G, C Sequence Specificity
Compounds that complex specifically to G,C bp are comparatively rare. Only
a single family of antibiotics, the aureolic acids, appears to bind non-intercalatively
to G,C sequences.41 Structures of the original members of this family, chromomycin
A3 , mithramycin, and olivomycin, are shown in figure 7. The aureolic acids share
a common anthracenone chromophore, which is substituted at both ends with a
series of polydeoxygenated sugar residues. The compounds differ from one another
by the presence or absence of the C7 methyl group and the substitution pattern of
the sugar residues. These compounds are negatively charged at neutral pH, and
require magnesium cations to bind DNA. 42 • 43 Binding does not unwind supercoiled
DNA,44 making an intercalative complex unlikely. The aureolic acids also require
-17-
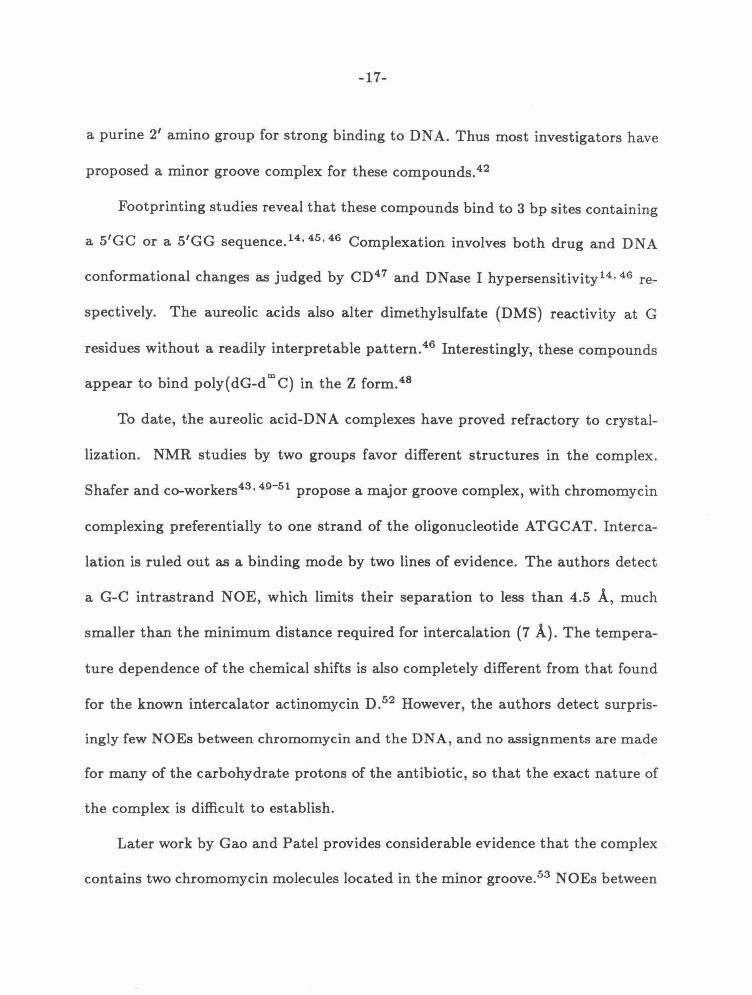
a purine 2' amino group for strong binding to DNA. Thus most investigators have
proposed a minor groove complex for these compounds. 42
Footprinting studies reveal that these compounds bind to 3 bp sites containing
a 5'GC or a 5'GG sequence. 14• 45• 46 Complexation involves both drug and DNA
conformational changes as judged by CD 47 and DNase I hypersensitivity14, 4 6 re
spectively. The aureolic acids also alter dimethylsulfate (DMS) reactivity at G
residues without a readily interpretable pattern. 46 Interestingly, these compounds
appear to bind poly(dG-dmC) in the Z form.48
To date, the aureolic acid-DNA complexes have proved refractory to crystal
lization. NMR studies by two groups favor different structures in the complex.
Shafer and co-workers43 • 49- 51 propose a major groove complex, with chromomycin
complexing preferentially to one strand of the oligonucleotide ATGCAT. Interca
lation is ruled out as a binding mode by two lines of evidence. The authors detect
a G-C intrastrand NOE, which limits their separation to less than 4.5 A, much
smaller than the minimum distance required for intercalation (7 A). The tempera
ture dependence of the chemical shifts is also completely different from that found
for the known intercalator actinomycin D .52 However, the authors detect surpris
ingly few NOEs between chromomycin and the DNA, and no assignments are made
for many of the carbohydrate protons of the antibiotic, so that the exact nature of
the complex is difficult to establish.
Later work by Gao and Patel provides considerable evidence that the complex
contains two chromomycin molecules located in the minor groove. 5 3 NOEs between

-18-
h · .. 0 'i OH OH~·o o o~~o HO o
HO 0~0 I
Olivomycin
Chromomycin A3
HO
Ho~~o L\ -O Ho~o~o
Mi thramycin
Figure 7 The aureolic acid family of G,C specific antitumor antibiotics.41
-19-
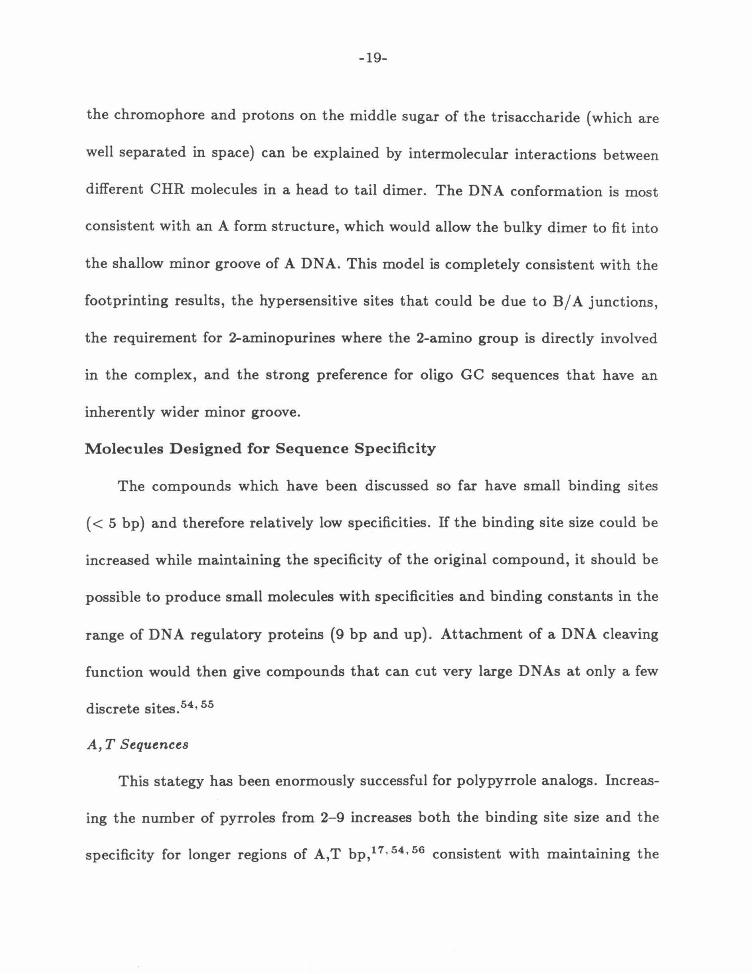
the chromophore and protons on the middle sugar of the trisaccharide (which are
well separated in space) can be explained by intermolecular interactions between
different CHR molecules in a head to tail dimer. The DNA conformation is most
consistent with an A form structure, which would allow the bulky dimer to fit into
the shallow minor groove of A DNA. This model is completely consistent with the
footprinting results, the hypersensitive sites that could be due to B/ A junctions,
the requirement for 2-aminopurines where the 2-amino group is directly involved
in the complex, and the strong preference for oligo GC sequences that have an
inherently wider minor groove.
Molecules Designed for Sequence Specificity
The compounds which have been discussed so far have small binding sites
( < 5 bp) and therefore relatively low specificities. If the binding site size could be
increased while maintaining the specificity of the original compound, it should be
possible to produce small molecules with specificities and binding constants in the
range of DNA regulatory proteins (9 bp and up). Attachment of a DNA cleaving
function would then give compounds that can cut very large DNAs at only a few
discrete sites. 5 4 • 55
A , T Sequences
This stategy has been enormously successful for polypyrrole analogs. Increas
ing the number of pyrroles from 2- 9 increases both the binding site size and the
specificity for longer regions of A,T bp, 17• 54 • 56 consistent with maintaining the

-20-
structural features of the netropsin and distamycin A complexes. 18 • 20 The longer
derivatives require ten or more consecutive A,T bp at high affinity sites , giving
these compounds an overall specificity greater than that of a unique 5 bp site. 55
An EDTA derivative of the nine pyrrole compound cuts the ~50,000 bp lambda
phage genome at only two major sites. 16 This is a higher specificity than is expected
from the binding site size, and probably represents the nonrandom distribution of
long stretches of A,T bp.
As the length of the pyrrole chain increases, the synthesis of these compounds
gets progressively more difficult.16 A possible solution is to connect shorter polypyr
role segments with fiexible56-61 or rigid62 linkers. This strategy is complicated
by the potential for long, flexible linkers to permit independent binding of the
polypyrrole subunits.56 Two different linker design strategies have proved viable.
Short rigid linkers, with geometric requirements similar to the replaced pyrrole
unit, exhibit similar binding specificities as the same size polypyrrole compound. 62
Specificity for a subset of A,T sequences is also increased by utilizing .8-alanine
or ethylenediamine as the linker.63 Thus, limiting the degrees of freedom in the
molecule appears to be a major factor in the selectivity between A,T sequences.
These studies are complicated by the large number of potential binding sites which
need to be observed to establish the specificity. For specificity at the 9 bp level,
there are 256 unique all A,T sequences, and considerably more potential binding
sites containing one or two G,C bp.55 Further studies on a larger number of DNA
sequences should help establish the exact specificities of these compounds.

-21-
G, C Sequences
Groove binding molecules that bind to G,C-containing sequences have proved
much more elusive. Design efforts have focused on developing an element that can
successfully hydrogen bond to G. The presence of the guanine N2H at the bottom
of the minor groove has led several investigators to simultaneously propose that hy
drogen bond accepting groups delivered to the bottom of the minor groove ought
to favor G,C sequences.19• 64
-67 During the course of the work described in this
thesis, Lown and co-workers have synthesized a number of imidazole-containing
netropsin analogs to test this proposal. Early reports concern the dicationic com
pounds shown in figure 8, which are minimal substitutions of the parent compound
netropsin.64 • 68 Footprinting studies indicate that these compounds exhibit a lower
specificity than netropsin, reflected by an increase in the number of sites bound.
The largest decrease is observed for the his-imidazole compound iii. Consistent
with the original proposal, there appears to be an increased tolerance for G,C bp,
although the overall preference remains for A,T sequences. NMR studies using the
well-studied CGCAATTGCG sequence69 provide supporting evidence.68 Like the
netropsin complex, the oligonucleotide is in the B conformation, and the largest
induced chemical shifts occur in the central A,T bp. Exchange rates increase in
the order netropsin < < Py-Im < Im-Im, again indicating a general decrease in
A, T binding.
Three explanations have been put forth to account for the lack of a clearly
defined G,C preference fori-iii. Calculations of the electrostatic potential of DNA
-22-
+ + + H2N~H2 H2N~H2 H2N~H2
H~ HN 0 HN 0
~ N.,..... NJ_N_ NXN-}=1 }=1
HN HN HN
N~No__ ;so__ Nt,.o__ )=J )=J
HN HN HN
~0 ~0 ~0 NH NH NH
H2N\{ H2N\{ H2N-( NH~ NH~ NH~
i i iii
H2N~H2 + +
H,N~H, H2N~H2 +NH2
H2N~ H~
HN 0 HN 0
NJ_N_ NJ_N_ ~ N.,.....
}=1 }=1
HNX.O
f~t ....... HN HN HN HN
NINO- i/o__ N~No__ )=J )=J
HN HN HN
;so__ HN
H ,.k:o
H , \::::o H,.k:o H,.k:o
iv v vi vii
Figure 8 Netropsin analogs studied by Lown and co-workers.6 4 • 65• 70

-23-
sequences have suggested that the dicationic compounds should prefer A,T se
quences on purely electrostatic grounds. 71 A second alternative is suggested by
the original design. While replacement of CH by N should result in better fits
with G,C sequences, there is no obvious mechanism for the disfavoring of A,T
sequences.39 Indeed, the narrower minor groove of A,T DNA should still provide
better contacts to the sides of the pyrrole rings. A third possibility is that the
methylenes at both ends of the molecule are also involved in close contacts with
A,T bp.70
Lown and co-workers have since redesigned the molecules to account for these
factors. Recently, they have reported the series of monocationic imidazole contain
ing compounds shown in the bottom row of figure 8. 65 These compounds contain
just one positive charge to minimize the electrostatic effects, and a formyl group
at the N-terminus to minimize any steric effects. As before, the monoimidazole
derivatives iv and v exhibit a predominantly A,T specificity. The his-imidazole
compound vi, however, is complexed most strongly to a pair of CCGT sequences
on the probe DNA. Several other oligo G,C sequences are not bound even at very
high concentrations of vi. As the restriction fragment used does not contain high
affinity netropsin or distamycin sites, 17 the overall specificity of this compound is
still in question.
Significant binding of vi to CCAT and CCGT sites has been confirmed by
NMR.72• 73 The NOE data support a minor groove complex with vi oriented so

-24-
that the formamide group is adjacent to the 5' C of the binding site. There are some
puzzling features about these complexes, especially with that of the more strongly
bound sequence. 73 Although the authors use a nonsymmetric DNA sequence, they
report peak doubling of the DNA protons in the binding site. Exchange with free
ligand seems unlikely because the imidazole protons are not doubled and the mil
imolar concentrations of DNA and ligand should produce very low concentrations
of uncomplexed DNA. Nonetheless, some sort of exchange appears to be occurring
because the doubled peaks coalesce at higher temperatures. Additionally, all signif
icant chemical shift changes are localized on one strand, indicating an asymmetric
complex. Finally, Lee et al. detect an NOE between the protons of the imidazole
rings, which are expected to be > 7 A apart in a crescent shaped conformation. It
is hoped that an X-ray structure will clarify this situation in the near future.
The success of this formamide his-imidazole compound has provided the impe
tus to produce pyrrole derivatives with potential for mixed G,C and A,T specificity.
The complex of netropsin analog vii, with a formyl group on theN-terminus and a
shorter methylene chain on the C-terminus, has recently been studied by NMR on
the usual CGCAATTGCG sequence.70 The chemical shift data look very similar to
that obtained for earlier A,T specific compounds,6 8 although the authors do detect
NOEs between the compound and the innermost G. No other data are currently
available on the specificity of vii.

-25-
Conclusion
While the work to date delineates a reasonably well understood motif for the
sequence specific complexation of all A,T bp sequences, the situation is not so
straightforward for the complexation of other sequences. The Lown compounds
show no simple correspondence between the number of hydrogen bond acceptor
groups on a small molecule and the sequence that it recognizes. It is encouraging
however, that binding to the minor groove is not limited to A,T sequences, which
appear at present to be the usual sequence preference of groove binding small
molecules.
The validity of designed specificity based on contacts and distances is still in
question for these small molecules. This design does not take into account the DNA
conformational changes that are common features in small molecule complexes.
The success of the polypyrrole strategy may mean that the DNA structure need
not be completely known to produce results. Clearly, much more investigation is
needed to determine the range and molecular details of even the smallest molecules
complexed to DNA. It is to this general problem that the rest of this work will be
addressed.

-26-
Chapter 2
Sequence Specific Complexation of Mixed A,T / G,C Sequences
-27-
In order to extend the specificity observed with the longer pyrrole compounds
to other sequences, it is necessary to develop a compound that is specific for
G,C bp. Two techniques recently developed in the Dervan group hold consider
able promise in screening for such specificity. Protection from methidium-propyl-
EDTA (MPE·Fe(II)) cleavage or MPE·Fe(II) footprinting13• 14• 45 is a recent ad
dition to the DNase 174 and dimethyl sulfate75 protection experiments. Advan-
tages over previous techniques include the determination of binding sites to nu
cleotide specificity 14 and the lack of sequence specificity in the cleavage patterns
produced. 13 A second recent technique is termed affinity cleaving. 76 An EDTA moi
ety is attached directly to the molecule of interest, and binding sites are revealed
by the sequence specificity of the cleavage patterns produced.
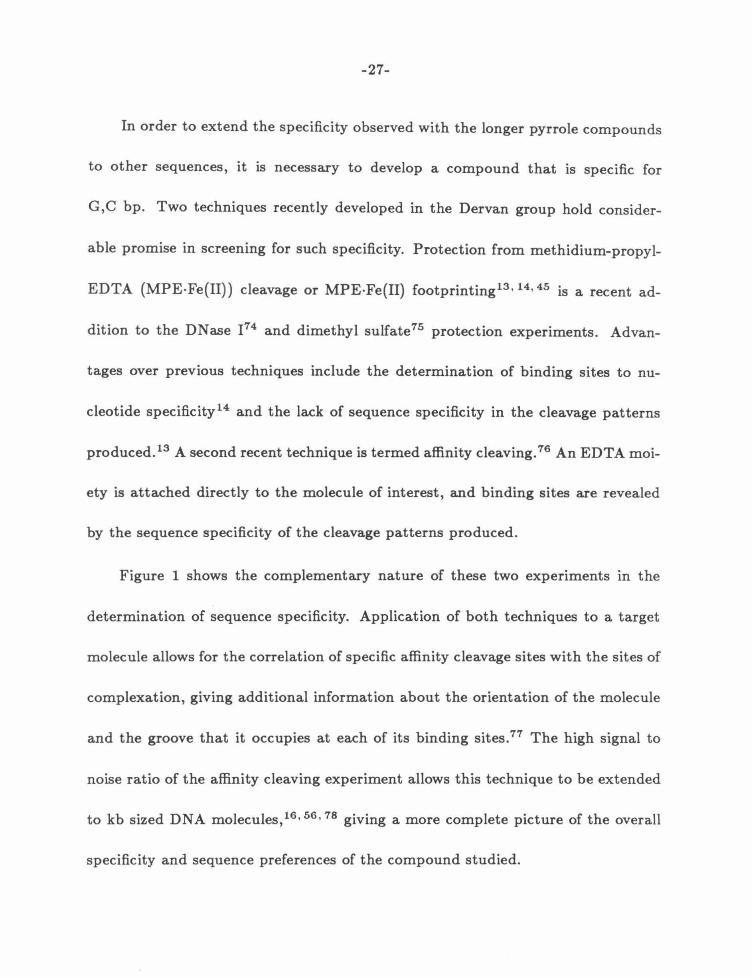
Figure 1 shows the complementary nature of these two experiments in the
determination of sequence specificity. Application of both techniques to a target
molecule allows for the correlation of specific affinity cleavage sites with the sites of
complexation, giving additional information about the orientation of the molecule
and the groove that it occupies at each of its binding sites.77 The high signal to
noise ratio of the affinity cleaving experiment allows this technique to be extended
to kb sized DNA molecules, 16 • 56 • 78 giving a more complete picture of the overall
specificity and sequence preferences of the compound studied.

• • • • 5 ' 3 ' 5' 3'
---+ • .... 4 ----+-- ----+ ----+ - - I ..... - ----+ ---- • ----• + -- - -~ -- -• +-- -- • 1:..... +----• 4 -- -E-3:_ --..._ 4 •t---14
5' 3' 5 ' 3'
F igure 1 Complementary information provided by the footprinting and affinity cleaving experiments. Footprinting determines the binding site of the small molecule. Affinity cleaving produces a relative ordering of binding site affinities. A 31 shift in the cleavage pattern (as shown) indicates that the compound binds in the minor groove.77 A comparison of both experiments determines t he orientation of the molecule at its binding sites.
I t..:> 00 I

-29-
Design of Potential G,C Binding Molecules
All of the groove-binding compounds in chapter 1 have some common features
presumably important for their DNA binding activity. The compounds that form
tight complexes are aromatic and positively charged, and usually form specific
hydrogen bonds with the target DNA. From the minor groove, the major difference
between A,T and G,C bp is the presence of the guanine N2 at the floor of the groove.
Thus the simplest design for a G,C specific minor groove binding molecule takes
advantage of the hydrogen bond donating ability of guanine with an aromatic ring
system containing hydrogen bond acceptors and a single positive charge. Several
different versions of such compounds have been synthesized, and are shown in
appendix D .
Attempts to footprint these compounds reveal two flaws in this simple strategy.
The DNA binding assays require a binding constant of at least 104 M- 1 . Affinity
cleaving at higher concentrations of cleaving agent needs mM concentrations of
iron, resulting in very high backgrounds. MPE·Fe(II) footprinting is complicated
by the potential for direct interaction between the intercalator probe and the groove
binder. Both experiments suffer from the substantial metal chelating abilities of the
synthetic compounds. In addition, such ligands prove labor-intensive to synthesize
and study.
For these reasons, a more successful strategy involves the modification of ex
isting DNA binding ligands. The best candidates for such an approach are the

A,T
(
'·. ;·~ -; HN .O
8 A
,'
HN
0
N--
5'
A,T
' \ \
' ' \ \ .. ,-/'', ' "-./.... \ . ..
(R
··~ /"~ 1 HN _,0
' ·""
HN
0
v ',(0/~~~-HN
~ h ~0
Figure 2 Design of synthetic compounds expected to complex with single G containing sites. Circles represent the lone pair electrons of thymine 02 and adenine N3. Dashed lines represent the expected pattern of hydrogen bonds. A) The putative complex of the distamycin A analog D based on the crystallized complexes. 18 • 20 B) Hypothetical effect of placing one hydrogen bond acceptor on the floor of the minor groove.
I w 0 I

-31-
polypyrrole compounds discussed in chapter 1. By utilizing the A,T specificity and
high affinity of netropsin or distamycin A to deliver a G,C bp recognizing element
to the minor groove of B DNA, it should be possible to produce hybrid molecules
that recognize mixed A,T/G,C sequences at micromolar concentrations. The de
sign of such a molecule is shown in figure 2. The first G,C recognition element to
be examined is a heterocyclic aromatic ring capable of forming a strong hydrogen
bond to the guanine NH. Placement of this ring at theN-terminus of netropsin has
two distinct advantages. Many different aromatic acids are commercially available
or readily prepared, and the synthesis of all compounds is convergently achieved
in one step from a common dipyrrole intermediate. Production of the appropriate
C-terminal EDTA compound has also been achieved,76 so that similar chemistry
produces the analogs required for both assays. Earlier studies have shown that
the monopyrrole analog of netropsin does not bind DN A,79 and that the bind
ing constant of these compounds increases with the number of pyrroles.9 • 17 Two
pyrroles appear to offer the best compromise between the requirement for large
binding constants and the lowest possible A,T bp preferences. Similarly, a single
positive charge appears to offer the best electrostatic compromise. As shown in
figure 2, a successfully designed compound is envisioned as binding to one G,C bp,
followed by 3- 4 A,T bp, having a strong preference for the orientation that gives
a hydrogen bond between the N2H of G and the N-terminal heterocycle. Such
binding should produce detectable differences from binding and cleavage patterns
of the distamycin A analog D shown in figure 2.
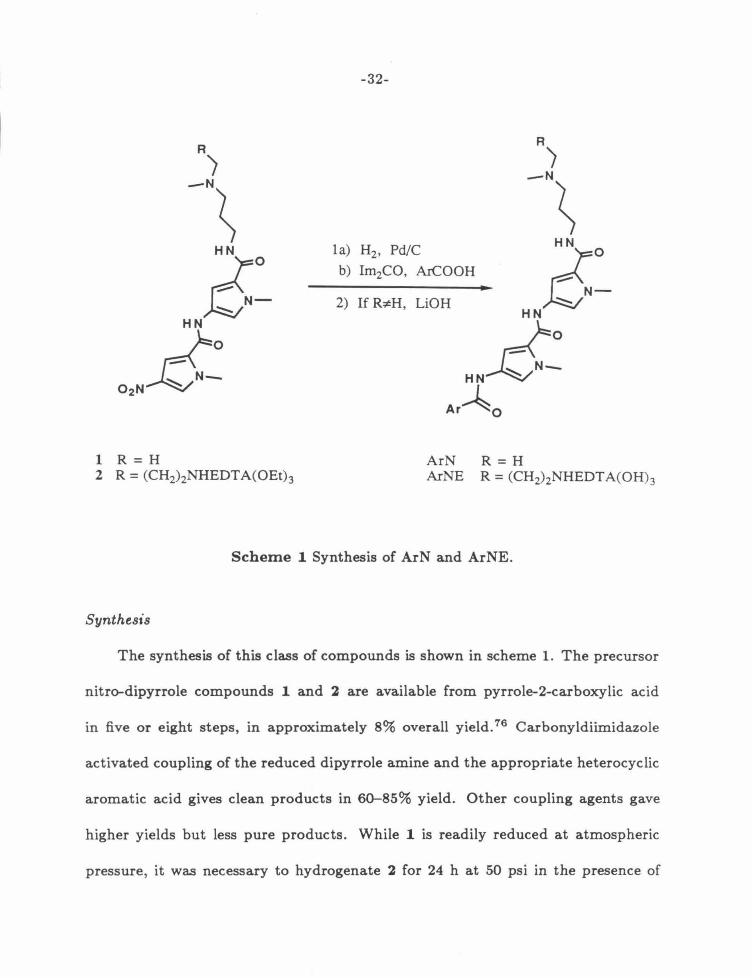
1 R = H 2 R = (CH2h NHEDT A(OEt)]
-32-
2) If R;tH, LiOH z~ HN
l a) H2 , Pd/C
b) Irn2CO, ArCOOH
J~ HNJ;;;;N-
Ar~o
ArN ArNE
R=H R = (CH2hNHEDT A(OH)J
Scheme 1 Synthesis of ArN and ArNE.
Synthesis
The synthesis of this class of compounds is shown in scheme 1. The precursor
n itro-dipyrrole compounds 1 and 2 are available from pyrrole-2-carboxylic acid
in five or eight steps, in approximately 8% overall yield. 76 Carbonyldiimidazole
activated coupling of the reduced dipyrrole amine and the appropriate heterocyclic
aromatic acid gives clean products in 60-85% yield. Other coupling agents gave
higher yields but less pure products. While 1 is readily reduced at atmospheric
pressure, it was necessary to hydrogenate 2 for 24 h at 50 psi in the presence of

-33-
a large amount of palladium catalyst. 76 The first compounds prepared are shown
in figure 3. Coupling of 1-methylimidazole-2-carboxylic acid to the amine derived
from 2 by several different methods fails completely. The synthesis of the imidazole
EDTA compound is shown in scheme 2.
5 R = t-Boc
1 a) H2, Pd/C
b) Im2CO, MelmCOOH (4)
2) CF3COOH
3) Im2CO, EDTA(OEth
4) LiOH
6 R = t-Boc 84 % 7 R = H 87 % 8 R = EDTA(OEth 15 %
2-ImNE R = EDTA(OHh 27 %
Scheme 2 Synthesis of 2-Im.NE.

-34-
I /N\ I /N\ I /N\ HNXO )dN~
HNXO )dN~
HNXO )dN~
HN
iNa_ HN
HN
iNa_ HN
HN
iNa_ HN
ifo 0~0 ifo 2-FuN 3-FuN 2-ThN
Rl
HN
60
'9' N~
HN
60
'9' N~
/N\ HN
60
'9' N~
- - -HN HN HN
iSN0-<10
iNa_ HN Ncto
iSNO-HN
ifo 2-PyN, 2-PyNE 3-PyN, 3-PyNE 4-PyN, 4-PyNE
I /N\ HNXO )dN~
HN
HN
iNa_ s~o
3-ThN
2-ImN, 2-ImNE
Figure 3 Synthetic compounds to be tested for G,C recognition.

-35-
DNA Binding Assays
The behavior of these compounds on the 517 bp EcoR I/ Rsa I restriction
fragment of pBR322 is shown in figures 4, 5, and 6. Analysis of these compounds
by MPE·Fe(II) footprinting reveals that J.LM concentrations of all the compounds
protect distinct 5-6 bp regions from MPE·Fe(II) induced cleavage. The location
of protected regions is determined by the published method. 77 An autoradiogram
of the high resolution sequencing gel is scanned by densitometer. The footprinting
lane is compared to a standard lane obtained from MPE·Fe(II) cleavage in the
absence of any ligand, and the nucleotides protected from cleavage are identified.
The extent of protection is measured by subtracting the protected peak heights
from the height of the nearest unaffected peak. These protection patterns are
plotted in histogram form in figures 7 and 8. Binding sites are determined by t he
published model13• 14 with MPE·Fe(II) cleavage protection shifted by one bp to
the 3' end of the DNA.
On this restriction fragment, distamycin A and its analog D (figure 2) bind to
five readily interpretable sites. The 5'-TTTTT-3' site is clearly the highest affinity
site, detected at 0.5 J.LM . Two other sites are detected at 2 J.LM, and the last two
show only weak protection at concentrations below 10 J.LM. 13• 84 This same pattern
is observed for the thiophene-2-carboxamide-netropsin, thiophene-3-carboxamide
netropsin, furan-2-carboxamide-netropsin, furan-3-carboxamide-netropsin, pyri
dine-3-carboxamide-netropsin, and pyridine-4-carboxamide-netropsin derivatives.

-36-
Figure 4 MPE·Fe(II) footprinting of the furan and thiophene analogs of D. Au
toradiogram of an 8% high resolution denaturing polyacrylamide gel. All reactions
contain 4 mM DTT, 100 J,LM-bp calf thymus DNA, and 12 kcpm 5' labeled 517 bp
restriction fragment in 40 mM Tris·acetate pH 7.9 buffer. Lane 1, intact DNA;
lane 2, Maxam-Gilbert G reaction;80 lanes 3-10 contain 4 J.LM MPE·Fe(II), lane 3,
MPE·Fe(II) standard, lane 4, 2 J,LM D; lanes 5-6, 20 J,LM and 10 J,LM 2-FuN re
spectively; lanes 7- 8 20 J,LM and 10 J,LM 3-FuN respectively; lane 9, 5 J.LM 2-ThN,
lane 10, 5 J,LM 3-ThN.

-37-
z z 0 :J :J ..... u. u. z z - I I .r::: .r::: c:
~ C\1 M
0 I- I-(,)(!) Cl n n I I
C\1 M
1 2 3 4 5 6 7 8 9 10
-

-38-
Figure 5 A) MPE·Fe(II) footprinting of the pyridine analogs of D. Autoradiogram
of an 8% high resolution denaturing polyacrylamide gel. All reactions contain 4 mM
DTT, 100 JLM-bp calf thymus DNA, and 12 kcpm 5' labeled 517 bp restriction
fragment in 40 mM Tris·acetate pH 7.9 buffer. Lane 1, intact DNA; lane 2, Maxam
Gilbert G reaction;80 lane 3, A reaction;81 lanes 4-13 contain 4 JLM MPE·Fe(II):
lane 4, MPE·Fe(II) standard; lane 5, 4 JLM D; lane 6, 20 JLM 2-PyN; lane 7,
20 JLM 2-ImN; lanes 8-10 contain 35 J,£M, 10 J,£M, and 1 JLM 3-PyN respectively;
lanes 11-13, 35 J,£M, 10 J,£M, and 1 JLM 4-PyN respectively. B) Specific Cleavage
by the pyridine analogs of D. Autoradiogram of an 8% high resolution gel. All
reactions contain 4 mM DTT, 100 JLM-bp calf thymus DNA, and 12 kcpm 5'
labeled 517 bp restriction fragment in 40 mM Tris·acetate pH 7.9 buffer. Lane 1,
intact DNA; lane 2, Maxam-Gilbert G reaction;80 lane 3, A reaction;81 lane 4,
2 JLM ED; lane 5, 50 JLM 2-PyNE; lane 6, 70 JLM 2-ImNE; lane 7, 10 JLM 3-PyNE;
lane 8, 7 JLM 4-PyNE.

-39-
A 8 z z
0 >. >. 0 UJUJ UJUJ
..... z z a.. a.. ..... zz zz ...... >- E ' ' ...... >-e >. >. c
~ C') "<t c
0 a.. - 0 0 a__ a.. a..
' ' ' ' ' ' (.) ~ ~ 0 C\1 C\1 rl II (.) ~ ~ UJ C\1 C\1 C')"<t
1 2 3 4 5 6 7 8 9 10 11 12 13 1 2 3 4 5 6 7 8
-
---
--

-40-
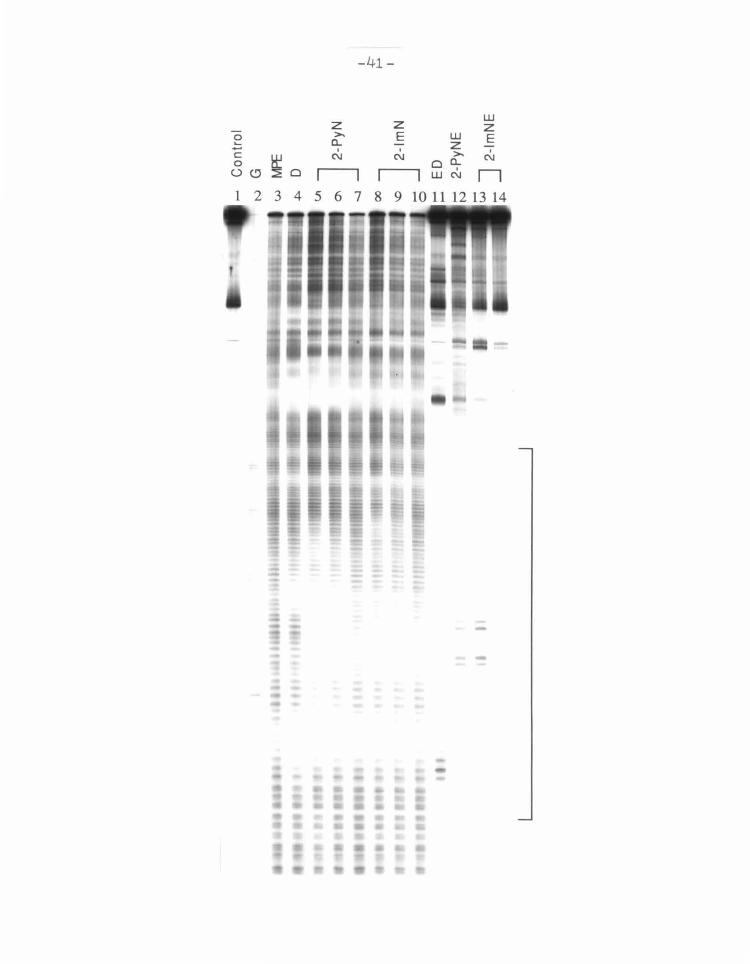
Figure 6 Footprinting and affinity cleaving of 2-PyN and 2-lm.N. Autoradiogram
of an 8% high resolution denaturing polyacrylamide gel. All reactions contain
4 mM DTT, 100 J.LM-bp calf thymus DNA, and 12 kcpm 5' labeled 517 bp restric
tion fragment in 40 mM Tris·acetate pH 7.9 buffer. Lane 1, intact DNA; lane 2,
Maxam-Gilbert G reaction;80 lanes 3-10 contain 4 J.LM MPE·Fe(II): lane 4, 2 J.LM D ;
lanes 5-7 2-PyN at 35, 20, and 10 J.LM respectively; lanes 8-10, 2-lmN at 35, 20,
and 10 J.LM respectively; lane 11, 2 J.LM ED; lane 12, 50 J.LM 2-PyNE; lanes 13-14,
70 and 50 J.LM 2-lmNE respectively.
-41-
w z z z 0 >- E w E ..... a.. z ...... I I >- I c
~0 C\1 C\1 C\1
0 oa.. (.)~
I n WC\1
1 2 3 4 5 6 7 8 9 10 11 12 13 14
-42-
D at 2 I-'M
2-FuN at 10 I-'M
... .... - .... 32p5'- C GC CT AffT"'fTT!A T A GG T T AA TG TC A TGAffiTfil.l TGG tffTC"'fn.lGA CG TC A GG TGG C~ G GG G-3' 3~GCGGA~ATCCAATTACAGTAC~ACC~CTGCAGTCCACCG~CCCC~' .... ._. ... ....
3-FuN at 10 I-'M
.IIIL. -*- ... 32p5'- C G C CT AffT"'fTT!A TAG G T T AA T G TC A TG A Tli'i"fi'iiTGG TTTCTT A G A C G T C A GG TGG CAICf"fT'Tic G G G G-3'
3'- G C GGA 'I'IA.A..UAJT A TC C AA TT A C AG TACT AII..I.A.I.IIA CC A H GAA TC TG C AG TCC A CC G T1!U.AA.AIG CCC C-5' .. .... 2-ThN at 5 I-'M
......_ ... A...._ A s2 p 5'- C G C C T AffT"'fTT!A T A G GfffriTic T C AT G A 'I'fi'i'"fA1It G G Tff'fCfflA G A C G T C A G G T G G C AICf"fT'Tic G G G G-3'
3'- G C G G A T1AA.AA.AJT A T C CIAA.llAJC A G TACT AII..I.A.I.IIA C C A~ C T G C A G T C C A C C G T1!U.AA.AIG C C C C ~·
~· .... .... ... 3-ThN at 5 I-'M
32p5'- CGCCT 3'- GCGGA
-- ..... .... .. TAG GffTTiTIG T CAT G A IIIIIllii G G T!f'f'C'i'TIA G A C G T C A G G T G G C AICf"fT'Tic G G G G-3' ATC~AGTACTA CCA~CTGCAGTCCACCG~CCCC~' ._.... ... ~ ...
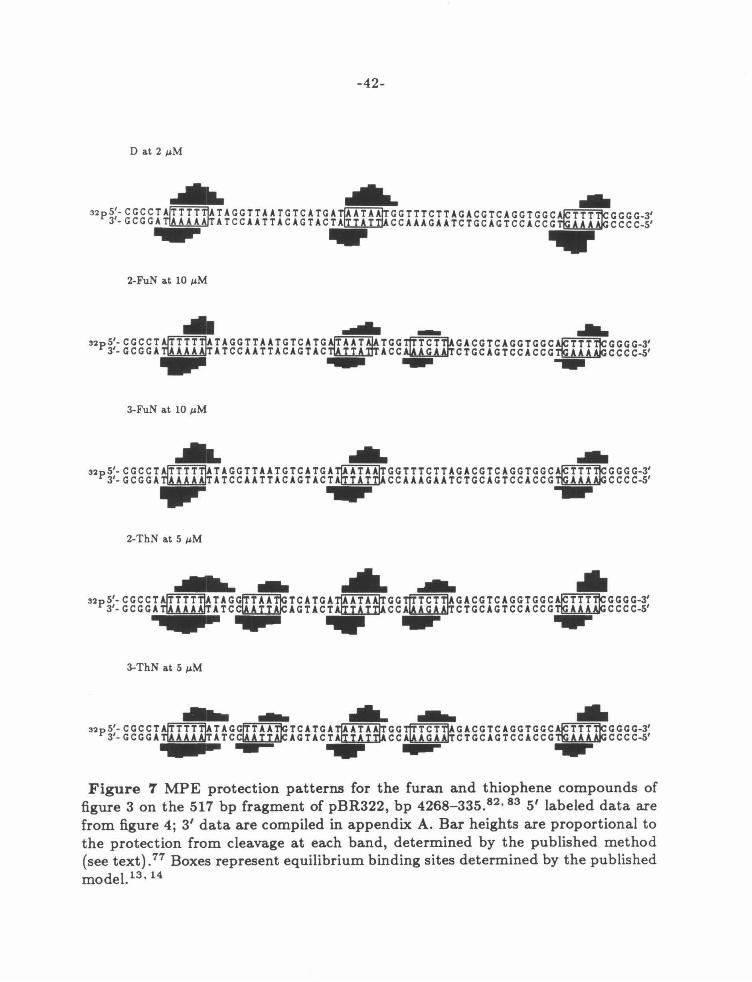
Figure 7 MPE protection patterns for the furan and thiophene compounds of figure 3 on the 517 bp fragment of pBR322, bp 4268-335. 82
• 83 5' labeled data are
from figure 4; 3' data are compiled in appendix A. Bar heights are proportional to the protection from cleavage at each band, determined by the published method (see text) .77 Boxes represent equilibrium binding sites determined by the published model.13, 14

D at 2 J.LM
2-PyN at 10 J.LM
-43-
.... ... T AGG TTAATG TCA TGA '1'1A'i'f'i'i~TGG TTTCTT AGACG TCAGG TGGC~GGGG-3' ATCCAATTACAGTACTA~CCAAAGAATCTGCAGTCCACCG~CCCC~' ... ..
.. d 3lp5:- C GC CT Aff'f'f'TT!A T AGG TTA~GA T AAT U TGG TTTCTT AGACGTCAGG TGGCACTT T TCGGGG-3' 3-GCGGA~ATCCAAT CA CTATTATTACCAAAGAATCTGCAGTCCACCGTGAAAAGCCCC-~ .....
2-ImN at 10 J.LM
3lp5'- CGCCTATTTTTATAGGTTA 3'- G CG GA TAAAU TA TCC AA T
GATAATAATGGTTTCTTAGACGTCAGGTGGCACTTTTCGGGG-~ CTATTATTACCAAAGAATCTGCAGTCCACCGTGAAAAGCCCC-~
3-PyN at 10 J.LM
4-PyN at 10 J.LM
SlpS'- CGCCT 3'- GCGGA
... .... .. T A GGfffi'ITlc TC A TG A '1'1A'i'f'i'i~TGG TTTCT TAG AC G TC A GG T G G C AJC'"ffTTic GG GG-3' ATCC~AGTACT~CCAAAGAATCTGCAGTCCACCG~CCCC~'
4 .. ...
~ ... .1111 T AGcfffi'ITlc TC A TG A '1'1A'i'f'i'i~TGG TTT CTT A GA CG TC A GG TGG C AJC'"ffTTic GG GG-3' ATCC~AGTACT~CCAAAGAATCTGCAGTCCACCG~CCCC~' .... ... .....
Figure 8 MPE protection patterns for the pyridine and 1-methylim.idazole containing compounds of figure 3 on the 517 bp fragment of pBR322, bp 4268-335.82 • 83
5' labeled data are from figures 5 and 6, 3' data are compiled in appendix A. Bar heights are proportional to the protection from cleavage at each band, determined by the published method (see text).77 Boxes represent equilibrium binding sites determined by the published model. 13
• 14

-44-
These compounds give generally lower binding constants and less selectivity be
tween sites than does D. The pyridine-3-carboxamide-netropsin compound is typ
ical, with all five normal D sites protected at 10 J.t.M and no detectable binding at
1 J.t.M. The lower specificity and binding affinity for these compounds is probably a
result of the removal of theN-terminal amide of D, representing the effect of loss of
one bifurcated hydrogen bond on the overall complex stabilities at various sites. 2 0
Two compounds exhibit significantly different binding properties that can be
readily observed in the affinity cleaving lanes of figure 6. The data are summarized
in histogram form in figure 9. Both the pyridine-2-carboxamide-netropsin (2-PyN)
and the 1-methylimidazole-2-carboxamide-netropsin (2-ImN) compounds bind to
a new site on the 517 bp fragment that maps to a TGTCA sequence. The cleavage
patterns of the EDTA derivatives, 2-PyNE and 2-ImNE, indicate one binding site
with two equivalent orientations. This correlates with the approximate two-fold
symmetry of the new site. The cleavage is shifted toward the 3' end of the DNA,
consistent with the presence of these compounds in the minor groove. The affinity
at all sites is reduced by at least a factor of 10. Both 2-PyNE and 2-ImNE cleave
this restriction fragment less efficiently at 50 JLM than ED at 2 J.t.M or the pyridine
isomers 3-PyNE and 4-PyNE at 10 J.t.M.
Several minor sites, most notably the CTTTT sequence in figure 9, show the
binding and cleavage patterns expected from the original model. Both compounds
cleave this site with a strong preference for the orientation that puts the hetero
cyclic nitrogen near the G,C bp. This specificity is reversed from the behavior of

-45-
ED at 2 ~M
!ll!t!~l!ll .~~~• 11ll!1 ;II~ 3:tp5'- CGCCT AiTTffTIA TAGGTT A A TG TCA TGA rfi1!ri}rGGTTTCTT AGACGTC AGGTGG C~GGGG-3: 3~GCGGA~ATCCAATTACAGTACT~CCAAAGAATCTGCAGTCCACCG~CCCC4
tlfll' lftttttt +ttt '1f11 tttt +tt
2
-PyNE at
50
~!~~ HUH+ dl! ~ll!HhuH+ U +H~ 3:tp5'- C GC C T AiTTffTIA TAG G T T A .A/fG"TCih'GA Tfi'iTilJTCG TTT C TT A C A CC TC A CC TC CC ~C GGC-3' 3~GCCCA~ATCCAAT~CT~CCAAACAATCTGCAGTCCACCG~CCCC4'
'jtt ttttt 'ilit tljitttt tt tttt tt
~lmNE at
7:;~. .dl1 111111 •Ul 3:tp5'- CCC CT ~TAG C T T A ~CAT A AT AA TC C TTTCTT A C A CG TC A GG TG CC ~ CG G G-3' •-cc:;: A ATCC'ifr l)!lii'TTATTACCAAAGAATCTGCAGTCCACCG +tft CCC~·
3-PyNE at 10 ~M
!!!~... +++ ···~··· +++ 3:tp5'- CGCCT Affff'fTIA TAGGff'fiA'TlcTCA TCA rfiTfiilTGGTTTCTT ACACG TC ACC TGGC~GGGG-3' 3~GCGGA~ATC~ACTACTA~CCAAACAATCTCCAGTCCACCC~CCC~~
flflf ttftt tt ttt tff!l ttt tt
4-PyNE at 10 ~M
.!!!~~········ ·~····~~~·· +++ 3:tp5'- CGCCT Affff'fTIA T AGGff'fiA'TlcTCA TGA IffillJIGGTTTCTT AGACGTCAGG TGGC~GGGG-3' 3~GCGGA~ATC~AGTACT CCAAAGAATCTGCAGTCCACCG~CCC~~
tfjftttttjttttt tjjttttjjtt ttt ttt ttt
Figure 9 Cleavage of the 517 bp fragment of pBR322, bp 4268-335,82 • 83 by the EDTA substituted analogs of figure 3. 5' labeled data are from figures 5 and 6 , 3' data are compiled in appendix A. Arrows are proportional to the maximum densities of the cleavage bands. Boxes represent binding sites determined by the published method. 77

-46-
ED at the same site, and thus probably represents the expected binding mode.
However, it is clear that the major binding site of these compounds on the 517 bp
fragment unexpectedly contains a second G,C bp.
The three pyridine isomers differ only by the relative position of the nitrogen
atom in the pyridine ring, yet the DNA binding behavior changes radically for the 2
isomer. Both 3-PyN and 4-PyN exhibit normal behavior for this type of compound.
They bind strongly to A,T rich sites at 10 JLM with orientation preferences and
relative site preferences identical to the parent compound D . When the pyridine
nitrogen is adjacent to the amide carbonyl, however, the binding of A,T is strongly
disfavored and the new site appears. This change in binding on isomer substitution
implicates the pyridine nitrogen in both the recognition of the TGTCA site and
the disfavoring of A,T rich sites. It also suggests that the proximity of the amide
and the heterocyclic nitrogen is important for the altered behavior of 2-PyN.
Comparison of the cleavage patterns of 2-PyNE and 2-ImNE reveals that the
imidazole compound is more selective for the TGTCA site. Although cleavage
at the new site is the same (within experimental error), cleavage at all A,T sites
is considerably reduced. There are only two major cleavage sites visible on the
517 bp fragment, the TGTCA site and a slower running site that maps to an
AGACA sequence. Again, the differences between the compounds imply an active
role for the heterocyclic nitrogen in the disfavoring of A,T sites. Simple geometric
arguments for the specificity d ifference are eliminated by the similar geometry

-47-
of the two compounds, the range of observed donor acceptor angles of hydrogen
bonds85 and the fact that the compound with a five-membered ring binds less well
to A, T regions.
A possible explanation for this behavior lies in the ability of the pyridine ring
to form two isomeric complexes with any DNA sequence. The pyridine nitrogen
can either face the floor of the minor groove, where it could form a hydrogen bond
with the bases, or face out of the groove, where it is available only to solvent.
In the second conformation, 2-PyN should be very similar to 4-PyN, which binds
only A,T rich sequences. It seems reasonable that the 2-PyN/TGTCA complex is
formed with the pyridine nitrogen facing the floor of the groove (giving a putative
hydrogen bond to the N2H of G), while the 2-PyN/TTTTT complex is formed with
the ring nitrogen facing out. This N out conformation is inaccessable to 2-ImN
because of close contacts between the 1-methyl group and the floor of the minor
groove. Free in solution, these compounds are presumed to be completely hydrogen
bonded to solvent. If the complex at A,T sites is similar to that of distamycin A,
then the imidazole nitrogen must be desolvated to form a tight complex, whereas
the pyridine nitrogen facing out does not lose a hydrogen bond.
TGTCA Site Structure
Strong sites for D binding, such as the TTTTT site on the 517 bp fragment,
are known to exhibit unusual reactivity86 and structure,87 which induces local
bending.88 On binding distamycin A, the binding site undergoes a conformational

-48-
Figure 10 Structural features of 2-PyN and 2-ImN binding. Autoradiogram
of an 8% high resolution denaturing polyacrylamide gel. All reactions contain
12 kcpm 3' labeled 517 bp restriction fragment. Lanes 1, 3-6, and 12-24 contain
200 JLM-bp calf thymus DNA in 40 mM tris acetate pH 7.9 buffer; Lanes 7- 11
contain 200 JLM-bp calf thymus DNA in TKMC buffer; Lane 1, intact DNA; lane 2,
Maxam-Gilbert G reaction;80 lanes 3-6 contain 4 JLM MPE·Fe(II), and 4 mM DTT,
cleavage time 20 min at 37°C; lane 7, intact DNA; lanes 8-11 contain 0.33 ng
DNase I reacted for 3 min at 25°C; lanes 12-15 contain 100 JLM calf thymus DNA,
100 JLM potassium permanganate, 15 min at 37°C; lanes 16-19 contain 100 JLM calf
thymus DNA, 136 mM diethyl pyrocarbonate, 10 min at 37°C; lanes 2Q-23 contain
53 mM dimethyl sulfate, reacted for 5 min at 25°C, then A>G workup;80 lanes 4, 9,
13, 17, and 21 contain 20 JLM D; lanes 5, 10, 14, 18, and 22 contain 20 JLM 2-PyN;
lanes 4, 9, 13, 17, and 23 contain 20 JLM 2-lmN.

-49-
0 0 ..... ..... - MPE -c c DNase I DEP OMS 0 0 uCJ I I u I I I I I I I I 1 2 3 4 5 6 7 8 9 10 11 12 13 14 15 16 17 18 19 20 21 22 23
---------
T
J G A c A
J A - - A - A A A
- ... -- ...
-50-
y y
5'· T A T A G G T T A A T G T C A T G A T A A T A A T T -3 '
3 '· AT AT C C A AT T A C A G T ACT AT T AT T A A·S'
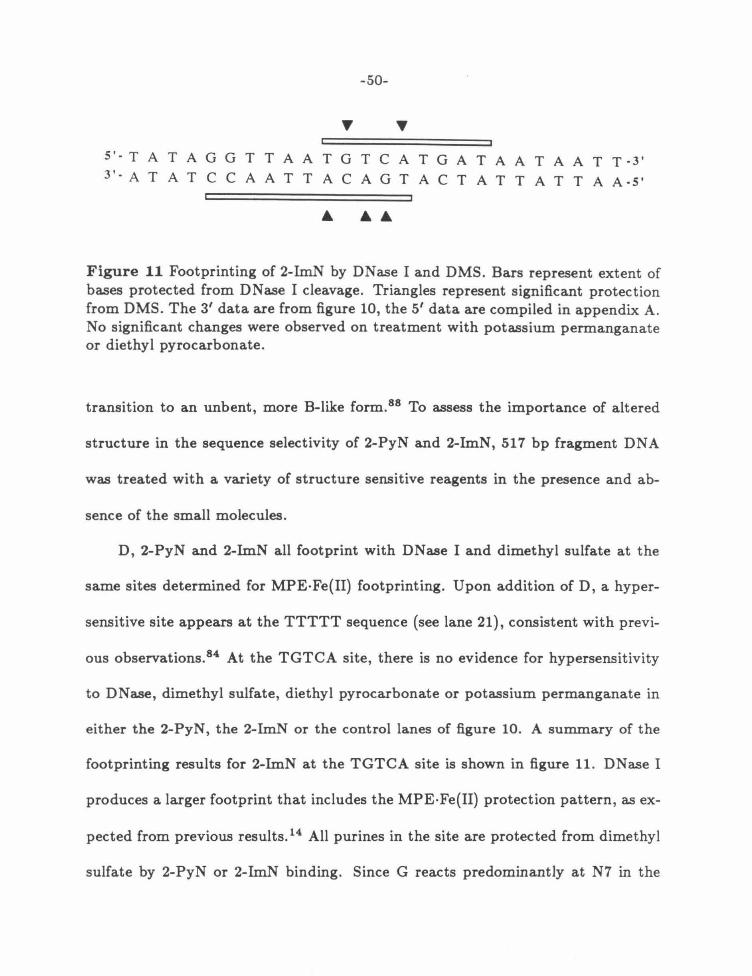
Figure 11 Footprinting of 2-ImN by DNase I and DMS. Bars represent extent of bases protected from DNase I cleavage. Triangles represent significant protection from DMS. The 3' data are from figure 10, the 5' data are compiled in appendix A. No significant changes were observed on treatment with potassium permanganate or diethyl pyrocarbonate.
transition to an unbent, more B-like form. 88 To assess the importance of altered
structure in the sequence selectivity of 2-PyN and 2-ImN, 517 bp fragment DNA
was treated with a variety of structure sensitive reagents in the presence and ab-
sence of the small molecules.
D, 2-PyN and 2-ImN all footprint with DNase I and dimethyl sulfate at the
same sites determined for MPE·Fe(II) footprinting. Upon addition of D, a hyper-
sensitive site appears at the TTTTT sequence (see lane 21), consistent with previ-
ous observations. 84 At the TGTCA site, there is no evidence for hypersensitivity
to DNase, dimethyl sulfate, diethyl pyrocarbonate or potassium permanganate in
either the 2-PyN, the 2-ImN or the control lanes of figure 10. A summary of the
footprinting results for 2-ImN at the TGTCA site is shown in figure 11. DNase I
produces a larger footprint that includes the MPE·Fe(II) protection pattern, as ex-
pected from previous results.14 All purines in the site are protected from dimethyl
sulfate by 2-PyN or 2-ImN binding. Since G reacts predominantly at N7 in the

-51-
major groove and A reacts predominantly at N3 in the minor groove, 89 this is most
consistent with a DNA structural transition on complexation. The negative results
obtained with the other structure-sensitive reagents are taken as evidence that any
change in DNA conformation remains in the B family.
Double Stranded Cleavage of pBR322
It appears from the high resolution gel data that 2-PyN and 2-ImN exhibit a
completely different DNA specificity than the other ArN compounds. However, in
the resolvable region of the 167 and 517 bp fragments of pBR322, only 36% of the
512 unique five bp sequences and only 11% of the 2080 unique six bp sequences are
present. Since high resolution gels can scan only a small fraction of the potential
binding sequences in a reasonable time period, an assay capable of examining larger
DNAs has been developed16 (figure 12). A small molecule equipped with an EDTA
cleaving moiety will produce double-stranded breaks whenever two cleavage events
occur within eight bp of one another on opposite strands.9° Frequently occupied
sites will then be revealed as cleavage bands on an agarose gel. Using two singly
labeled strands and averaging the band sizes determined for each strand gives site
positions accurate to ±40 bp on a 4000 bp DNA molecule as judged by the known
high affinity sites found on restriction fragments. 16 Conditions used for the double
stranded assay are essentially the same as those used for high resolution, except
that the decreased background permits longer cleavage times (2 h) and the use of
ascorbate as a reductant.

32p
----1) linearize II II Agarose Gel
...._ ..... • .................... -......... -.... -
2) label II or
II Electrophoresis
3) ds cleavage
-32p
Figure 12 Double stranded cleavage specificity assay. A circular DNA is linearized with a restriction enzyme that gives differentiable termini. Labeling with Klenow fragment of DNA polymerase I at one terminus and treatment with the specific cleavage agent gives a set of double stranded fragments (only one shown) which can be resolved on an agarose gel. Comparison of both labeled ends gives two independent determinations of the cleavage site locations.
I
'" N I
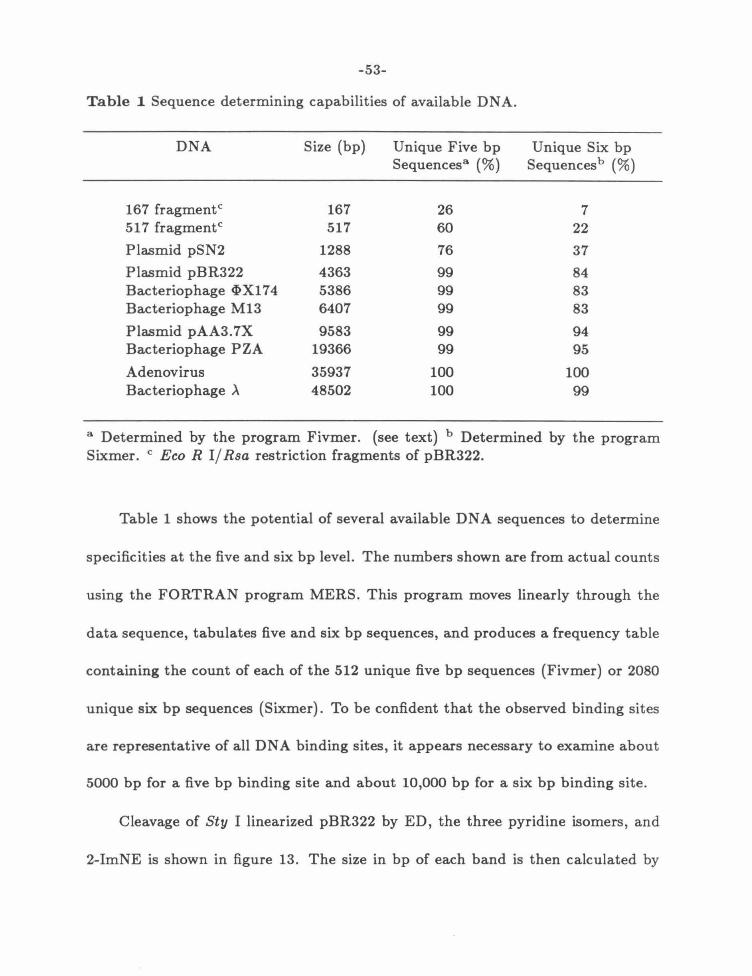
-53-
Table 1 Sequence determining capabilities of available DNA.
DNA Size (bp) Unique Five bp Unique Six bp Sequences3 (%) Sequencesb (%)
167 fragmentc 167 26 7 517 fragmentc 517 60 22
Plasmid pSN2 1288 76 37
Plasmid pBR322 4363 99 84 Bacteriophage ~ X1 7 4 5386 99 83 Bacteriophage M13 6407 99 83
Plasmid pAA3.7X 9583 99 94 Bacteriophage PZA 19366 99 95
Adenovirus 35937 100 100 Bacteriophage ). 48502 100 99
a Determined by the program Fivmer. (see text) b Determined by the program Sixmer. c Eco R 1/ Rsa restriction fragments of pBR322.
Table 1 shows the potential of several available DNA sequences to determine
specificities at the five and six bp level. The numbers shown are from actual counts
using the FORTRAN programMERS. This program moves linearly through the
data sequence, tabulates five and six bp sequences, and produces a frequency table
containing the count of each of the 512 unique five bp sequences (Fivmer) or 2080
unique six bp sequences (Sixmer). To be confident that the observed binding sites
are representative of all DNA binding sites, it appears necessary to examine about
5000 bp for a five bp binding site and about 10,000 bp for a six bp binding site.
Cleavage of Sty I linearized pBR322 by ED, the three pyridine isomers, and
2-lmNE is shown in figure 13. The size in bp of each band is then calculated by
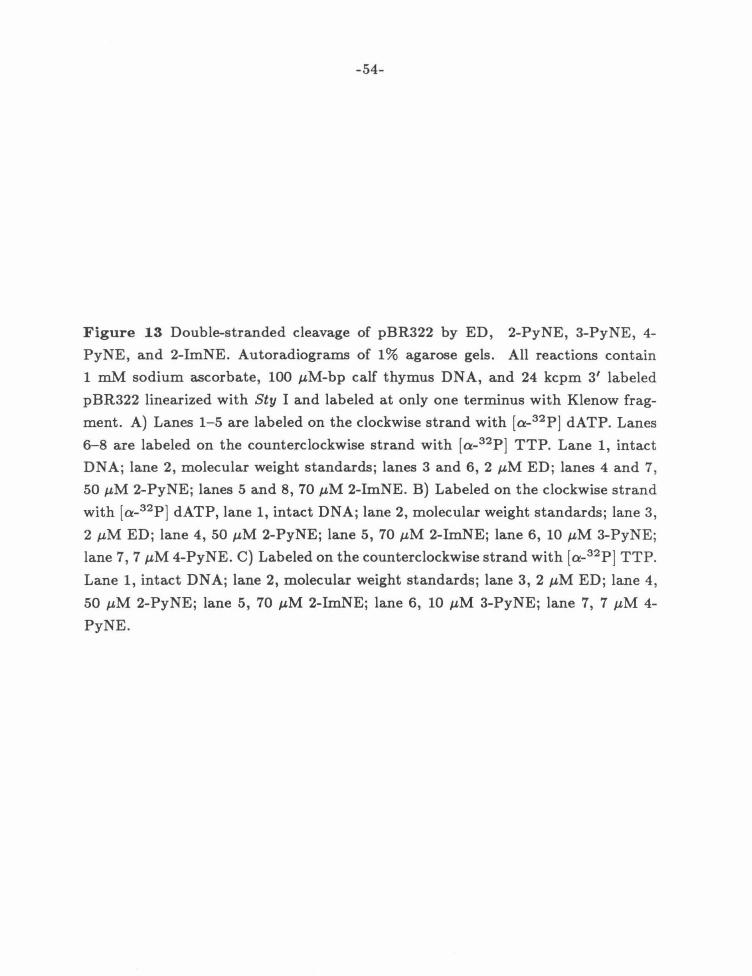
-54-
Figure 13 Double-stranded cleavage of pBR322 by ED, 2-PyNE, 3-PyNE, 4-
PyNE, and 2-Im.NE. Autoradiograms of 1% agarose gels. All reactions contain
1 mM sodium ascorbate, 100 JLM-bp calf thymus DNA, and 24 kcpm 3' labeled
pBR322 linearized with Sty I and labeled at only one terminus with Klenow frag
ment. A) Lanes 1-5 are labeled on the clockwise strand with [a-32P] dATP. Lanes
6-8 are labeled on the counterclockwise strand with [a-32P] TTP. Lane 1, intact
DNA; lane 2, molecular weight standards; lanes 3 and 6, 2 JLM ED; lanes 4 and 7,
50 JLM 2-PyNE; lanes 5 and 8, 70 JLM 2-lmNE. B) Labeled on the clockwise strand
with [a-32P] dATP, lane 1, intact DNA; lane 2, molecular weight standards; lane 3,
2 JLM ED; lane 4, 50 JLM 2-PyNE; lane 5, 70 JLM 2-ImNE; lane 6, 10 JLM 3-PyNE;
lane 7, 7 JLM 4-PyNE. C) Labeled on the counterclockwise strand with [a-32P ] TTP.
Lane 1, intact DNA; lane 2, molecular weight standards; lane 3, 2 JLM ED; lane 4,
50 JLM 2-PyNE; lane 5, 70 JLM 2-ImNE; lane 6, 10 JLM 3-PyNE; lane 7, 7 JLM 4-
PyNE.

- 55-
A 0 w w w w ..... z z z z - >. E >. E c:
~ Cl.. Cl.. 0 0 I I 0 I I
() w C\1 C\1 w C\1 C\1
1 2 3 4 5 6 7 8
---
B c 0 w w w w 0 w w w w ..... z z z z ..... z z z z - >. E >. >. - >. E >. >. c: c: 0 ~ 0 Cl.. Cl.. Cl.. 0 ~ 0 Cl.. Cl.. Cl..
I I I I I I I ..,;. () w C\1 C\1 M ..q- () w C\1 C\1 M
1 2 3 4 5 6 7 8 9 10 11 12 13 14

-56-
0 1000 2000 3000 4000 4363
ED at 2j..l.M
~· . ~ ll • + • + • !tll
2-PyNE at 50 llM
1 ~ l + •• • + ! j d! •• d! 2-ImNE at 70 j..lM
.~~ 111 t ~ 1 11 •. 11 ! ~ 3-PyNE at 10 j..l.M
+ •• • l +trt .. t! • • ••• ++ 1 ~ 4-PyNE at 7 j..lM
• • • J • • ' tl l •••• + .. ~~
Figure 14 Cleavage sites on pBR322. Arrows represent the extent of cleavage in each lane for figure 13. Band densities are averaged between labels, then normalized to the most intense band. Arrow positions represent approximate binding site locations accurate to within 40 bp. Cleavage bands within 700 bp of the labeled ends are not resolved on the gel.

-57-
linear interpolation from the logarithmic sizes of the standards, the numbers are
translated into a position on pBR322, and the data from the two labels is aver
aged to give the approximate cleavage positions shown in figure 14. The cleavage
patterns of all five compounds are consistent with the high resolution data. Only
2-ImNE shows a markedly different cleavage pattern from ED. All three pyridine
isomers contain bands that match those of the ED lane and additional bands. The
2-PyNE lane appears to be a linear combination of the ED and 2-ImNE lanes, while
3-PyNE and 4-PyNE appear to have only a few bands in common with 2-lmNE.
To determine the specificity of each compound, the portion of pBR322 within
40 bp of the strong cleavage bands was analyzed for sequence content by comparing
the list of sequences present near the cleavage bands to the list of all possible
sequences resolved on the gel. After using MERS to produce the required frequency
tables, the data are screened by stepwise comparison looking for frequencies above
a defined threshold. A single class of efficiently cleaved sites should result in a
distribution of sequences appearing at frequencies significantly greater than chance.
The highest frequency sequence is predicted to be the cleavage site, followed by
one bp shifts, followed by two bp shifts, and so forth. Because 2-PyN and 2-ImN
show efficient cleavage at both a TGTCA and an AGACA sequence on the 517 bp
fragment, the analysis is performed for both five and six bp sequences with each
base counted separately or with A and T being interchangeable (W in IUPAC
nomenclature91) .

-58-
Acetamide-distamycin-EDTA {ED)
Of the four analyses run, highest frequencies for the distamycin A analog are
obtained by tabulating six bp sequences with A and T treated separately. In the
427 bp close to the strong cleavage bands, only the sequences shown in table 2
are present at frequencies significantly above average. As published, 16 ED shows a
strong preference for stretches of homopolymer A longer than five bp. Sequences
that best fit the observed specificity with positions near the assigned cleavage sites
are shown in table 3. The distribution of the proposed sites is plotted against the
cleavage patterns in figure 15. For ED, efficient double-stranded cleavage correlates
well with A,T sequences at least eight bp long containing at least five consecutive
A's. A stretch of six A's is not sufficient for strong cleavage. One such stretch at
3707, surrounded by G,C bp, does not give a strong cleavage band (table 3). The
two stretches of seven A's also appear to give less cleavage. The band that contains
the cleavage from both is only as intense as the band that maps to the TTTTT
site on the 517 bp fragment. Assuming a seven bp A,T sequence containing an
AAAAA stretch is the minimum requirement for efficient cleavage at 2 JLM, D
has a specificity of 4/8192 = 0.05%. This is the equivalent of a unique six bp
site. Because only 36% of all possible seven bp A,T sequences appear on pBR, the
actual specificity could easily be lower.

-59-
Table 2 Six bp sequences found at significantly nonrandom frequencies near ED cleavage bands a.
Sequence Within ±40 bp Resolvable Frequency of Bands on gel
AAAAAA 5 6 0.83 AAAGGA 3 5 0.60 AGAAAA 3 5 0.60 GAAAAA 3 5 0.60 AAAAAG 3 7 0.43
a Expected single site frequency is 427/3162 = 0.135
Pyridine 9- and -1-carboxamide-netropsin-EDTA {9-PyNE and 4-PyNE}
The cleavage patterns of 3-PyNE and 4-PyNE are quite similar to ED, al-
though the total number of cleavage bands has increased. Both compounds give a
single major cleavage site at 3140. This band corresponds to the region on pBR322
richest in A,T bp, a 54 bp sequence that is 80% A,T. In addition, the two seven bp
homopolymer A tracts on pBR322 occur within 60 bp of calculated position of this
band. Because of the abnormal width of the band, a 160 bp segment centered on
the calculated size is used in the frequency analysis. The analysis (tables 4 and 5)
reveals a lower selectivity for the homopolymer A sites that ED cleaves most ef-
ficiently. 4-PyNE cleaves at more sites, and the band at 3140 represents a larger
fraction of the total cleavage. This suggests that the specificity of this compound
is lower than 3-PyNE.
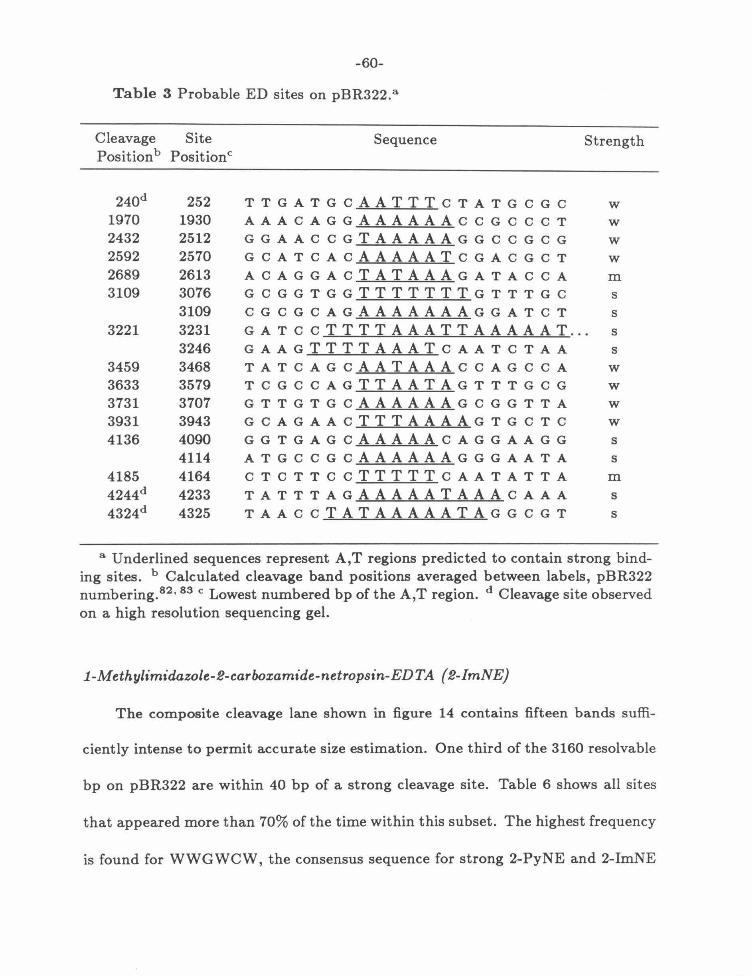
-60-
Table 3 Probable ED sites on pBR322. a
Cleavage Site Sequence Strength Positionb Positionc
240d 252 TTGATGCAATTTCTATGCGC w 1970 1930 AAACAGGAAAAAACCGCCCT w 2432 2512 GGAACCGTAAAAAGGCCGCG w 2592 2570 GCATCACAAAAATCGACGCT w 2689 2613 ACAGGACTATAAAGATACCA m 3109 3076 GCGGTGGTTTTTTTGTTTGC s
3109 CGCGCAGAAAAAAAGGATCT s 3221 3231 GAT c c TTTTAAATTAAAAAT . .. s
3246 GAAGTTTTAAATCAATCTAA s 3459 3468 TATCAGCAATAAACCAGCCA w 3633 3579 TCGCCAGTTAATAGTTTGCG w 3731 3707 GTTGTGCAAAAAAGCGGTTA w 3931 3943 GCAGAACTTTAAAAGTGCTC w 4136 4090 GGTGAGCAAAAACAGGAAGG s
4114 ATGCCGCAAAAAAGGGAATA s 4185 4164 CTCTTCCTTTTTCAATATTA m 4244d 4233 TATTTAGAAAAATAAACAAA s 4324d 4325 TAACCTATAAAAATAGGCGT s
a Underlined sequences represent A,T regions predicted to contain strong binding sites. b Calculated cleavage band positions averaged between labels, pBR322 numbering. 82• 83 c Lowest numbered bp of the A,T region. d Cleavage site observed on a high resolution sequencing gel.
1-Methylimidazole-2-carboxamide-netropsin-EDTA {2-ImNE}
The composite cleavage lane shown in figure 14 contains fifteen bands suffi-
ciently intense to permit accurate size estimation. One third of the 3160 resolvable
bp on pBR322 are within 40 bp of a strong cleavage site. Table 6 shows all sites
that appeared more than 70% of the time within this subset. The highest frequency
is found for WWGWCW, the consensus sequence for strong 2-PyNE and 2-lmNE

0 1000 2000 3000 4000 4363
ED at 2 JlM
t J l' t ~ 11.+ H 4 llll
0 o• o • 0000 00 • 0 • • • ••• • •
2-ImNE at 70 JlM
h .!) (u ~~ ~ 1 lt ~. 11 1 l b. \J lM ~ b. b. b. b. b.b.b. b. b.
Figure 15 Top) Position of ED cleavage bands in relation to long A,T sequences. o - AAAAA sites, • - AAAAAA sites, • - WWWWWWWW sites. Bottom) Position of 2-lmNE cleavage bands in relation to WWGWCW sequences (.6).
I O'l ...... I

-62-
Table 4 Five and six bp sequences found at significantly nonrandom frequencies near 3-Py NE cleavage bands. a
Sequence Within ±40 bp Resolvable Frequency of Bands on Gel
GGAAA 6 7 0.86 AAAAA 16 20 0.80 CAAAA 7 10 0.80 AAATA 7 9 0.78 GCAAA 7 9 0.78 CAGAA 7 9 0.78 GAAAA 10 13 0.77 AAAAC 6 8 0.75
GCAAAA 6 6 1.00 AAAAAA 6 6 1.00 AAAAAG 5 7 0.71
a Expected single site frequency is 1121/3162 = 0.354
binding on the high resolution gels. Most other table entries are one or two bp
shifts of this sequence, providing good evidence that WWGWCW represents the
only major class of binding sites for 2-lm.NE on pBR322.
Table 7 contains a summary of the proposed binding sites. The correlation
of these sites with the observed cleavage bands is shown in figure 15. Only one
of the 16 intense 2-Im.NE bands is not near a WWGWCW sequence. Its position
corresponds to the strong cleavage band found at 3270 in ED and 2-PyNE or 3140
in 3-PyNE and 4-PyNE lanes. Of the 21 detectable bands, only one very weak site
is not near a WGWCW sequence. Nearly every potential site is within 20 bp of the
band sizes determined from the gel. The strongest cleavage bands are positioned

-63-
Table 5 Five and six bp sequences found at significantly nonrandom frequencies near 4-Py NE cleavage bands. a
Sequence Within ±40 bp Resolvable Frequency of Bands on gel
TTAAA 9 9 1.00 ATAAA 8 9 0.89 AAAAG 13 15 0.87 AGTGC 6 7 0.86 ATCAT 6 7 0.86 AATAC 6 7 0.86 TATCA 9 11 0.82 GATAA 13 16 0.81 CAAAA 8 10 0.80 AAATA 7 9 0.78 GCAAA 7 9 0.78 CAGAA 7 9 0.78 AAAGG 9 12 0.75 AAAAA 14 20 0.70
AAAAGG 7 8 0.88 TGATAA 7 8 0.88 AAAAAG 6 7 0.86
a Expected single site frequency is 1394/3162 = 0.441
within 50 bp of more than one copy of the consensus sequence. Single WWGWCW
sites appear to give nearly the same amount of cleavage. The one exception, the site
at 29, cleaves much better than average. Thus, it is likely that WWGWCW is the
major site of 2-Im.N binding on DNA. There are 16 unique WWGWCW sequences,
giving 2-lm.N a specificity of 16/ 2080 = 0.8%, the equivalent of a four bp unique
site.
Several of these cleavage sites have been checked by examining high resolut ion

-64-
gels of the appropriate restriction fragment. In all cases examined (see table 7) ,
the cleavage bands map directly to WGWCW sites. All sites are cleaved without
orientation preference, and the relative cleavage intensities match those found on
the agarose gel. In addition, neither WGWGW nor WGWWWW nor WCWGW
sites bind 2-ImN to a measurable extent at 20 J.LM, as shown by high resolution
gels on the 517 bp fragment and others.
Table 6 Six bp sequences found at significantly nonrandom frequencies near 2-ImNE cleavage bands. a
Sequence Within ±40 bp Resolvable Frequency of Bands on gel
WGWGWC 6 6 1.00 WWGWCW 19 20 0.95 WWWGWC 11 13 0.85 CWWGWC 8 10 0.80 WGWCWG 18 24 0.75 WGWCCW 5 7 0.71
a Expected single site frequency is 1026/3162 = 0.324
Pyridine-2-carboxamide-netropsin-EDTA {2-PyNE}
Application of the same analysis in the pyridine case does not give clear-
cut results. As expected from the high resolution data, the cutting pattern is a
mixture of those obtained with 2-lmNE and ED. The strongest 2-PyNE cleavage
bands correspond to ED sites, but some bands are found only in the 2-PyNE and
2-ImNE lanes. Indeed, a high resolution gel of the Sal I/ Sty I 720 bp restriction
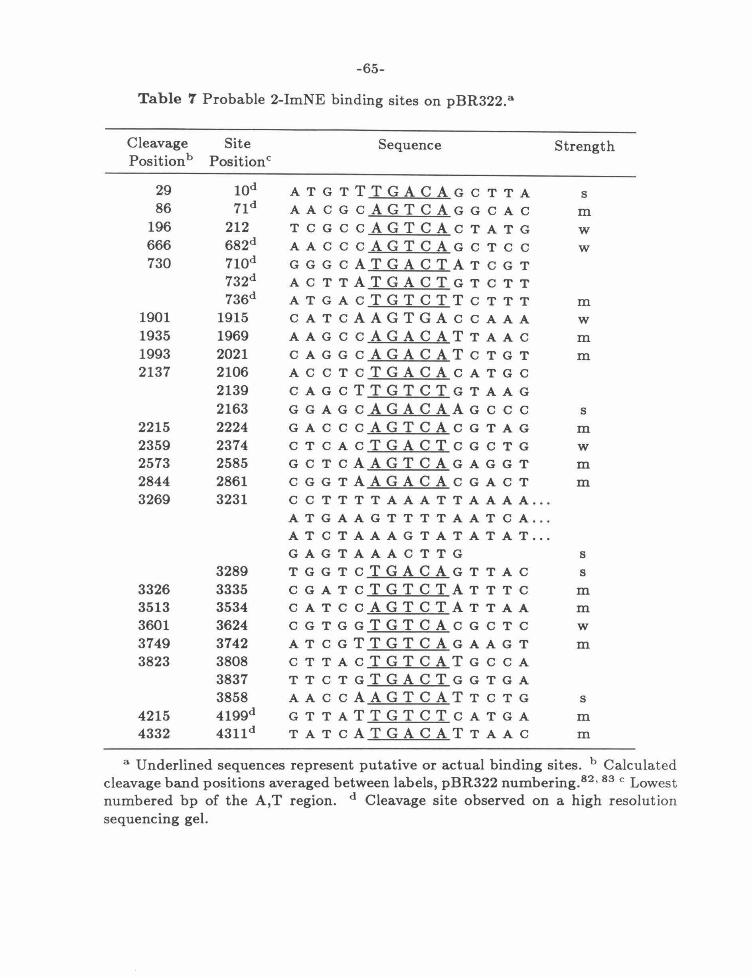
-65-
Table 7 Probable 2-ImNE binding sites on pBR322. a
Cleavage Site Sequence Strength Positionh Positionc
29 10d ATGTTTGACAGCTTA s 86 71d AACGCAGTCAGGCAC m
196 212 TCGCCAGTCACTATG w 666 682d AACCCAGTCAGCTCC w 730 710d GGGCATGACTATCGT
732d ACTTATGACTGTCTT 736d ATGACTGTCTTCTTT m
1901 1915 CATCAAGTGACCAAA w 1935 1969 AAGCCAGACATTAAC m 1993 2021 CAGGCAGACATCTGT m 2137 2106 ACCTCTGACACATGC
2139 CAGCTTGTCTGTAAG 2163 GGAGCAGACAAGCCC s
2215 2224 GACCCAGTCACGTAG m 2359 2374 CTCACTGACTCGCTG w 2573 2585 GCTCAAGTCAGAGGT m 2844 2861 CGGTAAGACACGACT m 3269 3231 CCTTTTAAATTAAAA ...
ATGAAGTTTTAATCA ... ATCTAAAGTATATAT ... GAGTAAACTTG s
3289 TGGTCTGACAGTTAC s 3326 3335 CGATCTGTCTATTTC m 3513 3534 CATCCAGTCTATTAA m 3601 3624 CGTGGTGTCACGCTC w 3749 3742 ATCGTTGTCAGAAGT m 3823 3808 CTTACTGTCATGCCA
3837 TTCTGTGACTGGTGA 3858 AACCAAGTCATTCTG s
4215 4199d GTTATTGTCTCATGA m 4332 431ld TATCATGACATTAAC m
a Underlined sequences represent putative or actual binding sites. h Calculated cleavage band positions averaged between labels, pBR322 numbering. 82• 83 c Lowest numbered bp of the A,T region. d Cleavage site observed on a high resolution sequencing gel.

-66-
fragment that contains the cleavage sites near 700 shows efficient cutting by 2-
PyNE only at three WWGWCW sites (see appendix A).
In contrast to the nearly equal WWGWCW:AAAAA site preference seen on
the 517 bp fragment, the strongest sites for 2-PyNE on pBR322 tend to match those
of ED. This can be explained by different distributions of the two types of sites.
WWGWCW sites are normally single and isolated. There are only three places on
pBR322 where two or more sites exist within 50 bp of one another. However, with
a poly A sequence there is nearly a 25% chance (on pBR322) that the stretch will
continue and create a stronger affinity site. This tends to produce ED cleavage
intensities that vary considerably with the actual sequence. In contrast, 2-ImNE
should cleave all WWG WCW sites to the same extent.
Of the five compounds, it appears that only two, ED and 2-ImNE, exhibit
cleavage patterns consistent with a single class of high affinity binding sites. Para
doxically, while the 3-PyNE and 4-PyNE compounds have lower specificities than
ED, they produce the most selective cleavage. Almost 25% of the total cleavage
products are found in the band at 3140. Such an example of anomalously high
specificity has been observed with ED on bacteriophage .X, 16 where it has been
attributed to the uneven distribution of cleavage sites. Thus, this strong cleav
age band that appears in all compounds is likely to be the superposition of a large
number of lower affinity sites. High resolution studies on other compounds support

-67-
this conclusion. 92 2-ImNE is the only compound where another site gives signifi-
cantly more cleavage. This indicates that A, T site binding must be quite strongly
disfavored before a shift in overall specificity occurs.
A Model for the 2-ImN Complex Conformation
Any binding model developed for 2-lmN binding at its major site must explain
a number of separate observations.
1. A GAC sequence must be present in the binding site.
2. 2-ImN binds a five bp sequence but recognizes a six bp sequence.
3 . 2-ImNE cleaves non C2 symmetric sites with no orientation preference.
4. A,T bp are interchangeable within the recognition site, but are strictly re
quired.
5 . The heterocyclic nitrogen is required and must be ortho to the amide carbonyl.
6. The binding affinity if 2-lmN to DNA is significantly lower than related com
pounds.
7. Dimethyl sulfate protection occurs in both the minor and major grooves.
The interchangeability of the A,T bp in the site indicates that the major inter-
actions responsible for sequence specific complexation must occur between 2-ImN
and the G,C bp in the site. This is borne out by the specificity for GAC sequences
over CAG and GAG. For all WWGWCW sites to be cleaved symmetrically, the
DNA site recognition element must also be C 2 symmetric. In the minor groove,
only the 02 of C, the N2H of G and the N3 of G are potential candidates. The
most accessible is the N2 of guanine, which is also the only hydrogen bonding
donor in the minor groove. Two changes have been made in designing 2-lmN. The
N-terminal amide has been removed and the pyrrole 3CH has been replaced by

-68-
A \ 8
IN~ 0 ' /N~ 0 HN~ ~ .-:::. N/ HN9 I f N/
HN 1.1 A .--:;
2:~ I HN 0 ;3-0 HN
<:~0 (~~ .._ N-N ' '
\ /- \ c 0 N-
~ NH
0~/ NH 09 I f N/
HN 10.6 A 8.3 A .--:; 2:0 I HN 0 ;3-0 HN ..;- N-
{~0 (N ~ .._ N ' '
Figure 16 Low energy conformers of 2-Im.N capable of fitting in minor groove of B DNA. Distances are measured using the program Macromodel and the AMBER forcefield parameters. 93 The planar conformation shown has the shortest distance between hydrogen bonding moieties.

-69-
nitrogen. The change in specificity cannot be due to the loss of the amide, for 2-
FuN, 2-ThN, 3-PyN, and 4-PyN do not show the same pattern. Thus it is probable
that a hydrogen bond is formed between the imidazole nitrogen and the guanine
exocyclic amine. To give two fold symmetry, a second G,C hydrogen bond must
be formed at the other end of the binding site. The four conformations of 2-ImN
capable of occupying the minor groove are shown in figure 16. For comparison
purposes, the distances shown are for the planar conformations, representing the
minimum distance between hydrogen bonding groups. In the actual complex, the
aromatic rings would be twisted lD-20° out of planarity, increasing the distance
slightly, as has been observed for netropsin18 • 19 and distamycin A.20
There is no obvious reason to choose or eliminate any of these conformations.
Conformation A is that observed in the netropsin and distamycin A crystal struc
tures. Conformations B + D have the virtue of decreasing the distance between
the ends of 2-ImN to a value more closely matching the idealized B DNA distance
(approximately 8 A).94 Conformations C + D have the advantage of placing a
second hydrogen bond acceptor at the bottom of the groove so that the 2-ImN to
G hydrogen bonds are actually symmetric.
With respect to the DNA target site, the remaining observations can be ex
plained by postulating a conformational change upon small molecule binding. An
induced fit could decrease the accessability of the guanine N7's to dimethyl sul
fate. If the bound sequence is favored by A,T bp, this would also explain the A,T

-70-
requirement outside the binding site. An induced fit would also require energy,
lowering the total free energy of complexation.
This putative conformational change also provides an explanation for the se
lective complexation of GAC sequences over CAG or GAG. The rigidity of 2-lmN
and the requirement for binding in the minor groove means that the positions of
G ,C bp in the complex are tightly constrained. If complexation of 2-ImN induces
a conformational change, then the sequence selectivity can be explained by t he
relative abilities of GAC, CAG, and GAG sequences to achieve the proper con
formation. From computer modeling,95 it appears that the relevant distances for
2-I.mN are at least one A larger than the DNA distance. For better matching,
the guanine nitrogens must move farther apart. This could be accomplished by
increasing the twist at the site to make the DNA longer and thinner, bending t he
helix axis towards the major groove or changing the propeller twist of the G ,C bp.
The first two possibilities offer no obvious difference between the the three se
quence isomers. However, the propensity for propeller twisting is predicted to vary
between these three sequences.6 To increase the distance between guanine N2's ,
a GAC sequence must increase the propeller twist at both G,C bp, for a GAG
sequence, one G must increase and the other must decrease the propeller twist,
and a CAG sequence must decrease both. Increased propeller twist will tend to
be favored by A,T bp that have an average 5° larger twist than G,C bp.4 The
observed selectivity of A,T bp outside the binding site can then be explained as

-71-
a preference for the more propeller twisted conformation, which would lower the
reorganization energy of the complex.
Recent studies of 434 repressor support the above outline. Like 2-lmN, 434
repressor binds with higher affinity to sequences that contain additional A,T bp
at the center of the dimeric binding site.96 An examination of the protein-DNA
cocrystal reveals that there are no specific contacts to these bp. Further, the
DNA region between monomers is overtwisted, compressing the minor groove and
producing larger propeller twists than are usually observed. 97 Nicking the center
of the operator site relaxes the specificity requirement for the noncontacted bp, 98
consistent with the postulated conformational role of these bp.
It is encouraging to find that a recognition mechanism similar to that proposed
is used by Nature. While the actual details of the complex await the use of more
powerful structural methods such as NMR or X-ray crystallography, the general
outlines of this model can be tested by chemical and biological techniques. This
will be the general focus of the following chapters.
Summary
To search for altered DNA sequence specificity, a series of distamycin A analogs
have been prepared. The majority of these compounds bind only to the A, T rich
sites of the parent compound. Two analogs, pyridine-2-carboxamide-netropsin {2-
PyN) and 1-methylimidazole-2-carboxamide-netropsin {2-ImN), bind a TGTCA
sequence. The pyridine isomers 3-PyN and 4-PyN do not bind this sequence. The

-72-
compounds are present in the minor groove, but protect the binding site from
dimethyl sulfate in both grooves. Two equivalent orientations are observed at this
binding site. The specificity of 2-ImN is higher than that of 2-PyN. Although both
compounds bind equally well to the TGTCA site, 2-ImN has significantly lower
affinity to all A,T sites. On pBR322, the EDTA derivative of 2-ImN (2-ImNE)
efficiently cleaves a single class of sites with the consensus sequence WWGWCW
(W is either A or T). An induced DNA conformational change is proposed to fit
this data.

-73-
Chapter 3
Quantitative MPE·Fe(II) Footprinting

-74-
The assays used in chapter 2 to measure DNA specificity give only relative
preferences for 2-PyN and 2-ImN binding sites. For comparison between DNA
substrates, it is necessary to describe the sequence specificity in absolute terms.
This corresponds to the measurement of the binding constant at the sites to be
compared. Moreover, by measuring the binding constant of identical sites in differ-
ent environments, it should be possible to precisely delineate the effect of flanking
sequences.
Methods capable of measuring individual site binding constants are rare. Most
binding assays, such as equilibrium dialysis, measure macroscopic properties. Mea-
surement of single site affinities is only possible for oligonucleotides containing a
single site. The relevance of the numbers produced then depends on the correspon-
dance of oligonucleotide properties to those of longer DNA. Recently a method has
been developed by Ackers and co-workers that is capable of determining individ-
ual site binding constants on restriction fragments. 99 The method uses standard
DNase I footprinting techniques to report the occupancy of binding sites over a
range of ligand concentrations. With the appropriate DNA sequence, affinity con-
stants for several binding sites can be determined from a single gel.
Theoretical Basis
The association constant for DNA binding of a general ligand is defined as
[DNA · L] K a = -:-:--'---:---:=--:---
[DNA ]tree [L ]tree

-75-
This can be redefined using Y, the fraction of DNA bound, as follows
Y= [DNA·L] [DNA]total
K _ [DNA·LJ ([DNA]total) 1 a- [DNA]total [DNA]free [L]free
y 1 Ka=--·--
1- Y [L]free
In the ideal case, Y will vary from 0 at very low concentrations of ligand to 1
at saturation. The binding constant can then be determined at a given site by
plotting the Y value versus the ligand concentration. At Y = 0.5, the association
constant will be the reciprocal of the free ligand concentration.
These equations lead to two conclusions important to the footprinting ex-
periment. First, the amount of DNA need not b~ measured, because the final
equation for Ka is independent of the DNA concentration. This permits the use
of radioactive DNA, because it not necessary to know the specific activity. Sec-
ond, an accurate determination of the binding constant depends only on accurate
measurements of the free ligand concentration and the fraction of DNA bound.
The Ackers group determines [L]free by lowering the DNA concentration.
When the concentration of DNA binding sites is < 1% of the total ligand con-
centration, even site saturation will have no significant effect on the total ligand
concentration. This is readily achieved with labeled DNA by increasing the specific
activity. Incorporation of four radioactive deoxynucleotides into a single restriction
fragment lowers the final concentration of radioactive probe DNA to <50 pM-bp.

-76-
However, > 99% of the DNA in the footprinting experiment is nonradioactive
carrier, usually present at 100 J,LM-bp or higher concentration. To minimize car
rier DNA effects, the final DNA concentration is lowered to 2 J.LM. If the average
binding constant to carrier is ~ 104 M- 1 and the binding site size is greater than
five bp, then < 3% of the ligand will be bound at any concentration. These condi
tions usually hold for the binding proteins to calf thymus DNA, so that no special
carrier is needed to measure the protein-DNA affinity constant. The properties of
the protein-DNA complex also permit direct measurement of carrier binding by a
nitrocellulose filter assay. 100
Y, the fraction of DNA bound, can then be determined from the footprinting
gel. If the cleavage events are independent, the length of the DNA molecules
remains constant over the course of the reaction, and all labeled DNA molecules
are equivalent targets, then nicking by DNase I should be described by a Poisson
distribution. Cleavage at the binding site is then proportional to the occupancy at
the site, and thus a direct measure of the percentage of that site bound. Ackers et
al. find that cleavage varies exponentially with DNase I concentration, as expect ed
for this distribution.
Under conditions that give a linear X-ray film response, the amount of cleavage
at any given site will then be proportional to the optical density of the correspond
ing band on the film. To ensure a linear film response with the best signal to noise

-77-
ratio, Ackers et al. use preflashed X-ray film exposed with one calcium tungstate
intensification screen. 101
The optical density at a site is determined by scanning the entire gel in two
dimensions. The total volume (AU x mm2 ) of the bands in question can then be
measured. Because the amount of cleavage at well-protected sites is close to the
background value of the film, it is necessary to apply a local background correction.
Panel A of figure 1 shows the procedure that Ackers and co-workers use. A special
gel comb is constructed with teeth spaced at 6 mm intervals instead of 3 mm.
This ensures that DNA lanes are far enough apart so that the optical density
between them reaches a true background value. The most probable value midway
between lanes is averaged between the two sides of a given lane, and the resultant
background is subtracted from the optical density of the site to give the actual
amount of cleavage at a given site.
The apparent fraction bound is then calculated, correcting for differences in
the total amount of cleavage by using an unbound sequence as an internal standard,
as shown below:
Y ODsite/ODref
app = 1- / ODsite,std ODref,std
where ODsite refers to the site to be measured, ODref refers to a set of bands that
are not bound by the ligand, and ODref,std and ODsite,std refer to the same bands
in a lane without any added ligand. In actual practice Y app does not reach either
0 or 1, so that the binding constant is determined by a non-linear least squares
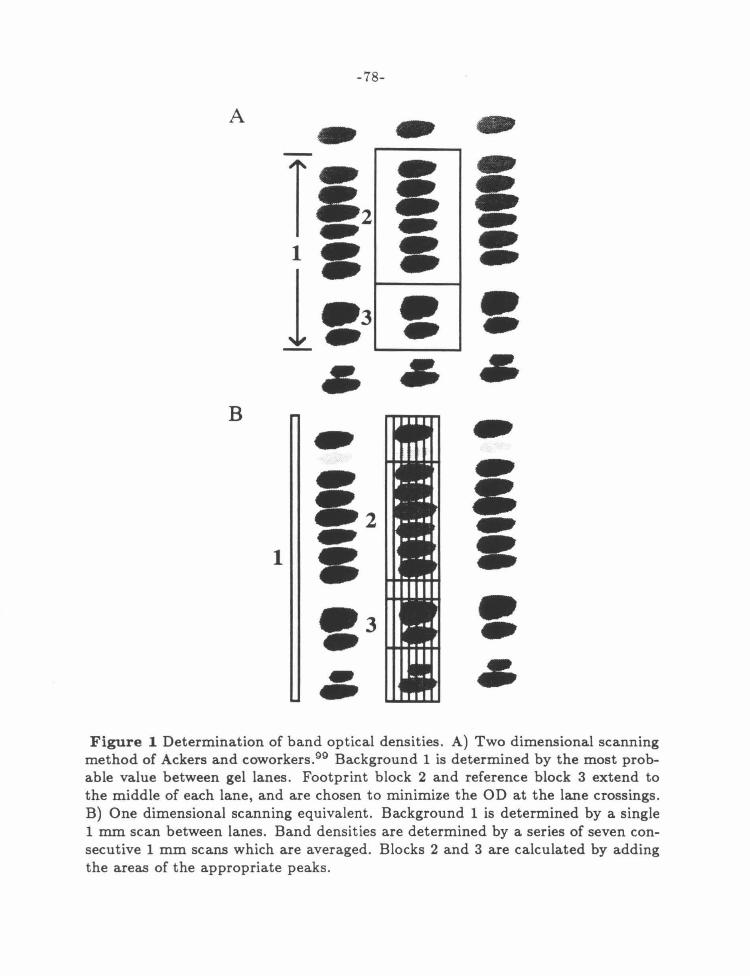
-78-
A .. ., .. 112
~ ~
& & ., ... 1 • • ~ .. 1 • 3 • • ., ., ., -
• • • B .. .. .. ~
• &2 ., ., • 1 •
• 3 • ., ., - • ...
Figure 1 Determination of band optical densities. A) Two dimensional scanning method of Ackers and coworkers.99 Background 1 is determined by the most probable value between gel lanes. Footprint block 2 and reference block 3 extend to the middle of each lane, and are chosen to minimize the OD at the lane crossings. B) One dimensional scanning equivalent . Background 1 is determined by a single 1 mm scan between lanes. Band densities are determined by a series of seven consecutive 1 mm scans which are averaged. Blocks 2 and 3 are calculated by adding the areas of the appropriate peaks.
-79-
fitting procedure. A single independent site binding curve is fit to the experimental
data using theY value at saturation binding (YH), theY value at no binding (YL) ,
and the Ka as adjustable parameters.
In studying the binding of lambda repressor to its operator sequence, Ack
ers et al. have found that the measured affinities agree well with measurements
made by other methods. 100 Importantly, the measured numbers are also relatively
insensitive to variations in the concentration of DN ase I or the amount of total
cleavage.
Modifications for Small Molecules
In order to use the Ackers procedure to determine small molecule-DNA bind
ing constants, several modifications need to be made. The large size of DNase I
footprints does not give sufficient resolution to separate individual D or 2-PyN foot
prints. Either MPE·Fe(II) or EDTA·Fe(II) has better resolution, and like DNase I,
these reagents give a Poisson distribution of cleavage fragments. 86 • 102 Initial ex
periments using EDTA·Fe(II) reveal that the 9 mM hydrogen peroxide required
destroys nearly 50% of the 2-PyN and 2-ImN chromophores over the standard
reaction time. No significant loss is observed when MPE·Fe(II) is used as the
footprinting agent. Apparently the presence of millimolar concentrations of DTT
in the MPE·Fe(II) cleavage reaction protects the small molecule from oxidative
degradation.
The high specificity of protein binding allows native DNA to be used as a car
rier because high affinity sites have very low frequencies. However, the specificity
-80-
studies of chapter 2 show that strong binding sites for D, 2-PyN, and 2-ImN are
common on random DNA sequences. All observed binding sites contain A,T bp,
so the best candidate for a weakly bound carrier is poly(dG)·poly(dC) . The bind
ing constant of distamycin A to this polymer has been measured by CD to be 5 x
104 M- 1 at 50 mM salt. 103 At higher salt concentrations, the total amount of com
pound bound drops rapidly.104 2-PyN and 2-ImN do not bind GGGG sequences
at 50 J.LM on the sequencing gels in chapter 2, indicating that the binding constant
for all three compounds is below the 104 M- 1 cutoff.
The size of small molecule binding sites ( -5 bp), is much smaller than most
protein binding sites ( -14 bp), and in general the binding constants are lower. This
has important implications for the accuracy of the experiment. Ackers et al. find
that the more bands included in the blocks used to calculate Yapp• the better the
precision of the experiment. Precision is also enhanced by the larger size of DNase I
footprints 74 that increase the number of cleavage bands averaged, and the partial
sequence specificity of D N ase I that allows the edges of sites to be determined
precisely at light cleavage bands. In contrast to the large footprints found with
proteins and DNase, the MPE·Fe(II) footprints of the three compounds are five bp
in length, with maximal inhibition only at the middle 2- 3 bp (see chapter 2). The
relatively uniform cleavage pattern of MPE·Fe(II) also means that the film density
between any two bands never reaches the background value. Because the sites
used to calculate Y app are smaller and the edges are less well defined, quantitative
-81-
MPE·Fe(II) footprinting should produce binding curves having more scattered data
points than DNase I curves.
The Footprinting Experiment
Unlike 14 other candidate fragments of pBR322, the 517 bp fragment contains
a representative D site (TTTTT) and a representative 2-ImN site (TGTCA) within
20 bp of one another. Labeling at the 3' terminus with the Klenow fragment of
DNA polymerase I following the Ackers et al. guidelines gives a fragment with 3-4
radioactive deoxynucleotides present in each molecule. For all experiments run, the
final DNA concentration is no greater than 50 nM-bp, and is often considerably
less. There are 10 potential strong binding sites for D on the restriction fragment ,
giving a final site concentration of 1 nM and 108 M- 1 as an upper limit for accurate
binding constant measurements.
Using a comb similar to that of the Ackers group, the maximum number of
footprinting lanes is nineteen. At three points per order of magnitude in small
molecule concentration, this gives a five order of magnitude concentration range.
A practical upper limit for sample concentrations is 200 JLM. Above this limit,
the surfactant properties of the compounds and the potential for base catalyzed
cleavage at apurinic sites105 make quantitation difficult.
To minimize electrostatic interactions, the footprinting reactions are per
formed in pH 7.0 tris·hydrochloride buffer containing 100 mM sodium chloride.
For 2-PyN and 2-lmN, final concentrations range from 200 JLM to 200 pM. ForD,
-82-
the final concentrations range from 20 J.LM to 20 pM. Optimum conditions for MPE
cleavage are 2.5 J.LM-bp poly(dG) ·poly(dC), 1 J.LM MPE·Fe(II), and 2 mM DTT,
incubating for 14 min at 37°C.
Poly (dG) ·(dC) is difficult to resuspend.106 The following conditions are found
to give the best results. Upon reaction completion, 1 J.Lg tRN A is added. The re
actions are ethanol precipitated without added salt, and resuspended in formamide
with sonication. By following this procedure, an average of only one lane per gel
did not resuspend properly. The dried gel is then exposed to prefiashed X-ray film
as in the Ackers procedure.
A typical film exposure of a 2-PyN gel is shown in figure 3. As expected from
previous experiments, there are four sites in close proximity near the bottom of the
gel, which correspond to the TTTTT, TTAAT, TGTCA, and AATAA sites mapped
in the previous section. As the amount of 2-PyN increases, the total amount of
cleavage by MPE·Fe(II) decreases. Above 100 J.LM, cleavage drops precipitously
(data shown only for 200 J.LM), consistent with a nonspecific binding constant of
2-PyN to DNA on the order of 103 M- 1 . Typical film exposures of a D gel and
a 2-ImN gel are shown in figures 2 and 4, respectively. Similar protection at all
sequences is observed forD above 10 J.LM and 2-lmN above 100 J.LM.
A one dimensional scan through the center of each band is shown in figure 5 .
Qualitatively, the relative binding constants at each site match the order in which
they appear in the normal footprinting experiment and the relative cleavage effi
ciencies of the EDTA derivatives. For 2-PyN, the TTTTT and TGTCA sites are
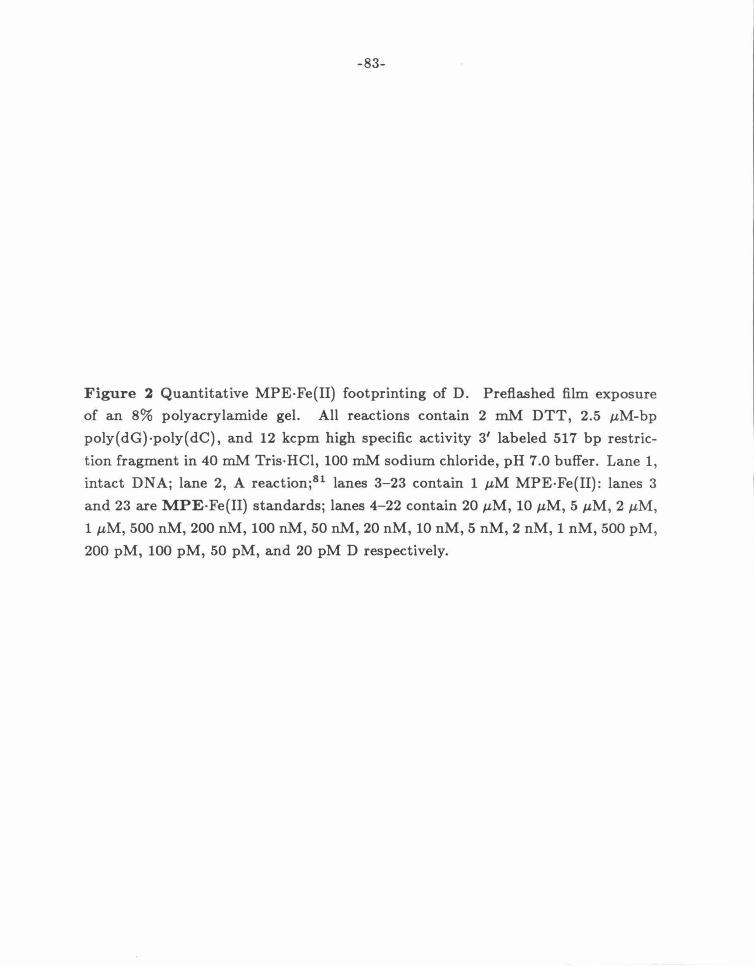
-83-
Figure 2 Quantitative MPE·Fe(II) footprinting of D. Preflashed film exposure
of an 8% polyacrylamide gel. All reactions contain 2 mM DTT, 2.5 J.LM-bp
poly(dG) ·poly(dC), and 12 kcpm high specific activity 3' labeled 517 bp restric
tion fragment in 40 mM Tris·HCl, 100 mM sodium chloride, pH 7.0 buffer. Lane 1,
intact DNA; lane 2, A reaction;81 lanes 3-23 contain 1 J.LM MPE·Fe(II): lanes 3
and 23 are MPE·Fe(II) standards; lanes 4-22 contain 20 J.LM, 10 J.LM, 5 J.LM, 2 J.LM,
1 J.LM, 500 nM, 200 nM, 100 nM, 50 nM, 20 nM, 10 nM, 5 nM, 2 nM, 1 nM, 500 pM,
200 pM, 100 pM, 50 pM, and 20 pM D respectively.
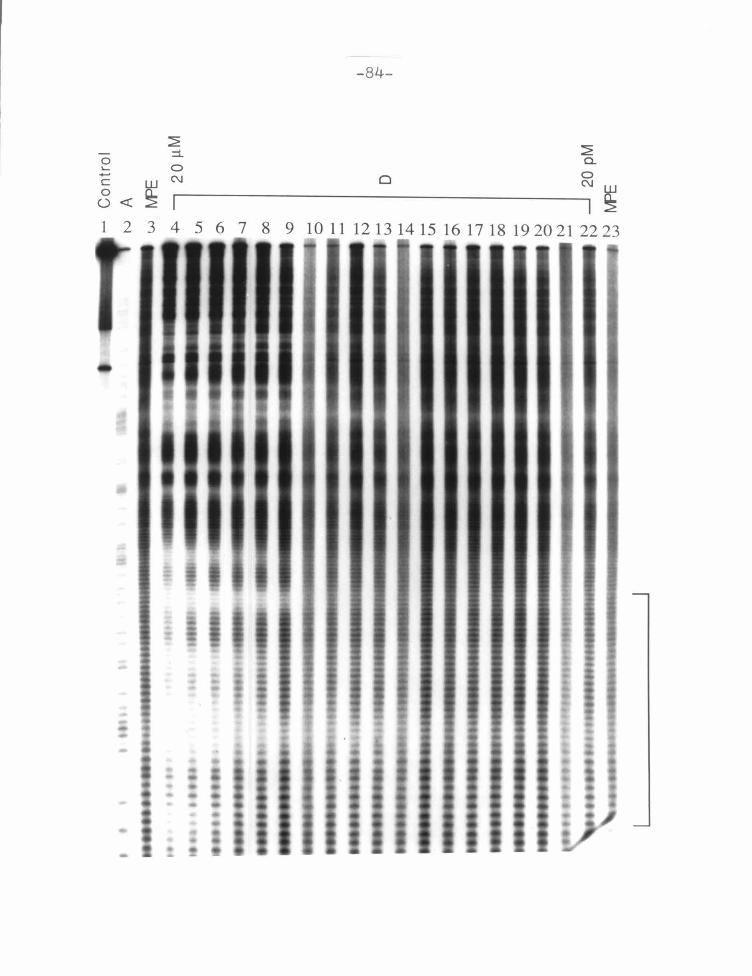
-84-
~ ~ :::l a. 0 ..... 0 0 ......
C\J 0 C\J~
c w 0 ~ O<t:
1 2 3 4 5 6 7 8 9 10 11 12 13 14 15 16 17 18 19 20 21 22 23
....

-85-
Figure 3 Quantitative MPE·Fe(II) footprinting of 2-PyN. Preflashed film expo
sure of an 8% polyacrylamide gel. All reactions contain 2 mM DTT, 2.5 J.LM-bp
poly( dG) ·poly( dC), and 12 kcpm high specific activity 3' labeled 517 bp restric
tion fragment in 40 mM Tris·HCl, 100 mM sodium chloride, pH 7.0 buffer. Lane 1,
intact DNA; lane 2, A reaction;81 lanes 3-23 contain 1 J.LM MPE·Fe(II): lanes 3
and 23 are MPE·Fe(II) standards; lanes 4-22 contain 200 J.LM, 100 J.LM, 50 J.LM,
20 J.LM, 10 J.LM, 5 J.LM, 2 J.LM, 1 J.LM, 500 nM, 200 nM, 100 nM, 50 nM, 20 nM,
10 nM, 5 nM, 2 nM, 1 nM, 500 pM, and 200 pM 2-PyN respectively.

-86-
~ ~ ::1. z c. 0 >.
0 a_ 0 ._ 0 I 0 +-' C\1 C\1
C\1~ c
~ 0 0<(
1 2 3 4 5 6 7 8 9 1 0 11 12 13 14 15 16 1 7 18 19 20 21 22 23
---

-87-
Figure 4 Quantitative MPE·Fe(II) footprinting of 2-ImN. Preflashed film expo
sure of an 8% polyacrylamide gel. All reactions contain 2 mM DTT, 2.5 J.LM-bp
poly( dG) ·poly( dC), and 12 kcpm high specific activity 3' labeled 517 bp restric
tion fragment in 40 mM Tris·HCl, 100 mM sodium chloride, pH 7.0 buffer. Lane 1,
intact DNA; lane 2, A reaction;81 lanes 3-23 contain 1 J.LM MPE·Fe(II): lanes 3
and 23 are MPE·Fe(II) standards; lanes 4-22 contain 200 J.LM, 100 J,LM, 50 J.LM,
20 J.LM, 10 J.LM, 5 J.LM, 2 J.LM, 1 J,LM, 500 nM, 200 nM, 100 nM, 50 nM, 20 nM,
10 nM, 5 nM, 2 nM, 1 nM, 500 pM, and 200 pM 2-ImN respectively.

-88-
~ z ~ ::::1.. a. 0 0 E
0 .._ 0 I 0 c
~ C'J C'J
C'J~ 0 0~
1 2 3 4 5 6 7 8 9 1 0 11 12 13 14 15 16 1 7 18 1 9 20 21 22 23
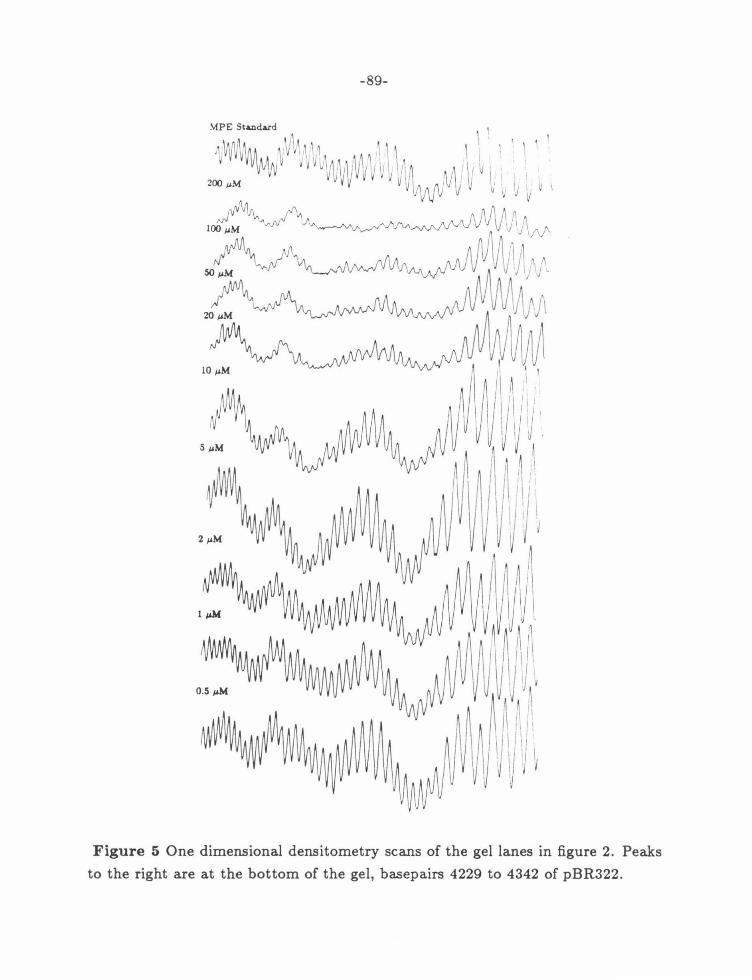
-89-
Figure 5 One dimensional densitometry scans of the gel lanes in figure 2. Peaks
to the right are at the bottom of the gel, basepairs 4229 to 4342 of pBR322.

-90-
bound at the lowest concentrations, with detectable protection at 2 J.LM. At higher
concentrations, the AATAA site is protected, while the TTAAT site is bound only
at 50 J.LM and above.
Analysis
Two dimensional densitometer scanning is currently unavailable. However,
the LKB laser densitometer used has the capability of scanning the width of an
entire band and averaging to give a one-dimensional result. As shown in panel B
of figure 1, this is equivalent to the two dimensional procedure. Due to the av
eraging function, the optical density values will be an order of magnitude smaller
and thus more susceptible to measurement errors. The scanned lanes are fed di
rectly from the densitometer to the LKB analysis program GSXL. The baseline for
each cleavage lane is determined by generation of an average baseline from 1 mm
background scans on either side of the lanes in question. The program outputs a
list of peaks with the area under each peak (in AU x mm) corresponding to the
optical density. Site densities are calculated by summing the appropriate bands on
a Microsoft Excel worksheet, and Yapp values calculated on the same worksheet
using the previously discussed equation.
Taking the CGC site of the 517 fragment as the reference, the apparent fraction
bound (Yapp) can be calculated at each position of the sequence. The Yapp values
averaged over three gels are plotted in figures 6, 7, and 8. The protection patterns
are in general agreement with the patterns observed with calf thymus carrier DNA

-91-
1 0
0.5
0.0
1.0
0.5
0.0
1.0
0.5
0.0
1.0
0.5
0.0
1.0
0.5
0 .0
1.0
0 .5
0 .0
1.0
0.5
0.0
CTATTTTTATAGGTTA A TGTCATGATAATAA
Figure 6 Quantitative MPE·Fe(II) footprints of Don bp 4332 to 4302 of pBR322. The apparent fraction bound (Yapp) for each cleavage band is averaged over three experiments, and plotted as a function of sequence. The CGC sequence adjacent to the 5' end of the plotted sequence is used as the internal standard.

-92-
1.0
100 uM 0.5
0.0
1.0
50 uM
0.5
0 .0
1.0
20uM
0.5
0.0
1.0
10uM
0.5
0.0
1.0
5uM
0.5
0.0
1.0
2uM
0.5
0.0
-0.5 CTATTTTTATAGGTTAATGTCATGATAATAA
Figure 7 Quantitative MPE-Fe(II) footprints of 2-PyN on bp 4332 to 4302 of pBR322. The apparent fraction bound (Yapp) for each cleavage band is averaged over three experiments, and plotted as a function of sequence. The CGC sequence adjacent to the 5' end of the plotted sequence is used as the internal standard.

-93-
1.0
100 uM 0.5
0 .0
1.0
50uM 0.5
0.0
1.0
20uM
0.5
0.0
1.0
10 uM
0.5
0 .0
1.0
SuM 0.5
0 .0
1.0 2uM
0.5
0.0
-0 .5 CTATTTTTATAGGTTAATGTCATGATAATAA
Figure 8 Quantitative MPE·Fe(II) footprints of 2-ImN on bp 4332 to 4302 of pBR322. The apparent fraction bound (Yapp) for each cleavage band is averaged over three experiments, and plotted as a function of sequence. The CGC sequence adjacent to the 5' end of the plotted sequence is used as the internal standard.

-94-
(see chapter 2). Again, D and 2-ImN give complementary protection, while 2-PyN
appears to be a linear combination of the two other patterns.
At intermediate binding densities, D protects the same TTTTT, TTAAT,
and AATAA sites that are observed in previous work.45 • 76 There is no significant
protection of the mixed G,C, A,T sequences. Above 2 J.LM, the protection pattern
of D changes, with two defined footprints in the TTTTT region. This is consistent
with end to end binding of two D molecules in the 10 bp A,T region. The negative
values for D protection at these densities are probably due to cleavage protection
at the reference site. There are weak D binding sites directly adjacent to both
sides of the CGCC sequence (5' site not shown). However, it is not possible to rule
out cleavage enhancement at this sequence.
As already observed, 2-ImN shows a strong preference for the TGTCA site,
although there is clearly some protection of the AATAA and TTTTT sites at
high concentrations. Assuming that the maximum protection value at these sites
is similar to that of D places an upper limit of 5 x 10⁴ M- 1 for the association
constant at the TTTTT site and 2 x 10⁴ M- 1 at the AATAA site. No significant
negative values are observed. This could be due to the lack of strong footprints
near the reference block. The specificity of 2-PyN is so low that all positions are
protected at intermediate binding densities. Although some decrease in Y app is
presumably occurring, it is not possible to determine the extent.
The higher specificity of D and 2-ImN allows an estimation of the maximum
distance for MPE·Fe(II) cleavage inhibition. For both compounds, the cleavage

-95-
pattern > 3 bases away from the end of a binding site is essentially normal. In
general the protection patterns are in close agreement to those determined by
the published model, 77 although protection at the most distant bp is not usually
observed. The similarity in pattern sizes between D and 2-lmN again suggests that
both compounds are binding to a DNA conformation in the B family.
To determine association constants at individual sites, the optical density ar-
eas of the bands that show maximum protection in figures 6, 7, and 8 are added.
The Y app values are then calculated for each concentration by the previous equa-
tion. The affinity constants of each compound are measured on at least three
independent gels. Different samples of the small molecule are used on each gel,
with at least two different labelings in each set of three experiments, and at least
two different MPE·Fe(II) samples in each set. For 2-PyN and 2-ImN, calculation
of Yapp uses the density at the CCG sequence as a reference. For D, the TCA
sequence that shows the minimum protection in figure 6 is chosen.
Fitting Procedure
Quantitative MPE·Fe(II) footprinting experiments do show increased scatter-
ing of data points, with an occasional point well separated from the points on
either side. All data points are included in the fitting procedure unless they meet
one of the following conditions.
1. Visual inspection of the film revealed a flaw at either the site or the standard
block.
2. The peak heights of the reference block are less than 0.2 AU above background.

-96-
3. Y values of a given lane were greater than two standard deviations away from
average of several points on both sides.
Most gels contain at least one data point rejected by the first condition and one
point rejected by the second. The median for all gels discussed is 16 points. A
gel is rejected if the number of valid points is lower than 14 or if more than one
of the eight highest concentration points is unusable. About two thirds of the gels
run produce acceptable data. Because of the altered protection pattern at high
concentrations of D, lanes with D concentrations above 5 JLM are not used. This
lowers the total number of data points to just above the 14 point limit.
Site values are then fitted to a single site binding curve using non-linear least
squares techniques. Generation of the analytical function for Y used in the fitting
procedure is straightforward.99 If YL is the apparent fraction bound at Y = 0 and
YH is the apparent fraction bound at saturation, then Y, the true fraction of DNA
bound, is related to Y app by the following equation.
Y = Yapp- YL YH -YL
From the previous equations and using [L]tree = [L]total = [L],
y = Ka[L] 1 + Ka[L]
Substitution and rearrangement gives a function for Y in terms of [L].

-97-
T he difference between Ym and Yapp for all ([L], Yapp) data points is minimized
using a standard algorithm implemented by Bevington in his book Data Reduction
and Error Analysis for the Physical Sciences. 107 The data points are fitted by a
gradient fit combined with a linear expansion of the function Yfit as described by
Marquardt 108 with Ka, YH, and YL as adjustable parameters.
The goodness of fit of the binding curve to the data points is evaluated by the
x2 criterion. Fits are judged acceptable if the x2 at a site other than the TTTTT
site is 1.5 or less. Fits generally converge in less than five cycles. An examination
of parameter space near the best fit results using the Excel worksheet Ka_map
confirms that a true minimum is reached. Binding isotherms determined for the
gel in figure 2 at the sites studied are shown in figure 9. The equivalent 2-PyN and
2-ImN isotherms are shown in figures 10 and 11 respectively.
The TGTCA site consistently gives much worse fits than the other sites on
the 2-PyN gels. Similarly poor fits are consistently found for 2-ImN at the same
site. Visual inspection of the binding curves reveals that in all cases, the increase
in Y app is steeper than expected from the fitted curve. Such a situation is normally
indicative of cooperativity or the presence of more than one ligand at the binding
site. 109 Therefore the previous data has been fitted to a series of cooperative curves
using the function shown below,
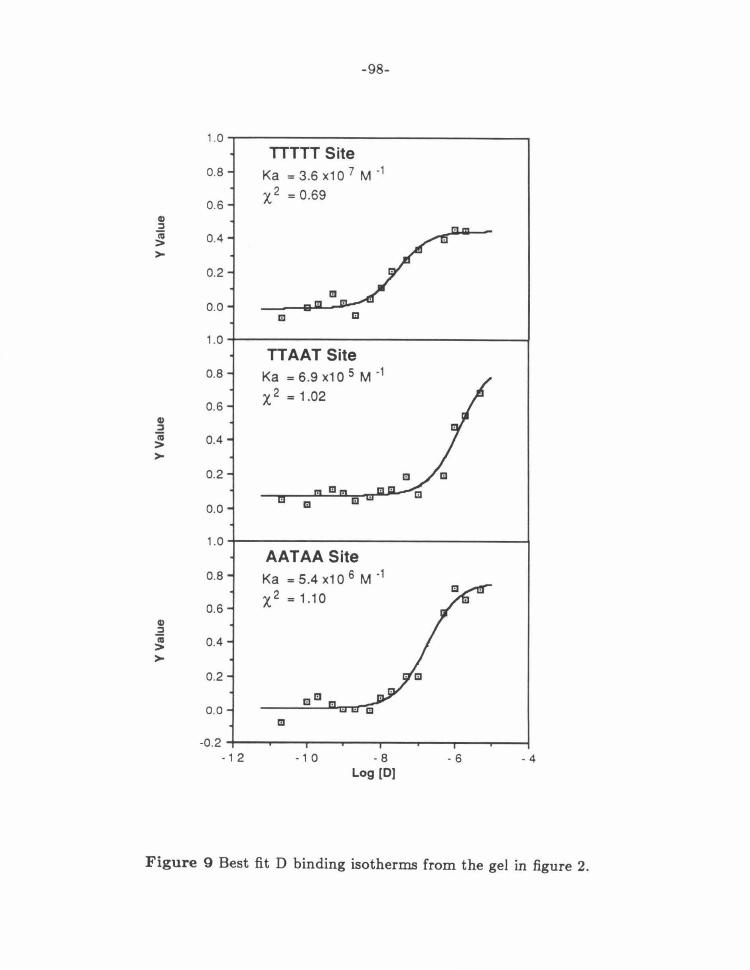
-98-
1.0 TTTTT Site
0.8 Ka = 3.6 x1 0 7 M -1
0.6 x 2 = o.69
Q) ::l co 0.4 > >
0.2
0.0 Ill Ill
1.0 TTAAT Site
0.8 Ka = 6.9 x1 0 5 M ·1
0.6 X 2 = 1.02
Q) ::l co > 0.4 >
0.2
0.0
1.0 AATAA Site
0.8 Ka = 5.4 x1 0 6 M -1
0.6 x2 = 1.10
Q) ::l co 0.4 > >
0.2
Ill Ill
0.0 Ill
-0.2 - 1 2 - 1 0 - 8 - 6 - 4
Log [D)
Figure 9 Best fit D binding isotherms from the gel in figure 2.

-99-
1.0 IIIII Site
0.8 Ka • 3.6 x1 0 5 M "1
0.6 x2 .. 1.19
0.4
0.2
0.0
0.9 TTAAT Site
0.7 Kaz4.2x10 4 M·1
0.5 x2 .. 1.27
0.3
0.1
·0.1 • •
1.0 TGTCA Site
0.8 Ka -2.0 x10 5 M "1
0.6 x2 -1.71
0.4
0.2 • 0.0
1.0 AATAASite
0.8 Ka-8.6x10 4 M"1
0.6 X 2 .. 2.59
0.4
0.2
• 0.0
1111 • ·0.2
• 1 1 . 9 . 7 . 5 · 3 Log [2-PyN]
Figure 10 Best fit 2-PyN binding isotherms from figure 3.

1.0
0.8
0.6 G) :I (1J
> 0.4 >
0.2
0.0
-0.2 - 1 1
-100-
TGTCA Site Ka = 1.1 x10 5 M -l
X 2 = 1.39
- 9 - 7 Log [2-lmN]
- 5 - 3
Figure 11 Best fit isotherm of 2-ImN at the TGTCA Site in figure 4.
where n is the Hill cooperativity coefficient. Over the range 1 ~ n ~ 3, the x2
values are lowest for an exponent near 2. However, the general flatness of the x2
function and the degree of scatter in the binding curves allows for considerable
leeway in the exponent. The fit is clearly worse for n = 1 and n = 3, but there is
only a small difference in x2 over the 1.5 ~ n ~ 2.5 range.
As a check of the quality of the fits, the residual (Yapp- Yfit) averaged over
the three experiments is shown in figures 12, 13, and 14. For both 2-PyN and 2-
ImN at the TGTCA site, the best fit curve with n = 1 shows significant deviations
from random scatter, while the n = 2 case shows no significant deviations and
smaller residuals. At low but non-zero binding densities, the fitted values are
consistently larger than the observed data points. Near the saturation point, the
fitted values are consistently smaller than observed. The opposite is true for D at

-101-
0 .9~--------------------------.---------------------------,
0.7 A B
c D
1 .04---------------------------~--------------------------;
0.8 E F
0.6
0.4
0.2
0 .0
0. 154---------------------------~--------------------------1
G H
-0 . 1 5 +-. .................. 'P""T'" .......... .....-. .................. 'P""T'" .......... .....-. .................. 'P""T'" ......... ...,.....,,.....,... ................. .....-. ................................................................ T""T"""l
-12-11 - 10-9 -8 -7 -6 - 5 -4 -11-10-9 - 8 -7 -6 -5 - 4
Log [D) Log [D)
Figure 12 Comparison of single site and cooperative fitting functions forD binding. A) Noncooperative fitting to the TTTTT site data. B) Cooperative fitting to the same data. C) Noncooperative residuals (Yapp- Yfit) averaged over four experiments. D) Cooperative curve residuals averaged over four experiments. E-H) The same data for the AATAA site.
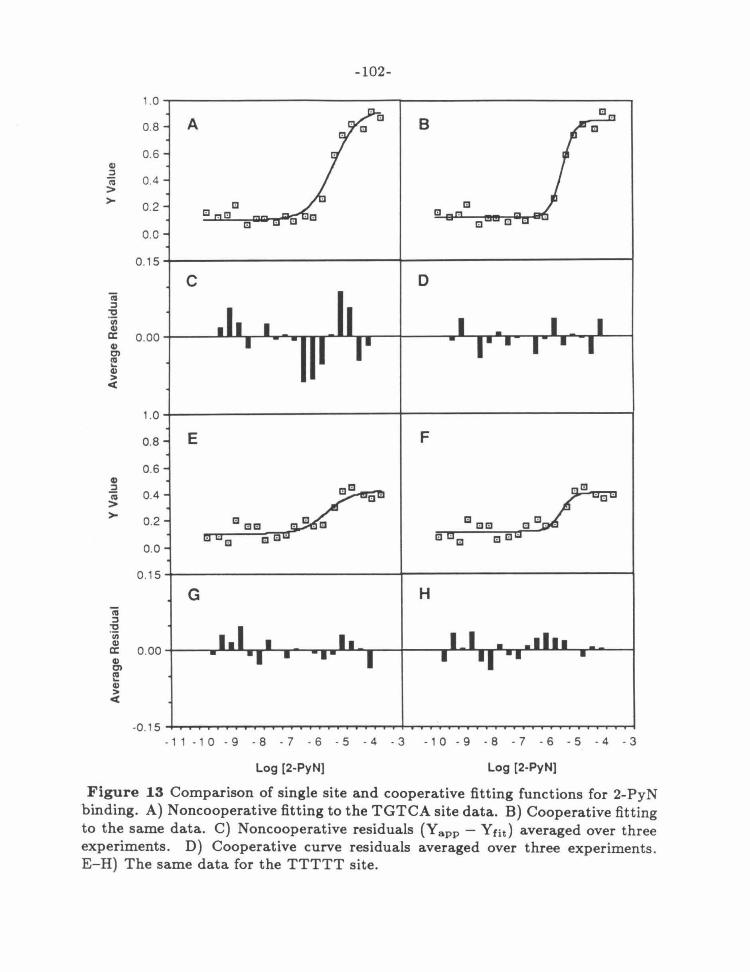
Cl)
.2 CQ
> >
G)
..2 CQ
> >
-102-
1 .0,-------------------------~--------------------------,
0 .8 A B
0 .6
0.4
0.2
0.0
0.15+------------------------+------------------------1
c 0
1.0~-----------------------1------------------------~
0 .8 E F
0.6
0.4
0.2
0.0
0 . 1 5~-------------------------+--------------------------;
G H
-0. 1 5 ..j.....,....,_,.......~ ............................................................................... ......-4-...................................................... ...,...... ..................... ,......... ........ 'I"""T"""'"""T"-4
-11 -10-9 - 8 -7 - 6 -5 -4 -3 -1 0-9 - 8 -7 - 6 -5 -4 - 3
Log [2-PyN) Log [2-PyN)
Figure 13 Comparison of single site and cooperative fitting functions for 2-PyN binding. A) Noncooperative fitting to the TGTCA site data. B) Cooperative fitting to the same data. C) Noncooperative residuals (Yapp- Ynt) averaged over three experiments. D) Cooperative curve residuals averaged over three experiments. E- H) The same data for the TTTTT site.

-103-
1.0
0.8 A B
0.6 Q)
~ 0.4 co > > 0.2
c c c 0.0
0.15
c D co :l
"C ·u; Q)
a: 0.00 Q) C) co ... Q) > <
-0 .1 5 - 1 1 - 1 0 - 9 - 8 - 7 - 6 - 5 - 4 - 3 - 1 0 - 9 - 8 - 7 - 6 - 5 - 4 - 3
Log [2-lmN] Log [2-lmN]
Figure 14 Comparison of single site and cooperative fitting functions for 2-ImN binding. A) Noncooperative fitting to the TGTCA site data. B) Cooperative fitting to the same data. C) Noncooperative residuals (Yapp - Yfit) averaged over three experiments. D) Cooperative curve residuals averaged over three experiments.
the TTTTT and AATAA sites. Consistently better fits are observed for n = 1.
The residuals plotted in figure 12, while barely significant, also appear to show
nonrandom behavior in the n = 2 case. The binding constant of the TTAAT site is
too low to satisfactorily determine the curve shape. Both curves fit the 2-PyN data
equally well at the A ,T sites, which is also observed forD when the CGC sequence
is used as the reference. This is the expected result if significant protection of
the CGC site occurs at high binding densities, since the top of curve will tend to
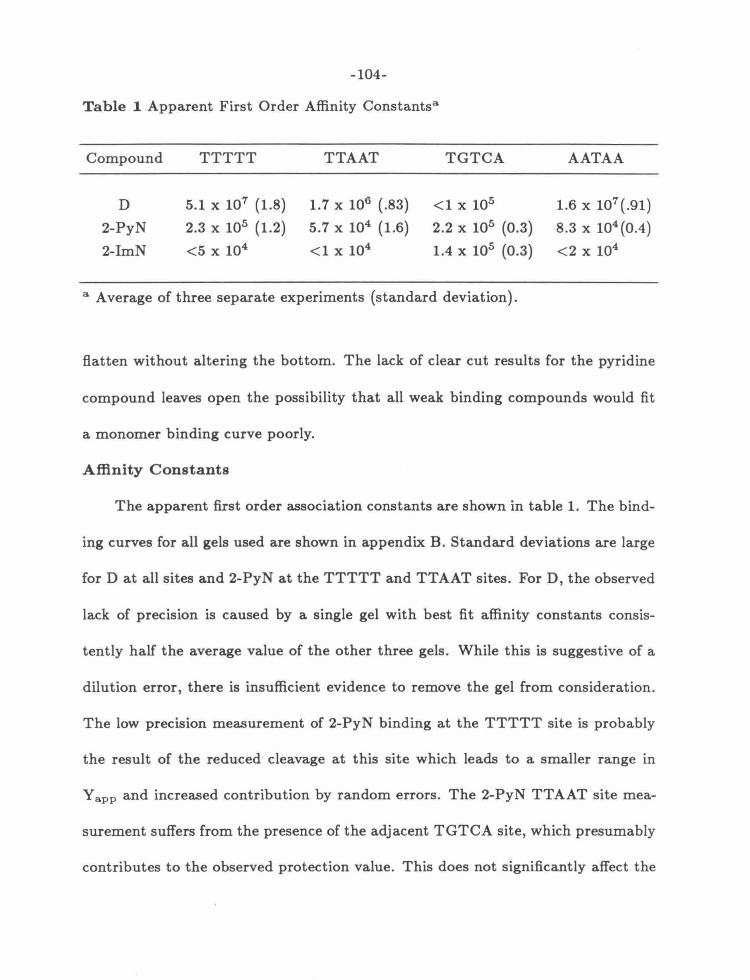
-104-
Table 1 Apparent First Order Affinity Constantsa
Compound TTTTT TTAAT TGTCA AATAA
D 5.1 X 10⁷ (1.8) 1.7 X 10⁶ (.83) <1 X 10⁵ 1.6 X 10⁷ (.91)
2-PyN 2.3 X 10⁵ (1.2) 5.7 X 10⁴ (1.6) 2.2 X 10⁵ (0.3) 8.3 X 10⁴ (0.4)
2-ImN <5 X 10⁴ <1 X 10⁴ 1.4 X 10⁵ (0.3) <2 X 10⁴
a Average of three separate experiments (standard deviation).
flatten without altering the bottom. The lack of clear cut results for the pyridine
compound leaves open the possibility that all weak binding compounds would fit
a monomer binding curve poorly.
Affinity Constants
The apparent first order association constants are shown in table 1. The bind-
ing curves for all gels used are shown in appendix B. Standard deviations are large
forD at all sites and 2-PyN at the TTTTT and TTAAT sites. ForD, the observed
lack of precision is caused by a single gel with best fit affinity constants consis-
tently half the average value of the other three gels. While this is suggestive of a
dilution error, there is insufficient evidence to remove the gel from consideration.
The low precision measurement of 2-PyN binding at the TTTTT site is probably
the result of the reduced cleavage at this site which leads to a smaller range in
Yapp and increased contribution by random errors. The 2-PyN TTAAT site mea-
surement suffers from the presence of the adjacent TGTCA site, which presumably
contributes to the observed protection value. This does not significantly affect the

-105-
TGTCA site measurement, for protection has almost reached the Y H value before
significant TTAAT protection is observed.
The binding constant of D to TTAAT site is within the range of values (3 .0 x
105 - 1.1 x 10⁶ ) reported for distamycin A binding to low affinity sites on calf thymus
DNA. 110• 111 The binding constant of D to the TTTTT site is also quite similar t o
the values measured for distamycin A and poly(dA)·poly(dT), 5.5 x 10⁷ and 4.3 x
107 , at similar salt concentrations. 26• 79• 103 An equilibrium dialysis measurement
of D itself binding to a fifteen bp oligonucleotide containing a TTTAT site (8.8
x 105 ) is also close to the TTAAT value. 112 Thus binding constants measured by
quantitative MPE·Fe(II) footprinting are in the range of values measured by other
techniques, suggesting that this method produces valid isotherms. 100
Error Analysis
The precision in the experiments is reasonably good, indicating that sources
of random error are relatively well controlled. To estimate the accuracy of the de
rived affinity constants, it is necessary to consider potential sources of systematic
error present in the experiment. Due to experimental difficulties in the pyrrole
compound purification 113 and complete water removal, 16 measured molar extinc
t ion coefficients are generally too small by as a much as 10%. This will tend to
underestimate the binding constant, because the concentration of ligand will be
smaller than expected:
A o bs = Eo bs[L]obs
A obs = Ereal [L ]real

4.0e+5
3.0e+5
2.0e+5
-i .0e+5
O.Oe+O 0 . 2
1:1
1:1
•
•
0 .4
-106-
1:1
0.6 0 .8
[MPE] x10 6
I!J TGTCA • MTM
1:1
1:1 -1:1
... -
i.O ; .2
Figure 15 Change of the 2-PyN apparent first order affinity constant with MPE·Fe{II) concentration.
If foba < Ereal, then [L]oba > [L]reah and since Ka ex: 1/[L], Ka(oba) < Ka(real)·
A second possible source of error is the potential for direct interactions be-
tween MPE·Fe{II) and the bound small molecules. Ackers et al. showed the absence
of direct interactions with DNase I by demonstrating that the measured associa-
tion constants are independent of DNase I concentration. The equivalent case for
MPE·Fe(II) is shown in figure 15. Low concentration MPE·Fe{II) footprinting gels
are considerably more difficult to perform. The binding constant of MPE·Fe(II)
is approximately 105 , leading to a sharp drop in total cleavage at concentrations
below 1 J.LM.102 Shown in figure 15 are all points with x2 < 3. There appears to be
-107-
a slight negative interaction between MPE·Fe(II) and 2-PyN. Linear extrapolation
to zero MPE·Fe(II) concentration suggests that the high concentration values are
underestimated by about 20%.
The third source of error stems directly from the fitting procedure. Because
the number of points at the high concentration end of the binding curve is limited,
the fitting program can increase the Y H parameter to fit lower concentration points
better with only a small penalty. This will also tend to underestimate the true value
of the association constant. Typically, Y app varies between 0 and 0.8. Taking
YH(real) = 0.8 and setting YH to its maximum value 1, substituting into the
previous equations gives Ka(fit) ~ 2/3Ka(real), equivalent to a maximum error of
30%. The actual error is almost certainly smaller, since Y H is usually 0.9 or less .
The fourth source of error rests in the assumptions defining the experiment.
The theoretical treatment depends on the total number of backbone cleavage events
not being significantly altered at saturation binding; the total amount of cleavage
must be nearly constant. This is clearly not true in figures 2-4, presumably because
most of the fragment is bound at high concentration. When MPE·Fe(II) cleaves a
well protected fragment, it normally cleaves unprotected regions more frequently. 16
This will lead to reference blocks that are darker than expected, which will increase
the measured protection value and result in reduced binding constants. The mag
nitude of this effect is difficult to estimate. The total effect is probably small
however, because 2-ImN has both the fewest sites on the 517 fragment and the
lowest measured binding constant at all sites.
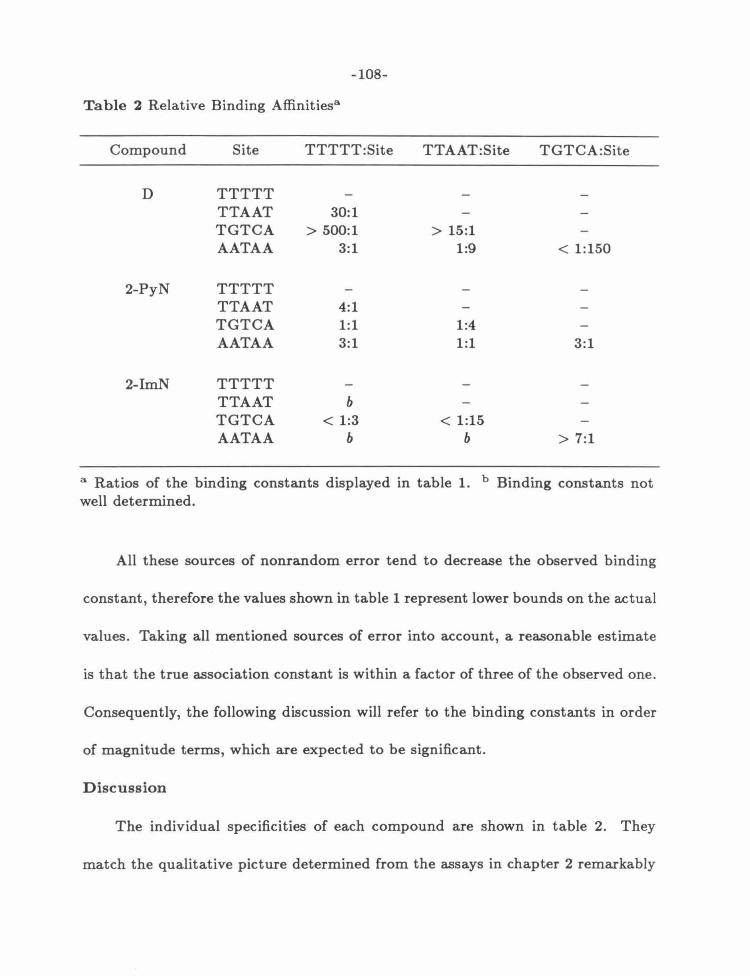
-108-
Table 2 Relative Binding Affinities3
Compound Site TTTTT:Site TTAAT:Site TGTCA:Site
D TTTTT TTAAT 30:1 TGTCA > 500:1 > 15:1 AATAA 3:1 1:9 < 1:150
2-PyN TTTTT TTAAT 4:1 TGTCA 1:1 1:4 AATAA 3:1 1:1 3:1
2-ImN TTTTT TTAAT b TGTCA < 1:3 < 1:15 AATAA b b > 7:1
a Ratios of the binding constants displayed in table 1. b Binding constants not well determined.
All these sources of nonrandom error tend to decrease the observed binding
constant, therefore the values shown in table 1 represent lower bounds on the actual
values. Taking all mentioned sources of error into account, a reasonable estimate
is that the true association constant is within a factor of three of the observed one.
Consequently, the following discussion will refer to the binding constants in order
of magnitude terms, which are expected to be significant.
Discussion
The individual specificities of each compound are shown in table 2. They
match the qualitative picture determined from the assays in chapter 2 remarkably
-109-
well. Most importantly, removal of the N-terminal amide and replacement of a
single aromatic CH by N results in a change in relative specificity of over three
orders of magnitude. As observed on high resolution gels with calf thymus DNA
as carrier, 2-PyN has equal affinities to the TGTCA and TTTTT sites. 2-PyN
and 2-ImN also have nearly equal affinities to the TGTCA site. The selective
disfavoring of A,T sites by 2-PyN compared to D and 2-ImN compared to 2-PyN
is also reproduced. However, the magnitude of these effects is much larger than in
the calf thymus case. 2-Py N binds two orders of magnitude less strongly than D
at A,T sites, compared to a factor of< 25 on previous gels. Likewise, 2-ImN binds
A,T sites at least an order of magnitude less strongly than 2-PyN, as compared to
a factor of < 5 on previous gels.
Calculations using a three site model for calf thymus binding reveal that this
observation is caused by the fact that the free ligand concentration is not propor
tional to the added ligand concentration over the measured concentration range. 114
While it is obvious that a substantial portion of the added ligand will be bound
to carrier, it is not as obvious that the presence of micromolar concentrations of
carrier sites will tend to compress the apparent binding constants towards lower
values. The magnitude of these effects is illustrated in table 3 . Depending on the
exact distribution of sites, ratios between site affinities determined from the added
ligand concentration can be inaccurate by more than an order of magnitude in a
normal footprinting experiment. The sequence of calf thymus DNA is not known,

-110-
Table 3 Effect of significant binding to carrier DNA on relative site affinities.
Case [Site] True Apparent True Apparent (JLM) Kaa K b a Krelc Kreld
1 10 1.0 X 10⁵ 4.9 X 10⁴ 1 1 5 1.0 X 10⁶ 1.9 X 10⁵ 10 4 1 1.0 X 10⁷ 8.7 X 10⁶ 100 18
2 0.1 1.0 X 10⁵ 9.8 X 10⁴ 1 1 0.1 1.0 X 10⁶ 8.7 X 10⁵ 10 9 0 .1 1.0 X 10⁷ 6.3 X 10⁶ 100 64
3 1 1.0 X 10⁵ 8.7 X 10⁴ 1 1 1 1.0 X 10⁶ 4.0 X 10⁵ 10 5 1 1.0 X 10⁷ 1.4 X 10⁶ 100 18
4 10 1.0 X 10⁵ 3.0 X 10⁴ 1 1 10 1.0 X 10⁶ 6.2 X 10⁵ 10 2 10 1.0 X 10⁷ 1.6 X 10⁵ 100 6
5 1 1.0 X 10⁵ 4.1 X 10⁴ 1 1 5 1.0 X 10⁶ 7.8 X 10⁴ 10 2
10 1.0 X 10⁷ 1.8 X 10⁵ 100 5
6 10 1.0 X 10³ 9.9 X 10² 1 1 5 1.0 X 10⁴ 9.6 X 10³ 10 10 1 1.0 X 10⁵ 9.1 X 10⁴ 100 91
7 1 1.0 X 10³ 1.0 X 10³ 1 1 1 1.0 X 10⁴ 9.9 X 10³ 10 10 1 1.0 X 10⁵ 9.4 X 10⁴ 100 95
8 10 1.0 X 10³ 9.8 X 10³ 1 1
10 1.0 X 10⁴ 8.7 X 10³ 10 9 10 1.0 X 10⁵ 6.3 X 10⁴ 100 64
9 0.1 1.0 X 10⁷ 2.9 X 10⁶ 1 1 0.1 1.0 X 10⁸ 6.3 X 10⁶ 10 2
0.1 1.0 X 10⁹ 1.6 X 10⁷ 100 6
a 1/[L]tree at half protection. b 1/[L]total at half protection, the number measured on a typical footprinting gel. c Ratio of the true Ka at a site to the true Ka at the weakest site. d Ratio of the apparent Ka at a site to the apparent Ka at the weakest site.
-111-
and 25% of the genome is significantly non-random, 115 so that no quantitative
model is currently available. Thus a footprinting or affinity cleaving experiment in
the presence of carrier can give only the relative ordering of binding sites. Given the
low specificities and potentially high site concentrations of these small molecules,
an observed change in affinity of a factor of two on a gel could correspond to an
order of magnitude change in binding constant.
The 2-PyN and 2-ImN results, while not conclusive, are at least suggestive
that TGTCA site binding is not a simple 1:1 complex. The fact that this effect
is observed at a single site severely limits the possible explanations. Cooperativ
ity based on the binding to adjacent sites is clearly excluded by the 2-ImN case.
Similarly, the observation of the same behavior over a range of MPE·Fe(II) concen
trations would tend to rule out the intercalator as a cause. This leaves two possible
explanations. The results could be an artifact of the footprinting procedure, or 2-
PyN and 2-ImN could bind as a dimer to the TGTCA site. It is certainly true
that these experiments are performed at much higher compound:DNA ratios than
usual.9 If 2-ImN is binding as a dimer, the observed footprint is not large enough to
fit two molecules end to end. This either puts one molecule in the minor groove and
one in the major, or both in the minor groove. A head to tail dimer in the minor
groove is most consistent with data of the previous section. It also neatly explains
the always symmetrical cleavage pattern and the interchangeability of the A,T bp
in the consensus binding sequence. To eliminate the possibility of an artifact, it
-112-
will be necessary to examine this system by an independent method like NMR, or
possibly a gel mobility shift experiment modified for fast exchange conditions.116
Both of these experiments have the advantage that detection of ternary complexes
is independent of the fitting method used to determine the binding constants .
A decrease in the binding affinity of 10 reflects a difference in binding free
energy of about 1.4 kcal/mol at 37°C. This is consistent with the lower affinity
of 2-Im.N to A,T sites being produced by the loss of a single hydrogen bond to
solvent. The source of the lower affinity of 2-PyN to A,T sequences is more difficult
to explain. Certainly the loss of one amide hydrogen bond from D to 2-PyN is
responsible for some of the decrease in binding at A,T rich sites, but it is unlikely
to account for all 3 kcaljmol as seen from the results with 3-PyN and 4-PyN in
chapter 2. The apparent free energy of interaction at the TGTCA site is about
-7 kcal/mol. This is below normal for DNA-binding small molecules, and well
below that of similar minor groove binding compounds. 9 It is tempting to attribute
this loss to structural rearrangement, but other explanations cannot be ruled out
at this time. Clearly, more data on the precise structure of the 2-ImN /TGTCA
complex is needed before this complex situation will be understood.
Summary
A footprinting method for measuring individual protein-DNA affinity con
stants is extended to small molecules. The method uses MPE·Fe(II) to report the
fraction of DNA bound over a large range in free ligand concentration. The exper
imental data are then fitted to individual site isotherms using a non-linear least

-113-
squares procedure. At the TGTCA site, the data for 2-PyN and 2-ImN fit best
to a cooperative binding curve. This may indicate that the compounds bind as a
dimer. At 100 mM salt, the affinity of the distamycin A analog D to its strongest
site is 107 M- 1 . The apparent affinity of 2-PyN and 2-ImN to the TGTCA site is
105 M-1 . The affinity of 2-PyN for the distamycin A sites is of similar magnitude.
Binding constants of 2-ImN at distamycin A sites are 5 x 10⁴ or less. Removal of
one amide and substitution of the N-terminal pyrrole ring of D by imidazole has
changed the relative specificity by a factor of 1000.

-114-
Chapter 4
The Scope of WGWCW Sequence Specificity

-115-
While the preceding chapters provide a detailed analysis of the DNA specificity
of 2-ImN and a reasonable model for WGWCW sequence selection, there is no clear
candidate for a molecular complex. To learn more about the details and the scope of
this complexation, a series of 2-PyN and 2-ImN derivatives have been synthesized,
and are shown in figure 1.
Substituted Pyridine Derivatives
4-Chloropyridine-2-carboxamide-netropsin ( 4-ClPy N) and 4-dimethylamino
pyridine-2-carboxamide-netropsin (4-Me2NPyN) are designed to test the role of
hydrogen bonding in the complex by changing the electron density at the ring nitro
gen. 3-Methoxypyridine-2-carboxamide-netropsin (3-MeOPyN) and imidazo[1,2-
a]pyrazinecarboxamide-netropsin ( CycN) are designed to assess the role of the car
bonyl oxygen in the complex. CycN requires the carbonyl and ring nitrogen to be
cis. 3-MeOPyN should prefer cis because of the weak hydrogen bond between the
methoxy 0 and the amide NH in this conformation. 3-MeOPyN and pyrimidine-2-
carboxamide-netropsin (2-PmN) are also designed to test the proposed model for
selection against A,T sites. Both modify the putative N-out conformation of 2-
PyN. 3-MeOPyN blocks a tight complex with the methoxy group. 2-PmN replaces
the CH at the bottom of the groove with N.
Synthesis
Synthesis of these compounds follows the procedures described earlier. The
final compounds are prepared from the common intermediates 1 and 2 described in

-116-
AI AI AI /N\ /N\ /N\ H~ H~ H~ 9' N,....... 9' N,....... 9' N,.......
HN HN HN !,a_ !,a_ !,a_ HN HN HN <to N~o <to GN
Cl /N-
4-ClPy N, 4-ClPy NE 2-PmN, 2-PmNE 4-M~PyN, 4-M~PyNE
AI I
AI /N\ /N\ /N\ H~ "C: H~ 9' N,.......
'7 N,....... 9' N,.......
HN HN
iNa_ HN iNa_ 0 i:o__
HN
N~ HN
~0 N~o ~N ~N, Me
3-MeOPyN, 3-MeOPyNE CycN 2-lmN, 2-ImNE
Figure 1 Substituted pyridine and imidazole compounds.

0 0 0 0 ({oH 1) SOC12 Q(ou. H30+ ifOH HNMe2, .1 ~OH 2)Me0H
Cl Cl /H....._
9 44% 10 94% 11 94%
0
(flc' Na2S~ (flso,No KCN,.1 (I( eN NaOH (00H I
N N N N ...... ...... ~ I
12 -100% 13 20 % from PmCI 14 38%
0 0 0 0
OCOH MeOH,W (CoMo 1) NaOMe OCOM• H3o+ OCOH OH OH 2) Mel, DMSO OMe OMe
15 32% 16 31% I 7 -100%
Scheme 1 Synthesis of substituted pyridine acids.
-118-
chapter 2. The required acids are not commercially available, but can be prepared
by the methods shown in scheme 1. All could be obtained in 1-2 steps from litera
ture starting materials. Preparation of 10 is best accomplished through the methyl
ester 9,117 which can be recrystallized, then hydrolyzed in acid. Preparation of
11 then follows the procedure for the 4-aminopyridine-3-carbo:xylic acid.118 The
pyrimidine acid 14 is best synthesized by the method of Ochia and Yamanaka 119
as adapted by Deady et a/. 12° Compound 17 is readily obtained by acid hydrolysis
of the known ester. 121
Coupling of these acids to the amine derived from 1 is difficult by the
N ,N'-carbonyldiimidazole procedure. For each compound, a standard sequence
of coupling reactions is attempted. The acid is first activated as the imida
zolide. If coupling fails, the acid is activated with dicyclohexylcarbodiimide and
N-hydroxybenzotriazole. If coupling still fails, the acid is activated as the acid
chloride. Several of these compounds, most notably 2-PmN, have the same Rf as
the amine derived from 1. To purify these compounds, the residual amine is acety
lated before chromatography. Coupling of the same acids to the amine derived
from 2 by the most successful procedure for 1 provides the EDTA derivatives.
The synthesis of the bicyclic imidazole derivative is shown in scheme 2. Alkyla
tion of imidazole at N1 and preparation of the ester follow standard procedures. 122
Compound 18 is apparently unstable at low pH, as has been found for other 1-
methylimidazole-2-carbo:xylic acids. 123 Best coupling yields are achieved by titrat-

-119-
Cl Cl
H Br......_CI ~ ~0 N 1) 02NC6H40COCI ('ff N
(roR NaH (~ 2) NaOH
18 39% 19 R = C6H 4 N02 49 % 20 R=H
NaH, Nal, THF
21 17% CycN 95%
NaH, Nal, THF
I o
(Y'-ou._1_) _H_2._P_dl_c __
o2N 2) 20, DCC,
HOBt N ~CI
~N
22 31% 23 72%
Scheme 2 Synthesis of CycN and model compound 23.

-120-
ing the alkaline hydrolysis reaction mixture of 19 until clear, extracting the nitro
phenol with dichloromethane, evaporating the solvent, then immediately activating
and coupling with the amine from 1. Under N-alkylation conditions/24 cyclization
occurs to give the target compound. The mass spectrum and the loss of one amide
proton in the 1 H NMR spectrum are consistent with either N to C or 0 to C bond
formation. Cyclization occurs on nitrogen as judged by the following evidence.
The 1 H NMR spectrum of CycN is very similar to the model compound 23 shown
in scheme 2. Compound 23 shows both an amide stretch and an ester stretch in
theIR spectrum, and the bicyclic portion of the molecule is unaffected by refluxing
sodium hydroxide. It is unlikely that the oxygen cyclized product would be stable
to these conditions, thus both compounds are probably correct as displayed. As in
the 2-ImN case, all attempts to couple 20 to the EDTA amine have failed.
Footprints of these compounds on the 517 bp fragment is shown in figure 2,
and the affinity cleaving is shown in figure 3. As observed for the 2-PyN, high
concentrations of these analogs show nonselective protection over most of the frag
ment. Histograms of cleavage and protection sites were determined by the same
method used in chapter 2, and are shown in figures 4 and 5. Each compound gives
a different binding and cleavage pattern, and will be discussed separately .
.+-Chloropyridine-f!- carboxamide-netropsin ( .+-CIPyN)
4-ClPyN protects the same sites as 2-PyN at about the same concentration.
4-ClPyNE cleaves A,T rich sites less efficiently at a slightly higher concentration

-121-
Figure 2 Footprinting of substituted derivatives of 2-PyN and 2-ImN. Autoradio
gram of an 8% denaturing polyacrylamide gel. All reactions contain 4 mM DTT,
100 J.LM-bp calf thymus DNA, and 12 kcpm 5' labeled 517 bp restriction fragment in
40 mM Tris·acetate pH 7.9 buffer. Lane 1, intact DNA; lane 2, G reaction;80 lane 3,
A reaction;81 lanes 4-22 contain 4 J.LM MPE·Fe(II): lane 4, MPE·Fe(II) standard;
lane 5 4 J.LM D; lane 6, 20 J.LM 2-PyN; lane 6, 20 J.LM 2-ImN; lanes 8-10 contain
35 J.LM, 10 J.LM, and 1 J.LM 4-ClPyN respectively; lanes 11-13, 35 J.LM, 10 J.LM, and
1 J.LM 2-PmN respectively; lanes 14-16, 35 J.LM, 10 J.LM, and 1 J.LM 4-Me2 NPyN
respectively; lanes 17-19, 35 J.LM, 10 J.LM, and 1 J.LM CycN respectively.

-122-
z z z >. >. a... >. z a... a... E N 0
Q) z Q) 0 z z 0 a... ~ u ~ '-
E ' ' ~ >. M c
~ >. "<t C\J 0
0 a... ' ' r-l r-l r-l r-l 0 <9 <{ ~ 0 C\J C\J r-l
1 2 3 4 5 6 7 8 9 10 11 12 13 14 15 16 17 18 19 20 21 22
= '
--
-
--
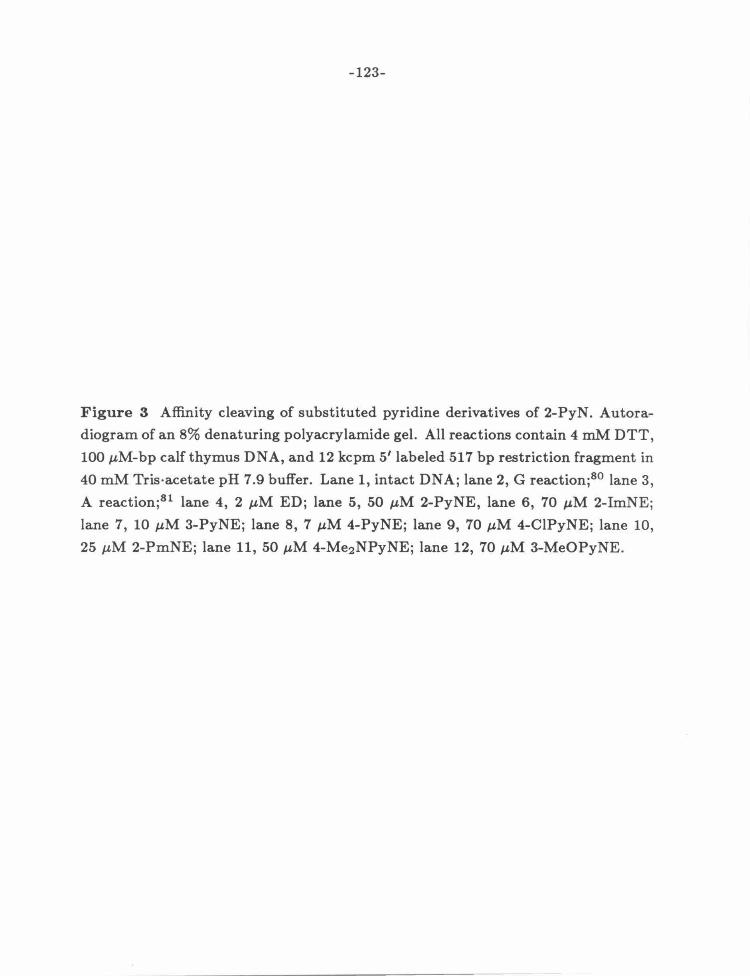
-123-
Figure 3 Affinity cleaving of substituted pyridine derivatives of 2-PyN. Autora
diogram of an 8% denaturing polyacrylamide gel. All reactions contain 4 mM DTT,
100 J,.LM-bp calfthymus DNA, and 12 kcpm 5' labeled 517 bp restriction fragment in
40 mM Tris·acetate pH 7.9 buffer. Lane 1, intact DNA; lane 2, G reaction;80 lane 3,
A reaction;81 lane 4, 2 J..LM ED; lane 5, 50 J..LM 2-PyNE, lane 6, 70 J..LM 2-ImNE;
lane 7, 10 J..LM 3-PyNE; lane 8, 7 J..LM 4-PyNE; lane 9, 70 J..LM 4-ClPyNE; lane 10,
25 J..LM 2-PmNE; lane 11, 50 J..LM 4-Me2 NPyNE; lane 12, 70 J..LM 3-MeOPyNE.
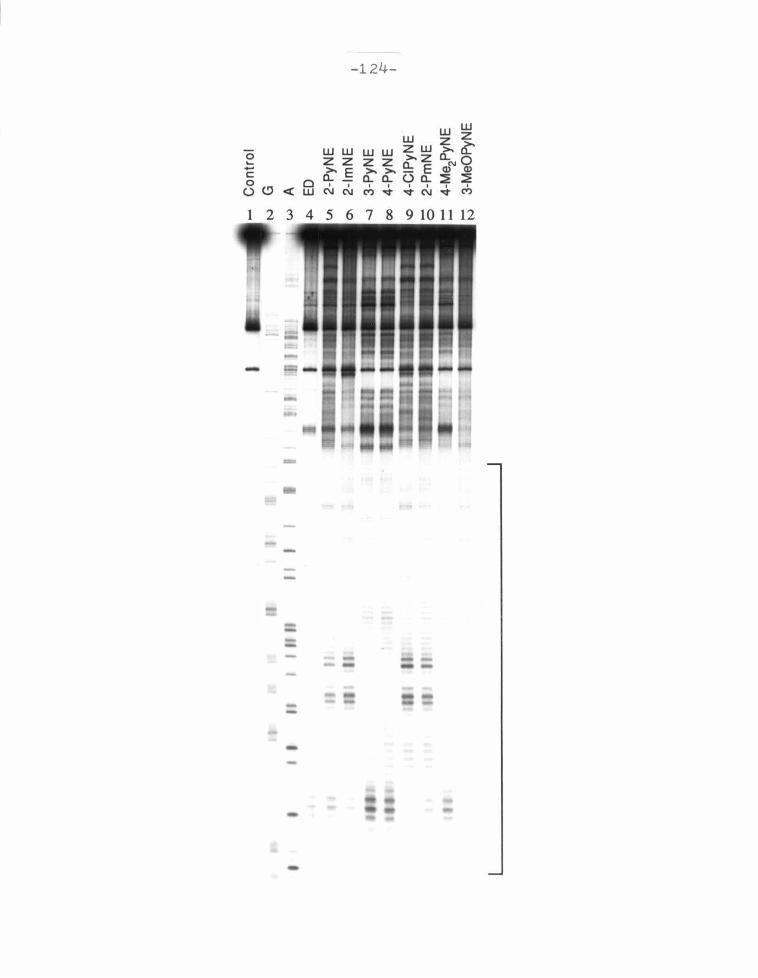
0 ..... -c 0 0 O<!J<w
- 124-
ww zz ct'E
I o
C\IC\1
w wwzw z z >-z >->.~E a..a..oa..
I I I I
C') "<t "<t C\1
w w z z >.~ a.. 0 of"Cll ~ ~ ' ' "<t C')
1 2 3 4 5 6 7 8 9 10 11 12
-
- --- -
-
--

-125-
2-PyN at 10 lolM
4-CIPyN at 10 lolM
.-. ...__ ... a 3'lp5'- CCC C T A TT TT AT A C C T T A Afi'G'fC1JT C Afi'1TfA1A T CC 'I'I'ffCfT\A G A CC TC A CC T CCC AIC"'fT"ftfeC C C G-3'
3'- CCCCA AA AAA A TCC AA T~ C Tt!.I.I.!JjT ACCAIA..All.AJTC TGCAC TCC ACCCT1!i..A.!.AAICCCC C-5' .... ... .. ....
2-PmN at 10 lolM ... ~ ~ .. 32p5'- CCC C T Afff'ff'T!A T A C G TT A ~T g rg m G Afi'1TfA1A TCG 'I'I'ffCfT\A G A CG TC A CC TGC C AIC"'fT"ftfe G GG G-3'
3'- CCC C A TI!.!.!A.AJT A TCC AA T A A C T1A..1.I.A.l1T ACC AIA..!.iAAJTC T GC AG T CC A CCC T1!i..A..!.A.AI CCC C-5' ... .. ... ... ... CycN at 10 1-lM
... -. .1111.- A 32p 5:- c c c c T W] I II» T A ccffTTI'Tic rcA rcA 1'1i1T'i'Alrcc 'I'I'ffC'fT\Ac A c c rcA cc T cc cAIC"'fT"ftfe c cc c -3'
3 - G CG G A A TCCIAA..I..I..AIC ACT A C TAlLI.A.IJ:IA CC A~C TG C AG T CC A C CG T1!i..A..!.A.AI CCC C-5' .... .,.. ... .. .. Figure 4 MPE·Fe(II) footprinting protection for the substituted pyridine and
imidazole compounds in figure 1.

-126-
ED at 214M
IJ!JtllUl+ llW lllh+ lll+ 32p 5'- C G C C T A TT TT TAG G T T AA T G TC A TG A 1'1i'I'T.U1TG G TTTCTT AG A CG TCA G G TG G C AlCf"ffTTc G G G G-3'
3~GCGGATAAAAA ATCCAATTACAGTACTA~CCAAAGAATCTGCAGTCCACCG~CCCC-g
tlj]Jt ttttttlt +ttt 1fff1 tttt •••
2-PyNE at 50 14M
~!!~ •• l~~~· ~ll! ~ll~l~~···~~· ~~ +ll~ 32p 5'- C GC C T ~rr ITT~ TAG G T TAm g rc me A 1'1i'I'T.U1TGG TTTC TT AG AC G TC A GG TGG C AlCf"ffTTc G GG G-3'
3~GCGGA AA ATCCAAT G CT~CCAAAGAATCTGCAGTCCACCG~CCCC-g
'itt ttttt 'ili' 'llffttt tt tttt tt
4-ClPyNE at 70 14M
·~~~ ~!l~ .l!~. + •• ~~~ 32p5'- c G c c T WJ r TT~ T A GG T T A AT G TC A G A 1'1i'I'T.U1TcG 'I'fi'TCfTlAG A CG TC A GG TGG c AlCf"ffTTc G G G G-3'
3'- GCG GA AA AT CC A AT AC AG CTA~CCAIAllA.AJTCTGC AG TCCACCGTI!i!.A.A.AIGCCCC-5'
ffff lfljl f]Jllff Iff! If lfffl
2-PmNE at 25 14M
+U+ UU d!! l!~~ HH H+ 32 p 5'- C G C C T A!Tf'f'fT1A T A G G T T A .AffG'T"C1JT G A 1'li'I'T.U1T G G 'I'fi'TCfT1A G A C G T C A G G T G G C AlCf"ffTTc G G G G-3' 3~GCGGAT~ATCCAAT~CTA~CCA~CTGCAGTCCACCG~CCCC-g
ttt ttfi' ttjit lflift ttt tt ttt 4-Me2NPyNE at 50 14M
!!!~ ++ ++++ 32p5'- C G C CT Afi'TffT!A T A cgttr A ~IJg rcmc A 1'1i'I'T.U1TGG TTTCTT AGA CG TC A GG T GG CAlCf"ffTTc GG G G-3' 3~GCGGA~ATCC AT AQ CTA~CCAAAGAATCTGCAGTCCACCG~CCC~g
'lfJlf tttt ftt ftf ttttt ltttttt ft
Figure 5 Affinity cleaving of 517 bp fragment of pBR322 by the compounds of figure 1.

-127-
than 2-PyNE. This produces a slightly higher TGTCA specificity than the parent
compound. 4-ClPyN also binds at the TTTTT site in the opposite orientation from
that observed for all compounds in chapter 2. Like 2-PyN and 2-lmN, 4-ClPyN
prefers the orientation at the CTTTT site that can hydrogen bond to G.
Pyrimidine-2-carboxamide-netropsin {2-PmN}
The pyrimidine compound protects the TGTCA site and all but one of the
A,T rich sites at 10 J.LM. As judged by the amount of cleavage by 2-PmNE, the
binding constant is higher than that of 2-PyN by more than a factor of two. On
this fragment, the cleavage specificity of 2-PmNE is identical to 2-PyNE except
for the TTTTT site. At the TTTTT site, 2-PmNE cleavage reveals that both
orientations are equally favored.
4-Dimethylaminopyridine-2-carboxamide-netropsin (4 -M e2 NPyN)
The protection pattern for 4-Me2NPyN suggests that A,T rich sites are more
favored by this compound. Unlike the parent compound at 10 J.LM, 4-Me2NPyN
at 10 J.LM prevents MPE·Fe(II) cleavage at the TTAAT site. Almost all cleavage
by the EDTA derivative occurs at the TTTTT site in the orientation generally
found for ED and 4-PyNE. There is little cleavage at the TGTCA site, consistent
with the favoring of A,T rich sites and the disfavoring of the TGTCA site relative
to 2-PyN. There is no orientation preference at the CTTTT site, which is also
consistent with an overall lower preference for G,C binding.
-128-
9-Methoxypyridine-2-carboxamide-netropsin {9-MeOPyN)
This compound does not give detectable footprints on the 517 fragment at
concentrations up to 50 J.LM. Control experiments establish that this is not due
to decomposition of the compound, sample packaging or misloading errors. The
1 H NMR spectrum of the final compound is clearly that of the 3-methoxy-2-
carboxamide compound. The aromatic region has a coupling pattern indicative of
three adjacent ring protons. Chemical shift data show one proton next to the ring
nitrogen, and large upfield shifts for two protons ( ortho and para to the methoxy)
with respect to 2-PyN.
Imidazo (1, 2-ajpyrazinecarboxamide-netropsin ( CycN}
CycN binds only the usual A,T rich sites at 35 or 10 J.LM. Despite having only
two amide hydrogens, its binding selectivity appears similar to 3-PyN or 4-PyN.
Cleavage Specificity on pBR922
The cleavage specificity of these compounds on larger DNA is determined by
the same procedure used in chapter 2. An autoradiogram of the agarose gels is
shown in figure 6 and the band sizes and relative cleavage efficiencies are shown
in figure 7. The pyrimidine compound gives a cleavage pattern that is identical to
the 2-PyNE pattern within the resolution of the experiment. By comparison, 4-
ClPyNE shows enhanced cleavage at sites that correlate with the 2-Im.NE cleavage
bands (i.e., the sites at 10 and 1900), while 4-Me2 NPyN shows decreased cleavage
at the same bands. Matching its behavior on the restriction fragment, 3-MeOPyNE
cleaves pBR322 very poorly.

-129-
Figure 6 Double-stranded cleavage of pBR322 by substituted pyridine com
pounds. Autoradiogram of a 1% agarose gel. All reactions contain 1 mM sodium
ascorbate, 100 J.LM-bp calf thymus DNA, and 24 kcpm 3' labeled pBR322 linearized
with Sty I and labeled at only one end with Klenow fragment. Top) Labeled on
the clockwise strand with [a-32P] dATP; Bottom) Labeled on the counterclock
wise strand with [a-32P] TTP. Lane 1, intact DNA; lane 2, molecular weight stan
dards; lane 3, 2 J.LM ED; lane 4, 50 J.LM 2-PyNE; lane 5, 70 J.LM 2-ImNE; lane 6,
50 J.LM 4-ClPyNE; lane 7, 50 J.LM 4-Me2NPyNE; lane 8, 25 J.LM 2-PmNE; lane 9,
70 J.LM 3-MeOPyNE.

-130-
w w A w z z
w z >. w >. 0 w a.. z z >. a.. z 0 ..... a.. Q)(\j - >. E E Q) c:
~ 0 0.. (.) ~ a.. ~ 0 I I I I I I (.) UJ C\1 C\1 v v C\1 ('I')
1 2 3 4 5 6 7 8 9
8
1 2 3 4 5 6 7 8 9

-131-
0 1000 2000 3000 4000 4363
2-PyNE at 50 ~M
~I + •• • t ~ 1 .. ~ ~ . d! 4-ClPyNE at 70 ~
ll . ~~ ~·. t H+ 1 ~ +IH ~ ll 2-PmNE at 25 ~M
l ~} l ~ ~ • • + ~ 1 t .1 + t d 1
4-Me~PyNE at 50~
t l .. 1 1 t .. ~ i ~ill
Figure 7 Cleavage sites on linearized pBR322. Arrows represent the extent of cleavage in each lane of figure 6. Arrow positions represent approximate binding site locations, accurate to within 40 bp. Cleavage bands within 700 bp of the labeled termini are not resolved on the gel.
-132-
Discussion
While the pyrimidine compound shows no change in specificity from 2-PyN,
the binding constant at the TGTCA site is significantly higher. This can be readily
explained by an entropic argument. There are now two degenerate conformations
each of which can hydrogen bond to G. An identical increase in binding affinity at
A,T rich sites could be explained by the same effect if only one of the pyrimidine
nitrogens is hydrogen bonded in water solution. This is reasonably consistent with
the low basicity of pyrimidine derivatives. Such a bonding scheme would give two
degenerate N-out complexes and the entropic contribution would be the same at
all sites. Alternatively, the difference in affinity may be caused by the change in
dipole or electronic structure between pyridine and pyrimidine, with the similar
magnitude at different sites being fortuitous.
Both CycN and 3-MeOPyN provide evidence against the participation of the
N-terminal amide carbonyl in the WGWCW complex. Neither shows detectable
binding at the TGTCA site. The methoxy compound also shows no detectable
binding at A,T sites, consistent with the solvent hydrogen bond model for dis
favoring such sites. Because of the methoxy group, 3-MeOPyN must have the
pyridine nitrogen at the floor of the groove at all sites. Thus it should behave like
2-ImN at all A,T sites. CycN, however, could rotate so that the two methylene
groups are present on the floor of the groove. Such a conformation looks very
similar to the piperazine ring of Hoechst 33258 in the crystal structure of the DNA
complexes.39 • 40

-133-
If the specificity of 2-PyN and 2-ImN is due mostly to hydrogen bonding
patterns, as proposed in chapter 2, then an increase in hydrogen bond strength
should increase the selectivity for TGTCA by two different mechanisms. The
G/aromatic N hydrogen bond should be stronger, increasing the WGWCW binding
affinity. A similar increase in the aromatic N to water hydrogen bond strength
should decrease the affinity at A,T sites. Substitution of the 4 carbon of the
pyridine ring should have the strongest effect on the aromatic nitrogen, but other
factors can intervene. It is expected that bulky groups at the 4 position prefer the
N-in conformation, thus selecting against A,T binding sites. For a bulky electron
withdrawing group, these factors will compete with one another. Steric factors
will favor WGWCW sites, and hydrogen bonding will favor A,T sites. For a bulky
electron donating group, both factors tend to favor WGWCW sequences.
Experimentally, the opposite trend is observed. 4-ClPyN is more specific for
the TGTCA site by disfavoring A,T sites. 4-Me2 NPyN is less specific for the
TGTCA site by both favoring A,T sites and disfavoring the TGTCA site. For
4-ClPyN, the results are consistent with the enhanced preference for theN-in con
formation dominating over the loss in hydrogen bond strength. The 4-Me2 NPyN
results cannot be explained by this argument. However, to obtain sharp 1H NMR
peaks for 4-Me2 NPyN and its precursors, it is necessary to add trifluoroacetic
acid. This suggests that a protonation event occurs near neutral pH. NMR stud
ies have shown that the protonation of dimethylaminopyridines occurs at the ring

-134-
nitrogen. 125 · 126 Such a protonation event would favor A,T sites at low pH, since
the pyridine nitrogen can now hydrogen bond to A and T.
The UV absorbance of 4-Me2NPyN with varying pH is shown in figure 8. At
low pH, the absorbance maxima at 270 nm shifts to longer wavelength. The three
isosbestic points at 278, 313, and 328 nm indicate that a single process is occuring
in this pH range. Plotting the difference in absorbance at 265 nm and 300 nm
versus pH gives an approximate pKa of 6.2, consistent with the literature values of
this class of compounds.127-129 The electronegative environment of DNA should
raise the pK3 , so that it is quite reasonable to expect 4-Me2NPyN to be at least
partially protonated under typical footprinting conditions. To test this hypothesis,
4-ClPyN, 2-PyN, 4-Me2NPyN, and 2-ImN have been foot printed over a range of pH
values. As the pH of the reaction increases, the binding affinity of all compounds
should decrease as the C-terminal amino group deprotonates. At the lowest pH, it
is possible that the DNA itself is partially protonated. In the absence of another
protonation site on the ligand, there should be a gradual decrease in the number
of protected sites with increasing pH.
Because MPE·Fe(II) cleaves extremes of pH at considerably lower efficiencies, 102
sodium ascorbate is used as the reductant. The cleavage time is varied from 4 min
at pH 7 or 8 to 30 min at pH 10. An autoradiogram of the 517 fragment is shown in
figure 9, and the footprints are shown in figures 10 and 11. Detection of light foot
prints is problematic. Any diminution of cleavage at the sites present at pH 6 was
considered to be evidence for binding at that site, and is shown in the histograms.
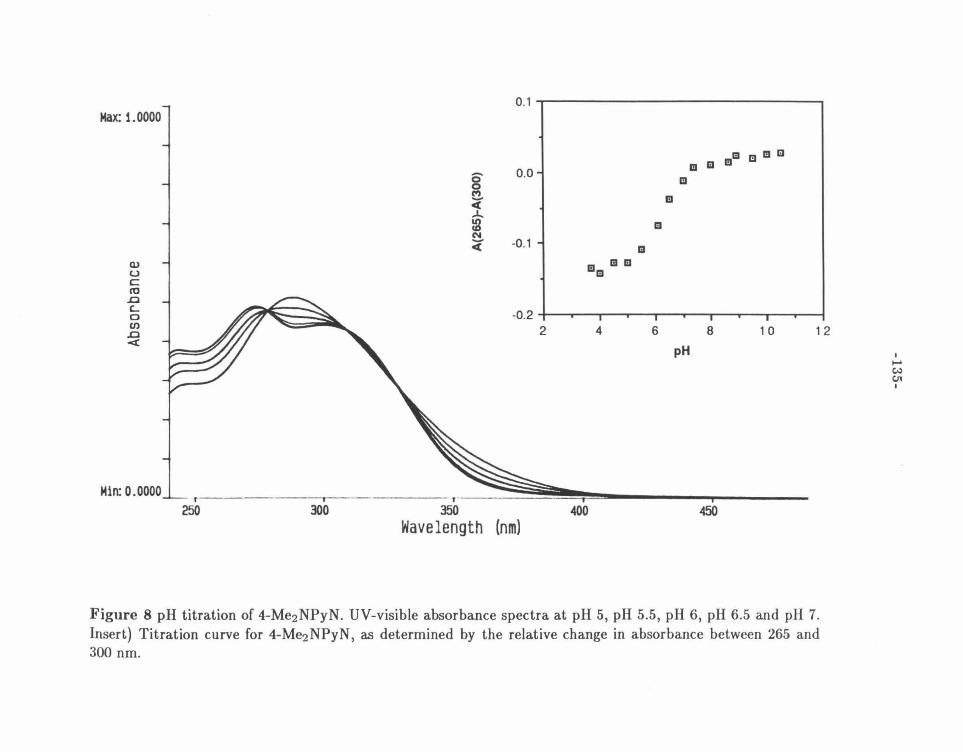
0.1
Max: 1. 0000 J ~
Ill Ill Ill Ill Ill Ill Ill
0 0.0 1 Ill 0 ('f)
Ill C( ...L.. :g I Ill N
-0.1 C(
I Ill
Ill Ill Ill C1.l l Ill u c 10 ..a
-0.2 a:....
J ~ 1 2 0
2 4 6 8 1 0 (/)
..a pH <
Min: 0.0000 ----~----------- ,· I I
300 350 400 450 Wave length (nm)
Figure 8 pH titration of 4-Me2NPyN. UV-visible absorbance spectra at pH 5, pH 5.5, pH 6, pH 6.5 and pH 7. Insert) Titration curve for 4-Me2NPyN, as determined by the relative change in absorbance between 265 and 300 nm.
I
'""' (;.)
"' I

-136-
Figure 9 pH dependence of 4-Me2 NPyN, 2-PyN, 4-ClPyN, and 2-ImN footprints .
Autoradiogram of an 8% denaturing polyacrylamide gel. All reactions contain
1 mM sodium ascorbate, 100 J.LM-bp calf thymus DNA, and 12 kcpm 31 labeled 517
bp restriction fragment in 40 mM Tris·acetate pH 7.9 buffer. Lanes 1- 3, intact DNA
at pH 6, 8, and 10 respectively; lane 4, G reaction;80 lane 5, A reaction;81 lanes 6-30
contain 4 J.LM MPE·Fe{II): lanes 6-10 contain the products ofMPE·Fe{II) cleavage
for 18 min at pH 6; lanes 11-15, cleavage for 4 min at pH 7; lanes 16-20, cleavage
for 4 min at pH 8; lanes 21-25, cleavage for 8 min at pH 9; lanes 26-30, cleavage for
30 min at pH 10; lanes 6, 11, 16, 21, and 26 are MPE·Fe(II) standards; lanes 7, 12,
17, 22, and 27 contain 20 J.LM 4-Me2 NPyN; lanes 8, 13, 18, 23, and 28, 20 J.LM 2-
PyN; lanes 9, 14, 19, 24, and 29, 20 J.LM 4-ClPyN; lanes 10, 15, 20, 25, and 30,
20 J.LM 2-ImN.

Controls 0
c.oro~
z >. z a..Nz g: z
~Q)>--E ~a..o-
...tN.J.N
z >. a..Nz
~Q)>. ~a.. ~N
-137-
z z z >. >-z Q_N Z g: Z ~ E ~Q)>--E~ 0- ~a..o-
' ' ...tN~N '<tC\1
z z z z >. >. a.. z >. z a.. z >. z Q)N >. ~
~~ Q)N >. ~ E
~ a.. (.) ~a..o ' ' ' ' ~N~ v C\IV C\1
a a a C} ~ pH 6 pH 7 pH 8 pH 9 pH 1 0
12 3 4 56 7 8 9101112131415161718192021222324252627282930
---- •
---
--

-138-
4-CIPyN &t 20 llM
..-. _... ~ P
H 6 32p5'- C GC C T AffT"'i'TTTA T A GG TT A AlfC"f'C1JTG Al'fiTfiJA TGG TffT'C"T'nAGA CG TC AGG TGCC~CCCC-3' 3'- G C G C A T1A.!A.A.AIT AT C C A AT~ C T\A.l.I.A.lfT A C C ~C T CC AG TC C A CCC~ CCC C-S'
... .... ..... .. .a 32p5'- CCC CT Aff1"'i'TT!A T A CC TT A AlfC"f'C1J'rc Al'fiTfiJA TCC TffT'C"T'nACACC TC ACCTCCC~CCCC-3'
3'- CCC C A T1U..A..A.AIT AT C C A AT~ C T\A.l.I.A.lfT A C C ~C T C C ACT C C A CCC~ CCC C-51 .. .. ... .. PH 8 32p 5'- CCC C T Aff1"'i'TT!A T A C C T T A AlfC"f'C1JT C Al'fiTfiiA T C C TffT'C"T'nA C A C C T C A C C T CCC~ CCC C-3'
3~CCCCATIA.!A.A.AITATCCAAT~CT\A.l.I.A.lfTACC~CTCCACTCCACCC~CCCC-S' ... ... ... .. 32p 5'- CCC C T Aff1"'i'TT!A T A C C T T A AlfC"f'C1J'rc Al'fiTfiJA T C C TffT'C"T'nA C A CC TC A C C T CCC~ C CCC-3' 3~CCCCATIA.!A.A.AITATCCAAT~C~ACC~CTCCACTCCACCC~CCCC-S'
... ... ~ pH 10 32p5'- CCC CT Aff1"'i'TTTA T ACC TTAAifC"f'C1J'rcAI'fiTfiJA TCC TffT'C"T'nAcACC TCA CC TCCC~CCCC-3'
3'- CCC CA T1A.!A.A.AIT AT CC A AT ~C T\A.l.I.A.lfT A C C ~C TC C ACT C C A CCC~ CCC C-51
pH 6
2-ImN &t 20 llM ... 32p5'- CCC CT A TTTTT AT A CC TT AAifC"f'C1JTC AT AA T U TCC TTTCTT AC ACC TC ACCTCCCACTTTTCCCCC-3'
3~ CCCCATAAAAATATCCAAT~CTATTATTACCAAACAATCTCCACTCCACCCTCAAAACCCCC-S'
• 32p5'- CCC CT A TTTTT AT ACC TT AAifC"f'C1JTCA T AA T U TCC TTTC TT ACACC TC A CC TCCCACTTTTCCCCC-3' 3~CCCCATAAAAATATCCAAT~CTATTATTACCAAACAATCTCCACTCCACCCTCAAAACCCCC-S'
.& PH 8 32p5'- CCC CT A TTTTT AT A CC TT AAffcfcllrcA T A AT U TCC TTTCTT ACACC TC ACCTCCCACTTTTCCCC C-3'
3'-CCCCATAAAAATATCCAAT~CTATTATTACCAAACAATCTCCACTCCACCCTCAAAACCCCC-S' .. npS'- C CCCT A TTTTTA T ACCTTAAffCTCilrc AT AA T U TCC TTTCTT ACACCTC ACC TCCCACTTTTCCCCC-3'
3'-CCCCATAAAAATATCCAAT~CTATTATTACCAAACAATCTCCACTCCACCCTCAAAACCCCC-S'
~ pH 10 32p5'- CCC CT A TTTTT AT ACCTTAAffCTCilrcA T A AT U TCC TTTCTT ACACC TCACCTCCCACTTTTCCCCC-3'
3~CCCCATAAAAATATCCAAT~CTATTATTACCAAACAATCTCCACTCCACCCTCAAAACCCCC-S'
Figure 10 pH dependence of 4-ClPyN and 2-ImN footprinting. Boxes represent sites bound by the compounds at pH 6.

pH 6
pH 8
-139-
2-PyN at 20 I'M
~ .... -32p5'- C GC C T AfffffT\A TAG G TT A A/TGfC"iirG AffiTT11A TGG Tff'i'Cf'i'IAG ACG TC AGG TGG CAIC'fi"'fncCGCC-3' 3'- G CG G A TI!A!.!.!JT A TCC A AT~ C T1A..I..I..!.l1 A CC ~C TCC AG TCC A CC GT1!il.AA..AIGCCC C-5' .. ... .... ..
32p5'- C GC CT AfffffT\A T A CG TT A A/TGfC"iircAffiTT11A TGG Tff'i'Cf'i'IAG ACG TC AGG TCG CAIC'fi"'fncCCCC-3' 3~GCGGA~ATCCAAT~C~ACCA~CTGCAGTCCACCGT1!il.AA..AIGCCCC-5' ... ... .... ...
32p5'- C GC C T AfffffT\A T AGG TT A A/TGfC"iirc AffiTT11A TGG Tff'i'Cf'i'IAGA CC TC A GG TGGCAIC'fi"'fncCCC G-3' 3'- G CG G A TIAA.!.A.AJT A TCC AA T~C~ ACC ~CTGC AG TCC A CCGT1!il.AA..AIGCC C C-5' ... .. ..
32p5'- CG C CT AfffffT\A T A GG T T A A/TGfC"iirG AffiTT11A TGG Tff'i'Cf'i'!Ac A CG TC ACC TGGCAIC'fi"'fncGGG G-3' 3'- GC G G A '1'\AA.!.AAlT A 'P CC A A T~C ~ ACC ~CTCC AG TCC A CC GT1!il.AA..AIGCCC C-5'
~ ~ ~ P
H 10 32p5'- C GC CT AfffffT\A TAG G TT AA/TGfC"iirGAffiTT11A TGG Tff'i'Cf'i'IAC ACG TCA GG TGGCAIC"fT"f'ncGG GG-3' 3'- G CG GA TIA.AA.A.AJT A TCC AA T~CT\A..I..I.A..l1 A CC ~CTGC AG TCC ACCG'I!aA.A.AIG CCC C-51
-- -- .. PH 6 32p 5'- C G C C T Af'f'TT'T'nA T A C CtTT A AIT1C T C AIT G AffiTT11A T GG Tff'i'Cf'i'IA C A C G TC A G G T GC C AIC'fi"'fnc G G G G-3'
3'- G C G G A 'I'\A.A.A.AAIT AT C Cl! AT~ A G !JA C T1A.I..IA.IIT A C C ~ C T G C ACT C C A C C G T1!il.AA..AIG CCC C-5'
pH 8 32p 5'- c G c c T mr r; T A cgttT Am$ TC Me mllit TCG TITTcTT!Ac A c G TC A CG TG G c ~ rlim GCG G-3' 3~GCGGA ATC AT AG C ACC~CTGCACTCCACCG CCCC-~
32pS'- C GC CT AffffftlA T A cgttT A mii TC ~cmm* TCG Tff'i'Cf'i'IACACCTC ACCTCCCAIC'fi"'fncCC C C-3' 3'- CCGGA T1.U..A..AA/TATC AT AC C ACC~CTCCACTCCACCCT1!il.AA..AIGCCCC-5'
=..,--,;~-~":'1 --H 10 32 p5'- CCC CT AffffftlA T A GGfrT UITIC TC Atrc Affi"iTllA TCC Tff'i'Cf'i'IACACC TCACC TCCCAIC'fi"'fncCCCC-3' P 3'- CCC C A T1.U..A..AA/T AT C Cl! AT~ AC !JA C ~A CC ~C T G C ACT C C A C C C1ti..AA..A.AIC CCC C-5'
Figure 11 pH dependence of 2-PyN and 4-Me2 NPyN footprinting. Boxes represent sites bound by the compounds at pH 6.
-140-
As expected, all four compounds protect fewer sites at high pH. TGTCA site
complexes are stable over the entire pH range for all compounds. 2-PyN and 4-
ClPyN complexes are also reasonably stable. One binding site is not detected at
pH 8 and another is very weakly protected at pH 10. The protection pattern of
4-Me2NPyN changes markedly with pH. Below pH 8, 6 sites are bound, including
the TTAAT site that is not bound by 2-PyN at this concentration. At pH 8,
the same 4 sites bound by 2-PyN are protected. Above pH 8, only two sites are
detected, one of them the TGTCA site. At pH 9, there is no detectable footprint
at the TTTTT site, unlike both 2-PyN and 4-ClPyN. Thus, it is likely that the
originally measured specificity corresponds to the protonated form. At higher pH,
4-Me2NPyN is more specific for the TGTCA site than 2-PyN, as expected from
the original hydrogen bonding argument.
Length Dependence of WGWCW Site Specificity
Studies of a series of polypyrrole analogs of distamycin A have shown that
the binding site size increases incrementally with the number of pyrroles, while the
A, T specificity of the molecules remains in force. 17 This has been formulated as the
n+1 rule, where n+1 A,T bp are recognized by n amides on the small molecule.
If 2-Im.N binds at the TGTCA site in the distamycin-like conformation, then the
same trend should hold. In contrast, the model proposed in chapter 2 predicts that
analogs containing two aromatic rings should have no TGTCA site affinity, and

-141-
that longer analogs should have potential for recognizing larger distances between
G,C bp.
In order to examine the susceptability of WGWCW sequence binding to vari
ations in small molecule length and number of amides, the series of compounds
shown in figure 12 has been synthesized. All compounds are readily available
from the appropriate nitroamine precursors by the standard reduction and cou
pling sequence. 16 Synthesis of AclmN requires the 4-nitro-1-methylimidazole-2-
carboxylic acid 25, which can be prepared by the literature method 113 as shown in
scheme 3. After coupling of 25, the nitro group is reduced and acetylated to give
AclmN. The specificity of one of the compounds in this series (iv in chapter 1) has
been reported to be solely A,T ,65 and therefore is not examined further here.
As shown in table 1, these compounds constitute two series with incremental
variations. The footprinting gel of these compounds is shown in figure 13, and
the derived histograms are shown in figures 14 and 15. The series containing only
pyrrole rings behaves as expected. There appears to be only a small increase in
binding affinity associated with the attachment of the third pyrrole ring in 2-PrN.
This is consistent with the affinity of the complex being determined by the amide
hydrogen bonds.
The imidazole-containing series shows a more variable selectivity. 2-ImP binds
only A,T rich sites as predicted by the WGWCW binding model. Binding affinities
are low, consistent with the lack of amides and the disfavoring of A,T sites by the

-142-
I \
I /N\ /N\.., /N\ HN~
H~ H~ ~ N/
'7 N..- -'7 N_..
H~:-HN
HN iNO-;60- HN HN
HN-d:-0
HN 0:0 }==o ~0
N 2-PrN D
\ \ I /N\.., /N~ 0
I /N\ HN~{ -N\ HN~
H~ ~ N/ '/ N ~
_...,
~0 '7 N..-
H~ ~ N- HN ~:- ~ N/
- ;!;a_ --HN HN
N/0 HN J!-0 HN
N=(=o ~N-
N~o HN~N......._ HN
~N'- ~0 (:0o N
'\.
2-IrnP 2-ImN AclmN 2-ImD
Figure 12 Variable Length Analogs of 2-ImN.

-143-
I o N. Jl ............... f_( ~0 NaOH
24 22% 25 80 %
Scheme 3 Synthesis of 1-methylimidazole-2-carboxylic acids.
Table 1 Expected Site Sizes for Variable Length Analogs.
Compound Aromatic Rings Ami des Site Size3
N 2 3 4 2-PrN 3 3 5
D 3 4 5
2-ImP 2 2 4 HCOimP, ivb 2 3 4
2-ImN 3 3 5 AclmN 3 4 5 2-ImD 4 4 6
a Based on the number of aromatic rings. b See chapter 1.
imidazole ring. AclmN does not bind detectably to the TGTCA site even at 50 J.LM.
It binds A,T sites with roughly the same affinity as 2-PrN. Thus the addition of
a single amide to 2-ImN has two significant effects. The fourth amide counteracts
the disfavoring of A,T sites by the imidazole ring, and disfavors WGWCW binding.
If the 2-ImN binding conformation is similar to distamycin A, this is difficult to
explain. If 2-ImN is binding so that the amide carbonyl faces inward, then the lack
of TGTCA site binding could be due to close contacts between the extra amide

-144-
Figure 13 Footprinting of varying length D and 2-lmN derivatives. Autoradio
gram of an 8% denaturing polyacrylamide gel. All reactions contain 4 mM DTT,
100 J,LM-bp calf thymus DNA, and 12 kcpm 3' labeled 517 bp restriction fragment
in 40 mM Tris·acetate pH 7.9 buffer. Lane 1, intact DNA; lane 2, G reaction;80
lane 3, A reaction;81 lanes 4-22 contain 4 J.LM MPE·Fe(II): lane 4, MPE·Fe(II)
standard lanes 5-7 contain 35 J.LM, 10 J.LM, and 1 J,LM N respectively; lanes 8-10,
35 J,LM, 10 J,LM, and 1 J,LM 2-PrN respectively; lanes 11-13, 5 J,LM, 2 J.LM, and 1 J,LM D
respectively; lanes 14-16, 50 J.LM, 35 J.LM, and 10 J,LM 2-PrN respectively; lanes 17-
19, 35 J,LM, 10 J,LM, and 1 J,LM 2-ImN respectively; lanes 2Q-22, 35 J,LM, 10 J.LM ,
and 1 J.LM AclmN respectively; lanes 23-25, 35 J,LM, 10 J,LM, and 1 J.LM 2-ImD
respectively.

-145-
z a.. z z 0 0
..... E E E E a.. ..... I I I 0 I - z C\1 0 C\1 C\1 < C\1 c
~ 0 ()C) < II II I I II 1 2 3 4 5 6 7 8 9 1 0 11 12 13 14 15 16 17 18 19 20 21 22 23 24 25
-

-146-
Nat 10 I'M
..... 5 ... 32p5'- C G C CT A TT TT T A GG TT AA TG TC A TG A TfA1"'fi1JTGG TTTCTT AGACG TC A GG TGG CAIC"ff"f'ncG GGG-3'
3~GC GGA AAAAATATCCAATTACAGTACTA~CCAAAGAATCTGCAGTCCACCG~CCCC-~ ... - .. 2-PrN at 10 I'M
~ ..... 32p5'- CGC CT mrrn~ T AGGfi"T'i"ATAGTC A TG ~ TGG TTTCTT AGACG TCAGG TGGCAIC"ff"f'ncGGGG-3'
3'- GCG GA A A A A TCCI!.!.l.I.AJC AG T AC 'I1A.l.IA..llT ACC AAAGAA TCTGC AG TCCACC G~CCCC-5' .... -- ~ .. .... ..... ..
32p5'- CGC CT mr rrm T AGG TT AA TG TC A TGA Tii'ITi1JTGG TTTCTT AGACGTC AGGTGGC~GGGG-3' 3~GCGGA A A ATCCAATTACAGTACTA~CCAAAGAATCTGCAGTCCACCG~CCCC-~ a ... ._
Figure 14 Footprinting of the distamycin A series.
and the bases.
Like 2-ImN, 2-ImD also shows altered sequence specificity. As predicted by
the n+1 rule, 2-ImD binds to 6 bp sites. 2-ImD also binds A,T rich sequences
better than 2-ImN. As with AclmN, the addition of another amide appears to
counteract the effect of the imidazole ring. At 10 ~M, this compound protects
an extended region on the 517 bp fragment. This sequence contains the TGTCA
and TAATAA sites observed previously as well as the TCATGA site in between.
The limited resolution of this footprint precludes convincing evidence of TCATGA
site binding, but the degree of protection is much higher than normally found for

2-ImP at 50 ~M
..-. -. 3lp 5'- C G C C T Afi"f"i'T'T AT A G G rfi"ATTT<; T C A TG
3'- G C G G A TIA.A..!.AJA TAT C C AUI.A)c A G T AC ... --2-ImN at 10 ~M
•
-147-
TGG TTTCTT AGACG TC AGGTGGCACTTTTC GGGG-3' ACCAAAGAATCTGCAGTCCACCGTGAAAAGCCCC-~
3lp5'- CCC CT A TTTTT AT A GG TTA~C AT A AT AA TCGTTTCTT AGACC TCAGG TGGCACTTTTCGGGG-3' 3~GCGGATAAAAATATCCAAT~CTATTATTACCAAAGAATCTGCACTCCACCGTGAAAAGCCCC-~ a
AcimN at lO ~M
2-ImD at 35 ~M
...... ~ 3lp5'- C GC CT mTTTTm AGGTT AATG TC A TC AT AA T AA TGGUTTCTmGACGlJg AGG TGCgj§CTTTlJgGGGC-3'
3'- GCG GA AAAA TCCAA TTACAG TACTA TT ATTACC AACA CTCC TCCACC GAAA CCCC-5' ... _......... ..... 2-ImD at 10 ~M
ACGTGGCACTTTTCGGGG-~ T CC A CC G TCAAAA CCC C C-5'
Figure 15 Footprinting of the 2-ImN series on bp 4268-4335 of pBR322.
-148-
the other compounds studied. In addition, 2-lmD binds to a AGACGT sequence
farther up on the 517 bp fragment . These observations suggest that 2-ImD can
recognize sequences with longer distances between the G,C bp.
Car boxy terminal Derivatives
To gather a final set of information about the WGWCW complex, a series of
C-terminal 2-PyN and 2-lmN analogs has been synthesized. Compounds in this
series , as shown in figure 16, have an additional atom between the amide carbonyl
and the heterocyclic nitrogen. As a consequence, the L shape of the carbonyl-in
conformation of the N-terminal analog does not occur for the same conformation
at the C-terminus. An extra atom between partners will also necessarily alter the
geometry of the hydrogen bonds.
The synthesis of the first three compounds in figure 16 is shown in scheme 4 .
Acylation of 2-aminopyridines is difficult, but could be accomplished in reflux
ing pyridine following literature precedent. 130 2-Amino-1-methylimidazole can be
prepared by the method of Lawson, 131 and is acylated under the same condi
tions. Compound 30 could then be N-methylated using the standard method.124
Elaboration of these compounds to the distamycin analogs uses the standard re
duction/ amide coupling sequence.76
Placement of an aromatic ring at each end of the netropsin unit requires
another position for the positive charge. The synthesis of a postively charged
derivative of the nitropyrrole building block 38 and its incorporation into the final

01 N~
HeN 0 7 N--
HN
HN L-~ to NPy
Nirn
-149-
" ~
~ N~
-eN 0
7 N--HN
HN L-~
to NMePy
01 N~
HeN 0 7 N--
HN
HN,O~ N-
O I
Figure 16 C-terminal 2-PyN and 2-ImN analogs.

-150-
0~ l ) H2NCN
/~~0~-----2) HCI
CAr o
N--
29 Ar = ImNH 30 Ar = PyNH 31 Ar = PyNMe
1) H2, Pd/C
28 16%
30 86%
CAr o
N--
32 Ar = ImNH 12 % 33 Ar = Py NH 43 % 34 Ar = PyNMe 57%
Mel
KOH
1) H2, Pd/C
!==\ NyN-
HCN 0
7 N--02N
29 85%
31 65 %
ACrN 0
7 N--HN
2) M~GABA, J60 Im2CO
: N-
HN
44% t oNim
NPy 52 % NMePy 25%
Scheme 4 Synthesis of simple C-terminal analogs of 2-PyN and 2-ImN.

Na 0 0
HVH N02
35
1) 0 H 0
HCI•H2N._,)lo""- ((N~OEt
NaOH j-!1 02N
2) EtOH, H2S04
36 27%
{) )l 1) H2, Pd/C
2) DCC, HOBt
K2C03, Nal
CI~N/ I
NaOH
f)
c:HN O
:;;.-"'
-HN
l-HN 0 + 'l(ro OH
~ !J -N 02N °2 o2N~~
30 38 -100%
39 64%
N/
Scheme 5 Synthesis of PyP+PPy.
I /N\ 0 ((N~OEt J-11
0 2N
37 82%
1) H2, Pd/C
~ N'f HeN 0
~ N--HN Z) CDI, PicOH yo £N~
CN~o t-v
PyP+PPy 47 %
I 1-' c.n 1-' I

-152-
compound PyP+PPy is shown in scheme 5. Compound 36 is prepared by the liter
ature procedure, 132 then alkylated by the procedure developed in the group by Sam
Gellman. 133 Coupling to the previous precursor 30 follows standard procedures.
The footprinting gel with these compounds is shown in figure 17. Histograms
are collected in figure 18. Neither Nlm nor NMePy exhibit any detectable bind
ing to the TGTCA site. Both NPy and PyP+PPy bind to the TGTCA site, but
have lower specificities than 2-PyN. PyP+PPy also has substantially lower bind
ing affinities to all sites, giving no detectable footprints at 10 J.LM . Like 2-ImD,
PyP+PPy recognizes the AGACG site.
The lower specificity of NPy is probably not due to protonation, becausesince
the pKa of 2-benzamidopyridine is 3.3.134 Clearly, separation of the amide carbonyl
and the heterocycle by one atom does not prevent WGWCW sequence binding as
does a one atom separation along the pyridine ring. As in the previous cases, the
lower specificity is produced by an increased affinity for A,T sites.
The lower specificity of PyP+PPy could be due solely to a lower binding con
stant at the TGTCA site. There are several possible explanations. The positive
charge on PyP+PPy is not at the bottom of the groove where the largest negative
electrostatic potential is calculated to be. 135 Alternatively, the distance between
the two pyridine rings may not allow for simultaneous interactions with the DNA.
The second aromatic ring would then tend to disfavor WGWCW sites in the same
way that 2-PyN disfavors A,T sites . This second interpretation is supported by

-153-
Figure 17 Footprinting of C-terminal analogs of 2-PyN and 2-ImN. Autoradio
gram of an 8% denaturing polyacrylamide gel. All reactions contain 4 mM DTT,
100 J..LM-bp calf thymus DNA, and 12 kcpm 5' labeled 517 bp restriction fragment
in 40 mM Tris·acetate pH 7.9 buffer. Lane 1, intact DNA; lane 2, G reaction;80
lane 3, A reaction;81 lanes 4-25 contain 4 J,.LM MPE·Fe(II): lane 4, MPE·Fe(II)
standard; lane 54 J,.LM D; lane 6, 20 J,.LM 2-PyN; lane 6, 20 J,.LM 2-ImN; lanes 8-10
contain 35 J,.LM, 10 J,.LM, and 1 J,.LM 3-PyN respectively; lanes 11-13, 35 J,.LM, 10 J,.LM,
and 1 J,.LM 4-PyN respectively; lanes 14-16, 35 J,.LM, 10 J,.LM, and 1 J..LM NPy respec
tively; lanes 17-19, 35 J,.LM, 10 J,.LM, and 1 J..LM NMePy respectively; lanes 20-22,
50 J,.LM, 35 J,.LM, and 10 J..LM PyP+PPy respectively; and lanes 23-25, 35 J,.LM, 10 J,.LM,
and 1 J,.LM Nlm respectively.

-154-
1 2 3 4 5 6 7 8 9 10 11 12 13 14 15 16 17 18 19 20 21 22 23 24 25

-155-
D at 2 ISM .... .... .. 32p5:- C GCCT Afi"f'ffTTA T AGG TT H TG TCA TGA T1Ai'fTI!TGGTTTCTT AGACG TC AGG TGGC~GCCC-3' 3-GCCGA~ATCCAATTACAGTACTA~CCAAACAATCTCCACTCCACCC~CCCC~' a ._. llllllr
2-ImN at 10 ISM
32p5'- C GCCT A TTTTT AT ACG TTA J~GCCGATAAAAATATCCAAT
NPy at 10 ISM
NMePy at 10 ~SM
CATAATAATCGTTTCTTACACGTCAGCTCCCACTTTTCCCCG-~ CTATTATTACCAAACAATCTGCAGTCCACCGTCAAAACCCCC-~
.A .... .. 32p5'- C G C CT Aff'i"'f'T'nA T A CGfffi"iTic TC A TCA T1Ai'fTI!Tcc T TTC TT AG ACC TC AGC TCCC~CCCC-3' 3~GCCGA~ATCC~ACTACTA~CCAAACAATCTCCACTCCACCG~CCCC~' .. .... .. ... Nim at 10 ISM ... .... ..
32p5'- CCCCT ~ T ACCTTAA TCTC ATCA Tli'i'fi'iJTCCTTTCTT ACACCTCACCTCCC~CCCC-3' J~CCGCA~ATCCAATTACACTACTA~CCAAACAATCTCCACTCCACCC~CCCC~' .. - .... PyP+ PPy at 35 ~SM
upS'- CCC CT ~nt TA O.A TC A omift TOOTTTCTn:gi'mcA OOTOOC lli' 0000-3' 3'- GCCCA ATC AC C ACCAAACA CTCCACCC CCC"C~' IJIIIII ... .... Figure 18 MPE·Fe(II) protection patterns of the C-terminal analogs of 2-PyN
and 2-l.mN.

-156-
presence of the AGACG binding site. It is possible that this compound could hy
drogen bond with 3 G's, the first two exactly as in the 2-lmN complex, with the
third G being picked up by the second pyridine nitrogen. Such a complex is pre
dicted to show a strong orientation preference with the affinity cleaving derivative .
The behavior of Nlm is also puzzling. Although this compound should be able
to bind to WGWCW sequences, it does not. UV-visible spectra show no change
between pH 5 and pH 11, thus it is unlikely that a protonation event is responsible
for the A,T preference.
Methylation of the C-terminal amide is predicted to limit substantially the
number of conformations available to NPy. From CPK and molecular modeling, 9 3
all trans me thy 1 amide conformations are strongly disfavored by contacts between
the amide methyl and the pyrrole ring. However, no such conformation can be fitted
into a normal B DNA minor groove. The lowest energy conformers of NMePy that
can fit apparently give A,T specificity.
Chemical Evidence for a Binding Conformation
From all of the compounds studied, some general conclusions can be drawn.
The minimum requirement for WGWCW sequence binding is a heterocyclic nitro
gen attached to two pyrrole rings. The nitrogen atom must be next to the amide,
and better results are achieved when the carbonyl is directly attached to the hete
rocycle. The factors that determine 2-lmN like specificity are relatively weak, and

-157-
can easily be overwhelmed by other effects. It is instructive that only one com
pound, 2-ImN, binds only WGWCW sequences. Because the overall specificity of
this class of compounds relies on the disfavoring of the normal binding sites, longer
derivatives should show further decreases in specificity unless the imidazole to pyr
role ratio can be increased. At present, the imidazole must cap the N terminus of
the polypyrrole subunit. To recognize more G's (i.e., a TGACTCA site), it will
be necessary to develop an imidazole linkage that can be used in the middle of a
pyrrole chain.
The binding constant at WGWCW sites also seems to be independent of
compound structure. Only one analog binds significantly more strongly than 2-
PyN or 2-ImN. It might be possible to increase the binding constant by increasing
the number of positive charges on the small molecule, but even simple electrostatic
interactions appear to lower the binding specificity.65• 135 If WGWCW binding
is actually dominated by two hydrogen bonds, as the model suggests, than the
best way to increase binding would be to increase the number of G's recognized.
Again, this requires the development of a middle chain imidazole derivative with
the proper specificity.
A recurring theme of this entire investigation is that simple substitutions lead
to far-reaching consequences. Conservative changes of 2-PyN and 2-ImN have
led to compounds that do not bind to DNA, compounds that prefer new mixed
G,C, A,T sites, and compounds that revert to distamycin A specificity. The four
-158-
simplest compounds have a WGWCW sequence preference decreasing in the order
2-lmN > 2-PyN > NPy > Nlm. However, it is clear that WGWCW sequence
binding is characteristic of a family of synthetic compounds with varied structure.
From this database, it should be possible to design similar molecules with good
potential for complexation to other G,C-containing sites. A key problem with
this class of compounds is the basicity of the final products. A protonation event
at near neutral pH can easily shift a G,C binding molecule to an A,T binder.
Fortunately, an analog with a pKa near 7 is usually detected by the broad peaks
of its 1 H NMR spectrum. To minimize this effect, the best choices are to use
either 2-carboxyimidazole or pyrimidine rings for G recognition. Both have pK3 s
significantly below biologically relevant pH. Some potential targets that incorporate
these design principles are shown in appendix C. The success of these designs would
show that it is possible to use the specificity found in 2-ImN to complex to sequences
in a rational manner. Judging from progress to date, however, it would seem that
there are many surprises still waiting to be discovered.
Lastly, evidence for a particular 2-lmN conformation in the WG WCW complex
is equivocal. The behavior of 3-MeOPyN and CycN favors models that use the
crescent-shaped carbonyl-out conformations. In contrast, the data from AclmN
and 2-ImD suggests that the carbonyl-in conformers that place a bend in the
small molecule could be correct. There is no chemical evidence that addresses the
possibility of dimer formation at the TGTCA site. There is also little evidence

-159-
for the amide conformation at the C-terminus of the pyrrole r ings, although the
behavior of PyP+PPy slightly favors the carbonyl-in form.
It will take more direct observations to establish the details of t he 2-
ImN / TGTCA complex. With the specificity of 2-ImN firmly in hand, it should
be possible to study the major DNA complex by physical techniques. 1H NMR
has been used with similar compounds to determine complex structure.72 In this
particular case, the analysis will almost certainly be complicated by the near C2
symmetry of the binding site, and the asymmetry of 2-ImN. At saturation binding,
there will be equal amounts of two diastereomeric complexes that differ from one
another only in the orientation of 2-lmN with respect to the A,T bp. This will lead
to four nonequivalent but closely related strands to be deconvoluted.72 However,
a minor groove dimer would be readily detected and might increase the symmetry
of the complex. Better options are probably X-ray crystallography or resonance
Raman, but degenerate orientations could still create serious difficulties.
A potential solution is shown in scheme 6. ImP+P+Im is completely C2 sym
met rical, and computer modeling indicates that there is potential for interaction
with symmetric sites with sequence TGATCA. This compound has been synthe
sized from 1-methylimidazole-2-carboxylic acid , 36 and 1,2-diaminoethane, as
shown in scheme 6. At present, little is known about its DNA binding specificity.
Jmp+p+Jm does not bind well to the 517 bp fragment, but then the predicted site
does not occur. Future experiments , especially with an affinity cleaving derivative ,
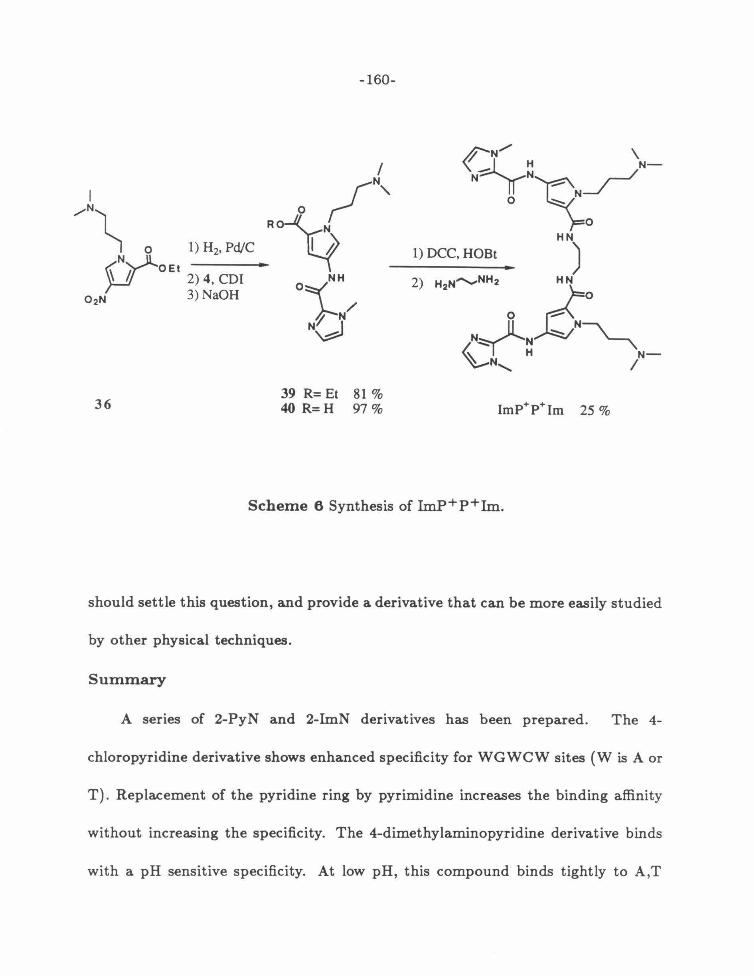
I ,..-N\ o 1) H2, Pd/C
OEt 2) 4, CDI
02N 3) NaOH
36
-160-
39 R= Et 81% 40 R= H 97%
1) DCC, HOBt
Scheme 6 Synthesis of Im.P+p+Im..
should settle this question, and provide a derivative that can be more easily studied
by other physical techniques.
Summary
A series of 2-PyN and 2-Im.N derivatives has been prepared. The 4-
chloropyridine derivative shows enhanced specificity for WGWCW sites (W is A or
T). Replacement of the pyridine ring by pyrimidine increases the binding affinity
without increasing the specificity. The 4-dimethylaminopyridine derivative binds
with a pH sensitive specificity. At low pH, this compound binds tightly to A,T

-161-
rich sites. At high pH, the same compound binds most tightly to the TGTCA
site. The 3-methoxypyridine derivative binds weakly to DNA. A bicyclic imidazole
derivative binds only A,T sites.
Shorter analogs of 2-ImN do not bind the TGTCA sequence. The 4-acetamido
derivative of 2-ImN also does not bind this site. An analog containing one imi
dazole ring and three pyrrole rings appears to bind the TGTCA site, but other
G,C-containing binding sites are also observed. All of these analogs consist of a
heterocyclic ring at the N-terminus of a polypyrrole subunit. Derivatives have
also been prepared with a heterocyclic ring at the C-terrninus. The C-terminal
pyridine compound binds to the TGTCA site with lower specificity than 2-PyN.
The imidazole compound binds only A,T rich sites. An N-methylarnide pyridine
compound binds solely to A,T sites. A compound with pyridine rings at both the
N- and C-termini does bind the TGTCA site with lower affinity, as well as a three
G-containing site. The only required structure for WGWCW sequence binding is
the presence a heterocyclic nitrogen next to a carboxamide.

-162-
Chapter 5
Biological Implications of WGWCW Sequence Binding

-163-
As shown in the previous chapters, the key requirement for WGWCW sequence
complexation is the imidazole or pyridine nitrogen. With a one atom C-+N change,
the specificity changes from A,T to WGWCW. It appears that WGWCW sequences
have a unique conformation that allows for ready recognition by the small molecule.
As nature tends to utilize recognizable structural features as control elements, 136
it seems likely that WGWCW sequences would also be complexed by proteins.
A literature search reveals that this is indeed true, with a WGWCW sequence
present in the consensus recognition sequence TGACTCA of both the eukaryotic
transcriptional activator GCN4 and the AP-1 family of eukaryotic transcriptional
activators/ oncogenes.
Background
GCN4
Under conditions of amino acid starvation, GCN4 activates the de novo synthe
sis of new amino acids by increasing transcription at the appropriate genes. 137 • 138
Deletion mutants of the 281 aa protein show that DNA binding is localized in
the 60 aa terminal region.139 GCN4 binds as a nonexchangeable dimer, with each
monomer presumably binding specifically to half of the pseudosymmetric recogni
tion site. 140 Activation occurs in both orientations of the binding site, 139 and is
mediated by a 19 aa region that is highly negatively charged. 141

-164-
Table 1 Effect of single mutations on the binding of GCN4 at his9.
Activity3
Increased
Wild type
Unchanged
Decreased
No Detectable Activity
Sequence
A
GGATGACTCTTTTTTTTT
CG A A G T
c A AG G G T
AACAA GC CCGGC GTTTG
a Activity measured by resistance to aminotriazole and GCN4 binding ability.
The binding properties of GCN4 are quite similar to those of 2-ImN. The
protein gives a 9 bp footprint at its binding site, 159 much smaller than a helix-turn-
helix dimer (~ 28 bp). Saturation mutagenesis in the his9 promoter region reveals
that the TGACT sequence is required for strong binding. 146 As shown in table 1,
additional bp give weaker effects, resulting in a TGACTCA consensus sequence
for high affinity sites. A survey of a number of amino acid gene promoter regions
reveals a similar pattern.146 Like 2-ImN, A,T bp are usually present adjacent to
the foot printed sequence (see tables 2 and 3).
AP-1
AP-1 is a family of related proteins that also appear to be transcriptional
activators. There are at least four different species that bind to AP-1 like recog-

-165-
Table 2 Sequences similar to the his9 GCN4 binding site found in other GCN4 inducible promoter regions.
Gene
arg9 arg~
cpa1 cpa2 his1 his1 his9 his~ hisS ils1 ilv1 ilv2
leu1 lw9 leu~
trp2 trp9
Sequence
Class I
GTCGTGACTCATATG TGAATGACTCACTTT TGTTTGACTCATCAT CGAATGACTCTTATT AGCGTGACTCTTCCC GAGGTGACTCACTTG CGGATGACTCTTTTT ACAGTGACTCACGTT CTGTTGACTCACTTC ATGATGACTCTTAAG GAGATGACTCTTTTT GCGATGATTCATTTC TAGATGACTCAGTTT CATATGACTCACAAC TAAGTGACTCAGTTC TTGCTGACTCATTAC TCGTTGACTCATTCT
A 3 5 4 8 o o 11 o o o 12 o 4 4 o c 4 3 2 1 0 0 0 16 0 17 0 5 2 2 6
G 4 5 9 5 o 11 o o o o o 2 1 o 3
T 6 4 2 3 11 o o 1 11 o 5 10 10 11 8
rrTGACTCWYww-
Position3
-296 -189 -~88
-297b -285 -188 -1~1
-221 -206 -80
-197b -958b -908 -~29
-105 -166 -67
Ref
142
143
144
144
145
145
146
147
148
146
149
150
151
152
153
154
155
a relative position of the upstreammost bp with respect to the start codon. b
Oriented in the opposite direction.
nition sequences, with varying specificities.160 These proteins are involved in
oncogenesis, 161 the biological activity of phorbol esters, 162 and the cellular re-
sponse to growth factors. 163 The proto-oncogenes jun and fos have been shown

-166-
Table 3 Probable GCN4 binding sites similar to the SV 40 enhancer sequence.156
Gene Sequence Position a Ref
Class II
his9 T c c c T G A C T A A T G c c -299b 146 his5 G A G A T G A C T A A A c T A -276 148 his5 T T A A T G A C T A A T c c G -997 148 leu2 T T c A T G A C T A A A T G c -162 157 leu~ G c G A T G A C T A A c c T A -~26b 153 trp2 A A C A T G A C T A A A G G G -111 154 trp5 A G A A T G A C T A A T T T T -66 158
A 2 2 2 6 o o 1 o o 1 1 3 o o 2
c 0 2 3 1 0 0 0 1 0 0 0 1 3 2 2
G 2 1 2 o o 1 o o o o o o 2 2 2
T 3 2 o o 1 o o o 1 o o 3 2 3 1
---ATGACTAAw---
a relative position of the upstreammost bp with respect to the start codon. b
Oriented in the opposite direction.
to be constituents of AP-1/DNA complexes.164• 165 There is almost 50% homol-
ogy between the DNA-binding regions of jun, fos, and GCN4, and jun can ac-
tivate transcription at GCN4 sites. 141 Because the identity of AP-1 varies with
the preparation,160· 163 much less is known about the DNA specificities of these
proteins. However, a TGACT sequence is almost always present in the observed
binding sites. 165
A Cleavage Assay for Specific DNA Complexes
A recent report from the Parker group has identified a yeast equivalent of AP-
1 with similar binding properties to the mamalian proteins.159 DMS footprinting
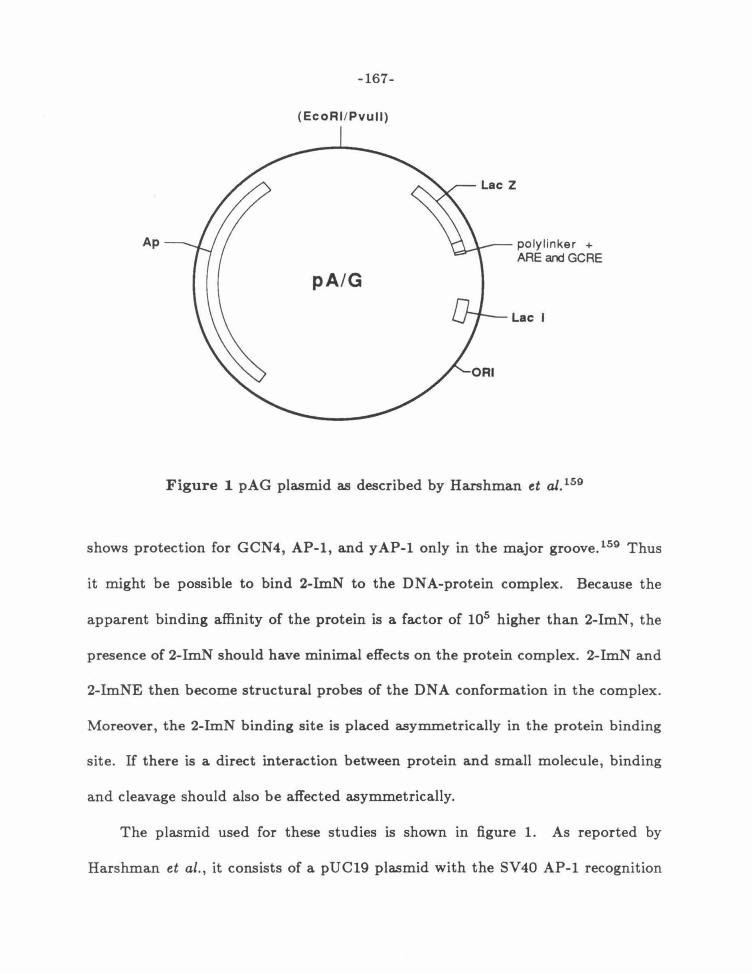
-167-
(EcoRI/Pvull)
Ap
pA/G
polylinker + ARE andGCRE
Lac I
Figure 1 pAG plasmid as described by Harshman et al. 159
shows protection for GCN4, AP-1, and yAP-1 only in the major groove. 159 Thus
it might be possible to bind 2-ImN to the DNA-protein complex. Because the
apparent binding affinity of the protein is a factor of 105 higher than 2-I.mN, the
presence of 2-ImN should have minimal effects on the protein complex. 2-ImN and
2-lmNE then become structural probes of the DNA conformation in the complex.
Moreover, the 2-ImN binding site is placed asymmetrically in the protein binding
site. If there is a direct interaction between protein and small molecule, binding
and cleavage should also be affected asymmetrically.
The plasmid used for these studies is shown in figure 1. As reported by
Harshman et al., it consists of a pUC19 plasmid with the SV40 AP-1 recognition

-168-
element (ARE) inserted into the BamH I site of the polylinker, and the his9 GCRE
inserted into the Pst I site. The EcoR I/ Pvu II restriction fragment of this plasmid
allows simultaneous examination of GCN4 and yAP-1 binding. GCN4 binds with
nearly equal affinity to both sites , whereas yAP-1 prefers the ARE by at least a
factor of 20.159
The behavior of 2-ImN and 2-ImNE in the presence of yAP-1 and GCN4
IS shown in figure 2. No attempt has been made to remove the proteins from
the reaction mixture, so that a substantial portion of the DNA exhibits altered
mobility in the protein-containing lanes. This probably could be avoided by phenol
extraction before electrophoresis. The 2-ImNE used for these experiments is only
50% as active as expected. Figure 2 is a tw~week exposure with concommitant
increase in background. This is most noticeable in the y AP-1 lanes, where a faint
purine lane is superimposed on the cleavage pattern.
Histograms of the footprinting data are shown in figure 3. 2-ImN binds specif
ically to the two protein binding sites, both of which contain the WWGWCW high
affinity consensus sequence. As expected at these binding densities, GCN4 binds
well to both sites, while yAP-1 is only detected at the ARE. Addition of 50 J.LM 2-
ImN does not prevent protein binding, and appears to increase the amount of
protection at the GCRE.
The 2-ImNE results are summarized in figure 4. Without added protein, 2-
ImNE cleavage is very similar to sites on fragments previously reported. At the

-169-
Figure 2 Interactions between 2-ImN and GCN4 or yAP-1. Autoradiogram of an
8% denaturing polyacrylamide gel. All reactions contain 4 mM DTT, 100 ttM-bp
calf thymus DNA, and 12 kcpm 5' labeled 280 bp EcoR 1/ Pvu II restriction frag
ment of plasmid pA/G159 in 40 mM Tris·acetate pH 7.9 buffer. Lane 1, intact DNA;
lane 2, G reaction;80 lane 3, A reaction;81 lanes 4-7 contain 4 ttM MPE·Fe{II):
lane 4, MPE·Fe(II) standard; lane 5 contains 50 ttM 2-ImN; lane 6, 5 binding units
of yAP-1 159 ; lane 7, 50 ttM 2-ImN and 5 units yAP-1; lanes 8-10 contain 2-ImNE
at 75 ttM, 50 ttM, and 25 ttM respectively; lanes 11-13 contain 5 units yAP-1 and
75 ttM, 50 ttM, and 25 ttM 2-ImN respectively; lanes 14-16 contain 5 binding units
GCN4 and 75 ttM, 50 ttM, and 25 ttM 2-ImNE respectively; lanes 17-20 contain
4 ttM MPE·Fe(II): lane 17 contains 5 units GCN4 and 50 ttM 2-ImN; lane 18,
5 units GCN4; lane 19, 50 ttM 2-ImN; lane 20, MPE·Fe(II) standard.

-170-
0 v 0.... UJ UJ UJ z <( z z 0 z v (.) >. E E+o.... E+z <9 0 + - <( "7 ~ + ..._ ZT"" z 0
c\J >- vz ...... Eci_ (\J (\J z c:
~ E E 8~~ 0 "7<(
(.) <9 <( 0
t\1 (\J>,(\J
1 2 3 4 5 6 7 8 9 10 11 12 13 1415 16 17 18 19 20
----

2-ImN at 50 ~M
GCN4
GCN4 + 2-Im.N
yAP-1
yAP-1 + 2-lmN
-171-
CCGG A-3' - ..... ,._,._,._.,..G G C C T -5'
Figure 3 Protection of the ARE and GCRE by 2-ImN, GCN4, and yAP-1.

-172-
2-lmNE at 75 I'M
,1!1 !ll11 1lJJJ 1lll! 32p5'- GGTTG C~A TTGAGA TCCTCT AGAGTCGACCAGA TCTAAAAA AAGIICfC1JTCCGGA-3'
3'- CCA ACGI!£li!/TT AACTCT AGGAGA TCTCAGCTGGTCT AGA TTTTTTT~GGCCT-5'
2-lmNE at 50 I'M
•!! •!~ .~l!!. ..~. 32p5'- G G TTG CffCACTl.U TTG A GA TC C TC TAG A G TC G A CC AG A TC T AA AAA AAGIICfC1JTCCGG A-3'
3'- CCAACG~T AACTCT AGGAGA TCTC AGCTGGTCTAGA TTTTTTTcttll&.IIACCCCT-5'
GCN4+2-lmNE at 75 I'M
.ll! !ll ~l! .ll! 32p5'- C C T TC CjtgAg nA A TTC A C A TC C TC T ACA C TC G A CC A C A TCT AA AA AAAGIICfC1JTC CCC A-3'
3'- CCAAC CA T A TTAACTCTACCACA TCTCAGCTCCTCTACA TTTTTTT~CCCCT-5'
GCN4+2-lmNE at 50 I'M
u~ d• .~. dU 32p5'- c c T TC c TC AC A A TTC A CA TC c TC T AC AG TCCA cc AC A TC T A AAA A AA ~*c TCNTCCC c A-3'
3~CCAACGACTGATTAACTCTAGGACATCTCACCTCCTCTAGATTTTTTT CAC ACC CC~~
yAP-1+ 2-lmNE at 75 I'M
~l~ •l!. .!lll! ~lll 32p5'- G C TTG Cfi'GACTIA AT TCA CA TC C TC T AC AC TCC A CC AC A TCT AA AAAA A GIICfC1JTCCCG A-31
3~CCAACG~TTAACTCTACCACATCTCAGCTCCTCTACATTTTTTT~ACCCCT-~
yAP-1 + 2-lmNE at 50 I'M
·~· ~·· ~!!! ·~~1. 32p5'- C G T TG cfi'GACTIA A TTG A GA TC C TC TAG AC TCC A CC AC A TC T AA AA A AA ~* grg *'TC CCC A-3' 3~CCAACC~TTAACTCTACCACATCTCACCTCCTCTACATTTTTTTC ACGCCT-~
Figure 4 2-ImNE cleavage in the presence of GCN4 and y AP-1. Arrows represent the maximum density of 2-lmNE cleavage bands. Bars represent the protein footprints from reference 159 and figure 3.

-173-
GCRE, there appears to be a small orientation preference, with better cleavage
at the AAAAAAA end of the site. Cleavage is much diminished at 50 J.t.M, and
nonexistent at 25 J.t.M. Addition of 5 binding units of yAP-1 to the affinity cleav
ing reactions gives an identical cleavage pattern at the GCRE, but substantially
reduces cleavage at the ARE. The shape of the cleavage patterns remains the same
in the presence of the protein. Therefore yAP-1 inhibits 2-ImNE cleavage symmet
rically at its binding site. Addition of GCN4 produces completely different results .
The cleavage pattern at the 5' end of the GCRE sharpens considerably, but the
overall cleavage efficiency is only slightly lower at either site. In both cases, the
inhibition of MPE·Fe(II) cleavage is much greater than the inhibition of 2-ImNE
cleavage. This implies that 2-ImN and the proteins are binding simultaneously to
the same binding site from opposite grooves. Thus the DNA conformation found
in the GCN~ complex is identical, (within experimental error} to that found in the
2-ImN complex.
The altered pattern at the GCRE cannot be due simply to a change in orien
tation preference, because the amount of cleavage at the 3' end of the site remains
essentially constant, and cleavage at the first two bands of the 5' end is close to the
level seen without GCN4. Instead, the missing cleavage maps exactly to the end of
the poly A stretch. MPE·Fe(II) also shows enhanced protection over the complete
homopolymer A sequence. This effect is seen in a region where there is relatively
low homology between GCN4 binding sites, which argues against direct protection

-174-
by the protein. Instead it suggests that the region undergoes a conformational
change upon GCN4 binding.
It is well known that runs of homopolymer A exhibit altered structure
m the solid phase, 87 and a decreased susceptibility to oxidative cleavage in
solution. 166•
167 Recently, Klug and co-workers have solved the structure of a B
DNA dodecamer containing an AAAAAA sequence.87 In the crystal, the A,T bp
are propeller twisted by an average of 20° with almost no tilt or roll between bp.
This allows for maximum stacking between the bases. The minor groove is consid
erably narrower (9.5 A) than expected for random sequence DNA (11 A).94 A key
feature is the presence of interbase-pair bifurcated hydrogen bonds, which appear
to stabilize the highly twisted conformation. The presence of an AAA sequence
is the minimum structural requirement, with only the interior bp capable of bi
furcation. This same feature has also been observed in the A,T sequence of the
distamycin A-DNA cocrystal.20 In solution, Tulius has shown that stretches of A's
longer than three bp show diminished cleavage when treated with EDTA·Fe(II),
presumably an effect of the narrower minor groove. 166 The effect is strongest at
the 3' end of the stretch of A's, which would place the most altered structure di
rectly adjacent to the GCN4 site. A reasonable hypothesis is that the presence
of the poly(dA) ·poly(dT) sequence at the GCRE increases the GCN4 affinity by
favoring a more propeller twisted complex. GCN4 binding would in turn favor the
bifurcated conformation of the poly A segment by increasing the propeller twist of
adjacent bp.

-175-
This hypothesis is also supported by the biological evidence. The stretch of
A 's is not well conserved over GCN4 binding sites, consistent with an indirect role
in complexation (table 1). At his9, presence of at least three T 's to the 5' of the
binding site is necessary to increase GCN4 binding and his9 transcription levels.
Presence of more than 6 T's gives no further increase in binding or transcription, 146
the expected result if a stable altered conformation has been reached. A similar
role for A, T bp has been observed in the 434 repressor crystal structure. 97 The
central A,T bases of the DNA sequence do not contact the protein directly, yet
they are highly twisted and appear to form a very similar bifurcated array. This
allows the protein to maximize dimer interactions. At the center of this region,
the minor groove is only 9 A wide, similar to the Klug DNA structure. G ,C bp
present in this region are highly propeller twisted, unlike the G ,C bp at the ends
of the binding site.
Differences between the effects of y AP-1 and GCN4 on 2-ImNE cleavage could
be due to a number of factors. It is unlikely that y AP-1 directly blocks 2-ImN bind
ing, because the cleavage inhibition is symmetric over the binding site. However,
either a complex with a different DNA conformation or a simple electrostatic ef
fect, where yAP-1 neutralizes the DNA negative potential more effectively than
GCN4, would satisfactorily explain the differences. To be able to evaluate these
possibilities, it is necessary to consider the structure of these proteins and their
DNA complexes in more detail.

~ ····a ~ ~
GCN4 Pro Ser Ser Asp Pro Ala Ala Leu Lys Arg ~ e e e • ~ • yAP- 1 Lys Gln Asp Leu Asp Pro Glu Thr Lys Gln Lys ArgiThr
~ e Ala Arg Asn Thr Glu Ala ....• ~
Ala Gln Asn Arg Ala Ala Gln Arg Ala Phe e e • • e • ~ ~ • • ····a
C-JUn Met Glu Ser Gln Glu Arg Ile Lys Ala Glu Arg Lys Arg Met Arg Asn Arg Ile Ala Ala Ser Lys Cys e e e • • e • • • jun-B Met Glu Asp Gln Glu Arg Ile Lys Val Glu Arg Lys Arg
. . ~
Leu Arg Asn Arg Leu Ala Ala Thr Lys Cys e e e e • • • • • v-fo s Pro Glu Glu Glu Glu Lys Arg Arg Ile ~~'- Arg
e • • ~ Glu Arg Asn ~Y.~ Net Ala Ala Ala ~Y.~ Cys
GCN4 Arg Ala Arg Lys Leu Gln Arg Net Lys Gln Leu Glu Asp Lys Val Glu Glu Leu Leu Ser Lys Asn Tyr His~ • • • ·· ··•·· ····· • e e • e eEl • ······ [""!
yAP- 1 IArg Glu Arg Lys Glu Arg Lys Net Lys Glu Leu Glu Lys Lys Val Gln Ser Leu Glu Ser Ile Gln Gln Gln :Asn : • eee e • • • e e • • e ..
C-JUn
jun-B
v-fos
GCN4
yAP-1
C-JUn
jun-B
v-fo s
• • • • e • • e e • • • Arg Lys Arg Lys Leu Glu Arg Ile Ala Arg Leu Glu Glu Lys Val Lys Thr Leu Lys • • • • e • • e e • • • e Arg Lys Arg Lys Leu Glu Arg Ile Ala Arg Leu Glu Asp Lys Val Lys Thr Leu Lys Ala Glu ;Asn ;Ala Gly • • . • a ··· ······ ·· ·· e e e e e • ·····• ·
Arg Asn Arg ~~~ Arg Glu Leu Thr Asp Thr Leu Gln Ala Glu Thr Asp Gln Leu Glu Asp Lys Lys Ser Ala
e e • ····• • e • Glu Asn Glu Val Ala Arg Leu Lys Lys Leu Val Gly Glu Arg e e • e e • •
Glu Val Glu Ala Thr Phe Leu Arg Asp Gln Leu Ile Thr Leu Val Asn Glu Leu Lys Lys Tyr • e • • Ala Ser Thr Ala Asn Net Leu Arg Glu Gln Val Ala Gln Leu Lys Gln Lys Val Net Asn His • e • • Ser Ser Ala Ala Gly Leu Leu Arg Glu Gln Val Ala Gln Leu Lys Gln Lys Val Net Thr His
e ······ • a ····· e • e Gln Thr Glu ~~~ Ala Asn Leu Leu Lys Glu Lys Glu Lys Leu Glu Phe Ile :Leu:Ala Ala His
Figure 5 Homology comparison of proteins with known sequence which bind to the ARE . The alignment was generated by matching theN- terminal leucine of the the leucine zipper. Amino acids 217 to 281 of GCN4 , 168•169
69 to 127 of yAP- 1, 170 256 to 324 of c-jun, 171 260 to 328 of jun-B, 163 and 134 to 200 of v-fos. 172
I ....... ~ Ol I

-177-
GCN4 and AP-1 Structure
While these proteins have not been crystallized, comparisons between the
various proteins that bind the ARE site have been used to assess structure. The
putative DNA binding regions for the proteins with published sequences are shown
in figure 5. Deletion analysis has shown that this region is responsible for most of
the DNA specific contacts for GCN4,140 ;"un141 and yAP-1. 173 Given the degree
of similarity between all these proteins, this is likely to carry over to the others as
well. There appears to be no specific organization of this protein family. In GCN4
the binding domain is at the C terminus, while in y AP-1 the putative binding
domain is near the N-terminus. The proteins also vary widely in size, from GCN4
at 281 aa to y AP-1 at > 600 aa.
This family of proteins does not display significant homology to either the
helix-turn-helix or zinc finger DNA binding proteins, so that new model DNA
binding structural motif is indicated.130 All of the proteins have a 45 aa region
predicted to have high alpha helix content with a leucine at every seventh position.
Homology comparisons between this portion of GCN4, ;·un, fos, and several other
proteins led Landschulz et al. to propose a structure for this region.174 In the model,
leucines on a long alpha helix of one peptide chain interdigitate with the leucines
on the same helix of a second peptide chain to form a stable dimer, which they term
a leucine zipper (see figure 6). As proposed, the helices could be either parallel or
antiparallel and still keep the C2 symmetry seen in transcriptional activation. The
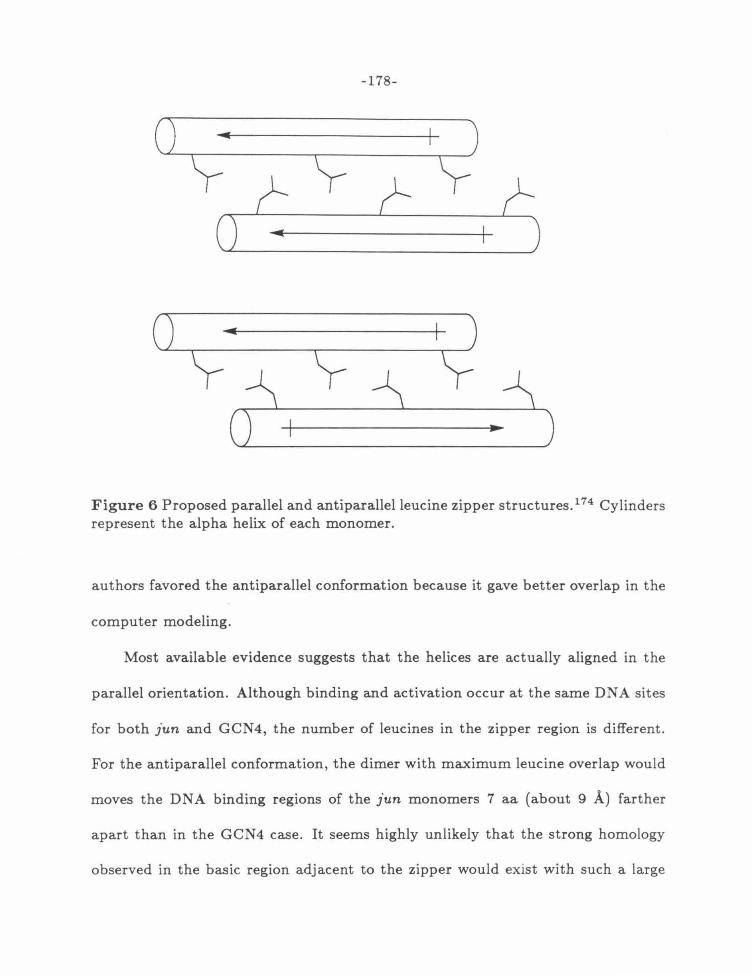
-178-
() ~ ... ----+- )
Y(-Yc-Yc () ~ ~
() ... I~ yr y ~ ~ .. ) (
Figure 6 Proposed parallel and antiparallelleucine zipper structures. 174 Cylinders represent the alpha helix of each monomer.
authors favored the antiparallel conformation because it gave better overlap in the
computer modeling.
Most available evidence suggests that the helices are actually aligned in the
parallel orientation. Although binding and activation occur at the same DNA sites
for both jun and GCN4, the number of leucines in the zipper region is different.
For the antiparallel conformation, the dimer with maximum leucine overlap would
moves the DNA binding regions of the jun monomers 7 aa (about 9 A) farther
apart than in the GCN4 case. It seems highly unlikely that the strong homology
observed in the basic region adjacent to the zipper would exist with such a large

-179-
difference in complex geometry. More importantly, the antiparallel dimer would
have no net helical dipole, whereas the parallel dimer would have a large dipole
oriented so that the positive terminus is at the DNA. Such an arrangement has been
proposed to be a major contributor to the stability of the EcoR I-DNA complex.l75
Simple Binding Model for GCN 4
The simplest binding model that explains all current data is shown in figure 7.
To take advantage of the maximum effect of the helix dipole, the leucine zipper is
shown perpendicular to the helix axis. In the dimer, the two zipper helices must
be offset by 3-4 bp from one another. H the helices continue into the DNA-binding
region, then the ends of the helix will create a three residue L-shaped pocket at
the N terminus of the helix. Computer modeling95 indicates that this structure
can fit into the major groove of B DNA with potential for specific contacts to all
the recognized bases.
The model predicts that residues forming specific contacts could be found at
3-4, 7, 1D-11, or 14 aa from the end of the leucine zipper. It is interesting that two
of the regions with the highest homology in the basic region are 7 and 10 residues
from the N-terminal leucine. The model also explains the asymmetric specificity
requirements seen in the mutagenesis experiments. Because of the offset a helix,
one monomer helix will interact head-on with the DNA sequence, while the other
will interact from the side. Thus, identical residues on identical monomers have
different positions with respect to the DNA. The actual residues involved in base

-180-
3' 5'
5' 3'
Figure 1 A Hypothetical leucine zipper DNA complex. The leucine containing alpha helices oriented parallel to each other and perpendicular to the major groove. TheN-termini are placed near the DNA by analogy to the Eco R I crystal structure. 175 The proposed complex can interact readily with 9 bp, as observed by MPE·Fe(II) footprinting. 159 2-ImN presumably binds in the minor groove at the right of the model.

-181-
contacts are not known. However, there are several highly conserved arginines
present in the basic region. Experiments are currently underway in the Parker
group to determine the specific contacts by replacing Arg by Lys using site directed
mutagenesis techniques. 173
Conformationally Isomeric Complexes?
An explanation for the difference of 2-ImNE cleavage based on electrostatic
arguments predicts that yAP-1 would be more positively charged so as to inhibit
2-ImN binding. Figure 6 shows that this is not the case. Starting with the firs t
proline shown, the basic region up to the leucine zipper has a + 10 net charge, while
the same region in y AP-1 is +8. The zipper regions of both proteins have a net - 1
charge. Overall, both proteins are quite negatively charged ( -11 for GCN4 and
- 33 for AP-1).
This leaves a change in DNA conformation as the most likely source of t he
cleavage differences. Increasing or decreasing the propeller twist would disrupt
the optimum alignment of 2-ImN and the G,C bp it recognizes. Alternatively,
decreasing the width of the minor groove would prevent 2-ImN from binding. The
evidence best fits a decrease in propeller twist in yAP-1 complexes compared to
GCN4 complexes. An increase in propeller twist or a narrower minor groove are
predicted to be favored at the GCRE, yet yAP-1 prefers the ARE by a large factor .
In addition, AP-1 binding sites that have been sequenced show an increased number
of G ,C bp outside the recognition sequence. 162• 164 Do the different proteins of t he
-182-
AP-1 family bind varying conformations of the same sequences? Future studies
with 2-ImNE and other probes might be able to answer this question.
Summary
A 2-ImN binding site is present in the consensus sequence of a family of tran
scriptional activators. Presence of 50 J.LM 2-ImN does not inhibit protein binding
for two members of this family, GCN4 and yAP-1. MPE·Fe(II) cleavage is strongly
inhibited in the presence of either protein. 2-ImNE cleavage is only slightly in
hibited by GCN4. This indicates that both protein and small molecule are bound
simultaneously by the same DNA sequence. yAP-1 inhibits 2-ImNE cleavage more
efficiently. A simple model for the DNA-protein complex is proposed.

-183-
Chapter 6
Experimental Procedures
-184-
General DNA Procedures
Reagents
All water used was distilled, filtered through an organic removal cartridge
(Corning) and redistilled. For DNA manipulations, the water and all buffers used
were autoclaved for 20 min at 160°C. Acrylamide was purchased as a 30% so
lution from National Diagnostics. To each liter was added 15 g {1.5%) N, N'
methylene-bisacrylamide. Chloroform was prepared by adding 4% amyl alcohol to
reagent grade chloroform. Recrystallized phenol was purchased from Bethesda Re
search Labs (BRL) and saturated with water. 5X TBE (acrylamide gel buffer) and
lOX TAE (agarose gel buffer) were prepared by standard methods. 176 Formamide
loading buffer was prepared by adding 100 J.LL 5X TBE to 1 mL twice recrystal
lized formamide containing 0.1% bromophenol blue and 0.1% xylene cyanol. Ficoll
loading buffer was prepared by dissolving 12.5 g Ficoll in 100 mL water containing
0.25% bromophenol blue and 0.1% xylene cyanol. All other reagents were used as
received.
Calf thymus DNA was sonicated for 1 min and extracted with equal volumes of
phenol, 1:1 phenol:chloroform, chloroform, and butanol twice. The solution was ex
haustively dialyzed against water and diluted to 1 mM-bp. Sigma type XX tRNA,
was deproteinized by extraction with phenol, 1:1 phenol:chloroform, chloroform,
and butanol twice, and diluted to 1 mg/mL. Poly( dG) ·poly( dC) from Boehringer
Mannheim (25 AU) was dissolved in 5 mL water over 20 min with sonication

-185-
(cleaning bath), extracted with phenol, 1:1 phenol:chloroform, chloroform, and
butanol 5 times, and lyophilized to 1 mL. The solution was diluted to 500 J.LM-bp
with 5 min sonication (cleaning bath).
Plasmid pBR322 was grown in HB101 cells and purified by CsCl gradient.17 6
Plasmid pAG, a pUC19 derived plasmid containing the his9 GCN4 binding
site and the SV40 ARE AP-1 binding site; GCN4, purified by phosphocellu
lose chromatography; and yAP-1, purified by ion exchange and DNA affinity
chromatography, 159 were gifts of K . Harshman. 32P labeled nucleotides were pur
chased from Amersham. Restriction endonucleases were purchased from New Eng
land Biolabs and Boehringer-Mannheim. Calf alkaline phosphatase, DNA poly
merase I, Klenow fragment and T4 polynucleotide kinase were purchased from
Boehringer-Mannheim.
Concentrations of all compounds studied were determined by UV. Mg quan
tities of the compounds studied were weighed on a Sartorius microbalance and
diluted to 100 mL with water. The average molar extinction coefficient from three
measurements was used to determine the concentration of a stock solution, which
was lyophilized in 600 J.LL double-lock eppendorf tubes and stored dry at -20° C.
Ethanol Precipitation
To the DNA solution to be purified was added 1/ 10 volume 3M sodium acetate
at pH 5.2 and 3 volumes ethanol. The solution was vortexed and incubated at 0°C
for 10 min. The solution was then centrifuged at 13,000 rpm for 25 min in an
-186-
Eppendorf model 5415 microcentrifuge, and the supernatant was decanted and
discarded. 300 J.LL 70% ethanol was added and the tubes were centrifuged at
13,000 rpm for 10 min. The supernatant was discarded, and the DNA pellet was
dried for 5 min on a Sorval Speedvac at < 1 Torr.
Ammonium Acetate Ethanol Precipitation
To the DNA solution to be purified was added 1/ 2 volume 7.5 M ammonium
acetate, pH 5.2, and 2 volumes ethanol. The solution was vortexed and incubated
at 0°C for 10 min. The solution was then centrifuged at 13,000 rpm for 25 min, and
the supernatant was decanted and discarded. The DNA was resuspended in 50 J.LL
water and the procedure repeated. Finally, 300 J.LL 70% ethanol was added to the
pellet and the tubes were centrifuged at 13,000 rpm for 10 min. The supernatant
was discarded, and the DNA pellet was dried for 5 min on a Sorval Speedvac at
< 1 Torr.
Electrophoresis
Agarose Gels
For DNA purification, a horizontal agarose gel containing 2 J.Lg ethidium bro
mide/ 100 mL was used. The appropriate amount of agarose in 200 mL 1X TAE
buffer was heated to a rolling boil, cooled to 70° C, and poured into the UV trans
parent tray of a Pharmacia GNA 100 horizontal gel apparatus. For gels > 1%,
a comb that gave 1 mm x 5 mm wells was used. For lower percentage gels, a
2 mm x 4 mm comb was necessary. The DNA was visualized on a Fotodyne

-187-
Transilluminator, and the bands were excised from the gel and purified by either
electro-elution or melting followed by phenol extraction.
For cleavage assays, a 1% agarose vertical gel was used. 2 g agarose was
suspended in 200 mL TAE buffer, heated to a rolling boil, and cooled slowly. The
gel plates were clamped upright in a gel pouring stand, and an agarose plug was
poured. When the plug had solidified and the temperature of the main agarose
solution was between 50 and 55°C, the solution was poured between the plates and
capped with a comb. Cooling gave a 14 em x 21 em x 4 mm gel with twelve wells
3 mm thick by 8 mm wide separated by 3 mm.
The gel was set vertically in a Watson Products EV300 apparatus and pre
electrophoresed with fan cooling at 120 V for 15 min. The DNA solution in 1X Fi
coll buffer was added to the wells and the gel was electrophoresed at 120 V with
fan cooling until the bromophenol blue was 3 em from the bottom of the gel. The
plates were separated, and the gel transferred to filter paper and dried at <1 Torr
on a Bio-Rad model 483 Slab dryer for 30 min at 60°C, then 30 min at 80°C. X-ray
film was exposed to the dried gel for 12- 36 hat 25°C.
Polyacrylamide Gels
An 8% denaturing polyacrylamide gel was prepared from 36 g urea, 16 mL
5X TBE, 20 mL of a commercial 30% acrylamide solution containing 1.5% bis
acrylamide, 50 mg ammonium persulfate and water to make 80 mL. The solution
was run through a 0.45 J.l.m filter, 20 JJ.L tetramethylethylenediamine was added,
-188-
and the solution was poured between glass plates using a standard 0.4 nun spacer
and comb set (BRL). Polymerization gave a 31 em x 37 em x 0.4 nun 8% gel with
32 wells 6 mm wide separated by 3 nun.
The gel was set vertically on a BRL model S2 gel setup with aluminum back
plate and pre-electrophoresed at the running voltage for 1 h. The DNA solutions
in formamide buffer were heated to 90°C for 3 min, chilled on ice, and loaded
into the wells. A typical 8% gel was electrophoresed at 1100 V for .....,3 h until the
bromophenol blue eluted from the bottom of the gel. X-ray film was exposed to
the dried gel for 1G-14 h at -80°C with one intensifying screen and for 4-10 d at
25°C without intensification.
Preparation of Labeled Restriction Fragments
A list of the labeled restriction fragments used is shown in table 1. The
appropriate plasmid was linearized with a restriction enzyme, labeled on either
strand, and cut with a second enzyme. The radioactive DNA was isolated on a
1% LMP agarose gel containing ethidium bromide, running at 32 V for 2.5 h. The
band visualized by UV was cut out of the gel and eluted using a Schleicher and
Schuell Elutrap (1X TAE, 100 V for 2.5 h). The DNA-containing solution was
extracted with phenol, 1:1 phenol:chloroform, chloroform, and butanol 5 times,
ethanol precipitated, resuspended in water and stored at - 20°C.
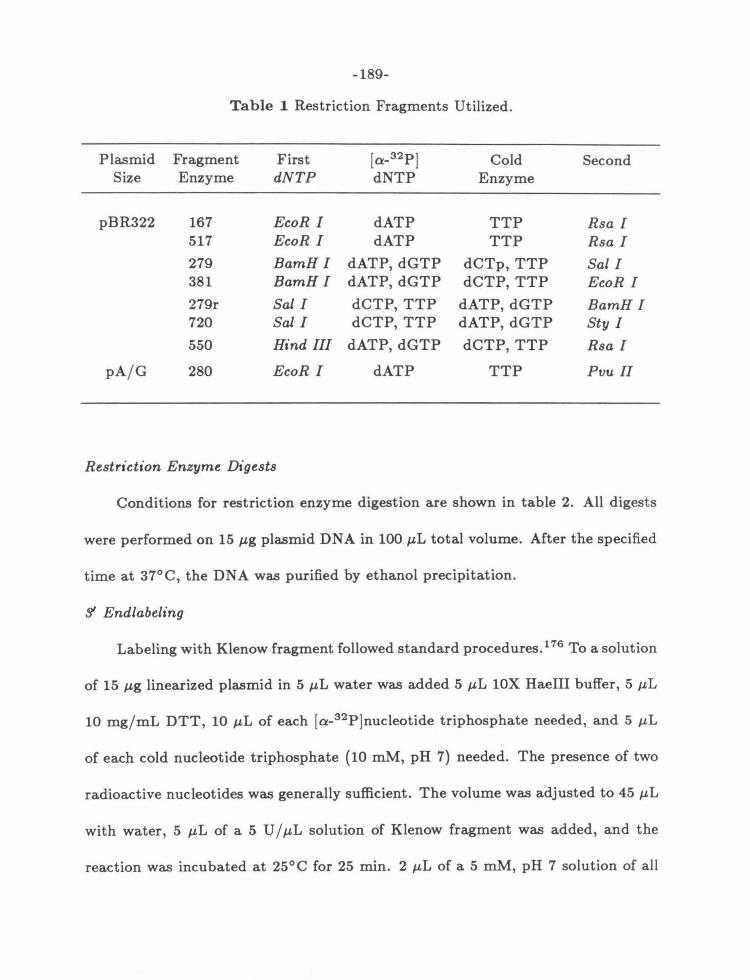
-189-
Table 1 Restriction Fragments Utilized.
Plasmid Fragment First [a-32p] Cold Second Size Enzyme dNTP dNTP Enzyme
pBR322 167 EcoR I dATP TTP Rsa I 517 EcoR I dATP TTP Rsa I 279 BamH I dATP, dGTP dCTp,TTP Sal I 381 BamH I dATP, dGTP dCTP, TTP EcoR I
279r Sal I dCTP, TTP dATP, dGTP BamH I 720 Sal I dCTP, TTP dATP, dGTP Sty I
550 Hind III dATP, dGTP dCTP, TTP Rsa I
pA/G 280 EcoR I dATP TTP Pvu II
Restriction Enzyme Digests
Conditions for restriction enzyme digestion are shown in table 2. All digests
were performed on 15 J.Lg plasmid DNA in 100 J.LL total volume. After the specified
time at 37°C, the DNA was purified by ethanol precipitation.
9' Endlabeling
Labeling with Klenow fragment followed standard procedures. 176 To a solution
of 15 J.Lg linearized plasmid in 5 J.LL water was added 5 J.LL lOX Haeiii buffer, 5 J.LL
10 mg/mL DTT, 10 J.LL of each [a-32P]nucleotide triphosphate needed, and 5 J.LL
of each cold nucleotide triphosphate (10 mM, pH 7) needed. The presence of two
radioactive nucleotides was generally sufficient. The volume was adjusted to 45 J.LL
with water, 5 J.LL of a 5 U / J.LL solution of Klenow fragment was added, and the
reaction was incubated at 25°C for 25 min. 2 J.LL of a 5 mM, pH 7 solution of all

-190-
Table 2 Restriction Enzyme Digest Conditions.
Enzyme Units/ [Tris] pH [NaCl] [MgCh] DTTa ,8-MEb Time p,g DNA (mM) (mM) (mM) (h)
Bam HI 5 10 7.9 150 10 1.5 Eco RI 2 100 7.5 50 5 2
Hind III 4 10 7.5 50 10 2 Pst I 5 10 7.4 100 10 .; 1
Pvu II 7 10 7.5 50 10 .; 1.5 Rsa I 1.5 10 8.0 50 10 .; 1 Sal I 10 10 7.9 150 10 2.5 Sty I 5 10 8.5 100 10 .; 2
Xmni 5 10 8.0 6 10 .; 2
a Dithiothreitol. b 2-Mercaptoethanol.
four cold nucleotides was then added and the solution was incubated at 25°C for
10 min. The radioactive DNA was isolated by ammonium acetate precipitation.
S Endlabeling
Labeling of the 5' end of a linearized plasmid by treatment with calf alkaline
phosphatase and then T4 polynucleotide kinase followed standard procedures. 176 A
solution of 15 p,g linearized plasmid in 170 p,L water and 20 p,L lOX CAP buffer was
treated with 10 JJ.L of a 1 U / JJ.L calf alkaline phosphatase solution, incubating at
37°C for 30 min. The solution was extracted with phenol, 1:1 phenol:chloroform,
chloroform, and butanol twice, then ethanol precipitated. The DNA was redis-
solved in 28 p,L water, 5 p,L 10 mg/ mL DTT, 5 p,L lOX kinase salts and 10 p,L
[J-32P]ATP. The solution was treated with 2 p,L 11 U / JJ.L T4 polynucleotide ki-
-191-
nase and was incubated at 37°C for 45 min. The DNA was isolated by ammonium
acetate/ ethanol precipitation.
G Reaction 80
A 1.5 mL eppendorf tube containing 100 J.LL 100 mM sodium cacodylate,
pH 8; 40 J.LL 10 mM EDTA, pH 8; 3 J.LL 1 mM-bp calf thymus DNA; 100,000 cpm
labeled restriction fragment and water to make 199 J.LL was cooled to 0°C. One J.LL
dimethyl sulfate was added, the tube was shaken vigorously and incubated at 25°C
for 2.5 min {3 min for fragments smaller than 300 bp). The reaction was quenched
with 50 J.LL stop buffer ( 4 7 J.LL 4 M sodium acetate, pH 5.2, 9 J.LL 2-mercaptoethanol,
6 J.LL 1 mgf mL tRNA and water to make 125 J.LL) and 750 J.LL ethanol. After
ethanol precipitation, the pellet was resuspended in 100 J.LL 10% piperidine and
heated to 90°C for 30 min. The solution was lyophilized four times and diluted to
4000 cpm/ J.LLwith formamide loading buffer.
A Reaction81
To a solution of 3 J.LL 1 mM-bp calf thymus DNA and 100,000 cpm labeled
restriction fragment in a total of 160 J.LL water was added 40 J.LL of a pH 2 pot as
sium tetrachloropalladate solution (1.6 mg K2PdCl4j100 J.LL of 100 mM NaCl/ HCl,
pH 2). The reaction was incubated for 40 min at 25°C, quenched with 50 J.LL G
reaction stop buffer and 750 J.LL ethanol, precipitated, heated with 10% piperi
dine for 30 min, lyophilized four times and resuspended in formamide as for the G
reaction.

-192-
Labeling of Linear pBR322
pBR322 was linearized as above with Sty I, and then labeled on the 3' terminus
of the clockwise strand with [ a-32P]dATP or on the 3' terminus of the counterclock
wise strand with [a-32P]TTP using Klenow fragment. The radioactive plasmid was
purified on a 0.7% agarose gel (16 V, 9 h) containing ethidium bromide. The lin
earized plasmid band was cut out, diluted with 500 J..LL TE buffer (20 m.M Tris,
1 mM EDTA, pH 7.9), melted at 70°C for 10 min, extracted with phenol, 1:1 phe
nol:chloroform, chloroform, and butanol five times and ethanol precipitated. The
pellet was resuspended in water, diluted to 4000 cpm/ J..LL, and stored at -20°C.
Molecular Weight Standards
Equal amounts of the [a-32P]A and [a-32P]T labeled plasmid were combined
with 1 J..Lg .X DNA and digested with the restriction enzymes Eco RI, Xmn I, BamH
I, and Pst I or Pvu II. The reactions were ethanol precipitated, counted, diluted
to the same concentration ( cpm/ J..LL) and equal volumes were combined with the
same cpm of intact pBR322.
DNA Binding Assays
MPE·Fe(II} Footprinting
MPE·Fe(II) footprinting followed the standard method. 14 • 45 A 100 J.LM
MPE·Fe(II) solution was prepared by mixing 10 J.LL of a 1 mM MPE solution with
10 J..LL of a freshly prepared 2 mM ferrous ammonium sulfate solution in the dark,
then diluting to 100 J.LL. This solution could be stored at -20°C for several months.

-193-
Just before use, the 100 J.LM stock solution was thawed and the appropriate amount
diluted 1:5 with water.
A DNA cocktail was prepared containing 1 J.LL/tube 20X TA buffer (800 mM
Tris, 100 mM sodium acetate, pH 7.9), 2 J.LL/tube 1mM-bp calf thymus DNA,
36,000 cpm labeled restriction fragment and water to make 8 J.LL/tube total solu
tion. The solution was pipetted into individual 600 J.LL eppendorf tubes and 4 J.LL
of a 5X solution of the compound was added. The tubes were vortexed, spun down
and incubated in the dark for 30 min at 37°C. To each tube was added 4 J.LL of
the 20 J.LM MPE·Fe(II) solution above and 4 J.LL of a freshly prepared 20 mM DTT
solution in separated drops. Final concentrations: 40 mM pH 7.9 Tris·acetate,
5 mM sodium acetate, 100 J.LM-bp DNA, 4 J.LM MPE·Fe(II) and 4 mM DTT, in
20 J.LL. The reactions were incubated at 37°C for 10 min (15 min for fragments
shorter than 300 bp) . The solutions were frozen, lyophilized, Cerenkov counted on
a Beckman LS 3801 scintillation counter, diluted to 3000 cpm/ J.LL with formamide
loading buffer, and electrophoresed on a denaturing polyacrylamide gel.
MPE·Fe(II) Footprinting at pH 6.0-10.0
A DNA cocktail was prepared for each pH studied from 2 J.LL/tube lOX CPB
buffer (200 mM sodium citrate, 200 mM disodium hydrogen phosphate, 100 mM
boric acid, 200 mM sodium hydroxide, adjusted to the proper pH with concen
trated hydrochloric acid), 2 J.LL/ tube 1 mM-bp calf thymus DNA and water to
make 8 J.LL/ tube. The procedure for MPE·Fe(II) footprinting was followed exactly

-194-
except that 4 JLL 5 mM sodium ascorbate was added as the reducing agent. Final
concentrations: 20 mM citrate, 20 mM phosphate, 10 mM borate, -20 mM sodium
chloride, 4 JLM MPE·Fe(II) and 1 mM sodium ascorbate, in 20 JLL . Cleavage time
varied with pH. 18 min at pH 6, 4 min at pH 7- 8, 8 min at pH 9 and 30 min at
pH 10 gave comparable cleavage. The reactions were lyophilized, counted, diluted
and electrophoresed.
EDTA·Fe(II} Footprinting86
A DNA cocktail was assembled from 1 JLL/tube 20X TN buffer (400 mM Tris,
2 M NaCl, pH 7.4), 2 JLL/tube 1 mM-bp calf thymus DNA, 36,000 cpm/ tube
labeled restriction fragment and water to make 8 JLL/tube. This was pipetted into
individual 600 JLL eppendorf tubes and 4 JLL of a 5X solution of the compound
to be footprinted was added. The solutions were mixed and incubated at 37°C in
the dark for 30 min. Three solutions were then added in separate drops: 2 JLL of
a 1 mM EDTA·Fe(II) solution (equal volumes of 2 mM EDTA, pH 8, and 2 mM
freshly prepared ferrous ammonium sulfate), 4 JLL of a 5 mM sodium ascorbate
solution, and 2 JLL of a 0.3% hydrogen peroxide solution. Final concentrations:
20 mM pH 7.4 Tris·HCl, 100 JLM-bp DNA, 100 JLM EDTA·Fe(II), 1 mM sodium
ascorbate and 9 mM hydrogen peroxide, in 20 JLL. The solutions were mixed, then
incubated at 37°C. After 5 min, the reactions were lyophilized, counted, diluted to
3000 cpm/ JLL, and electrophoresed.

-195-
Affinity Cleaving
A DNA cocktail was prepared from 1 J.LL/tube 20X TA buffer (800 mM Tris,
200 mM sodium acetate, pH 7.9), 2 J.LL/tube calf thymus DNA, 36,000 cpmj tube
labeled restriction fragment and water to make 12 J.LL/tube. This solution was
pipetted into individual 600 J.LL eppendorf tubes. The compounds to be examined
were loaded with Fe2+ by adding 10 J.LL of a 2 rnM freshly prepared 2 rnM ferrous
ammonium sulfate solution to 10 J.LL of a 2 mM solution of the compound. The
tube was vortexed and diluted to the appropriate 5X concentration. 4 J.LL of the
compound was added to each tube, and the solutions were incubated at 37°C for
30 min in the dark. DTT ( 4 J.LL at 20 mM) was added, and the reactions were
incubated in the dark at 37°C for 30 min. Final concentrations: 40 mM pH 7.9
Tris·acetate, 5 mM sodium acetate, 100 J.LM-bp DNA, 4 mM DTT, in 20 J.LL. The
reactions were lyophilized, counted, diluted to 3000 cpm/ J.LL, and electrophoresed
in the usual manner.
DNase I Footprinting 14
A DNA stock solution was prepared from 1 J.LL / tube lOX TKMC buffer
{100 mM Tris, 100 mM potassium chloride, 100 mM magnesium chloride, 50 mM
calcium chloride, pH 7.0), 2 J.LL / tube calf thymus DNA, 18,000 cpmj tube labeled
517 bp fragment and water to make 7 J.LL/tube. The compound to be footprinted
was added in 2 J.LL of a 5X solution, and the tubes were incubated at 25°C for
30 min in the dark. A DNase I solution was prepared from 1 J.LL of a 0.33 mg/ mL

-196-
stock solution, 20 11-L 50 mM DTT and water to make 1 mL. 1 11-L was added to each
tube, and the reactions were incubated at 25°C for 3 min. Final concentrations:
10 mM pH 7.0 Tris·HCl, 10 mM potassium chloride, 10 mM magnesium chloride,
5 mM calcium chloride, 200 11-M-bp DNA, 0.33 ng DNase and 100 11-M DTT, in
10 JJ-L. The cleavage was quenched with 2.5 11-L of a 3 M ammonium acetate solu
tion containing 250 mM EDTA, ethanol precipitated, dried, counted and prepared
for electrophoresis as before.
Dimethyl Sulfate Footprinting 15
A DNA solution was prepared from 0.5 11-L/tube 20X TA buffer, 2 11-L/tube
1 mM-bp calf thymus DNA, 18,000 cpmftube labeled 517 bp fragment, and water
to make 6 11-L/tube. The footprinted compound was added as a 5X solution (2 11-L),
and the tubes were incubated for 30 min in the dark at 25°C. 2 11-L of a 1:40
dimethyl sulfate:water solution was added to each tube and the reactions were
incubated at 25°C for 5 min. Final concentrations: 40 mM pH 7.9 Tris·acetate,
5 mM sodium acetate, 200 11-M-bp DNA and 53 mM dimethyl sulfate, in 10 JJ-L.
One 11-L of mercaptoethanol was added, and the reactions were ethanol precipitated.
The pellet was taken up in 20 11-L dilute hydrochloric acid, pH 2.2, and incubated at
0°C for 2 h with vortexing at 15 min intervals. The solution was diluted with 80 11-L
200 mM sodium hydroxide containing 200 11-M EDTA, heated to 90°C for 30 min,
and ethanol precipitated. The precipitate was prepared for gel electrophoresis in
the usual manner.

-197-
Diethyl Pyrocarbonate Reactions 177
The same DNA solution used for dimethyl sulfate foot printing was divided into
individual 600 J.LL eppendorf tubes. 2 J.LL of the compound to be tested was added as
a 5X solution, and the tubes were incubated for 30 min at 37°C in the dark. Diethyl
pyrocarbonate (2 J.LL of a 10% solution in methanol) was added, and the reactions
were incubated at 37°C for 10 min in the dark. Final concentrations: 40 mM
pH 7.9 Tris·acetate, 5 mM sodium acetate, 200 J.LM-bp DNA and 136 mM diethyl
pyrocarbonate, in 10 J,LL. The reactions were ethanol precipitated, resuspended in
10% piperidine and heated to 90°C for 15 min. The solution was lyophilized twice
to dryness, counted, diluted to 3000 cpm/ J.LL and electrophoresed.
Potassium Permanganate Reactions 178
The same DNA solution used for dimethyl sulfate footprinting was divided
into individual 600 J.LL eppendorf tubes. The compound to be studied was added
as a 5X solution in 2 J,LL, and the solution was incubated at 37°C for 30 min in
the dark. A 2 J.LL portion of 500 J.LM potassium permanganate was added, and the
tubes were incubated for 15 min at 37°C in the dark. Final concentrations: 40 mM
pH 7.9 Tris·acetate, 5 mM sodium acetate, 200 J,LM-bp DNA and 100 J.LM potassium
permanganate, in 10 J.LL. The reactions were ethanol precipitated, resuspended in
10% piperidine and heated to 90°C for 15 min. The solution was lyophilized twice
to dryness, counted, diluted to 3000 cpm/ J,LL, and electrophoresed.

-198-
Cleavage of Linear pBR922 16
A DNA solution was prepared from 0 .75 JLL/ tube 20X TA buffer, 1.5 JLL 1 mM
bp calf thymus DNA, 30,000 cpm radioactive pBR322 and water to make 9 JLL.
The solution was pipetted into individual 600 JLL eppendorf tubes, and 3 JLL of a
5X solution of compound·Fe(II) was added. The tubes were incubated at 37°C for
30 min in the dark, then 3 JLL of a 5 mM sodium ascorbate solution was added, and
the reactions were incubated at 37°C for 2 h . Final concentrations: 40 mM pH 7.9
Tris·acetate, 5 mM sodium acetate, 100 JLM-bp DNA, 1 mM sodium ascorbate, in
15 JLL. The solutions were diluted with 4 JLL 5X Ficoll loading buffer, and 18 JLL
were loaded on a 1% vertical agarose gel and electrophoresed in the usual manner.
Quantitative Footprinting99
DNA Preparation
Labeled 517 bp fragment was prepared by the standard procedure with two
modifications. The linearized plasmid was labeled at the 3' end using both [ o:-
32PjdATP and [o:-32P ]TTP and no cold nucleotide triphosphates. After ethanol
precipitation, the labeled fragment was resuspended in 100 JLL 20 mM Tris·HCl,
pH 7, and diluted to 2 mL with water. The solution was reconcentrated using an
Amicon Centricon 30,000 MW cutoff membrane. The centricon was sterilized with
70% ethanol, and washed with water. The DNA solution was added to the top,
and the Centricon spun in a 45° fixed rotor of a clinical centrifuge for 30 min. The
DNA in 40 JLL was collected, diluted to 4000 cpm/ JLL, and stored at - 20°C.

-199-
Footprinting Reactions
Nineteen 600 J.LL eppendorf tubes were prepared containing the amount of
water shown in the following table.
Table 3 2-PyN, 2-ImN Dilutions.
Lane J.LL J.LL Lane J.LL J.LL Lane J.LL J.LL Lane J.LL J.LL No. 4 H20 No. 9 H20 No. 14 H20 No. 19 H20
4 250
5 50 50 10 50 75 15 50 50 20 50 50 6 50 150 11 50 200 16 50 200 21 50 150
7 10 90 12 10 90 17 10 90 22 10 90 8 10 190 13 10 240 18 10 190 9 10 390 14 10 490 19 10 490
Twenty three 1.5 mL eppendorf tubes were numbered sequentially and number
2 was set aside. Into the remaining tubes was placed 160 J.LL 1.25X Qfp buffer
(200 mM Tris·HCl, 1 M NaCl, pH 7.0, diluted 12.5:100). Water was added to
lanes 1 (control DNA, 25 J.LL), 3 and 23 (MPE standards, 20 J.LL) . 10 J.LL of a
DNA solution prepared from 25 J.LL 500 J.LM poly(dG)·poly(dC), 25 x 30,000 cpm
labeled 517 bp restriction fragment and water to make 250 J.LL, was added to each
tube. The compound to be footprinted was serially diluted as shown in the table
above, and 20 J.LL of the appropriate concentration was added to each tube. The
tubes were vortexed, spun down and incubated at 37°C for 30 min. Five J.LL of a
freshly prepared 80 mM DTT solution and 5 J.LL of a 40 J.LM MPE·Fe(II) solution in

-200-
separate drops were added. The reactions were vortexed, spun down and incubated
at 37°C for 10 min. Final concentrations: 20 mM pH 7.0 Tris·HCl, 100 mM sodium
chloride, 2.5 J.LM-bp DNA, 1 J.LM MPE·Fe(II) and 2 mM DTT, in 200 J.LL. 25 J.LL
of a tRNA solution (25 J.LL 1 mg/mL tRNA plus 600 J.LL water) was added, then
700 J.LL of ethanol, and the reactions were ethanol precipitated without added salt
as above, counted and diluted to 3000 cpm/ J.LL. Poly( dG) ·poly( dC) proved difficult
to resuspend. Best results were obtained by sonicating the formamide solutions
for 5 min in a cleaning bath before loading, although most gels still contained
at least one lane that did not resuspend. An 8% denaturing polyacrylamide gel
was prepared with a special comb consisting of twenty 6 mm teeth separated by
6 mm, surrounded by seven 6 mm teeth separated by 3 mm. The standard and
A lanes were loaded in wells separated by 3 mm. All other lanes were loaded
in wells separated by 6 mm. The DNA was electrophoresed at 1100 V for 3 h
until the bromophenol blue eluted from the bottom of the gel. The gel was dried
as before and exposed to preflashed X-ray film at -78°C with one intensifying
screen. Several exposures of varied duration were routinely prepared.
Densitometry
Normal footprinting and affinity cleaving autoradiograms were scanned on a
LKB XL laser densitometer. Settings of X width 2, Y step 3 and no smoothing
gave an absorbance value every 120 J.tm averaged over two 1 mm wide scans. The
scans were output to an IBM printer, and footprints determined by comparison to
-201-
the MPE·Fe(II) standard lane. A horizontal line was drawn from the top of the
nearest unprotected band, and the distance in AU from this line to the maximum
peak height was determined for each band and plotted as a histogram. Affinity
cleavage patterns were measured in similar fashion, using the peak heights of sites
without specific cleavage as a baseline.
To determine the sites of cleavage in the linearized pBR322 assay, the cleavage
lanes were scanned as above and output to the Hoefer program GS370 using sequen
tial digital to analog and analog to digital conversions. Cleavage band molecular
weights were determined by comparison to the molecular weight standard lane, and
positions on pBR322 were calculated. The positions were averaged between labels
and used, along with the average relative area of the peaks, to generate histograms.
For the quantitative footprinting gels, a suitable preflashed film was scanned
using an X width of 7, Y step 2 and no smoothing for gel lanes, or X width 1, Y
step 2 and no smoothing for background scans. Output was directed to the LKB
program GSXL running on an IBM AT. The baseline was determined manually
using a linear interpolation of the minimum number of points needed to reproduce
the background curve shape (usually 3-4). The average of the baseline scans on
both sides of the lane in question was subtracted by the program and the resultant
peaks were integrated in signal mode. Peak areas were printed out and transferred
to an Excel worksheet, running on a Macintosh Plus.
The apparent fractions bound were calculated by the equations in chapter 3,
and the data points transferred to the program BINDFIT, running on an IBM AT.

-202-
The best fit parameters were used to calculate a fitted curve (Excel), and the data
points and the curve were transferred to Cricket Graf (Macintosh) and printed.
Average residuals were calculated from the Cricket Graf data sheet.
Synthesis
Instruments
-203-
Melting points were taken on a Thomas-Hoover apparatus and are uncor
rected. Infrared spectra were recorded on a Shimadzu IR-435 spectrometer.
1 H NMR's were taken on a Jeol JNM-GX400 spectrometer at 400 MHz using
partially deuterated solvent as an internal standard. Mass Spectrometry was per
formed at the Midwest Center for Mass Spectrometry, Lincoln, Nebraska. Ultravi
olet and visible spectra were recorded on a Perkin-Elmer Lambda 4C spectropho
tometer.
Reagents
Dry THF was distilled from sodium benzophenone ketyl. Dry DMF and
dichloromethane were treated with activated 4A Molecular Sieves. 179 N, N'
Carbonyldiimidazole was sublimed at 100°C and <1 Torr. All other reagents were
used as received.
Methods
Oven-dried glassware was used for all non-aqueous reactions. All reactions ex
cept those containing thionyl chloride or other concentrated acids were performed
under argon. The acidic reactions were flushed with argon, connected to a mineral
bubbler, and heated to the reaction temperature. Reaction progress was moni
tored by TLC, using the following detection methods: UV, iodine ( amines, pyrrole
compounds), bromocresol purple (acids), or potassium permanganate ( alkenes,
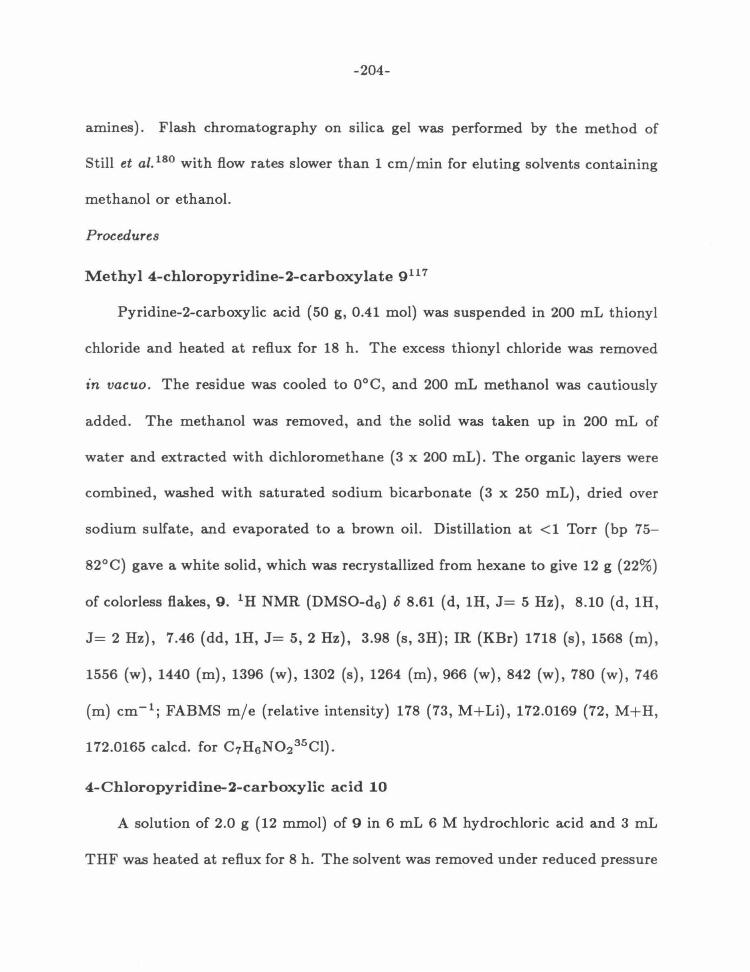
-204-
amines). Flash chromatography on silica gel was performed by the method of
Still et al. 180 with flow rates slower than 1 em/min for eluting solvents containing
methanol or ethanol.
Procedures
Methyl 4-chloropyridine-2-carboxylate 9 117
Pyridine-2-carboxylic acid {50 g, 0.41 mol) was suspended in 200 mL thionyl
chloride and heated at reflux for 18 h. The excess thionyl chloride was removed
in vacuo. The residue was cooled to 0°C, and 200 mL methanol was cautiously
added. The methanol was removed, and the solid was taken up in 200 mL of
water and extracted with dichloromethane (3 x 200 mL). The organic layers were
combined, washed with saturated sodium bicarbonate (3 x 250 mL), dried over
sodium sulfate, and evaporated to a brown oil. Distillation at <1 Torr (bp 75-
820C) gave a white solid, which was recrystallized from hexane to give 12 g {22%)
of colorless flakes, 9. 1H NMR (DMSO-d6 ) 6 8.61 (d, 1H, J= 5Hz), 8.10 (d, 1H,
J= 2Hz), 7.46 (dd, 1H, J= 5, 2Hz), 3.98 (s, 3H); IR (KBr) 1718 (s), 1568 (m),
1556 (w), 1440 (m), 1396 (w), 1302 (s), 1264 (m), 966 (w), 842 (w), 780 (w), 746
(m) cm- 1 ; FABMS m/e (relative intensity) 178 (73, M+Li), 172.0169 (72, M+H,
172.0165 calcd. for C 7 H 6 N0235Cl).
4-Chloropyridine-2-car boxy lie acid 10
A solution of 2.0 g (12 mmol) of 9 in 6 mL 6 M hydrochloric acid and 3 mL
THF was heated at reflux for 8 h. The solvent was removed under reduced pressure

-205-
to give a white paste which was triturated with THF to give 2.3 g 10 {94 %) . 1 H
NMR (DMSO-d6 ) 6 8.68 (d, 1H, J= 5Hz), 8.05 (d, 1H, J= 2Hz), 7.79 (dd, 1H,
J= 5, 2Hz); IR (KBr) 3090 (m), 2850 (m), 1740 (m), 1620 (m), 1606 (s), 1438
(m), 1410 (s), 1338 (w), 1284 (m), 1260 (m), 1220 (m), 1166 (w), 1084 (w), 844
(w), 768 (w), 720 (w) cm- 1 ; FABMS m/e (relative intensity) 166 (41, M+2+Li),
164.0092 (78, M+Li, 164.0091 calcd. for C6 H4 N0235C1Li), 160 {69, M+2+H),
158 {87, M+H), 140 {100, M+H-H2 0).
4-Dimethylaminopyridine-2-carboxylic acid 11
91 mg (0.47 mmol) of 10 and 5 mL of 40% dimethylamine in water were
heated to 160° C for 12 h in a sealed tube. 118 The reaction was concentrated under
reduced pressure and the residue purified by flash chromatography on silica gel
with methanol, yielding 73 mg (94%) 11, a white solid. 1 H NMR (DMSO-d6 ) 6
7.96 (d, 1H, J= 7Hz), 7.21 (d, 1H, J= 3Hz), 6.88 (dd, 1H, J= 7, 3Hz), 3.17 (s,
6H); IR (KBr) 3400 (w), 1628 (s), 1580 (m), 1560 (m), 1440 (w), 1392 (m), 1360
(m), 1250 (w), 1240 (w), 1002 (w), 860 (w), 812 (w), 796 (w) cm- 1 ; FABMS mj e
(relative intensity) 167.0815 {100, M+H, 167.0821 calcd. for C8 H 11N2 0 2 ).
Sodium Pyrimidine-2-sulfite 12119
A suspension of 3. 77 g {32.9 mmol) 2-chloropyrimidine and 4.4 g {34.9 mmol)
sodium sulfite in 20 mL of water was heated at reflux for 1 h. The solution was
concentrated to 10 mL and cooled to 0°C, precipitating 4.17 g (70%) 12 as a white
solid. 1H NMR (DMSO-d6 ) 6 8.78 (d, 2H, J= 5Hz), 7.46 (t, 1H, J = 5Hz); IR

-206-
(KBr) 3500 (s), 3420 (m), 1568 (w), 1394 (w), 1238 (s), 1220 (s), 1058 (w), 1040
(w) , 658 (w) cm- 1 ; FABMS mje (relative intensity) 189 (35, M+Li), 160 (100,
M+H- Na), 158.9862 (M-H-Na, 158.9864 calcd. for C 4 H3N203S).
2-Cyanopyrimidine 13119
Potassium cyanide (1.66 g, 25.5 mmol) and 3.47 g (19.1 mmol) 12 were inti
mately mixed in a mortar. The mixture was heated slowly to 300°C at <1 Torr.
The solid distillate was dissolved in dichloromethane, filtered through Celite, and
purified by flash chromatography on silica gel with 50% ether in hexane to give
0.578 g (29%) clear crystalline 13. 1H NMR (DMSO-d6 ) 6 9.03 (d, 2H, J= 5Hz),
7.87 (t, 1H, J= 5 Hz); IR (KBr) 1560 (s), 1500 (s), 1266 (w), 1084 (w), 988 (w) ,
816 (m), 786 (m), 640 (w) cm- 1 ; ElMS mje (relative intensity) 105.0318 (100,
M+, 105.0319 calcd. for C5 H3N3 ), 78 (17, M-HCN).
Pyrimidine-2-carboxylic acid 14120
A 556 mg (5 .30 mmol) sample of 13 was dissolved in 6 mL of 2 M sodium
hydroxide and heated to reflux . After 5 h, the reaction was cooled to 25°C and
neutralized with 6N hydrochloric acid. The water was lyophilized and the methanol
soluble fraction sublimed at <1 Torr and 150°C to give 250 mg (38%) 14 as a white
solid. 1 H NMR (DMSO-d6 ) 6 8.95 (d, 2H, J= 5Hz), 7.69 (t, 1H, J = 5Hz); IR
(KBr) 3050 (m), 2700 (s), 1744 (s), 1608 (s), 1596 (m), 1570 (m), 1442 (m), 1404
(m), 1306 (m), 1288 (m), 1272 (s), 1188 (s), 1166 (m), 1104 (w), 998 (m), 862
(w), 838 (w), 798 (w) , 672 (m) cm- 1 ; FABMS m/e (relative intensity) 137 (74,

-207-
M-H+2Li), 131.0436 (81, M+Li, 131.0432 calcd. for C 5 H 4 N2 0 2 Li), 125 (79,
M+H).
Methyl 3-hydroxypyridine-2-carboxylate 15
3-Hydroxypyridine-2-carboxylic acid (5.0 g, 36 mmol) was heated at reflux
for 72 h in 150 mL methanol containing 6 mL concentrated sulfuric acid. The
methanol was removed, and the remainder diluted with 250 mL dichloromethane,
washed with saturated sodium carbonate (2 x 250 mL) and water (1 x 200 mL).
Drying over sodium sulfate and vacuum evaporation gave a light yellow solid, which
was recrystallized from ether/hexane to give 1.76 g (32%) 15. 1H NMR (CDC13)
6 10.61 (s, 1H), 8.26 (dd, 1H, J= 4, 1Hz), 7.40 (dd, 1H, J= 9, 4Hz), 7.36 (dd,
1H, J= 9, 1Hz), 4.04 (s, 3H); IR (KBr) 3100 (w), 1670 (s), 1596 (w), 1448 (s),
1366 (m), 1304 (s), 1240 (m), 1202 (s), 1098 (m), 960 (w), 860 (w), 820 (m), 804
(w), 736 (m), 688 (m), 662 (w) cm- 1 ; ElMS m/e (relative intensity) 153.0424 (100,
M+, 153.0426 calcd. for C1H1N03), 123 (98, M-CH2 0), 95 (98, M-C2 H2 0 2 ).
Methyl 3-methoxypyridine-2-carboxylate 16121
Sodium methoxide was freshly prepared from 200 mg (8.7 mmol) sodium metal
and 10 mL of methanol. A 1.0 g (6.7 mmol) sample of 15 was added and then
enough DMSO to give a clear solution. The methanol was removed at <1 Torr,
1 mL (16 mmol) iodomethane was added, and the reaction was stirred for 6 h.
Another mL of iodomethane was added, and the reaction stirred for another 12 h.
The DMSO was removed at <1 Torr pressure, and the residue was taken up in
-208-
75 mL of water and extracted with dichloromethane (3 x 80 mL). The organic
layers were combined, dried over sodium sulfate, and concentrated. The resulting
oil was distilled at < 1 Torr and 130°C by Kiigelrohr to yield 339 mg (31 %) of 16,
a yellow oil. 1H NMR (CDC13 ) o 8.24 (d, 1H, J= 4Hz), 7.39 (dd, 1H, J= 9, 4Hz),
7.33 (d, 1H, J= 9Hz), 3.94 (s, 3H), 3.89 (s, 3H); IR (film) 1736 (s), 1304 (s) ,
1100 (s) cm- 1 ; ElMS m / e (relative intensity) 167.0580 (16, M+, 167.0583 calcd.
for CsHgNOs), 152 (17, M-CHs), 108 (94, M-C2Hs02) .
3-Methoxypyridine-2-carboxylic Acid 1'1
A 239 mg (1.43 mmol) sample of 16 was dissolved in 4 mL 6 M hydrochloric
acid and 2 mL THF and heated at reflux for 8 h. The solvent was removed in
vacuo to give 1 '1 in nearly quantitative yield. 1 H NMR (DMSO-d6 ) o 8.18 ( d, 1H,
J = 5 Hz), 7.70 (d, 1H, J= 9Hz), 7.57 (dd, 1H, J= 9, 5 Hz) , 3.85 (s, 3H); IR
(KBr) 3360 (s) , 2920 (s), 1720 (m), 1520 (s), 1480 (m), 1306 (m) cm- 1 ; FABMS
m / e (relative intensity) 160.0584 (72, M+Li, 160.0586 calcd. for C 7 H 7 N03Li) ,
154 {83, M+H), 136 {100, M+H- H20).
2-Nitromalonaldehyde, sodium salt, 35181
To a solution of 102 g {1.5 mol) sodium nitrite in 100 mL water at 50°C
was added dropwise over 1.25 h a solution of 100 g (0.38 mol) mucobromic acid in
100 mL 95% ethanol (heated to dissolve), keeping the temperature at 50 ±5° C. The
solution was stirred for 10 min, then cooled to 0°C. The orange solid was collected,
a ir-dried, and recrystallized from 200 mL 80% ethanol with a hot filtration to give

-209-
19.6 g 35 {36%) as orange needles. 1H NMR (DMSO-d6 ) 6 9.74 (s, 2H); IR {KBr)
3410 {s), 3200 {m), 1690 {s), 1652 {s), 1612 {m), 1544 {m), 1380 {m), 1322 {m),
860 (w), 690 (w), 548 (w) cm- 1•
Ethyl 4-Nitropyrrole-2-carboxylate 36132
An 8.1 g {58 mmol) sample of 35 and 7.9 g {57 mmol) ethyl glycinate hy
drochloride were dissolved in 14 mL water and 28 mL methanol. 5 M sodium
hydroxide {120 mL, 60 mmol) was added, and the reaction heated to 50°C for
0 .5 h . The solution was cooled to 0°C and acidified to pH <1 with concentrated
hydrochloric acid. The suspension was extracted with ethyl acetate (7 x 200 mL),
keeping the pH <1 by adding concentrated hydrochloric acid as needed. The ethyl
acetate was dried over sodium sulfate, removed under reduced pressure, and the
residue was dissolved in 80 mL ethanol containing 1 mL concentrated sulfuric acid
and heated at reflux. After 14 h, the solution was cooled to 25°C and 20 mL of
water was added to start precipitation. Cooling to -20°C gave a tan precipitate,
which was recrystallized from ethanol to give 2.79 g {27%) tan crystalline 36. 1 H
NMR {DMSO-d6 ) 6 8.03 {d, 1H, J= 2Hz), 7.22 {d, lH, J = 2Hz), 4.24 {q, 2H,
J = 7Hz), 1.30 {t, 3H, J= 7Hz); IR {KBr) 3280 (s), 1690 (s), 1564 (w), 1506 {s) ,
1472 (w), 1420 (w), 1384 {m), 1362 {s), 1320 (s), 1264 (m), 1202 (s) , 1016 (w),
766 (w) , 752 (m) cm- 1 ; FABMS m je (relative intensity) 197 (57, M-H+ 2Li), 191
{100, M + Li) , 185.0564 {51, M + H, 185.0562 calcd. for C 7 H9 N2 0 4 ) .

-210-
Ethyl 4-Nitro-N-{3-dirnethylarninopropyl)pyrrole-2-carboxylate 37
A solution of 523 mg (2.84 mmol) 36 in 25 mL acetone was stirred over 1.25 g
(9.1 mmol) potassium carbonate for 1 hat 25°C.133 Meanwhile, 520 mg (3.3 mmol)
3-chloro-1-dimethylaminopropane hydrochloride and 490 mg (3.3 mmol) sodium
iodide were stirred in 15 mL acetone at 25°C for 1 h. The iodide solution was
filtered, and the two solutions combined and heated at reflux for 14 h. Another
portion of the iodide was prepared as above, added to the reaction mixture, and
heated at reflux. After 5 h, the solution was filtered and the solvent removed in
vacuo to produce a yellow solid, which was purified by flash chromatography on
silica gel , eluting with 5% methanol in dichloromethane to give 626 mg (82%) of
37 as a white solid. 1H NMR (DMSO-d6 ) 6 8.28 (d, 1H, J= 2Hz), 7.32 (d, 1H,
J= 2 Hz), 4.35 (t, 2H, J= 7Hz), 4.26 (q, 2H, J= 7Hz), 2.20 (t, 2H, J= 7Hz),
2.13 (s, 6H), 1.85 (quint, 2H, J= 7Hz), 1.28 (t, 3H, J= 7Hz); IR (KBr) 2980
(w), 2810 (w), 1720 (s), 1536 (m), 1508 (s), 1492 (m), 1424 (m), 1380 (m), 1362
(w), 1320 (s), 1250 (s), 1200 (m), 1172 (w), 1156 (w), 1100 (m), 1078 (w), 1022
(w), 840 (w), 802 (w), 744 (m) cm-1; FABMS m/e (relative intensity) 270.1447
(100, M+H, 270.1454 calcd. for C12H2oNs04 ), 252 (23, M-H20).
4-Nitro-N-{3-dirnethylarninopropyl)pyrrole-2-carboxylic acid 38
A 610 mg (2.3 mmol) sample of 37 was dissolved in 4 mL ethanol and treated
with 2.5 mL 2.5 M sodium hydroxide at reflux for 2 h. The solvent was removed
under reduced pressure and the residue purified by flash chromatography on silica

-211-
gel eluting with methanol to give the zwitterionic form of 38 in quantitative yield.
1H NMR (DMSO-d6) 6 7.87 (d, lH, J= 2Hz), 6.85 (d, lH, J= 2Hz), 4.49 (t,
2H, J= 7Hz), 2.27 (t, 2H, J= 7Hz), 2.22 (s, 6H), 1.91 (quint, 2H, J= 7Hz); IR
(KBr) 3420 (w), 1630 (m), 1600 (m), 1536 (w), 1500 (s), 1418 (w), 1390 (w), 1346
(s), 1292 (m), 820 (w), 750 (w) cm- 1 ; FABMS m/e (relative intensity) 242.1144
(8, M+H, 242.1141 calcd. for C 10H16N304).
Ethyl 1-methylimidazole-2-carboxylate 3 122
A solution of 1-methylimidazole (3.2 mL, 40 mmol) and triethylamine (10 mL,
72 mmol) in 20 mL acetonitrile was cooled to -30°C. A solution of 7 mL (73 mmol)
ethyl chloroformate in 10 mL acetonitrile was added rapidly and the solution was
warmed to 25°C and stirred for 18 h. The reaction mixture was filtered and the
solvent removed under reduced pressure. The residue was dissolved in 50 mL
water, extracted with chloroform (3 x 50 mL) and the organic layers combined,
dried (sodium sulfate), and concentrated. Purification by flash chromatography
on silica gel using ethyl acetate produced 3.11 g (51%) of 3 as a light yellow solid.
1H NMR (DMSO-d6) 6 7.43 (s, lH), 7.04 (s, lH), 4.26 (q, 2H, J= 7Hz), 3.89
(s, 3H), 1.28 (t, 3H, J= 7Hz); IR (KBr) 1706 (s), 1478 (m), 1420 (s), 1384 (m),
1260 (s), 1124 (m) cm-1; FABMS mje (relative intensity) 161.0900 (94, M + Li,
161.0902 calcd. for C7H10N202Li), 155 (100, M+H), 127 (79, M+H-C2H4), 109
(94, M+H- EtOH).

-212-
1-Methylimidazole-2-carboxylic acid 4 122
To a solution of 1.95 g (10.0 mmol) 3 in 20 mL ethanol was added 20 mL
0.5 M lithium hydroxide (11.5 mmol). After 5 h, the ethanol was removed in
vacuo and the remaining solution lyophilized to dryness. The white powder was
taken up in a minimum amount of water, cooled to 0°C, acidified to pH 2 with
6 M hydrochloric acid, and a minimum amount of acetone was added to precipitate
1.04 g 4 containing -10% 1-methylimidazole (77% yield). 1H NMR (DMSO-d6 )
6 7.50 (s, 1H), 7.27 (s, 1H), 3.99 (s, 3H); IR (KBr) 3450 (w), 2600 (m), 1980
(w), 1652 (s), 1514 (m), 1462 (m), 1402 (s), 1354 (s), 1312 (s), 1276 (m), 1172
(w), 1014 (w), 906 (w), 800 (s), 778 (m), 632 (w) cm- 1 ; ElMS mje (relative
intensity) 126.0428 (17, M+, 126.0430 calcd. for C5 H 6 N2 0 2 ), 109 (6, M-OH),
108 (7, M-H2 0), 82 (100, M-C02 ).
Ethy I 4-nitro-1-methy limidazole-2-carboxy late 24 113
A mixture of 1.05 g 3 (3.74 mmol), 4 mL concentrated sulfuric acid , and
4 mL fuming nitric acid was heated to 95°C for 1 h. The reaction was cooled,
poured onto ice, and extracted with carbon tetrachloride (3 x 50 mL), then di
chloromethane (3 x 50 mL). The dichloromethane layers were dried over sodium
sulfate, concentrated under vacuum, and the solid was recrystallized from carbon
tetrachloride containing a few drops of ethanol. Yield: 303 mg white crystals
(22%). mp 124-127°C (lit 113 130-131°C); 1H NMR (DMSO-d6 ) 6 8.63 (s, 1H),
4.34 (q, 2H, J= 7Hz), 3.98 (s, 3H), 1.32 (t, 3H, J= 7Hz); IR (KBr) 3130 (m),
-213-
1720 (s), 1538 (s), 1510 (m), 1496 (s), 1444 (m), 1380 (m), 1364 (m), 1340 (m),
1308 (s), 1260 (s), 1172 (w), 1140 (m), 1118 (s), 1008 (w), 992 (w), 858 (w), 840
(w), 822 (m), 756 (w), 652 (w) cm- 1 ; FABMS m/e (relative intensity) 206.0751
(100, M+Li, 206.0753 calcd. for C 7 H9 N3 0 4Li), 200 (37, M+H).
4-Nitro-1-methylimidazole-2-carboxylic acid 25 113
275 m.g (1.38 mmol) 24 was heated at reflux in 2 mL 0.25 M sodium hydroxide
for 15 min. The reaction was cooled to 50° C and acidified to pH 2. Further cooling
gave 235 mg (99%) 25 as a white solid. 1 H NMR (DMSO-d6 ) 6 8.58 (s, 1H), 3.97
(s, 3H); IR (KBr) 3000 (w), 1724 (s), 1548 (s), 1518 (m), 1502 (s), 1460 (w), 1390
(s), 1340 (m), 1300 (s), 1208 (m), 1154 (s), 1136 (m), 1070 (w), 1006 (w), 938 (w),
922 (w), 760 (w), 750 (w), 700 (s) cm- 1 ; FABMS m/e (relative intensity) 170.0204
(M-H, 170.0202 calcd. for CsH4Ns04)·
1- ( 2-Chloroethy 1) imidazole 18
A commercial sample of 60% sodium hydride (5.0 g, 125 mmol) was washed
with hexane (3 x 75 mL) and dried in vacuo . THF (180 mL) then 5.0 g (73 mmol)
imidazole were added cautiously with positive argon flow to remove hydrogen.
10 mL (120 mmol) 1-bromo-2-chloroethane was then added, and the mixture stirred
for 30 min at 25°C and 4 h at reflux. After filtration and removal of the solvent
under reduced pressure, the remaining oil was purified by flash chromatography on
silica gel using 5% methanol in dichloromethane to yield 3. 72 g (39%) 18 containing
a small amount of 1-vinylimidazole. 1 H NMR (DMSO-d6 ) 6 7.65 (s, 1H), 7.22 (d,
-214-
1H, J = 1Hz), 6.89 (s, 1H), 4.30 (t, 2H, J= 6Hz), 3.92 (t, 2H, J = 6Hz); IR
(film) 3100 (w), 1506 (s), 1458 (w), 1284 (w), 1226 (m), 1102 (w), 1076 (m) , 922
(w), 816 (w) , 738 (w), 660 (s), 580 (w) cm- 1 ; FABMS m / e (relative intensity) 139
(72, M + 2+Li), 137.0457 (88, M+Li, 137.0458 calcd. for C5 H7 N235C1Li), 133 (91,
M+2+ H), 131 (100, M + H).
4-Nitrophenyl 1-(2-chloroethyl)imidazole-2-carboxylate, 19
To a solution of 500 mg (3.8 mmol) 18 and 1.4 mL (8.1 mmol) diisopropy
lethylamine in 10 mL acetonitrile at -40°C was added rapidly a solution of 1.55 g
(7.7 mmol) 4-nitrophenyl chloroformate in 10 mL acetonitrile at -40°C. There
action solidified upon warming and was allowed to stand at 25°C for 18 h. The
mixture was diluted with 50 mL acetonitrile, filtered and evaporated under reduced
pressure to a yellow oil. Purification by flash chromatography on silica gel eluting
with 40% ethyl acetate in hexane gave 563 mg ( 49%) of a yellow solid which was
-95% pure 19 (the rest is diisopropylammonium 4-nitrophenylate). An analytical
sample was obtained by washing with ethyl acetate. 1 H NMR (DMSO-d6) 6 8.35
(d, 2H, J = 9Hz), 7.72 (s, 1H), 7.61 (d, 2H, J = 9Hz), 7.26 (s, 1H), 4.74 (t, 2H,
J = 6Hz), 4 .02 (t, 2H, J = 6Hz); IR (KBr) 3100 (w), 1732 (s), 1615 (w), 1588 (m),
1512 (s), 1485 (m), 1470 (m), 1448 (w), 1436 (w), 1406 (s), 1386 (m), 1366 (w),
1345 (s), 1324 (w), 1308 (m) , 1270 (w), 1240 (s), 1200 (s), 1160 (m) , 1152 (m) ,
1140 (m), 1106 (m), 1082 (s), 1060 (s), 915 (w), 860 (m), 798 (w), 780 (w), 740
(w), 702 (w) cm- 1 ; FABMS m / e (relative intensity) 304 (65, M + 2+Li), 302.0535

-215-
(88, M+Li, 302.0520 calcd. for C 12H 10N3 0 435C1Li), 298 (49, M+2+H), 296 (84,
M+H) .
1-(2-Chloroethyl)imidazole-2-carboxylic acid 20
A solution of 278 mg (0.94 mmol) 19 in 4 mL THF was treated with 2 mL of
1.25 M sodium hydroxide at 25°C for 45 min. The yellow solution was titrated with
6 M hydrochloric acid until clear, the THF was removed in vacuo, and the water
layer washed with dichloromethane (3 x 5 mL). The water layer was lyophilized and
the solid extracted with methanol (2 x 5 mL). The methanol was filtered through
Celite and evaporated to give 20 as an unstable clear glass containing some sodium
chloride. 1H NMR (DMSO-d6 ) o 7.63 (s, 1H), 7.33 (s, 1H), 4.84 (t, 2H, J= 6
Hz), 4.01 (t, 2H, J= 6Hz); IR (KBr) 3400 (s), 3100 (s), 2900 (s), 1655 (s), 1500
(w), 1460 (w), 1360 (m), 800 (m), 762 (w) cm- 1 ; FABMS mje (relative intensity)
183 (16, M+2+Li), 181.0348 (38, M+Li, 181.0356 calcd. for C6 H7 N2 0 235C1Li),
177 (17, M+2+H), 175 (49, M+H), 157 (32, M+H-H2 0), 131 (72, ClEtlm+H).
Me thy I 4- ( 1-( 2-chloroethy I) imidazole-2-carboxamide )-N -met by 1-
pyrrole-2-carboxylate 22
Methyl 4-nitro-N-methylpyrrole-2-carboxylate (198 mg, 1.20 mmol) in 8 mL
dry DMF was hydrogenated with 5% paladium on charcoal at 25°C and 1 atmo
sphere for 8 h. After filtration, the solvent was removed at <1 Torr. A solution of
130 mg (0.74 mmol) 20 and 208 mg (1.54 mmol) N-hydroxybenzotriazole at 0°C
was treated with 149 mg (0. 72 mmol) dicyclohexylcarbodiimide. The reaction was

-216-
warmed, stirred for 7 h at 25°C, and a solution of the pyrrole amine in 2 mL dry
DMF was added. After 14 h, the reaction was filtered, and the solvent removed
at <1 Torr. Purification by flash chromatography on silica gel using 40% ethyl
acetate in hexane yielded 69 mg (31 %) 22 as a yellow solid. 1 H NMR (DMSO-d6 )
6 10.62 (s, 1H), 7.53 (s, 1H), 7.50 (s, 1H), 7.07 (s, 1H), 7.03 (d, 1H, J= 2
Hz), 4.77 (t, 2H, J= 6Hz), 3.98 (t, 2H, J= 6Hz), 3.83 (s, 3H), 3.72 (s, 3H); IR
(KBr) 3210 (m), 2930 (w), 1684 (s), 1652 (s), 1626 (m), 1578 (s), 1558 (s), 1508
(w), 1464 (s), 1448 (s), 1436 (m), 1420 (m), 1254 (s), 1195 (m), 1108 (s), 1094
(w), 780 (w), 756 (w), 650 (w), 620 (w) cm- 1 ; FABMS mje (relative intensity) 319
(68, M+2+Li), 317 (87, M+Li), 313 (63, M+2+H), 311.0909 (88, M+H, 311.0911
calcd. for C 13H16N 4 0 335Cl), 295 (25, M+H-0), 281 (34, M+H-CH2 0).
Me thy 1 4- (Imidazo[ 1,2-a ]pyrazinecarboxamide )-N-methyl-2-carboxy late
23
A solution of 27 mg (0.091 mmol) 22 in 15 mL dry THF containing 12 mg
60% sodium hydride and 5 mg sodium iodide was warmed to 35°C and stirred for
15 min. The solvent was removed under reduced pressure and the solid purified
by flash chromatography on silica gel (5% methanol in dichloromethane) to give
17 mg (72%) white solid 23. 1H NMR (DMSO-d6 ) 6 7.54 (d, 1H, J= 2Hz), 7.39
(s, 1H), 7.13 (s, 1H), 7.02 (d, 1H, J = 2Hz), 4.37 (t, 2H, J= 6Hz), 4.11 (t, 2H,
J = 6Hz), 3.87 (s, 3H), 3.75 (s, 3H); IR (KBr) 1712 (m), 1680 (w), 1664 (s), 1510
(w), 1486 (m), 1456 (m), 1402 (m), 1260 (m), 1200 (w), 1148 (w), 1104 (w), 1058

-217-
(w), 762 (w) cm-1; FABMS mje (relative intensity) 281 (100, M+Li), 275.1143
(79, M+H, 275.1144 calcd. for C13H14N4 03), 263 (46, M+Li-H2 0) .
General Procedure for Preparing ArN
A solution of 80 mg (0.21 mmol) 4-nitro-di-(N-methylpyrrole)-2-dimethyl
aminopropylcarboxamide and 15 mg of 5% paladium on charcoal in dry DMF
(12 mL) was hydrogenated at atmospheric pressure for 12 h. The solution was
filtered, and the DMF removed at <1 Torr. Several methods were used for acid
activation:
Method A
Carbonyldiimidazole (68 mg, 0.42 mmol) was added separately to a solution
of 0.42 mmol of the appropriate acid, and the solution stirred at 25°C for 1 h.
Method B
A solution of 0.42 mmol of the aromatic acid and 136 mg (1.0 mmol) N
hydroxybenzotriazole in 2 mL dry DMF was cooled to 0°C and 104 mg (0.5 mmol)
dicyclohexylcarbodiimide was added. The solution was warmed to 25°C and stirred
for 14 h.
Method C
The aromatic acid (0.42 mmol) was suspended in 10 mL thionyl chloride and
heated to reflux for 1 h . The excess thionyl chloride was removed in vacuo and
the residue cooled to 0°C and dissolved in 2 mL dry DMF containing 0.2 mL
(1.4 mmol) triethylamine.

-218-
The pyrrole amine was dissolved in 2 mL dichloromethane, added to the acti
vated acid, and the solution stirred for 14 h. The solvent was removed at <1 Torr ,
and the orange oil chromatographed with 0.25% concentrated aqueous ammonia
in methanol. The products were lyophilized from dilute hydrochloric acid, and
characterized as the hydrochloride salts.
Furan-2-carboxarnide-netropsin (2-FuN)
Furan-2-carboxylic acid was activated by method A, yielding 35 mg 2-FuN,
35%. UV-vis Amax(e) 253 (21,000), 303 (25,000) nm; 1H NMR (DMSO-d6) 6 10.33
(s, 1H), 9.96 (s, 1H), 9.78 (bs, 1H), 8.17 (t, 1H, J= 6Hz), 7.89 (s, 1H), 7.25 (d,
1H, J= 2Hz), 7.22 (d, 1H, J= 3Hz), 7.19 (s, 1H), 7.07 (s, 1H), 6.92 (s, 1H),
6.66 (dd, 1H, J= 3, 1Hz), 3.85 (s, 3H), 3.81 (s, 3H), 3.24 (q, 2H, J= 6Hz),
3.08 (t, 2H, J= 7 Hz), 2.74 (s, 6H), 1.84 (quint, 2H, J= 7 Hz); IR (KBr) 2920
(w), 2700 (w), 1650 (s), 1580 (m), 1526 (s), 1464 (m), 1436 (s), 1400 (m), 1260
(m) cm- 1 ; FABMS m/e (relative intensity) 441.2245 (56, M+H, 441.2250 calcd.
for C22H29N604), 339 (20, M+H-CsH14N2), 217 (27).
Furan-3-carboxamide-netropsin (3-FuN)
Furan-3-carboxylic acid was activated by method A, yielding 74 mg 3-FuN,
79%. UV-vis ,\max(e) 246 (19,500), 299 (23,000) nm; 1H NMR (DMSO-d6) 6 10.12
(bs, 1H), 10.07 (s, 1H), 9.94 (s, 1H), 8.30 (s, 1H), 8.17 (t, 1H, J= 6Hz), 7.75
(t, 1H, J= 1Hz), 7.25 (d, 1H, J= 2Hz), 7.19 (d, 1H, J= 2Hz), 7.02 (d, 1H, J=
2Hz), 6.97 (s, 1H), 6.91 (d, 1H, J= 2Hz), 3.85 (s, 3H), 3.80 (s, 3H), 3.24 (q,

-219-
2H, J= 6Hz), 3.04 (dt, 2H, J= 8, 6Hz), 2.74 (d, 6H, J= 5Hz), 1.85 (quint, 2H,
J= 7Hz); IR (KBr) 2920 (w), 2700 (w), 1640 (s), 1580 (m), 1528 (s), 1460 (m),
1436 (s), 1401 (m), 1260 (m), 1202 (w), 1158 (m) cm-1; FABMS mje (relative
intensity) 441.2256 (7, M+H, 441.2250 calcd. for C22H29N60 4).
Thiophene-2-car boxamide-netropsin ( 2-ThN)
Thiophene-2-carboxylic acid was activated by method A, yielding > 4 7 mg
2-ThN, > 48%. UV-vis Amax(€) 246 (21,500), 300 (26,000) nm; 1H NMR (DMSO
d6) 6 10.43 (s, 1H), 10.17 (bs, 1H), 9.97 (s, 1H), 8.19 (t, 1H, J= 7Hz), 7.97 (d,
1H, J= 4Hz), 7.79 (dd, 1H, J= 5, 1Hz), 7.27 (d, 1H, J= 2Hz), 7.20 (d, 1H,
J= 2Hz), 7.19 (dd, 1H, J= 5, 1 Hz), 7.09 (d, 1H, J= 2 Hz), 6.93 (d, 1H, J= 2
Hz), 3.85 (s, 3H), 3.81 (s, 3H), 3.24 (q, 2H, J= 7 Hz), 3.06 (dt, 2H, J= 8, 6
Hz), 2.78 (d, 6H, J= 5Hz), 1.86 (quint, 2H, J= 7Hz); IR (KBr) 2940 (w), 2700
(w), 1640 (s), 1580 (m), 1532 (s), 1462 (m), 1436 (s), 1401 (m), 1260 (m), 1200
(w), 1100 (w) cm-1; FABMS mje (relative intensity) 457.1985 (67, M+, 457.2804
calcd. for C22H29N60sS), 355 (17, M-CsH14N2).
Thiophene-3-car boxamide-netropsin ( 3-ThN)
Thiophene-3-carboxylic acid was activated by method A, yielding 74 mg 3-
ThN, 75%. UV-vis Amax(€) 202 (23,500), 243 (22,500), 298 (25,000) nm; 1H NMR
(DMSO-d6) 6 10.31 (s, 1H), 10.23 (s, 1H), 9.97 (s, 1H), 8.28 (t, 1H, J= 2 Hz),
8.19 (t, 1H, J= 6Hz), 7.62 (d, 2H, J= 2Hz), 7.29 (d, 1H, J= 2Hz), 7.15 (d,
1H, J= 2Hz), 7.07 (d, 1H, J= 2Hz), 6.91 (d, 1H, J= 1Hz), 3.85 (s, 3H), 3.80
-220-
(s, 3H), 3.24 (q, 2H, J= 6Hz), 3.04 (dt, 2H, J= 8, 6Hz), 2.73 (d, 6H, J= 7Hz),
1.86 (quint, 2H, J = 7Hz); IR (KBr) 2920 (w), 2700 (w), 1640 (s), 1580 (m), 1530
(s), 1460 (m), 1436 (s), 1401 (m), 1260 (m) cm- 1 ; FABMS mje (relative intensity)
457.2003 (100, M+, 457.2804 calcd. for C22H29N6 0 3 S), 412 (8, M-C2H 7 N), 355
(27, M- CsH14N2)·
N-methy lpyrrole-2-carboxamide-netropsin ( 2-Pr N)
N-methylpyrrole-2-carboxylic acid was activated by method A, yielding 34 mg
2-PrN, 34%. UV-vis .Xmax(£) 240 (19,500), 297 (31,500) nm; 1 H NMR (DMSO-d6 )
8 9.90 (s, 1H), 9.83 (s, 1H), 9.70 (bs, 1H), 8.16 (t, 1H, J= 6Hz), 7.22 (d, 1H,
J = 2Hz), 7.17 (d, 1H, J= 2Hz), 7.03 (d, 1H, J= 2Hz), 6.94 (t, 1H, J= 2Hz),
6.92 (d, 1H, J= 2Hz), 6.91 (dd, 1H, J= 4, 2Hz), 6.05 (dd, 1H, J= 4, 2Hz),
3.87 (s, 3H), 3.84 (s, 3H), 3.80 (s, 3H), 3.23 (q, 2H, J= 6Hz), 3.04 (t, 2H, J=
6Hz), 2.75 {s, 6H), 1.84 (quint, 2H, J= 7Hz); IR (KBr) 3400 {m), 3300 (m),
2950 (w), 1640 (s), 1580 {m), 1536 (s), 1464 (m), 1436 {m), 1315 (w), 1252 {m) ,
1200 (w), 1108 (w), 740 (w) cm- 1 ; FABMS mje (relative intensity) 454.2574 {55,
M + H, 454.2567 calcd. for C2sHs2N10s).
Pyridine-2-carboxamide-netropsin { 2-Py N)
Pyridine-2-carboxylic acid was activated by method A, yielding 65 mg 2-PyN,
64%. UV-vis Arnax(f) 223 {sh, 21,000), 238 (22,000), 296 {26,000) nm; 1 H NMR
{DMSO-d6 ) 8 10.73 (s, 1H), 9.95 (s, 1H), 8.71 (dd, 1H, J= 6, 2Hz), 8.17 (t, 1H,
J = 7Hz), 8.11 {d, 1H, J= 8Hz), 8.05 (ddd, 1H, J = 8, 8, 2Hz), 7.64 (ddd, 1H,

-221-
J= 8, 5, 2Hz), 7.37 (d, 1H, J= 2Hz), 7.24 (d, 1H, J= 2Hz), 7.18 (d, 1H, J = 2
Hz) , 6.93 (d, 1H, J= 2Hz), 3.85 (s, 3H), 3.81 (s, 3H), 3.23 (q, 2H, J= 7Hz),
3.02 (t, 2H, J= 7Hz), 2.74 (s, 6H), 1.84 (quint, 2H, J= 7Hz); IR (KBr) 2910
(w), 2700 (w), 1640 (s), 1580 (s), 1530 (s), 1460 (rn), 1432 (s), 1400 (m), 1260 (rn) ,
1200 (w), 1120 (w) cm- 1 ; FABMS mje (relative intensity) 452.2427 (60, M+H,
452.2410 calcd. for C2sHsoN10s), 350 (28, M-CsH14N2), 228 (46).
Pyridine-3-carboxamide-netropsin ( 3-Py N)
Pyridine-3-carboxylic acid was activated by method A, yielding > 31 mg 3-
PyN, > 32%. UV-vis Amax(e) 213 (19,500), 246 (19,500), 300 (23,500) nrn; 1 H
NMR (DMSO-d6 ) o 10.64 (s, 1H), 9.98 (s, 1H), 9.77 (bs, 1H), 9.14 (d, 1H, J= 2
Hz), 8.77 (dd, 1H, J= 6, 5Hz), 8.38 (d, 1H, J= 9Hz), 8.17 (t, 1H, J= 6Hz),
7.64 (dd, 1H, J= 9, 6Hz), 7.35 (d, 1H, J= 2Hz), 7.19 (d, 1H, J= 2Hz), 7.10 (d,
1H, J = 2Hz), 6.93 (d, 1H, J= 2Hz), 3.87 (s, 3H), 3.81 (s, 3H), 3.24 (q, 2H, J=
5Hz), 3.05 (dt, 2H, J= 8, 7Hz), 2.76 (d, 6H, J= 5Hz), 1.84 (quint, 2H, J= 8
Hz); IR (KBr) 3100 (w), 2940 (w), 2700 (w), 1670 (m), 1632 (s), 1575 (s), 1550 (s),
1530 (s), 1464 (m), 1434 (s), 1422 (s), 1260 (m), 1200 (w), 1120 (w) cm- 1 ; FABMS
rn/e (relative intensity) 452.2399 (2, M+H, 452.2410 calcd. for C23H30N703).
Pyridine-4-carboxamide-netropsin ( 4-PyN)
Pyridine-4-carboxylic acid was activated by method A, yielding 69 mg 4-PyN,
72%. UV-vis .Xmax(e) 209 (22,500), 241 (17,500), 293 {22,500) nrn; 1H NMR
(DMSO-d6 ) o 10.82 (s, 1H), 10.00 (s, 1H), 8.84 (d, 2H, J = 6 Hz), 8.18 (t,

-222-
1H, J= 7Hz), 8.01 (d, 2H, J= 6Hz), 7.38 (d, 1H, J= 2Hz), 7.20 (d, 1H, J = 2
Hz), 7.13 (d, 1H, J= 2 Hz), 6.93 (d, 1H, J= 2 Hz), 3.87 (s, 3H), 3.81 (s, 3H),
3.23 (q, 2H, J= 7Hz), 3.02 (t, 2H, J= 7Hz), 2.74 (s, 6H), 1.84 (quint, 2H, J=
7Hz); IR (KBr) 3100 (w), 2950 (w), 2700 (w), 1660 (m), 1640 (s), 1573 (s), 1542
(s), 1462 (m), 1434 (s), 1402 (s), 1288 (w), 1260 (m), 1202 (w) cm- 1 ; FABMS m/e
(relative intensity) 452.2431 (6, M+H, 452.2410 calcd. for C23H30N7 0 3 ).
1-Metbylimidazole-2-carboxamide-netropsin (2-ImN)
Compound 4 was activated by method A, yielding 72 mg 2-ImN, 80%. UV-vis
Amax(e) 255 (19,000), 302 (26,000) nm; 1 H NMR (DMSO-d6) o 10.92 (bs, 1H),
10.05 (bs, 1H), 9.89 (s, 1H), 8.18 (t, 1H, J= 6 Hz), 7.58 (s, 1H), 7.35 (s, 1H),
7.32 (d, 1H, J= 2Hz), 7.18 (d, 1H, J= 2Hz), 7.14 (d, 1H, J= 2Hz), 6.92 (d, 1H,
J= 2Hz), 4.02 (s, 3H), 3.85 (s, 3H), 3.80 (s, 3H), 3.24 (q, 2H, J= 6Hz), 3.04
(m, 2H), 2.74 (d, 6H, J= 5Hz), 1.85 (quint, 2H, J= 7Hz); FABMS m/e (relative
intensity) 455.2519 {M+H, 0.8, 455.2519 calcd. for C22H31 N8 0 3 ), 351 (8).
4-Cbloropyridine-2-carboxamide-netropsin ( 4-ClPyN)
Compound 10 was activated by method A, yielding 90 mg 4-ClPyN, 79%.
UV-vis Amax(e) 200 (45,500), 235 (23,000), 300 (26,500) nm; 1 H NMR (DMSO-dG)
o 10.86 (s, 1H), 9.97 (s, 1H), 9.42 (bs, 1H), 8.69 (d, 1H, J= 5 Hz), 8.15 (t,
1H, J= 6 Hz), 8.10 (d, 1H, J= 2 Hz), 7.80 (dd, 1H, J = 5, 2 Hz), 7.37 (d, 1H,
J = 2Hz), 7.24 (d, 1H, J= 2Hz), 7.18 (d, 1H, J= 2Hz), 6.93 (d, 1H, J = 2
Hz), 3.85 (s, 3H), 3.80 (s, 3H), 3.25 (q, 2H, J= 6Hz), 3.00 (m, 2H), 2.72 (bs,

-223-
6H), 1.81 (quint, 2H, J= 6Hz); IR (KBr) 3330 (m), 1646 (s), 1580 (m), 1540 (s),
1462 (m), 1436 (m), 1406 (m), 1260 (m), 1202 (w), 774 (w) cm- 1 ; FABMS m je
(relative intensity) 486.2027 (65, M+H, 486.2020 calcd. for C 23H29N7 0 335 Cl), 384
(22, M+H-CsH14N2).
4-Dimethylaminopyridine-2-carboxamide-netropsin ( 4-Me2 NPyN)
Compound 11 was activated by method C, yielding 41 mg 4-Me2NPyN, 38%.
UV-vis -Xmax(f) 226 (25,500), 287 (31,500) nm; 1H NMR (DMSO-d6+TFA) 6 11.25
(s, 1H), 10.02 (s, 1H), 9.50 (bs, 1H), 8.19 (d, 2H, J= 7Hz), 7.74 (d, 1H, J=
3Hz), 7.39 (d, 1H, J= 2Hz), 7.18 (d, 1H, J= 2Hz), 7.14 (d, 1H, J= 2Hz),
7.05 (dd, 1H, J= 7, 3Hz), 6 .93 (d, 1H, J= 2Hz), 3.89 (s, 3H), 3.81 (s, 3H),
3.26 (m, 8H), 3.06 (m, 2H), 2.77 (d, 6H, J= 5Hz), 1.83 (quint, 2H, J= 7Hz) ;
IR (KBr) 3400 (m), 3300 (m), 3100 (w), 2950 (w), 1634 (s), 1570 (s), 1532 (m),
1464 (m), 1406 (m), 1262 (w), 1210 (w), 1006 (w), 804 (w), 776 (w) cm- 1 ; FABMS
mje (relative intensity) 517 (6, M+Na), 495.2834 (25, M+H, 495.2832 calcd. for
C2sHssNsOs), 393 (11, M+H-CsH14N2)·
3-Methoxypyridine-2-car boxamide-netropsin ( 3Me0Py N)
Compound 17 was activated by method B, and purified with the usual proce
dure. An additional chromatography step using 10% ammonia saturated methanol
in dichloromethane as the eluent gave 21 mg 3-MeOPyN, 18%. UV-vis Amax(f)
192 (33,000), 234 (20,500), 300 (27,000) nm; 1 H NMR (DMSO-d6) 6 10.34 (s, 1H),
9.94 (s, 1H), 9.80 (bs, 1H), 8.18 (dd, 1H, J = 5, 1 Hz), 8.16 (t, 1H, J= 6 Hz),

-224-
7.62 (dd, 1H, J= 9, 1Hz), 7.51 (dd, 1H, J= 9, 5Hz), 7.26 (d, 1H, J= 2Hz),
7.18 (d, 1H, J= 2Hz), 7.04 (d, 1H, J= 2Hz), 6.92 (d, 1H, J= 2Hz), 3.85 (s,
3H), 3.80 (s, 3H), 3.23 (q, 2H, J= 5Hz), 3.04 (dt, 2H, J= 8, 6Hz), 2.75 (d,
6H, J= 5Hz), 1.84 (quint, 2H, J= 7Hz); IR (KBr) 3400 (s), 1676 (m), 1644 (s),
1556 (m), 1520 (s), 1464 (m), 1436 (m), 1404 (m), 1308 (w), 1268 (m), 1212 (w),
1000 (w), 804 (w), 600 (w) cm-1; FABMS m/e (relative intensity) 482.2514 (34,
M+H, 482.2512 calcd. for C24Hs2N104), 380 (8, M+H-CsH14N2)·
Pyrimidine-2-carboxamide-netropsin ( 2-PmN)
Compound 14 was activated by method A, yielding 55 mg 2-PmN, 57%. UV
vis -Amax(E) 209 (20,000), 238 (17,000), 297 (21,500) nm; 1H NMR (DMSO-d6) 6
10.87 (s, 1H), 9.98 (s, 1H), 9.01 (d, 2H, J= 5Hz), 8.15 (t, 1H, J= 6Hz), 7.71
(t, 1H, J= 5Hz), 7.37 (d, 1H, J= 2Hz), 7.21 (d, 1H, J= 2Hz), 7.18 (d, 1H,
J= 2Hz), 6.92 (d, 1H, J= 2Hz), 3.85 (s, 3H), 3.80 (s, 3H), 3.22 (q, 2H, J = 6
Hz), 2.92 (m, 2H), 2.66 (bs, 6H), 1.80 (quint, 2H, J= 7Hz); IR (KBr) 3400 (m) ,
3300 (m), 2950 (w), 1640 (s), 1560 (s), 1530 (s), 1464 (m), 1436 (s), 1400 (s), 1262
(m), 1206 (w), 1138 (w), 1000 (w), 972 (w), 660 (w), 632 (w) cm-1; FABMS m/e
(relative intensity) 453.2352 (8, M+H, 453.2342 calcd. for C22H29N8 0s), 371 (4).
4-Nitro-1-methylimidazole-2-carboxamide-netropsin (02 NimN)
Compound 25 was activated by method A. Purification by flash chromatog
raphy on silica gel twice gave 39 mg 0 2NlmN, 37%. 1H NMR (DMSO-d6 ) 6 10.87
(s, 1H), 9.94 (s, 1H), 8.61 (s, 1H), 8.07 (t, 1H, J= 7Hz), 7.31 (d, 1H, J = 2

-225-
Hz), 7.18 (s, 2H), 6.83 (d, 1H, J= 2Hz), 4.04 (s, 3H), 3.84 (s, 3H), 3.79 (s, 3H),
3.18 (q, 2H, J= 7Hz), 2.31 (m, 2H), 2.19 (s, 6H), 1.62 (quint, 2H, J= 7Hz); IR
(KBr) 3350 (w), 3120 (w), 2930 (w), 1642 (s), 1580 (m), 1536 (s), 1460 (m), 1436
(m) , 1400 (m), 1382 (m), 1328 (w), 1304 (w), 1258 (w), 1200 (w), 1116 (w), 822
(w) cm-1; FABMS m je (relative intensity) 506.2461 (62, M+Li, 506.2451 calcd.
for C22H2gN9 0 5 Li), 500 (25, M+H), 452 (23).
1-(2-Chloroethyl)imidazole-2-carboxamide-netropsin21
20 was activated by method B, yielding 20 mg 21,17%. 1H NMR (DMSO-d6 )
o 10.55 (s , 1H), 9.90 (s, 1H), 8.05 (t, 1H, J= 7 Hz), 7.50 (s, 1H), 7.28 (d, 1H,
J = 2 Hz), 7.17 (d, 1H, J= 2 Hz), 7.15 (d, 1H, J = 2Hz), 7.08 (d, 1H, J = 1
Hz), 6.82 (d, 1H, J= 2 Hz), 4.78 (t, 2H, J= 6Hz), 4.00 (t, 2H, J= 6Hz), 3.83
(s, 3H), 3.78 (s, 3H), 3.17 (q, 2H, J= 7Hz), 2.22 (t, 2H, J= 7Hz), 2.12 (s,
6H), 1.59 (quint, 2H, J= 7Hz); IR (KBr) 3350 (w), 2920 (w), 1646 (s), 1586 (m),
1530 (s), 1466 (s), 1432 (m), 1400 (w), 1258 (w) , 1104 (w), 774 (w) cm- 1; FABMS
m / e (relative intensity) 505 (23, M+2+H), 503.2283 (59, M+H, 503.2286 calcd.
for C23 Hs2NsOs35Cl), 401 (14, M+H- CsH14N2)·
4-Acetomido-1-methy limidazole-2-carboxamide-netropsin ( AcimN)
0 2NimN (18 mg, 0.036 mmol) was dissolved in 6 mL dry DMF containing
8 mg 5% paladium on charcoal and hydrogenated at 1 atmosphere and 25°C for
12 h. Acetic acid (10mg, 0.17 mmol) was activated by method A. The solutions
were combined and stirred for 14 h. Application of the usual ArN purification

-226-
procedure gave 13 mg (69%) AclrnN, characterized as the hydrochloride salt. UV
vis ~max(f) 207 (22,000), 241 (21,000), 305 (29,500) nm; 1H NMR (DMSO-d6 ) 6
10.24 (s, 1H), 9.97 (s, 1H), 9.93 (s, 1H), 9.81 (bs, 1H), 8.16 (t, 1H, J= 6 Hz),
7.42 (s, 1H), 7.25 (s, 1H), 7.17 (s, 1H), 7.13 (s, 1H), 6.93 (s, 1H), 3.94 (s, 3H),
3.84 (s, 3H), 3.80 (s, 3H), 3.23 (q, 2H, J= 6Hz), 3.04 (dt, 2H, J= 8, 6Hz), 2.75
(d, 6H, J= 5 Hz), 2.02 (s, 3H), 1.84 (quint, 2H, J= 7 Hz); IR (KBr) 3300 (m),
2960 (w), 1646 (s), 1580 (s), 1540 (s), 1464 (m), 1438 (s), 1322 (m), 1260 (m), 1206
(w), 1118 (w), 804 (w), 774 (w) cm- 1 ; FABMS m/e (relative intensity) 512.2743
(22, M+H, 512.2733 calcd. for C24Hs4N904), 371 (8).
Imidazo[1,2-a]pyrazinecarboxamide-netropsin (CycN)
A solution of 17 mg (0.034 mmol) ClEtlrnN in 15 mL dry THF containing
25 mg 60% sodium hydride and 5 mg sodium iodide was warmed to 35°C for
0.5 h. Flash chromatography on silica gel eluting with 0.5% concentrated aqueous
ammonia in methanol produced 15 mg (95%) CycN, which was characterized as
the hydrochloride salt. UV-vis ~max(f) 248 (16,000), 293 (23,000) nm; 1H NMR
(DMSO-d6 ) 6 10.39 (bs, 1H), 10.05 (s, 1H), 8.21 (t, 1H, J = 6Hz), 7.80 (s, 1H),
7.67 (s, 1H), 7.42 (s, 1H), 7.26 (s, 1H), 7.20 (s, 1H), 6.93 (s, 1H), 4.57 (t, 2H, J =
6Hz), 4.24 (t, 2H, J= 6Hz), 3.90 (s, 3H), 3.81 (s, 3H), 3.24 (q, 2H, J= 6Hz),
3.04 (m, 2H), 2.72 (d, 6H, J= 6Hz), 1.87 (quint, 2H, J = 7Hz); IR (KBr) 3400
(m), 3100 (w), 2960 (w), 2700 (w), 1676 (s), 1640 (s), 1574 (m), 1540 (s), 1468 (s),
1440 (s) , 1404 (m), 1365 (m), 1260 (m), 1214 (w), 1142 (w), 1100 (w), 1060 (w),

-227-
778 (w), 612 (w) cm- 1 ; FABMS mje (relative intensity) 489 (30, M+Na), 467.2521
(29, M+H, 467.2521 calcd. for C23H31 N8 0 3), 413 (17), 371 (34).
Synthesis of ArD
The synthesis of ArD followed the procedure for ArN exactly except that the
nitro-tri-N-methylpyrrole starting material was hydrogenated for 18 h. Purification
by flash chromatography on silica gel used 1% concentrated aqueous ammonia in
methanol as the eluting solvent.
Pyridine-2-car boxamide-distamycin ( 2-Py D)
Pyridine-2-carboxylic acid was activated by method A, yielding 53 mg 2-PyD,
57%. UV-vis Amax(f) 241 (28,500), 310 (38,500) nm; 1H NMR (DMSO-d6) 6 10.74
(s, 1H), 10.00 (s, 1H), 9.93 (s, 1H), 9.89 (bs, 1H), 8.71 (d, 1H, J= 4Hz), 8.17 (t,
1H, J= 6Hz), 8.12 (d, 1H, J= 8Hz), 8.03 (ddd, 1H, J= 8, 8, 2Hz), 7.64 (ddd,
1H, J = 7, 5, 2 Hz), 7.39 (d, 1H, J= 2 Hz), 7.25 (d, 1H, J= 2Hz), 7.24 (d, 1H,
J = 2Hz), 7.18 (d, 1H, J = 2Hz), 7.07 (d, 1H, J = 2Hz) , 6.93 (d, 1H, J = 2Hz) ,
3.87 (s, 3H), 3.84 (s, 3H), 3.81 (s, 3H), 3.24 (q, 2H, J = 7Hz), 3.06 (m, 2H),
2.75 (d, 6H, J= 5Hz), 1.84 (quint, 2H, J= 7 Hz); IR (KBr) 3300 (m) , 1640 (s),
1580 (s), 1522 (s), 1464 (m), 1432 (s), 1404 (m), 1258 (m), 1204 (w), 1100 (w), 772
(w) cm- 1 ; FABMS m je (relative intensity) 574.2872 (0.6, M+H, 574.2890 calcd.
for C29Hs6 N904), 351 (0.8).

-228-
1-Methy limidazole-2-carboxamide-distamycin ( 2-ImD)
4 was activated by method A, yielding 51 mg 2-ImD, 47%. UV-vis Amax( ~:)
248 (27,500), 307 (41,000) nm; 1H NMR (DMSO-d6) 6 10.74 (bs, lH), 9.99 (s,
lH), 9.91 (s, lH), 9.88 (bs, lH), 8.16 (t, lH, J= 6Hz), 7.51 (s, lH), 7.31 (d,
lH, J= 2Hz), 7.23 (d, 2H, J= 2Hz), 7.18 (d, lH, J= 2Hz), 7.17 (d, lH, J= 2
Hz), 7.06 (d, lH, J= 2 Hz), 6.93 (d, lH, J= 2 Hz), 4 .01 (s, 3H), 3.86 (s, 3H),
3.83 (s, 3H), 3.80 (s, 3H), 3.24 (q, 2H, J= 5Hz), 3.05 (m, 2H), 2.75 (d, 6H, J=
5Hz), 1.85 (quint, 2H, J= 8Hz); IR (KBr) 3400 (m), 3300 (m), 3130 (w), 2960
(w), 2700 (w), 1680 (m), 1642 (s), 1580 (s), 1540 (s), 1466 (s), 1436 (s), 1404 (s),
1348 (w), 1258 (m), 1204 (w), 1138 (w), 1100 (w), 775 (w), 604 (w) cm- 1 ; FABMS
m/e (relative intensity) 577.2984 (12, M+H, 577.2970 calcd. for C28H37N100 4) .
3-Dime thy laminopropy 1-4-( 1-methy !imidazole-2-carboxamide )-
N -methy lpyrrole-2-carboxamide ( 2-ImP)
The synthesis of 2-ImP followed the exact procedure for ArN, except that the
4-nitro-N-me thy 1 pyrrole-2-( 3-dimethy laminopropy 1) carboxamide starting material
was hydrogenated for 18 h. Yield(method A) : 50 mg 2-ImP, 48% . UV-vis Amax(€)
259 (15,000), 286 (18,500) nm; 1 H NMR (DMSO-d6) 6 11.08 (s, lH), 10.33 (bs,
lH), 8.27 (t, lH, J= 6Hz), 7.64 (s, lH), 7.44 (s, lH), 7.29 (d, lH, J= 1Hz),
7.00 (d, lH, J = 1Hz), 4.02 (s, 3H), 3.82 (s, 3H), 3.23 (q, 2H, J= 6Hz), 3.03 (m,
2H), 2.72 (d, 6H, J= 6Hz), 1.86 (quint, 2H, J= 7Hz); IR (KBr) 3470 (m), 3320
(m) , 3250 (m), 3100 (s), 2940 (m), 2700 (m), 1684 (s), 1646 (s), 1574 (m), 1530
-229-
(s), 1478 (m), 1460 (m), 1440 (s), 1408 (m), 1356 (w), 1282 (w), 1260 (s) , 1204
(w) , 1140 (w), 800 (w), 750 (w), 590 (w) cm- 1 ; FABMS m / e (relative intensity)
333.2036 (73, M+H, 333.2033 calcd. for C 16 H25 N6 0 2).
N-Methyl, N-{2,2-diethoxyethyl)guanadinium acetate 27131
A 5.6 g (38 mmol) sample of N-methylaminoacetaldehyde diethyl acetal and
5 .1 g (121 mmol) cyanamide were dissolved in 20 mL water, and acidified to pH 5
with acetic acid(> 3 mL). The solution was heated to 75°C and stirred for 45 min.
The solvent was removed at <1 Torr and the residue triturated with ether and
washed with acetone. The solid product was recrystallized from ethanol/ ethyl
acetate to give 2.1 g (22%) 27 as a white powder. 1 H NMR (DMSO-d6 ) o 4.62
(t, 1H, J = 5 Hz), 3.64 (dq, 2H, J= 9, 7 Hz), 3.50 (dq, 2H, J= 9, 7 Hz), 3.35
(d, 2H, J= 5 Hz), 2 .90 (s, 3H), 1.62 (s, 3H), 1.10 (t, 6H, J= 7 Hz) ; IR (KBr)
3100 (s), 1688 (m), 1606 (s), 1575 (s), 1410 (s), 1122 (m), 1060 (m) , 1020 (w) , 692
(w) cm- 1 ; FABMS m/e (relative intensity) 190 (100, M+), 176.1400 (24, M - CH2,
176.1399 calcd. for C1H 18N302), 144 (76, M-EtOH).
2-Amino-1-methylimidazole hydrochloride 28131
A solution of 2.0 g (8.0 mmol) 27 in 7 mL concentrated hydrochloric acid
was heated to 75°C for 15 min. The solution was concentrated to dryness under
reduced pressure and recrystallized from ethanol/ether to give 782 mg (73%) 28
as white needles. 1H NMR (DMSO-d 6 ) o 12.21 (bs, 1H), 7.72 (bs, 2H), 6.94 (d,
1H, J= 3 Hz) , 6.87 (d, 1H, J= 3 Hz), 3.45 (s, 3H); IR (KBr) 3270 (s), 3130 (s),

-230-
1664 (s), 1614 (m) , 1544 (w), 1360 (w), 1080 (w) , 742 (m), 598 (w), 588 (m) cm- 1;
ElMS m / e (relative intensity) 97.0641 (100, M+, 97.0640 calcd. for C4 H7 N3 ), 82
(11, M - NH3).
Synthesis of 0 2NP Ar
Acylation of the amino heterocycles followed the published procedure for acy
lation of 2-aminopyridine.130
4-Nitro-N -met by lpyrrole-2- ( 1-methy limidazole) carboxamide, 29
4-Nitro-N-methylpyrrole-2-carboxylic acid (513 mg, 3.2 mmol) was heated at
reflux in thionyl chloride for 1 h . The excess was removed in vacuo and the residual
solid dissolved in 15 mL pyridine. 28 {503 mg, 3.8 mmol) was added, and the
reaction heated at reflux for 5 h. The liquid was poured onto ice, the precipitate
was collected, washed with water {3 x 20 mL) and dried to give 0 .66 g (85%) 29, a
brown solid. 1H NMR {DMSO-d6 +TFA) 6 8.31 {d, 1H, J= 2Hz), 7.84 {d, 1H, J =
2Hz) , 7.54 (d, 1H, J= 2Hz), 7.45 (d, 1H, J= 2Hz), 3.95 (s, 3H), 3.75 (s, 3H);
IR {KBr) 3230 (w), 1602 {s), 1560 {m), 1530 {m), 1500 {s), 1432 (w), 1416 (w),
1378 (s), 1320 (s), 1304 (s), 1285 {m), 1066 (w), 876 (w), 818 (w) cm- 1; FABMS
m / e (relative intensity) 250.0945 {4, M+H, 250.0940 calcd. for C 10H 12N5 0 3) , 195
(42).
4-Nitro-N-methylpyrrole-2-pyridinecarboxamide 30
4-Nitro-N-methylpyrrole-2-carboxylic acid (600 mg, 3.8 mmol) was heated at
reflux in thionyl chloride for 1 h. The excess was removed in vacuo and the remain-

-231-
ing tan solid dissolved in 15 mL pyridine. 2-Aminopyridine (540 mg, 5. 7 mmol)
was added, and the reaction heated to reflux and stirred for 5 h . The liquid was
poured onto ice, the precipitate was collected, washed with water (3 x 20 mL) and
dried to give 0. 76 g (86%) 30, a tan solid. 1 H NMR (DMSO-d6 ) 6 10.78 (s, 1H) ,
8.37 (dd, 1H, J= 5, 1Hz), 8.24 (d, 1H, J= 2Hz), 8.08 (dd, 1H, J= 9 , 1 Hz),
7.90 (d, 1H, J= 2 Hz), 7.82 (ddd, 1H, J= 9, 9, 2 Hz), 7.16 (ddd, 1H, J= 9, 6,
1Hz), 3.96 (s, 3H); IR (KBr) 1680 (m), 1582 (m), 1536 (s), 1500 (s), 1460 (m) ,
1435 (m), 1420 (m), 1402 (w), 1320 (s), 1302 (s), 1234 (w), 1198 (w), 770 (w), 748
(w) cm-1; FABMS m/e (relative intensity) 247.0829 {35, M+H, 247.0831 calcd.
for CuHuN40s), 195 (44).
4-Nitro-N-methylpyrrole-2-methyl(2-pyridine)carboxamide 31
Alkylation of the heterocyclic amide followed the procedure of Pachter and
Kloetzel. 124 A solution of 203 mg (0.868 mmol) 30 in 25 mL acetone was treated
with 242 mg ( 4.3 mmol) powdered potassium hydroxide and 0.5 mL iodomethane
(8 mmol). After 10 min at reflux, the reaction was filtered and 25 mL water was
added to the filtrate. The acetone was removed in vacuo and the solid collected
and dried, yielding 139 mg 31 {65%), a tan solid. 1H NMR (DMSO-d6 ) 6 8.29 (d,
1H, J= 9Hz), 8.18 (d, 1H, J= 7Hz), 8.06 (d, 1H, J= 2Hz), 7.75 (ddd, 1H,
J= 7, 7, 2 Hz), 7.27 (d, 1H, J= 2 Hz), 6.76 (ddd, 1H, J= 7, 7, 2 Hz), 4.00 (s,
3H), 3.82 (s, 3H); IR (KBr) 1640 (w), 1608 (w), 1556 (w), 1512 (m), 1485 (s),
1452 (m), 1416 (w), 1380 (s), 1308 (s), 1254 (w), 1152 (w), 764 (w) cm-1; FABMS
-232-
m je (relative intensity) 261.0989 (4, M+H, 261.0988 calcd. for C 12H 13N 4 0 3 ), 195
(42) .
Synthesis of 02NNAr
Synthesis of the nitro-dipyrrole compounds followed that of the general Ar N
method. The nitro-monopyrrole compounds were stirred under with 5% paladium
on charcoal under 1 atm hydrogen until TLC showed the disappearance of t he
nitro compound. After filtration, the DMF was removed at <1 Torr. 4-Nitro-N
methylpyrrole-2-carboxylic acid was activated by method C with thionyl chloride.
Both the amine and the acid chloride were dissolved in dry DMF, combined and
stirred with 3 equivalents of triethylamine for 18 h. The reactions were diluted
with water and the precipitate was collected and further purified by flash chro
matography on silica gel eluting with 4% methanol in dichloromethane to give the
corresponding dipyrrole compound.
4-( 4-Nitro-N-methylpyrrole-2-carboxamide)-N-methylpyrrole
N-(1-methylimidazole)carboxamide 32
199 mg 29 was hydrogenated for 48 h, yielding 36 mg (12%) 32 after coupling.
1 H NMR (DMSO-d6 + TFA) 6 11.27 (bs, 1H), 10.42 (s, 1H), 8.19 (s, 1H) , 7.60
(d, 1H, J = 2Hz), 7.55 (d, 1H, J = 2Hz), 7.48 (d, 1H, J = 2Hz), 7.46 (d, 1H,
J = 2Hz), 7.38 (s, 1H), 3.95 (s, 3H), 3.89 (s, 3H), 3 .73 (s, 3H); IR (KBr) 3300
(w), 3130 (w), 1660 (w) , 1588 (m), 1540 (m), 1506 (m), 1484 (m), 1440 (m) , 1400

-233-
(m), 1310 (s), 1110 (w), 750 (w) cm- 1; FABMS m / e (relative intensity) 372.1420
(5, M+H, 372.1420 calcd. for C 16H 18N7 0 4) .
4-( 4-Nitro-N-methylpyrrole-2-carboxamide)-N-methylpyrrole-
2-pyridinecarboxamide 33
202 mg 30 was hydrogenated for 11 h, yielding 129 mg ( 43%) 33 after coupling.
1H NMR (DMSO-d6) o 10.35 (s, 1H), 10.32 (s, 1H), 8.35 (d, 1H, J= 6Hz), 8.19
(d, 1H, J= 2Hz), 8.07 (d, 1H, J= 9Hz), 7.77 (ddd, 1H, J= 9, 9, 2Hz), 7.61
(d, 1H, J= 2Hz), 7.41 (d, 1H, J= 2Hz), 7.16 (d, 1H, J= 2Hz), 7.09 (ddd,
1H, J = 7, 7, 1 Hz), 3.95 (s, 3H), 3.87 (s, 3H); IR (KBr) 1660 (m), 1578 (m),
1518 (s), 1504 (s), 1470 (w), 1436 (w), 1404 (m), 1310 (s), 1200 (w), 1106 (w), 780
(w) cm-1; FABMS m/e (relative intensity) 369.1333 (5, M+H, 369.1311 calcd. for
C11H11N604), 195 (38).
4-(4-Nitro-N-methylpyrrole-2-carboxamide)-N-methylpyrrole-
2-methyl(2-pyridine)carboxamide 34
120 mg 31 was hydrogenated for 56 h to produce 99 mg (57%) 34 after cou
pling. 1H NMR (DMSO-d6) o 10.15 (s, 1H), 8.18 (d, 1H, J= 9Hz), 8.16 (d, 1H,
J = 2Hz), 8.05 (dd, 1H, J= 5, 2Hz), 7.61 (ddd, 1H, J= 9, 7, 2Hz), 7.56 (d, 1H,
J= 2Hz), 7.27 (d, 1H, J= 2Hz), 6.87 (d, 1H, J= 2Hz), 6.60 (ddd, 1H, J= 7,
7, 2Hz), 3.95 (s, 3H), 3.91 (s, 3H), 3.76 (s, 3H); IR (KBr) 1638 (m), 1570 (m),
1504 (s), 1436 (s), 1396 (s), 1372 (s), 1308 (s), 1254 (m), 1150 (w), 1110 (w) , 750

-234-
(w) cm- 1; FABMS mje (relative intensity) 383.1456 (3, M+H, 383.1468 calcd. for
C1sH19N604), 351 (2).
4- ( 4-Nitro-N- ( 3-dimethylaminopropy 1 )pyrrole-2-carboxamide )
N -methy lpyrrole-2-pyridinecarboxamide 39
A 146 mg (0.62 mmol) sample of 30 in 12 mL dry DMF containing 40 mg 5%
paladium on charcoal was hydrogenated for 1 h at 25°C and 1 atm. The solution
was filtered, and the solvent removed at <1 Torr. 150 mg (0.62 mmol) 38 that had
been lyophilized from dilute hydrochloric acid was suspended in 4 mL dry DMF.
The acid was activated by addition of 204 mg (1.5 mmol) N-hydroxybenzotriazole
and then 156 mg (0. 75 mmol) dicyclohexylcarbodiimide at 0°C. After 6 h, the
amine dissolved in 2 mL dichloromethane was added, and the reaction stirred at
25°C. At 20 h, 0.2 mL (2.1 mmol) acetic anhydride was added. At 32 h, the solvent
was removed at <1 Torr pressure and the residue purified by flash chromatography,
loading with methanol and eluting with 0.25% concentrated aqueous ammonia in
methanol to give 170 mg (64%) 39. 1H NMR (DMSO-da) 6 10.35 (bs, 2H), 8.34
(dd, 1H, J= 5, 1 Hz), 8.18 (d, 1H, J= 2Hz), 8.07 (d, 1H, J= 8Hz), 7.77 (ddd,
1H, J= 8, 8, 2 Hz), 7.60 (d, 1H, J= 2 Hz), 7.41 (d, 1H, J= 2Hz), 7.16 (d, 1H,
J= 2Hz), 7.10 (ddd, 1H, J= 6, 6, 1Hz), 4.42 (t, 2H, J= 7Hz), 3.87 (s, 3H),
2.15 (t, 2H, J= 7 Hz), 1.86 (quint, 2H, J= 7 Hz); IR (KBr) 1668 (m), 1650 (w),
1576 (m), 1508 (s), 1464 (w), 1434 (s), 1400 (m), 1308 (s), 1220 (w), 775 (w), 746
(w) cm- 1 •
-235-
Synthesis of NAr
The synthesis of N Ar compounds followed closely the ArN synthesis. The
nitro-dipyrrole compounds {80 mg, ....... 0.2 mmol) were hydrogenated at 25°C and
1 atm for 14 h. The solution was filtered and evaporated to dryness under <1 Torr.
4-Dimethylaminobutyric acid hydrochloride (75 mg, 0.45 mmol) was dissolved in
2 mL dry DMF and treated with 73 mg (0.45 mmol) N,N'-carbonyldiimidazole for
1 h at 25 ° C. The amine was dissolved in 2 mL dichloromethane, added to the acy 1
imidazole and stirred for 14 h. After solvent removal in vacuo, purification by
flash chromatography on silica gel with 0.25% concentrated aqueous ammonia in
methanol gave the product, which was characterized as the hydrochloride salt.
4-Dimethylaminobutylcarboxamide-netropsin-2-(1-methylimidazole)
carboxamide (Nim)
31 mg 32 yielded 17 mg (44%) Nlm after coupling. UV-vis Amax(€) 235
(20,000), 308 {26,000) nm; 1H NMR (DMSO-d6 ) 6 11.33 (bs, 1H), 10.34 (bs, 1H),
10.11 (s, 1H), 10.06 (s, 1H), 7.57 (s, 1H), 7.49 (s, 1H), 7.47 (s, 1H), 7.44 (s,
1H), 7.19 (s, 1H), 6.94 (s, 1H), 3.88 (s, 3H), 3.83 (s, 3H), 3.75 (s, 3H), 3.04
(q, 2H, J= 5Hz), 2.75 (d, 6H, J= 6Hz), 2.36 (t, 2H, J= 6Hz), 1.93 (quint, 2H,
J = 6 Hz); IR {KBr) 3400 (m), 2950 (w), 1660 {s), 1616 (s), 1580 (m), 1550 (m),
1488 (m), 1430 (s), 1400 (m), 1240 (w), 1200 (w), 1048 (w) cm- 1; FABMS m je
(relative intensity) 455.2519 (46, M+H, 455.2519 calcd. for C22H31Ns03) .

-236-
4-Dimethylaminobutylcarboxamide-netropsin-2-pyridine
carboxamide (NPy)
Yield: 51 mg, 52%. UV-vis Amax(f) 235 (21,000), 305 (29,000) nm; 1 H NMR
(DMSO-d6 ) 8 11.17 (bs, lH), 10.37 (bs, lH), 10.07 (s, lH), 10.06 (s, lH), 8.40
(d, lH, J= 5Hz), 8.13 (t, lH, J= 7Hz), 8.02 (d, lH, J= 9Hz), 7.47 (d, lH, J=
2 Hz), 7.40 (s, lH), 7.35 (t, lH, J= 7Hz), 7.19 (d, lH, J= 2 Hz), 6.93 (d, lH,
J= 2Hz), 3.90 (s, 3H), 3.83 (s, 3H), 3.02 (m, 2H), 2.74 (d, 6H, J= 5Hz), 2.36
(t, 2H, J= 7Hz), 1.93 (quint, 2H, J= 7Hz); IR (KBr) 1652 (s), 1610 (m), 1560
(s), 1436 (s), 1400 (m), 1236 (m), 1205 (w), 1048 (w), 780 (w) cm- 1; FABMS m/e
(relative intensity) 452.2436 (4, M+H, 452.2410 calcd. for C2sH30N103).
4-Dimethylaminobutylcarboxamide-netropsin-2-methyl(2-pyridine)
carboxamide (NMePy)
Yield: 22 mg, 25%. UV-vis Amax(f) 230 (20,000), 301 (24,000) nm; 1 H NMR
(DMSO-d6 ) 8 11.09 (bs, 1H), 10.57 (bs, lH), 10.13 (s, lH), 10.10 (s, lH), 8.92
(d, lH, J= 6Hz), 8.52 (t, lH, J= 6Hz), 8.18 (d, lH, J= 8Hz), 7.84 (d, lH,
J= 7Hz), 7.49 (s, 1H), 7.44 (s, lH), 7.18 (s, 1H), 6.96 (d, lH, J= 2Hz) , 4.25
(s, 3H), 3.87 (s, 3H), 3.83 (s, 3H), 3.05 (q, 2H, J= 6Hz), 2.73 (d, 6H, J= 6
Hz), 2.36 (t, 2H, J= 6 Hz), 1.94 (quint, 2H, J= 7 Hz); IR (KBr) 3400 (s), 2950
(m), 1690 (m), 1640 (m), 1580 (m), 1550 (w), 1510 (m), 1425 (m), 1400 (m), 1280
(w), 1230 (w), 1195 (w), 1030 (w), 760 (w) cm- 1 ; FABMS mje (relative intensity)
466.2539 (3, M+H, 466.2567 calcd. for C24H32N103).

-237-
Pyridine-2-car boxamide-netropsin-2-pyridinecarboxamide (Py P +ppy)
The procedure above was followed exactly except that pyridine-2-carboxylic
acid was used as the acid component. Yield: 44 mg, 47%. UV-vis Amax(e) 239
(20,500), 309 (32,500) run; 1 H NMR (DMSO-d6 ) 6 11.48 (bs, 1H), 10.80 (s, 2H),
10.42 (bs, 1H), 8.72 (d, 1H, J= 5 Hz), 8.43 (d, 1H, J= 5Hz), 8.23 (t, 1H, J= 7
Hz), 8.17 (d, 1H, J= 7Hz), 8.07 (d, 1H, J= 5Hz), 8.04 (ddd, 1H, J= 7, 7, 2
Hz), 7.65 (ddd, 1H, J= 6, 6, 1Hz), 7.54 (d, 1H, J= 2Hz), 7.51 (s, 1H), 7.48
(s, 1H), 7.41 (t, 1H, J= 6 Hz), 7.35 (d, 1H, J= 2 Hz), 4.40 (t, 2H, J= 6 Hz),
3.92 (s, 3H), 3.03 (q, 2H, J= 7Hz), 2.74 (d, 6H, J= 6Hz), 2.14 (quint, 2H, J=
7Hz); IR (KBr) 2950 (w), 1646 (s), 1608 (m), 1560 (s), 1522 (m), 1438 (s), 1404
(s), 1230 (m), 1200 (w), 1092 (w), 1050 (w), 780 (w) cm- 1 ; FABMS m/e (relative
intensity) 515.2524 (7, M+H, 515.2519 calcd. for C21Hs1NsOs).
Ethy 1 4- ( 1-me thy !imidazole-2-car boxamide )-N-( 3-dimethy lamino
pyrrole-2-carboxylate 39
A 198 mg (0.74 mmol) portion of 36 was hydrogenated for 8 hat 1 atm and
25°C in 8 mL dry DMF containing 20 mg 5% paladium on charcoal. The reaction
was filtered and the solvent removed at <1 Torr. 154 mg (1.2 rnmol) 4 was activated
by 205 mg (1.3 mmol) N,N'-carbonyldiimidazole in 4 mL dry DMF. After 1 h, the
pyrrole amine was redissolved in dichloromethane, and the solutions combined and
stirred for 10 h. Removal of the solvent and flash chromatography on silica gel
eluting with 0.25% concentrated aqueous ammonia in 1:1 methanol:ethanol gave

-238-
206 mg {81%) 39 as a yellow solid. 1H NMR {DMSO-d6) 6 10.52 {s, 1H), 7.52 {d,
1H, J= 2Hz), 7.38 {s, 1H), 7.06 {d, 1H, J= 2Hz), 4.25 {t, 2H, J= 7Hz), 4.19
{q, 2H, J= 7Hz), 3.97 {s, 3H), 2.13 {t, 2H, J= 7Hz), 2.11 {s, 6H), 1.76 (quint,
2H, J= 7Hz), 1.26 {t, 3H, J= 7Hz); IR {KBr) 3320 {m), 1680 {s), 1668 {s), 1580
{m), 1555 {m), 1512 (w), 1460 (w), 1418 {s), 1396 (w), 1274 (w), 1224 (w), 1206
(w), 1106 (w), 1084 (m), 784 (w) cm- 1; FABMS m/e {relative intensity) 354 {87,
M+Li), 348.2037 {100, M+H, 348.2036 calcd. for C11H26NsOs), 325 {70).
4- ( 1-Methy !imidazole-2-carboxamide )-N- ( 3-dimethy laminopropy 1)
pyrrole-2-carboxylic acid 40
To a solution of 190 mg {0.55 mmol) 39 in 10 mL ethanol was added 2 mL
1.25 M sodium hydroxide and the mixture heated at reflux for 1 h. The solvent was
removed in vacuo and the residue purified by flash chromatography. Eluting with
methanol yielded 170 mg {97%) 40, which was lyophilized from dilute hydrochloric
acid and characterized as the hydrochloride salt. 1 H NMR (DMSO-d6) 6 12.30 {bs,
1H), 10.58 {s, 1H), 9.90 {s, 1H), 7.60 {d, 1H, J= 2 Hz), 7.41 {s, 1H), 7.06
(s, 1H), 7.01 {d, 1H, J= 2Hz), 4.33 {t, 2H, J= 7Hz), 3.97 (s, 3H), 3.00 {m,
2H), 2.73 {d, 6H, J= 5Hz), 2.07 (quint, 2H, J= 7Hz); IR {KBr) 3400 {w), 3260
(w), 3100 (w), 2950 (m), 2680 (w), 1676 (s), 1664 (s), 1576 (m), 1470 (m), 1416
(m), 1398 (m), 1282 (w), 1258 (m), 1182 (w), 1108 (w), 780 (w) cm-1; FABMS
m/e (relative intensity) 326 {44, M+Li), 320.1716 {74, M+H, 320.1723 calcd. for
C1sH22NsOs).

-239-
bis-4-(1-Methylimidazole-2-carboxamide)-N-(3-dimethylamino
propyl)-pyrrole-2-carboxamide (ImP+P+Im)
A solution of 161 mg (0.45 mmol) 40 and 148 mg (1.09 mmol) N-hydroxybenzo
triazole in 10 mL dry DMF was cooled to 0°C . A 118 mg (0.57 mmol) portion
of dicyclohexylcarbodiimide was added, and the mixture stirred for 6 h . 1,2-
Diaminoethane (20 J.LL, 0.30 mmol) was added and the solution was stirred for
14 hat 25°C. Evaporation to dryness followed by purification by flash chromatog
raphy on silica gel using 2% concentrated aqueous ammonia in methanol yielded
38 mg (25%) white solid ImP+p+rm, which was lyophilized from dilute hydrochlo
ric acid to be characterized as the hydrochloride salt. UV-vis Amax(e) 257 (sh,
28,000), 285 (36,500) nm; 1 H NMR (DMSO-d6 ) 6 10.93 (s, 2H), 10.27 (s, 2H),
8 .30 (bs , 2H), 7.57 (s, 2H), 7.40 (d, 2H, J= 2 Hz), 7.32 (bs, 2H), 7.03 (d, 2H,
J= 2Hz), 4.34 (t, 4H, J= 6Hz), 4.01 (s, 6H), 3.33 (bs, 4H), 2.98 (q, 4H, J = 6
Hz), 2.71 (d, 12H, J= 6Hz), 2.08 (quint, 4H, J= 7Hz); IR (KBr) 3400 (m), 3300
(m), 3050 (m), 2950 (m) , 2700 (m), 1680 (s), 1640 (s), 1578 (s), 1520 (s), 1460 (m) ,
1412 (s), 1340 (w), 1260 (m), 1236 (w), 1120 (w), 770 (w), 608 (w) cm-1; FABMS
m f e (relative intensity) 661.3679 (4, M+H, 661.3672 calcd. for Cs2H4sN1204) .
Synthesis of ArNE
A suspension of 20 mg (26 J.Lmol) 2 and 15 mg 5% Pd/ C was hydrogenated
for 18 h at 50 psi in a Parr Rocker. The solution was filtered and the DMF
was removed in vacuo. Carbonyldiimidazole (12.5 mg, 77 J.Lmol) was added to a

-240-
solution of the appropriate acid (3 equiv.) and the reaction stirred for 1 h . The
amine was dissolved in dry dichloromethane, added to the activated acid, and
the solution was stirred for 18 h in the dark. The solvent was removed, and the
residue chromatographed with 0.25% concentrated aqueous ammonia in 1:1 meth
anol:ethanol to give a 50-65% yield of ArNE(OEt)s. This was dissolved in 1 mL of
ethanol, and 1 mL of 0.5 M lithium hydroxide was added. After 18 h, the solvent
was removed, and the solid chromatographed on silica gel using 1% concentrated
aqueous ammonia in 1:1 methanol:ethanol as the eluent to give a 65% yield of
ArNE.
Pyridine-2-carboxamide-netropsin-EDTA (2-PyNE)
UV-vis ).max(E) 245, 305 nm; 1H NMR (DMSO-d6+TFA) 6 10.78 (s, 1H),
9.95 (s, 1H), 9.33 (bs, 1H), 8.70 (dd, 1H, J= 4, 1 Hz), 8.48 (t, 1H, J= 7 Hz),
8.18 (m, 1H), 8.15 (d, 1H, J= 8 Hz), 8.06 (ddd, 1H, J= 8, 8, 2 Hz), 7.64 {ddd,
1H, J= 8, 5, 1Hz), 7.37 (d, 1H, J= 2Hz), 7.24 (d, 1H, J= 2Hz), 7.17 (d, 1H,
J = 2Hz), 6.96 (d, 1H, J= 2Hz), 4.01 (s, 2H), 3.88 (s, 2H), 3.85 (s, 3H), 3.80
(s, 7H), 3.3-3.0 (m, 12H), 2.75 (d, 3H, J= 5Hz), 1.82 (m, 4H); FABMS m je
(relative intensity) 769.3634 (2, M+H, 769.3633 calcd. for C3sH49N10010) .
Pyridine-3-carboxamide-netropsin-EDTA (3-PyNE)
UV-vis ).max(E) 238, 296 nm; 1H NMR (DMSO-d6+TFA) 6 10.88 (s, 1H),
9.99 (s, 1H), 9.35 (bs, 1H), 9.32 (s, 1H), 9.01 (d, 1H, J= 6Hz), 8.88 (dd, 1H,
J= 8, 1 Hz) , 8.47 (t, 1H, J= 7Hz), 8.18 (t, 1H, J= 7Hz), 8.08 (dd, 1H, J= 8, 6

-241-
Hz), 7.36 (d, 1H, J= 2Hz), 7.17 (d, 1H, J= 2Hz), 7.12 (d, 1H, J= 2Hz), 6.96
(d, 1H, J= 2Hz), 4.01 (s, 2H), 3.88 (s, 5H), 3.81 (s, 4H), 3.80 (s, 3H), 3.3-3.0
(m, 12H), 2.76 (d, 3H, J= 5 Hz), 1.83 (m, 4H); FABMS m/e (relative intensity)
769.3606 (10, M+H, 769.3633 calcd. for C3sH49N10010), 743 (20, M+H-CN).
Pyridine-4-carboxamide-netropsin-EDTA ( 4-PyNE)
UV-vis ..\max(€) 245, 305 nm; 1H NMR (DMSO-dG+TFA) 6 11.09 (s, 1H),
9.98 (s, 1H), 9.33 (bs, 1H), 9.08 (d, 1H, J= 7Hz), 8.49 (t, 1H, J= 7Hz), 8.46
(d, lH, J= 7Hz), 8.18 (bs, 1H), 7.38 (d, 1H, J= 2Hz), 7.15 (d, 1H, J= 4Hz),
6.97 (d, 1H, J= 2 Hz), 4.04 (s, 2H), 3.91 (s, 2H), 3.88 (s, 3H), 3.86 (s, 4H),
3.79 (s, 3H), 3.4-3.0 (m, 12H), 2.75 (d, 3H, J= 5Hz), 1.82 (m, 4H); FABMS m /e
(relative intensity) 769.3638 {0.4, M+H, 769.3633 calcd. for C3sH49N10010).
4-Chloropyridine-2-carboxamide-netropsin-EDTA (4-ClPyNE)
UV-vis ..\max( f) 199, 236, 300 nm; 1H NMR (DMSO-d6+TFA) 6 10.82 (s, 1H),
9.96 (s, 1H), 9.33 (bs, 1H), 8.67 (d, 1H, J= 5Hz), 8.47 (t, 1H, J= 5Hz), 8.17
(t, 1H, J = 5Hz), 8.09 (d, 1H, J= 2Hz), 7.76 (dd, 1H, J= 5, 2Hz), 7.36 (d, 1H,
J= 2Hz), 7.25 (d, 1H, J= 2Hz), 7.17 (d, 1H, J= 2Hz), 6.95 (d, 1H, J= 2Hz),
4.01 (s, 2H), 3.87 (s, 2H), 3.85 (s, 3H), 3.80 (s, 4H), 3.79 (s, 3H), 3.3-2.9 (m,
12H), 2.76 (d, 3H, J= 4Hz), 1.83 (m, 4H); FABMS m/e (relative intensity) 812
(14, M+ 2+Li), 810 (28, M+Li), 805 (40, M+2+H), 803.3269 (89, M+H, 803.3243
calcd. for C3sH4sN 1001035Cl), 384 (52).

-242-
4-Dimethylaminopyridine-2-carboxamide-netropsin-EDTA
(4-Me2 NPyNE)
UV-vis Amax(e) ,pH 4, 225, 289 nm; 1 H NMR (DMSO-d6+TFA) 6 11.12 (s,
1H), 10.01 (s, 1H), 9.36 (bs, 1H), 8.47 (t, lH, J= 6Hz), 8.19 (d, 2H, J= 7Hz),
7.66 (d, 1H, J= 3Hz), 7.38 (d, 1H, J= 2Hz), 7.16 (d, 1H, J= 2Hz), 7.12 (d,
1H, J= 2 Hz), 7.05 (dd, 1H, J= 7, 3 Hz), 6.95 (d, 1H, J= 2 Hz), 4.01 (s, 2H),
3.89 (s, 3H), 3.87 (s, 2H), 3.81 (s, 4H), 3.79 (s, 3H), 3.3 (bs, 6H), 3.3-2.9
(m, 12H), 2.76 (d, 3H, J= 4 Hz), 1.84 (m, 4H); FABMS m/e (relative intensity)
812.4050 (13, M+H, 812.4055 calcd. for Cs7Hs4 Nu010), 621 (4).
3-Methoxypyridine-2-carboxamide-netropsin-EDTA (3-MeOPyNE)
UV-vis Amax(e) 191,238,300 nm; 1 H NMR (DMSO-d6+TFA) 6 10.44 (s, 1H),
9.94 (s, 1H), 9.32 (bs, 1H), 8.47 (t, 1H, J= 6Hz), 8.31 (d, 1H, J= 4Hz), 8.17
(t, 1H, J= 6Hz), 7.92 (d, 1H, J= 9Hz), 7.73 (dd, 1H, J= 9, 5Hz), 7.31 (d, lH,
J= 2Hz), 7.15 (d, 1H, J= 2Hz), 7.08 (d, 1H, J= 2Hz), 6.95 (d, 1H, J= 2 Hz),
4.01 (s, 2H), 3.93 (s, 3H), 3.87 (s, 2H), 3.86 (s, 3H), 3.80 (s, 7H), 3.3-2.9 (m,
12H), 2.76 (d, 3H, J= 5 Hz), 1.83 (m, 4H); FABMS mje (relative intensity) 821
(2, M+Na), 799.3730 (17, M+H, 799.3739 calcd. for Cs6Hs1 Nl00u), 608 (5).
Pyrimidine-2-carboxamide-netropsin-EDTA ( 2-PmNE)
UV-vis >-max( e) 206, 237, 296 nm; 1 H NMR (DMSO-d6+TFA) 6 10.86 (s, lH),
9.97 (s, 1H), 9.32 (bs, 1H), 8.99 (d, 2H, J= 5Hz), 8.47 (t, 1H, J= 6Hz), 8.17
(t, 1H, J= 6Hz), 7.68 (t, lH, J= 5Hz), 7.36 (d, 1H, J= 2Hz), 7.23 (d, 1H, J=

-243-
2Hz), 7.17 {d, 1H, J= 2Hz), 6.95 {d, 1H, J= 2Hz), 4.01 {s, 2H), 3.87 (s , 2H),
3.86 {s, 3H), 3.80 {s, 7H), 3.4-2.9 {m, 12H), 2.75 {d, 3H, J= 5 Hz), 1.84 {m,
4H); FABMS m / e (relative intensity) 814 {3, M+2Na), 792 {5, M+Na), 770.3574
{8, M + H, 770.3586 calcd. for Cs4H4sNu010).
1-Methy !imidazole-2-carboxamide-netropsin-diaminoazaheptane-tBoc 6
A solution of 125mg {0.24 mmol) 4-nitro-di-{N-methylpyrrole)-2-diaminoaza
heptane-tBoc 5 76 and 35mg of 5% paladium on charcoal in dry DMF (15 mL) was
hydrogenated at atmospheric pressure for 9 h. The solution was filtered, and the
DMF removed in vacuo. To a solution of the hydrochloride salt of imidazole-
2-carbo:xylic acid {75 mg, 0.50 mmol) and N-hydroxybenzotriazole {183 mg,
1.36 mmol) at 0°C was added dicyclohexylcarbodiimide and the solution allowed
to warm to 25°C over 14 h . The hydrogenation residue was dissolved in dichloro
methane, added to the activated acid, and the solution stirred for 16 h . The solvent
was removed and the solid chromatographed with 8% ammonia saturated methanol
in dichloromethane to give 119 mg (84%) of 6. 1H NMR (DMSO-d6) 6 10.44 (s,
1H), 9.89 (s, 1H), 8.01 (t, 1H, J= 7Hz), 7.38 (s, 1H), 7.27 {d, 1H, J = 2Hz) ,
7.17 {d, 1H, J= 2Hz) , 7.14 {d, 1H, J= 2Hz), 6.82 {d, 1H, J= 2Hz), 6.77 {t,
1H, J = 6Hz), 3.98 {s, 3H), 3.83 {s, 3H), 3.78 {s, 3H), 3.17 {q, 2H, J = 7Hz) ,
2.93 (q, 2H, J = 7Hz), 2.28 {t, 2H, J = 7Hz), 2.27 (t, 2H, J = 7Hz), 2.10 (s, 3H) ,
1.59 (quint, 2H, J = 7Hz), 1.50 {quint, 2H, J = 7Hz) , 1.35 {s, 9H) ; FABMS

-244-
mje (relative intensity) 598.3447 (41, M+H, 598.3464 calcd. for C29H44 N90 5 ),
498 (19, M+H-C5 Hs02)·
1-Methylimidazole-2-carboxamide-netropsin-diaminoazaheptane 7
To a solution of 110 mg 6 ( 0.188 mmol) in 8 mL of dichloromethane was
added 1 mL of trifluoroacetic acid and the solution allowed to stand for 0.25 h.
Ether was added and the solid collected, dissolved in 8% concentrated aqueous
ammonia in methanol and purified by flash chromatography on silica gel to yield
79 mg (87%) 1 as a white foam. 1H NMR (DMSO-d6) 6 10.44 (s, 1H), 9.92 (s,
1H), 8.03 (t, 1H, J= 7Hz), 7.37 (d, 1H, J= 1 Hz), 7.27 (d, 1H, J= 2Hz), 7.16
(d, 2H, J= 2Hz), 7.13 (s, 1H), 7.02 (d, 1H, J= 2Hz), 3.97 (s, 3H), 3.82 (s, 3H),
3.77 (s, 3H), 3.3 (q, 2H, J= 7Hz), 3.17 (q, 2H, J= 7Hz), 2.50 (m, 2H), 2.28
(t, 2H, J= 7Hz), 2.10 (s, 3H), 1.59 (quint, 2H, J= 7Hz), 1.47 (quint, 2H, J =
7 Hz); FABMS m/e (relative intensity) 498.2947 (22, M+H, 498.2941 calcd. for
C24H36N903).
1-Methylimidazole-2-carboxamide-netropsin-EDTA, triethyl ester 8
A solution of 128 mg (0.34 mmol) EDTA triethylester and 55 mg (0.34 mmol)
N,N'-carbonyldiimidazole in 4 mL dry dichloromethane was stirred at 25°C for 1 h.
1 was added and the solution stirred in the dark for 12 h. Purification by flash
chromatography on silica gel using 0.25% concentrated aqueous ammonia in 1:1
methanol:ethanol gave 17 mg (15%) of 8 . 1 H NMR (DMSO-d6) 6 10.43 (s, 1H),
9.90 (s, 1H), 8.01 (t, 1H, J = 7 Hz), 7.95 (t, 1H, J= 7 Hz), 7.39 (s, 1H), 7.28
-245-
(d, 1H, J= 2Hz), 7.17 (d, 1H, J= 2Hz), 7.13 (d, 1H, J= 2Hz), 7.03 (d, 1H,
J = 2Hz), 6.83 (d, 1H, J= 2Hz), 4.05 (q, 6H, J= 7Hz), 3.98 (s, 3H), 3.83 (s,
3H), 3.74 {s, 3H), 3.49 (s, 4H), 3.43 (s, 2H), 3.18 (s, 2H), 3.15 (m, 2H), 3.11
(q, 2H, J= 7Hz), 2.69 (m, 4H), 2.31 (t, 2H, J= 7Hz), 2.29 (t, 2H, J= 7Hz) ,
2.13 (s, 3H), 1.6 (m, 4H), 1.16 (t, 9H, J= 7Hz).
1-Methylimidazole-2-carboxamide-netropsin-EDTA (2-ImNE)
Compound 8 {14 mg, 0.016 mmol) was stirred in a mixture of 1:2 0.5 M lithium
hydroxide to ethanol at 25°C for 16 h. Flash chromatography on silica gel using
1% concentrated aqueous ammonia in 1:1 methanol:ethanol yielded 3.4 mg (27%)
of 2-ImNE. UV-vis ..Xmax(f) 252, 304 nm; 1H NMR (DMSO-dG+TFA) 6 10.96 (s,
1H), 9.98 (s, 1H), 9.36 (bs, lH), 8.47 (t, 1H, J = 7Hz), 8.19 (t, 1H, J = 7Hz),
7.70 (s, 1H), 7.54 (s, 1H), 7.32 (d, 1H, J= 2Hz), 7.16 {d, 1H, J= 2Hz), 7.12 (d,
1H, J= 2Hz), 6.95 (d, 1H, J= 2Hz), 4.02 (2s, 5H), 3.87 {s, 5H), 3.81 (s, 4H),
3.79 (s, 2H), 3.78 (s, 3H), 3.3-3.0 (m, 12H), 2.75 (s, 3H), 1.84 (m, 4H); FABMS
mje (relative intensity) 772.3746 (14, M+H, 772.3742 calcd. for C34H50 N 11 0 10),
549 (39), 507 (17) .

-246-
References
1 Watson, J .D . & Crick, F.H.C. (1953) Nature. 171, 737-8.
2 Seemen, N.C., Rosenberg, J. & Rich, A. (1976) Proc. Natl. Acad. Sci. , U.S.A .
73, 804- 8.
3 Pabo, C .O., Jordan, S.R. & Frankel, A.D . (1983) J. Biomol. Struc. Dyn. 1 ,
1039-49.
4 For a review of DNA single crystal structures see Dickerson, R.E. (1988) in
Unusual DNA Structures, Wells, R.D. & Harvey, S.C., eds. (Springer-Verlag,
New York) , pp. 287- 306.
5 Wells, R.D . & Harvey, S.C., eds (1988) in Unusual DNA Structures, (Springer
Verlag, New York), pp. 1-311.
6 Calladine, C.R. (1982) J. Mol. Bioi. 161, 343-52.
7 Dickerson, R.E. {1983) J. Mol. Bioi. 166, 419-41.
8 Sarai, A., Mazur, J. , Nussinov, R. & Jernigan, R.L. (1988) Biochemistry 27,
8498- 502.
9 Zimmer, C . & Wa.hnert, U. (1986) Prog. Biophys. Mole.c. Bioi. 47, 31-112.
10 Neidle, S., Pearl, L.H. & Skelly, J .V . (1987) Bioche.m. J. 243, 1- 13.
11 Neidle, S.R. (1984) CRC Grit . Rev. Bioche.m. 17, 73-121.
12 Kolchinsky, A.M., Mirzabekov, A.D., Zasedatelev, A.S., Gursky, G.V. ,
Grokhovsky, S.L., Zhuze, A.L. & Gottikh, B.P. (1975) Mole.c. Bioi. {USSR}
9, 19-27.
13 Van Dyke, M .W ., Hertzberg, R.P. & Dervan, P .B. (1982) Proc. Natl. Acad.
Sci., U.S.A . 79, 5470-4.

-247-
14 Van Dyke, M.W. & Dervan, P.B. (1982) Cold Spring Harbor Symposium on
Quantitative Biology 47, 347- 53.
15 Lane, M.J., Dobrowiak, J.C. & Vournakis, J. (1983) Proc. Natl. Acad. Sci.,
U.S .A. 80, 326G-4.
16 Youngquist, R.S . (1988) Ph.D. thesis, California Institute of Technology.
17 Youngquist, R.S. & Dervan, P.B. (1985) Proc. Natl. Acad. Sci., U.S.A. 82,
2565-Q9.
18 Kopka, M.L., Yoon, C., Goodsell, D., Pjura, P. & Dickerson, R.E. (1985) J.
Mol. Biol. 183, 553- 563.
19 Kopka, M.L., Yoon, C., Goodsell, D., Pjura, P. & Dickerson, R.E. (1985)
Proc. Natl. Acad. Sci. , U.S.A. 82, 1376-80.
2° Coll, M., Frederick, C.A., Wang, A.H.-J. & Rich, A. (1987) Proc. Natl. Acad.
Sci. , U.S.A. 84, 8385-9.
21 Goodsell, D. & Dickerson, R.E. (1986) J. Med. Chern. 29, 727- 33.
22 Patel, D.J., Shapiro, L. & Hare, D. (1986) Biopolymers 25, 693-706.
23 Patel, D.J. & Shapiro, L . (1986) J. Biol. Chern. 261, 123G-40.
24 Klevitt, R.E., Wemmer, D.E. & Reid, B.R. (1986) Biochemistry 25, 3296-303.
2 5 Marky, L.A. & Breslauer, K.J. (1987) Proc. Natl. Acad. Sci., U.S.A. 84,
435~3.
26 Marky, L.A., Blumenfeld, K.S. & Breslauer, K.J. (1983) Nucl. Acids Res. 11,
2857-70.
27 Breslauer, K.J., Remeta, D.P., Chou, W.-Y., Ferrante, R., Curry, J., Zaunck
owski, D. & Marky, L.A. (1987) Proc. Natl. Acad. Sci., U.S.A. 84, 8922-6.
2 8 Mahendrasingham, A., Rhodes, N.J., Goodwin, G.C., Nave, C., Pigram,
W.J., Fuller, W., Brahms, J. & Vergne, J. (1983) Nature 301, 535-7.
-248-
29 Arnott, S. & Selsing, E. (1974) J. Mol. Bioi. 88, 509-21.
30 Arcamone, F ., Lazzari, E., Menozzi, M., Soranzo, C. & Verini, M.A. (1986)
Anti-Cancer Drug Des. 1, 235-44.
31 Arcamone, F., Penco, S. & Delle Monache, F. (1969) Gazz. chim. italiana 99,
62Q--631.
32 Arcamone, F. (1972) in Medicinal Chemistry, Pratesi, P., ed. (Butterworths,
London), pp. 29-45.
33 Arcamone, F., Nicolella, V., Penco, S. & Redaelli, S. (1969) Gazz. chim. ital
iana 99, 62Q--631.
34 Rao, K.E., Dasgupta, D. & Sasiskeharan, V. (1988) Biochemistry 27, 3018-
24.
35 Zimmer, C., Luck, G. & Burckhardt, G. (1984) Studia Biophys., 247-51.
36 Luck, G., Zimmer, C. & Baguley, B. (1984) Biochim. Biophys. Acta 782, 41-
8.
37 Burckhardt, G., Zimmer, C. & Baguley, B. (1987) J. Biomol. Struc. Dyn. 4,
813-31.
38 Harshman, K.D. & Dervan, P.B. (1985) Nucl. Acids Res. 13, 4825-35.
39 Pjura, P., Grzeskowiak, K. & Dickerson, R.E. (1987) J. Mol. Biol. 197, 257-
71.
40 Teng, M., Usman, N., Frederick, C.A. & Wang, A.H.-J. (1988) Nucl. Acids
Res. 16, 2671-90.
41 Remers, W.A. (1979) in The Chemistry of Antitumor Antibiotics, (Wiley and
Sons, New York) Vol. 1, pp. 133-75.
42 Ward, D.C., Reich, E. & Goldberg, I.H. (1965) Science 149, 1259-65.
43 Weinberger, S., Shafer, R. & Berman, E. (1988) Biopolymers 27, 831-42.

- 249-
44 Waring, M. (1970) J. Mol. Biol. 54, 247-79.
45 Van Dyke, M.W. & Dervan, P.B. {1983) Biochemistry 22, 2373-7.
46 Fox, K.R. & Howarth, N.R. {1985) Nucl. Acids Res. 13, 8695-714.
47 Prasad, K.S. & Nayak, R. {1976) FEBS Lett. 71, 171-4.
48 Shafer, R.H., Roques, B.P., LePecq, J .B. & Delepierre, M. (1988) Eur. J.
Biochem. 173, 377-82.
49 Kam, M., Schafer, R.H. & Berman, E. {1988) Biochemistry 27, 3581-8.
5° Keniry, M.A., Brown, S.C., Berman, E. & Shafer, R.H. {1987) Biochemistry
26, 1058-67.
51 Berman, E., Brown, S.C., James, T .L. & Shafer, R.H. {1985) Biochemistry
24, 6887-93.
52 Patel, D.J. (1978) Proc. Natl. Acad. Sci., U.S.A. 75, 5483-7.
53 Gao, X. & Patel, D.J. {1989) Biochemistry 28, 751-62.
54 For recent examples from the Dervan group see Dervan, P.B. {1988) in
Nucleic Acids and Molecular Biology, Eckstein, F. & Lilley, D.M.J. eds.
(Springer-Verlag, Berlin) Vol. 2, pp. 49-64.
55 Dervan, P .B. (1986) Pont. Acad. Sci. Scr. Var. 70, 365-84.
56 Schultz, P.G. & Dervan, P.B. {1983) J. Am. Chern. Soc. 105, 7748-50.
57 Youngquist, R.S. & Dervan, P.B. {1985) J . Am. Chern. Soc. 107, 5528-9.
58 Griffin, J.H. & Dervan, P.B. (1986) J. Am. Chern. Soc. 108, 5008- 9.
59 Parrack, P., Dasgupta, D., Ayyer, J. & Sasisekharan, V. {1987) FEBS Lett.
212, 297-301.
6° Khorlin, A.A., Krylov, A.S., Grokhovsky, S.L., Zhuse, A.L., Zasedatelev, A.S.,
Gursky, G.V. & Gottikh, B.P. (1980) FEBS Lett. 118, 311-4.

-250-
61 Khorlin, A.A., Grokhovsky, S.L., Zhuze, A.L. & Gottikh, B.P. {1982) Bioor
gan. Khim. 8, 1063-9.
62 Youngquist, R.S. & Dervan, P.B . {1987) J. Am. Chern. Soc. 109, 7564-6.
63 Griffin, J.H., Mack, D.P. & Dervan, P .B., unpublished results.
64 Lown, J.W., Krowicki, K., Bhat, U.G., Skorobogaty, A., Ward, B. & Dabrow
iak, J.C. {1986} Biochemistry 25, 7408-16.
65 Kissinger, K., Krowicki, K., Dabrowiak, J.C. & Lown, J .W. {1987) Biochem
istry 26, 5590-5.
66 Van Dyke, M.W. {1984) Ph.D. thesis, California Institute of Technology.
67 Wade, W .S. & Dervan, P.B. (1987) J. Am. Chern. Soc. 109, 1574-5.
68 Lee, M., Pon, R.T., Krowicki, K. & Lown, J.W. (1988) J . Biomol. Struc. Dyn.
5, 939-49.
69 Patel, D.J., Pardi, A. & Itakura, K. (1982) Science 216, 581-90.
70 Lee, M., Krowicki, K., Hartley, J.A., Pon, R.T. & Lown, J.W. (1988) J. Am.
Chern. Soc. 110, 3641-9.
71 Zakrzewska, K., Lavery, R. & Pullman, B. (1987) J. Biomol. Struc. Dyn. 4,
833-43.
72 Lee, M., Hartley, J.A., Pon, R.T., Krowicki, K . & Lown, J.W. (1988) Nucl.
Acids Res. 16, 665-84.
73 Lee, M., Coulter, D.M., Pon, R.T., Krowicki, K . & Lown, J.W. {1988) J.
Biomol. Struc. Dyn. 5, 1059-87.
74 Galas, D. & Schmitz, A. {1978) Nucl. Acids Res. 5, 3157-70.
75 Gilbert, W., Maxam, A. & Mirzabekov, A. (1976) in Control of Ribosome
Synthesis, Kjelgaard, N.O. & Mallfl!e, 0., eds. (Munksgaard, Copenhagen),
pp. 139-48.
-251-
76 Taylor, J .S., Schultz, P.G. & Dervan, P .B . (1984) Tetrahedron 40, 457-65.
77 Dervan, P.B. (1986) Science 232, 464- 71.
78 Strobel, S.A., Moser, H.E. & Dervan, P.B. (1988) J. Am. Chern. Soc . 110,
7927-7929.
79 Gursky, G., Zasedatelev, A.S., Zhuze, A.L., Khorlin, A.A., Grokhovsky, S.L. ,
Streltsov, S.A., Surovaya, A.N., Nikitin, S.M., Krylov, A.S., Retchinsky, V.O. ,
Mikhailov, M.V. , Beabealashvili, R.S. & Gottikh, B.P. (1982) Cold Spring
Harbor Symposium on Quantitative Biology 14, 367-78.
80 Maxam, A.M. & Gilbert, W.S. (1980) Methods in Enzymology 65, 499-560.
81 Iverson, B.L. & Dervan, P.B. (1987) Nucl. Acids Res. 15, 7823-30.
82 Sutcliffe, J .G. (1978) Cold Spring Harbor Symposium on Quantitative Biology
43, 77- 90.
83 Peden, K.W.C. (1983) Gene 22, 277-80.
84 Fox, K.R. & Waring, M.J. (1984) Nucl. Acids Res. 12, 9271-85.
85 Ceccarelli, C., Jeffrey, G.A. & Taylor, R. (1981) J . Mol. Struct. 10, 255- 71.
86 Tullius, T .D. & Dombroski, B.A. (1986) Proc. Natl. Acad. Sci., U.S.A. 83,
5469-73.
87 Nelson, H.C.M., Finch, J.T., Luisi, B.F. & Klug, A. (1987) Nature 330, 221-
6.
88 Wu, H-M. & Crothers, D.M. (1984) Nature 308, 509-13.
89 Beranek, D.T., Weis, C.C. & Swenson, D.H. (1980) Carcinogenesis 1, 595-
605.
90 Zimmerman, S.B. (1982) Ann. Rev. Biochem. 51, 395-427.
9 1 Cornish-Bowden, A. (1985) Nucl. Acids Res. 13, 3021- 30.
-252-
92 Griffin, J .H., unpublished results.
93 MACROMODEL is a graphic based program developed by W.C. Still at
Columbia University for the purpose of modeling macromolecules. A complete
conformational search was done on the aromatic portion of each structure
studied. The conformer list was refined by molecular mechanics techniques
using the AMBER forcefield.
94 Arnott, S. & Hukins, D.W.L. (1973) J. Mol. Bioi. 81, 93-105.
95 BIOGRAF is a graphic based program developed by W.A. Goddard III,
S. Mayo and B. Olafson at BioDesign for the purpose of modeling macro
molecules. All structures were refined by molecular mechanics techniques to
a local minimum using the Dreiding force field supplied with the program.
96 Koudelka, G.B., Harrison, S.C. & Ptashne, M. (1987) Nature 326, 886-8.
97 Aggarwal, A.K., Rodgers, D.W., Drottar, M., Ptashne, M. & Harrison, S.C.
(1988) Science 242, 899-907.
98 Koudelka, G.B., Harbury, P., Harrison, S.C. & Ptashne M. (1988) Proc. Natl.
Acad. Sci., U.S.A. 85, 4633-7.
99 Brenowitz, M., Senear, D.F., Shea, M.A. & Ackers, G.K. (1986) Methods in
Enzymology 130, 133-181.
100 Brenowitz, M., Senear, D.F., Shea, M .A. & Ackers, G.K. (1986) Proc. Natl.
Acad. Sci., U.S .A . 83, 8462-6.
101 Lasky, R. & Mills, D.A. (1975) Eur. J. Biochem. 56, 335-41.
102 Hertzberg, R.P. & Dervan, P.B. (1983) Biochemistry 23, 3934-45.
103 Krylov, A.S., Grokhovsky, S.L., Zasedatelev, A.S., Zhuze, A.L., Gursky, G.V.
& Gottikh, B.P. (1979) Nucl. Acids Res. 6, 289-304.
104 Zimmer, C., Luck, G., Birch-Hirschfeld, E., Weiss, R., Arcamone, F. &
Guschlbauer, W. (1983) Biochim. Biophys. Acta 7 41, 15-22.
-253-
105 Lindahl, T. & Andersson, A. {1972) Biochemistry 11, 3618-23.
106 Pharmacia Molecular Biologicals Catalog, (1988) 135.
107 Bevington, P.R. (1969) in Data Reduction and Error Analysis for the Physical
Sciences, (McGraw Hill, New York), pp. 204-45.
108 Marquardt, D.W. (1963) J . Soc. Ind. Appl. Math. 11, 431-41.
109 Cantor, C.R. & Schimmel, P.R. (1980) in Biophysical Chemistry, (W .H. Free
man, San Francisco) Part III, pp. 849-78.
110 Luck, G., Triebel, H., Waring, M. & Zimmer, C. (1974) Nucl. Acids Res. 1,
503-30.
111 Hogan, M., Dattagupta, N. & Crothers, D. (1979) Nature 278, 521-4.
112 Baker, B. {1988) Ph.D. thesis, California Institute of Technology.
113 Krowicki, K. & Lown, J.W. (1987) J. Org. Chern. 52, 3493-501.
114 Crothers, D.M. {1968) Biopolymers 6, 575-84.
115 Pages, M.J.M. & Roizes, G.P. (1984) J. Mol. Biol. 173, 143-57.
116 Fried, M. & Crothers, D.M. {1981) Nucl. Acids Res. 9, 6506-25.
117 DeRoos, K.B. & Salemink, C.A. (1969) Recuil. Trav. Chim. Pays-Bas 88,
1263-74.
118 Den Hertog, H.J. & Jouwersma, C. (1953) Recuil. Trav. Chim. Pays-Bas 72,
44-49.
119 Ochia, E. & Yamanaka, H. (1955) Chern. Pharm. Bull. 3, 173-4.
120 Deady, L.W., Foskey, D.J. & Shanks, R.J. (1971) J . Chern. Soc . {B), 1962- 3.
121 Nedenskov, P., Clauson-Kaas, N., Lei, J., Heide, H., Olsen, G. & Jansen, G.
{1969) Acta Chern. Scand. 23, 1791- 1796.
122 Regel, E. & Buchel, K.M. (1977) Justus Liebigs Ann. Chern., 145- 58.

-254-
123 Jones, R.G. {1949) J. Am. Chem. Soc. 71, 383-6.
124 Pachter, LJ. & Kloetzel, M.C. {1952) J. Am. Chem. Soc. 74, 1321-5.
125 Barbieri, G., Benassi, R., Grandi, R ., Pagnoni, U.M. & Taddei, F . {1979) Org.
Magn. Reson. 12, 159-62.
1 26 Katritzky, A.R. & Reavill, R.E. (1965) J. Chem. Soc., 3825-7.
127 Green, R. W. & Tong, H.K. (1956) J . Am. Chem. Soc. 78, 4896-900.
128 Jellinek, H.H.G. & Urwin, J .R. (1954) J. Phys. Chem. 58, 548-50.
129 Essery, J.M. & Schofield, K. (1961) J. Chem. Soc., 3939-53.
130 Shirley, D .A. & Cameron, M.D. {1952) J. Am. Chem. Soc . 74, 664-5.
131 Lawson, A. {1956) J . Chem. Soc., 307-310.
132 Morgan, K.J. & Morrey, D.P. {1966) Tetrahedron 22, 57-62.
133 Gellman, S.H., final report.
134 Evans, R.F. (1964) J. Chem. Soc., 2450-5.
135 Pullman, B. (1984) in Specificity and Biological Interactions, Int. Symp. at the
Pontifical Acad. Sci., Chagas, C. & Pullman, B., eds. {Vatican Press) Vol. 55,
pp. 1- 20.
136 Weller, R .D. (1987) NATO AS!, ser. A 137, 63- 83.
137 Strohl, K ., Chen, W., Hill, D.E., Hope, LA. & Oettinger, M.A. (1986) Cold
Spring Harbor Symposium on Quantitative Biology 50, 489- 503.
138 Jones, E.W. & Fink, G.R. (1982) in The molecular biology of the yeast Sac
charomyces: Metabolism and gene expression, Strathern, J .N., et al. eds. (Cold
Spring Harbor Laboratory, New York), pp. 181- 299.
139 Hope, LA. & Struhl, K . (1986) Cell 46, 885- 94.
140 Hope, LA. & Struhl, K . (1987) EMBO J. 6, 2781-4.

-255-
141 Struhl, K. (1987) Cell 50, 841-6.
142 Crabeel, M., Huygen, R., Verschueren, K., Messenguy, F., Tinel, K ., Cunin,
R. & Glansdorff, N. (1985) Mol Cell. Biol. 5, 3139-48.
143 Beacham, I.R., Schweitzer, B.W., Warrick, H.M. & Carbon, J. (1984) Gene
29, 271-9.
144 Werner, M., Feller, A. & Pierard, A. (1985) Eur. J. Biochern. 146, 371-81.
145 Hinnebusch, A.G. & Fink, G.R. (1983) J. Biol. Chern. 258, 5238-47.
146 Hill, D.E ., Hope, I.A., Macke, J.P. & Struhl, K. (1986) Science 234, 451-7,
and references therein.
147 Donahue, T .F., Daves, R.S., Lucchini, G.R. & Fink, G.R. (1983) Cell 32, 89-
98.
14 8 Nishiwaki, K., Hayashi, N., lrie, S., Chung, D.H., Harashima, S. & Oshima,
Y. (1987) Mol. Gen. Genet. 208, 159-67.
149 Holmberg, S., Kielland-Brandt, M.C., Nilsson-Tillgren, T. & Petersen, J .G.L.
(1985) Carlsberg Res. Cornrnun. 50, 163- 78.
15° Falco, S.C., Dumas, K.S. & Livak, K.J. (1985) Nucl. Acids Res. 13, 4011- 27.
151 Hsu, Y.-P. & Schimmel, P. (1984) J. Biol. Chern. 259, 3714-9.
152 Zhou, K ., Brisco, P.R .G., Hinkkanen, A.E. & Kohlhaw, G .B. (1987) Nucl.
Acids Res. 15, 5261- 73.
153 Beltzer, J .P. , Chang, L.L., Hinkkanen, A.E. & Kohlhaw, G.B . (1986) J. Bioi.
Chern. 261, 5160--7.
154 Zalkin, H., Paluh, J .L., van Cleemput, M., Moye, W.S. & Yanofsky, C. (1984)
J . Biol. Chern. 259, 3985- 92.
155 Aebi, M ., Furtur, R., Prantl, F., Niederberger, P. & Hutter, R. (1984) Curr.
Genet. 8, 165- 72.

-256-
156 Lee, W ., Mitchell, P. & Tjian, R. (1987) Cell49, 741-52.
157 Andreadis, A., Hsu, Y.-P., Kohlhaw, G.B. & Schimmel, P. (1982) Cell 31,
319-25.
158 Zalkin, H. & Yanofsky, C. (1982) J. Bioi. Chern. 257, 1491-1500.
159 Harshman, K.D., Moye-Rowley, W.S. & Parker, C.S. (1988) Cell 53, 321-30.
160 Hai, T., Liu, F., Allegretto, E.A., Karin, M. & Green, M.R. (1988) Genes and
Development 2, 1216-26.
161 Marx, J.L. (1988) Science 242, 1377-8.
162 Angel, P., Imagawa, M., Chiu, R., Stein, B., Imbra, R.J., Rahmsdorf, H.J .,
Jonat, C., Herrlich, P. & Karin, M. (1987) Cell 49, 729-39.
163 Ryder, K., Lau, L.F. & Nathans, D. (1988) Proc. Natl. Acad. Sci., U.S.A. 85,
1487-91.
164 Rauscher III, F.J., Sambucetti, L .C., Curran, T., Distel, R.J. & Spiegelman,
B.M. (1988) Cell 52, 471-80.
165 Franza, B.R., Jr., Rauscher III, F.J., Josephs, S.F. & Curran, T. (1988) Sci
ence 239, 115Q--3.
166 Burkoff, A.M. & Tullius, T.D. (1987) Cell48, 935-43.
167 Burkoff, A.M. & Tullius, T.D. (1988) Nature 331, 455-7.
168 Thireos, G., Penn, M.D. & Greer, H. (1984) Proc. Natl. Acad. Sci., U.S.A.
81, 5096-100.
169 Hinnebusch, A.G. (1984) Proc. Natl. Acad. Sci., U.S.A. 81, 6442-6.
170 Harshman, K.D . (1989) Ph.D. thesis, California Institute of Technology.
171 Bohmann, D., Bos, T.J., Admon, A., Nishimwo, T., Vogt, P.K. & Tjian, R.
(1987) Science 238, 1386-92.
-257-
172 Van Beveren, C., von Stroaken, F., Curran, T., Muller, R. & Verma, I.M.
(1983) Cell 32, 1241-55.
173 Harshman, K.D., unpublished data.
174 Landschulz, W.H., Johnson, P.F. & McKnight, S.L. (1988) Science 240,
1759--64.
175 McClarin, J.A., Frederick, C.A., Wang, B-C., Greene, P., Boyer, H.W.,
Grable, J. & Rosenberg, J.M. (1986) Science 234, 1526-41.
176 Maniatis, T., Fritsch, E.F. & Sambrook, J. (1982) in Molecular Cloning, A
Laboratory Manual, (Cold Spring Harbor Laboratory, New York), pp. 1-542.
177 Mendel, D.M. & Dervan, P.B. {1987) Proc. Natl. Acad. Sci., U.S.A. 84, 910-
4.
178 Haniford, D.B. & Pulleyblank, D.E. {1985) Nucl. Acids Res. 13, 4343-63.
179 Stewart, J.M. & Young, S.D. (1984) in Solid Phase Peptide Synthesis, (Pierce,
Rockford, Illinois) 2nd ed., pp. 1-158.
180 Still, W .C., Kahn, M. & Mitra, A. (1978) J. Org. Chern. 40, 2923-5.
181 Fanta, P. (1963) Org. Syn. Coll. Vol. IV, 844-5.

-258-
Appendix A
Summary of Gel Data
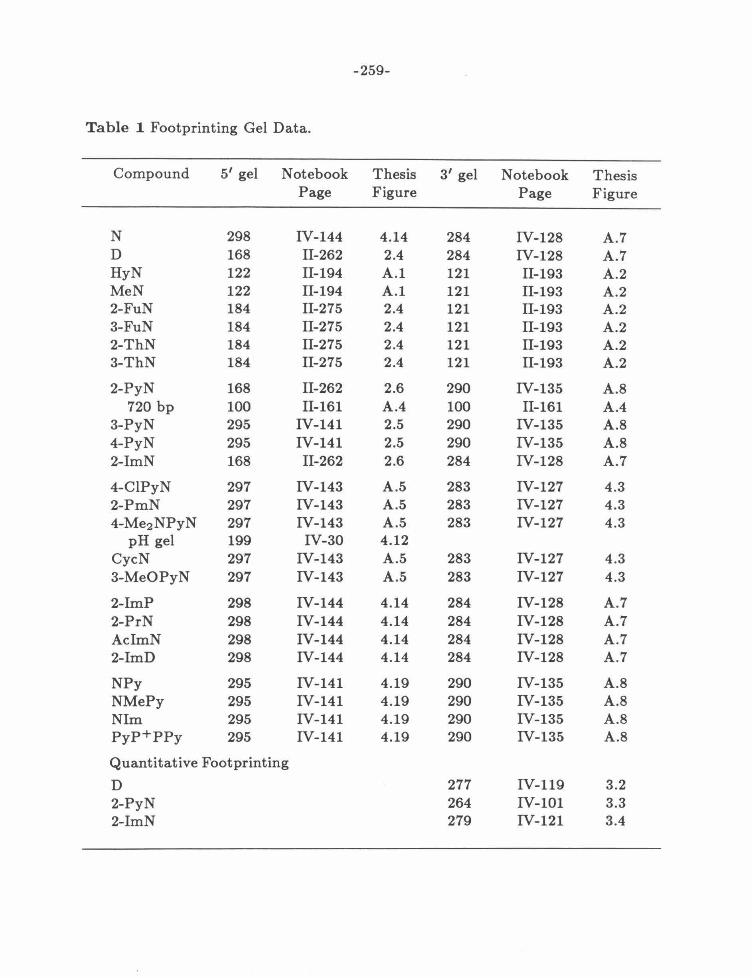
-259-
Table 1 Footprinting Gel Data.
Compound 5' gel Notebook Thesis 3' gel Notebook Thesis Page Figure Page Figure
N 298 IV-144 4.14 284 IV-128 A.7 D 168 II-262 2.4 284 IV-128 A.7 HyN 122 II-194 A.1 121 II-193 A.2 MeN 122 II-194 A.1 121 II-193 A.2 2-FuN 184 II-275 2.4 121 II-193 A.2 3-FuN 184 II-275 2.4 121 II-193 A.2 2-ThN 184 II-275 2.4 121 II-193 A.2 3-ThN 184 II-275 2.4 121 II-193 A.2
2-PyN 168 II-262 2.6 290 IV-135 A.8 720 bp 100 II-161 A.4 100 II-161 A.4
3-PyN 295 IV-141 2.5 290 IV-135 A.8 4-PyN 295 IV-141 2.5 290 IV-135 A.8 2-ImN 168 II-262 2.6 284 IV-128 A.7
4-ClPyN 297 IV-143 A.5 283 IV-127 4.3 2-PmN 297 IV-143 A.5 283 IV-127 4.3 4-Me2NPyN 297 IV-143 A.5 283 IV-127 4 .3
pH gel 199 IV-30 4 .12 CycN 297 IV-143 A.5 283 IV-127 4.3 3-MeOPyN 297 IV-143 A.5 283 IV-127 4 .3
2-lmP 298 IV-144 4.14 284 IV-128 A .7 2-PrN 298 IV-144 4.14 284 IV-128 A.7 AclmN 298 IV-144 4.14 284 IV-128 A.7 2-ImD 298 IV-144 4.14 284 IV-128 A.7
NPy 295 IV-141 4.19 290 IV-135 A .8 NMePy 295 IV-141 4.19 290 IV-135 A.8 Nlm 295 IV-141 4.19 290 IV-135 A.8 PyP+PPy 295 IV-141 4 .19 290 IV-135 A.8
Quantitative Footprinting
D 277 IV-119 3.2 2-PyN 264 IV-101 3.3 2-lmN 279 IV-121 3.4

-260-
Table 2 Affinity Cleaving Gel Data.
Compound 5' gel Notebook Thesis 3' gel Notebook Thesis Page Figure Page Figure
ED 296 IV-142 2.6 291 IV-136 A.6 HyNE 122 II-194 A.1 121 II-193 A.2 MeNE 122 II-194 A.1 121 II-193 A.2 2-FuNE 122 II-194 A.1 121 II-193 A.2 3-FuNE 122 II-194 A.1 121 II-193 A.2
2-PyNE 296 IV-142 2.6 291 IV-136 A.6 3-PyNE 296 IV-142 2.5 291 IV-136 A.6 4-PyNE 296 IV-142 2.5 291 IV-136 A.6 2-lmNE 296 IV-142 2.6 291 IV-136 A.6
3-PyNE 296 IV-142 4.4 291 IV-136 A.6 4-PyNE 296 IV-142 4.4 291 IV-136 A.6 4-ClPyNE 296 IV-142 4.4 291 IV-136 A.6 2-PmNE 296 IV-142 4.4 291 IV-136 A.6 4-Me2NPyNE 296 IV-142 4.4 291 IV-136 A.6 3-MeOPyNE 296 IV-142 4.4 291 IV-136 A.6
Double Strand Assay
ED 293 IV-138 2.13 2-PyNE 293 IV-138 2.13 3-PyNE 293 IV-138 2.13 4-PyNE 293 IV-138 2.13 2-lmNE 293 IV-138 2.13
4-ClPyNE 213 IV-38 4.6 2-PmNE 213 IV-38 4.6 4-Me2NPyNE 213 IV-38 4.6 3-MeOPyNE 213 IV-38 4.6

-261-
Figure 1 Footprinting and affinity cleaving of the furan and thiophene analogs of
D. Autoradiogram of an 8% high resolution denaturing polyacrylamide gel. All re
actions contain 4 mM DTT, 100 J,LM-bp calf thymus DNA, and 12 kcpm 5' labeled
517 bp restriction fragment in 40 mM Tris·acetate pH 7.9 buffer. Lane 1, intact
DNA; lane 2, Maxam-Gilbert G reaction;80 lanes 3-11 contain 4 J,LM MPE·Fe(II),
lane 3, MPE·Fe(II) standard; lane 4, 1 J,LM D; lane 5, 10 J,LM N, lane 6,
25 J,LM Hydroxyacetamide-netropsin (Hy N); lane 7, 25 J,LM Methoxyacetamide
netropsin (MeN); lane 8, 10 J,LM 2-FuN; lane 9, 10 J,LM 3-FuN; lane 10, 5 J,LM 2-ThN;
lane 11, 5 J,LM 3-ThN; lane 12, 2 J,LM ED; lane 13, 40 J.LM NE; lane 14, 60 J,LM HyNE;
lane 15, 60 J,LM MeNE; lane 16, 40 J,LM 2-FuNE; lane 17, 80 J,LM 3-FuNE.

- 262-
ww wwZZ
~ ~ ~
Wo w
2 ~ u.. u.. f c\irh
5 6 7 8 9 1011 1213 1415 1617

-263-
Figure 2 Footprinting and affinity cleaving of the furan and thiophene analogs of
D . Autoradiogram of an 8% high resolution denaturing polyacrylamide gel. All re
actions contain 4 mM DTT, 100 JLM-bp calf thymus DNA, and 12 kcpm 3' labeled
517 bp restriction fragment in 40 mM Tris·acetate pH 7.9 buffer. Lane 1, intact
DNA; lane 2, Maxam-Gilbert G reaction;80 lanes 3-11 contain 4 JLM MPE·Fe(II),
lane 3, MPE·Fe(II) standard; lane 4, 1 JLM D; lane 5, 10 JLM N, lane 6,
25 JLM Hydroxyacetamide-netropsin (HyN); lane 7, 25 JLM Methoxyacetamide
netropsin (MeN); lane 8, 10 JLM 2-FuN; lane 9, 10 JLM 3-FuN; lane 10, 5 JLM 2-ThN;
lane 11, 5 JLM 3-ThN; lane 12, 2 JLM ED; lane 13, 40 JLM NE; lane 14, 60 JLM HyNE;
lane 15, 60 JLM MeNE; lane 16, 40 JLM 2-FuNE; lane 17, 80 JLM 3-FuNE.

- 264-
1 2 3 4 5 6 7 8 9 10 11 12 13 1415 16 17

-265-
Figure 3 Structural features of 2-PyN and 2-ImN binding. Autoradiogram of
an 8% denaturing polyacrylamide gel. All reactions contain 12 kcpm 5' labeled
517 bp restriction fragment. Lanes 1, 3-6, 12-24, and 26-28 contain 200 J..LM-bp
calf thymus DNAin 40 mM tris acetate pH 7.9 buffer; Lanes 7- 11, and 25 contain
200 J..LM-bp calf thymus DNA in TKMC buffer; Lane 1, intact DNA; lane 2, G
reaction;80 lanes 3-6 contain 4 J..LM MPE·Fe(II), and 4 mM DTT, cleavage time 20
min at 37°C; lanes 7-11 , and 25 contain 1 ng DNase I reacted for 3 min at 25°C;
lanes 12- 15, and 26 contain 53 mM dimethyl sulfate, reacted for 5 min at 25°C,
then A > G workup;80 lanes 16-19, and 27 contain 136 mM diethyl pyrocarbonate,
10 min at 37°C; lanes 2G-23, and 28 contain 100 J..LM potassium permanganate,
15 min at 37°C; lanes 4, 9, 13, 17, and 21 contain 20 J..LM D; lanes 5, 10, 14, 18,
and 22 contain 20 J..LM 2-PyN; lanes 6, 11, 15, 19, and 23 contain 20 J..LM 2-ImN;
lanes 25- 28 contain 20 J..LM echinomycin.
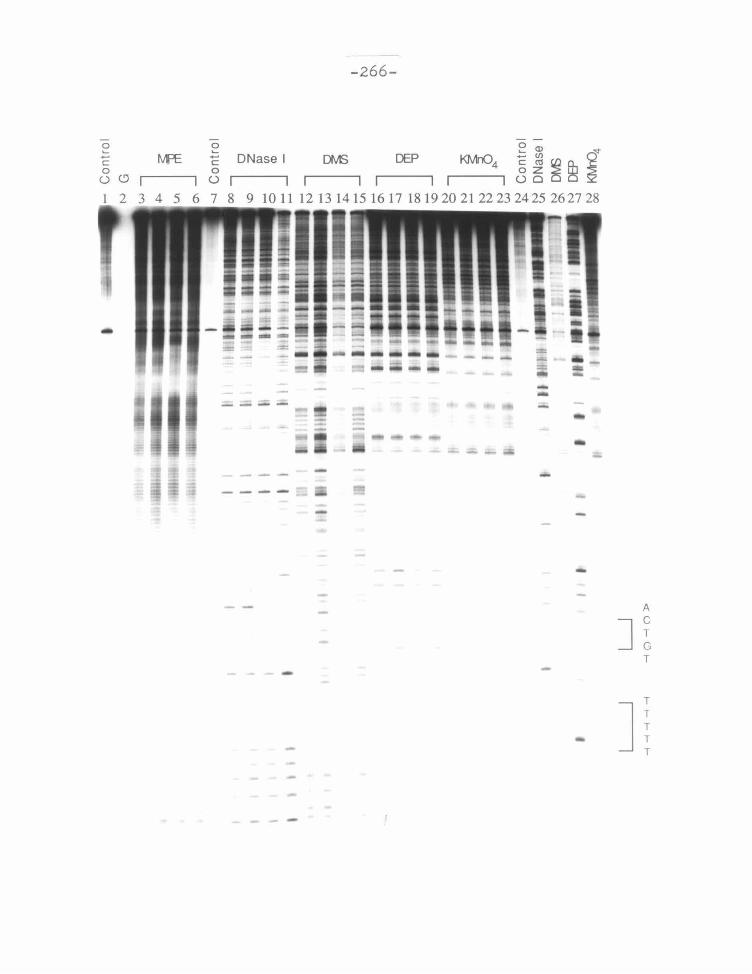
0 ..... -c 0 ()CJ
-
0 .....
-266-
~ Q) """
KMn04 ug zorJ ~ A, 2 I I I I 1 1 I Ei ~ ~
DNase I DEP
1011 121314151617 181920 2122 23 2425 2627 28
---
--- - --
A
J ~ T -
- ] ~ T

-267-
Figure 4 Footprinting and affinity cleaving of 2-PyN on the Sal 1/ Sty I restriction
fragment of pBR322. Autoradiogram of an 8% denaturing polyacrylamide gel. All
reactions contain 4 mM DTT, 100 ~tM-bp calf thymus DNA, and 12 kcpm labeled
720 bp restriction fragment in 40 mM Tris·acetate pH 7.9 buffer. Lanes 1- 9, 5'
labeled fragment; lanes 1Q-18, 3' labeled fragment; Lanes 1 and 18, intact DNA;
lanes 2 and 17, G reaction;80 lanes 3 and 10, contain 10 ~tM ED; lanes 4-6 and 15-
13 contain 2-PyNE at 50 ~tM, 25 ~tM, and 10 ~tM, respectively; lanes 7-12 contain
4 ~tM MPE·Fe(II), lanes 7 and 12, MPE·Fe(II) standards; lanes 8 and 11, 1 ~tM D;
lanes 9-10, 10 ~tM 2-PyN.

0 ..... -c:: 0 0 OCJW
1 2 3
- 268-
LU LU z z z ~ ~ ~ 0 a.. a.. a.. .....
I I I ~
I C\J I~ on o ~I C\J 1@ <.98 4 5 6 7 8 9 10 11 12 13 14 15 1 17 8
--

-269-
Figure 5 Footprinting of substituted derivatives of 2-PyN and 2-lmN. Autoradio
gram of an 8% denaturing polyacrylamide gel. All reactions contain 4 mM DTT,
100 JLM-bp calf thymus DNA, and 12 kcpm 5' labeled 517 bp restriction fragment in
40 mM Tris·acetate pH 7.9 buffer. Lane 1, intact DNA; lane 2, G reaction;80 lane 3,
A reaction;81 lanes 4-22 contain 4 JLM MPE·Fe(II): lane 4, MPE·Fe(II) standard;
lane 5 4 JLM D; lane 6, 20 JLM 2-PyN; lane 6, 20 JLM 2-ImN; lanes 8-10 contain
35 JLM, 10 JLM, and 1 JLM 4-ClPyN respectively; lanes 11-13, 35 JLM, 10 JLM, and
1 JLM 2-PmN respectively; lanes 14-16, 35 JLM, 10 JLM, and 1 JLM 4-Me2 NPyN
respectively; lanes 17-19, 35 JLM, 10 JLM, and 1 JLM CycN respectively.

-270-
z z >-
>- z 0.... 0.... E Q)N z 0 z z () 0.... ~ (.)
~
' ' >-..... >- E ~ C\1 ...;. () c
~ 0 0....-0<.9 <( ~ 0 t\J t\J II II II II 1 2 3 4 5 6 7 8 9 10 11 12 13 1415 16 17 18 19
-

-271-
Figure 6 Affinity cleaving of the substituted pyridine derivatives. Autoradiogram
of an 8% denaturing polyacrylamide gel. All reactions contain 4 mM DTT, 100 J,LM
bp calf thymus DNA, and 12 kcpm 3' labeled 517 bp restriction fragment in 40 mM
Tris·acetate pH 7.9 buffer. Lane 1, intact DNA; lane 2, G reaction;80 lane 3, A
reaction;81 lane 4, 2 J.LM ED; lane 5, 50 J.LM 2-PyNE, lane 6, 70 J.LM 2-ImNE;
lane 7, 10 J.LM 3-PyNE; lane 8, 7 J.LM 4-PyNE; lane 9, 70 J.LM 4-ClPyNE; lane 10,
25 J.LM 2-PmNE; lane 11, 50 J.LM 4-Me2NPyNE; lane 12, 70 J.LM 3-MeOPyNE.
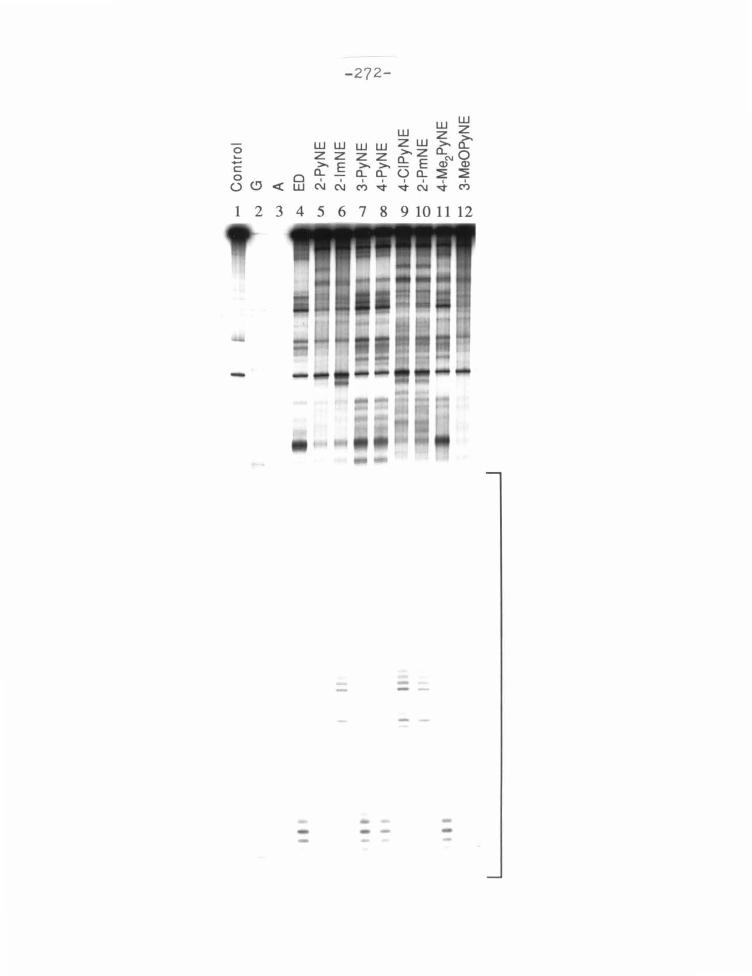
-272-
w w z z >.~
0...(\J 0 Q) Q)
::E ::E I I
~ M
1 2 3 4 5 6 7 8 9 10 11 12
-

-273-
Figure 7 Footprinting of varying length D and 2-lmN derivatives. Autoradiogram
of an 8% denaturing polyacrylamide gel. All reactions contain 4 mM DTT, 100 J.LM
bp calf thymus DNA, and 12 kcpm 3'labeled 517 bp restriction fragment in 40 mM Tris·acetate pH 7.9 buffer. Lane 1, intact DNA; lane 2, G reaction;80 lane 3, A
reaction;81 lanes 4-22 contain 4 J.LM MPE·Fe(II): lane 4, MPE·Fe(II) standard
lanes 5-7 contain 35 J.LM, 10 J.LM, and 1 J.LM N respectively; lanes 8-10, 35 J.LM,
10 J.LM, and 1 J.LM 2-PrN respectively; lanes 11-13, 5 J.LM, 2 J.LM, and 1 J.LM D
respectively; lanes 14-16, 50 J.LM, 35 J.LM, and 10 J.LM 2-PrN respectively; lanes 17-
19, 35 J.LM, 10 J.LM, and 1 J.LM 2-ImN respectively; lanes 2D-22, 35 J.LM, 10 J.LM,
and 1 J.LM AclmN respectively; lanes 23-25, 35 J.LM, 10 J.LM, and 1 J.LM 2-lmD
respectively.

-274-
z a.. z z 0 ._ E E E E 0 a.. ._ ' 0 ' '
(.) ' ...... z (\J (\J (\J <: (\J c H: 0
u <.9<: ~ II II II I I I I 1 2 3 4 5 6 7 8 9 10 11 12 13 14 15 16 17 18 19 20 21 22 23 24 25
-

-275-
Figure 8 Footprinting of C-terminal analogs of 2-PyN and 2-ImN. Autoradiogram
of an 8% denaturing polyacrylamide gel. All reactions contain 4 mM DTT, 100 J.LM
bp calf thymus DNA, and 12 kcpm 3' labeled 517 bp restriction fragment in 40 mM
Tris·acetate pH 7.9 buffer. Lane 1, intact DNA; lane 2, G reaction;80 lane 3, A
reaction;81 lanes 4-25 contain 4 J,LM MPE·Fe(II): lane 4, MPE·Fe(II) standard;
lane 5 4 J,LM D; lane 6, 20 J.LM 2-PyN; lane 6, 20 J.LM 2-ImN; lanes 8-10 contain
35 J,LM, 10 J,LM, and 1 J,LM 3-PyN respectively; lanes 11-13, 35 J,LM, 10 J,LM, and
1 J.LM 4-PyN respectively; lanes 14-16, 35 J,LM, 10 J,LM, and 1 J.LM NPy respectively;
lanes 17-19, 35 J,LM, 10 J,LM, and 1 J,LM NMePy respectively; lanes 20-22, 50 J,LM,
35 J,LM, and 10 J,LM PyP+PPy respectively; and lanes 23-25, 35 J,LM, 10 J,LM, and
1 J,LM Nlm respectively.

- 276-
>.
~ CL z z {
0 >. >.
~ Q) E .... z z CL CL ::E ~ - >. E
I I z z z c:
~ M ~
0 CL I I
()(.9 < 0 C\1 C\1
1 2 3 4 5 6 7 8 9 10 11 12 13 14 15 16 17 18 19 20 21 22 23 24 25
- - - --- -- - - -.... - - - .... -- - - - - - .. -- - ---- ---- - -• -- •

-277-
Appendix B
Summary of Quantitative Footprinting Data

-278-
f!-PyN Quantitative Footprinting Data
[MPE] Site Data Gel K a x2 K a x2 File # Monomer Dimer
1J,LM TGTCA qfppS23w 264 2.0x10⁵ 1.71 2.Sx105 0.71 qfpp78a 278 1.8x10⁵ 0.87 2.1x10⁵ 0 .66 qfpp82a 262 1.4x10⁵ 1.99 1.9x10⁵ 1.40
Average 1.7x10⁵ 18a 2.2x10⁵ 14a
TTTTT qfppS23x 264 3.6x10⁵ 1.19 3.0x10⁵ 1.06 qfpp78c 278 1.1x10⁵ 1.36 1.2x10⁵ 1.12 qfpp82b 262 2.1x10⁵ 1.18 3.2x10⁵ 0 .94
Average 2 .3x105 so a 2.Sx105 44a
TTAAT qfppS23y 264 4 .2x104 1.28 7.2x10⁴ 1.27 qfpp78b 278 7.4x10⁴ 1.13 9 .9x104 l.S4 qfpp82c 262 S.4x104 1.28 8.7x10⁴ 1.03
Average S.7x104 28a 8.6x10⁹ 16a
AATAA qfppS23z 264 8.6x10⁴ 2.S9 1.2x10⁵ 1.31 qfpp78d 278 8.4x10⁴ 3.06 1.1x10⁵ 2.27 qfpp82d 262 7.8x10⁴ 2.97 1.1x10⁵ 1.93
Average 8.3x10⁴ sa 1.2x10⁵ s a
O.S J,LM TGTCA qfpp106a 314 1.9x10⁵ 3 .1S 2.4x10⁵ 0 .93 TTTTT qfpp106b 314 l.Sx105 0.71 1.9x10⁵ O.S8 TTAAT qfpp106c 314 2.6x10⁴ 2.23 6.4x10⁴ 1.79 AATAA qfpp106d 314 1.3x10⁵ 3.00 1.7x10⁵ l.S8
0.38 J.LM TGTCA qfpp82Sa 28S 3.0x10⁵ 0.93 3.1x10⁵ 0 .26 qfpp103a 312 1.6x10⁵ 2.32 2.4x10⁵ 0 .67
TTTTT qfpp82Sb 28S 6.1x10⁵ 0.61 2.3x10⁵ o .ss qfpp103b 312 1.3x10⁵ 1.42 1.3x10⁵ 1.19
AATAA qfpp82Sd 28S 2.1x10⁵ 1.44 2.Sx105 0.92 qfpp103d 312 6 .8x104 2.18 1.2x10⁵ 1.41
TTAAT qfpp103c 312 2.2x10⁴ 0.48 2.7x10⁴ O.S9
a Standard Deviation (%).

-279-
D, 2-ImN Quantitative Footprinting Data
L Site Data Gel K a x2 Ka x2 File # Monomer Dimer
D TTTTT qfpd614k 273 4.4x10⁷ 2.84 6.3x10⁷ 2.28 qfpd615k 275 7.7x10⁷ 0.96 9.0x10⁷ 1.06 qfpd618k 276 4.7x10⁷ 1.60 5.8x10⁷ 2 .19 qfpd78k 277 3.6x10⁷ 0.69 4.7x10⁷ 1.04
Average 5.1x10⁷ 35a 6.5x10⁷ 28a
TTAAT qfpd614l 273 2.7x10⁶ 1.32 3.3x10⁶ 0.81 qfpd6151 275 1.9x10⁶ 1.88 1.9x10⁶ 1.89 qfpd618l 276 1.6x10⁶ 1.35 1.8x10⁶ 0.78 qfpd78l 277 6.9x10⁵ 1.02 1.2x10⁶ 0.85
Average 1.7x10⁶ 49a 2.1x10⁶ 42a
AATAA qfpd614m 273 1.9x10⁷ 0.92 2.0x10⁷ 0.57 qfpd615m 275 2.7x10⁷ 0.68 2.3x10⁷ 1.44 qfpd618m 276 1.3x10⁷ 0.42 1.4x10⁷ 1.62 qfpd78m 277 5.4x10⁶ 1.10 6.7x10⁶ 1.40
Average 1.6x10⁷ 57a 1.6x10⁷ 45a
2-ImN TGTCA qfpi64 268 1.4x10⁵ 1.40 1.5x10⁵ 0.63 qfpi612a 271 1.6x10⁵ 1.63 1.9x10⁵ 0.64 qfpi712 279 1.1x10⁵ 1.39 1.3x10⁵ 0.46
Average 1.4x10⁵ 18a 1.6x10⁵ 19a
a Standard Deviation (%).

-280-
0.9 TTTTT Site
0.7 Ka = 7.7 x1 0 7 M ·1
0.5 x2 = o.96 1!1
G) :::l c; 0.3 > >
0.1
-0.1 1!1 1!1 1!1 1!1
1.0 TTAAT Site
0.8 Ka = 1.9 x1 0 6 M "1
0.6 x2 = 1.89
G) :::l c; > 0.4 >
0.2
0.0 1!1 Ill
1.0 AATAA Site
0.8 Ka = 2.7 x1 0 7 M ·1
0.6 X 2 = 0.68
G) :::l c; > 0.4 >
0.2
0.0 1!1
-0.2 - 1 2 - 1 0 - 8 - 6 - 4
Log [D]
D, Gel # 275, 1 ~M MPE·Fe(II), qfpd615 Data
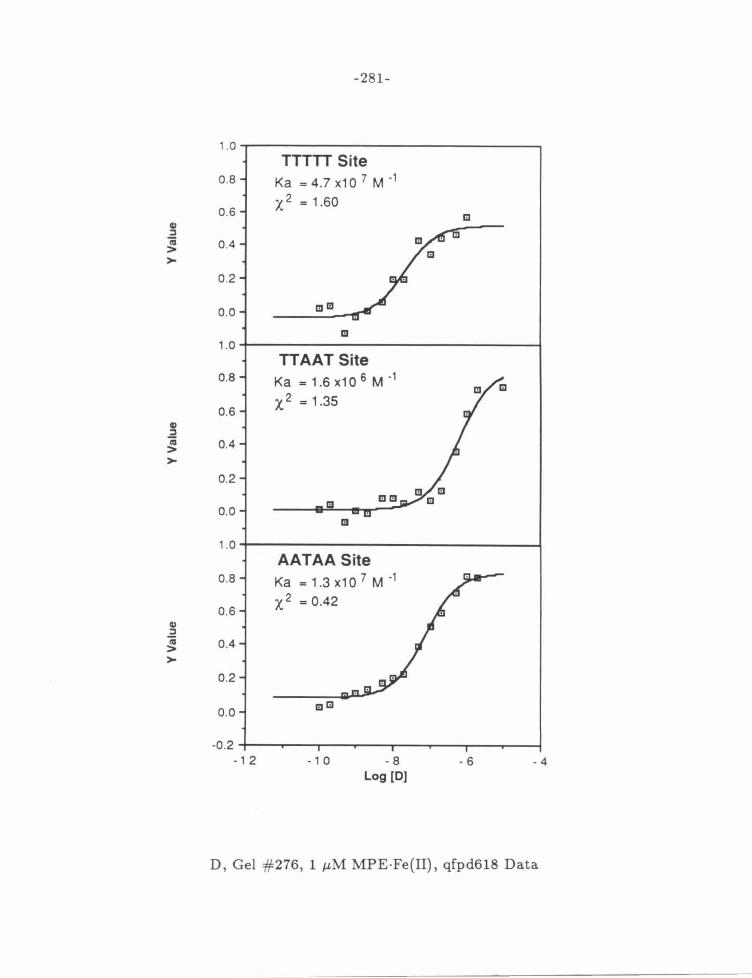
-281-
1.0 TTTTT Site
0.8 Ka = 4.7 x1 0 7 M -1
0.6 X 2 = 1.60
1:1 Gl ~
"i > 0.4 >
0.2
0.0 m~:~
1!1 1.0
TTAAT Site 0.8 Ka = 1.6 x1 0 6 M -1
0.6 X 2 = 1.35
Gl ~ "i 0.4 > >
0.2
0.0 1:1
1.0 AATAA Site
0.8 Ka = 1.3 x1 0 7 M -1
0.6 x 2 = o.42
Gl ~
"i > 0.4 >
0.2
0.0 ~:~!:!
-0.2 -1 2 - 1 0 - 8 - 6 -4
Log [D)
D, Gel #276, 1 JLM MPE·Fe(II), qfpd618 Data
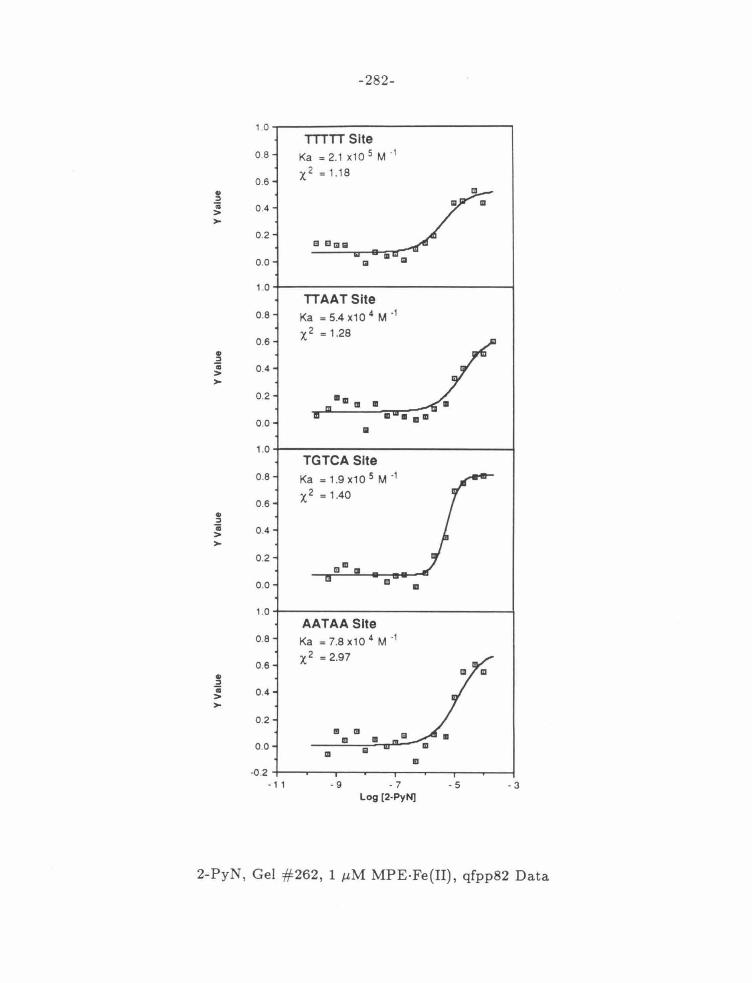
-282-
1.0 TTTTT Site
0.8 Ka = 2.1 x10 5 M · 1
0.6 x2 =1.18
.. ~ -; 0 .4 > >
0.2 a mlil 11
0.0 Ill
1.0 TTAATSite
0.8 Ka = 5.4 x10 4 M '1
0.6 x2 = 1.28
• ~ -; 0.4 > >
0.2
0 .0 Iii
1.0 TGTCA Site
0.8 Ka = 1.9x10 5 M·1
0.6 X 2 = 1.40
• ~ -; 0.4 > >
0.2
0.0 II
1.0 AATAA Site
0.8 Ka = 7 .8 x10 4 M ·1
0 .6 x2 = 2.97
• ~ 'i 0.4 > >
0.2
• II m II
0.0 &I II m
-0 .2 - 1 1 - 9 - 7 - 5 - 3
Log [2-PyN]
2-PyN, Gel #262, 1 ,uM MPE·Fe(II), qfpp82 Data

-283-
1.0
TTTTT Site 0 .8 Ka =1.1x10 5 M ·1
0 .6 X 2 = 1.36
Qj ~
Cii 0 .4 > >-
0 .2
0 Iii
0 .0
1.0
TTAATSite 0 .8 Ka = 7.4 x10 4 M ·1
0 .6 x2 = 1.13
Qj
.a .. 0.4 > >-
0.2 • Ill
II Ill Iii.
0.0
1.0
TGTCA Site 0.8 Ka =2.1x10 5 M·1
0.6 x2 = o.66
.. ~
Cii 0 .4 > >-
0.2 ID
0.0
1.0
AATAA Site 0.8 Ka = 8 .4 x10 4 M ·1
0.6 x2 = 3 .06
.. ~
"i 0.4 > >-
0 .2
0.0
-0.2 II II.
- 1 1 - 9 - 7 - 5 -3 Log [2-PyN]
2-PyN, Gel #278, 1 J.LM MPE ·Fe(II), qfpp78 Data

-284-
1.0 TTTTT Site
08 Ka = 1.5 x1 0 5 M '1
0 .6 x2 = o.11
Ill :I iii 0.4 > >
0.2
0.0
1.0 TTAAT Site
0.8 Ka = 2.6 x1 0 4 M ·l
0.6 X 2 = 2.23
! iii 0.4 > >
0.2 Iii Ill El II II II 101
0.0 Ill • 1.0
TGTCA Site 0.8 Ka = 1.5 x1 0 10 M ·2
0.6 x2 = 1.21
Ill :I iii 0.4 > >
0.2 II
0.0 II
1.0 AATAA Site
0.8 Ka = 1.3 x10 5 M ·1
0.6 x2 = 3.oo
• :I iii 0.4 > >
0.2
0.0 101
-o.2 -11 -9 - 7 - 5 - 3
Log [2-PyN]
2-PyN, Gel # 314 , 0.5 J.LM MPE-Fe(II), qfpp106 Data

-285-
1.0 TTTTT Site
08 Ka =1.3x10 5 M-1
0 .6 x2 = 1.43
~ ::I "i 0 .4 > >
0 .2
Ill 0 .0
1.0 TTAAT Site
0 .8 Ka =2.2x10 4 M -1
0 .6 x2 = o.48
Ql ::I "i 0 .4 > >
0 .2
0 .0
1.0 TGTCA Site
0 .8 Ka = 1.6 x10 5 M _,
0 .6 x2 = o.67
~ ::I "i 0.4 > >
0 .2 II lllliJ
0 .0
1.0 AATAA Site
0 .8 Ka = 6.8 x10 4 M _,
x2 = 2.1 8 Iii 0.6
Ql ::I "i 0 .4 > >
0 .2 . ., .. 0.0 Ill
.0.2 _, 1 -9 - 7 -5 - 3
Log [2-PyN]
2-PyN, Gel #285, 0.375 JLM MPE·Fe(II), qfpp825 Data
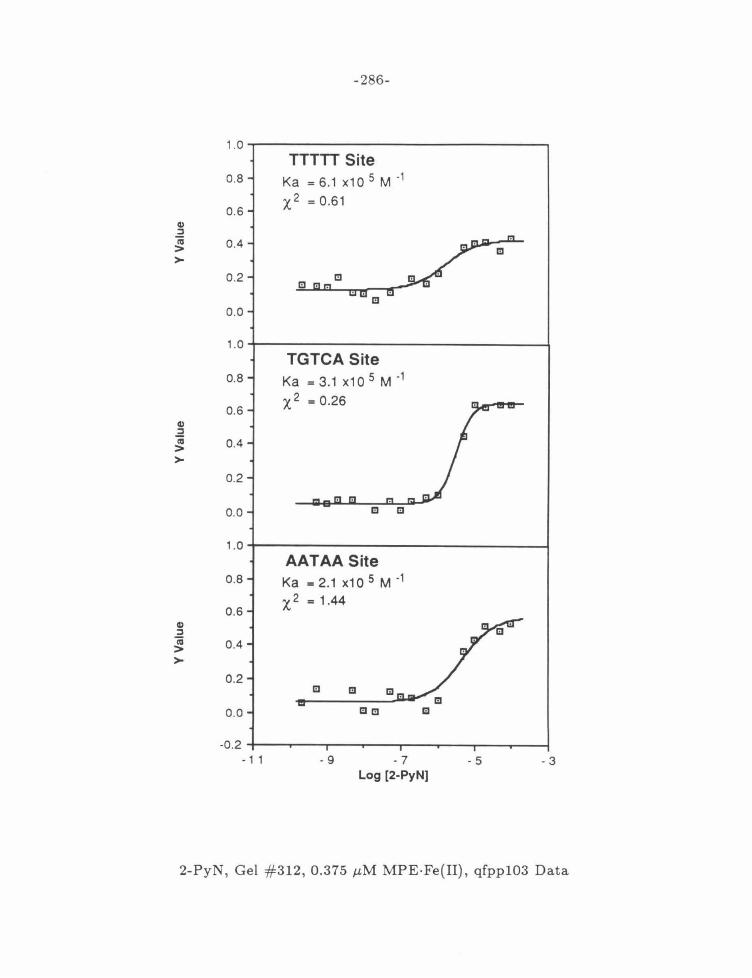
-286-
1.0 TTTTI Site
0.8 Ka =6.1x10 5 M-1
0.6 x2 = o.61
Q) :I IV > 0.4 >
0.2
0.0
1.0 TGTCA Site
0.8 Ka = 3.1 x1 0 5 M -1
0.6 x2 = o.26
Q)
:I IV > 0.4 >
0.2
0.0
1.0 AATAA Site
0.8 Ka z2.1 x105M-1
0.6 x2 = 1.44
G) :I IV > 0.4 >
0.2 1::1 1::1 1::1
0.0 1::11::1
-0.2 - 1 1 - 9 - 7 - 5 - 3
Log [2-PyN]
2-PyN, Gel #312, 0.375 J.LM MPE·Fe(II), qfpp103 Data

Q)
.2 (II
> >
Q) :J iii > >
-287-
1.0 TGTCA Site
0.8 Ka = 3.5 x1 0 10 M ·2 1;:1
0.6 x2 = o.65
0.4
0.2 1;:1 1;:1 1;:1
1!1
0.0 1;:1 1;:1
-0.2 - , 1 - 9 - 7 - 5 -3
Log [2-lmN]
, .0 TGTCA Site
1!1 0.8 Ka = 2.3 x1 0 10 M -2
0.6 x2 = o.63
0.4
0.2
1;:1 1;:1
0.0 1;:1 1!1
-0.2 - 1 1 - 9 - 7 - 5 -3
Log (2-lmN]
2-ImN, Gel #268, 1 J.LM MPE·Fe(II), qfpi64 Data 2-ImN, Gel #271, 1 J.LM MPE·Fe(II), qfpi712 Data

-288-
Appendix C
Proposed G ·C Binding Molecules

H 0 (;/OEI 1) K2C03,
I(CH~0CH2I
2) NaOH
~N02
RO H~~ N02
RO H'JrN " I N I . 0 f, I
0 (CH2)n P1 Extenston N 0 (CH2)n 1
1 0 I 1 o f/N\ /_o (.NylloR (.NyllN~ 02N
~ / J-JI H OR 02N 02N
n = 3, 4, 5 R = Et, H I) NaOH
2) DCC, HOBt,
H2N~N"' I
I I N~ -· / -· \ ., '\_ NO, / '\_ HN_(-N,
·~~n ~~no o-' '._!f 1('-~? o' U/ 1('-• ..:>
N 0 I N 0 I I (CH2)n I H2, Pd/C I (CH2)n I
I 0 N I 0 UN\ /;
c"Yl _}f).-fo ' o c"Yl ~o 'j-.!1 ~ A HN ~rOH 0 J-JI ~ A HN
o,N " N '.-:-NH " N- /. ~N N-
1 ~ I
I
~ 00 10 I

I N~ /N\ )==N
i-HN 0 + ~0 OH
-0 2N 02N
see WSW-III-30
~ ~
N~ 'FN
c:HN O
1) H2, Pd/C ;:;..-"' -2) DCC, HOBt HN
o2N~~ N
/
H N
O /NHBoc
Jl. .tBu
CI ............... N 0 1) ~NC6H40COCI H N
;:HBoc
(ff (ff NaH (Ylon N
2) NaOH
see JSK
1) H2, Pd/C
2) CDI 3)TFA
~ N 'fN HeN 0
N--HN
HNL-~ (~0 t-
\ NH2
I t.,j (!) 0 I

-291-
Appendix D
Other Potential G·C Binding Molecules Synthesized

-292-
I-230, II-88
~~~ ~~~N~~Yl-Y OH OH 0 0 HO HO
0
OH
I-230, II-88
N~N~N H I H
I-226, II-80, 82
0
HO
Compounds Which Do Not Bind Detectably to DNA. References are to key note
book pages with synthesis and characterization respectively.

-293-
I I
""\ ""\ H~ H~
'7 N- '7 N-
HN HN
;£;a_ ;sNa__ HN HN
~0 ~0 OH OMe
I-270, appendix A
EDTA EDTA I I I ""\ ""\ ""\
H~ H~ H~ '7 N-'7 N- '7 N-
HN HN HN rso-;sNo__ iS•o- HN
HN HN ro ~0 ~0 NH NH
NH
I-176, ll-39, 43 ill-23, ll-177
Additional compounds which appear to bind weakly to DNA with the normal
distamycin A specificity. References are to key notebook pages with synthesis and
characterization respectively.

-294-
Appendix E
Computer Programs

-295-
A Commentary on HistSO.tex
Hist80.tex is a TEX program which takes an input sequence of DNA and
generates a bar or arrow histogram to be output on the laser printer. The software
was originally written by Jim Sluka, and has been modified several times since.
Because the understanding of TEX is a hard-won process, I will attempt to describe
hist80 in such a way as to make future modification easier.
WARNING Even simple changes can produce far-reaching effects. Make all changes on a copied version of the program. A spare copy will be kept on my thesis
disk for emergency recovery.
For those few brave souls who wish to use the power of TEX, I commend you. I
urge you to start by reading the first twenty-three chapters of the TEXbook and do
as many exercises as are humanly possible. TEXing is just not agreeable without
much practice. I will also leave a copy of this thesis on floppy disk which is designed
to run off the floppy. The disk is intended to be an extended example of T£X in
action. I do not claim to be an expert and therefore it is highly likely that there
is plenty of inefficient code and more than one lapse of insight. Still, this thesis
should be a reasonable example of what can be done with TEX· The following
discussion will be divided into two parts. The general introduction to the program
is relatively straightforward, but the design portion assumes an acquaintance with
the T£Xbook.
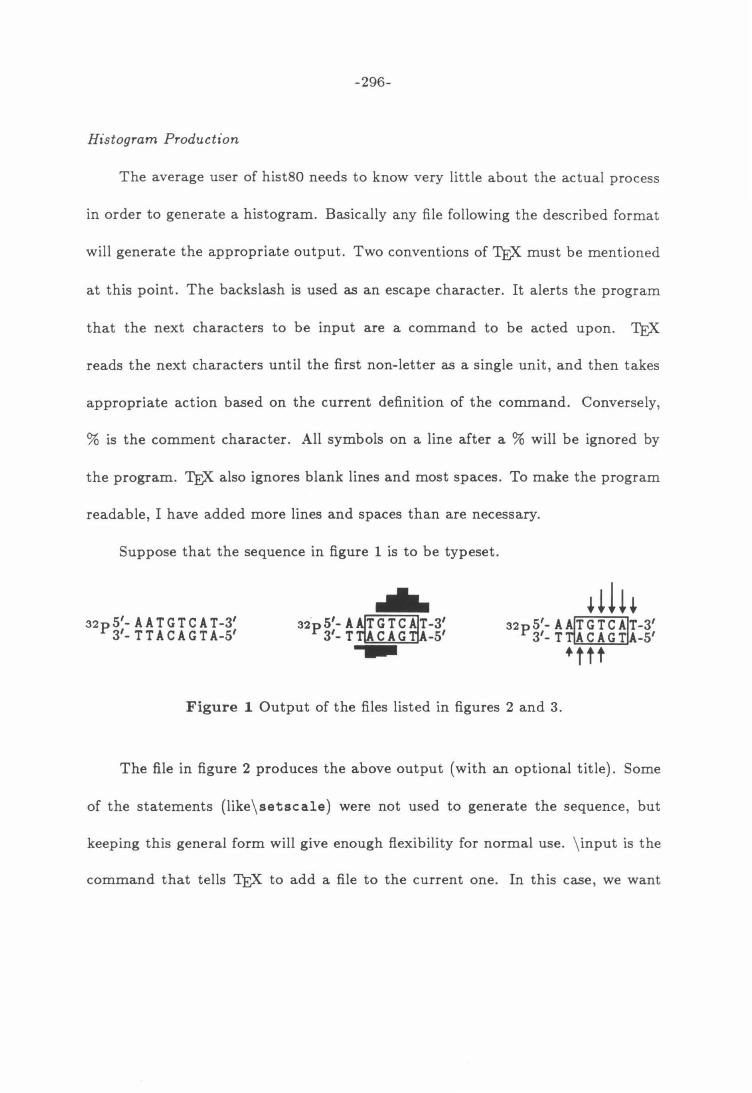
-296-
Histogram Production
The average user of hist80 needs to know very little about the actual process
in order to generate a histogram. Basically any file following the described format
will generate the appropriate output. Two conventions of 'lEX must be mentioned
at this point. The backslash is used as an escape character. It alerts the program
that the next characters to be input are a command to be acted upon. 1E,X
reads the next characters until the first non-letter as a single unit, and then takes
appropriate action based on the current definition of the command. Conversely,
% is the comment character. All symbols on a line after a % will be ignored by
the program. 'lEX also ignores blank lines and most spaces. To make the program
readable, I have added more lines and spaces than are necessary.
Suppose that the sequence in figure 1 is to be typeset .
32p5'- AATGTCAT-3' 3'- TTACAGTA-5'
... 32.p5'- AmG rcm-3'
3'- T CAG -5'
Figure 1 Output of the files listed in figures 2 and 3.
The file in figure 2 produces the above output (with an optional title). Some
of the statements (like\setscale) were not used to generate the sequence, but
keeping this general form will give enough flexibility for normal use. \ input is the
command that tells 1E,X to add a file to the current one. In this case, we want

-297-
\ input d:/programs/his/hist80
\ title {Short Sequence}
\ bars
\ start \ setscale{lOO}
\ A{O}{O} \ A{O}{O} \ T{O}{O} \ G{O}{O} \ T{O}{O} \ C{O}{O} \ A{O}{O} \ T{O}{O} \ stop
\ vfill\ eject \ end
Figure 2 A typical sequence file used by hist80.tex.
to process the file with definitions and macros present in hist80, and so the file is
added first. \ vfill\ eject \ end are commands that should occur at the end of all
TEX files. They finish out the page and end the program without complaint .
The rest of the commands relate directly to histograms and are defined by
hist80. \ start tells TEX that a histogram is being made and adds the 32P label
and the lefthand side 51 and 3'. Next comes the sequence arranged so that the
lefthand side of the top strand in the display is at the top of the file. The numbers
in curly brackets are parameters which will be described later. \ stop then tells
t he program that the histogram is finished and adds the right hand s ide 5' and 3'.

-298-
To utilize the other macros it is necessary to construct a histogram like the
one shown below. Suppose that we have an MPE·Fe(II) footprint such that on the
5' strand the GTCAT bases of the previous example are protected by 5, 10, 15, 10,
and 5 mAU respectively, and on the 3' strand the ACAT bases are protected 5, 6, 7
and 1 mAU respectively. This would give a 5 bp binding site, which can be boxed
as shown in figure 1 using both bars and arrows.
\ input d : /programs/his/hist80
\ title {Short Sequence}
\ bars
\ start \ setscale{100}
\ A{O}{O} \ A{0}{1} \ boxit{5} \ T{0}{7} \ G{5}{6} \ T{10}{5} \ C{15}{0} \ A{10}{0} \ T{5}{0} \ stop
\vfill \ eject\end
Figure 3 A typical histogram file used by hist80. tex.
The file which produces this output is shown in figure 3. \ bars tells 'fEX to
choose bars for the histogram (\arrows chooses arrows). The parameters after
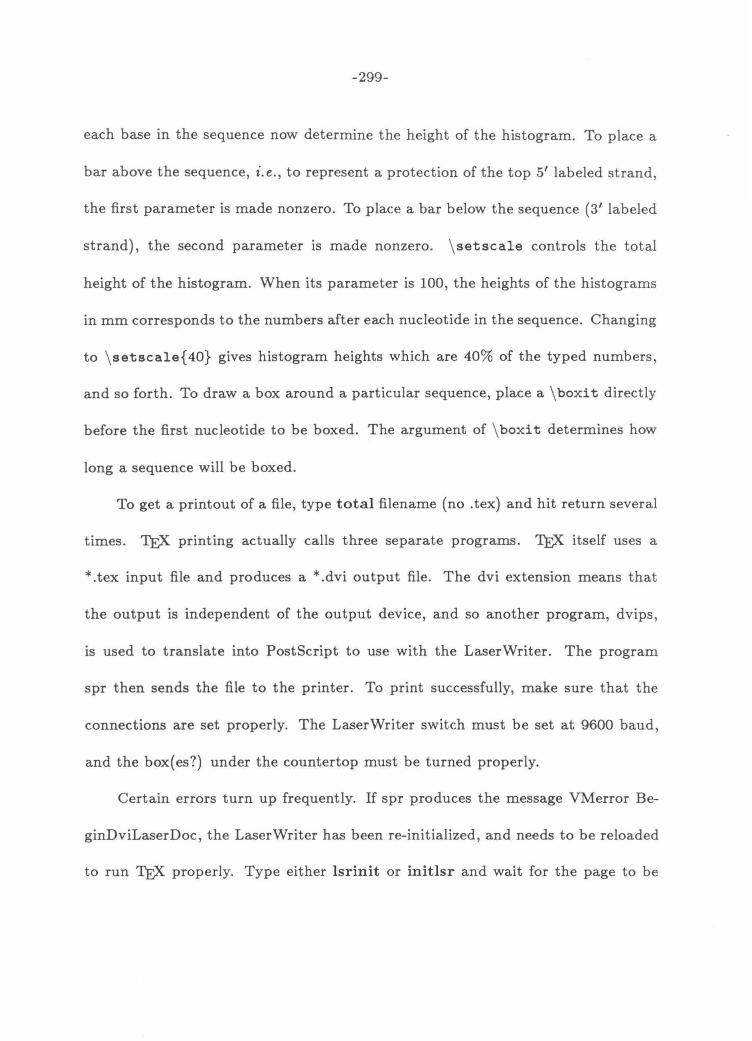
-299-
each base in the sequence now determine the height of the histogram. To place a
bar above the sequence, i.e., to represent a protection of the top 51 labeled strand,
the first parameter is made nonzero. To place a bar below the sequence (3' labeled
strand), the second parameter is made nonzero. \ setscale controls the total
height of the histogram. When its parameter is 100, the heights of the histograms
in mm corresponds to the numbers after each nucleotide in the sequence. Changing
to \ setscale{ 40} gives histogram heights which are 40% of the typed numbers,
and so forth . To draw a box around a particular sequence, place a \ boxi t directly
before the first nucleotide to be boxed. The argument of \ boxi t determines how
long a sequence will be boxed.
To get a printout of a file, type total filename (no .tex) and hit return several
times. 'lEX printing actually calls three separate programs. 'lEX itself uses a
* .tex input file and produces a * .dvi output file. The dvi extension means that
the output is independent of the output device, and so another program, dvips,
is used to translate into PostScript to use with the LaserWriter. The program
spr then sends the file to the printer. To print successfully, make sure that the
connections are set properly. The LaserWriter switch must be set at 9600 baud,
and the box( es?) under the countertop must be turned properly.
Certain errors turn up frequently. If spr produces the message VMerror Be
ginDviLaserDoc, the LaserWriter has been re-initialized, and needs to be reloaded
to run TEX properly. Type either lsrinit or initlsr and wait for the page to be

-300-
printed. If spr produces the error Nostringval, ignore it. Everything should print
as usual. If any other error occurs, the LaserWriter memory is probably jammed.
First try spr again. Sometimes data gets garbled on the way to the printer, and
sending it twice will fix the problem. Next try printing a small file from the Mac.
If this doesn't help, check the status of the LaserWriter by typing status. This
command will dump the amount of memory used to the screen. If less than 20K
remains before the purge, then the memory needs to be unjammed. Turn off the
LaserWriter, turn it back on, wait for the boot page, and lsrinit as before. If this
does not work, trying panicking, calling CCO, buying a new LaserWriter, etc. You
are now a fully qualified user of hist80.
WARNING The rest of this appendix will deal with the hist80 macros themselves. Consider the rest of this a dangerous bend section (see Knuth, D .E . The TE;Xbook).
In the original design of hist80, the designer, Jim Sluka, was faced with a
number of different specifications which needed to be met simultaneously. The
sequence needs to be evenly spaced, and ideally both strands should be produced
from one strand sequence. Histograms can contain either bars (footprinting) or ar-
rows (affinity cleaving) or both, which must be centered on the proper bp. Binding
sites need to be boxed, and the left and right sides of the box must be centered
between two bp. To address these challenges, Jim used some of the advanced
capabilities of 'JEX.

-301-
Each position of the sequence was conceived as a vertical series of boxes. At
the top is the cleavage or protection pattern for the 5' strand, followed by the 5'
base, followed by the 3' base, followed by the cleavage or protection pattern of the
3' strand. Horizontal equal spacing was readily accomplished by using the TEX
\ setbox facility. The width of all bp was set by determining the width of a G
plus a little extra space (\ charwidth). The vertical boxes of any given sequence
position are then placed in a \ hbox of width \ charwidth. These boxes are then
tightly packed horizontally so that there is no glue between them, ensuring equal
spacing.
Vertical spacing is determined using the strut concept. (A strut is a vertical
line of zero width.) Jim chose a maximum height for the histogram above and
below the sequence of 50 mm. The sequence itself contains struts which are just
slightly higher than a single character. Thus the total height of the histogram is 50
mm for the 51 data, 2 \charheight for the sequence, and 50 mm for the 31 data,
but only the heights of the bars or arrows are visible.
Alignment of arrows over the middle of the sequence proved more difficult,
since boxes have a single horizontal reference point . However, TEX does not require
that the contents of a box reside in that box. This allows for the constructions
\ rlap, \mlap, and \llap, which are boxes of zero width with the contents of the
box just to the right of the box, centered on the box or just to the left of the
box. Hist80 places the the entire contents of a sequence position box inside an

-302-
\ mlap, then fills the sequence box with glue (of width \ charwidth). This has
the effect of placing the \ mlap box at the extreme left of the sequence box, and
the \ mlap ensures that the contents are centered there. This also means that
the positions of the printed sequence do not correspond to the postions that the
computer calculates (Oh well). To reach the actual midpoint between two bp, the
program must skip either forward or backward by \ halfcharwidth.
Boxing a binding site is also a lesson in using TEX commands. Again, hist80
uses \ mlap so that no physical space is taken up by the box itself. Four lines need
to be drawn to produce the proper box. The vertical two are readily accomplished,
with a skip of one \halfcharwidth backwards or one \ halfcharwidth backwards
followed by the appropriate number of \ charwidth forward giving the correct
horizontal positions for \ vrule's. Hist80 handles the top of the box by drawing
a rule with a large height, a negative depth of slightly smaller magnitude, and a
width of the right number of \ charwidth's. This yields a visible line of thickness
height - depth which is drawn depth units above the baseline. Similar use of a
negative height and a positive (and larger depth) gives the bottom line of the box.
So far, there has been no distinction made between arrow and bar histograms,
and for most practical purposes none is needed. Any differences which do exist can
be handled using the \ ifcase construction of 'lEX· One caveat remains, however.
Jim did not like the available arrowheads of TEX, and so he wrote his own definition.
For each arrowhead constructed, the program must draw a set of twenty nested

-303-
\ vrule's of gradually increasing width. As a consequence, arrowheads take up
most of the programs processing memory, and a common error seen is "Sorry, 'lEX
main memory capacity exceeded." When this happens, placement of a \ page in
the middle of a sequence should permit printing.
The rest of hist80 is relatively straightforward, and its understanding will be
left for the reader. As a further example of this general approach to alignment , I
offer the hom.def program used to contruct the protein homology figure in chap
ter 5. This program uses exactly the same strategy as hist80, with the added
complication that boxes can have dotted boundaries as well as solid ones, and a
box may not be square or rectangular. The reader is referred to the file gjfig2 .tex
for usage of hom.def definitions.
The rest of this appendix contains the source code for hist80.tex, hom.def,
and a representative sample of the programs used in this thesis, which will not be
discussed in detail.

-304-
Hist80.tex
\magnitication=\magstep1 \nopagenumbers \special{ps: landscape}\ \par\vtill\eject \tracingstats=1 \pageno=1 ~ ============================= HISTOGRAM Macros ================================ ~ 80bp/line version, April 1986 ~ ===============================================================================
\baselineskip=Opt \lineskiplimit=Opt \lineskip=Opt \parindent=Opt \parskip=Opt plusOpt minus20truemm
\pretolerance=10000 \tolerance•10000 \exhyphenpenalty=O \linepenalty=O \adjdemerits=O \doublehyphendemerits=O \tinalhyphendemerits=O
~ FONTS -------------------------------------------\tont\rm•amr10 \tont\tt=amtt10 \tont\srm=amr8
~ ignore CR'c and spaces \det\nocrsp{\begingroup\catcode\~~L=9\catcode\ =9\catcode\~~M=9\endlinechar=-1} \det\crsp{\endgroup}
\newdimen\charheight \newdimen\charwidth \newdimen\haltchar \newdimen\shortdbl \newdimen\topboxit \newdimen\scale \newdimen\scaledht \newcount\arrowbarcharseq \newcount\printer \printer=O \newcount\colcount \colcount=1 \newcount\maxcount \maxcount=80 \newcount\linecount \linecount=O
\setboxO•\hbox{{\tt G}}\charheight=\htO\charwidth=\wdO\setboxO=\null \advance\charwidth by1 . 6pt \advance\charheight by2pt \advance\haltchar by\charwidth\divide\haltchar by2 \advance\shortdbl by2\charheight\advance\shortdbl by- 0 . 6pt \advance\topboxit by2\charheight\advance\topboxit by0 . 2pt
\det\mlapt1{\hbox toOpt{\hss t1\hss}}
\det\dh{\hskip 3sp plus1sp minus1sp\penalty-200}~allow breaks atter bp's
~ ============•================ PRINTER TYPE =========================== ~\det\laser{\global\printer=O\setprinter} ~\det\versatec{\global\printer=1\setprinter} ~\det\epson{\global\printer=2\setprinter} ~

-305-
~ =========================== TYPE OF HISTOGRAM ======================== \def\arrows{\global\arrowbarcharseq=O} \def\bars{\global\arrowbarcharseq=1} \def\characters{\global\arrowbarcharseq=2} \def\sequence{\global\arrowbarcharseq=3} \sequence ~ default output type ~ \endlinechar=-1
\def\a{\A{O}{O}} \def\t{\!{0}{0}} \def\c{\C{O}{O}} \def\g{\G{O}{O}}
\def\start{\message{START OF PROCESSING} \leavevmode\parshape=1 Opt 80\charwidth\leftlbl}
\def\stop{\rightlbl\hfill\break}
\def\page{\par\vfill\eject\leavevmode\parshape=1 Opt 80\charwidth}
\def\downarrowhead{\dimen60=0pt\relax \loop\ifdim\dimen60<4pt\advance\dimen60 by0.2pt \mlap{\raise\dimen60\hbox{\vrule height0 . 2pt depthOpt width\dimen60}} \repeat}
\def\uparrowhead{\dimen60=0pt\relax \loop\ifdim\dimen60<4pt\advance\dimen60 by0 . 2pt \mlap{\lower\dimen60\hbox{\vrule heightOpt depth0 .2pt width\dimen60}} \repeat}
\def\boxitt1{\rlap{\hskip-\halfchar\mlap{\vrule height\topboxit width0.7pt depth1.7pt}\rlap{\vrule height\topboxit widtht1\charwidth depth-\shortdbl}\rlap{\vrule
height-1pt widtht1\charwidth depth1 . 7pt}\hskipt1\charwidth\mlap{\vrule height\topboxit width0.7pt depth1 . 7pt} \hskip-t1\charwidth\hskip\halfchar}}
\def\bboxitt1{{\advance\topboxit by1pt \advance\shortdbl by1pt \rlap{\hskip-\halfchar\mlap{\vrule height\topboxit width0.7pt depth2.7pt}\rlap{\vrule height\topboxit widtht1\charwidth depth-\shortdbl}\rlap{\vrule
height-2pt widtht1\charwidth depth2.7pt}\hskipt1\charwidth\mlap{\vrule height\topboxit width0.7pt depth2 . 7pt} \hskip-t1\charwidth\hskip\halfchar}}}
\def\aetscalet1{\global\scale•t1sp\relax} \setacale{100}
\def\calct1{\scaledht=t1truemm \multiply\scaledht by\scale\global\divide\scaledht by100}
~\def\curline{\ifnum\colcount>\maxcount\endlinechar=13\par ~\ \unskip\colcount=2\advance\linecount by1 ~\message{ ~NEW LINE -- \number\linecount}\endlinechar=-1 ~\else\advance\colcount by1\fi}
~\def\setprinter{\ifcase\printer ~ case 0; output for LASER PRINTER (LANDSCAPE MODE) --------------------~\message{LASER} \hoffset=0 . 6truein \hsize=80\charwidth

\topskip=0 . 6truein \voffset=0.01truein \vsize=6truein ~\or
-306-
~ case 1; output for VERSATEC (LANDSCAPE MODE) -------------------------~\message{VERSATEC} ~\hoffset=0 . 6truein ~\hsize=80\charwidth ~\topskip=0 . 1truein ~\ vsize• 10truein ~\or ~ case ~; output for EPSON (PORTRAIT MODE) -----------------------------~\message{output set for EPSON printer} ~\hoffeet•0 . 76truein ~\heize•80\charwidth ~\topskip=0 . 6truein ~\vei:u•10truein ~\voffset•0.6truein ~\fi} ~\laser ~ default printer
\def\lstrut{\ifcase\arrowbarcharseq \vrule height\charheight depthOpt widthOpt \or \vrule height\charheight depthOpt widthOpt \or \vrule height\charheight depthOpt widthOpt \or \vrule height\charheight depthOpt widthOpt \fi}
\def\astrutt{\ifcase\arrowbarcharseq \vrule height60truemm depth1 . 6pt widthOpt \or \vrule height60truemm depth1 . 6pt widthOpt \or {} \or {} \fi}
\def\astrutb{\ifcase\arrowbarcharseq \vrule heightOpt depth60truemm widthOpt ~see \or \vrule \or
heightOpt depth60truemm widthOpt ~see
\vrule \or
height Opt depth60truemm widthOpt hee
\hbox{\vrule heightOpt depth8mm widthOpt} \fi}
also vskip
also vskip
also vskip
\def\downarrowll{\ifcase\arrowbarcharseq \hbox{\astrutt\vbox{\ifnum11>0\calc{l1} \mlap{\vrule height\scaledht depth1 . 6pt width0 . 8pt} \mlap{\downarrowhead}\fi\vekip 0 .4pt\relax}}
in uparrow
in up bar
in up bar
\or \hbox{\aetrutt\vbox{\ifnum11>0\calc{l1}\mlap{\vrule height\scaledht depth1 . 6pt width\charwidth}\fi\vskip 0 .4pt\relax}}
\or {} \or {} \fi}

-307-
\fi}
\def\uparrowt1{\ifcaae\arrowbarcharaeq \hbox{\aatrutb\vbox{\vakip 3.2pt\ifnumt1>0\calc{#1} \mlap{\uparrowhead}\mlap{\vrule height\acaledht depth1pt width0 .8pt}\fi}} \or \hbox{\aatrutb\vbox{\vbox to 3.2pt{}\ifnum#1>0\calc{#1} \mlap{\vrule height1 . 6pt depth\acaledht width\charwidth}\fi}} \or {} \or {} \fi}
\def\At1t2{\ifcaae\arrowbarcharaeq \hbox to\charwidth{\vtop{\vbox{\downarrow{#1}\mlap{\latrut A} \mlap{\latrut T}}\uparrow{#2}}\hfil}\dh \or \hbox to\charwidth{\vtop{\vbox{\downarrow{#1}\mlap{\latrut A} \mlap{\latrut T}}\uparrow{#2}}\hfil}\dh \or \hbox to\charwidth{\vtop{\mlap{\latrut A}\mlap{\latrut T}}\hfil}\dh \or \hbox to\charwidth{\vtop{\vbox{\mlap{\latrut A} \mlap{\latrut T}}\aatrutb}\hfil}\dh \fi}
\def\!#1#2{\ifcaae\arrowbarcharaeq \hbox to\charwidth{\vtop{\vbox{\downarrow{t1} \mlap{\latrut T}\mlap{\latrut A}}\uparrow{#2}}\hfil}\dh \or \hbox to\charwidth{\vtop{\vbox{\downarrow{#1} \mlap{\latrut T}\mlap{\latrut A}}\uparrow{#2}}\hfil}\dh \or \hbox to\charwidth{\vtop{\mlap{\latrut T} \mlap{\latrut A}}\hfil}\dh \or \hbox to\charwidth{\vtop{\vbox{\mlap{\latrut T} \mlap{\latrut A}}\aatrutb}\hfil}\dh \fi}
\def\Gt1t2{\ifcaae\arrowbarcharaeq \hbox to\charwidth{\vtop{\vbox{\downarrow{t1} \mlap{\lstrut G}\mlap{\lstrut C}}\uparrow{t2}}\hfil}\dh \or \hbox to\charwidth{\vtop{\vbox{\downarrow{t1} \mlap{\lstrut G}\mlap{\latrut C}}\uparrow{#2}}\hfil}\dh \or \hbox to\charwidth{\vtop{\mlap{\latrut G} \mlap{\lstrut C}}\hfil}\dh \or \hbox to\charwidth{\vtop{\vbox{\mlap{\latrut G} \mlap{\lstrut C}}\astrutb}\hfil}\dh \fi}
\def\Ct1t2{\ifcaae\arrowbarcharaeq \hbox to\charwidth{\vtop{\vbox{\downarrow{#1} \mlap{\latrut C}\mlap{\latrut G}}\uparrow{#2}}\hfil}\dh \or \hbox to\charwidth{\vtop{\vbox{\downarrow{#1} \mlap{\latrut C}\mlap{\latrut G}}\uparrow{#2}}\hfil}\dh \or \hbox to\charwidth{\vtop{\mlap{\latrut C}

\mlap{\lstrut G}}\hfil}\dh \or
-308-
\hbox to\charwidth{\vtop{\vbox{\mlap{\lstrut C} \mlap{\lstrut G}}\astrutb}\hfil}\dh \fi}
\def\p3~{\ifcase\arrowbarcharseq \hbox{\raise 4 . 2pt\hbox{$.{3~}$\rm P\hskip1pt}} \or \hbox{\raise 4.~pt\hbox{$-{3~}$\rm P\hskip1pt}} \or \hbox{\raise 4 . ~pt\hbox{$.{3~}$\rm P\hskip1pt}} \or {} \fi}
\def\leftlbl{\ifcase\arrowbarcharseq \llap{\p3~\vtop{\vbox{\downarrow0\hbox{\lstrut\rm 6$.\prime$-} \hbox{\lstrut\rm 3$.\prime$-}}\vskip ~pt\uparrowO}\ } \or \llap{\p32\vtop{\vbox{\downarrow0\hbox{\lstrut\rm 6$.\prime$-} \hbox{\lstrut\rm 3$.\prime$-}}\vskip ~pt\uparrowO}\ } \or \llap{\vbox{\hbox{\lstrut \rm 6$.\prime$- }\hbox{\lstrut\rm 3$.\prime$- }}\ } \or \llap{\vbox{\hbox{\lstrut \rm 6$.\pri me$-}\hbox{\lstrut\rm 3$.\prime$-}}\ } \fi}
\def\rightlbl{\ifcase\arrowbarcharseq \hskip-\halfchar\hbox{\vtop{\vbox{\downarrowO \hbox{\lstrut\rm -3$.\prime$}\hbox{\lstrut\rm -6$.\prime$}} \vskip ~pt\uparrowO}\hfill} \or \hskip-\halfchar\hbox{\vtop{\vbox{\downarrowO \hbox{\lstrut\rm -3$.\prime$}\hbox{\lstrut\rm - 6$.\prime$}} \vskip 2pt\uparrow0}\hfill} \or \hskip- \halfchar\hbox{\vbox{\hbox{\lstrut\rm - 3$.\prime$} \hbox{\lstrut\rm - 6$ . \prime$}}\hfil} \or \hskip- \halfchar\hbox{\vbox{\hbox{\lstrut\rm - 3$.\prime$} \hbox{\latrut\rm -6$.\prime$}}\hfil} \fi}
\def\titlel1{\ifcaae\arrowbarcharseq \endlinechar•13\rm 11\tt\par\endlinechar~-1 \or \endlinechara13\rm 11\tt\par\endlinechar=-1 \or \endlinechara13\rm 11\tt\par\endlinechar=-1 \or \divide\hoffset by2 \hsize•80\charwidth \topskipa1truein \voffset=0 .6truein \headline•{{\rm 11}\hfil{\rm pg . -\folio}}\footline={\hfill} \fi}
\tt
% ============================= end HISTO Macros =======================
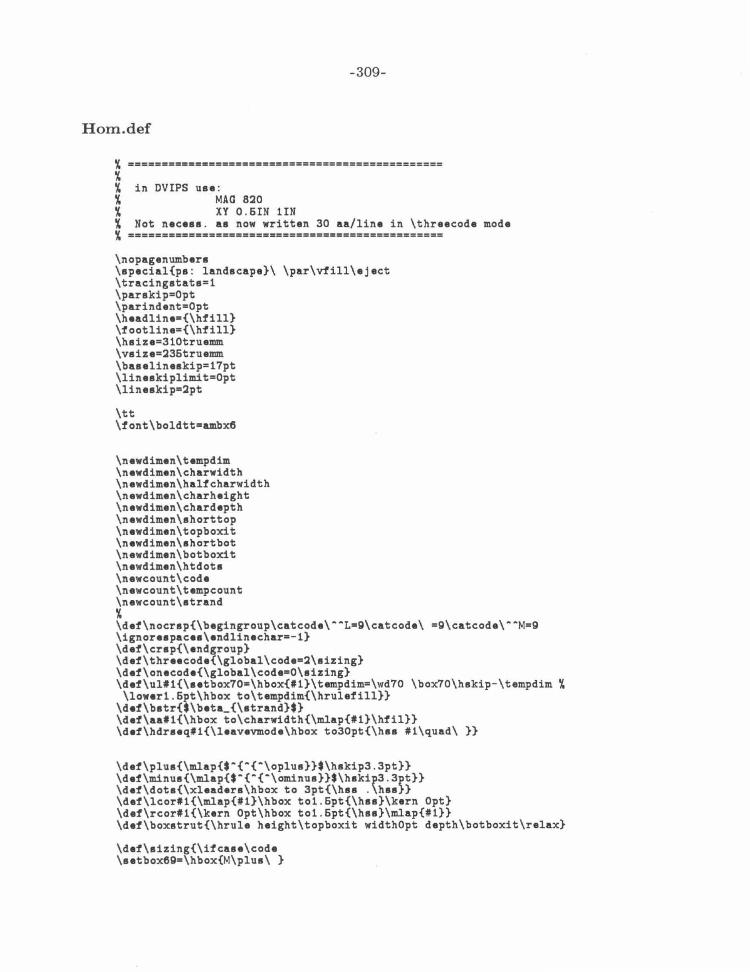
-309-
Hom.def
in DVIPS uae : MAG 8:;!0 XY 0 . 6IN 1IN
Not neceaa . aa now written 30 aa/line in \threecode mode
\nopagenumbera \apecial{pa : landscape}\ \par\vfill\eject \tracingatata=1 \parakip=Opt \parindent=Opt \headline•{\hfill} \footline•{\hfill} \haize=310truemm \vaize=:l36truemm \baaelineakip=17pt \lineakiplimit=Opt \lineakip=:lpt
\tt \font\boldtt=ambx6
\newdimen\tempdim \newdimen\charwidth \newdimen\halfcharwidth \newdimen\charheight \newdimen\chardepth \newdimen\ahorttop \newdimen\topboxit \newdimen\ahortbot \newdimen\botboxit \newdimen\htdota \newcount\code \newcount\tempcount \newcount\atrand
" \def\nocrap{\begingroup\catcode\··L•g\catcode\ :g\catcode\··M=Q \ignoreapacea\endlinecharz-1} \def\crap{\endgroup} \def\threecode{\global\code•:l\aizing} \def\onecode{\global\codeaO\aizing} \def\ult1{\aetbox70•\hbox{t1}\tempdim=\wd70 \box70\hakip-\tempdim %
\lower1 . 6pt\hbox to\tempdim{\hrulefill}} \def\batr{$\beta_{\atrand}$} \def\aat1{\hbox to\charwidth{\mlap{t1}\hfil}} \def\hdraeqt1{\leavevmode\hbox to30pt{\haa #1\quad\ }}
\def\plua{\mlap{$•{•{·\oplua}}$\hakip3 .3pt}} \def\minua{\mlap{$·{·{·\ominua}}$\hakip3 . 3pt}} \def\dota{\xleadera\hbox to 3pt{\haa .\haa}} \def\lcort1{\mlap{#1}\hbox to1 . 6pt{\haa}\kern Opt} \def\rcort1{\kern Opt\hbox to1 . 6pt{\haa}\mlap{#1}} \def\boxatrut{\hrule height\topboxit widthOpt depth\botboxit\relax}
\def\aizing{\ifcaae\code \aetbox6g=\hbox{M\plua\ }

-310-
\charheight•\ht69 \ahorttop•\charheight\advance\ahorttop by . 8pt \topboxit•\charheight\advance\topboxit by1 . 6pt \chardepth•\dp69\advance\chardepth by2pt \charwidth=\wd69 \halfcharwidth=\charwidth\divide\halfcharwidth by2 \or \or \aetbox69•\hbox{Arg\plua\ } \charheight=\ht69 \ahorttop=\charheight\advance\ahorttop by . 8pt \topboxit•\charheight\advance\topboxit by1.6pt \chardepth=\dp69\advance\chardepth by2pt \charwidth•\wd69 \halfcharwidth•\charwidth\divide\halfcharwidth by2 ~i } \def\mlapt1{\hbox toOpt{\haa t1\haa}}
\def\idt1,t2{\nocrap \tempcount=t2\advance\tempcount by-1 \botboxit•\chardepth\advance\botboxit by\tempcount\baaelineakip \ahortbot•\botboxit\advance\ahortbot by-0 . 7pt \rlap{\vbox to Opt{\vaa\hrule height\topboxit widthOpt depth\botboxit~ \hakip-\halfcharwidth~ \mlap{\vrule height\topboxit width0 . 7pt depth\botboxit}~ \rlap{\raiae\ahorttop\hbox tot1\charwidth{\leadera\vrule height0.7pt depthOpt\hfil}}~ \rlap{\lower\ahortbot\hbox tot1\charwidth{\leadera\vrule heightOpt depth0 . 7pt\hfil}}~ \hakipt1\charwidth\mlap{\vrule height\topboxit width0.7pt depth\botboxit}\hakip-t1\charwidth\hakip\halfcharwidth\vakip-\botboxit}}~ \crap}
\def\ibt1,t2{\nocrap \tempcount•t2\advance\tempcount by-1 \botboxit•\chardepth\advance\botboxit by\tempcount\baaelineakip \ahortbot•\botboxit\advance\ahortbot by-0 . 7pt \rlap{\vbox to Opt{\vaa\hrule height\topboxit widthOpt depth\botboxit \hakip-\halfcharwidth~ \rlap{\lower\ahortbot\hbox tot1\charwidth{\leadera\vrule heightOpt depth0 . 7pt\hfil}}~ \hakip\halfcharwidth\vakip-\botboxit}}~ \crap}
\def\iut1,t2{\nocrap \botboxit•\chardepth \rlap{\vbox to Opt{\vaa\boxatrut \hakip-\halfcharwidth~ \mlap{\vrule height\topboxit widthOpt depth\botboxit}~ \rlap{\raiae\ahorttop\hbox tot1\charwidth{\leadera \vrule height0.7pt depthOpt\hfil}}~ \hakip\halfcharwidth\vakip-\botboxit}}~ \crap}
\def\ilt1,t2{\nocrap \tempcount•t2\advance\tempcount by-1 \botboxit=\chardepth\advance\botboxit by\tempcount\baaelineakip \ahortbot•\botboxit\advance\ahortbot by- 0.7pt \rlap{\vbox to Opt{\vaa\boxatrut \hakip-\halfcharwidth~ \mlap{\vrule height\topboxit width0 . 7pt depth\botboxit}~ \hakip\halfcharwidth\vakip-\botboxit}}~

-311-
\crap}
\def\irt1,t2{\nocrap \tempcount•t2\advance\tempcount by-1 \botboxitz\chardepth\advance\botboxit by\tempcount\baaelineakip \ahortbot•\botboxit\advance\ahortbot by-0 . 7pt \rlap{\vbox to Opt{\vaa\boxatrut \hakip-\halfcharwidth\hakipt1\charwidth\mlap{\vrule height\topboxit width0 . 7pt depth\botboxit}\hakip-t1\charwidth\hakip\halfcharwidth~ \vakip-\botboxit}}~ \crap}
\def\1Nt1,t2{\il{t1},{t2}\iu{t1},{t2}\ir{t1},{t2}} \def\1Ut1,t2{\il{t1},{t2}\ib{t1},{t2}\ir{t1},{t2}} \def\1Lt1,t2{\il{t1} ,{t2}\ib{t1},{t2}\iu{t1},{t2}} \def\1Rt1,t2{\iu{t1},{t2}\ib{t1},{t2}\ir{t1},{t2}} \def\1Mt1,t2{\il{t1},{t2}\ir{t1},{t2}} \def\1Bt1,t2{\il{t1} ,{t2}\iu{t1},{t2}\ib{t1},{t2}\ir{t1},{t2}}
\def\amt1,t2{\nocrap \tempcountzt2\advance\tempcount by-1 \botboxit•\chardepth\advance\botboxit by\tempcount\baaelineakip \ahortbot•\botboxit\advance\ahortbot by-0.7pt \tempdim•\topboxit\advance\tempdim by\botboxit\advance\tempdim by-3pt \htdota•\topboxit\advance\htdota by-1 . 6pt \aetbox71•\vbox to\tempdim{ \xleadera\mlap{ . \vrule height1.6pt depth1 . 6pt width0pt}\vfill}\ht71=\htdota~
\rlap{\vbox to Opt{\vaa\boxatrut \hakip-\halfcharwidth\mlap{\copy71}~ \rlap{\raiae\topboxit\hbox tot1\charwidth{\lcor{ . }\dota\hfil\rcor{ . }}}~ \rlap{\lower\ahortbot\hbox tot1\charwidth{\lcor{ . }\dota\hfil\rcor{ . }}}~ \hakipt1\charwidth\mlap{\copy71}% \hakip-t1\charwidth\hakip\halfcharwidth\vakip- \botboxit}}% \crap}
\def\aut1,t2{\nocrap \tempcount•t2\advance\tempcount by-1 \botboxit•\chardepth\advance\botboxit by\tempcount\baaelineakip \ahortbot•\botboxit\advance\ahortbot by-0 .7pt \tempdim•\topboxit\advance\tempdim by\botboxit\advance\tempdim by-3pt \htdota•\topboxit\advance\htdota by-1 . 6pt \aetbox71•\vbox to\tempdim{\vfill}\ht71•\htdota% \rlap{\vbox to Opt{\vaa\boxatrut \hakip-\halfcharwidth\mlap{\copy71}% \rlap{\raiae\topboxit\hbox tot1\charwidth{\lcor{ . }\dota\hfil\rcor{.}}}% \rlap{\lower\ahortbot\hbox tot1\charwidth{\hfil}}% \hakip\halfcharwidth\vakip-\botboxit}}~ \crap}
\def\abt1,t2{\nocrap \tempcount•t2\advance\tempcount by-1 \botboxit•\chardepth\advance\botboxit by\tempcount\baaelineakip \ahortbot•\botboxit\advance\ahortbot by-0 . 7pt \tempdim•\topboxit\advance\tempdim by\botboxit\advance\tempdim by- 3pt \htdota•\topboxit\advance\htdota by-1 . 6pt \aetbox71z\vbox to\tempdim{\vfill}\ht71z\htdota~ \rlap{\vbox to Opt{\vaa\boxatrut% \hakip- \halfcharwidth\mlap{\copy71}% \rlap{\lower\ahortbot\hbox tot1\charwidth{\lcor{ . }\dota\hfil\rcor{.}}}~ \hakip\halfcharwidth\vakip-\botboxit}}% \crap}

-312-
\def\alt1,t2{\nocrap \tempcount=t2\advance\tempcount by- 1 \botboxit=\chardepth\advance\botboxit by\tempcount\baaelineakip \ahortbot=\botboxit\advance\ahortbot by- 0 . 7pt \tempdim• \topboxit\advance\tempdim by\botboxit\advance\tempdim by- 3pt \htdota=\topboxit\advance\htdota by-1 . 6pt \aetbox71=\vbox to\tempdim{ \xleadera\mlap{ . \vrule height1 . 6pt depth1 . 6pt width0pt}\vfill}\ht71=\htdota~
\rlap{\vbox to Opt{\vaa\boxatrut \hakip-\halfcharwidth\mlap{\copy71}~ \rlap{\raiae\topboxit\hbox tot1\charwidth{\lcor{ . }\hfil}}~ \rlap{\lower\ahortbot\hbox tot1\charwidth{\lcor{.}\hfil}}~ \hakip\halfcharwidth\vakip-\botboxit}}~ \crap}
\def\art1,t2{\nocrap \tempcount=t2\advance\tempcount by-1 \botboxit•\chardepth\advance\botboxit by\tempcount\baaelineakip \ahortbot•\botboxit\advance\ahortbot by-0 . 7pt \tempdim•\topboxit\advance\tempdim by\botboxit\advance\tempdim by- 3pt \htdota=\topboxit\advance\htdota by-1 . 6pt \aetbox71•\vbox to\tempdim{ \xleadera\mlap{ . \vrule height1 . 6pt
depth1 . 6pt width0pt}\vfill}\ht71=\htdota~ \rlap{\vbox to Opt{\vaa\boxatrut~ \hakip-\halfcharwidth\rlap{\raiae\topboxit\hbox tot1\charwidth{\hfil\rcor{ . }}}~ \rlap{\lower\ahortbot\hbox tot1\charwidth{\hfil\rcor{ . }}}~ \hakipt1\charwidth\mlap{\copy71}~ \hakip-11\charwidth\hakip\halfcharwidth\vakip-\botboxit}}~ \crap}
\def\lmt1,t2{\nocrap \tempcount=t2\advance\tempcount by- 1 \botboxit=\chardepth\advance\botboxit by\tempcount\baaelineakip \ahortbot• \botboxit\advance\ahortbot by- 0 . 7pt \tempdim=\topboxit\advance\tempdim by\botboxit\advance\tempdim by-3pt \htdota=\topboxit\advance\htdota by- 1 .6pt \aetbox71• \vbox to\tempdim{ \xleadera\mlap{.\vrule height1.6pt depth1.6pt width0pt}\vfill}\ht71=\htdota~
\rlap{\vbox to Opt{\vaa\boxatrut \hakip-\halfcharwidth\mlap{\copy71}~ \rlap{\raiae\topboxit\hbox tot1\charwidth{\lcor{ . }\dota\hfil\rcor{}}}~ \rlap{\lower\ahortbot\hbox tot1\charwidth{\lcor{ . }\dota\hfil\rcor{}}}~ \vakip-\botboxit}}~ \crap}
\def\rmt1,t2{\nocrap \tempcount•t2\advance\tempcount by- 1 \botboxit•\chardepth\advance\botboxit by\tempcount\baaeli neakip \ahortbot• \botboxit\advance\ahortbot by- 0 . 7pt \tempdim•\topboxit\advance\tempdim by\botboxit\advance\tempdim by-3pt \htdota•\topboxit\advance\htdota by-1 . 6pt \aetbox71=\vbox to\tempdim{ \xleadera\mlap{ . \vrule height1 . 6pt depth1 . 6pt width0pt}\vfill}\ht71=\htdota~
\rlap{\vbox to Opt{\vaa\boxatrut \hakip-\halfcharwidth\mlap{}~ \rlap{\raiae\topboxit\hbox tot1\charwidth{\lcor{}\dota\hfil\rcor{.}}}~ \rlap{\lower\ahortbot\hbox tot1\charwidth{\lcor{}\dota\hfil\rcor{ . }}}~ \hakipt1\charwidth\mlap{\copy71}~ \hakip-11\charwidth\hakip\halfcharwidth\vakip-\botboxit}}~

-313-
\crap}
\def\sUt1,t~{\sl{t1},{#~}\sb{#1},{#~}\sr{#1},{#~}} \def\sNt1,t~{\sl{t1},{t~}\su{#1},{#~}\sr{t1} , {#~}} \def\sL#1,#~{\sl{t1},{#~}\sb{#1},{#~}\su{#1} , {t~}} \def\sR#1,#~{\su{t1},{#~}\sb{#1},{#~}\sr{#1},{#~}} \def\sB#1 , t~{\sl{#1},{t~}\su{#1},{#~}\sb{#1},{#~}\sr{#1},{#~}}
\def\A{\ifcase\code \aa{\ul{A}} \or \or \aa{\ul{Ala}}\fi} \def\R{\ifcase\code \aa{R\plus} \or \or\aa{Arg\plus}\fi} \def\N{\ifcase\code \aa{N} \or \or \aa{hn}\fi} \def\0{\ifcase\code \aa{D\minus} \or \or \aa{Asp\minus}\fi} \def\C{\ifcase\code \aa{C} \or \or \aa{Cys}\fi} \def\Q{\ifcase\code \aa{Q} \or \or \aa{Gln}\fi} \def\E{\ifcase\code \aa{E\minus} \or \or\aa{Glu\minus}\fi} \def\G{\ifcase\code \aa{G} \or \or \aa{Gly}\fi} \def\H{\ifcase\code \aa{H} \or \or \aa{His}\fi} \def\I{\ifcase\code \aa{\ul{I}} \or \or\aa{\ul{Ile}}\fi} \def\L{\ifcase\code \aa{\ul{L}} \or \or \aa{\ul{Leu}}\fi} \def\K{\ifcase\code \aa{K\plus} \or \or \aa{Lys\plus}\fi} \def\M{\ifcase\code \aa{\ul{M}} \or \or \aa{\ul{Met}}\fi} \def\F{\ifcase\code \aa{\ul{F}} \or

\or\aa{\ul{Phe}}\fi} \def\P{\ifcase\code \aa{P} \or \or \aa{Pro}\fi} \def\S{\ifcase\code \aa{S} \or \or \aa{Ser}\fi} \def\T{\ifcase\code \aa{T} \or \or \aa{Thr}\fi} \def\W{\ifcase\code \aa{\ul{W}} \or \or \aa{\ul{Trp}}\fi} \def\Y{\ifcase\code \aa{\ul{Y}} \or \or \aa{\ul{Tyr}}\fi} \def\V{\ifcase\code \aa{\ul{V}} \or \or \aa{\ul{Val}}\fi} \def\J{\ifcase\code \aa{B} \or \or \aa{Aax}\fi} \def\Z{\ifcase\code \aa{Z} \or \or \aa{Glx}\fi} \def\X{\ifcase\code \aa{X} \or \or \aa{Xxx}\fi} \def\B{\aa{\ }} \def\?{\aa{'?}} \def\U{\aa{\hrulefil}}
~\def\BA{\aa{$\beta_1$}} ~\def\BB{\aa{$\beta_~$}} ~\def\BC{\aa{$\beta_3$}} ~\def\BO{\aa{$\beta_4$}} ~\def\BE{\aa{$\beta_6$}} ~\def\BF{\aa{$\beta_6$}} ~\def\BG{\aa{$\beta_7$}}
-314-
\onecode \sizing ~\obeylines ~\vakip 1true!IID.
i\ \ \ I \F\P\0\G\M\L\I\L\V\0\P\E\Q\A\V\E\P\G\0\F\C\I\A\R\L\G\G\0\E\F\T ~ \ \ II \F\P\0\G\M\L\I\L\V\0\P\E\Q\A\V\E\P\G\0\F\C\I\A\R\L\G\G\0\E\F\T ~ \ III \F\P\0\G\M\L\I\L\V\0\P\E\Q\A\V\E\P\G\0\F\C\I\A\R\L\G\G\0\E\F\T ~ \ \ IV \F\P\0\G\M\L\I\L\V\0\P\E\Q\A\V\E\P\G\0\F\C\I\A\R\L\G\G\0\E\F\T ~\ \ \ v ~ \ \ VI ~ \ \ VII
~\vskip 1truemm ~ ~\ \ \ \ \ \ Hydrophobic residues are \ul{underlined} .

-315-
BINDFIT.FOR
C PROGRAM BINDFIT c C PURPOSE C FITS A SERIES OF (L] , Y VALUE POINTS TO A BINDING CURVE C USING Ka, YL, AND YH AS FITTING PARAMETERS c C VARIABLES c C SUBROUTINES NEEDED C CURFIT (X, Y, SIGMAY, A, DELTAA, SIGMAA, C FLAMDA, YFIT, CHISQR) C MAKES LEAST SQUARES FIT TO BINDING CURVE (ONE ITERATION) c c c
c
c
PROGRAM BINDFIT REAL•8 CONC, YVAL, SIGMAY, A, DELTAA, SIGMAA, FLAMDA, YFIT REAL•8 CHINEW, CHIOLD, MULT, KA INTEGER•~ NPTS , NTERMS, MODE, NFREE, I CHARACTER•40 NDAT, WDISK, FNAME, SAVEFILE, BANNER•eo DIMENSION CONC(60), YVAL(60), SIGMAY(60), A(3), DELTAA(3),
t SIGMAA(3), YFIT(60) COMMON NPTS, NTERMS, MODE, NFREE
COMMON /PARS/ A, DELTAA ,SIGMAA ,FLAMDA, MULT COMMON /DEPV/ YVAL, YFIT, SIGMAY
FLAMDA= 0 . 0001 NTERMS= 3 I= 0
C I NPUT DATA c
OPEN (1,FILE•'CON') OPEN (6,FILE•'DUMP .DAT') OPEN (4,FILE='NAME.JNK' ,STATUS=' OLD' ,ERR=6) READ (4, 16) FNAME IF (INDEX(FNAME,' . ').EQ.1) GOTO 6 CLOSE (4) SAVEFILE• 'INPUT.DAT' OPEN (4, FILE= SAVEFILE, STATUS=' OLD', ERR=66) READ (4,•) MODE, NPTS READ (4,•) A(1), A(~). A(3) IF (MODE .EQ.1) THEN
DO 8 I• 1, NPTS READ (4,•) CONC(I),YVAL(I),SIGMAY(I)
8 CONTINUE PRINT 10, 'MODE 1 READING'
ELSE DO g I• 1,NPTS
READ (4,•) CONC(I), YVAL(I) g CONTINUE
PRINT 10, 'MODE NOT 1 READING' END IF CLOSE (4) SAVEFILE='CHIFIT.OUT' GOTO 9~
6 PRINT 10, 'IS THIS NEW DATA (N]? ' 10 FORMAT (~X.A)
READ (1,FMT=16) NDAT 16 FORMAT (A)

-316-
IF (NDAT(1:1).EQ . 'Y' .OR.NDAT(1:1) .EQ . 'y') THEN PRINT 10, 'INPUT WEIGHTING MODE:' PRINT 10, '1 - (INSTRUMENTAL) WEIGHT= 1ISIGMAY**~' PRINT 10, ·~ - (NONE) WEIGHT= 1' PRINT 10, '3 - (STATISTICAL) WEIGHT= 1IY PRINT 10, 'MODE? ' READ (1, *) MODE MODEC= MODE IF (MODE.EQ . 1) THEN
BANNER• 'INPUT POINTS AS TRIPLETS :' BANNER= BANNER(1 : ~6)II'CONCENTRATION, Y VALUE, SIGMA Y' PRINT 10, BANNER PRINT 10, 'A NEGATIVE CONCENTRATION SIGNALS END OF DATA'
~0 I= I+1 PRINT 10, 'NEXT POINT ' READ (1,*) CONC(I), YVAL(I), SIGMAY(I) IF (CONC(I) . GE .O. O) GOTO ~0 NPTS= I-1 NFREE= NPTS-NTERMS
ELSE PRINT 10 , 'INPUT POINTS AS PAIRS : CONCENTRATION, YVALUE ' PRINT 10, 'A NEGATIVE CONCENTRATION SIGNALS END OF DATA'
30 I• I+1 PRINT 10, 'NEXT POINT ' READ (1,*) CONC(I), YVAL(I) IF (CONC(I) . GE .O. O) GOTO 30 NPTS• I-1 NFREE• NPTS-NTERMS
END IF PRINT 10, 'INPUT INITIAL GUESSES FOR Ka, YL, YH ' READ (1,*) A(1), A(~). A(3) PRINT 10, 'WRITE TO DISK? ' READ (1,FMT•16) WDISK IF (WDISK(1 : 1) .EQ . 'Y' . OR .WDISK(1 : 1) .EQ. 'y') THEN
PRINT 10 , ' FILENAME? (NO EXTENSION)' READ (1,FMT=16) FNAME LNAME= INDEX(FNAME,' ')-1 FNAME• FNAME(1 : LNAME) I I' . DAT' SAVEFILE• FNAME PRINT 10 , SAVEFILE OPEN (4, FILE•SAVEFILE) WRITE (4,*) MODE, NPTS WRITE (4,*) A(1), A(~). A(3) IF (MODE .EQ . 1) THEN
DO 40 I= 1,NPTS WRITE (4,*) CONC(I), YVAL(I), SIGMAY(I)
40 CONTINUE ELSE
DO 60 I= 1, NPTS WRITE (4,*) CONC(I), YVAL(I)
60 CONTINUE END IF CLOSE (4)
END IF ELSE
BANNER• 'FILE NAME (NO EXTENSION) PRINT 10, BANNER(1 : ~6)
C PRINT 10, 'FILE•' READ (1,FMT=16) FNAME LNAME• INDEX(FNAME,' ')-1 SAVEFILE= FNAME(1 :LNAME)II' .DAT' FNAME= FNAME(1 :LNAME)II' .DAT' OPEN (4, FILE=SAVEFILE , STATUS=' OLD', ERR=66)
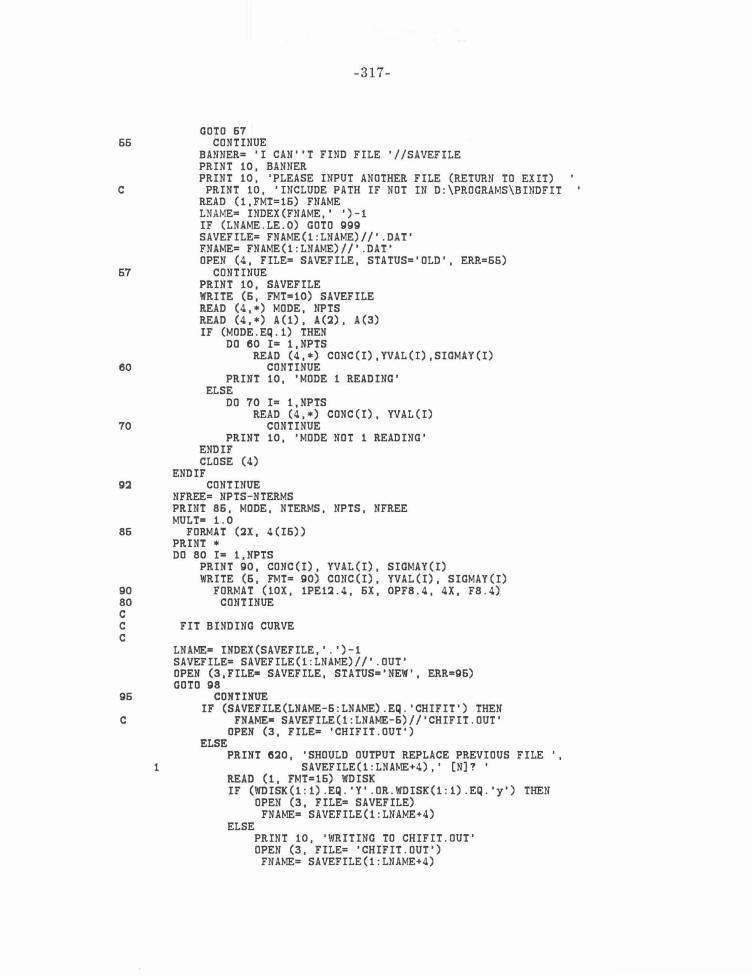
-317-
GOTO 67 66 CONTINUE
BANNER= 'I CAN' 'T FIND FILE '//SAVEFILE PRINT 10, BANNER PRINT 10, 'PLEASE INPUT ANOTHER FILE (RETURN TO EXIT)
C PRINT 10, 'INCLUDE PATH IF NOT IN D:\PROGRAMS\BINDFIT READ (1,FMT=16) FNAME LNAME= INDEX(FNAME,' ')-1 IF (LNAME . LE . O) GOTO ggg SAVEFILE= FNAME(l:LNAME)//' . DAT' FNAME= FNA~~(l:LNAME)//' .DAT' OPEN (4, FILE~ SAVEFILE, STATUS='OLD', ERR=66)
67 CONTINUE PRINT 10, SAVEFILE WRITE (6, FMTzlO) SAVEFILE READ (4,•) MODE, NPTS READ (4,•) A(l), A(~). A(3) IF (MODE.EQ.l) THEN
DO eo I= l,NPTS READ (4,*) CONC(I),YVAL(I),SIGMAY(I)
60 CONTINUE PRINT 10, 'MODE 1 READING'
ELSE DO 70 I= l,NPTS
READ (4,*) CONC(I), YVAL(I) 70 CONTINUE
PRINT 10, 'MODE NOT 1 READING' END IF CLOSE (4)
END IF g~ CONTINUE
NFREE= NPTS-NTERMS PRINT 86, MODE, NTERMS, NPTS, NFREE MULT= 1.0
86 FORMAT (~X. 4(I6)) PRINT * DO 80 I• 1, NPTS
PRINT 90, CONC(I), YVAL(I), SIGMAY(I) WRITE (6, FMT= 90) CONC(I), YVAL(I), SIGMAY(I)
90 FORMAT (lOX, 1PE1~ . 4, 6X, OPF8.4, 4X, F8.4) 80 CONTINUE c C FIT BINDING CURVE c
LNAMEz INDEX(SAVEFILE,' . ')-1 SAVEFILE• SAVEFILE(l :LNAME)//' . OUT' OPEN (3,FILE• SAVEFILE, STATUS•'NEW', ERR=96) GOTO 98
96 CONTINUE IF (SAVEFILE(LNAME-6:LNAME) . EQ.'CHIFIT') THEN
C FNAME• SAVEFILE(l :LNAME-6)//'CHIFIT.OUT' OPEN (3, FILE• 'CHIFIT .OUT')
ELSE PRINT e~o. 'SHOULD OUTPUT REPLACE PREVIOUS FILE ',
1 SAVEF ILE ( 1: LN AME+4) , ' (N]? ' READ (1, FMT=16) WDISK IF (WDISK(l : l) .EQ. 'Y' .OR.WDISK(l : l).EQ.'y') THEN
OPEN (3, FILE= SAVEFILE) FNAME= SAVEFILE(l :LNAME+4)
ELSE PRINT 10, 'WRITING TO CHIFIT.OUT' OPEN (3, FILE= 'CHIFIT.OUT') FNA~~= SAVEFILE(l:LNAME+4)

END IF END IF
98 CONTINUE LNAME= INDEX(FNAME,' . ')-1 WRITE (3,•)
-318-
WRITE (3, FMT•800) 'LEAST SQUARES ANALYSIS OF FILE ', 1 FNAME(1 :LNAME)//' .OAT'
IF (MODE .EQ . 1) THEN WRITE (3, FMT•eOO)'INSTRUMENTAL WEIGHTING','= 1/SIGMAY••~·
ELSEIF (MODE .EQ.3) THEN WRITE (3, FMT=800) 'STATISTICAL WEIGHTING','= 1/Y'
ELSE WRITE (3, FMT=600) 'NO WEIGHTING',' '
END IF WRITE (3,*) WRITE (3,•)
C WRITE (3, FMT=800) 'DATA ','POINTS' WRITE (3, FMT=630) 'CONCENTRATION', 'YVALUE', 'SIGMA(YVAL)' WRITE (3,•) DO 140 Iz 1, NPTS
WRITE (3, FMT=90) CONC(I), YVAL(I), SIGt-lAY(I) 140 CONTINUE
WRITE (3,•) WRITE (3,•) WRITE (3, FMT•810) 'RUN', 'CHISQR', 'Ka', 'SIGMA(KA)', 'YL',
1 ' SIGMA(YL)', 'YH', 'SIGMA(YH)' WRITE (3,*)
800 FORMAT (10X,A,A) 810 FORMAT (6X,A,3X,A,eX,A,7X,A ,4X,A,3X , A.~X.A,3X,A) 6~0 FORMAT (~X.A,A,A) 630 FORMAT (10X,A,6X,A,6X,A)
I= 1 CALL CURFIT (CONC, CHIOLD) PRINT 110, I, CHIOLD, A(1), SIGMAA(1), A(~). SIGMAA(~). A(3),
1 SIGMAA(3) WRITE (3,FMT•110) I, CHIOLD, A(1), SIGMAA(1), A(~).
1 SIGMAA(~). A(3), SIGMAA(3) I= I+1
100 CONTINUE CALL CURFIT (CONC, CHINEW)
IF ((CHIOLD-CHINEW).GT . 0.0001) THEN PRINT 1~0. CHIOLD, CHINEW, CHIOLD-CHINEW PRINT 110, I, CHINEW,A(1), SIGMAA(1), A(~). SIGMAA(~). A(3),
1 SIGMAA(3) WRITE (3,FMT•110) I, CHINEW, A(1), SIGMAA (1) , A(~).
1 SIGMAA(~). A(3), SIGMAA(3) 110 FORMAT (~X. I6 , F10 .4 , 1PE1~ .4. E1~ .4 . OP, 4 (~X ,F8 .4) ) 130 FORMAT (~X. A, F10 .4) 1~0 FORMAT (~X , 3(F10 . 4))
CHIOLD= CHINEW I=I+1 GOTO 100
END IF CLOSE (6) CLOSE (3)
ggg CONTINUE END

-319-
CURFIT.FOR
c c c c c c c c c c c c c c c c c c c c c c c c c c c c c c c c c c c c c c
c
c c 2 c
c c
SUBROUTINE CURFIT
MAKE LEAST SQUARES FIT TO A NON-LINEAR FUNCTION (FUNCTN) WITH A LINEARIZATION OF THE FITTING FUNCTION
REF: BEVINGTON, P .R., "DATA REDUCTION AND ERROR ANALYSIS FOR THE PHYSICAL SCIENCES", MCGRAW-HILL, 1969, CHAP 11.
DESCRIPTION X
OF PARAMETERS
y SIGMAY NPTS NTERMS MODE
A DELTAA SIGMAA FLAMDA -YFIT CHISQR MULT
ARRAY OF DATA POINTS FOR INDEPENDENT VARIABLE ARRAY OF DATA POINTS FOR DEPENDENT VARIABLE
ARRAY OF STANDARD DEVIATIONS FOR Y DATA POINTS NUMBER OF DATA POINT PAIRS
NUMBER OF PARAMETERS TO BE FIT DETERMINES METHOD OF WEIGHTING LEAST SQUARES FIT
1 (INSTRUMENTAL) WEIGHT(!)= 1/SIGMAY(I)••2 2 (NONE) WEIGHT(!)= 1 3 (STATISTICAL) WEIGHT(!)= 1/Y(I)
ARRAY OF PARAMETERS ARRAY OF INCREMENTS FOR PARAMETERS A ARRAY OF STANDARD DEVIATIONS FOR PARAMETERS A
PROPORTION OF GRADIENT SEARCH INCLUDED ARRAY OF CALCULATED VALUES FOR Y
REDUCED CHI SQUARE FOR FIT EXPONENT OF Ka (A(1))
SUBROUTINES AND FUNCTIONS REQUIRED FUNCTN (X, I, A)
EVALUATES THE FITTING FUNCTION FOR THE Ith TERM FCHISQ (Y, SIGMAY, YFIT)
EVALUATES REDUCED CHI SQUARE FOR FIT TO DATA FDERIV (X, I, A, DELTAA, DERIV)
EVALUATES THE DERIVATIVES OF THE FITTING FUNCTION FOR THE Ith TERM WRT EACH PARAMETER
MATINV (ARRAY, NTERMS, DET) INVERTS A SYMMETRIC TWO-DIMENSIONAL MATRIX OF DEGREE NTERMS AND CALCULATES ITS DETERMINANT
SUBROUTINE CURFIT (X, CHISQR) 1 SIGMAA, YFIT, CHISQR)
REAL•S X, Y, SIGMAY, A, DELTAA, SIGMAA , FLAMDA, YFIT, CHISQR REAL•S WEIGHT, ALPHA, BETA, DERIV, ARRAY, B, CHISQ1, DET
REAL•S CHIOLD, MULT INTEGER•2 NPTS, NTERMS, MODE, NFREE, NORDER, I, J, K DIMENSION X(60), Y(60), SIGMAY(60), A(3), DELTAA(3), SIGMAA(3),
1 YFIT(60) DIMENSION WEIGHT(60), ALPHA(3,3), BETA(3), DERIV(3),
1 ARRAY(3,3), B(3) COMMON NPTS, NTERMS, MODE, NFREE COMMON /PARS/ A, DELTAA, SIGMAA, FLAMDA, MULT COMMON /DEPV/ Y, YFIT, SIGMAY
PRINT 2, NPTS, NTERMS, MODE, NFREE FORMAT (2X, 4(!6)) NORDER= NTERMS
CHIOLD= 1E16 FLAMDA= 0.0001 A(1)= A(1)/MULT
WRITE (6, FMT=123) 'A(1)=' , A(1) WRITE (6, FMT= 123) 'MULT=' ,MULT

IF (NFREE . GT . O) GOTO 6 CHISQR=O . O GOTO ggg
-320-
7 FORMAT (~X,A) c C EVALUATE WEIGHTS c 6 CONTINUE
WRITE (6, FMT= 7) 'EVALUATE WEIGHTS' DO 10 I• 1,NPTS
IF (MODE .EQ . 1) THEN WEIGHT(I)=1.0/SIGMAY(I)**~
ELSEIF ((MODE .EQ . 3).AND . (Y(I).NE .O.O)) THEN WEIGHT(!)= 1. 0/ABS(Y(I))
ELSE WEIGHT(I)=1 . 0
END IF 10 CONTINUE C WRITE (6, FMT= 7) 'EVALUATE ALPHA AND BETA MATRICES' c C EVALUATE ALPHA AND BETA MATRICES c
DO ~0 J= 1,NTERMS BETA(J) = 0 . DO 30 K= 1,J
ALPHA(J,K)•O . 30 CONTINUE ~0 CONTINUE c
DO 60 I• 1,NPTS CALL FDERIV (X, I, DERIV) DO eo J= 1,NTERMS
BETA(J)= BETA(J)+WEIGHT(I)•(Y(I) - FUNCTN(X, I, A, MULT) 1 )•DERIV(J)
DO 70 K= 1,J ALPHA(J,K)• ALPHA(J,K)+WEIGHT(I)•DERIV(J)•DERIV(K)
70 CONTINUE 60 CONTINUE 60 CONTINUE c
DO 80 J• 1,NTERMS DO go K=1 , J ALPHA(K,J)•ALPHA(J,K)
go CONTINUE 80 CONTINUE
DO 91 J•1, NTERMS WRITE (6, FMT• g~) ALPHA(J,1), ALPHA(J,~). ALPHA(J ,3) ,
1 BETA(J) g1 CONTINUE g~ FORMAT (~X. 4(E1~.4)) C PRINT 7, ' EVALUATE CHI SQUARE AT STARTING POINT' c C EVALUATE CHI SQUARE AT STARTING POINT c
DO 100 I= 1,NPTS YFIT(I)• FUNCTN(X , I, A, MULT) WRITE (6, FMT= 8g) Y(I), SIGMAY(I), NPTS , NFREE, MODE, YFIT(I)
8g FORMAT (~X , ~(E1~. 4), 3(I6), E1~ . 4) 100 CONTINUE
CHISQ1 = FCHISQ () WRITE (6, FMT= 1~3) 'CHISQR AT START= ' , CHISQ1
8 FORMAT (~X. F8 . 6) WRITE (6, FMT= 7) 'INVERT CURVATURE MATRIX'

-321-
c C INVERT MODIFIED CURVATURE MATRIX TO FIND NEW PARAMETERS c 170 CONTINUE
DO 110 Jz 1 , NTERMS DO 120 K=1,NTERMS
ARRAY(J,K) 2 ALPHA(J,K)/SQRT(ALPHA(J , J) • ALPHA(K ,K)) C IF (J.NE . K) PRINT 124 , J , K, ARRAY(J , K) 124 FORMAT (2X , I5, I5, E14 . 6) 120 CONTINUE
ARRAY(J,J)=1 . 0+FLAMDA C PRINT 124 , J , J, ARRAY(J,J) 123 FORMAT (2X , A, E14 . 6) 110 CONTINUE
WRITE (5 , FMTz 123) 'FLAMDA=' ,FLAMDA c C PRINT 136, 'NORDER• ',NORDER 135 FORMAT (2X, A, I6)
CALL MATINV(ARRAY, DET) DO 130 J• 1,NTERMS
B (J) o:A (J) DO 140 Kz 1 , NTERMS
B(J)• B(J)+BETA(K)•ARRAY(J,K)/SQRT(ALPHA(J,J) • ALPHA(K,K)) 140 CONTINUE
WRITE (5, FMT• 123) 'B(J) =' , B(J) 130 CONTINUE c C IF CHI SQUARE INCREASED, INCREASE FLAMDA AND TRY AGAIN c C PRINT 7, 'REEVALUATE CHI SQUARE'
DO 150 I• 1, NPTS YFIT(I) • FUNCTN (X, I, B, MULT)
C PRINT 123, 'YFIT•', YFIT(I) 150 CO NTINUE
CHISQR z FCHISQ () WRITE (6, FMT= 123) ' REEVALUATE CHISQR=', CHISQR IF (CHISQR .LE . CHISQ1) GOTO 1~0 IF (ABS(CHIOLD-CHISQR) . LT.0.001) GOTO 160 CHIOLD• CHISQR FLAMDA= 10 . •FLAMDA WRITE (5, FMTo: 7) ' CHI SQUARE INCREASED, TRYING AGAIN'
C WRITE (3, FMT= 7) ' CHI SQUARE INCREASED, TRYING AGAIN' PRINT 7, 'CHI SQUARE INCREASED, TRYING AGAIN' GOTO 170
c C EVALUATE PARAMETERS AND UNCERTAINTIES c 160 CONTINUE
WRITE (6, FMT= 7) ' EVALUATE PARAMETERS AND UNCERTAINTIES ' DO 180 J• 1, NTERMS
A (J) •B (J) SIGMAA(J)• SQRT(ARRAY(J,J)/ALPHA(J,J)) WRITE (5, FMT• 123) 'A (J) =' , A (J) WRITE (5, FMT• 123) 'ARRAY= ' ,ARRAY(J,J) WRITE (5, FMT• 123) ' ALPHA= ' ,ALPHA(J,J) WRITE (6, FMT• 123) 'SIGMAA=' ,SIGMAA(J)
180 CONTINUE FLAMDA=FLAMDA/10 .
999 RETURN END

-322-
CHI. FOR
C SUBROUTINE MATINV c C INVERT A SYMMETRIC MATRIX AND CALCULATE ITS DETERMINANT c C USAGE C CALL MATINV(ARRAY, DET) c C DESCRIPTION OF PARAMETERS C ARRAY INPUT MATRIX, REPLACED BY INVERSE C NORDER DEGREE OF MATRIX C DET DETERMINANT OF INPUT MATRIX c c
c
SUBROUTINE MATINV(ARRAY, DET) REAL•8 ARRAY, DET, AMAX, SAVE INTEGER*~ NPTS, NORDER, IK, JK, I, J, K DIMENSION ARRAY(3,3), IK(3), JK(3) COMMON NPTS, NORDER
DET=1 . C PRINT 6, ARRAY(1,~). NORDER, DET 6 FORMAT (~X. E1~.4. I6, F8.4) c C FIND LARGEST ELEMENT ARRAY(I,J) IN REST OF MATRIX c
DO 10 K•1,NORDER AMAX•O . O
~6 DO ~0 I•K,NORDER DO 30 J=K,NORDER
IF (ABS(AMAX) . GT.ABS(ARRAY(I,J))) GOTO 30 AMAXz ARRAY(I,J) IK(K)•I JK(K)•J
30 CONTINUE ~0 CONTINUE
DO 33 I• K, NORDER DO 36 J=K, NORDER
C PRINT 37, K, IK(K), JK(K) 37 FORMAT (~X. 3(I6)) 36 CONTINUE 33 CONTINUE c C INTERCHANGE ROWS AND COLUMNS TO PUT AMAX IN ARRAY(K,K) c
IF (AMAX.EQ.O.O) THEN DET• 0 . GOTO ggg END IF
I• IK(K) IF (I . LT.K) GOTO ~6 IF (I. GT. K) THEN
DO 40 Jz 1,NORDER SAVE= ARRAY(K,J) ARRAY(K,J)• ARRAY(I,J) ARRAY(I,J)= -SAVE
40 CONTINUE END IF
J= JK(K) IF (J . LT.K) GOTO ~6 IF (J.GT.K) THEN

-323-
DO 60 I= 1,NORDER SAVE= ARRAY(I,K) ARRAY(I,K)= ARRAY(I,J) ARRAY(I,J)= -SAVE
60 CONTINUE END IF
c C ACCUMULATE ELEMENTS OF INVERSE MATRIX c
DO 60 I= 1,NORDER IF (I .NE.K) ARRAY(I,K)= -ARRAY(I,K)/AMAX
60 CONTINUE DO 70 I•1,NORDER
DO 80 J .. 1,NORDER IF ((I.NE .K) . AND.(J . NE.K)) THEN
ARRAY(I,J)= ARRAY(I,J)+ARRAY(I,K)•ARRAY(K,J) END IF
80 CONTINUE 70 CONTINUE
DO go Js1,NORDER IF (J . NE .K) ARRAY(K,J)= ARRAY(K,J)/AMAX
go CONTINUE ARRAY(K,K)• 1./AMAX DE!• DET•AMAX
10 CONTINUE c C RESTORE ORDERING OF MATRIX c
DO 100 L•1, NORDER K• NORDER-L+1 J• IK(K) IF (J . GT.K) THEN
DO 110 I=1,NORDER SAVE= ARRAY(I,K) ARRAY(I,K)= -ARRAY(I,J) ARRAY(I,J)• SAVE
110 CONTINUE END IF
I• JK(K) IF (I.GT .K) THEN
DO 1~0 J=1,NORDER SAVE= ARRAY(K,J) ARRAY(K,J)• -ARRAY(I,J) ARRAY(I,J)• SAVE
1~0 CONTINUE END IF
100 CONTINUE ggg RETURN
c c c
END
C FUNCTION FCHISQ c C PURPOSE C EVALUATE REDUCED CHI SQUARE FOR FIT TO DATA C FCHISQ • SUM((Y-YFIT)••~/SIGMA••~)/NFREE c C USAGE C RESULT= FCHISQ (Y, SIGMAY, YFIT) c C DESCRIPTION OF PARAMETERS C Y ARRAY OF DATA POINTS

c c c c c c c c c
c
SIGMAY NPTS NFREE MODE
YFIT
-324-
- ARRAY OF STANDARD DEVIATIONS FOR Y DATA POINTS NUMBER OF DATA POINTS
NUMBER OF DEGREES OF FREEDOM DETERMINES METHOD OF WEIGHTING LEAST SQUARES FIT
1 (INSTRUMENTAL) ~~IGHT(I)= 1/SIGMAY(I)**2 2 (NONE) WEIGHT(I)= 1 3 (STATISTICAL) WEIGHT(I)= 1/Y(I)
ARRAY OF CALCULATED VALUES FOR Y
REAL*8 FUNCTION FCHISQ() REAL*8 Y,SIGMAY,YFIT,WEIGHT,CHISQ INTEGER*2 NPTS,NFREE,MODE,NTERMS, I, J DIMENSION Y(60), SIGMAY(60), YFIT(60) COMMON NPTS, NTERMS, MODE, NFREE COMMON /DEPV/ Y, YFIT, SIGMAY
CHISQ= 0 . 0 110 FORMAT (2X,A,I6) C PRINT 110, 'NPTS(FCHISQ)', NPTS C PRINT 110, 'NTERMS(FCHISQ)', NTERMS C PRINT 110, 'MODE(FCHISQ)', MODE C PRINT 110, ' NFREE(FCHISQ)', NFREE
c
IF (NFREE . LE. O) THEN FCHISQ• 0 . 0 GOTO ggg END IF
C ACCUMULATE CHI SQUARE c
DO 10 I• 1, NPTS IF (MODE . EQ.1) THEN
WEIGHT = 1.0/SIGMAY(I)**2 ELSEIF ((MODE .EQ . 3) . AND . (Y(I) . NE .O.O)) THEN
WEIGHT = 1.0/ ABS(Y(I)) ELSE
WEIGHT= 1.0 END IF CHISQ• CHISQ+WEIGHT*(Y(I) - YFIT(I))**2
C PRINT 100, 'CHISQ=', CHISQ 10 CONTINUE 100 FORMAT (2X,A,E12.4) c C DIVIDE BY THE NUMBER OF DEGREES OF FREEDOM c C PRINT 100, 'FCHISQ•', CHISQ/REAL(NFREE)
FCHISQ= CHISQ/REAL(NFREE) C PRINT 100, 'CRASH???', CHISQ 999 CONTINUE
RETURN END

-325-
BINDF.FOR
C FUNCTIONS NEEDED FOR LEAST SQUARES FIT TO BINDING CURVES C FUNCTION FUNCTN EVALUATES Yapp=(YH-YL)•KA•(L]/(1+KA•(L]) c C VARIABLES C L LIGAND CONCENTRATION ARRAY (INDEPENDENT VARIABLE) C I INDEX C A PARAMETER ARRAY A(1)=Ka, A(2)=YL, A(3)=YH C MULT- EXPONENT OF Ka c
REAL•8 FUNCTION FUNCTN (L, I, A, MULT) REAL*8 LI,L,A,MULT INTEGER•2 I DIMENSION L(60), A(3) LI .. L(I) FUNCTN= (A(3)-A(2))•A(1)•LI/(1+A(1)•LI)+A(2)
100 FORMAT (2X,F8 . 4,F8 . 4,F8.4)
c c
RETURN END
C SUBROUTINE FDERIV EVALUATES PARTIAL DERIVATIVES OF EACH C PARAMETER IN EQUATION FOR Yapp c C VARIABLES c c c c c c c c
c
L I
LIGAND CONCENTRATION ARRAY (INDEPENDENT VARIABLE) INDEX
A DELTAA NTERMS DERIV(I)
PARAMETER ARRAY A(1)=Ka, A(2)=YL, A(3)=YH PARAMETER INCREMENT ARRAY NUMBER OF PARAMETERS (3 FOR BINDING CURVES) Ith PARTIAL DERIVATIVE OF BINDING CURVE
WRT PARAMETERS
SUBROUTINE FDERIV (L, I, DERIV) REAL•8 LI, Z, L, A, DELTAA, DERIV, SIGMAA, FLAMDA, MULT INTEGER•2 I DIMENSION L(60), A(3), DELTAA(3), DERIV(3), SIGMAA(3) COMMON /PARS/ A, DELTAA, SIGMAA, FLAMDA, MULT
Lia L(I) Z• 1+A(1)•LI RANGE• A(3)-A(2) DERIV(1)• RANGE•LI/Z-RANGE•A(1)•LI••2/Z••2 DERIV(3)• A(1)•LI/Z DERIV(2)• 1.0-DERIV(3)
C WRITE (6, •) 'A(1), Z=', A(1), Z C WRITE (6, •) 'DERIVS 1,3=', DERIV(1), DERIV(3) 100 FORMAT (2X, A, 2(F8.4))
RETURN END

-326-
HILLFIT .FOR
C PROGRAM BINDFIT c C PURPOSE C FITS A SERIES OF [L] , Y VALUE POINTS TO A BINDING CURVE C USING Ka, YL, AND YH AS FITTING PARAMETERS c C VARIABLES c C SUBROUTINES NEEDED C CURFIT (X, Y, SIGMAY, A, DELTAA, SIGMAA, C FLAMDA, YFIT, CHISQR) C MAKES LEAST SQUARES FIT TO BINDING CURVE (ONE ITERATION) c c c
c
c
PROGRAM BINDFIT REAL•S CONC, YVAL, SIGMAY, A, DELTAA, SIGMAA, FLAMDA, YFIT REAL•8 CHINEW, CHIOLD, MULT, KA INTEGER*~ NPTS, NTERMS, MODE, NFREE, I CHARACTER•40 NDAT, WDISK, FNAME, SAVEFILE, BANNER•60 DIMENSION CONC(60), YVAL(60), SIGMAY(60), A(3), DELTAA(3),
t SIGMAA(3), YFIT(60) COMMON NPTS, NTERMS, MODE, NFREE
COMMON /PARS/ A, DELTAA ,SIGMAA ,FLAMDA, MULT COMMON /DEPV/ YVAL, YFIT, SIGMAY
FLAMDA,. 0 . 0001 NTERMS= 3 I= 0
C INPUT DATA c
OPEN (1,FILE='CON') OPEN (6,FILEz'DUMP.DAT') OPEN (4,FILE•'NAME.JNK' ,STATUSz'OLD' ,ERR=6) READ (4, 16) FNAME IF (INDEX(FNAME,' . ').EQ.1) GOTO 6 CLOSE (4) SAVEFILE• 'INPUT . DAT' OPEN (4, FILE= SAVEFILE, STATUS='OLD', ERR=66) READ (4,•) MODE, NPTS READ (4,*) KA, A(~). A(3) IF (MODE .EQ . 1) THEN
DO 8 I• 1,NPTS READ (4,*) CONC(I),YVAL(I),SIGMAY(I)
8 CONTINUE PRINT 10, 'MODE 1 READING'
ELSE DO g I• 1,NPTS
READ (4,•) CONC(I), YVAL(I) g CONTINUE
PRINT 10, 'MODE NOT 1 READING' END IF CLOSE (4) SAVEFILE• ' HILLFIT.OUT' GOTO g~
6 PRINT 10, 'IS THIS NEW DATA [N]? ' 10 FORMAT (~X,A)
READ (1,FMT=16) NDAT 16 FORMAT (A)

- 327-
IF (NDAT(1:1) .EQ. 'Y' . OR . NDAT(1:1) .EQ . 'y') THEN PRINT 10, 'INPUT WEIGHTING MODE:' PRINT 10, '1 - (INSTRUMENTAL) WEIGHT= 1/SIGMAY**~' PRINT 10, ·~- (NONE) WEIGHT= 1' PRINT 10, '3 - (STATISTICAL) WEIGHT= 1/Y PRINT 10, 'MODE? ' READ (1,*) MODE MODEC= MODE IF (MODE .EQ . 1) THEN
BANNER= 'INPUT PO UITS AS TRIPLETS: ' BANNER= BANNER(1:~6)//'CONCENTRATION, Y VALUE, SIGMA Y' PRINT 10, BANNER PRINT 10, 'A NEGATIVE CONCENTRATION SIGNALS END OF DATA '
~0 I= I+1 PRINT 10, 'NEXT POINT ' READ (1,*) CONC(I), YVAL(I), SIGMAY(I) IF (CONC(I) . GE .O. O) GOTO ~0 NPTS= I-1 NFREE• NPTS-NTERMS
ELSE PRINT 10, 'INPUT POINTS AS PAIRS : CONCENTRATION, YVALUE ' PRINT 10, 'A NEGATIVE CONCENTRATION SIGNALS END OF DATA'
30 I• I+1 PRINT 10 , 'NEXT POINT ' READ (1,*) CONC(I), YVAL(I) IF (CONC(I) . GE .O.O) GOTO 30 NPTS= I-1 NFREE= NPTS-NTERMS
END IF PRINT 10, 'INPUT INITIAL GUESSES FOR Ka, YL, YH' READ (1,*) KA, A(~). A(3) PRINT 10 , 'WRITE TO DISK? ' READ (1,FMT•16) WDISK IF (WDISK(1 : 1).EQ . 'Y' . OR.WDISK(1 :1) .EQ . 'y') THEN
PRINT 10, 'FILENAME? (NO EXTENSION)' READ (1,FMT•16) FNAME LNAME= INDEX(FNAME,' ')-1 FNAME• FNAME(1 :LNAME)//' .OAT' SAVEFILE• FNAME PRINT 10, SAVEFILE OPEN (4, FILE•SAVEFILE) WRITE (4,*) MODE, NPTS WRITE (4,•) KA, A(~). A(3) IF (MODE .EQ . 1) THEN
DO 40 I= 1,NPTS WRITE (4,•) CONC(I), YVAL(I), SIGMAY(I)
40 CONTINUE ELSE
DO 60 I= 1, NPTS WRITE (4,•) CONC(I), YVAL(I)
60 CONTINUE END IF CLOSE (4)
END IF ELSE
BANNER• 'FILE NAME (NO EXTENSION) PRINT 10 , BANNER(1 : ~6)
C PRINT 10, 'FILE•' READ (1,FMT=16) FNAME LNAME= INDEX(FNAME,' ') - 1 SAVEFILE= FNAME(1 :LNAME)//' .OAT' FNAME• FNAME(1:LNAME)// ' .OAT' OPEN (4, FILE=SAVEFILE, STATUS='OLD', ERR=66)
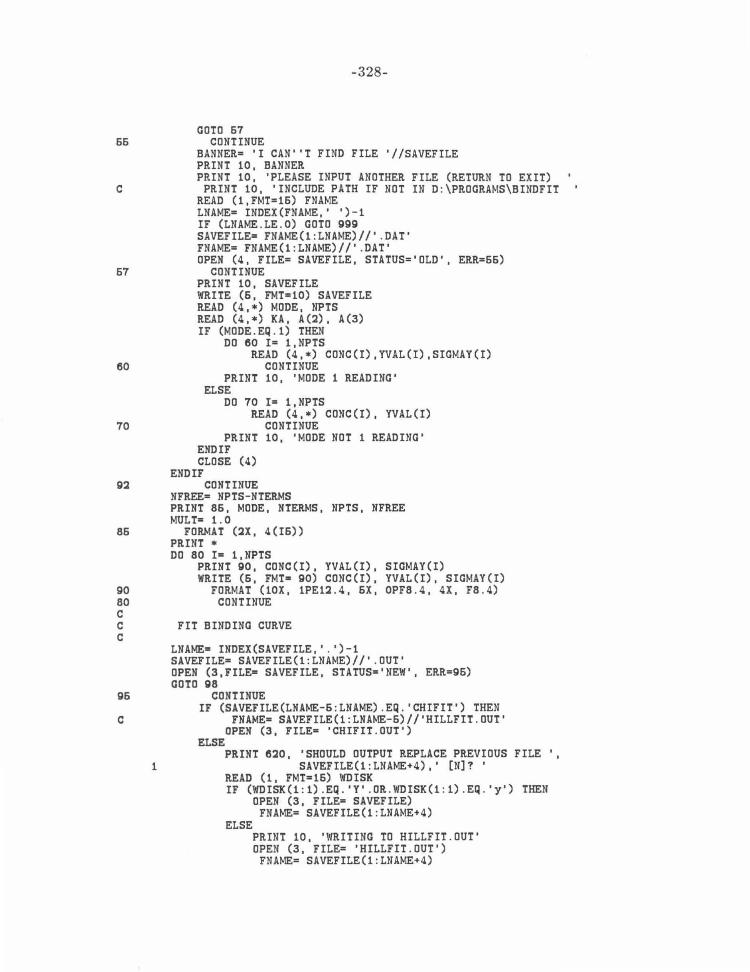
-328-
GOTO 67 66 CONTINUE
BANNER= 'I CAN' 'T FIND FILE '//SAVEFILE PRINT 10, BANNER PRINT 10, 'PLEASE INPUT ANOTHER FILE (RETURN TO EXIT)
C PRINT 10, 'INCLUDE PATH IF NOT IN D: \PROGRAMS\BINDFIT READ (1,FMT=16) FNAME LNAME• INDEX(FNAME,' ')-1 IF (LNAME .LE.O) GOTO 999 SAVEFILE= FNA~ffi(1 : LNAME)// ' . OAT' FNAME• FNAME(1 :LNAME)//' .OAT' OPEN (4, FILE= SAVEFILE, STATUS=' OLD', ERR=66)
67 CONTINUE PRINT 10, SAVEFILE WRITE (6, FMT=10) SAVEFILE READ (4,*) MODE, NPTS READ (4,*) KA, A(~). A(3) IF (MODE .EQ.1) THEN
DO 80 I,. 1,NPTS READ (4,*) CONC(I),YVAL(I),SIGMAY(I)
60 CONTINUE PRINT 10, 'MODE 1 READING'
ELSE DO 70 I,. 1, NPTS
READ (4,*) CONC(I), YVAL(I) 70 CONTINUE
PRINT 10, 'MODE NOT 1 READING' END IF CLOSE (4)
END IF 9~ CONTINUE
NFREE• NPTS-NTERMS PRINT 86, MODE, NTERMS, NPTS, NFREE MULT• 1. 0
86 FORMAT (~X . 4(I6)) PRINT * DO 80 I• 1,NPTS
PRINT 90, CONC(I), YVAL(I), SIGMAY(I) WRITE (6, FMT• 90) CONC(I), YVAL(I) , SIGMAY(I)
90 FORMAT (10X, 1PE1~ .4 . 6X, OPF8 . 4, 4X, F8.4) 80 CONTINUE c C FIT BINDING CURVE c
LNAME• INDEX(SAVEFILE,'. ')-1 SAVEFILE• SAVEFILE(1 :LNAME)//' . OUT' OPEN (3,FILE• SAVEFILE, STATUS•'NEW', ERR=96) GOTO 98
96 CONTINUE IF (SAVEFILE(LNAME-6 :LNAME) .EQ . 'CHIFIT') THEN
C FNAME• SAVEFILE(1 :LNAME-6)//'HILLFIT.OUT' OPEN (3, FILE• 'CHIFIT.OUT')
ELSE PRINT 6~0. 'SHOULD OUTPUT REPLACE PREVIOUS FILE ',
1 SAVEFILE(1 : LNAME+4),' [N]? ' READ (1, FMT=16) WDISK IF (WDISK(1 : 1) .EQ. 'Y' . OR .WDISK(1 : 1) .EQ . 'y') THEN
OPEN (3, FILE• SAVEFILE)
ELSE FNAME= SAVEFILE(1:LNAME+4)
PRINT 10, 'WRITING TO HILLFIT . OUT' OPEN (3 , FILE= 'HILLFIT.OUT')
FNAME= SAVEFILE(1:LNAME+4)
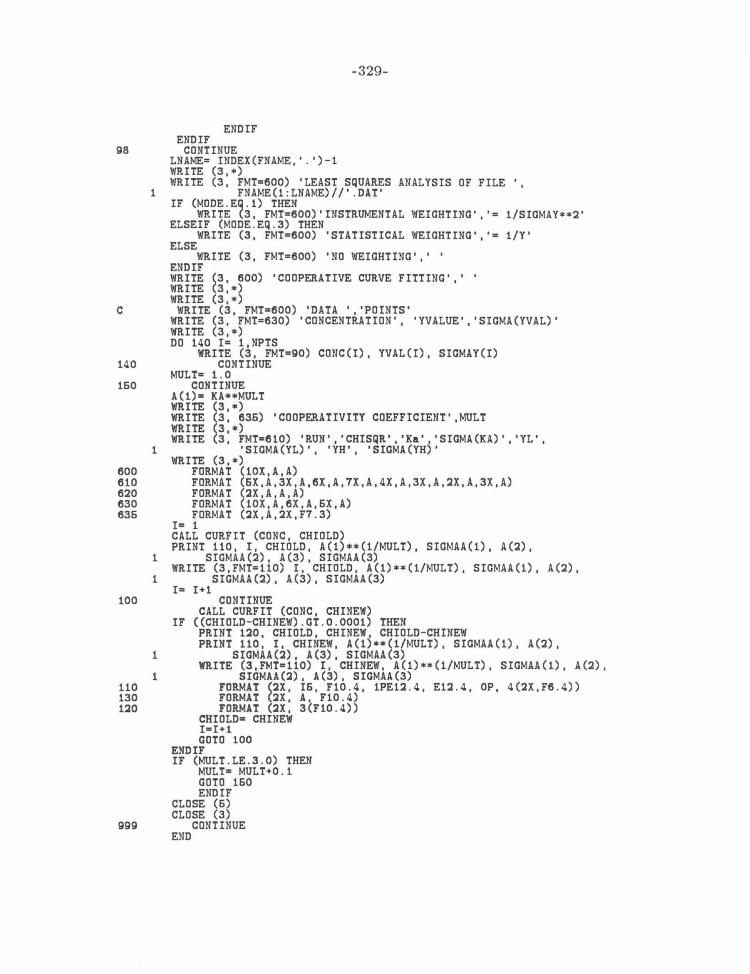
98
c
140
160
600 610 620 630 636
100
110 130 1~0
ggg
END IF END IF
CONTINUE LNAME= HIDEX(FNAME,' . ')-1 WRITE (3, •)
-329-
WRITE (3, FMT=600) 'LEAST SQUARES ANALYSIS OF FILE ', 1 FNAME(1 :LNAME)//' . OAT'
IF (MODE .EQ.1) THEN WRITE (3, FMT=600)'INSTRUMENTAL WEIGHTING','= 1/SIGMAY••:l'
ELSE IF (~lODE . EQ. 3) THEN WRITE (3, FMT=600) 'STATISTICAL WEIGHTING', '• 1/Y'
ELSE WRITE (3, FMT=600) 'NO WEIGHTING',' '
END IF WRITE (3, 600) 'COOPERATIVE CURVE FITTING', ' ' WRITE (3,•) WRITE (3,•)
WRITE (3, FMT=600) 'DATA ','POINTS' WRITE (3, FMT=630) 'CONCENTRATION', 'YVALUE','SIGMA(YVAL)' WRITE (3,•) DO 140 I= 1, NPTS
WRITE (3, FMT=90) CONC(I), YVAL(I), SIGMAY(I) CONTINUE
MULT• 1. 0 CONTINUE
A(1)= KA**MULT WRITE (3, •) WRITE (3, 636) 'COOPERATIVITY COEFFICIENT' ,MULT WRITE (3,•) WRITE (3, FMT•610) 'RUN','CHISQR','Ka' ,'SIGMA(KA)', 'YL',
1 'SIGMA(YL)', 'YH', 'SIGMA(YH)' WRITE (3, •)
FORMAT (10X,A,A) FORMAT (6X,A,3X,A,6X,A,7X,A,4X,A,3X,A.~X.A,3X,A) FORMAT (~X,A,A,A) FORMAT (10X,A,6X,A,6X,A) FORMAT (~X.A.~X.F7 . 3)
I= 1 CALL CURFIT (CONC, CHIOLD) PRINT 110, I, CHIOLD, A(1)••(1/MULT), SIGMAA(1), A(~).
1 SIGMAA(~). A(3), SIGMAA(3) WRITE (3,FMT=110) I, CHIOLD, A(1)**(1/~1ULT), SIGMAA(1), A(~),
1 SIGMAA(:l), A(3), SIGMAA(3) I• I+1
CONTINUE CALL CURFIT (CONC, CHINEW)
IF ((CHIOLD-CHINEW) . GT . 0.0001) THEN PRINT 1~0, CHIOLD, CHINEW, CHIOLD-CHINEW PRINT 110, I, CHINEW, A(1)••(1/MULT), SIGMAA(1), A(:l),
1 SIGMAA(:l), A(3), SIGMAA(3) WRITE (3,FMT=110) I, CHINEW, A(1)••(1/MULT) , SIGMAA(1), A(2),
1 SIGMAA(~). A(3), SIGMAA(3) FORMAT (:lX, I6, F10.4, 1PE1~ . 4. E1~.4. OP, 4(~X,F6.4)) FORMAT (~X. A, F10 . 4) FORMAT (~X, 3(F10 . 4))
CHIOLD• CHINEW I•I+1 GOTO 100
END IF IF (MULT.LE .3 . 0) THEN
MULT• MULT+0.1 GOTO 160 END IF
CLOSE (6) CLOSE (3)
CONTINUE END

-330-
HILLF.FOR
C FUNCTIONS NEEDED FOR LEAST SQUARES FIT TO TERTIARY CO~lPLEX
C BINDING FUNCTION C FUNCTION FUNCTN EVALUATES Yapp=(YH-YL)•KA•[L]/(1+KA•[L]) c C VARIABLES C L LIGAND CONCENTRATION ARRAY (INDEPENDENT VARIABLE) C I INDEX C A PARAMETER ARRAY A(1)=Ka, A(~)=YL, A(3)=YH C MULT- EXPONENT OF Ka c
REAL*8 FUNCTION FUNCTN (L, I, A, MULT) REAL•8 LI,L,A,MULT INTEGER•~ I DIMENSION L(80), A(3) LI• L(I)uMULT FUNCTN• (A(3)-A(~))•A(1)•LI/(1+A(1)•LI)+A(~)
100 FORMAT (~X,F8 . 4,F8 . 4,F8 . 4)
c c
RETURN END
C SUBROUTINE FDERIV EVALUATES PARTIAL DERIVATIVES OF EACH C PARAMETER IN EQUATION FOR Yapp c C VARIABLES c c c c c c c c
c
L I
LIGAND CONCENTRATION ARRAY (INDEPENDENT VARIABLE) INDEX
A DELTAA NTERMS DERIV(I)
PARAMETER ARRAY A(1) 2 Ka, A(~)=YL, A(3)=YH PARAMETER INCREMENT ARRAY NUMBER OF PARAMETERS (3 FOR BINDING CURVES) Ith PARTIAL DERIVATIVE OF BINDING CURVE
WRT PARAMETERS
SUBROUTINE FDERIV (L, I, DERIV) REAL•8 LI, Z, L, A, DELTAA, DERIV, SIGMAA, FLAMDA, MULT INTEGER•~ I DIMENSION L(80), A(3) , DELTAA(3), DERIV(3), SIGMAA(3) COMMON /PARS/ A, DELTAA, SIGMAA, FLAMDA, MULT
LI=- L(I)**MULT Z= 1+A(1)•LI RANGE• A(3) -A(~)
DERIV(1)• RANGE•LI/Z-RANGE•A(1)•LI•LI/Z**~ DERIV(3)• A(1)•LI/Z DERIV(~)· 1.0-DERIV(3)
C WRITE (6, •) 'A(1), Z•', A(1), Z C WRITE (6, •) 'DERIVS 1,3=', DERIV(1), DERIV(3) 100 FORMAT (~X. A, ~(F8 . 4))
RETURN END

-331-
SIXMER.FOR
C MERS TAKES A MICROGENIE SINGLE SEQUENCE OUTFILE AND DETERMINES C THE DISTRIBUTION OF SIXMERS WITHIN IT . CURRENTLY, NO C POSITIONAL DATA IS STORED . MERS USES A 6D ARRAY AS A THE C SIXMER FREQUENCY STORAGE ELEMENT . USING A=1, C=2 , G=3 , AND T=4, C TO DESCRIBE EACH SEQUENCE, IE SMERS(1,1,2,3,4, 4) = AACGTT . C MERS FIRST INPUTS A STRING OF 60 BASES, THEN MOVES SEQUENTIALLY C FORWARD COUNTING SIXMERS. THE LAST FIVE BASES ARE SAVED TO C START THE NEXT INPUT LINE . THE PROGRAM THEN REMOVES COMPLEMENTS C SO THAT ONLY THE ALPHABETICALLY FIRST OF A PAIR IS WRITTEN. C OUTPUT CONSISTS OF THE FILE C:\WSW\FORT\SEQLS6.0UT . c C ********DATA PREPARATION********** c C IF THE SEQUENCE IS LINEAR, THE FIRST LINE OF THE FILE MUST BE C XXXIX (OR MORE X'S) IF THE SEQUENCE IS CIRCULAR, C PUT THE LAST FIVE BASES IN C THE SEQUENCE AT THE FRONT . ALL FILES MUST HAVE END AS THE FIRST C THREE CHARACTERS OF THE LAST LINE . CURRENTLY THE INPUT FILE IS C NAMED DATA . SEQ . IF THE BATCH FILES ARE USED TO RUN MERS, THE C . SEQ FILE OF YOUR CHOICE IS COPIED TO THE PROGRAMS DIRECTORY C AND THE END COMMAND IS AUTOMATICALLY ADDED. THE OUTPUT FILE IS C THEN COPIED BACK TO YOUR DIRECTORY WITH A 6.0UT APPENDED TO THE C NAME . TO PRODUCE A SUITABLE DATA FILE ON MICROGENIE, C ENTER ANALYZE, AND CHANGE A SET OF PARAMETERS TO THE FOLLOWING C NWIDTH=6, NFREQ=O, NSKIP=O. ANALYZE THE DESIRED SEQUENCE USING C ONLY PROCEDURE 1, EXIT MICROGENIE AND COPY OUTFILE TO YOUR C DIRECTORY .SEQ . THEN EDIT THE FILE AND REMOVE THE SEQUENCE NAME C (IT APPEARS PERIODICALLY) . PLACE EITHER MORE THAN FIVE X's (OR C THE LAST FIVE BASES FOR CIRCULAR ma) AT THE FRONT OF THE FILE . C IT IS NOT NECESSARY TO REMOVE COMPLETELY BLANK LINES.
PROGRAM MERS INTEGER•2 I,J,K(6),L,M,N,Q,SMERS,COUNT DIMENSION SMERS(6 ,6,6,6,6,6) CHARACTER•4 BP•6, TEMP, SITE•10 CHARACTER•60 LAST, SEQ, !SEQ
PRINT 3,'STARTING' CALL IN IT (SMERS) COUNT•O BP• 'ACGTX'
3 FORMAT (2X,A) CALL INPUT(LAST) CALL INPUT(ISEQ) SEQ•LAST(1 :6)//ISEQ(1:60) PRINT 3,SEQ
7 CONTINUE c C SORT SIXMERS OF SEQUENCE IN ORDER INTO ARRAY
DO 10 Ia1,60 DO 20 Ja1,6
K(J)ziNDEX(BP,SEQ(I+J- 1: I+J-1)) 20 CONTINUE
SMERS(K(1),K(2),K(3),K(4),K(6),K(6))=SMERS(K(1),K(2), 1 K(3),K(4),K(6),K(6))+1
C IF (K(1) . NE . 6 . AND .K(2) . NE.6.AND .K(3) . NE .6 . AND.K(4).NE . 6 C 1 .AND.K(6).NE.6.AND . K(6) .NE . 6) COUNT=COUNT+1 10 CONTINUE
C INPUT SEQUENCE UNTIL ' END'
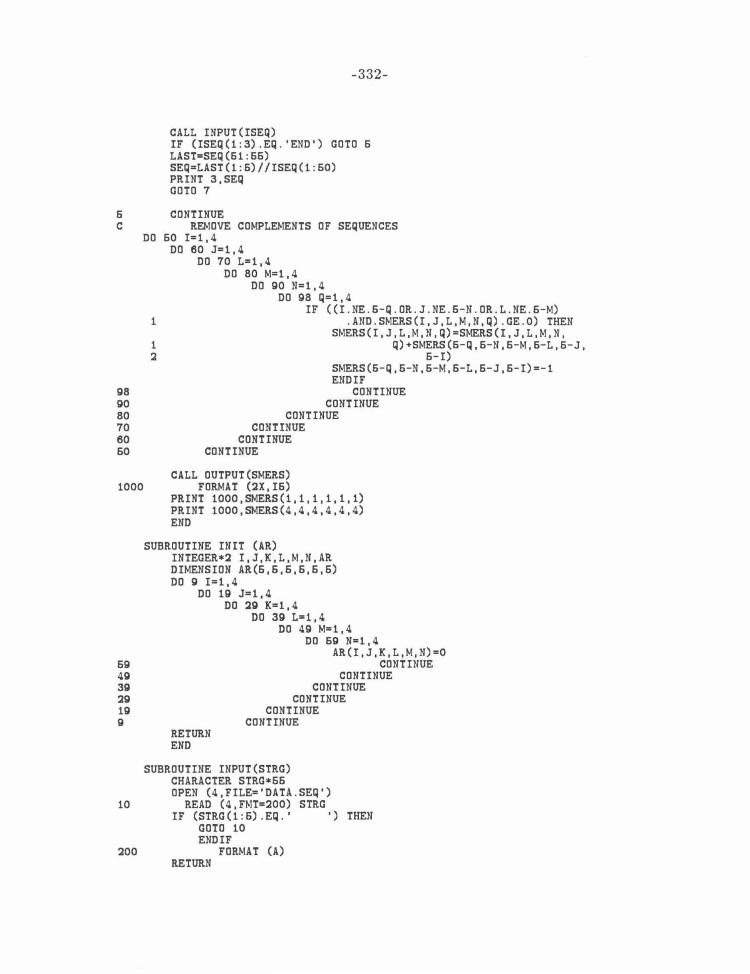
-332-
CALL INPUT(ISEQ) IF (ISEQ(1 :3) . EQ . 'END') GOTO 6 LAST=SEQ(61 :66) SEQ=LAST(1 :6)//ISEQ(1 :60) PRINT 3,SEQ GOTO 7
6 CONTINUE C REMOVE COMPLEMENTS OF SEQUENCES
DO 60 I=1,4 DO 60 J=1,4
DO 70 L=1,4 DO 80 M=1,4
DO go N=1,4 DO g8 Q=1,4
IF ((I .NE.6-Q . OR . J . NE .6-N . OR .L.NE.6-M) 1 .AND .SMERS(I,J,L ,M ,N,Q) . GE .O) THEN
SMERS(I,J,L ,M,N, Q)=SMERS(I,J,L,M,N, 1 Q)+SMERS(6-Q,6-N,6-M,6-L,6- J, ~ 6-I)
SMERS(6-Q,6-N,6-M,6-L,6-J,6-I)=-1 END IF
g8 CONTINUE go CONTINUE 80 CONTINUE 70 CONTINUE 60 CONTINUE 60 CONTINUE
CALL OUTPUT(SMERS) 1000 FORMAT (~X,I6)
PRINT 1000,SMERS(1,1,1,1 , 1,1) PRINT 1000,SMERS(4,4,4,4,4,4) END
SUBROUTINE INIT (AR) INTEGER•~ I,J,K,L,M,N,AR DIMENSION AR(6 ,6,6,6,6,6) DO 9 I=1,4
DO 19 J=1,4 DO ~9 K=1,4
DO 3g L:o:1,4 DO 4g M•1 ,4
DO 5g N•1,4 AR(I,J,K,L,M,N)=O
5g CONTINUE 49 CONTINUE 39 CONTINUE ~g CONTINUE 19 CONTINUE g CONTINUE
RETURN END
SUBROUTINE INPUT(STRG) CHARACTER STRG•66 OPEN (4,FILE='DATA .SEQ')
10 READ (4,FMT=~OO) STRG IF (STRG(1 :6) . EQ . ' ') THEN
GOTO 10 END IF
~00 FORMAT (A) RETURN
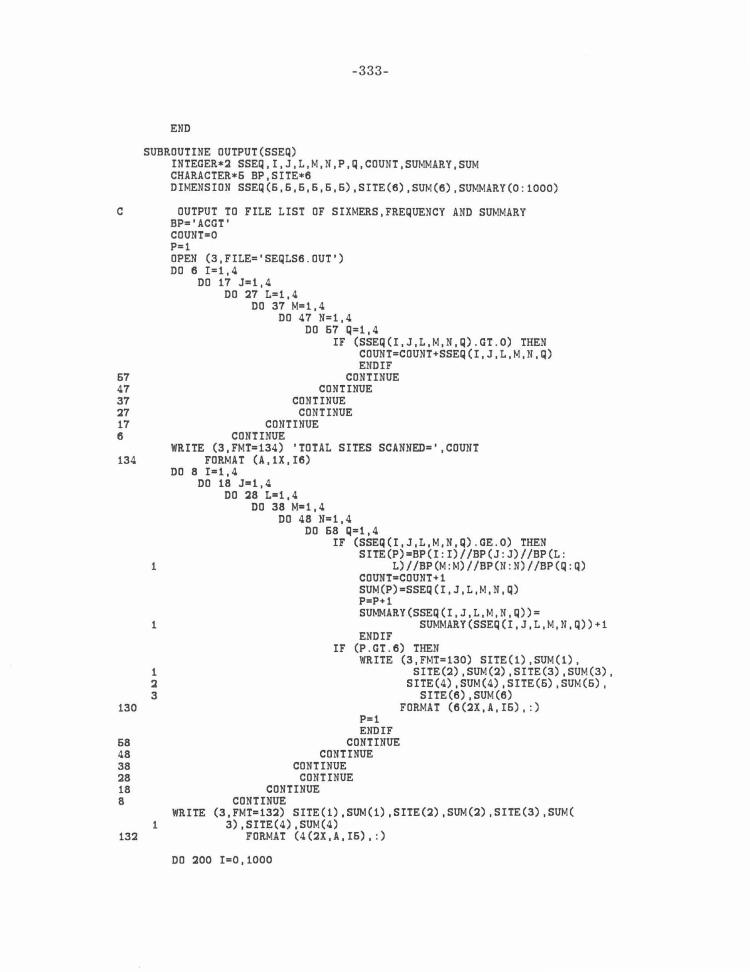
-333-
END
SUBROUTINE OUTPUT(SSEQ) INTEGER*~ SSEQ,I,J,L,M,N,P,Q,COUNT,SUMMARY,SUM CHARACTER*6 BP,SITE*6 DIMENSION SSEQ(6,6,6,6,6,6),SITE(6),SUM(6),SUMMARY(0:1000)
C OUTPUT TO FILE LIST OF SIXMERS,FREQUENCY AND SUMMARY BP='ACGT' COUNT=O P=1 OPEN (3,FILE='SEQLS6.0UT') DO 6 I=1,4
DO 17 J=1,4 DO ~7 L=1,4
DO 37 M=1,4 DO 47 N=1,4
DO 67 Q=1, 4 IF (SSEQ(I,J,L,M,N,Q) . GT.O) THEN
COUNT=COUNT+SSEQ(I,J,L,M,N,Q) END IF
67 CONTINUE 47 CONTINUE 37 CONTINUE ~7 CONTINUE 17 CONTINUE 6 CONTINUE
WRITE (3,FMT•134) 'TOTAL SITES SCANNED=' ,COUNT 134 FORMAT (A,1X,I6)
130
68 48 38 ~8 18 8
13~
DO 8 I•1,4 DO 18 J=1,4
DO ~8 L=1,4 DO 38 M•1,4
DO 48 N=1,4 DO 68 Q=1,4
IF (SSEQ(I,J,L,M,N,Q) .GE . O) THEN SITE(P)=BP(I:I)//BP(J:J)//BP(L:
1 L)//BP(M:M)//BP(N :N)//BP(Q : Q) COUNT=COUNT+1 SUM(P)•SSEQ(I,J,L,M,N,Q) P=P+1 SUMMARY(SSEQ(I,J,L,M,N,Q))=
1 SUMMARY(SSEQ(I,J,L,M,N , Q))+1
1 ~ 3
1 WRITE
END IF IF (P . GT.6) THEN
WRITE (3,FMT=130) SITE(1),SUM(1), SITE(~).SUM(2),SITE(3),SUM(3),
SITE(4),SUM(4),SITE(6) ,SUM(6), SITE(6) ,SUM(6)
P=1 END IF
CONTINUE CONTINUE
CONTINUE CONTINUE
CONTINUE CONTINUE
FORMAT (6(~X.A,I6), : )
(3,FMT=13~) SITE(1),SUM(1),SITE(2),SUM(~).SITE(3),SUM( 3),SITE(4),SUM(4)
FORMAT (4(2X,A,I6), : )
DO ~00 I=0,1000

120
200
1
-334-
IF (SUMMARY(I) . GT.O) THEN
RETURN END
WRITE (3, FMT=120) 'SIXMERS FOUND' , I,' TIMES = ' SUMMARY(I)
FORMAT (A,1X,I3,1X,A,I6) END IF
CONTINUE
WEAKSX.FOR
C FOR A DESCRIPTION OF PROGRAM, SEE SIXMER . FOR . THIS PROGRAM C TREATS A AND T AS INTERCHANGEABLE .
PROGRAM MERS INTEGER•2 I,J,K(6),L,M,N,Q,II,JJ,LL,MM,NN,QQ,SMERS , COUNT DIMENSION SMERS(6,6,6,6 ,6,6) CHARACTER•4 BP*6, TEMP, SITE•10 CHARACTER•60 LAST , SEQ, ISEQ
PRINT 3,'STARTING' CALL INIT(SMERS) OPEN (4,FILE•'DATA .SEQ') BP• 'ACGTX'
3 FORMAT (2X,A) CALL INPUT(LAST) CALL INPUT(ISEQ) SEQ•LAST(1 : 6)//ISEQ(1 :60) PRINT 3,SEQ
7 CONTINUE c C SORT SIXMERS OF SEQUENCE IN ORDER INTO ARRAY
DO 10 I'"1,60 DO 20 J•1,6
K(J)•INDEX(BP,SEQ(I+J-1 : I+J-1)) C COMBINES ALL A,T BP AS A'S
IF (K(J).EQ.4) K(J)=1 20 CONTINUE
SMERS(K(1),K(2),K(3),K(4) , K(6),K(6))=SMERS(K(1) , K(2) , 1 K(3),K(4),K(6),K(6))+1
10 CONTINUE
C INPUT SEQUENCE UNTIL 'END' CALL INPUT(ISEQ) IF (ISEQ(1 : 3) . EQ . 'END') THEN
GOTO 6 END IF
LAST• SEQ (61 : 66) SEQ•LAST(1 : 6)//ISEQ(1 :60) PRINT 3,' ',SEQ OOTO 7
6 CONTINUE PRINT 1000,SMERS(1,2,2,1,2 , 2) PRINT 1000,SMERS(3,3,1,3,3,1) PRINT 1000,SMERS(4,4,4,4,4,4)
C REMOVE COMPLEMENTS OF SEQUENCES DO 60 I•1,3
DO 60 J=1,3 DO 70 L"'1,3
DO 80 M=1,3

g8 go 80 70 eo 60
1
1
-335-
DO go N=1,3 DO g5 Q=1,3
II=6-Q JJ=6-N LL=6-M MM=6-L NN=6-J QQ=6-I IF (II.EQ .4) II=1 IF (JJ .EQ . 4) JJ=1 IF (LL.EQ .4) LL=1 IF (MM .EQ .4) MM=1 IF (NN.EQ .4) NN=1 IF (QQ.EQ .4) QQ=1 IF ((I.NE . II.OR. J .NE. JJ.OR.L . NE.LL)
. AND .SMERS(I,J ,L,M ,N,Q) .GE.O) THEN SMERS(I,J,L,M,N , Q)=SMERS(I , J,L,M,N,
Q)+SMERS(II,JJ,LL, MM,NN ,QQ) SMERS(II,JJ,LL,MM,NN,QQ)=- 1 END IF
CONTINUE CONTINUE
CONTINUE CONTINUE
CONTINUE CONTINUE
CALL OUTPUT(SMERS) 1000 FORMAT (2X,I6)
PRINT 1000,5MERS(1,2 ,2,1,2,2) PRINT 1000,5MERS(3,3,1,3,3,1) PRINT 1000,5MERS(4,4,4,4,4,4) END
SUBROUTINE INIT (AR) INTEGER*2 I , J ,K,L,M,N , AR DIMENSION AR(6,6,6,6,6,6) DO g I=1,4
DO 1g J•1,4 DO 2g K=1, 4
DO 3g L•1 I 4 DO 4g Ms1,4
DO 5g N"'1,4 AR(I,J,K,L,M,N)=O
5g CONTINUE 4g CONTINUE 3g CONTINUE 2g CONTINUE 1g CONTINUE g CONTINUE
RETURN END
SUBROUTINE INPUT(STRG) CHARACTER STRG•66
10 READ (4,FMT=200) STRG IF (STRG(1:6).EQ. ' ') THEN
GOTO 10 END IF
200 FORMAT (A) RETURN END
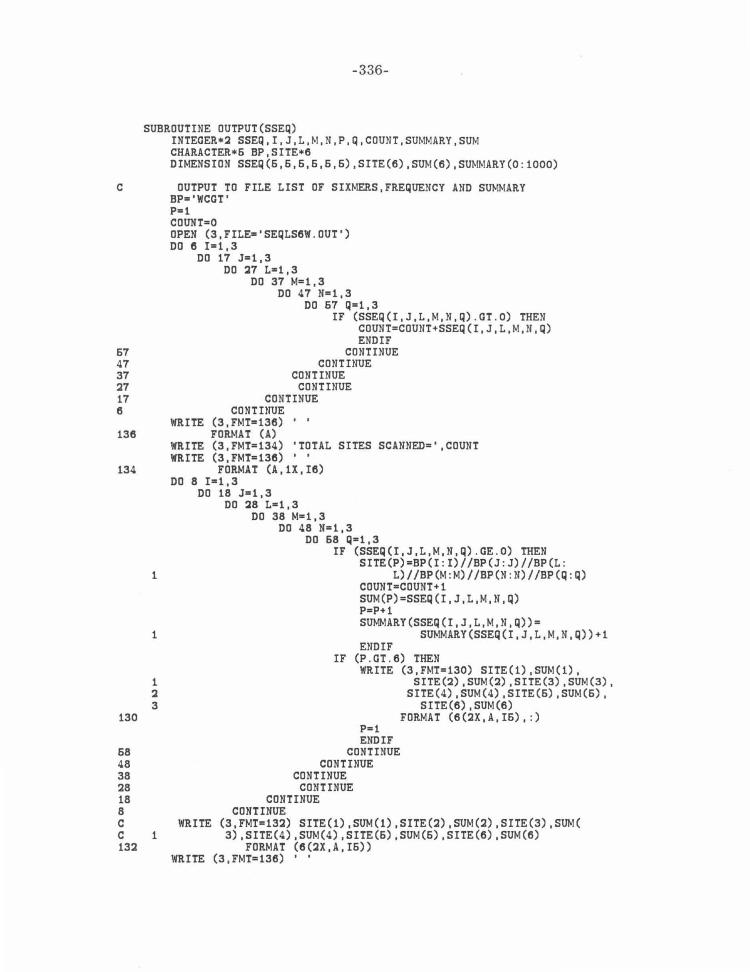
-336-
SUBROUTINE OUTPUT(SSEQ) INTEGER•~ SSEQ,I,J,L,M,N,P,Q,COUNT , SUMMARY,SUM CHARACTER•6 BP,SITE•6 DIMENSION SSEQ(6 ,6,6,6,6,6),SITE(6),SUM(6),SUMMARY(0 :1000)
C OUTPUT TO FILE LIST OF SIXMERS,FREQUENCY AND SUMMARY BP•'WCGT' P•1 COUNT=O OPEN (3,FILE~ ' SEQLS6W.OUT') DO 6 I=1,3
DO 17 J=1,3 DO ~7 L•1,3
DO 37 M=1,3 DO 47 N=1,3
DO 67 Q=1, 3 IF (SSEQ(I,J,L,M,N,Q) . GT.O) THEN
COUNT=COUNT+SSEQ(I,J,L,M,N,Q) END IF
67 CONTINUE 47 CONTINUE 37 CONTINUE ~7 CONTINUE 17 CONTINUE 6 CONTINUE
WRITE (3,FMT=136) 136 FORMAT (A)
WRITE (3,FMT=134) 'TOTAL SITES SCANNED=' ,COUNT WRITE (3,FMT=136)
134 FORMAT (A,1X,I6)
130
68 48 38 ~8 18 8 c c 13~
DO 8 I .. 1,3 DO 18 J=1,3
DO ~8 L•1,3 DO 38 Mz1,3
DO 48 N•1,3 DO 68 Q•1,3
IF (SSEQ(I,J,L,M,N,Q) . GE.O) THEN SITE(P)=BP(I : I)//BP(J : J)//BP(L:
1 L)//BP(M :M)//BP(N:N)//BP(Q : Q)
1
1 ~
3
1
COUNT•COUNT+1 SUM(P)=SSEQ(I,J,L,M,N,Q) P•P+1 SUMMARY(SSEQ(I,J ,L,M ,N,Q))=
SUMMARY(SSEQ(I,J,L,M,N,Q))+1 END IF
IF (P . GT.6) THEN WRITE (3,FMT=130) SITE(1),SUM(1),
SITE(~).SUM(~).SITE(3),SUM(3), SITE(4),SUM(4),SITE(6),SUM(6),
SITE(6),SUM(6) FORMAT (6(~X.A,I6), : )
P=1 END IF
CONTINUE CONTINUE
CONTINUE CONTINUE
CONTINUE CONTINUE
WRITE (3,FMT=13~) SITE(1),SUM(1),SITE(~),SUM(~).SITE(3),SUM( 3),SITE(4),SUM(4),SITE(6),SUM(6),SITE(6),SUM(6)
FORMAT (6(~X.A,I6)) WRITE (3,FMT=136) ' '
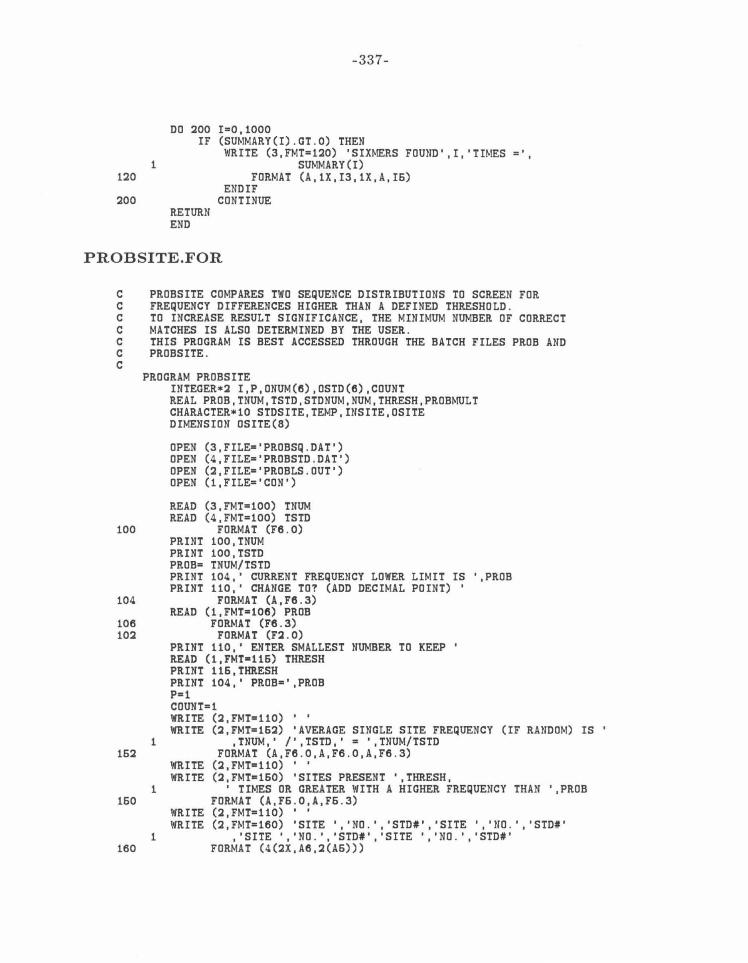
-337-
DO :ZOO !=0,1000 IF (SUMMARY(I) . GT . O) THEN
WRITE (3,FMT=1:ZO) ' SIXMERS FOUND' ,I, 'TIMES=' 1 SUMMARY(!)
120 FORMAT (A,1X , I3,1X,A,I6) END IF
:ZOO CONTINUE RETURN END
PROBSITE.FOR
C PROBSITE COMPARES TWO SEQUENCE DISTRIBUTIONS TO SCREEN FOR C FREQUENCY DIFFERENCES HIGHER THAN A DEFINED THRESHOLD . C TO INCREASE RESULT SIGNIFICANCE, THE MINIMUM NUMBER OF CORRECT C MATCHES IS ALSO DETERMINED BY THE USER. C THIS PROGRAM IS BEST ACCESSED THROUGH THE BATCH FILES PROB AND C PROBSITE. c
PROGRAM PROBSITE INTEGER•:Z I,P,ONUM(e),OSTD(e),COUNT REAL PROB , TNUM,TSTD,STDNUM,NUM,THRESH,PROBMULT CHARACTER*10 STDSITE,TEMP,INSITE,OSITE DIMENSION OSITE(8)
OPEN (3,FILE•'PROBSQ .DAT') OPEN (4,FILE•'PROBSTD .DAT') OPEN (:Z,FILE•'PROBLS.OUT') OPEN (1,FILE='CON')
READ (3,FMT•100) TNUM READ (4,FMT=100) TSTD
100 FORMAT (F6 . 0) PRINT 100,TNUM PRINT 100,TSTD PROB= TNUM/TSTD PRINT 104,' CURRENT FREQUENCY LOWER LIMIT IS ',PROB PRINT 110 , ' CHANGE TO? (ADD DECIMAL POINT) '
104 FORMAT (A,Fe . 3) READ (1,FMT•10e) PROB
10e FORMAT (Fe .3) 102 FORMAT (F:Z.O)
PRINT 110,' ENTER SMALLEST NUMBER TO KEEP ' READ (1,FMT•116) THRESH PRINT 116,THRESH PRINT 104,' PROB•' ,PROB P•1 COUNT•1 WRITE (:Z,FMT=110) ' ' WRITE (:Z,FMT=16:Z) 'AVERAGE SINGLE SITE FREQUENCY (IF RANDOM) IS '
1 ,TNUM , ' /' ,TSTD,' = ',TNUM/TSTD 162 FORMAT (A,F6 . 0,A,F6 .0,A,F6 . 3)
WRITE (:Z,FMT•110) ' ' WRITE (:Z,FMT•160) 'SITES PRESENT ',THRESH,
1 ' TIMES OR GREATER WITH A HIGHER FREQUENCY THAN ',PROB 160 FORMAT (A,F6.0,A,F6.3)
WRITE (:Z,FMT•110) ' ' WRITE (:Z,FMT=160) 'SITE ','NO . ', 'STDt' , 'SITE ','NO . ' , 'STDt'
1 , 'SITE', 'NO.', 'STDt' ,'SITE ','NO . ', 'STDt' 160 FORMAT (4(:ZX,A6,:Z(A6)))

WRITE (2,FMT=110) ' '
10 CONTINUE READ (3 , FMT=110) INSITE READ (3,FMT=116) MUM READ (4 , FMT=110) STDSITE READ (4,FMT=116) STDNUM
110 FORMAT (A) 116 FORMAT (F6 . 0) C PRINT 140,INSITE,STDSITE 140 FORMAT (2X,A,2X,A)
-338-
IF (INSITE(1 : 3) . EQ . 'END') GOTO 30 IF (INSITE .EQ .STDSITE) THEN
IF (NUM/STDNUM.GE.PROB .AND . NUM .GE . THRESH) THEN OSITE(P)xiNSITE ONUM(P)=NUM OSTD(P)=STDNUM P=P+1 COUNT,.COUNT+1 IF (P.GT . 4) THEN
WRITE (2,FMT=120) OSITE(1)(1 :6),0NUM(1),0STD(1), 1 OSITE(2)(1 :6),0NUM(2),0STD(2),0SITE(3)(1 :6) , 2 ONUM(3),0STD(3),0SITE(4)(1 :6),0NUM(4),0STD(4)
PRINT 120,0SITE(1)(1 :6),0NUM(1),0STD(1), 1 OSITE(2)(1 :6),0NUM(2),0STD(2),0SITE(3)(1:6), 2 ONUM(3),0STD(3),0SITE(4)(1 :6),0NUM(4),0STD(4)
120 FORMAT (4(2X,A6,I6,I6)) DO 40 I=1,4
OSITE(I)•' ' 40 CONTINUE
P=1 END IF
END IF END IF
GOTO 10 30 CONTINUE
IF (OSITE(1).EQ.' ') GOTO 60 IF (OSITE (2). EQ. ' ') GOTO 70 IF (OSITE (3) . EQ . ' ') GOTO 60 WRITE (2,FMT=170) OSITE(1),0NUM(1),0STD(1),
1 OSITE(2),0NUM(2),0STD(2),0SITE(3), 2 ONUM(3),0STD(3)
170 FORMAT (3(2X,A6,I6,I6)) GOTO 60
60 CONTINUE WRITE (2,FMT=172) OSITE(1),0NUM(1),0STD(1),
1 OSITE(2),0NUM(2),0STD(2) 172 FORMAT (2(2X,A6,I6,I6))
GOTO 60 70 CONTINUE
WRITE (2,FMT=174) OSITE(1),0NUM(1) ,0STD(1) 174 FORMAT (1(2X , A6,I6,I6)) 60 CONTINUE
END