Competitive indices of wheat + compact-mustard intercropping in a 5:1 row proportion as influenced...
16
This article was downloaded by: [Central Agricultural University ] On: 20 February 2014, At: 23:02 Publisher: Taylor & Francis Informa Ltd Registered in England and Wales Registered Number: 1072954 Registered office: Mortimer House, 37-41 Mortimer Street, London W1T 3JH, UK Archives of Agronomy and Soil Science Publication details, including instructions for authors and subscription information: http://www.tandfonline.com/loi/gags20 Competitive indices of wheat + compact-mustard intercropping in a 5:1 row proportion as influenced by fertilizer doses and seed rates of wheat varieties Amit Kumar Singh a & J.S. Bohra a a Department of Agronomy , Institute of Agricultural Sciences , Varanasi , India Published online: 07 Mar 2012. To cite this article: Amit Kumar Singh & J.S. Bohra (2012) Competitive indices of wheat + compact-mustard intercropping in a 5:1 row proportion as influenced by fertilizer doses and seed rates of wheat varieties, Archives of Agronomy and Soil Science, 58:12, 1399-1412, DOI: 10.1080/03650340.2011.598513 To link to this article: http://dx.doi.org/10.1080/03650340.2011.598513 PLEASE SCROLL DOWN FOR ARTICLE Taylor & Francis makes every effort to ensure the accuracy of all the information (the “Content”) contained in the publications on our platform. However, Taylor & Francis, our agents, and our licensors make no representations or warranties whatsoever as to the accuracy, completeness, or suitability for any purpose of the Content. Any opinions and views expressed in this publication are the opinions and views of the authors, and are not the views of or endorsed by Taylor & Francis. The accuracy of the Content should not be relied upon and should be independently verified with primary sources of information. Taylor and Francis shall not be liable for any losses, actions, claims, proceedings, demands, costs, expenses, damages, and other liabilities whatsoever or howsoever caused arising directly or indirectly in connection with, in relation to or arising out of the use of the Content. This article may be used for research, teaching, and private study purposes. Any substantial or systematic reproduction, redistribution, reselling, loan, sub-licensing, systematic supply, or distribution in any form to anyone is expressly forbidden. Terms &
-
Upload
independent -
Category
Documents
-
view
0 -
download
0
Transcript of Competitive indices of wheat + compact-mustard intercropping in a 5:1 row proportion as influenced...

This article was downloaded by: [Central Agricultural University ]On: 20 February 2014, At: 23:02Publisher: Taylor & FrancisInforma Ltd Registered in England and Wales Registered Number: 1072954 Registeredoffice: Mortimer House, 37-41 Mortimer Street, London W1T 3JH, UK
Archives of Agronomy and Soil SciencePublication details, including instructions for authors andsubscription information:http://www.tandfonline.com/loi/gags20
Competitive indices of wheat +compact-mustard intercropping in a5:1 row proportion as influenced byfertilizer doses and seed rates of wheatvarietiesAmit Kumar Singh a & J.S. Bohra aa Department of Agronomy , Institute of Agricultural Sciences ,Varanasi , IndiaPublished online: 07 Mar 2012.
To cite this article: Amit Kumar Singh & J.S. Bohra (2012) Competitive indices of wheat +compact-mustard intercropping in a 5:1 row proportion as influenced by fertilizer doses andseed rates of wheat varieties, Archives of Agronomy and Soil Science, 58:12, 1399-1412, DOI:10.1080/03650340.2011.598513
To link to this article: http://dx.doi.org/10.1080/03650340.2011.598513
PLEASE SCROLL DOWN FOR ARTICLE
Taylor & Francis makes every effort to ensure the accuracy of all the information (the“Content”) contained in the publications on our platform. However, Taylor & Francis,our agents, and our licensors make no representations or warranties whatsoever as tothe accuracy, completeness, or suitability for any purpose of the Content. Any opinionsand views expressed in this publication are the opinions and views of the authors,and are not the views of or endorsed by Taylor & Francis. The accuracy of the Contentshould not be relied upon and should be independently verified with primary sourcesof information. Taylor and Francis shall not be liable for any losses, actions, claims,proceedings, demands, costs, expenses, damages, and other liabilities whatsoever orhowsoever caused arising directly or indirectly in connection with, in relation to or arisingout of the use of the Content.
This article may be used for research, teaching, and private study purposes. Anysubstantial or systematic reproduction, redistribution, reselling, loan, sub-licensing,systematic supply, or distribution in any form to anyone is expressly forbidden. Terms &

Conditions of access and use can be found at http://www.tandfonline.com/page/terms-and-conditions
Dow
nloa
ded
by [
Cen
tral
Agr
icul
tura
l Uni
vers
ity ]
at 2
3:02
20
Febr
uary
201
4

Competitive indices of wheat þ compact-mustard intercropping
in a 5:1 row proportion as influenced by fertilizer doses
and seed rates of wheat varieties
Amit Kumar Singh and J.S. Bohra*
Department of Agronomy, Institute of Agricultural Sciences, Varanasi, India
(Received 5 March 2011; final version received 8 June 2011)
A field experiment in a split-plot design with three replications was conducted onwheat þ compact-mustard intercropping in a 5:1 row proportion at the researchfarm, Institute of Agricultural Sciences, Banaras Hindu University, India, duringthe winter seasons of 2005–2006 and 2006–2007. The main plot treatmentinvolved a combination of three fertilizer doses [100, 120 and 140% recommendedfertilizer dose (RFD) to wheat, accompanied by 100% RFD to mustard] and twowheat varieties (HD-2824 and HUW-468); the subplot treatment consisted ofthree seed rates of wheat (100, 115 and 130 kg ha71). The treatment differenceswere studied intensively in light of the various reciprocity indices. Wheat varietyHD-2824 at 115 kg ha71 seed rate and 140% RFD, intercropped with compact-mustard variety Sanjukta Aschesh at 100% RFD in a 5:1 row proportion,resulted in the best land utilization, maximum productivity and monetaryadvantage. Among the various yield indices studied, area time equivalent ratio(ATER), competitive ratio (CR) and effective land equivalent ratio (LER) curveswere found to be good for comparing the variations in fertilizer doses and seedrates used in wheat varieties. Nevertheless, to compare monetary advantage, themonetary advantage index (MAI) based on LER proved a better index thanintercropping advantage (IA), which is based on actual yield loss (AYL).
Keywords: fertilizer dose; wheat variety; seed rate; competitive indices;wheat þ compact-mustard intercropping
Introduction
Intercropping of wheat (Triticum aestivum L.) and Indian mustard (Brassica junceaL.) is a traditional and widespread system in India under both irrigated and rainfedconditions. Growing cereals with pulses and oilseeds of varying rooting depths andgrowth patterns facilitates better extraction of soil moisture and nutrients fromdifferent soil profiles. In addition to increased water- and nutrient-use efficiency(Yang et al. 2010), intercropping is also known to intercept more solar energy andprovide comparatively higher yield stability (Tsubo et al. 2003) and yield insuranceduring aberrant weather conditions compared with sole crops (Willey 1979, Sinhaet al. 1985, Mandal et al. 1991). A substantial increase in total production over spaceand time not by means of costly inputs, but by the simple expedient of growing crops
*Corresponding author. Email: [email protected]
Archives of Agronomy and Soil Science
Vol. 58, No. 12, December 2012, 1399–1412
ISSN 0365-0340 print/ISSN 1476-3567 online
� 2012 Taylor & Francis
http://dx.doi.org/10.1080/03650340.2011.598513
http://www.tandfonline.com
Dow
nloa
ded
by [
Cen
tral
Agr
icul
tura
l Uni
vers
ity ]
at 2
3:02
20
Febr
uary
201
4

together is the unique advantage associated with intercropping, in particular,microclimatic manipulation is shown to be appreciably more limited in sole croppingthan in intercropping (Stigter and Baldy 1995). In an intercropping system,competitive effects between the principal and subsidiary crops depend on the natureof growth, duration, plant habit, rooting pattern, canopy structure and days tomaturity of the component crops. Based on aggressivity, relative crowding coefficientand competitive ratio, it has been established that in wheat þ mustard intercroppingthe competition offered by mustard is much higher than that offered by wheat(Srivastava et al. 2007). In addition, competition for nutrients may result in symptomsof deficiency and physiological impairment, which, in turn, may further affect growthvia feedback mechanisms. Moreover, because of its success in absorbing one soilfactor, the aggressive component also absorbs greater quantities of other factors(Snaydon and Harris 1979). However, this can be modified to some extent bychanging management or cropping design (Singh and Gupta 1993). Higher yield oryield advantage, as well as monetary return, can be achieved by proper manipulationof the plant population, genotype selection and effective fertilizer management.
Wheat is the predominant winter season crop of north and central India underirrigated conditions. However, it is mainly taken in a mixed stand with mustardunder imbalanced proportions. Being aggressive in nature, mustard affects theperformance of the main wheat crop to a large extent. However, a previous studyconducted at Varanasi, India, showed that intercropping of wheat þ compact-mustard variety Sanjucta Aschesh in a 5:1 row ratio with 100% RFD to both thecrops was highly productive and remunerative (Srivastava et al. 2007). Furtherimprovement in the efficiency of this intercropping system may be possible byenhancing the competitive ability of wheat (poor competitor) through propergenotype selection, as well as better nutrition and choosing a competitivepopulation. Therefore, this study was undertaken to assess the monetary advantageand other reciprocity functions of wheat þ compact-mustard (5:1) intercroppingunder varying nutrient and seed rates of wheat varieties.
Materials and methods
Crop management and experimental design
The experiments were carried out during two consecutive winter seasons (2005–2006and 2006–2007) at the Agricultural Research Farm of Banaras Hindu University,Varanasi in Northern Gangetic Alluvial Plain, India (838030000E longitude;258180000N latitude; altitude 128.93 m above sea level). The experimental soil wasGangetic alluvial (Ustochrept) pH 7.6. It was moderately fertile being low in organiccarbon (0.39%) and available nitrogen (198.4 kg ha71), and medium in availablephosphorus (15.7 kg ha71) and potassium (215.4 kg ha71). Seedbed preparationincluded ploughing, disk harrowing and planking. In the sole and intercroppingsystems, wheat was sown at a row spacing of 22.5 cm and plant-to-plant distancewas maintained as per seed rate. However, for mustard, thick sowing was carried outat a row spacing of 36.0 cm in the sole stand, whereas in the intercropping system,sowing was according to the main crop. The plant-to-plant distance for mustard onrows was maintained at 12 cm by thinning at 14 and 21 days after sowing. Wheatand mustard under intercropping were sown in a 5:1 row arrangement inreplacement series. The experiment was laid out in a split-plot design with threereplications comprising six treatment combinations of three fertilizer doses, i.e. 100,
1400 A.K. Singh and J.S. Bohra
Dow
nloa
ded
by [
Cen
tral
Agr
icul
tura
l Uni
vers
ity ]
at 2
3:02
20
Febr
uary
201
4
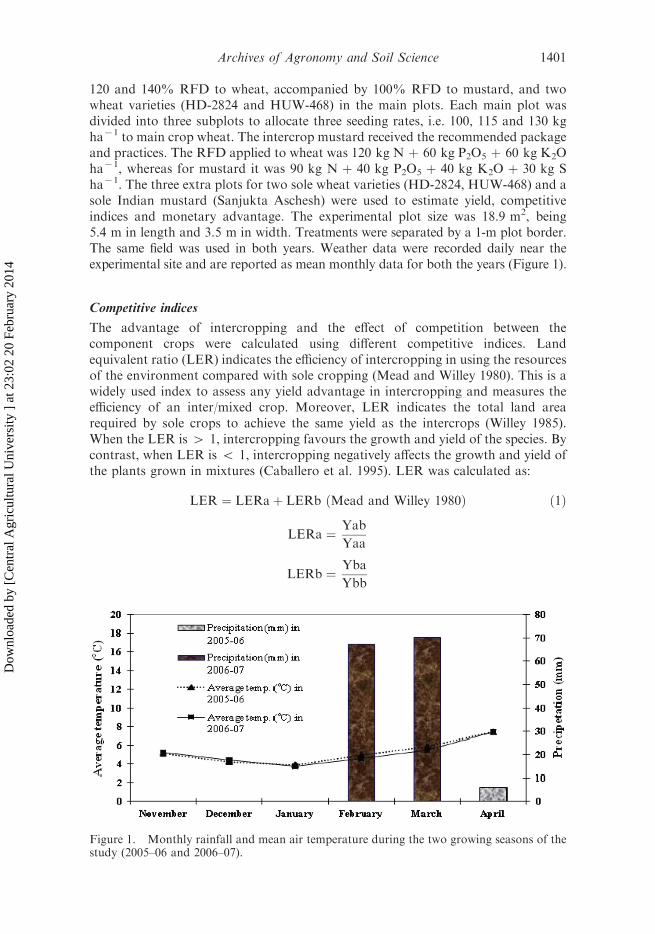
120 and 140% RFD to wheat, accompanied by 100% RFD to mustard, and twowheat varieties (HD-2824 and HUW-468) in the main plots. Each main plot wasdivided into three subplots to allocate three seeding rates, i.e. 100, 115 and 130 kgha71 to main crop wheat. The intercrop mustard received the recommended packageand practices. The RFD applied to wheat was 120 kg N þ 60 kg P2O5 þ 60 kg K2Oha71, whereas for mustard it was 90 kg N þ 40 kg P2O5 þ 40 kg K2O þ 30 kg Sha71. The three extra plots for two sole wheat varieties (HD-2824, HUW-468) and asole Indian mustard (Sanjukta Aschesh) were used to estimate yield, competitiveindices and monetary advantage. The experimental plot size was 18.9 m2, being5.4 m in length and 3.5 m in width. Treatments were separated by a 1-m plot border.The same field was used in both years. Weather data were recorded daily near theexperimental site and are reported as mean monthly data for both the years (Figure 1).
Competitive indices
The advantage of intercropping and the effect of competition between thecomponent crops were calculated using different competitive indices. Landequivalent ratio (LER) indicates the efficiency of intercropping in using the resourcesof the environment compared with sole cropping (Mead and Willey 1980). This is awidely used index to assess any yield advantage in intercropping and measures theefficiency of an inter/mixed crop. Moreover, LER indicates the total land arearequired by sole crops to achieve the same yield as the intercrops (Willey 1985).When the LER is 4 1, intercropping favours the growth and yield of the species. Bycontrast, when LER is 5 1, intercropping negatively affects the growth and yield ofthe plants grown in mixtures (Caballero et al. 1995). LER was calculated as:
LER ¼ LERaþ LERb Mead and Willey 1980ð Þ ð1Þ
LERa ¼ Yab
Yaa
LERb ¼ Yba
Ybb
Figure 1. Monthly rainfall and mean air temperature during the two growing seasons of thestudy (2005–06 and 2006–07).
Archives of Agronomy and Soil Science 1401
Dow
nloa
ded
by [
Cen
tral
Agr
icul
tura
l Uni
vers
ity ]
at 2
3:02
20
Febr
uary
201
4

Where, LERa and LERb are the partial LER of crops ‘a’ and ‘b’, respectively. Yaband Yba are the yields of two component crops; Yaa and Ybb are the yields per unitarea when ‘a’ and ‘b’ are grown as sole crops under those conditions with whichcomparison are to be made.
Area time land equivalent ratio (ATER) takes into account the duration of cropsand permits an evaluation of crops on yield per day basis. It is a modification of LERand expressed as given below:
ATER ¼ La � Dað Þ þ Lb � Dbð Þf gT
ðHiebsch and McCollum; 1987Þ ð2Þ
Where, La and Lb are the relative yield or partial LER of component crops ‘a’ and‘b’; Da and Db are the duration of component crops and T is the total duration ofthe intercropping system.
The relative crowding coefficient (RCC or k) is the measure of the relativedominance of one crop/species over the other in an intercropping or mixed croppingsystem (De Wit 1960). In intercropping of two crops ‘a’ and ‘b’ in replacement series,the association of ‘a’ with ‘b’ and vice versa, the coefficient is given as:
kab ¼ Yab
Yaa�Yab� Zba
ZabDe Wit 1960ð Þ ð3Þ
kba ¼ Yba
Ybb�Yba� Zab
Zba
Where, kab and kba are the relative crowding coefficient of crop ‘a’ and ‘b’intercropped with crop ‘b’ and ‘a’, Yab and Yba are yield per unit area of crop ‘a’and ‘b’ intercropped with crop ‘b’ and ‘a’ (expressed over the area occupied by bothcrops), Yaa and Ybb are the yield per unit area of sole crop ‘a’ and ‘b’, Zab and Zbaare the proportion of intercropped area initially allocated to crop ‘a’ and ‘b’,respectively. It has further been suggested that kab 6 kba ¼ K. If the product ofthe coefficients of component crops (K) is greater than, equal to or less than unity, itindicates that there is a ‘yield advantage’, ‘no effect’ or ‘yield disadvantage’ forintercropping, respectively.
Aggressivity is another index that is often used to indicate how much the relativeyield increase in crop ‘a’ is greater than that for crop ‘b’ and vice versa in anintercropping system (McGilchrist 1965). Aggressivity of crop ‘a’ with ‘b’ and viceversa is given as:
Aab ¼ Yab
Yaa � Zab� Yba
Ybb � ZbaMcGilchrist 1965ð Þ ð4Þ
Aba ¼ Yba
Ybb� Zba� Yab
Yaa� Zab
Where, Aab and Aba are the aggressivity of crop ‘a’ and ‘b’ intercropped with crop‘b’ and ‘a’, respectively. An aggressivity value of zero indicates that the componentcrops are equally competitive. For any situation, both components will have thesame numerical value but the sign for the dominant component will be positive and
1402 A.K. Singh and J.S. Bohra
Dow
nloa
ded
by [
Cen
tral
Agr
icul
tura
l Uni
vers
ity ]
at 2
3:02
20
Febr
uary
201
4

that for the dominated crop will be negative. The greater the numerical value, thelarger the difference in competitive abilities.
The next reciprocity index is the competitive ratio (CR), which assessescompetition between component crops in intercropping system. CR gives a bettermeasure of the competitive ability of the crops and has advantage over ‘K’ andaggressivity (Willey and Rao 1980). It represents simply the ratio of individual LERsof the two component crops and takes into account the proportion of the crops inwhich they are initially sown. The CR is calculated according to the followingformula:
CRa ¼ LERa
LERb
� �� Zba
ZabWilley and Rao 1980ð Þ ð5Þ
CRb ¼ LERb
LERa
� �� Zab
Zba
Where, LERa and LERb are the partial land equivalent ratio of crop ‘a’ and ‘b’.Banik et al. (2000) reported that actual yield loss (AYL) as an index gives more
precise information than the other indices about the competition between and withinthe component crops and the behaviour of each species in the intercropping system,because it is based on yield per plant. AYL is the proportionate yield loss or gain ofintercrops in comparison with the respective sole crop, i.e. it takes into account theactual sown proportion of the component crops with its pure stand. In addition,partial actual yield loss (AYLa or AYLb) represents the proportionate yield loss ofeach crop when grown as intercrops, relative to their yield in pure stand. The AYL iscalculated according to the following formula:
AYL ¼ AYLaþAYLb Banik et al: 2000ð Þ ð6Þ
AYLa ¼ Yab
Zab
� �� Yaa
Zaa
� �� �� 1
� �
AYLb ¼ Yba
Zba
� �� Ybb
Zbb
� �� �� 1
� �
Where AYL is the actual yield loss; AYLa and AYLb are the partial actual yield lossof crop ‘a’ and ‘b’; Yab and Yba are yield per unit area of crop ‘a’ and ‘b’ asintercrop (expressed over the area occupied by both crops); Yaa and Ybb are theyield per unit area of crop ‘a’ and ‘b’ in sole stand; Zab and Zba are the sownproportion of intercropped area of crop ‘a’ and ‘b’ compared with their respectivesole stand; Zaa and Zbb are the proportion of sole cropped area of crop ‘a’ and ‘b’under normal seed rate and spacing. AYL can have positive or negative values thatgive quantitative assessment of an advantage or disadvantage accrued under anintercrop situation when the main objective is to compare yield on a per plant basis.
Yield proportion of wheat as well as effective LER curves for wheat þ mustardintercropping were developed according to the equation suggested by Mead andWilley (1980).
Archives of Agronomy and Soil Science 1403
Dow
nloa
ded
by [
Cen
tral
Agr
icul
tura
l Uni
vers
ity ]
at 2
3:02
20
Febr
uary
201
4

Yield proportion of wheat ¼ LERwheat
LER
� �Mead and Willey 1980ð Þ ð7Þ
Intercropping advantage (IA) was calculated using the following formula:
IA ¼ IAaþ IAb Banik et al: 2000ð Þ ð8Þ
IAa ¼ AYLa� Pa
IAb ¼ AYLb� Pb
Where, Pa and Pb are the commercial value of crop ‘a’ and ‘b’, respectively. The currentprice of wheat and mustard are US $235 per Mg and US $500 per Mg, respectively.
However, none of the above competition indices provides any clear informationon the economic advantage of the intercropping system. For this reason, themonetary advantage index (MAI) was calculated as:
MAI US $ ha�1�
¼ Values of combined intercrops� LER� 1
LER
� �Ghosh 2004ð Þ
ð9Þ
The higher MAI value represents the more profitable treatment combinations inintercropping system (Ghosh 2004).
Data were subjected to analysis of variance (ANOVA) using the SPSS programversion 8 (SPSS 1998). A combined ANOVA over two growing seasons wasperformed for yield and different indices. Bartlett’s test used to check thehomogeneity of variance of each parameter among years indicated that they werehomogenous. The ANOVA was performed using a split-plot design with 18 or 21treatments replicated three times. Treatment mean differences were separated andtested by Fisher’s protected least significant difference (LSD) at a significance level ofp ¼ 0.05. Because the ANOVA indicated no treatment 6 experimental timeinteraction, the values are reported as means of the two growing seasons.
Results and discussion
Effect of weather
In this investigation, the meteorological data depicted in Figure 1 showed markedvariation in weather conditions during the two years of the experiment. Precipitationduring the crop season in 2006–2007 was 119.3 mm higher than during 2005–2006.Consequently, to meet the water requirement of crops, more irrigation was givenduring the first year than the second. Similarly, the average temperature duringFebruary and March, coinciding with the reproductive stages of the componentcrops, remained milder during the second year than the first. This resulted in aslightly better performance of the crops during 2006–2007 than during 2005–2006.
Effect of fertilizer doses
Application of increasing fertilizer doses from 100 to 140% RFD to wheat,accompanied by 100% RFD NPK to mustard, significantly enhanced the partial
1404 A.K. Singh and J.S. Bohra
Dow
nloa
ded
by [
Cen
tral
Agr
icul
tura
l Uni
vers
ity ]
at 2
3:02
20
Febr
uary
201
4

LER of wheat, LERwheat, but did not affect the partial LER of mustard, LERmustard
(Table 1). This could be ascribed to the fact that the increasing levels of fertilizerapplied to the wheat rows enhanced the grain yield (Table 1) mainly due to betteryield-attributing characters of wheat, viz. spikes linear m71, thousand grain weightand grain yield linear m71 (data not reported). However, the yield-attributingcharacters and seed yield of mustard (Table 1) remained comparable at differentfertilizer doses because there was no variation in the fertilizer dose applied tomustard. Moreover, it seems that because wheat is a heavy user of nutrients, themustard failed to utilize the nutrients applied to wheat rows. Furthermore, values ofLERmustard 5 0.5 for various fertilizer doses show that even though mustard is moreaggressive and dominant than wheat, it did not have a negative effect on LERwheat.This was probably due to the compact nature of the mustard genotype ‘Sanjuctaaschesh’, which did not have much of a shading effect on wheat in the 5:1 rowarrangement of wheat þ mustard intercropping. Consequently, at all the fertilizerdoses, wheat registered LERwheat values 4 0.76. Chen et al. (2004) reported similarresults for barley–pea intercropping.
Total LER was also enhanced by increasing fertilizer doses to wheat, however,applications of 120 and 140% RFD to wheat remained comparable, and bothrecorded significantly higher LER than 100% RFD to wheat. This clearly shows a 25and 28% yield advantage for the intercropping system at 120 and 140% RFD,respectively, compared with 17% at 100% RFD to wheat (Srivastava and Bohra2006). It is also evident from the data that a sole culture of wheat or mustard wouldrequire 28% more land to produce an economic yield equal to intercropping with140% RFD to wheat, indicating greater land use efficiency (Agegnehu et al. 2006).The yield advantage due to increasing fertilizer doses is further supported by theproduct of relative crowding coefficients of wheat and mustard ‘K’.
The indices for mustard, viz. the relative crowding coefficient (RCCmustard),aggressivity (Amustard) and actual yield loss (AYLmustard), remained on a parstatistically with respect to fertilizer doses applied to wheat, but their positive andgreater values compared with wheat confirmed the aggressivity, competitiveness anddominance of mustard over wheat in the intercropping system (Bora 1999,Srivastava et al. 2007). It is further noted in Tables 1 and 2 that despite mustardbeing more aggressive and competitive than wheat, the increasing fertilizer dosesapplied to wheat reduced its competitiveness, as well as the yield proportion. Bycontrast, CRwheat and the yield proportion of wheat improved with increasingfertilizer doses and proved effective in enhancing LER at higher rates of fertilizerapplication (Figure 2a).
Increasing fertilizer doses from 100 to 140% RFD significantly enhanced theATER, indicating an improvement in per day productivity of the wheat þ mustard(5:1) intercropping system with every increment in fertilizer dose (Table 1). Here, itwould be pertinent to mention that the difference between 120 and 140% RFD thatremained comparable regarding LER proved significant with respect to ATER. Thisshows the advantage of ATER over LER.
According to Banik et al. (2000), the AYL index gives more precise informationthan other indices about competition between and within the component crops.Negative values of AYLwheat signify the negative effect of the intercrop mustard onwheat, but it is interesting to note that AYLwheat reduced significantly withincreasing fertilizer doses to wheat (Table 2). This could be ascribed to the enhancedcompetitiveness of wheat at higher levels of nutrient application, which also
Archives of Agronomy and Soil Science 1405
Dow
nloa
ded
by [
Cen
tral
Agr
icul
tura
l Uni
vers
ity ]
at 2
3:02
20
Febr
uary
201
4

Table1.
Grain
yield,landequivalentratio(LER),relativecrowdingcoeffi
cientandyield
proportionofwheatþ
compact-m
ustard
intercroppingin
a5:1
row
arrangem
entin
relationto
fertilizer
dosesandseed
ratesofwheatvarieties(m
eandata).
Yield
(kgha7
1)
LER
Relativecrowding
coeffi
cient(k)
Yield
proportion
Treatm
ent
Grain
yield
Seedyield
Wheat
Mustard
LER
ATER
kwheat
kmustard
System
(K)
Wheat
Mustard
Fertilizerdose
(Wheatþ
Mustard)
100%
RFDþ
100%
RFD
3312.0
a690.0
a0.764a
0.409a
1.173a
1.013a
0.716a
3.487a
2.498a
0.651a
0.349ab
120%
RFDþ
100%
RFD
3586.0
b732.5
a0.826b
0.422a
1.248b
1.095b
1.202b
3.681a
4.436b
0.662a
0.338a
140%
RFDþ
100%
RFD
3681.0
b741.0
a0.849c
0.426a
1.275b
1.127c
1.559c
3.707a
5.785b
0.666ab
0.334a
SEM
+42.0
15.0
0.007
0.006
0.009
0.008
0.103
0.089
0.336
0.004
0.004
LSD
(p¼
0.05)
131.0
NS
0.022
NS
0.027
0.024
0.325
NS
1.057
0.012
0.012
Wheatvariety
HD-2824
3710.0
b745.5
a0.854b
0.423a
1.278b
1.155b
1.600b
3.703a
5.939b
0.668b
0.332a
HUW-468
3343.0
a717.0
a0.770a
0.413a
1.183a
1.001a
0.718a
3.546a
2.540a
0.651a
0.349b
SEM
+34.0
12.0
0.006
0.005
0.007
0.006
0.084
0.072
0.274
0.003
0.003
LSD
(p¼
0.05)
107.0
NS
0.018
NS
0.023
0.020
0.265
NS
0.863
0.010
0.010
Seedrate
(kgha71)
100
3361.0
a741.5
a0.774a
0.424a
1.199a
1.044a
0.797a
3.721a
2.959a
0.645a
0.355b
115
3600.0
b728.5
a0.829b
0.420a
1.249b
1.096b
1.404b
3.638a
5.174b
0.663b
0.337a
130
3618.0
b713.0
a0.833b
0.411a
1.244b
1.094b
1.276b
3.516a
4.586b
0.670b
0.330a
SEM
+32.0
15.5
0.006
0.007
0.007
0.006
0.094
0.104
0.680
0.005
0.005
LSD
(p¼
0.05)
92.0
NS
0.019
NS
0.021
0.019
0.277
NS
1.978
0.014
0.014
Sole
vs.intercrop
Sole
HD-2824
4556.0
c–
1.000
–1.000
1.000
1.000
–1.000
Sole
HUW-468
4131.0
b–
1.000
–1.000
1.000
1.000
–1.000
Sole
mustard
–1735.5
b–
1.000
1.000
1.000
–1.000
1.000
Intercropmean
3526.0
a726.0
a0.812
0.418
1.230
1.080
1.159
3.625
4.240
SEM
+16.0
8.5
LSD
(p¼
0.05)
46.0
24.5
Note:Meansare
averaged
over
twogrowingseasons.100%
RFD
towheatis120kgN/60kgP2O
5/60kgK
2O
per
hectare
and100%
RFD
tomustard
is90kgN/40kgP2O
5/
40kgK
2O/30kgSper
hectare.NS,notsignificant.
1406 A.K. Singh and J.S. Bohra
Dow
nloa
ded
by [
Cen
tral
Agr
icul
tura
l Uni
vers
ity ]
at 2
3:02
20
Febr
uary
201
4

Table
2.
Aggressivity
(A),
competitive
ratio
(CR),
actualyield
loss
(AYL),
intercropping
advantage
(IA)and
monetary
advantage
index
of
wheatþ
compact-m
ustard
intercroppingin
5:1
row
arrangem
entin
relationto
fertilizer
dosesandseed
rate
ofwheatvarieties(m
eandata).
ACR
AYL
IA
Monetary
advantage
index
(US
Treatm
ent
AWheat
AMustard
CR
Wheat
CR
Mustard
AYLWheat
AYLMustard
AYL
IAWheat
IAMustard
IA$ha7
1)
Fertilizerdose
(Wheatþ
Mustard)
100%
RFDþ
100%
RFD
71.537a
1.537a
0.376a
2.699ab
70.085a
1.453a
1.368a
719.9
a726.3
a706.4
a190.1
a
120%
RFDþ
100%
RFD
71.539a
1.539a
0.395a
2.570a
70.009b
1.531a
1.522b
72.0
b765.3
a763.3
b275.9
b
140%
RFDþ
100%
RFD
71.527a
1.527a
0.402ab
2.514a
0.017c
1.544a
1.562b
4.1
c772.1
a776.2
b304.0
b
SEM
+0.037
0.037
0.007
0.043
0.008
0.036
0.037
1.94
17.9
18.03
10.3
LSD
(p¼
0.05)
NS
NS
0.021
0.135
0.026
NS
0.116
6.10
NS
56.80
32.5
Wheatvariety
HD-2824
71.515a
1.515a
0.406b
2.491a
0.025b
1.540a
1.565b
5.9
b770.0
a775.9
b274.1
bHUW-468
71.554a
1.554a
0.376a
2.698b
70.076a
1.478a
1.402a
717.8
a739.2
a721.3
a239.2
aSEM
+0.030
0.030
0.005
0.035
0.007
0.029
0.030
1.58
14.6
14.72
8.4
LSD
(p¼
0.05)
NS
NS
0.017
0.111
0.021
NS
0.095
4.98
NS
46.38
26.5
Seedrate
(kgha7
1)
100
71.617a
1.617ab
0.368a
2.762b
70.071b
1.546a
1.475a
716.7
a773.1
a756.4
a219.9
a115
71.523a
1.523a
0.397b
2.545b
70.005a
1.518a
1.513a
71.2
b758.8
a757.7
a277.3
b130
71.464ab
1.464a
0.409b
2.477a
70.001a
1.463a
1.464a
0.0
b731.7
a731.7
a272.8
bSEM
+0.045
0.045
0.008
0.054
0.008
0.026
0.039
1.81
20.5
19.87
4.7
LSD
(p¼
0.05)
0.130
0.130
0.024
0.154
0.022
NS
NS
5.27
NS
NS
13.6
Note:Meansare
averaged
over
twogrowingseasons.100%
RFD
towheatis120kgN/60kgP2O
5/60kgK
2O
per
hectare
and100%
RFD
tomustard
is90kgN/40kgP2O
5/
40kgK
2O/30kgSper
hectare.NS,notsignificant
Archives of Agronomy and Soil Science 1407
Dow
nloa
ded
by [
Cen
tral
Agr
icul
tura
l Uni
vers
ity ]
at 2
3:02
20
Febr
uary
201
4

minimized the intercropping disadvantage of wheat (IAwheat) and ultimately resultedin an intercropping advantage at higher fertility levels, as evident by the highervalues of AYL and IA.
The positive values of MAI reveal a definite economic advantage ofintercropping at all the fertilizer doses compared with sole cropping (Table 2). Itmay further be observed that increasing fertilizer doses applied to wheatcorrespondingly enhanced MAI and, being comparable, 120 and 140% RFDrecorded significantly higher MAI than 100% RFD. The economic benefit of higherdoses of fertilizer application to wheat together with 100% RFD to mustard couldbe attributed to higher values of LER and K (Ghosh 2004, Aasim et al. 2008). These
Figure 2. Effective LER curves for wheat þ compact-mustard intercropping as affected by(a) fertilizer dose of wheat, (b) wheat variety and (c) seed rates of wheat.Note: Yield proportion of wheat ¼ partial LERwheat/LERintercropping system.
1408 A.K. Singh and J.S. Bohra
Dow
nloa
ded
by [
Cen
tral
Agr
icul
tura
l Uni
vers
ity ]
at 2
3:02
20
Febr
uary
201
4

results are further supported by the greater net return at higher doses of fertilizerapplication (data not reported).
Comparing different indices for the response of the component crops and theintercropping system with different doses of fertilizer application, the variations weresignificant in wheat for all indices except aggressivity (Awheat). In mustard, thesignificant effect of the fertilizer doses was observed only for competitive ratio(CRmustard). However, for the system as a whole, the differences among fertilizerdoses were more pronounced with respect to ATER. Therefore, ATER and CRappear to be good indices for such comparisons. Effective LER curve based on LERand yield proportionate of component crops also appears a good index as it clearlydemonstrates the contribution of yield proportionate of component crops to theLER of the system.
Effect of wheat varieties
Of the two wheat varieties used in the wheat þ compact-mustard (5:1) intercrop-ping, HD-2824 exhibited distinct superiority over HUW-468 with respect to thepartial LER of wheat (Table 1). This seems to be mainly due to its better yield-attributing characters, viz. spikes linear m71, 1000 grain weight and grain yieldlinear m71 (data not reported), which were the result of enhanced competitiveness(CRwheat) and relative dominance over mustard (RCCwheat) compared with HUW-468. However, the two wheat varieties failed to influence the LERmustard orRCCmustard, indicating that despite of being more competitive and dominant thanHUW-468, HD-2824 did not affect the partial LER of mustard adversely although itsignificantly reduced CRmustard and the yield proportion of mustard. The total LERwith respect to intercropping of compact mustard variety Sanjukta Aschesh inassociation with wheat variety HD-2824 was markedly higher than HUW-468. Thiswas obviously due to the marked difference in partial LER of the wheat varieties andindicates that the production efficiency of the intercropping system in associationwith wheat variety HD-2824 was 10% higher than with the other variety. The valuesof ATER further indicate that the per day productivity of the intercropping systemwas noticably higher with wheat variety HD-2824 than with HUW-468.
The product of the relative crowding coefficients of wheat and mustard ‘K’ alsoshows the yield advantage of the system with wheat variety HD-2824 rather thanHUW-468. The effective LER curves (Figure 2b) indicate that the productionefficiency of the wheat þ mustard (5:1) intercropping system with wheat variety HD-2824 was higher than with wheat variety HUW-468. This could be attributed mainlyto the significantly higher yield of the former compared with the latter.
AYLwheat with respect to the two wheat varieties followed the same trend asLERwheat, RCCwheat and CRwheat, but the difference was too great. This could beascribed to the fact that HD-2824 had 44.4% higher test weight than HUW-468(data not reported). Therefore, at a given seed rate, the former accommodated30.7% fewer plants per unit area than the latter. However, growing more vigorously,HD-2824 produced significantly greater values for spikes linear m71, 1000 grainweight and grain yield linear m71 than HUW-468 (data not reported). Moreover,there was a difference of 12 days in the maturity of the two wheat varieties; the gapsbetween the harvesting of intercrop mustard and the two wheat varieties HD-2824and HUW-468 were 29 and 17 days, respectively. This might have exerted morecompetition for the intercrop mustard with wheat variety HUW-468, particularly
Archives of Agronomy and Soil Science 1409
Dow
nloa
ded
by [
Cen
tral
Agr
icul
tura
l Uni
vers
ity ]
at 2
3:02
20
Febr
uary
201
4

during its reproductive phase. Consequently, in wheat þ mustard intercropping,HD-2824 recorded a 2.5% gain in wheat yield, whereas HUW-468 suffered a loss of7.6%, as evident by the values of AYLwheat.
However, because mustard is highly aggressive and competitive, AYLmustard didnot differ much due to the two wheat varieties, and to some extent compensated forthe actual yield loss of wheat variety HUW-468, leading to positive values of AYLfor wheat þ mustard intercropping. Nevertheless, due to its better competitiveness,HD-2824 registered significantly higher yield advantage in terms of AYL comparedwith HUW-468.
The two wheat varieties can be assessed for their economic viability using theintercropping advantage (IA). The positive values of partial intercropping advantagefor wheat variety HD-2824 indicated that intercropping had economic advantage,but with wheat variety HUW-468, the negative values indicate a disadvantage. Theseresults were similar to those obtained for AYL. The positive values of total IA forboth wheat varieties indicated an intercropping advantage. It can be further notedthat although the intercropping disadvantage of HUW-468 was compensated for bymustard, due to its stable production and better market price, the IA of the system inassociation with wheat variety HD-2824 was significantly higher than with HUW-468. This ultimately resulted in a significantly higher MAI for wheat þ mustard (5:1)intercropping in association with wheat variety HD-2824 than with wheat varietyHUW-468.
Effect of seed rates
Aggressivity (A) values presented in Table 2 show that although wheat wasdominated by the aggressive intercrop mustard, increasing the seed rates of wheatfrom 100 to 130 kg ha71 enhanced the aggressivity of wheat and the differencesbetween the lowest and highest seed rates were significant; this led to a correspondingdecline in the aggressivity of mustard. The improved aggressivity of wheat withincreasing seed rates enhanced the competitive ability of wheat (CRwheat) against thedominant intercrop mustard (Table 2).
The enhanced aggressivity and competitiveness of wheat with increasing seedrates resulted in a marked improvement in the LERwheat (Table 1) which was aconsequence of enhanced maturity characters, viz. spikes linear m71 and grain yieldlinear m71 (data not reported). The LER, which is the sum of partial LER values ofthe component crops, was highest (1.249) at the 115 kg ha71 seed rate, closelyfollowed by 130 kg seed ha71 (1.244), however both proved significantly superior to100 kg seed ha71 (1.199). As evident by the values of ATER, the per day yield of theintercropping system was also highest at 115 kg seed ha71, closely followed by130 kg seed ha71, and both proved significantly superior to the 100 kg ha71 seedrate. This shows that the production efficiency of the wheat þ compact-mustardintercropping in the 5:1 row arrangement was maximum with the 115 kg ha71 seedrate of wheat and the normal density of mustard. These results are further supportedby values of relative crowding coefficient (kwheat and kmustard). The product of therelative crowding coefficient of wheat and mustard, i.e. ‘K’ also indicated themaximum yield advantage at 115 kg ha71 seed rate of wheat followed by 130 and100 kg ha71 seed rate, respectively. The data on yield proportion of wheat andmustard (Table 1) and effective LER curves (Figure 2) further revealed that thehigher LERs at 115 and 130 kg ha71 seed rate of wheat were mainly due to their
1410 A.K. Singh and J.S. Bohra
Dow
nloa
ded
by [
Cen
tral
Agr
icul
tura
l Uni
vers
ity ]
at 2
3:02
20
Febr
uary
201
4

significantly greater yield proportion of wheat compared with the lowest seed rate(100 kg ha71).
AYL assesses the component crops in an intercropping system on the basis of thesown proportion of intercrops with respect to their sole stand. The data presented inTable 2 show that increasing wheat seed rates reduced the yield loss of wheat(AYLwheat) and being comparable among themselves, 115 and 130 kg ha71 seed ratesproved significantly superior to the 100 kg ha71 seed rate in reducing the yield loss ofwheat (Banik et al. 2000). However, although all the seed rates of wheat show yieldadvantage for mustard as well as the system, the differences among seed rates were notsignificant, indicating that the reduced yield loss of wheat at higher seeding ratescould not be reflected in the AYL of the system, whereas the differences in seed rateswere clear with respect to LER and ATER. Because intercropping advantage (IA) isbased on AYL, the IAwheat, IAmustard and IA values were also in agreement withAYL. Consequently, the IA of wheat at 115 and 130 kg ha71 seed rates remained on apar and proved significantly better than the 100 kg ha71 seed rate. However, thedifferent seed rates failed to exert marked variation in IAmustard and IA.
The MAI, which is used to assess the monetary advantage of intercroppingsystems, is based on LER and not the AYL as in IA. The positive values of MAI atall the seed rates of wheat indicate definite monetary advantage (Table 1). Like LERand K, the maximum MAI was noticed at the 115 kg ha71 seed rate, closelyfollowed by 130 kg ha71, and both proved significantly superiority over 100 kgha71. This shows that MAI is a better index for assessing monetary advantage inintercropping system than IA.
Sole vs intercropping
Both wheat varieties and the mustard in their sole stand recorded significantly highereconomic yield than their respective intercrop mean (Table 1). This could beattributed to the differences in actual sown area under intercropping and purecropping, as well as the fewer disturbances in the habitat and the homogenousenvironment of sole cropping (Banik et al. 2006).
Conclusion
This study of the reciprocity functions of wheat þ mustard intercropping in a 5:1row proportion showed definite advantage of intercropping in relation to fertilizerdoses and seed rates of wheat varieties. It was concluded that wheat variety HD-2824at 115 kg ha71 seed rate and 140% RFD may be intercropped with compactmustard variety ‘Sanjukta Aschesh’ at 100% RFD in 5:1 row proportions to achievethe best land utilization, maximum productivity and monetary advantage under theirrigated conditions of north India. Among the various reciprocity functions, ATER,CR and effective LER curves were found to be good, but for comparing themonetary advantage, MAI, which is based on LER, proved the better index than IAthat depends on AYL.
Acknowledgements
The authors are grateful to Prof. S.R. Singh, Director, Institute of Agricultural Sciences forproviding the facilities pertaining to the experiment and to Prof. H.C. Sharma for his valuablesuggestions and critical review of the manuscript.
Archives of Agronomy and Soil Science 1411
Dow
nloa
ded
by [
Cen
tral
Agr
icul
tura
l Uni
vers
ity ]
at 2
3:02
20
Febr
uary
201
4

References
Aasim M, Umer EM, Karim A. 2008. Yield and competition indices of intercropping cotton(Gossypium hirsutum) using different planting patterns. Tar Bili Der. 14(4):326–333.
Agegnehu G, Ghizwah A, Sinebo W. 2006. Yield performance and land use effeiciency ofbarley and faba bean mixed cropping in Ethiopian highlands. Eur J Agron. 25:202–207.
Banik P, Midya A, Sarkar BK, Ghose SS. 2006. Wheat and chickpea intercropping systems inadditive series experiment: advantageous and weed smothering. Eur J Agron. 24:325–332.
Banik P, Sasmal T, Ghosal PK, Bagchi DK. 2000. Evaluation of mustard (Brassica campestrisvar. Toria) and legume intercropping under 1:1 and 2:1 row-replacement series systems. JAgron Crop Sci. 185:9–14.
Bora PC. 1999. Competition studies in intercropping of wheat (Triticum aestivum), rapeseed(Brassica campestris) and pea (Pisum sativum). Ind J Agron. 44(3):509–513.
Caballero R, Goicoechea EL, Herniaz PJ. 1995. Forrage yield and quality of cotton vetch andoat sown at varying seed ratios and seeding rates of common vetch. Field Crops Res.41:135–140.
Chen C, Westcott M, Neill K, Wichman D, Knox M. 2004. Row configuration and nitrogenapplication for barley–pea intercropping in Montana. Agron J. 96:1730–1738.
De Wit CT. 1960. On competition. Verslag Landbouw-Kundige Onderzoek. 66:1–28.Ghosh PK. 2004. Growth, yield, competition and economics of groundnut/cereal fodder
intercropping systems in the semi-arid tropics of India. Field Crop Res. 88:227–237.Hiebsch CK, McCollum RE. 1987. Area–time equivalency ratio: a method for evaluating the
productivity of intercrops. Agron J. 79:15–22.Mandal BK, Saha A, Kundu TK, Ghorai AK. 1991. Wheat based intercropping and the
effects of irrigation and mulch on growth and yield. Ind J Agron. 36:23–29.McGilchrist CA. 1965. Analysis of competition experiments. Biometrics. 21:975–985.Mead R, Willey RW. 1980. The concept of a land equivalent ratio and advantages in yields for
intercropping. Exp Agr. 16:217–228.Singh RV, Gupta PC. 1993. Aggressivity, competitive ratio and relative crowding coefficient of
wheat (Triticum aestivum) and Indian mustard (Brassica juncea) in mixed andintercropping systems. Ind J Agr Sci. 63:1–3.
Sinha AK, Nathan AK, Singh AK. 1985. Radiation climate and water use studies inintercropping systems. J Nucl Agr Biol. 14:64–69.
Snaydon RW, Harris PM. 1979. Interactions below ground. The use of nutrients and water. InProceedings of the International Workshop on Intercropping; January 10–13. Hyderabad(India): ICRISAT. p. 188–201.
SPSS. 1998. SPSS base 8.0 user’s guide and SPSS applications guide. Chicago (IL): SPSS.Srivastava RK, Bohra JS. 2006. Performance of wheat (Triticum aestivum) þ Indian mustard
(Brassica juncea) intercropping in relation to row ratio, Indian mustard variety andfertility levels. Ind J Agron. 51(2):107–111.
Srivastava RK, Bohra JS, Singh RK. 2007. Yield advantage and reciprocity functions ofwheat (Triticum aestivum) þ Indian mustard (Brassica juncea) intercropping undervarying row ratio, variety and fertility level. Ind J Agr Sci. 77(3):139–144.
Stigter CJ, Baldy Ch. 1995. Manipulation of the microclimate by intercropping: making thebest of services rendered. In: Sinoquet H, Cruz P, editors. Ecophysiology of tropicalintercropping. Paris (France): INRA. p. 29–44.
Tsubo M, Mukhala E, Ogindo HO and Walker S. 2003. Productivity of maize–beanintercropping in a semi-arid region of South Africa. Water SA. 29:381–388.
Willey RW. 1979. Intercropping – its importance and research needs. 1. Competition and yieldadvantages. Field Crop Abstr. 32:73–85.
Willey RW. 1985. Evaluation and presentation of intercropping advantages. Exp Agr. 21:119–133.
Willey RW, Rao MR. 1980. A competitive ratio for quantifying competition betweenintercrops. Exp Agr. 16:117–125.
Yang CH, Chai Q, Huang GB. 2010. Root distribution and yield responses of wheat/maizeintercropping to alternate irrigation in the arid areas of northwest China. Plant SoilEnviron. 56(6):253–262.
1412 A.K. Singh and J.S. Bohra
Dow
nloa
ded
by [
Cen
tral
Agr
icul
tura
l Uni
vers
ity ]
at 2
3:02
20
Febr
uary
201
4