Occurrence of C3 and C4 Photosynthetic Pathways in North ...
Upload
independentCategory
view
4download
0
Pores;~~iogy
Management ELSEVIER Forest Ecology and Management 83 (19%) 171-180
Influence of direction and distance from trees on wheat yield and photosynthetic photon flux density ( Qp) in a Paulownia and
wheat intercropping system
Charles P. Chirko a, Michael A. Gold b3*, Phu.V. Nguyen b, J.P. Jiang ’ a Zhe Jiang Forestry College, Hand Zhou, Zhe Jiang Province, 311300, PR China
b Department of Forestry, Michigan State University, E. Lnnsing, MI 48824-1222, USA ’ Henan Agricultural University, Zhengzhou City, Henan Province, 450002, PR China
Accepted 8 January 1996
Abstract
A Poulowniu-winter wheat intercropping experiment with the object of quantifying photosynthetically active radiation (PAR) and its effect on wheat yield was conducted 60 km south of Zhengzhou (3S’N 113%), Henan Province, PR China, from September 1991 to July 1992 using a tree and crop interface approach. The middle row of three 240 m long rows of 1 l-year-old trees was studied for its effects on tire yield of irrigated and fertilized winter wheat. Photosynthetic photon flux density (Q,) was quantified using a split-plot design with four blocks. There were four distance (subplot) treatments (2.5 m, 5 m, 10 m and 20 m) and two direction (main plot) treatments laid out to the east and west of a north-south tree line. Results showed no difference in direction effects but Qp did affect total grain weight (P = 0.0047) between 2.5 m and 20 m. A regression equation was fit using the mean for each distance treatment: Y - 391.7 + 4.57X with r* = 0.9310 indicating a yield increase of 4.57 g m-* (45.7 kg ha-‘) over a distance of 2.5 m to 20 m from the trees.
Keywords: Agroforestry; Wheat yield; Tree and crop interface; China
1. Introduction Many of the basic relationships in this biological
The Chinese people have long realized the impor- tree and crop system are now under investigation
tance of incorporating multipurpose trees into their (Zhu et al., 1986; Jiang, 1990). This paper reports on
agricultural landscape. The Paulownia tree, native to the effects of varying levels of photosynthetic photon
China, and wheat, China’s leading staple crop, are flux density (Q,) on wheat yield components and
commonly intercropped. Phenologically, Paulowniu wheat yield.
is suitable for intercropping with wheat as tree leaves Shading generally decreases crop yields by reduc-
emerge late in the wheat cycle resulting in minimal in8 Qp and correspondingly, crop photosynthesis
shading. (Monte& 1972). Leaves of many C3 species satu- rate at moderate Qp but when the entire canopy is considered, growth of crops is generally linearly
* Corresponding author. Tel.: 517 353 4751; fax: 517 432 1143; related to Qp absorbed (Monteith and Unsworth, e-mail: [email protected]. 1990). With cloudless days Qp from direct radiation
0378- 1127/%/$15.00 Copyright 0 1996 Elsevier Science B.V. All rights reserved. PII SO378-1127(96)03721-8
172 C.P. Chirko et d/Forest Ecology and Management 83 (19961171-180
is much greater than diffuse and diffuse radiation can be neglected (Ross, 1975). On very cloudy days all Q, comes from diffuse radiation. Thus, the addi- tional amount of Qp intercepted by a tree canopy can become important to the understory crop canopy. The study of light transmission through the canopy in agroforestry must consider extant discontinuous canopy conditions. With trees arranged so that the canopy cover is not continuous, light reaching the crop is composed of two parts, full sunlight and light transmitted and filtered through the canopy (Jackson and Palmer, 1989).
Studies testing effects of shading on wheat gener- ally do not apply shading at specific times of the day (as occurs under trees in the field), but rather at certain times of the development cycle at whole-day intervals (Willey and Holliday, 1971; Fischer, 1975).
This study focussed on the tree and crop interface in a Paufownia and wheat intercropping system. Within the interface, the objective was to isolate and determine the impact of tree canopy on Q,, micro- climate, wheat yield components and final yield. Experiments were designed to examine the effects of Q, on wheat yield at 2.5 m, 5 m, 10 m and 20 m distances from a tree line in a Paulowniu and wheat intercropping system. Microclimate variables were monitored to determine the extent of influence on wheat yield (Chirko, 1993).
To prevent competition for nutrients and water, below-ground root barriers were placed between the tree and the measured yield plots and results indi- cated that Paulownia was compatible with wheat (Chirko, 1993).
This paper addresses two specific questions: (1) How much will wheat yield, at different distances from a tree line in the Paulownia and wheat inter- cropping system, be affected by variations in total daily Qp as a function of distance from the tree canopy?; and (21 Is wheat yield affected by east-west positioning, relative to a Paulownia north-south tree line?
2. Materials and methods
The research was conducted on-farm, on the tem- perate North China Plain, in collaboration with the research staff of HAU’s Puufownia research institute
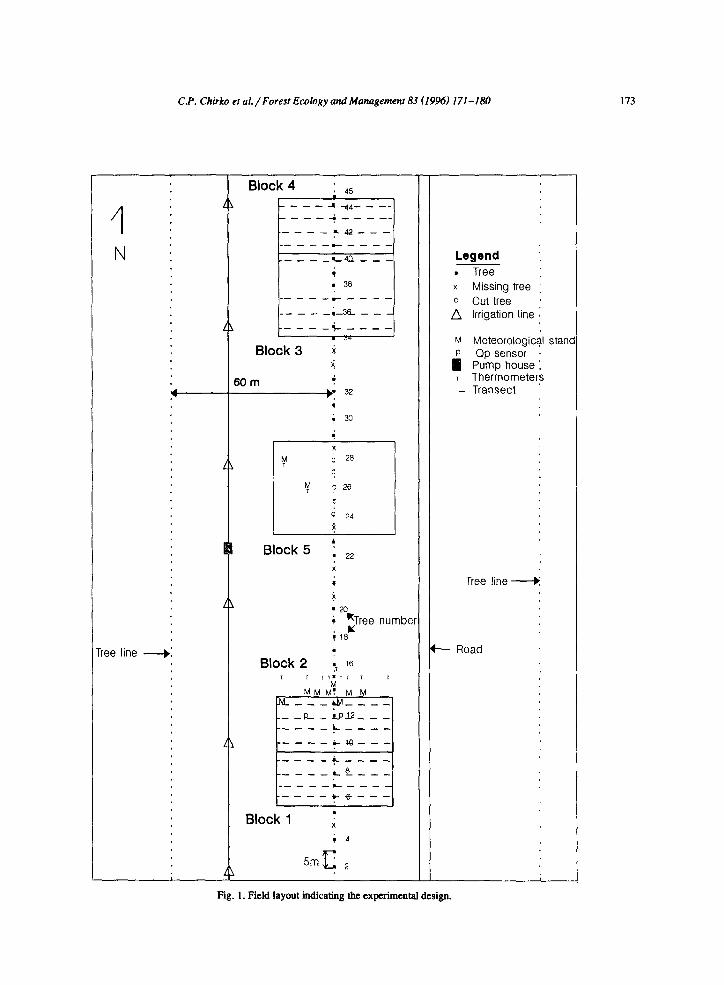
located in Zhengzhou, Henan Province, PR China (35” North latitude, 113” East longitude). Experimen- tal fields were located adjacent to the village of Shu Zhuang Cun, approximately 62 km south of Zhengzhou, Henan Provence. A large field south of the village gardens contained three north-south rows, each 240 m long, of 1 l-year-old Paulownia trees (Fig. 1). The middle row contained the trees to be studied and the other two rows were guard rows. Yield plots were situated to the east and west of this tree line out to 20 m. The trees were spaced at 5 m (between trees> and 60 m to 70 m either side of the center row. An irrigation system was used. In order to control the flow of water into a section, embank- ments were prepared using shovels and hoes to mound the soil and restrict the water to specific field areas (Fig. 1). Control plots were situated within the middle tree row forming a 40 m gap of ‘cut trees’ removed at the start of the research.
2.1. Experimentat design
A split-plot experiment was laid out in a random- ized complete block design with four blocks (Fig. 11. Within a block, four trees of similar size (height and crown diameter) were selected to insure uniform shading effects. The main plot treatments (the direc- tions east and west) were not randomly chosen due to the fixed nature of their positions. Within each block four subplot treatments (distances) were ran- domly assigned to both the east and west sides of the tree line at 2.5 m, 5 m, 10 m and 20 m. Wheat yield plots were randomly located on transects perpendicu- lar to the north-south tree line at each selected tree. Each yield plot consisted of three samples (quadrats) 1 m long and 3 rows wide (0.6 m’). A plastic sheet, placed 2 m wide to a 1 m depth, was used as a barrier to separate the Paulownicz roots from the wheat roots to eliminate competition for nutrients and water.
Five trees were cut (#24-#28) to establish a control yield plot for determining yield under sole crop conditions. Control plots were randomly located at 2.5 m East (2.5 El and 20 m West (20 W> on transects where trees had been cut. The standard crop rotation, used prior to tree establishment in 1981 and continuing to the present, was fall sown wheat fol- lowed by sequential cropping of intercropped corn
C.P. Chirko et al. / Forest Ecology and Management 83 (19%) 171-l 80 173
1 N :
:-
‘ee line -1
Block 4 : 45
---A-----
----------
Block 3 i i
60 m 2 32
1
i 30
;
Block 5 : 22 x
‘20 ) =Tree numbe
Y i 18
----i----
is-----
------F---
Block 1 ; 9 4
Legend 1 - Tree : x Missing tree : c Cut tree -
n irrigation line :
M Meteorological stanc
T Thermometers - Transect :
Tree line __f
- Road
Fig. 1. Field layout indicating the experimental design.
174 C.P. Chirko et d/Forest Ecology and Managemenli33 (1996) /71-180
(Zea muys) and soy beans (Glycine max) planted in the summer. To ensure standardization a tractor and a mechanical planter were used and only one cultivar was sown.
2.2. Equipment
Two LI-COR ES 220 quantum sensors, placed in the field at 2.5 E and 10 W, from sunrise to sunset each day, were used to measure Qp just above the wheat plant. The unshaded (by trees) quantum sensor was dedicated as a control (Fig. 1). Sensors continu- ously recorded Qp in millivolts (later converted to pm01 rnM2 s- ‘), between 11 March 1992 and 4 June 1992 at specified time intervals.
Once a week the sensors were set at reading and recording intervals of 1 min in order to obtain a continuous record of Qp readings under open sun and Q, affected by a moving region of tree shade. Sensors were repositioned so that one sensor was in the sun as a control and the other was at one of the nine positions (from 20 W to 20 E) shaded by the tree. The sensors were connected by a cable to a two channel data logger which used a data storage mod- ule and continuously recorded the Q, readings.
Measurements taken from planting until after har- vest in June 1992 included: 1) Q,; 2) soil moisture; 3) wind and precipitation data from Chang Ge County; 4) soil chemical properties; 5) yield harvest for total grain weight (TGW) and IOOO-grain weight (lOOO-GW). Wheat and Paulowniu phenological de- velopment were noted by visual inspection.
The soils at O-25 cm depth were silt loam, and at 25-50 cm silty clay loam (Wei, 1979), with the C horizon estimated at 20 m. The research fields were
fertilized to meet crop requirements based on previ- ous experience in Puuluwniu and wheat intercrop- ping systems (J.P. Jiang, personal communication). Periodic soil cores were taken in the top 20 cm with a soil auger. All eight yield plot positions (20 E, 10 E, 5 E, 2.5 E, 2.5 W, 5 W, 10 W, and 20 W) and the tree line were sampled by block. Control areas were also sampled. Soil samples were weighed at the site then oven dried at 100°C for about 68 h and reweighed again to determine percent soil moisture. Analyses included pH, soil organic matter. and avail- able nitrogen (N) and phosphorus (P).
Meteorological stands contained a dry bulb ther- mometer to measure air temperature and two addi- tional thermometers to record daily high and low temperatures were placed in the field at 10 E, 5 E, 2. 5 E, the tree line, 5 W and 20 W (Fig. 1). This ensured instrumentation at the tree crown border (5 E and 5 W). under the trees (tree line), and away from the trees (10 E and 20 WXFig. 1). Thermome- ters were read daily at 1 m above ground, from 28 October 1991 through to 4 June 1992 at 08:OO h, 14:OO h, and 20:00 h. Daily precipitation was ob- tained at the county weather bureau located in Chang Ge County 12 km south of the research site.
Due to unusually dry weather, irrigation took place on 16 October (Julian date 91289), in mid- February (92045-92048) and late April (9211 S- 92119). The tree and control areas were soaked, section by section.
Harvest began on 2 June 1992. Measurements were made for grain weight rnd2 and X000-grain weight. Results from all tables, figures and discus- sion have data adjusted from yield per 0.6 rn’ (a quadrat) to yield 1 per m2.
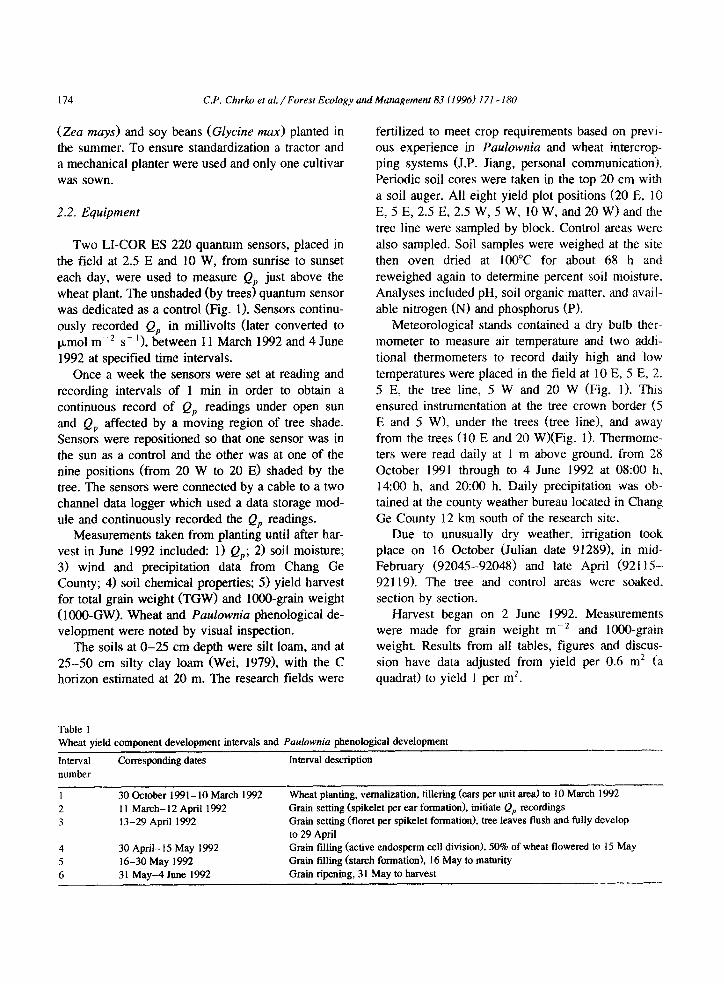
Table 1 Wheat yield component development intervals and Paulowniu phenological development
Interval Corresponding dates Interval description number
1 30 October 1991-10 March 1992 2 11 March-12 April 1992 3 13-29 April 1992
Wheat planting, vernalization, tillering (ears per unit area) to 10 March I992 Gram setting (spikelet per ear formation), initiate Q,, recordings Grain setting (floret per spikelet formation), tree leaves flush and fully develop to 29 April
4 30 April- 15 May 1992 Gram filling (active endosperm cell division), 50% of wheat flowered to 15 May 5 16-30 May 1992 Grain tilling (starch formation), 16 May to maturity 6 31 May-4 June 1992 Grain ripening, 3 1 May to harvest

C.P. Chirko et al. / Forest Ecology and Management 83 (1996) 171-l 80 175
A total of six growth intervals were established for this experiment in order to correlate QP with wheat yield component development and total wheat yield. Intervals coincide with tree and wheat pheno- logical stages (Table 1).
3. Results
3.1. Direction and distance effects
There was no direction by distance interaction for TGW (P = 0.4952) or lOOO-GW (P = 0.5840). No difference was found in direction either for TGW (P = 0.3206) or lOOO-GW (P = 0.7153). There was a highly significant increase in yield with distance from the tree line for total grain weight (P = 0.0047).
Fig. 2 illustrates the mean total grain weight by distance from the tree line. The fitted equation using the four treatment means was:
Y = 391.74 + 4.57x
with r2 = 0.9310 indicating an increase of 4.57 g rnd2 (45.7 kg ha-’ ) for each meter as the distance from the trees increased over a range of 2.5 m to 20 m. Using orthogonal coefficients a linear relationship (P = 0.0006) accounted for 93% of the variance. The lOOO-GW distance treatments (means tabulated in Table 2) were not significant (P = 0.3 180) (Table 2). Neither TGW (P = 0.0652) or the lOOO-GW (P = 0.0893) showed a significant difference be- tween 2.5 E and 20 W in the control area.
Total Grain Weight (glm2)
5oa lr-
47a
Y = 391.74 + 4.57x
r2 = 0.931
41a
380
35c J
25m 5m 10m 20m
Distance from Tree Line
Fig. 2. Wheat yield (Total Grain Weight) vs. distance from tree line.
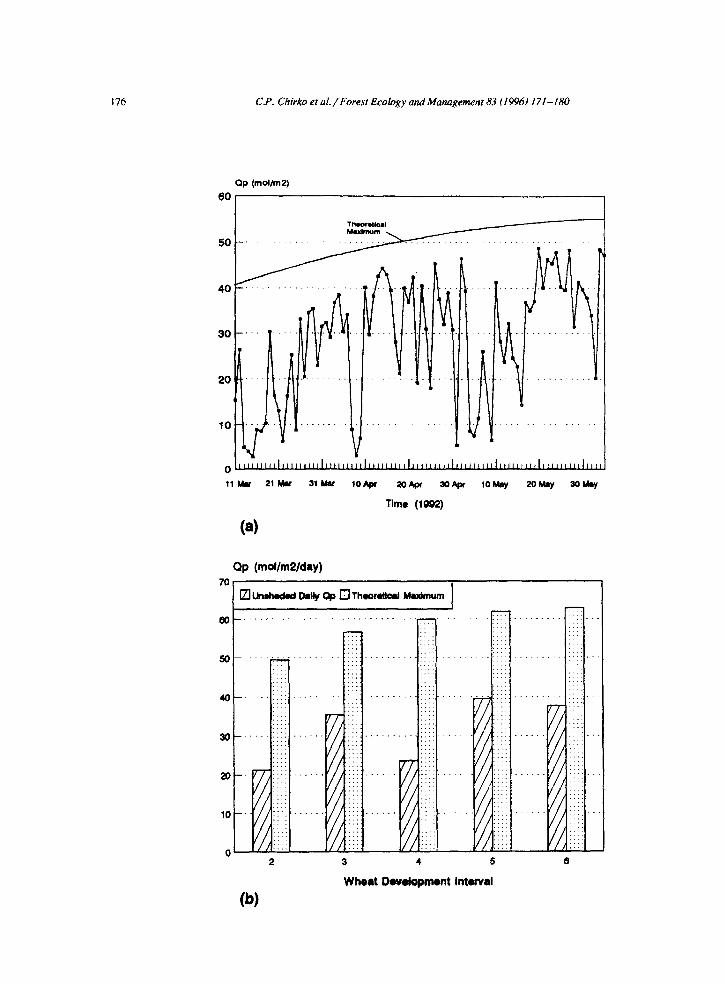
3.2. Photosynthetic photon jlux density (Qp )
Fig. 3(a) shows average daily theoretical maxi- mum along with average daily unshaded QP (mol rnd2 day-‘). Theoretical maximum was supplied by a computer program showing total irradiance for
Table 2 Means and standard error of total grain weight, NO-grain weight
Block and treatment
Rl-4 RI-4,20 m RI-4, 10 m Rl-4.5 m Rl-4,2.5 m Control Control 20 W Control 2.5 E
Total grain weight
Mean(gm-*)
424 478 449 419 393 497 511 484
SE.
7.3 11.4 12.2 14.0 15.1 15.8 26.4 20.0
IOOO-grain weight
&an (8)
32.1 33.6 33.1 31.7 30.9 34.9 35.7 34.2
S.E.
0.43 0.87 1.12 1.03 0.93 0.98 1.17 1.60
R l-4, Replications 1-4.
176 C.P. Chirko et al. / Forest Ecology ad Management 83 (1996) 171- I80
Qp (moVm2)
11 Mu 21 Mu 31 Mu fOApr 2QApr -Ap low 2ow =lky
Time (1992)
(a)
Qp (mdlmllday)
:: :: : :
:: :: :: :: :: :: ::
4 5 6
W
Wheat Dwelapmont Interval
C.P. Chirko et al./ Forest Ecology and Management 83 (1996) 171-180 177
100% sunshine at 34” latitude converted to approxi- mate Qp (mol m-’ day-‘) using conversions from the LI-COR manual (Biggs, 1982). The number of grains per ear are determined in Intervals 2 and 3 (before anthesis) and Intervals 4 and 5 reflect grain filling (kernel development). Fig. 3(a) differentiates unshaded and theoretical maximum Qp by day show- ing atypical cloudy spring to early summer weather in 1992, while Fig. 3(b) reflects the difference by interval (Table 1). The days from the start of anthesis 27 April through 9 May were important for en- dosperm production. Extremely low Qp values oc- curred during this time and at the start of starch production in the ensuing 7 days.
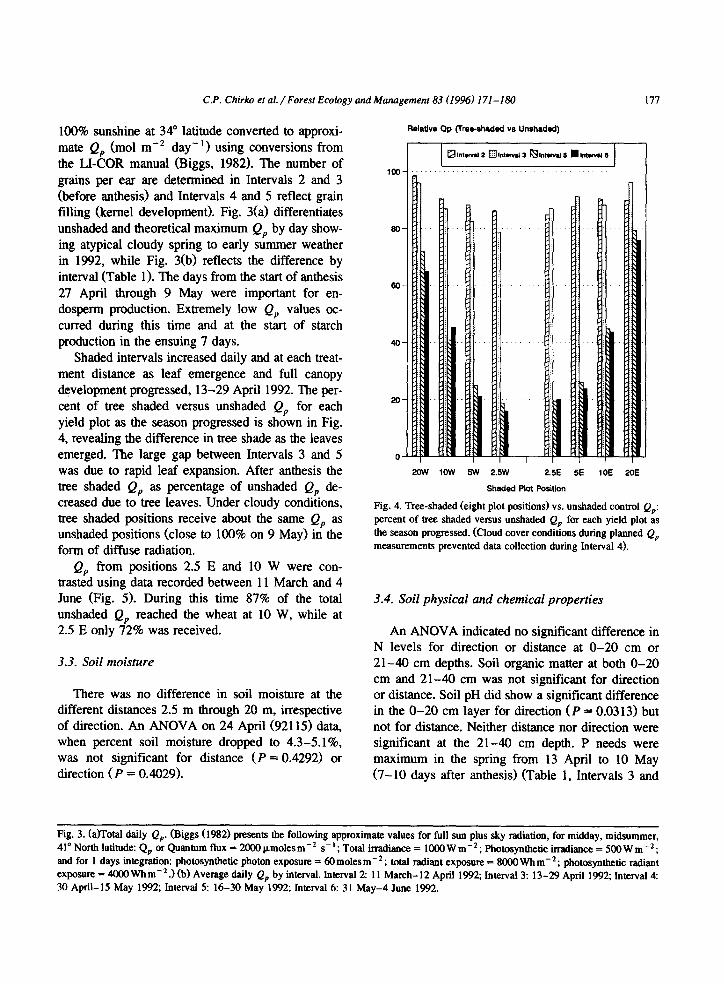
Shaded intervals increased daily and at each treat- ment distance as leaf emergence and full canopy development progressed, 13-29 April 1992. The per- cent of tree shaded versus unshaded Qp for each yield plot as the season progressed is shown in Fig. 4, revealing the difference in tree shade as the leaves emerged. The large gap between Intervals 3 and 5 was due to rapid leaf expansion. After anthesis the tree shaded Qp as percentage of unshaded Qp de- creased due to tree leaves. Under cloudy conditions, tree shaded positions receive about the same Q, as unshaded positions (close to 100% on 9 May) in the form of diffuse radiation.
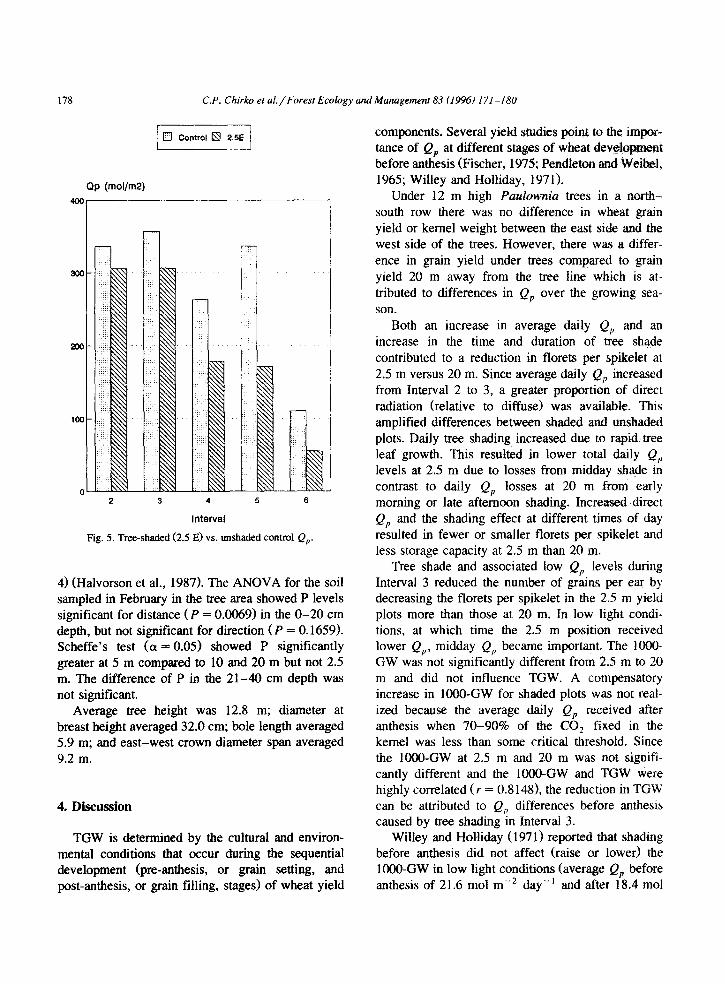
Qp from positions 2.5 E and 10 W were con- trasted using data recorded between 11 March and 4 June (Fig. 5). During this time 87% of the total unshaded Qp reached the wheat at 10 W, while at 2.5 E only 72% was received.
3.3. Soil moisture
There was no difference in soil moisture at the different distances 2.5 m through 20 m, irrespective of direction. An ANOVA on 24 April (92115) data, when percent soil moisture dropped to 4.3-5.1%, was not significant for distance (P = 0.4292) or direction (P = 0.4029).
loo
a0
60
40
20
0
relative Qp (Tree-shaded YS Unshaded)
20W 1OW !3W 2.5W 2.5E 5E 10E 20E
Shaded Plot Position
Fig. 4. Tree-shaded (eight plot positions) vs. unshaded control Q,: percent of tree shaded versus unshaded Qp for each yield plot as the season progressed. (Cloud cover conditions during planned Q, measurements prevented dam collection during Interval 4).
3.4. Soil physical and chemical properties
An ANOVA indicated no significant difference in N levels for direction or distance at O-20 cm or 21-40 cm depths. Soil organic matter at both O-20 cm and 21-40 cm was not significant for direction or distance. Soil pH did show a significant difference in the O-20 cm layer for direction (P = 0.03 13) but not for distance. Neither distance nor direction were significant at the 21-40 cm depth. P needs were maximum in the spring from 13 April to 10 May (7-10 days after anthesis) (Table 1, Intervals 3 and
Fig. 3. (a)Total daily Q,,. (Biggs (1982) presents the following approximate values for full sun plus sky radiation, for midday, midsummer, 41” Norm latitude: Q, or Quantum flux = 2000 pmoles m- * s- ’ ; Total irradiance = 1000 W m-* ; Photosynthetic irradiance = 500 W m-* ; and for I days integration: photosynthetic photon exposure = 60 moles m- * ; total radiant exposure = 8OOOWh m-* ; photosynthetic radiant exposure = 4OOOWhm-*.I (b) Average daily Qp by interval. Interval 2: 11 March-12 April 1992, Interval 3: 13-29 April 1992; Interval 4: 30 April-15 May 1992; Interval 5: 16-30 May 1992; Interval 6: 31 May-4 June 1992.
178 C.P. Chirko et d/Forest Ecology und Management 83 (1996) 171-180
[3 Control 69 2.5E
Qp (moVm2)
4M)J
2 3 4 5 6
Fig. 5. Tree-shaded (2.5 E) vs. unshaded control Qp.
4) (Halvorson et al., 1987). The ANOVA for the soil sampled in February in the tree area showed P levels significant for distance (P = 0.0069) in the O-20 cm depth, but not significant for direction (P = 0.1659). Scheffe’s test (a = 0.05) showed P significantly greater at 5 m compared to 10 and 20 m but not 2.5 m. The difference of P in the 21-40 cm depth was not significant.
Average tree height was 12.8 m; diameter at breast height averaged 32.0 cm; bole length averaged 5.9 m; and east-west crown diameter span averaged 9.2 m.
4. Discussion
TGW is determined by the cultural and environ- mental conditions that occur during the sequential development (pre-anthesis, or grain setting, and post-anthesis, or grain filling, stages) of wheat yield
components. Several yield studies point to the impor- tance of Qp at different stages of wheat development before anthesis (Fischer, 1975; Pendleton and -Weibel, 1965; Willey and Holliday, 1971).
Under 12 m high Puufownia trees in a north- south row there was no difference in wheat grain yield or kernel weight between the east side and the west side of the trees. However, there was a differ- ence in grain yield under trees compared to grain yield 20 m away from the tree line which is at- tributed to differences in Q, over the growing sea- son.
Both an increase in average daily Q,, and an increase in the time and duration of tree shade contributed to a reduction in florets per spikelet at 2.5 m versus 20 m. Since average daily Q,, increased from Interval 2 to 3, a greater proportion of direct radiation (relative to diffuse) was available. This amplified differences between shaded and unshaded plots. Daily tree shading increased due to rapid tree leaf growth. This resulted in lower total daily Qp levels at 2.5 m due to losses from midday shade in contrast to daily Qp losses at 20 m from early morning or late afternoon shading. Increased direct Qp and the shading effect at different times of day resulted in fewer or smaller florets per spikelet and less storage capacity at 2.5 m than 20 m.
Tree shade and associated low Qp levels during Interval 3 reduced the number of grains per ear by decreasing the florets per spikelet in the 2.5 m yield plots more than those at 20 m. In low light condi- tions, at which time the 2.5 m position received lower Q,, midday Qp became important. The lOOO- GW was not significantly different from 2.5 m to 20 m and did not influence TGW. A compensatory increase in lOOO-GW for shaded plots was not real- ized because the average daily Qp received after anthesis when 70-90% of the CO, fixed in the kernel was less than some critical threshold. Since the lOOO-GW at 2.5 m and 20 m was not signifi- cantly different and the lOOO-GW and TGW were highly correlated ( r = 0.8 1481, the reduction in TGW can be attributed to Qp differences before anthesis caused by tree shading in Interval 3.
Willey and Holliday ( 197 1) reported that shading before anthesis did not affect (raise or lower) the lOOO-GW in low light conditions (average Qp before anthesis of 21.6 mol m -2 day-’ and after 18.4 mol
C.P. Chirko et al./Forest Ecology and Management 83 (1996) 171-180 179
m -* day-‘). Data from the present study support Willey and Holliday’s findings, as the shading under the trees did not result in a compensatory difference in lOOO-GW (average Qp before anthesis 27.3 mol m -’ day-’ for Intervals 2 and 3 and after 31.6 mol m-* day-‘) with less Qp due to tree shade.
In the control area, measurement plots were taken at 2.5 m and 20 m eliminating comparisons between the control area to the four yield plot positions on a transect as in Blocks l-4. TGW at 20 m in the control area was 5 11 g m-* compared to a mean of 478 g m -* in Blocks l-4 (Table 2). This difference of 33 g m - ’ is small compared to the difference of 91 g m-* at 2.5 m (484 g m-’ and 393 g m-* for the control area and Blocks l-4, respectively). The lOOO-GW for the control area was 35.7 g (20 m) and 34.2 g (2.5 m). These compared favorably to the lOOO-GW for 20 m in Blocks l-4 (33.6 g). Under the trees at 2.5 m in Blocks 1-4 the lOOO-GW was only 30.9 g, attributed to greater Qp in the control area and at 20 m due to less tree shading leading up to maturity.
5. Summary and conclusions
This on-farm study occurred on irrigated, fertil- ized wheat lands. China is increasing the land area under irrigation annually. In poor to moderate soil conditions, with limited water availability the Paulownia and wheat intercrop system can signifi- cantly improve overall agricultural output.
Several important factors support the compatibil- ity between wheat and Paufownia and helped mini- mize, although not remove, the effect of tree shade on the wheat crop, including: 1) tree form; 2) row orientation; 3) row spacing, and 4) phenological development. As this research illustrated, with a long clear bole, north-south tree orientation, wide inter- row spacing and late leaf flush, wheat under the trees was able to receive Qp in the morning and after- noon.
Along with canopy factors that influence yield, further root studies are needed. Minirhizotrons should be used to investigate root interaction dynamics. In addition, work on the presence or absence of mycor- rhizae associated with Paulownia roots may shed light on phosphorus and tree interactions and general
nutrient uptake as it affects the tree directly and crop indirectly.
This was the first rotation of Paulownia trees grown in this region of China. The next rotation will likely exist in a different spatial arrangement as new saplings are often planted along roadsides bordering fields in a double row configuration, rather than being planted in the center of the fields. This will change the distance between windbreaks and spacing between tree rows, altering microclimate. There will be less porosity with double rows, yet more available Qp to the associated crop plants.
Acknowledgements
A USDE Title VI FLAS research fellowship sup- ported the in-country research. Within China, thanks are due to staff members at Henan Agricultural University, Liu, Tingzhi; Wu, Luguang; and Zhu, Jianjun who comprised the heart of the research team. In Chang Ge extension agents Lao He and Lao Su provided the essential connection to the farmers without whom the research would never have been completed, and thanks are owed to Lao Li, the farmer who was our link to the on-farm research site. Finally, a note of thanks to both Dr. Charlie Feld- hake, ARS, Beckley, W.Va. and Dr. Julie Winkler, Geography Department, Michigan State University, for their insightful comments on an earlier draft of this manuscript.
References
B iggs, W .W ., 1982. LI-188B Integrating quantum/radiometer/photometer instruction manual. Publica- tion No. 8004-4. Lincoln, NE.
Chirko, C.P., 1993. PauZownia/winte.r wheat intercropping: Quantifying the relationship between photosynthetically active radiation (PAR) and yield. Ph.D. dissertation. Michigan State University, 248 pp.
Fischer, R.A., 1975. Yield potential in dwarf spring wheat and effect of shading. Crop Sci., 15(5): 607-613.
Halvorson, A.D., Alley, M.M. and Murphy, L.S., 1987. Nutrient requirements and fertilizer use. In: E.G. Heyne (Editor), Wheat and Wheat Improvement (2nd edn.). Am. Sot. Agron., Madi- son, WI, pp. 345-383.
Jackson, J.E. and Palmer, J.W., 1989. Light Available at the Tree/Crop Interface. In: W.S. Reifsnyder and T.O. Damhofer
180 C.P. Chirko et al./Forest Ecology andManagement 83 (1996) 171-180
&ditors), Meteorology and Agroforestry, ICRAF, Nairobi, pp. Monteith @&or), Vegetation and the Atmosphere, Academic 391-400. Press, New York.
Jiang, J.P. (Editor). 1990. The Silvicultute of Paulownia. China’s Forestry Publishing House, Beijing, (in Chinese).
Monteith, J.L., 1972. SoIar radiation and productivity in tropical ecosystems. J. Appl. Ecol., 9 747-766.
Monte&h, J.L. and Unsworth, M.H., 19%. Principles of Environ- mental Physics. Arnold, London. 291 pp.
Pendleton, J. and Weibel, R., 1%5. Shading studies on winter wheat. Agron. J., 57: 292-293.
Wei, K., 1979. Henan Soils. People’s Publishing House of Henan Province, Peoples Republic of China.
Willey, R.W. and Holliday, R., 1971. Plant population, shading and thinning studies in wheat. J. Agric. Sci., 77: 453-461.
Zhu, 22, Chao, C., Lu, X. and Xiong, Y., 19% Paubwniu in China: Cultivation and Utilization. Asian Network for Biologi- cal Sciences and International Development Research Centre Singapore 65 pp.
Ross, J., 1975. Radiative Transfer in Plant Communities. In: J.L.
Copyright © 2022 FDOKUMEN