Evaluation of mustard meal as a source of supplemental protein
Upload
khangminh22Category
view
6download
0
The Species Biology of Garlic Mustard in Illinois
by
Roger C . Anderson
Professor of Biology
Illinois State University
Normal, Illinois 61761
SEPTEMBER 4, 1991

LIFE HISTORY OF GARLIC MUSTARD
An important aspect of a plant's biololgy is its life history
characteristics including its seasonal or phenological development,
seed production and germination, pollination biology and other
features . This information may be especially important to the
development of methods to control the spread of garlic mustard because
it may point critical stages in the plants life cycle when it is
especially susceptible to manipulation .
Phenological Development and Population Dynamics
Methods
Garlic mustard is a strict biennial, maintaining only a basal
rosette of leaves during its first year of growth and requiring two
growing seasons to complete its life cycle . Studies of seasonal
aspects of the life history of garlic mustard were conducted at a
single location in central Illinois . Beginning on 10 October 1989,
phenological studies were initiated at Ewing Park, Bloomington,
Illinois, where garlic mustard plants were growing adjacent to a east-
west oriented trail . The site was shaded during most of the day when
the trees supported foliage, but during the rest of the year direct
sunlight reached the site during the middle part of the day . To
select plants for study, a transect line was established at each
sampling date at a distance of about 1 .5 m from the north edge of the
trail . At meter intervals along the line, sampling points were
randomly selected . The first two digits of a random number were used
to determine the how far to the left or right of the line, in a
direction perpendicular to the line, the sampling point should be
located. The distance of the point from the line varied from 0 to 99
1

cm . Thirty sampling points were located at each sampling date, except
•
for the last two dates in 1991, when only 16 sampling points were used .
The plant closest to each sampling point was selected for study . The
number of flower buds, flowers, and fruits present on each plant was
counted. Then the root system was excavated and the entire plant was
placed in a plastic bag . Plants were transported to a laboratory
at Illinois State university and the following measurements were taken
(1) the length and width of each leaf was measured and these linear
measurements were converted to leaf areas as described later, and (2)
the plant tissue was separated into reproductive tissue (buds,
flowers, and fruits), shoot tissue, and root mass, oven dried for 48 h
at 800 C and weighed .
Plant leaf areas were determined by first establishing a
relationship between leaf area and the product of leaf length and
width . To accomplish this, the length and width of 100 garlic mustard
leaves ranging in size (L x W) from 1 .1 x 0 .1 cm to 6 .8 x 3 .5 cm were
measured . These leaves were traced on paper and their areas were
determined using a planimeter . A linear relationship was determined
for the product of leaf length and width and leaf area (Y (estimated
leaf area) = 0 .787 + 0 .0273X (Length x Width), r 2 = 0 .97, p<0 .0001) .
The derived equation was used to estimate the leaf area of the plants
sampled in the field . For each leaf, the percent of the leaf which
was eaten, yellow, or brown was estimated . The percent green leaf
area of each leaf was estimated by multiplying this percentage,
expressed as a decimal fraction, by the area of the leaf . The mean leaf
area, determined at each sampling date, was expressed as a percentage of
•
the maximum leaf area achieved by the population . These data were
2

plotted over sampling dates .
•
To follow demographic changes in garlic mustard during its life
cycle, seedling counts were initiated in the spring of 1990 .
Beginning on 11 April 1990, decimeter quadrats were located at each of
the randomly selected points described above, and the number of first-
year plants in each quadrat was counted . During 1991, one-year and
two-year plants were counted in the decimeter quadrat until the
termination of this phase of the study on 25 June 1991 .
Results and Discussion
Seasonal Changes in leaf area, plant height, and biomass
Leaf area change .- For the cohort of plants sampled in the fall
of 1989 (27 October 1989), which had completed their first growing
season, leaf area declined until March of 1990 (Figure 1) . During
0 extended periods of cold weather, when temperatures fell several
degrees below freezing, some leaf tissue died . However, new leaves
were initiated following days when the temperatures reached above 3-5 0
C for several hours in the afternoon . Thus, even though the leaf area
declined during this period of time, the plants retained green leaves
I*
3

•
•
Figure
Seasonal Variation In Garlic Mustard Green Leaf Area
m16-
8-
0
•
1989 - 90o 1990 - 91
0
J' F M A MO J' JI' A' S 1 01 1 N D'IJ' F' M'IA' M' J J I
1 Year-Day100
200
300
0
100
200
300
Year One
Year Two
104 -
96 -
Cu 88 -NiQ 80 -
cv 72 -NJE 64 -
E 56 --XCu 48 -50 40 -
C 32 -dVL
24 -

and periodically put on new leaf growth throughout the winter months .
Beginning in late March, the plants bolted and they quickly reached
their maximum leaf area by the end of April .
For the plants that emerged as seedlings in the spring of 1990,
changes in leaf area was monitored throughout their life cycle .
Germination occurred in February, and measurement of leaf
area and biomass was initiated on 11 April 1990 . There was an initial
increase in leaf area from April into early June, and this was followed
by a slight decline in leaf area . Following the decline, leaf area
tended to remain relatively stable until about mid-March of the
following year (1991) . From this time onward, pattern of changes in
leaf area mirrored those of the previous year, but leaf development and
decline occurred about two week earlier than it had in the previous
•
year. Also, mean leaf area was much greater for plants completing
their life cycle in 1991 than those completing their life cycle in the
previous year (leaf area (X ± SE) = 92 ± 27 cm2 and 361 ± 60 cm 2
for plants two-years old in 1990 and 1991, respectively) . These
differences are probably reflective of the severe drought, which the
plants completing there life cycle 1990 endured in during their first
year of growth in 1989 . In contrast, the 1990 growing season of and the
early part of the 1991 growing season were extremely wet .
By early July of 1991, there were essentially no plants
supporting green leaves on the study site . However, rates of
senescence are variable depending upon habitat conditions . In other
habitats, especially shady and sheltered sites, within a radius of 50
km of this site, there were some plants supporting green leaves, and
•
even flowering, into July and August . Nevertheless, the pattern of
5

rapid shoot growth in late March and April followed by a rapid decline
in green tissue and complete sensescence by mid to late July appears
to be a typical growth pattern for most two-year old plants . However,
this rapid rate of senescence in June of 1991 may have been somewhat
accentuated by the extremely dry conditions and high temperatures
associated with the last part of May and the entire month of June .
Changes in stem height . - Changes in plant stem height also
occurred also rapidly during the second spring of the life cyle as the
plants began to bolt, Figure 2 . In the spring of 1991, stem height
increased an average of 1 .9 cm/day between April 18 and May 13, and
then total stem height increased slightly into June . The ability of
garlic mustard to compete successfully with native understory plant
species may be related to the rapid rate of stem elongation and canopy
0 development occurring at this time of the year . In contrast, the
plant does not display strong competitive abilities during the rosette
stage of its life cycle . An exception to this generalization may
occur when the plant's density is so great that it virtually carpets
the ground . However, there is a high rate of mortality among one-year
old plants and even in areas with large numbers of seedlings in the
spring, plant density is substantially reduced by mid-summer . The lack
of competitive abilities of garlic mustard in the rosette stage was
illustrated by the results of two competition experiment that are not
described in detail in this report . In two separate experiments,
first-year rosettes of garlic mustard where planted in 10 cm
plastic
6

70-
10-
40Stem Height Growth (1991)
II
I
I
I
I
190
100
110
120 130 140MAR'
APR
MAYI
I
I
Year150 160 UN170 Day
Figure

pots and grown with wheat under greenhouse conditions, or with clear
•
weed (Pilea pumila) under reduced levels of radiation in a growth
chamber . In both experiments, there was no evidence that the growth
of wheat or clear weed was reduced when grown with garlic mustard
compared with their growth when a conspecific was planted with them .
To control garlic mustard, it is important to remove the plant before
it achieves large size during the period of rapid aboveground
growth . This should reduce its competitive ability and prevent
flowering and seed set .
Changes in biomass . - For plants emerging as seedlings in 1990,
seasonal variation in biomass production tended to follow that of leaf
area (Figure 3) . However, after a, decline in biomass from April into
May during the first year (1990) of growth, there was a slight but
•
generally steady increase in biomass until early March of the next
year . This was followed by a rapid increase in plant biomass
especially shoot and reproductive biomass . There was also an increase
in root biomass, but the increase in root biomass during the March
April period of the second year was considerably smaller than the
increase in shoot and reproductive biomass .
Plants size can vary greatly within a single habitat, between
habitats, or between years in the same habitat . For example, at the
Ewing Park site in 1990 the maximum mean (X ± SE) biomass of two-year
old plants was 2 .3 ± 0 .4 g . By comparison, in 1991 the maximum mean
biomass (3 .2 ± 0 .8 g) was 39% higher than in 1990 .
8
'.0
•
• Figure
Seasonal Allocation Of Biomass In Garlic Mustard3.5-
2.5 -
ECa
3.0-
100
200
300
Year One
F M A M J J A S O N D J F M A M J J
Year - Day100
200
Year Two
01
El - Reproductive Mass® - Shoot MassEl - Root Mass
300

---------------------------------------------------------------------
Reproductive Phenology
Flower buds appeared shortly after the plant begans to bolt,
Figure 4 . In 1991, flower buds were first recorded on April 6 when
the mean stem height of the population was about 7 .5 cm . The maximum
number of buds ( 62 .3 ± 8 .8 , X ± SE) per plant was recorded on April
18, which is also the date when the first flowers were recorded .
Green fruits and flowers per plant reached a peak number on the same
date . By June 6, no buds or flowers were recorded for the Ewing Park
10
The light intensity of the habitat strongly influences the size
of the plant as described in a later section of the report . For two-
year old plants grown in a garden, receiving 80% of full sunlight, the
mean plant weight (n = 10) on May 18, 1991 was 19 .1 ± 0 .8 g . The
allocation of the this biomass (5? ± SE) into various plant structures
is given below . Root mass constituted a relatively small amount of
the total biomass but allocation of biomass to reproductive and
remaining shoot mass was relatively high, Table 1 .
---------------------------------------------------------------------Table 1 .
Allocation of biomass into various organs for garlic
mustard plants grown in a garden (X ± SE) .
Total Mass Root Mass Leaves Remaininq ReproductionShoot (Green Fruits
• Dryweight 19 .1 3 .0 3 .2 9 .0 3 .9(grams) ± 0 .8 ± 1 .2 ± 1 .3 ± 1 .1 ± 1 .6
Percentof total
100% 15 .7% 16 .8% 47 .1% 20 .4%

4-cm
C
100 -
C)3 80 -0LA 60-cc
L. 40-G).0P
20 -
5
Reproductive Phenology (1991)
90MAR ,
100
110
120 130
140APR
MAY
DriedOpenFruits
Dried : :Closed :
rolls
Year150 160 170 DayJUN
Figure

population, and dried mature fruits, some of which had undergone
•
dehiscence, were present on the plants . Dehiscent fruits represented
22 .1 percent of all fruits present on plants on
fruits were recorded on this date . It should be
where senescence of two-year plants
Park, flowers are often produced in
into July or even August . However,
never observed to successfully form
Population dynamics
In 1990, the largest number of seedlings per dm 2 quadrat,
7 .5 ± (X ± SE) was recorded on the first sampling date, Figure 5 .
The decline in plant surviorship was quite rapid during the first
growing season and by 6 June 1991, at the end of the second year of
•
growth, the number of plant surviving was only plants 0 .5/dm2 quadrat .
The percent of plans surviving to maturity was about 7 .5% . In 1991,
more than twice as many seedling were tallied (18/dm 2 quadrat) as in
1990, but eventually the number of seedlings surviving was about the
same. High seedling densities appear to be important to insure the
success of garlic mustard in the field . The high seedling density is
necessary to offset the high rates of seedling mortality . Also,
occurring in dense stands apparently increases the plant's competitve
occurs more
leaf axils throughout June and
these late produced flowers were
fruits among field populations .
June 25, and no green
noted that in habitats
slowly than in Ewing
ability, especially during the second year of its life cycle when it
bolts and produces a large leaf mass in a short period of time .
Establishment of dense population also ensures that the plant has
the potential to strongly influence components of the soil, including
microorganisms . Examination of the roots of garlic mustard revealed
•
that it is a nonmycorrhizal species, whereas many of the native
12

woodland herbs form associations with vesicular arbuscular mycorrhizae
(VAM) fungi . In dense stands, garlic mustard may substantially lower
the mycorrhizal inoculum potential of sites, especially those it
occupies for several years . This could reduce the competitive ability
of species dependent upon mycorrhizae .
13

a 10-La)a 8-N
CCO 6-
4-
0.
2-
0
-1,750
-1,500
-1,250
L -(Da
-750 -Cca
-500
-250
Figure
a
J I F I MI A I M l J I J I A I S 1 0 1 N I D I JI FIMIA M I J II
I
I
I
I100
200
300
100
200 Year Day
18-
16-
LV 14 -N-IIx 12 -NE

40
FLORAL BIOLOGY AND BREEDING SYSTEM
Floral Biology
Garlic mustard flowers are typical of the family Brassicaceae .
The flowers are perfect ; they have a single pistil, a superior two-
celled ovary, four sepals, four white petals, and six stamens (two
short and four long) . The inflorescence is an indeterminant raceme
and the fruit is a silique, Figure 6 .
Pollen grains from 21 flowers were counted and the number of
grains per anther was 3,207 grains for tall stamens and 3,487 for
short stamens (19,794 per flower) . Based on an examination of 45
flowers, the mean number of ovules per ovary is 15 .3 and the pollen to
ovule ratio is about 1,294 :1 . In 1990, in the basal rosettes began to
•
bolt in McLean County, Illinois on about April 15 and flowering began
about the first week of May . The peak period of flowering occurred
between May 14-20 . After early June, occasional flowers were produced
from axillary inflorescences but none of these flowers were observed
to set fruit . Fully developed green fruits were on the plants by mid-
June and fruit dehiscence began about the first week of July .
15

FLORAL DIAGRAM :
QD
FLORAL FORMULA:
® t K4 C4 A 2+4 G(2)
FRUIT: SILIQUE .INFLORESCENCE : INDETERMINATE
(Racemose)
16
0
Figure 6

Pollination Biology
To study the pollination biology of the plant, six phenological
stages of flower development were recognized (Figures 7 and 8) : (a) 2_
mm bud stage with white stripes beginning to develop at the margins of
the sepals, (b) 3 mm bud stage with enlarged white marginal stripes on
the sepals, (c) 3 .3 mm bud stage just before the developing petals
push the sepals to the top of the flower, (d) cap stage, the sepals
are pushed to the top of the petal by the expanding petals and they
temporarily form a cap on top of the flower, (e) anthesis, the calyx
cap has fallen off, the petals unfold, and the anthers are dehiscing,
although anthers usually begin to shed pollen in the late stages of
the cap stage, (f) late flower open, the petals are unflolded and the
pollen sacs are completely open .
17

2mm
4mm
PHENOLOGICAL STAGES OF THE FLOWER
white stripe
green
calyx
2 m
D.
3.25-3.75 mm
F.
18
calyx
r
anther(entrorsedehiscense)
Figure 7

S
3.75-4 mm
DORSALVIEW
3.25-3.50 mm
STAMEN
antherwall
fold
11
19
A 60
VENTRAL VIEWshowing anther dehiscence
PISTIL
numerouspappilae
Figure 8
0 0O0

Stigmatic receptivity was examined for selected phenological
stages of flowering . For each of the stages, the stigmas were hand
pollinated, emasculated, and collected five hours later . Pistils
were placed on moistened filter paper in a Petri dish and a drop of
cotton blue stain was applied to each . Stigmas were observed under a
microscope to determine if pollen germination occurred and if the
pollen tube penetrated the stigma . Stigmas were considered to be
receptive if the pollen tube penetrated the stigma . All phenological
stages examined had receptive stigmas, Table 2 .
--------------------------------------------------------------------------
Table 2 . Stigmatic receptivity of selected phenological flowering stages .
Phenological Stage
Treatments "a" and "b" were established to ensure that the flowerswere not self-pollinated before they were hand pollinated . For thetreatments listed
above, the relative stigmatic receptivity (basedon a subjective rating of
the number of pollen grains penetratingthe stigma) is a>e&c>b>d .
---------------------------------------------------------------------------
Pollen germination was examined in the six phenological stages of
•
flower development by placing pollen from each of the stages in five
20
Treatment Bud size Bud size t stigmas t sticrmasMay 29 May 30 Pollinated Receptive
a . Emasculated on May 29pollinated on May 30 3 mm cap stage 7 7
b . Emaculated on May 29pollinated on May 30 2 mm 3 mm 10 10
c . Emasculated andpollinated on May 30 2 .75- 3 mm 8 8
d . Emasculated andpollinated on May 30 2 mm 6 6
e . Emasculated andpollinated on May 30 cap stage 5 5

• sucrose solutions (2 .5%, 5%, 10%, 20%, and 30%) on microscope slides .
Germinated and non-germinated grains were counted after 2, 5, 10, and
24 hours . All of the pollen grains were plasmolyzed in the 30%
sucrose solution . Maximum germination occurred in the 20% sucrose
solution for pollen from all phenological stages . Of the phenological
stages examined, the cap stage had the highest percentage (83%) of
pollen grains germinate, Table 3 .
---------------------------------------------------------------------------
---------------------------------------------------------------------------
Studies of the breeding system of garlic mustard indicate that
the plant is not apomictic and is highly self-fertile (autogamy) . The
plant is also capable of cross-fertilization . Potential pollinators
were observed visiting garlic mustard flowers (syphrid flies and small
bees), however, most of the flowers observed were self-pollinated in
the "cap stage," so that autogamy is the most likely mode of
•
pollination .
21
Table 3 . Percent of pollen grains germinating in sucrose solutionsfor pollen from various phenological stages .
Phenoloqical Stages Examined
3 .3 mm bud stage cap stage anthesis late flower
SucrosePercent
Time
2 .5 5 10 20 2 .5 5 10 20 2 .5 5 10 20 2 .5 5 10
2 hours 0
0
0
0 0 0 0 6 0 0
0 5 0
0
0
5 hours 0
0
0
0 0 0 4 22 0 0
6 19 0
0
0
10 hours 0
0
0
0 0 0 7 35 >1 10 15 38 0
0
0
24 hours 0
0
1
5 5 8 27 83 7 10 24 52 0
1
4

SEED BIOLOGY
•
The study of the seed biology of garlic mustard included
examination of seed production as related to plant size, seed rain,
and seed germination . This information will be useful to understand
how the plant is able to maintain high density populations once it
becomes established at a site .
Methods
Seed Production and Seed Rain
To determine the influence of plant size on seed production, 22
plants were sampled in the Parklands Foundation Merwin Preserve
located about 25 km northeast of Normal, Illinois on 21 June 21 1990 .
On this date, almost all the fruits had reached their maximum length
and were still green . No fruits were observed which had undergone
•
dehiscence . There were a few immature green fruits on some plants but
subsequent observations indicated that these fruits did not set seeds .
The 22 plants selected for sampling characterized the range in plant
size that occurred on the site . The density of stems per 25 x 25 cm
quadrat, based on a sample of ten quadrats, was 18 .5 ± 2 .9 (X ± SE) .
For each plant sampled, the number of stems was counted and the height
of each stem was measured . All mature green fruits occurring on each
stem was measured to the nearest mm and the length of the main axis of
the inflorescence and all of its side branches was measured . To
predict the number of seed produced by each fruit, a sample of 140
fruits were collected and taken to the laboratory . The length of the
fruits were measured to the nearest mm and then the number of seeds
contained in each was counted . There was a significant linear
•
relationship between fruit length and number of seeds contained in the
22

fruit [Y (Number of seeds per fruit) = - 6 .8 + 4 .38X (fruit length in
cm), r2 = 0 .75, p<0 .001J . This relationship was used to estimate the
number of seeds per plant by converting the measurements of fruit
length to estimates of seeds/fruit and then summing these values for
each plant . For each plant, the total length of all of its stems, or
stem in the case of plants with a single stem, and the length of its
inflorescence (main axis plus side branches for all stems) was
computed . These variables were then regressed against fruit and seed
production per plant using stepwise forward multiple regression and
linear regression and correlation .
Estimatinq Seed Rain
In a density stand of garlic mustard, adjacent to the location
where the previous study was conducted, the seed rain was determined
using 21 circular glass jars that had an opening of 28 cm 2 (diam . = 6
cm) as seed traps . In each jar, a funnel shaped piece of wire screen
(mesh size = 5 mm) was inserted into the jar so the top of the funnel
was nearly flush with the top edge of the jar . This permitted seeds
to fall into the jars, while most potential seed predators were
excluded . On July 4, 1990 the jars were placed about 30 cm apart in
three separate transects (7 traps per transect) and dug into the soil,
so that the top of the jar was level with the soil surface . Seeds
falling into the trap were removed and counted weekly until October 11 .
Results and Discussion
Simple linear correlations between the independent variables, (1)
number of stems per plant and (2) total stem length, and seeds
produced per plant were highly significant (p<0 .001) with r2 values of
•
0 .69 and 0 .72, respectively (Table 4) . However, the best predictor of
23

number of seeds produced per plant, of the independent variables used
in the stepwise multiple regression model, was total infloresence
length per plant accounting for 93 percent of the variation in seed
production . The inclusion of the other independent variables (number
of stems and total stem length) in the model did not result in a
significant F-value and they were not entered into the equation
(number of seeds per plant) = 37 .53 + 0 .33X (total length of
infloresence per plant), R2 = 0 .93, p<0 .001)] . Measurement of
inflorescence length is very time consuming and depending upon the
degree of accuracy desired in estimating fruit production, it might be
more efficient to use one of the other estimators of seed production,
number of stems or total stem length . Both of these variables,
however, accounted for about 20 percent less of the variation in seed
production per plant than did total inflorescence length .
24
[Y

Table 4 . Relationships between stem and inflorescence variables and fruit and production/plant .
Dependent
Constant
Independent Variables (Coefficient) 1
R2
PVariables
Stem
Stem
Inflorescence
FruitNo .
Length Length
Length
lAll variables were measured in cm .
Multiple Regression
Number Seeds 34 .53 1) 0 .331 0 .93 <0 .0012) not entered - ns3) not entered ns
Linear Regression
Number Seeds 8 .16 0 .69 <0 .001176 .03
Number Seeds 92 .98 0 .04 0 .72 <0 .001
Number Seeds -6 .79 0 .44 0 .75 <0 .001
Number Fruits 1 .15 0 .64 0 .83 <0 .001

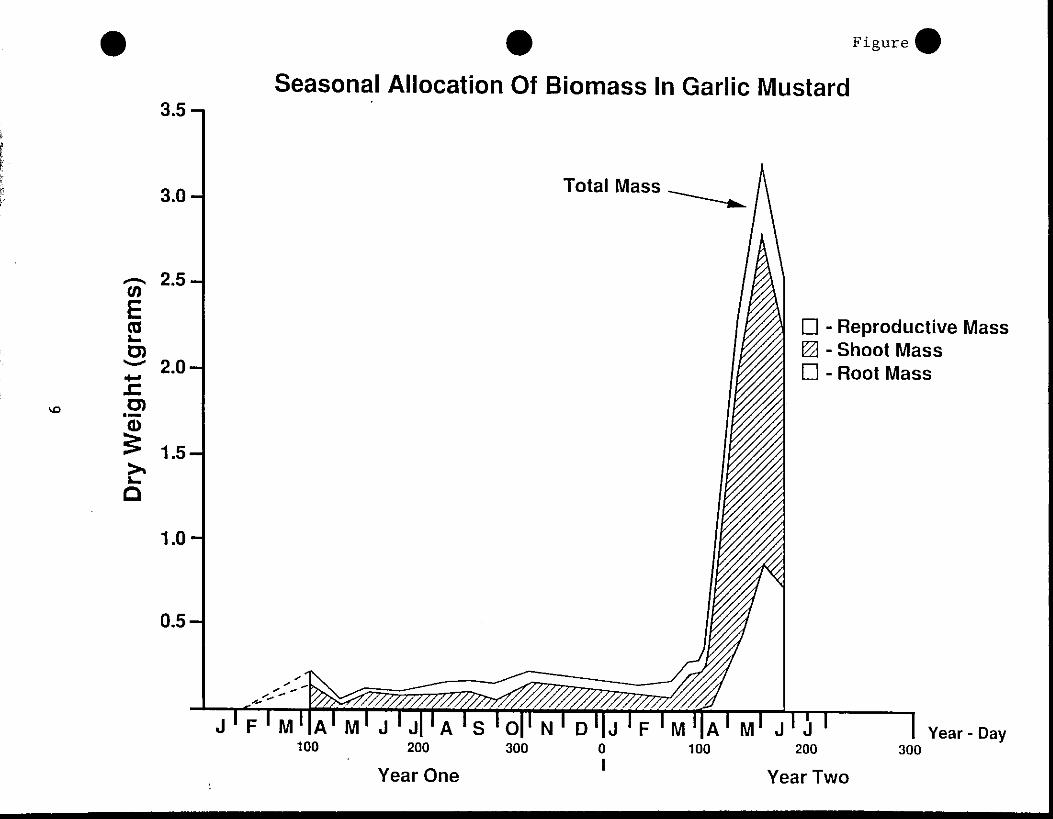
Seeds were collected in the seed traps in the first week after
they were placed in the field and they continued to be dispersed for
an additional thirteen weeks , Figure 9 . The dispersal of seed showed
a bimodal pattern having peak periods of seed dispersal in the middle
of August and September . The second peak period of seed fall in
September was associated periods of rain following a short dry period,
Figure 9 . The accumulated number of seeds per trap was 44 .1 ± 2 .1 (X
± SE) which is equivalent to a seed rain of 1 .5 seeds/cm2 , Figure 10 .
This high rate of seed production insures that large numbers of
seedling can be come established in a single area . Thus, even though
only a small percent of seedling actually become mature plant that set
seed, seed production for the population is high because each plant
produces a large number of seeds .
26

Allaria Peti•to Seed Rain
5
12July
19 26 2
9 16 23 30 6 13 20August
SeptemberWeekly Sampling Dates
27 4
11October
Figure
a 60
U)OY 50
. OO OZy 40-
00ca
O
U0
D ON oIXU 10-Ccoa)5 0
30 -
20 -
Allaria Petiolata Cumulative Seed Numbers
11
I
I
I
I
I
I
1
I
I
I
15
12 19 26 2
9
16 23 30 6
13 20 27 4
11July
August
September
OctoberWeekly Sampling Dates 1990
Figure

Garlic Mustard Seed Germination
•
Previously published reports indicated that garlic mustard
seeds germinated at low levels and required two winters of cold
stratification before germination occurred . To further our
understanding of seed germination in this species, studies were
conducted under laboratory and simulated field conditions .
Laboratory Experiments
Phase 1 . - Seeds collected from Illinois Wesleyan University Woods
(Tazewell County) on 17 July 1989 . Beginning on 12 October 1989, they
seeds were exposed to one of seventeen experimental conditions . These
included 0, 30, 60, or 90 days of cold-moist stratification at 1-2 °C
prior to incubation . Seeds from each of the four stratification
regimes (0,30,60, or 90 days) were incubated in growth chambers at
•
18/23 °C (10/14 hours, day/night) or at temperatures of 22/25 °C (10/14
hours, day/night) . For seed incubated at the higher temperatures,
one-half of the seeds were placed in petri dishes covered with
aluminium foil and the remainder were exposed to the 10/14 hour,
light/dark cycle . For seed stratified for 60 days, there were four
additional treatments (1) exposure to 1,000 ppm gibberellic acid (GA),
(2) treatment with full strength Clorox bleach (CL) for 15 minutes, to
remove germination inhibitors, (3) treatment with Clorox and then
exposure to 1,000 ppm of gibberellic acid, and (4) incubation at 30 ° C
in the dark . The first three treatments (i .e . GA, CL, CL + GA) were
incubated at 22/25 °C (10/14 hours, day/night) . Seeds receiving 0 and
60 days of cold-moist stratification were also incubated in the dark
at 30 °C . Seeds were stratified and/or incubated on moistened filter
•
paper placed in the bottom of glass petri dishes . Fifty seeds were
29

placed in each dish and there were four replicates per treatment,
•
except for the non-stratified seeds incubated at 22/25 °C and 30 0C in
the dark ; these treatments each had eight replicates .
During the period of incubation, seeds were examined 3-4 times
per week to determine if germination had occurred . No germination
occurred for any of the treatments . On 23 February 1990, all of the
seeds were moved to room temperature conditions . The minimal length
of exposure to incubation conditions in the growth chamber was for the
90-day moist-cold stratified seed (@ 72 days) .
On 18-20 May 1990 seeds in each of the treatments (2 per
replicate) were tested for embryo viability using a solution of
2,3,5-triphenyl tetrazolium chloride (TZ) . Seeds were dissected to
expose the embryo, placed on moistened filter paper in petri dishes,
•
and TZ solution was placed on each sectioned seed . Viable embryos
began to show a pinkish coloration after about 12 hours of incubation
after exposure to TZ . After 20-24 hours, in viable seeds the embryo
was bright red in color, with the plummule, epicotyl, and hypocotyl
regions developing the brightest coloration . With some seeds, parts
of the cotyledons also developed red coloration . The viability of the
seeds tested was 100 percent, except for the 0 and 60 day cold-moist
stratifed seed incubated at 30 °C in the dark, and the 0 day cold-moist
stratified seed incubated at 18/23 °C. Based on a sample of 16 seeds,
viability for these treatments ranged from 25-37 % .
Because a high proportion of the seeds contained viable embyros,
the seed were exposured to cold-moist stratification to determine if
this would stimulate germination . For most of the treatments, this
•
was the second time seeds were given cold moist stratification . For
30

seeds in these treatments, it simulated exposure to a second
winter of cold-moist stratification . In each treatment, seeds with
obvious microbial growth on their surfaces were discarded and the
seeds remaining in each treatment were randomly divided into two
groups . Seeds were place on fresh moistened filter paper, with the
number of seeds and replicates varying among the treatments as
indicated in Table 5 . One-half of the replicates for each treatment
were maintained at room temperature and the remaining replicates were
placed in a walk in cold room (@ 1-2 °C)on 24 May 1990 . In addition,
seeds that were collected in 1988 were also placed in the walk in cold
room (4 replicates, with 25 seeds per replicate) . The seeds in the
walk in cold room were to receive 100 days of cold-moist
stratification before they were removed . On 1 September 1990, when
the seeds were examined at the end of the planned stratification
period, a high percentage (80 %) of the seeds that had been collected
in 1988 had already germinated . of the seeds that had been used in
the earlier experiment, germination had occurred for only two
treatments which had been exposed to gibberellic acid (GA treated =
23% and CL,GA = 34%) . The seeds were allowed to remain in the cold
room and after 122 days the germination percentages for the various
treatments was high ranging from 76 to 100% (Table 5) . None of the
seeds maintained at room temperature germinated .
31

Table 5 . Number of seeds per replication prior to cold-moist
stratification for seeds exposed to previous incubation and
stratification conditions .
---------------------------------------------------------------------------
aIndicates previous exposure to Clorox (CL) or giberellic acid (GA)
bMean number of seeds per replicate (X±SD, number in parenthesis isthe number of replicates
°The percent of seeds that germinated in each treatment after 122 daysin the walk in cold room .
32
PreviousIncubationTemp .
D/L Cycle Stratif .(days)
(Cl,GA) a No . seedsbper rep .
% Germ . c
22/25 °C 10/14 hNone 25 .2+0 .7 (4) 100
30 25 .0+0 .7 (4) 10060 24 .5+0 .9 (4) 9890 25 .8+1 .5 (4) 10060 (CL) 25 .0+0 .7 (4) 9160 (GA) 15 .5+7 .5 (4) 8160 (CL,GA) 19 .0+4 .0 (2) 97
22/25 0C darkconstant
None 24 .3+0 .7 (7) 9830 24 .5+0 .5 (4) 10060 23 .3+0 .5 (4) 9790 25 .8+1 .8 (4) 97
18/23°C 10/14 h0 None 25 .8+1 .3 (8) 10030 25 .0+0 .7 (4) 9660 25 .8+1 .3 (4) 7690 24 .3+0 .4 (4) 100
30 °C dark None 25 .8+1 .5 (4) 94constant 60 24 .5+0 .5 (4) 99

• Phase 2 . - The results described above suggested that garlic mustard
seeds germinated under a cool temperature regime and that after
exposure to cold-most stratification (@1-2 °C) for about 100-120 days
the seeds readily germinate . This speculation was supported by the
observation that in 1990 emerging seedlings were observed on February
11 in central Illinois . To further verify these results, on October
3, 1990, seeds were exposed to two experimental conditions : (1)
incubation under cold-moist conditions in the walk-in-cold room,or (2)
30 days of cold-moist in the walk-in-cold room, then 60 days of
stratification in a freezer (@ 16 °C) followed by incubation in the
walk-in-cold room. Twenty-five seeds were placed on moistened filter
paper in petri dishes prior to treatment conditions . Seeds collected
from three years (1988, 1989, and 1990) were used in the study . Seed
•
for each year were collected from a different location . For each
treatment condition there were five replicates .
For seeds incubated in the walk in cold room no germination
occurred after 90 days of incubation . However, there was a low
percentage of the the 1990 (2%) and 1988 (1%) seed that had germinated
at the next observation six days later . Seeds were checked for
germination at one to three day intervals over the next 52 days (148
days of incubation) . A few seeds germinated between the 96th and
111th days of incubation (total germination = 1988 seed 1%, 1989 seed
1%, 1990 seed 10%), but after the 111th day of incubation no
additional germination occurred .
For seed that was placed in the freezer for 30 days, there
•
was less germination . One seed, from the lot collected in 1990,
germinated after 30 days after the seed were returned to the walk
33

• in cold room on 30 April 1990 . No additional germination was
recorded over the next 43 days .
The reason for the difference in results obtained when seeds
were incubated in the walk in cold room begining in May of 1990
and October of 1990 is not known . It is possible that the
temperature in the walk in cold room is slightly warmer
during the summer than it is during the winter . The slightly
elevated temperatures to which the seed may have been exposed to
in beginning in May of 1990, compared to those started in October,
may be reponsible for the differences in results . It is also
possible that there is a seasonal rhythm to the germination
pattern and seeds germinate more readily at one time of the year
than another when exposed to the same conditions .
Simulated Field Studies
Phase 1 .- In the fall of 1989, two experiments were established at
the ISU farm to determine the nature of the garlic mustard seed bank
and rates of seed germination following exposure to cold
stratification during the winter . To examine the seed bank, ten soil
cores (10 cm in diameter and 2 cm deep, area = 78 .5 cm2 ), were
extracted from areas adjacent to one-year old and two-year old garlic
mustard plants growing in Ewing Park, Bloomington, Illinois on
September 22, 1990 . The soil cores were layered on top of greenhouse
potting soil in 10 cm plastic pots and placed under a lath frame that
provided 60% shade .
To examine germination rates of seeds under simulated field
•
conditions, seed collected in the fall of 1989, from the
Illinois Wesleyan University woods, was sprinkled on the top of
10
34

Sgreenhouse potting soil contained in 10 cm diameter plastic pots
and placed under the lath frame described above on November 11,
1989 . There were ten pots each with fifty seeds .
Observations were made of germination three times during the
late-winter and spring of 1990 . Seedling emergence from soil
collected adjacent to one-year and two-year old plants was recorded on
February 11, 1990 but there was no seedling emergence from the seed
collected in 1989, until 17 March 1990 . At the time of the last
observation, June 14, 1990, based on a t-test, there was no
significant (p > 0 .05) difference in the number of seedling that
emerged per pot from soil collected adjacent to one-year old and two-
year old plants (Table 6) . The mean percentage germination (seedling
emergence) for seed collected in the fall of 1989 was 17 .2% .
•
----------------------------------------------------------------------Because the literature suggested that seeds required exposure to
two winter before germinating, observations of seedling emergence were
continued in the late-winter and spring of 1991 for seed collected in
•
the fall of 1989 and soil collected adjacent to one-year old plants
35
Table 6 . Total seedling counts for soil collected adjacent to
one-year old and two-year old plants and seeds collected in the
fall of 1989 .
Seedling Counts (X+SD)
Date Soil adjacent to Soil adjacent to Soil withone-year old plants two-year old plants 1989 seed
Feb 11, 1990 5 .7+7 .1 3 .8+3 .1 0 .0+0 .0
March 17, 1990 7 .3+8 .6 8 .4+5 .3 0 .7+1 .8
June 14, 1990 7 .9+8 .6 9 .0+5 .3 8 .6+7 .7

(Table 7) . Both treatment conditions had some seedling emergence in
1991, but the number of seedlings emerging per replicate was small .
The seedlings emerging in 1999 represent 12 .2% and 11 .2% of the total
seedling emergence occurring in 1990 and 1991, for the 1989 seed
and soil collected adjacent to one-year old plants, respectively . In
1991, 17 .2% of the 1989 collected seed germinated in 1990, and in 1991
an additional 2 .4% germinated . A total of 19 .6% of the 1989 seed
germinated during the two years of the study .
---------------------------------------------------------------------
Table 7 . Emergence of seedlings from soil collected adjacent to one-
year old plants and seeds collected in the fall of 1989 .
36
Seedling Counts
Date Soil collected adjacentto one-year old plants 1989 seed
March 21, 1991 0 .2±1 .0 0 .0±0 .0April 1, 1991 0 .6±1 .0 0 .9±1 .6April 9, 1991 1 .0±1 .3 1 .1±1 .8April 17, 1991 1 .0+1 .3 1 .1±1 .8April 24, 1991 1 .0±1 .3 1 .2+1 .7May 13, 1991 1 .0±1 .3 1 .2±1 .7May 24, 1991 (Total 1991) 1 .0±1 .3 1 .2±1 .7
June 14, 1991 (Total 1990) 7 .9±8 .7 8 .6+7 .7
Total 1990-91 8 .9+9 .9 9 .8+8 .0
Percent of Totalemerging in 1991 11 .2% 12 .2%

• Phase 2 .-To verify that seeds will germinate following exposure to
cold stratification during a single winter, seeds that were collected
in 1988 (northern Illinois source), 1989 (Indian Creek Woods),and
1990 (Parklands Foundation Merwin Preserve) were treated as described
above for the 1989 collected seed, except that only 25 seeds were sown
per pot on November 5, 1991 . There were ten replicate pots per year .
Initially, the seed collected in 1988 had a higher rate of
germination than seed collected in the other years, but by 9 April
1991, seeds collected in 1989 had more seedlings emerge per
replicate than seeds collected in any of the other years (Table 8,
Figure 11) . Total germination for 1989 (14 .4 ± 5 .7, X ± SD, per
replicate) was significantly higher than for seed collected in
1988 (12 .1 ± 7 .2, p<0 .05) or 1990 (7 .6 ± 5 .3, p<0 .001) . The seeds
•
collected in 1988 had more seedlings emerge than the 1990 seeds
(p<0 .01) . The percent of the seeds producing emerging seedlings
was 48%, 58%, and 30%, for the 1988, 1989, and 1990 seed,
respectively . Germination for seed collected from all three
years was higher than it had been for the seed that was collected
in 1989 and sown in the fall of 1989 . It should also be note
that difference in seedling emergence note between seeds collected in
1988, 1989, and 1990 could be due to seed source, since none of the
seeds were collected at the same site .
37

• Table 8 . Mean (X±SD) seeds emerging per replicate for seeds collected
from different locations and in different years .
% Germination
30%
58%
58%
38
Mean Number of Seedling Emerging Per Replicate
Year of Collection 1990 1989 1988
Date of Observation
March 2, 1991 0 .3±0 .6 0 .2±0 .4 3 .9±3 .5
April 1, 1991 2 .9±3 .9 4 .7±5 .5 8 .9±4 .5
April 9, 1991 4 .6±4 .0 10 .9±6 .9 10 .7±4 .3
April 17, 1991 7 .2±5 .3 13 .9±5 .9 11 .9±4 .7
April 24, 1991 7 .6±5 .3 14 .2±5 .8 12 .1±7 .2
May 13, 1991 7 .6±5 .3 14 .4±5 .7 12 .1±7 .2
May 24, 1991 7 .6+5 .3 14 .4+5 .7 12 .1+7 .2

a)a 10COC
W
G 8-L
N6 2Z
Germination of Seed CollectedIn Three Years
00
20
30 3
13
23 1
11
21MARCH
APRIL
MAY
-60%
-50% OCUC
-40% ELQ)
(7-30%
vL
-20% a-10%
Figure

INFLUENCE OF VARIED LEVELS OF IRRADIANCES ON THE GROWTH AND
PHOTOSYNTHESIC RATES OF GARLIC MUSTARD
Field observations of garlic mustard indicate that it is
associated with habitats ranging from understories of closed canopy
forests to sites receiving only partial shade, although other workers
have reported that it will grow in full sunlight conditions . The size
of the plant appears to increase as light intensity of the habitat
increases . For example, second year plants growing in a garden that
were exposed to 81% of full sunlight during mid-summer (July 20)
during their second year of growth (18 May 1991) had a mean plant
weight 19 .2 ± 19 .8 g (X ± SD) . By comparison second year plants
growing in Ewing Park, Bloomington, Illinois, next to the edge of a
trail in a forest area that was shaded most of the day, had a mean•
plant weight of 2 .3 ± 2 .0 g on 23 May 1991 . The purpose of this
portion of the study was to determine the influence of varied levels
of radiation on growth and photosynthetic rates of garlic mustard
grown under varied levels of irradiance in a growth chamber and under
partial sunlight and under a forest canopy .
Method
Growth Chamber Study .
Shoot Biomass Production . - On February 8, 1990, seedlings were
collected by removing a block of soil (about 15 cm in diameter and 4
cm deep) containing 100-150 seedlings from Ewing Park . The block of
soil was placed in a plastic tray which was placed in a growth chamber
maintained at a day-night cycle of 10/14 hr (light) and 20/24 °C
•
(temperature) . The plants were watered daily. On February 13 and 14,
40

61 seedlings were removed from the soil and single seedlings were
planted in 10 cm plastic pots containing a commercial peat soil . The
plants were grown in the growth chamber with full irradiance (1,140
uE/m 2 /s) and watered daily . Fifteen plants were randomly assigned to
each of four treatments receiving different levels of irradiance on 18
February 1990 . The various radiation treatments were established by
growing plants under wooden frames with zero, one, two or three layers
of plastic shade cloth providing 125, 243, 469, and 1,140 uE/m 2 /s of
PAR (photosynthetically active radiation), respectively . The plants
were watered with a commercial fertilizer solution (1 .25 g of
fertilizer per liter), 50 ml and 100 ml per pot on 20 February and 20
March 1990 . The plants were grown until March 29 and then shoots of
all plants were harvested, dried for 48 h at 80 ° C, and weighed .
Is Establishinq plants for Determininq Photosynthetic Rates . - On 29 March
seedlings were obtained from Ewing Park and planted in 10-cm
plastic pots in peat soil as described above . Five plants were
randomly assigned to each of the four irradiance treatments as
described above . Plants were grown until August, when rates of
photosythesis under various irradiance levels was determined . Plants
were watered daily with deionized water and with 100 ml of fertilizer
solution on April 27 .
Field Studies
To expose plants to nearly full light intensity, plants were
established in the garden described above that was sheltered from
winds by landscape plantings and buildings . On l'April 1990, sixteen
seedlings were planted in a square wooden frame 65 cm x 65 cm x 6 cm
•
(L x W x D) . There were four seedlings in each of four rows that were
41

15 cm apart . Plants in each row were 15 cm apart and the plants
adjacent to the sides of the square were 10 cm from the edge . After
planting, the seedlings were watered and covered with a piece of
burlap for two days . After two days, the burlap was removed and the
plants were provided with supplemental watering periodically
throughout the next four months .
Rates of photosynthesis were also measured for first year plants
growing in a forest that emerged as seedlings in the spring of 1990 .
The plants occurred in a small forest opening on the Parklands
Foundation's Merwin Preserve about 25 km northeast of Bloomington,
Illinois . The plants were shaded during most of the day .
Measurement of Photosynthetic Rates Under Varied Levels of PAR
Rates of photosynthesis, stomatal conductance, and leaf
•
temperatures, were measured for all plants using a Licor 6200 portable
photosynthesis and transpiration measurement system . For the plants
grown in the growth chamber, these measurements were made in the growth
chamber under zero to three layers of shade cloth placed on wooden
frames, while the irradiance in the growth chamber was at a maximum
intensity . Plants grown in the growth chamber were transfered to the
garden area and then photosynthesis, stomatal conductance, and leaf
temperature was measured for these plants under open sunlight
conditions and under four layers of shade cloth . For plants growing
in the garden, measurements were made in full sunlight and under one-
four layers of shade cloth between 11 am and 2 pm . For plants growing
in the forest understory, rates of photosynthesis were measured first
in situ under the forest canopy . These plants were then excavated by
digging a cylinder of soil (diameter 22 cm by 20 cm deep) with the
42

• plant in the center . This cylinder of soil was placed in a clay pot
of the same size and moved into a full sunlight area and measurements
were made under the same conditions as for the plants grown in the
garden . These plants were returned to the area they were removed from
after the measurements were made . Ten days later the plants appeared
to be doing well and none of them had lost leaves .
Results and Discussion
Shoot biomass production decreased as the level of irradiance to
which the plants were grown under was reduced, being 799 ± 672 mg, 103
± 120 mg, 40 ± 58 mg, and 8 ± 7 mg (X ± SD) for plants . grown under
zero to three layers of shade cloth, respectively .
During the measurement of photosynthesis, chamber temperatures,
•
relative humidity, and leaf temperatures were similar for plants
measured under the various levels of irradiance (Table 9) .
43

Plants grown under growth chamber
photosynthesis under irradiance levels
under which they were grown . The only
generalization were plants grown under
that had their maximum rate of photosyntheis under irradiance
conditions of 469 uE/m2 /s .
to decrease as the irradiance level under which the plants were grown
decreased (Figure 12, Table 10) .
44
which were similar to
exception to this
three layers of shade
The only exception to this
conditions had maximum rates
those
cloth
The maximum rates of photosythesis tended
of
Table 9 . Variation (X ± SD) in leaf temperature, chamber temperature,and relative humidity under various levels of irradiance .
ConditionIrradi nceµ E/m /s
Chamber LeafChamberRelativeHumidity %Temp . ( °C) Temp . ( °C)
Forest Shade 45 + 8 31 .0 + 0 .9 31 .9 + 0 .7 51 .5 + 1 .6
4-layersGrowth Chamber 125 + 5 30 .3 + 2 .1 30 .2 + 1 .9 51 .5 + 1 .6
4-layersFull Sun 108 + 6 30 .2 + 1 .4 30 .6 + 1 .0 54 .2 + 3 .3
3-layersFull Sun 218 + 30 30 .2 + 2 .6 30 .8 + 1 .1 54 .1 + 3 .0
2-layersGrowth Chamber 243 + 6 30 .2 + 1 .6 30 .4 + 1 .6 51 .8 + 1 .5
2-layersFull Sun 351 + 13 31 .7 + 1 .2 31 .5 + 0 .9 51 .0 + 3 .4
One-layer•Growth Chamber 469 ± 7 30 .3 ± 1 .2 30 .4 ± 2 .4 53 .1 ± 3 .0
One-layerFull Sun 713 + 14 31 .0 + 1 .2 31 .1 + 0 .7 51 .8 + 1 .9
Full Sun 1791 + 35 30 .8 + 1 .8 30 .9 + 1 .9 51 .8 + 1 .3
Growth ChamberNo Shade 1103 + 11 29 .8 + 1 .8 29 .4 + 2 .1 51 .2 + 0 .5

Table 10 . Mean rates of photosynthesis (X ± SD, gmol m-2 s-1 ) for plant grown under various
levels of photosynthetically active radiation (PAR) .
PAR
108 .0+6
124+5
243+6
469+7
1104+10
1791+35
Growth Conditions
Photosynthetic Rates
Growth Chamber
Full intensity
0 .08 ±
0 .52 ±
1 .54 ±
3 .62 ±
7 .70 ±
5 .26 ±0 .03aA
0.70aA
0.62aA
0 .63aB
1 .02dD
1 .11cC
One-layer
0 .04 ±
1 .52 ±
2 .87 ±
6 .59 ±
6.21 ±
1 .36 ±0 .24aA
0.13 abA 1 .OObB
0 .33bC
0.90cC
0 .18bA
Two-layers
2 .31 ±
2 .51 ±
5.36 ±
3 .82 ±
1 .53 ±
0.20 ±0 .08bB
0.64bB
0 .59cD
0.83aC
0 .26aB
0.01aA
Three-layers
2 .53 ±
3 .93 ±
4 .87 ±
6 .99 ±
2 .90 ±
0.09 ±0 .2bB
1 .08cC,D
0 .40cD
0 .22bE
0 .52bB,C
0.03aA
Garden
0 .01 ±
4 .48 +.009a
0.43c
Forest
Shade
3 .04 +
0 .05 +0 .39c
0 .03a
A = Means in a row with the same capital letter are not significantly (p<0 .05) diferent .
a = Means in a column with the same lower case letter are not significantly different .

Photosynthetic Rates of Garlic Mustard Plants Grown ina Growth Chamber Under Selected PAR
•
Full Light
1800
Figure
I
I
I
I
I
I
I
I
I0
200
400
600
800 1000 1200 1400 1600PAR uE m -2 s -1
O 1- Layer
A 2- Layers
0 3- Layers
2000

generalization is for plants grown under three layers of shade cloth
•
which had higher maximum rates of photosynthesis ( 6 .99 umol/m2 /s)
than those grown under two or three layers of shade cloth (5 .36 and
6 .59 umol/m2 /s) . The highest rates of photosynthesis was acheived by
the plants grown under full irradiance levels (7 .70 umol/m2 /s) .
Stomatal conductance tended to follow the same pattern as
photosynthetic rates under the varied levels of PAR (Table 11, Figure
13) . The only exception to this generalization was for plants grown
under two layers of shade cloth that had higher conductance at a
radiation level of 108 uE/m 2 /s than at 125 uE/m2 /s, but for
photosynthesis the reverse was true . Only the plants grown at the
full radiation intensity in the growth chamber maintained high rates
of stomatal conductivity under the highest levels of radiation (1,791
uE/m2 /s) . In contrast, at the two lowest radiation levels only plants
rates of stomatal conductance . These results indicate a strong
stomatal control of photosynthetic rates . Plants which developed at
reduced levels of irradiance experienced rapid stomatal closure and
reduced photosynthetic rates at moderate to high levels of irradiance .
However, these plants had moderately high rates of photosynthesis and
stomatal conductance at reduced levels of irradiance . In contrast,
plants developing under higher levels of irradiance displayed little
stomatal sensitivity at low levels of irradiance but they maintained
high rates of conductance and photosyntheis at moderately high levels
of irradiance .
Comparison of the growth chamber grown plants with those grown
•
under field conditions, for the two irradiance levels for which both
•
grown under two or three layers of shade cloth had relatively high
47

Table 11 . Mean rates of stomatoe conductance (cm/s, X ± SD) under various levels of PAR
(photosynthetically active radiation µE, m2 /s) .
A = Means in a row with the same capital letter are not significantly (p<0 .05) different .
a = Means in a column with the same lower case letter are not significantly different .
PAR
Growth Conditions
108 ± 6
125 ± 5 243 ± 6 469 ± 7 1104 ± 10 1791 ± 35
Stomatal Conductance
Growth Chamber
Full 1 .06 ± 9 .25 ± 16 .24 ± 66 .43 ± 88 .01 ± 67 .01 ±Intensity 0 .64aA 0 .94aB 1 .99aC 1 .50bD 0 .47dE 8 .04dD
One-layer 7 .37 ± 12 .19 ± 37 .34 ± 65 .62 ± 56 .78 ± 17 .25 ±2 .47aA 1 .72bB 3 .7ObD 0 .94bF 2 .49cD 0 .64bC
Two-layers 38 .69 ± 28 .45 ± 54 .27 ± 50 .98 ± 16 .44 ± 0 .09 ±3 .96bD 1 .16cC 3 .72cE 3 .84aE 0 .43aB 0 .01aA
Three-layers 41 .86 ± 50 .10 ± 64 .02 ± 80 .40 ± 31 .74 ± 0 .40 ±1 .31bC 2 .17dD 1 .03dE 1 .49cF 1 .20bB 0 .22aA
Garden 10 .91 ± 57 .96 +1 .69a 1 .77c
Forest Shade 46 .63 ± 4 .48 +2 .57b 3 .91a

Rates of Stomatal Conductance of Garlic Mustard PlantsGrown in a Growth Chamber Under Selected Light Intensities
90-
0 200
•
Full Light
400 600
800
1000 1200 1400
PAR uE m-2 s-1
A 1 - Layer
• 2 -Layers
1600 1800
Figure* 3
2000
(] 3 - Layers

groups were measured, indicates similiar patterns of acclimatization
to levels of irradiance (Table 10 and 11) . The plants grown in the
garden had extremely low rates of photosynthesis and stomatal
conductance at the lowest levels of irradiance . However, they did not
have statistically significant different rates of photosynthesis than
plant grown under maximum levels of irradiance in the growth chamber
at the highest level of irradiance (Table 10) . In contrast, plants
that developed in the shaded forest environment had the highest rates
of photosynthesis and stomatal conductance at the lowest level of
irradiance . They experienced low levels of photosynthesis and
stomatal conductance at the highest level of irradiance (Figures 14
and 15) . For the forest grown plants, maximum rates of photosynthesis
and stomatal conductance occurred between about 200 and 800 uE/m 2 /s
•
but these plants also had moderately high rates of photosynthesis and
stomatal conductance at the lowest levels of irradiance . For the
forest understory plants, photosynthesis and stomatal conductance
essentially stopped at the highest levels of irradiance . In contrast,
for the garden plants, there was nearly a linear increase in
photosynthesis and stomatal conductance across the range of irradiance
for which these parameters were measured .
50

8
7-
5-
1
0
Photosynthetic Rates of Garlic Mustard Plants Grown inPartial Sunlight and Shade Conditions
200 400 600
0 Shadea(n
m Partial Sunlight
IX
6-
~ N~N.C
0 E0ta0C)ICo
Figuree4
0
800
1000 1200 1400 1600 1800 2000PAR uE m -2 s -1

N90
E 8o-
13 70-(f)
V) 0
Rates of Stomatal Conductance of Garlic Mustard PlantsGrown in Partial Sunlight and Shade Conditions
O ShadePartial Sunlight
Figur*5
I
I
I
I
I
I
I0
200
400
600
800 1000 1200 1400 1600 1800 2000
Photosynthetically Active Radiation (PAR)

The results of this study indicates that garlic mustard is
adapted to growing across a wide range of irradiance conditions . The
plant is able to adjust to varied habitat conditions and maintain high
rates of photosynthesis in the radiation environment in which it
grows . These results explain why its is able to invade and compete
successfully in habitats ranging from partial shade to deeply shaded
habitats .
53

GROWTH OF GARLIC MUSTARD IN NATIVE SOILS OF DIFFERENT ACIDITY
Field observations of garlic mustard indicated that by 1991 it
had not invaded most of the southern third of Illinois, where the
soils tend to be more acidic than elsewhere in the state . To test the
hypothesis that soil pH might play a role in limiting the plant's
distribution, the soil pH of sites where garlic mustard was growing
was measured . Also, the growth of transplanted seedlings from Ewing
Park, Bloomington, Illinois, in soil collected from five locations
from southern Illinois, and Ewing Park, was compared under growth
chamber conditions .
Methods
The southern Illinois soils were collected on 16-17 January 1991,
and transported to Illinois State University . The soils were placed
•
in plastic bags and stored at a temperature of 0-2 ° C until March 21 .
Then they were placed in a growth chamber and air dried . Soil was
collected from Ewing Park on March 29 and several hundred garlic
mustard seedlings were collected on the same day . The seedlings were
placed in the growth chamber maintained at a 14/10 h day/night
cycle with a day/night temperature of 22/24 ° C . The seedlings were
watered daily with deionized water . All of the collected soils were
allowed to air dry until April 2 . Following air drying, the soils
were broken into smaller aggregates that were generally less than one
cm in diameter. The soils were mixed with pearlite (1 :1 by volume)
and for each of the six soils, seven 10 cm pots were filled with the
mixture . Seedlings were planted in each of the pots . The seedlings
were watered and the pots were placed in trays and about one cm of
0 water was placed in the bottom of each tray to ensure hydration of the
54

soil . For the first two days after planting one-half of the lights in
the growth chamber were turned off . The plants were grown until June
27 . At the end of the growth period, the plants were harvested, oven
dried at 80 0 C for 48 hours and weighed and the number of surviving
plants for each soil type was recorded .
The initial pH of the air dried soils at the beginning of the
growth experiment and the pH of the soil-pearlite mixture at the
termination of the experiment was measured . In addition, the pH of
soil collected from the sites where garlic mustard grew was also
measured . Soil pH was measured with a Nester Pocket pH meter with an
accuracy of ± 0 .1 pH units . The accuracy of the meter was calibrated
before each use with pH buffer 4 .0 and 7 .0 .
Results and Discussion
The pH of the soil in which garlic mustard grew ranged from a
of 5 .0 to slightly above neutral . The soils from southern Illinois
were generally more acidic than those in which garlic mustard was
growing. All of the soils from southern Illinois had higher soil pH
at the end of the experiment than they did at the beginning (Table 12) .
55
low

Table 12 . The pH of soils from various locations in Illinois
supporting populations of garlic mustard and soils used in the growth
experiment .
Soils used in the Growth Experiment
1Number of suviving plants
beginning of the study .
out of seven planted per soil at the
56
Soils supporting garlic mustard population
Location County Soil RHH
Wrights Woods Lake 5 .9
Ryerson Conservation Area Lake 5 .3
Lloyds Woods Lake 5 .0
Fermilab site 1 Kane 7 .1
Fermilab site 2 Kane 7 .2
Ewing Park McLean 6 .1
Little Mackinaw Wildlife Park Tazewell 7 .2
Indian Creek Woods Tazwell 7 .0
Mettler Woods DeWitt 5 .9
• Sand Prairie Scrub Oak NP (1) Mason 6 .4
Sand Prairie Scrub Oak NP (2) Mason 6 .3
Location County Soil pH_
No. Plants lInitial Final
1 . Brownstown Flatwoods Fayette 4 .2 4 .7 4
2 . Southern Till Plain Slope Marion 4 .2 4 .3 6(post oak flat woods)
3 . Small stream floodplain Marion 6 .3 6 .8 5
4 . Upland Shawnee Hill Pope 4 .3 4 .7 6
5 . Cache River Floodplain Johnson 5 .2 5 .3 6
6 . Ewing Park McLean 6 .1 6 .3 2

--//14.0
•
Figure~6
Growth of Garlic Musfard in Southern Illinois Soils
I
y=0.1316(X)+0.5281
r = 0 .98 **
Soil Key
•
Soil 1 Brownstown Flatwoods•
Soil 2 Post Oak Rest Area - Salem•
Soil 3 Flood Plain - South of SalemA Soil 4 Upland Shawnee Hills13 Soil 5 Cache River F.P . - Heron Pond
1
15 .0
Soil pH
17 .0
380-
340-
300-
E260-
D)220-
180-
C140-L-
a100-
60-
20-

•
The number of plant surviving to the end of the experiment
varied from 2 to 6 for the various soils . However, chi-square
analysis indicated that there were no significant differences in the
proportion of plants surviving in the various soils . It is of
interest that the Ewing soil, which is the soil type from which the
seedlings used in the experiment were collected, had the smallest
number of plants surviving . In spite of the growth of some plants in
all of the southern Illinois soils, there was a significant negative
correlation between the average plant weight and soil pH for the five
southern Illinois soil, Figure 16 . This results indicate that garlic
mustard is capable of growing in soils from southern Illinois, but
the success of the plant, as measured by plant dry weight, increases as
the soil becomes more basic . It should be noted that the plant are
•
not responding directly to the concentration of hydrogen ions in the
soil . Soil pH is usually reflective of the availability of nutrient
ions in the soil (especially bases Ca, Mg, and K) . The decrease in
plant growth associated with increased acidity is probably the result
of the more acidic soil having lower availability of inorganic
nutrients than the less acidic soils .
ALLELOPATHIC PROPERTIES OF GARLIC MUSTARD
Because of the rapidity which garlic mustard has been able to
invade forests and apparently displace the native understory flora, it
was suspected that it might produce allelopathic compounds . Several
laboratory tests were preformed to determine if the plant contains
water soluble inhibitors of seed germination and early seedling growth
as described below .
58
Preparation of the Plant Extract Used in the Allelopathy Tests
Water extracts were made of whole garlic plants (shoots and roots)
collected at random locations within a dense colony of the plant .
Water extracts of fresh plants (plants were collected in February and
June) were made to ensure that volatile components would not be lost
during the drying of the tissue . The plant tissue was placed in a
blender and water was added to yield a ratio of fresh tissue to water
of 1 :3 (w/w) . The blender was run at high speed for about five
minutes . The extract was then filtered twice through Whatman # 42,
ashless filter paper and then passed through a Buchner filter
containing Whatman # 1 qualitative filter paper . The extract was
allowed to settle and the upper portion was decanted and then
centrifuged ten minutes to remove some of the remaining plant tissue
•
residues . The osmotic potential of the resulting extract was measured
using a vapor pressure osmometer and determined to be 220±6 (N = 3)
milliosmoles . To ensure that the osmotic potential of the extract was
not sufficiently low to inhibit seed germination and seedling growth,
1 :5 (4 ml of deionized water to 1 ml of full strength extract) and
1 :10 (equal volumes of the 1 :5 dilution and deionized water) dilutions
of the extract were prepared for use in the bioassay tests . Deionized
water was used as the control throughout the experiment . Three types
of bioassay tests were conducted using the plant extracts .
Testinq the Allelopathic Properties of the Extract Using Garden
Annuals
The first bioassay tested the inhibitory properties of 1 :5 and
1 :10 strength extracts using several garden annuals as test species
(radish, wheat, lettuce, and tomato) . Twenty seeds of each garden
59

annual were placed in a glass Petri dishes containing a single layer
of filter paper in the bottom of the dish . The filter paper was
moistened with 5 ml of deionized water (control), 1 :5 extract, or 1 :10
strength extract . Each treatment and control was replicated three
times . Dishes were placed in a growth chamber and maintained at a
day/night (14/10 h) temperature of 18/23° C . After 48 h, plant axis
lengths (root + shoot length below the cotyledons) were measured for
radish, root lengths were measured for lettuce and tomato, and root
and shoot lengths were measured for wheat .
Oneway analysis of variance indicated that there were significant
differences in root, shoot, or plant axis length for all of the
species tested (Table 13) between seedlings exposed to the plant
extract, or deionized water . For each species, Tukey B mean
separation procedure was used to determine which treatment means were
significantly (P < 0 .05) different . For all species, seeds exposed to
the extract had significantly smaller means than the control, except
for the shoot length of wheat for seeds exposed to the 1 :5 extract and
the root length of tomato for seeds exposed to the 1 :10 extract (Table
13) .
60

Table 13 . Mean (X ± S .E .) length for measured variate for garlic mustard extract treated seedsand deionized water control
AMeans within a column with the same letter are not significantly different at the p<0 .05 level
Treatment
Radish
Measured Variate (cm)
Lettuce
Tomato Wheat
Shoot
RootAxis Root
Root
Extract
1 :5 Concentration 7 .5652± .8547 b 1 .1887± .0543 b 10 .5000±1 .2321a 10 .2979±1 .2407 b 5 .1304± .50
1 :10 Concentration 5 .8788± .5915b 2 .2453± .1171 b 22 .8966±1 .9573 b 5 .1333± .7485a 6 .7500±1 .21
Control
Deionized H2 O 14 .950011 .0759 A 14 .9818±.6883 A 23 .0714±2 .2747 $ 11 .2800± .6357$ 30 .7347±1 .6A
Influence of Microbial Activity On the Inhibitory Properties of the
Extract
Bioassays were also conducted to determine if the inhibitory
properties of the extract were the result of chemicals present in the
extract or due to the production of microbial compounds that resulted
from microorganisms present in the extract (Figure 17) . Fresh plant
extracts were prepared and filtered as previously described . A
portion of the extract was then passed through a 0 .2u millipore filter
in a sterile transfer hood . To determine if the filtration through
the millipore filter had removed fungal and bacterial cells, 0 .5 ml of
the filtered or non-filtered extract were pipetted in a sterile
transfer hood onto nutrient agar, or 2% malt extract agar in Petri
dishes .
millipore
incubated
(nutrient
bacterial
millipore
There were three replicate plates of each type of agar for
filtered and non-filtered extracts . The plates were
at room temperature for 4 days and checked for bacterial
agar) and fungal growth (2% malt extract agar) . No fungal or
growth occurred on the surface of the agar receiving
filtered extract, whereas plates receiving non-filtered
extract had both fungal (2% malt extract agar) and bacterial growth
(nutrient agar) .
62

Plant Extract(1 :5)
Deionized H 0Control
Test for Potential Inhibitory Compounds Produced by Microorganisms inFiltered and Unfiltered Garlic Mustard extracts
Test for Microbes
i Filtered Extract(0.2u millipore)
--'w- Bioassay*
Test for Microbes
Unfiltered Extract -
-Bioassay*
-~ Deionized H 20
Bioassay*
Deionized H20
Bioassay*(Autoclaved)
*All Bioassays conducted with surface sterilized lettuce seed
Figur*7
Fungi2% Malt Extract
BacteriaNutrient Agar
im- Fungi2% Malt Extract
P.- BacteriaNutrient Agar

Surface sterilized lettuce seeds were used in the bioassay .
•
Seeds were surface sterilized in 50% (V/V) Clorox bleach (5 .25% sodium
hypochlorite) solution for 1 .5 minutes and then washed twice in
sterile deionized water . Both sterilized and non-sterilized seeds
were placed on nutrient agar and 2% malt extract agar and checked for
germination and the growth of fungi and bacteria . There was no growth
of either fungi or bacteria in plates with surface sterilized seed
after four days, whereas fungi and bacteria developed in plates
containing non-sterilized seed . The percent germination for treated
and non-treated seeds was about the same (71% for surface sterilized
seed and 76% for non-sterilized seed) .
The allelopathic properties of millipore filtered and non-filtered
extracts were tested by placing twenty surface sterilized lettuce
seeds were placed on the surface of filter paper in twelve glass Petri
•
dishes (100 x 15 mm) that had been previously autoclaved for 90
minutes . The filter paper in four of the dishes was moistened with
10 ml of 1 :5 millipore filtered extract, 1 :5 non-filtered extract, or
sterile deionized water (control) . Petri dishes were placed in an
incubator maintained on a 10/14 hour day night cycle with light and
dark temperatures being 18/23 ° C . After 72 hours, the root lengths of
the lettuce seedlings were measured and the percent germination
determined for the treatments and the control .
Data were analyzed using oneway ANOVA and Tukey B mean separation
procedure . Filtered and non-filtered extracts inhibited the growth of
lettuce roots compared to the control but there was no difference in
root length between seeds exposed to millipore filtered or non-
filtered extract (Table 14) . These results indicate that the
64
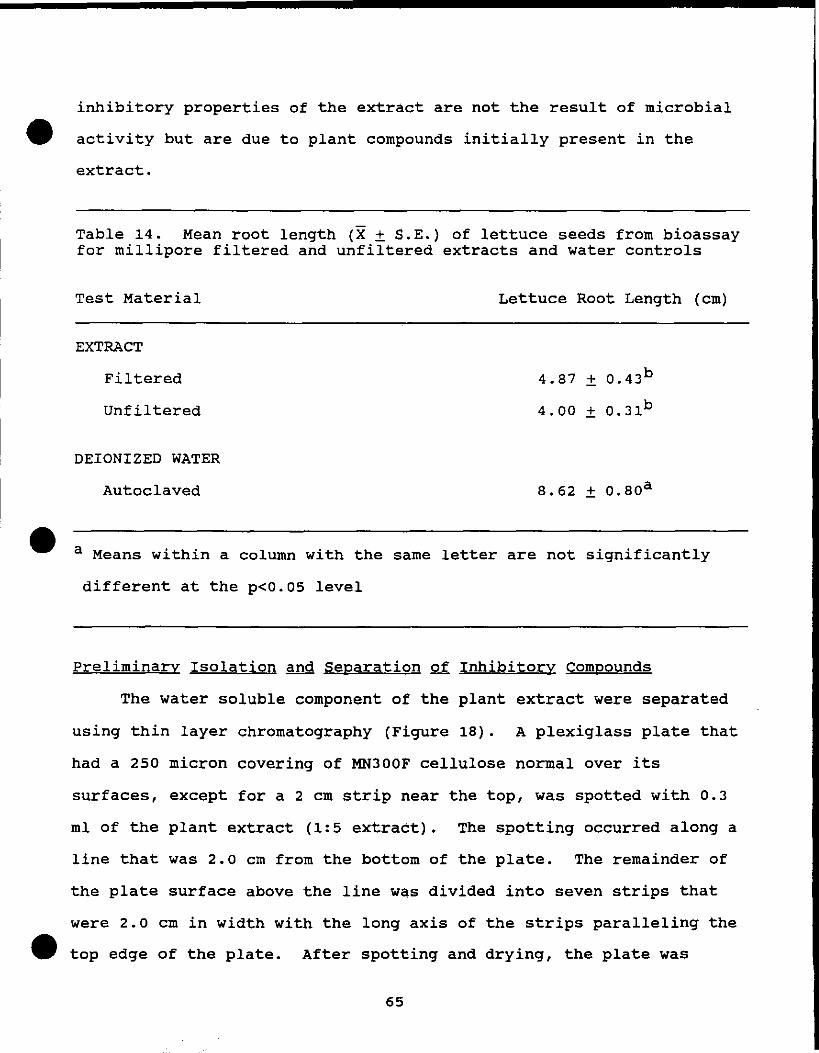
• a
inhibitory properties of the extract are not the result of microbial
activity but are due to plant compounds initially present in the
extract .
Table 14 . Mean root length (X ± S .E .) of lettuce seeds from bioassayfor millipore filtered and unfiltered extracts and water controls
Means within a column with the
different at the p<0 .05 level
same letter are not significantly
Preliminary Isolation and Separation of Inhibitory Compounds
The water soluble component of the plant extract were separated
using thin layer chromatography (Figure 18) . A plexiglass plate that
had a 250 micron covering of MN300F cellulose normal over its
surfaces, except for a 2 cm strip near the top, was spotted with 0 .3
ml of the plant extract (1 :5 extract) . The spotting occurred along a
line that was 2 .0 cm from the bottom of the plate . The remainder of
the plate surface above the line was divided into seven strips that
were 2 .0 cm in width with the long axis of the strips paralleling the
•
top edge of the plate . After spotting and drying, the plate was
65
Test Material Lettuce Root Length (cm)
EXTRACT
Filtered 4 .87 + 0 .43 b
Unfiltered 4 .00 + 0 .31 b
DEIONIZED WATER
Autoclaved 8 .62 + 0 .80 a

placed in a glass chromatographic chamber and deionized water was used
as the solvent . When the solvent front nearly reached the upper edge
of the top 2 .0 cm strip the plate was removed and dried . After
drying, the cellulose was removed from each 2 .0 cm strip and a 2 .0 cm
strip was also removed from below the line that had been spotted with
the extract . Each strip of cellulose was placed in a separate test
tube and 5 ml of deionized water was added to each tube . The contents
of the tube was mixed using a vortex mixer to suspend the cellulose
and elude water soluble consituents from it . After mixing, the liquid
in each tube was transferred to a centrifuge test tube and the
contents of the tube was centrifuged for five minutes to remove
suspended cellulose from the liquid .
The contents of the tubes were placed in separate lyophilization
•
tubes and frozen in liquid nitrogen . After freezing, all tubes were
placed in a lyophilization flask and lyophilized for 24 h . To each
tube, 3 .6 ml of deionized water were added to ensure that the
concentration of soluble materials in the resulting solution was not
greater than occurring in the 1 :5 plant extract. From each tube, 0 .9
ml of the liquid was pipetted into the bottom of each of four plastic
Petri dishes (50 x 10 mm) that were lined with a single layer of
filter paper . Ten lettuce seeds were placed on the surface
of each filter paper . To reduce evaporation and drying out of the
filter paper, which was a problem in early trails of this experiment,
the Petri dishes were placed in a plastic pan that had a thin layer of
water in the bottom (@ 3 mm) . The plastic pan was covered with a
layer of transparent plastic . The seeds were incubated under
66

Procedures for TLC Separation
Plant Extract (1 :5)
aTLC
Division of Cellulose into 8 2 cm - strips
aElude Strips (H 20)
4
1Centrifuge
Lyophylization
iReconstitute (H20)
aBioassay
67
a
Figure 18

conditions of a 10/14 h dark/light cycle and with temperatures of
18/23 ° C for 72 h .
Germination of lettuce seeds exposed to the liquid resulting from
the eluding of each of the eight cellulose strips and deionized water
was recorded after 24, 48 . and 72 h . Differences in the proportion of
germinated and non-germinated seeds for the eight treatments and the
control was tested using chi-square .
Only the lettuce seeds exposed to the liquid produced by eluding
the upper cellulose strip had significantly shorter root lengths than
the control (Table 15) . This indicates that the inhibitory compound
is very soluble in water . We are presently being assisted by a
biochemist to further characterize this compound .
68

• Table 15 . Average root length (X ± S .E .) of lettuce seeds from
bioassay for extract eluded from TLC strips
a Means withing a column with the same letterdifferent at the p<0 .05 level
69
are not significantly
Chi-square analysis indicated that the liquid produced by eluding
the upper cellulose strip had a smaller portion of seeds germinate
than the control and the liquids produced by eluding the seven other
cellulose strips (Table 16) . However, after 72 hours there were no
significant differences in germination between the eight treatments
and the control . This suggest that the inhibitory compound affects
the seed by slowing germination and seedling growth rather than
preventing germination .
Lettuce Root Lenqth (cm)
TLC Strip X + S . E .
1(Bottom) 19 .8974 + 1 .5654b
2 21 .2973 + 1 .6961b
3 24 .0263 + 1 .6189b
4 24 .9118 + 1 .6549 b
5 20 .8649 + 1 .9937 b
6 25 .9250 + 1 .6963b
7 21 .9231 + 1 .1792b
8 (Top) 5 .4000 + .5437 a
Control 25 .5429 + 1 .8368 b

* The proportion of germinated and ungerminated seeds weresignificantly different than the controls using chi-square analysis,p<0 .005
70
• Table 16 . Percent germination of lettuce seeds (N=40)tests of eluded TLC strips
in bioassay
Time 24H 48h 72H
TLC Strip
1 56% 72% 78%
2 56% 72% 74%
3 58% 72% 76%
4 52% 68% 68%
5 48% 70% 74%
6 58% 78% 80%
7 62% 74% 68%
8 6$ * 42% * 60%
Control A 58% 70% 70%
• Control B 54% 74% 78%

Other StudiesRelatedtoInvestigationofthe Allelopathic Properties
Seeds of garlic mustard were also examined to determine if there
are chemicals in the seeds that are inhibitory to seed germination .
when scarified seeds of garlic mustard are placed on moist filter
paper a brownish stain forms around each seed within 24 h suggesting
that chemicals present in the seed diffuse out and are present in the
area immediately adjacent to the seed . We placed radish seeds on
moisten filter paper adjacent to scarified and non-scarified garlic
mustard seeds and lettuce seeds . Radish seeds were also placed next
to scarified and non-scarified garlic mustards 24 h after they were
placed on filter paper moistened with deionized water . This was done
to determine if the prescence of the compounds on the filter paper
when the radish seeds begin to take up water would be more effective
in inhibiting growth than having compounds diffuse out after the
radish seeds were placed on the filter paper . Test seeds, those being
examined for potential allelopathic properties, and control seeds
(lettuce) were located in a 6 x 6 cm grid (36 seeds) in the middle of
a glass Petri dish . Seeds of the bioassay species (radish) were
located in rows between the test species or control, so that there
were five seeds in each of five rows . Each bioassay seed was adjacent
to four test or control seeds . There was no significant differences
in plant axis length or germination between seeds exposed to the
various conditions (Table 17) .
7 1,

RadishPlantAxisLength(cm)
Test Material
X + S .E .-----------------------------------------------------------------------------------------------
Table 17 .
Mean Plant Axis Length (X ± S .E .) of Radish Seedlings From Bioassay Test forInhibitory Compounds Released From Garlic Mustard Seed
a Means within a column with the same letter are not significantly different at the P<0 .05 level
Scarified Seed
Simultaneous Placement 17 .9880 + .7642 a
24-Hour Delay 20 .4697 + 1 .2220a
Control (lettuce)
Simultaneous Placement 18 .7083 + 1 .1172 a
24-Hour Delay 19 .9701 + 1 .1849a
on-Scarified Seed
Simultaneous Placement 18 .5319 + 1 .1787 a
24-Hour Delay 20 .8125 + 1 .1295a

The radish seed were also placed on soil in glass Petri dishes
that was collected from beneath garlic mustard plants or from around
the roots system of the plant (rhizosphere soil) and on soil collected
from areas where garlic
differences in germination or seedling growth for seeds germinated
under the various conditions .
mustard was not present . There were no
7 3
Copyright © 2022 FDOKUMEN