Antibacterial activity of garlic (Allium sativum) against probiotic ...
189
Antibacterial activity of garlic (Allium sativum) against probiotic Bifidobacterium species BY Jemma Booyens Submitted in partial fulfilment of the requirements for the degree Magister Scientiae In the Faculty of Natural and Agricultural Sciences, Department of Microbiology and Plant Pathology, University of Pretoria, Pretoria, South Africa June 2013 Supervisor: Dr. M.S. Thantsha © University of Pretoria
-
Upload
khangminh22 -
Category
Documents
-
view
0 -
download
0
Transcript of Antibacterial activity of garlic (Allium sativum) against probiotic ...

Antibacterial activity of garlic (Allium sativum) against
probiotic Bifidobacterium species
BY
Jemma Booyens
Submitted in partial fulfilment of the requirements for the degree
Magister Scientiae
In the Faculty of Natural and Agricultural Sciences, Department of Microbiology and Plant
Pathology, University of Pretoria, Pretoria, South Africa
June 2013
Supervisor: Dr. M.S. Thantsha
©© UUnniivveerrssiittyy ooff PPrreettoorriiaa

Declaration
I declare that the dissertation “Antibacterial activity of garlic (Allium sativum) against probiotic
Bifidobacterium species”, which I hereby submit for the degree Magister Scientiae at the
University of Pretoria, is my own work and has not previously been submitted by me for a
degree at this or any other tertiary institution.
…………………………………………..
©© UUnniivveerrssiittyy ooff PPrreettoorriiaa

i
TABLE OF CONTENTS
Acknowledgements..................................................................................................................viii
Publications and conference contributions................................................................................ix
List of abbreviations....................................................................................................................x
List of tables............................................................................................................................xiii
List of figures...........................................................................................................................xiv
Summary................................................................................................................................xviii
INTRODUCTION.......................................................................................................................1
REFERENCES............................................................................................................................4
CHAPTER 1: LITERATURE REVIEW
1.1 The human gastrointestinal tract (GIT).....................................................................8
1.2 Probiotics...................................................................................................................8
1.2.1 History..............................................................................................................8
1.2.2 Definition..........................................................................................................9
1.2.3 Microorganisms used as probiotics...................................................................9
1.2.4 Selection criteria.............................................................................................10
1.2.5 Health benefits of probiotics...........................................................................11
1.2.5.1 Prevention and treatment of gastrointestinal disorders......................11
1.2.5.2 Immunomodulation effects................................................................12
1.2.5.3 Antimutagenic and anticarcinogenic effects......................................12
1.2.5.4 Irritable bowel syndrome (IBS).........................................................13
1.2.5.5 Hypocholesterolemic effects..............................................................13
1.2.5.6 Treatment of lactose intolerance........................................................14
1.2.5.7 Prevention of hepatic encephalopathy...............................................14
1.2.5.8 Additional health benefits..................................................................14
1.2.6 Mechanism of action.......................................................................................14
1.2.6.1 Antimicrobial activity.........................................................................14
©© UUnniivveerrssiittyy ooff PPrreettoorriiaa

ii
1.2.6.2 Improved barrier function...................................................................15
1.2.6.3 Enhancement of host immune functions.............................................15
1.2.7 Concerns about the use of probiotics..............................................................15
1.2.8 Prebiotics and synbiotics................................................................................16
1.2.8.1 Prebiotics............................................................................................16
1.2.8.2 Synbiotics............................................................................................17
1.3 Bifidobacteria..........................................................................................................17
1.3.1 Morphology and physiology..........................................................................18
1.3.2 Identification..................................................................................................19
1.3.3 Ecology..........................................................................................................19
1.3.4 Susceptibility to antimicrobials.....................................................................20
1.3.4.1 Antimicrobial susceptibility testing methods....................................22
1.3.4.1.1 Agar dilution method..........................................................22
1.3.4.1.2 Disk diffusion (DD) method...............................................23
1.3.4.1.3 Broth-dilution method.........................................................23
1.3.4.1.4 The E-test............................................................................24
1.3.5 Isolation and enumeration..............................................................................24
1.4 Viability assessment of Bifidobacteria...................................................................25
1.4.1 Molecular techniques.....................................................................................27
1.4.2 Flow cytometry..............................................................................................27
1.4.3 Microscopy....................................................................................................29
1.4.3.1 Fluorescent microscopy.....................................................................29
1.4.3.2 Scanning electron microscopy (SEM)...............................................30
1.4.3.3 Infrared (IR) and Raman spectroscopies...........................................31
1.4.4 Microplate assays...........................................................................................32
1.5 Garlic (Allium sativum)...........................................................................................33
1.5.1 History...........................................................................................................33
1.5.2 Health benefits...............................................................................................34
©© UUnniivveerrssiittyy ooff PPrreettoorriiaa

iii
1.5.2.1 Effects related to cardiovascular disease...........................................34
1.5.2.2 Anticarcinogenic and antimutagenic activities..................................35
1.5.2.3 Immune-enhancing effects.................................................................35
1.5.2.4 Other health benefits..........................................................................36
1.5.3 Antimicrobial activity....................................................................................36
1.5.4 Antimicrobial compounds in garlic...............................................................37
1.5.5 Mechanism of action of garlic........................................................................38
1.5.6 Adverse effects...............................................................................................38
1.5.7 Garlic preparations..........................................................................................38
1.6 Conclusions.............................................................................................................40
1.7 References...............................................................................................................41
CHAPTER 2: ASSESSMENT OF BIFIDOBACTERIUM SUSCEPTIBILITY TO
INHIBITORY EFFECTS OF DIFFERENT GARLIC (ALLIUM SATIVUM)
PREPARATIONS: AN IN VITRO STUDY
2.1 Abstract..................................................................................................................55
2.2 Introduction............................................................................................................56
2.3 Materials and methods...........................................................................................58
2.3.1 Microorganisms............................................................................................58
2.3.2 Garlic preparations........................................................................................58
2.3.2.1 Preparation of garlic extract..............................................................58
2.3.2.2 Determination of final concentration of garlic and allicin in
solution..............................................................................................58
2.3.3 Determination of actual allicin concentration...............................................59
2.3.4 Preparation of inoculums...............................................................................59
2.3.5 Phosphoketolase assay...................................................................................59
2.3.6 Disk diffusion (DD) assay.............................................................................60
2.3.7 Viable plate counts.........................................................................................60
©© UUnniivveerrssiittyy ooff PPrreettoorriiaa

iv
2.3.8 Determination of minimum exposure times (Time kill curves).....................60
2.3.9 MIC and MBC determinations.......................................................................61
2.3.10 Statistical analysis.........................................................................................61
2.4 Results and discussion.............................................................................................62
2.4.1 Determination of the antibacterial activity using the disk diffusion
(DD) assay.........................................................................................................62
2.4.2 Minimum exposure times................................................................................66
2.4.2.1 B. bifidum LMG 11041.......................................................................66
2.4.2.2 B. longum Bb 536...............................................................................69
2.4.2.3 B. longum LMG 13197.......................................................................69
2.4.2.4 B. lactis Bb12......................................................................................72
2.4.2.5 B. lactis Bi-07 300B............................................................................72
2.4.2.6 L. acidophilus La14 150B...................................................................72
2.4.3 MICs and MBCs..............................................................................................76
2.5 Conclusions..............................................................................................................79
2.6 References................................................................................................................80
CHAPTER 3: MORPHOLOGICAL PROPERTIES OF GARLIC (ALLIUM SATIVUM)
TREATED BIFIDOBACTERIA AS DEPICTED BY SCANNING ELECTRON
MICROSCOPY (SEM)
3.1 Abstract....................................................................................................................86
3.2 Introduction..............................................................................................................87
3.3 Materials and methods.............................................................................................89
3.3.1 Bacterial cultures............................................................................................89
3.3.2 Preparation of inoculums.................................................................................89
3.3.3 Garlic preparations...........................................................................................89
3.3.3.1 Preparation of garlic extracts and determination of final
concentration of garlic in solution....................................................89
©© UUnniivveerrssiittyy ooff PPrreettoorriiaa

v
3.3.4 Scanning electron microscopy.........................................................................90
3.4 Results and discussion.............................................................................................90
3.4.1 L. acidophilus La14 150B................................................................................90
3.4.2 B. bifidum LMG 11041....................................................................................91
3.4.3 B. longum LMG 13197....................................................................................93
3.4.4 B. longum Bb536.............................................................................................94
3.4.5 B. lactis Bb12...................................................................................................95
3.4.6 B. lactis Bi-07 300B.........................................................................................96
3.5 Conclusions..............................................................................................................99
3.6 References..............................................................................................................100
CHAPTER 4: FOURIER-TRANSFORM INFRARED (FT-IR) SPECTROSCOPY
ANALYSIS OF SELECTED BIFIDOBACTERIUM SPP. TREATED WITH GARLIC
(ALLIUM SATIVUM) CLOVE EXTRACT
4.1 Abstract..................................................................................................................105
4.2 Introduction............................................................................................................106
4.3 Materials and methods...........................................................................................108
4.3.1 Culture preparation........................................................................................108
4.3.2 Preparation of bacteria for FT-IR..................................................................109
4.3.3 FT-IR spectroscopy and spectral measurements...........................................109
4.3.4 Data analysis..................................................................................................109
4.4 Results and discussion...........................................................................................109
4.4.1 FT-IR spectral measurements........................................................................113
4.4.1.1 B. bifidum LMG 11041......................................................................113
4.4.1.2 B. longum LMG 13197.......................................................................118
4.4.1.3 B. lactis Bb12......................................................................................122
4.4.2 PCA data........................................................................................................125
4.5 Conclusions............................................................................................................130
©© UUnniivveerrssiittyy ooff PPrreettoorriiaa

vi
4.6 References..............................................................................................................131
CHAPTER 5: FLOW CYTOMETRIC VIABILITY ASSESSMENT OF SELECTED
BIFIDOBACTERIUM SPP. EXPOSED TO GARLIC (ALLIUM SATIVUM) CLOVE
EXTRACT
5.1 Abstract..................................................................................................................136
5.2 Introduction............................................................................................................137
5.3 Materials and methods...........................................................................................139
5.3.1 Bacterial cultures...........................................................................................139
5.3.2 Preparation of inocula and exposure to garlic clove extract..........................139
5.3.3 Staining of bacteria for flow cytometric analysis..........................................139
5.3.4 Flow cytometry analyses...............................................................................140
5.3.5 Data analysis..................................................................................................140
5.3.6 Revival of stained treated cells......................................................................140
5.3.7 Statistical analysis..........................................................................................141
5.4 Results and discussion...........................................................................................141
5.4.1 Flow cytometric data interpretation...............................................................141
5.4.1.1 L. acidophilus La14 150B...................................................................142
5.4.1.2 B. bifidum LMG 11041.......................................................................145
5.4.1.3 B. longum LMG 13197.......................................................................148
5.4.1.4 B. lactis Bb12......................................................................................151
5.4.2 Determination of recovery of damaged cells.................................................154
5.4.2.1 B. bifidum LMG 11041.......................................................................155
5.4.2.2 B. longum LMG 13197.......................................................................156
5.4.2.3 B. lactis Bb12......................................................................................157
5.5 Conclusions...........................................................................................................158
5.6 References.............................................................................................................159
©© UUnniivveerrssiittyy ooff PPrreettoorriiaa

vii
CHAPTER 6: GENERAL CONCLUSIONS AND RECOMMENDATIONS....................................163
Appendix...............................................................................................................................................167
©© UUnniivveerrssiittyy ooff PPrreettoorriiaa

viii
ACKNOWLEDGEMENTS
Dr. M.S. Thantsha, my supervisor, for all her guidance, advice and support throughout the
years. It was wonderful working with her and she provided me with invaluable knowledge.
Mr A. Hall and Mr C. van der Merwe, Laboratory of Microscopy and Microanalysis, for all
their technical assistance and advice with the scanning electron microscope.
Dr L. Prinsloo, Department of Physics, for her technical assistance and expertise with the FT-
IR microscope.
Mr W. Barnes, Dr A. Smit and Mrs P. Kapewangolo, for their technical assistance with flow
cytometry.
All the staff and students at the Department of Microbiology and Plant Pathology who made
my time at the University enjoyable.
The University of Pretoria and the National Research Foundation for financial support.
All the members and work colleagues at Stimuplant for your encouragement and
understanding when I needed leave from work to go to University.
Friends and family, especially my sister, grandmother and aunt, for always being there for me
and for all your support and encouragement.
My Mom and Dean for never failing to believe in me. Without your support this would never
have been possible.
Lastly and most importantly, God, for giving me strength and faith to complete my studies
and for constantly being with me throughout this incredible journey.
©© UUnniivveerrssiittyy ooff PPrreettoorriiaa

ix
PUBLICATIONS AND CONFERENCE CONTRIBUTIONS
Research articles
Booyens, J, Thantsha, M.S 2013 ‘Antibacterial effect of hydrosoluble extracts of garlic
(Allium sativum) against Bifidobacterium spp. and Lactobacillus acidophilus’, African
Journal of Microbiology Research, vol. 7, no. 8, pp. 669-677.
Booyens, J, Labuschagne, M.C & Thantsha, M.S 2013, ‘In vitro antibacterial mechanism of
action of crude Garlic (Allium sativum) clove extract on selected probiotic Bifidobacterium
species as revealed by SEM, TEM and SDS-PAGE analysis’, Probiotics and Antimicrobial
Proteins (Accepted).
Book chapter
Thantsha, M.S., Mamvura, C.I., Booyens, J. Probiotics: what they are, their benefits and
challenges in ‘New Advances in the Basic and Clinical Gastroenterology’. Editor Tomasz
Brzozowski. ISBN 978-953-51-0521-3, InTech, April 4, 2012.
Conference Proceedings
Booyens, J, Hall, A.N & Thantsha, M.S 2011 ‘Morphological effects of garlic on selected
bifidobacterial species as determined by influence of garlic on morphology of
Bifidobacterium species as determined by SEM’, Proceedings of Microscopy Society of
Southern Africa, vol. 41, pp. 7. ISSN: 0250-0418:ISBN 0-620-35056-3.
Conference papers
National
Booyens, J, Thantsha, M.S & Hall, A.N. ‘Influence of garlic on morphology of
Bifidobacterium species as determined by SEM’, Microscopy Society of Southern Africa
(MSSA) conference. CSIR Conference Centre, Pretoria, 7-9 December, 2011 (Oral
presentation).
©© UUnniivveerrssiittyy ooff PPrreettoorriiaa

x
Booyens, J & Thantsha, M.S. ‘In vitro assessment of the antibacterial activity of garlic on
selected Bifidobacterium strains’, South African Society for Microbiology (SASM)
conference. Southern Sun Cape Sun Hotel, Cape Town, 6-9 November, 2011 (Oral
presentation).
International
Booyens J & M. S. Thantsha. ‘Susceptibility of Bifidobacteria to the antimicrobial effects of
garlic (Allium Sativum)’, 15th
World Congress of Food Science and Technology- IUFoST
2010, Cape Town ICC, 22-26 August 2010 (Poster Presentation).
Booyens J & M. S. Thantsha. ‘Susceptibility of Bifidobacteria to the antimicrobial effects of
garlic (Allium Sativum)’ 4th
International Scientific Conference on Probiotics and Prebiotics-
IPC2010. 14-17 June 2010. Doubletree by Hilton, Kosice, Slovakia (Oral Presentation).
©© UUnniivveerrssiittyy ooff PPrreettoorriiaa

xi
LIST OF ABBREVIATIONS
4-MP: 4-mercaptopyridine
AAD: Antibiotic-associated diarrhea
AGE: Aged garlic extract
AMP: Ampicillin
ARDRA: Amplified ribosomal DNA restriction analysis
cF: Carboxyfluorescein
cFDA: Carboxyfluorescein diacetate
cfu: Colony forming units
CSLM: Confocal scanning laser microscopy
DAS: Diallyl sulphide
DD: Disk diffusion
DNA: Deoxyribonucleic acid
EPS: Extracellular polysaccharides
ESEM: Environmental scanning electron microscope
FAO-WHO: Food and Agriculture Organization of the United Nations - World Health
Organization
F6PPK: Fructose-6-phosphate phosphoketolase enzyme
FS: Forward scatter
FT-IR: Fourier-transform infrared
GC: Garlic clove
GIT: Gastrointestinal tract
GP: Garlic paste
Gp: Garlic powder
GRAS: Generally regarded as safe
GS: Garlic spice
HDL: High density lipoproteins
HIV: Human immunodeficiency virus
©© UUnniivveerrssiittyy ooff PPrreettoorriiaa

xii
IBS: Irritable bowel syndrome
IgA: Immunoglobulin A
IR: Infrared
ISA: Iso-Sensitest agar
ISAPP: International Scientific Association for Probiotics and Prebiotics
LAB: Lactic acid bacteria
LDL: Low density lipoproteins
LSM + cysteine: LAB susceptibility test medium supplemented with cysteine
MBC: Minimum bactericidal concentration
MIC: Minimum inhibitory concentration
MRS: De Man Rogosa Sharpe
MSA: Multiplicative scatter correction
NASBA: Nucleic acid sequence-based amplification
NK: Natural killer
NO: Nitric oxide
PCA: Principle component analysis
PCR: Polymerase chain reaction
PI: Propidium iodide
rep-PCR: repetitive sequence-based PCR
RT-PCR: Reverse transcriptase PCR
RNA: Ribonucleic acid
rRNA: Ribosomal RNA
RT-SDA: Reverse transcriptase-strand displacement amplification
SAC: S-allyl cysteine
SEM: Scanning electron microscopy
SSC: Side scatter
TLRs: Toll-like receptors
VBNC: Viable but not culturable
VLDL: Very low density lipoproteins
©© UUnniivveerrssiittyy ooff PPrreettoorriiaa

xiii
LIST OF TABLES
Table 1.1: Antibiotics to which Bifidobacterium spp. are resistant and susceptible to, as well
as those antibiotics which have variable effectivity ................................................21
Table 2.1: Allicin concentration of garlic preparations.............................................................62
Table 2.2: Antibacterial activity of different garlic preparations..............................................63
Table 2.3: Inhibitory effect (MIC and MBC) of different garlic extracts on tested
Bifidobacterium strains...........................................................................................77
Table 4.1: Assignment of bands frequently found in FT-IR spectra of microorganisms (4000
-400 cm-1
.................................................................................................................111
Table 5.1: Percentages of live, dead, lysed/unstained cells and compromised/damaged cell of
B. bifidum LMG 11041, B. longum LMG 13197 and B. lactis Bb12 treated with GC
extract and after re-inoculation in the absence of GC extract................................155
©© UUnniivveerrssiittyy ooff PPrreettoorriiaa

xiv
LIST OF FIGURES
Figure 2.1: Inhibition zones of the Bifidobacterium strains to the garlic preparations: L.
acidophilus La14 150B (A), B. lactis Bi-07 300B (B), B. longum Bb536 (C),
B.longum LMG 11041 (D), B. lactis Bb12 (E) and B. longum LMG 13197 (F)
exposed to distilled water (W), garlic clove extract (C and FE), garlic paste (P),
garlic powder (Gp) and garlic spice (GS)……………………………………65
Figure 2.2: The effect of GC, Gp, GP and GS on B. bifidum LMG 11041 viability with time
with untreated cell suspensions and ampicillin (Amp) as negative and positive
controls respectively..............................................................................................67
Figure 2.3: The effect of GC, Gp, GP and GS on B. longum Bb 536 viability with time with
untreated cell suspensions and ampicillin (Amp) as negative and positive
controls, respectively.............................................................................................68
Figure 2.4: The effect of GC, Gp, GP and GS on B. longum LMG 13197 viability with time
with cell suspensions and ampicillin (Amp) as negative and positive controls,
respectively............................................................................................................70
Figure 2.5: The effect of GC, Gp, GP and GS on B. lactis Bb12 viability with time with
untreated cell suspensions and ampicillin (Amp) as negative and positive
controls, respectively.............................................................................................71
Figure 2.6: The effect of GC, Gp, GP and GS on B. lactis Bi-0-7 300B viability with time
with untreated cell suspensions and ampicillin (Amp) as negative and positive
controls, respectively.............................................................................................73
Figure 2.7: The effect of GC, Gp, GP and GS on L. acidophilus La14 150B viability with
time with untreated cell suspensions and ampicillin (Amp) as negative and
positive controls, respectively................................................................................74
Figure 3.1: Scanning electron micrographs of L. acidophilus La14 150B before (A) and after
exposure to ampicillin (B) and GC extract (C)......................................................91
©© UUnniivveerrssiittyy ooff PPrreettoorriiaa
xv
Figure 3.2: Scanning electron images of B. bifidum LMG 11041. Morphological
characteristics before (A) and after exposure to ampicillin (B), GP (C) and GC
(D-E) extract....................................................................................................92
Figure 3.3: SEM images showing morphological changes in B. longum LMG 13197 before
(A-B) and after exposure to ampicillin (C), GC (D-G) and GP extract (H-J).......94
Figure 3.4: SEM images showing changes in morphology to B. longum Bb536 before (A) and
after exposure to GC (B-E) and GP extract (F)......................................................95
Figure 3.5: SEM images showing B. lactis Bb12 before (A) and after treatment with positive
control, ampicillin (B) and GC extract (C-D).........................................................96
Figure 3.6: SEM images of B. lactis Bi-07 300B before (A) and after exposure to ampicillin
(B) and GC extract (C-E)........................................................................................97
Figure 4.1: Mean FT-IR spectra of untreated B. bifidum LMG 11041 showing the major
bands and regions (I-IV) (4000 to 850 cm-1
) of most bacterial specimen...........112
Figure 4.2: Micrographs of untreated (A, B) and garlic-treated (C, D) B. bifidum LMG 11041
samples………………..........................................................................................113
Figure 4.3: Average FT-IR spectra of B. bifidum LMG 11041 (Untreated: black; Garlic-
treated: pink).........................................................................................................114
Figure 4.4: Close up of the shift in peaks at 3290 cm-1
and 2930 cm-1
for B. bifidum LMG
11041. Untreated (black), garlic-treated (pink).....................................................115
Figure 4.5: FT-IR spectra of B. bifidum LMG 11041 denoting shifts in the Amide I and
Amide II peaks as well as an increase in band intensities (Black: untreated; Pink:
garlic-treated)........................................................................................................116
Figure 4.6: Spectra of B. bifidum LMG 11041 showing a shift at peaks 1234 and 1072 cm-1
as
well as drop in intensity between 1280 and 1000 cm-1
........................................117
Figure 4.7: Micrographs of untreated (A, B) and garlic-treated (C, D) B. longum LMG 13197
samples..................................................................................................................119
Figure 4.8: FT-IR spectra of non-treated and garlic-treated B. longum LMG 13197 samples
(untreated: black; garlic-treated; blue)..................................................................120
©© UUnniivveerrssiittyy ooff PPrreettoorriiaa

xvi
Figure 4.9: FT-IR spectra of B. longum LMG 13197 untreated (black) and garlic-treated
(blue) samples showing peak shifts, drop in intensity as well as decrease in area in
the lipid region.....................................................................................................121
Figure 4.10: Shift in peaks at Amide I (1650 cm-1
), Amide II (1545 cm-1
) and 1395 cm-1
....121
Figure 4.11: Micrographs of untreated (A, B) and garlic-treated (C, D) B. lactis Bb12
samples................................................................................................................123
Figure 4.12: FT-IR spectra of garlic-treated (red) and untreated (Black) samples of B. lactis
Bb12...................................................................................................................124
Figure 4.13: PCA of the first derivative and multiplicative scatter correction (MSC) of B.
bifidum LMG 11041 for all spectral regions (4000-850 cm-1
) (A), region I (3000-
2400 cm-1
) (B), region II (1800-1500 cm-1
) (C), region III (1500-1200 cm-1
) (D)
and region IV (1200-900 cm-1
(E). Blue: untreated samples; pink: garlic
treated samples...................................................................................................126
Figure 4.14: PCA of the first derivative and multiplicative scatter correction (MSC) of B.
longum LMG 13197 for all spectral regions (4000-850 cm-1
) (A), region I (3000-
2400 cm-1
) (B), region II (1800-1500 cm-1
) (C), region III (1500-1200 cm-1
) (D)
and region IV (1200-900 cm-1
(E). Blue: untreated samples; pink: garlic treated
samples................................................................................................................128
Figure 4.15: PCA of the first derivative and multiplicative scatter correction (MSC) of B.
lactis Bb12 for all spectral regions (4000-850 cm-1
) (A), region I (3000-2400 cm-
1) (B), region II (1800-1500 cm
-1) (C), region III (1500-1200 cm
-1) (D) and
region IV (1200-900 cm-1
(E). Blue: untreated samples; pink: garlic treated
samples...............................................................................................................129
Figure 5.1: Fluorescence histograms showing compensation controls for L. acidophilus La14
150B: A: SYTO9 stained/SYTO9+; B: PI stained/PI
+; C: Unstained control/ PI
-;
D: Unstained control/ SYTO9-………………….................................................143
Figure 5.2: Flow cytometry dot plots of viable untreated (A), dead (B), unstained (C), Amp-
treated (D) and GC extract treated (E) L. acidophilus La14 150B cells..............144
©© UUnniivveerrssiittyy ooff PPrreettoorriiaa
xvii
Figure 5.3: Fluorescence histograms showing compensation controls for B. bifidum
LMG11041: A: SYTO9 stained/SYTO9+; B: PI stained/PI
+; C: Unstained
control/ PI-; D: Unstained control/ SYTO9
-......................................................146
Figure 5.4: Flow cytometry dot plots of viable untreated (A), dead (B), unstained (C),
ampicillin-treated (D) and GC extract treated (E) B. bifidum LMG 11041 cells..147
Figure 5.5: Fluorescence histograms showing compensation controls for B. longum LMG
13197: A: SYTO9 stained/SYTO9+; B: PI stained/PI
+; C: Unstained control/ PI
-;
D: Unstained control/ SYTO9-.............................................................................149
Figure 5.6: Flow cytometry dot plots of viable untreated (A), dead (B), unstained (C),
ampicillin-treated (D) and GC extract treated (E) B. longum LMG 13197
cells…………………………………………………………………………......150
Figure 5.7: Fluorescence histograms showing compensation controls for B. lactis Bb12: A:
SYTO9 stained/SYTO9+; B: PI stained/PI
+; C: Unstained control/ PI
-; D:
Unstained control/SYTO9-..................................................................................152
Figure 5.8: Flow cytometry dot plots of viable untreated (A), dead (B), unstained (C),
ampicillin-treated (D) and GC extract treated (E) B. lactis Bb12 cells………...153
Figure 5.9: Flow cytometry dot plots of GC extract treated B. bifidum LMG 11041 cells after
initial staining (A) and after re-inoculation into fresh broth (B)…………….….156
Figure 5.10: Flow cytometry dot plots of GC extract treated B. longum LMG 13197 cells
after initial staining (A) and after re-inoculation into fresh broth (B)………...157
Figure 5.11: Flow cytometry dot plots of GC extract treated B. lactis Bb12 cells after initial
staining (A) and after re-inoculation into fresh broth (B)…….…...…………..158
©© UUnniivveerrssiittyy ooff PPrreettoorriiaa

xviii
SUMMARY
Antibacterial activity of garlic (Allium sativum) against probiotic Bifidobacterium species
Student : Booyens Jemma
Supervisor : Dr. M.S. Thantsha
Department : Microbiology and Plant Pathology
Degree : MSc (Microbiology)
During the past decade there has been an explosion in the probiotic industry due to an
increase in concern for health. It is well known that these probiotic products offer consumers
numerous health benefits and that viability of cultures in these products need to be maintained
at high levels. It is therefore important to test for antimicrobial compounds or substances that
may come into contact with probiotics and thereby negatively affect and decrease their
viability. Garlic (Allium sativum) has been used as a natural medicinal remedy for thousands
of years and research has shown that it has antimicrobial activity against a wide variety of
microorganisms. Although it has been tested against numerous pathogenic microorganisms,
there have been few studies on its effect on beneficial bacteria, specifically probiotic
Bifidobacterium species. A great amount of work and money is put into preparing probiotic
products with sufficient numbers of viable bacterial cells. All these are devoted to ensure that
the consumers seize the optimal purported health benefits from probiotic cultures
incorporated within the different products. Hence it is necessary to recognize any compound
or substance that poses a threat to viability of these probiotic cells, thereby rendering them
ineffective.
Therefore, the current study aimed at determining whether garlic had any antibacterial
activity towards selected Bifidobacterium spp. In vitro studies revealed that garlic has an
inhibitory effect on these specific probiotic bacteria. The disk diffusion assay revealed
antibacterial activity of garlic preparations characterized by inhibition zones ranging from
13.0 ± 1.7 to 36.7 ± 1.2 mm. Minimum inhibitory concentration (MIC) values for garlic clove
extract ranged from 75.9 to 303.5 mg/ml (estimated to contain 24.84 to 99.37 µg/ml allicin)
while the minimum bactericidal concentration (MBC) ranged from 10.24 to 198.74 µg/ml
©© UUnniivveerrssiittyy ooff PPrreettoorriiaa

xix
allicin. Susceptibility of the tested Bifidobacterium species to garlic varied between species as
well as between strains even within a small numbers of the tested bifidobacteria. Among the
tested Bifidobacterium spp., B. bifidum LMG 11041 was most susceptible to garlic, whereas
B. lactis Bi-07 300B was the most resistant. These results were contrary to what has been
generally published in literature, that garlic selectively kills pathogens without negatively
affecting beneficial bacteria. Garlic clove, garlic powder, garlic paste and garlic spice showed
varying degrees of potency, with fresh garlic clove extract and garlic paste extract having the
highest and lowest antibifidobacterial activity, respectively.
It became necessary to investigate the actual antibacterial mechanism of action of garlic on
Bifidobacterium spp., upon realization that its extracts inhibits growth of or kills some of
these bacteria, whose contribution to health and well being of consumers is to a large extent
dependent on their viability. This was determined by using scanning electron microscopy
(SEM) and Fourier-transform infrared (FT-IR) spectroscopy. Scanning electron microscopy
was used to investigate the effect of garlic on the morphology and cell surface properties of
the tested strains while FT-IR spectroscopy was used to determine any biochemical changes
taking place in garlic-treated bifidobacteria. Scanning electron microscopy showed various
morphological changes such as cell elongation, distorted cells with bulbous ends and cocci-
shaped cells. Behavioural changes were also observed such as swarming of cells was also
observed. FT-IR spectra confirmed that garlic damaged Bifidobacterium cells by inducing
biochemical changes within the cells. It identified some of the main targets sites of garlic on
bifidobacteria, mainly, the nucleic acids and fatty acids (lipids) in the cell membrane.
Flow cytometry analysis was used to determine the level at which the garlic decreased the
viability of Bifidobacterium cells as well as the extent of damage induced by the garlic.
Results revealed a drop in viability with associated decrease in stainability of some the cells,
for all strains upon treatment with garlic clove extract. The inability of cells to be stained by
nucleic acid stains, hence presence of cells referred to as ‘ghost cells’, has been associated
with extensive damage and lysis of cellular membranes resulting in loss nucleic acids.
Interestingly, re-inoculation of the cells analysed by flow cytometry into a fresh growth
medium and their subsequent reanalysis using the same technique showed an increase in
percentage of viable cells and a decrease in percentages of damaged, unstained and dead cells.
This suggested that injured cells were able to recover and regress to their active state.
©© UUnniivveerrssiittyy ooff PPrreettoorriiaa

xx
Therefore, Bifidobacterium cells exposed to sub lethal amounts of garlic can repair any
damage and regrow. However, it was not determined how long active compounds of garlic
remain stable within the gastrointestinal tract.
This study is the first, according to our knowledge, to show that garlic exhibits antibacterial
activity against beneficial bacteria specifically, probiotic bifidobacteria. Furthermore, the
results revealed that the mechanism of action of garlic towards bifidobacteria is similar to that
which was reported for pathogenic bacteria. Bacterial death and growth inhibition occurs due
to damage to the fatty acids/lipids in the cell membrane, modification of the nucleic acids
(DNA and RNA).
This study is of significant importance to consumers, medical practitioners as well as to the
probiotic industry. It suggests that if garlic comes into contact with probiotic bifidobacteria,
they die and thus become unable to deliver the promised health benefits to the consumers.
Therefore, consumers should be advised against ingestion of probiotic products and garlic
simultaneously, as this study reveals that garlic does indeed inhibit some probiotic
Bifidobacterium spp. The probiotic industry should also consider including this information
on their product labels to make consumers aware of this fact. Failure to include this
information may lead to market deterioration due to loss of interest in the products as soon as
consumers realize they do not get their money’s worth from the products. Lastly, medical
practitioners should also be made aware of this as they also prescribe probiotics to patients for
various health reasons. The effect of food matrices on the antibacterial effects, as well as
determination of how long the active compounds of garlic remain within the gastrointestinal
tract, in relation to levels of garlic ingested will confirm whether indeed there is concern. But
for now, in light of results of the current study, caution needs to be taken in simultaneous use
of probiotics and garlic, until further testing indicates otherwise.
©© UUnniivveerrssiittyy ooff PPrreettoorriiaa

1
INTRODUCTION
The conception and evolution of probiotics began in 1907 when Metchnikoff proposed that
ingested bacteria, such as lactobacilli, are able to modify gut flora by replacing harmful
microbes with useful microbes (Dobrogosz et al., 2010; Amalaradjou and Bhunia, 2012). In
2002 the Food and Agriculture Organization of the United Nations - World Health
Organization (FAO-WHO) defined probiotics as “live microorganisms which, when
administered in adequate amounts confer health benefits on the host. These health benefits
include among others, assisting in food digestion and lactose intolerance, control of enteric
infections such as antibiotic-associated diarrhea (AAD), irritable bowel syndrome (IBS),
cholesterol-lowering, anticarcinogenic and antimycotic effects, treatment of allergies, eczema
and urinary tract infections (Kolida et al., 2006; Amalaradjou and Bhunia, 2012). The
probiotic industry has encountered many disbeliefs and scepticisms concerning probiotics‟
health benefits but numerous studies showing scientific evidence have proven this “probiotic
concept” correct (Lacroix and Yildirim, 2007; Dobrogosz et al., 2010; Aureli et al., 2011).
The most commonly used probiotics include strains of the genus Bifidobacterium,
Lactobacillus, Enterococcus, Streptococcus, Leuconostoc and Saccharomyces (Amalaradjou
and Bhunia, 2012).
Probiotics are available in conventional and fermented products for nutritional purpose such
as yoghurt, cheese, fruit juice and ice-cream (Fasoli et al., 2003; Champagne et al., 2011).
They are also found in food supplements or formulations and are available as dietary
supplements in the form of capsules or tablets, powders and even sprays (Fooks et al., 1999;
Fasoli et al., 2003; Kramer et al., 2009). Viability is an important requirement for optimal
probiotic functionality and products containing probiotics should contain 106-10
8 CFU/ g of
viable cells in order to confer health benefits (Kramer et al., 2009; Champagne et al., 2011).
Probiotics have a short shelf life as they are very sensitive to high temperatures, light, high
oxygen levels and moisture (Saxelin et al., 1999; O‟Riordan et al., 2001). Viability studies
are therefore critical in evaluating the quality of probiotic-carrying products not only to
ensure health benefits but also for economic reasons (Lacroix and Yildirim, 2007;
Champagne et al., 2011).
©© UUnniivveerrssiittyy ooff PPrreettoorriiaa

2
Interest in the use of natural remedies such as extracts from medicinal plants has also
increased. Recently, these extracts have been suggested as an alternative to antibiotics due to
the ever increasing resistance of pathogens to antibiotics (Nazir and Latif, 2012). Garlic
(Allium sativum) is one such plant that is used as a medicinal herb for its numerous health
benefits, and as a flavour enhancing agent. Health benefits for which garlic is used include
among others its antimicrobial, anti-inflammatory, antioxidant, antithrombotic and
anticarcinogenic effects (Capasso, 2013).
Numerous studies have demonstrated garlic‟s antibacterial activity against both Gram-
positive and Gram-negative bacteria including, among many others, species of Bacillus,
Clostridium, Klebsiella, Proteus and Streptococcus. Pathogenic bacteria such as Escherichia
coli, Helicobacter pylori, Salmonella typhi as well as methicillin-resistant Staphylococcus
aureus (MRSA) and Salmonella goldcoast are also inhibited by garlic (Gull et al., 2012;
Hannan et al., 2012; Gaekwad and Trivedi, 2013). In addition, it also possesses antifungal
and antiviral activities (Ankri and Mirelman, 1999; Goncagul and Ayaz, 2010). These
antimicrobial activities are mainly due to organosulfur compounds, such as allicin, ajoene and
diallylsulfides, which are released upon crushing of garlic clove tissue. Allicin is the main
active compound among these compounds. It is easily taken up by bacterial cells causing
damage by altering their membrane and in turn causing cell lysis and eventually death (Lu et
al., 2011). It affects bacterial cells by a number of different mechanisms, including total
inhibition of RNA synthesis and partially inhibition of DNA and protein synthesis (Al-Waili
et al., 2007; Deresse, 2010).
The similarities between the health effects of garlic and probiotics suggest that both of them
can be recommended to consumers for alleviation of diseases. This is especially possible
because it has been documented that garlic exerts differential inhibition between beneficial
and potentially harmful bacteria (Rees et al., 1993; Hayes, 1996). However, contrary to the
availability of extensive literature to indicate the effect of garlic on pathogens, there are few
studies on demonstrating its inability to harm beneficial bacteria. A few studies that are
available tested the susceptibility of lactic acid bacteria, specifically Lactobacillus
acidophilus and Enterobacter (Rees et al., 1993; Naganawa et al., 1996; O‟Gara et al., 2000;
Ross et al., 2001; Banerjee and Sarkar, 2003; Ruddock et al., 2005).
©© UUnniivveerrssiittyy ooff PPrreettoorriiaa

3
This study is significant as there is a need to know whether garlic will inhibit and decrease
the viability of probiotic bifidobacteria. Firstly, the cost of probiotics to the consumer is
relatively high due to commercialization of probiotic products requiring significant time and
costly research. Secondly, viability of the product is a very important aspect, not only in
terms of making sure the consumer gets what they are paying for, but also ensuring that they
get the optimal benefits promised from the products. Another reason to test if garlic inhibits
bifidobacteria is because medical practitioners prescribe probiotic products containing
bifidobacteria to patients for various reasons. If these patients were to ingest the probiotics
and garlic simultaneously, it would be a waste of money for the consumer as the probiotic
product would not provide the promised health effects, should garlic decrease viability of the
bifidobacteria in the probiotic product. As a result, testing probiotic products against various
compounds that may decrease their effectivity is very important.
To the best of our knowledge, there are no studies showing the effect of garlic on
Bifidobacterium species. Therefore, the main of this study was to determine the effects of
garlic on selected strains of probiotic Bifidobacterium species. The specific objectives were
to:
Determine whether different garlic preparations have an antimicrobial activity on
selected probiotic Bifidobacterium species.
Determine the mechanism of action of allicin on bifidobacteria using scanning
electron microscopy.
Determine internal biochemical changes on bifidobacteria treated with garlic clove
extract.
Determine the effect on the viability as well as the extent of damage of
Bifidobacterium spp. treated with garlic clove extract and possible recovery and
regrowth of injured/damaged cells.
©© UUnniivveerrssiittyy ooff PPrreettoorriiaa

4
REFERENCES
Al-Waili, N.S., Saloom, K.Y., Akmal, M, Al-Waili, T.N., Al-Waili, A.N., Al-Waili, H, Ali. A
& Al-Sahlani, K 2007, „Effects of heating, storage, and ultraviolet exposure on antimicrobial
activity of garlic juice‟, Journal of Medicinal Food, vol. 10, no. 1, pp. 208-212.
Amalaradjou, M.A.R & Bhunia, A.K 2012, „Chapter 5-Modern approaches in probiotics
research to control foodborne pathogens‟, Advances in Food and Nutrition Research, vol. 67,
pp. 185-239.
Ankri, S & Mirelman, D 1999, „Antimicrobial properties of allicin from garlic‟, Microbes
and Infection, vol.2, pp.125-129.
Aureli, P, Capurso, L, Castellazzi, A.M., Clerici, M, Giovannini, M, Morelli, L, Poli, A,
Pregliasco, F, Salvini, F & Zuccotti, G.V 2011, „Probiotics and health: An evidence-based
review‟, Pharmacological Research, vol 63, pp. 366-376.
Banerjee M & Sarkar, P.K 2003 „Inhibitory effect of garlic on bacterial pathogens from
spices‟, World Journal of Microbiology and Biotechnology, vol. 19, pp. 565-569.
Capasso, A 2013, „Antioxidant action and therapeutic efficacy of Allium sativum L.‟
Molecules, vol. 18, pp. 690-700.
Champagne, C.P., Ross, R.P., Saarela, M, Hansen, K.F & Charalampopoulos, D 2011,
„Recommendations for the viability assessment of probiotics as concentrated cultures and in
food matrices‟, International Journal of Food Microbiology, vol. 149, pp. 185-193.
Deresse, D 2010, „Antibacterial effect of garlic (Allium sativum) on Staphylococcu aureus:
An in vitro study‟, Asian Journal of Medical Sciences, vol. 2, no. 2, pp. 62-65.
Dobrogosz, W.J., Peacock, T.J & Hassan, H.M 2010, „Chapter 1-Evolution of the probiotic
concept: From conception to the validation and acceptance in medical science‟, Advances in
Applied Microbiology, vol. 72, pp. 1-41.
Fasoli, S, Marzotto, M, Rizzotti, L, Rossi, F, Dellaglio, F & Torriani, S 2003, „Bacterial
composition of commercial probiotic products as evaluated by PCR-DGGE analysis‟,
International Journal of Food Microbiology, vol. 82, pp.59-70.
©© UUnniivveerrssiittyy ooff PPrreettoorriiaa

5
Fooks, L.J., Fuller, R & Gibson, G.R 1999, „Prebiotics, probiotics and human gut
microbiology‟, International Dairy Journal, no. 9, pp. 53-61.
Gaekwad, V & Trivedi, N.A 2013, In vitro evaluation of antimicrobial effect of fresh garlic
extract and its interaction with conventional antimicrobials against Escherichia coli isolates‟,
International Journal of Current Research and Review, vol. 5, no. 1, pp. 106-114.
Goncagul, G & Ayaz, E, 2010, „Antimicrobial effect of garlic (Allium sativum) and
traditional medicine‟, Journal of Animal and Veterinary Advances, vol. 9, no. 1, pp. 1-4.
Gull, I, Saeed, H.S., Shahbaz, M.A., Zahoor, Q.S & Amin, M.A 2012, „Inhibitory effect of
Allium sativum and Zingiberofficinale extracts on clinically important drug resistant
pathogenic bacteria‟, Annals of Clinical Microbiology and Antimicrobials, vol. 11, no. 8, pp.
1-6.
Hannan, A, Rauf, K, Ullah, M.I., Naeem, T, Raja, M, Qamar, M.U., Tahir, R & Saba, M
2012, „Inhibitory effect of aqueous garlic (Allium sativum) extract against clinical isolates of
Salmonella typhi‟, African Journal of Microbiology Research, vol. 6, no. 21, pp. 4475-4480.
Hayes, A 1996 „Fight flu with lots of garlic‟. Sydney morning herald.
http://cabbagediet.com/au/cabbage-diet-articles/1996/5/29/fight-flu-with-lots-of-garlic/.
Accessed 24 February 2009.
Kolida, S, Saulnier, D.M & Gibson, G.R 2006, „Gastrointestinal Microflora: Probiotics‟,
Advances in Applied Microbiology, vol. 59, pp. 187-219.
Kramer, M, Obermajer, N, Matijašié, B.B., Rogelj, I & Kmetee, V 2009, „Quantification of
live and dead probiotic bacteria in lyophilised product by real-time PCR and by flow
cytometry‟, Applied Genetics and Molecular Biotechnology, vol. 84, no. 6, pp. 1137-1147.
Lacroix, C & Yildirim, S 2007, „Fermentation technologies for the production of probiotics
with high viability and functionality‟, Current Opinion in Biotechnology, vol. 18, pp. 176-
183.
Lu, X, Rasco, B.A., Jabal, J.M.F., Aston, D.E., Lin, M & Konkel, M.E 2011, „Investigating
antibacterial effects of garlic (Allium sativum) concentrate and garlic-derived organosulfur
compounds on Campylobacter jejuni by using fourier transform infrared spectroscopy, raman
©© UUnniivveerrssiittyy ooff PPrreettoorriiaa

6
spectroscopy, and electron microscopy‟, Applied and Environmental Microbiology, vol. 77,
no. 15, pp. 5257-5269.
Naganawa, R, Iwata, N, Ishikawa, K, Hiroyuki, F, Tsuchiyoshi, F & Suzuki, A 1996
„Inhibition of microbial growth by adjoene, a sulphur-containing compound derived from
garlic‟, Applied and Environmental Microbiology, vol. 62, pp. 4238-4242.
Nazir, S & Latif, Z 2012, „Screening of natural extracts for their antibacterial activity against
different enteric pathogens isolated from soil, water and rotten fruit samples‟, African Journal
of Biotechnology, vol. 11, no. 73, pp. 13814-13820.
O‟ Gara, E.A., Hill, D.J & Maslin, D.J 2000 „Activities of Garlic Oil, Garlic Powder, and
their diallyl constituents against Helicobacter pylori‟, Applied and Environmental
Microbiology, vol. 66,pp. 2269-2273.
O‟ Riordan, K, Andrews, D, Buckle, K, & Conway, P 2001,„Evaluation of a Bifidobacterium
strain with starch as an approach to prolonging viability during storage‟, Journal of Applied
Microbiology, vol. 91, pp. 1059-1066.
Rees, L. P., Minney, S. F., Plummer, N. T., Slater, J. H & Skryme, D.A 1993 „A quantitative
assessment of the antimicrobial activity of garlic (Allium sativum)‟, World Journal of
Microbiology and Biotechnology, vol. 9, pp. 303-307.
Ross, Z.M., O‟ Gara, E.A., Hill, D.J., Sleightholme, H.V& Maslin. D.J 2001 „Antimicrobial
properties of garlic oil against human enteric bacteria: Evaluation of methodologies and
comparisons with garlic oil sulfides and garlic powder‟, Applied and Environmental
Microbiology, vol. 67, pp. 475-480.
Ruddock, P.S., Mingman, L, Foster, B.C., Lawson, L., Arnason, J.T & Dillon, J-AR 2005
„Garlic Natural Health Products Exhibit Variable Constituent Levels and Antimicrobial
Activity against Neisseria gonorrhoeae, Staphyloccocus aureus and Enterococcus faecalis’,
Phytotherapy Research, vol.19, pp. 327-334.
Saxelin, M, Grenov, B, Svensson, U, Fondén, R, Reniero, R & Mattila-Sandholm, T 1999,
„The technology of probiotics‟, Trends in Food Science and Technology, vol. 10, pp. 387-
392.
©© UUnniivveerrssiittyy ooff PPrreettoorriiaa

7
CHAPTER 1
Literature review
Part of this work is published as a book chapter: M. S. Thantsha, C. I. Mamvura and J.
Booyens. Probiotics: What they are, Their Benefits and Challenges. New Advances in the
Basic and Clinical Gastroenterology‟. Editor Tomasz Brzozowski. ISBN 978-953-51-0521-3,
InTech, April 4, 2012.
©© UUnniivveerrssiittyy ooff PPrreettoorriiaa

8
1.1 THE HUMAN GASTROINTESTINAL TRACT (GIT)
The gastrointestinal tract (GIT) is a complex and diverse ecosystem which consists of over
500 different bacterial species including both beneficial and pathogenic bacteria. The GIT is
sterile at birth but immediately after birth becomes colonized by environmental microbes and
remains relatively stable throughout life. This collection of microorganisms, known as the
intestinal microflora, is mostly located in the colon or large bowel (Tannock, 1997; Gill,
2003; Kolida et al., 2006). Bifidobacteria and lactobaclli account for up to one third of the
colon flora and are beneficial to human health (Reyed, 2007). Although most members of the
indigenous flora are beneficial, there are also pathogenic bacteria present. In a healthy
individual there is usually a balance of the two groups. This balance may be altered by
numerous disturbances such as antibiotic and radiation therapy, stress, changes in bile
secretion, diet, bowel movements and colonization by pathogens (Collins et al., 1998; Gill,
2003). It is therefore critical to keep this ecosystem in good balance. Numerous studies have
shown that supplementation with probiotics, specifically bifidobacteria can be used to restore
and optimize the microbial balance and maintain good health (Gill, 2003; Reyed, 2007).
1.2 PROBIOTICS
1.2.1 History
Live bacterial cultures have been consumed by humans for centuries in the form of fermented
milk. In the Old Testament it is written that „Abraham owed his longevity to the consumption
of sour milk‟ (Fioramonti et al., 2003; Kolida et al., 2006). In 76 B.C. Plinius, a Roman
historian also described its use in warding off gastro-intestinal infections (Jankovic et al.,
2010). The concept of probiotics was first proposed by Metchnikoff in 1905 when he
attributed the long life of Bulgarian peasants to the ingestion of fermented milk products. He
hypothesised that ingested bacteria, such as lactobacilli, had a positive effect on the normal
gut flora of the GIT (Rolfe, 2000; Fioramonti et al., 2003; Kolida et al., 2006). During this
time he isolated Bulgarian bacillus, which is currently known as Lactobacillus delbreukii
species (spp.) bulgaricus. During World War I, the physician Nissle isolated a strain of E.
coli, now known as E. coli Nissle 1917, from the only remaining soldier in a group suffering
from diarrhoea. He proposed that this strain was responsible for preventing diarrhoea because
©© UUnniivveerrssiittyy ooff PPrreettoorriiaa

9
it suppressed the responsible pathogens. The foundation upon which the probiotic concept
was based was provided by the above mentioned observations (Kolida et al., 2006).
1.2.2 Definition
In the past there have been many attempts to define the term „probiotic‟, one of the first being
described by Lilly and Stillwell in 1965. They defined probiotics as “substances secreted by
one microorganism, which stimulates the growth of another”. Subsequently, in 1974, Parker
defined them as “organisms and substances which contribute to intestinal microbial balance”
(Schrezenmier and de Vrese, 2001). In 1989, Fuller tried to improve on Parker‟s definition
and he proposed the following definition: “Probiotics are live microbial feed supplements
which beneficially affect the host by improving its intestinal microbial balance” (Salminen et
al., 1999). Many other descriptions followed until the Food and Agriculture Organization of
the United Nations - World Health Organization (FAO-WHO) officially defined probiotics
as: “live microorganisms that when administered in adequate amounts confer a significant
health benefit on the host”. It was later on endorsed by the International Scientific
Association for Probiotics and Prebiotics (ISAPP) and is now widely accepted (Reid, 2006).
There has been much scepticism in the probiotic industry concerning the proposed health
benefits of probiotics but scientific evidence in recent years has proven this true (Dobrogosz
et al., 2010). It is estimated that the probiotic industry holds a 10% share of the global
functional food market and products containing probiotics are fast becoming a considerable
and growing economic importance (Champagne et al., 2011).
1.2.3 Microorganisms used as probiotics
Many microorganisms have been used and considered as probiotics. The most commonly
used probiotic strains that are commercially available include those of Bifidobacterium,
Lactobacillus and Streptococcus species. The list of probiotic microorganisms extends to
include Bacillus spp., Bacteriodes spp., Enterococcus spp., Escherichia coli, Leuconostoc
spp., Pediococcus acidilactici, Propionibacterium spp., as well as various fungi such as
Saccharomyces boulardii. Probiotic preparations may include one or more strains of these
microorganisms (Amalaradjou and Bhunia, 2012; Collins et al., 1998; Rolfe, 2000; Kolida et
©© UUnniivveerrssiittyy ooff PPrreettoorriiaa

10
al., 2006). However, the most commonly used are species of Lactobacillus and
Bifidobacterium including; L. brevis, L. casei, the yoghurt strain L. delbrueckii subsp.
bulgaricus, L. johnsonii (acidophilus), L. plantarum, L. reuteri, L. rhamnosus, L. salivarius,
and B. adolescentis, B. bifidum, B. breve, B. cereus, B. infantis, B. lactis, B. longum among
others (Collins et al., 1998; Gismondo et al., 1999; Saarela et al., 2000; Ouwehand et al.,
2002).
The lactic acid bacteria (LAB) strains have been used since ancient times and incorporated
into a wide range of foods without having a negative effect on human health (Collins et al.,
1998). LAB have many properties which make them prime candidates for their use as
probiotics. They can withstand the conditions in the GIT; they resist bile salts, gastric acid
and pancreatic enzymes and adhere to the intestinal mucosal surface allowing them to
colonize the intestinal tract. They are an important part of the gastrointestinal (GI) flora and
inhibit the growth of pathogens such as Staphylococcus aureus, Escherichia coli, Salmonella
typhimurium, Clostridium perfringens and Clostridium difficile (Rolfe, 2000).
1.2.4 Selection criteria
The general microbiological criteria for the selection of probiotics include safety,
performance, technology and health benefits (Gibson and Fuller, 2000). With regards to
safety, probiotic strains must be of human origin and must be isolated from healthy human
GIT‟s. They should also have an accurate taxonomic identification. They should possess
GRAS (generally regarded as safe) status, be non-pathogenic, and have no history of
association with diseases such as infective endocarditis or GI disorders. Probiotic strains must
not deconjugate bile salts and they should be genetically stable and carry no antibiotic
resistance genes that can be transferred to pathogens (Collins et al., 1998; Saarela et al.,
2000; Amalaradjou and Bhunia, 2012).
With respect to their performance, potential probiotic strains should be acid-tolerant and
therefore survive human gastric juice and bile. They must be able to survive in sufficient
numbers and adhere to the intestinal mucosal surface in order to endure the GIT. Lastly, they
should also have antagonistic activity against pathogens such as Salmonella spp., Clostridium
©© UUnniivveerrssiittyy ooff PPrreettoorriiaa

11
difficile and Listeria monocytogenes that adhere to mucosal surfaces (Biavati et al., 2000;
Saarela et al., 2000; Mattila-Sandholm et al., 2002; Kolida et al., 2006).
Technological aspects must also be taken into account before selecting a probiotic strain.
Strains should be capable of being prepared on a large scale and should be able to multiply
rapidly, with good viability and stability in the product during storage. The strains must not
produce off flavours or textures once incorporated into foods. They should be metabolically
active within the GIT and biologically active against their identified target. Probiotic strains
must be resistant to phages and have good sensory properties (Collins et al., 1998; Saarela et
al., 2000; Mattila-Sandholm et al., 2002; Kolida et al., 2006)). Therefore probiotic containing
foods and products need to be of good quality and must have high enough numbers of viable
probiotic cells to ensure consumers get the optimal benefits from the product (Alakomi et al.,
2005).
1.2.5 Health benefits of probiotics
1.2.5.1 Prevention and treatment of gastrointestinal disorders
Probiotic bacteria are incorporated into foods, especially dairy products such as yoghurt,
cheese and fermented milk, due to their exceptional health benefits (Mattila-Sandholm et al.,
2002). These health benefits include their ability to prevent and treat many GI disorders such
as antibiotic-associated diarrhea (AAD) and Clostridium difficile-associated intestinal
disease, which is the most common cause of AAD. Examples of probiotic strains effective in
this regard include Bifidobacterium, Lactobacillus, Streptococcus and Saccharomyces spp.
However, only S. boulardii, E. faecium and Lactobacillus are clinically effective in
preventing AAD. It has also been demonstrated that S. boulardii is most effective and safe, in
combination with standard antibiotics, for treating C. difficile-associated intestinal disease
(Rolfe, 2000; Ouwehand et al., 2002; Kolida et al., 2006).
It has been proven that probiotics prevent traveller‟s diarrhoea and treat Rotavirus diarrhoea
as well as diarrhoea caused by human immunodeficiency virus (HIV) infection. For HIV
patients suffering with chronic diarrhoea, the probiotic S. boulardii has proven an effective
treatment. A few probiotics have been examined for their ability to prevent Traveller‟s
diarrhoea, including Lactobacillus, Bifidobacterium, Streptococcus and Saccharomyces spp.
©© UUnniivveerrssiittyy ooff PPrreettoorriiaa

12
(Rolfe, 2000). Studies have also shown that certain probiotics such as L. rhamnosus GG, L.
Reuteri, L. Casei and L. lactis can shorten the duration of Rotavirus diarrhoea in children and
infants (Ouwehand et al., 2002).
1.2.5.2 Immunomodulation effects
Probiotic bacteria also have immunomodulatory properties and human studies have shown
that they can have a positive effect on the immune system of the host. Adhesive probiotic
strains such as L. casei, L. rhamnosus and L. plantarum adhere to the gut associated
lymphoid tissue and this enhances both systemic and mucosal immunity, stimulating
phagocytic cells more efficiently than other bacteria (Saarela et al., 2000; Galdeano and
Perdigón, 2004). L. johnsonii and L. salivarus are able to stimulate a mucosal
immunoglobulin A (IgA) response, which also increases phagocytic activity. In addition, L.
rhamnosus GG and B. lactis were shown to have immunomodulation effects in a trial
involving children with severe eczema resulting from food allergy. Children fed both L.
rhamnosus and B. lactis showed a significant improvement (Saarela et al., 2000). Isolauri and
colleagues (1992) determined that infants supplemented with a strain of L. casei had
enhanced concentrations of circulating IgA, which correlated with a shortened duration of
rotavirus-induced diarrhoea (Roberfroid, 2000). In other studies oral introduction of B.
bifidum and B. breve was shown to enhance antibody response to ovalbumin and to stimulate
IgA response to cholera toxin in mice, respectively (Isolauri et al., 2001). Consumption of B.
bifidum and L. acidophilus greatly enhances the non-specific immune phagocytic activity of
circulating blood granulocytes (Roberfroid, 2000).
1.2.5.3 Antimutagenic and anticarcinogenic effects
Antimutagenic and anticarcinogenic properties of probiotics have been studied and more and
more evidence that these normal intestinal bacteria can influence carcinogenesis, especially
with regards to colorectal cancer, is accumulating (Rolfe, 2000; Saarela et al., 2000). There
are three postulated mechanisms that allow protection from these probiotics. Firstly, the
probiotic may inhibit the bacteria responsible for converting procarcinogens into carcinogens.
Lactobacilli and bifidobacteria decrease the quantity of faecal microbial enzymes, such as β-
glucuronidase, β-glucosidase, azoreductase, nitroreductase and urease, which are also
responsible for transforming procarcinogens into active carcinogens, which are harmful and
cause cancer (Roberfroid, 2000; Rolfe, 2000; Saarela et al., 2000, Schrezenmeir and de
Vrese, 2001). Secondly, animal studies have shown that some probiotics inhibit tumor cell
©© UUnniivveerrssiittyy ooff PPrreettoorriiaa

13
formation directly, and lastly some probiotic bacteria have been shown to bind and inactivate
carcinogens (Rolfe, 2000). Antigenotoxic and antitumor activities of some Bifidobacterium
and Lactobacillus strains have been shown by in vitro studies using rat and mice models. L.
acidophilus, L. casei, L. gasseri and L. rhamnosus consumption was shown to decrease faecal
and urinary mutagenicity in humans (Saarela et al., 2000).
1.2.5.4 Irritable bowel syndrome (IBS)
There is evidence showing that probiotics reduce IBS (Ouwehand et al., 2002; Aureli et al.,
2011). This syndrome usually occurs during childhood and is associated with diarrhea,
constipation or both, and symptoms which include abdominal bloating and chronic, recurring
pain. There is no specific treatment but studies done by Niedzielin and Kordecki in 1996
demonstrated that there was a reduction in severity of abdominal pain in individuals that
consumed L. plantarum (Rolfe, 2000; Schrezenmeir and de Vrese, 2001; Kolida et al., 2006).
Bifidobacteria have also been suggested to relieve constipation due to an observed reduction
of their levels in individuals experiencing constipation (Schrezenmeir and de Vrese, 2001;
Ouwehand et al., 2002).
1.2.5.5 Hypocholesterolemic effects
The hypocholesterolemic effects of probiotics are controversial due to inconsistency of
results of studies published in the 1970s, 1980‟s and those of the 1990‟s. Earlier studies
reported a decrease in cholesterol levels in patients consuming fermented milk products for 2-
4 weeks, while the latter reported no significant effect in cholesterol reduction due to probiotc
consumption (Roberfroid, 2000). In 1984, Massey showed that initially, the consumption of
yoghurt significantly reduced cholesterol in human adult males, but 2 weeks later
concentrations returned to control values even with continuous consumption of yoghurt.
Similar conflicting results were obtained in 1989 when Lin and colleagues fed experimental
animals milk and fermented dairy products (Taranto et al., 1998). More recent studies show
that some probiotics do indeed have hypocholesterolemic effects. In vitro studies performed
by Pereira and colleagues (2004), showed that L fermentum has cholesterol-lowering
properties in humans. L. plantarum has also been tested for cholesterol-lowering properties in
mice and results indicated a reduction in cholesterol in mice that were fed L. plantarum
(Nguyen et al., 2007). In addition, the Lactobacillus cultures fed to chickens also showed
significant reduction in total serum cholesterol, low-density lipoproteins and triglycerides
(Kalavathy et al., 2008).
©© UUnniivveerrssiittyy ooff PPrreettoorriiaa

14
1.2.5.6 Treatment of lactose intolerance
Lactose intolerance occurs when individuals have a congenital deficiency of the enzyme β-
galactosidase and are therefore unable to digest and absorb significant amounts of lactose.
This then causes abdominal cramping, bloating, diarrhoea and nausea. Some probiotics, such
as Lactobacillus, Bifidobacterium and Streptococcus spp. are commonly added to dairy
products to improve lactose digestion and help alleviate the symptoms in people suffering
from lactose intolerance (Roberfroid, 2000; Rolfe, 2000; Ouwehand et al., 2002; Kolida et
al., 2006).
1.2.5.7 Prevention of hepatic encephalopathy
Probiotics have also been proven to decrease the occurrence of hepatic encephalopathy which
is a neurological disorder caused by increased levels of ammonia in the blood. The probiotic
L. acidophilus has proven effective in decreasing fecal urease activity together with
neomycin. Lactobacillus has also been shown to be antagonistic to Helicobacter pylori
thereby reducing H. pylori gastroenteritis (Rolfe, 2000; Schrezenmeir and de Vrese, 2001).
1.2.5.8 Additional health benefits
Probiotics have also recently been implicated in the treatment of urogenital infections, the
most studied and effective strain being L. rhamnosus GR-1 (Kolida et al., 2006). In addition,
probiotics have a potential for application in vaccine development and are being used more
frequently as an alternative to antibiotic therapy for treating GIT disorders as there is a huge
concern that effective antibiotics are no longer being developed fast enough to compete with
the development of microbial resistance to old antibiotics (Rolfe, 2000; Alvares-Olmos and
Oberhelman, 2001).
1.2.6 Mechanism of action
1.2.6.1 Antimicrobial activity
Probiotics are able to modify the gut microbiota composition by means of a number of
different factors, one being the reduction of luminal pH. This is achieved through their
production of lactic and acetic acids, which inhibit the growth of pathogenic bacteria (Ng et
al., 2009; Wohlgemuth et al., 2010). They exert their antimicrobial effects on their host
intestinal epithelium directly by production of antimicrobial factors and indirectly through the
©© UUnniivveerrssiittyy ooff PPrreettoorriiaa

15
increase in expression of host cell antimicrobial peptides. Host intestinal cells produce
defensins, which kill susceptible bacteria, fungi and viruses, and cathelicidins which aid in
protection of the host against pathogens. Most probiotics themselves also produce
antimicrobial peptides such as bacteriocins (e.g. nisin and lactacin B) (Wohlgemuth et al.,
2010; Amalaradjou and Bhunia, 2012). Probiotics may also compete with pathogenic bacteria
for epithelial binding sites thereby inhibiting pathogen invasion and blocking their adhesion
to these sites (Ng et al., 2009; Wohlgemuth et al., 2010).
1.2.6.2 Improved barrier function
The intestinal barrier serves as a defence mechanism, by maintaining epithelial integrity.
Disruption of its integrity turns the intestines into a site where pathogenic bacteria and food
antigens enter and reach the submucosa causing intestinal disorders. Probiotics are able to
repair and maintain this barrier after damage by stimulating mucus secretion, chloride and
water secretion and the binding together of these submucosal cells by tight junctional proteins
(Ng et al., 2009; Wohlgemuth et al., 2010).
1.2.6.3 Enhancement of host immune functions
Probiotics utilize specific effects on different cells involved in innate and adaptive immune
responses. These cells include epithelial and dendritic cells, macrophages, B cells, T cells and
natural killer (NK) cells (Ng et al., 2009). Intestinal microorganisms are recognized by the
immune system in the gut through pattern-recognition molecules called Toll-like receptors
(TLRs), which results in complex intracellular signal transduction cascades and enhancement
of pro- and anti-inflammatory cytokine production (Wohlgemuth et al., 2010).
1.2.7 Concerns about the use of probiotics
Although there are numerous advantages and health benefits associated with probiotics, there
are certain risks associated with probiotic therapy. These risks are mainly concerned with
respect to safety in vulnerable target groups such as immunocompromised individuals
(pregnant women, babies and the elderly) or critically ill or hospitalized patients (Boyle et al.,
2006; Jankovic et al., 2010).
©© UUnniivveerrssiittyy ooff PPrreettoorriiaa
16
Probiotic cultures are resistant to some antibiotics. There is concern about the possible
transfer of antimicrobial resistance from probiotic strains to pathogenic bacteria in the gut.
For example, many Lactobacillus strains are naturally resistant to vancomycin, which poses a
potential threat of transfer of this resistance to other pathogenic bacteria such as
Staphylococcus aureus. However, these vancomycin-resistant genes in lactobacilli are
chromosomal and not readily transferred to other species (Boyle et al., 2006).
Another important area of concern is the risk of sepsis. There have been several reports of
cases of Lactobacillus sepsis and other bacterial sepsis due to the intake of probiotic
supplements (Boyle et al., 2006). One case included a 67 year-old man who took probiotic
capsules daily for mitral regurgitation and developed L. rhamnosus endocarditis after a dental
procedure (Mackay et al., 1999; Borriello et al., 2003). In another case, a 4-month old infant
with AAD, who was given L. rhamnosus after cardiac surgery, developed Lactobacillus
endocarditis 3 weeks after L. rhamnosus treatment (Kunz et al., 2004; Boyle et al., 2006).
However, there have been no reports to date on the occurrence of Bifidobacterium sepsis. All
cases of bacterial sepsis from the use of probiotics (Lactobacillus spp.) have occurred in
immunocompromised individuals or patients who have a chronic disease or debilitation. No
cases have been reported in healthy individuals. There is also a small risk of adverse
metabolic effects from manipulation of the microbiota with the use of probiotics, although
probiotic studies to date have not shown significant adverse effects on growth or nutrition
(Boyle et al., 2006).
1.2.8 Prebiotics and synbiotics
1.2.8.1 Prebiotics
Prebiotics are defined as „nondigestible food ingredients that selectively stimulate the growth
and/or activity of one or a limited number of gut microflora which in turn beneficially affects
the host‟s well-being and health‟ (Tuohy et al., 2003; Davis and Milner, 2009; Wang, 2009).
The most important GI microbiota targeted for selective stimulation are lactobacilli and
bifidobacteria (Wang, 2009). Non-digestible oligosaccharides such as inulin, other
oligosaccharides, lactulose, resistant starch and dietary fibre are common prebiotics (Davis
and Milner, 2009). Fruit and vegetables such as leek, asparagus, banana, garlic, onion,
©© UUnniivveerrssiittyy ooff PPrreettoorriiaa

17
chicory, artichoke, as well as wheat, oats and soybeans naturally contain the prebiotic inulin
(Manning and Gibson, 2004; Davis and Milner, 2009).
Three criteria are required for a dietary substance to be classified as a prebiotic. The
substance must not be absorbed in the stomach or small intestine, it must be selectively
utilized by the beneficial gut microflora and beneficial luminal or systemic effects should be
induced within the host upon its fermentation. An individual needs to consume 4-8g/day of
fructooligosaccharide in order to significantly increase levels of bifidobacteria in the gut
(Manning and Gibson, 2004).
In the last decade there have been numerous investigations on the health-promoting effects of
prebiotics. Some of these effects include better mineral absorption, alleviation of constipation
and IBS, protection against colon cancer, enhancement of the immune system,
anticarcinogenic effects and lowering of cholesterol (Tuohy et al., 2003; Manning and
Gibson, 2004; Venter, 2007; Davis and Milner, 2009).
1.2.8.2 Synbiotics
Synbiotics have been defined as „a combination of probiotics and prebiotics which improves
the survival, establishment and activity of the probiotic in the GIT, thereby having a
beneficial effect on the host. Synbiotics aim to improve the viability of the proven probiotic
in vivo as well as stimulate the indigenous gut microflora such as bifidobacteria. A well-
known benefit of synbiotics is that they increase the persistence of the probiotic in the GIT
(Tuohy et al., 2003; Davis and Milner, 2009).
1.3 BIFIDOBACTERIA
Although Lactobacillus spp., which have been extensively studied for many years, are used
most often in probiotic products due to their exceptional tolerance to the harsh conditions in
the gut, there has been a rapid increase in the use of Bifidobacterium spp. as probiotics.
Bifidobacteria were first discovered in 1899 by Tissier, who isolated a Y-shaped bacterium
from infant faeces and named it Bacillus bifidus (Husain et al., 1972; Biavati et al., 2000).
There was not much progress made relating to facts and information on these bacteria in the
50 years after their isolation. Then in 1957, Dehnart recognized numerous biotypes of
©© UUnniivveerrssiittyy ooff PPrreettoorriiaa

18
Bifidobacterium and proposed a method to differentiate these bacteria based on their
carbohydrate fermentation patterns. By 1963 seven spp. of Bifidobacterium, including B.
bifidum were recognised by Reuter. In the first edition of Bergey‟s Manual Systematic
Bacteriology, 24 species were reported. Since then there are now 32 known species within the
genus (Biavati et al., 2000).
1.3.1. Morphology and physiology
Bifidobacteria belong to the class Actinobacteria and are Gram-positive, anaerobic and
fermentative rods typically Y or V-shaped (Moubareck et al., 2005; Mättő et al., 2007). This
rod-shape is highly variable and is influenced by nutritional or other conditions (Boylston et
al., 2004). Bifidobacteria were previously classified as LAB. Their sensitivity to oxygen
varies between species and different strains within a species. Bifidobacteria of human origin
have an optimum growth temperature of 37°C- 38°C, whereas animal species grow at slightly
higher temperatures of 41°C- 43°C. No growth occurs below 20°C and above 46°C (Biavati
et al., 2000; Boylston et al., 2004). They are acid-tolerant bacteria and their optimum pH is
6.5 to 7.0 with little or no growth below the pH range of 4.5 to 5.0 and above 8.0 to 8.5
(Biavati et al., 2000; Roy, 2001; Reyed, 2007). They do not produce spores and promote
good intestinal health in humans and animals (Domig et al., 2007; Mättő et al., 2007).
Bifidobacteria produce acetic and lactic acid in a molar ratio 3:2 and are able to degrade
glucose (Tannock, 1997; Mättő et al., 2007). They are distinguished from Lactobacillus
species by the presence of fructose-6-phosphate phosphoketolase enzyme (F6PPK) (Doleyres
and Lacroix, 2005).
Due to the production of acetic and lactic acid, bifidobacteria have an antagonistic activity
against a wide variety of microorganisms such as Campylobacter, Clostridium perfringens,
Escherichia coli, Salmonella, Shigella dysentriae, Vibrio cholerae, Yersinia enterocolitica
(Biavati et al., 2000; Reyed, 2007). These acids lower the intestinal pH which then prohibits
the growth of pathogens. Acetic acid has a greater antimicrobial effect compared to lactic
acid due to an increased amount of undissociated acetic acid in the intestine and because it is
produces almost two-fold more than lactic acid. In addition, some bifidobacterial species
produce bacteriocins with a broad antimicrobial spectrum of activity towards both Gram-
positive and Gram-negative bacteria (De Vuyst and Leroy, 2007).
©© UUnniivveerrssiittyy ooff PPrreettoorriiaa

19
1.3.2 Identification
The most practical and common phenotypic tests used to identify or assign a bacterial strain
to the genus Bifidobacterium is the phosphoketolase assay. This assay makes use of the
F6PPK which is intracellular and can be extracted by sonification of the harvested
bifidobacterial cells. Cultures can be identified as belonging to the Bifidobacterium genus if a
reddish-violet colour is observed on completion of the assay (Biavati et al., 2000; Orban and
Patterson, 2000). Gas chromatography of the fermentation products can also be performed for
identification at genus level (Biavati et al., 2000).
There are many molecular techniques that have been developed for identification of
bifidobacteria. In 1995, Langendijk and colleagues developed three 16S rRNA hybridization
probes that detected Bifidobacterium species in human fecal microflora using whole-cell
hybridization. In 1996, Mangin and colleagues used ribosomal DNA polymorphism to
demonstrate between intra- and interspecies differentiation of Bifidobacterium strains
(Mangin et al., 1996). A year later, by designing an oligonucleotide probe specific for this
genus, Kaufmann and colleagues developed a practical identification system for
bifidobacterial strains isolated from food and faeces. The % GC of bifidobacteria DNA is 55-
67% and one of the most reliable identification methods for this species is the DNA-DNA
homology technique. The main disadvantage of this technique is that it is time-consuming
and laborious and thus not commonly applied nowadays. An additional genotypic tool used
for the identification of a wide range of bifidobacteria, isolated from any environment, at
spp., subspecies and strain level is repetitive sequence-based PCR (rep-PCR) fingerprinting
(Masco et al., 2003). Amplified ribosomal DNA restriction analysis (ARDRA) can also be
used to differentiate between the strains (Křížová et al., 2006).
1.3.3 Ecology
Bifidobacteria coexist with a large number of different bacteria in the intestinal tract of both
animals and humans. Studies have found over 7000 strains isolated from different habitats,
such as from faeces of human infants, adults and animals, the vagina and in dental caries
(Biavati et al., 2000). Bifidobacteria are among the first bacteria to colonize the GIT of new-
borns and predominate in breast-fed infants until weaning (Schell et al., 2002; Reyed, 2007).
©© UUnniivveerrssiittyy ooff PPrreettoorriiaa

20
The main spp. isolated from the colon of humans and used in probiotic products are B.
adolescentis, B. bifidum, B. infantis, B. lactis, B. breve and B. longum (Collins et al., 1998;
Ouwehand et al., 2002).
Bifidobacteria are very sensitive microbes and have a low survival rate due to stresses
occurring during their production, storage and consumption. Although they occur in a wide
range of food products such as fermented milks, drinking and frozen yoghurts, ice-cream,
probiotic cheeses and fermented soya products, they are sensitive to low pH, hydrogen
peroxide and have low viability at a low temperature in refrigerated products (Doleyres and
Lecroix, 2005). Therefore it is important to find ways and means to increase their survival
and viability as well to know what they are susceptible to.
There are many ways to protect bifidobacteria, such as microencapsulation, which provides a
physical barrier against the external environment and keeps cells viable. Microencapsulation
is defined as a technology for packing solids, liquids or gaseous materials in miniature sealed
capsules, which then release their contents at controlled rates under specific conditions (Anal
et al., 2006). Microencapsulation in protein or polysaccharide gel beads is a means of
protecting sensitive bifidobacteria against acid environments, high oxygen levels and cold
temperatures for freezing or refrigeration. Immobilised cell technology and long term
continuous culture also produce bifidobacterial cells with enhanced viability and tolerance to
harsh environmental conditions (Doleyres and Lacroix, 2005).
1.3.4 Susceptibility to antimicrobials
Bifidobacteria are susceptible to various antimicrobials. There have been several studies and
publications on the susceptibility of Bifidobacterium spp. to different antimicrobial agents,
especially antibiotics (Moubareck et al, 2005; Masco et al., 2006; Domig et al., 2007; Mättő
et al, 2007). Table 1.1 shows what antibiotics bifidobacteria are susceptible and resistant to.
Since there is a continuous rise in the consumption of probiotics, it is important that those
designed especially for consumers‟ health are well documented with regards to antibiotic
resistance. There is a concern that antibiotic resistance genes may be transferred to potential
pathogens in the gut, rendering them resistant to certain antibiotics, creating an even bigger
problem (Moubareck et al., 2005)
©© UUnniivveerrssiittyy ooff PPrreettoorriiaa

21
Table 1.1: Antibiotics to which Bifidobacterium spp. are resistant and susceptible to, as well as those
antibiotics which have variable effectivity (Reyed, 2007).
Resistant Variable effectiveness Susceptible
Nalidixic acid
Neomycin
Kanamycin
Streptomycin
Metronidazole
Gentamicin
Polymoxin B
Colistin
Sulphonamide
Aminoglycoside
Tetracycline
Moxalactam
Cloxacillin
Oxacillin
Fusidic acid
Furazolidone
Nitrofurazone
Penicillins
Vancomycin
Macrolides
Clindamycin
Chloroamphenicol
Cephalosporins
Erythromycin
Spiramycin
Bacitracin
Oleandomycin
Imipenam
Nitrofurantoin
Ampicillin
Amoxicillin
Carbenicillin
Novobiocin
©© UUnniivveerrssiittyy ooff PPrreettoorriiaa

22
The tet(W) gene is known to be responsible for acquired tetracycline resistance in B. longum,
B. bifidum, B. adolescentis and B. pseudocatenulatum (Moubareck et al., 2005; Masco et al.,
2006).
The antimicrobial activity of essential oils and structurally related food additives has also
been tested against B. longum and B. breve (Si et al., 2006). This study found that some
essential oils or compounds could be used in vitro as substitutes for antibiotics. It is also
important to test the susceptibility of probiotics to certain foods or compounds that have
antimicrobial activity, as it would be useless to use probiotics together with certain foods that
may inhibit their effect or activity.
1.3.4.1 Antimicrobial susceptibility testing methods
The determination of antimicrobial susceptibility of anaerobic organisms is generally more
complicated than for aerobic organisms due to the difficulty in isolating and identifying them,
and the necessity to test them in an anaerobic environment (Stalons and Thornsberry, 1975).
There have been a large number of different methods and protocols which have been
described for antimicrobial susceptibility testing of bifidobacteria. These include, among
others, the agar dilution method, the disk diffusion (DD) assay, broth-dilution and the E-test
(Arora and Kaur, 1999; Masco et al., 2006; Domig et al., 2007; Mättő et al., 2007).
1.3.4.1.1 Agar dilution method
The agar dilution susceptibility-testing method is used for determining the minimum
inhibitory concentration (MIC) of an antimicrobial agent required to inhibit the growth of a
microorganism. MIC is the lowest concentration needed to inhibit the growth of a
microorganism. The agar dilution method provides a quantitative result in the form of an
MIC. It is accepted worldwide and is the most well-established method for susceptibility
testing and commonly used as the standard method for evaluation of new antimicrobial
agents and susceptibility test methods (Schwalbe et al., 2007).
This method has various advantages such as the ability to test a large number of organisms at
the same time, the ability to detect mixed cultures and flexibility in the antimicrobial
selection as well as concentration range to be tested (Stalons and Thornsberry, 1975;
Schwalbe et al., 2007). When compared to other methods such as the disk diffusion method
and broth microdilution, the agar dilution test performs better and has fewer errors (Steward
©© UUnniivveerrssiittyy ooff PPrreettoorriiaa

23
et al., 1999). Despite these advantages there are also some problems associated with this
method. A major disadvantage is that the organisms tested are likely to be subjected to
oxygen when they are spread on the surface of the agar and their growth is therefore likely to
be inhibited. The addition of agar to broth also adds to the complexity of the medium and
therefore may interfere with the accuracy of the test (Stalons and Thornsberry, 1975).
1.3.4.1.2 Disk diffusion (DD) method
The disk diffusion susceptibility test is where a paper disk is impregnated with a known
amount of antimicrobial agent and placed on the surface of a solid medium which has
previously been inoculated with the bacterial suspension to be tested. The antimicrobial agent
then diffuses out of the disk into the medium, producing a concentration gradient. Bacterial
growth in the vicinity of the disk only occurs when the concentration diffusing from the disk
is no longer sufficient to inhibit bacterial replication or when the bacteria is resistant to the
antimicrobial. If the concentration of the antimicrobial is sufficient and there is no bacterial
growth, a zone of inhibition will form (Schwalbe et al., 2007).
The advantages of this method are that it is simple and easy to perform; it is also convenient
and cost effective. Despite these advantages bifidobacteria are subjected to oxygen when they
are spread onto the surface of the agar which may inhibit their growth and may therefore
interfere with the results. Another disadvantage is that it only gives qualitative results
(Stalons and Thornsberry, 1975). Because quantitative MIC information is preferred above
classification into resistant, intermediate and susceptible phenotypes for evaluation of the
biosafety of industrial LAB cultures (probiotics), dilution methods and the E-test are
favoured above the disk diffusion test (Mayrhofer et al., 2008).
1.3.4.1.3 Broth-dilution method
The broth-dilution method is performed by making serial dilutions of the antimicrobial agent
in a liquid medium, which is then inoculated with a standardized number of organisms and
incubated for a certain period of time. The lowest concentration/highest dilution of
antimicrobial preventing the appearance of turbidity is considered to be the MIC. In addition,
the minimum bactericidal concentration (MBC) can be determined by sub culturing the
contents of the tubes onto antibiotic free medium and examining bacterial growth (Stalons
and Thornsberry, 1975).
©© UUnniivveerrssiittyy ooff PPrreettoorriiaa

24
Advantages of the broth-dilution method are that the use of broth minimizes exposure of the
anaerobic organisms to oxygen, thereby increasing the growth response and reducing the time
needed to reach a high amount of growth in the culture. It is a very precise method and can be
used to determine both MIC and MBCs. It can also be used to test several antibiotics in
synergism studies. This method also gives both quantitative and qualitative results. It is
efficient for routine use in laboratories where only a small amount of anaerobic isolates are
tested at a time. Disadvantages associated with this method include having fewer sources for
variation in testing anaerobic bacteria compared to the agar dilution and disk diffusion
methods. There is also a high risk of contamination and this method allows testing of only
one organism per series of test tubes (Stalons and Thornsberry, 1975).
1.3.4.1.4 The E-test
The E-test combines the principle of the agar diffusion test with the determination of the MIC
value. It is based on the diffusion of a continuous concentration gradient of an antimicrobial
agent from a plastic strip into an agar medium. For bacteria sensitive to the antimicrobial, an
oval zone of inhibition will result. The point at which the border of the zone of inhibition
crosses the strip is the MIC. There have been many studies evaluating the E-test as a routine
susceptibility testing method and comparing it with other methods such as the broth micro-
dilution, agar dilution and the disk diffusion method (Hughes et al., 1993).
In general, the E-test-determined MIC‟s were favourable when compared to those of the
above-mentioned methods (Hughes et al., 1993). This method is reasonably fast, accurate and
reproducible (Akcali et al., 2005). It is also easy to perform, easy to interpret and allows
simultaneous testing of several antimicrobials (Hughes et al., 1993). This technique is also
less labour-intensive than the standard agar and micro-dilution methods (Kelly et al., 1999).
Despite these advantages there is also a possibility that the anaerobic test organism may be
exposed to oxygen and their growth inhibited when they are spread onto the plates. E-tests
are also very expensive to perform (Akcali et al., 2005).
1.3.5 Isolation and enumeration
In 1990, Rasic and Sad confirmed the two factors important in detecting and enumerating
bifidobacteria. They are: an adequate culture medium and anaerobic conditions. The success
©© UUnniivveerrssiittyy ooff PPrreettoorriiaa

25
of detection of bifidobacteria in optimal culture media is dependent on the following factors:
firstly, if the culture media has no selective effect, then non-bifidobacteria may outgrow
bifidobacteria. Secondly, if bifidobacteria colonies are to be identified macroscopically,
differential colouring may be helpful. The freshness of the ingredients of the media is also
very important for optimal growth. Lastly, the composition of the culture medium allows the
growth of different biotypes present in the medium to be investigated (Roy, 2001).
In 1983, Rasic and Kurmann divided the culture media for bifidobacteria into commercial,
complex, selective, synthetic and semi-synthetic. When selecting a culture medium for
bifidobacteria the following factors must be considered; supply of nutrients and growth
material, low oxidation-reduction potential, maintenance of the pH value during growth, the
buffering capacity and final pH of the medium. De Man Rogosa Sharpe (MRS) supplemented
with cysteine is the medium of choice for industrial quality control laboratories. From the
large number of selective media available, it can be said that there is no standard medium for
the detection of bifidobacteria (Roy, 2001).
Various growth media have also been specifically used for susceptibility testing. Recently,
the LAB susceptibility test medium supplemented with cysteine (LSM + cysteine), was
proposed for susceptibility testing of bifidobacteria. The Iso-Sensitest agar (ISA) (BSAC) and
Mueller-Hinton agar (CLSI) are the universally applied test media which are generally used
for bifidobacteria susceptibility testing but they do not always support growth of any given
LAB food strain. The LSM media supplemented with cysteine provides sufficient growth
support of all bifidobacterial strains and minimizes antagonistic effects between antimicrobial
agents and growth medium components (Masco et al., 2006). Schaedler broth and Mueller-
Hilton broth are used when broth dilution susceptibility tests are used as they support the
growth of the majority of anaerobic organisms (Stalons and Thornsberry, 1975).
1.4. VIABILITY ASSESMENT OF BIFIDOBACTERIA
Assessment of cell viability is one of the main requirements in many areas of microbiology,
from environmental research to industrial applications (López-Amorós et al., 1997). Bacterial
viability is the reproductive capacity of the bacterium and survival is the maintenance of the
viability (Bunthof et al., 2001). In other words, a microbial cell is considered “viable” if it
©© UUnniivveerrssiittyy ooff PPrreettoorriiaa

26
has all the elements and mechanisms needed for continued reproduction. Probiotic-containing
foods and products need to contain a high number of viable probiotic cells in order to be
beneficial to the consumers (Alakomi et al., 2005). Probiotic products should contain at least
107 colony forming units (cfu) per ml or g of product (Auty et al., 2001). The viability of
probiotic bifidobacteria depends on the bacterial strain; fermentation conditions such as
composition of growth medium and toxic by-products; downstream processes such as
mechanical stress, extreme temperature conditions and oxygen stress; storage and
preservation conditions such as temperature, moisture and acid content; and finally conditions
in the GIT such as bile salt, acid, and enzymatic processes (Roy, 2001; Lacroix and
Yildrimin, 2007).
Cell viability in probiotic products is traditionally assessed by the plate count method, where
cells actively grow and form visible colonies on solid media (Keer and Birch, 2003; Alakomi
et al., 2005). There are many disadvantages associated with this approach. The number of
viable microorganisms may be underestimated as this method excludes sub lethally damaged
and fastidious uncultivable bacteria, and viable cells that have lost the ability to form colonies
(Keer and Birch, 2003). The microorganisms may also be unevenly distributed in the product
and may also be in clumps or chains (Auty et al., 2001). This method is also time-consuming
as it requires an incubation period of 2-3 days before the colonies can be counted. In addition
to this, for many species a good growth medium is yet to be found (Auty et al., 2001;
Bunthof et al., 2001). Bifidobacteria are anaerobic organisms and they are likely to be
subjected to oxygen when they are spread on the surface of the agar. Growth is therefore
likely to be inhibited, which could result in an underestimation of the number of viable cells
(Auty et al., 2001).
Cultivation-based methods provide only a limited view of the physiological status of cells.
There are alternative culture-independent methods that can be used instead for testing the
viability of probiotic products. These methods provide a means of detecting the cells that may
not been detected (dormant cells) by the culture-based methods (Lahtinen et al., 2006).
©© UUnniivveerrssiittyy ooff PPrreettoorriiaa

27
1.4.1 Molecular techniques
Nowadays, molecular methods are more popular for assessing bacterial viability. Initially, the
presence of intact DNA sequences was used as an indicator of cell viability, with the
assumption that dead cells‟ DNA would be degraded more rapidly than other cellular
components. Ribosomal RNA (rRNA) has also been used as an indicator of viability.
Molecular methods include the PCR, hybridisation as well as reverse transcriptase PCR (RT-
PCR) to detect mRNA which increases the speed and specificity of assessing viability of
bacterial species in a sample. Nucleic acid sequence-based amplification (NASBA) and
reverse transcriptase-strand displacement amplification (RT-SDA) have also been used as
indicators of bacterial viability (Keer et al., 2003).
These molecular methods are indirect methods and the persistence of nucleic acids is highly
dependent on both the manner of cell death and environmental conditions and therefore, there
may be a poor correlation between the results obtained using molecular methods and cell
viability. The use of a combination of the above indirect molecular methods provides a better
correlation with cell viability than the use of only a single analytical technique (Keer et al.,
2003).
1.4.2 Flow cytometry
Flow cytometry is an appealing technique for fast analysis of bacterial viability, which
measures the physical and physiological characteristic of individual cells as they flow past an
electrical or optical sensor (Diaper et al., 1992; Bunthof et al., 2001). The principle of flow
cytometry is that single particles suspended within a stream of liquid are examined
individually within a short time period as they pass through a light source. The optical signals
generated are mostly spectral bands of lights in the visible spectrum, which represent the
detection of various chemicals or biological components, mostly fluorescence (Robinson,
2004). It uses fluorescent labelling and can analyse 5 000- 10 000 cells at a time (Bunthof et
al., 2001). The basis of the flow is a jet of isotonic sheath fluid, which travels at a speed of 20
km h-1
, into which the bacterial samples are introduced at controlled rates. This flow of cells
moves in a single file into the cytometer. The light source used is either a mercury vapour
lamp or different lasers. Three factors are measured using photomultiplier tubes as the
©© UUnniivveerrssiittyy ooff PPrreettoorriiaa

28
particles pass through the light beam. These factors are forward scatter (FS), side scatter
(SSC) and fluorescence. FS is related to cell size while SSC measures the internal
composition of the cell (Veal et al., 2000).
The most widely used dye for determining bacterial or cell viability is the esterase substrate
carboxyfluorescein diacetate (cFDA), which measures intracellular esterase activity. This is a
non-fluorescent dye that diffuses across undamaged or intact cell membranes and yields a
positively charged green fluorescent compound, carboxyfluorecein (cF), upon hydrolysis by
non-specific cellular esterases. Another nucleic acid dye used as a probe for mortality studies,
is propidium iodide (PI), which enters cells with damaged membranes but not those with
intact membranes and forms a red fluorescent DNA-complex. Stained cells correspond to
cells having compromised or damaged membranes and are considered dead (Rault et al.,
2007; Paparella et al., 2008).
Multiparametric flow cytometry uses cFDA and PI at the same time and is a very useful and
sensitive tool for measuring viability of bacteria. It has been used for this purpose for
Bifidobacterium spp. that are sensitive to bile salts, as well as Streptococcus macedonicus
which is sensitive to acid (Rault et al., 2007). Flow cytometry has also been used to assess the
viability of Lactococcus, Lactobacillus, Leuconostoc, Enterococcus and Pediococcus spp.
among others (Bunthof et al., 2001). The LIVE/DEAD BacLight kit is widely used in
microbial flow cytometry to measure viability, although to obtain useful results one must
ensure appropriate controls are used (Winson and Davey, 2000). It comprises two fluorescent
nucleic acid stains: SYTO9 and PI. SYTO9 penetrates both viable and nonviable bacteria,
while PI penetrates bacteria with damaged membranes only, as mentioned above. Therefore,
bacterial cells with compromised membranes fluoresce red and those with intact membranes
fluoresce green (Auty et al., 2001).
Subpopulations can also be physically selected or sorted for further studies. Cell sorting is a
very useful procedure as it can be used for confirmation of a particular population. A specific
population can be isolated for further analysis and growth and it can also be used to isolate a
rare event (Veal et al., 2000; Winson and Davey, 2000; Bunthof et al., 2001). In addition to
estimation of cell viability, there are many other applications of flow cytometry and cell
sorting. A wide range of fluorescent probes are available for directly estimating cellular
parameters such as nucleic acid content, enzyme activity, calcium flux, membrane potential
©© UUnniivveerrssiittyy ooff PPrreettoorriiaa

29
and intracellular pH. The use of flow cytometers for cell sorting is also widespread and
applications range from separation of large numbers of cells for functional studies or
chromosomes for preparing gene libraries (Ormerod, 2000).
The major advantages of flow cytometry are that a large number of bacterial cells can be
examined simultaneously and data acquired quickly. Both physical as well as physiological
characteristics can be studied. The cells of interest can also be recovered by sorting.
Disadvantages are that the data corresponds to the population of the cells, making it difficult
if not impossible, to tell which individual cell produced a particular measurement. The flow
cytometer is also a very complex instrument, requiring the possession of knowledge of the
underlying principles and operation in order to use the machine and for accurate
interpretation of results. There are also many different methods and staining procedures for
different parameters measured (Ormerod, 2000; Winson and Davey, 2000; Robinson, 2004).
1.4.3 Microscopy
Microscopy is also very useful for assessing bacterial viability, although it is somewhat
laborious, and some microscopic techniques require the differentiation of live and dead
bacteria by using fluorescent stains or dyes (Auty et al., 2001; Alakomi et al., 2005).
1.4.3.1 Fluorescent microscopy
These fluorescent stains allow the differentiation of viable, dead and damaged cells in a
sample by staining the viable cells with one stain followed by counterstaining of dead or all
cells with another stain (Alakomi et al., 2005). The direct epifluorescent microscope is used
for enumeration of environmental samples and conventional epifluorescence microscopy is
used for viability staining of liquid samples such as milk. Fluorescence microscopy is a rapid
and direct method for assessing bacterial viability but it has a disadvantage that certain strains
cannot be identified. The fluorescent indicators of viability are based on membrane integrity,
enzyme activity, membrane potential, respiration and pH gradient, similar to flow cytometry
(Auty et al., 2001).
Confocal scanning laser microscopy (CSLM) has been used to study the viability of
Escherichia coli and Salmonella among other bacteria (López-Amorós et al., 1997). CSLM
©© UUnniivveerrssiittyy ooff PPrreettoorriiaa

30
has many advantages such as increased sensitivity and clearer focus, which enables
observation of subsurface structures of food in situ. The digital attainment of images by this
microscope enables quick enumeration of bacteria by image analysis. It has been used for
direct in situ viability assessment of bacteria in probiotic dairy products such as the human
probiotic strains of Lactobacillus paracasei and Bifidobacterium spp. (Auty et al., 2001).
1.4.3.2 Scanning electron microscopy (SEM)
Microscopes that do not need fluorescent dyes can also be used to determine the viability of
bacterial samples. SEM is one such microscope used to test bacterial viability by viewing the
structural characteristics of the cells outer surface. During the last 40 years, SEM has been a
very useful tool for scientists to observe the external surfaces of microorganisms. A beam of
electrons is scanned back and forth across the specimen and focused on a very small point on
the specimen of interest, resulting in a transfer of energy to that area. These primary electrons
will then dislodge electrons from the specimen itself. The resulting secondary electrons will
then be attracted and collected by a detector and then translated into a signal image, allowing
scientists to see the intricate details of the material‟s surface. The specimen is coated with a
thin film of heavy metal such as gold, which enhances conductivity at low voltage and
contrast at high voltage (Kim and Fane, 1993; Williams and Carter, 1996; Muscariello et al.,
2005; Madigan and Martinko, 2006). The specimen has to be thin in order to transmit
sufficient electrons so that enough intensity falls on the screen to produce an interpretable
image in a reasonable time (Williams and Carter, 1996).
Advantages of SEM include its ability to analyse intact biological structures regardless of
their shape and it has a wide range of magnification, able to go to more than 300 000x. It has
a high depth of field, which allows more of the specimen to be in focus at one time. The
image produced is a representation of electronic data, allowing for image analysis and
quantification. It has also been described as a technique that combines the best aspects of
light microscopy and transmission electron microscopy (Müller and Engel, 2001; James,
2009).
There are certain limitations to SEM such as the requirement of coating samples before
viewing. Coatings such as gold are very expensive and they also obscure the fine surface
detail on some of the specimens, although SEMs equipped with field emission guns have
made such samples easier to view (Kim and Fane, 1993; Muscariello et al., 2005). Another
©© UUnniivveerrssiittyy ooff PPrreettoorriiaa

31
difficulty is when wet or damp samples, such as biological tissue, need to be viewed. The
high vacuum requirements in the chamber means that in order to remove or fix the water
before imaging, long specimen preparation techniques are required. This also raises the risk
of introducing artefacts which can destroy the finer features and leach out the ions that could
otherwise be analyzed by microanalysis (Muscariello et al., 2005; James, 2009). Drying of
the sample can also lead to damage of the sample‟s structure (Kim and Fane, 1993). These
problems can be overcome by the new environmental scanning electron microscope (ESEM)
that allows the observation of wet samples without the need of prior sample preparation
(Muscariello et al., 2005). Despite these disadvantages, SEM is still a very useful tool for
estimating cell viability.
1.4.3.3 Infrared (IR) and Raman spectroscopies
Vibrational spectroscopies such as IR and Raman are nowadays extensively used to study the
molecular and chemical (lipids, proteins, membranes, nucleic acids, polysaccharides, ect.)
composition of cells based on the fact that all organic molecules absorb IR light. Useful
information on the chemical composition of cells can therefore be attained (Beekes et al.,
2007; Zoumpopoulou et al., 2010; Lu et al., 2011b). There have been many studies on the
application of these techniques to identify changes at cellular level after cells have been
exposed to certain stress factors which cause internal damage to the cell (Zoumpopoulou et
al., 2010). Fourier transform infrared (FT-IR) spectroscopy is a physiochemical technique
that “fingerprints‟ the entire cell and is able to detect even the slightest compositional
changes that cannot be revealed by other methods (Alvarez-Ordóñez et al., 2010).
Advantages of these techniques is that they are non-invasive, inexpensive, simple to use,
rapid, no reagents are used and all biological specimens can be distinguished; including
bacteria (Davis and Mauer, 2010; Lu et al., 2011b). Detection, enumeration, classification
and identification can all be carried out using one single instrument when using IR
spectroscopes. There is also little or no sample preparation required and therefore bacterial
cells remain intact during analysis (Naumann, 2000; Lin et al., 2004; Davis and Mauer,
2010). Despite the many advantages of IR spectroscopy, there are a few disadvantages. Only
microorganisms that are grown in culture can be analyzed and factors such as cultivation
time, temperature and culture medium need to be rigidly controlled in order to obtain
reproducible results. Multiple scans of the same sample are therefore required (Naumann,
2000; Davis and Mauer, 2010).
©© UUnniivveerrssiittyy ooff PPrreettoorriiaa

32
Both Raman and IR spectroscopies are non-invasive, rapid alternatives to study changes and
injury in bacterial cell membranes by various treatments such as heat and cold treatment,
antibiotic, bacteriocin and chemical treatment (Lu et al., 2011a; Lu et al., 2011b). FT-IR
spectroscopy has been successfully used in Microbiology (Marcotte et al., 2007). The FT-IR
spectra of microorganisms represent a unique “fingerprint” which is highly representative for
different strains and species. Gram-positive and Gram-negative bacteria can be faultlessly
discriminated on their FT-IR spectra (Ngo-Thi et al., 2003). Changes in the IR spectra of
bacteria can replicate modifications in protein and polysaccharide contents using vibrational
methods related with the functional group characteristics of these species (Marcotte et al.,
2007).
FT-IR has been used in numerous studies to detect bacterial cell damage. Lu and colleagues
(2011c) successfully used FTIR together with Raman spectroscopy to detect cell injury
caused by garlic and its diallyl constituents on Listeria monocytogenes and Escherichia coli
as well as on Campylobacter jejuni in another study. Zoumpopoulou and colleagues (2010)
detected changes in the cellular composition of Salmonella enterica serovar Typhimurium
once exposed to antimicrobial compounds of Lactobacillus strains. FT-IR spectroscopy has
also been used to differentiate intact and sonication-injured cells of L. monocytogenes, heat-
induced lethal and sub lethal injury of Lactococcus lactis as well as cell damage of
Lactobacillus helveticus during vacuum drying (Zoumpopoulou et al., 2010). The survival
and injury of E. coli O157:H7, C. jejuni and Pseudomonas aeruginosa under cold stress was
also determined using FT-IR (Lu et al 2011a).
1.4.4 Microplate assays
Microplate scale fluorochrome staining assays are also used for assessing the viability of
probiotic preparations. This method also makes use of fluorescent staining. A microplate is a
flat plate with multiple wells used as test tubes into which the sample to be studied is
transferred. The microplate will then be wrapped in parafilm to prevent evaporation and the
samples will then be incubated at room temperature for 24 hours for cell attachment. After
incubation the plate is then washed three times in a plate washer with a buffer in order to
remove loosely adhered cells. Fresh broth is then added to the wells, wrapped with parafilm,
incubated and washed. After the final washing, a fluorescent dye such as cFDA, or in other
©© UUnniivveerrssiittyy ooff PPrreettoorriiaa
33
cases labels with red or green fluorescent probes is added and the plate is once again
incubated and then washed with buffer. The microplate is then read with a fluorescent-plate
reader (Snyder and Champness, 2003; Gamble and Muriana, 2007).
A study was carried out to compare this method with traditional culture-based techniques and
with epifluorescent microscopy. In this study the cell state of freeze-dried L. rhamnosus and
B. animalis subsp. lactis preparations were assessed. It was found that this method is a rapid
and strong tool for viability assessment of probiotic preparations and also enabled kinetic
measurements (Alakomi et al., 2005). Microplate assays are also safe, easy to use cost
effective and has greater objectivity in interpreting results (Tansuphasiri et al., 2002).
1.5. GARLIC (Allium sativum)
Garlic (Allium sativum) is a member of the Lillaceae family which includes onions, chives
and leeks (Haciseferoğullari et al., 2005). It is a rigid, tall, bulbous herb that reaches heights
of 30-60 cm and has a very strong smelling odour when crushed. Underground it consists of a
multifarious bulb with lots of fibrous roots. Above ground, narrow, grass-like leaves arise
from it (Hovana et al., 2011). Garlic has been used since ancient times as a food, spice and
herbal remedy for curing various diseases and can be consumed fresh, as pills or capsules as
well as extracts (Rees et al., 1993; Haciseferoğullari et al., 2005; Goncagul and Ayaz, 2010).
1.5.1 History
It has been mentioned throughout history, dating back to the ancient Egyptians where slaves
building the pyramids were given garlic as part of their staple diet. It was believed that garlic
would maintain and increase their strength (Rivlin, 2001; Daka, 2011). It was also placed in
tombs of pharaohs as they believed that if they took garlic to their next life, the food there
would always be well seasoned. The use of garlic as a food for the Israelites is also
mentioned in the bible in Numbers 11:5 (Rivlin, 2001; Amagase et al., 2002).
In Ancient Greece there is evidence that during the earliest Olympic Games garlic was fed to
the participants in order to give them strength (Deresse, 2010; Daka, 2011). It is also believed
that Hippocrates, the father of medicine, used garlic (Rivlin, 2001). The Romans used garlic
©© UUnniivveerrssiittyy ooff PPrreettoorriiaa

34
for a wide variety of illnesses and infections such as asthma, animal and insect bites and GIT
disorders among others, and was also fed to soldiers and sailors for strength and endurance
(Harris et al., 2001; Rivlin, 2001). In Ancient China and Japan garlic was used as a food
preservative and was part of the daily diet. Garlic tea was recommended for fever, headaches,
cholera and dysentery and was believed to have a positive effect on cardiovascular disease
(Rivlin, 2001; Corzo-Martínez et al., 2007; Deresse, 2010; Daka, 2011).
Throughout the Middle Ages and in World War II it was used to treat the wounds of soldiers.
It was also used as a treatment for the Great Plagues (Rivlin, 2001; Amagase et al., 2002). In
Early America, the Natives added garlic to their tea as they believed it treated flu (Rivlin,
2001). Today, over 3000 studies have confirmed the beneficial health effects of garlic and it
is still being employed in folk medicine all over the world for treatment of various diseases
(Amagase et al., 2002; Corzo-Martínez et al., 2007).
1.5.2 Health benefits of garlic
Alliums have been extensively studied for their health benefits and thousands of publications
have been written about them (Amagase et al., 2002). Garlic and onions have been shown to
be effective in cardiovascular disease due to their hypocholesterolemic, hypolipidermic, anti-
hypertensive, anti-diabetic, antithrombotic and anti-hyperhomocysteinemia effect. They also
have antimicrobial, antioxidant, anticarcinogenic, antimutagenic, antiarthritic, immune-
enhancing and prebiotic activities (Matsuura, 1997; Amagase et al., 2002; Corzo-Martínez et
al., 2007).
1.5.2.1 Effects related to cardiovascular disease
Many studies have been done to confirm the beneficial effects of garlic in the alleviation of
cardiovascular disease. In studies where garlic essential oil and raw garlic were fed to rats,
chicken, swine and rabbits, the results indicated that garlic consumption significantly lowered
the total serum cholesterol, low density lipoproteins (LDL), very low density lipoproteins
(VLDL) and increased the level of high density lipoproteins (HDL) in the animals. There
have also been several clinical reports which revealed the cholesterol-lowering effects of raw
garlic and some garlic supplements (Ackermann et al., 2001; Amagase et al., 2002; Corzo-
Martínez et al., 2007; Kojuri et al., 2007).
©© UUnniivveerrssiittyy ooff PPrreettoorriiaa
35
Kojuri and colleagues (2007) tested the effect of garlic on the lipid profile of hyperlipidemic
patients. Patients were given enteric-coated garlic powder tablets twice daily, and their lipid
profiles were checked after 6 weeks. The results showed that the garlic tablets lowered
cholesterol and LDL-cholesterol and increased HDL-cholesterol. These results indicated that
garlic may play a very important role in therapy of hypercholesterolemia. Mansell and
Reckless (1991) suggested that garlic essential oil had an effect on reducing blood pressure in
hypertensive patients (Corzo-Martínez et al., 2007). Other researchers reported that the
bioactive constituents of garlic and onion had an anti-diabetic effect by stimulating insulin
production and secretion by the pancreas, interfering with the absorption of glucose and
favouring the saving of insulin. It has also been determined that garlic has an antithrombotic
effect by inhibiting platelet aggregation in vitro (Corzo-Martínez et al., 2007; Tsuchiya and
Nagayama, 2008).
1.5.2.2 Anticarcinogenic and antimutagenic activities
The possibility of the use of garlic as an anticancer agent began in 1958 when Weisberger
and Pensky demonstrated in vitro and in vivo that thiosulfinate extracts from garlic inhibited
the growth of tumor cells. Since then, there has been ongoing epidemiological and laboratory
investigations to prove the chemopreventative or anticarcinogenic effects of garlic and related
Allium species. Nakata and Fujiwara (1975) identified a carbohydrate in garlic extract that
appeared to have antitumor immunity (Corzo-Martínez et al., 2007). Studies on their
capabilities to inhibit tumor growth and cellular proliferations have shown that ingestion of
garlic or onions decreases the risk of sarcoma and carcinoma in the stomach, colon,
oesophagus, prostate, bladder, blood, liver, lungs, skin and brain (Sengupta et al., 2004;
Corzo-Martínez et al., 2007; Tsuchiya and Nagayama, 2008). It has also recently been
discovered that garlic has an antimutagenic effect. The sulphur compounds in garlic have an
effect on DNA repair mechanisms, removing mutations in DNA and therefore preventing the
start of carcinogenesis (Corzo-Martínez et al., 2007).
1.5.2.3 Immune-enhancing effects
In 2001, Kyo and colleagues found that garlic could be used as a promising candidate as an
immune response modifier, being able to maintain the homeostasis of immune function and
suppressing unnecessary functions. The components responsible for garlic‟s immune-
enhancing effects are not fully known, but it is known that several low-molecular weight
sulphur compounds, such as diallyl sulphide (DAS) and S-allyl cysteine (SAC) have
©© UUnniivveerrssiittyy ooff PPrreettoorriiaa

36
immune-stimulating properties. In 1987, Hirao and colleagues isolated a garlic protein
fraction with an immune-stimulating effect (Corzo-Martínez et al., 2007).
1.5.2.4. Other health benefits
Studies conducted on animals have shown that garlic may improve brain function. This is due
to its antioxidant agents that neutralises free radicals accumulating in the body. Garlic could
therefore possibly be used to treat patients with Alzheimer‟s disease. It has also been used to
treat asthma, whooping cough, chronic bronchitis, ring worm, ear infections, and tonsillitis
and is even used as a mosquito repellent (Kumar et al., 2010).
1.5.3 Antimicrobial activity
Garlic has many antimicrobial activities including antibacterial, antifungal, antiviral and
antiprotozoal (Uchida et al., 1975; Harris et al., 2001). Louis Pasteur was the first person to
describe the antibacterial activity of garlic juices (Sivam, 2001). It exhibits antibacterial
activity against a wide range of Gram-positive, Gram-negative and acid-fast bacteria which
include Bacillus, Clostridium, Enterococcus faecalis, Escherichia coli, Hafnia, Klebsiella,
Lactobacillus acidophilus, Micrococcus, Mycobacterium tuberculosis, Neisseria
gonorrhoeae, Proteus, Pseudomonas, Salmonella, Shigella dysenteriae, S. flexneri, S. sonnei,
Staphylococcus and Streptococcus (Uchida et al., 1975; Rees et al., 1993; Ankri and
Mirelman, 1999; Harris et al., 2001; Ruddock et al., 2005). Helicobacter pylori, the causative
agent of stomach ulcers and stomach cancer, is also susceptible to garlic (Cellini et al., 1996;
Sivam, 2001). Garlic extracts also prevent the formation of Staphylococcus enterotoxins A, B
and C1. On the other hand some bacteria such as the mucoid strains of Pseudomonas
aureginosa, Streptococcus β hemolyticus and Enterococcus faecium are resistant to the action
of allicin (Ankri and Mirelman, 1999). The antimicrobial effect of garlic on Bifidobacterium
spp. has not yet been investigated.
Antifungal activity of garlic was discovered in 1936 by Schmidt and Marquardt. Aspergillus,
Candida, Cryptococcus, Epidermophyton, Microsporum, Rhodotorula, Torulopsis,
Trichophyton and Trichosporon are all susceptible to garlic extracts. Garlic also inhibits the
growth of some protozoan species such as Balantidium entozoon, Crithidia fasciculata,
©© UUnniivveerrssiittyy ooff PPrreettoorriiaa

37
Entamoeba histolytica, Giardia lamblia, Leishmania major, Leptomonas colosoma, Opalina
ranarum, O. dimidicita and Trypanosomes (Ankri and Mirelman, 1999; Harris et al., 2001).
Garlic also exhibits antimicrobial activity against viruses although there have been very little
investigations on its antiviral properties. It has been found to have in vitro activity against
cytomegalovirus, herpes simplex virus 1 and 2, HIV, influenza A and B, parainfluenza virus
type 3, rhinovirus, rotavirus, vaccinia virus, vesicular stomatitis virus and viral pneumonia
(Rees et al., 1993; Ankri and Mirelman, 1999; Harris et al., 2001; Goncagul and Ayaz, 2010).
1.5.4 Antimicrobial compounds in garlic
In 1944, Cavallito and colleagues isolated and identified the compound responsible for the
antimicrobial activity of crushed garlic cloves. They used different methods of extraction and
isolated diallyl disulfide, the main component of garlic oil (Harris et al., 2001). This very
unstable and rapidly decomposing oxygenated sulphur compound giving garlic its
characteristic odour, was called allicin. It is produced when alliin, the stable precursor in
garlic, is rapidly converted to allicin by the enzyme allinase once intact garlic tissues are
damaged by crushing or cutting (Ankri and Mirelman, 1999; Harris et al., 2001; Ruddock et
al., 2005).
Cross-section studies have shown that alliin and allinase are situated in different
compartments in garlic cloves. Fungi and other soil pathogens invade the clove and destroy
the membranes enclosing the compartments containing alliin and allinase, thereby causing the
reaction between two, producing allicin which in turn inactivates the invading microbes
(Ankri and Mirelman, 1999). This suggests that allicin is designed as a potential defence
mechanism against soil microbes. Garlic also contains various other compounds such as
adjoene, enzymes (peroxidise and miracynase), carbohydrates (glucose and sucrose), amino
acids like cysteine, glutamine and methionine; bioflavonoids such as quercetin and cyanidin;
vitamin B and C; allistatin I and allistatin II as well as minerals such as iron, calcium, zinc
and phosphorous. Some of these compounds may also be responsible for garlic‟s
antimicrobial activity (Goncagul and Ayaz, 2010; Kumar et al., 2010).
©© UUnniivveerrssiittyy ooff PPrreettoorriiaa

38
1.5.5 Mechanism of action of garlic
Allicin, which is the main active compound in garlic, is readily permeable through
phospholipid membranes and is easily taken up by the cell causing damage by altering their
membranes which in turn causes autolysis leading to cell death or cessation of growth (Lu et
al., 2011b). It is known to affect microorganisms by a number of different actions. It acts by
immediately and totally inhibiting RNA synthesis and partially inhibiting DNA and protein
synthesis (Focke et al., 1990; Al-Waili et al., 2007; Deresse, 2010). Lipid and fatty acid
biosynthesis as well as NO formation are also influenced which has significant changes in the
viability of cells (Focke et al., 1990; Miron et al., 2000). Allicin is able to alter a cells signal
transduction and electrochemical ability and even causes cells to undergo apoptosis. In
addition, it also reacts with cysteine and thiol containing enzymes in cells (Miron et al., 2000;
Gruhlke et al., 2010).
1.5.6 Adverse effects
The most common side effects from the intake of garlic are bad breath and body odour due to
garlic‟s strong smell. Studies have also shown that excessive intake of garlic can cause GIT
problems or upsets such as diarrhoea, flatulence and changes in the intestinal microflora.
There have also been instances where skin problems have occurred in individuals where fresh
or crushed garlic came into direct contact with the skin and caused blisters, burns and allergic
dermatitis. In 1982, Lybarger and colleagues found that workers exposed to garlic powder in
garlic-growing or industrial processing developed asthmatic symptoms (Corzo-Martínez et
al., 2007). There have also been reports that raw garlic and garlic powder decrease serum
protein and calcium, cause anemia and inhibit spermatogenesis. However, aged garlic extract
(AGE) has no adverse effects and has been studied extensively and its safety has been well
established (Amagase et al., 2001).
1.5.7 Garlic preparations
Garlic can be consumed fresh, in the form of pills, capsules and extracts (Goncagul and Ayaz,
2010). There are many commercial garlic preparations available and these are classified into
four groups, namely, essential oil, garlic oil macerate, garlic powder and garlic extract. All of
©© UUnniivveerrssiittyy ooff PPrreettoorriiaa

39
these preparations are produced from the garlic cloves. The manufacturing processes
influence the composition of the garlic product and the manufacturers must ensure these
products are safe, effective and stable and don‟t have any adverse effects (Amagase et al.,
2001).
Garlic essential oil is obtained by heating crushed garlic cloves to 100°C and collecting it as a
steam distillate. All water-soluble compounds including allicin are removed from the oil (O‟
Gara et al., 2000; Amagase et al., 2001). Garlic oil macerate is a product made of
encapsulated mixtures of whole garlic cloves ground into vegetable oil. During the
manufacturing process some alliin is converted to allicin (Amagase et al., 2001). Garlic
powder is mainly used as a spice for condiments and processed foods and is prepared by
slicing, drying and pulverizing garlic cloves which then form allicin upon the addition of
water. Garlic extract is produced by soaking whole or sliced garlic cloves in an extracting
solution such as purified water and diluted alcohol. After separation of the solution the
extract is concentrated and is then ready for use (O‟ Gara et al., 2000; Amagase et al., 2001).
Aged garlic extract (AGE) is another form of garlic used and is processed differently. The
extract is aged for up to 20 months wherein the odorous, harsh and irritating compounds are
converted into a safe and natural form (Amagase et al., 2001). AGE, in addition to being the
safest garlic preparation, has a greater effectiveness than other preparations, even raw garlic
and is therefore probably the most suitable preparation used to enrich foods. In addition, it is
the only garlic preparation that has been studied to prove its safety for human consumption
(Corzo-Martínez et al., 2007).
These different garlic preparations have varying effects on the different microorganisms
mentioned above as some exert a greater inhibitory effect compared to others. Ross and
colleagues (2001) examined the antimicrobial properties of garlic oil and garlic powder
against human enteric bacteria. They found that garlic oil had the strongest inhibitory effect
on the bacteria and shows that garlic oil contains a much greater concentration of
antibacterial substances than garlic powder which needs a liquid medium to activate the
allicin. This was also proven in a previous study where the activities of garlic oil and garlic
powder were tested against Helicobacter pylori (O‟ Gara et al., 2000). Iwalokun and
colleagues (2004) showed that AGE has a broad spectrum of antimicrobial activity against
many multi-drug resistant Gram-positive and Gram-negative bacteria, as well as Candida
©© UUnniivveerrssiittyy ooff PPrreettoorriiaa

40
spp. This antimicrobial activity was comparable to that of ciprofloxacin and fluconazole
antibiotics. Therefore AGE has a very strong inhibitory effect and is active against many
pathogenic microbes.
1.6. CONCLUSION
The viability of probiotic bacteria, in particular bifidobacteria, is essential in order for
consumers to get the promised health benefits provided by these probiotic products.
Susceptibility of bifidobacteria to numerous antimicrobials has been studied but to our
knowledge, to date, there have been no studies on how garlic affects the probiotic strains of
bifidobacteria. This question is essential to answer because although garlic has certain
beneficial effects, it also kills or inhibits certain bacteria.
Bifidobacteria are used as probiotics due to their numerous health benefits and are also
prescribed by doctors to help treat AAD. Therefore, it is essential to know whether probiotics
and garlic can be used simultaneously, as it would be a disadvantage and waste of money to
the consumer if garlic were to inhibit or decrease the viability of these products. In this study
the susceptibility of different probiotic Bifidobacterium strains to the antimicrobial effects of
garlic will be tested using numerous methods. The disk diffusion method as well as MIC and
MBC determination will be performed firstly to see whether garlic inhibits bifidobacteria.
Morphological alterations and changes in cell surface properties will be monitored by SEM.
FT-IR will be used to assess any biochemical changes taking place inside the cells once
exposed to garlic. It will also be used to investigate the mechanism of action of the garlic on
bifidobacterial cells. Viability after treatment with garlic will be assessed using flow
cytometry as well as determination of possible recovery of garlic-damaged cells.
©© UUnniivveerrssiittyy ooff PPrreettoorriiaa

41
1.7. REFERENCES
Ackermann, R.T., Mulrow, C.D., Ramirez, G, Gardner, C.D., Morbidoni, L & Lawrence,
V.A 2001, „Garlic shows promise for improving some cardiovascular risk factors‟, Archives
of Internal Medicine, vol. 161, pp. 813-824.
Akcali, S, Cicek, C, Surucuoglu, S & Ozbakkaloglu, B 2005, „E-test: An alternative method
for susceptibility testing of Mycobacterium tuberculosis‟, Medical Principles and Practice,
vol. 14, pp. 264-267.
Alakomi, H-L, Matto, J, Virkajarvi, I & Saarela, M 2005, „Application of a microplate scale
fluorochrome staining assay for the assessment of viability of probiotic preparations‟, Journal
of Microbiological Methods, vol,62, pp.25-35.
Alvares-Olmos, M.I & Oberhelman, R.A 2001, „Probiotic Agents and Infectious Diseases: A
Modern Perspective on a Traditional Therapy‟, Clinical Infectious Diseases, vol. 32, pp.
1567-1576.
Alverez-Ordóñez, A, Halisch, J & Prieto, M 2010, „Changes in Fourier transform infrared
spectra of Salmonella enteric serovars Typhimurium and Enteritidis after adaption to stressful
growth conditions‟, International Journal of Food Microbiology, vol. 142, pp. 97-105.
Al-Waili, N.S., Saloom, K.Y., Akmal, M, Al-Waili, T.N., Al-Waili, A.N., Al-Waili, H, Ali. A
& Al-Sahlani, K 2007, „Effects of heating, storage, and ultraviolet exposure on antimicrobial
activity of garlic juice‟, Journal of Medicinal Food, vol. 10, no. 1, pp. 208-212.
Amagase, H, Petesch, B.L, Matsuura, H, Kasuga, S & Itakura, Y 2001, „Intake of garlic and
its bioactive components‟, Journal of Nutrition, vol.131, pp.955-962.
Amalaradjou, M.A.R & Bhunia, A.K 2012, „Chapter 5-Modern approaches in probiotics
research to control foodborne pathogens‟, Advances in Food and Nutrition Research, vol. 67,
pp. 185-239.
Anal, A.K., Stevens, W.F & Remunan-Lopez, C 2006, „Ionotropic cross-linked chitosan
microspheres for controlled release of ampicillin‟ International Journal of Pharmaceutics,
vol. 312, pp. 166-173.
©© UUnniivveerrssiittyy ooff PPrreettoorriiaa

42
Ankri, S & Mirelman, D 1999, „Antimicrobial properties of allicin from garlic‟, Microbes
and Infection, vol.2, pp.125-129.
Aureli, P, Capurso, L, Castellazzi, A.M., Clerici, M, Giovannini, M, Morelli, L, Poli, A,
Pregliasco, F, Salvini, F & Zuccotti, G.V 2011, „Probiotics and health: An evidence-based
review‟, Pharmacological Research, vol 63, pp. 366-376.
Arora, D.S & Kaur, J 1999, „Antimicrobial activity of spices‟, International Journal of
Antimicrobial Agents, vol. 12, pp. 257-262.
Auty, M.A.E., Gardiner, G.E., McBrearty, S.J., O‟Sullivan, E.O., Mulvihill, D.M., Collins,
J.K., Fitzgerald, G.F., Stanton, C & Ross, R.P 2001, „Direct In Situ Viability Assessment of
Bacteria in Probiotic Dairy Products Using Viability Staining in Conjunction with Confocal
Scanning Laser Microscopy‟, Applied and Environmental Microbiology, vol. 67, no. 1, pp.
420-425.
Beekes, M, Lasch, P & Naumann, D 2007, „Analytical applications of fourier transform-
infrared (FT-IR) spectroscopy in microbiology and prion research‟, Veterinary Microbiology,
vol. 123, pp. 305-319.
Biavati, B, Vescoco, M, Torriani, S & Bottazzi, V 2000, „Bifidobacteria: history, ecology,
physiology and applications‟, Annals of Microbiology, vol. 50, pp. 117-131.
Borriello, S.P., Hammes, W.P., Holzapfel, W, Marteau, P, Schrezenmeir, J, Vaara, M &
Valtonen, V 2003, „Safety of probiotics that contain lactobacilli or bifidobacteria‟, Clinical
Infectious Diseases, vol. 36, pp. 775-780.
Boyle, R.J, Robins-Browne, R.M & Tang, M.L.K 2006, „Probiotic use in clinical practice:
what are the risks?‟, American Journal of Clinical Nutrition, vol. 83, pp. 1256-1264.
Boylston, T.D., Vinderola, C.G., Ghoddusi, H.B & Reinheimer, J.A 2004, „Incorporation of
bifidobacteria into cheeses: challenges and rewards‟, International Dairy Journal, vol. 14, pp.
375-387.
Bunthof, C.J., Bloemen, K, Breeuwer, P, Rombouts, F.M & Abee, T 2001, „Flow Cytometric
Assessment of Viability of Lactic Acid Bacteria‟, Applied and Environmental Microbiology,
vol. 67, no. 5, pp. 2326-2335.
©© UUnniivveerrssiittyy ooff PPrreettoorriiaa

43
Cellini, L, Di Campli, E, Masulli, M, Di Bartolomeo, S & Allocati, N 1996, „Inhibition of
Helicobacter pylori by garlic extract (Allium sativum)‟, FEMS Immunological and Medical
Journal of Microbiology, vol.13, pp.273-277.
Champagne, C.P., Ross, R.P., Saarela, M, Hansen, K.F & Charalampopoulos, D 2011,
„Recommendations for the viability assessment of probiotics as concentrated cultures and in
food matrices‟, International Journal of Food Microbiology, vol. 149, pp. 185-193.
Collins, J.K., Thornton, G & Sullivan, G.O 1998, „Selection of Probiotic Strains for Human
Applications‟, International Dairy Journal, vol. 8, pp. 487-490.
Corzo-Martínez, M, Corzo, N & Villamiel, M 2007, „Biological properties of onions and
garlic‟, Trends in Food Science & Technology, vol. 18, pp. 609-625.
Daka, D 2011, „Antibacterial effect of garlic (Allium sativum) on Staphylococcus aureus: An
in vitro study‟, African Journal of Biotechnology, vol. 10, no. 4, pp. 666-669.
Davis, R & Mauer, L.J 2010, „Fourier transform infrared (FT-IR) spectroscopy: A rapid tool
for detection and analysis of foodborne pathogenic bacteria‟, Current Research, Technology
and Education Topics in Applied Microbiology and Microbial Biotechnology, pp. 1582-1594.
Davis, D.C & Milner, J.A 2009, „Gastrointestinal microflora, food components and colon
cancer prevention‟, Journal of Nutritional Biochemistry, l. 20, no. 10, pp. 743-752.
Deresse, D 2010, „Antibacterial effect of garlic (Allium sativum) on Staphylococcus aureus:
An in vitro study‟, Asian Journal of Medical Sciences, vol. 2, no. 2, pp. 62-65.
De Vuyst, L & Leroy, F 2007, „Bacteriocins from lactic acid bacteria: Production,
purification and food applications‟, Journal of Molecular Microbiology and Biotechnology,
vol. 13, pp. 194-199.
Diaper, J.P., Tither, K & Edwards, C 1992, „Rapid assessment of bacterial viability by flow
cytometry‟, Applied Microbiology and Biotechnology, vol. 38, pp. 268-272.
Dobrogosz, W.J., Peacock, T.J & Hassan, H.M 2010, „Chapter 1-Evolution of the probiotic
concept: From conception to the validation and acceptance in medical science‟, Advances in
Applied Microbiology, vol. 72, pp. 1-41.
©© UUnniivveerrssiittyy ooff PPrreettoorriiaa

44
Doleyres, Y & Lacroix, C 2005, „Technologies with free and immobilised cells for probiotic
bifidobacteria production and protection‟, International Dairy Journal, vol. 15, pp. 973-988.
Domig, K.J, Mayrhofer, S, Zitz, U, Mair, C, Petersson, A, Amtmann, E, Mayer, H.K &
Kneifel, W 2007, „Antibiotic susceptibility testing of Bifidobacterium thermophilum and
Bifidobacterium pseudolongum strains: Broth microdilution vs. agar disc diffusion assay‟,
International Journal of Food Microbiology, vol.120, pp.191-195.
Fioramonti, J, Theodorou, V & Bueno, L 2003, „Probiotics: what are they? What are their
effects on gut physiology?‟, Best Practice & Research Clinical Gastroenterology, vol. 15, no.
5, pp. 711-724.
Focke, M, Feld, A & Lichtenthaler, H.K 1990, „Allicin, a naturally occurring antibiotic from
garlic, specifically inhibits acetyl-CoA synthetase‟, Federation of European Biochemical
Societies, vol. 261, no. 1, pp. 106-108.
Galdeano, C.M & Perdigón, G 2004, „Role of viability of probiotic strains in their persistence
in the gut and in mucosal immune stimulation‟, Journal of Applied Microbiology, vol. 97, pp.
673-681.
Gamble, R & Muriana, P.M 2007, „Microplate fluorescence assay for measurement of the
ability of strains of Listeria monocytogenes from meat and meat-processing plants to adhere
to abiotic surfaces‟, Applied and Enviromental Microbiology, vol. 73, no. 16, pp. 5235-5244.
Gibson, G.R & Fuller, R 2000, „Aspects of in vitro and in vivo research approaches directed
towards identifying probiotics and prebiotics for human use‟, Journal of Nutrition, vol.130,
pp.391-395.
Gill, H.S 2003, „Probiotics to enhance anti-infective defences in the gastrointestinal tract‟,
Best Practice & Research Clinical Gastroenterology, vol. 17, no. 5, pp. 755-773.
Gismondo, M.R., Drago, L & Lombardi, A 1999, „Review of probiotics available to modify
gastrointestinal flora‟, International Journal of Antimicrobial Agents, vol. 12, pp. 287-292.
Goncagul, G & Ayaz, E, 2010, „Antimicrobial effect of garlic (Allium sativum) and
traditional medicine‟, Journal of Animal and Veterinary Advances, vol. 9, no. 1, pp. 1-4.
©© UUnniivveerrssiittyy ooff PPrreettoorriiaa

45
Gruhlke, M.C.H., Portz, D, Stitz, M, Anwar, A, Schneider, T, Jacob, C, Schlaich, L &
Slusarenko, A.J 2010, „Allicin disrupts the cell‟s electrochemical potential and induces
apoptosis in yeast‟ Free Radical Biology and Medicine, vol. 49, pp. 1916-1924.
Hacıseferoğullari, H, Őzcan, M, Demir, F & Çalışır 2005, „Some nutritional and
technological properties of garlic (Allium sativum L.)‟, Journal of Food Engineering, vol. 68,
pp. 463-469.
Harris, J.C., Cottrell, S.L., Plummer, S & Lloyd, D 2001, „Antimicrobial properties of Allium
sativum (garlic)‟, Applied Microbiology and Biotechnology, vol. 57, pp. 282-286.
Hovana, E-I.K., James, U.S., James, E, Egbobor, E.M., Egba, A.G., Eta, S.E & Nwakaku,
O.A 2011, „Antibacterial and phytochemical studies of Alllium sativum‟, New York Science
Journal, vol. 4, no. 4, pp. 123-128.
Hughes, J.H., Biedenbach, D.J & Erwin, M.E 1993, „E-test as susceptibility test and
epidemiological tool for evaluation of Neisseria meningitidis isolates‟, Journal of Clinical
Microbiology, vol. 31, no. 12, pp. 3255-3259.
Husain, I, Poupard, J.A & Norris, R.F 1972, „Influence of nutrition on the morphology of a
strain of Bifidobacterium bifidum‟, Journal of Bacteriology, vol. 111, no. 3, pp. 841-844.
Isolauri, E, Sütas, Y, Kankaanpää, P, Arvilommi, H & Salminen, S 2001, „Probiotics: effects
on immunity‟, American Journal of Clinical Nutrition, vol. 73, pp. 444-450.
Iwalokun, B.A., Ogunledun, A, Ogbolu, D.O., Bamiro, S.B & Jimi-Omojola, J 2004, „In vitro
Antimicrobial properties of aqueous garlic extract against multidrug-resistant bacteria and
Candida species from Nigeria‟, Journal of Medicinal Food, vol. 7, no. 3, pp. 327-333.
James, B 2009, „Advances in “wet” electron microscopy techniques and their application to
the study of food structure‟, Trends in Food Science and Technology, vol. 20, pp. 114-124.
Jankovic, I, Sybesma, W, Phothirath, P & Mercenier, A 2010, „Application of probiotics in
food products- challenges and new approaches‟, Current Opinion in Biotechnology, vol. 21,
pp. 175-181.
Kalavathy, R, Abdullah, N, Jalaludin, S, Wong, C.M.V.L. & Ho, Y.W 2008, „Effect of
Lactobacillus cultures and oxytetracyclineon the growth and performance and serum lipids of
chicken‟, International Journal of Poultry Science, vol. 7, no. 4, pp. 385-389.
©© UUnniivveerrssiittyy ooff PPrreettoorriiaa

46
Keer, J.T & Birch, L 2003, „Molecular methods for the assessment of bacterial viability‟,
Journal of Microbiological Methods, vol. 53, pp. 175-183.
Kelly, L.M., Jacobs, M.R & Appelbaum, P.C 1999, „Comparison of agar dilution,
microdilution, E-test, and disk diffusion methods for testing activity of Cefditoren against
Streptococcus pneumoniae‟, Journal of Clinical Microbiology, vol. 37, no. 10, pp. 3296-
3299.
Kim, K-J & Fane, A.G 1993, „Low voltage scanning electron microscopy in membrane
research‟, Journal of Membrane Science, vol. 88, pp. 103-114.
Kolida, S, Saulnier, D.M & Gibson, G.R 2006, „Gastrointestinal Microflora: Probiotics‟,
Advances in Applied Microbiology, vol. 59, pp. 187-219.
Kojuri, J, Vosoughi, A.R & Akrami, M 2007, „Effects of anethum graveolens and garlic on
lipid profile in hyperlipidemic patients‟, Lipids in Health and Disease, vol. 6, no. 5, pp. 1-5.
Křížová, J, Španová, A & Bohuslav, R 2006, Evaluation of amplified ribosomal DNA
restriction analysis (ARDRA) and species-specific PCR for identification of Bifidobacterium
species, Systematic and Applied Microbiology, vol. 29, pp. 36-44.
Kumar, K.P.S., Bhowmik, D, Chiranjib, Tiwari, P & Kharel, R 2010, „Allium sativum and its
health benefits: An overview‟, Journal of Chemical and Pharmaceutical Research, vol. 2, no.
1, pp. 135-146.
Kunz, A.N., Noel, J.M & Fairchock, M.P 2004, „Two cases of Lactobacillus bacteremia
during probiotic treatment of short gut syndrome‟, Journal of Pediatric Gastro-enterol
Nutrition, vol. 38, pp. 457-458.
Lahtinen, S.J., Ouwehand, A.C., Reinikainen, J.P., Korpela, J.M., Sandholm, J & Salminen,
S.J 2006, „Intrinsic Properties of So-Called Dormant Probiotic Bacteria, Determined by Flow
Cytometric Viability Assays‟, Applied and Environmental Microbiology, vol. 72, no. 7, pp.
5132-5134.
Lacroix, C & Yildirim, S 2007, „Fermentation technologies for the production of probiotics
with high viability and functionality‟, Current Opinion in Biotechnology, vol. 18, pp. 176-
183.
©© UUnniivveerrssiittyy ooff PPrreettoorriiaa

47
Lin, M, Al-Holy, M, Al-Qadiri, H, Kang, D-H, Cavinato, A.G., Huang, Y & Rasco, B.A
2004, „Discrimination of intact and injured Listeria monocytogenes by fourier transform
infrared spectroscopy and principal component analysis‟, Journal of Agricultural and Food
Chemistry, vol. 52, pp. 5769-5772.
López-Amorós, R, Castel, S, Comas-Riu J & Vives-Rego, J 1997, „Assessment of E.coli and
Salmonella viability and starvation by confocal laser microscopy and flow cytometry using
rhodamine 123, DiBAC4, propidium iodide and CTC‟, Cytometry, vol. 29, pp. 298-305.
Lu, X, Liu, Q, Wu, D, Al-Qadiri, H.M., Al-Alami, N .I., Kang, D-H, Shin, J-H, Tang, J,
Jabal, J.M.F., Aston, E.D & Rasco, B.A (2011a), „Using of infrared spectroscopy to study the
survival and injury of Escherichia coli o157:H7, Campylobacter jejuni and Pseudomonas
aeruginosa under cold stress in low nutrient media‟, Food Microbiology, vol. 28, pp. 537-
546.
Lu, X, Rasco, B.A., Jabal, J.M.F., Aston, E.D., Lin, M & Konkel, M.E (2011b),
„Investigating antibacterial effects of garlic (Allium sativum) concentrate and garlic-derived
organosulfur compounds on Campylobacter jejuni by using fourier transform infrared
spectroscopy, raman spectroscopy and electron microscopy‟, Applied and Environmental
Microbiology, vol. 77, no. 15, pp. 5257-5269.
Lu, X, Rasco, B.A., Kang, D-H, Jabal, J.M.F., Aston, D.E & Konkel, M.E (2011c), „Infrared
and raman spectroscopic studies of the antimicrobial effects of garlic concentrates and diallyl
constituents on foodborne pathogens‟, Analytical Chemistry, vol. 83, pp. 4137-4146.
Mackay, A.D., Taylor, M.D., Kibbler, C.C & Hamilton-Miller, J.M 1999, „Lactobacillus
endocarditis caused by a probiotic organism‟, Clinical Microbial Infections, vol. 5, pp. 290-
292.
Madigan, M.T & Martinko, J.M 2006, Brock Biology of Microorganisms, 11th
edn, Pearson
Prentice Hall, United States of America, pp. 63.
Mangin, I, Bourget, N & Decaris, B 1996, Ribosomal DNA polymorphism in the genus
Bifidobacterium, Research in Microbiology. vol. 147, pp. 183-192.
Manning, T.S & Gibson, G.R 2004, „Microbial-gut interactions in health and disease.
Prebiotics‟, Best Practice and Research. Clinical Gastroenterology, vol. 18, no. 2, pp. 287-
298.
©© UUnniivveerrssiittyy ooff PPrreettoorriiaa
48
Marcotte, L, Kegelaer, G, Sandt, C, Barbeau, J & Lafleur, M 2007, „An alternative infrared
spectroscopy assay for the quantification of polysaccharides in bacterial samples‟, Analytical
Chemistry, vol. 361, pp. 7-14.
Masco, L, Huys, G, Gevers, D, Verbrugghen & Swings, J 2003, „Identification of
Bifidobacterium species using rep-PCR fingerprinitng‟ Systematic and Applied Microbiology,
vol. 26, pp. 557-563.
Masco, L, Van Hoorde, K, De Brandt, E, Swings, J & Huys, G 2006, „Antimicrobial
susceptibility of Bifidobacterium strains from humans, animals and probiotic products‟,
Journal of Antimicrobial Chemotherapy, vol. 58, pp. 85-94.
Matsuura, H 1997, „Phytochemistry of garlic horticultural and processing procedures. In
Nutraceuticals: Designer Foods III Garlic, Soy and Licorice, Lanchance PP (ed.). Food and
Nutrition Press: Trumbell, CT, pp. 55-69.
Mattila-Sandholm, T, Myllärinen, P, Crittenden, R, Mogensen, G, Fondén, R & Saarela, M
2002, „Technological challenges for future probiotic foods‟, International Dairy Journal, vol.
12, pp. 173-182.
Mättő, J, van Hoek, A.H.A.M, Domig, K.J, Saarela, M, Florez, A.B, Brockmann, E,
Amtmann, E, Mayo, B, Aarts, H.J.M & Danielsen, M 2007, „Susceptibility of human and
probiotic Bifidobacterium spp. to selected antibiotics as determined by the Etest method‟,
International Dairy Journal, vol.17, pp.1123-1131.
Mayrhofer, S, Domig, K.J., Mair, C, Zitz, U, Huys, G & Kneifel, W 2008, „Comparison of
broth microdilution, Etest and agar disk diffusion methods for antimicrobial susceptibility
testing of Lactobacillus acidophilus group members‟, Applied and Environmental
Microbiology, vol. 74, no. 12, pp. 3745-3748.
Moubareck, C, Gavini, F, Vaugien, L, Butel, M.J & Doucet-Popularie, F 2005,
„Antimicrobial susceptibility of Bifidobacteria‟, Journal of Antimicrobial Chemotherapy, vol.
55, pp. 38-44.
Miron, T, Rabinkov, A, Mirelman, D, Wilchek, M & Weiner, L 2000, „The mode of action of
allicin: its ready permeable through phospholipid membranes may contribute to its biological
activity‟, Biochimica et Biophysica Acta, vol. 1463, pp. 20-30.
©© UUnniivveerrssiittyy ooff PPrreettoorriiaa

49
Müller, S.A & Engel, A 2001, „Structure and mass analysis by scanning transmission electron
microscopy‟, Micron, vol. 32, pp. 21-31.
Muscariello, L, Rosso, F, Marino, G, Giordano, A, Barbariso, M, Cafiero, G & Barbarisi, A
2005, „A critical overview of ESEM applications in the biological field‟, Journal of Cellular
Physiology, vol. 205, pp. 328-334.
Naumann, D 2000, „Infrared Spectroscopy in Microbiology‟ John Wiley & Sons Ltd,
Chichester, pp. 102-131.
Ng, S.C., Hart, A.L., Kamm, M.A., Stagg, A.J & Knight, S.C 2009 „Mechanisms of action of
probiotics: Recent advances‟, Inflammatory Bowel Disease‟, vol. 15, no. 2, pp. 300-310.
Ngo-Thi, N.A., Kirschner, C & Naumann, D 2003, „Characterization and identification of
microorganisms by FT-IR microspectrometry‟, Journal of Molecular Structure, vol. 661-662,
pp. 371-380.
Nguyen, T.D.T., Kang, J.H & Lee, M.S 2007, „Characterization of Lactobacillus plantarum
PH04, a potential probiotic bacterium with cholesterol-lowering effects, „International
Journal of Food Microbiology, vol. 113, pp. 358-361.
O‟ Gara, E.A, Hill, D.J & Maslin, D.J 2000, „Activities of Garlic Oil, Garlic Powder, and
their diallyl constituents against Helicobacter pylori‟, Applied and Environmental
Microbiology, vol. 66, no.5, pp. 2269-2273.
Orban, J.I & Patterson, J.A 2000, „Modification of the phosphoketolase assay for rapid
identification of bifidobacteria‟, Journal of Microbiological Methods, vol. 40, pp. 221-224.
Ormerod, M.G 2000, „Flow cytometry: Practical approach‟, 3rd
edn., Oxford University
Press, New York, pp. 1 & 2.
Ouwehand, A.C., Salminen, S & Isolauri, E 2002, „Probiotics: an overview of beneficial
effects‟, Antonie van Leeuwenhoek, vol. 82, pp. 279-289.
Paparella, A, Taccogna, L, Aguzzi, I, Chaves-López, C, Serio, A, Marsilio, F & Suzzi, G
2008, „Flow cytometric assessment of the antimicrobial activity of essential oils against
Listeria monocytogenes‟ Food Control, vol. 19, pp. 1174-1182.
©© UUnniivveerrssiittyy ooff PPrreettoorriiaa

50
Pereira, D.I.A., McCartney, A.L & Gibson, G.R 2004, „An in vitro study of the probiotic
potential of a bile-salt-hydrolyzing Lactobacillus fermentum strain , and determination of its
cholesterol-lowering properties‟, Applied and Environmental Microbiology, vol. 69, no. 8,
pp. 4743-4752.
Rault, A, Béal, C, Ghorbal, S, Ogier, J-C & Bouix, M 2007, „Multiparametric flow cytometry
allows rapid assessment and comparison of lactic acid bacteria viability after freezing and
during frozen storage‟, Cryobiology, vol. 55, pp. 35-43.
Rees, L.P., Minney, S.F., Plummer, N.T., Slater, J.H & Skryme, D.A 1993, „A quantitative
assessment of the antimicrobial activity of garlic (Allium sativum)‟, World Journal of
Microbiology and Biotechnology, vol. 9, pp. 303-307.
Reid, G 2006, „Safe and efficacious probiotics: what are they?‟, Trends in Microbiology, vol.
14, no. 8, pp. 348-352.
Reyed, R.M 2007, „The role of Bifidobacteria in health‟, Research Journal of Medicine and
Medical Science, vol. 2, no. 1, pp. 14-24.
Rivlin, R. S 2001, „Historical perspective on the use of garlic‟, The Journal of Nutrition, vol.
131, pp. 951S-954S.
Roberfroid, M.B 2000, „Prebiotics and probiotics: are they functional foods?‟, American
Journal of Clinical Nutrition, vol. 7, pp. 1682- 1687.
Robinson, J.P 2004, Encyclopaedia of Biomaterials and Biomedical Engineering, Marcel
Dekker Incorporation, New York, pp. 630.
Rolfe, R.D 2000, „Symposium: Probiotic Bacteria: Implications for Human Health‟, Journal
of Nutrition, vol. 130, pp. 396S-402S.
Ross, Z.M., O‟ Gara, E.A., Hill, D.J., Sleightholme, H.V & Maslin, D.J 2001, „Antimicrobial
Properties of Garlic Oil against Human Enteric Bacteria: Evaluation of Methologies and
Comparisons with Garlic Oil Sulfides and Garlic Powder‟, Applied and Environmental
Microbiology, vol. 67, no. 1, pp. 475-480.
Roy, D 2001, „Media for the isolation and enumeration of bifidobacteria in dairy products‟,
International Journal of Food Microbiology, vol. 69, pp.167-182.
©© UUnniivveerrssiittyy ooff PPrreettoorriiaa

51
Ruddock, P.S, Mingman, L, Foster, B.C, Lawson, L, Arnason, J.T & Dillon, J-A.R 2005,
„Garlic Natural Health Products Exhibit Variable Constituent Levels and Antimicrobial
Activity against Neisseria gonorrhoeae, Staphyloccocus aureus and Enterococcus faecalis’,
Phytotherapy Research, vol.19, pp. 327-334.
Saarela, M, Mogensen, G, Fondén, R, Mättö & Mattila-Sandholm, T 2000, „Probiotic
bacteria: safety, functional and technological properties‟, Journal of Bacteriology, vol. 84,
pp. 197-215.
Salminen, S, Ouwehand, A, Benno, Y & Lee, Y.K 1999, „Probiotics: how should they be
defined?‟, Trends in Food Science & Technology, vol. 10, pp. 107-110.
Schell, M.A., Karmirantzou, M, Snel, B, Vilanova, D, Berger, B, Pessi, G, Zwahlen, M-C,
Desiere, F, Bork, P, Delley, M, Pridmore, R.D & Arigoni, F 2002, „The genome sequence of
Bifidobacterium longum reflects its adaptation to the human gastrointestinal tract‟, PNAS,
vol. 99, no. 22, pp. 14422-14427.
Schrezenmeir, J & de Vrese, M 2001, „Probiotics, prebiotics, and synbiotics-approaching a
definition‟, American Journal for Clinical Nutrition, vol. 73, pp. 361S-364S.
Schwalbe, R, SteeleMoore, L & Goodwin, A.C 2007, Antimicrobial Susceptibility Testing
Protocols, Taylor & Francis Group, USA, New York, pp. 91.
Sengupta, A, Ghosh, S, Bhattacharjee, S & Das, S 2004, „Indian food ingredients and cancer
prevention – an experimental evaluation of anticarcinogenic effects of garlic in rat colon‟,
Asian Pacific Journal of Cancer Prevention, vol. 5, pp. 126-132.
Si, W, Gong, J, Tsao, R, Zhou, T, Yu, H, Poppe, C, Johnson, R & Du, Z 2006, „Antimicrobial
activity of essential oils and structurally related synthetic food additives towards selected
pathogenic and beneficial gut bacteria‟, Journal of Applied Microbiology, vol. 100, pp. 296-
305.
Sivam, G.P 2001, „Protection against Helicobacter pylori and other bacterial infections by
garlic‟, Journal of Nutrition, vol. 131, pp. 1106S-1108S.
Snyder, L & Champness, W 2003, Molecular Genetics of Bacteria, 2nd
edn, ASM Press,
Washington, DC, pp. 473.
©© UUnniivveerrssiittyy ooff PPrreettoorriiaa

52
Stalons, D.R & Thornsberry, C 1975, „Broth-Dilution Method for determining the antibiotic
susceptibility of anaerobic bacteria‟, Antimicrobial Agents and Chemotherapy, vol. 7, no. 1,
pp. 15-21.
Steward, C.D., Stocker, S.A., Swenson, J.M., O‟Hara, C.M., Edwards, J.R., Gaynes, R.P.,
McGowan, J.E & Tenover, F.C 1999, „Comparison of Agar dilution, disk diffusion,
microscan, and Vitek antimicrobial susceptibility testing methods to broth microdilution for
detection of Fluoroquinolone-resistant isolates of the family Enterobacteriaceae‟, Journal of
Clinical Microbiology, vol. 37, no. 3, pp. 544-547.
Tannock, G.W 1997, „Probiotic properties of lactic-acid bacteria: plenty of scope for
fundamental R & D‟, Trends in Biotechnology, vol. 15, pp. 270-274.
Tansuphasiri, U, Suttirat, S & Rienthong, S 2002, „Comparison of microplate hybridization
with gel electrophoresis and dot blot hybridization for the rapid detection of Mycobacterium
tuberculosis PCR products‟, Southeast Asian Journal for Tropical Medicine, vol. 33, no. 1,
pp. 136-146.
Taranto, M.P., Medici, M, Perdigon, G, Ruiz Holgado, A.P & Valdez, G.F 1998, „Evidence
for hypocholesterolemic effect of Lactobacillus reuteri in hypocholesterolemic mice‟,
Journal of Dairy Science, vol. 81, pp. 2336-2340.
Tsuchiya, H & Nagayama, M 2008, „Garlic allyl derivatives interact with membrane lipids to
modify the membrane fluidity‟, Journal of Biomedical Science, vol. 15, pp. 653-660.
Tuohy, K.M., Probert, H.M., Smejkal, C.W & Gibson, G.R 2003, „Using probiotics and
prebiotics to improve gut health‟, Drug Discovery Today, vol. 8, no. 15, pp. 692-700.
Uchida, Y, Takahashi, T & Sato, N 1975, „The characteristics of the antibacterial activity of
garlic‟, Japanese Journal of Antibiotics, vol. 28, pp. 638-646.
Veal, D.A., Deere, D, Ferrari, B, Piper, J & Attfield, P.V 2000, „ Fluorescence staining and
flow cytometry for monitoring microbial cells‟, Journal of Immunological Methods, vol. 243,
pp. 191-210.
Venter, C.S 2007, „Prebiotics: an update‟, Journal of Family Ecology and Consumer Science,
vol. 35, pp. 17-25.
©© UUnniivveerrssiittyy ooff PPrreettoorriiaa

53
Wang, Y 2009, „Prebiotics: Present and future trends in food science and technology‟, Food
Research International, vol. 42, no. 1, pp. 8-12.
Williams, D.B & Carter, C.B 1996, „Transmission Electron Microscopy: A Textbook for
Materials Science‟, Plenum Press, New York, pp. 9.
Winson, M.K & Davey, H.M 2000, „Flow cytometric analysis of microorganisms‟, Methods,
vol. 21, pp. 231-240.
Wohlgemuth, S, Loh, G & Blaut, M 2010, „Recent developments and perspectives in the
investigation of probiotic effects‟, International Journal of Medical Microbiology, vol. 300,
pp. 3-10.
Zoumpopoulou, G, Papadimitriou, K, Polissiou, M.G., Tarantilis, P.A 2010, „Detection of
changes in the cellular composition of Salmonella enteric serovar Typhimurium in the
presence of antimicrobial compound(s) of Lactobacillus strains using Fourier transform
infrared spectroscopy‟, International Journal of Food Microbiology, vol. 144, pp. 202-207.
©© UUnniivveerrssiittyy ooff PPrreettoorriiaa

54
CHAPTER 2
Assessment of Bifidobacterium susceptibility to
inhibitory effects of different garlic (Allium sativum)
preparations: An In vitro study
Published: Booyens, J & Thantsha, M.S 2013, „Antibacterial effect of hydrosoluble extracts
of garlic (Allium sativum) against Bifidobacterium spp. and Lactobacillus acidophilus‟,
African Journal of Microbiology, vol. 7, no. 8, pp. 669-677.
©© UUnniivveerrssiittyy ooff PPrreettoorriiaa

55
2.1 Abstract
Probiotic containing foods and products need to contain high enough numbers of viable
probiotic cells in order to be of optimal benefit to the consumer. Therefore it is significant to
identify any products or materials that may have a negative influence on probiotic viability.
The antimicrobial effect of garlic (Allium sativum) on numerous pathogenic microorganisms
is well recognized but there is inadequate knowledge on its effects on beneficial probiotic
bacteria, in particular bifidobacteria. This study investigated the antibacterial effects of
different garlic preparations against selected strains of probiotic bifidobacteria. The disk
diffusion assay revealed the antibacterial activity of the different garlic preparations which
were characterized by zones of inhibition ranging from 13.0 ± 1.7 to 36.7 ± 1.2 mm. All
Bifidobacterium strains were inhibited by fresh garlic clove extract and time kill curves
established that the inhibitory effect of this extract was apparent within approximately 1 h of
incubation. Minimum inhibitory concentration (MIC) values ranged from 75.9 to 303.5
mg/ml garlic (estimated 24.84-99.37 µg/ml allicin) for garlic clove extract. From the selected
strains tested it was observed that the B. bifidum strain was most susceptible, followed by the
B. longum strains. The B. lactis strains were most resistant to the antibacterial effects of
garlic. These results indicate that probiotic bifidobacteria are susceptible to garlic. Therefore
probiotic-containing foods and products should not be ingested in conjunction with garlic as
this could possibly lower probiotic viability.
Keywords: garlic, Allium sativum, allicin, probiotics, antimicrobial, minimum inhibitory
concentration values, Bifidobacterium bifidum.
©© UUnniivveerrssiittyy ooff PPrreettoorriiaa

56
2.2 Introduction
Probiotics are viable microorganisms which when administered in adequate amounts provide
significant health benefits to the host by inhibiting the growth of pathogenic organisms in the
GIT, thereby sustaining the intestinal microbial balance (Leahy et al., 2005; Moubareck et
al., 2005; Reid, 2006; Wohlgemuth et al., 2010). Further health benefits include the treatment
of many GIT disorders such as constipation, IBS as well as diarrhoea associated with
antibiotics and travel (Schrezenmeir and de Vrese, 2001; Kaur et al., 2002). Probiotics are
also known to possess antimutagenic and anticarcinogenic properties as well as enhancing
immune responses, reducing cholesterol and for their vaccine adjuvant effects (Kaur et al.,
2002). It is therefore important that consumers get high quality probiotic containing products
which possess high enough numbers of viable probiotic cells (Alakomi et al., 2005).
The most common strains used as probiotics are those from the LAB which include
lactobacilli and bifidobacterial species both belonging to the normal human gut microflora
(Sullivan and Nord, 2002). Bifidobacteria have antagonistic activity against many microbes
such as Campylobacter, Salmonella, Listeria, Shigella and Vibrio cholera as well as
pathogens such as Escherichia coli, Shigella dysentriae and Yersinia enterocolitica (Biavati
et al., 2000; Reyed, 2007). Although bifidobacteria do inhibit many microbes, they
themselves are susceptible to a wide range of antimicrobials, specifically antibiotics, and this
has been confirmed by many studies (Masco et al., 2006; Domig et al., 2007; Mättő et al,
2007). It is therefore important to test the susceptibility of bifidobacteria against various
compounds and food products that may have an antimicrobial effect as it would render the
specific probiotic ineffective if used in conjunction with the antimicrobial.
Garlic (Allium sativum) is a perennial plant which belongs to the Allium family (Liliaceae)
(Iwalokun et al., 2004; Hovana et al., 2010). Throughout history garlic has been used as a
food spice and herbal medicine due to its health benefits in preventing and treating a wide
variety of diseases (Amagase et al., 2001; Haciseferoğullari et al., 2005; Belguith et al.,
2010). There is extensive literature on the health benefits of garlic. Some examples include
relief of digestive system disorders, asthma, skin disorders, prevention of cardiovascular
disease, kidney and bladder problems, high blood pressure, as well as reduction of pain and
inflammation. It has even been proposed to treat malaria, sexual debility, and Alzheimer‟s
©© UUnniivveerrssiittyy ooff PPrreettoorriiaa

57
disease (Kumar et al., 2010; Daka, 2011). Garlic is mainly consumed as a condiment in an
assortment of dishes (Belguith et al., 2010). Allicin is the main active compound in crushed
garlic cloves. It is produced by the rapid reaction between the substrate alliin with the enzyme
allinase once intact garlic tissue is damaged; by the attack of a microbe, once it is crushed,
cut or chewed, or when it is dehydrated, pulverized and then exposed to water (Miron et al.,
1998; Amagase et al., 2001; Miron et al., 2002). Antimicrobial agents such as allicin are able
to alter bacterial cell membranes which lead to cell leakage as well as autolysis which
prevents growth and causes cell death (Lu et al., 2011). Allicin concentration in garlic
products can be measured using spectrophotometrical analysis by the reaction between 4-
mercaptopyridine (4-MP) and allicin (Miron et al., 2002). It is this compound, allicin, which
is responsible for its antimicrobial activity and acts by immediately and totally inhibiting
RNA synthesis as well as partial DNA and protein synthesis (Al-Waili et al., 2007; Deresse,
2010).
The therapeutic uses of garlic have been well documented throughout the ages and these
include its antimicrobial, antihelmantic, antiseptic and anti-inflammatory properties. The
antimicrobial properties of garlic comprise its antibacterial, antifungal, antiviral and
antiprotozoal activities (Uchida et al., 1975; Rees et al., 1993; Deresse, 2010; Daka, 2011). It
inhibits both Gram-positive and Gram-negative bacteria which include species such as
Bacillus, Candida, Enterococcus, Escherichia, Proteus, Pseudomonas, Saccharomyces,
Salmonella, Staphylococcus, Helicobacter, as well as Mycobacterium, among others (Uchida
et al., 1975; Rees et al., 1993; O‟ Gara et al., 2000; Belguith et al., 2010; Deresse, 2010).
Although there have been numerous studies on the effects of garlic on pathogens there are
few studies on the susceptibility of beneficial bacteria, particularly probiotic strains of
Lactobacillus (Rees et al., 1993; Naganawa et al., 1996; Ross et al., 2001) and to our
knowledge there is currently no tests that have been done to date on its effects on
Bifiobacterium species.
©© UUnniivveerrssiittyy ooff PPrreettoorriiaa

58
2.3 Materials and Methods
2.3.1 Microrganisms
The following bacterial cultures were tested in this study; Bifidobacterium lactis Bb12 which
was obtained as freeze-dried sachets from CHR-Hansen, Denmark. B. bifidum LMG 11041
and B. longum LMG 13197 were purchased from the LMG culture collection, Belgium and
revived as per instructions from the supplier. B. lactis Bi-07 300B, B. longum Bb536 and
Lactobacillus acidophilus La14 150B were obtained from the Department of Food Science,
University of Pretoria, South Africa as subcultures on selective media. The Lactobacillus
culture was used as a comparison strain.
2.3.2 Garlic preparations
Fresh garlic cloves (GC), garlic paste (GP), garlic powder (Gp) and garlic spice (GS) were
bought from local supermarkets in Pretoria. GC, Gp and GS were stored at room temperature,
whilst GP was stored at 4°C for no longer than 2 weeks.
2.3.2.1 Preparation of garlic extract
The garlic extract was prepared as described by Bakri and Douglas (2005), with slight
modifications. Fresh cloves were separated and peeled and a predetermined amount of 10 g
was weighed and crushed using a mortar and pestle. This was then suspended in 5 ml sterile
distilled water. The same amounts of GP, Gp and GS were weighed and GS and Gp were
suspended in 10 ml of sterile distilled water, whilst GP was suspended in 5 ml. These
suspensions were then centrifuged and filtered through a 0.22 µm filter (Minisart).
2.3.2.2 Determination of final concentration of garlic and allicin in solution
The weight of the insoluble material of the GC, GP, Gp and GS was subtracted from the
weight of the original material to get the final concentration of GE in solution. The sterile
extract was used within 30 min of its preparation for the inhibitory studies.
©© UUnniivveerrssiittyy ooff PPrreettoorriiaa

59
2.3.3 Determination of actual allicin concentration
The concentration of allicin in each garlic preparation was determined spectrophotometrically
by reaction with thiol, 4- mercaptopyridine (Bakri and Douglas, 2005). A 1:1 dilution of each
garlic extract was incubated at room temperature in 1 ml 4- mercaptopyridine (10-4
) in 50
mM phosphate buffer, 2 mM EDTA, pH 7.2. The decrease in optical density at 324 nm after
1 h was used to calculate the allicin concentrations in each garlic preparation used (Miron et
al., 2002; Bakri and Douglas, 2005). This was repeated in duplicate.
2.3.4 Preparation of inoculums
Lactobacillus acidophilus La14 150B was grown in MRS broth while Bifidobacterium strains
were grown in MRS-cys-HCL broth. Both of the inoculated broths were then incubated at
37°C for 48 h in anaerobic jars with Anaerocult A gaspacks (Merck Ltd, Mofferfontein, SA).
For the disk diffusion assay and the broth dilution assay for MIC testing the bacterial cell
suspensions were adjusted to a 0.5 McFarland standard (approximately 1 x 10⁸ cfu/ml).
2.3.5 Phosphoketolase assay
Verification of the Bifidobacterium cultures was performed by using the phosphoketolase
assay, according to Orban and Patterson (2000). Bifidobacterial cells were harvested by
centrifugation (5000 rpm) for 10 min at 4°C. A nutrient broth culture of E. coli, which had
been left overnight, was also harvested and the cells were used as a negative control.
Overnight MRS-cys-HCL cultures of bifidobacteria were used as positive controls. Cells
were washed twice with phosphate buffer (KH2PO4, 0.05M, and cys-HCl, 500mg/L, mixed
1:1 (V/V) and adjusted to pH of 6.5 by centrifugation for 15 min (5000 rpm) and resuspended
in 1 ml phosphate buffer. 0.4 ml CTAB (450 µg/ml) was then added and incubated for 5 min
at 37°C. Following pretreatment with CTAB, 0.25 ml of a solution containing NaF (3 mg/ml)
and NaI (5 mg/ml) in dH2O was added followed by addition of 0.25 ml sodium fructose-6-
phosphate (80 mg/ml in dH2O). It was then vortexed and incubated at 37°C for 30 min. 1.5
ml hydroxylamine-HCl (13 g/100 ml) was added, vortexed and incubated at 37°C for 15 min.
following this, 1ml TCA (15% w/v), 1 ml 4N HCl and 1 ml ferric chloride (5% w/v in 0.1 ml
HCl) was added after which colour formation was observed.
©© UUnniivveerrssiittyy ooff PPrreettoorriiaa

60
2.3.6 Disk diffusion (DD) assay
The antimicrobial activity of the garlic preparations were tested using the disk diffusion
method according to Benkeblia (2004), with minor modifications. A lawn of bifidobacteria
was prepared by spreading 0.1 ml of each the broth cultures onto MRS-cys-HCl agar plates.
Filter disks (1 cm in diameter) were used and impregnated with 0.1 ml garlic extract of fresh
GC, GP, Gp and GS of varying concentrations. Sterile dH2O was used as a negative control
and ampicillin (Amp) (100 mg/ml), which was passed through a 0.22 µm filter (Minisart),
was also used as a positive control for comparison with the garlic preparations. Filters were
impregnated with 0.1 ml ampicillin on separate plates for each culture. L. acidophilus was
used for comparison with the Bifidobacterium cultures. The inoculated plates were then
incubated anaerobically at 37°C for 48-72 h, after which the resultant inhibition zones were
measured and expressed in millimeters (mm) as its antimicrobial activity. Each combination
of the isolate and antimicrobial agent was repeated in triplicate.
2.3.7 Viable plate counts
Each of the Bifidobacterium cultures was suspended in sterile ½ strength Ringers solution.
The suspensions were then serially diluted up to 10-6
using Ringers solution and 0.1 ml of
each dilution pour-plated onto triplicate MRS-cys-HCl plates. The plates were then incubated
anaerobically at 37°C for 72 h, after which the resultant colonies were counted on plates
containing 30-300 colonies. This then gave us a confirmation of the initial amount of bacteria
before the garlic preparations were added and enabled us to determine the minimum exposure
time.
2.3.8 Determination of minimum exposure times (Time kill curves)
MRS-cys-HCl broth was inoculated with each of the Bifidobacterium spp. respectively and
incubated overnight (24 h) anaerobically at 37°C. The cultures were then diluted to a
concentration equivalent to 0.5 McFarland standards. The different garlic extracts were then
added to each of the Bifidobacterium broth cultures respectively. The cultures were then
incubated at 37°C for 6 h. A 1 ml sample was then taken from each of the broth cultures,
containing the garlic extracts, immediately after the addition of garlic extracts, then after 0.5,
1, 2, 3, 4, 5 and 6 h of incubation. Cells were recovered by centrifugation at 13.5 rpm for 15
©© UUnniivveerrssiittyy ooff PPrreettoorriiaa

61
min and then rinsed with ½ Ringers solution and once again vortexed for 15 min at 13.5 rpm.
These samples were then serially diluted in ½ Ringers solution up to 10-6
and 0.1 ml of each
dilution was pour-plated onto MRS-cys-HCl plates and incubated anaerobically at 37°C.
Ampicillin was used as a positive control while bacterial cell suspensions without garlic
extract were used as negative controls. This experiment was repeated in triplicate.
2.3.9 MIC and MBC determinations
The minimum inhibitory concentrations (MICs) and minimum bactericidal concentrations
(MBCs) were determined using the broth dilution method according to Bakri and Douglas
(2005) with minor modifications. The garlic extracts were serially diluted in MRS-cys-HCl
broth in Eppendorf tubes and inoculated with 100 µl of the Bifidobacterium cultures. The
cultures were all adjusted to a concentration equivalent to 0.5 McFarland‟s standard. The
Eppendorf tubes were then incubated anaerobically overnight at 37°C and the highest dilution
where there was no growth was recorded as the MIC. The MBC was then determined by
taking 100 µl from the tubes that had no visible growth and plating out onto MRS-cys-HCl
agar plates. The plates were then incubated anaerobically overnight at 37°C. The highest
dilution where there was no growth at all on the plates was recorded as the MBC. Sterile
MRS-cys-HCl broth was used as a control for both of the above mentioned methods. MIC
and MBC determinations were performed in triplicate.
2.3.10 Statistical analysis
Statistical analysis of results was performed using STATISTICA version10, which included
determination of standard deviations of means. Student‟s t test was performed to analyze the
difference between the mean values and was performed at 5% significance level. Values
where p < 0.05 indicated a marked significant difference, and p > 0.05 was non-significant.
©© UUnniivveerrssiittyy ooff PPrreettoorriiaa

62
2.4 Results and Discussion
2.4.1 Determination of the antibacterial activity using the disk diffusion (DD) assay
Identity of all Bifidobacterium strains was confirmed by performing the phosphoketolase
assay. The final concentration of garlic extract in solution was determined as 60.7% (w/v), 10.7%
(w/v), 9% (w/v) and 8.9% (w/v) for the GC, GP, Gp and GS, respectively. The allicin concentration of
each garlic preparation was determined spectrophotometrically (Table 2.1) (Miron et al., 2002). All
extracts inhibited most strains except for B. lactis Bi-07 300B and L. acidophilus.
Table 2.1: Allicin concentration of garlic preparations.
Garlic preparation Allicin concentration
(µg/ml)
Garlic clove 198.74
Garlic paste 124.98
Garlic powder 26.63
Garlic spice 10.24
To determine the sensitivity of the Bifidobacterium strains to the garlic preparations the disk
diffusion assay was performed. All garlic extracts exhibited different levels of inhibition
against the tested strains as shown by results in Table 2.2 and the zones of inhibition in
Figure 2.1. The zone of inhibition indicates the effectiveness of the garlic in inhibiting the
growth of the bifidobacteria. The larger the zone, the more sensitive the bifidobacteria is to
garlic. These reported results are means (mm) ± SD of triplicate measurements. All strains,
excluding the control L. acidophilus were susceptible to most of the extracts. This is the first
time that the sensitivity of bifidobacteria to garlic is being reported. Ampicillin was used as a
positive control and all Bifidobacterium strains were inhibited with inhibition zones ranging
from 31.0 ± 1.7 to 52.0 ± 2.0 mm. These results correlate with those reported by Domig and
colleagues (2007) whom obtained zones of inhibition ranging from ±35-±67 mm for
ampicillin against Bifidobacterium strains. This was expected as previous research shows
bifidobacteria are susceptible to this antibiotic (Domig et al., 2007; Mättő et al., 2007; Reyed,
2007). For the GC extract the susceptibility pattern was as follows: B. bifidum LMG 11041 >
©© UUnniivveerrssiittyy ooff PPrreettoorriiaa
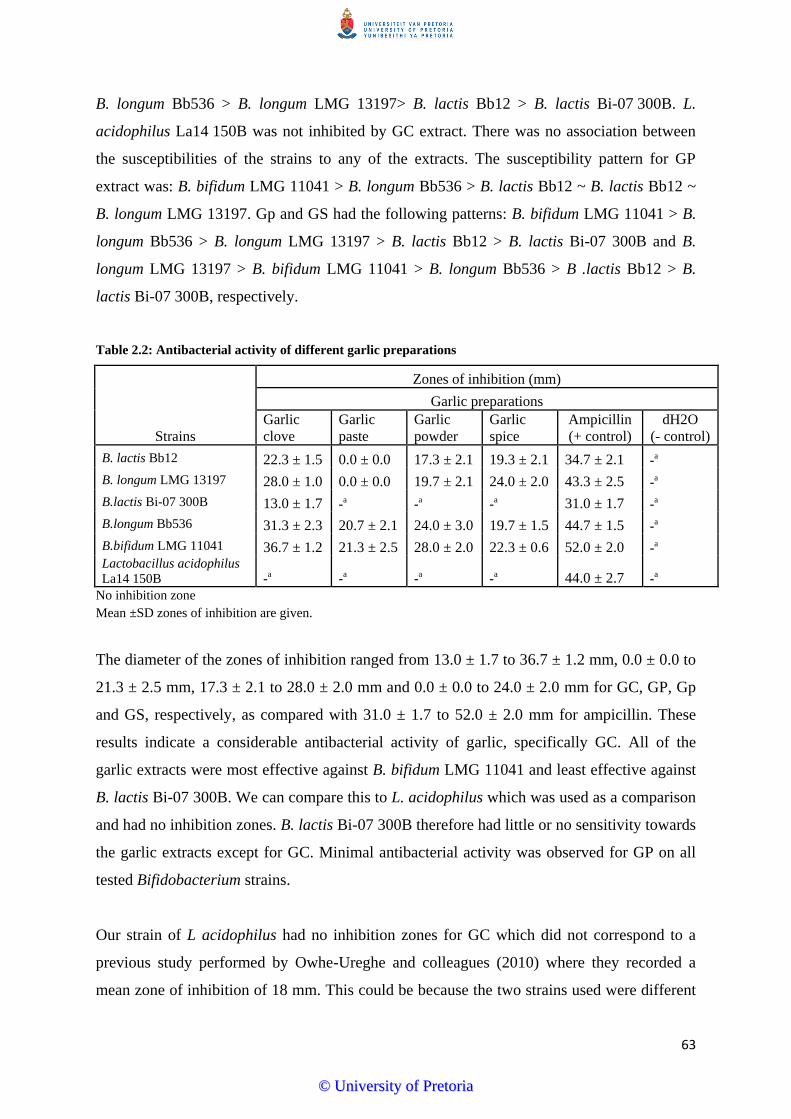
63
B. longum Bb536 > B. longum LMG 13197> B. lactis Bb12 > B. lactis Bi-07 300B. L.
acidophilus La14 150B was not inhibited by GC extract. There was no association between
the susceptibilities of the strains to any of the extracts. The susceptibility pattern for GP
extract was: B. bifidum LMG 11041 > B. longum Bb536 > B. lactis Bb12 ~ B. lactis Bb12 ~
B. longum LMG 13197. Gp and GS had the following patterns: B. bifidum LMG 11041 > B.
longum Bb536 > B. longum LMG 13197 > B. lactis Bb12 > B. lactis Bi-07 300B and B.
longum LMG 13197 > B. bifidum LMG 11041 > B. longum Bb536 > B .lactis Bb12 > B.
lactis Bi-07 300B, respectively.
Table 2.2: Antibacterial activity of different garlic preparations
Strains
Zones of inhibition (mm)
Garlic preparations
Garlic
clove
Garlic
paste
Garlic
powder
Garlic
spice
Ampicillin
(+ control)
dH2O
(- control)
B. lactis Bb12 22.3 ± 1.5 0.0 ± 0.0 17.3 ± 2.1 19.3 ± 2.1 34.7 ± 2.1 -a
B. longum LMG 13197 28.0 ± 1.0 0.0 ± 0.0 19.7 ± 2.1 24.0 ± 2.0 43.3 ± 2.5 -a
B.lactis Bi-07 300B 13.0 ± 1.7 -a -
a -
a 31.0 ± 1.7 -
a
B.longum Bb536 31.3 ± 2.3 20.7 ± 2.1 24.0 ± 3.0 19.7 ± 1.5 44.7 ± 1.5 -a
B.bifidum LMG 11041 36.7 ± 1.2 21.3 ± 2.5 28.0 ± 2.0 22.3 ± 0.6 52.0 ± 2.0 -a
Lactobacillus acidophilus
La14 150B -a -
a -
a -
a 44.0 ± 2.7 -
a
No inhibition zone
Mean ±SD zones of inhibition are given.
The diameter of the zones of inhibition ranged from 13.0 ± 1.7 to 36.7 ± 1.2 mm, 0.0 ± 0.0 to
21.3 ± 2.5 mm, 17.3 ± 2.1 to 28.0 ± 2.0 mm and 0.0 ± 0.0 to 24.0 ± 2.0 mm for GC, GP, Gp
and GS, respectively, as compared with 31.0 ± 1.7 to 52.0 ± 2.0 mm for ampicillin. These
results indicate a considerable antibacterial activity of garlic, specifically GC. All of the
garlic extracts were most effective against B. bifidum LMG 11041 and least effective against
B. lactis Bi-07 300B. We can compare this to L. acidophilus which was used as a comparison
and had no inhibition zones. B. lactis Bi-07 300B therefore had little or no sensitivity towards
the garlic extracts except for GC. Minimal antibacterial activity was observed for GP on all
tested Bifidobacterium strains.
Our strain of L acidophilus had no inhibition zones for GC which did not correspond to a
previous study performed by Owhe-Ureghe and colleagues (2010) where they recorded a
mean zone of inhibition of 18 mm. This could be because the two strains used were different
©© UUnniivveerrssiittyy ooff PPrreettoorriiaa

64
and from different origins, theirs being isolated from extracted carious teeth. A smaller
concentration of garlic was also used compared to that of Owhe-Ureghe and colleagues
(2010). Another reason, according to Deresse (2010), is that garlic species are different in
various countries as well as the means of the processing methods for garlic preparations.
It was anticipated that if there were any antimicrobial effects, it would most likely be
observed in the fresh GC extract, as raw garlic contains the active compound allicin which is
released upon crushing of the cloves. There have been countless studies proving that this
compound exhibits antimicrobial activities against a wide variety of both Gram-positive and
Gram-negative bacteria including some fungi and viruses (Harris et al., 2001; Benkeblia,
2004; Ruddock et al., 2005; Durairaj et al., 2009; Goncagul and Ayaz, 2010). GC extract also
revealed the highest allicin concentration which therefore coincides with the results obtained.
GS and Gp had lower allicin concentrations. This is probably due to their preparation process
where they are dehydrated, dried and stored for long periods of time before they are utilized.
The active ingredients found in fresh garlic extract, such as allinase, often become inactive;
thereby producing insignificant amounts of allicin and thus negligible antimicrobial
properties (Yu and Shi-ying, 2007). These preparations should therefore theoretically have
less effect on the strains compared to that of GC, which was observed. GS and Gp may
possibly contain other compounds, besides and less potent than allicin, which have an
antagonistic effect on bifidobacteria. Other compounds with antimicrobial effects such as
ajoene, vinyl dithiins and thiosulfanates have been isolated as products of garlic degradation
(Harris et al., 2001). Another reason for the low allicin concentrations for Gp and GS could
be due to volatilization as allicin is a very unstable compound and may undergo various
reactions forming other derivatives depending on conditions and processing actions (Hovana
et al., 2011). GP had little or no visible antibacterial effect on the strains.
There have been very few studies done on the influence that different culture media may have
on the antimicrobial activity of garlic components but it is known that cysteine has an effect
on allicin (Ross et al., 2001). Therefore this may have influenced our disk diffusion assay
results on the antimicrobial activity of not only our GP preparation, but for all the other
preparations, as bifidobacteria require cysteine in its culture media.
©© UUnniivveerrssiittyy ooff PPrreettoorriiaa

65
(A) (B)
(C) (D)
(E) (F)
Figure 2.1: Inhibition zones of the Bifidobacterium strains to the garlic preparations. L. acidophilus
La14 150B (A), B. lactis Bi-07 300B (B), B. longum Bb536 (C), B. longum LMG 11041 (D), B. lactis Bb12
(E) and B. longum LMG 13197 (F) exposed to distilled water (W), garlic clove extract (C and FE), garlic
paste (P), garlic powder (Gp) and garlic spice (GS).
©© UUnniivveerrssiittyy ooff PPrreettoorriiaa

66
2.4.2 Minimum exposure times
The minimum exposure times established the time required for the garlic preparations to start
decreasing the viability of each strain as well as revealing what effects they had on cell
growth. The initial concentration of bacteria for all strains was approximately equal to 0.5
McFarland‟s standard.
2.4.2.1. B. bifidum LMG 11041
This strain showed the highest (p<0.05) decrease in viability overall to all the garlic
preparations after the 6 h period (Fig. 2.2). The initial lag phase for GC lasted approximately
30 min, which was very similar to that of the positive control, ampicillin. According to Ross
and colleagues (2001) lag phases may be an indication of the waiting period for the garlic
molecules to be taken up and/or the start of the toxic effect on the metabolic processes of the
cell. This lag phase was then followed by a gradual drop in viability. After 5 h another steep
drop in viability occurred. GP, Gp and GS had longer lag phases of ± 2 h before a slight drop
was even observed followed by another drop after the 4th
hour. Negative control cell
suspensions that contained no garlic showed no drop in viability over the same period, there
was actually an increase in viable cells indicating that the garlic preparations, once exposed,
obviously do have an effect on the strain‟s viability. This is evident in the marked difference
(p < 0.05) between the drop in viability when exposed to the garlic preparations as opposed to
the negative control. Total reductions of approximately 1.2log, 0.4log, 0.6log and 0.7log were
observed after 6 h to GC, GP, Gp and GS, respectively. Results indicate that this strain was
most susceptible to GC which showed the highest drop in viability (p < 0.05), followed by
GS, Gp and GP.
©© UUnniivveerrssiittyy ooff PPrreettoorriiaa

67
Fig
ure
2.
2:
Th
e ef
fect
of
GC
, G
p,
GP
an
d G
S o
n B
. b
ifid
um
LM
G 1
10
41
via
bil
ity
wit
h t
ime
wit
h u
ntr
eate
d c
ell
susp
ensi
on
s a
nd
am
pic
illi
n (
Am
p)
as
neg
ati
ve
an
d
po
siti
ve
con
trols
, re
spec
tivel
y.
©© UUnniivveerrssiittyy ooff PPrreettoorriiaa

68
Fig
ure
2.
3:
Th
e ef
fect
of
GC
, G
p,
GP
an
d G
S o
n B
. lo
ng
um
Bb
53
6
via
bil
ity
wit
h t
ime
wit
h u
ntr
eate
d c
ell
susp
ensi
on
s a
nd
am
pic
illi
n (
Am
p)
as
neg
ati
ve
an
d
po
siti
ve
con
tro
ls,
resp
ecti
vel
y.
©© UUnniivveerrssiittyy ooff PPrreettoorriiaa

69
2.4.2.2. B. longum Bb 536
B. longum Bb 536 was also susceptible to all garlic preparations and therefore showed a
significant decrease (p < 0.05) in viability for each garlic preparation, compared to the
negative control, during the exposure period (Fig. 2.3). With GC, a longer initial lag phase of
approximately 1.5 h occurred in comparison with B. bifidum LMG 11041‟s 0.5 h lag phase.
Therefore it took longer for the garlic molecules to start reacting with this strain before there
was a considerable drop in cell numbers. After 2 h viability dropped at a gradual rate for the
remainder of the exposure period. Lag phases of 1 to 2 h were observed for GP, Gp and GS
after which there was a slight decrease in viability for 2 h before the numbers seemed to start
leveling out. A total reduction of approximately 0.8log was observed after 6 h to GC and
0.3log to GP, Gp as well as to GS. B. longum Bb 536 showed the highest drop in viability for
GC extract followed by GS. GP and Gp showed a very similar, if not identical, effect on this
strains cell growth and viability with a p-value higher than 0.05.
2.4.2.3. B. longum LMG 13197
Interestingly, B. longum LMG 13197 experienced an even longer lag phase upon exposure to
GC than the previous two strains (Fig. 2.4). It had an initial lag phase of 2 h before the GC
began to have a decreasing effect on its viability. On the contrary, it took GS only 0.5 h to
start lowering the viability of B. longum LMG 13197 and ampicillin initiated an immediate
decrease in viability. Gp only started having an inhibitory effect after 3 h, whereas viability
remained relatively constant throughout the exposure period to GP and actually started to
increase slightly after 4 h. This may be an indication that the active compounds in GP,
responsible for its antibactertial activity, became diminished and the remaining population of
B. longum cells started multiplying again. Instability of the active compound or its
transformation into stable compounds such as polysulfides and thiosulphonates may be the
reason for the diminished antimicrobial activity (Cellini et al., 1996; Belguith et al., 2010).
This has happened previously to bacterial cells exposed to garlic. Regrowth of Salmonella
enterica cells exposed to garlic powder was observed by Margues and colleagues (2008).
Feldberg and colleagues, (1988) suggested that regrowth of Salmonella typhimurium could be
owed to its capability to titrate allicin or possibly to metabolize it into non-inhibitory
compounds (Belguith et al., 2010). At 6 h an approximate reduction of 0.9log, 0.3 log and
0.4log was observed for GC, Gp and GS. For GP there was an increase of approximately
0.1log after the exposure period.
©© UUnniivveerrssiittyy ooff PPrreettoorriiaa

70
Fig
ure
2.4
: T
he
effe
ct o
f G
C,
Gp
, G
P a
nd
GS
on
B.
lon
gu
m L
MG
13
197
v
iab
ilit
y w
ith
tim
e w
ith
cel
l su
spen
sio
ns
an
d a
mp
icil
lin
(A
mp
) a
s n
ega
tiv
e a
nd
po
siti
ve
con
tro
ls, re
spec
tivel
y.
©© UUnniivveerrssiittyy ooff PPrreettoorriiaa

71
Fig
ure
2.
5:
Th
e ef
fect
of
GC
, G
p,
GP
an
d G
S o
n B
. la
ctis
Bb
12
v
iab
ilit
y w
ith
tim
e w
ith
un
trea
ted
cel
l su
spen
sio
ns
an
d a
mp
icil
lin
(A
mp
) a
s n
ega
tiv
e a
nd
po
siti
ve
con
tro
ls, re
spec
tivel
y.
©© UUnniivveerrssiittyy ooff PPrreettoorriiaa

72
2.4.2.4. B. lactis Bb12
The initial lag phase for GC, Gp and GS was 1 h, after which there was only a very slight
decrease in viability for both Gp and GS (Fig. 2.5). There was somewhat more of a drop after
1 h exposure to the GC extract. There was a noteworthy difference (p < 0.05) between
viability loss to GC as opposed to the other preparations. Total reductions in the region of
0.8log and 0.2log were observed for GC and for Gp and GS, respectively. This strain was
resistant to GP with no drop in viability after the 6 h of exposure. Viability remained fairly
constant with the same number of viable cells observed at the end of exposure to GP
compared with the initial amount at 0 h.
2.4.2.5. B. lactis Bi-07 300B
This strain was least susceptible to the antimicrobial effects of all the garlic preparations with
only a small decrease in viability after exposure to GC and no decrease in viability after
exposure to Gp, GP and GS (Fig. 2.6). After an initial lag phase of 1 h for GC there was a
drop in viability for the next hour followed by a relatively small and slow decline in cell
numbers for the remainder of the exposure period. The viable population decreased by
roughly 0.4log after 6 h exposure to GC.
2.4.2.6. L.acidophilus La14 150B
This strain was used as a comparison for all the Bifidobaterium strains as it is resistant to Gp,
GP and GS, as seen with results from disk diffusion assay, and only slightly susceptible to the
antimicrobial effects of GC (Fig. 2.7). If we compare the time kill curves of the tested
Bifidobacterium strains with the Lactobacillus strain we can definitely see that B. bifidum
LMG 11041 showed the highest (p < 0.05) drop in viability for all garlic preparations over
the 6 h exposure period. B. lactis Bi-07 300B, on the other hand, demonstrated a slight
decrease in viability for the GC extract and no decrease for the other three preparations. This
strain showed the closest trend to that for L. acidophilus.
©© UUnniivveerrssiittyy ooff PPrreettoorriiaa

73
Fig
ure
2.6
: T
he
effe
ct o
f G
C,
Gp
, G
P a
nd
GS
on
B.
lact
is B
i-0
-7 3
00
B v
iab
ilit
y w
ith
tim
e w
ith
un
trea
ted
cel
l su
spen
sion
s a
nd
am
pic
illi
n (
Am
p)
as
neg
ati
ve
an
d
po
siti
ve
con
trols
, re
spec
tivel
y.
©© UUnniivveerrssiittyy ooff PPrreettoorriiaa

74
Fig
ure
2.7
: T
he
effe
ct o
f G
C,
Gp
, G
P a
nd
GS
on
L.
aci
do
ph
ilu
s L
a1
4 1
50
B v
iab
ilit
y w
ith
tim
e w
ith
un
trea
ted
cel
l su
spen
sio
ns
an
d a
mp
icil
lin
(A
mp
) a
s n
ega
tiv
e a
nd
po
siti
ve
con
trols
, re
spec
tivel
y.
©© UUnniivveerrssiittyy ooff PPrreettoorriiaa

75
Overall B.bifidum LMG 11041 and B. longum Bb 536 were the only two Bifidobacterium
strains to show a decrease in viability for all garlic preparations over the 6 h exposure period.
All strains showed a significant decrease (p < 0.05) in viability upon exposure to GC. B.
longum LMG 13197 experienced a decrease in viability for Gp and GS but not for GP; while
B. lactis Bb12, upon exposure to Gp and GS, decreased slightly less. B. lactis Bi-07 300B
showed a very similar pattern to that of the comparison Lactobacillus strain which showed
practically no decrease in viability upon exposure to GP, Gp and GS and a slight decrease for
GC. This could also possibly indicate that B. lactis Bi-07 300B requires a longer exposure
period of more than 6 h to succumb to the antimicrobial effects of garlic. All bacterial cell
suspensions containing ampicillin decreased in viability during the 6 h exposure which was
expected with B. longum Bb536 experiencing the highest decrease. There was no drop in cell
viability in the negative controls after 6 h. All strains, including the Lactobacillus strain, if
only slightly, showed a drop in viability to that of their initial counts when exposed to the GC
extract (p < 0.05). The order of strains that demonstrated the highest drop in viability to the
lowest was as follows: B. bifidum LMG 11041 > B. longum Bb 536 > B. longum LMG 13197
> B. lactis Bb12 > B. lactis Bi-07 300B. For most strains, GC had the shortest lag phase when
compared to the other garlic preparations and on average took 1 h to start inhibiting the
bacterial cells. The most sensitive strain, B. bifidum LMG 11041 succumbed to the
antibacterial activity of GC within 0.5 h.
Viable cell numbers of all Bifidobacterium strains, except B. bifidum LMG 11041 and B.
longum Bb536, were the same; and for others slightly higher, as their initial inoculums for
GP. This could possibly be an indication of these strains showing a bacteriostatic response to
GP. This could also be the case for both B. lactis strains for Gp and GS as their viable cell
numbers were also the same as their initial counts, with very slight decreases in viability over
the 6 h exposure time to these preparations.
The differences in minimum exposure period observed for these strains signified that
sensitivity of Bifidobacterium strains to garlic preparations differed between species as well
as within strains of the same species. This emphasized that no generalizations should be made
for the various strains on their sensitivity to antimicrobial effects of garlic. Inter-strain
variations in garlic extract sensitivity was also observed for strains of Streptococcus mutans
by Chen and colleagues (2009), whom attributed it to be partly due to the different cell
surface compositions in different strains.
©© UUnniivveerrssiittyy ooff PPrreettoorriiaa

76
2.4.3 MICs and MBCs
As mentioned previously, the garlic extract used for GC, GP, Gp and GS was 60.7% (w/v),
10.7% (w/v), 9% (w/v) and 8.9% (w/v) respectively. The allicin concentration for each
preparation can be seen in Table 2.1. Both garlic extract concentration and the determined
allicin concentration were used to calculate the MIC and MBC values. MIC and MBC values
obtained are shown in Table 2.2.
The MIC values of GC, Gp and GS against the different Bifidobacterium strains ranged from
75.9-303.5 mg/ml garlic, 24.84-99.37 µg/ml allicin; 30->90 mg/ml garlic, 8.88->26.63 µg/ml
allicin and 44.5>89 mg/ml garlic, 5.12->10.24 µg/ml allicin, respectively. The MIC values
for GP against all strains, except for B. longum Bb536 and B. bifidum LMG 11041, were
>107 mg/ml garlic; >124.98 µg/ml allicin. MIC values for ampicillin were significantly lower
(p < 0.05) against all strains, including Lactobacillus, compared to any garlic extract and
ranged from 0.00000035-0.5 mg/ml. This was expected as bifidobacteria and lactobacilli are
very susceptible to this antibiotic (Zhou et al., 2005; D‟Aimmo et al., 2007).
GC extract was found to inhibit all Bifidobacterium strains tested as well as the control
Lactobacillus culture and had significantly higher (p < 0.05) MIC values compared to the
other preparations. The maximum effectiveness of GC extract was on B. bifidum LMG 11041
(75.9 mg/ml garlic; 24.84 µg/ml allicin) followed by B. longum Bb536 (86.7 mg/ml garlic;
28.39 µg/ml allicin), B. longum LMG 13197 (151.75 mg/ml garlic; 49.69 µg/ml), B. lactis
Bb12 (202.3 mg/ml garlic; 66.25 µg/ml allicin) and lastly B. lactis Bi-07 300B, with a higher
MIC value of 303.5 mg/ml garlic and 99.37 µg/ml allicin for GC. There was no significant
difference (p > 0.05) between the MIC values obtained for GP for most Bifidobacterium
strains, besides B. bifidum LMG 11041 and B. longum Bb536, indicating that the first three
were not susceptible to this preparation. GS also showed no negligible differences between
MIC values for B. lactis strains and B. longum LMG 13197, but had lower values for B.
bifidum LMG 11041 and B. longum Bb536 showing that these two strains were more
sensitive to the GS preparation. Once again the B. bifidum strain showed the lowest MIC for
Gp, followed by B. longum Bb536 and B. lactis Bb12. High MIC values for Gp were
obtained for the rest of the strains. Strains that were sensitive to the different garlic
preparations had MBC values that were a dilution lower, sometimes more, than those for the
MIC values.
©© UUnniivveerrssiittyy ooff PPrreettoorriiaa

77
Table 2.3: Inhibitory effect (MIC and MBC) of different garlic extracts on tested Bifidobacterium strains.
Bifidobacterium
species
Antimicrobial agent MIC (mg/ml (µg/ml)) MBC (µg/ml)
B. lactis Bb12 GC
Gp
GP
GS
Amp
202.3 (66.25)
45 (13.32)
>107 (124.98)
89 (10.24)
0.035
1:1 (198.74)
1:1 (26.63)
>107 (>124.98)
>89 (>10.24)
1:2
B.bifidum LMG 11041 GC
Gp
GP
GS
Amp
75.9 (24.84)
30 (8.88)
107 (124.98)
44.5 (5.12)
0.00000035
1:5 (39.75)
1:2 (13.32)
>107 (>124.98)
1:1 (10.24)
1:7
B.lactis Bi-07 300B GC
Gp
GP
GS
Amp
303.5 (99.37)
>90 (>26.63)
>107 (>124.98)
>89 (>10.24)
0.05
1:1 (198.74)
>90 (>26.63)
>107 (>124.98)
>89 (>10.24)
1:2
B.longum Bb536 GC
Gp
GP
GS
Amp
86.7 (28.39)
45 (13.32)
107 (124.98)
44.5 (10.24)
0.00005
1:4 (49.69)
1:1 (26.63)
>107 (>124.98)
1:1 (10.24)
1:4
B.longum LMG 13197 GC
Gp
GP
GS
Amp
151.75 (49.69)
90 (26.63)
>107 (124.98)
89 (10.24)
0.002
1:2 (99.37)
>90 (>13.32)
>107 (>124.98)
>89 (>10.24)
1:3
Lactobacillus
acidophilus La14 150B
GC
Gp
GP
GS
Amp
303.5 (99.37)
>90(>26.63)
>107 (>124.98)
>89 (>10.24)
0.5
>607 (>198.74)
>90 (>26.63)
>107 (>124.98)
>89 (>10.24)
1:1
Sterile broth, without garlic, was used for negative control. Ampicillin (Amp) (50 mg/ml) was used as positive
control. The allicin concentration was determined spectrophotometrically (Miron et al., 2002). Strains not killed
by the highest garlic clove concentration are depicted as: >607 mg/ml (The same goes for GP, Gp and GS
extracts).
©© UUnniivveerrssiittyy ooff PPrreettoorriiaa

78
Bifidobacterium bifidum LMG 11041 had the lowest MIC‟s and MBC‟s for all garlic
preparations compared to the other bifidobacterial strains, indicating that it was the most
sensitive strain overall to all the preparations. These results correspond to the disk diffusion
assay as well as the minimum exposure time results. L. acidophilus, the strain used as the
comparison, had the highest MIC and MBC values and was therefore least susceptible to all
the garlic preparations. With these results we can say that Bifidobacterium spp. are indeed
more sensitive to garlic than the Lactobacillus strain. In a study conducted by Rees and
colleagues (1993), Lactobacillus spp. were also least inhibited by the presence of garlic
compared to other microorganisms tested.
For our results GC and Gp have an inhibitory effect against L. acidophilus at slightly higher
MIC values compared to those recently reported by Ross and colleagues (2001) and Owhe-
Ureghe et al (2010). Our estimated allicin concentration for GC extract was also slightly
lower than some published allicin MIC results such as Bakri and Douglas, 2005. These
differences in results may be due to a number of reasons. One important reason is the origin
and type of strains of garlic. According to Deresse (2010) and Hannan and colleagues (2012),
garlic spp. tend to vary in different countries as well as the different processing methods in
garlic preparation. Therefore there may be varying concentrations of individually and
synergistically active bio-substances in different garlic preparations around the world which
may explain the differences in antimicrobial potency as well as variations in genetic disparity
among bacteria tested (Iwalokun et al., 2004; Hannan et al., 2012; Gaekwad and Trivedi,
2013).
Our slightly lower allicin concentrations and higher MIC values may also be due to too little
precautions taken to prevent loss of garlic components, specifically allicin, by volatilization.
Allicin is not only a very volatile compound, but is also very unstable and will undergo
numerous reactions forming other derivatives dependent on environmental conditions and the
processing reactions. Our garlic preparations were suspended in dH2O and according to
Lawson and Wan (1995), allicin can react with water to form diallyl disulphide, which
doesn‟t show evidence of the same level of antimicrobial activity as allicin does (Hovana et
al., 2010). Lastly, the type of methodology used for determination of MIC‟s will also affect
results. The depth of agar, lag-time required for diffusion of the garlic extract, pH, size of
inoculum and incubation time will all influence the MIC of the extract (Hannan et al., 2012).
Therefore standardization of garlic extract used as well as methodologies is necessary.
©© UUnniivveerrssiittyy ooff PPrreettoorriiaa

79
There has been very little investigation on the antimicrobial activity of GP, Gp and GS. Our
results indicate that GP had a slight antimicrobial effect on Bifidobacterium spp. and Gp and
GS had much less of an antimicrobial effect on the strains compared to GC. According to O‟
Gara and colleagues (2000), Gp does have a lower potency or inhibitory effect compared to
GC due to its high vegetable content. As mentioned before, cysteine in the culture media may
have had an impact on the interpretation of our in vitro test results on the antimicrobial
activity of our GP preparation. Therefore these results may be an underestimate of its full
antimicrobial potential, possibly even for GS and Gp. Commercial GP contains acetic acid
and benzoic acid and may therefore also have affected our determined allicin concentration
and results (Gupta and Ravishankar, 2005).
2.5 Conclusions
These are the first results obtained on the inhibitory effect of GC, GP, Gp and GS on
Bifidobacterium spp. and there have been no other studies, to our knowledge, on
susceptibility tests of garlic on Bifidobacterium spp. This study highlighted that garlic
displays an antimicrobial activity towards bifidobacteria. Results indicated that fresh GC
extract was the most effective with inhibiting the strains, followed by GS, Gp and GP having
negligible or no antimicrobial effect. All Bifidobacterium strains were inhibited at different
extents and it appeared that the B. bifidum strain was most susceptible, followed by the B.
longum and B. lactis strains. This therefore shows that susceptibility of bifidobacteria to
garlic differs between spp. and among different strains of the same species.
Time kill curves showed that viability of the strains definitely decreased and for most strains
began to decrease after 1 h of exposure to GC. According to O‟ Gara and colleagues (2000)
allicin remains stable in an acidic medium and this gives us ample enough reason to believe,
that when ingested in conjunction, garlic may inhibit and lower the effectiveness of the
probiotic bifidobacteria once they come into contact in the GIT. Much work is put into
preparing probiotic products with the optimal number of viable bacterial cells in order to give
the consumer the optimal health benefits, and it is therefore important to recognize anything
that may hamper the products viability. Therefore this study was significant in identifying
garlic as a product that could possibly decrease the viability of probiotic bifidobacteria when
ingested simultaneously.
©© UUnniivveerrssiittyy ooff PPrreettoorriiaa

80
Future studies will explore the actual antibacterial mechanism of garlic against bifidobacteria
as well as the effect that food processing and different food matrices have on the
antibifidobacterial effects of garlic. Additional studies can also be done on the physiological
changes that occur in bifidobacteria once it is exposed to garlic.
2.6 References
Alakomi, H-L, Mättő, J, Virkajarvi, I & Saarela, M 2005, „Application of a microplate scale
fluorochrome staining assay for the assessment of viability of probiotic preparations‟, Journal
of Microbiological Methods, vol. 62, pp. 25-35.
Al-Waili, N.S., Saloom, K.Y., Akmal, M, Al-Waili, T.N., Al-Waili, A.N., Al-Waili, H, Ali. A
& Al-Sahlani, K 2007, „Effects of heating, storage, and ultraviolet exposure on antimicrobial
activity of garlic juice‟, Journal of Medicinal Food, vol. 10, no. 1, pp. 208-212.
Amagase, H, Petesch, B.L., Matsuura, H, Kasuga, S & Itakura, Y 2001, „Intake of garlic and
its bioactive components‟, Journal of Nutrition, vol. 131, pp. 955-962.
Bakri, I.M & Douglas, C.W.I 2005, „Inhibitory effect of garlic extract on oral bacteria‟,
Archives of Oral Biology, vol. 50, pp. 645-651.
Belguith, H, Kthiri, F, Chati, A, Abu Sofah, A, Ben Hamida, J & Laduolsi, A 2010,
„Inhibitory effect of aqueous garlic extract (Allium sativum) on some isolated Salmonella
serovars‟, African Journal of Microbiology Research, vol. 4, no. 5, pp. 328-338.
Benkeblia, N 2004, „Antimicrobial activity of essential oil extracts of various onions (Allium
cepa) and garlic (Allium sativum)‟, Lebensmittel-Wissenschaft und-Technologie, vol. 37, pp.
263-268.
Biavati, B, Vescovo, M, Torriani, S & Bottazzi, V 2000, „Bifidobacteria: history, ecology,
physiology and applications‟, Annals of Microbiology, vol. 50, pp. 117-131.
Cellini, L, Campli, D, Masulli, E, Bartolomeo, D.S & Allocati, N 1996, „Inhibition of
Helicobacter pylori by garlic extract (Allium sativum)‟, Immunology and Medical
Microbiology, vol. 13, pp. 273-277.
©© UUnniivveerrssiittyy ooff PPrreettoorriiaa
81
Chen, Y-Y., Chiu, H-C & Wang, Y-B 2009, „Effects of garlic extract on acid production and
growth of Streptococcus mutans‟, Journal of Food and Drug Analysis, vol. 17, no.1, pp. 59-
63.
D‟Aimmo, M.R., Modesto, M & Biavati, B 2007, „Antibiotic resistance of lactic acid bacteria
and Bifidobacterium spp. isolated from dairy and pharmaceutical products‟, International
Journal of Food Microbiology, vol. 115, pp. 35-42.
Daka, D 2011, „Antibacterial effect of garlic (Allium sativum) on Staphylococcus aureus: An
in vitro study‟, African Journal of Biotechnology, vol. 10, no. 4, pp. 666-669.
Deresse, D, 2010 „Antibacterial effect of garlic (Allium sativum) on Staphylococcus aureus:
An in vitro study‟, Asian Journal of Medical Sciences, vol. 22, no. 2, pp. 62-65.
Domig, K.J., Mayrhofer, S, Zitz, U, Mair, C, Petersson, A, Amtmann, E, Mayer, H.K &
Kneifel, W 2007, „Antibiotic susceptibility testing of Bifidobacterium thermophilum and
Bifidobacterium pseudolongum strains: Broth microdilution vs. agar disk diffusion assay‟,
International Journal of Food Microbiology, vol. 120, pp. 191-195.
Durairaj, S., Srinivasan, S & Lakshmanaperumalsamy, P 2009, „In vitro antibacterial activity
and stability of garlic extract at different pH and temperature‟, Electronic Journal of Biology,
vol. 5, no. 1, pp. 5-10.
Gaekwad, V & Trivedi, N.A 2013, In vitro evaluation of antimicrobial effect of fresh garlic
extract and its interaction with conventional antimicrobials against Escherichia coli isolates‟,
International Journal of Current Research and Review, vol. 5, no. 1, pp. 106-114.
Goncagul, G & Ayaz, E 2010, „Antimicrobial effect of garlic (Allium sativum) and traditional
medicine‟, Journal of Animal and Veterinary Advances, vol. 9, no. 1, pp. 1-4.
Gupta, S & Ravishankar, S 2005, „A comparison of the antimicrobial activity of garlic,
ginger, carrot, and turmeric pastes against Escherichia coli O157:H7 in laboratory buffer and
ground beef‟, Foodborne Pathogens and Disease, vol. 2, no. 4, pp. 330-340.
Hacıseferoğullari, H, Őzcan, M, Demir, F & Çalışır 2005, „Some nutritional and
technological properties of garlic (Allium sativum L.)‟, Journal of Food Engineering, vol. 68,
pp. 463-469.
©© UUnniivveerrssiittyy ooff PPrreettoorriiaa

82
Hannan, A, Rauf, K, Ullah, M.I., Naeem, T, Raja, M, Qamar, M.U., Tahir, R & Saba, M
2012, „Inhibitory effect of aqueous garlic (Allium sativum) extract against clinical isolates of
Salmonella typhi‟, African Journal of Microbiology Research, vol. 6, no. 21, pp. 4475-4480.
Harris, J.C., Cottrell, S.L., Plummer, S & Lloyd, D 2001, „Antimicrobial properties of Allium
sativum (garlic)‟, Applied Microbiology and Biotechnology, vol. 57, pp. 282-286.
Hovana, E-I. K., James, U.S., James, E, Egbobor, E. M., Egba, A. G., Eta, E.S & Nwakaku,
O. A 2011, „Antibacterial and phytochemical studies of Allium Sativum‟, New York Science
Journal, vol. 4, no. 4, pp. 123-128
Iwalokun, B.A., Ogunledun, A., Ogbolu, D.O., Bamiro, S.B & Jimi-Omojola, J 2004, „In
vitro antimicrobial properties of aqueous garlic extract against multi-drug resistant bacteria
and Candida species from Nigeria‟, Journal of Medicinal Food, vol. 7, no. 3, pp. 327-333.
Kaur, I.P., Chopra, K & Saini, A 2002, „Probiotics: Potential Pharmaceutical Applications‟,
European Journal of Pharmaceutical Sciences, vol. 15, pp. 1-9.
Kumar, K. P. S., Bhowmik, D., Chiranjib, Tiwari, P & Kharel, R 2010, „Allium sativum and
its health benefits: An overview‟, Journal of Chemical and Pharmaceutical Research, vol. 2,
no. 1, pp. 135-146.
Leahy, S.J., Higgins, D.G., Fitzgerlad, G.F & van Sinderen, D 2005, „Getting better with
bifidobacteria‟, Journal of Applied Microbiology, vol. 98, pp. 1303-131.
Lu, X, Rasco, B.A., Kang, D-H, Jabal, J.M.F., Aston, D.E & Konkel, M.E 2011, „Infrared
and raman spectroscopic studies of the antimicrobial effects of garlic concentrates and diallyl
constituents on foodborne pathogens‟, Analytical Chemistry, vol. 83, pp. 4137-4146.
Marques, A., Encarnação, S., Pedro, S & Nunes, M. L 2008, „In vitro antimicrobial activity
of garlic, oregano and chitosan against Salmonella enteric’, World Journal of Microbiology
and Biotechnology, vol. 24, pp. 2357-2360.
Masco, L, Van Hoorde, K, De Brandt, E, Swings, J & Huys, G 2006, „Antimicrobial
susceptibility of Bifidobacterium strains from humans, animals and probiotic products‟,
Journal of Antimicrobial Chemotherapy, vol. 58, pp. 85-94.
Mättő, J, van Hoek, A.H.A.M., Domig, K.J., Saarela, M, Floréz, A.B., Brockmann, E,
Amtmann, E, Mayo, B, Aarts, H.J.M & Danielsen, M 2007, „Susceptibility of human and
©© UUnniivveerrssiittyy ooff PPrreettoorriiaa

83
probiotic Bifidobacterium spp. To selected antibiotics as determined by the Etest method‟,
International Dairy Journal, vol. 17, pp. 1123-1131.
Miron, T, Rabinkov, A, Mirelman, D, Weiner, L & Wilchek, M 1998, „A spectrophotometric
assay for allicin and allinase (Alliin lyase) activity: Reaction of 2-nitro-5-thiobenzoate with
thiosulfinates‟, Analytical Biochemistry, vol. 265, pp. 317-325.
Miron, T, Shin, I, Feigenblat, G, Weiner, L, Mirelman, D, Wilchek, M & Rabinkov, A 2002,
„A spectrophotometric assay for allicin, alliin, and allinase (alliin lyase) with a chromogenic
thiol: reaction of 4-mercaptopyridine with thiosulfinates‟, Analytical Biochemistry, vol. 307,
pp. 76-83.
Moubareck, C, Gavini, F, Vaugien, L, Butel, M.J & Doucet-Popularie, F 2005,
„Antimicrobial susceptibility of Bifidobacteria‟, Journal of Antimicrobial Chemotherapy, vol.
55, pp. 38-44.
Naganawa, R., Iwata, N., Ishikawa, K., Hiroyuki, F., Tsuchiyoshi, F & Suzuki, A 1996,
„Inhibition of microbial growth by adjoene, a sulphur-containing compound derived from
garlic‟, Applied Environmental Microbiology, vol. 62, no. 11, pp. 4238-4242.
O‟ Gara, E.A., Hill, D.J & Maslin, D.J 2000, „Activities of garlic oil, garlic powder, and their
diallyl constituents against Helicobacter pylori‟, Applied and Environmental Microbiology,
vol. 66, no. 5, pp. 2269-2273.
Orban, J.I & Patterson, J.A 2000, „Modification of the phosphoketolase assay for rapid
identification of bifidobacteria‟, Journal of Microbiological Methods, vol. 40, pp. 221-224.
Owhe-Ureghe, U.B., Ehwarieme, D.A & Eboh, D.O 2010, „Antibacterial activity of garlic
and lime on isolates of extracted carious teeth‟, African Journal of Biotechnology, vol. 9, no.
21, pp. 3163-3166.
Rees, L.P., Minney, S.F., Plummer, N.T., Slater, J.H & Skryme, D.A 1993, „A quantitative
assessment of the antimicrobial activity of garlic (Allium sativum)‟, World Journal of
Microbiology and Biotechnology, vol. 9, pp. 303-307.
Reid, G 2006, „Safe and efficacious probiotics: what are they?‟, Trends in Microbiology, vol.
14, no. 8, pp. 348-352.
©© UUnniivveerrssiittyy ooff PPrreettoorriiaa

84
Reyed, R.M 2007, „The role of bifidobacteria in health, „Research Journal of Medicine and
Medical Sciences‟, vol. 2, no. 1, pp. 14-24.
Ross, Z.M., O‟ Gara, E.A., Hill, D.J., Sleightholme, H.V & Maslin, D.J 2001, „Antimicrobial
properties of garlic oil against human enteric bacteria: Evaluation of methodologies and
comparisons with garlic oil sulfides and garlic powder‟, Applied Environmental
Microbiology, vol. 67, no. 1, pp. 475-480.
Ruddock, P.S, Mingman, L, Foster, B.C, Lawson, L, Arnason, J.T & Dillon, J-A.R 2005,
„Garlic Natural Health Products Exhibit Variable Constituent Levels and Antimicrobial
Activity against Neisseria gonorrhoeae, Staphylococcus aureus and Enterococcus faecalis’,
Phytotherapy Research, vol. 19, pp. 327-334.
Schrezenmeir, J & de Vrese, M 2001, „Probiotics, prebiotics, and synbiotics-approaching a
definition‟, American Journal for Clinical Nutrition, vol. 73, pp. 361S-364S.
Sullivan, A & Nord, C.E 2002, „The place of probiotics in human intestinal infections‟,
International Journal of Antimicrobial Agents, vol. 20, pp. 313-319.
Uchida, Y, Takahashi, T & Sato, N 1975, „The characteristics of the antibacterial activity of
garlic‟, Japanese Journal of Antibiotics, vol. 28, pp. 638-646.
Wohlgemuth, S, Loh, G & Blaut, M 2010, „Recent developments and perspectives in the
investigation of probiotic effects‟, International Journal of Medical Microbiology, vol. 300,
pp. 3-10.
Yu, L. I & Shi-ying, X. U 2007, „Preparation of garlic powder with high allicin content‟,
Agricultural Sciences in China, vol. 6, no. 7, pp. 890-898.
Zhou, J.S., Pillidge, C.J., Gopal, P.K & Gill, H.S 2005, „Antibiotic susceptibility profiles of
new probiotic Lactobacillus and Bifidobacterium strains‟, International Journal for Food
Microbiology, vol. 98, pp. 211-217.
©© UUnniivveerrssiittyy ooff PPrreettoorriiaa

85
CHAPTER 3
Morphological properties of garlic (Allium sativum)
treated bifidobacteria as depicted by scanning
electron microscopy (SEM)
Booyens, J, Labuschagne, M.C & Thantsha, M.S 2013, „In vitro antibacterial mechanism of
action of crude Garlic (Allium sativum) clove extract on selected probiotic Bifidobacterium
species as revealed by SEM, TEM and SDS-PAGE analysis‟, Probiotics and Antimicrobial
Proteins (Accepted).
©© UUnniivveerrssiittyy ooff PPrreettoorriiaa

86
3.1 Abstract
Bifidobacteria are important beneficial microbes that inhabit the human gastrointestinal tract
and are used in probiotic-containing foods and products. Changes in morphology of
bifidobacteria occur as a result of stress which may include anything from predation,
limitation of nutrients, environmental changes as well as contact with a toxic or antimicrobial
compound that is harmful to the cell. Garlic (Allium sativum) has been found to have
antimicrobial properties and has an inhibitory effect on a number of microorganisms. The
morphological alterations as well as behavioural changes of selected Bifidobacterium strains
induced upon exposure to different garlic extracts were illustrated and discussed in this study
using scanning electron microscopy (SEM). All strains were affected by garlic clove extract
and SEM micrographs revealed an assortment of changes which included swarming, cell
elongation, cell wall and cytoplasm lysis, distortion of the outer surface and shape of the
cells, pore-formation as well as swelling of the cells. Initiation of apoptosis was also evident.
Exposure to garlic paste extract resulted in morphological alterations in most strains except
the B. lactis strains. This study provides new insights into the action of garlic on the outer
surface and behaviour of bifidobacteria.
Keywords: morphology, bifidobacteria, scanning electron microscopy (SEM), garlic, Allium
sativum
©© UUnniivveerrssiittyy ooff PPrreettoorriiaa

87
3.2 Introduction
The occurrence of bifidobacteria is a significant indication of stability of microflora in the
human gastrointestinal tract (GIT) as well as good health. These bacteria have a positive
effect against allergies, acute and chronic intestinal infections and immunodeficiency
diseases among others (Novic et al., 2001). Together with lactobacilli, bifidobacteria are used
in probiotic products due to these beneficial health effects (Reyed, 2007). In order for
probiotic bacteria to exert their health benefits they must be able to attach to and colonize the
intestinal mucosa. Surface properties of these bacteria play an important role in the probiotic
effect and colonization capability. Therefore changes to the surface properties may prevent
probiotics from colonizing the intestinal mucosa and thereby decrease their effectiveness
(Gueimonde et al., 2005).
Bifidobacteria are Gram-positive, anaerobic, non-spore-forming bacteria which are
pleomorphic, branched rods that may occur as single cells, clumps or in chains (Biavati et al.,
2000; Giovanna and Dellaglio, 2007). Their rod-shape appearance is inconsistent and can
change due to a variety of factors such as stress and nutrient conditions (Boylston et al.,
2004). Their cell wall is characteristically Gram-positive with a structure that consists of a
thick peptidoglycan envelope which contains various proteins, polysaccharides and teichoic
acids (Biavati et al., 2000). Their inconsistent appearance was already observed in earlier
years when they were observed as colon bacteria reproducing by budding and formation of
Y-shapes (Biavati et al., 2000; Young, 2006).
Morphological changes in bacteria occur due to various environmental demands or basic
forces. These may include among other, a limitation of nutrients, predation, cell division,
attachment and differentiation. In response to nutrient scarcity, cells may undergo elongation
in order to increase total surface area without a noticeable increase in the surface-to-volume
ratio. With regards to predation, smaller cells, which are sought out by some predators, will
increase their cell length. Individual bacteria adopt a shape that is adaptive and advantageous
and they will modify their morphology in order to cope with these changes (Young, 2006;
Young, 2007). Exposure to or contact with a harmful compound or agent also induces cell
surface changes as the cell surface is the first physical barrier of defence against
environmental compounds (Ruiz et al., 2007). Bacterial cells also use biofilm formation as an
©© UUnniivveerrssiittyy ooff PPrreettoorriiaa

88
alternative survival strategy, where cells cluster together for protection from exposure to
harmful chemicals such as antibiotics, or phagocytosis by protozoa (Young, 2006).
Changes in morphology have been observed in Bifidobacterium species where the typical
rod-shaped cells have become coccoid once there is a nutrient constraint in order to save
energy (Young, 2007). The genus Bifidobacterium is distinct for its pleomorphic forms
within the species and B. bifidum has been studied numerous times specifically for its
variation in shape (Husain et al., 1972; Young, 2006). Research has proven that once
bifidobacterial species enter their death phase due to an environmental constraint, they
undergo irreversible structural and functional rearrangement. During this phase they can also
form cyst-like capsules (Novic et al., 2001). In this study we have already established that
bifidobacteria are inhibited on exposure to garlic.
Garlic (Allium sativum) has been used for centuries due to its numerous medicinal uses and
health benefits (Kumar et al., 2010; Daka, 2011). Numerous reports have indicated that garlic
has a broad antibacterial spectrum against both Gram-positive and Gram-negative bacteria
(Ruddock et al., 2005; Daka, 2011). Allicin is the compound responsible for garlic‟s
antimicrobial activity and once intact garlic tissue is crushed, cut or damaged; alliin is
converted into this compound, allicin (Harris et al., 2001; Ruddock et al., 2005).
There is much research which indicates that garlic has a morphological effect on bacterial
cells. A study done by Belguith and colleagues (2009) proved that outer membrane integrity
of Salmonella hadar was affected once exposed to aqueous garlic extract. Rod-like
projections were also observed on the outer membrane of the cells. O‟ Gara and colleagues
(2000) also observed changes in the morphology and behaviour of Helicobacter pylori cells
once exposed to garlic oil. Typical rod-shaped cells decreased in numbers and coccoid cells
became apparent. There was also an increase in clumping of these cells and cellular debris.
Garlic has also been shown to affect the cell surface properties of Candida albicans and
Listeria monocytogenes (Lemar et al., 2005; Kim et al., 2007). Biofilm formation in
Streptococcus mutans has also been attributed as a result of exposure to garlic extract (Lee et
al., 2011). The aim of this study was to investigate the changes in morphology, cell wall
structure and behaviour of Bifidobacterium species once exposed to different garlic
preparations.
©© UUnniivveerrssiittyy ooff PPrreettoorriiaa

89
3.3. Material and Methods
3.3.1 Bacterial cultures
Commercial probiotic cultures of Bifidobacterium lactis Bb12 (CHR- Hansen), B. longum
Bb536 (Morinaga Milk company), B. lactis Bi-07 300B and Lactobacillus acidophilus La14
150B (Danisco) were used. L. acidophilus La14 150B (Danisco) was used as a comparison.
B. bifidum LMG 11041 and B. longum LMG 13197 strains were both purchased from the
BCCM/LMG culture collection, Belgium and revived as per instructions from the supplier.
3.3.2 Preparation of inoculums
Lactobacillus acidophilus La14 150B was grown in MRS broth while the bifidobacterial
cultures were grown in MRS broth supplemented with 0.05% cysteine hydrochloride. Both of
the inoculated broths were incubated at 37°C for 48 h in anaerobic jars with Anaerocult A
gaspacks (Merck Ltd, Mofferfontein, SA) and Anaerocult C test strips for confirmation of
anaerobic conditions inside the jar. Bacterial cell suspensions were adjusted to a 0.5
McFarland standard (approximately 1 x 10⁸ cfu/ml).
3.3.3 Garlic preparations
Fresh garlic cloves (GC), garlic paste (GP), garlic powder (Gp) and garlic spice (GS) were
bought from a local supermarket in Pretoria. GC, Gp and GS were stored at room
temperature, whilst GP was stored at 4°C for no longer than 2 weeks.
3.3.3.1 Preparation of garlic extracts and determination of the final concentration of
garlic in solution
The garlic extract was prepared as described by Bakri and Douglas (2005), with minor
modifications. Fresh cloves were separated and peeled and 10 g was weighed and crushed
using a mortar and pestle. This was then suspended in 5 ml sterile distilled water. The same
amounts of GP, Gp and GS were weighed and GS and Gp were suspended in 10 ml of sterile
distilled water, whilst GP was suspended in 5 ml. These suspensions were then centrifuged
and filtered through a 0.22 µm filter (Minisart). The weight of the insoluble material of the
©© UUnniivveerrssiittyy ooff PPrreettoorriiaa

90
GC, GP, Gp and GS was subtracted from the weight of the original material to get the final
concentration of garlic extract in solution. The sterile extract was used within 30 min of its
preparation for the inhibition studies. One hundred microlitres of each of the different garlic
extracts were added to 1 ml of the Bifidobacterium and Lactobacillus broth cultures.
Untreated broth cultures were used as a negative control while ampicillin (Amp) was used as
a positive control. The cultures were then incubated at 37°C for 6 h. Samples were taken
immediately before exposure to the garlic extracts and then after 6 h of exposure. Eppendorf
tubes were then centrifuged for 10 min at 12044.9 g. Cells were resuspended in 1 ml Ringer‟s
solution and centrifuged once again. This was repeated three times after which the cultures
were prepared for SEM.
3.3.4 Scanning electron microscopy
To determine the effect that the garlic preparations have on the morphology and membrane of
bifidobacteria, a modification of the method by Lai-King et al (1985) was used. The cells,
which were suspended in ¼ Ringer‟s solution, were harvested by filtering through a 0.2 μm
filter membrane and then fixed using 2.5% gluteraldehyde for 1 h. This was followed by
washing the cells three times with 0.15M phosphate buffer. Following this the cells were
dehydrated in a graded alcohol series (25, 50, 75, 90 and 100% ethanol). After critical-point
drying for 24 h, the filters were then mounted onto SEM specimen stubs and coated with
gold. The specimens were observed under a JEOL JSM-840 and a JEOL JSM-5800LV
scanning electron microscope.
3.4 Results and Discussion
SEM micrographs revealed numerous changes to the morphology and outer surface of all
Bifidobacterium strains exposed to the GC extract for 6 h. The control, L. acidophilus strain,
also experienced some changes.
3.4.1 L. acidophilus La14 150B
It was already revealed in the previous chapter that L. acidophilus was not sensitive to the
antimicrobial effects of garlic. Contrary to those results, SEM analysis revealed some
morphological changes such as bunching or swarming in groups (Fig. 3.1B and C) as well as
©© UUnniivveerrssiittyy ooff PPrreettoorriiaa

91
collection of debris on the outer surface (Fig. 3.1B) after exposure to ampicillin and GC
extract. Changes in bacterial morphology were expected after L. acidophilus cells were
treated with ampicillin as it has been proven that antibiotics alter the surface morphology of
bacterial cells (Klainer and Perkins, 1970; Nikiyan et al., 2010). Ampicillin also inhibits
synthesis of the peptidoglycan layer of gram-positive bacterial cell walls such as Bacillus
cereus and therefore destructs the cell wall (Nikiyan et al., 2010). This may be the cause of
the cellular debris on the outer surface of the ampicillin-treated cells. Untreated cells retained
a uniform rod-shape with a smooth surface (Fig. 3.1A).
Figure 3.1: Scanning electron micrographs of L. acidophilus La14 150B before (A) and after
exposure to ampicillin (B) and GC extract (C).
3.4.2 B. bifidum LMG 11041
In the disk diffusion test (Chapter 2, section 2.4.1), B. bifidum LMG 11041 was most
susceptible to the antibacterial effects of all the garlic extracts. SEM analysis revealed a
pleomorphic cell culture and untreated B. bifidum LMG 11041 cells (Fig. 3.2A) were non-
uniform in appearance. These pleomorphic Bifidobacterium cells have also been observed by
other researchers previously. Gyllenberg (1955) described mycelial cells of bifidobacteria
that appeared to swell and form coccoid granules (Poupard et al., 1973). In addition, Poupard,
and colleagues (1973) documented bifidobacteria that were highly branched, filamentous,
with some irregular and so swollen they resembled a bladder with a cross-like structure on
the surfaces. Cells with cross-walls are morphology common to some bifidobacterial strains
that are in their exponential and early stationary growth phases (Novic et al., 2001).
Exposure of this pleomorphic culture to ampicillin resulted in an increase in short, oval rods
which resembled cocciod cells. Distorted cells as well as cells with swollen ends were also
evident (Fig. 3.2B). Chains of short, oval rods have also been observed when bifidobacteria
A B C
©© UUnniivveerrssiittyy ooff PPrreettoorriiaa

92
have been exposed to ultrafiltered and skim milk (Ventling and Mistry, 1992). Cells exposed
to GP extracts showed a loss in cell wall consistency (Fig. 3.2C). Distortion to the outer
surface or cell wall could possibly be a result of lysis of the cell wall. Loss of cell wall
integrity has also been observed by Lu and colleagues (2011a) when they exposed
Campylobacter jejuni cells to garlic. According to Kim and colleagues (2007), cell wall lysis
may be due to the weakening of the peptidoglycan layer, possibly in this case as a result of
exposure to the GP extract. They observed similar results when they treated Listeria
monocytogenes with garlic shoot juice. The observed change is not only restricted to bacteria
as Ghannoum (1988) observed it in garlic treated Candida albicans (Kim et al., 2007).
Exposure to GP extract also revealed cell debris among the cells (Fig. 3.2C). Debris
collection on the outer surface of C. albicans cells treated with garlic powder extract was also
detected using SEM by Lemar and colleagues (2005) and the debris collection may be a
result of the loss in the volume of cellular cytoplasm.
Figure 3.2: Scanning electron images of B. bifidum LMG 11041. Morphological characteristics before (A)
and after exposure to ampicillin (B), GP (C) and GC (D-E) extract.
B. bifidum cells treated with GC extract (Fig. 3.2D-E) became highly distorted with a club
shape appearance and bulbous ends. The cells also appeared to be swollen and appearance of
cells with cross walls that looked as if they were budding into cocci-shaped cells was also
evident. This has been observed previously in Bifidobacterium spp. where typical rod-shaped
cells became coccoid once there was a nutrient limitation (Young, 2007). In addition, in a
A B
B
D
C A
E
©© UUnniivveerrssiittyy ooff PPrreettoorriiaa
93
study performed by Husain and colleagues (1972), B. bifidum cells became pleomorphic and
did not resemble rods at all due to a change of nutrients used in the medium. As with
exposure to GP extract, debris was also evident in the surrounding medium of GC extract
treated cells. In their death phase, bifidobacteria do show various morphologies which
include rod-shaped and coccoid cells, budding and branched cells as well as club-shaped cells
forms (Novic et al., 2001).
3.4.3. B. longum LMG 13197
Untreated B. longum LMG 13197 cells showed a uniform structure with consistent dispersal
(Fig. 3.3A-B). Garlic-treated cells showed morphological surface damage as well as
clumping of the cells. Exposure to ampicillin resulted in swarming or bunching of the cells.
Possible production of extracellular polysaccharides (EPS) was also observed (Fig. 3.3C).
Secretion of EPS probably serves as a survival mechanism protecting the cells from any form
of stress. EPS production has been observed in B. longum cells which were cultured in skim
milk and peptone-yeast lactose media (Biavati et al., 2000).
Cells treated with GC extract for 6 h showed various morphological alterations and damage
to the outer surface of the cells. Numerous cells appeared longer, varying in sizes between
~5-10 µm compared to 1 µm control cells (Fig. 3.3D-E). Cells become elongated in order to
increase their surface-to-volume ratio in response to environmental changes or stress (Koch,
1996), such as in this case, GC extract. Lysis of the cell wall and cytoplasm as well
perforation of some cells was also evident (Fig. 3.3F-G). These results correspond to those
reported by Kim and colleagues (2007), where they treated Listeria monocytogenes with
garlic shoot juice. They attributed cell wall lysis to be due to the weakening of the
peptidoglycan layer possibly as a result of exposure to the garlic extract. This was also
proposed by Ghannoum (1988) where he attributed the change in structure and integrity of
the outer membrane of Candida albicans to the decrease in lipid content of the membrane
due to the presence of garlic (Kim et al., 2007).
Exposure to GP extract resulted in bunching or swarming of cells in groups (Fig. 3.3H-I). In a
study done Lee et al (2011), it was observed that Staphylococcus mutans cells showed an
increase in aggregation due to treatment with garlic extract. Aggregation is the first step in
biofilm formation (Lee et al., 2011). Exposure to GP extract also revealed possible EPS
production in the culture as was observed with GC extract.
©© UUnniivveerrssiittyy ooff PPrreettoorriiaa

94
Figure 3.3: SEM images showing morphological changes in B. longum LMG 13197 before (A-B) and after
exposure to ampicillin (C), GC (D-G) and GP extract (H-J).
3.4.4 B. longum Bb536
B. longum Bb536 cells not subjected to garlic showed a smooth, regular surface (Fig. 3.4A)
while GC-treated cells showed severe distortion of the cell surface, cell wall lysis and
disintegration, EPS production as well as pore formation (Fig. 3.4B-E). Our results
correspond with findings performed by Lemar and colleagues (2005) and Kim and colleagues
(2007) whom used garlic on different microorganisms. Sinking and distortion of the cell wall
may be due to the loss of cytosolic volume possibly as a result of the autolysis
A B C
D E F
G H I
J
©© UUnniivveerrssiittyy ooff PPrreettoorriiaa

95
Figure 3.4: SEM images showing changes in morphology to B. longum Bb536 before (A) and after
exposure to GC (B-E) and GP extract (F).
activity of allicin (Lemar et al., 2005; Kim et al., 2007). Formation of EPS or possibly a
collection of debris was also observed after exposure to GC extract (Fig. 3.4D). EPS is
normally produced in biofilms by bacteria in a reaction to stress such as physiological
changes and nutrient depletion among others. It may either form a capsule which is made up
of high-molecular weight polysaccharide that attaches to the cell surface or it could produce
slime which is attached to the cell surface or released into the culture (Wai et al., 1998). EPS
formation may also indicate that the culture reached its death phase due to exposure to the
garlic. Novic and colleagues (2001) showed that once bifidobacterial cells were in their death
phase they also began to produce capsular polysaccharides and microfibrils. As was observed
with B. longum LMG 13197, B. longum Bb536 cells also exhibited swarming after treatment
with GP extract (Fig. 3.4F).
3.4.5 B. lactis Bb12
The morphology of B. lactis Bb12 was also pleomorphic as was observed with the B. bifidum
LMG 11041 strain (Fig. 3.5A). The untreated sample consisted of rod-shaped cells, including
very short rods and irregular cocci-shaped cells with cross-walls, in comparison to the
uniform cultures of the other strains (Fig. 3.3A and 3.4A). The phosphoketolase assay was
performed to confirm that this strain was indeed Bifidobacterium. A non-uniform culture has
been observed before by other researchers. Poupard and colleagues (1973) documented
A B C
D E F
©© UUnniivveerrssiittyy ooff PPrreettoorriiaa

96
bifidobacteria that were highly branched, filamentous, with some irregular swollen cells that
they resembled a bladder with a cross-like structure on the surfaces.
Exposure of B. lactis Bb12 to ampicillin (Fig. 3.5B) and GC (Fig. 3.5C-D) resulted in
swollen ends or a dumbbell-shaped appearance. Nikiyan and colleagues (2010) found that
cells become spherical or coccus in appearance on exposure to ampicillin. It has also been
previously suggested that swelling of bacillary forms, which are rod-shaped bacteria, is due
to an interference with cell wall synthesis compounds, which in this case could be as a result
of allicin (Husain et al., 1972). There was an increase in numbers of cocci-shaped cells and
cells with distorted shapes and wall surfaces due to exposure to GC extract. As mentioned
before when bifidobacteria are entering their death phase, possibly as a result of stress, they
have an assortment of morphologies which include coccoid cells (Novic et al., 2001).
Figure 3.5: SEM images showing B. lactis Bb12 before (A) and after treatment with positive control,
ampicillin (B) and GC extract (C-D).
3.4.6. B. lactis Bi-07 300B
Control cells were smooth and uniform in appearance (Fig. 3.6A) with lengths of 1 µm. On
the contrary, cells that were treated with ampicillin increased to lengths of ~5-10 µm. Cell
wall lysis and indentations occurring in the middle of the cell wall were also observed (Fig.
3.6B). Sinking or indentation of the cell wall could also be as a result of the autolysis
properties of allicin as suggested by Kim and colleagues (2007). The same results were
A B C
D
©© UUnniivveerrssiittyy ooff PPrreettoorriiaa
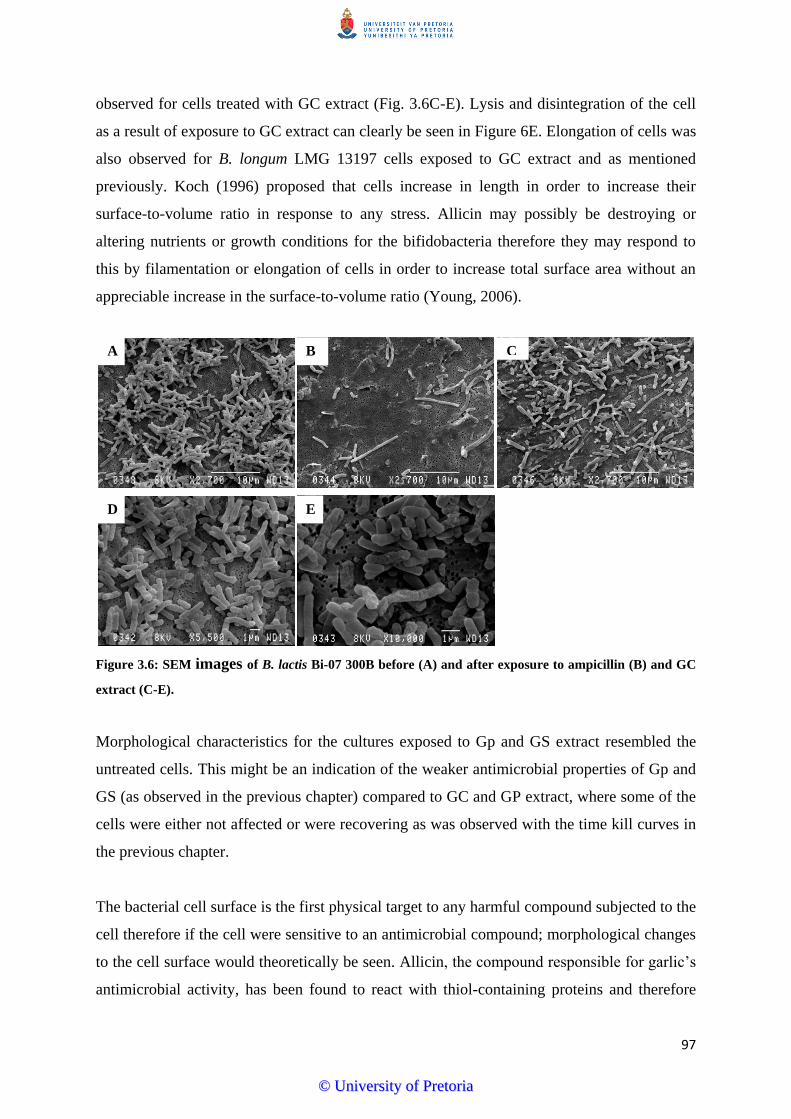
97
observed for cells treated with GC extract (Fig. 3.6C-E). Lysis and disintegration of the cell
as a result of exposure to GC extract can clearly be seen in Figure 6E. Elongation of cells was
also observed for B. longum LMG 13197 cells exposed to GC extract and as mentioned
previously. Koch (1996) proposed that cells increase in length in order to increase their
surface-to-volume ratio in response to any stress. Allicin may possibly be destroying or
altering nutrients or growth conditions for the bifidobacteria therefore they may respond to
this by filamentation or elongation of cells in order to increase total surface area without an
appreciable increase in the surface-to-volume ratio (Young, 2006).
Figure 3.6: SEM images of B. lactis Bi-07 300B before (A) and after exposure to ampicillin (B) and GC
extract (C-E).
Morphological characteristics for the cultures exposed to Gp and GS extract resembled the
untreated cells. This might be an indication of the weaker antimicrobial properties of Gp and
GS (as observed in the previous chapter) compared to GC and GP extract, where some of the
cells were either not affected or were recovering as was observed with the time kill curves in
the previous chapter.
The bacterial cell surface is the first physical target to any harmful compound subjected to the
cell therefore if the cell were sensitive to an antimicrobial compound; morphological changes
to the cell surface would theoretically be seen. Allicin, the compound responsible for garlic‟s
antimicrobial activity, has been found to react with thiol-containing proteins and therefore
A B C
D E
©© UUnniivveerrssiittyy ooff PPrreettoorriiaa

98
this could possibly mean that it is able to permeate both biological and artificial membranes
(Kim et al., 2007). Most antimicrobial agents, such as allicin, are able to modify cell
membranes which may cause leakage and autolysis therefore preventing growth and causing
cell death (Lu et al., 2011b). Therefore this could be a strong indication why the tested
Bifidobacterium strains undergo the above mentioned changes in morphology. Allicin has
been found to have a bacteriocidal effect on many bacteria and is effective against most
Gram-positive and Gram-negative bacteria which include methicillin-resistant
Staphylococcus aureus. Most bacteria cannot develop resistance against allicin as it directly
modifies thiol enzymes or proteins involved in cell division. Allicin is known to inhibit cell
growth and apoptosis and inhibits RNA synthesis more strongly than DNA and protein
synthesis (Fujisawa et al., 2008; Lui et al., 2010).
It has also been found that garlic alters the electrochemical ability of cells and induces
apoptosis (Gruhlke et al., 2010). Apoptosis or programmed cell death result in morphological
changes such as shrinkage of the cell and cytoplasm condensation (Saraste and Pulkki, 2000).
When Escherichia coli undergoes apoptosis, cell elongation and lysis also take place (Lewis,
2000). Some of these changes were also observed for Bifidobacterium strains tested in this
study after exposure to the GC extract. Initiation of apoptosis may therefore have been
occurring in the Bifidobacterium strains exposed to allicin.
Morphological changes have been previously reported for many different bacteria treated
with garlic. Belguith and colleagues (2009) observed changes in morphology of Salmonella
hadar cells when exposed to aqueous garlic extract. Campylobacter jejuni endured
morphological damage as well as cell wall changes once in contact with garlic (Lu et al.,
2011a). Changes in morphology of the structure of an organism exposed to garlic have also
been studied by Awny and colleagues (2005). The formation of various projections on the
outer membrane of the cell envelope of Salmonella hadar has also been observed after
exposure to garlic. Garlic aqueous extract has also altered the morphology and ultrastructure
integrity of Salmonella typhimurium, Escherichia coli, Bacillus subtilis and Bacillus pumilus
(Belguith et al., 2009).
This study provides new insights into the action of garlic on the morphology and cell surface
properties of bifidobacteria. All of the Bifidobacterium strains tested showed considerable
and various alterations in their morphology, cell surface properties as well some changes in
©© UUnniivveerrssiittyy ooff PPrreettoorriiaa

99
the actual behaviour of the cells once exposed to the different garlic preparations. There were
no significant changes observed for the control strain, L. acidophilus. This is probably due to
the fact that the composition of the cell wall of lactobacilli is significantly different from
bifidobacteria (Exterkate et al., 1971; He et al., 2006). Therefore, garlic would naturally
affect these two species differently. Results showed garlic stress-associated morphological
changes for all Bifidobacterium strains. The strains were affected differently; some having a
number of different changes to their morphology while others had one or two of the same or
different modifications. These differences in morphology between the different strains may
be due to variations in the composition of fatty acids in Bifidobacterium spp. A study done by
Veerkamp (1971) showed that there were slight differences in fatty acid composition for
different Bifidobacterium strains.
These variations in morphology included cell elongation, a decrease in rod-shaped cells and
increase in coccoid cells, formation of EPS or biofilm, bulbous and distorted ends of the cells,
cell shrinkage or disintegration. Behavioural aspects such as swarming in groups or bunching
were also observed. The beginning stages of cell apoptosis were also evident. We couldn‟t
deduce which Bifidobacterium strain was most affected, in terms of morphology but B.
bifidum and B. longum strains both underwent morphological changes after exposure to GC
and GP extract whereas B. lactis strains were only morphologically affected by the GC
extract.
3.5 Conclusions
In conclusion, it can be seen from these results that garlic promotes various morphological
changes, external structural changes as well behavioural changes for all the Bifidobacterium
strains tested. All strains experienced changes in morphology after exposure to GC extract,
while B. bifidum LMG 11041, B. longum LMG 13197 and B. longum Bb536 were the only
strains to show any changes after being treated with GP extract. Gp and GS extract did not
affect the morphology of any of the strains which could possibly indicate that, although it
inhibited some strains as seen with the disk diffusion assay, its antimicrobial effects were not
as strong as GC and GP extract to morphologically alter the cells. It could also be because of
these preparations‟ lower allicin concentration as allicin seems to be the main compound
which affects the cells. Changes in the cell surface properties of these Bifidobacterium strains
©© UUnniivveerrssiittyy ooff PPrreettoorriiaa

100
may also alter their ability to colonize the intestinal mucosa and therefore prevent them from
conferring their health benefits.
These changes in morphology on the external structure of treated cells may be surface
reflections of biochemical reactions occurring within the cell wall and further biochemical
studies as well as TEM analysis should be considered. Future studies also include the
determination of the physiological changes occurring within the cells as well as changes in
lipid composition.
3.6 References
Awny, N. M., Tawfik, Z S., Abu Nor S. M & El-Saled K. M 2005, „Effect of aqueous garlic
extract (AGE) and γ-irradiation on some bacterial strains‟, Arab Journal of Nuclear Sciences
and Applications, vol. 38, no. 3, pp. 215-227.
Bakri, I.M & Douglas, C.W.I 2005, „Inhibitory effect of garlic extract on oral bacteria‟,
Archives of Oral Biology, vol. 50, pp. 645-651.
Belguith, H, Kthiri, F, Ammar, A.B., Jaafoura, H, Hamida, J.B & Landoulsi, A 2009,
„Morphological and biochemical changes of Salmonella hadar exposed to aqueous garlic
extract‟, International Journal of Morphology, vol. 27, no. 3, pp. 705-713.
Biavati, B, Vescovo, M, Torriani, S & Bottazzi, V 2000, „Bifidobacteria: history, ecology,
physiology and applications‟, Annals of Microbiology, vol. 50, pp. 117-131.
Boylston, T.D., Vinderola, C.G., Ghoddusi, H.B & Reinheimer, J.A 2004, „Incorporation of
bifidobacteria into cheeses: challenges and rewards‟, International Dairy Journal, vol. 14, pp.
375-387.
Daka, D 2011, „Antibacterial effect of garlic (Allium sativum) on Staphylococcus aureus: An
in vitro study‟, African Journal of Biotechnology, vol. 10, no. 4, pp. 666-669.
Exterkate, F.A., Otten, B.J., Wassenberg, H.W & Veerkamp, J.H 1971, „Comparison of the
phospholipid composition of Bifidobacterium and Lactobacillus strains‟, Journal of
Biotechnology, vol. 106, no. 3, pp. 824-829.
©© UUnniivveerrssiittyy ooff PPrreettoorriiaa

101
Fujisawa, H, Suma, K, Origuchi, K, Seki, T & Ariga, T 2008, „Thermostability of allicin
determined by chemical and biological assays‟, Bioscience, Biotechnology and Biochemistry,
vol. 72, no. 11, pp. 2877-2883.
Giovanna, E.F & Dellaglio, F 2007, „Taxonomy of lactobacilli and bifidobacteria‟, Current
Issues in Intestinal Microbiology, vol. 8, pp. 44-61.
Gruhlke, M.C.H., Portz, D, Stitz, M, Anwar, A, Schneider, T, Jacob, C, Schlaich, L &
Slusarenko, A.J 2010, „Allicin disrupts the cell‟s electrochemical potential and induces
apoptosis in yeast‟ Free Radical Biology and Medicine, vol. 49, pp. 1916-1924.
Gueimonde, M, Noriega, L, Margolles, A, de los Reyes-Gavilan, C.G & Salminen, S 2005,
„Ability of Bifidobacterium strains with acquired resistance to bile to adhere to human
intestinal mucose‟, International Journal of Food Microbiology, vol. 101, pp. 341-346.
Harris, J.C., Cottrell, S.L., Plummer, S & Lloyd, D 2001, „Antimicrobial properties of Allium
sativum (garlic)‟, Applied Microbiology and Biotechnology, vol. 57, pp. 282-286
He, F, Morita, H & Ouwehand, A.C 2006, „Bifidobacteria and lactobacilli exhibited different
mitogenic activity on murine splenocytes‟, International Journal of Probiotics and
Prebiotics, vol. 1, no. 1, pp. 77-82.
Husain, I, Poupard, J.A & Norris, R.F 1972, „Influence of nutrition on the morphology of a
strain of Bifidobacterium bifidum‟, Journal of Bacteriology, vol. 111, no. 3, pp. 841-844.
Kim, J.E., Choi, N.H & Kang, S.C 2007, „Anti-listerial properties of garlic shoot juice at
growth and morphology of Listeria monocytogenes‟, Food Control, vol. 18, pp. 1198-1203.
Klainer, A.S & Perkins, R.L 1970, „Antibiotic-induced alterations in the surface morphology
of bacterial cells: scanning-beam electron microscope study‟, The Journal of Infectious
Diseases, vol. 122, no. 4, pp. 323-328.
Koch, A.L 1996, „What size should a bacterium be? A question of scale?‟, Annual Reviews in
Microbiology, vol. 50, pp. 317-348.
Kumar, K. P. S., Bhowmik, D., Chiranjib, Tiwari, P & Kharel, R 2010, „Allium sativum and
its health benefits: An overview‟, Journal of Chemical and Pharmaceutical Research, vol. 2,
no. 1, pp. 135-146.
©© UUnniivveerrssiittyy ooff PPrreettoorriiaa

102
Lai-King, N.G., Sherburne, R, Taylor, D.E & Stiles, M.E 1985, „Morphological forms and
viability of Campylobacter species studied by electron microscopy‟, Journal of Bacteriology,
vol. 164, no. 1, pp. 338-348.
Lee, H-J., Park, H-S., Kim, K-H., Kwon, T-Y & Hong, S-H 2011, „Effect of garlic on
bacterial biofilm formation on orthodontic wire‟, Angle Orthodontist, vol. 00, no. 3, pp. 1-6.
Lemar, K.M., Passa, O, Aon, M.A., Cortassa, S, Müller, C.T., Plummer, S, O‟Rourke, B &
Lloyd, D 2005, „Allyl alcohol and garlic (Allium sativum) extract produce oxidative stress in
Candida albicans‟, Microbiology, vol. 151, pp. 3257-3265.
Lewis, K 2000, „Programmed death in bacteria‟, Microbiology and Molecular Biology
Reviews, vol. 64, no. 3, pp. 503-514.
Liu, P, Luo, L, Guo, J, Liu, H, Wang, B, Deng, B, Long, C & Cheng, Y 2010, „Farsenol
induces apoptosis and oxidative stress in the fungal pathogen Penicillium expansum‟,
Mycologia, vol. 102, no. 2, pp. 311-318.
Lu, X, Rasco, B.A., Jabal, J.M.F., Aston, D.E., Lin, M & Konkel, M.E 2011a, „Investigating
antibacterial effects of garlic (Allium sativum) concentrate and garlic-derived organosulfur
compounds on Campylobacter jejuni by using fourier transform infrared spectroscopy, raman
spectroscopy, and electron microscopy‟, Applied and Environmental Microbiology, vol. 77,
no. 15, pp. 5257-5269.
Lu, X, Rasco, B.A., Kang, D-H, Jabal, J.M.F., Aston, D.E & Konkel, M.E 2011b, „Infrared
and raman spectroscopic studies of the antimicrobial effects of garlic concentrates and diallyl
constituents on foodborne pathogens‟, Analytical Chemistry, vol. 83, pp. 4137-4146.
Nikiyan, H, Vasilchenko, A & Deryabin, D 2010, „AFM investigations of various disturbing
factors on bacterial cells‟, Microscopy, vol. 3, no. 4, pp. 546-553.
Novic, G.I., Astapovich, N.I & Samartsev, A.A 2001, „Investigation of the physiological and
biochemical characteristics of bifidobacteria at the late stages of their development‟,
Microbiology, vol. 70, no. 4, pp. 429-435.
O‟ Gara, E.A, Hill, D.J & Maslin, D.J 2000, „Activities of Garlic Oil, Garlic Powder, and
their diallyl constituents against Helicobacter pylori‟, Applied and Environmental
Microbiology, vol. 66, no. 5, pp. 2269-2273.
©© UUnniivveerrssiittyy ooff PPrreettoorriiaa
103
Poupard, J. A., Husain, I & Norris, R. F 1973, „Biology of the Bifidobacteria‟,
Bacteriological Reviews, vol. 37, no. 2, pp. 136-165.
Reyed, R.M 2007, „The role of bifidobacteria in health, „Research Journal of Medicine and
Medical Sciences‟, vol. 2, no. 1, pp. 14-24.
Ruddock, P.S, Mingman, L, Foster, B.C, Lawson, L, Arnason, J.T & Dillon, J-A.R 2005,
„Garlic Natural Health Products Exhibit Variable Constituent Levels and Antimicrobial
Activity against Neisseria gonorrhoeae, Staphyloccocus aureus and Enterococcus faecalis’,
Phytotherapy Research, vol. 19, pp. 327-334.
Ruiz, L, Sánchez, B, Ruas-Madiedo, P, de los Reyes-Gavilán, C.G & Margolles, A 2007,
„Cell envelope changes in Bifidobacterium animalis ssp. lactis as a response to bile‟, FEMS
Microbiology Letters, vol. 274, pp. 316-322.
Saraste, A & Pulkki, K 2000, „Morphological and biochemical hallmarks of apoptosis‟,
Cardiovascular Research, vol. 45, pp. 528-537.
Veerkamp, J.H 1971, „Fatty acid composition of Bifidobacterium and Lactobacillus strains‟,
Journal of Bacteriology, vol. 108, no. 2, pp. 861-867.
Ventling, B.L & Mistry, V.V 1992, „Growth characteristics of bifidobacteria in ultrafiltered
milk‟, Journal of Dairy Science, vol. 76, pp. 962-971.
Wai, S. N., Mizunoe, Y., Takade, A., Kawabata, S-I & Yoshida, S-I 1998, „Vibrio cholerae
O1 strain TSI-4 produces the exopolysaccharide materials that determine colony morphology,
stress resistance, and biofilm formation‟, Applied and Environmental Microbiology, vol. 64,
no. 10, pp. 3648-3655.
Young, K. D 2006, „The selective value of bacterial shape‟, Microbiology and Molecular
Biology Reviews, vol. 70, no. 3, pp. 660-703.
Young, K. D 2007, „Bacterial morphology: Why have different shapes?‟, Current Opinion in
Microbiology, vol. 10, no. 6, pp. 596-600.
©© UUnniivveerrssiittyy ooff PPrreettoorriiaa

104
CHAPTER 4
Fourier-transform infrared (FT-IR) spectroscopy
analysis of selected Bifidobacterium spp. treated with
garlic (Allium sativum) clove extract
©© UUnniivveerrssiittyy ooff PPrreettoorriiaa

105
4.1 Abstract
Fourier transform infrared (FT-IR) spectroscopy (4000-850 cm-1
) was used to detect damage
of probiotic B. bifidum LMG 11041, B. longum LMG 13197 and B. lactis Bb 12 after
exposure to garlic clove extract. Probiotic Bifidobacterium species are used in pharmaceutical
products as well as certain foods and they need to be present in high viable numbers. It is
therefore important to test these strains against compounds that may decrease their viability.
FT-IR spectroscopy confirmed damage to the cells as indicated by changes in spectral
features of lipids and fatty acids in cell membranes, proteins and polysaccharides as well as
nucleic acids. Spectral data was analyzed by principle component analysis (PCA). It revealed
segregation of garlic-treated and untreated cells for all bifidobacterial strains tested, with B.
bifidum LMG 11041 showing the most variation. Allicin appeared to be the main compound
responsible for garlic‟s antibifidobacterial activity. Therefore, FT-IR could detect
biochemical differences between intact and injured bifidobacterial strains once exposed to
garlic clove extract, indicating that garlic has a negative effect on these probiotic strains.
Keywords: Fourier-transform infrared (FT-IR) spectroscopy, Bifidobacterium, probiotics,
garlic, allicin, biochemical changes, principle component analysis (PCA)
©© UUnniivveerrssiittyy ooff PPrreettoorriiaa

106
4.2 Introduction
Bifidobacteria are used as probiotics and are added to a variety of different food products and
pharmaceutical preparations due to their numerous health benefits (Perez et al., 1998;
Mattarelli et al., 1999; Gueimonde et al., 2005). In order for probiotic bacteria to exert their
health benefits they must have high enough viable counts as well as be able to attach to and
colonize the intestinal mucosa. Surface properties of these bacteria play an important role in
their probiotic effect and colonization capability. The most important cell wall components
involved in colonization include polysaccharides, teichoic and lipoteichoic acids and proteins
(Mattarelli et al., 1999; Gueimonde et al., 2005). Therefore changes to the surface properties
may prevent probiotics from colonizing the intestinal mucosa and thereby decrease the effect
of probiotics (Gueimonde et al., 2005). It is therefore important to test these probiotics
against compounds that may render them ineffective or decrease their capacity to perform.
Fourier transform infrared (FT-IR) spectroscopy is a fairly new technique used to study the
entire molecular composition of microbial cells. This is possible because all functional
groups of organic molecules are able to absorb IR light (Zoumpopoulou et al., 2010). Not
only is FT-IR spectroscopy a rapid and non-invasive alternative to study changes or injury
that takes place in bacterial cells, sample preparation is also very minimal (Lu et al., 2011b).
The infrared spectra of bacterial cells is able to reveal the biochemical composition of their
cellular constituents which include the cell wall and membrane (composed of phospholipid
bilayer, peptidoglycan and lipopolysaccharides), as well as the cytoplasm (fatty acids, water,
nucleic acids, proteins and polysaccharides) (Al-Qadiri et al., 2008; Zoumpopoulou et al.,
2010).
Due to the fact that FT-IR spectroscopy reveals the biochemical composition of bacterial
cellular components, it has recently been used to investigate the mode of action of
bactericidal compounds as well as to determine changes in membrane fluidity and membrane
phase behavior in response to environmental stresses (Alvarez-Ordóñez et al., 2010). When
bacteria are exposed to or grow under stressful conditions, changes of cell structures and
molecules may take place which causes different FT-IR spectra. Certain bacteria, such as
Salmonella typhimurium and S. enteritidis, develop adaptive responses to changes in their
environment or under stressful conditions, such as changes in salt concentration, pH,
©© UUnniivveerrssiittyy ooff PPrreettoorriiaa
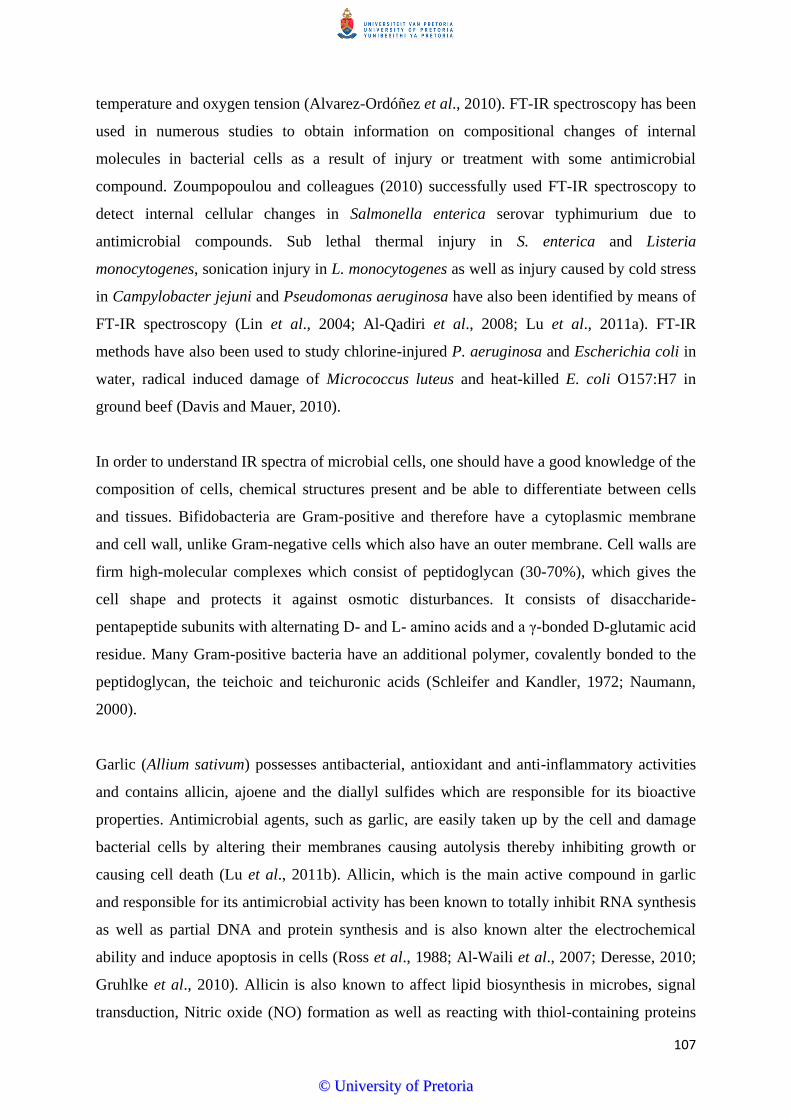
107
temperature and oxygen tension (Alvarez-Ordóñez et al., 2010). FT-IR spectroscopy has been
used in numerous studies to obtain information on compositional changes of internal
molecules in bacterial cells as a result of injury or treatment with some antimicrobial
compound. Zoumpopoulou and colleagues (2010) successfully used FT-IR spectroscopy to
detect internal cellular changes in Salmonella enterica serovar typhimurium due to
antimicrobial compounds. Sub lethal thermal injury in S. enterica and Listeria
monocytogenes, sonication injury in L. monocytogenes as well as injury caused by cold stress
in Campylobacter jejuni and Pseudomonas aeruginosa have also been identified by means of
FT-IR spectroscopy (Lin et al., 2004; Al-Qadiri et al., 2008; Lu et al., 2011a). FT-IR
methods have also been used to study chlorine-injured P. aeruginosa and Escherichia coli in
water, radical induced damage of Micrococcus luteus and heat-killed E. coli O157:H7 in
ground beef (Davis and Mauer, 2010).
In order to understand IR spectra of microbial cells, one should have a good knowledge of the
composition of cells, chemical structures present and be able to differentiate between cells
and tissues. Bifidobacteria are Gram-positive and therefore have a cytoplasmic membrane
and cell wall, unlike Gram-negative cells which also have an outer membrane. Cell walls are
firm high-molecular complexes which consist of peptidoglycan (30-70%), which gives the
cell shape and protects it against osmotic disturbances. It consists of disaccharide-
pentapeptide subunits with alternating D- and L- amino acids and a γ-bonded D-glutamic acid
residue. Many Gram-positive bacteria have an additional polymer, covalently bonded to the
peptidoglycan, the teichoic and teichuronic acids (Schleifer and Kandler, 1972; Naumann,
2000).
Garlic (Allium sativum) possesses antibacterial, antioxidant and anti-inflammatory activities
and contains allicin, ajoene and the diallyl sulfides which are responsible for its bioactive
properties. Antimicrobial agents, such as garlic, are easily taken up by the cell and damage
bacterial cells by altering their membranes causing autolysis thereby inhibiting growth or
causing cell death (Lu et al., 2011b). Allicin, which is the main active compound in garlic
and responsible for its antimicrobial activity has been known to totally inhibit RNA synthesis
as well as partial DNA and protein synthesis and is also known alter the electrochemical
ability and induce apoptosis in cells (Ross et al., 1988; Al-Waili et al., 2007; Deresse, 2010;
Gruhlke et al., 2010). Allicin is also known to affect lipid biosynthesis in microbes, signal
transduction, Nitric oxide (NO) formation as well as reacting with thiol-containing proteins
©© UUnniivveerrssiittyy ooff PPrreettoorriiaa

108
(Focke et al., 1990; Rabinkov et al., 1998; Miron et al., 2000; Lu et al., 2011b; Lu et al.,
2011c). FT-IR spectroscopy has also been able to detect sub lethal damage in foodborne
pathogens, such as Campylobacter jejuni, Escherichia coli O157:H7 and Listeria
monocytogenes, as a result to garlic exposure (Lu et al., 2011b; Lu et al., 2011c).
We have already shown sensitivity of bifidobacteria to antibacterial effects of garlic and also
investigated the effect of garlic on morphology of the treated bifidobacteria using SEM. Here
we aim to analyze, using FT-IR spectroscopy, the biochemical changes that take place in
Bifidobacterium spp. after cells are treated and incubated with garlic clove extract in order to
better understand the mechanism of bacterial injury from exposure to garlic.
4.3 Materials and Methods
4.3.1 Culture preparation
B. bifidum LMG 11041, B. longum LMG 13197 both purchased from the LMG culture
collection, Belgium and revived as per instructions. B. lactis Bb12 was obtained as freeze-
dried sachets from CHR-Hansen (Denmark). These strains were grown in MRS-cys-HCl
broth and incubated at 37°C for 48 h in anaerobic jars containing Anaerocult A gaspacks
(Merck Ltd, Modderfontein, SA). Cultures were diluted to a concentration equivalent to 0.5
McFarland standards. Garlic clove extract (100 µl), prepared as previously mentioned
(Chapter 2, section 2.3.2.1), was then added to 1 ml broth cultures and further incubated for 6
h. Cells were recovered from 1 ml broth cultures by centrifugation at 13.4 rpm for 15 min
(Eppendorf minispin centrifuge), supernatant discarded and the pellet resuspended in ½
Ringers solution. This was repeated twice as to remove media components. The pellet was
then resuspended in 1 ml distilled water (dH20) and ready for FT-IR sample preparation and
measurement. The average cell concentration of the bacterial samples was kept constant at 1
x 109 cfu/ml in order to generate consistent FT-IR signals.
©© UUnniivveerrssiittyy ooff PPrreettoorriiaa

109
4.3.2 Preparation of bacteria for FT-IR
All of the bacterial samples were prepared according to Marcotte and colleagues (2007) with
slight modifications. Five microlitres of each sample was deposited onto a CaF2 slide and air-
dried at room temperature under low vacuum for 15 min. A further 2 µl of bacterial sample
was deposited on top of the already dried sample to form a homogenous dried film of cells
for FT-IR analysis. Samples were dried before analysis as absorption of water greatly affects
FT-IR spectra. Samples were analyzed directly after preparation to prevent any changes
associated with aging of the samples.
4.3.3 FT-IR spectroscopy and spectral measurements
A Bruker Vertex 70V FT-IR spectrometer, equipped with a Hyperion microscope attachment
was used to view the samples and record the bacterial IR spectra. The CaF2 slides, coated
with the bacteria, were placed under the microscope objective and IR spectra were recorded
in transmission mode from 4000 to 850 cm-1
at a spectral resolution of 4 cm-1
. Fifteen spectra
for each sample were acquired at room temperature to get a total of 45 spectra for each
treatment. Experiments were done in triplicate.
4.3.4 Data analysis
OPUS software (version 6, Bruker) was used to perform data analysis. Spectra were
smoothed with a Savitsky-Goly function algorithim with 25 smoothing points, base-line
corrected and normalized. PCA was used on the raw data to separate and group control and
garlic-treated spectra in order to show a clear difference between the two data sets
4.4 Results and Discussion
FT-IR spectroscopy was used in addition to SEM (Chapter 3) as sample preparation is
minimal for this technique. SEM samples had to undergo a lot of preparation which may
possibly have damaged the cell surface giving inaccurate results. To confirm that the
morphological changes were due to the garlic and not due to damage during SEM sample
preparation, it was decided to utilize FT-IR spectroscopy. FT-IR spectroscopy was also able
©© UUnniivveerrssiittyy ooff PPrreettoorriiaa

110
to reveal even the slightest biochemical changes that may not have been picked up by other
techniques employed.
Spectra obtained for all Bifidobacterium strains were comparable to spectra previously
reported for other bacteria (Al-Qadiri et al., 2008; Vodnar et al., 2010; Zoumpopoulou et al.,
2010; Lu et al., 2011a; Lu et al., 2011b; Lu et al., 2011c). Strong absorptions were obtained
in all four spectral regions (4000-850 cm-1
), which distinguish the main cellular components.
Table 4.1 shows the most common spectral band assignments found in microorganisms.
Variation in spectra between the controls and garlic-treated bacterial samples was evident
once the spectra were converted by smoothing, normalization and base-line correction.
Various aspects affect FT-IR spectra and these may include the incubation time of the
samples and temperature as well as the optical properties of the filter membranes used for
sample preparation (Lin et al., 2004). For this study, preparation of samples was consistent to
reduce these aspects and to generate dependable spectral patterns in order to obtain
reproducible data. The average cell concentration of the samples was always 1 x 10⁹
cfu/ml
with the aim to provide strong FT-IR signals.
Mean FT-IR spectral features of B. bifidum LMG 11041 are shown in Figure 4.1, illustrating
all four distinguishable regions. Region I (3000-2800 cm-1
) depicts the fatty acids of the
bacterial cell membrane, with 3 peaks (2960, 2925, and 2860 cm-1
) depicting the alkyl group
of lipids (Davis and Mauer, 2010; Zoumpopoulou et al., 2010; Lu et al., 2011a). Region II
(1700-1500 cm-1
) contains the amide I (1650 cm-1
) and amide II (1550 cm-1
) bands of
proteins and peptides (Davis and Mauer, 2010). According to Davis and Mauer (2010) region
I and II are the most useful regions when identifying bacteria while the other regions are
useful in identifying structural and compositional changes. Region III (1500-1200 cm-3
)
represents fatty acids and ester bending vibrations as well as proteins and phosphate-carrying
compounds. The three major peaks include the peak at 1455 cm-1
which represents the CH2
bending vibrations of lipids and proteins, 1400 cm-1
the C(CH3)2 bending vibrations of
proteins and carbohydrates.
©© UUnniivveerrssiittyy ooff PPrreettoorriiaa

111
Table 4.1: Assignment of bands frequently found in FT-IR spectra of microorganisms (4000-400 cm-1
)
Wavelength
(cm-1
)
Assignment of bands
~3500 O-H stretch of hydroxyl groups (Beekes et al., 2007)
~3200 N-H stretching of Amide A in proteins (Beekes et al., 2007; Davis and
Mauer, 2010)
~2959 C-H asymmetric stretching of CH3 (Beekes et al., 2007)
~2930 C-H asymmetric stretching of >CH2 (Beekes et al., 2007)
~2921 C-H asymmetric stretching of >CH2 in fatty acids (Beekes et al., 2007)
~2898 C-H stretching of →C-H methane (Beekes et al., 2007; Davis and Mauer,
2010)
~1740 >C=O stretching of lipid esters (Davis and Mauer, 2010; Lu et al., 2011)
~1715 >C=O stretching of esters, nucleic acids and carbonic acids (Davis and
Mauer, 2010; Lu et al., 2011)
1695-1675 Amide I components of proteins resulting from antiparallel pleated sheets
and β-turns of proteins (Beekes et al., 2007, Davis and Mauer, 2010)
~1655 Amide I of α-helical structures of proteins (Beekes et al., 2007; Lu et al.,
2011)
~1637 Amide I of β-pleated sheet structures of proteins (Davis and Mauer,
2010; Lu et al., 2011)
~1620 Stretch of base carbonyl and ring breathing mode of nucleic acid (Lu et
al., 2011)
1550-1520 Amide II band of proteins (Davis and Mauer, 2010)
1515 “Tyrosine”band (Beekes et al., 2007; Davis and Mauer, 2010)
~1469 CH2 bending of acyl chains (phospholipids) (Lu et al., 2011)
~1458 C-H deformation of >CH2 of proteins (Lu et al., 2011)
~1415 C-O-H in-plane bending in carbohydrates, DNA/RNA backbone, proteins
(Davis and Mauer, 2010)
~1400 C=O symmetric stretching of COO- group in amino acids and fatty acids
(proteins) (Davis and Mauer, 2010; Lu et al., 2011)
1310-1240 Amide III band components of proteins (Beekes et al., 2007; Davis and
Mauer, 2010)
1250-1220 P=O asymmetric stretching of phosphodiesters in phospholipids (Beekes
et al., 2007)
1200-900 C-O-C, C-O dominated by ring vibrations in various carbohydrates C-O-
P, P-O-P (associated with cell wall glycopeptides and
lipopolysaccharides (Beekes et al., 2007; Vodnar et al., 2010)
~1161 Stretch of C-OH of serine, threonine and tyrosine residues of cellular
proteins (Lu et al., 2011)
~1150 C-O stretch of carbohydrates (Lu et al., 2011)
~1085 P=O symmetric stretching in DNA, RNA and phospholipids (Davis and
Mauer, 2010; Lu et al., 2011)
~1078 C-OH stretch of oligosaccharide (Lu et al., 2011)
~1028 -CH2OH and C-O stretch coupled with C-O bending of carbohydrates
(Lu et al., 2011)
900-600 “Fingerprint region” (Beekes et al., 2007; Davis and Mauer, 2010)
720 C-H rocking of >CH2 in fatty acids, proteins (Beekes et al., 2007; Davis
and Mauer, 2010)
©© UUnniivveerrssiittyy ooff PPrreettoorriiaa

112
Absorption at 1240 cm-1
is due to the asymmetric stretching mode of phosphate groups in
nucleic acids or phospholipids. Lastly, region IV (1200-900 cm-3
) contains absorption bands
typical of polysaccharides or carbohydrates of microbial cell walls with absorption peak
occurring at 1100-950 cm-1
(Davis and Mauer, 2010; Zoumpopoulou et al., 2010). The band
at 1080 cm-1
is related to nucleic acids (Lu et al., 2011a). All spectra shown are means of the
averages of 45 spectra of the 3 independent experiments performed.
Due to the fact that bacterial spectra usually show fairly small compositional differences in
cellular constituents, spectra were modified to amplify the spectral changes. Owing to the fact
that the spectrometer produces high frequency instrumental noise, smoothing of spectra (25
points) was performed to eliminate noise as well as to enhance the information content of the
spectra (Al-Qadiri et al., 2008; Davis and Mauer, 2010). Normalization was done to balance
differences in path length strength as well as base-line correction (Al-Qadiri et al., 2008). The
change in spectra of the different bifidobacteria, due to exposure to garlic, is discussed next.
Three strains with differing susceptibility to garlic were chosen, namely, B. bifidum LMG
11041 (most sensitive), B. lactis Bb12 (most resistant) and B. longum LMG 13197
(moderately sensitive).
FINGERPRINT
REGION
I
Symmetric deformation
of CH2, CH3
Polysaccharide
Asymmetric stretch of PO2, P=O
of
DNA and RNA
Amide II
Amide I
C=O of esters & lipids
Symmetric stretch of CH2 & CH3
Asymmetric stretch of CH2 & CH3
IV II
II
1000 1500 2000 2500 3000 3500
Wavenumber cm-1
A
bso
rban
ce
III O-H stretch of H2O
Figure 4.1: Mean FT-IR spectra of untreated treated B. bifidum LMG 11041 showing the major bands and
regions (I-IV) (4000 to 850 cm-1
) of most bacterial specimens.
©© UUnniivveerrssiittyy ooff PPrreettoorriiaa

113
4.4.1 FT-IR spectral measurements
4.4.1.1 B. bifidum LMG 11041
(A)
(C) (D)
Figure 4.2: Micrographs of untreated (A, B) and garlic-treated (C, D) B. bifidum LMG 11041 samples.
(B)
©© UUnniivveerrssiittyy ooff PPrreettoorriiaa

114
C:\
Univ
ers
ity o
f P
reto
ria\M
easure
ments
\Jem
ma\1
3 J
uly
- B
. bifi
dum
\Altere
d s
pectr
a B
. bif
hig
h c
onc\A
vera
ge g
arlic
all
sam
ple
s.0
B
. bifi
dum
garlic
sam
ple
3 1
3 july
| A
v. o
f 48
C:\
Univ
ers
ity o
f P
reto
ria\M
easure
ments
\Jem
ma\1
3 J
uly
- B
. bifi
dum
\Altere
d s
pectr
a B
. bif
hig
h c
onc\A
vera
ge o
f all
3 c
ontr
ols
B.
bif.
0
B.
bifi
dum
contr
ol sam
ple
3 1
3 july
| A
v. o
f 47
13/0
7/2
012
13/0
7/2
012
3293.883287.70
2934.082927.32
1649.911647.83
1544.291542.671452.851452.601402.671401.71
1238.861234.69
1079.941072.44
913.98
1000
1500
2000
2500
3000
3500
Wave
num
ber
cm
-1
0.000.020.040.060.080.10
Absorbance Units
P
ag
e 1
/1
Fig
ure
4.3
: A
ver
ag
e F
T-I
R s
pec
tra o
f B
. b
ifid
um
LM
G 1
10
41
(U
ntr
eate
d):
bla
ck;
Ga
rlic
-tre
ate
d:
pin
k)
©© UUnniivveerrssiittyy ooff PPrreettoorriiaa

115
Results obtained from SEM (Chapter 3, section 3.4.2) clearly showed a change in
morphology once B. bifidum LMG11041 was exposed to garlic. Micrographs (Fig. 4.2) taken
with the Hyperion microscope attachment showed a clear difference between untreated (A,
B) and treated (C, D) samples. Garlic-treated cells appeared to have condensed and
disintegrated.
Changes in spectral patterns between the control and garlic-treated samples for B. bifidum
LMG 11041 are illustrated in Figure 4.3. There were shifts at all major peaks (3285, 2930,
1655, 1550, 1452, 1400, 1238, 1078, and 913 cm-1
) once this strain was exposed to garlic
clove extract for 6 h indicating changes in biochemical composition in the cells.
Figure 4.4: Close up of the shift in peaks at 3290 cm-1
and 2930 cm-1
for B. bifidum LMG 11041.
Untreated (black), garlic-treated (pink).
There were definite shifts in peaks (Fig. 4.4) which correspond to the N-H stretch of proteins
and the O-H stretch of polysaccharides and water (~3290 cm-1
) as well as at the peak
representing lipids or the asymmetric stretching of >CH2 in fatty acids (~2930 cm-1
).
Therefore there were changes in these areas once the cells were treated with garlic. In
addition there was also an increase in spectral frequency/intensity of the peak at 2934 cm-1
.
C:\University of Pretoria\Measurements\Jemma\13 July- B. bifidum\Altered spectra B. bif high conc\Average garlic all samples.0 B. bifidum garlic sample 3 13 july | Av. of 48
C:\University of Pretoria\Measurements\Jemma\13 July- B. bifidum\Altered spectra B. bif high conc\Average of all 3 controls B. bif.0 B. bifidum control sample 3 13 july | Av. of 47
13/07/2012
13/07/2012
3293.8
83287.7
0
2934.0
82927.3
2
280029003000310032003300340035003600
Wavenumber cm-1
0.0
00.0
20.0
40.0
60.0
80.1
00.1
2
Ab
sorb
ance U
nits
Page 1/1
©© UUnniivveerrssiittyy ooff PPrreettoorriiaa

116
An increase in spectral frequency around this peak denotes an increase in membrane fluidity
as well as conformation disorder of the acyl chains of cell membrane phospholipids (Fang et
al., 2007; Alvarez-Ordonez et al., 2010) therefore possibly changing cell membrane
morphology. It is known that allicin is membrane-permeable and affects lipid and fatty acid
biosynthesis in microbes thereby causing changes in the viability of cells (Focke et al., 1990;
Gruhlke et al., 2010).
Slight shifts were also observed at the peaks in the region of Amide I (~1649 cm-1
) and
Amide II (1544 cm-1
) of proteins (Fig. 4.5). In addition, the intensity of spectral features
associated with these two peaks increased compared to the control. According to Lu et al
(2011a) this may mean that there was an increase in the amount of polysaccharides and
oligosaccharides. This could serve as a survival mechanism for bacteria to down regulate
most functions in order to save energy and protect itself from a stress, against which in this
case could possibly be the garlic.
Figure 4.5: FT-IR spectra of B. bifidum LMG 11041 denoting shifts in the Amide I and Amide II peaks as
well as an increase in band intensities (Black: untreated; Pink: garlic-treated).
C:\University of Pretoria\Measurements\Jemma\Altered spectra of averages of all strains\Average garlic all samples B. bif.0 B. bifidum garlic sample 3 13 july | Av. of 48
C:\University of Pretoria\Measurements\Jemma\Altered spectra of averages of all strains\Average of all 3 controls B. bif.0 B. bifidum control sample 3 13 july | Av. of 47
13/07/2012
13/07/2012
1649.9
11647.8
3
1544.2
91542.6
7
150015501600165017001750
Wavenumber cm-1
0.0
20.0
40.0
60.0
80.1
0
Absorb
ance U
nits
Page 1/1
©© UUnniivveerrssiittyy ooff PPrreettoorriiaa

117
Figure 4.6: Spectra of B. bifidum LMG 11041 showing a shift at peaks 1234 and 1072 cm-1
as well as drop
in intensity between 1280 and 1000 cm-1
.
The biggest shift in peaks occurred at 1238 cm-1
and 1079 cm-1
which represent
phosphodiesters, and nucleic acids and carbohydrate regions in the cell wall respectively.
There was also a decrease in spectral intensities in these two areas (Fig. 4.6). This was also
found in a previous study by Lu and colleagues (2011a) and they attributed this decrease to a
reduction in viable counts, prevention of cell growth or cell death.
The difference between treatments at these two peaks may possibly indicate nucleic acid
denaturation associated with the P=O antisymmetric stretching mode of the phosphodiester
backbone of nucleic acids (1238 cm-1
) as well as effects on nucleic acid ribose and
deoxyribose structure observed in the difference between treatments at 1080 cm-1
(Al-Qadiri
et al., 2008). It is expected to find changes in the nucleic acid region as previous studies have
proved that one of allicin‟s main mechanisms of action is to completely inhibit RNA
synthesis and partially inhibit protein and DNA synthesis (Ross et al., 1988).
Lastly, there was a clear peak at 913 cm-1
for the control sample (indicated by arrow in box in
Fig. 4.3), whereas the peak was lost once B. bifidum LMG 11041 was exposed to garlic
clove. This can be seen clearly in Figure 4.3 and 4.6. This peak represents phosphodiesters
C:\University of Pretoria\Measurements\Jemma\13 July- B. bifidum\Altered spectra B. bif high conc\Average garlic all samples.0 B. bifidum garlic sample 3 13 july | Av. of 48
C:\University of Pretoria\Measurements\Jemma\13 July- B. bifidum\Altered spectra B. bif high conc\Average of all 3 controls B. bif.0 B. bifidum control sample 3 13 july | Av. of 47
13/07/2012
13/07/2012
1649.9
11647.8
3
1544.2
91542.6
7
1452.8
51452.6
0
1402.6
71401.7
1
1238.8
61234.6
9
1079.9
41072.4
4
913.9
8
10001200140016001800
Wavenumber cm-1
0.0
00.0
20.0
40.0
60.0
80.1
0
Absorb
ance U
nits
Page 1/1
©© UUnniivveerrssiittyy ooff PPrreettoorriiaa

118
(Lu et al., 2011b). This may therefore indicate damage to the phospholipids in the cell wall
and therefore a change in the structure of the bacterial envelope polysaccharides. The same
differences were observed in Escherichia coli and Listeria monocytogenes once they were
exposed to garlic in a study performed by Lu and colleagues (2011b) as well as in
Pseudomonnas auruginosa once exposed to chlorine (Al-Qadiri et al., 2008). There were
minor peak shifts at 1452 and 1402 cm-1
which correspond to the asymmetrical CH3 and
symmetrical CH3 bending vibrations.
4.4.1.2 B. longum LMG 13197
Micrographs taken of B. longum LMG 13197 also showed clear variations between non-
treated and garlic-treated samples (Fig. 4.7). Differences in spectral features between the
control and the garlic-treated bacterial samples for this strain can be seen in Figure 4.8.
There were a number of shifts in all the main peaks; 3291, 2928, 1649, 1544, 1453, 1403,
1236 and 1073 cm-1
. As with B. bifidum LMG 11041, a big shift occurred at peak 3291 cm-1
(Fig. 4.9) which represents the N-H stretch of proteins and O-H stretch of polysaccharides
and water. There was also a slight shift at peak 2928 cm-1
associated with lipids in the cell
membrane (C-H asymmetric stretch of CH2 in fatty acids). Another prominent change that
could be seen in the region 3600-2800 cm-1
was the drop in intensity as well as a significant
decrease in the area of bands 3291 cm-1
and 2928 cm-1
compared to the control. The drop in
the area associated with lipids might be related with a drop in viability or cessation of growth.
The fall in intensity indicates cell death according to Lu and colleagues (2011a), who also
observed similar results for Escherichia coli O157:H7 once this organism was placed under
cold stress and in low nutrient media. Another possible reason for the drop in intensity of the
CH2 vibration may be as a result of a decrease in membrane fluidity, which results in an
increase in saturated fatty acids and a decrease in unsaturated fatty acids (Fang et al., 2007).
This change in intensity of the CH2 stretching may suggest changes in the conformational
order of the membrane acyl chains (Fang et al., 2007). Many studies on bacteria have shown
that variations in the cell membrane lipid composition results from environmental stresses
(Scherber et al., 2009) and that allicin affects lipid and fatty acid formation in microbes
which causes large changes in viability of cells (Focke et al., 1990).
©© UUnniivveerrssiittyy ooff PPrreettoorriiaa

119
(A) (B)
(C) (D)
Figure 4.7: Micrographs of untreated (A, B) and garlic-treated (C, D) B. longum LMG 13197 samples.
Definite shifts in peaks were observed at bands assigned to Amide I (1655 cm-1
) and Amide
II (1545 cm-1
) as well at the peak representing the C=O symmetric of COO- of proteins (1399
cm-1
), when compared to control samples. Therefore biochemical changes occurred within
these molecules after exposure to garlic. According to Lu and colleagues (2011c) it is the
phenolic and organosulfur compounds in garlic that contribute to protein damage as observed
at 1399 cm-1
. As with the B. bifidum strain, when comparing the control and treated strain,
there was an increase in intensities which once again may mean that there was an increase in
the amount of polysaccharides produced. This is probably the way the bacteria acts in
response to stress and uses the increase in polysaccharides as a survival mechanism in order
to save energy and protect itself (Lu et al., 2011a). EPS and biofilm formation was also
observed using SEM.
©© UUnniivveerrssiittyy ooff PPrreettoorriiaa

120
C:\
Univ
ers
ity o
f P
reto
ria\M
easure
ments
\Jem
ma\6
july
2012 B
. lo
ngum
\Altere
d s
pectr
a B
. lo
ngum
\Ave
rage a
ll 3 g
arlic
tre
ate
d s
am
ple
s.0
B
. lo
ngum
sam
ple
3 g
arlic
| A
v. o
f 48
C:\
Univ
ers
ity o
f P
reto
ria\M
easure
ments
\Jem
ma\6
july
2012 B
. lo
ngum
\Altere
d s
pectr
a B
. lo
ngum
\Ave
rage o
f all
3 c
ontr
ol sam
ple
s.0
B
. lo
ngum
sam
ple
3 c
ontr
ol | A
v. o
f 45
06/0
7/2
012
06/0
7/2
012
3760.81
3662.61
3291.073283.80
2928.672926.47
1649.851644.68
1544.061538.731453.301452.771403.091399.50
1237.021236.88
1074.121073.38
914.34871.49
1000
1500
2000
2500
3000
3500
Wave
num
ber
cm
-1
0.000.020.040.060.080.10
Absorbance Units
P
ag
e 1
/1
Fig
ure
4.8
: F
T-I
R s
pec
tra o
f u
ntr
eate
d a
nd
ga
rlic
-tre
ate
d B
. lo
ng
um
LM
G 1
31
97
sa
mp
les
(No
n-t
rea
ted
: b
lack
; g
arl
ic-t
rea
ted
; b
lue)
.
©© UUnniivveerrssiittyy ooff PPrreettoorriiaa

121
Figure 4.9: FT-IR spectra of B. longum LMG 13197 untreated (black) and garlic-treated (blue) samples
showing peak shifts, drop in intensity as well as decrease in area in the lipid region.
Figure 4.10: Shift in peaks at Amide I (1650 cm-1
), Amide II (1545 cm-1
) and 1395 cm-1
.
C:\University of Pretoria\Measurements\Jemma\6 july 2012 B. longum\Altered spectra B. longum\Average all 3 garlic treated samples.0 B. longum sample 3 garlic | Av. of 48
C:\University of Pretoria\Measurements\Jemma\6 july 2012 B. longum\Altered spectra B. longum\Average of all 3 control samples.0 B. longum sample 3 control | Av. of 45
06/07/2012
06/07/2012
3760.8
1
3662.6
1
3291.0
73283.8
0
2928.6
72926.4
7
280030003200340036003800
Wavenumber cm-1
0.0
00.0
10.0
20.0
30.0
40.0
50.0
60.0
7
Ab
sorb
ance U
nits
Page 1/1
C:\University of Pretoria\Measurements\Jemma\6 july 2012 B. longum\Altered spectra B. longum\Average all 3 garlic treated samples.0 B. longum sample 3 garlic | Av. of 48
C:\University of Pretoria\Measurements\Jemma\6 july 2012 B. longum\Altered spectra B. longum\Average of all 3 control samples.0 B. longum sample 3 control | Av. of 45
06/07/2012
06/07/2012
1649.8
51644.6
8
1544.0
61538.7
3
1453.3
01452.7
7
1403.0
91399.5
0
1237.0
21236.8
8
1074.1
21073.3
8
914.3
4
871.4
9
10001200140016001800
Wavenumber cm-1
0.0
00.0
20.0
40.0
60.0
80.1
0
Ab
sorb
ance U
nits
Page 1/1
©© UUnniivveerrssiittyy ooff PPrreettoorriiaa

122
When compared with the spectra of B. bifidum LMG 11041, B. longum LMG 13197 showed
a decrease in intensity in the region of 1490 cm-1
– 1260 cm-1
whereas the B. bifidum strain
showed a slight increase. Drops in spectral intensities usually indicate cell death, a decrease
in viable cells or cessation of growth, vice versa (Lu et al., 2011a). Compared to the B.
bifidum strain, there were slight shift in peaks at 1236 cm-1
and 1074 cm-1
representing
nucleic acid denaturation of the phosphodiester backbone as well as damage to DNA and
RNA, although not as significant as the B. bifidum strain. In addition there was a significant
drop in intensity and band area at peak 1074 cm-1
(nucleic acids (DNA and RNA)), which
according to Lu and colleagues (2011a) indicates microbial death.
Disappearance of peaks 914 cm-1
and 871 cm-1
may possibly mean there were changes or
damages to glycopeptides and lipopolysaccharides associated with the cell wall, therefore
changing the structure of the bacterial envelope polysaccharides (914 cm-1
) as well as
possible changes in aromatic ring vibrations of various nucleotides (871cm-1
) (Naumann,
2000; Vodnar et al., 2010). Disappearance of peak 914 cm-1
was also seen with the B. bifidum
strain.
4.4.1.3 B. lactis Bb12
Micrographs taken of B. lactis Bb12 showed slight differences between garlic-treated and
untreated samples.
FT-IR spectra of untreated compared to garlic-treated B. lactis Bb12 samples showed slight
differences in spectral features (Fig. 4.12). There were slight shifts in spectral peaks at 2930
cm-1
(lipid), 1648 cm-1
(Amide I), 1542 cm-1
(Amide II), 1453 cm-1
(C-H deformation of CH2
proteins) and 1235 cm-1
(P=O asymmetric stretch of PO2 phosphodiesters). A notable peak
shift occurred at 3292 cm-1
(N-H stretch of proteins and O-H stretch of polysaccharides and
water) as well as 1395 cm-1
(C=O symmetric stretch of COO- of proteins).
As with B. bifidum LMG 11041, there was a slight increase in spectral intensity round the
lipid regions (2929 cm-1
) for this strain when comparing treated and untreated spectra. Once
again this could mean an increase in membrane fluidity as well as conformation disorder of
the acyl chains of membrane phospholipids (Fang et al., 2007; Alvarez-Ordonez et al., 2010).
©© UUnniivveerrssiittyy ooff PPrreettoorriiaa

123
(A) (B)
(C) (D)
Figure 4.11: Micrographs of untreated (A, B) and garlic-treated (C, D) B. lactis Bb12 samples.
There were no significant changes in spectral intensities at peaks depicting Amide I and II.
There was however a slight decrease in spectral intensity at peak 1235 cm-1
(phosphodiesters)
compared to control samples which may possibly indicate a decrease in viable cell counts or
cell death (Lu et al., 2011a) as was seen with the previous strains. According to Al- Qadiri
and colleagues (2008) a change at this peak indicates nucleic acid denaturation associated
with the P=O anti-symmetric stretching mode of the phosphodiester backbone of nucleic
acids.
In addition, there was also quite a big loss in spectral intensity at peak 1073 cm-1
which
corresponds to nucleic acids. Therefore garlic clove extract could possibly be altering or
affecting RNA and DNA which may indivertibly lead to microbial death or cessation of
growth as was seen with previous strains.
©© UUnniivveerrssiittyy ooff PPrreettoorriiaa

124
C:\
Univ
ers
ity o
f P
reto
ria\M
easure
ments
\Jem
ma\7
July
- B
. la
ctis\a
ltere
d s
pectr
a B
. la
ctis\A
vera
ge a
ll 3 s
am
ple
s c
ontr
ol.0
B.
lactis B
b12 c
ontr
ol sam
ple
3 | A
v. o
f 49
C:\
Univ
ers
ity o
f P
reto
ria\M
easure
ments
\Jem
ma\7
July
- B
. la
ctis\a
ltere
d s
pectr
a B
. la
ctis\A
vera
ge a
ll garlic
tre
ate
d s
am
ple
s.0
B
. la
ctis B
b12 g
arlic
sam
ple
3 | A
v. o
f 45
07/0
7/2
012
07/0
7/2
012
3853.103852.87
3746.913745.71
3292.003288.63
2931.232929.86
1648.791646.34
1542.481539.891453.961453.151396.671391.43
1238.241238.12
1073.171071.01
1000
1500
2000
2500
3000
3500
Wave
num
ber
cm
-1
0.000.020.040.060.080.10
Absorbance Units
P
ag
e 1
/1
Fig
ure
4.
12:
FT
-IR
sp
ectr
a o
f ga
rlic
-tre
ate
d (
red
) a
nd
un
trea
ted
(B
lack
) sa
mp
les
of
B.
lact
is B
b1
2
©© UUnniivveerrssiittyy ooff PPrreettoorriiaa

125
Significant spectral features related to bacterial cell injury included changes in nucleic acid
and lipid features of the cell membrane for the three strains tested. Differences were also
observed between control and garlic-treated samples in spectral regions associated with
proteins for B. bifidum LMG 11041 and B. longum LMG 13197 only. B. longum LMG 13197
also showed changes or damage to the cell wall structure. According to Lu and colleagues
(2011b), proteins and phospholipids in bacterial cell membranes are the main targets affected
by plant antioxidants. Once these antimicrobials alter the cell membrane cell leakage and
lysis occur resulting in cessation of growth or microbial death and this was seen in the
spectral features for B. bifidum LMG 11041 and B. longum LMG 13197. It is known that
allicin acts by immediately and totally inhibiting RNA synthesis as well as partial DNA and
protein synthesis (Al-Waili et al., 2007; Deresse, 2010). Allicin is also known to affect lipid
biosynthesis in microbes which causes changes in cell viability (Focke et al., 1990). Nucleic
acid changes were seen in the FT-IR spectra in all three strains treated with garlic.
4.4.2 PCA data
PCA has been extensively used in interpreting infrared spectra in microbiology, medicine
agricultural and food sciences. It reduces a multidimensional data set to its most dominant
features, removes random variation, and maintains the relevant variation between the data
points (Lin et al., 2004; Davis and Mauer, 2010). PCA shows whether there are natural
clusters in the data and describes similarities or differences from multivariate data sets (Lin et
al., 2004). In this study PCA confirmed a clear segregation between control and garlic-treated
samples. Clear segregations with distinct sample clusters were observed between control and
garlic-treated samples. PCA was performed for all four regions as well as for the separate
regions including region I the fatty acids (lipids) of the cell membrane (3000-2800 cm-1
),
region II representing structural proteins (1800-1500 cm-1
), region III associated with
proteins, fatty acids and phosphate carrying compounds (1500-1200 cm-1
) and region IV
typical for polysaccharides in the cell wall (1200-900 cm-1
). Groupings of the spectra
represent differences or similarities among the regions and can be compared with variations
in the molecular composition of the bifidobacterial strains.
Figure 4.13 shows the PCA of the first derivative and multiplicative scatter correction (MSC)
of B. bifidum LMG 11041 for all the different regions. When comparing all the regions
together between the control and garlic-treated samples segregation between the two sample
©© UUnniivveerrssiittyy ooff PPrreettoorriiaa

126
(A) (B)
(D)
(E)
Figure 4.13: PCA of the first derivative and multiplicative scatter correction (MSC) of B. bifidum LMG
11041 for all spectral regions (4000-850 cm-1
) (A), region I (3000-2400 cm-1
) (B), region II (1800-1500 cm-1
)
(C), region III (1500-1200 cm-1
) (D) and region IV (1200-900 cm-1
(E). Blue=untreated samples;
pink=garlic treated samples.
(C)
©© UUnniivveerrssiittyy ooff PPrreettoorriiaa

127
clusters for most regions can be observed (Fig. 4.13A). On closer inspection when comparing
the separate regions, one can observe that there was a distinct separation between clusters in
region I (lipids/fatty acids) and III (mixed region) (Fig. 4.13B and D). This means that there
were more significant changes between control and treated samples in these two regions than
all the other regions for B. bifidum LMG 11041. In spectral region III, control and garlic-
treated samples were distinguished even better than in region I (Fig. 4.13D). There was no
distinct clustering achieved related to spectral region II and IV. Therefore, these findings
show that the most significant changes induced by the garlic clove extract occurred in the
region representing cell structure proteins and phosphodiesters associated with phospholipid
bilayers, while other cellular constituents were less affected. This could be a reason why B.
bifidum LMG 11041 showed unusual morphological changes as indicated by SEM results
(Chapter 3, section 3.4.2).
When comparing PCA of B. longum LMG 13197 to B. bifidum LMG 11041 it can be
observed that there is a significant separation between the control and garlic-treated samples
over the all regions (Fig. 4.14). There were major spectral differences in region I, II and III
(Fig. 4.14B-D). Nucleic acids and polysaccharides of the cell wall (Region IV) were less
affected than the other cellular components as was seen with less distinct clustering in Figure
4.14 (E). Therefore garlic clove extract caused more biochemical changes in this strain
compared to B. bifidum LMG 13197.
Clear separations with distinct sample clusters were seen among non-treated and garlic-
treated B. lactis Bb12 in the entire spectral region (Fig. 4.15). There were fewer differences
between control and treated samples in region III and IV as these clusters were closer
together (Fig. 4.15D-E). Most differences were seen within the lipid and protein regions of
the cell for B. lactis Bb12 as can be seen with the more isolated clusters (Fig. 4.15B-C).
Damage was confined to the cell wall for this strain whereas for the more sensitive strains (B.
bifidum LMG 11041 and B. longum LMG 13197), damage extended to the nucleic acid
region.
©© UUnniivveerrssiittyy ooff PPrreettoorriiaa

128
(A) (B)
(C) (D)
(E)
Figure 4.14: PCA of the first derivative and multiplicative scatter correction (MSC) of B. longum LMG
13197 for all spectral regions (4000-850 cm-1
) (A), region I (3000-2400 cm-1
) (B), region II (1800-1500 cm-1
)
(C), region III (1500-1200 cm-1
) (D) and region IV (1200-900 cm-1
(E). Blue=untreated samples;
pink=garlic treated samples.
©© UUnniivveerrssiittyy ooff PPrreettoorriiaa

129
(A) (B)
(C) (D)
(E)
Figure 4.15: PCA of the first derivative and multiplicative scatter correction (MSC) of B. lactis Bb12 for
all spectral regions (4000-850 cm-1
) (A), region I (3000-2400 cm-1
) (B), region II (1800-1500 cm-1
) (C),
region III (1500-1200 cm-1
) (D) and region IV (1200-900 cm-1
(E). Blue=untreated samples; pink=garlic
treated samples.
©© UUnniivveerrssiittyy ooff PPrreettoorriiaa

130
Taken as a whole, PCA revealed distinctive features of the FT-IR spectra among
Bifidobacterium cells. It showed that all bifidobacterial strains tested showed definite
differences in most if not all of their regions and for some strains fewer differences once
treated with garlic clove extract. When the strains were exposed to garlic clove extract,
significant changes were seen in lipids or fatty acids in the cell membrane as well as cell
structure proteins and phosphodiesters associated with phospholipid bilayer in all three
strains. For B. longum LMG 13197 and B. lactis Bb12 noteworthy differences were observed
in the amide groups of proteins as well as in the nucleic acids and polysaccharides of the cell
wall.
It was observed that B. bifidum LMG 11041 showed more variation between control and
treated samples therefore representing less distinct changes in spectral features. A reason for
this could be the difficulty of obtaining a condensed sample during sample preparation as can
be seen in the micrographs in Figure 4.2. Therefore this may have influenced results making
it difficult to obtain reproducibility of control and treated samples of this strain therefore
showing more variation in the clusters in PCA.
4.5 Conclusions
This study showed that FT-IR could differentiate between non-treated and garlic-treated
Bifidobacterium species, confirming that garlic clove extract does indeed have a damaging
effect on the tested Bifidobacterium spp.
Upon studying the spectral data, the bactericidal effect of garlic on Bifidobacterium cells
causes apparent variations in the spectral properties associated with secondary structure
proteins, fatty acids and phospholipids in the cell membrane as well as nucleic acids (damage
to the DNA and RNA). B. bifidum LMG 11041 and B. longum LMG 13197 also showed
variations in spectral features associated with carbohydrates or polysaccharides of the cell
wall, whereas B. lactis Bb12 showed no apparent difference in spectral features for this
region. B. lactis Bb12 appeared to have been least affected by the garlic clove extract than the
other two strains as was seen with the smaller amount of biochemical changes occurring
within the cell. This study therefore supports previous studies that protein and membrane
damage are the main factors in inactivation of gram-positive bacteria by garlic.
©© UUnniivveerrssiittyy ooff PPrreettoorriiaa

131
PCA clearly showed detection and separation of both garlic-treated (injured) and control cells
and showed a somewhat slightly different but more reliable picture of the variations in the
spectra. It was much more representative and removes any random variations encountered. It
showed changes in all spectral features for B. lactis Bb12 including changes in region III
which was not observed by just interpreting the spectra.
.
Results from this study prove that garlic clove extract does indeed induce biochemical
changes within Bifidobacterium cells and therefore also confirms that garlic does damage and
inhibit these cells. The main targets for garlic clove extract for all the strains appear to be the
nucleic acids (DNA and RNA) and the fatty acids (lipids) in the cell membrane. Changes to
the surface properties may therefore prevent these probiotic Bifidobacterium strains from
colonizing the intestinal mucosa and thereby decrease their positive effect as well as their
viability.
Further studies could be done using Raman spectroscopy to study spectral changes in the
sulfur region (500-700 cm-1
) which indicates protein structural changes, as previous studies
(Lu et al., 2011b) have suggested that garlic reacts with thiol-containing enzymes, causing
cell injury or death.
4.6 References
Al-Qadiri, H.M., Al-Alami, N.I., Al-Holy, M.A & Rasco, B.A 2008, „Using Fourier
Tranform Infrared (FT-IR) absorbance spectroscopy and multivariate analysis to study the
effect of chlorine–induced bacterial injury in water‟, Journal of Agricultural and Food
Chemistry, vol. 56, no. 19, pp. 8992-8997.
Al-Qadiri, H.M., Lin, M, Al-Holy, M.A., Cavinato, A.G & Rasco, B.A 2008, „Detection of
sublethal thermal injury in Salmonella enteric serotype Typhimurium and Listeria
monocytogenes using fourier transform infrared (FT-IT) spectroscopy (4000 to 600cm-1
)‟,
Journal of Food Science, vol. 73, no. 2, pp. 54-61.
Alverez-Ordóñez, A, Halisch, J & Prieto, M 2010, „Changes in Fourier transform infrared
spectra of Salmonella enteric serovars Typhimurium and Enteritidis after adaption to stressful
growth conditions‟, International Journal of Food Microbiology, vol. 142, pp. 97-105.
©© UUnniivveerrssiittyy ooff PPrreettoorriiaa

132
Al-Waili, N.S., Saloom, K.Y., Akmal, M, Al-Waili, T.N., Al-Waili, A.N., Al-Waili, H, Ali. A
& Al-Sahlani, K 2007, „Effects of heating, storage, and ultraviolet exposure on antimicrobial
activity of garlic juice‟, Journal of Medicinal Food, vol. 10, no. 1, pp. 208-212.
Beekes, M, Lasch, P & Naumann, D 2007, „Analytical applications of Fourier transform-
infrared (FT-IR) spectroscopy in microbiology and prion research‟, Veterinary Microbiology,
vol. 123, pp. 305-319.
Davis, R & Mauer, L.J 2010, „Fourier transform infrared (FT-IR) spectroscopy: A rapid tool
for detection and analysis of foodborne pathogenic bacteria‟, Current Research, Technology
and Education Topics in Applied Microbiology and Microbial Biotechnology, pp. 1582-1593.
Deresse, D, 2010 „Antibacterial effect of garlic (Allium sativum) on Staphylococcus aureus:
An in vitro study‟, Asian Journal of Medical Sciences, vol. 22, no. 2, pp. 62-65.
Fang, J, Lyon, D.Y., Wiesner, M.R., Dong, J & Alvarez, P.J.J 2007, „Effect of a fullerene
water suspension on bacterial phospholipids and membrane phase behavior‟, Environmental
Science and Technology, vol. 41, no. 7, pp. 2636-2642.
Focke, M, Feld, A & Lichtenthaler, H.K 1990, „Allicin, a naturally occurring antibiotic from
garlic, specifically inhibits acetyl-CoA synthetase‟, Federation of European Biochemical
Societies, vol. 261, no. 1, pp. 106-108.
Gruhlke, M.C.H., Portz, D, Stitz, M, Anwar, A, Schneider, T, Jacob, C, Schlaich, L &
Slusarenko, A.J 2010, „Allicin disrupts the cell‟s electrochemical potential and induces
apoptosis in yeast‟ Free Radical Biology and Medicine, vol. 49, pp. 1916-1924.
Gueimonde, M, Noriega, L, Margolles, A, de los Reyes-Gavilan, C.G & Salminen, S 2005,
„Ability of Bifidobacterium strains with acquired resistance to bile to adhere to human
intestinal mucosa‟ International Journal of Food Microbiology, vol. 101, pp. 341-346.
Lin, M, Al-Holy, M, Al-Qadiri, H, Kang, D-H, Cavinato, A.G., Huang, Y & Rasco, B.A
2004, „Discrimination of intact and injured Listeria monocytogenes by Fourier Transform
Infrared spectroscopy and principal component analysis‟, Journal of Agricultural and Food
Chemistry, vol. 52, pp. 5769-5772.
Lu, X, Liu, Q, Wu, D, Al-Qadiri, H.M., Al-Alami, N.I., Kang, D-H, Shin, J-H, Tang, J, Jabal,
J.M.F., Aston, E.D & Rasco, B.A (2011a), „Using of infrared spectroscopy to study the
©© UUnniivveerrssiittyy ooff PPrreettoorriiaa

133
survival and injury of Escherichia coli O157:H7, Campylobacter jejuni and Pseudomonas
aeruginosa under cold stress in low nutrient media‟, Food Microbiology, vol. 28, pp. 537-546
Lu, X, Rasco, B.A., Kang, D-H, Jabal, J.M.F., Aston, D.E & Konkel, M.E (2011b), „Infrared
and raman spectroscopic studies of the antimicrobial effects of garlic concentrates and diallyl
constituents on foodborne pathogens‟, Analytical Chemistry, vol. 83, pp. 4137-4146.
Lu, X, Rasco, B.A., Jabal, J.M.F., Aston, D.E., Lin, M & Konkel, M.E (2011c),
„Investigating antibacterial effects of garlic (Allium sativum) concentrate and garlic-derived
organosulfur compounds on Campylobacter jejuni by using Fourier transform infrared
spectroscopy, Raman spectroscopy, and Electron microscopy‟, Applied and Environmental
Microbiology, vol. 77, no. 15, pp. 5257-5269.
Marcotte, L, Kegelaer, G, Sandt, C, Barbeau, J & Lafleur, M 2007, „An alternative infrared
spectroscopy assay for the quantification of polysaccharides in bacterial samples‟, Analytical
Biochemistry, vol. 361, pp. 7-14.
Mattarelli, P, Biavati, B, Pesenti, M & Crociani, F 1999, „Effect of growth temperature on the
biosynthesis of cell wall proteins from Bifidobacterium globosum‟, Research in
Microbiology. vol. 150, pp. 117-127.
Miron, T, Rabinkov, A, Mirelman, D, Wilchek, M & Weiner, L 2000, „The mode of action of
allicin: its ready permeable through phospholipid membranes may contribute to its biological
activity‟, Biochimica et Biophysica Acta, vol. 1463, pp. 20-30.
Naumann, D 2000, „Infrared Spectroscopy in Microbiology‟ John Wiley & Sons Ltd,
Chichester, pp. 102-131.
Perez, P.F., Minnaard, Y, Disalvo, E.A & De Antoni, G.L 1998, „Surface properties of
bifidobacterial strains of human origin, „Applied and Environmental Microbiology, vol. 64,
no. 1, pp. 21-26.
Rabinkov, A, Miron, T, Konstantinovski, L, Wilchek, M, Mirelman, D & Weiner, L 1998,
„The mode of action of allicin: trapping of radicals and interaction with thiol containing
proteins‟, Biochimica et Biophysica Acta, vol. 1379, pp. 233-244.
©© UUnniivveerrssiittyy ooff PPrreettoorriiaa

134
Ross, F.S., Chang, S.C., Kotik, A.N., Nadler, M, Neuwirth, Z, Sundstrom, D.C & Thompson,
N.H 1988, „In vitro mechanism of inhibition of bacterial cell growth by allicin‟,
Antimicrobial Agents and Chemotherapy, vol. 32, no. 12, pp. 1763-1768.
Scherber, C.M., Schottel, J.L & Aksan, A 2009, „Membrane phase behaviour of Escherichia
coli during desiccation, rehydration, and growth recovery‟, Biochimica et Biophysica Acta,
vol. 1788, pp. 2427-2435.
Schleifer, K.H & Kandler. O 1972, „Peptidoglycan types of bacterial cell walls and their
taxonomic implications‟, Bacteriological Reviews, vol. 36, no. 4, pp. 407-477.
Vodnar, D.C., Paucean, A, Dulf, F.V & Socaciu, C 2010, „HPLC characterization of lactic
acid formation and FTIR fingerprint of probiotic bacteria during fermentation processes‟,
Notulae Botanicae Horti Agrobotanici Cluj-Napoca, vol. 38, no. 1, pp. 109-113.
Zoumpopoulou, G, Papadimitriou, K, Polissiou, M.G., Tarantilis, P.A 2010, „Detection of
changes in the cellular composition of Salmonella enteric serovar Typhimurium in the
presence of antimicrobial compound(s) of Lactobacillus strains using Fourier transform
infrared spectroscopy‟, International Journal of Food Microbiology, vol. 144, pp. 202-207.
©© UUnniivveerrssiittyy ooff PPrreettoorriiaa

135
CHAPTER 5
Flow cytometric viability assessment of selected
Bifidobacterium spp. exposed to garlic (Allium
sativum) clove extract
©© UUnniivveerrssiittyy ooff PPrreettoorriiaa

136
5.1 Abstract
The objective of this work was to use flow cytometry as a tool to assess viability of
Bifidobacterium bifidum LMG 11041, B. longum LMG 13197, B. lactis Bb12 and
Lactobacillus acidophilus La14 150B after exposure to garlic clove (GC) extract.
Furthermore, we aimed to determine the extent of damage induced by garlic on the cells. The
LIVE/DEAD BacLight viability kit was used to stain the cells. Results revealed a decrease in
percentage of viable cells with an associated increase in damaged cells and, possibly lysed
cells, after treatment with GC extract for all three Bifidobacterium spp. tested. Subsequent
inoculation of the stained treated cells into fresh growth medium in the absence of GC extract
resulted in an increase of the percentage of live cells. This suggested that injured cells were
able to recover and revert to the physiologically active state, as well as assume their original
shapes and sizes. Thus, cells exposed to sub-lethal concentrations of garlic can repair their
damage and start multiplying again. This work showed that flow cytometry in combination
with fluorescent techniques is useful to improve understanding of the effects of GC extract on
Bifidobacterium species.
Keywords: Probiotics, Bifidobacterium spp., garlic, viability, flow cytometry, membrane
integrity.
©© UUnniivveerrssiittyy ooff PPrreettoorriiaa

137
5.2 Introduction
Allicin, the main active compound of garlic responsible for its antimicrobial activity, can
readily pass through phospholipid membranes and be taken up by the cells. This causes
damage to their membranes, leading to cessation of growth, autolysis and eventually cell
death (Bakri and Douglas, 2005; Lu et al., 2011). It is known to affect microorganisms by a
number of different mechanisms of action. It mainly acts by immediately and totally
inhibiting RNA synthesis and partially inhibiting DNA and protein synthesis (Focke et al.,
1990; Al-Wailiet al., 2007; Deresse, 2010).
We have shown that garlic has antibacterial activity and decreases viability of selected
Bifidobacterium spp. using the disk diffusion assay and conventional plate count methods.
Traditional plate count methods only take into account cells that can replicate under
conditions provided for growth and therefore some cells which are viable but nonculturable
are not counted and are considered as dead, dormant, damaged, injured or inactive cells
(Rault et al., 2007). These traditional culture methods therefore examine bacterial death only
in retrospect and intermediate states such as cell injury and stress are very difficult to
distinguish (Hewitt et al., 1999; Berney et al., 2007).
It has been reported in the past that cells in injured populations can possibly enter a brief
noncultivable state, presumably due to sub-lethal injury mechanisms, which include damage
of the cell membrane or reversible and temporary membrane permeabilization (Rault et al.,
2007). This is known as the “viable but not culturable” (VBNC) state. These nonculturable
bacteria may remain in this state for more than a year (Paparella et al., 2008). This has been
observed for starved Micrococcus luteus or bile salt-stressed Bifidobacterium cells (Ben
Amor et al., 2002; Rault et al., 2007).
Therefore more rapid and sensitive techniques have been developed for quicker assessment of
the viability of samples. Such techniques use a variety of stain-based methods such as
fluorescent probes or dyes (Rault et al., 2007). Flow cytometry is one such technique. Flow
cytometric analysis allows rapid enumeration of individual cells and can simultaneously
measure the morphological and functional cellular functions of cells. Analysis of different
physiological parameters such as membrane integrity, cellular viability, membrane potential,
©© UUnniivveerrssiittyy ooff PPrreettoorriiaa
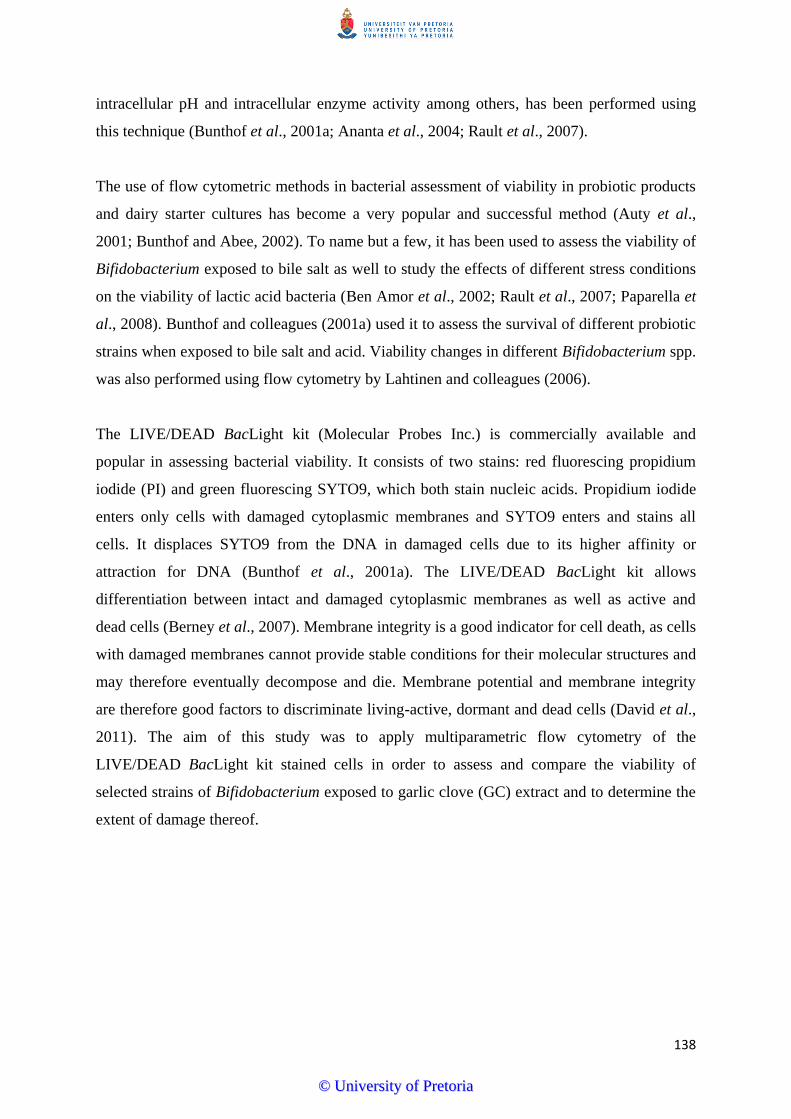
138
intracellular pH and intracellular enzyme activity among others, has been performed using
this technique (Bunthof et al., 2001a; Ananta et al., 2004; Rault et al., 2007).
The use of flow cytometric methods in bacterial assessment of viability in probiotic products
and dairy starter cultures has become a very popular and successful method (Auty et al.,
2001; Bunthof and Abee, 2002). To name but a few, it has been used to assess the viability of
Bifidobacterium exposed to bile salt as well to study the effects of different stress conditions
on the viability of lactic acid bacteria (Ben Amor et al., 2002; Rault et al., 2007; Paparella et
al., 2008). Bunthof and colleagues (2001a) used it to assess the survival of different probiotic
strains when exposed to bile salt and acid. Viability changes in different Bifidobacterium spp.
was also performed using flow cytometry by Lahtinen and colleagues (2006).
The LIVE/DEAD BacLight kit (Molecular Probes Inc.) is commercially available and
popular in assessing bacterial viability. It consists of two stains: red fluorescing propidium
iodide (PI) and green fluorescing SYTO9, which both stain nucleic acids. Propidium iodide
enters only cells with damaged cytoplasmic membranes and SYTO9 enters and stains all
cells. It displaces SYTO9 from the DNA in damaged cells due to its higher affinity or
attraction for DNA (Bunthof et al., 2001a). The LIVE/DEAD BacLight kit allows
differentiation between intact and damaged cytoplasmic membranes as well as active and
dead cells (Berney et al., 2007). Membrane integrity is a good indicator for cell death, as cells
with damaged membranes cannot provide stable conditions for their molecular structures and
may therefore eventually decompose and die. Membrane potential and membrane integrity
are therefore good factors to discriminate living-active, dormant and dead cells (David et al.,
2011). The aim of this study was to apply multiparametric flow cytometry of the
LIVE/DEAD BacLight kit stained cells in order to assess and compare the viability of
selected strains of Bifidobacterium exposed to garlic clove (GC) extract and to determine the
extent of damage thereof.
©© UUnniivveerrssiittyy ooff PPrreettoorriiaa

139
5.3 Materials and methods
5.3.1 Bacterial cultures
Commercial probiotic cultures of Bifidobacterium lactis Bb12 (CHR- Hansen), B. bifidum
LMG 11041 and B. longum LMG 13197 (BCCM/LMG culture collection, Belgium) and
Lactobacillus acidophilus La14 150B (Danisco) were used. L. acidophilus La14 150B was
used as a comparison.
5.3.2 Preparation of inocula and exposure to garlic clove extract
Bifidobacterium strains were grown in MRS broth supplemented with 0.05% cysteine
hydrochloride and incubated at 37°C for 16 h in anaerobic jars containing Anaerocult A
gaspacks (Merck Ltd. Modderfontein, SA). Lactobacillus acidophilus La14 150B was
cultured in MRS broth without cysteine hydrochloride. Overnight cultures were then diluted
10-fold in fresh MRS broth at 37°C and subcultured cells allowed to grow anaerobically to
reach the mid-exponential phase (0.5 McFarland standard), which corresponds to a
concentration of approximately 108 cell/ml. One hundred microlitres of garlic clove (GC)
extract, prepared as previously mentioned (Chapter 2, section 2.3.2.1) and ampicillin (Amp)
were added to 1 ml of the bacterial suspensions and further incubated for 6 h at 37°C.
Bacterial cells were then harvested by centrifugation at 13400 rpm for 15 min (Eppendorf
minispin centrifuge) and the pellet washed twice with ½ Ringers solution by centrifugation.
Washed cells were resuspended in phosphate buffered saline (PBS) and the concentration
adjusted to 108 cells/ml. Untreated and heat-killed (incubated at 70°C for 30 min) cells were
used as control samples.
5.3.3 Staining of bacteria for flow cytometric analysis
Live cells that were in their mid-exponential phase were used as positive controls while heat
killed cells (70°C heat-killed for 30 min) were used as negative controls. Samples were
stained with the Live/Dead BacLight bacterial viability kit (Molecular Probes, L7012). Three
replicates of positive and negative control cultures were individually stained with 2 µl PI, 1.5
µl SYTO9 and 1.5 µl of mixed SYTO9 and PI, respectively. The same amount of stains were
©© UUnniivveerrssiittyy ooff PPrreettoorriiaa

140
added to the untreated, heat killed samples, the three GC extract treated and to the ampicillin-
treated samples. All cultures (live, heat-killed, GC extract treated and ampicillin treated cells)
were stained separately with 1.5 µl (Diluted 1:20) of SYTO 9, PI or a mixture of two stains
(dual staining). Dual staining was performed for one sample of each of the untreated live,
untreated dead and GC treated sample sets in order to differentiate live, dead and
compromised cells. After addition of the stains to the culture, the tubes were incubated in a
dark cupboard for 15 min. Then the samples were centrifuged at 13 400 rpm for 10 min. The
cell pellets were resuspended in PBS and placed on ice before flow cytometric analysis.
5.3.4 Flow cytometry analyses
Flow cytometric analysis was performed with a BD FACSAria, equipped with fourargon
lasers (488-nm, 633-nm, 405-nm laser and 375-nm near UV laser) for excitation. BD
FACSflow (Becton Dickinson) was used as sheath fluid and the flow cytometer was adjusted
to count 10 000 events per sample. The green fluorescence from SYTO9 was detected
through a 530-nm, 30-nm-bandwidth band-pass filter which amounts to a range of 675-715-
nm (FITC). Red fluorescence was detected through a 695-nm, 40-nm band-pass filter (Per-C-
P), which amounts to a range of 515-545-nm. The forward scatter (FSC), sideward scatter
(SSC), green and red fluorescence of each single cell were measured. All signals were
collected using exponential amplifications. A combination of FSC and SSC was used to
discriminate bacteria from background. All experiments were performed in triplicate.
5.3.5 Data analysis
Data compensation and analysis was performed using FlowJoVersion 7.6.1.
5.3.6 Revival of stained treated cells
The dual stained GC extract-treated sample was centrifuged at 13400 rpm for 15 min after the
initial flow cytometric analysis. The supernatant was discarded and the pellet resuspended in
1 ml fresh MRS-cys broth, and incubated for 24 h at 37°C. After incubation, bacteria were
harvested from the broth by centrifugation at 13 400 rpm for 15 min and washed twice with
½ Ringers solution. The cells were then resuspended in PBS and the concentration adjusted to
©© UUnniivveerrssiittyy ooff PPrreettoorriiaa

141
108 cells/ml. The cells were stained as described above and analysed using flow cytometry,
with live untreated and heat-killed cells used as controls.
5.3.7 Statistical analysis
Microsoft Excel 2007 was used to determine means and standard deviations of the samples.
5.4 Results and Discussion
5.4.1 Flow cytometric data interpretation
Flow cytometric data allowed us to estimate the impact of GC extract on microbial viability.
Dual-parameter dot plots of the green fluorescence (SYTO9) (y-axis) and the red
fluorescence (PI) (x-axis) were used to differentiate bacterial populations based on their
fluorescence properties. Each dot represents one detected event, which is identified as a
single cell which is plotted as a co-ordinate of their green (SYTO9) and red (PI) fluorescence
value. PI and SYTO9 were simultaneously used for viability assessment of the strains before
and after addition of GC extract.
Dot plots with results closest to the average means of triplicate experiments (Appendix) were
used to illustrate our results. The different quadrants were set to represent the following
population of cells: Quadrant 1 (Q1), upper left quadrant, SYTO9-stained (SYTO9+PI
-) cells,
quadrant 2 (Q2) upper left quadrant, double-stained (SYTO9+PI
+) cells, quadrant 3 (Q3)
lower right quadrant, PI-stained (PI+SYTO9
-) and quadrant 4 (Q4), unstained (SYTO9
-PI
-)
cells. Thus events appearing in Q1 (SYTO9+PI
-) correspond to the live/viable cells in the
population, Q2 (SYTO9+PI
+) represents cells which suffered membrane damage
(compromised cells), Q3 (PI+SYTO9
-) shows dead cells while unstained viable, or lysed cells
with depolarized cytoplasmic membranes are located in Q4 (SYTO9-PI
-). Figures 5.1 and 5.2
show the flow cytometric detectors and compensation settings as determined using control
samples. Results from these two figures show that a good discrimination was achieved
between live and dead/compromised cells by the dual staining method.
Double staining of the GC extract treated Bifidobacterium cells with PI and SYTO9 was used
to determine the effect of garlic on the membrane integrity of the cells, thereby giving an
©© UUnniivveerrssiittyy ooff PPrreettoorriiaa

142
indication of whether the cell is viable, dead or damaged. If the cell membrane is intact and
not damaged, the cells exclude the nucleic acid dye PI, which binds to RNA and DNA.
Damage to the cell membrane makes it permeable to PI, which upon entry into the cells stains
nucleic acids resulting in red fluorescence. PI is therefore used as a marker for dead cells and
indicates that cells have lost their membrane integrity and tend to reduce culturability
(Volkert et al., 2008). SYTO9 stains all cells in a population, whether they are dead or alive.
Fluorescent stains, such as PI and SYTO9, have been used in many studies on lactic acid
bacteria to differentiate between intact and permeable (damaged) cells (Bunthof et al., 2001a;
Bunthof et al., 2001b; Bunthof and Abee, 2001; Ananta et al., 2005). The results obtained for
each of the tested strains in the current study are discussed separately below.
5.4.1.1 L. acidophilus La14 150B
In Chapter 2, it was documented that L. acidophilus La14 150B was not susceptible to GC
extract, whereas it was very susceptible to ampicillin. Flow cytometric data confirmed these
findings. Compensation controls represented by dot plots (Fig. 5.1A-D) worked well and it
can be seen that once L. acidophilus La14 150B cells were treated with GC extract (Fig.
5.2E) there was not much difference when compared to the untreated control (Fig. 5.2A).
After GC extract treatment approximately 99.2% (Fig. 5.2E, Q1) did not take up the PI stain,
indicating that cells remained healthy with intact polarized cytoplasmic membranes and were
able to withstand GC extract treatment.
Only 0.56% (Fig. 5.2E, Q2 and Q3) of the cell population took up PI and showed cytoplasmic
membrane damage as a result of the GC extract treatment. Ampicillin was used as a positive
control and it was expected that there would be a decline in viability as well as considerable
cell damage or death once L. acidophilus La14 150B was treated with this antibiotic. Upon
treatment of L. acidophilus with ampicillin, the percentage of healthy cells with intact
polarized cytoplasmic membranes decreased from 99.6% to 48.6% (Fig. 5.2D, Q1). There
was an increase of 44% for cells with damaged or depolarized membranes (Fig. 5.2D, Q2)
and 6.99% of the dead cells (Fig. 5.2D, Q3).
©© UUnniivveerrssiittyy ooff PPrreettoorriiaa

143
Figure 5.1: Fluorescence histograms showing compensation controls for L. acidophilus La14 150B: A:
SYTO9 stained/SYTO9+; B: PI stained/PI
+; C: Unstained control/ PI
-; D: Unstained control/SYTO9
-.
A B
C D
SYTO9 +
PI -
Unstained/ PI - Unstained/
SYTO9+
©© UUnniivveerrssiittyy ooff PPrreettoorriiaa
144
Figure 5.2: Flow cytometry dot plots of viable untreated (A), dead (B), unstained (C), ampicillin-treated
(D) and GC extract treated (E) L. acidophilus La14 150B cells.
SYTO9-PI+
A B
C D
E
SYTO9+PI
-
SYTO9+PI
+
SYTO9-PI-
©© UUnniivveerrssiittyy ooff PPrreettoorriiaa

145
According to Nikiyan and colleagues (2010), ampicillin inhibits the synthesis of the
peptidoglycan layer of Gram-positive bacteria cell walls and therefore destructs the cell wall.
These results once again correlated with the results that were obtained in the previous
Chapters for effect of ampicillin on this bacterium. This therefore confirms that L.
acidophilus La14 150B is relatively resistant to GC extract as has been observed in the
previous Chapters.
5.4.1.2 B. bifidum LMG 11041
Figure 5.3 shows successful controls for B. bifidum LMG 11041. The live cell sample
however did not have 100% viable cells, but 98.7% viable and 0.34% of damaged cells (Fig.
5.4A). This indicated that even in a sample which is presumed to be totally healthy by
classical microbiology, there are already some cells that are damaged or injured. This has also
been observed by Ben Amor and colleagues (2002) and Hayouni et al (2008). The heat-killed
B. bifidum LMG 11041 sample contained 98.4% cells that were permeable to PI, with a
corresponding fluorescence intensity of 103 (Fig. 5.4B). Dot plots obtained for this strain
showed significant differences between untreated and GC extract treated cells (Fig. 5.4A and
E). Not only were there cells visible in three of the four quadrants after exposure to GC
extract, but the entire population also changed shape and density (Fig. 5.4E). The relative
percentage of freshly harvested viable cells in the treated sample decreased from 98.7% to
82.2% (Fig. 5.4A, Q1), whereas there were increases from 0.34% to 8.66% and 1% to 9.08%
in Q2 and Q4, respectively. The increase of cells located in Q2 (SYTO9+PI
+ stained
population) of Figure 5.4E is evident of progressive cell damage and membrane deterioration
or permeabilization. Cell depolarization indicates a decline in cell functionality, due to energy
depletion, but it does not imply cell death (Cánovas et al., 2007).
It is known that allicin, the main active compound found in garlic, can easily pass through
phospholipid membranes and be taken up by the cell, which in turn causes cell membrane
damage and eventually cell lysis and termination of growth (Al-Waili et al., 2007; Deresse,
2010). Similar flow cytometric data for bifidobacteria exposed to bile salt stress was obtained
by Ben Amor et al (2002). Ananta and colleagues (2005) also found cell membrane damage
using flow cytometry when Lactobacillus rhamnosus underwent spray drying.
©© UUnniivveerrssiittyy ooff PPrreettoorriiaa

146
Figure 5.3: Fluorescence histograms showing compensation controls for B bifidum LMG 11041: A:
SYTO9 stained/SYTO9+; B: PI stained/PI+; C: Unstained control/ PI-; D: Unstained control/ SYTO9
-.
Interestingly, after GC extract treatment the percentage of the cell population in Q4 (SYTO9-
PI-) increased to 9.08% (Fig. 5.4E). An increase in numbers of unstained cells could be
possibly due to a number of reasons. Firstly, these cells could correspond to cells that have
undergone lysis, as a result have lost their nucleic acids, thereby rendering them unstainable
(Martínez-Abad et al., 2012). Secondly, they may also be cells that were unstained possibly
due to the fact that bacterial species may exist or are able to clump together or form
interlaced chains which, according to Hayouni et al (2008), may provide a single increasing
signal resulting from the input of each cell to it, therefore decreasing staining accuracy and
producing misleading results. These „ghost cells‟ have also been described by other
researchers elsewhere (da Silva et al., 2005; Shena et al., 2009).
SYTO9 +
PI -
Unstained/ PI - Unstained/
SYTO9+
C
A B
D
©© UUnniivveerrssiittyy ooff PPrreettoorriiaa

147
Figure 5.4: Flow cytometry dot plots of viable untreated (A), dead (B), unstained (C), ampicillin-treated
(D) and GC extract treated (E) B. bifidum LMG 11041cells.
A B
C D
D
E
SYTO9+PI
-
SYTO9+PI
+
SYTO9-PI
-
SYTO9-PI
+
©© UUnniivveerrssiittyy ooff PPrreettoorriiaa

148
It can also clearly be observed that there was a significant difference in the shape and density
of the populations‟ light scatter pattern before and after exposure to GC extract (Fig. 5.4A
and E). Flow cytometric analysis is able to measure each cell‟s individual light dispersion
pattern, which supplies information on cell size and granularity (Schenk et al., 2011). There
was a definite change in light scatter of the bacterial cell population after treatment, which
became less diffuse and much more concentrated. This could possibly be due to a change in
cellular structure and external morphology as a result of the GC extract treatment. It could
also indicate that the size of the cells decreased after GC extract treatment possibly changing
form a rod-shape to coccoid in shape, as was evident with scanning electron microscopy
(Chapter 3, section 3.4.2). Similar results were obtained by Schenk and colleagues (2011)
after Escherichia coli and Listeria innocua cells were exposed to UV-C light.
Bifidobacterium bifidum LMG 11041 therefore showed a considerable drop in viability and
cell damage when exposed to GC extract. Comparing the results for GC extract treatment
with those obtained for cells treated with ampicillin, a significant change in cell population
due to treatment was also observed. The percentage of viable B. bifidum LMG 11041 cells
decreased from 98.7% to 69.6%, (Fig. 5.4D, Q1) while there was an increase to 25.1% (Fig.
5.4D, Q2) and 4.93% (Fig. 5.4D, Q3) for that of stressed cells with damaged membranes and
dead cells, respectively. This confirms results shown in Chapter 3 (Section 3.4.2) that B.
bifidum LMG 11041 was very susceptible to ampicillin.
5.4.1.3 B. longum LMG 13197
As with B. bifidum LMG 11041, this strain also gave good results for the controls (Fig. 5.5).
Good fluorescent peaks for both SYTO9 and PI were obtained and for the unstained sample
both stains were absent. When comparing untreated (Fig. 5.6A) and GC extract treated (Fig.
5.6E) cells, dot plots revealed that B. longum LMG 13197 followed a similar pattern to that
of B. bifidum LMG 11041 (Fig. 5.4). The viable cell population decreased from 99.8% to
88.8% after GC extract treatment, whereas cell numbers increased in Q2 to 9.4% (Fig. 5.6E),
indicating damaged cells with depolarized membranes. The population shape and density also
changed after exposure to GC extract (Fig. 5.6E) compared to the untreated bacterial
population (Fig. 5.6A), with the light scatter pattern becoming more concentrated indicating a
change in size and molecular content of the cells.
©© UUnniivveerrssiittyy ooff PPrreettoorriiaa

149
Figure 5.5: Fluorescence histograms showing compensation controls for B. longum LMG 13197: A:
SYTO9 stained/SYTO9+; B: PI stained/PI+; C: Unstained control/ PI-; D: Unstained control/ SYTO9
-.
A concentrated light pattern indicates smaller cells whereas a more diffuse light scatter
pattern indicates bigger cells (Schenk et al., 2011). Therefore the cells may have changed
from their normal rod-shape appearance to more coccoid-shape after GC extract treatment.
According to Novik et al (2001), bifidobacteria entering their death phase have an assortment
of morphologies which include coccoid-shaped cells as a result of stress. This clearly shows
that GC extract affects both the viability of the cells and their shape and morphology. A study
by Young et al (2007) showed that typical rod-shaped Bifidobacterium spp. became coccoid
under stress, such as a nutrient limitation.
SYTO9 +
PI -
Unstained/ PI -
Unstained/ SYTO9+
A B
C D
©© UUnniivveerrssiittyy ooff PPrreettoorriiaa
150
Figure 5.6: Flow cytometry dot plots of viable untreated (A), dead (B), unstained (C), ampicillin-treated
(D) and GC extract treated (E) B. longum LMG 13197cells.
SYTO9-PI+
A B
C D E
SYTO9+PI
+
SYTO9+PI
-
SYTO9-PI
-
©© UUnniivveerrssiittyy ooff PPrreettoorriiaa

151
Therefore GC extract negatively affected B. longum LMG 13197, causing cell membrane
damage and a drop in viable cells. The only difference between B. longum LMG 13197 and
B. bifidum LMG 11041 is that the percentage of unstained cells did not increase as much as
was observed with the later strain, with only 1.68% of cells recorded (Fig. 5.4D, Q4). This
suggests that this strain was probably less susceptible to the effects of GC extract.
Ampicillin had a much more detrimental effect on B. longum LMG 13197 (Fig. 5.6D) than it
had on B. bifidum LMG 11041 (Fig. 5.4D). There were barely any viable cells remaining
after treatment (0.23%) as compared with 99.8% before treatment. A percentage of 69.5% of
cells were membrane compromised (Fig. 5.6D, Q2) and 29.9% appeared dead (Fig. 5.6D,
Q3). The light scatter pattern was also much more concentrated and less diffuse when
compared to untreated cells (Fig. 5.6A, Q1) indicating a change in the size and contents
(granularity) of the cells as mentioned previously.
5.4.1.4 B. lactis Bb12
Compensation controls for B. lactis Bb12 were successful with good fluorescent peaks for
both stains (Fig. 5.7). Results for GC extract treated sample showed that 8.09% of the cell
population had membrane damage (Fig. 5.8E, Q2) and 24.8% of the population was
unstained (Fig. 5.8E, Q4) due to severe cell lysis. Previous studies have confirmed that garlic
damages cell membranes and causes cell lysis. Kim et al (2007) reported cell wall lysis in
Listeria monocytogenes cells treated with garlic shoot juice. Similar results were also
observed by Ghannoum (1988), where he attributed the change in structure and integrity of
the outer membrane of Candida albicans to the decrease in lipid content of the membrane
due to the presence of garlic (Kim et al., 2007).
Only 67% of the cells remained viable and healthy after treatment (Fig 5.8E, Q1) as opposed
to 99.7% before treatment (Fig. 5.8A). As with the B. bifidum LMG 11041 (Fig. 5.4) and B.
longum LMG 13197 (Fig. 5.6), the entire cellular population changed in terms of the size of
each cell as well as the granular content of the cells, meaning GC extract had an effect on the
intracellular contents of the cells. These results confirmed that B. lactis Bb12 is susceptible to
GC extract and there is a significant drop in viable cells after treatment. Dot plots for
ampicillin treated B. lactis Bb12 cells revealed that this strain was very also very susceptible
to ampicillin.
©© UUnniivveerrssiittyy ooff PPrreettoorriiaa

152
Figure 5.7: Fluorescence histograms showing compensation controls for B. lactis Bb12: A: SYTO9
stained/SYTO9+; B: PI stained/PI+; C: Unstained control/ PI-; D: Unstained control/ SYTO9
-.
Ampicillin treatment reduced the population of viable cells from 99.7% to only 44.7% (Fig.
5.8D, Q1). The rest of the cells were membrane damaged (42.7%), dead (11.2%) or lysed
(1.49%), (Fig. 5.8D, Q2, Q3 and Q4, respectively). The population shape of B. lactis Bb12
was similar to that of B. bifidum LMG 11041 after ampicillin treatment.
SYTO9 +
PI -
Unstained/ PI -
Unstained/ SYTO9+
D C
B A
©© UUnniivveerrssiittyy ooff PPrreettoorriiaa

153
Figure 5.8: Flow cytometry dot plots of viable untreated (A), dead (B), unstained (C), ampicillin-treated
(D) and GC extract treated (E) B. lactis Bb12 cells.
A B
C D
E
SYTO9+PI
-
SYTO9+PI
+
SYTO9-PI-
SYTO9-PI+
©© UUnniivveerrssiittyy ooff PPrreettoorriiaa

154
Untreated cells for all Bifidobacterium strains and L. acidophilus stained with SYTO9 (Fig.
5.2A, 5.4A, 5.6A and 5.8A) showed a homogeneous behavior in their fluorescent labeling
properties. All cells yielded high green fluorescence and were situated in Q1. For all three
Bifidobacterium strains, exposure to GC extract resulted in a sub-population increase of
9.32%, 12.87% and 7.76% (means of triplicate experiments, Appendix) for B. bifidum LMG
11041, B. longum LMG 13197 and B. lactis Bb12, respectively in the number of events
encountered in Q2 (SYTO+PI
-), indicating damage to the cell and a drop in viability. We
know that allicin, the active agent of garlic, is able to penetrate and enter cell membranes
causing damage to the cell (Bakri and Douglas, 2005). Additionally, sub-population increases
of 11.01%, 5.04% and 22.83% for B. bifidum, B. longum and B. lactis spp., respectively,
appeared in Q4 (Fig. 5.4E, 5.6E and 5.8E) after GC extract exposure. This indicated either
severe cell lysis occurred, thereby probably inhibiting the cell to take up any stains, especially
since control samples indicated good staining.
In order for a cell to be healthy and fully functional, it needs both an intact polarized
cytoplasmic membrane as well as an active transport system (Hewitt et al., 1999; da Silva et
al., 2005). Therefore with the use of PI, a DNA stain that cannot enter a cell with an intact
cytoplasmic membrane, we established that GC extract does indeed damage the cell and
renders it non-functional and unhealthy. When a cell is excessively stressed, the cytoplasmic
membrane depolarizes and ultimately permeabilzes which indicates cell death and cell lysis
(da Silva et al., 2005; Hewitt et al., 1999). Garlic causes cell membrane damage which can
result in cell lysis which ultimately leads to death (Lu et al., 2011). Lipid and fatty acid
biosynthesis as well as NO- formation are also influenced by garlic, which has significant
changes in the viability of cells (Focke et al., 1990; Miron et al., 2000). This could support
our results where cells were found in Q2 and Q4, indicating cell membrane damage and cell
lysis, respectively. Dot plots for L. acidophilus La14 150B showed no real susceptibility to
GC extract, which substantiates results obtained in previous chapters.
5.4.2 Determination of recovery of damaged cells
Cells that have undergone stress such as damaged membrane, proteins and/or DNA, possibly
from sub-lethal injury, can generally assume a dormant or nonculturable condition in which
they do not grow, but they are able to recover by repairing or replacing damaged molecules,
and come back to their physiologically active condition (Ben Amor et al., 2002). In order to
©© UUnniivveerrssiittyy ooff PPrreettoorriiaa

155
determine the ability of compromised or injured bifidobacteria cells to recover from sub-
lethal damage due to GC extract exposure, we harvested the stained cells after flow
cytometry analysis, re-inoculated them into fresh medium and incubated the suspension under
appropriated growth conditions. If the DNA or damaged molecules are damaged beyond
repair or if the damage/stress caused by culture conditions requires more energy than the cell
can safely generate for its repair; no growth will occur (Nebe-von-Caron et al., 2000). Table
5.1 shows percentages of live, dead, lysed or unstained cells and damaged (compromised)
cells of the three Bifidobacterium strains treated with GC extract and after they were re-
inoculated into fresh broth in the absence of GC extract. The results show that generally, the
numbers of viable cells in all the samples increased after re-inoculation, indicating growth of
the cells. The differences in the extent of increase in viability for the Bifidobacterium strains
are discussed briefly below.
5.4.2.1 B. bifidum LMG 11041
After treatment with GC extract, it was observed that 8.66% of the cells were damaged and
had compromised membranes (Fig. 5.9A, Q2). After cells were re-inoculated into fresh broth
in the absence of GC extract, it was observed that the percentage of previously damaged cells
decreased from 8.66% (Fig. 5.9A, Q2) to 0.73% (Fig. 5.9B, Q2). The percentage of „lysed‟
cells decreased from 9.08% (Fig. 5.9A, Q4) to 0.57% (Fig. 5.9B, Q4). This possibly suggests
Bifidobacterium
strains
Live (%) Damaged (%) Dead (%) Lysed/Unstained (%)
Treated After
reinoculation
Treated After
reinoculation
Treated After
reinoculation
Treated After
reinoculation
B. bifidum LMG
11041
82.2 98.7 8.66 0.73 0.1 0.01 9.08 0.57
B. longum LMG
13197
88.8 97.4 9.4 2.35 0.08 0.02 1.67 0.19
B. lactis Bb12 67 97.4 8.09 1.83 0.17 0.08 24.8 0.7
Table 5.1: Percentages of live, dead, lysed/unstained cells and compromised/damaged cell of B. bifidum LMG
11041, B. longum LMG 13197 and B. lactis Bb12 treated with GC extract and after re-inoculation in the
absence of GC extract
©© UUnniivveerrssiittyy ooff PPrreettoorriiaa

156
that these cells were able to recover in the absence of GC extract and return to their
physiologically active and growing state. Therefore, the damaged cells exposed to GC extract
entered a dormant state in which they could not grow. Once the source of stress, in this case
GC extract, was removed and the cells received a fresh medium with adequate nutrients, they
were able to recover and repair the damage induced by the GC extract. The reduction in the
percentage of lysed cells is an indication that these numbers were fewer than other cells in the
population, as it is highly unlikely that cells are able to recover after cell lysis. The light
scatter pattern of the re-inoculated cells also showed that they returned to their original size
and shape (Fig. 5.9B) as they were before GC extract treatment (Fig. 5.9A), as the pattern
became more diffuse in appearance.
Figure 5.9: Flow cytometry dot plots of GC extract treated B. bifidum LMG 11041 cells after initial
staining (A) and after re-inoculation into fresh broth (B).
5.4.2.2 B. longum LMG 13197
For B. longum LMG 13197, slightly fewer cells recovered after removal of GC extract and
re-inoculation into fresh medium (Fig. 5.10B). The percentage of live cells increased from
88.8% (Fig. 5.10A, Q1) to 97.4% (Fig. 5.10B, Q1). A decrease from 9.4% (Fig. 5.10A, Q2)
to 2.35% (Fig. 5.10B, Q2) in the percentage of damaged cells was also observed. A possible
reason for fewer cells recovering could be that GC extract had a more permanent damaging
effect on this strain or the recovery time may be longer than 24 h in order for the cells to
revert to the physiologically active state and start multiplying again. Once again the
A B
©© UUnniivveerrssiittyy ooff PPrreettoorriiaa

157
concentrated light scatter pattern became more diffuse indicating that the cells assumed their
original size and shape.
Figure 5.10: Flow cytometry dot plots of GC extract treated B. longum LMG 13197 cells after initial
staining (A) and after re-inoculation into fresh broth (B).
5.4.2.3 B. lactis Bb12
The results obtained for B. lactis Bb12 after re-inoculation were similar to those of B. bifidum
LMG 11041. Most of the compromised cells for B. lactis Bb12 recovered after resuscitation
in fresh broth without GC extract (Table 5.1 and Fig. 5.11B). This once again suggests that
these cells assumed a dormant (non-culturable) state after GC extract treatment, but were able
to recover by repairing the damaged molecules, and return back to their physiologically
active condition once the source of stress was removed and fresh nutrients became available.
In summary, re-inoculation of the damaged GC extract treated cells into fresh broth, resulted
in apparent re-growth of the injured cells for all the three Bifidobacterium spp. All three
Bifidobacterium spp. showed a decrease in the amount of events occurring in Q2 after the
cells were inoculated into fresh broth without GC extract as compared to cells that were
exposed to GC extract (Table 5.1). This could mean that a fraction of the stressed cells
adopted a latent state in which they couldn‟t reproduce but were induced to a physiologically
active state after recovery.
A B
©© UUnniivveerrssiittyy ooff PPrreettoorriiaa

158
Figure 5.11: Flow cytometry dot plots of GC extract treated B. lactis Bb12 cells after initial staining (A)
and after re-inoculation into fresh broth (B).
Garlic clove may have induced sub-lethal injury within the Bifidobacterium populations
through a reversible and transient membrane permeabilization which resulted in loss of
viability, but these cells could then regain growth after being resuscitated in fresh broth
containing fresh sources of growth. According to Hewitt and colleagues (1999), cells are able
to exist without a membrane potential for a short period of time after which they either
quickly progress to permeabilisation and death or re-polarise in the presence of a fresh energy
source, as was the case with our results. This was also observed by Ben Amor et al (2002),
for Bifidobacterium cells exposed to bile salt.
5.5 Conclusion
Multiparameter flow cytometric analysis and simultaneous use of LIVE/DEAD BacLight
viability kit provided a good discrimination between viable, damaged and dead cells in the
mixtures of untreated and GC extract treated Bifidobacterium cells. The decrease in the
populations of SYTO9-stained Bifidobacterium cells with concomitant increase in PI stained
cells for all three species indicated membrane deterioration after GC treatment. The bacterial
membrane was identified as one of the main sites of injury for the Bifidobacterium spp. tested
after GC treatment. These findings showed that for all three Bifidobacterium cells, GC extract
treatment destroyed membrane integrity as PI was able to enter the cells.
B A
©© UUnniivveerrssiittyy ooff PPrreettoorriiaa

159
B. bifidum LMG 11041 and B. lactis Bb12 were the most vulnerable to GC extract, having
higher increases in events occurring in Q4 possibly indicating lysed cells. This signifies that
these two strains had significant cytoplasmic membrane damage and lysis eventually
occurred. Once lysis occurrs the cells cellular contents are exposed to the external
environment and the cell ultimately dies. The treated cells showed changes in light scatter
patterns after exposure to GC extract, which indicates a change in cell shape and granularity.
All three Bifidobacterium spp. were able to recover after damaged cells when re-inoculated
into fresh broth. Cell sorting would be a much better representation of whether damaged cells
were really able to recover as one would easily be able to gate the cells and sort them in order
to obtain only the damaged cells to plate them out. Dead cells and “lysed” cells could then
also be obtained and plated to confirm their physiological state as indicated by flow
cytometry.
5.6 References
Al-Waili, N.S., Saloom, K.Y., Akmal, M, Al-Waili, T.N., Al-Waili, A.N., Al-Waili, H, Ali. A
& Al-Sahlani, K 2007, „Effects of heating, storage, and ultraviolet exposure on antimicrobial
activity of garlic juice‟, Journal of Medicinal Food, vol. 10, no. 1, pp. 208-212.
Ananta, E, Heinz, V & Knorr, D 2004, „Assessment of high pressure induced damage on
Lactobacillus rhamnosus GG by flow cytometry‟, Food Microbiology, vol. 21, pp. 567-577.
Ananta, E, Volkert, M & Knorr, D 2005, „Cellular injuries and storage stability of spray-dried
Lactobacillus rhamnosus GG‟, International Dairy Journal, vol. 15, pp. 399-409.
Auty, M.A.E., Gardiner, G.E., McBrearty, S.J., O‟Sullivan, E.O., Mulvihill, D.M., Collins,
J.K., Fitzgerald, G.F., Stanton, C & Ross, R.P 2001, „Direct in situ viability assessment of
bacteria in probiotic dairy products using viability staining in conjunction with confocal
scanning laser microscopy, Applied and Environmental Microbiology, vol. 67, no. 1, pp. 420-
425.
Bakri, I.M & Douglas, C.W.I 2005, „Inhibitory effect of garlic extract on oral bacteria‟,
Archives of Oral Biology, vol. 50, pp. 645-651.
Ben Amor, K, Breeuwer, P, Verbaarschot, P, Rombouts, F.M., Akkermans, A.D., de Vos,
W.M & Abee, T 2002, „Multiparametric flow cytometry and cell sorting for the assessment
©© UUnniivveerrssiittyy ooff PPrreettoorriiaa

160
of viable, injured, and deadBifidobacterium cells during bile salt stress‟, Applied and
Environmental Microbiology, vol. 68, pp. 5209-5216.
Berney, M, Hammes, F, Bosshard, F, Weilenmann, H-U & Egli, T 2007, „Assessment and
interpretation of bacterila viability by using the LIVE/DEAD BacLight kit in combination
with flow cytometry‟, Applied and Environmental Microbiology, vol. 73, no. 10, pp. 3283-
3290.
Bunthof, C.J & Abee, T 2002, „Development of a flow cytometric method to analyze
subpopulations of bacteria in probiotic products and dairy starters‟, Applied and
Environmetal Microbiology, vol. 68, no. 6, pp. 2934-2942.
Bunthof, C.J., Bloemen, K, Breeuwer, P, Rombouts, F.M & Abee, T 2001a, „Flow cytometric
assessment of viability of lactic acid bacteria‟, Applied and Environmental Microbiology, vol.
67, no. 5, pp. 2326-2335.
Bunthof, C.J., van Schalkwijk, S, Meijer, W, Abee, T & Hugenholtz, J (2001b), „Fluorescent
method for monitoring cheese starter permeabilization and lysis‟, Applied and Environmental
Microbiology, vol. 67, no. 9, pp. 4264-4271.
Cánovas, M, García, V, Bernal, V, Torroglosa, T & Iborra, J.L 2007, „Analysis of
Escherichia coli cell state by flow cytometry during whole cell catalyzed biotransformation
for L-carnitine production‟, Process Biochemistry, vol. 42, pp. 25-33.
Da Silva, T.L., Reis, A, Kent, C.A., Kosseva, M, Roseiro, J.C & Hewitt, C.J 2005, „Stress-
induced physiological responses to starvation periods as well as glucose and lactose pulses in
Bacillus licheniformis CCMI 1034 continuous aerobic fermentation processes as measured by
multi-parameter flow cytometry‟, Biochemical Engineering Journal, vol. 24, pp. 31-41.
David, F, Hebeisen, M, Schade, G, Franco-Lara, E & Di Berardino, M 2011, „Viability and
membrane potential analysis of Bacillus megaterium by impedance flow cytometry‟,
Biotechnology and Bioengineering, vol. 109, no. 2, pp. 483-492.
Deresse, D 2010, „Antibacterial effect of garlic (Allium sativum) on Staphylococcus aureus:
An in vitro study‟, Asian Journal of Medical Sciences, vol. 2, no. 2, pp. 62-65.
©© UUnniivveerrssiittyy ooff PPrreettoorriiaa

161
Focke, M, Feld, A & Lichtenthaler, H.K 1990, „Allicin, a naturally occurring antibiotic from
garlic, specifically inhibits acetyl-CoA synthetase‟, Federation of European Biochemical
Societies, vol. 261, no. 1, pp. 106-108.
Hayouni, E.A., Bouix, M, Abedrabba, M, Leveau, J-Y & Hamdi, M 2008, „Mechanism of
action of Melaleuca armillaris (Sol. Ex Gaertu) Sm. essential oil on six LAB strains as
assessed by multiparametric flow cytometry and automated microtiter-based assay‟, Food
Chemistry, vol. 111, pp. 707-718.
Hewitt, C.J., Caron, G.N-V., Nienow, A.W & McFarlane, C.M 1999, „The use of multi-
parameter flow cytometry to compare the physiological response of Escherichia coli W3110
to glucose limitation during batch, fed-batch and continuous culture cultivations‟ Journal of
Biotechnology, vol. 75, pp. 251-264.
Kim, J.E., Choi, N.H & Kang, S.C 2007, „Anti-listerial properties of garlic shoot juice at
growth and morphology of Listeria monocytogenes‟, Food Control, vol. 18, pp. 1198-1203.
Lahtinen, S.J., Ouwehand, A.C., Reinikainen, J.P., Korpela, J.M., Sandholm, J &Salminen,
S.J 2006, „Intrinsic properties of so-called dormant probiotic bacteria, determined by flow
cytometric viability analysis‟, Applied and Environmental Microbiology, vol. 72, no. 7, pp.
5132-5134.
Lu, X, Rasco, B.A., Jabal, J.M.F., Aston, D.E., Lin, M & Konkel, M.E 2011, „Investigating
antibacterial effects of garlic (Allium sativum) concentrate and garlic-derived organosulfur
compounds on Campylobacter jejuni by using fourier transform infrared spectroscopy, raman
spectroscopy, and electron microscopy‟, Applied and Environmental Microbiology, vol. 77,
no. 15, pp. 5257-5269.
Martínez-Abad, A, Sánchez, G, Lagaron, J.M & Ocio, M.J 2012, „On the different growth
conditions affecting silver antimicrobial efficacy on Listeria monocytogenes and Salmonella
enterica‟, International Journal of Food Microbiology, vol. 158, pp. 147-154.
Miron, T, Rabinkov, A, Mirelman, D, Wilchek, M & Weiner, L 2000, „The mode of action of
allicin: its ready permeable through phospholipid membranes may contribute to its biological
activity‟, Biochimica et Biophysica Acta, vol. 1463, pp. 20-30
©© UUnniivveerrssiittyy ooff PPrreettoorriiaa

162
Nebe-von-Caron, G, Stephens, P.J., Hewitt, C.J., Powell, J.R & Badley, R.A 2000, „Analysis
of bacterial function by multi-colour fluorescence flow cytometry and single cell sorting‟,
Journal of Microbiological Methods, vol. 42, pp. 97-114.
Nikiyan, H, Vasilchenko, A & Deryabin, D 2010, „AFM investigations of various disturbing
factors on bacterial cells‟, Microscopy: Science, Technology, Applications & Education, vol.
3, pp. 515-522.
Novik, G.I., Astapovich, N.I & Samartsev, A.A 2001, „Investigation of the physiological and
biochemical characteristics of bifidobacteria at the late stages of their development‟,
Microbiology, vol. 70, no. 4, pp. 429-435.
Paparella, A, Taccogna, L, Aguzzi, I, Chaves-López, C, Serio, A, Marsilio, F & Suzzi, G
2008, „Flow cytometric assessment of the antimicrobial activity of essential oils against
Listeria monocytogenes‟ Food Control, vol. 19, pp. 1174-1182.
Rault, A, Béal, C, Ghorbal, S, Ogier, J-C & Bouix, M 2007, „Multiparametric flow cytometry
allows rapid assessment and comparison of lactic acid bacteria viability after freezing and
during frozen storage‟, Cryobiology, vol. 55, pp. 35-43.
Schenk, M, Raffellini, S, Guerrero, S, Guillermo, A.B & Maris Alzamora, S 2011,
„Inactivation of Escherichia coli, Listeria innocua and Saccharomyces cerevisiae by UV-C
light: Study of cell injury by flow cytometry‟, Food Science and Technology, vol. 44, pp.
191-198.
Shen, T, Bos, A.P & Brul, S 2009, „Assessing freeze-thaw and high pressure low temperature
induced damage to Bacillus subtilis cells with flow cytometry‟, Innovative Food Science and
Emerging Technologies, vol. 10, pp. 9-15.
Young, K. D 2007, „Bacterial morphology: Why have different shapes?‟, Current Opinion in
Microbiology, vol. 10, no. 6, pp. 596-600.
Volkert, M, Ananta, E, Luscher, C & Knorr, D 2008, „Effect of air freezing, spray freezing,
and pressure shift freezing on membrane integrity and viability of Lactobacillus rhamnosus
GG‟ Journal of Food Engineering, vol. 87, pp. 532-54.
©© UUnniivveerrssiittyy ooff PPrreettoorriiaa

163
CHAPTER 6
General conclusions and recommendations
©© UUnniivveerrssiittyy ooff PPrreettoorriiaa

164
General conclusions
Garlic has an antibacterial activity on bifidobacteria, with garlic clove extract having
the highest activity, followed by garlic powder, garlic spice and garlic paste. Garlic
paste only inhibited B. bifidum LMG 11041 and B. longum Bb 536.
All Bifidobacterium strains tested were inhibited at different extents with the B.
bifidum strain being most susceptible, followed by B. longum and B. lactis strains.
Susceptibility to garlic differed between Bifidobacterium spp. and among strains of
the same spp. All the Bifidobacterium spp. tested were more susceptible to garlic than
L. acidophilus La14 150B.
The probiotic bifidobacteria succumb to antibacterial effects of garlic within a
relatively short period. It takes only 30 min of exposure to garlic clove extract to
decrease viability of B. bifidum LMG 11041 and at least 1 h for viability of all other
tested Bifidobacterium strains to start decreasing.
Minimum inhibitory concentration (MIC) values for garlic were lower for most
bifidobacterial strains compared to the control Lactobacillus strain, indicating that the
bifidobacterial strains were more sensitive to the garlic preparations than L.
acidophilus.
Garlic promotes unusual morphological as well as behavioural changes in probiotic
Bifidobacterium spp. with garlic clove and garlic paste showing the most evident
changes.
Exposure to garlic causes an increase in highly distorted cells, elongated and swollen
cells with bulbous ends and cocci-shaped cells as well as pore formation, cell lysis
and an increase in the presence of debris in the area surrounding the treated
Bifidobacterium cells.
Fourier-transform infrared (FT-IR) spectroscopy showed a much clearer picture for
the damaging effects of garlic happening inside the celland it clearly differentiated
between non-treated and garlic-treated Bifidobacterium cells. Biochemical changes
©© UUnniivveerrssiittyy ooff PPrreettoorriiaa

165
took place inside garlic-treated cells and spectral variations were evident in regions
associated with fatty acids and phospholipids in the cell membrane, secondary
structure proteins and nucleic acids.
The main targets for garlic clove extract appeared to be the nucleic acids (DNA and
RNA) and the fatty acids (lipids) in the cell membrane. Therefore, these changes to
the surface properties may possibly prevent probiotic Bifidobacterium strains from
colonizing the intestinal mucosa and thereby decrease their viability as well as
beneficial effect, which would disadvantage both the consumers as well as jeopardize
the probiotic industry.
Flow cytometric results revealed a decrease in viable cells and an increase of 8-10%
in damaged cells after exposure to garlic for all three Bifidobacterium spp.
Fluorescent dyes (PI) confirmed that the membrane integrity of the cells were
compromised in the presence of garlic proving that the cell membrane of
bifidobacteria is indeed a main target site for garlic. Flow cytometry also confirmed
that garlic-damaged cells changed in terms of size and shape.
Garlic-damaged cells were able to recover and return to their physiologically active
state and were also able to assume their original shape and size, indicating that garlic
damage is temporary once cells areexposed to a fresh medium in the absence of
garlic.
Recommendations and future work
It would be necessary to determine the effect that food processing and different food
matrices could have on the antibidobacterial activity of garlic.
Another important study would be to simulate gastrointestinal tract conditions when
exposing bifidobacteria to garlic as this would give a much more representative
depiction of how the two will interact. It will also be used to determine how long the
active compounds in garlic remain stable under these conditions.
©© UUnniivveerrssiittyy ooff PPrreettoorriiaa
166
Physiological changes taking place inside bifidobacteria once exposed to garlic can
also be determined.
Transmission electron microscopy should be considered to confirm possible cell lysis
as well as loss of nucleic acid and other cytoplasmic contents resulting from garlic
exposure.
Further studies could be done using Raman spectroscopy to study spectral changes in
the sulfur region (500-700cm-1
) which would indicate effect on protein structures.
Cell sorting, which will allow selective harvesting and culturing of only damaged
cells from flow cytometry, is necessary to confirm the actual recovery and resumption
of growth by garlic-damaged bifidobacteria. Re-inoculation results reported in this
study were obtained from culturing of all cells including those that were still viable
and therefore are not a very good indication of this phenomenon.
Microencapsulation is currently the main strategy used to improve or protect viability
of probiotic cultures. It would be worthwhile to investigate the ability of the coating
matrices to limit or prevent contact between encapsulated probiotics and garlic.
©© UUnniivveerrssiittyy ooff PPrreettoorriiaa

167
APPENDIX
Fluorescent
dye
Mean (%) (Standard derivative) of triplicate experiments
B. bifidum LMG 11041 B. longum LMG 13197 B. lactis Bb12 L. acidophilus La14 150B
Q1 Q2 Q3 Q4 Q1 Q2 Q3 Q4 Q1 Q2 Q3 Q4 Q1 Q2 Q3 Q4
Syto9 98.7
(0.4)
0.74
(0.64)
0
(0)
0.57
(0.31)
99.2
(0.22)
0.37
(0.37)
0
(0)
0.19
(0.09)
99.63
(0.09)
0.27
(0.04)
0
(0)
0.1
(0.05)
99.75
(0.15)
0.7
(0.04)
0
(0)
0.17
(0.15)
PI 0.06
(0.04)
0.02
(0)
99.03
(0.46)
0.86
(0.86)
0.16
(0.12)
0.11
(0.07)
99.17
(0.54)
0.61
(0.42)
0.04
(0.03)
0.06
(0.03)
98.37
(0.78)
1.55
(0.8)
0.11
(0.09)
5.42
(5)
94.2
(4.7)
0.27
(0.21)
Unstained 0
(0)
0
(0)
0
(0)
100
(0)
0.04
(0.05)
0.01
(0)
0
(0)
99.99
(0.05)
0.11
(0.13)
0
(0)
0
(0)
99.9
(0.14)
8.26
(7.35)
0.04
(0.02)
0.01
(0.01)
91.85
(7.25)
Amp mix
(Syto9 + PI)
31.62
(28.21)
50.53
(20.9)
17.51
(21.22)
0.38
(0.05)
20.21
(19.47)
51.59
(32.05)
14.6
(10.82)
13.64
(18.85)
22.49
(22.12)
34.65
(8.05)
41.5
(30.3)
1.34
(0.16)
24.43
(24.18)
24.51
(19.5)
50.45
(43.46)
0.61
(0.2)
GC mix
(Syto9 + PI)
79.37
(5.26)
9.32
(2.45)
0.34
(0.37)
11.01
(7.09)
81.8
(7.31)
12.87
(8.13)
0.27
(0.25)
5.04
(3.49)
68.97
(3.74)
7.76
(0.4)
0.47
(0.26)
22.83
(3.89)
98
(1.2)
1.86
(1.33)
0.02
(0.01)
0.15
(0.14)
Mean values and standard derivative values for flow cytometric analysis data of triplicate experiments.
©© UUnniivveerrssiittyy ooff PPrreettoorriiaa