Anti-Endo Parasitic Effects of Garlic (Allium sativum) as ...
98
Anti-Endo Parasitic Effects of Garlic (Allium sativum) as Supplement in the Diets of Rabbits Reared under Deep Litter System Bello, K.O. 1* ; Akanji, A.O. 2 ; Irekhore, O.T. 3 and Lala, A.O. 1 1 Institute of Food Security, Environmental Resources and Agricultural Research, Federal University of Agriculture, Abeokuta, Nigeria. 2 Department of Animal Production and Health, Federal University of Agriculture, Abeokuta, Nigeria. 3 Agricultural Medial Resources and Extension Centre, Federal University of Agriculture, Abeokuta, Nigeria. *Corresponding author: Email: [email protected] ABSTRACT This study was carried out to determine anti-endo parasitic effects of garlic (Allium sativum) in the diets of male (buck) and female (doe) weaner rabbits reared under deep litter system. Twenty-four cross bred weaner (8 weeks old) rabbits comprising twelve each of bucks and does were randomly allocated according to sex and feed supplement (conventional anticoccidia drug and garlic) in a 2x2 factorial arrangement. Data were collected on growth performance, faecal microbial population and carcass yield and analysed using ANOVA. Result showed that neither sex nor feed supplement had significant (P>0.05) effect on the growth performance of weaner rabbits. Coccidial load was progressively and completely eliminated in bucks and does from the baseline population of 1680epg and 600epg, respectively with rabbits fed diet supplemented with garlic. Also, does fed diet supplemented with commercial coccidiostat had complete coccidial load elimination from 5200epg at 8th week to the 16th week. Helminthic load (3800epg) recorded with bucks fed diet supplemented with garlic at the beginning of study were totally eliminated at the end of the study (56d). Helminthic load reduced from 6450epg at base line (0 week) to 950epg in the 4th week and was totally eliminated at 56d with bucks fed diet supplemented with the commercial coccidiostat. From the finding of this study, it could be concluded that sex, garlic or conventional anti-coccidiostat had no effect on growth performance and carcass yield of rabbits. However, garlic could be used as natural additive in rabbit production without adverse effects on growth and carcass yield where effective preventive measure for helminth and coccidiosis is paramount in deep litter housing type. Keywords: coccidiosis; commercial coccidiostat; garlic; helminth,; rabbit INTRODUCTION Rabbits, beside their use as laboratory animals are equally reared for a variety of commercial purposes: for their meat and fur (wool). Rabbit meat production among other products has developed into an important industry that attracts high economic returns to the rabbit farmers (Samkol and Lukefahr, 2008; Fanatico and Green, 2012). Often times, the returns are affected by the outbreak of various diseases such as coccidiosis and helminths. Coccidiosis is mainly observed in animals that are managed under intensive production system (Amy, 2005). Coccidiosis is caused by Eimeria spp, and it results in tremendous economic losses in poultry industry worldwide. Currently, it is an emerging disease of increasing economic importance in commercial rabbit production (Licious et al., 1992; Kustos et al., 2003; Szendro et al., 2009). Healthy rabbits often may be carriers of the organism (Eimeria) causing coccidiosis, but show no symptoms of the disease. The severity of the disease depends on the number of oocysts ingested by the rabbit. The entrance of Eimeria spores into the intestinal and liver cells of young rabbit scauses cells to malfunction and expand in size. Erosion and ulceration occur in the epithelial lining of the intestine, which result in poor absorption of nutrients, electrolyte imbalance, anemia and dehydration of the cells. Consequently, reduced appetite, depression, abdominal pain, retarded growth, diarrhea and pale mucous membranes ensue. Feaces may contain blood or mucous particularly in young rabbit (Amy, 2005). Similarly, helminths or worms are common parasites in the digestive tract of livestock including poultry and rabbit and result in high economic loss or marginal profit (Besier et al., 2003). Studies have shown that the continuous and indiscriminate use of drugs have caused a growing problem of parasite resistance to conventional commercial treatments (Devendra et al., 2006). However, plant essential oils (and/or active components) can be used as alternatives to conventional commercial anti-hel¬minth and anti-coccidial drugs. Garlic has been used to treat animals that suffer from gastrointestinal parasitism (Guarrera, 1999). There are numerous reports
-
Upload
khangminh22 -
Category
Documents
-
view
0 -
download
0
Transcript of Anti-Endo Parasitic Effects of Garlic (Allium sativum) as ...
Anti-Endo Parasitic Effects of Garlic (Allium sativum) as Supplement in the Diets of Rabbits
Reared under Deep Litter System
Bello, K.O.1*; Akanji, A.O.2; Irekhore, O.T.3 and Lala, A.O.1
1Institute of Food Security, Environmental Resources and Agricultural Research, Federal University of Agriculture,
Abeokuta, Nigeria. 2Department of Animal Production and Health, Federal University of Agriculture, Abeokuta, Nigeria. 3Agricultural Medial Resources and Extension Centre, Federal University of Agriculture, Abeokuta, Nigeria.
*Corresponding author: Email: [email protected]
ABSTRACT
This study was carried out to determine anti-endo parasitic effects of garlic (Allium sativum) in the diets of male (buck) and
female (doe) weaner rabbits reared under deep litter system. Twenty-four cross bred weaner (8 weeks old) rabbits
comprising twelve each of bucks and does were randomly allocated according to sex and feed supplement (conventional
anticoccidia drug and garlic) in a 2x2 factorial arrangement. Data were collected on growth performance, faecal
microbial population and carcass yield and analysed using ANOVA. Result showed that neither sex nor feed supplement
had significant (P>0.05) effect on the growth performance of weaner rabbits. Coccidial load was progressively and
completely eliminated in bucks and does from the baseline population of 1680epg and 600epg, respectively with rabbits fed
diet supplemented with garlic. Also, does fed diet supplemented with commercial coccidiostat had complete coccidial load
elimination from 5200epg at 8th week to the 16th week. Helminthic load (3800epg) recorded with bucks fed diet
supplemented with garlic at the beginning of study were totally eliminated at the end of the study (56d). Helminthic load
reduced from 6450epg at base line (0 week) to 950epg in the 4th week and was totally eliminated at 56d with bucks fed diet
supplemented with the commercial coccidiostat. From the finding of this study, it could be concluded that sex, garlic or
conventional anti-coccidiostat had no effect on growth performance and carcass yield of rabbits. However, garlic could be
used as natural additive in rabbit production without adverse effects on growth and carcass yield where effective
preventive measure for helminth and coccidiosis is paramount in deep litter housing type.
Keywords: coccidiosis; commercial coccidiostat; garlic; helminth,; rabbit
INTRODUCTION
Rabbits, beside their use as laboratory animals are equally reared for a variety of commercial purposes: for their meat and
fur (wool). Rabbit meat production among other products has developed into an important industry that attracts high
economic returns to the rabbit farmers (Samkol and Lukefahr, 2008; Fanatico and Green, 2012). Often times, the returns are
affected by the outbreak of various diseases such as coccidiosis and helminths. Coccidiosis is mainly observed in animals
that are managed under intensive production system (Amy, 2005). Coccidiosis is caused by Eimeria spp, and it results in
tremendous economic losses in poultry industry worldwide. Currently, it is an emerging disease of increasing economic
importance in commercial rabbit production (Licious et al., 1992; Kustos et al., 2003; Szendro et al., 2009).
Healthy rabbits often may be carriers of the organism (Eimeria) causing coccidiosis, but show no symptoms of the disease.
The severity of the disease depends on the number of oocysts ingested by the rabbit. The entrance of Eimeria spores into
the intestinal and liver cells of young rabbit scauses cells to malfunction and expand in size. Erosion and ulceration occur in
the epithelial lining of the intestine, which result in poor absorption of nutrients, electrolyte imbalance, anemia and
dehydration of the cells. Consequently, reduced appetite, depression, abdominal pain, retarded growth, diarrhea and pale
mucous membranes ensue. Feaces may contain blood or mucous particularly in young rabbit (Amy, 2005). Similarly,
helminths or worms are common parasites in the digestive tract of livestock including poultry and rabbit and result in high
economic loss or marginal profit (Besier et al., 2003).
Studies have shown that the continuous and indiscriminate use of drugs have caused a growing problem of parasite
resistance to conventional commercial treatments (Devendra et al., 2006). However, plant essential oils (and/or active
components) can be used as alternatives to conventional commercial anti-hel¬minth and anti-coccidial drugs. Garlic has
been used to treat animals that suffer from gastrointestinal parasitism (Guarrera, 1999). There are numerous reports
indicating the efficacy of garlic in the prevention and treatment of a variety of diseases and for validating its traditional
uses. For instance, garlic has been described to exhibit antimicrobial activity (Chowdhury et al., 1991; Yoshida et al., 1998;
Fleischauer et al., 2000), antitumor activity (Sundaram and Milner, 1996; Karasaki et al., 2001), as well as antithrombotic,
antiarthritic, hypolipidemic, and hypoglycemic activities (Duraka et al., 2002; Kumar et al., 2003). Moreover, garlic has
been reported to be effective against diverse parasites such as Amoeba (Peyghan et al., 2008). However, there is dearth of
information on use of garlic supplement in the prevention and control of coccidiosis and worms in male and female weaner
rabbits. This is therefore the focus of this study.
MATERIALS AND METHODS
Study location
The study was carried out at the Rabbit Unit of the Directorate of University Farms (DUFARMS), Federal University of
Agriculture Abeokuta, Ogun state, Nigeria. The site is located in the rain forest vegetation zone of south-western Nigeria on
latitude7˚ 13ʼ 49.46ˮ N, longitude 3˚ 26ʼ 11.98ˮ E and at an altitude of 76m above sea level. The climate is humid with a
mean annual rainfall of 1037mm and mean temperature and humidity of 27˚C and 83%, respectively (Obot et al., 2011).
This housing was a typical movable, raised floor deep litter type. It has a dwarf wall with the sides covered with chicken
net. The size was 1.2m x 3m x 1.7m in breadth, length and height respectively. The experimental pen was divided into 12
cells. It had individual internal cell dimension of 45cm x 60cm that ran both the length of the cage to the left and to the
right sides to accommodate 24 rabbits comprising of 12 males (Bucks) and 12 females (Does) at 2 animals per cell; 2
Bucks, 2 females Does, respectively.
Animal Treatment
Twenty-four 8 weeks old cross-bred rabbits comprising 12 bucks and 12 does were used for the study. The animals’ weight
ranged between 621.67g and 939.00g. They were divided into four treatment groups according to their sexes and anti-endo
parasite feed additives and balanced for weight. Treatment 1 (male rabbits fed with commercial coccidiostat); treatment 2
(male rabbits fed with garlic supplement); treatment 3 (female rabbits fed with commercial anticocciodia preparation); and
treatment 4 (female rabbits fed with garlic supplement). There were 6 replicates in all and each animal served as replicate.
The rabbits were sourced from a reputable farm within Abeokuta metropolis. The hutch was washed and disinfected and
wood shavings were spread as bedding materials. The animals were fed with grower diet that contain crude protein of 18%
and Metabolizable Energy (ME) of 11.0MJ/KG and water ad-libitum.
Provide appropriate headings for the methodologies
Rabbits on garlic supplement were fed with grower diet that contained 1.25g of garlic per kilogram of the animal diet (Ari
et al., 2012). The treatment groups on convectional anticoccidia diets were administered according to manufacturer
recommendation (0.6g per kilogramme feed).
Feacal samples were collected from each animal per treatment and replicate. The samples were collected through the
rectum using swab stick. The swab stick was inserted into the rectum and rolled round the internal lining of the rectum to
gather sample. The clogged was thereafter transferred into the sterile casing for analysis in the laboratory. Samples were
collected at the beginning (base line) of the study, mid-stream (4th week = 28d) and at the end (8th week = 56d) of the
study.
At the 56th day, 6 bucks and 6 does comprising 50% of the population were sacrificed for carcass evaluation. The live
weight of the animal per treatment was taken before slaughtering. The animals were slaughtered through neck decapitation.
The fur was removed by singeing, washed and eviscerated. The eviscerated weight was taken and then hot carcass was
stored in a refrigerator at about 0˚C - 4˚C for 24hrs. Carcass was prepared according to the norms of the World Rabbit
Science Association (Blasco and Ouhayoun, 1996). Then the cooled carcass was weighed and expressed in percentage
relative to live weight as described by Lukefahr et al., (1982). Record of cut parts (fore-limbs, hind limbs, loin, head),
organs (heart, liver, kidney, lungs) was taken.
Statistical analysis
Data generated were subjected to analysis of variance (ANOVA) in 2x2 factorial (randomized complete block design) using
SAS (2000). Significant mean at 5% was separated using Duncan's multiple range test (Duncan 1955) as contained in SAS.
RESULTS AND DISCUSSION
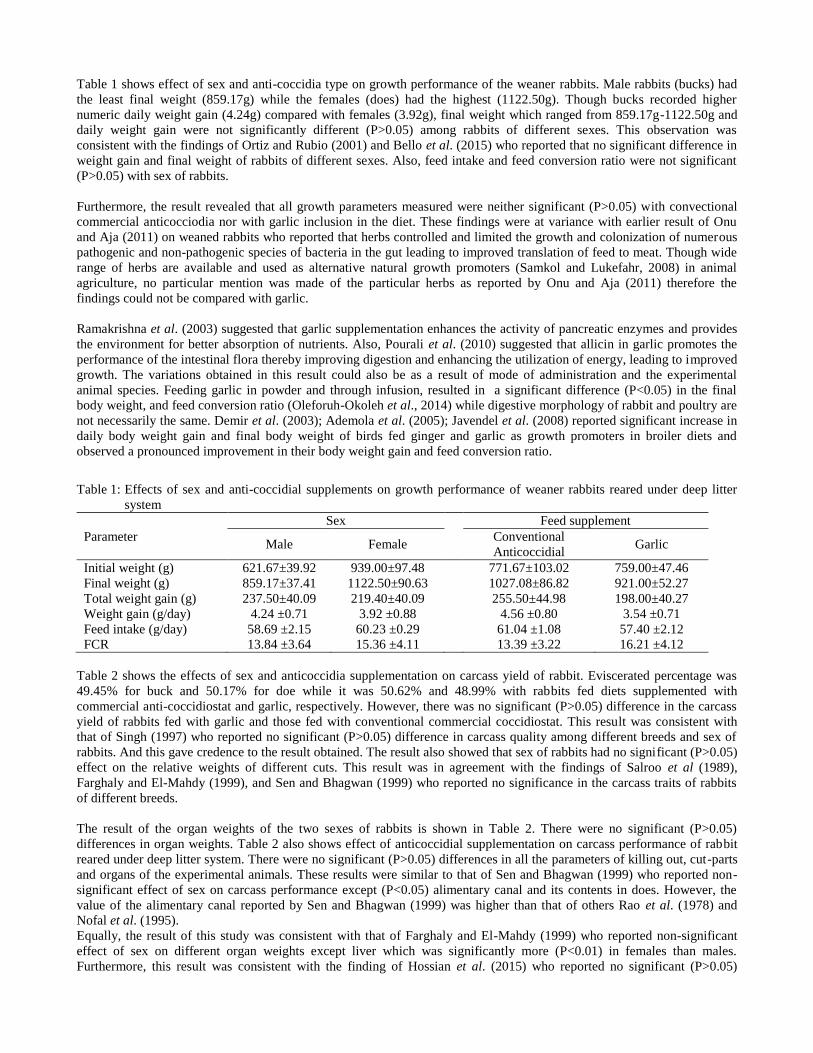
Table 1 shows effect of sex and anti-coccidia type on growth performance of the weaner rabbits. Male rabbits (bucks) had
the least final weight (859.17g) while the females (does) had the highest (1122.50g). Though bucks recorded higher
numeric daily weight gain (4.24g) compared with females (3.92g), final weight which ranged from 859.17g-1122.50g and
daily weight gain were not significantly different (P>0.05) among rabbits of different sexes. This observation was
consistent with the findings of Ortiz and Rubio (2001) and Bello et al. (2015) who reported that no significant difference in
weight gain and final weight of rabbits of different sexes. Also, feed intake and feed conversion ratio were not significant
(P>0.05) with sex of rabbits.
Furthermore, the result revealed that all growth parameters measured were neither significant (P>0.05) with convectional
commercial anticocciodia nor with garlic inclusion in the diet. These findings were at variance with earlier result of Onu
and Aja (2011) on weaned rabbits who reported that herbs controlled and limited the growth and colonization of numerous
pathogenic and non-pathogenic species of bacteria in the gut leading to improved translation of feed to meat. Though wide
range of herbs are available and used as alternative natural growth promoters (Samkol and Lukefahr, 2008) in animal
agriculture, no particular mention was made of the particular herbs as reported by Onu and Aja (2011) therefore the
findings could not be compared with garlic.
Ramakrishna et al. (2003) suggested that garlic supplementation enhances the activity of pancreatic enzymes and provides
the environment for better absorption of nutrients. Also, Pourali et al. (2010) suggested that allicin in garlic promotes the
performance of the intestinal flora thereby improving digestion and enhancing the utilization of energy, leading to improved
growth. The variations obtained in this result could also be as a result of mode of administration and the experimental
animal species. Feeding garlic in powder and through infusion, resulted in a significant difference (P<0.05) in the final
body weight, and feed conversion ratio (Oleforuh-Okoleh et al., 2014) while digestive morphology of rabbit and poultry are
not necessarily the same. Demir et al. (2003); Ademola et al. (2005); Javendel et al. (2008) reported significant increase in
daily body weight gain and final body weight of birds fed ginger and garlic as growth promoters in broiler diets and
observed a pronounced improvement in their body weight gain and feed conversion ratio.
Table 1: Effects of sex and anti-coccidial supplements on growth performance of weaner rabbits reared under deep litter
system
Table 2 shows the effects of sex and anticoccidia supplementation on carcass yield of rabbit. Eviscerated percentage was
49.45% for buck and 50.17% for doe while it was 50.62% and 48.99% with rabbits fed diets supplemented with
commercial anti-coccidiostat and garlic, respectively. However, there was no significant (P>0.05) difference in the carcass
yield of rabbits fed with garlic and those fed with conventional commercial coccidiostat. This result was consistent with
that of Singh (1997) who reported no significant (P>0.05) difference in carcass quality among different breeds and sex of
rabbits. And this gave credence to the result obtained. The result also showed that sex of rabbits had no significant (P>0.05)
effect on the relative weights of different cuts. This result was in agreement with the findings of Salroo et al (1989),
Farghaly and El-Mahdy (1999), and Sen and Bhagwan (1999) who reported no significance in the carcass traits of rabbits
of different breeds.
The result of the organ weights of the two sexes of rabbits is shown in Table 2. There were no significant (P>0.05)
differences in organ weights. Table 2 also shows effect of anticoccidial supplementation on carcass performance of rabbit
reared under deep litter system. There were no significant (P>0.05) differences in all the parameters of killing out, cut-parts
and organs of the experimental animals. These results were similar to that of Sen and Bhagwan (1999) who reported non-
significant effect of sex on carcass performance except (P<0.05) alimentary canal and its contents in does. However, the
value of the alimentary canal reported by Sen and Bhagwan (1999) was higher than that of others Rao et al. (1978) and
Nofal et al. (1995).
Equally, the result of this study was consistent with that of Farghaly and El-Mahdy (1999) who reported non-significant
effect of sex on different organ weights except liver which was significantly more (P<0.01) in females than males.
Furthermore, this result was consistent with the finding of Hossian et al. (2015) who reported no significant (P>0.05)
Sex Feed supplement
Parameter Male Female
Conventional
Anticoccidial Garlic
Initial weight (g) 621.67±39.92 939.00±97.48 771.67±103.02 759.00±47.46
Final weight (g) 859.17±37.41 1122.50±90.63 1027.08±86.82 921.00±52.27
Total weight gain (g) 237.50±40.09 219.40±40.09 255.50±44.98 198.00±40.27
Weight gain (g/day) 4.24 ±0.71 3.92 ±0.88 4.56 ±0.80 3.54 ±0.71
Feed intake (g/day) 58.69 ±2.15 60.23 ±0.29 61.04 ±1.08 57.40 ±2.12
FCR 13.84 ±3.64 15.36 ±4.11 13.39 ±3.22 16.21 ±4.12
differences in the carcass weight and dressing percentage among the rabbit groups treated with either 0%, 0.25% and 0.5%
mixture of garlic powder.
Table 2: Effects of sex and anticoccidial supplementation on carcass Performance of weaner rabbits reared under deep litter
system
Parameter
Sex Anti-endo parasite feed supplement
Male Female Commercial
Drug Garlic
Killing out
Live weight(g) 1652.08±228.05 1598.50±169.74
1724.08±134.32 1526.50±243.22
Bled weight (%) 72.45±3.26 76.38±1.68
72.08±2.01 76.75±2.95
Plucked (%) 69.10±2.53 70.17±1.45
69.33±1.20 69.95±2.67
Eviscerated weight (%) 49.45±1.06 50.17±0.40
50.62±0.16 48.99±1.02
Cut-Part (%)
Head 7.29±0.52 7.48±0.28
7.32±0.25 7.45±0.53
Fore limb 6.97±0.31 7.22±0.16
7.29±0.26 6.89±0.19
Hind limb 10.99±0.52 10.93±0.40
11.24±0.52 10.69±0.37
Loin 5.10±0.31 5.53±0.39
5.27±0.41 5.37±0.32
Organ (%)
Liver 1.94±0.14 2.25±0.20
2.13±0.23 2.07±0.12
Heart 0.18±0.01 0.17±0.01
0.18±0.00 0.18±0.01
Kidney 0.43±0.02 0.48±0.04
0.48±0.04 0.43±0.03
Lungs 0.49±0.08 0.45±0.05 0.44±0.05 0.50±0.07
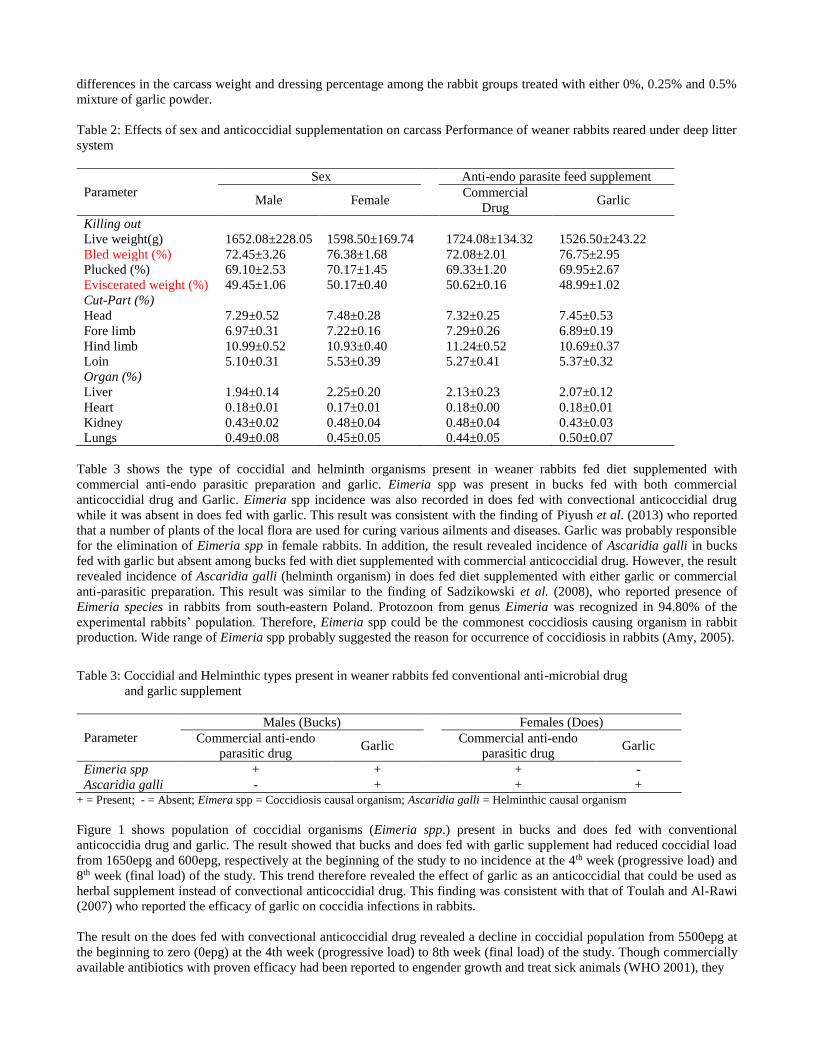
Table 3 shows the type of coccidial and helminth organisms present in weaner rabbits fed diet supplemented with
commercial anti-endo parasitic preparation and garlic. Eimeria spp was present in bucks fed with both commercial
anticoccidial drug and Garlic. Eimeria spp incidence was also recorded in does fed with convectional anticoccidial drug
while it was absent in does fed with garlic. This result was consistent with the finding of Piyush et al. (2013) who reported
that a number of plants of the local flora are used for curing various ailments and diseases. Garlic was probably responsible
for the elimination of Eimeria spp in female rabbits. In addition, the result revealed incidence of Ascaridia galli in bucks
fed with garlic but absent among bucks fed with diet supplemented with commercial anticoccidial drug. However, the result
revealed incidence of Ascaridia galli (helminth organism) in does fed diet supplemented with either garlic or commercial
anti-parasitic preparation. This result was similar to the finding of Sadzikowski et al. (2008), who reported presence of
Eimeria species in rabbits from south-eastern Poland. Protozoon from genus Eimeria was recognized in 94.80% of the
experimental rabbits’ population. Therefore, Eimeria spp could be the commonest coccidiosis causing organism in rabbit
production. Wide range of Eimeria spp probably suggested the reason for occurrence of coccidiosis in rabbits (Amy, 2005).
Table 3: Coccidial and Helminthic types present in weaner rabbits fed conventional anti-microbial drug
and garlic supplement
Parameter
Males (Bucks)
Females (Does)
Commercial anti-endo
parasitic drug Garlic
Commercial anti-endo
parasitic drug Garlic
Eimeria spp + +
+ -
Ascaridia galli - + + + + = Present; - = Absent; Eimera spp = Coccidiosis causal organism; Ascaridia galli = Helminthic causal organism
Figure 1 shows population of coccidial organisms (Eimeria spp.) present in bucks and does fed with conventional
anticoccidia drug and garlic. The result showed that bucks and does fed with garlic supplement had reduced coccidial load
from 1650epg and 600epg, respectively at the beginning of the study to no incidence at the 4th week (progressive load) and
8th week (final load) of the study. This trend therefore revealed the effect of garlic as an anticoccidial that could be used as
herbal supplement instead of convectional anticoccidial drug. This finding was consistent with that of Toulah and Al-Rawi
(2007) who reported the efficacy of garlic on coccidia infections in rabbits.
The result on the does fed with convectional anticoccidial drug revealed a decline in coccidial population from 5500epg at
the beginning to zero (0epg) at the 4th week (progressive load) to 8th week (final load) of the study. Though commercially
available antibiotics with proven efficacy had been reported to engender growth and treat sick animals (WHO 2001), they
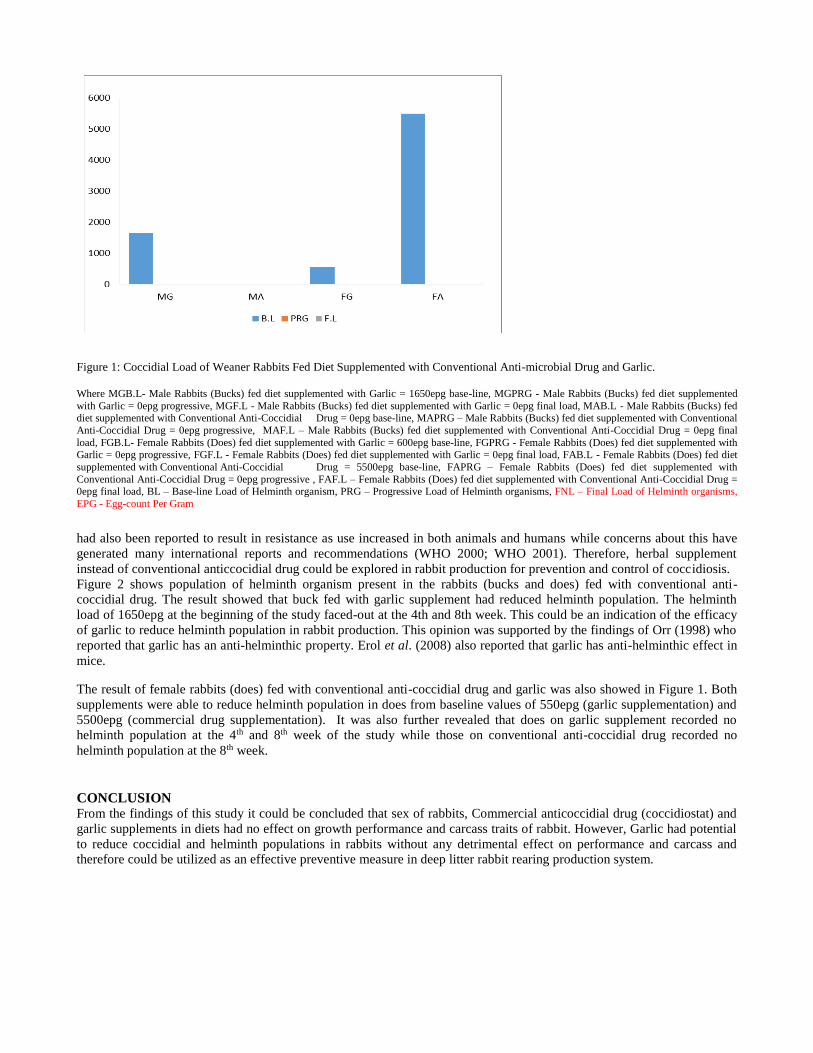
Figure 1: Coccidial Load of Weaner Rabbits Fed Diet Supplemented with Conventional Anti-microbial Drug and Garlic.
Where MGB.L- Male Rabbits (Bucks) fed diet supplemented with Garlic = 1650epg base-line, MGPRG - Male Rabbits (Bucks) fed diet supplemented
with Garlic = 0epg progressive, MGF.L - Male Rabbits (Bucks) fed diet supplemented with Garlic = 0epg final load, MAB.L - Male Rabbits (Bucks) fed diet supplemented with Conventional Anti-Coccidial Drug = 0epg base-line, MAPRG – Male Rabbits (Bucks) fed diet supplemented with Conventional
Anti-Coccidial Drug = 0epg progressive, MAF.L – Male Rabbits (Bucks) fed diet supplemented with Conventional Anti-Coccidial Drug = 0epg final
load, FGB.L- Female Rabbits (Does) fed diet supplemented with Garlic = 600epg base-line, FGPRG - Female Rabbits (Does) fed diet supplemented with Garlic = 0epg progressive, FGF.L - Female Rabbits (Does) fed diet supplemented with Garlic = 0epg final load, FAB.L - Female Rabbits (Does) fed diet
supplemented with Conventional Anti-Coccidial Drug = 5500epg base-line, FAPRG – Female Rabbits (Does) fed diet supplemented with
Conventional Anti-Coccidial Drug = 0epg progressive , FAF.L – Female Rabbits (Does) fed diet supplemented with Conventional Anti-Coccidial Drug = 0epg final load, BL – Base-line Load of Helminth organism, PRG – Progressive Load of Helminth organisms, FNL – Final Load of Helminth organisms,
EPG - Egg-count Per Gram
had also been reported to result in resistance as use increased in both animals and humans while concerns about this have
generated many international reports and recommendations (WHO 2000; WHO 2001). Therefore, herbal supplement
instead of conventional anticcocidial drug could be explored in rabbit production for prevention and control of coccidiosis.
Figure 2 shows population of helminth organism present in the rabbits (bucks and does) fed with conventional anti-
coccidial drug. The result showed that buck fed with garlic supplement had reduced helminth population. The helminth
load of 1650epg at the beginning of the study faced-out at the 4th and 8th week. This could be an indication of the efficacy
of garlic to reduce helminth population in rabbit production. This opinion was supported by the findings of Orr (1998) who
reported that garlic has an anti-helminthic property. Erol et al. (2008) also reported that garlic has anti-helminthic effect in
mice.
The result of female rabbits (does) fed with conventional anti-coccidial drug and garlic was also showed in Figure 1. Both
supplements were able to reduce helminth population in does from baseline values of 550epg (garlic supplementation) and
5500epg (commercial drug supplementation). It was also further revealed that does on garlic supplement recorded no
helminth population at the 4th and 8th week of the study while those on conventional anti-coccidial drug recorded no
helminth population at the 8th week.
CONCLUSION From the findings of this study it could be concluded that sex of rabbits, Commercial anticoccidial drug (coccidiostat) and
garlic supplements in diets had no effect on growth performance and carcass traits of rabbit. However, Garlic had potential
to reduce coccidial and helminth populations in rabbits without any detrimental effect on performance and carcass and
therefore could be utilized as an effective preventive measure in deep litter rabbit rearing production system.
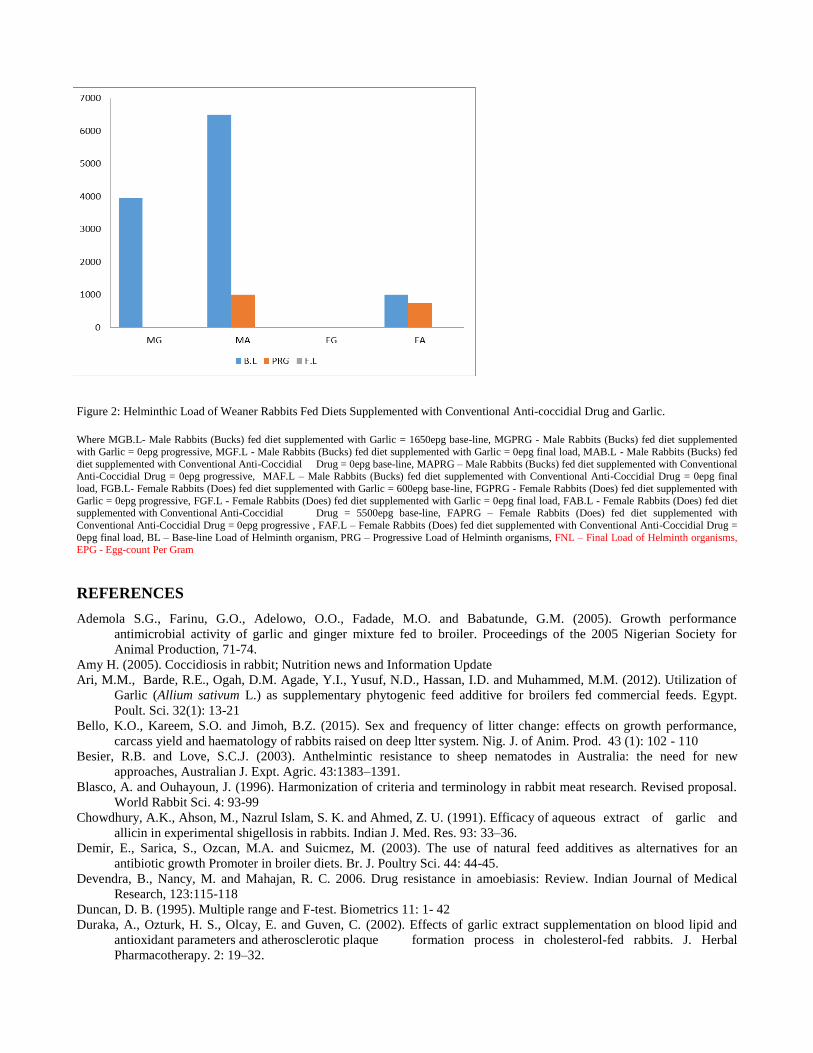
Figure 2: Helminthic Load of Weaner Rabbits Fed Diets Supplemented with Conventional Anti-coccidial Drug and Garlic.
Where MGB.L- Male Rabbits (Bucks) fed diet supplemented with Garlic = 1650epg base-line, MGPRG - Male Rabbits (Bucks) fed diet supplemented
with Garlic = 0epg progressive, MGF.L - Male Rabbits (Bucks) fed diet supplemented with Garlic = 0epg final load, MAB.L - Male Rabbits (Bucks) fed
diet supplemented with Conventional Anti-Coccidial Drug = 0epg base-line, MAPRG – Male Rabbits (Bucks) fed diet supplemented with Conventional Anti-Coccidial Drug = 0epg progressive, MAF.L – Male Rabbits (Bucks) fed diet supplemented with Conventional Anti-Coccidial Drug = 0epg final
load, FGB.L- Female Rabbits (Does) fed diet supplemented with Garlic = 600epg base-line, FGPRG - Female Rabbits (Does) fed diet supplemented with
Garlic = 0epg progressive, FGF.L - Female Rabbits (Does) fed diet supplemented with Garlic = 0epg final load, FAB.L - Female Rabbits (Does) fed diet supplemented with Conventional Anti-Coccidial Drug = 5500epg base-line, FAPRG – Female Rabbits (Does) fed diet supplemented with
Conventional Anti-Coccidial Drug = 0epg progressive , FAF.L – Female Rabbits (Does) fed diet supplemented with Conventional Anti-Coccidial Drug =
0epg final load, BL – Base-line Load of Helminth organism, PRG – Progressive Load of Helminth organisms, FNL – Final Load of Helminth organisms, EPG - Egg-count Per Gram
REFERENCES
Ademola S.G., Farinu, G.O., Adelowo, O.O., Fadade, M.O. and Babatunde, G.M. (2005). Growth performance
antimicrobial activity of garlic and ginger mixture fed to broiler. Proceedings of the 2005 Nigerian Society for
Animal Production, 71-74.
Amy H. (2005). Coccidiosis in rabbit; Nutrition news and Information Update
Ari, M.M., Barde, R.E., Ogah, D.M. Agade, Y.I., Yusuf, N.D., Hassan, I.D. and Muhammed, M.M. (2012). Utilization of
Garlic (Allium sativum L.) as supplementary phytogenic feed additive for broilers fed commercial feeds. Egypt.
Poult. Sci. 32(1): 13-21
Bello, K.O., Kareem, S.O. and Jimoh, B.Z. (2015). Sex and frequency of litter change: effects on growth performance,
carcass yield and haematology of rabbits raised on deep ltter system. Nig. J. of Anim. Prod. 43 (1): 102 - 110
Besier, R.B. and Love, S.C.J. (2003). Anthelmintic resistance to sheep nematodes in Australia: the need for new
approaches, Australian J. Expt. Agric. 43:1383–1391.
Blasco, A. and Ouhayoun, J. (1996). Harmonization of criteria and terminology in rabbit meat research. Revised proposal.
World Rabbit Sci. 4: 93-99
Chowdhury, A.K., Ahson, M., Nazrul Islam, S. K. and Ahmed, Z. U. (1991). Efficacy of aqueous extract of garlic and
allicin in experimental shigellosis in rabbits. Indian J. Med. Res. 93: 33–36.
Demir, E., Sarica, S., Ozcan, M.A. and Suicmez, M. (2003). The use of natural feed additives as alternatives for an
antibiotic growth Promoter in broiler diets. Br. J. Poultry Sci. 44: 44-45.
Devendra, B., Nancy, M. and Mahajan, R. C. 2006. Drug resistance in amoebiasis: Review. Indian Journal of Medical
Research, 123:115-118
Duncan, D. B. (1995). Multiple range and F-test. Biometrics 11: 1- 42
Duraka, A., Ozturk, H. S., Olcay, E. and Guven, C. (2002). Effects of garlic extract supplementation on blood lipid and
antioxidant parameters and atherosclerotic plaque formation process in cholesterol-fed rabbits. J. Herbal
Pharmacotherapy. 2: 19–32.

Fanatico, A. and Green, C. (2012). Small-scale sustainable rabbit production. A project of the National Center for
Appropriate Technology. www.attra.ncat.org.
Farghaly, H. M. and El-Mahdy, M. R. M. (1999). Genetic and non-genetic factors affecting live, carcass and non-carcass
traits of New Zealand White rabbits in Egypt. Indian Journal of Animal Science 69(8): 596-603
Fleischauer, A. T., Poole, C. H. and Arab, L. (2000). Garlic consumption and cancer prevention: meta-analyses of
colorectal and stomach cancers. Am. J. Clin. Nutr. 72: 1047–1052.
Guarrera, P. M. (1999). Traditional anti-helminthic, anti-parasitic, and repellent uses of plants in Central Italy. J.
Ethnopharmacol. 68: 183-192
Hossian, M. J., Kamruzzaman, M., Akbar, M. A. and Haque, M. A. (2015). Feeding garlic powder on growth performance,
nutrient digestibility and carcass characteristics of rabbit. International Journal of Natural and Social Sciences, 2(5):
74-81.
Javendel, F., Blaridshad, B., Seifarati, J., Pourrahimi, A. H. and Baniyaghoub, S. (2008). The favorite dosage of garlic meal
as a feed addictive in broiler chickens ration. Pak. J. Biol. Sci., 11(13): 1746-1749
Karasaki, Y., Tsukamoto, S., Mizusaki, K., Sugiura, T. and Gotoh, S. (2001). A garlic lectin exerted an antitumor activity
and induced apoptosis in human tumor cells. Food Res. Int. 34: 7–13
Kumar, V. G., Surendranathan, K. P., Umesh, K. G., Gayathri Devi, D. R. and Belwadi, M. R. (2003). Effect of onion
(Allium cepa Linn.) and garlic (Allium Sativum Linn.) on plasma triglyceride. Indian Journal of Experimental
Biology, 41(1):88-90
Kustos, K., Tóbiás, G., Kovacs, D., Eiben C. and Szendro Z. 2003. Effect of stocking density, the material of botton
and feeding on performance of growing rabbits in Hungary. In Proceedings of 15th Hungarian Conference on
Rabbit Production, May 2003, Kasposvar, Hungary, 123-128
Licious, D., Coudert, P., Bahagia, S. and Rossi, G. L. (1992). Endogenous development of Eimeria intestinalis in rabbits
(Oryctolagus cuniculus). J. Parasitol. 78: 1041–1048.
Lukefahr, S. D., Hohenboken, W. D., Cheeke, P. R. and Patton, N. M. (1982). Carcass and meat characteristics of Flemish
Giant and New Zealand white pure bred and terminal cross rabbit. J. Anim. Sci., 54(6): 1169-1174
Nofal, R.Y., Toth, S. and Virag, G. Y. (1995). Carcass traits of purebred and crossbred rabbits. World Rabbit Science 3:
167-170
Obot, N. I.; Emberga, T. T. and Ishola, K. S. (2011). 22 Years characterized trends of rainfall in Abeokuta, Nigeria.
Research Journal of Applied Sciences 6(4): 264-271
Oleforuh-Okoleh, V. U., Chukwu G. C. and Adeolu, A. I. (2014). Effect of ground ginger and garlic on the growth
performance, carcass quality and economics of production of broiler chickens. Global Journal of Biosciences
and Biotechnology. 3(3): 225-229.
Onu, P. N. and Aja, P. M. 2011 Growth performance and haematological indices of weaned rabbits fed garlic (Allium
sativum) & ginger (Zingiber officinale) supplemented diets. Inter. J. Food, Agric. and Vet. Sci. 1: 51-59
Orr C. (1998). Comparing alternative for controlling internal parasite in dairy goat, Herbal wormers versus chemical
wormer. www.fiascofarm.com/goats/wormers.htm
Ortiz, H. J. A. and Rubio, L. M. S, (2001). Effect of breed and sex on rabbit carcass yield and meat quality. World Rabbit
Science 9:51-60.
Peyghan, R., Powell, M. D. and Zadkarami, M. R. (2008). In vitro effect of garlic extract and metronidazole against
Neoparamoeba pemaquidensis and isolate amoebae from Atlantic salmon. Pak. J. Biol. Sci. 11: 41–47.
Pourali, M., Mirghelenj, S.A. and Kermanshashi, D. (2010). Effect of garlic powder on productive performance and
immune response of broiler chickens challenged with Newcastle disease virus. Global Veterinaria 4:616-621
Piyush, J., Seema, S., Sandeep, K.S., Verma, S. K., Kharya, M.D. and Sanjeev, S. (2013). Anthelmintic potential of herbal
drugs. International Journal of Research and Development in Pharmacy and Life Sciences. 2(3): 412-427.
Ramakrishna, R.R., Platel, K. and Srinivasan, K. (2003). In-vitro influence of species and spice active principles on
digestive enzymes of rat pancreas and small intestine. Nahrung 47:408-412
Rao, D. R., Chen, C. P., Sunki, G. R. and Johnson, W.M. (1978). Effect of weaning and slaughter ages on rabbit meat
production II: Carcass quality and composition. Journal of Animal Science 46: 578-583
Sadzikowski, A. B., Szkucik, K., Szczepaniak, K. O. and Paszkiewicz, W. 2008. Pre-valance of protozoon genus Eimeria in
slaughter rabbits. (In Polish). Med. Wet., 64 (12): 1426–1429.
Salroo, G. M., Prasad, V. S. S. and Gupta, S. C. (1989). Effect of age on carcass traits of the SC rabbit. Indian J. Anim. Sci.,
59: 890-892.
Samkol, P. and Lukefahr, S. D. (2008). A challenging role of organic rabbit production towards poverty alleviation in South
East Asia. 9th World Rabbit Congress, Verona, Italy
SAS. (2000). SAS/STAT Software: Changes and Enhancements through Release 8.1, SAS Institute Inc., Cary, NC.
Sen, A. R. and Bhagwan, P. S. K. (1999). Appraisal of two genetic groups of rabbits for carcass and meat quality traits in
males and females. Indian Journal Animal Science 69(8): 631- 633

Singh, G. (1997). Performance of rabbits in semi-arid tropical regions in Indian. Proceedings of a Workshop on Integrated
Angora rabbit Development Project, April 1997, KVK Bajaura, Himachal Pradesh, Pp. 51-60.
Sundaram, S. G. and Milner, J. A. (1996). Diallyl disulfide inhibits the proliferation of human tumor cells in culture.
Biochem. Biophys Acta, 1315:15–20.
Szenrdő, Z., Matric, Z., Nagy, I., Odermatt, M., Gerenser, Z., Szendrő, E., Radnai, I. and Dalle Zotte, A. (2009).
Examination of growing rabbit house in pen without or with platform. 16th Intern. Symp. Housing and Diseases
of Rabbits: Fur providing Animals and Pet Animals, Celle, (in Press)
Toulah, F. H. and Al-Raw, M. M. 2007. Efficacy of garlic extract on hepatic coccidiosis in infected rabbits (Oryctolagus
cuniculus): histological and biochemical studies. J. Egypt Soc. Parasitol. 37 (3): 957-968
WHO 2000. WHO Global Principles for the Containment of Anti-microbial Resistance in Animals Intended for Food:
Report of a WHO Consultation, Geneva, Switzerland, 5-9 June 2000, WHO/CDS/CSR/APH/200
WHO 2001. Monitoring Anti-microbial Usage in Food Animals for the Protection of Human Health: Report of a WHO
Consultation, Oslo, Norway, 10-13 September 200
Yoshida, H., Iwata, N., Katsuzaki, H., Naganawa, R., Ishikawa, K., Fukuda, H., Fujino, T., Suzuki, A. 1998. Antimicrobial
activity of a compound isolated from an oil-macerated garlic extract. Biosci. Biotechnol. Biochem. 62: 1014–1017.
Chemical Composition and Sensory Evaluation of Cookies Baked from the Blends from the
Blends of Soya Bean and Maize Flours
Atobatele, O.B. and Afolabi, M.O.*
Department of Food Science and Technology, Bowen University Iwo, Osun State
*Corresponding author: Email: [email protected], [email protected]
ABSTRACT
Cookies were produced from the blends of maize flour (MF) and soya bean flour (SF). The functional properties of the MF
and SF were determined using standard methods. Proximate composition, mineral analysis and sensory evaluation of the
baked cookies from the flour blends were carried out .The SF possessed good water and oil absorption capacities (310%;
160%) than the MF (169%; 120%); the bulk density of SF (0.52%) was significantly lower than that of the MF (0.80%).
The protein content of the cookies increased from 4.5% in 100% maize cookies to 7.00% for cookies with 30% soya bean
flour. Substitution of soy-flour also significantly increased the ash (1.00%-1.8%), fibre (0.24%-0.94%) and fat (16.10%-
18.13%) contents of the cookies. However, the moisture and carbohydrate contents decreased with addition of soy-flour
while the mineral contents of the cookies samples increased with increase in soy-flour inclusion. Sensory evaluation
showed that the cookies samples were not significantly different (p>0.05) in terms of colour, aroma, crunchiness,
sweetness, flavour and general acceptability. Cookies produced from the blends of 70% MF+30% SF were the most
acceptable of all the samples.
Keywords: cookies; functional properties; maize flour; nutrients contents; soy-flour
INTRODUCTION
Cookie is conventionally a wheat flour-based food product that has become a major component of human snacks in most
part of the world. Most other English-speaking countries would call it a biscuit. In North American English a biscuit is a
kind of quick bread similar to a scone. Cookies are small, flat dessert treats, commonly formed into a circular shape. They
constitute an important component of the diet (Mishra et al., 2012). Cookies are convenient snacks product dried to a very
low moisture content taken among young people and adults (Okaka, 1997).
Wheat flour constitutes the basic ingredient for biscuit production because of its gluten proteins, which are not present in
flours of other cereals (Kent, 1975). Gluten protein forms elastic dough during baking and gives high organoleptic quality
to the finished products (Ihekoronye and Ngoddy, 1985). Unfortunately wheat production is low in Nigeria due to the
climatic condition which is unfavourable to the crop leading to the importation of wheat. Nigeria is endowed with many
legume crops like soybean (Glycine max) which is cheap and used mostly in the production of milk in most homes. The use
of soybean is increasing because of its functional properties and being an economic source of dietary protein and important
bio-active components such as isoflavones.
Soy-based foods may provide additional benefits for consumer due to their hypolipidemic and anticholesterolemic
properties with reduced allergenicity (Sipos, 1988). Soybeans are considered an inexpensive source of high-quality protein
(38%-55%) that are abundantly rich in lysine and essential amino-acid that are deficient in most cereal grains (Dhingra and
Jood 2004; Shorgren et al., 2006) but low in sulphur amino-acids, lutein and xanthenes. On the other hand, maize is rich in
methionine but deficient in lysine and tryptophan (Mishra, 2012) and low in calcium. Therefore, on the basis of
complementary, the combination of maize and soybean flours in food formulations could potentially provide most of the
nutrients needed by sub-Saharan Africans. This has stimulated the research into the determination of the chemical
composition and sensory properties of cookies baked from maize fortified with soy-bean flour. The objective of this study
is to develop soy-maize cookies that will be acceptable to the consumers.
MATERIALS AND METHODS
Materials
Dry maize (Zea mays), Soybean (Glycine max) seeds, cooking margarine, Sodium bicarbonate, Sugar,Salt, skimmed milk
powder, Condensed milk flavour and Aluminium foil paper were purchased from ‘okesa’ market in Ado-Ekiti, Ekiti state,
Nigeria. Master Chef electric toaster oven (Model MC-1957k, people’s republic of china) was used for baking.
Maize flour preparation
Maize flour was produced according to the procedure described by Okoruwa (1995). Dried maize kernels was sorted to
remove dirt’s and impurities, thereafter it was milled using hammer mill and packaged into high density polyethylene film.
Preparation of soybean flour
Soybean flour was produced using the procedure of Smith and Circle (1972). The soy bean seeds were roasted for 2 hours
and dehulled. It was dried, milled and sieved and the soybean flour was packed into polyethylene films till used.
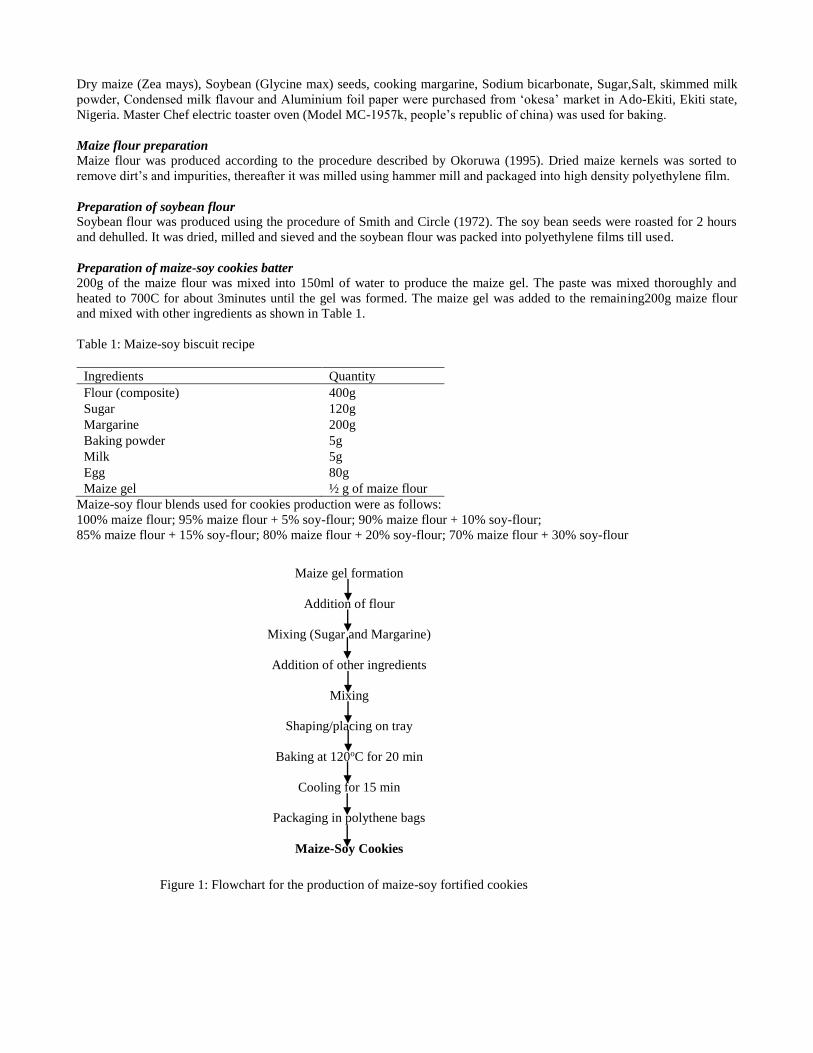
Preparation of maize-soy cookies batter
200g of the maize flour was mixed into 150ml of water to produce the maize gel. The paste was mixed thoroughly and
heated to 700C for about 3minutes until the gel was formed. The maize gel was added to the remaining200g maize flour
and mixed with other ingredients as shown in Table 1.
Table 1: Maize-soy biscuit recipe
Ingredients Quantity
Flour (composite) 400g
Sugar 120g
Margarine 200g
Baking powder 5g
Milk 5g
Egg 80g
Maize gel ½ g of maize flour
Maize-soy flour blends used for cookies production were as follows:
100% maize flour; 95% maize flour + 5% soy-flour; 90% maize flour + 10% soy-flour;
85% maize flour + 15% soy-flour; 80% maize flour + 20% soy-flour; 70% maize flour + 30% soy-flour
Figure 1: Flowchart for the production of maize-soy fortified cookies
Maize gel formation
Addition of flour
Mixing (Sugar and Margarine)
Addition of other ingredients
Mixing
Shaping/placing on tray
Baking at 120oC for 20 min
Cooling for 15 min
Packaging in polythene bags
Maize-Soy Cookies
Production of maize-soy cookies The ingredients were added to the gel formed and mixed thoroughly into a batter. The batter was rolled on a flat rolling
with a rolled on a floured board using pin to a thickness of 0.2-0.3cm. The rolled batter was cut into shapes and arranged on
a greased tray and baked at 1500c for 20 minutes (colour changes indicate the cookies are done. The cookies were brought
out, cooled and packaged in high density polyethylene bag until used.
Chemical composition of the samples The biscuits and flours were analyzed for moisture contents, crude proteins, Total lipids, Total ashes, Crude fibres, calcium
and zinc using AOAC (2005) methods. The carbohydrate contents were determined by difference
Functional properties of the flour The flour (maize and soy bean) was analyzed for bulk density, water absorption capacity and oil absorption capacity using
the methods of Okaka et al. (1979) and Lin et al. (1974)
Sensory evaluation
The sensory evaluation of the cookies was conducted using 20 member-untrained panellists from different age groups. A 9
point Hedonic scale was used with 1 corresponding to dislike extremely and 9 corresponding to like extremely.
Statistical Analysis
Means of triplicate determinations were analyzed using the one way ANOVA with α=0.05 (SPSS 20.0 for windows, USA)
to determine statistically differences between the quality attributes of samples with Duncan’s multiple range test.
RESULTS AND DISCUSSION
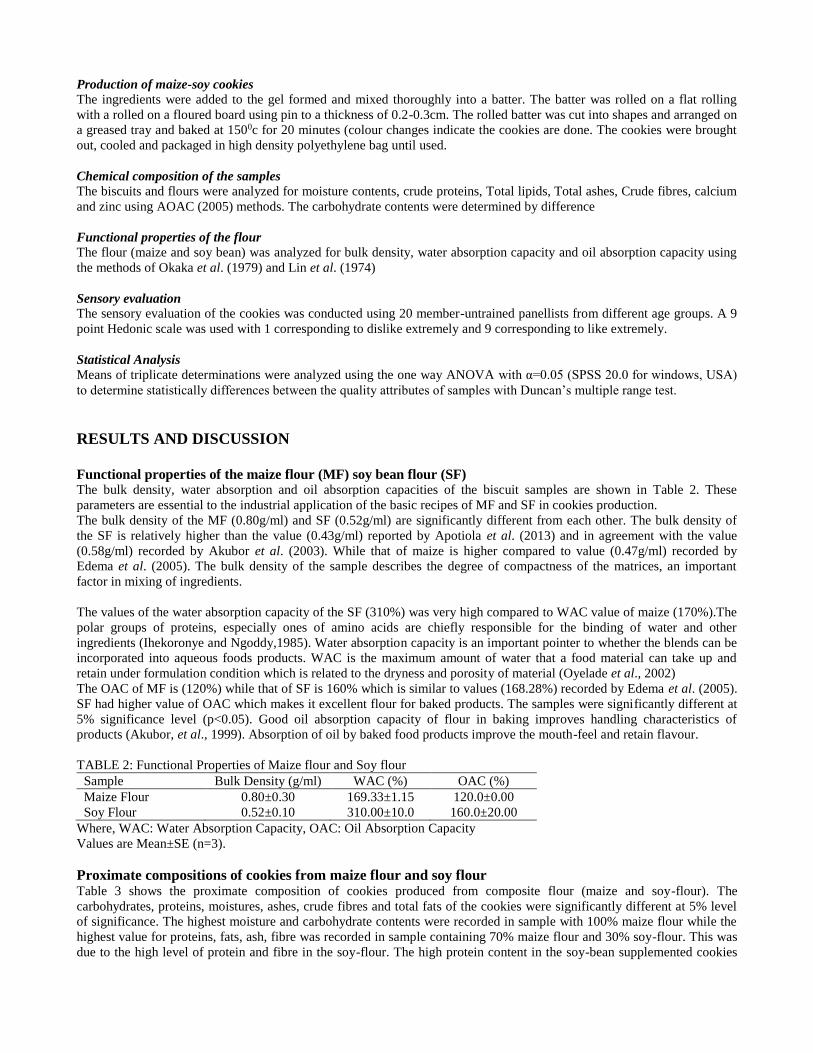
Functional properties of the maize flour (MF) soy bean flour (SF) The bulk density, water absorption and oil absorption capacities of the biscuit samples are shown in Table 2. These
parameters are essential to the industrial application of the basic recipes of MF and SF in cookies production.
The bulk density of the MF (0.80g/ml) and SF (0.52g/ml) are significantly different from each other. The bulk density of
the SF is relatively higher than the value (0.43g/ml) reported by Apotiola et al. (2013) and in agreement with the value
(0.58g/ml) recorded by Akubor et al. (2003). While that of maize is higher compared to value (0.47g/ml) recorded by
Edema et al. (2005). The bulk density of the sample describes the degree of compactness of the matrices, an important
factor in mixing of ingredients.
The values of the water absorption capacity of the SF (310%) was very high compared to WAC value of maize (170%).The
polar groups of proteins, especially ones of amino acids are chiefly responsible for the binding of water and other
ingredients (Ihekoronye and Ngoddy,1985). Water absorption capacity is an important pointer to whether the blends can be
incorporated into aqueous foods products. WAC is the maximum amount of water that a food material can take up and
retain under formulation condition which is related to the dryness and porosity of material (Oyelade et al., 2002)
The OAC of MF is (120%) while that of SF is 160% which is similar to values (168.28%) recorded by Edema et al. (2005).
SF had higher value of OAC which makes it excellent flour for baked products. The samples were significantly different at
5% significance level (p<0.05). Good oil absorption capacity of flour in baking improves handling characteristics of
products (Akubor, et al., 1999). Absorption of oil by baked food products improve the mouth-feel and retain flavour.
TABLE 2: Functional Properties of Maize flour and Soy flour
Sample Bulk Density (g/ml) WAC (%) OAC (%)
Maize Flour 0.80±0.30 169.33±1.15 120.0±0.00
Soy Flour 0.52±0.10 310.00±10.0 160.0±20.00
Where, WAC: Water Absorption Capacity, OAC: Oil Absorption Capacity
Values are Mean±SE (n=3).
Proximate compositions of cookies from maize flour and soy flour Table 3 shows the proximate composition of cookies produced from composite flour (maize and soy-flour). The
carbohydrates, proteins, moistures, ashes, crude fibres and total fats of the cookies were significantly different at 5% level
of significance. The highest moisture and carbohydrate contents were recorded in sample with 100% maize flour while the
highest value for proteins, fats, ash, fibre was recorded in sample containing 70% maize flour and 30% soy-flour. This was
due to the high level of protein and fibre in the soy-flour. The high protein content in the soy-bean supplemented cookies
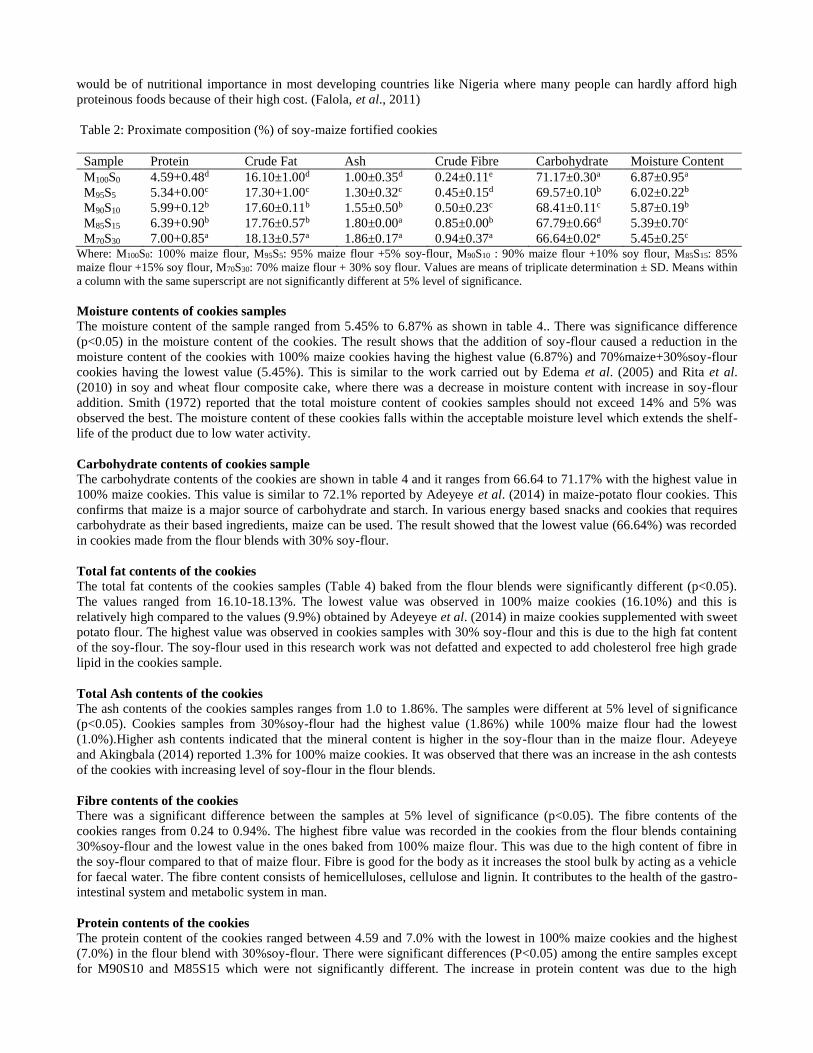
would be of nutritional importance in most developing countries like Nigeria where many people can hardly afford high
proteinous foods because of their high cost. (Falola, et al., 2011)
Table 2: Proximate composition (%) of soy-maize fortified cookies
Sample Protein Crude Fat Ash Crude Fibre Carbohydrate Moisture Content
M100S0 4.59+0.48d 16.10±1.00d 1.00±0.35d 0.24±0.11e 71.17±0.30a 6.87±0.95a
M95S5 5.34+0.00c 17.30+1.00c 1.30±0.32c 0.45±0.15d 69.57±0.10b 6.02±0.22b
M90S10 5.99+0.12b 17.60±0.11b 1.55±0.50b 0.50±0.23c 68.41±0.11c 5.87±0.19b
M85S15 6.39+0.90b 17.76±0.57b 1.80±0.00a 0.85±0.00b 67.79±0.66d 5.39±0.70c
M70S30 7.00+0.85a 18.13±0.57a 1.86±0.17a 0.94±0.37a 66.64±0.02e 5.45±0.25c Where: M100S0: 100% maize flour, M95S5: 95% maize flour +5% soy-flour, M90S10 : 90% maize flour +10% soy flour, M85S15: 85%
maize flour +15% soy flour, M70S30: 70% maize flour + 30% soy flour. Values are means of triplicate determination ± SD. Means within
a column with the same superscript are not significantly different at 5% level of significance.
Moisture contents of cookies samples
The moisture content of the sample ranged from 5.45% to 6.87% as shown in table 4.. There was significance difference
(p<0.05) in the moisture content of the cookies. The result shows that the addition of soy-flour caused a reduction in the
moisture content of the cookies with 100% maize cookies having the highest value (6.87%) and 70%maize+30%soy-flour
cookies having the lowest value (5.45%). This is similar to the work carried out by Edema et al. (2005) and Rita et al.
(2010) in soy and wheat flour composite cake, where there was a decrease in moisture content with increase in soy-flour
addition. Smith (1972) reported that the total moisture content of cookies samples should not exceed 14% and 5% was
observed the best. The moisture content of these cookies falls within the acceptable moisture level which extends the shelf-
life of the product due to low water activity.
Carbohydrate contents of cookies sample
The carbohydrate contents of the cookies are shown in table 4 and it ranges from 66.64 to 71.17% with the highest value in
100% maize cookies. This value is similar to 72.1% reported by Adeyeye et al. (2014) in maize-potato flour cookies. This
confirms that maize is a major source of carbohydrate and starch. In various energy based snacks and cookies that requires
carbohydrate as their based ingredients, maize can be used. The result showed that the lowest value (66.64%) was recorded
in cookies made from the flour blends with 30% soy-flour.
Total fat contents of the cookies
The total fat contents of the cookies samples (Table 4) baked from the flour blends were significantly different (p<0.05).
The values ranged from 16.10-18.13%. The lowest value was observed in 100% maize cookies (16.10%) and this is
relatively high compared to the values (9.9%) obtained by Adeyeye et al. (2014) in maize cookies supplemented with sweet
potato flour. The highest value was observed in cookies samples with 30% soy-flour and this is due to the high fat content
of the soy-flour. The soy-flour used in this research work was not defatted and expected to add cholesterol free high grade
lipid in the cookies sample.
Total Ash contents of the cookies
The ash contents of the cookies samples ranges from 1.0 to 1.86%. The samples were different at 5% level of significance
(p<0.05). Cookies samples from 30%soy-flour had the highest value (1.86%) while 100% maize flour had the lowest
(1.0%).Higher ash contents indicated that the mineral content is higher in the soy-flour than in the maize flour. Adeyeye
and Akingbala (2014) reported 1.3% for 100% maize cookies. It was observed that there was an increase in the ash contests
of the cookies with increasing level of soy-flour in the flour blends.
Fibre contents of the cookies
There was a significant difference between the samples at 5% level of significance (p<0.05). The fibre contents of the
cookies ranges from 0.24 to 0.94%. The highest fibre value was recorded in the cookies from the flour blends containing
30%soy-flour and the lowest value in the ones baked from 100% maize flour. This was due to the high content of fibre in
the soy-flour compared to that of maize flour. Fibre is good for the body as it increases the stool bulk by acting as a vehicle
for faecal water. The fibre content consists of hemicelluloses, cellulose and lignin. It contributes to the health of the gastro-
intestinal system and metabolic system in man.
Protein contents of the cookies
The protein content of the cookies ranged between 4.59 and 7.0% with the lowest in 100% maize cookies and the highest
(7.0%) in the flour blend with 30%soy-flour. There were significant differences (P<0.05) among the entire samples except
for M90S10 and M85S15 which were not significantly different. The increase in protein content was due to the high
content of protein in the soy-flour. Therefore, soy-flour served a complementary purpose in increasing the protein content
of products based with maize-flour and also helps in providing the limiting protein (lysine and tryptophan) in maize. The
increase in protein content agrees with the findings of Olaoye et al.( 2006) and Rita et al.( 2010) but the value is lower than
that reported by Mishra (2010) in development and compositional analysis of protein-rich cookies. The soy-fortified
cookies will help to alleviate diseases like kwashiorkor that result from higher carbohydrate intake
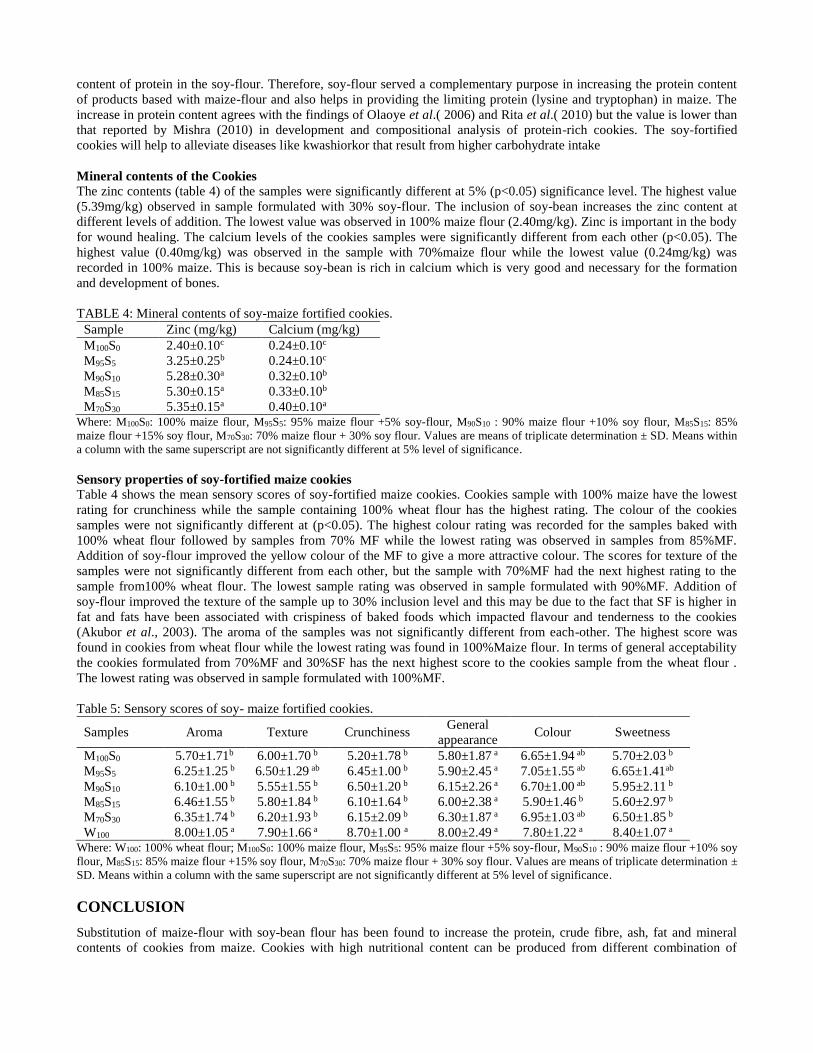
Mineral contents of the Cookies
The zinc contents (table 4) of the samples were significantly different at 5% (p<0.05) significance level. The highest value
(5.39mg/kg) observed in sample formulated with 30% soy-flour. The inclusion of soy-bean increases the zinc content at
different levels of addition. The lowest value was observed in 100% maize flour (2.40mg/kg). Zinc is important in the body
for wound healing. The calcium levels of the cookies samples were significantly different from each other (p<0.05). The
highest value (0.40mg/kg) was observed in the sample with 70%maize flour while the lowest value (0.24mg/kg) was
recorded in 100% maize. This is because soy-bean is rich in calcium which is very good and necessary for the formation
and development of bones.
TABLE 4: Mineral contents of soy-maize fortified cookies.
Sample Zinc (mg/kg) Calcium (mg/kg)
M100S0 2.40±0.10c 0.24±0.10c
M95S5 3.25±0.25b 0.24±0.10c
M90S10 5.28±0.30a 0.32±0.10b
M85S15 5.30±0.15a 0.33±0.10b
M70S30 5.35±0.15a 0.40±0.10a Where: M100S0: 100% maize flour, M95S5: 95% maize flour +5% soy-flour, M90S10 : 90% maize flour +10% soy flour, M85S15: 85%
maize flour +15% soy flour, M70S30: 70% maize flour + 30% soy flour. Values are means of triplicate determination ± SD. Means within
a column with the same superscript are not significantly different at 5% level of significance.
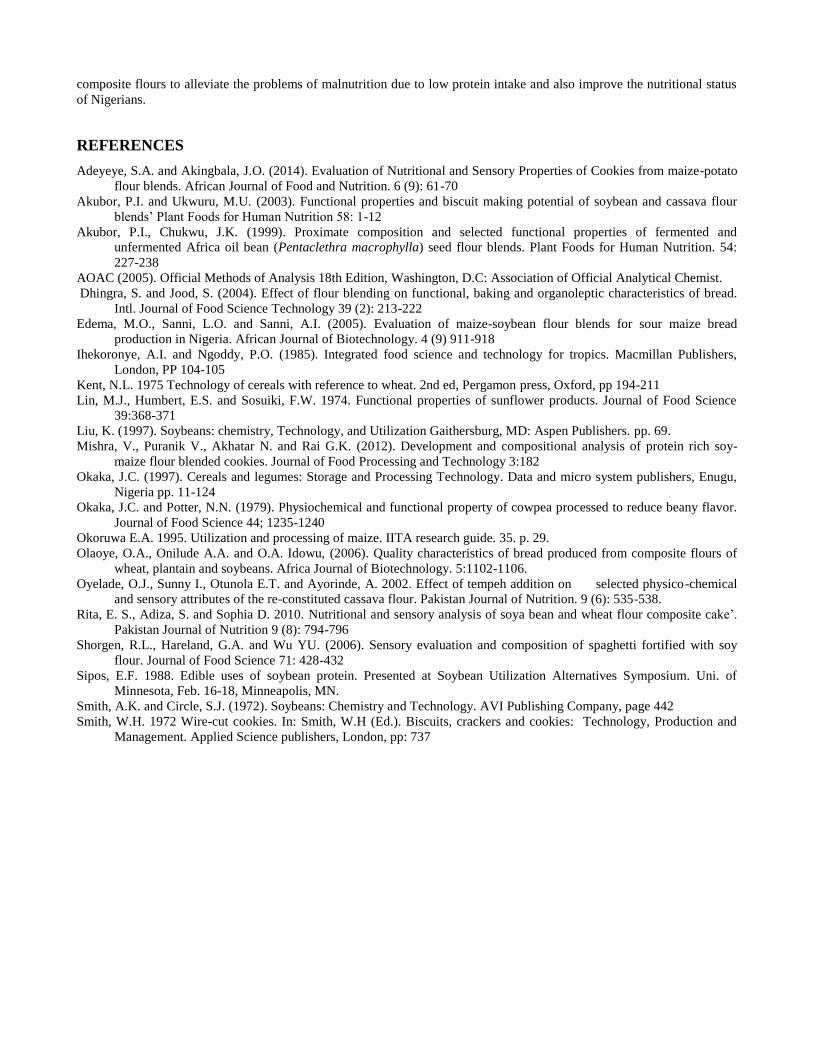
Sensory properties of soy-fortified maize cookies Table 4 shows the mean sensory scores of soy-fortified maize cookies. Cookies sample with 100% maize have the lowest
rating for crunchiness while the sample containing 100% wheat flour has the highest rating. The colour of the cookies
samples were not significantly different at (p<0.05). The highest colour rating was recorded for the samples baked with
100% wheat flour followed by samples from 70% MF while the lowest rating was observed in samples from 85%MF.
Addition of soy-flour improved the yellow colour of the MF to give a more attractive colour. The scores for texture of the
samples were not significantly different from each other, but the sample with 70%MF had the next highest rating to the
sample from100% wheat flour. The lowest sample rating was observed in sample formulated with 90%MF. Addition of
soy-flour improved the texture of the sample up to 30% inclusion level and this may be due to the fact that SF is higher in
fat and fats have been associated with crispiness of baked foods which impacted flavour and tenderness to the cookies
(Akubor et al., 2003). The aroma of the samples was not significantly different from each-other. The highest score was
found in cookies from wheat flour while the lowest rating was found in 100%Maize flour. In terms of general acceptability
the cookies formulated from 70%MF and 30%SF has the next highest score to the cookies sample from the wheat flour .
The lowest rating was observed in sample formulated with 100%MF.
Table 5: Sensory scores of soy- maize fortified cookies.
Samples Aroma Texture Crunchiness General
appearance Colour Sweetness
M100S0 5.70±1.71b 6.00±1.70 b 5.20±1.78 b 5.80±1.87 a 6.65±1.94 ab 5.70±2.03 b
M95S5 6.25±1.25 b 6.50±1.29 ab 6.45±1.00 b 5.90±2.45 a 7.05±1.55 ab 6.65±1.41ab
M90S10 6.10±1.00 b 5.55±1.55 b 6.50±1.20 b 6.15±2.26 a 6.70±1.00 ab 5.95±2.11 b
M85S15 6.46±1.55 b 5.80±1.84 b 6.10±1.64 b 6.00±2.38 a 5.90±1.46 b 5.60±2.97 b
M70S30 6.35±1.74 b 6.20±1.93 b 6.15±2.09 b 6.30±1.87 a 6.95±1.03 ab 6.50±1.85 b
W100 8.00±1.05 a 7.90±1.66 a 8.70±1.00 a 8.00±2.49 a 7.80±1.22 a 8.40±1.07 a Where: W100: 100% wheat flour; M100S0: 100% maize flour, M95S5: 95% maize flour +5% soy-flour, M90S10 : 90% maize flour +10% soy
flour, M85S15: 85% maize flour +15% soy flour, M70S30: 70% maize flour + 30% soy flour. Values are means of triplicate determination ±
SD. Means within a column with the same superscript are not significantly different at 5% level of significance.
CONCLUSION
Substitution of maize-flour with soy-bean flour has been found to increase the protein, crude fibre, ash, fat and mineral
contents of cookies from maize. Cookies with high nutritional content can be produced from different combination of
composite flours to alleviate the problems of malnutrition due to low protein intake and also improve the nutritional status
of Nigerians.
REFERENCES
Adeyeye, S.A. and Akingbala, J.O. (2014). Evaluation of Nutritional and Sensory Properties of Cookies from maize-potato
flour blends. African Journal of Food and Nutrition. 6 (9): 61-70
Akubor, P.I. and Ukwuru, M.U. (2003). Functional properties and biscuit making potential of soybean and cassava flour
blends’ Plant Foods for Human Nutrition 58: 1-12
Akubor, P.I., Chukwu, J.K. (1999). Proximate composition and selected functional properties of fermented and
unfermented Africa oil bean (Pentaclethra macrophylla) seed flour blends. Plant Foods for Human Nutrition. 54:
227-238
AOAC (2005). Official Methods of Analysis 18th Edition, Washington, D.C: Association of Official Analytical Chemist.
Dhingra, S. and Jood, S. (2004). Effect of flour blending on functional, baking and organoleptic characteristics of bread.
Intl. Journal of Food Science Technology 39 (2): 213-222
Edema, M.O., Sanni, L.O. and Sanni, A.I. (2005). Evaluation of maize-soybean flour blends for sour maize bread
production in Nigeria. African Journal of Biotechnology. 4 (9) 911-918
Ihekoronye, A.I. and Ngoddy, P.O. (1985). Integrated food science and technology for tropics. Macmillan Publishers,
London, PP 104-105
Kent, N.L. 1975 Technology of cereals with reference to wheat. 2nd ed, Pergamon press, Oxford, pp 194-211
Lin, M.J., Humbert, E.S. and Sosuiki, F.W. 1974. Functional properties of sunflower products. Journal of Food Science
39:368-371
Liu, K. (1997). Soybeans: chemistry, Technology, and Utilization Gaithersburg, MD: Aspen Publishers. pp. 69.
Mishra, V., Puranik V., Akhatar N. and Rai G.K. (2012). Development and compositional analysis of protein rich soy-
maize flour blended cookies. Journal of Food Processing and Technology 3:182
Okaka, J.C. (1997). Cereals and legumes: Storage and Processing Technology. Data and micro system publishers, Enugu,
Nigeria pp. 11-124
Okaka, J.C. and Potter, N.N. (1979). Physiochemical and functional property of cowpea processed to reduce beany flavor.
Journal of Food Science 44; 1235-1240
Okoruwa E.A. 1995. Utilization and processing of maize. IITA research guide. 35. p. 29.
Olaoye, O.A., Onilude A.A. and O.A. Idowu, (2006). Quality characteristics of bread produced from composite flours of
wheat, plantain and soybeans. Africa Journal of Biotechnology. 5:1102-1106.
Oyelade, O.J., Sunny I., Otunola E.T. and Ayorinde, A. 2002. Effect of tempeh addition on selected physico-chemical
and sensory attributes of the re-constituted cassava flour. Pakistan Journal of Nutrition. 9 (6): 535-538.
Rita, E. S., Adiza, S. and Sophia D. 2010. Nutritional and sensory analysis of soya bean and wheat flour composite cake’.
Pakistan Journal of Nutrition 9 (8): 794-796
Shorgen, R.L., Hareland, G.A. and Wu YU. (2006). Sensory evaluation and composition of spaghetti fortified with soy
flour. Journal of Food Science 71: 428-432
Sipos, E.F. 1988. Edible uses of soybean protein. Presented at Soybean Utilization Alternatives Symposium. Uni. of
Minnesota, Feb. 16-18, Minneapolis, MN.
Smith, A.K. and Circle, S.J. (1972). Soybeans: Chemistry and Technology. AVI Publishing Company, page 442
Smith, W.H. 1972 Wire-cut cookies. In: Smith, W.H (Ed.). Biscuits, crackers and cookies: Technology, Production and
Management. Applied Science publishers, London, pp: 737
Chemical, Anti-Nutritional and Sensory Attributes of Melon Enriched Gari
Abiodun, O.A.1*, Adepeju, A.B.2, Odedeji, J.O.3 and Amanyunose, A.A.3
1Department of Home Economics and Food Science, University of Ilorin, Kwara State, Nigeria. 2Department of Food Science and Technology, Joseph Ayo Babalola University, PMB 5006 Ikeji Arakeji Osun State. 3Department of Food Science and Technology, Osun State Polytechnic, Iree, Osun State, Nigeria.
*Corresponding author: Email: [email protected]
ABSTRACT
This study was carried out to determine the chemical, anti-nutritional and sensory quality attributes of melon enriched
gari. Freshly harvested cassava was peeled, washed and grated into pulp. Cassava pulp and melon flour were mixed
together in ratio 90:10 and 80:20 respectively. The fermented mixture was packaged in a sack and fermented for five days.
The fermented mixture was dewatered and samples taken each day, pulverized and toasted. Proximate, mineral, anti-
nutritional factors and sensory quality attributes of the gari were determined. Protein content ranged from 0.83-8.86 % in
the gari with 20% melon. Fat and crude fibre increased with melon substitution. Carbohydrate contents of the control were
higher than melon substituted gari. The pH ranged from 5.5 in control day 5 to 6.6 in enriched gari at 20 % level. Higher
potassium and sodium were observed in the control gari while the melon substituted gari had higher values in the calcium,
magnesium and phosphorus. Oxalate, tannin and hydrogen cyanide contents ranged from 0.27-1.35 mg/g, 0.24-0.69 mg/g
and 0.05-0.18 mg/g respectively in the gari. Sensory evaluation conducted showed no significant differences (p<0.05) in
the texture of the control gari from day one to five but there were significant differences (p>0.05) in the texture, aroma and
appearance of melon fortified gari. The longer the fermentation of gari fortified with melon, the better it becomes in term of
the sensory quality attributes. Enrichment of gari with 10 % melon in day 3 to 5 was more acceptable in terms of texture,
appearance and overall acceptability. The protein contents of gari increased with increase in the level of melon flour
addition.
Keywords: Cassava, gari, melon, mineral, proximate
INTRODUCTION
Cassava is the chief source of dietary food energy for the majority of the people living in the lowland tropics, and much of
the sub-humid tropics of West and Central Africa (Echebiri and Edaba, 2008). The major constraint in the utilization of
cassava is the perishability of the roots which results in post-harvest physiological deterioration (Isamah, 2004). According
to Nwabueze and Odunsi (2007), cassava plays important role in alleviating African food crisis. Processing of cassava
improved palatability, product quality, shelf life and reduce the hydro-cyanide contents of the products (Chijindu and
Boateng, 2008). Cassava are processed into chips, pellets, flour, adhesives, alcohol, and starch, which are vital raw
materials in the livestock feed, alcohol/ethanol, textile, confectionery, wood, food and soft drinks industries (Knipscheer et
al., 2007).
Gari is a fermented dry product from cassava. It is a cheap and popular meal consumed by mixing with boiling water to
form paste and eaten with soup in many rural areas of Nigeria especially among the low income earners (Makanjuola et al.,
2012). Arisa et al. (2011) reported the use of gari as snack. It could be soaked with cold water and eaten with groundnut,
fried fish and coconut with addition of sugar. Gari is a staple food and therefore consists of majorly carbohydrate. The
protein content of cassava is low and of poor quality (Oluwamukomi and Jolayemi, 2012), due to this a lot of studies had
been conducted to improve the nutritional value of gari using soybean, melon, groundnut and sesame seed flour (Osho,
2003; Oluwamukomi et al., 2005; Oluwamukomi and Jolayemi, 2012; Arisa et al. 2011; Oluwamukomi, 2015). Melon is a
cucurbit crop that belongs to the Cucurbitaceae family with protein content ranging from 33.80-39.96% (Abiodun and
Adeleke, 2010).
There is limited work on the enrichment of gari with melon seed flour despite its high protein content. However,
Oluwamukomi and Jolayemi (2012) enriched gari with combination of soybean and melon seed flour and improvement in
the protein contents were reported. Studying the effect of fermentation on gari enriched with melon seed flour could give an
in-depth knowledge of possible reactions and contents of the product. Enrichment of gari with high proteineous crop such

as melon could improve the nutritional contents of the product. Therefore, objective of this paper was to determine the
chemical, anti-nutritional and sensory attributes of gari enriched with gari.
MATERIALS AND METHODS
Materials
Cassava was obtained in a farm at Ada, Osun State, Nigeria while the melon seeds were purchased at a market at Osogbo,
Osun State.
Methods
Modified method of Oluwamukomi and Jolayemi (2012) was used for the gari production. The Cassava tubers were peeled
manually with a sharp knife, washed and grated in a locally fabricated mechanical grater. The grated wet mash were then
packed into sack and allowed to ferment for 1-5 days after which they were pressed and dewatered with a mechanical press.
Melon seeds were sorted, cleaned, dried and milled into flour. The cassava and melon were mixed together in ratio 90:10
and 80:20 % respectively. The enriched cassava pulp was dewatered each day and toasted for a period of 5 days. The gari
was processed according to the method in Fig. 1.
Cassava
Peeling
Washing
Grating
Mixing (Addition of melon)
Fermentation (1-5 days)
Dewatering
Cake disintegration
Sifting
Toasting
Cooling (at ambient temperature)
Melon enriched gari
Fig. 1: Production of gari enriched with melon flour
Analyses
Proximate, pH, mineral and anti-nutritional contents of the gari was determined using standard methods (AOAC, 1990).
Temperature data of the experimental periods (17-21 November 2014) were obtained at Meteorological Agency in Osogbo,
Osun State, Nigeria. Eba, a reconstituted paste was prepared by reconstituting it with hot water in ratios 1:2.2 (w/v) after
which it was mixed thoroughly with spoon to form stiff dough (Oluwamukomi et al., 2005). The sensory evaluation was
determined using untrained 20 panelists. The panelists were requested to examine the dough and score according to their
degree of likeness using a 9-point Hedonic scale ranging from 1 (dislike extremely) to 9 (like extremely) (Larmond, 1977).
The parameters evaluated were the texture, aroma, appearance and overall acceptability.
Statistical analysis
The data were subjected to one way Analysis of Variance (ANOVA) and a difference was considered to be significant at
p≤0.05. Means were separated using Tukey’s tests through SPSS software (version16.0) (Abiodun and Akinoso, 2014).

RESULTS
The proximate composition of gari enriched with melon is shown in Table 1. Ash contents of gari ranged from 2.20 % in
gari enriched 20% melon at day 5 to 2.99% in gari enriched 20% melon at day 3 while moisture contents ranged from
1.07% in day 4 control to 4.89% in day 1 control. Fat contents of gari with 20% melon at day 1 and 2 were not significantly
different (p>0.05) from each other but significantly different (p<0.05) from the control and 10 % melon substitution. Crude
fibre contents of 10 % (day 5) and 20 % (day 1 and 2) melon substituted gari were significantly different (p<0.05) from
other gari samples. Protein contents ranged from 0.83-8.86 % with higher values in 20 % melon fortified gari. Gari with 20
% melon (day 1) was significantly different (p<0.05) from control and other samples.
Table 1: Proximate composition (%) and pH of gari enriched with melon flour.
Sample Day Crude ash Moisture Fat Crude fibre Crude
protein Carbohydrate pH
Control
1 2.65±0.03c 4.89±0.07a 0.92±0.04f 2.21±0.02g 0.83±0.02g 88.50±013b 5.9
2 2.89±0.06b 1.33±0.02h 0.94±0.08f 2.86±0.10d 1.07±0.02g 90.91±0.09b 5.9
3 2.34±0.12e 1.10±0.06i 0.89±0.02f 2.80±0.10d 1.04±0.04g 91.83±0.23a 5.8
4 2.34±0.07e 1.07±0.02i 0.90±0.14f 2.46±0.30f 1.73±0.10f 91.50±0.17a 5.6
5 2.60±0.01cd 2.16±0.03f 0.94±0.10f 2.20±0.05g 1.45±0.02f 90.65±0.09b 5.5
10 % melon
1 2.58±0.07d 2.10±0.09f 8.25±0.11e 2.53±0.03e 3.06±0.06e 81.48±0.28c 6.2
2 2.50±0.09d 2.30±0.10e 8.93±0.05d 2.67±0.06e 3.51±0.20e 80.09±0.06c 6.0
3 2.65±0.01c 1.90±0.04g 8.78±0.07d 2.94±0.03c 3.60±0.10de 80.13±0.16c 5.9
4 2.99±0.05a 2.66±0.07c 8.10±0.16e 2.55±0.12e 4.32±0.07d 79.38±0.08c 5.9
5 2.35±0.05e 2.80±0.02b 8.62±0.08d 3.68±0.08a 3.87±0.03d 78.68±0.07c 5.8
20 % melon
1 2.85±0.11b 1.10±0.13i 15.67±0.03a 3.78±0.03a 8.86±0.21a 67.74±0.13d 6.6
2 2.70±0.09c 2.20±0.09e 15.43±0.04a 3.76±0.01a 8.00±0.05b 67.91±0.18d 6.5
3 2.99±0.16a 2.50±0.01d 14.47±0.04b 3.50±0.01b 7.66±0.06c 68.88±0.06d 6.2
4 2.85±0.01b 2.23±0.03e 14.54±0.02b 3.60±0.08b 7.82±0.04c 68.96±0.15d 6.0
5 2.20±0.07f 2.79±0.02b 12.74±0.07c 3.44±0.04b 7.83±0.03c 71.00±0.11d 6.0
Value with the same letter down the column are not significantly (p<0.05) different.
Table 2: Temperature data for the experimental periods.
Day Temperature (oC)
Maximum Minimum
1 32.0 23.7
2 31.5 24.2
3 31.0 23.4
4 32.8 21.0
5 33.0 20.0
Source: Metereological agency, Osogbo, Osun State
Carbohydrate contents of the controls at day 3 (91.83 %) and day 4 (91.50 %) were significantly different (p>0.05) from the
melon fortified gari. pH values ranged from 5.5 in control at day 5 to 6.6 in gari enriched with 20 % melon in day 1. pH
value decreased slightly from day 1 to 5 in the control and gari enriched with melon. Table 3 showed the mineral
composition of melon fortified gari. Highest sodium value (59.48 %) was in gari enriched with 20 % melon at day 2 while
the least sodium content (20.20 mg/kg) was observed in day 5 of gari substituted with 20 % melon. Potassium contents of
gari ranged from 30.00 to 175.00 mg/kg with highest value in control sample at day 2.
Anti-nutritional compositions of gari are shown in Table 4. The gari had low oxalate, tannin and hydrogen cyanide.
Likewise, gari enriched with melon had higher phytic acid when compared to the control. The values ranged from 1.17 to
3.54 mg/g. Table 5 showed the sensory properties of melon fortified eba (gari dough).
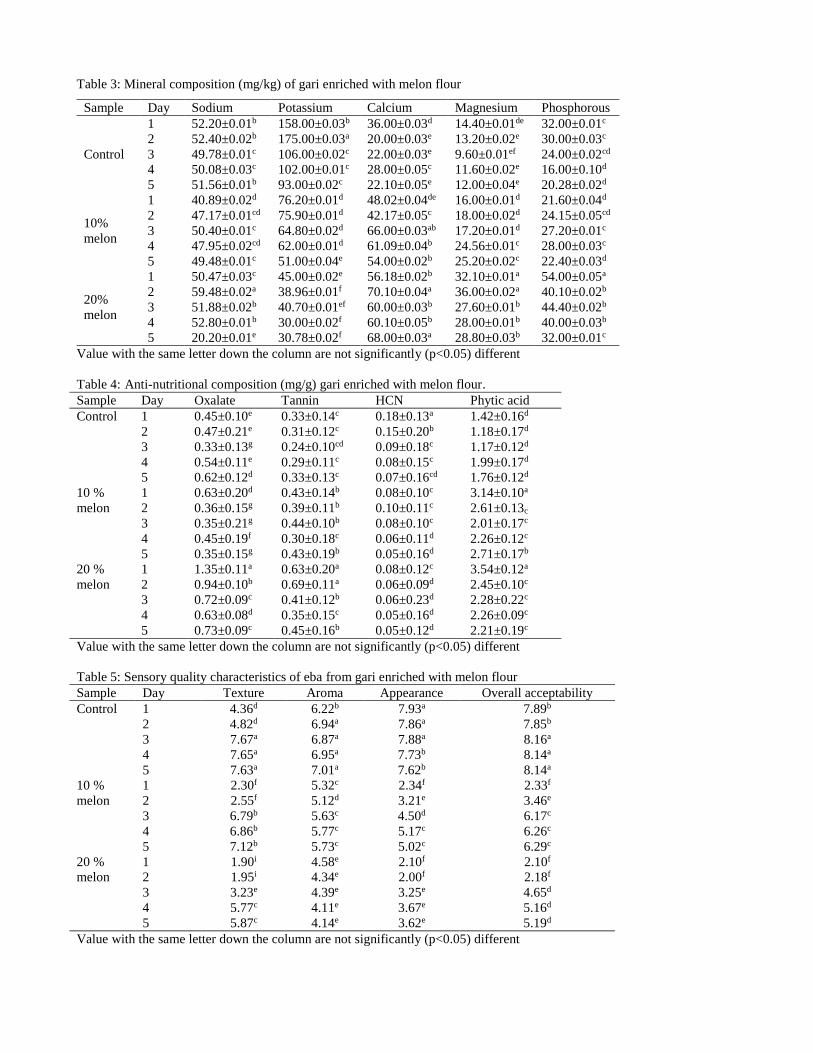
Table 3: Mineral composition (mg/kg) of gari enriched with melon flour
Sample Day Sodium Potassium Calcium Magnesium Phosphorous
Control
1 52.20±0.01b 158.00±0.03b 36.00±0.03d 14.40±0.01de 32.00±0.01c
2 52.40±0.02b 175.00±0.03a 20.00±0.03e 13.20±0.02e 30.00±0.03c
3 49.78±0.01c 106.00±0.02c 22.00±0.03e 9.60±0.01ef 24.00±0.02cd
4 50.08±0.03c 102.00±0.01c 28.00±0.05c 11.60±0.02e 16.00±0.10d
5 51.56±0.01b 93.00±0.02c 22.10±0.05e 12.00±0.04e 20.28±0.02d
10%
melon
1 40.89±0.02d 76.20±0.01d 48.02±0.04de 16.00±0.01d 21.60±0.04d
2 47.17±0.01cd 75.90±0.01d 42.17±0.05c 18.00±0.02d 24.15±0.05cd
3 50.40±0.01c 64.80±0.02d 66.00±0.03ab 17.20±0.01d 27.20±0.01c
4 47.95±0.02cd 62.00±0.01d 61.09±0.04b 24.56±0.01c 28.00±0.03c
5 49.48±0.01c 51.00±0.04e 54.00±0.02b 25.20±0.02c 22.40±0.03d
20%
melon
1 50.47±0.03c 45.00±0.02e 56.18±0.02b 32.10±0.01a 54.00±0.05a
2 59.48±0.02a 38.96±0.01f 70.10±0.04a 36.00±0.02a 40.10±0.02b
3 51.88±0.02b 40.70±0.01ef 60.00±0.03b 27.60±0.01b 44.40±0.02b
4 52.80±0.01b 30.00±0.02f 60.10±0.05b 28.00±0.01b 40.00±0.03b
5 20.20±0.01e 30.78±0.02f 68.00±0.03a 28.80±0.03b 32.00±0.01c
Value with the same letter down the column are not significantly (p<0.05) different
Table 4: Anti-nutritional composition (mg/g) gari enriched with melon flour.
Sample Day Oxalate Tannin HCN Phytic acid
Control 1 0.45±0.10e 0.33±0.14c 0.18±0.13a 1.42±0.16d
2 0.47±0.21e 0.31±0.12c 0.15±0.20b 1.18±0.17d
3 0.33±0.13g 0.24±0.10cd 0.09±0.18c 1.17±0.12d
4 0.54±0.11e 0.29±0.11c 0.08±0.15c 1.99±0.17d
5 0.62±0.12d 0.33±0.13c 0.07±0.16cd 1.76±0.12d
10 %
melon
1 0.63±0.20d 0.43±0.14b 0.08±0.10c 3.14±0.10a
2 0.36±0.15g 0.39±0.11b 0.10±0.11c 2.61±0.13c
3 0.35±0.21g 0.44±0.10b 0.08±0.10c 2.01±0.17c
4 0.45±0.19f 0.30±0.18c 0.06±0.11d 2.26±0.12c
5 0.35±0.15g 0.43±0.19b 0.05±0.16d 2.71±0.17b
20 %
melon
1 1.35±0.11a 0.63±0.20a 0.08±0.12c 3.54±0.12a
2 0.94±0.10b 0.69±0.11a 0.06±0.09d 2.45±0.10c
3 0.72±0.09c 0.41±0.12b 0.06±0.23d 2.28±0.22c
4 0.63±0.08d 0.35±0.15c 0.05±0.16d 2.26±0.09c
5 0.73±0.09c 0.45±0.16b 0.05±0.12d 2.21±0.19c
Value with the same letter down the column are not significantly (p<0.05) different
Table 5: Sensory quality characteristics of eba from gari enriched with melon flour
Sample Day Texture Aroma Appearance Overall acceptability
Control 1 4.36d 6.22b 7.93a 7.89b
2 4.82d 6.94a 7.86a 7.85b
3 7.67a 6.87a 7.88a 8.16a
4 7.65a 6.95a 7.73b 8.14a
5 7.63a 7.01a 7.62b 8.14a
10 %
melon
1 2.30f 5.32c 2.34f 2.33f
2 2.55f 5.12d 3.21e 3.46e
3 6.79b 5.63c 4.50d 6.17c
4 6.86b 5.77c 5.17c 6.26c
5 7.12b 5.73c 5.02c 6.29c
20 %
melon
1 1.90i 4.58e 2.10f 2.10f
2 1.95i 4.34e 2.00f 2.18f
3 3.23e 4.39e 3.25e 4.65d
4 5.77c 4.11e 3.67e 5.16d
5 5.87c 4.14e 3.62e 5.19d
Value with the same letter down the column are not significantly (p<0.05) different

DISCUSSION
There were significant differences (p<0.05) in the ash contents of the control and the melon fortified gari. Ash contents of
gari fortified with 10% melon at day 4 and 20 % melon at day 3 were higher than other samples. Control gari was
significantly different (p<0.05) from other samples in moisture contents. Moisture contents of control gari and gari enriched
with melon were low and within the Codex standard for gari (12 %) (Codex, 2013). Low moisture content is desirable in
gari as this reduces the activity of microorganisms in the product. Therefore, low moisture contents of gari signified high
stability of the products. Control samples had low fat contents than the melon substituted gari. Fat contents increased with
increase in melon substitution. Increase in fat contents may reduce the shelf life of the gari due to its susceptibility to
oxidative rancidity (Ihekoronye and Ngoddy, 1985). Addition of 20 % melon increased the crude fibre contents of the
fortified gari. Crude fibre contents of gari substituted with 20 % melon flour were higher than the maximum level (3 %)
recommended for gari (Ibe, 1981). Values obtained for ash, crude fibre and fat were higher than the values reported for
gari by Makanjuola et al. (2012). Mokanjuola et al. (2012) recorded 0.69-0.78% for ash, 0.33-0.44% for fat and 0.48-0.66
% for crude fibre contents of gari. This may be due to the cassava cultivar and melon seed flour used. Protein contents
increased with melon substitution but these decreased with days of fermentation in 20 % melon substitution. Protein
contents of gari enriched with 10 % melon increased from day 1 to day 4 and there was reduction in the protein value at the
5th day. In the control, the protein contents increased with fermentation days. Increase in protein contents in the control
with duration of fermentation was in line with the study of Irtwange and Achimba (2009). Decrease in protein contents with
fermentation periods in gari enriched with melon may be due to leaching of the nutrients especially the water soluble
protein during dewatering process. Protein content is very important and is one of the reasons for enriching gari with melon
so as to alleviate the problem of malnutrition. Carbohydrate contents decreased with increase in melon substitution. This
may be due to increase in fat and protein contents of the melon fortified gari. The pH of the gari was slightly decreased
from day 1 to 5 in control and gari enriched with melon. The pH of gari enriched with melon was higher than the control
samples. The control at day 5 had the lowest pH which indicates higher acidity in the control than the gari enriched with
melon. The pH values observed in this study were higher than the values (4.3-4.5) reported for gari by Makanjuola et al.
(2012). This might be as a result of low temperature as shown in Table 2. The fermentation temperature for gari reported by
Ogueke et al. (2013) was 35-40 oC. However, the temperatures during the experimental periods were lower than these
values. Lower temperature may hinder the activities of the fermentating microorganism. The experiment was carried out
during harmattan period and invariably affected the rate of fermentation process as this resulted in higher pH values in the
gari. This also led to reduced breakdown and utilization of the chemical components of the control and gari enriched with
melon.
Gari with 20 % melon at day 2 was significantly different (p<0.05) from other samples in sodium content. There were slight
increases in sodium contents of melon fortified gari. Potassium contents of the control samples were higher than melon
fortified gari and substitution with melon reduced the potassium contents. This showed that the cassava tubers used for the
gari product have high potassium contents. Magnesium, calcium and phosphorus contents were higher in melon fortified
gari than the control samples. Mineral contents depend on the soil, location, species and cultural practices adopted during
planting (Steven et al., 1985).
Oxalate and tannin contents of control and gari enriched with melon values decreased with melon substitution and days of
fermentation. Hydrogen cyanide (HCN) contents in the control and melon fortified gari were low when compared to the
report (4.31-4.77 mg/kg) of Ogueke et al. (2013) and maximum limit (10 mg/kg) recommended for gari (Codex, 2013).
Low HCN may be as a result of the cultivar of cassava used for the experiment. Reduction in HCN might be due to the
processing methods employed which include peeling, grating, fermenting, dewatering/pressing and toasting. Phytic acid
values also decreased with fermentation periods. Slight increase in melon fortified gari samples may be as results of melon
added to the grated cassava pulp. Reduction in anti-nutritional contents may be as a result of leaching of the anti-nutrients
into the medium during fermentation and dewatering process.
As shown in Table 5, texture of the control was not acceptable to the panelists at day 1 to 2 of fermentation due to the high
starch contents. But at day 3 to 5 of fermentation, the texture were acceptable with no significant difference (p>0.05)
among the control samples. Fortified gari (10 and 20 %) were not acceptable at day 1 to 2 due to the texture of the eba but
the textural qualities were improved from day 3 to 5. Aroma of eba from the control were acceptable than the fortified gari.
Increase in melon substitution up to 20 % level imparted undesirable aroma on the eba. These may be due to high fat
contents in the fortified gari. The appearances of the control eba were acceptable but the appearances became darker with
increase in fermentation days. Among the fortified gari dough, appearances of eba from 10 % melon fortified gari at day 3
to 5 were acceptable and significantly different (p<0.05) from 20 % melon fortified gari. Overall acceptability revealed the
control sample from day 3 to 5 as the most acceptable followed by enriched gari at day 3 to 5 at 10 % level.
CONCLUSION
The objective of this work was to improve the nutritional values of gari with melon flour. Addition of melon to gari
increased the protein, fat and crude fibre contents of the gari at both 10 and 20 % levels. The pH of the enriched gari was
higher than the control samples and fermentation rate was affected by low temperatures during this experimental periods.
Lower anti-nutrients were observed in the control and fortified gari. The reductions in these anti-nutrients were observed
with increase in number of days of fermentation. The dough made from gari with 10 % melon at day 3 to 5 were more
acceptable to the panelist than the eba made from gari with 20 % melon in terms of texture, flavor and appearance.
REFERENCES
Abiodun, O.A. and Adeleke, R.O. (2010). Comparative studies on nutritional composition of four melon seeds varieties.
Pakistan Journal of Nutrition, 9 (9): 905-908
Abiodun O.A and Akinoso, R. (2014). Effect of delayed harvesting and pre-treatment methods on the anti-nutritional
contents of trifoliate yam flour. Food Chemistry 146: 515-520
AOAC (1990). Official Methods of Analysis. 15th edition. Association of Official Analytical Chemists, Washington DC.
Arisa, N.U., Omosaiye, O.B., Adenekan, A.O. and Alabi-MacFoy, A. (2011). Chemical and sensory qualities of gari
fortified with groundnut flour. African Journal of Food Science and Technology 2(5): 116-119
Chijindu, E.N. and Boateng, B. A. (2008). Effect of nutritional content of processed cassava chips on development of
Prostephanus truncatus (Horn). World Journal of Agricultural Sciences, 4 (3): 404-408
CODEX (2013). CODEX standard for gari. Codex Standard 151-1989
Echebiri, R. N and Edaba, M.E. I. (2008). Production and Utilization of Cassava in Nigeria: Prospects for Food Security
and Infant Nutrition. Production, Agriculture and Technology, 4 (1): 38-52
Ibe, D.C. (1981). Semi Mechanized Gari Processing for Rural Communities in Nigeria. In: Terry, E.R., K.A. Oduro and E.
Caveness, (Eds.), Tropical Root Crops: Research Strategies, for the 1980s. International Society for Tropical Root
Crops. African Branch, Ibadan, pp: 159.
Ihekoronye, A.I. and Ngoddy, P.O. (1985). Integrated Food Science and Technology for the tropics. Macmillan Publisher,
London. 236-358.
Irtwange, S.V. and Achimba, O. (2009). Effect of the duration of fermentation on the quality of gari. Current Research
Journal of Biological Sciences 1(3): 150-154
Isamah, G.K. (2004). ATPase, peroxidase and lipoxygenase activity during post-harvest deterioration of cassava (Manihot
esculenta Crantz) root tubers. International Biodeterioration and Biodegradation 54: 319 – 323
Knipscheer, H., Ezedinma, C., Kormawa, P., Asumugha, G., Makinde, K., Okechukwu, R. and Dixon, A. (2007).
Opportunities in the Industrial Cassava Market in Nigeria. International Institute of Tropical Agriculture, 1-47
Larmond, E. (1977). Methods of sensory testing. In : Laboratory methods for sensory evaluation of foods. Publication
1637. Ottawa, Canadian dept of Agric.
Makanjuola, O.M., Ogunmodede, A.S., Makanjuola, J.O. and Awonorin, S.A. (2012). Comparative study on quality
attributes of gari obtained from some processing centres in South West, Nigeria. Advance Journal of Food Science
and Technology, 4 (3): 135-140.
Nwabueze, T. U. and Odunsi, F. O. (2007). Optimization of process conditions for cassava (Manihot esculenta) lafun
production. African Journal of Biotechnology, 6 (5): 603-611
Ogueke, C.C., Ehirim, C., Owuamanam, C.I., Ahaotu, I. and Olawuni, I.A. (2013). Quality characteristics and HCN in
gari as affected by fermentation variables. International Journal of Life Sciences 2(1): 21-28
Oluwamukomi, M.O., Adeyemi, I.A. and Oluwalana, I.B. (2005). Effects of soybean supplementation on the
physicochemical and sensory properties of gari. Applied Tropical Agriculture, 10: 44-49
Oluwamukomi M. O. and Jolayemi O.S. (2012). Physico-thermal and pasting properties of soy-melon-enriched “gari”
semolina from cassava. Agric Eng Int: CIGR Journal, 14(3): 105-116.
Oluwamukomi M. O. (2015). Chemical and sensory properties of gari enriched with sesame seed flour (sesamum indicum
l.). FUTA Journal of Research in Sciences, 1: 123-131
Osho, S.M. (2003). The processing and acceptability of a fortified cassava-based product (gari) with soybean. Nutrition and
Food Science, 33 (6): 268 – 272
Steven, R.T., Vernon, R.Y. and Michael, C.A. (1985). Vitamins and Minerals. In: Fennema, O. (ed). Food Chemistry. (2nd
ed), Marcel Dekker, New York. P 523
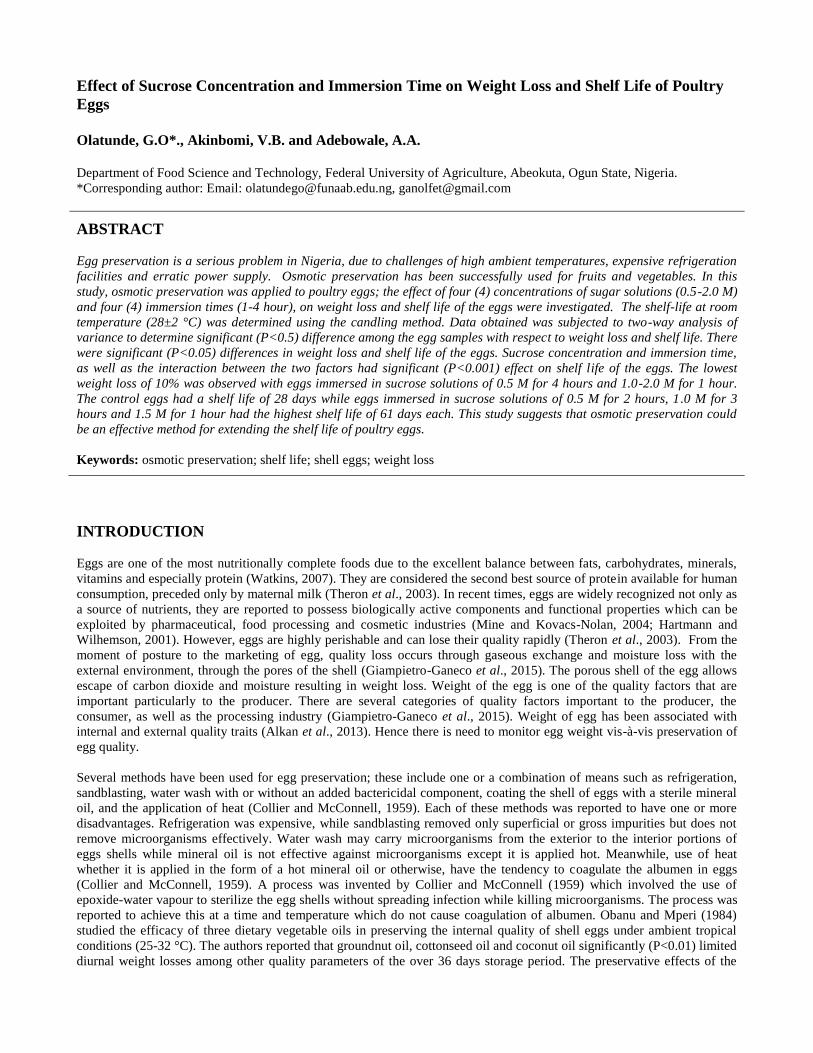
Effect of Sucrose Concentration and Immersion Time on Weight Loss and Shelf Life of Poultry
Eggs
Olatunde, G.O*., Akinbomi, V.B. and Adebowale, A.A.
Department of Food Science and Technology, Federal University of Agriculture, Abeokuta, Ogun State, Nigeria.
*Corresponding author: Email: [email protected], [email protected]
ABSTRACT
Egg preservation is a serious problem in Nigeria, due to challenges of high ambient temperatures, expensive refrigeration
facilities and erratic power supply. Osmotic preservation has been successfully used for fruits and vegetables. In this
study, osmotic preservation was applied to poultry eggs; the effect of four (4) concentrations of sugar solutions (0.5-2.0 M)
and four (4) immersion times (1-4 hour), on weight loss and shelf life of the eggs were investigated. The shelf-life at room
temperature (28±2 °C) was determined using the candling method. Data obtained was subjected to two-way analysis of
variance to determine significant (P<0.5) difference among the egg samples with respect to weight loss and shelf life. There
were significant (P<0.05) differences in weight loss and shelf life of the eggs. Sucrose concentration and immersion time,
as well as the interaction between the two factors had significant (P<0.001) effect on shelf life of the eggs. The lowest
weight loss of 10% was observed with eggs immersed in sucrose solutions of 0.5 M for 4 hours and 1.0-2.0 M for 1 hour.
The control eggs had a shelf life of 28 days while eggs immersed in sucrose solutions of 0.5 M for 2 hours, 1.0 M for 3
hours and 1.5 M for 1 hour had the highest shelf life of 61 days each. This study suggests that osmotic preservation could
be an effective method for extending the shelf life of poultry eggs.
Keywords: osmotic preservation; shelf life; shell eggs; weight loss
INTRODUCTION
Eggs are one of the most nutritionally complete foods due to the excellent balance between fats, carbohydrates, minerals,
vitamins and especially protein (Watkins, 2007). They are considered the second best source of protein available for human
consumption, preceded only by maternal milk (Theron et al., 2003). In recent times, eggs are widely recognized not only as
a source of nutrients, they are reported to possess biologically active components and functional properties which can be
exploited by pharmaceutical, food processing and cosmetic industries (Mine and Kovacs-Nolan, 2004; Hartmann and
Wilhemson, 2001). However, eggs are highly perishable and can lose their quality rapidly (Theron et al., 2003). From the
moment of posture to the marketing of egg, quality loss occurs through gaseous exchange and moisture loss with the
external environment, through the pores of the shell (Giampietro-Ganeco et al., 2015). The porous shell of the egg allows
escape of carbon dioxide and moisture resulting in weight loss. Weight of the egg is one of the quality factors that are
important particularly to the producer. There are several categories of quality factors important to the producer, the
consumer, as well as the processing industry (Giampietro-Ganeco et al., 2015). Weight of egg has been associated with
internal and external quality traits (Alkan et al., 2013). Hence there is need to monitor egg weight vis-à-vis preservation of
egg quality.
Several methods have been used for egg preservation; these include one or a combination of means such as refrigeration,
sandblasting, water wash with or without an added bactericidal component, coating the shell of eggs with a sterile mineral
oil, and the application of heat (Collier and McConnell, 1959). Each of these methods was reported to have one or more
disadvantages. Refrigeration was expensive, while sandblasting removed only superficial or gross impurities but does not
remove microorganisms effectively. Water wash may carry microorganisms from the exterior to the interior portions of
eggs shells while mineral oil is not effective against microorganisms except it is applied hot. Meanwhile, use of heat
whether it is applied in the form of a hot mineral oil or otherwise, have the tendency to coagulate the albumen in eggs
(Collier and McConnell, 1959). A process was invented by Collier and McConnell (1959) which involved the use of
epoxide-water vapour to sterilize the egg shells without spreading infection while killing microorganisms. The process was
reported to achieve this at a time and temperature which do not cause coagulation of albumen. Obanu and Mperi (1984)
studied the efficacy of three dietary vegetable oils in preserving the internal quality of shell eggs under ambient tropical
conditions (25-32 °C). The authors reported that groundnut oil, cottonseed oil and coconut oil significantly (P<0.01) limited
diurnal weight losses among other quality parameters of the over 36 days storage period. The preservative effects of the
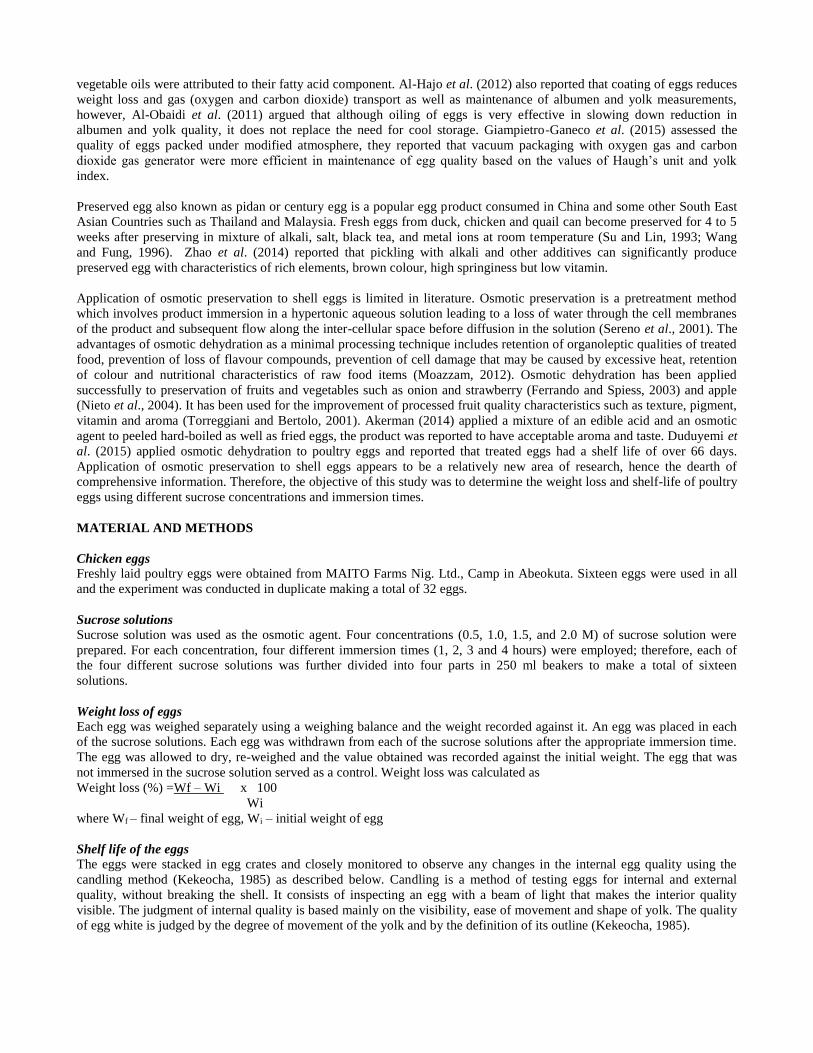
vegetable oils were attributed to their fatty acid component. Al-Hajo et al. (2012) also reported that coating of eggs reduces
weight loss and gas (oxygen and carbon dioxide) transport as well as maintenance of albumen and yolk measurements,
however, Al-Obaidi et al. (2011) argued that although oiling of eggs is very effective in slowing down reduction in
albumen and yolk quality, it does not replace the need for cool storage. Giampietro-Ganeco et al. (2015) assessed the
quality of eggs packed under modified atmosphere, they reported that vacuum packaging with oxygen gas and carbon
dioxide gas generator were more efficient in maintenance of egg quality based on the values of Haugh’s unit and yolk
index.
Preserved egg also known as pidan or century egg is a popular egg product consumed in China and some other South East
Asian Countries such as Thailand and Malaysia. Fresh eggs from duck, chicken and quail can become preserved for 4 to 5
weeks after preserving in mixture of alkali, salt, black tea, and metal ions at room temperature (Su and Lin, 1993; Wang
and Fung, 1996). Zhao et al. (2014) reported that pickling with alkali and other additives can significantly produce
preserved egg with characteristics of rich elements, brown colour, high springiness but low vitamin.
Application of osmotic preservation to shell eggs is limited in literature. Osmotic preservation is a pretreatment method
which involves product immersion in a hypertonic aqueous solution leading to a loss of water through the cell membranes
of the product and subsequent flow along the inter-cellular space before diffusion in the solution (Sereno et al., 2001). The
advantages of osmotic dehydration as a minimal processing technique includes retention of organoleptic qualities of treated
food, prevention of loss of flavour compounds, prevention of cell damage that may be caused by excessive heat, retention
of colour and nutritional characteristics of raw food items (Moazzam, 2012). Osmotic dehydration has been applied
successfully to preservation of fruits and vegetables such as onion and strawberry (Ferrando and Spiess, 2003) and apple
(Nieto et al., 2004). It has been used for the improvement of processed fruit quality characteristics such as texture, pigment,
vitamin and aroma (Torreggiani and Bertolo, 2001). Akerman (2014) applied a mixture of an edible acid and an osmotic
agent to peeled hard-boiled as well as fried eggs, the product was reported to have acceptable aroma and taste. Duduyemi et
al. (2015) applied osmotic dehydration to poultry eggs and reported that treated eggs had a shelf life of over 66 days.
Application of osmotic preservation to shell eggs appears to be a relatively new area of research, hence the dearth of
comprehensive information. Therefore, the objective of this study was to determine the weight loss and shelf-life of poultry
eggs using different sucrose concentrations and immersion times.
MATERIAL AND METHODS
Chicken eggs
Freshly laid poultry eggs were obtained from MAITO Farms Nig. Ltd., Camp in Abeokuta. Sixteen eggs were used in all
and the experiment was conducted in duplicate making a total of 32 eggs.
Sucrose solutions
Sucrose solution was used as the osmotic agent. Four concentrations (0.5, 1.0, 1.5, and 2.0 M) of sucrose solution were
prepared. For each concentration, four different immersion times (1, 2, 3 and 4 hours) were employed; therefore, each of
the four different sucrose solutions was further divided into four parts in 250 ml beakers to make a total of sixteen
solutions.
Weight loss of eggs
Each egg was weighed separately using a weighing balance and the weight recorded against it. An egg was placed in each
of the sucrose solutions. Each egg was withdrawn from each of the sucrose solutions after the appropriate immersion time.
The egg was allowed to dry, re-weighed and the value obtained was recorded against the initial weight. The egg that was
not immersed in the sucrose solution served as a control. Weight loss was calculated as
Weight loss (%) =Wf – Wi x 100
Wi
where Wf – final weight of egg, Wi – initial weight of egg
Shelf life of the eggs
The eggs were stacked in egg crates and closely monitored to observe any changes in the internal egg quality using the
candling method (Kekeocha, 1985) as described below. Candling is a method of testing eggs for internal and external
quality, without breaking the shell. It consists of inspecting an egg with a beam of light that makes the interior quality
visible. The judgment of internal quality is based mainly on the visibility, ease of movement and shape of yolk. The quality
of egg white is judged by the degree of movement of the yolk and by the definition of its outline (Kekeocha, 1985).
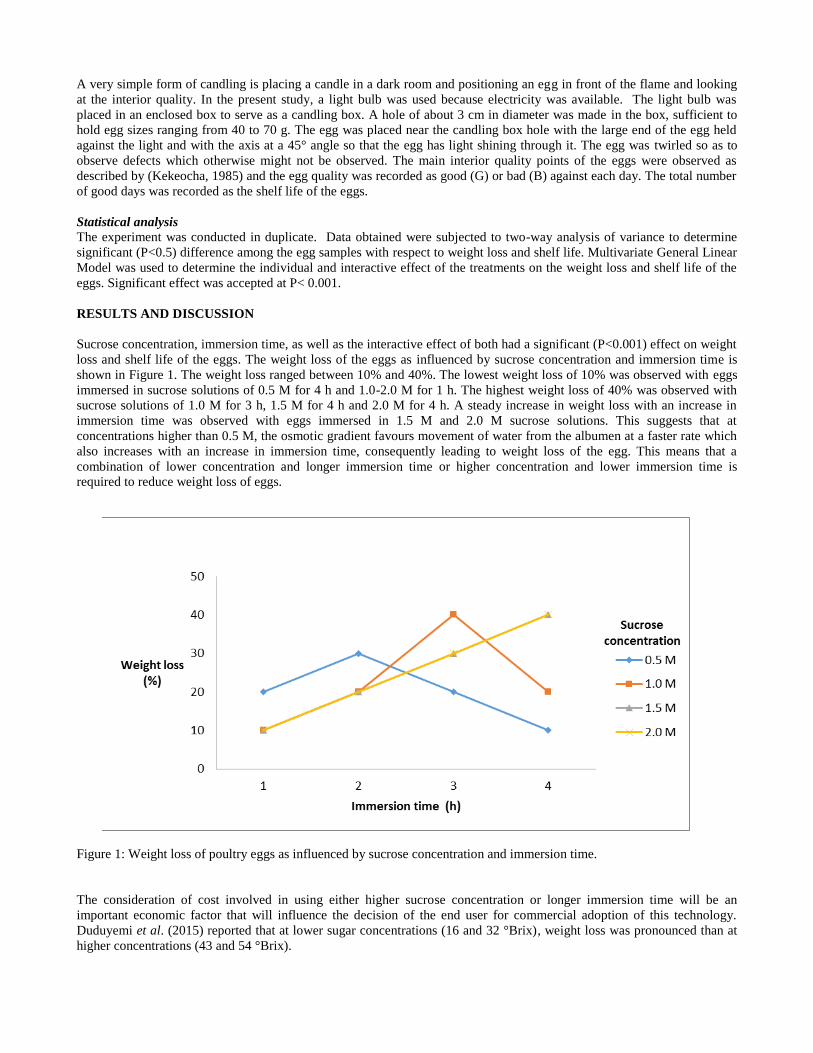
A very simple form of candling is placing a candle in a dark room and positioning an egg in front of the flame and looking
at the interior quality. In the present study, a light bulb was used because electricity was available. The light bulb was
placed in an enclosed box to serve as a candling box. A hole of about 3 cm in diameter was made in the box, sufficient to
hold egg sizes ranging from 40 to 70 g. The egg was placed near the candling box hole with the large end of the egg held
against the light and with the axis at a 45° angle so that the egg has light shining through it. The egg was twirled so as to
observe defects which otherwise might not be observed. The main interior quality points of the eggs were observed as
described by (Kekeocha, 1985) and the egg quality was recorded as good (G) or bad (B) against each day. The total number
of good days was recorded as the shelf life of the eggs.
Statistical analysis
The experiment was conducted in duplicate. Data obtained were subjected to two-way analysis of variance to determine
significant (P<0.5) difference among the egg samples with respect to weight loss and shelf life. Multivariate General Linear
Model was used to determine the individual and interactive effect of the treatments on the weight loss and shelf life of the
eggs. Significant effect was accepted at P< 0.001.
RESULTS AND DISCUSSION
Sucrose concentration, immersion time, as well as the interactive effect of both had a significant (P<0.001) effect on weight
loss and shelf life of the eggs. The weight loss of the eggs as influenced by sucrose concentration and immersion time is
shown in Figure 1. The weight loss ranged between 10% and 40%. The lowest weight loss of 10% was observed with eggs
immersed in sucrose solutions of 0.5 M for 4 h and 1.0-2.0 M for 1 h. The highest weight loss of 40% was observed with
sucrose solutions of 1.0 M for 3 h, 1.5 M for 4 h and 2.0 M for 4 h. A steady increase in weight loss with an increase in
immersion time was observed with eggs immersed in 1.5 M and 2.0 M sucrose solutions. This suggests that at
concentrations higher than 0.5 M, the osmotic gradient favours movement of water from the albumen at a faster rate which
also increases with an increase in immersion time, consequently leading to weight loss of the egg. This means that a
combination of lower concentration and longer immersion time or higher concentration and lower immersion time is
required to reduce weight loss of eggs.
Figure 1: Weight loss of poultry eggs as influenced by sucrose concentration and immersion time.
The consideration of cost involved in using either higher sucrose concentration or longer immersion time will be an
important economic factor that will influence the decision of the end user for commercial adoption of this technology.
Duduyemi et al. (2015) reported that at lower sugar concentrations (16 and 32 °Brix), weight loss was pronounced than at
higher concentrations (43 and 54 °Brix).
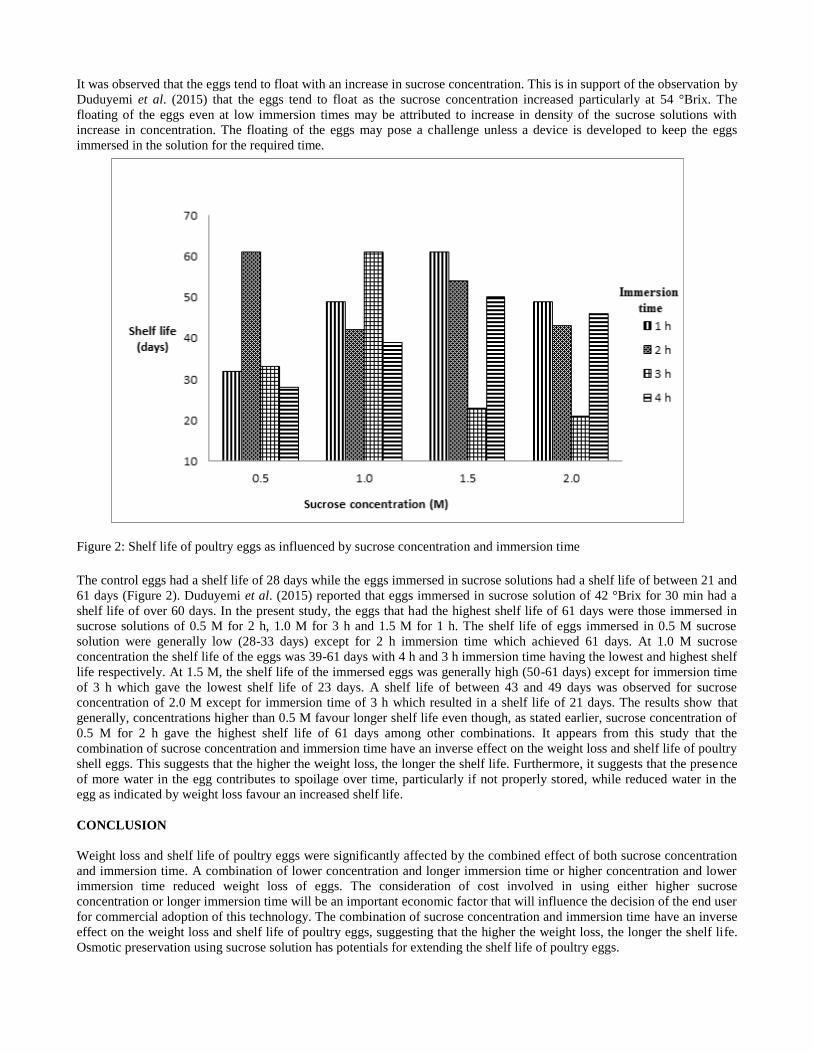
It was observed that the eggs tend to float with an increase in sucrose concentration. This is in support of the observation by
Duduyemi et al. (2015) that the eggs tend to float as the sucrose concentration increased particularly at 54 °Brix. The
floating of the eggs even at low immersion times may be attributed to increase in density of the sucrose solutions with
increase in concentration. The floating of the eggs may pose a challenge unless a device is developed to keep the eggs
immersed in the solution for the required time.
Figure 2: Shelf life of poultry eggs as influenced by sucrose concentration and immersion time
The control eggs had a shelf life of 28 days while the eggs immersed in sucrose solutions had a shelf life of between 21 and
61 days (Figure 2). Duduyemi et al. (2015) reported that eggs immersed in sucrose solution of 42 °Brix for 30 min had a
shelf life of over 60 days. In the present study, the eggs that had the highest shelf life of 61 days were those immersed in
sucrose solutions of 0.5 M for 2 h, 1.0 M for 3 h and 1.5 M for 1 h. The shelf life of eggs immersed in 0.5 M sucrose
solution were generally low (28-33 days) except for 2 h immersion time which achieved 61 days. At 1.0 M sucrose
concentration the shelf life of the eggs was 39-61 days with 4 h and 3 h immersion time having the lowest and highest shelf
life respectively. At 1.5 M, the shelf life of the immersed eggs was generally high (50-61 days) except for immersion time
of 3 h which gave the lowest shelf life of 23 days. A shelf life of between 43 and 49 days was observed for sucrose
concentration of 2.0 M except for immersion time of 3 h which resulted in a shelf life of 21 days. The results show that
generally, concentrations higher than 0.5 M favour longer shelf life even though, as stated earlier, sucrose concentration of
0.5 M for 2 h gave the highest shelf life of 61 days among other combinations. It appears from this study that the
combination of sucrose concentration and immersion time have an inverse effect on the weight loss and shelf life of poultry
shell eggs. This suggests that the higher the weight loss, the longer the shelf life. Furthermore, it suggests that the presence
of more water in the egg contributes to spoilage over time, particularly if not properly stored, while reduced water in the
egg as indicated by weight loss favour an increased shelf life.
CONCLUSION
Weight loss and shelf life of poultry eggs were significantly affected by the combined effect of both sucrose concentration
and immersion time. A combination of lower concentration and longer immersion time or higher concentration and lower
immersion time reduced weight loss of eggs. The consideration of cost involved in using either higher sucrose
concentration or longer immersion time will be an important economic factor that will influence the decision of the end user
for commercial adoption of this technology. The combination of sucrose concentration and immersion time have an inverse
effect on the weight loss and shelf life of poultry eggs, suggesting that the higher the weight loss, the longer the shelf life.
Osmotic preservation using sucrose solution has potentials for extending the shelf life of poultry eggs.
REFERENCES
Al-Hajo, N. N. A.; Zangana, B. S. R.; Al-Janabi, L. A. F. and Al-Khalani, F. M. H. (2012). Effect of coating materials
(gelatin) and storage time on internal quality of chicken and quail eggs under refrigeration storage. Egypt. Poult.
Sci. 32(1):107-115.
Akerman, E. (2014). Food product and method of preserving same. United States Patent US20140127359 A1
https://www.google.com/patents/US20140127359
Alkan, S.; Karsli, T.; Galic, A. and Karabag, K. (2013). Determination of phenotypic correlations between internal and
external quality traits of guinea fowl eggs. Kafkas Univ. Vet. Fak. Derg. 19(5): 861-867.
http://vetdergi.kafkas.edu.tr/extdocs/2013_5/861-867.pdf
Al-Obaidi, F. A.; Al-Shadeedi, S. M. J. and Al-Dalawi, R. H. (2011). Quality, chemical and microbial characteristics of
table eggs in retail stores in Baghdad. International Journal of Poultry Science 10(5): 381-385.
Collier, C. P. and McConnell, J. E. W. (1959). Preservation of Eggs. United States Patent US3144342 A.
https://www.google.com/patents/US3144342.
Duduyemi, O.; Ade-Omowaye, B. I. O. and Popoola, O. (2015). Application of osmotic dehydration for shelf-life extension
of fresh poultry eggs. International Journal of Engineering and Applied Sciences 2(6): 15-19.
Ferrando, M. and Spiess, W.E.L. (2003). Effect of osmotic stress on microstructure and mass transfer in onion and
strawberry tissue. Journal of the Science of Food and Agriculture, 83(9): 951-959.
Giampietro-Ganeco, A.; Borba, H.; Scatolini-Silva, A. M.; Boiago, M. M; de Souza, P. A. and de mello, P. L. M. (2015).
Quality assessment of eggs packed under modified atmosphere. Cienc. Agrotec. 39:1.
http://dx.doi.org/10.1590/S1413-70542015000100010.
Hartmann, C. and Wilhemson, M. (2001). The hen’s egg yolk: A source of biologically active substances. World Poultry
Sci. J. 57: 13-28.
Kekeocha, C. C. (1985). Introduction to Poultry Keeping. Poultry Production Hand Book. Pfizer Corporation, Nairobi. Pp:
1-15.
Mine, Y. and Kovacs-Nolan, J. (2004). Biologically active hen egg components in human health and disease. The Journal
of Poultry Sci. 41:1-29.
Moazzam, R. K. (2012). Osmotic dehydration technique for fruits preservation-A Review. Pakistan Journal of Food
Sciences 22(2): 71-85.
Nieto, A. B. Salvatori, D. M.; Castro, M.A. and Alzamora S. SM. (2004). Structural changes in apple tissue during glucose
and sucrose osmotic dehydration: shrinkage, porosity, density and microscopic features. Journal of Food
Engineering, 61: 269.
Obanu, Z. A. and Mpieri, A. A. (1984). Efficiency of dietary vegetable oils in preserving the quality of shell eggs under
ambient tropical conditions. J. Sci. Food Agric. 35(12): 1311-1317.
Sereno, A. M.; Moreira, R. and Martinez, E. (2001). Mass transfer coefficients during osmotic dehydration of apple in
single and combined aqueous solutions of sugar and salt. Journal of Food Engineering, 47(1):43-49.
Su, H. P. and Lin, C. W. (1993). A new process for preparing transparent alkalized duck egg and its quality. J. Sci. Food
Agric. 61:117-120.
Theron, H.; Venter, P. and Lues, J. F. R. (2003). Bacterial growth on chicken eggs in various storage environments. Food
Research International. 36:969-975.
Torreggiani, D. and Bertolo, G. (2001). Osmotic pre-treatments in fruit processing: chemical, physical and structural
effects. Journal of Food Engineering, 49(2-3): 247-253.
Wang, J. and Fung, D. Y. C. (1996). Alkaline-fermented foods: A review with emphasis on pidan fermentation. Crit. Rev.
Microbiol. 22:101-138.
Watkins, B. A. (2007). The nutritive value of egg. In: W. J. Stadelman and O. J. Cotteril (eds.) Egg Science & Technology
4th Edition. Haworth Press Inc., New York. pp.177-194.
Zhao, Y.; Xu, M. S. and Tu, Y. G. (2014). Research progress in mechanisms of preserved egg processing. Food Sci.
(Chinese) 17:472-475.

Influence of Roasting Techniques on Chemical Composition and Physico-chemical Properties of
Sesame (Sesamum indicum) Seed Flour and Oil
Makinde, F.M.1*, Adetutu, A.O.2 and Olorunyomi, G.O.2
Department of Food Science and Technology, Bowen University, Iwo, Osun State, Nigeria.
*Corresponding author: Email: [email protected]
ABSTRACT
The most common form of utilization of sesame seed is its roasting, which supplies nutrients to the diet. The objective of
this study was to determine the effect of different roasting techniques (using open pan and microwave) on the chemical
composition of sesame seed flour and physico-chemical properties of its oil. The raw sesame flour (RSF), open pan roasted
sesame flour (ORSF) and microwave roasted sesame flour (MRSF) were analysed for proximate composition, minerals,
vitamins, anti-nutritional factors and colour, and the seed oils were analyzed for peroxide and iodine values. The ranges of
proximate composition of the flours were: protein 24.3-27.5 g/100g, fat 52.4-59.0 g/100g, crude fiber 3.86- 6.13 g/100g,
ash 2.88-3.67 g/100g, carbohydrate 5.4-13.2 g/100g and energy value 552.5 -576.6 kcal/100g. Crude fat, ash, fiber and
energy values were significantly higher in MRSF and ORSF compared to RSF. However, protein and carbohydrate values
were significantly lower in roasted seeds compared to RSF. Calcium, potassium, phosphorus and magnesium ranged from
439.25-445.02, 342.14-346.77, 427.81-434.77 and 357.38- 364.03 mg/100g respectively with the RSF having the least
value. Whereas micro elements such as iron, manganese and zinc ranged from 3.06-6.42, 0.76-1.50 and 2.78-3.62
mg/100g. Thiamine values for RSF, ORSF and MRSF were 40.23, 20.56 and 4.52 mg/Kg respectively; riboflavin values
were 21.08, 15.33 and 2.60 mg/Kg respectively while niacin values were and 28.28, 17.30, 2.01 mg/Kg respectively.
Roasting in open pan caused significant reduction in phytate and oxalate contents in sesame than roasting in microwave
oven. Colour values (L*) of seed flour significantly decreased, whereas a* and b* values increased (P ≤0.05) in ORSF and
MRSF compared to RSF. The peroxide values of RSF, ORSF and MRSF were 1.43, 11.21 and 10.02 mEq O2/kg oil
respectively while the iodine values were 118.65, 106.44 and 109.71 g I/100g oil for RSF, ORSF and MRSF respectively.
The effect of roasting techniques with regard to loss and retention of the nutrients differed significantly (P ≤ 0.05).
Keywords: chemical composition; microwave irradiation; open pan roasting
INTRODUCTION
There has been immense expansion in oil seeds production as a result of increasing demand for food applications. Sesame
seeds are small, the size, form and colour vary with the thousands of varieties known (Oplinger et al., 1990). Sesame seeds
occur in many colours depending on the cultivar (Langham, 2008). The most traded variety of sesame is off-white coloured.
Other common colours are buff, tan, gold, brown, reddish, gray, and black. Through the ages, sesame seeds have been a
source of food and oil. Sesame is also grown for its leaves that are used in stews, and the dried stems may be burnt as fuel
with the ash used for local soap making, but such uses are entirely subordinate to seed production. Sesame seeds contain
47-50% fat, 25-27% protein, 10-12% carbohydrate, 3.7-6.4% fiber and 3.7-4.6% ash (Makinde and Akinoso, 2013). The
seeds are rich in mono-unsaturated fatty acid (oleic acid) and equally rich sources of many minerals such as calcium,
phosphorus, manganese, zinc, magnesium and potassium which play vital roles in the body (Makinde and Akinoso, 2014).
The seeds also contain B complex vitamins such as niacin, folic acid, thiamine, riboflavin and pyridoxine with some health
benefiting compounds such as sesamol, sesamolin and sesamin (Nakai et al., 2003). Phillips et al. (2005) however reported
that the seeds contain phytic and oxalic acids, which are anti- nutrients.
The effects of various processing methods in the preparation of oilseeds for human consumption are of utmost importance.
Roasting is the most important practice for sesame seed processing in Nigeria and is commonly carried out in open pan
over fire with continuous stirring, however, such roasting process takes about 20 min or more, which may adversely affect
sesame constituents such as lipids, protein, vitamins and other essential nutrients. Meanwhile, social changes and rapid
lifestyle make the working women search for a rapid method for preparing food with microwave oven especially those
needed a long time for cooking or roasting. Microwave operation have been applied with increasing success in oil
extraction, pasteurization, sterilization, baking, blanching, roasting, cooking, drying, and thawing of different food products
(Tan et al., 2001; Mariod et al., 2013) and it is accomplished by means of electromagnetic waves, which penetrate deeply
and heat rapidly (Schlegel, 1992). Electromagnetic waves are of electrical and magnetic energy moving together through
space. They include gamma rays, x-rays, ultraviolet radiation, visible light, infrared radiation, microwaves and the less
energetic radio waves. Although there is no formal definition of the frequency range for microwave radiation, these
electromagnetic waves occur in the 300MHz - 300GHz region. Nevertheless, and in accordance with the industrial,
scientific and medical (ISM) frequency bands for non- communication purposes, only 915 MHz and 2.45MHz are used for
food applications, especially the second due to its worldwide availability (Malheiro et al., 2011). Numerous advantages
boosted the use of microwave heating making it in many cases a technique preferred in the processing of food. These
advantages include precise timing, rapidity, and energy saving. Moreover, it has been found to be safe; there was no
toxicity or adverse effects on microwave treated foods (Miller et al., 1989).
Many researchers have been concerned with the evaluation of the effect of roasting on sesame seeds; these include: anti
oxidative activity of roasted sesame seed oil and the effect of using the oil for frying (Fukuda et al., 1986), influence of
seed roasting process on the changes in composition and quality of sesame oil (Yen, 1990), oxidative stability of sesame oil
prepared from sesame seed with different roasting temperatures (Yen and Shyu, 1989) and microwave roasting effects on
the composition and oxidative stability of sesame oil (Yoshida and Kajimoto,1994). However, there is paucity of
information on the effect of roasting techniques on chemical composition of sesame seeds. This study was designed to
determine the effect of open pan and microwave roasting on the chemical composition of sesame flour and physico-
chemical properties of its oil.
MATERIALS AND METHOD
Sample materials White sesame seeds (Sesamum indicum L.) were purchased from a local market in Oyo state, Nigeria and transported to the
laboratory in airtight polythene bags and stored under cool dry storage (4°C) condition until needed. All the chemicals and
reagents used in the study were of analytical grade.
Sample preparation Figure 1 shows the flow diagram for the preparation of the raw and roasted sesame seeds. The seeds were first cleaned by
removing extraneous materials such as chaff and stone, after which the unwholesome grains were removed by sorting.
Raw Sesame Flour (RSF) Whole sesame seeds were dehulled by soaking in water (1: 5 w/v) for 4 h at 29 ± 2°C according to the method reported by
Mohamed et al. (2007). The ruptured seed coats were then removed by rubbing with palms and washed with water. The
dehulled seeds were spread on trays and sundried for 4 h. The dried seeds were milled (Wiley mill, 30 mesh) to obtain raw
sesame flour (RSF) and stored in glass container.
Open pan Roasted Sesame Flour (ORSF) The dried dehulled sesame seeds (200g) were roasted in an open iron pan at a temperature of 75 – 85oC with continuous
stirring for 20 min until the seeds turned golden brown. After roasting, the seeds were allowed to cool to ambient
temperature, milled (Wiley mill, 30 mesh) to obtain open pan roasted sesame flour (ORSF) and stored in glass container.
Microwave Roasted Sesame Flour (MRSF)
The dried seeds (200g) were spread on the glass plate of a domestic-size Beko microwave oven (BKMD 1550) capable of
generating 1330 watt powers at 2450 MHz. The microwave oven used operates at a frequency of 2450 MHz, with 1330,
931, 665 and 399 watts of output with power levels of high, medium high, medium and defrost, respectively. Samples were
microwave treated at medium power level (665W) for 10 min. Each time the plate of the microwave oven contained 200
grams of seeds with a depth of 1 cm. After roasting, the seeds were allowed to cool to ambient temperature, milled (Wiley
mill, 30 mesh) to obtain microwave roasted sesame flour (MRSF) and stored in glass container.
Chemical Analysis
Proximate Analysis Proximate analysis was determined following the standard methods of the Association of Official Analytical Chemists
(AOAC, 2005). Different samples were analysed in triplicate and the results were reported as means. Total carbohydrate
content was calculated from the difference. The energy value was estimated (kcal/100g) following the method as described
by Ekanayake et al. (1999).
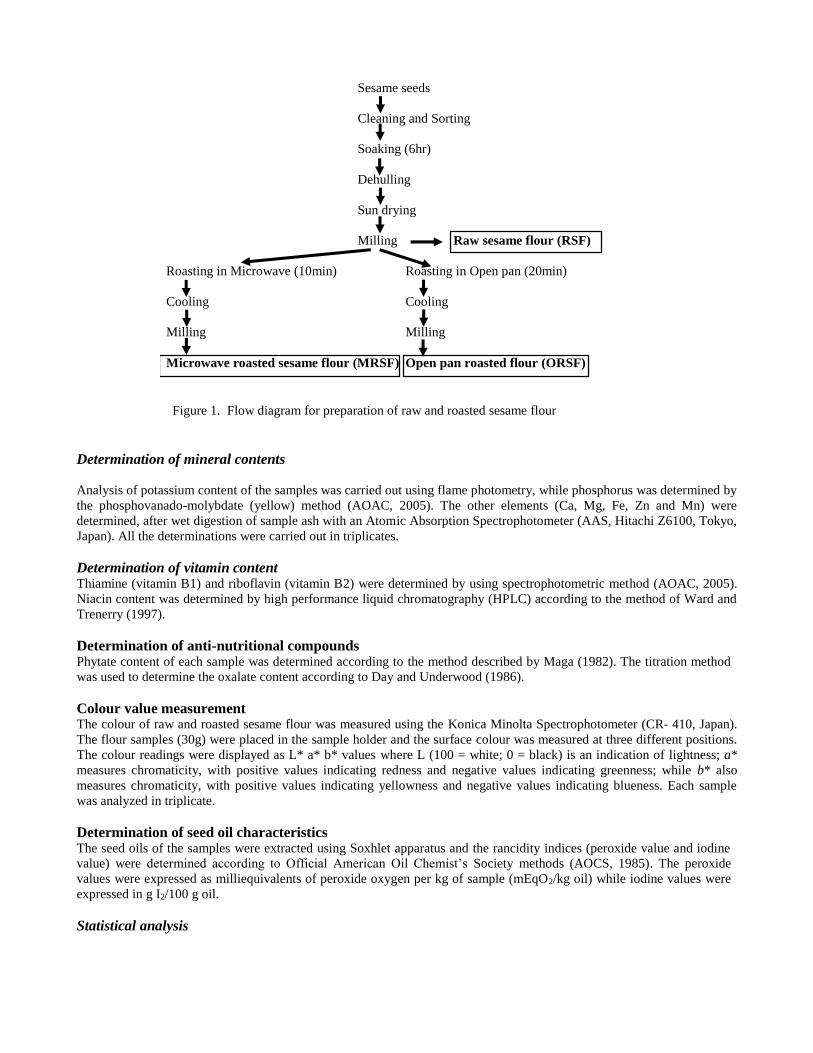
Figure 1. Flow diagram for preparation of raw and roasted sesame flour
Determination of mineral contents
Analysis of potassium content of the samples was carried out using flame photometry, while phosphorus was determined by
the phosphovanado-molybdate (yellow) method (AOAC, 2005). The other elements (Ca, Mg, Fe, Zn and Mn) were
determined, after wet digestion of sample ash with an Atomic Absorption Spectrophotometer (AAS, Hitachi Z6100, Tokyo,
Japan). All the determinations were carried out in triplicates.
Determination of vitamin content Thiamine (vitamin B1) and riboflavin (vitamin B2) were determined by using spectrophotometric method (AOAC, 2005).
Niacin content was determined by high performance liquid chromatography (HPLC) according to the method of Ward and
Trenerry (1997).
Determination of anti-nutritional compounds Phytate content of each sample was determined according to the method described by Maga (1982). The titration method
was used to determine the oxalate content according to Day and Underwood (1986).
Colour value measurement The colour of raw and roasted sesame flour was measured using the Konica Minolta Spectrophotometer (CR- 410, Japan).
The flour samples (30g) were placed in the sample holder and the surface colour was measured at three different positions.
The colour readings were displayed as L* a* b* values where L (100 = white; 0 = black) is an indication of lightness; a*
measures chromaticity, with positive values indicating redness and negative values indicating greenness; while b* also
measures chromaticity, with positive values indicating yellowness and negative values indicating blueness. Each sample
was analyzed in triplicate.
Determination of seed oil characteristics The seed oils of the samples were extracted using Soxhlet apparatus and the rancidity indices (peroxide value and iodine
value) were determined according to Official American Oil Chemist’s Society methods (AOCS, 1985). The peroxide
values were expressed as milliequivalents of peroxide oxygen per kg of sample (mEqO2/kg oil) while iodine values were
expressed in g I2/100 g oil.
Statistical analysis
Sesame seeds
Cleaning and Sorting
Soaking (6hr)
Dehulling
Sun drying
Milling Raw sesame flour (RSF)
Roasting in Microwave (10min) Roasting in Open pan (20min)
Cooling Cooling
Milling Milling
Microwave roasted sesame flour (MRSF) Open pan roasted flour (ORSF)
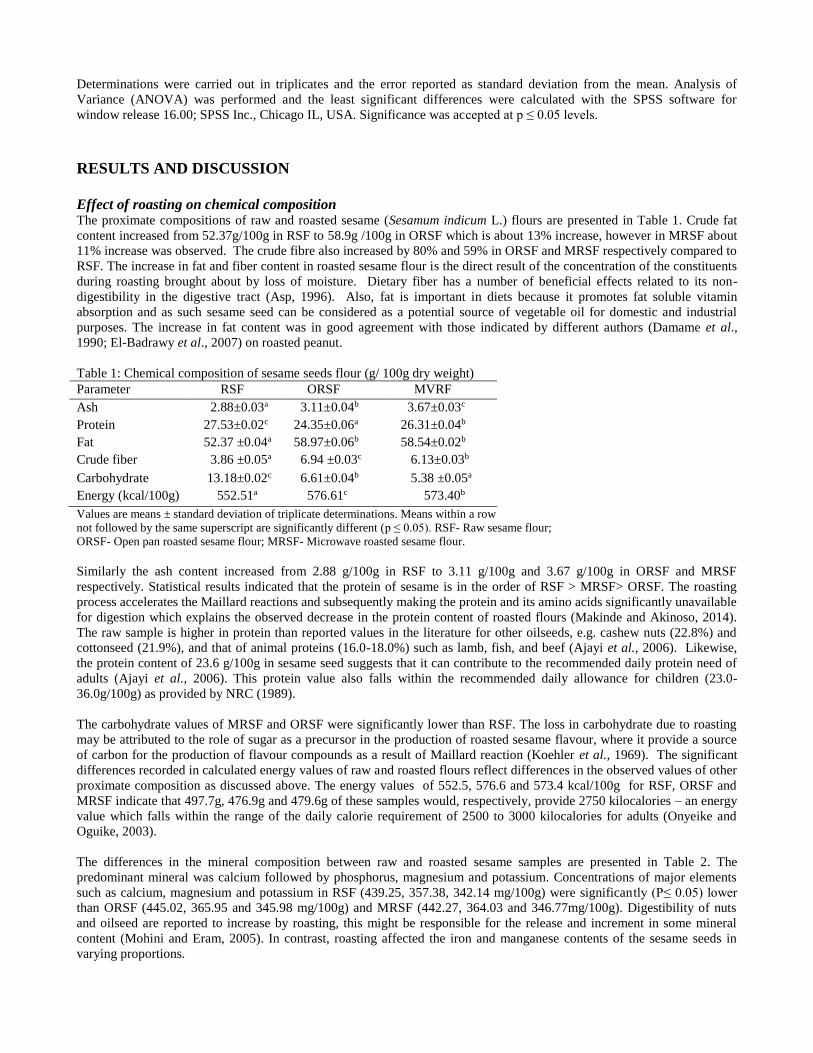
Determinations were carried out in triplicates and the error reported as standard deviation from the mean. Analysis of
Variance (ANOVA) was performed and the least significant differences were calculated with the SPSS software for
window release 16.00; SPSS Inc., Chicago IL, USA. Significance was accepted at p ≤ 0.05 levels.
RESULTS AND DISCUSSION
Effect of roasting on chemical composition The proximate compositions of raw and roasted sesame (Sesamum indicum L.) flours are presented in Table 1. Crude fat
content increased from 52.37g/100g in RSF to 58.9g /100g in ORSF which is about 13% increase, however in MRSF about
11% increase was observed. The crude fibre also increased by 80% and 59% in ORSF and MRSF respectively compared to
RSF. The increase in fat and fiber content in roasted sesame flour is the direct result of the concentration of the constituents
during roasting brought about by loss of moisture. Dietary fiber has a number of beneficial effects related to its non-
digestibility in the digestive tract (Asp, 1996). Also, fat is important in diets because it promotes fat soluble vitamin
absorption and as such sesame seed can be considered as a potential source of vegetable oil for domestic and industrial
purposes. The increase in fat content was in good agreement with those indicated by different authors (Damame et al.,
1990; El-Badrawy et al., 2007) on roasted peanut.
Table 1: Chemical composition of sesame seeds flour (g/ 100g dry weight)
Parameter RSF ORSF MVRF
Ash 2.88±0.03a 3.11±0.04b 3.67±0.03c
Protein 27.53±0.02c 24.35±0.06a 26.31±0.04b
Fat 52.37 ±0.04a 58.97±0.06b 58.54±0.02b
Crude fiber 3.86 ±0.05a 6.94 ±0.03c 6.13±0.03b
Carbohydrate 13.18±0.02c 6.61±0.04b 5.38 ±0.05a
Energy (kcal/100g) 552.51a 576.61c 573.40b
Values are means ± standard deviation of triplicate determinations. Means within a row
not followed by the same superscript are significantly different (p ≤ 0.05). RSF- Raw sesame flour;
ORSF- Open pan roasted sesame flour; MRSF- Microwave roasted sesame flour.
Similarly the ash content increased from 2.88 g/100g in RSF to 3.11 g/100g and 3.67 g/100g in ORSF and MRSF
respectively. Statistical results indicated that the protein of sesame is in the order of RSF > MRSF> ORSF. The roasting
process accelerates the Maillard reactions and subsequently making the protein and its amino acids significantly unavailable
for digestion which explains the observed decrease in the protein content of roasted flours (Makinde and Akinoso, 2014).
The raw sample is higher in protein than reported values in the literature for other oilseeds, e.g. cashew nuts (22.8%) and
cottonseed (21.9%), and that of animal proteins (16.0-18.0%) such as lamb, fish, and beef (Ajayi et al., 2006). Likewise,
the protein content of 23.6 g/100g in sesame seed suggests that it can contribute to the recommended daily protein need of
adults (Ajayi et al., 2006). This protein value also falls within the recommended daily allowance for children (23.0-
36.0g/100g) as provided by NRC (1989).
The carbohydrate values of MRSF and ORSF were significantly lower than RSF. The loss in carbohydrate due to roasting
may be attributed to the role of sugar as a precursor in the production of roasted sesame flavour, where it provide a source
of carbon for the production of flavour compounds as a result of Maillard reaction (Koehler et al., 1969). The significant
differences recorded in calculated energy values of raw and roasted flours reflect differences in the observed values of other
proximate composition as discussed above. The energy values of 552.5, 576.6 and 573.4 kcal/100g for RSF, ORSF and
MRSF indicate that 497.7g, 476.9g and 479.6g of these samples would, respectively, provide 2750 kilocalories – an energy
value which falls within the range of the daily calorie requirement of 2500 to 3000 kilocalories for adults (Onyeike and
Oguike, 2003).
The differences in the mineral composition between raw and roasted sesame samples are presented in Table 2. The
predominant mineral was calcium followed by phosphorus, magnesium and potassium. Concentrations of major elements
such as calcium, magnesium and potassium in RSF (439.25, 357.38, 342.14 mg/100g) were significantly (P≤ 0.05) lower
than ORSF (445.02, 365.95 and 345.98 mg/100g) and MRSF (442.27, 364.03 and 346.77mg/100g). Digestibility of nuts
and oilseed are reported to increase by roasting, this might be responsible for the release and increment in some mineral
content (Mohini and Eram, 2005). In contrast, roasting affected the iron and manganese contents of the sesame seeds in
varying proportions.
Table 2. Mineral composition of sesame seeds flour samples (mg/ 100g dry weight)
Sample RSF ORSF MRSF
Ca 439.25±1.00a 445.02±0.58c 442.27±0.43b
Mg 357.38±0.54 a 365.95±0.51c 364.03±0.63b
K 342.14±0.69 a 345.98±0.47b 346.77±0.52c
P 434.77±0.97c 428.46±0.64b 427.81±0.72a
Fe 6.42±0.02c 4.98±0.04b 3.06±0.03a
Mn 1.50±0.02c 0.87±0.03b 0.76±0.01a
Zn 2.79±0.04a 3.07±0.04b 3.62±0.05c
Ca/P 1.01a 1.04a 1.03a
K/(Ca+Mg) 0.43a 0.43a 0.43a Values are means ± standard deviation of triplicate determinations.
Means within a row not followed by the same superscript are significantly different (p ≤ 0.05).
RSF- Raw sesame flour; ORSF- Open pan roasted sesame flour; MRSF- Microwave roasted sesame flour
The results also showed that iron content of RSF was 6.42 mg/100g while it reduced to 4.98 and 3.06 mg/100g in ORSF
and MRSF respectively. Similarly, the manganese content of RSF was 1.50 mg/100g while 0.87 and 0.76 mg/100g were
recorded for ORSF and MRSF respectively. The ratio of Ca/P of the flour samples range between 1.01 for RSF, 1.04 for
ORSF and 1.03 for MRSF respectively. The ratio of Ca/P indicated that raw and roasted sesame were good sources of these
essential mineral elements as food products containing Ca/P ratio of greater than 1.0 is rated good, while less than 0.5 is
rated poor (Nieman et al., 1992). The same value (0.43) was recorded for [K/ (Ca+Mg)] ratio of RSF, ORSF and MRSF.
The ratio is of great concern for the prevention of disease known as hypomagnesaemia. The milliequivalent of [K/
(Ca+Mg)] of less than 2.2 is recommended in food sample (Marten et al., 1987); hence consumption of raw and roasted
sesame flour may not lead to hypomagnesaemia.
There was significant reduction in vitamin content of sesame when subjected to roasting as presented in Table 3.
Riboflavin level decreased by almost 25.40%, thiamine by 47.60% and niacin by 42.4% respectively in ORSF compared
to RSF. Similarly, 15.86% riboflavin, 29.70% thiamine and 31.42% niacin were lost in MRSF. Results showed that
roasting significantly affected vitamin content of sesame seed. Nutritional substances, such as vitamins and amino acids,
may be destroyed or they can be blocked by reactions with other ingredients during roasting.
Table 3. Vitamin content of sesame seed flours (mg/Kg dry weight)
Sample RSF ORSF MRSF
Thiamine 40.23±0.18c 21.08±0.15a 28.28±0.20b
Riboflavin 20.56±0.24c 15.33±0.07a 17.30±0.12b
Niacin 4.52±0.03c 2.60±0.01a 3.10±0.02b
Values are means ± standard deviation of triplicate determinations
Means within a row not followed by the same superscript are significantly different (p ≤ 0.05).
RSF- Raw sesame flour; ORSF- Open pan roasted sesame flour; MRSF- Microwave roasted sesame flour
The anti-nutritional factors of raw and roasted sesame flours are presented in Table 4. The values of oxalate were 63.70,
15.16 and 17.50mg/100g for RSF, ORSF and MRSF respectively. Microwave roasting reduced the oxalate content by
72.5% with open pan roasting causing further decrease (76.30%) in the activity of this anti nutrient. The significant loss of
oxalate in ORSF and MRSF could be attributed to the destruction of the oxalate at high temperature as oxalates were heat
labile. Similar to oxalate reduction activity, roasting process caused significant decrease in phytate level. It was reduced
up to 80.23% in ORSF and 68.72% in MRSF. The reduction of phytate concentration is an indication of chemical
degradation of phytate to lower inositol phosphates and inositol or cleavage of the phytate ring itself during roasting (Chen
and Betty, 2003). The reduction in phytate and oxalate levels could be interpreted as the main reason for the observed
increase in the concentrations of some of the minerals during roasting.
Table 4. Anti-nutrient concentration of sesame seed flour (mg/ 100g dry weight)
Sample RSF ORSF MRSF
Phytate 25.64±0.42c 5.07±0.03a 8.02±0.04b
Oxalate 63.70±0.11c 15.16±0.03a 17.50±0.05b
Values are means ± standard deviation of triplicate determinations
Means within a row not followed by the same superscript are significantly different (p ≤ 0.05). RSF- Raw sesame flour; ORSF- Open pan roasted sesame flour; MRSF- Microwave roasted sesame flour
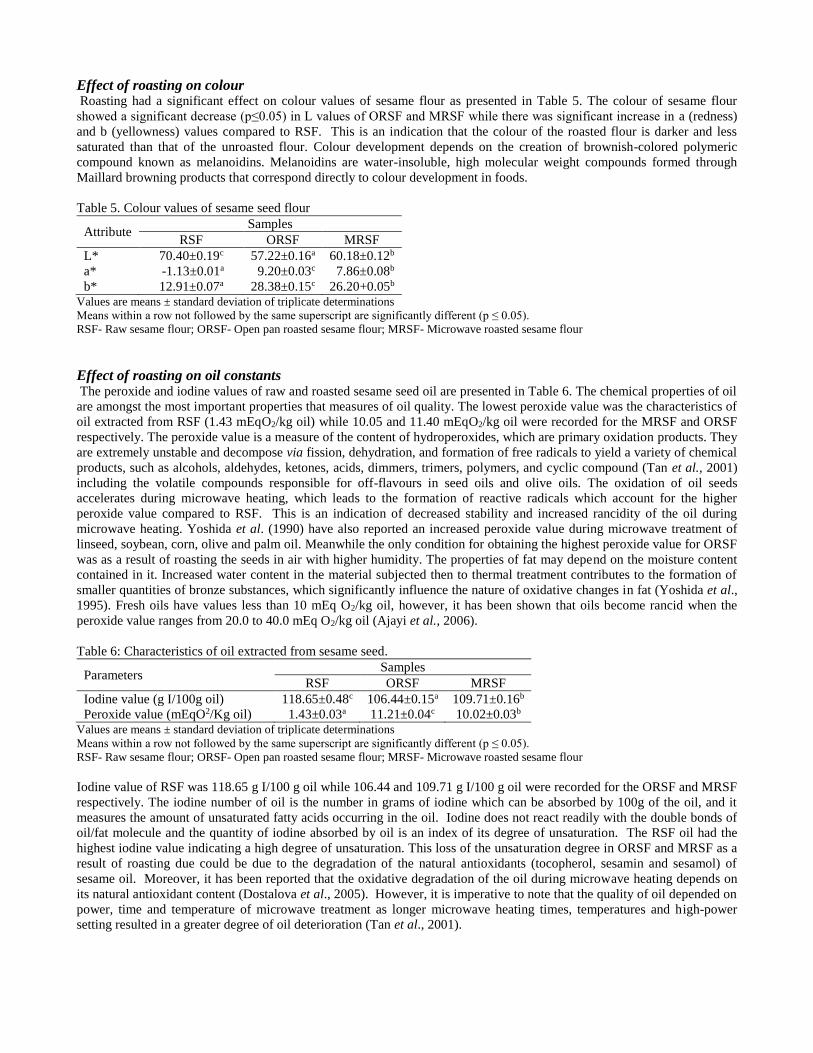
Effect of roasting on colour Roasting had a significant effect on colour values of sesame flour as presented in Table 5. The colour of sesame flour
showed a significant decrease (p≤0.05) in L values of ORSF and MRSF while there was significant increase in a (redness)
and b (yellowness) values compared to RSF. This is an indication that the colour of the roasted flour is darker and less
saturated than that of the unroasted flour. Colour development depends on the creation of brownish-colored polymeric
compound known as melanoidins. Melanoidins are water-insoluble, high molecular weight compounds formed through
Maillard browning products that correspond directly to colour development in foods.
Table 5. Colour values of sesame seed flour
Attribute Samples
RSF ORSF MRSF
L* 70.40±0.19c 57.22±0.16a 60.18±0.12b
a* -1.13±0.01a 9.20±0.03c 7.86±0.08b
b* 12.91±0.07a 28.38±0.15c 26.20+0.05b Values are means ± standard deviation of triplicate determinations
Means within a row not followed by the same superscript are significantly different (p ≤ 0.05).
RSF- Raw sesame flour; ORSF- Open pan roasted sesame flour; MRSF- Microwave roasted sesame flour
Effect of roasting on oil constants The peroxide and iodine values of raw and roasted sesame seed oil are presented in Table 6. The chemical properties of oil
are amongst the most important properties that measures of oil quality. The lowest peroxide value was the characteristics of
oil extracted from RSF (1.43 mEqO2/kg oil) while 10.05 and 11.40 mEqO2/kg oil were recorded for the MRSF and ORSF
respectively. The peroxide value is a measure of the content of hydroperoxides, which are primary oxidation products. They
are extremely unstable and decompose via fission, dehydration, and formation of free radicals to yield a variety of chemical
products, such as alcohols, aldehydes, ketones, acids, dimmers, trimers, polymers, and cyclic compound (Tan et al., 2001)
including the volatile compounds responsible for off-flavours in seed oils and olive oils. The oxidation of oil seeds
accelerates during microwave heating, which leads to the formation of reactive radicals which account for the higher
peroxide value compared to RSF. This is an indication of decreased stability and increased rancidity of the oil during
microwave heating. Yoshida et al. (1990) have also reported an increased peroxide value during microwave treatment of
linseed, soybean, corn, olive and palm oil. Meanwhile the only condition for obtaining the highest peroxide value for ORSF
was as a result of roasting the seeds in air with higher humidity. The properties of fat may depend on the moisture content
contained in it. Increased water content in the material subjected then to thermal treatment contributes to the formation of
smaller quantities of bronze substances, which significantly influence the nature of oxidative changes in fat (Yoshida et al.,
1995). Fresh oils have values less than 10 mEq O2/kg oil, however, it has been shown that oils become rancid when the
peroxide value ranges from 20.0 to 40.0 mEq O2/kg oil (Ajayi et al., 2006).
Table 6: Characteristics of oil extracted from sesame seed.
Parameters Samples
RSF ORSF MRSF
Iodine value (g I/100g oil) 118.65±0.48c 106.44±0.15a 109.71±0.16b
Peroxide value (mEqO2/Kg oil) 1.43±0.03a 11.21±0.04c 10.02±0.03b Values are means ± standard deviation of triplicate determinations
Means within a row not followed by the same superscript are significantly different (p ≤ 0.05).
RSF- Raw sesame flour; ORSF- Open pan roasted sesame flour; MRSF- Microwave roasted sesame flour
Iodine value of RSF was 118.65 g I/100 g oil while 106.44 and 109.71 g I/100 g oil were recorded for the ORSF and MRSF
respectively. The iodine number of oil is the number in grams of iodine which can be absorbed by 100g of the oil, and it
measures the amount of unsaturated fatty acids occurring in the oil. Iodine does not react readily with the double bonds of
oil/fat molecule and the quantity of iodine absorbed by oil is an index of its degree of unsaturation. The RSF oil had the
highest iodine value indicating a high degree of unsaturation. This loss of the unsaturation degree in ORSF and MRSF as a
result of roasting due could be due to the degradation of the natural antioxidants (tocopherol, sesamin and sesamol) of
sesame oil. Moreover, it has been reported that the oxidative degradation of the oil during microwave heating depends on
its natural antioxidant content (Dostalova et al., 2005). However, it is imperative to note that the quality of oil depended on
power, time and temperature of microwave treatment as longer microwave heating times, temperatures and high-power
setting resulted in a greater degree of oil deterioration (Tan et al., 2001).
CONCLUSIONS
This work has shown that significant improvement in the nutritional value of Sesamum indicum can be attained through
roasting of the seeds prior to conversion into flour. However, open pan roasting offers greater reduction of inherent anti
nutrients (phytate and oxalate), over its microwave counterpart. Extracted oil from open pan and microwave roasted seeds
showed similar characteristics but significantly different from that of raw sesame oil, indicating that quality of oil is
affected by roasting treatment. The present study indicates that microwave roasting can be used as a desirable energy -
saving alternative to open pan roasting technique of sesame seeds; however, further study is needed to evaluate the cost of
this process, as well as the technical feasibility of setting up an industrial process.
REFERENCES
Ajayi, I.A., Oderinde, R.A., Kajogbola, D.O. and Uponi, J. I. (2006). Oil Content and Fatty Acid Composition of Some
Underutilized Legumes from Nigeria. Food Chemistry 99: 115–120.
AOAC. (2005). Official Methods of Analysis. 19th Edn. Association of Official Analytical Chemists, Washington, DC.,
USA.
AOCS. (1985). The Official and Tentative Methods of The American Oil Chemist’s Society, 3rd Ed. American Oil
Chemist’s Society. 508 South Sixth Street, Champaign, Illinois.
Asp, N.G. (1996). Dietary carbohydrate, classification by chemistry and physiology. Food Chemistry 1: 9-14.
Chen, Q. and Betty, W. (2003). Separation of phytic acid and other related inositol phosphates by high-performance ion
chromatography and its applications. Journal of Chromatography. 1018: 41–52.
Damame, S.V., Chavan, J.K. and Kadam, S.S. (1990). Effects of roasting and storage on proteins and oil in peanut kernels.
Plant Foods for Human Nutrition 40: 143–148.
Day, R.A and Underwood, A.L. (1986). Qualitative Analysis. 5th Ed. New Delhi, India: Prentice Hall Publications. 701.
Dostálová, J., Hanzlík, P., Réblová, Z. and Pokorný, J. 2005. Oxidative changes of vegetable oils during microwave
heating. Czech Journal of Food Sciences 23:230–239.
Ekanayake, S., Jansz, E.R. and Nair B.M. (1999). Proximate composition, mineral and amino acid content of mature
Canavalia gladiata seeds. Food Chemistry 66: 115-119.
El-Badrawy, E.E.Y., El-Zainy, A.R.M., Shalaby, A.O. and El-Sayed, N.Y. (2007). Effect of microwave roasting on
chemical composition of peanut seeds and comparing it with the ordinary roasting process. Proceeding of Annual
Conference Credit and Accreditation, Faculty of Specific Education, Mansoura University, Egypt, 938-957.
Fukuda, Y., Nagata, M., Osawa, T. and Namika, M., (1986). Chemical aspects of the antioxidative activity of roasted
sesame seed oil, and the effect of using the oil for frying. Agricultural and Biological Chemistry 50(4): 857-862.
Koehlar, P., Mason, M. E. and Newell, J. A. 1969. Formation of pyrazine compounds in sugar –amino acid model system.
Journal of Agricultural and Food Chemistry 17:393-396.
Langham, D. R., Riney, J., Smith, G. and Wiemers, T. (2008). Sesame Harvest Guide,
www.sesaco.net/Harvest%20pamphlet%20080903%20final%20b.pdf on 8/9/2008.
Maga, J.A. (1982). Phytates: Its chemistry, occurrence, food interactions. Nutritional significance and method of analysis.
Journal of Agricultural and Food Chemistry 30 (1): 1-7.
Makinde F.M. and Akinoso R. (2014). Comparison between the nutritional quality of flour obtained from raw, roasted and
fermented sesame (Sesamum indicum L.) seed grown in Nigeria. ACTA Scientiarum Polonorum Technologia
Alimentaria 13(3): 309-319.
Makinde, F.M. and Akinoso, R. (2013). Nutrient composition and effect of processing treatments on anti-nutritional factors
of Nigerian sesame (Sesamum indicum Linn) cultivars. International Food Research Journal 20(5): 2293-2300.
Mariod A.A., Suryaputra S., Hanafi M., Rohmana T., Kardono L.B.S. and Herwan T. (2013). Effect of different processing
techniques on Indonesian Roselle (Hibiscus radiates) seed constituents. ACTA Scientiarum Polonorum Technologia
Alimentaria 12(4):359-364.
Marten, G. C., Sheaffer, C. C. and D. L. Wyse, D. L. (1987). Forage nutritive value and palatability of perennial weeds.
Agronomy Journal 79: 980-986.
Miller, B.J., Billedeau, S.M. and Miller, D.W. (1989). Formation of N-nitrosamines in mirowaved verses skillet-fried bacon
containing nitrite. Food and Chemical Toxicology 27: 295-299.
Mohamed, E., Souhail, B., Olivier, R., Christophe, B. and Hamadi, A. (2007). Quality characteristics of sesame seeds and
by-products. Food Chemistry 103: 641-650.
Mohini, S. and Eram, S.R. 2005. Food Science-experiments and applications. CBS Publishers, 161:22-27.
Nakai, M., Harada, M., Nakahara, K., Akimoto, K., Shibata, H., Miki, W. and Kiso, Y. (2003). Novel antioxidative
metabolites in rat liver with ingested sesamin. Journal of Agricultural and Food Chemistry 51:1666-1670.
Nieman D.C., Butterworth D.E., Nieman C.N. (1992). Nutrition. WmC. Brown, Dbugye, USA, 237-312.
NRC, 1989. National Research Council. Recommended Dietary Allowances. 10th edn. National Academic Press,
Washington DC.
Onyeike, E.N. and Oguike, J.U. (2003). Influence of heat processing methods on the nutrient composition and lipid
characterization of groundnut (Arachis hypogaea) seed pastes. Nigerian Society for Experimental Biology 15 (1):
34-43.
Oplinger, E.S., Putnam, D.H., Kaminski, A.R., Hanson, C.V., Oelke, E.A., Schulte, E.E. and
Phillips, K. M., Ruggio, D. M. and Ashraf-Khorassani, M. 2005. Phytosterol composition of nuts and seeds commonly
consumed in the United States. Journal of Agricultural and Food Chemistry 53(24): 9436-9445.
Ricardo, M., Susana, C., Elsa, R. and José, A.P. (2011). Microwave Heating: A Time Saving Technology or a Way to
Induce Vegetable Oils Oxidation?, Advances in Induction and Microwave Heating of Mineral and Organic
Materials, Prof. Stanisław Grundas (Ed.), ISBN: 978-953-307-522-8, InTech, Available from:
http://www.intechopen.com/books/advan
Schlegel, W. (1992). Commercial pasteurization and sterilization of foods products using microwave technology. Food
Technology 46: 62-63.
Tan, C.P., Che Man, Y.B., Jinap, S. and Yusoff, M.S.A. (2001). Effects of microwave heating on changes in chemical and
thermal properties of vegetable oils. Innovative Food Science and Emerging Technologies 3: 157–163.
Ward, C.M. and Trenerry, V.C. (1997). The determination of niacin in cereals, meat and selected foods by capillary
electrophoresis and high performance liquid chromatography. Food Chemistry 60 (4): 667- 674.
Yen, G.C. and Shyu, S.L. (1989). Oxidative stability of sesame oil prepared from sesame seed with different roasting
temperatures. Food Chemistry 31: 215-224.
Yen, G.C., (1990). Influence of seed roasting process on the changes in composition and quality of sesame (Sesamum
indicum) oil. Journal of the Science of Food and Agriculture 50: 563-570.
Yoshida, H. and Kajimoto, G. (1994). Microwave heating affects composition and oxidative stability of sesame (Sesamum
indicum) oil. Journal of Food Science 59: 613–616.
Yoshida, H., Hirooka, N. and Kajimoto, G. (1990). Microwave energy effects on quality of some seed oils. Journal Food
Science 55: 1412-1416.
Yoshida, H., Mieno, A., Takagi, S., Yamaguchi, M. and Kajimoto, G. (1995). Microwave roasting effects on acyl lipids in
soybeans at different moisture content. Journal Food Science 60: 801-805.

Knowledge, Attitude and Practice of Mothers Regarding Iodized Salt in Selected Communities in
Ibadan, Oyo State
Esan Olukorede T.1 and Fadupin Grace T.2
1Home Economics and Food Science Department, University of Ilorin, Ilorin. Nigeria 2Human Nutrition Department, University of Ibadan, Ibadan. Nigeria
*Corresponding author: Email: [email protected]
ABSTRACT
Iodine deficiency disorder (IDD) is a public health problem in developing countries such as Nigeria and universal salt
iodization has been chosen to be the basic measure for sustainable elimination of IDD. This study evaluated the
knowledge, attitude and practice of mothers regarding iodized salt in selected communities in Ibadan. The study was
carried out among 250 purposively selected mothers of under-5 children in three randomly selected local government area
of Ibadan, Oyo state. Nigeria. A structured interview schedule was used to obtain relevant information from the
respondents. Data were analyzed using Statistical Package for Social Sciences version 15. Level of significance was 5%.
Chi square test was used to test for the relationship between variables. Less than a third (22.1%) had less than secondary
education. About52%were either full housewives or petty traders. Seventy nine percent have heard about iodized salt but
only 48.4% know the main sources of iodine was iodized salt while 51.6% had inadequate knowledge about the sources of
iodized salt. Most of the mother (58.0%) had positive attitude towards iodized salt. More than half of the mothers (53.2%)
had poor practices regarding iodized salt. Knowledge about iodized salt was found to be significantly associated with
usage of iodized. There was association between the attitude and consumption of iodized. The study showed that most
mothers with children under 5 years in Ibadan had positive attitude towards iodized salt, however, their knowledge and
practices were inadequate.
Keywords: attitude; iodized salt; knowledge; mothers of under-5; practice
INTRODUCTION
Iodine is required during the synthesis of thyroid hormones, which plays a determining role in the process of the early
growth and development of most organs, especially the brain, in human subjects during fetal and early post natal life
(Sebotsa et al., 2009). Iodine deficiency disorders (IDD) has been adopted to describe the spectrum of effects of iodine
deficiency that include goiter, endemic cretinism, psychomotor delay and increased pre- and post-natal mortality (Takele et
al., 2003). The consequences of iodine deficiency can be found at all stages of life, but mostly in vulnerable groups such as
children, adolescents and pregnant women (Dragan et al., 2006)
Globally, Iodine deficiency disorders (IDDs) are associated with many thyroid related diseases including hypothyroidism,
hyperthyroidism, goiter and cretinism and also inherit real risk of coronary artery diseases, autoimmune disorders,
psychiatric disorders, cognitive impairment and cancer. (Patrick, 2008, Verheesen and Schweitzer, 2008, Simone, 2010).
Iodine deficiency disorders remain a significant public health problem in many countries. Recent studies have shown that
over 200 million people in the world are affected by the most visible symptom of iodine deficiency disorder (Takele et al.,
2003). Globally, 30% of the world’s population is affected by iodine deficiency disorders and more than 150 million people
are affected in Africa alone. (Takele et al.,2003). According to World Health Organisation estimates, goiter is present in
28.3% of the African population and approximately 25% of the global burden of iodine deficiency as measured by
disability-adjusted life years (DALYS) occurs in Africa (Okosieme, 2006). Lar et al (2007) reported that goiter rate in
Nigeria was between 15% and 59% which still makes it a public health problem. The prevalence of iodine deficiency
disorders was established by measurement of total goiter rate and the total goiter rate for Nigeria was put at 20%, thereby
generating public health concern (Egbuta et al., 2002).
The most effective preventive measures against iodine deficiency disorder is universal salt iodization recommended by the
International Iodine Deficiency Disorders Elimination Program (Okosieme, 2006). All food-grade salt, used in household
and food processing should be fortified with iodine as a safe and effective strategy for the prevention and control of iodine

deficiency disorders in populations living in stable and emergency settings. (WHO, 2014).This study is therefore necessary
to provide information on the knowledge, attitude and practice of mothers regarding iodized salt in Ibadan, Oyo state.
MATERIALS AND METHODS
Provide sub-heading for this section
The descriptive study was carried out in three randomly selected local governments’ areas (LGA) which include: Ibadan
North Local Government, Ido Local Government and Ibadan South-East Local Government. A community was selected
from each of the selected LGA using simple random sampling technique. A systematic purposive sampling technique was
used to select households consisting of mothers with children under 5 years of age. The sampling unit was household and
after selection of first household by lottery method, every 4th household that have mothers with under 5 (U-5) children was
selected for the assessment of knowledge attitude and practice of mothers regarding iodized salt and iodine deficiency
disorders.
Eighty three percent of people who are familiar with iodized was used as prevalence and 95% confidence interval was used
to get minimums sample size. Using formula according to the Food and Agricultural Organization (1995) a sample size of
216 subjects was gotten which was rounded up to 250 subjects that were included in the study.
A pretested and validated structured, interview schedule was used to collect information on the socio-demographic
characteristics, knowledge, attitude and practice of mothers on iodized salt and iodine deficiency disorders.
Knowledge was assessed using ten questions relating to iodine deficiency disorder and iodized salt, every right answer was
scored 10 marks and every wrong answer was scored zero. Knowledge score was calculated for each respondent, a score of
50th percentile or less were categorized as inadequate knowledge while knowledge score above 50th percentile were
categorized adequate knowledge.
To assess respondents attitude towards iodized salt, 5-point likert scale was constructed by asking respondents series of
positive and negative statements to reflect underlying attitude in a variety of ways. Attitude statements had five possible
responses; strongly agree, agree, uncertain, strongly disagree, and disagree. For positive statements, response including
strongly agree and agree were categorized as positive attitude while strongly disagree, disagree and uncertain were
categorized as negative attitude and vice versa. Every right answer was scored twelve and half and every wrong answer
was scored zero. Marking the total attitude score summed up to hundred, those with score greater than 50th percentile were
rated to have positive attitude and those with score of 50th percentile and below were rated to have negative attitude.
Practices were assessed by asking questions about the cooking practices and habit of purchase of iodized salt. Every good
practice was scored 7.7 marks and wrong/ bad practice was scored zero. The practice score was calculated for each
respondent out of a hundred. Practice score above 50th percentile were labeled good practice while practice score of 50th
percentile and below were labeled poor practice.
Statistical analysis
Data obtained were analyzed using SPSS windows version 15. The level of significance was set at 5%. Descriptive
statistics was used to summarize the continuous variables while Chi square test was used to evaluate the relationship
between variables.
RESULTS
Table 1 shows the socio demographic status of the respondents. The mean age of respondents was 28years, most of the
mothers were petty traders, 11% of the respondents had no formal or primary education and a high percentage (71.7%) of
the respondents earned less than #15,000 monthly.
Knowledge of respondents on iodized salt and iodine deficiency disorder
Table 2 shows the knowledge of respondent. Majority (51.8%) of the respondents lacked knowledge of what iodine is; only
48.4% indicated that iodine is a mineral and knew that iodized salt is the main source of iodine in their foods, Also, 79.4%
of the respondents indicated that they have heard about iodized salt and 48.5% of the respondents identified iodized salt
through labeling, 28.7% identified iodized salt through the taste, 17.8% identified through texture while 5.0% identified it
through colour.
Attitude of Respondents Regarding Iodized Salt Table 3 shows the attitude of the mothers. Some (48.4%) usually buy iodized salt and less than half of the respondents
(47.6%) disagreed that iodized salt incure more cost,42.4% of the respondents .disagreed that food cooked with iodized salt
is less delicious,48.0% agreed to giving children iodized salt. More than half of the respondents (57.8%) agreed to using
iodized salt exclusively.

Table 1: Socio-demographic characteristics of the respondents.
Group Number Frequency Percentage
Age
16-25years 97 38.7
26-30years 107 42.8
Above 35 years 46 18.5
Place of Residence
Urban 84 33.6
Sub-Urban 82 32.8
Rural 84 33.6
Religion
Islam 77 30.6
Christianity 167 66.9
Traditional 6 2.5
Highest Level of Education
No Formal Education 28 11.1
Primary School 40 16
Secondary School 78 31.1
Tertiary Education 104 41.6
Employment Status
Full Housewife 37 14.6
Petty Trader 121 48.6
Employed 92 36.9
Household Income Per Month
Less than N5,000 73 29.2
N5,000-N10,000 69 27.5
N11,000-N15,000 37 15
N16,000-N20,000 23 9.2
Above N20,000 48 19.2
Type of Housing
Brick 30 12
Concrete 220 88
Total 250 100
Practice regarding iodized salt
Table 4 shows that less than average of the respondents (48.4%) indicated they usually read the label of the packaging
during purchase of salt and more than average (79.9%) of the respondents obtained their salt from local shops.
Table 5 shows that more than half (51.6%)of the respondents had inadequate knowledge about iodine and iodized salt,58%
of the respondents had positive attitude regarding iodized salt,53.2% of the respondents had poor practice towards iodized
salt.
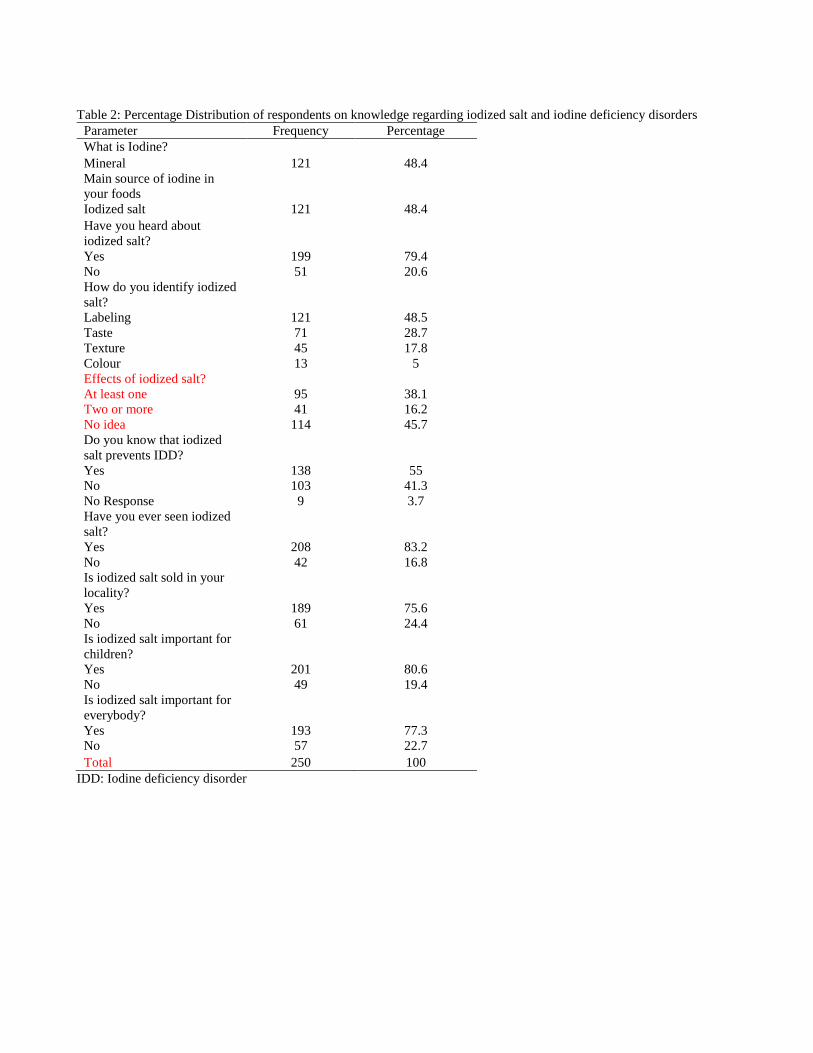
Table 2: Percentage Distribution of respondents on knowledge regarding iodized salt and iodine deficiency disorders
Parameter Frequency Percentage
What is Iodine?
Mineral 121 48.4
Main source of iodine in
your foods
Iodized salt 121 48.4
Have you heard about
iodized salt?
Yes 199 79.4
No 51 20.6
How do you identify iodized
salt?
Labeling 121 48.5
Taste 71 28.7
Texture 45 17.8
Colour 13 5
Effects of iodized salt?
At least one 95 38.1
Two or more 41 16.2
No idea 114 45.7
Do you know that iodized
salt prevents IDD?
Yes 138 55
No 103 41.3
No Response 9 3.7
Have you ever seen iodized
salt?
Yes 208 83.2
No 42 16.8
Is iodized salt sold in your
locality?
Yes 189 75.6
No 61 24.4
Is iodized salt important for
children?
Yes 201 80.6
No 49 19.4
Is iodized salt important for
everybody?
Yes 193 77.3
No 57 22.7
Total 250 100
IDD: Iodine deficiency disorder

Table 3: Attitude of Respondents Regarding Iodized Salt
Variables Agree Uncertain Disagree
Do you buy iodized salt? 121 (48.4$) - 129 (51.6%) Iodized salt incure more
cost than its benefits 21(8.4%) 110(44.0%) 119(47.6%)
Food prepared with iodized
salt taste less delicious than
non-iodized salt does
87(34.8%) 57(22.8%) 106(42.4%)
Giving iodized salt to
children is good for them 120(48.0%) 50(20.0%) 80(32.0%)
Iodized salt should be
handled and stored properly 171()68.4% 66(26.4%) 13(5.2%)
Iodized salt needs greater
care to store 152(65.0%) 71(30.3%) 11(4.7%)
Using iodized salt
exclusively 144(57.8%) 77(30.6%) 29(11.6%)
Every member of my family
should use iodized salt
exclusively
141(56.5%) 80(31.9%) 29(11.6%)
Iodine should be added to
table salt for preparing
meals
205(82.0%) 23(9.2%) 22(8.8%)
DISCUSSION
The results of this study showed that more than average (51.6%) of the respondents had inadequate knowledge of iodine
and iodized salt but more than half of the respondents were aware that iodized salt is important for children and pregnant
women and most of the respondents were aware of its health benefits. A similar result was reported by Dragan et al (2006)
who found that the participants were not well informed about the importance of using iodized salt in prevention of iodine
deficiency disorders. It was reported that only half of the participants in Dragan’s study (49.1%) knew of iodine deficiency
disorders. Most of them were familiar with goiter (70.2%) while only 14.5% are able to single out stillbirth as a
consequence of iodine deficiency disorders Similar result was also reported by Gul Nawaz Khan et al, (2012) that the
respondents were not well informed about the advantages of using iodised salt in prevention of IDDs. Most of them were
familiar with goiter, while 17.1% of the respondents in Sindh and 42.2 % in Punjab mentioned that use of iodised salt
helped to prevent goiter. With regard to the factors that influence the use of iodized salt and iodine consumption, the results
showed that literacy status and thorough awareness of IDD influence positively the usage of iodized salt (Okosieme, 2006)..
The result was contrary to the survey conducted by Palafox et al (2002)among school children, mothers/caregivers (of 1-5
years old children), pregnant and lactating women in selected Philippine, all the three groups of respondents were more
knowledgeable on the sources of the micronutrients than on the deficiency diseases arising from lack of a particular nutrient
The study further revealed that more than half (58.0%)of the mothers had positive attitude towards iodized salt and agreed
that iodized salt does not incure more cost than its benefits and it has no negative effect on the taste of food. Regardless of
the fact that not all the respondents are aware of iodine and its deficiencies, 82.3% of the respondents agreed to iodine being
added to table salt and this finding is similar to the study of Takele et al(2003) conducted among the food caterers and
shopkeepers which showed that half of the caterers (50.0%) and 80.0% of the shopkeepers had favorable attitude towards
iodized salt. Study on patients with hyperthyroidism in Free State of South Africa indicated that the patients agreed to
iodine being added to salt (Sebotsa et al., 2009). The results of this survey indicates that despite the inadequate knowledge
and positive attitude of the respondents toward iodized salt, 53.2% of the respondents had poor practices towards iodized
salt and this is similar to the study conducted by Takele etal (2003) who reported that higher education level was
significantly associated with good practices (no habit of sunlight exposure of salt) (P = 0.002), better education may
influence good practices therefore, the poor practice recorded in this study may be linked to the inadequate knowledge of
the mothers and this may suggest the need for more awareness and better education on iodine, iodized salt and the right
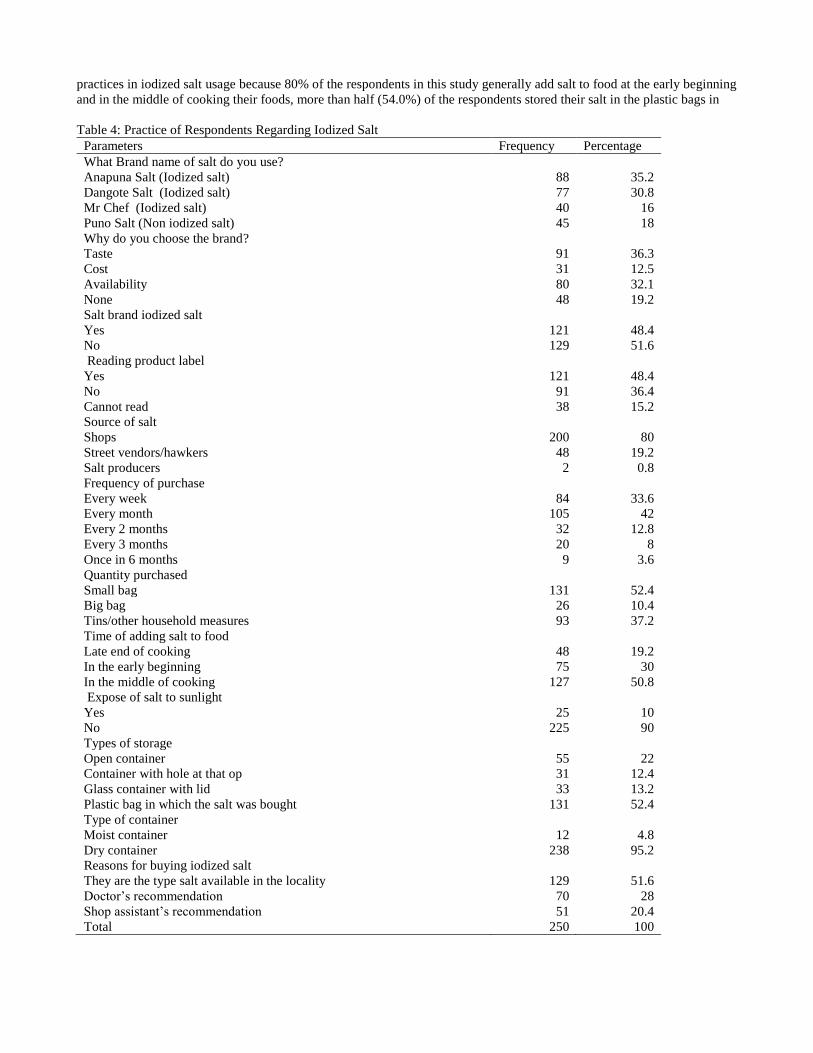
practices in iodized salt usage because 80% of the respondents in this study generally add salt to food at the early beginning
and in the middle of cooking their foods, more than half (54.0%) of the respondents stored their salt in the plastic bags in
Table 4: Practice of Respondents Regarding Iodized Salt
Parameters Frequency Percentage
What Brand name of salt do you use?
Anapuna Salt (Iodized salt) 88 35.2
Dangote Salt (Iodized salt) 77 30.8
Mr Chef (Iodized salt) 40 16
Puno Salt (Non iodized salt) 45 18
Why do you choose the brand?
Taste 91 36.3
Cost 31 12.5
Availability 80 32.1
None 48 19.2
Salt brand iodized salt
Yes 121 48.4
No 129 51.6
Reading product label
Yes 121 48.4
No 91 36.4
Cannot read 38 15.2
Source of salt
Shops 200 80
Street vendors/hawkers 48 19.2
Salt producers 2 0.8
Frequency of purchase
Every week 84 33.6
Every month 105 42
Every 2 months 32 12.8
Every 3 months 20 8
Once in 6 months 9 3.6
Quantity purchased
Small bag 131 52.4
Big bag 26 10.4
Tins/other household measures 93 37.2
Time of adding salt to food
Late end of cooking 48 19.2
In the early beginning 75 30
In the middle of cooking 127 50.8
Expose of salt to sunlight
Yes 25 10
No 225 90
Types of storage
Open container 55 22
Container with hole at that op 31 12.4
Glass container with lid 33 13.2
Plastic bag in which the salt was bought 131 52.4
Type of container
Moist container 12 4.8
Dry container 238 95.2
Reasons for buying iodized salt
They are the type salt available in the locality 129 51.6
Doctor’s recommendation 70 28
Shop assistant’s recommendation 51 20.4
Total 250 100
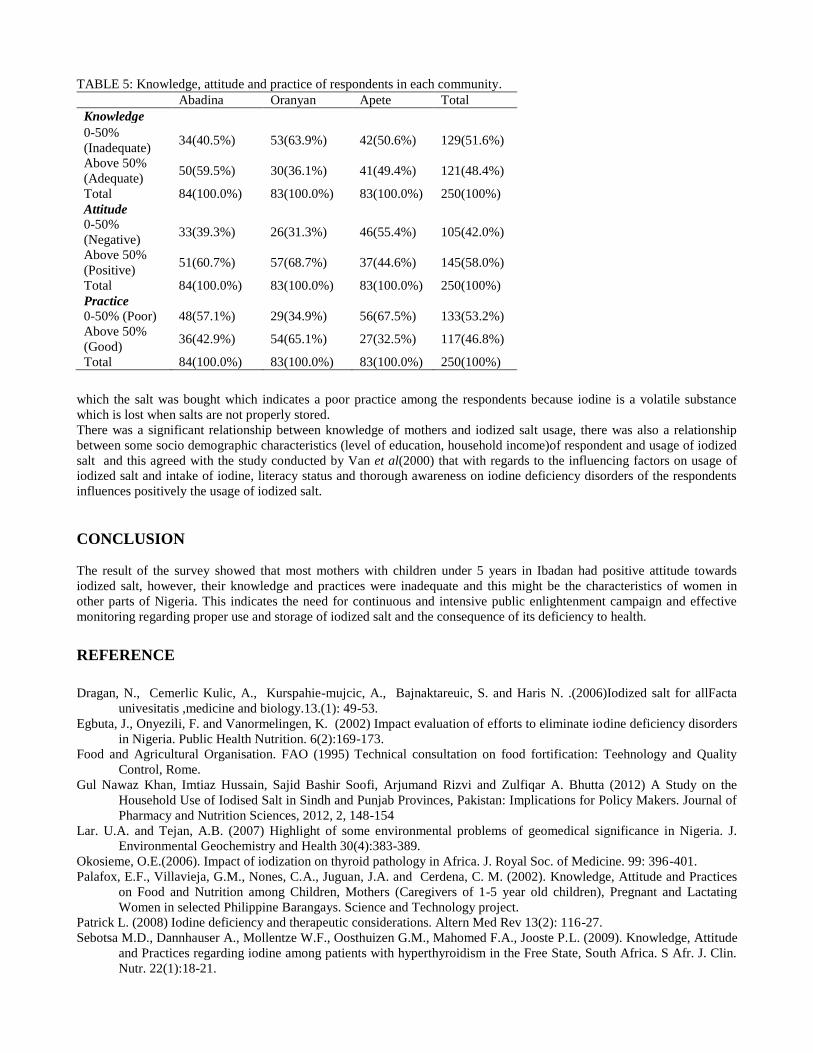
TABLE 5: Knowledge, attitude and practice of respondents in each community.
Abadina Oranyan Apete Total
Knowledge
0-50%
(Inadequate) 34(40.5%) 53(63.9%) 42(50.6%) 129(51.6%)
Above 50%
(Adequate) 50(59.5%) 30(36.1%) 41(49.4%) 121(48.4%)
Total 84(100.0%) 83(100.0%) 83(100.0%) 250(100%)
Attitude
0-50%
(Negative) 33(39.3%) 26(31.3%) 46(55.4%) 105(42.0%)
Above 50%
(Positive) 51(60.7%) 57(68.7%) 37(44.6%) 145(58.0%)
Total 84(100.0%) 83(100.0%) 83(100.0%) 250(100%)
Practice
0-50% (Poor) 48(57.1%) 29(34.9%) 56(67.5%) 133(53.2%)
Above 50%
(Good) 36(42.9%) 54(65.1%) 27(32.5%) 117(46.8%)
Total 84(100.0%) 83(100.0%) 83(100.0%) 250(100%)
which the salt was bought which indicates a poor practice among the respondents because iodine is a volatile substance
which is lost when salts are not properly stored.
There was a significant relationship between knowledge of mothers and iodized salt usage, there was also a relationship
between some socio demographic characteristics (level of education, household income)of respondent and usage of iodized
salt and this agreed with the study conducted by Van et al(2000) that with regards to the influencing factors on usage of
iodized salt and intake of iodine, literacy status and thorough awareness on iodine deficiency disorders of the respondents
influences positively the usage of iodized salt.
CONCLUSION
The result of the survey showed that most mothers with children under 5 years in Ibadan had positive attitude towards
iodized salt, however, their knowledge and practices were inadequate and this might be the characteristics of women in
other parts of Nigeria. This indicates the need for continuous and intensive public enlightenment campaign and effective
monitoring regarding proper use and storage of iodized salt and the consequence of its deficiency to health.
REFERENCE
Dragan, N., Cemerlic Kulic, A., Kurspahie-mujcic, A., Bajnaktareuic, S. and Haris N. .(2006)Iodized salt for allFacta
univesitatis ,medicine and biology.13.(1): 49-53.
Egbuta, J., Onyezili, F. and Vanormelingen, K. (2002) Impact evaluation of efforts to eliminate iodine deficiency disorders
in Nigeria. Public Health Nutrition. 6(2):169-173.
Food and Agricultural Organisation. FAO (1995) Technical consultation on food fortification: Teehnology and Quality
Control, Rome.
Gul Nawaz Khan, Imtiaz Hussain, Sajid Bashir Soofi, Arjumand Rizvi and Zulfiqar A. Bhutta (2012) A Study on the
Household Use of Iodised Salt in Sindh and Punjab Provinces, Pakistan: Implications for Policy Makers. Journal of
Pharmacy and Nutrition Sciences, 2012, 2, 148-154
Lar. U.A. and Tejan, A.B. (2007) Highlight of some environmental problems of geomedical significance in Nigeria. J.
Environmental Geochemistry and Health 30(4):383-389.
Okosieme, O.E.(2006). Impact of iodization on thyroid pathology in Africa. J. Royal Soc. of Medicine. 99: 396-401.
Palafox, E.F., Villavieja, G.M., Nones, C.A., Juguan, J.A. and Cerdena, C. M. (2002). Knowledge, Attitude and Practices
on Food and Nutrition among Children, Mothers (Caregivers of 1-5 year old children), Pregnant and Lactating
Women in selected Philippine Barangays. Science and Technology project.
Patrick L. (2008) Iodine deficiency and therapeutic considerations. Altern Med Rev 13(2): 116-27.
Sebotsa M.D., Dannhauser A., Mollentze W.F., Oosthuizen G.M., Mahomed F.A., Jooste P.L. (2009). Knowledge, Attitude
and Practices regarding iodine among patients with hyperthyroidism in the Free State, South Africa. S Afr. J. Clin.
Nutr. 22(1):18-21.

Simone Caramel. (2010) Coronary artery disease and CAD inherited real risk,
http://www.sisbq.org/uploads/5/6/8/7/5687930/ cad_caramel.pdf
Takele L., Belachew T. and Bekele T. (2003). Iodine concentration in salt at household and retail shop levels in Shebe
town, South west Ethiopia. East African Med. J. 80:532-539.
Van Binh T., Kim Uoc H. and Quang Toan L.(2000) Report on IDD control activities. UNICEF evaluation database.
Verheesen RH, Schweitzer CM. (2008) Iodine deficiency, more than cretinism and goiter. Med Hypotheses 71(5): 645-8.
World Health Organisation (2014). Fortification of food-grade salt with iodine for the prevention and control of iodine
deficiency disorders
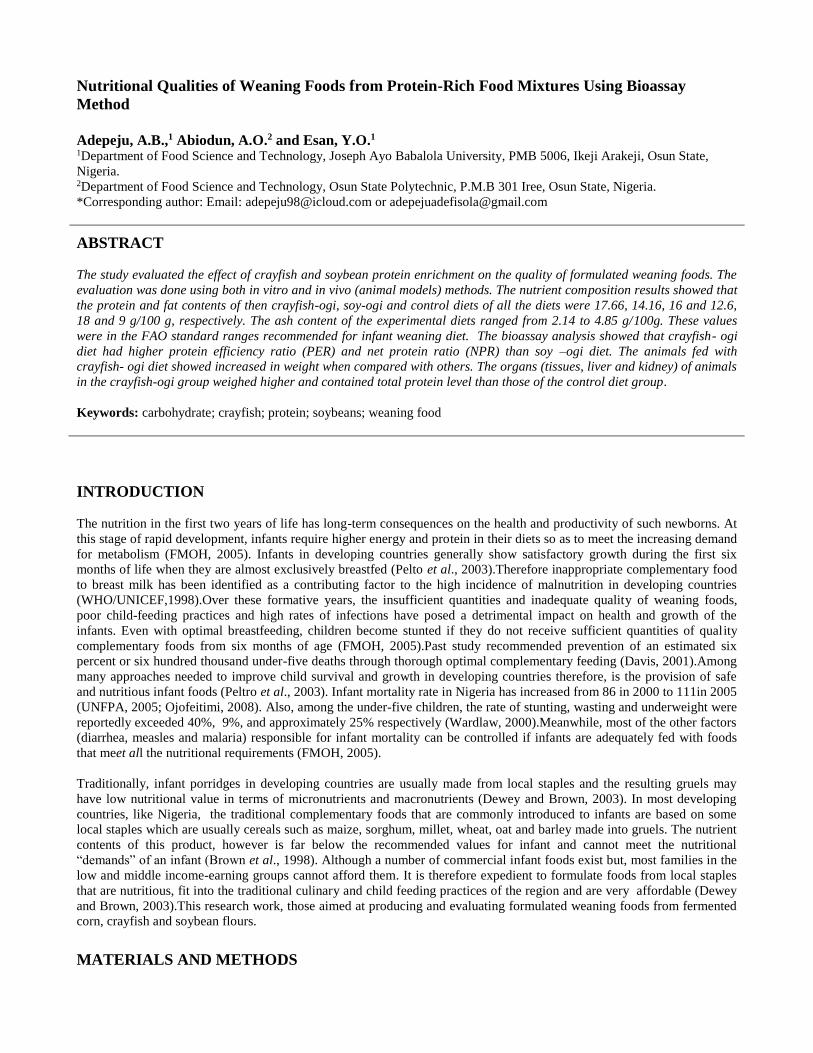
Nutritional Qualities of Weaning Foods from Protein-Rich Food Mixtures Using Bioassay
Method
Adepeju, A.B.,1 Abiodun, A.O.2 and Esan, Y.O.1 1Department of Food Science and Technology, Joseph Ayo Babalola University, PMB 5006, Ikeji Arakeji, Osun State,
Nigeria. 2Department of Food Science and Technology, Osun State Polytechnic, P.M.B 301 Iree, Osun State, Nigeria.
*Corresponding author: Email: [email protected] or [email protected]
ABSTRACT
The study evaluated the effect of crayfish and soybean protein enrichment on the quality of formulated weaning foods. The
evaluation was done using both in vitro and in vivo (animal models) methods. The nutrient composition results showed that
the protein and fat contents of then crayfish-ogi, soy-ogi and control diets of all the diets were 17.66, 14.16, 16 and 12.6,
18 and 9 g/100 g, respectively. The ash content of the experimental diets ranged from 2.14 to 4.85 g/100g. These values
were in the FAO standard ranges recommended for infant weaning diet. The bioassay analysis showed that crayfish- ogi
diet had higher protein efficiency ratio (PER) and net protein ratio (NPR) than soy –ogi diet. The animals fed with
crayfish- ogi diet showed increased in weight when compared with others. The organs (tissues, liver and kidney) of animals
in the crayfish-ogi group weighed higher and contained total protein level than those of the control diet group.
Keywords: carbohydrate; crayfish; protein; soybeans; weaning food
INTRODUCTION
The nutrition in the first two years of life has long-term consequences on the health and productivity of such newborns. At
this stage of rapid development, infants require higher energy and protein in their diets so as to meet the increasing demand
for metabolism (FMOH, 2005). Infants in developing countries generally show satisfactory growth during the first six
months of life when they are almost exclusively breastfed (Pelto et al., 2003).Therefore inappropriate complementary food
to breast milk has been identified as a contributing factor to the high incidence of malnutrition in developing countries
(WHO/UNICEF,1998).Over these formative years, the insufficient quantities and inadequate quality of weaning foods,
poor child-feeding practices and high rates of infections have posed a detrimental impact on health and growth of the
infants. Even with optimal breastfeeding, children become stunted if they do not receive sufficient quantities of quality
complementary foods from six months of age (FMOH, 2005).Past study recommended prevention of an estimated six
percent or six hundred thousand under-five deaths through thorough optimal complementary feeding (Davis, 2001).Among
many approaches needed to improve child survival and growth in developing countries therefore, is the provision of safe
and nutritious infant foods (Peltro et al., 2003). Infant mortality rate in Nigeria has increased from 86 in 2000 to 111in 2005
(UNFPA, 2005; Ojofeitimi, 2008). Also, among the under-five children, the rate of stunting, wasting and underweight were
reportedly exceeded 40%, 9%, and approximately 25% respectively (Wardlaw, 2000).Meanwhile, most of the other factors
(diarrhea, measles and malaria) responsible for infant mortality can be controlled if infants are adequately fed with foods
that meet all the nutritional requirements (FMOH, 2005).
Traditionally, infant porridges in developing countries are usually made from local staples and the resulting gruels may
have low nutritional value in terms of micronutrients and macronutrients (Dewey and Brown, 2003). In most developing
countries, like Nigeria, the traditional complementary foods that are commonly introduced to infants are based on some
local staples which are usually cereals such as maize, sorghum, millet, wheat, oat and barley made into gruels. The nutrient
contents of this product, however is far below the recommended values for infant and cannot meet the nutritional
“demands” of an infant (Brown et al., 1998). Although a number of commercial infant foods exist but, most families in the
low and middle income-earning groups cannot afford them. It is therefore expedient to formulate foods from local staples
that are nutritious, fit into the traditional culinary and child feeding practices of the region and are very affordable (Dewey
and Brown, 2003).This research work, those aimed at producing and evaluating formulated weaning foods from fermented
corn, crayfish and soybean flours.
MATERIALS AND METHODS

Sweet corn, and soybean were purchased at the Ife Central Market, fresh crayfish was obtained from Eko-ende in Ikirun,
Nigeria while Nutrend (control diet) was purchased from Infinity grace supermarket, Obafemi Awolowo University in
Ife. The vitamin and mineral mix used were from Pfizer Nigeria Plc. Twenty- five male and female albino rats (Wister
strain) were obtained from the Department of Pharmacy, Obafemi Awolowo University, Ile Ife, Nigeria.
Preparation of fermented corn flour
The grains were cleaned and steeped for 48 h to encourage fermentation. The fermented corn was then washed dried,
milled, sieved and packaged in a polythene bag and stored in the refrigerator for later use.
Preparation of soybean flour
The soybean seeds were sorted, cleaned and boiled for 30 mins. They were dehulled and thoroughly washed and dried in
the cabinet dryer (Gallenhamp SM 905, England) at 45 oC for 24 h. The dried soybean seed were cleaned by winnowing,
milled, sieved, packaged and stored in the refrigerator.
Preparation of crayfish flour
The crayfish was sorted and cleaned in water and unwanted materials were removed. It was dried at 45 oC for12 hrs. It was
milled, packaged and stored in the refrigerator.
Mineral and vitamin mixtures
The mineral mixture in gram per kilogram of the corn flour contain 5.40g calcium, 4.30g phophorus, 0.01g iron, 1.60g
sodium, 6.60g potassium, 0.035g zinc. All these were mixed for 10 min using kenwood mixer (Kenwood, A200, Britain).
The vitamin mixture in milligrams per 50 g of corn flour contained 3.0mg vitamin A, 0.60mg vitamin D, 300mg vitamin E,
350mg vitamin C, 0.25 mg folic acid, 8.0mg thiamine, 3.0mg riboflavin, 40mg niacin, 3.0mg vitamin B6, 0.075 mg vitamin
B12, 2.5mg biotin, 15.0mg pantothenate and starch to make up to 50g. They were all mixed for 10 min using kenwood
mixer (Kenwood, A200, Britain).
Preparation of the experimental diets The fermented corn flour was mixed in a Kenwood mixer (Kenwood, A200, Britain) for 10 min with sugar, vegetable oil,
cod liver oil, mineral and vitamin mix, to obtain the basal diet. Similar processing method was followed for the other diets
(Table 1).
Experimental animal
The 25 male and female albino rats were weighed and divided into five groups randomly until each group had
approximately same average weight. One group of five animals served as the control for the experimental group and was
sacrificed. Tissue from the liver, kidney and plantaris muscle of the hind-leg were removed, weighed and frozen till
nitrogen efficiency was determined. The remaining animals were placed on experimental diet fed ad libitum over a period
of 28days.
Analyses of the formulated diet and experimental animal
Proximate analyses of commercial (control) and experimental diet were carried out using AOAC (2005) methods. The
dietary intake and weight of the experimental animals were studied and the organs such as the muscle, liver and kidney
were collected and examined. The Net Protein Ratio (NPR) and Protein Efficiency Ratio (PER) were calculated.
RESULTS AND DISCUSSION
The nutrient composition of control and experimental diets were shown in Table 2. The result showed that the protein
contents of, the crayfish-ogi (17.66 g/100 g) and soy-ogi (14.16 g/100 g) diets compared well with the 16 g/100 g of control
diet. The protein contents of the experimental diets obtained in this study (14-18 g/100 g) meet the normal requirement
standards (12-20 g / 100 g) set for infant diet (FAO/WHO, 1992).it is noteworthy that both crayfish and soybean flours
increased the protein contents of Ogi by four and five times respectively, since Ogi was reported (Adepeju and Abiodun,
2011) to contain 3.40g/100 g protein .Meanwhile, the fat content of the crayfish-enriched diet (12.60 g / 100 g) is lower
than 18 g/100 g obtained for soybean-enriched diet. The difference may be due to the fact that soybean seeds are well
known as a good source of vegetable oil production. The fat content also meets the standard requirement (9-10 g/100 g) for
infant diet. The ash content of the experimental diets ranged from 2.14 to 4.85 g/100g. The value for crayfish-ogi was
higher when compared with that of the control diet (2.00 g/100g) while soy-ogi had a similar value with the control diet
(2.00 g/100 g). The moisture contents of all the diets (7.54-7.88 g/100 g) were higher than that of the control diet (4.00
g/100 g). However, these values still fall within the expected range for weaning diet which must not exceed 10%. The
carbohydrate content of the diets compared well with the control diet (64.00 g/100 g). The most favourable protein

efficiency ratio (PER) and net protein ratio (NPR) were apparent in all the groups. The values of PER in crayfish-ogi
exceeded the recommended value which is 2.1 (PAG, 1982) while soy-ogi and control diet fall below the recommended
requirement. The result of this work agreed with the report of Ahenkora et al., 1994).
Animal Feeding Experiment
During the 28 days experimental period the adaptation of the animals fed on each dietary sample and utilization of each diet
were studied and the result presented in Fig. I. The animals that depend on the basal diet for survival were found to become
leaner and weaker each passing day of the experiment. The physical changes were observed on the skin as well as in their
consumption rate. For instance, loss of weight was dramatic from average weight of 67.60 g at day one to 54.22 g at day
twenty eight (even animal loss was recorded in this group). On the other hand, the animals fed with other diets increased in
weight especially in the crayfish-ogi diet group followed by the control diet group (Fig.1) and this might be due to the fact
that crayfish is very nutritious as compared to other sources of protein. Meanwhile, the lower rates results recorded for soy-
ogi diet as compared to the control diet, might be due to the presence of antinutrients (such as oligosaccharides and protease
inhibitors) in soybean, which might rendered it bio-unavailable for metabolism. Past works had also reported the decrease
in weight of the animal fed on basal diet over a set period of time (Fashakin et al.,1991; Adepeju and Abiodun, 2011) . The
weight gained was largely influenced by the quality of protein constituents of the diet. Protein is required among other
things for growth, healthy living and maintenance and production of tissues and cells of the body (FMOH, 2005). The
current results supported the fact that ogi has a protein content of poor biological value which did not support growth in
rats. The results of the rate of diet consumption by the rats were presented in Table III. The rate at which crayfish-ogi, soy-
ogi and the control diets were consumed by the animals was low when compared with the basal diet, but highest in the
control diet towards the middle and to the end of the experiment than those of the animals from other experimental groups.
The tissues of animals fed on basal diet were smaller than those of animals from other experimental groups as shown in
Table IV. The livers, kidney and muscle of animals in the crayfish-ogi were found to have the highest total protein level
when compared to the control and soy-ogi diet groups (Table V).This work compared well with the work of Murray et al.,
(1993) who reported higher body weight and high kidney value for rat fed a high protein diet.
Table 1: Composition of experimental diet
Constituents Basal diet Crayfish
Ogi diet
Soybean
Ogi diet
Crayfish flour (g) - 200 -
Corn flour (g) 809 609 609
Soybean flour (g) - - 200
Vitamin premix (mg) 10 10 10
Mineral Premix (g) 16 16 16
Vegetable oil (g) 100 100 100
Cod liver oil (g) 5 5 5
Sugar (g) 60 60 60
Table 2: Chemical composition and energy values of experimental diets in g/100g of diet
Parameter Crayfish-Ogi Soybean-Ogi Control diet
Protein 17.66±0.88 14.16±0.40 16.00±0.20
Fat 12.60±0.33 18.00±0.20 9.00±0.50
Moisture 7.88±0.35 7.54±0.40 4.00±0.35
Values are Mean±SD

Fig.1. Average weight changes over the experimental period
Table 3: Food composition (g) over experimental period
Experimental
Period (days)
Diets
Basal Crayfish ogi Soy-ogi Control
7 33.2 32.44 32.74 31.62
14 74.78 70.62 66 73.34
21 114.7 109.7 110.19 119.88
28 155.54 149.34 148.39 165.54
Table 4: Weight of various tissues of Experimental animals
Tissues Zero day
Animal Basal Diet
Crayfish-
ogi Soy-ogi Control
Liver 2.42±0.11 1.33±0.12 3.60±0.10 2.62±0.12 2.70±0.45
Kidney 0.24±0.33 0.16±0.33 0.34±0.30 0.27±0.46 0.29±0.18
Muscle 0.62±0.42 0.26±0.19 0.72±0.12 0.65±0.24 0.68±0.12 The zero day animals (control) are the animals sacrificed on the first day of the experiment.
The tissues collected from these animals served as the initial level for the other animal’s tissues at the end of the experiment
Table 5: Total protein level (mg/N) in various tissues of experimental animals
Tissues
Zero day
Animal Basal Diet
Crayfish-
ogi Soy-ogi Control
Liver 80.47±0.24 37.43±0.12 192.60±0.20 125.11±0.20 132.98±0.20
Kidney 7.28±0.33 3.77±0.40 15.24±0.30 11.40±0.43 12.57±0.15
Muscle 18.31±0.42 6.50±0.20 35.45±0.10 27.94±0.18 31.79±0.20 The zero day animals (control) are the animals sacrificed on the first day of the experiment.
The tissues collected from these animals served as the initial level for the other animal’s tissues at the end of the experiment
CONCLUSION
Based on the findings of the investigation, it may be concluded that locally available protein-rich food resources have great
potentials in the formulation and preparation of infant weaning foods. The potential, viability, cheaper sources and readily
accessibility of crayfish-ogi and soy-ogi diets as the infant weaning diet formulations were fully exploited in this study.
Moreso, this will go a long way in ameliorating the usual symptoms (stunted growth, wasting of muscles, low height for
age) associated with protein energy malnutrition (PEM) that are commonly prevalent in the developing country.
REFERENCES
Adepeju, A.B. and Abiodun, O.A., (2011). Effect of protein rich foods mixtures on the quality of formulated weaning food
diet. International Research Journal of Biochemistry and Bioinformatics. 1 (5):114-118
Ahenkora, K.S., Iwumasi-Afriyie, W. Hagg and Dzah, B.D., (1994). Ghananian kenkey from normal and quality protein
maize comparative chemical composition and fat growth trials. Cereal Research communication. 23(3):299-304.
AOAC, (1990). Official Methods of Analysis. 15th Edn. Association Official Analytical
Chemists. Washington D.C
Brown, K.H., Dewey, K.G. and Allen, L.H., (1998). Complementary feeding of young children in developing countries: a
review of current scientific knowledge. Geneva: WHO/NUT/98.
Davis, M.K., (2001). Breastfeeding and chronic disease in childhood and adolescence. Ped. Clin. Amer.48:125-142.
Dewey, K.G and Brown, K.H., (2003). Update in Technical Issues concerning complementary feeding of young children in
development countries and implications for intervention programs. Food Nutr. Bulletin. 24:5-28.
FAO/WHO, (1992). International conference on Nutrition and Development- A Global Assessement, Rome. FAO.
Fashakin, J.B, Ilori M.O., Olanrewaju I.,(1991). Cost and quality optimization of a weaning diet from plant protein and
corn flour using a computer aided linear programming model. Nig. Food J. 9:123-127.
FMOH, (2005). Infant and Young Child Feeding in Nigeria- Guidelines. Federal Ministry of Health, Abuja.
Ojofeitimi, E.O., (2008). A Healthy Life: Your Birth right. An inaugural lecture series 2209. OAU press Ltd. OAU, Ile- Ife.
8th January, 2008.
PAG, (1982). Protein rich mixture for use as weaning foods. Protein Auditory Guidelines. No. 8. Food and Agriculture
Organisation of the United Nations Children’s funds.1-7.
Peltro, G.H, Levitt, E., and Thairu, L., (2003). Improving Feeding Practices. Current Patterns Common constraints and
Design of Intervention. Food and Nutrition Bulletin. 24:24-82.
UNFPA, (2005). Country profiles for population and reproductive health. Policy development and indicators 2005.
Population Reference Bureau. 1-9.
Wardlaw, G.M., (2000). Contemporary Nutrition Issues and Insights. 4th ed. McGraw- Hill Higher Education, USA:450-
475.
WHO/UNICEF., (1998). Complementary feeding of young children in developing countries: a review of current scientific
knowledge, WHO/NUT/98.1.
Physico-chemical, Nutritional and Sensory Characteristics of Chin-Chin made from Trifolate
Yam (Dioscorea dumentorum) Flour Enriched with Pumpkin Seeds (Telfaria occidentalis) Flour
Adelekan, A.O.*, Arisa, N.U. and Ogunseye, F.R.
Department of Food Technology and Nutrition, Bells University of Technology, P.M.B 1015, Ota, Ogun State, Nigeria.
*Corresponding author: Email: [email protected]
ABSTRACT
Trifoliate yam flour (Dioscorea dumentorum) was produced and enriched with pumpkin (Telfaria occidentalis) seed flour
at three substitution levels (10%, 15% and 20%) and processed into chin-chin, the quality of this product was compared
with the chin-chin made from Irish potato (Solanum tuberosum) flour. The flour was analysed for physico-chemical,
mineral, vitamins and anti-nutritional factors using standard procedures. The product made from the flour (Chin-chin) was
analyzed for proximate composition and sensory evaluation to determine its acceptability. Results showed that enrichment
of trifoliate yam flour with pumpkin seed flour increased the pH of the flour from 5.95 at 10% substitution to 6.03 at 15%
substitution level, while the protein content also increased from 14.23% (10% substitution) to 16.53% (20% substitution).
There was also an increase in fat content at the same substitution level. Potassium and Phosphorous also showed an
increase in their contents after enrichment. Tannin decreased from 5.34% at 10% substitution level to 3.86% at 15%
substitution. The overall acceptability showed that 10% substitution level had the highest rating and there was no
significant difference in the chin-chin made from the enriched flour (P>0.05).
Keywords: acceptability; enrichment; pumpkin seed flour; trifoliate yam flour
INTRODUCTION
The importance of yam in general has been communicated by various researchers. Manuel et al., (2005) reported yam to be
one of the principal foods in Nigeria, also an economically, socially and traditionally valuable crop in many tropical
countries predominantly in West African, South Asian and Caribbean continents. Yam has been reported to be rich in
carbohydrate with many of its varieties widespread throughout the humid tropics. The most economically important species
grown are: White yam (Dioscorea rotundata), Yellow yam (Dioscorea cayenensis), Water yam (Dioscorea alata), Chinese
yam (Dioscorea esculenta), Aerial yam (Dioscorea bulbifera) and Trifoliate yam (Dioscorea dumentorum) (Ike and Inoni,
2006) but only a few species of yams are cultivated as food crops. To some extent, processing of yam has not reached a
significant level commercially.
Predominantly, the use of yam has been limited to the preparation of local dishes such as pounded yam (yam dough) and
porridges (Amani et al., 2002). The production of instant yam flour, yam flakes and starch has been explored but industrial
scale production has been limited due to various constraints including high fresh market price (Onayemi and Potter, 1974;
FAO, 2005). In other words, some yam varieties are widely known and overexploited for food while others are known and
exploited as food only in a few rural communities in Nigeria and as a result underutilized. Over dependence on the common
yam varieties for food and industrial use account for the high market price of yams and this incidentally limits industrial
exploitation.
Trifoliate yam is a species of yam in which limited work has been done in terms of its production and utilization though it
is high yielding compared to other yam species. In Nigeria, its local names include; Esuru (in Yoruba language), Ona (in
Ibo language) and Kosanrogo (in Hausa language). Some of its other common names are three-leaved yam, bitter yam and
cluster yam. It has starch grains that are smaller, more soluble and more digestible than those of other yam species (Treche
and Guion, 1980). The proteins also, are more balanced than those of white yam (Mbome and Treche, 1994) and it is rich in
vitamins and minerals. The consumption of trifoliate yam is restricted due to its bitter taste, inability to keep for longer time
after harvesting and poor binding capacity of its flour (Martin et al.,1983;Mbome and Treche, 1994; Sefa-dedeh and
Afoakwa, 2001). Some works have been done on ways of minimizing the post-harvest problem associated with trifoliate
yam but no solution has been suggested yet but processing the yam tuber into a shelf –stable product offers an alternative to
fresh storage.
Pumpkin seeds used for the enrichment of the trifoliate yam are valuable both as oilseeds (54%) and also as protein source
(27%) with a fairly well balanced amino acid composition (Akwaowo et al., 2000; Hamed et al., 2008). Unfortunately, 78
to 91% of the fruits are wasted annually (Fagbemi et al., 2005). It has also been reported by Jun et al. (2006) that pumpkin
is a good source of carotene, pectin, mineral salts, vitamins and other substances that are beneficial to health. These facts
lead to the processing of pumpkin into various food products.
In the quest for industrial progress, a contribution was made through this research using trifoliate yam, an underutilized
yam species as a case study. The trifoliate yam was enriched with pumpkin seed another underutilized food crop and
compared with Irish potato a commonly known and utilized food crop which served as the control sample.
This research was carried out to determine the effect of enriching trifoliate yam flour with pumpkin seeds (in three
substitution levels) on the physico-chemical, nutritional and sensory qualities of its product (Chin chin).
MATERIALS AND METHODS
Source of materials
Fresh Trifoliate yam tubers and the fluted pumpkin fruit containing viable seeds were obtained from Lusada market, Ogun
state. The raw Irish Potato tubers were obtained from Sango Ota market, Ogun State.
Raw Materials Preparation
Production of Trifoliate Yam Flour:
The tubers were washed with clean water, peeled with sharp kitchen knives and sliced to a thickness of between 2mm to
3mm and oven-dried at a temperature of 65oC for duration of 11 hours. The dried yam slices were milled into flour using a
hammer milling machine and sieved through a standard laboratory sieve of 500 micron meter aperture to produce uniform
particle size flour as described by Eke Ejiofor and Kiin-Kabari, (2010).
Production of Irish Potato Flour:
The fresh raw Irish potatoes were washed, peeled, and sliced to a thickness of about 2 to 3 mm and treated to stop
enzymatic browning by soaking in a 0.3% salt water solution for 10 minutes. The treated potatoes were thereafter drained
and oven-dried at a temperature of 65oCfor duration of 9 hours. The dried potato chips were thereafter hammer-milled into
flour and sieved through a standard laboratory sieve of 500 micron meter essentially as described by Chukwuonso et
al.,(2010).
Production of Pumpkin Seeds Flour:
The fresh seeds were removed from the gourds, washed and sun dried to reduce sliminess, and thereafter broken out of
shells, size-reduced by chopping with a kitchen knife and oven-dried at a temperature of 60oC for duration of 30 hours and
thereafter milled into flour using first, a laboratory dry miller and secondly, a small size hammer mill as described by Eke
Ejiofor and Kiin-Kabari, (2010).
Enrichment Formulation:
The dried pumpkin seeds flour was added directly into the plain trifoliate yam flour in different proportions of 10% (to 90%
trifoliate yam flour), 15% (to 75% trifoliate yam flour and 20% (to 80% trifoliate yam flour) and made to pass through a
500 micron meter aperture standard laboratory sieve to obtain the enriched trifoliate yam flour.
Production of Chin-Chin:
The flour sample (250 g) was sifted and margarine (25g) was rubbed in with 1 and half eggs added. This was followed by
the addition of sugar (80g) and nutmeg (10g). All these were mixed into fairly stiff dough, turned into a floured board,
rolled out thinly and cut into strips which were then squared. The squares of dough were fried (King’s vegetable oil) in
small batches and frequently turned until brown. These were thereafter drained, allowed to cool and packaged in an air-tight
freezer bag.
Physico-chemical analysis
Determination of pH of flour samples
The pH meter was switched on and allowed to warm up for about 5 minutes and then standardized with pH buffer solutions
to ensure the sensitivity and accuracy of the meter. This was done by dipping the electrode of the meter into each buffer
solution with thorough rinsing with distilled water.
The pH values of samples (initially prepared by dissolving 10 grams of dry sample into 10mls of distilled water) were taken
individually by dipping the pH meter electrode into the samples followed by thorough rinsing with distilled water after each
dip. The pH values were consequently read out from the display unit of the meter.
Chemical Properties
The moisture, protein, crude fat, crude fiber, and ash contents of the “Trifoliate yam flour ”were determined using the
methods of AOAC (2000). Carbohydrate was determined by difference according to James (1995).
Mineral Content determination The dry ashing procedure was used for mineral content determination. Five (5) grams of each of the samples were
accurately weighed into porcelain crucibles and pre-ashed until the sample was completely charred on a hot plate. The pre-
ashed samples were thereafter ashed in the muffle furnace at 500oC till the ash was white for about 2 hours. After ashing,
the crucibles were transferred into the desiccator to cool and the reweighed. Each sample was quantitatively transferred into
volumetric flasks by carefully washing the crucibles with 1ml nitric acid, then with portions of dilute nitric acid. All
washings were transferred to individual volumetric flasks, repeating the washing procedure twice. The solutions were
diluted to volume with deionized water and were used for individual mineral determination using the appropriate standards
and blank. The content of the minerals; Calcium, Magnesium, Potassium, Sodium, Manganese, Iron, Copper and Zinc were
determined with the Atomic Absorption Spectrophotometer (Buck Scientific, Model 210).
Calculation: Mineral Element concentration (%) = Ppm / 1000
Where Parts per million (Ppm) of any element = Meter reading x Slope x Dilution factor
Phosphorus Content:
Phosphorus was determined using the Spectrophotometric method described by Ceirwyn (1998). The dry ash of each
sample obtained was digested by adding 5mls of 2Molar Hydrochloric acid to the ash in the crucible and heated to dryness
on a heating mantle. 5mls of the 2Molar Hydrochloric acid was added again, heated to boil and filtered through a Whatman
No.1 filter paper into a 100ml volumetric flask. 10ml of the filtrate solution was pipetted into 50ml standard volumetric
flask and 10ml of Vanadate – molybdate yellow was added and the flask was made up to mark with distilled water,
stoppered and left for 10 minutes for full yellow development. The concentration of phosphorus was obtained by taking the
absorbance of the solution on a Spectronic 21D (Milton Roy Model) Spectrophotometer at a wave length of 470nm.
Calculation:
Phosphorus (%) = (Absorbance x Slope x Dilution Factor) / 10000
Vitamin Content Determination Vitamin A:
Each sample was weighed (2g) into a flat bottom reflux flask and 10ml of distilled water was added followed by careful
shaking to form a paste. This was followed by the addition of 25mls of alcoholic Potassium Hydroxide solution and the
attachment of a reflux condenser. The mixture was then heated in boiling water bath for 1 hour with frequent shaking and
rapidly cooled with 30mls of distilled water added. The hydrolysate obtained was transferred into a separating funnel and
the solution was extracted three times with 250ml quantities of chloroform. Two grams of Anhydrous Sodium
tetraoxosulphate (Na2SO4) was thereafter added to the extract to remove any traces of water. The mixture was then filtered
into a 100ml volumetric flask and made up to mark with chloroform. Standard solutions (within the range of 0 to 50 micron
gram/ml) prepared were determined with reference to their absorbance from which average gradients were taken to
calculate Vitamin A (Beta- Carotene in micron gram/100 gram).
Absorbance of each sample and standards was read on the Spectrophotometer (Spectronic 21D, Milton Roy Model) at a
wavelength of 328nm.
Calculation:
Vitamin A (micron gram / 100g) = [(Absorbance x Dilution Factor) / (Weight of sample)] x100/1
Vitamin C:
Equal weights of each of the samples and 3% metaphosphoric acid were individually mechanically blended and each
portion mixed to obtain homogenous slurry. Five (5) grams of individual slurry was transferred using a pipette into a 100ml
volumetric flask and made up to mark with 3% metaphosphoric acid. Each mixture was filtered, discarding the first portion
of the filtrate and 10ml of the aliquot was pipetted into a 50ml volumetric flask and titrated immediately with the standard
dye solution of 2, 6 – dichlorophenolindophenol to a faint pink colour which persisted for 15 seconds.
Calculation:
Vitamin C (mg/100g) = [(W1 + W2) / (W1 x W3)] x [V1/V2] x [100 (V x F)]
Where: W1 = Weight of sample (grams), W2 = Weight of extracting acid (grams), W3 = Weight of slurry removed for
analysis, V1 = Volume to which slurry sample in diluted (ml), V2 = Volume of filtrate taken for titration (ml), V= Volume
of dye solution used for titration, F = Ascorbic acid Equivalent of dye in milligrams/milliliters.

Determination of Anti-nutritional Composition Determination of Tannins:
One (1) gram of each sample was weighed into a beaker and individually soaked with a solvent mixture (made up of 80mls
of acetone and 20mls of glacial acetic acid) for five hours to extract the tannin. Samples were thereafter filtered through a
double layer filter paper to obtain filtrate. This was followed by the preparation of a set of standard Tannic acid solution
ranging from 10ppm to 50ppm. The absorbance of the standard solution and that of the filtrates were read at 500nm on a
Spectronic 21D (Milton Roy Model) Spectrophotometer.
Calculation:
Tannin (%) = (Absorbance x Average gradient x Dilution factor) / 10,000
Determination of Oxalate:
One (1) gram of each sample was weighed into 250mls conical flask and soaked with 100mls of distilled water to extract
the oxalates. Soaked samples were allowed to stand for three (3) hours and each was filtered through a double layer of filter
paper. 10ppm, 20ppm, 30ppm, 40ppm and 50ppm standard solution of oxalic acid were prepared and the absorbance of
standard solution and that of the filtrates from each sample was read using a Spectronic 21D (Milton Roy Model)
Spectrophotometer at 420nm.
Calculation:
Oxalate (%) = (Sample Absorbance x Average gradient from the Standard’s curve x Dilution factor) / 10,000
Determination of Phytates:
The method described by Inuwa et al., (2011) was used for phytate determination. Sample (2g) was weighed into 250mls
conical flask. 100mls of 2% concentrated hydrochloric acid was used to soak each of the samples in conical flasks for 3
hours and then filtered through a double layer filter paper. Each of the sample filtrates (50mls) was placed in 250ml beakers
and 107mls of distilled water was added to each of the samples to improve proper acidity. 10mls of 0.3% Ammonium
Thiocyanate solution was added to each sample solution as indicator and titrated with standard iron (III) chloride solution
which contained 0.00195 g iron per ml. The end point was signified by brownish-yellow coloration that persisted for 5
minutes.
Calculation: Phytic acid (%) = [(Titre value x0.00195) x 1.19 x100] / 2
Determination of Saponin:
Two (2) grams of each of the samples were weighed into 250ml beakers and 100ml of isobutyl alcohol (octanol) was added
to each sample and left for 5 hours on a UDY shaker for uniform mixing so as to obtain a uniform solution .The mixtures
were then filtered through a No 1 Whatman filter paper. The filterate was transferred to another 10ml beaker and saturated
with magnesium carbonate solution. The mixture thereafter obtained was then filtered to obtain a clear colourless solution.
Standard saponin solutions (0 ppm to 10ppm) were prepared from 1000ppm saponin stock standard solution and saturated
with magnesium carbonate as done above followed by filtration. The absorbances of the saponin standard solution (0 to
10ppm) were read at 380nm to obtain the gradient of the plotted curve.
Calculation:
Saponin (%) = [(Abs. Standard – Abs. Sample) / Weight of Sample] x [(Dilution factor x Average gradient) / 10,000]
Determination of Trypsin Inhibitor:
Samples (0.2g) were weighed into screw cap centrifuge tubes. Thereafter 10mls of 0.1 Molar phosphate buffers were added
into each and contents were shaken at room temperature for 1hour on a UDY shaker. The suspension obtained was
thereafter centrifuged at 500rpm for 5 minutes and filtered through Whatman No 42 filter paper. The volumes of each were
adjusted to 2mls with phosphate buffer and the test tubes were placed in water bath maintained at 37degrees Celsius. 6mls
of 5% TCA Solution was added to an empty tube to serve as the blank. 2mls of casein solution was added to each of the
tubes initially placed in the water bath followed by incubation for 20 minutes. TCA solution (6mls) was added into the
sample tubes 20 minutes after (so as to stop the reaction) and shaken. The reaction was allowed to proceed for 1 hour at
room temperature and the mixture was filtered through Whatman No 42 filter paper. The absorbance of sample filtrates and
trypsin standard solutions were then read at 280nm.
Calculation:
Trypsin Inhibitor (mg/100 g) = [(Abs. Standard – Abs. sample) / 0.19 x Sample weight in grams] x [(Dilution factor) / 1000
x Sample size]
Determination of cyanogenic glycoside:
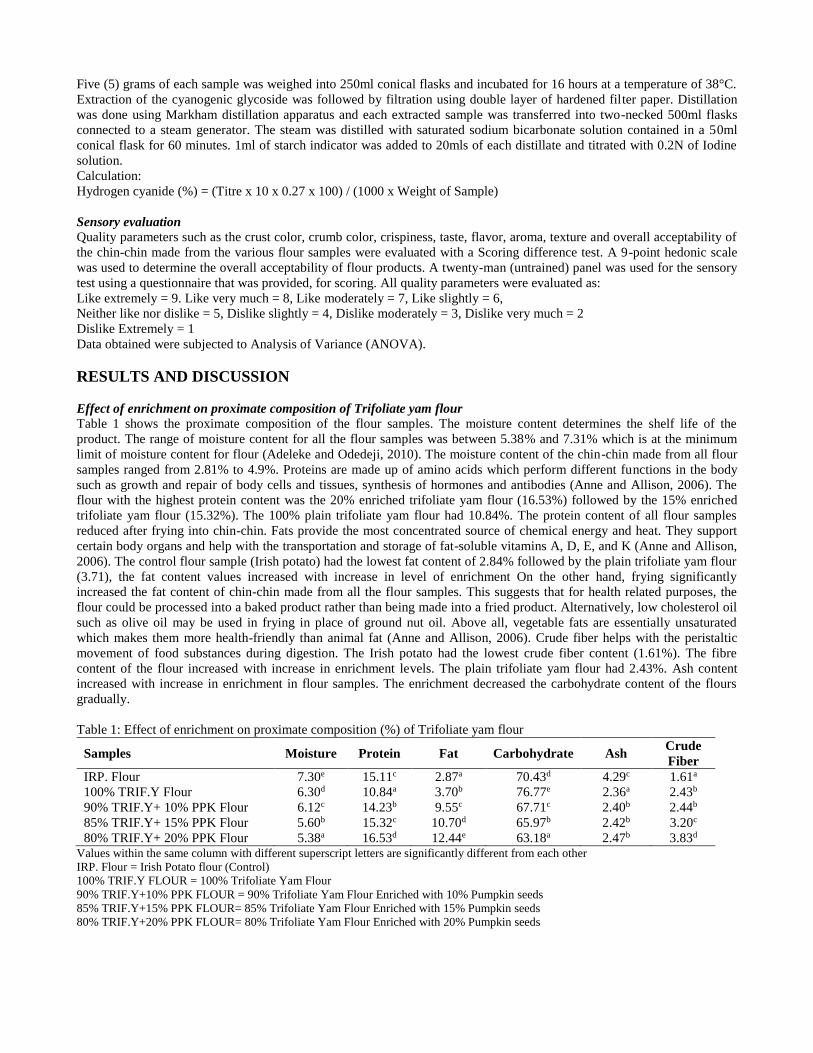
Five (5) grams of each sample was weighed into 250ml conical flasks and incubated for 16 hours at a temperature of 38°C.
Extraction of the cyanogenic glycoside was followed by filtration using double layer of hardened filter paper. Distillation
was done using Markham distillation apparatus and each extracted sample was transferred into two-necked 500ml flasks
connected to a steam generator. The steam was distilled with saturated sodium bicarbonate solution contained in a 50ml
conical flask for 60 minutes. 1ml of starch indicator was added to 20mls of each distillate and titrated with 0.2N of Iodine
solution.
Calculation:
Hydrogen cyanide (%) = (Titre x 10 x 0.27 x 100) / (1000 x Weight of Sample)
Sensory evaluation
Quality parameters such as the crust color, crumb color, crispiness, taste, flavor, aroma, texture and overall acceptability of
the chin-chin made from the various flour samples were evaluated with a Scoring difference test. A 9-point hedonic scale
was used to determine the overall acceptability of flour products. A twenty-man (untrained) panel was used for the sensory
test using a questionnaire that was provided, for scoring. All quality parameters were evaluated as:
Like extremely = 9. Like very much = 8, Like moderately = 7, Like slightly = 6,
Neither like nor dislike = 5, Dislike slightly = 4, Dislike moderately = 3, Dislike very much = 2
Dislike Extremely = 1
Data obtained were subjected to Analysis of Variance (ANOVA).
RESULTS AND DISCUSSION
Effect of enrichment on proximate composition of Trifoliate yam flour
Table 1 shows the proximate composition of the flour samples. The moisture content determines the shelf life of the
product. The range of moisture content for all the flour samples was between 5.38% and 7.31% which is at the minimum
limit of moisture content for flour (Adeleke and Odedeji, 2010). The moisture content of the chin-chin made from all flour
samples ranged from 2.81% to 4.9%. Proteins are made up of amino acids which perform different functions in the body
such as growth and repair of body cells and tissues, synthesis of hormones and antibodies (Anne and Allison, 2006). The
flour with the highest protein content was the 20% enriched trifoliate yam flour (16.53%) followed by the 15% enriched
trifoliate yam flour (15.32%). The 100% plain trifoliate yam flour had 10.84%. The protein content of all flour samples
reduced after frying into chin-chin. Fats provide the most concentrated source of chemical energy and heat. They support
certain body organs and help with the transportation and storage of fat-soluble vitamins A, D, E, and K (Anne and Allison,
2006). The control flour sample (Irish potato) had the lowest fat content of 2.84% followed by the plain trifoliate yam flour
(3.71), the fat content values increased with increase in level of enrichment On the other hand, frying significantly
increased the fat content of chin-chin made from all the flour samples. This suggests that for health related purposes, the
flour could be processed into a baked product rather than being made into a fried product. Alternatively, low cholesterol oil
such as olive oil may be used in frying in place of ground nut oil. Above all, vegetable fats are essentially unsaturated
which makes them more health-friendly than animal fat (Anne and Allison, 2006). Crude fiber helps with the peristaltic
movement of food substances during digestion. The Irish potato had the lowest crude fiber content (1.61%). The fibre
content of the flour increased with increase in enrichment levels. The plain trifoliate yam flour had 2.43%. Ash content
increased with increase in enrichment in flour samples. The enrichment decreased the carbohydrate content of the flours
gradually.
Table 1: Effect of enrichment on proximate composition (%) of Trifoliate yam flour
Samples Moisture Protein Fat Carbohydrate Ash Crude
Fiber
IRP. Flour 7.30e 15.11c 2.87a 70.43d 4.29c 1.61a
100% TRIF.Y Flour 6.30d 10.84a 3.70b 76.77e 2.36a 2.43b
90% TRIF.Y+ 10% PPK Flour 6.12c 14.23b 9.55c 67.71c 2.40b 2.44b
85% TRIF.Y+ 15% PPK Flour 5.60b 15.32c 10.70d 65.97b 2.42b 3.20c
80% TRIF.Y+ 20% PPK Flour 5.38a 16.53d 12.44e 63.18a 2.47b 3.83d Values within the same column with different superscript letters are significantly different from each other
IRP. Flour = Irish Potato flour (Control)
100% TRIF.Y FLOUR = 100% Trifoliate Yam Flour
90% TRIF.Y+10% PPK FLOUR = 90% Trifoliate Yam Flour Enriched with 10% Pumpkin seeds
85% TRIF.Y+15% PPK FLOUR= 85% Trifoliate Yam Flour Enriched with 15% Pumpkin seeds
80% TRIF.Y+20% PPK FLOUR= 80% Trifoliate Yam Flour Enriched with 20% Pumpkin seeds
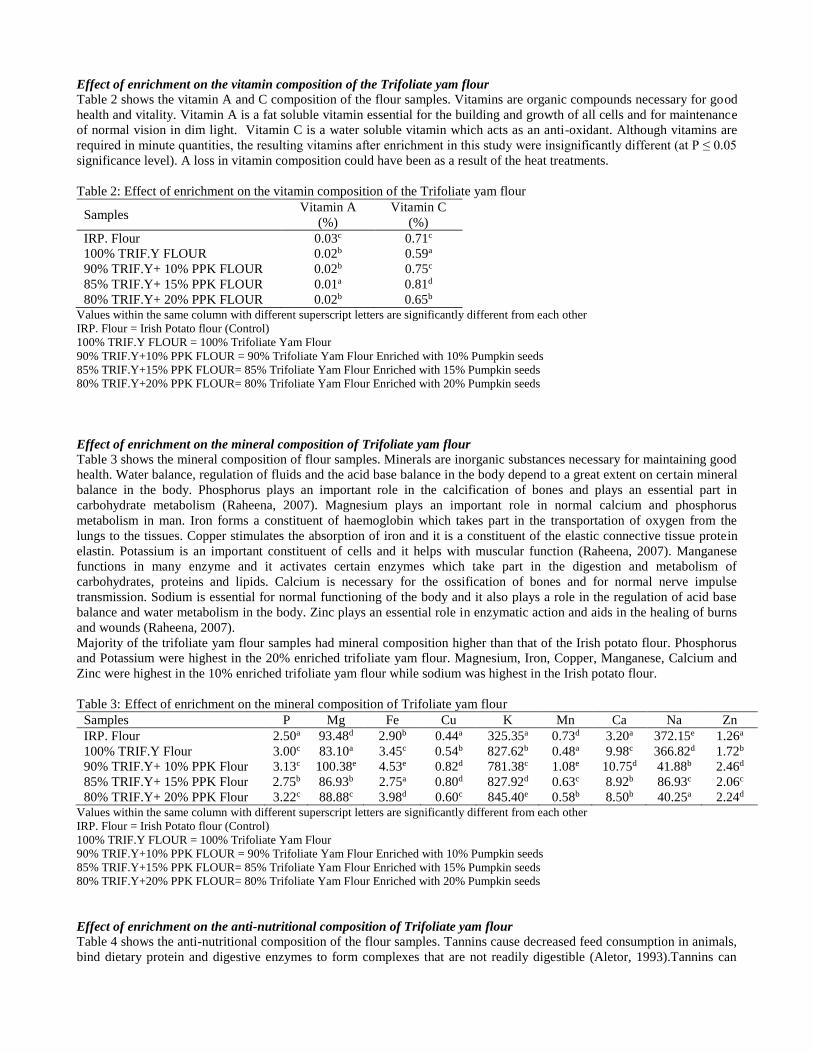
Effect of enrichment on the vitamin composition of the Trifoliate yam flour
Table 2 shows the vitamin A and C composition of the flour samples. Vitamins are organic compounds necessary for good
health and vitality. Vitamin A is a fat soluble vitamin essential for the building and growth of all cells and for maintenance
of normal vision in dim light. Vitamin C is a water soluble vitamin which acts as an anti-oxidant. Although vitamins are
required in minute quantities, the resulting vitamins after enrichment in this study were insignificantly different (at P ≤ 0.05
significance level). A loss in vitamin composition could have been as a result of the heat treatments.
Table 2: Effect of enrichment on the vitamin composition of the Trifoliate yam flour
Samples Vitamin A
(%)
Vitamin C
(%)
IRP. Flour 0.03c 0.71c
100% TRIF.Y FLOUR 0.02b 0.59a
90% TRIF.Y+ 10% PPK FLOUR 0.02b 0.75c
85% TRIF.Y+ 15% PPK FLOUR 0.01a 0.81d
80% TRIF.Y+ 20% PPK FLOUR 0.02b 0.65b Values within the same column with different superscript letters are significantly different from each other
IRP. Flour = Irish Potato flour (Control)
100% TRIF.Y FLOUR = 100% Trifoliate Yam Flour
90% TRIF.Y+10% PPK FLOUR = 90% Trifoliate Yam Flour Enriched with 10% Pumpkin seeds
85% TRIF.Y+15% PPK FLOUR= 85% Trifoliate Yam Flour Enriched with 15% Pumpkin seeds
80% TRIF.Y+20% PPK FLOUR= 80% Trifoliate Yam Flour Enriched with 20% Pumpkin seeds
Effect of enrichment on the mineral composition of Trifoliate yam flour
Table 3 shows the mineral composition of flour samples. Minerals are inorganic substances necessary for maintaining good
health. Water balance, regulation of fluids and the acid base balance in the body depend to a great extent on certain mineral
balance in the body. Phosphorus plays an important role in the calcification of bones and plays an essential part in
carbohydrate metabolism (Raheena, 2007). Magnesium plays an important role in normal calcium and phosphorus
metabolism in man. Iron forms a constituent of haemoglobin which takes part in the transportation of oxygen from the
lungs to the tissues. Copper stimulates the absorption of iron and it is a constituent of the elastic connective tissue protein
elastin. Potassium is an important constituent of cells and it helps with muscular function (Raheena, 2007). Manganese
functions in many enzyme and it activates certain enzymes which take part in the digestion and metabolism of
carbohydrates, proteins and lipids. Calcium is necessary for the ossification of bones and for normal nerve impulse
transmission. Sodium is essential for normal functioning of the body and it also plays a role in the regulation of acid base
balance and water metabolism in the body. Zinc plays an essential role in enzymatic action and aids in the healing of burns
and wounds (Raheena, 2007).
Majority of the trifoliate yam flour samples had mineral composition higher than that of the Irish potato flour. Phosphorus
and Potassium were highest in the 20% enriched trifoliate yam flour. Magnesium, Iron, Copper, Manganese, Calcium and
Zinc were highest in the 10% enriched trifoliate yam flour while sodium was highest in the Irish potato flour.
Table 3: Effect of enrichment on the mineral composition of Trifoliate yam flour
Samples P Mg Fe Cu K Mn Ca Na Zn
IRP. Flour 2.50a 93.48d 2.90b 0.44a 325.35a 0.73d 3.20a 372.15e 1.26a
100% TRIF.Y Flour 3.00c 83.10a 3.45c 0.54b 827.62b 0.48a 9.98c 366.82d 1.72b
90% TRIF.Y+ 10% PPK Flour 3.13c 100.38e 4.53e 0.82d 781.38c 1.08e 10.75d 41.88b 2.46d
85% TRIF.Y+ 15% PPK Flour 2.75b 86.93b 2.75a 0.80d 827.92d 0.63c 8.92b 86.93c 2.06c
80% TRIF.Y+ 20% PPK Flour 3.22c 88.88c 3.98d 0.60c 845.40e 0.58b 8.50b 40.25a 2.24d Values within the same column with different superscript letters are significantly different from each other
IRP. Flour = Irish Potato flour (Control)
100% TRIF.Y FLOUR = 100% Trifoliate Yam Flour
90% TRIF.Y+10% PPK FLOUR = 90% Trifoliate Yam Flour Enriched with 10% Pumpkin seeds
85% TRIF.Y+15% PPK FLOUR= 85% Trifoliate Yam Flour Enriched with 15% Pumpkin seeds
80% TRIF.Y+20% PPK FLOUR= 80% Trifoliate Yam Flour Enriched with 20% Pumpkin seeds
Effect of enrichment on the anti-nutritional composition of Trifoliate yam flour
Table 4 shows the anti-nutritional composition of the flour samples. Tannins cause decreased feed consumption in animals,
bind dietary protein and digestive enzymes to form complexes that are not readily digestible (Aletor, 1993).Tannins can
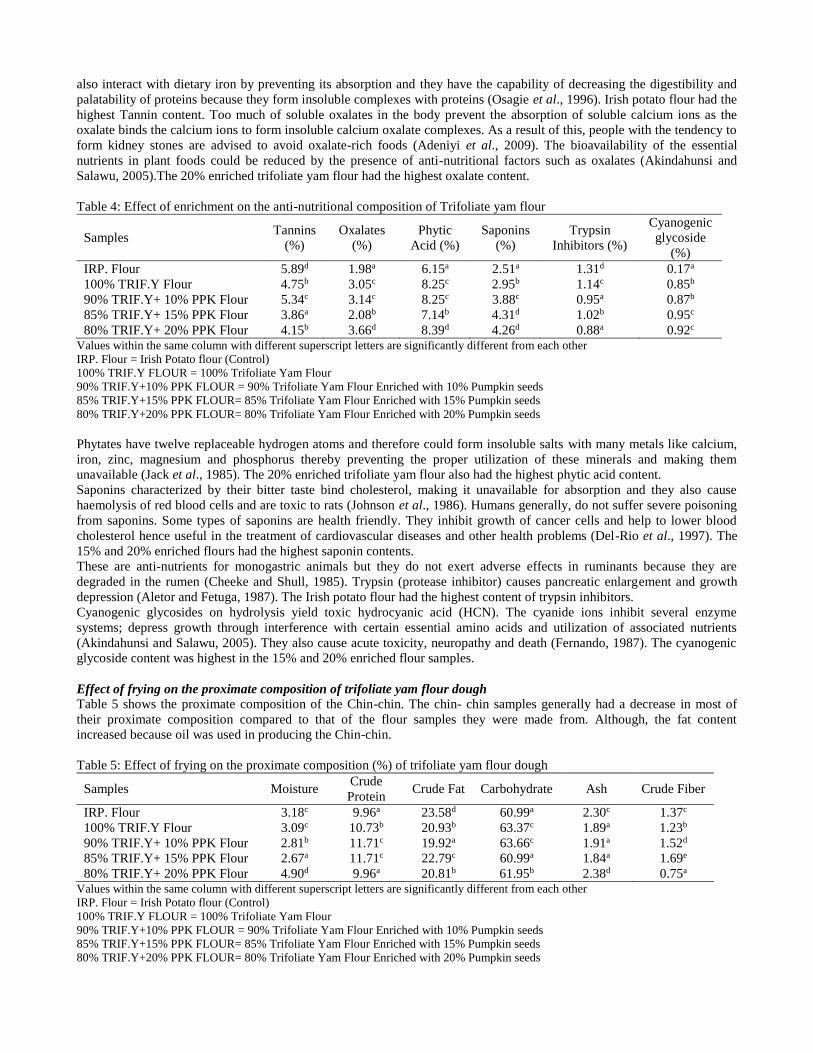
also interact with dietary iron by preventing its absorption and they have the capability of decreasing the digestibility and
palatability of proteins because they form insoluble complexes with proteins (Osagie et al., 1996). Irish potato flour had the
highest Tannin content. Too much of soluble oxalates in the body prevent the absorption of soluble calcium ions as the
oxalate binds the calcium ions to form insoluble calcium oxalate complexes. As a result of this, people with the tendency to
form kidney stones are advised to avoid oxalate-rich foods (Adeniyi et al., 2009). The bioavailability of the essential
nutrients in plant foods could be reduced by the presence of anti-nutritional factors such as oxalates (Akindahunsi and
Salawu, 2005).The 20% enriched trifoliate yam flour had the highest oxalate content.
Table 4: Effect of enrichment on the anti-nutritional composition of Trifoliate yam flour
Samples Tannins
(%)
Oxalates
(%)
Phytic
Acid (%)
Saponins
(%)
Trypsin
Inhibitors (%)
Cyanogenic
glycoside
(%)
IRP. Flour 5.89d 1.98a 6.15a 2.51a 1.31d 0.17a
100% TRIF.Y Flour 4.75b 3.05c 8.25c 2.95b 1.14c 0.85b
90% TRIF.Y+ 10% PPK Flour 5.34c 3.14c 8.25c 3.88c 0.95a 0.87b
85% TRIF.Y+ 15% PPK Flour 3.86a 2.08b 7.14b 4.31d 1.02b 0.95c
80% TRIF.Y+ 20% PPK Flour 4.15b 3.66d 8.39d 4.26d 0.88a 0.92c Values within the same column with different superscript letters are significantly different from each other
IRP. Flour = Irish Potato flour (Control)
100% TRIF.Y FLOUR = 100% Trifoliate Yam Flour
90% TRIF.Y+10% PPK FLOUR = 90% Trifoliate Yam Flour Enriched with 10% Pumpkin seeds
85% TRIF.Y+15% PPK FLOUR= 85% Trifoliate Yam Flour Enriched with 15% Pumpkin seeds
80% TRIF.Y+20% PPK FLOUR= 80% Trifoliate Yam Flour Enriched with 20% Pumpkin seeds
Phytates have twelve replaceable hydrogen atoms and therefore could form insoluble salts with many metals like calcium,
iron, zinc, magnesium and phosphorus thereby preventing the proper utilization of these minerals and making them
unavailable (Jack et al., 1985). The 20% enriched trifoliate yam flour also had the highest phytic acid content.
Saponins characterized by their bitter taste bind cholesterol, making it unavailable for absorption and they also cause
haemolysis of red blood cells and are toxic to rats (Johnson et al., 1986). Humans generally, do not suffer severe poisoning
from saponins. Some types of saponins are health friendly. They inhibit growth of cancer cells and help to lower blood
cholesterol hence useful in the treatment of cardiovascular diseases and other health problems (Del-Rio et al., 1997). The
15% and 20% enriched flours had the highest saponin contents.
These are anti-nutrients for monogastric animals but they do not exert adverse effects in ruminants because they are
degraded in the rumen (Cheeke and Shull, 1985). Trypsin (protease inhibitor) causes pancreatic enlargement and growth
depression (Aletor and Fetuga, 1987). The Irish potato flour had the highest content of trypsin inhibitors.
Cyanogenic glycosides on hydrolysis yield toxic hydrocyanic acid (HCN). The cyanide ions inhibit several enzyme
systems; depress growth through interference with certain essential amino acids and utilization of associated nutrients
(Akindahunsi and Salawu, 2005). They also cause acute toxicity, neuropathy and death (Fernando, 1987). The cyanogenic
glycoside content was highest in the 15% and 20% enriched flour samples.
Effect of frying on the proximate composition of trifoliate yam flour dough
Table 5 shows the proximate composition of the Chin-chin. The chin- chin samples generally had a decrease in most of
their proximate composition compared to that of the flour samples they were made from. Although, the fat content
increased because oil was used in producing the Chin-chin.
Table 5: Effect of frying on the proximate composition (%) of trifoliate yam flour dough
Samples Moisture Crude
Protein Crude Fat Carbohydrate Ash Crude Fiber
IRP. Flour 3.18c 9.96a 23.58d 60.99a 2.30c 1.37c
100% TRIF.Y Flour 3.09c 10.73b 20.93b 63.37c 1.89a 1.23b
90% TRIF.Y+ 10% PPK Flour 2.81b 11.71c 19.92a 63.66c 1.91a 1.52d
85% TRIF.Y+ 15% PPK Flour 2.67a 11.71c 22.79c 60.99a 1.84a 1.69e
80% TRIF.Y+ 20% PPK Flour 4.90d 9.96a 20.81b 61.95b 2.38d 0.75a Values within the same column with different superscript letters are significantly different from each other
IRP. Flour = Irish Potato flour (Control)
100% TRIF.Y FLOUR = 100% Trifoliate Yam Flour
90% TRIF.Y+10% PPK FLOUR = 90% Trifoliate Yam Flour Enriched with 10% Pumpkin seeds
85% TRIF.Y+15% PPK FLOUR= 85% Trifoliate Yam Flour Enriched with 15% Pumpkin seeds
80% TRIF.Y+20% PPK FLOUR= 80% Trifoliate Yam Flour Enriched with 20% Pumpkin seeds
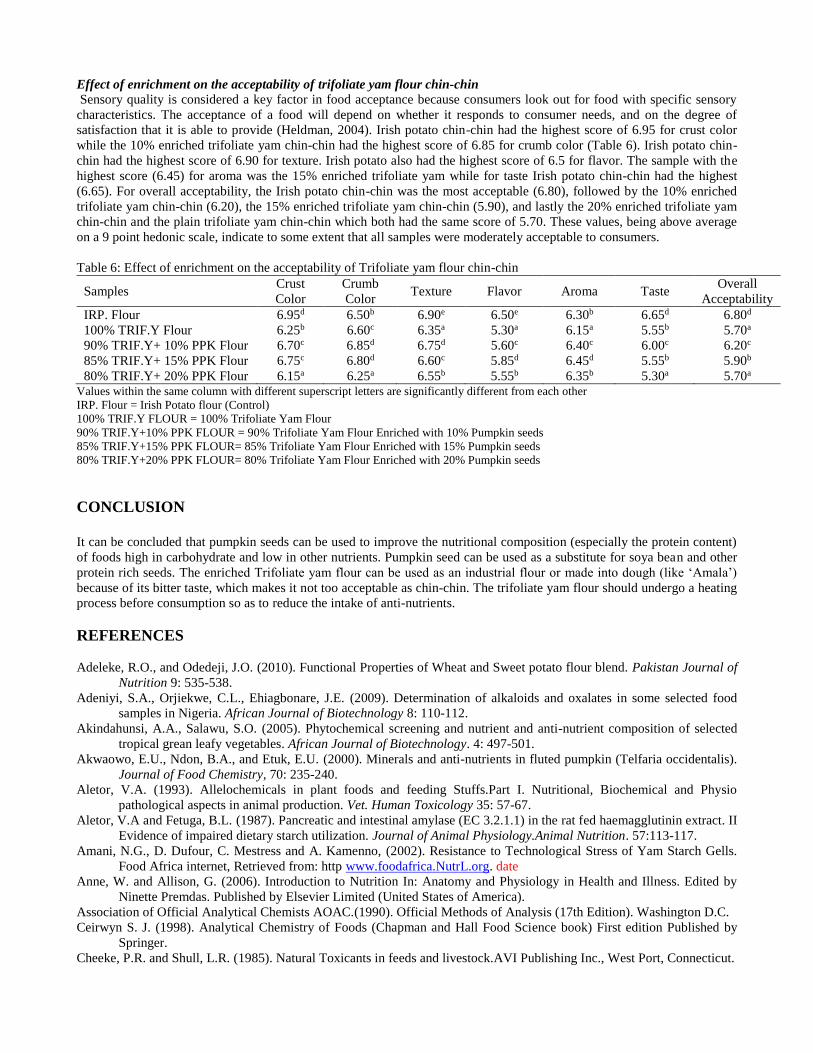
Effect of enrichment on the acceptability of trifoliate yam flour chin-chin
Sensory quality is considered a key factor in food acceptance because consumers look out for food with specific sensory
characteristics. The acceptance of a food will depend on whether it responds to consumer needs, and on the degree of
satisfaction that it is able to provide (Heldman, 2004). Irish potato chin-chin had the highest score of 6.95 for crust color
while the 10% enriched trifoliate yam chin-chin had the highest score of 6.85 for crumb color (Table 6). Irish potato chin-
chin had the highest score of 6.90 for texture. Irish potato also had the highest score of 6.5 for flavor. The sample with the
highest score (6.45) for aroma was the 15% enriched trifoliate yam while for taste Irish potato chin-chin had the highest
(6.65). For overall acceptability, the Irish potato chin-chin was the most acceptable (6.80), followed by the 10% enriched
trifoliate yam chin-chin (6.20), the 15% enriched trifoliate yam chin-chin (5.90), and lastly the 20% enriched trifoliate yam
chin-chin and the plain trifoliate yam chin-chin which both had the same score of 5.70. These values, being above average
on a 9 point hedonic scale, indicate to some extent that all samples were moderately acceptable to consumers.
Table 6: Effect of enrichment on the acceptability of Trifoliate yam flour chin-chin
Samples Crust
Color
Crumb
Color Texture Flavor Aroma Taste
Overall
Acceptability
IRP. Flour 6.95d 6.50b 6.90e 6.50e 6.30b 6.65d 6.80d
100% TRIF.Y Flour 6.25b 6.60c 6.35a 5.30a 6.15a 5.55b 5.70a
90% TRIF.Y+ 10% PPK Flour 6.70c 6.85d 6.75d 5.60c 6.40c 6.00c 6.20c
85% TRIF.Y+ 15% PPK Flour 6.75c 6.80d 6.60c 5.85d 6.45d 5.55b 5.90b
80% TRIF.Y+ 20% PPK Flour 6.15a 6.25a 6.55b 5.55b 6.35b 5.30a 5.70a Values within the same column with different superscript letters are significantly different from each other
IRP. Flour = Irish Potato flour (Control)
100% TRIF.Y FLOUR = 100% Trifoliate Yam Flour
90% TRIF.Y+10% PPK FLOUR = 90% Trifoliate Yam Flour Enriched with 10% Pumpkin seeds
85% TRIF.Y+15% PPK FLOUR= 85% Trifoliate Yam Flour Enriched with 15% Pumpkin seeds
80% TRIF.Y+20% PPK FLOUR= 80% Trifoliate Yam Flour Enriched with 20% Pumpkin seeds
CONCLUSION
It can be concluded that pumpkin seeds can be used to improve the nutritional composition (especially the protein content)
of foods high in carbohydrate and low in other nutrients. Pumpkin seed can be used as a substitute for soya bean and other
protein rich seeds. The enriched Trifoliate yam flour can be used as an industrial flour or made into dough (like ‘Amala’)
because of its bitter taste, which makes it not too acceptable as chin-chin. The trifoliate yam flour should undergo a heating
process before consumption so as to reduce the intake of anti-nutrients.
REFERENCES
Adeleke, R.O., and Odedeji, J.O. (2010). Functional Properties of Wheat and Sweet potato flour blend. Pakistan Journal of
Nutrition 9: 535-538.
Adeniyi, S.A., Orjiekwe, C.L., Ehiagbonare, J.E. (2009). Determination of alkaloids and oxalates in some selected food
samples in Nigeria. African Journal of Biotechnology 8: 110-112.
Akindahunsi, A.A., Salawu, S.O. (2005). Phytochemical screening and nutrient and anti-nutrient composition of selected
tropical grean leafy vegetables. African Journal of Biotechnology. 4: 497-501.
Akwaowo, E.U., Ndon, B.A., and Etuk, E.U. (2000). Minerals and anti-nutrients in fluted pumpkin (Telfaria occidentalis).
Journal of Food Chemistry, 70: 235-240.
Aletor, V.A. (1993). Allelochemicals in plant foods and feeding Stuffs.Part I. Nutritional, Biochemical and Physio
pathological aspects in animal production. Vet. Human Toxicology 35: 57-67.
Aletor, V.A and Fetuga, B.L. (1987). Pancreatic and intestinal amylase (EC 3.2.1.1) in the rat fed haemagglutinin extract. II
Evidence of impaired dietary starch utilization. Journal of Animal Physiology.Animal Nutrition. 57:113-117.
Amani, N.G., D. Dufour, C. Mestress and A. Kamenno, (2002). Resistance to Technological Stress of Yam Starch Gells.
Food Africa internet, Retrieved from: http www.foodafrica.NutrL.org. date
Anne, W. and Allison, G. (2006). Introduction to Nutrition In: Anatomy and Physiology in Health and Illness. Edited by
Ninette Premdas. Published by Elsevier Limited (United States of America).
Association of Official Analytical Chemists AOAC.(1990). Official Methods of Analysis (17th Edition). Washington D.C.
Ceirwyn S. J. (1998). Analytical Chemistry of Foods (Chapman and Hall Food Science book) First edition Published by
Springer.
Cheeke, P.R. and Shull, L.R. (1985). Natural Toxicants in feeds and livestock.AVI Publishing Inc., West Port, Connecticut.

Chukwuonso, E.C.C., Paschal U. C. and Lawrence E. S. (2010). Dietary Incorporation of Boiled Fluted Pumpkin (Telfairia
occidentalis Hook F.) Seeds: Growth and Toxicity in Rats. Journal of Biological Sciences, 5:140-145
Del-Rio, A., Obudulio, B.G., Costillo, J., Mann, F.G., and Otuno, A. (1997). “Uses and Properties of Citrus Flavonoids”.
Journal of Agricultural Food Chemistry. 46 : 4505 – 4515.
Eke – Ejiofor J. and Kiin – Kabari D. (2010). Chemical Pasting Functional and Sensory Properties of Sweet of and Irish
Potato Chips. Nigeria Food Journal. 28. Pg.47-52.
Fagbemi, T.N., Oshodi, O.O., and Ipinmoroti, K.O. (2005). Processing effects on some antinutritional factors and in vitro
multienzyme protein digestibility (IVPD) of three tropical seeds: Breadnut (Artocarpus altillis), cashewnut
(Anacardium occidentale) and fluted pumpkin (Telfairia occidentalis). Pakistan Journal of Nutrition, 4: 250-256.
Fernando R. 1987. Plant poisoning in Sri Lanka. In: Progress in venom and toxin research. Proceedings of the 1st Asia-
Pacific Congress in Animal, Plant and Microbial toxins, pp. 624-627.
Hamed, S.Y., El-Hassan, N.M., Hassan, A.B., Eltayeb, M.M., and Babiker, E.E. (2008). Nutritional evaluation and
physicochemical properties of processed pumpkin (Telfairia occidentalis) seed flour. Pakistan Journal of Nutrition,
7: 330-334.
Heldman, D.R. (2004). Identifying food science and technology research needs. Journal of Food Technology, 58: 32-34.
Ike, P.C., and Inoni, O.E. (2006). Determination of yam production and economic efficiency among small-holder farmers in
South-Eastern Nigeria. Journal of Central European Agriculture, 7:337-342.
Inuwa, H.M., Aina, V.O., Baba G., Aimola I. and Amao T. (2011). Comparative determination of anti-nutritional factors in
groundnut oil and palm oil. Advanced Journal of Food Science and Technology 3: 275-279.
Jack, G.A., Rambeck, W.A and Kollmer, W.E. (1985). Retention of Cadmium in Organs of rats after single dose of
labelled Cadmium - 3 - phytate.BioI. Trace Elem. Res. 6: 69 - 74.
Johnson, I.T., Gee, J.M., Price, K., Curl, C., Fenwick, G.R. (1986). Influence of saponin on gut permeability and active
nutrient transport in vitro. Journal of Nutrition.116: 2270-2277.
Jun, H., Lee, C., Song, G., and Kim, Y. (2006). Characterization of pectin and polysaccharides from pumpkin peel.
Lebensmittel-Wissenchaft und-Technologie 39: 554-561.
Manuel, C.J., Rafael, G.K., Milagros, B.P., Arletys, S.P., Victor, M.V., Jorge, L.T., Ayme, R.C., and Magaly, G.G., Jose
2005. Production of yam micro tubers using a temporary immersion system. Plant Cell Tissue Organs, 83: 103-107.
Martin, G.S., Treche, L., Noubi, T., Agbor, E., and Gwangwa, A. (1983).Introduction of flour from Dioscorea dumentorum
in a rural area. In: Terry, E.R., Doku, E.V., Arene, O.B., and Mahungu, N.M. (Editors), Tropical Root Crops:
Production and uses in Africa. Proceeding of the second triennial Symposium of the International Society for
Tropical Root Crops Africa, Doaula, Cameroon.
Mbome, L.I., and Treche, S. (1994). Nutritional quality of yam (Dioscorea dumentorum and Dioscorea. rotundata) flours
for growing rats. Journal of Science and Food Agriculture, 66: 441- 455.
Onayemi, O., and Potter, N.N. (1974). Preparations and properties of drum dried yam (Dioscorea rotundata) flakes.
Journal of Food Science, 39: 559-562.
Osagie, A.U., Muzguiz, M., Burbano, C., Cuadsado, C., Ayet, G. and Castano, A. (1996). Some anti-nutritional constituents
in ten staple Food items in Nigeria. Journal of Tropical Science 36: 109 -115.
Raheena, B.M. (2007). A Textbook of Foods, Nutrition and Dietetics (Second Edition).Published by Sterling Publishers
Private Ltd., New Delhi.
Sefa-dedeh, S.K., and Afoakwa, E.O. (2001). Biochemical and textural changes in trifoliate yam (Dioscorea dumentorum)
tubers after harvest.
Treche, S. and Guion, P. (1980). “Nutritional repercussions of the differences in physicochemical characteristics of starches
of two yam species grown in Cameroon”, paper presented at fifth Symp. of the Intl. Soc. for Trop. Root Crops,
Manila, Philippines, September 17‐21.

Physico-chemical and Functional Properties of Sweet Potato-Soybean Flour Blends
Omoniyi, S.A.1*; Awonorin, S.O.2; Idowu, M.A.2 and Adeola, A.A.3
1Department of Home Science and Management, Federal University, Gashua, Yobe State, Nigeria 2Department of Food Science and Technology, Federal University of Agriculture, Abeokuta, Ogun State, Nigeria 3Institute of Food Security, Environmental Resources and Agricultural Research, Federal University of Agriculture,
Abeokuta, Ogun State, Nigeria.
*Corresponding author: Email: [email protected]
ABSTRACT
The study investigated the physicochemical and functional properties of sweet potato-soybean flour blends. Defatted
soybean and sweet potato flours were blended in the ratios of 10:90, 25:75, 30:70 and 40:60, respectively, while 100%
sweet potato flour was used as a control. The moisture, crude protein, crude fat, ash, crude fibre and carbohydrate contents
of the flour blends were significantly different (p<0.05)with the values ranging between 7.28-7.32, 7.05-12.4, 2.62-3.22,
1.87-2.62, 3.76-4.55 and 68.10-76.63%, respectively. The bulk density, degree of starch damage, water absorption index,
swelling power, amylose content and water solubility index of the flour blends were also significantly different (p < 0.05)
with values ranging between 0.59-0.68 g/cm3, 0.74-1.17%, 2.34-2.81%, 1.46-1.56g/g, 12.62-12.91%, and 1.12-1.41%
respectively. The results revealed that the increase in percentage of defatted soybean led to increase in moisture, protein,
ash, crude fat, bulk density, degree of starch damage, water absorption index, swelling power and water solubility index of
the flour blends but decrease in carbohydrate, crude fibre and amylose content of the flour blends. The study showed that
the flour blends from defatted soybean and sweet potato had higher protein content and better physico-chemical properties
making it a potential ingredient in baking products, extruded snacks and complementary/weaning foods formulations.
Keywords: defatted soybean flour; physico-chemical properties; proximate composition; sweet potato flour
INTRODUCTION
Sweet potato (Ipomoea batatas), a dicotyledonous plant belongs to the family convolvulaceae (Douglas, 1987). It is an
important food crop of the tropics with potential to alleviate food insecurity, improve nutrition and economy of many
African countries including Nigeria (Hurton, 1998; Saeed et al., 2012). It is an important alternative source of
carbohydrates and attains fourth place after rice, corn and cassava (Saeed et al., 2012).West African sweet potato
production is about 2.516 million tonnes per annum with Nigeria being one of the largest producers (FAO, 2006).
The crop is reported to be of low income value but with a significant social importance due to its high potential food source
for most developing nations with limited resources as a result of its short maturity time, ability to grow under diverse
climatic condition on less fertile soil (Saeed et. al., 2012). Sweet potato flour has been reported as a source of energy and
carbohydrates, beta carotene (pro Vitamin A), Vitamin C, Vitamin B6, minerals (calcium, phosphorus, iron, manganese and
potassium) and dietary fibre, which can add natural sweetness, colour and flavour to processed food products (Ulm, 1998;
Woolfe, 1992; Onabanjo and Ighere, 2014). The underutilization of this crop, despite the industrial applications of its flour,
has been reported (Putri et al., 2014; Mohd-Hanim et al., 2014). For instance, the flour could be used in production of
cakes, muffins, cookies and noodles, extruded snacks, chiffons even as cereal flour supplements in bakery products such as
pancakes and pudding (Zainun et al., 2005; Jennifer, 1992).
Soybean (Glycine max), a grain legume cultivated in many areas of the world, belongs to the family leguminosae and sub-
family papillionnideae (Sanful and Darko, 2010). It is an excellent source of protein (40-45%) and the seeds are the richest
in food value of all plant food consumed in the world (Egunlety and Aworh, 1990). Igbabul et al., (2013) reported that
soybean contributes protein, fat, vitamins, and minerals in the diet of people in developing countries. Soybean contains
some anti-nutritional factors, which inhibit the availability of the desirable elements such as protein, minerals and vitamins.
However, several studies have been reported that most of these anti-nutritional factors can be destroyed through processing
(Enwere, 1998; Osho and Dashiell, 1998). However, many studies had reported the improvement of protein quality of
cereals and tuber crops, for instance, in production of soy-‘ogi’ (Adeyemi and Beckley, 1986), yam-soy flour (Akingbala et
al., 1995), and soy-‘agidi’(Akpapunam et al., 1997).
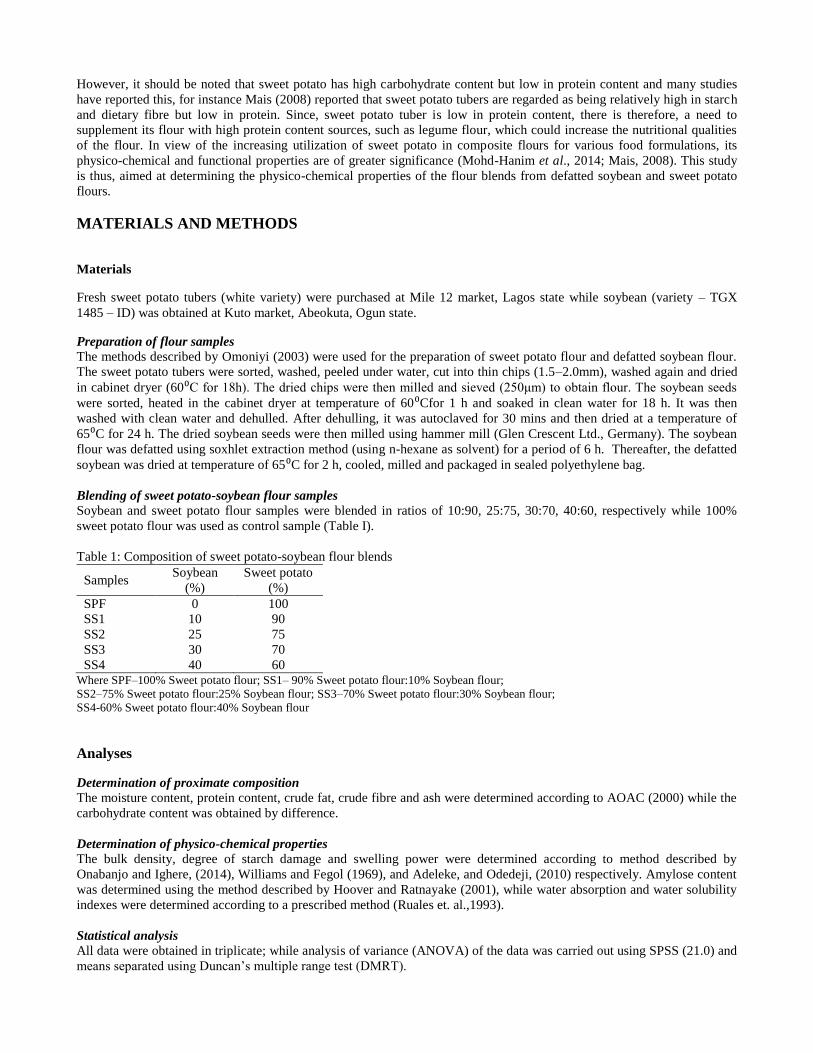
However, it should be noted that sweet potato has high carbohydrate content but low in protein content and many studies
have reported this, for instance Mais (2008) reported that sweet potato tubers are regarded as being relatively high in starch
and dietary fibre but low in protein. Since, sweet potato tuber is low in protein content, there is therefore, a need to
supplement its flour with high protein content sources, such as legume flour, which could increase the nutritional qualities
of the flour. In view of the increasing utilization of sweet potato in composite flours for various food formulations, its
physico-chemical and functional properties are of greater significance (Mohd-Hanim et al., 2014; Mais, 2008). This study
is thus, aimed at determining the physico-chemical properties of the flour blends from defatted soybean and sweet potato
flours.
MATERIALS AND METHODS
Materials
Fresh sweet potato tubers (white variety) were purchased at Mile 12 market, Lagos state while soybean (variety – TGX
1485 – ID) was obtained at Kuto market, Abeokuta, Ogun state.
Preparation of flour samples
The methods described by Omoniyi (2003) were used for the preparation of sweet potato flour and defatted soybean flour.
The sweet potato tubers were sorted, washed, peeled under water, cut into thin chips (1.5–2.0mm), washed again and dried
in cabinet dryer (60⁰C for 18h). The dried chips were then milled and sieved (250μm) to obtain flour. The soybean seeds
were sorted, heated in the cabinet dryer at temperature of 60⁰Cfor 1 h and soaked in clean water for 18 h. It was then
washed with clean water and dehulled. After dehulling, it was autoclaved for 30 mins and then dried at a temperature of
65⁰C for 24 h. The dried soybean seeds were then milled using hammer mill (Glen Crescent Ltd., Germany). The soybean
flour was defatted using soxhlet extraction method (using n-hexane as solvent) for a period of 6 h. Thereafter, the defatted
soybean was dried at temperature of 65⁰C for 2 h, cooled, milled and packaged in sealed polyethylene bag.
Blending of sweet potato-soybean flour samples
Soybean and sweet potato flour samples were blended in ratios of 10:90, 25:75, 30:70, 40:60, respectively while 100%
sweet potato flour was used as control sample (Table I).
Table 1: Composition of sweet potato-soybean flour blends
Samples Soybean
(%)
Sweet potato
(%)
SPF 0 100
SS1 10 90
SS2 25 75
SS3 30 70
SS4 40 60 Where SPF–100% Sweet potato flour; SS1– 90% Sweet potato flour:10% Soybean flour;
SS2–75% Sweet potato flour:25% Soybean flour; SS3–70% Sweet potato flour:30% Soybean flour;
SS4-60% Sweet potato flour:40% Soybean flour
Analyses
Determination of proximate composition
The moisture content, protein content, crude fat, crude fibre and ash were determined according to AOAC (2000) while the
carbohydrate content was obtained by difference.
Determination of physico-chemical properties
The bulk density, degree of starch damage and swelling power were determined according to method described by
Onabanjo and Ighere, (2014), Williams and Fegol (1969), and Adeleke, and Odedeji, (2010) respectively. Amylose content
was determined using the method described by Hoover and Ratnayake (2001), while water absorption and water solubility
indexes were determined according to a prescribed method (Ruales et. al.,1993).
Statistical analysis
All data were obtained in triplicate; while analysis of variance (ANOVA) of the data was carried out using SPSS (21.0) and
means separated using Duncan’s multiple range test (DMRT).
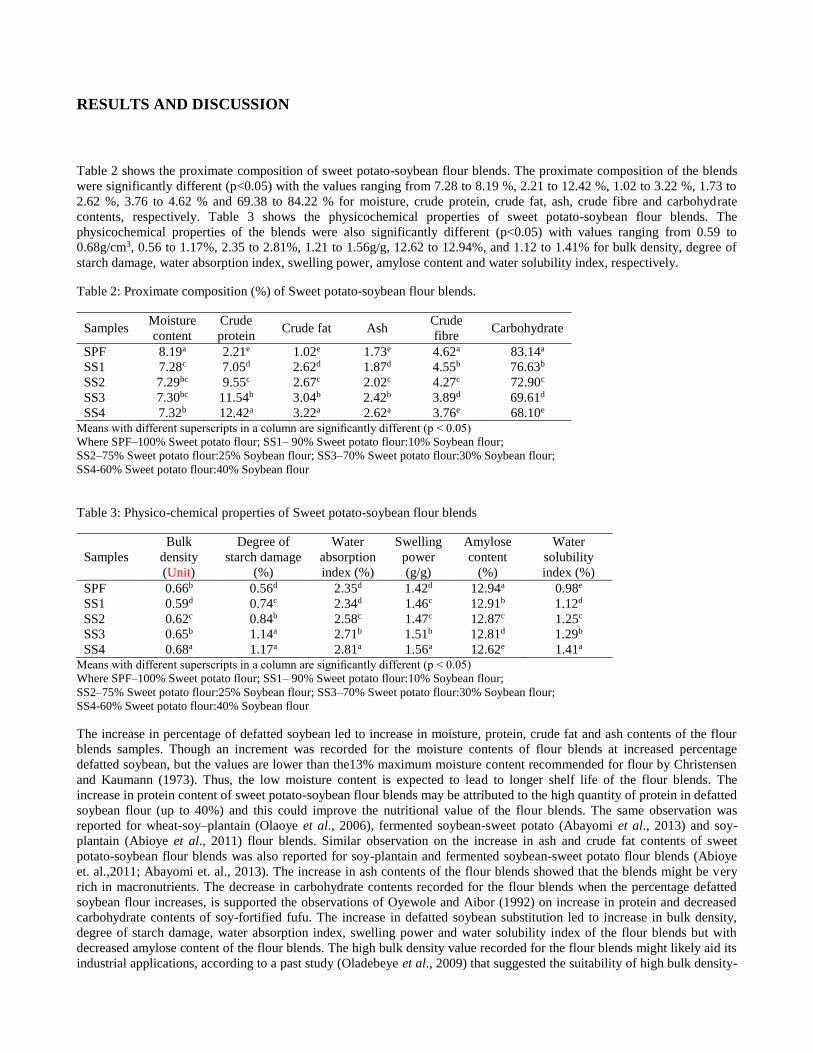
RESULTS AND DISCUSSION
Table 2 shows the proximate composition of sweet potato-soybean flour blends. The proximate composition of the blends
were significantly different (p<0.05) with the values ranging from 7.28 to 8.19 %, 2.21 to 12.42 %, 1.02 to 3.22 %, 1.73 to
2.62 %, 3.76 to 4.62 % and 69.38 to 84.22 % for moisture, crude protein, crude fat, ash, crude fibre and carbohydrate
contents, respectively. Table 3 shows the physicochemical properties of sweet potato-soybean flour blends. The
physicochemical properties of the blends were also significantly different (p<0.05) with values ranging from 0.59 to
0.68g/cm3, 0.56 to 1.17%, 2.35 to 2.81%, 1.21 to 1.56g/g, 12.62 to 12.94%, and 1.12 to 1.41% for bulk density, degree of
starch damage, water absorption index, swelling power, amylose content and water solubility index, respectively.
Table 2: Proximate composition (%) of Sweet potato-soybean flour blends.
Samples Moisture
content
Crude
protein Crude fat Ash
Crude
fibre Carbohydrate
SPF 8.19a 2.21e 1.02e 1.73e 4.62a 83.14a
SS1 7.28c 7.05d 2.62d 1.87d 4.55b 76.63b
SS2 7.29bc 9.55c 2.67c 2.02c 4.27c 72.90c
SS3 7.30bc 11.54b 3.04b 2.42b 3.89d 69.61d
SS4 7.32b 12.42a 3.22a 2.62a 3.76e 68.10e Means with different superscripts in a column are significantly different (p < 0.05)
Where SPF–100% Sweet potato flour; SS1– 90% Sweet potato flour:10% Soybean flour;
SS2–75% Sweet potato flour:25% Soybean flour; SS3–70% Sweet potato flour:30% Soybean flour;
SS4-60% Sweet potato flour:40% Soybean flour
Table 3: Physico-chemical properties of Sweet potato-soybean flour blends
Samples
Bulk
density
(Unit)
Degree of
starch damage
(%)
Water
absorption
index (%)
Swelling
power
(g/g)
Amylose
content
(%)
Water
solubility
index (%)
SPF 0.66b 0.56d 2.35d 1.42d 12.94a 0.98e
SS1 0.59d 0.74c 2.34d 1.46c 12.91b 1.12d
SS2 0.62c 0.84b 2.58c 1.47c 12.87c 1.25c
SS3 0.65b 1.14a 2.71b 1.51b 12.81d 1.29b
SS4 0.68a 1.17a 2.81a 1.56a 12.62e 1.41a Means with different superscripts in a column are significantly different (p < 0.05)
Where SPF–100% Sweet potato flour; SS1– 90% Sweet potato flour:10% Soybean flour;
SS2–75% Sweet potato flour:25% Soybean flour; SS3–70% Sweet potato flour:30% Soybean flour;
SS4-60% Sweet potato flour:40% Soybean flour
The increase in percentage of defatted soybean led to increase in moisture, protein, crude fat and ash contents of the flour
blends samples. Though an increment was recorded for the moisture contents of flour blends at increased percentage
defatted soybean, but the values are lower than the13% maximum moisture content recommended for flour by Christensen
and Kaumann (1973). Thus, the low moisture content is expected to lead to longer shelf life of the flour blends. The
increase in protein content of sweet potato-soybean flour blends may be attributed to the high quantity of protein in defatted
soybean flour (up to 40%) and this could improve the nutritional value of the flour blends. The same observation was
reported for wheat-soy–plantain (Olaoye et al., 2006), fermented soybean-sweet potato (Abayomi et al., 2013) and soy-
plantain (Abioye et al., 2011) flour blends. Similar observation on the increase in ash and crude fat contents of sweet
potato-soybean flour blends was also reported for soy-plantain and fermented soybean-sweet potato flour blends (Abioye
et. al.,2011; Abayomi et. al., 2013). The increase in ash contents of the flour blends showed that the blends might be very
rich in macronutrients. The decrease in carbohydrate contents recorded for the flour blends when the percentage defatted
soybean flour increases, is supported the observations of Oyewole and Aibor (1992) on increase in protein and decreased
carbohydrate contents of soy-fortified fufu. The increase in defatted soybean substitution led to increase in bulk density,
degree of starch damage, water absorption index, swelling power and water solubility index of the flour blends but with
decreased amylose content of the flour blends. The high bulk density value recorded for the flour blends might likely aid its
industrial applications, according to a past study (Oladebeye et al., 2009) that suggested the suitability of high bulk density-

sweet potato as drug binder and disintegrant in pharmaceuticals industries. It should be noted that as the degree of starch
damage in the flour blends increases, there was increase in water absorption index of the blends as well. This observation is
in support of the findings of Adeyemi and Beckley (1986) that reported a direct relationship between the water absorption
indexes and higher damaged starch of the flour. The increase in water absorption index might be due to the increase in
protein and carbohydrate contents reported for the flour blends. This correlates with the study of Afoakwa (1996) that
reported the importance of protein and starch (cellulose) in water uptake of flour at room temperature.
CONCLUSION
The study showed that the flour blends from defatted soybean and sweet potato had high protein content and better physico-
chemical properties which could make it a potential and functional ingredient in the production of baking and
complementary/weaning food products.
REFERENCES
Abayomi, H. T., Oresanya, T. O., Opeifa, A. O. and Rasheed, T. R. 2013. Quality evaluation of cookies produced from
blends of sweet potato and fermented soybean flour. International Journal of Biological, Veterinary, Agricultural
and Food Engineering, 7(7): 356-361.
Abioye, V. F., Ade-Omowaye, B. I. O., Babarinde, G. O. and Adesigbin, M. K.2011. Chemical, physico-chemical and
sensory properties of soy-plantain flour. African Journal of Food Science, 5(4): 176–180.
Adeleke, R. O. and Odedeji, J. O. 2010. Functional Properties of Wheat and Sweet Potato Flour Blends. Pakistan Journal
of Nutrition 9 (6): 535-538.
Adeyemi, I. A. and Beckley, O. 1986. Effect of period of maize fermentation and sourcing on chemical properties and
amylograph pasting viscosity of ogi. Cereal Science, 4: 353-360.
Afoakwa, J. C. 1996. Water absortion capacity of legumes.B.Sc thesis, Department of Food Science and Technology,
Federal University of Technology, Owerri, Nigeria.
Akingbala, J. O., Oguntimein, G. B. and Sobande, A. O. 1995. Physiochemical properties and acceptability of yam flour
substituted with soy flour. Plant Foods for Human Nutrition, 48: 73-80.
Akpapunam M. A., Badifu, G. I. O. and Etokudo, E. P. 1997. Production and quality characteristics of Nigerian “Agidi”
supplemented with soy flour. Journal of Food Science and. Technology, 34(2): 143-145.
A.O.A.C. 2000. Official methods of Analysis (17th edition). Association of Official Analytical Chemists. Washington D. C.
USA.
Chritensen, C. M. and Kaufman, H. H. 1973. Maintenance of quality in stored grains and seeds. Agricultural Extension
Service, University of Minnesota.
Douglas, E. H. 1987. Exploration, maintenance and utilization of sweet potato genetics resources. A report of International
sweet potato Conference, Training and Communication Department, International Potato Centre, Lima, Peru, 17pp.
Egunlety M. and Aworh O. C. 1990. Production and physicochemical properties of tempeh fortified maize bread weaning
food. Nigerian Food Journal, 70: 92-102.
Enwere, N. J. 1998. Foods of Plant Origin: Processing and Utilization with Recipes and Technology Profiles. Afro-Orbis
Publications Ltd., Nsukka
F.A. O. 2006. FAOSTAT database result. Food and Agricultural Organization of the United Nation, Rome, Italy.
Hoover, R. and Ratnayake, W. S. 2001. Determination of Total Amylose content of Starch. Current protocols in Food and
Analytical chemistry. John willey and Sons, Inc.
Horton, D. 1998. Underground crops: Long term trends in production of roots and tubers. Windrock International,
Morrilton, USA, First edition, 22pp.
Igbabul, B., Adole, D. and Sule S. 2013. Proximate composition, functional and sensory properties of bambara nut
(Voandzeia subterranean), Cassava (Manihot esculentus) and Soybean (Glycine max) flour blends for “Akpekpa”
production. Current Research in Nutrition and Food Science, 1(2) page number?
Jennifer, A. W. 1992. Sweet potato: an untapped Food Resources. Cambridge University press, UK, 262pp.
Mais, A. 2008. Utilization of sweet potato starch, flour and fibre in Bread and Biscuits: Physicochemical and nutritional
characteristics. M.Tech. thesis, Department of Food Technology, Massey University, New Zealand.
Mohd-Hanim, A. B., Chin, N. L. and Yusof, Y. A. 2014. Physicochemical and flowability characteristics of a new variety
of Malaysian sweet potato, VitAto Flour. International Food Research Journal, 21(5): 2099-2107.
Oladebeye, A. O., Oshodi, A. A. and Oladebeye, A. A. 2009. Physicochemical properties of starches of sweet potato
(Ipomea batata) and red cocoyam (Colocasia esculenta) cormels. Pakistan Journal of Nutrition, 8(4): 313-315.

Olaoye, O. A., Onilude, A. A. and Idowu, O. A. 2006. Quality characteristics of bread produced from composite flours of
wheat, plantain and soybeans. African Journal of Biotechnology, 11: 1102-1106.
Omoniyi, S. A. 2003. Physico-chemical characteristics of soybean-sweet potato flour blends. Unpublished B.Sc. thesis,
University of Agriculture, Abeokuta, Nigeria.
Onabanjo, O. O. and Ighere, D. A. 2014. Nutritional, functional and sensory properties of Biscuit produced from wheat-
sweet potato composite. Journal of Food Technology Research, 1(3): 111 – 121.
Osho, O. and. Dashiell, K. E 1998. Expanding soyabean production, processing and utilization in Nigeria. In: R.S.B. Ferris
(ed.). Postharvest Technology and Commodity Marketing. Proceedings of a PostHarvest Conference, Accra, pp:
151-156.
Oyewole, O. B. and Aibor, A. M. 1992. Fermentation of cassava with cowpea and soybean for an enriched ‘‘fufu’’. Journal
of Tropical Science, 33: 9-15.
Putri, W. D. R., Zubaidah, E. and Ningtyas, D. W. 2014. Effect of heat moisture treatment on functional properties and
microstructural profiles of sweet potato flour. Advance Journal of Food Science and Technology, 6(5): 655-659.
Ruales, J., Valencia, S. and Nair, B. 1993. Effect of processing on the physico-chemical characteristics of guinea flour
(Chenopodium quinoa, wild). Starch/starke, 46: 13-19.
Saeed, S., Ahmad, M. M., Kausar, H., Parveen, S., Masih, S. and Salam, A. 2012. Effect of sweet potato flour on quality of
cookies. Journal of Agricultural Research, 50(4): 525-538.
Sanful, R. E. and Darko, S. 2010. Utilization of soybean flour in the production of Bread. Pakistan Journal of Nutrition,
9(8): 815-818.
Ulm, S. G. 1988. The Effect of Storage Conditions on Selected Quality Attributes of Sweet Potato Flour, Thesis of the
University of Tennessee, Knoxville. p.26.
Williams, P. C. and Fegol, K. S. W. 1969. Colorimetric determination of damaged starch in flour. Cereal Chemistry, 46(1):
56-62.
Woolfe, J. A.1992. Post harvest procedures. In: Sweet potato - an untapped food source. UK University Press, Cambridge
292pp.
Zainun, C., Salma, O. and Hamidah, H. 2005. Organoleptic acceptability and nutritional properties of the sweet potato
based traditional cakes produced using sweet potato flour. Journal of Tropical Agricultural and Food Science,
33(2): 211-219.
Proximate Composition, Microbial Quality and Consumer Acceptability of Gruel from
Fermented Maize and Soybean
Balogun, M.A.*; Kolawole, F.L.; Karim, O.R. and Fasakin, T.B.
Department of Home Economics & Food Science, University of Ilorin, Ilorin, Nigeria.
*Corresponding author: Email: [email protected]; [email protected]
ABSTRACT
Gruel is an acid-fermented cereal food product mostly made from maize and wrapped in banana leaves. This study was
aimed at producing an enriched gruel from maize by incorporating soybean. Maize and soybeans pastes were mixed in
ratios of 100:0, 90:10, 80:20, 70:30, 60:40 and 50:50 to produce maize-soy gruel. Proximate, sensory and microbial
analyses were carried out on the samples using standard methods. The proximate result shows that moisture content
decreased from 35.22% in 100:0 to 25.97% in 50:50 maize-soy gruels. Protein content increased from 6.56% in 100:0 to
14.84% and 16.75% in 60:40 and 50:50 maize-soy ratio respectively. The carbohydrate content decreased from 55.01% in
100:0 to 47.92% in 60:40 maize-soy ratios while the ash content, fat content and crude fiber content increased from 100:0
maize to 50:50 maize and soybeans with values of 1.21% to 3.77%, 1.25% to 4.88% and 0.74% to 2.71% respectively. The
maize-soy of 100:0 and 80:20 were highly acceptable by the sensory evaluators whereas addition of soybeans up to levels
above 20% affected the colour of the samples. The microbial load of the samples stored at room temperature increased
with increasing soybeans composition with values ranging between 3.0 x 10⁵ to 26.0 x 10⁵ cfu/g for bacterial count and 4.0
x 105 to 24.0 x 10⁵ cfu/g for mould count. This work has shown that maize-soy gruel will make a balanced meal that is
affordable and acceptable to the consumers..
Keywords: acceptability; gruel; maize; proximate; soybeans
INTRODUCTION
Gruel is a white thin or cream coloured traditionally prepared fermented food product made majorly from cereals especially
maize which can be consumed as a whole or using stew or other food products (Abdulrahaman and Kolawole, 2006). It is
commonly consumed in West Africa mostly in Nigeria. The organisms responsible for its fermentation are lactic acid
bacteria, Lactobacillus plantarum; the aerobic bacteria, Corynebacterium and Aerobacter, the yeasts Candida mycodema
and Saccharomyces cerevisiae. (Odunfa and Oyewole, 1998). It is a good source of carbohydrate which is mostly packaged
in banana leaves (Musa spp) but majority use the leaf Thaumatocococcus daniella normally used to wrap moinmoin
(depending on your locality) to obtain a characteristic doomed shape. It has recently been wrapped in polythene bags.
In Nigeria, maize is known and called by different vernacular names ‘masara’ (Hausa); ‘agbado’ (Yoruba); ‘oka’ (Ibo);
‘apaapa’ (Ibira); ‘oka’ (Bini and Isha); ‘ibokpot’ (Efik) and ‘igumapa’ (Yala). Reports showed that maize contains 80%
carbohydrate, 10 % protein (although deficient in lysine and tryptophan, but has fair amounts of sulphur-containing amino
acids), 3.5% fiber (soluble and insoluble) and 2% mineral. Iron and Vitamin B are also present in maize. Maize is high in
both soluble and insoluble fiber. Maize protein is deficient in lysine and tryptophan, but has fair amounts of sulphur-
containing amino acids (IITA 2001).
Maize is most popularly consumed as fermented gruel ‘ogi’ (Aminigo and Akingbala, 2004) but which has low nutritional
value as they are not adequate sources of micro and macro nutrients (Fasasi et al., 2006). Substantial nutrient losses occur
during the various steps of ogi processing. The situation is even made worse by the method of its processing which involves
wet milling, wet sieving and several washings which deplete it of even the little nutrients contained and therefore incapable
of supporting growth and good health of the people (Otunola et al., 2007). Much of the protein in cereal grains is located in
the testa and germ which are usually sifted off during processing (Aminigo and Akingbala, 2004).
Soybean (US) or soya bean (UK) (Glycine max) assumed to be a source of complete protein, is a species of legume native
to Southeast Asia, widely grown for its edible bean which has numerous uses such as a substitute for expensive meat and
meat products. (Adelakun et al., 2013). In addition to its high food value, it is one of the least expensive sources of protein
when compared to eggs, milk, beef and cowpea. They contain proteins which provide all the essential amino acids in the

amounts needed for human health. Most of the essential amino acid present in soybean is available in an amount that is
close to those required by animals and humans (Adelakun et al., 2013).
Efforts have been made to modify the processing of foods with a view of enhancing their nutritive value, shelf life and
possible therapeutic qualities. Such effort include s but not limited to fortification of foods with legumes in enrichment
processes (Osundahunsi and Aworh, 2003). Soybeans has been used to fortify foods such as kunun zaki (Ayo and Gaffa,
2002); tapioca flour (Samuel et al., 2006); tortilla (maize product) (Obatolu et al., 2007); Hausa koko (Owusu-Kwarteng et
al., 2010); tapioca meal (Balogun et al., 2012) and gari (Ogunlakin et al., 2015; Karim et al, 2015).
The production of gruel from maize and soybeans is a way of increasing the utilization of soybeans at the household level
and providing a complete meal for consumers. Therefore, this work is designed to produce gruel from different maize-soy
ratios and determine the proximate and microbiological compositions as well as assessing the consumer acceptability of the
samples.
MATERIALS AND METHODS
Materials The white maize (Zea mays), soybeans (Glycine max) and banana leaves (for packaging) were purchased from a local
market in Ilorin, Kwara State, Nigeria.
Methods The maize-soy gruel was prepared in the Home Economics and Food Science kitchen of the Department of Home
Economics and Food Science, University of Ilorin in a hygienic manner according to the method of Omemu, (2011). The
maize was soaked for 72h in clean water at room temperature (27 ± 20C) to initiate fermentation. The steep water was
decanted while the fermented maize grains were washed with clean water and then wet-milled using a fabricated attrition
mill (Sanzid Nig Ltd) to obtain a white coloured maize paste. The maize paste was then mixed with water and wet- sieved
using muslin cloth to remove the shaft or bran. The sievate was left to settle beneath the mixture for another 48h during
which fermentation proceeds in the process known as souring. The soybeans were sorted by handpicking to remove
unwanted materials such as stones, threads, pebbles, broken beans, spoilt beans etc. while the soy-paste was prepared
according to the method of Nwosu et al. (2014) with slight modifications. The sorted beans were boiled for 45min to reduce
the antinutrional factors in them and to facilitate easy dehulling. The soybeans were then dehulled and wet milled to obtain
soybeans paste.
The maize-soy gruel was thereafter prepared according to the method of Adesokan et al. (2011) with slight modification.
The maize and soy pastes were mixed together at different proportions (100:0, 90:10, 80:20, 70:30, 60:40 and 50:50
respectively). The mixture was poured in boiled water, stirred to obtain a custard-like semi-solid product. Water was then
added at the sides of the gruel and left for 10min to mix properly with the water. After stirring, the gruel obtained was
packaged in banana leaves and left to cool in order to obtain the doomed shape.
Proximate Analysis
Proximate analysis (crude protein, crude fat, ash, moisture, crude fiber) was determined as described by AOAC (2000)
methods while carbohydrate content was obtained by difference.
Microbial Analysis
Agar Preparation
Nutrient agar (NA) and Potato Dextrose Agar (PDA) were prepared according to manufacturer’s instruction. 28g of NA and
40g of PDA were weighed into separate beakers and each dissolved in 1L of distilled water, the mixture was thoroughly
mixed and sterilized using the autoclave at 121°C for 15 min.
Microbial Examination of Samples
One gram of the gruel sample was added to 10ml of sterile water in sterile test tube and was shaken properly. 1 ml from the
first test tube was transferred to 9 ml of sterile water and shaken properly to achieve solution of 10 -1 dilution. 1 ml from the
10-1 solution was then transferred to 9 ml sterile water in another sterile test tube to achieve 10-2 and the procedure was
repeated until 10-5 solution for both bacterial and fungal analysis. The microbial examination was performed according to
method described by Barnett et al., (2000) with slight modification. The pour plate technique was used. 1 ml each from 10-
3 and 10-5 were dispensed into sterile petri dishes using sterile pipettes. Cooled, molten sterile NA and PDA were poured
separately to cover the mixture in the petri dishes and swirled. The petri dishes were left for some minutes to solidify. After
solidifying, the plates for bacterial examination were inverted and incubated at temperature of 360C for 24 h while those for
fungi were incubated at ambient temperature (27 ± 20C) for 72 h. The colonies were counted after incubation using the
colony counter.
Sensory Evaluation
Sensory evaluation of maize-soy gruel was carried out by a fifteen-man panel comprising people who are familiar with the
product. The parameters evaluated were colour, aroma, taste, texture and overall acceptability using a 7-point hedonic scale.
The rating of samples ranged from 1(like extremely) to 7(dislike extremely).
Statistical Analysis
Proximate composition data were obtained in triplicates and expressed as mean ± standard deviation. All data obtained
were analyzed using one way Analysis of Variance (ANOVA) and the means separated using Duncan Multiple Range Test.
RESULTS AND DISCUSSION
The result of the proximate analysis carried out on the gruel samples are reported in Table 1. The moisture content in
maize-soy gruel are as follows; 35.22%, 33.69% , 31.10%, 29.85% , 27.96% and 25.97% for 100:0, 90:10, 80:20, 70:30,
60:40 and 50:50 maize- soybean respectively. Soybean has been reported to have a high water absorption capacity (Ribotta
et al., 2005; Samuel et al., 2006). However, the values of the moisture content obtained in the present study are higher than
8.8-8.9% reported by past study (Ijarotimi and Famurewa, 2006) for soy-maize flour.
Table 1: Proximate composition (%) of maize-soybean gruel.
Sample Moisture Crude
protein
Crude
fibre Ash Crude fat Carbohydrate
M 35.22±0.01a 6.56± 0.01f 0.74± 0.01f 1.21± 0.01e 1.25± 0.0f 55.01 ± 0.04f
MSA 33.69± 0.01b 8.72± 0.01b 1.18± 0.01e 1.86± 0.01d 2.29± 0.01e 52.26± 0.01e
MSB 31.10± 0.01c 10.83± 0.01d 1.50± 0.01d 2.13 ± 0.01c 3.58± 0.02d 50.86±0.02d
MSC 29.85± 0.02d 12.78± 0.02c 1.79± 0.02c 2.44± 0.01b 3.95± 0.01c 48.87 ±0.04c
MSD 27.96± 0.02e 14.84± 0.02b 2.15± 0.03b 2.95± 0.01a 4.32 ± 0.02b 47.92±0.04b
MSE 25.97± 0.01f 16.75± 0.01a 2.71± 0.01a 3.77± 0.01a 4.88± 0.01a 46.51±0.04a Values represent means of triplicate determinations. Means within a column with different superscripts are significantly different at P <
0.05. where M- 100% maize; MSA- 90% maize and 10% soybeans; MSB- 80% maize and 20% soybeans; MSC- 70% maize and 30%
soybeans; MSD- 60% maize and 40% soybeans; MSE- 50% maize and %50% soybeans
Soybeans addition undoubtedly increases protein content of any food product of its inclusion. For 6.56% protein content
was recorded for 100%:0 while 90:10, 80:20, 70:30, 60:40 and 50:50 maize-soybean had 8.72, 10.83, 12.78, 14.84 and
16.75% respectively. A similar increase of values ranging from 10.85 to 20.48% has been reported for soy–maize snacks
(Lasekan and Akintola, 2002), soy fortified kunun zaki (Ayo and Gaffa, 2002; Ijarotimi and Famurewa, 2006) and soy-
fortified custard (Okoye and Mazi, 2011). This is a desirable attribute especially for a developing country like Nigeria
where other sources of protein are relatively expensive.
There was increase in fat content on addition of soybeans in the gruel samples 100:0, 90:10, 80:20, 70:30, 60:40 and 50:50
maize-soybean having 1.25, 2.29, 3.58, 3.95, 4.32 and 4.88% respectively. The present result is in correlation with fat
content (0.97 to 4.52%) reported for tapioca-soybean fortified flour (Samuel et al., 2006). The ash content of maize-soy
gruel (p < 0.05) significantly increased from 1.21% in 100:0 to 3.77% in 50:50 maize-soybean samples. This is due to the
fact that soybeans are rich in minerals. Okoye and Mazi, (2011) reported similar findings in the production of soy fortified
custard with values ranging from 3.45 to 6.02%. However the crude fiber content varies considerably with increasing
soybean inclusions. This ranges from 0.74% in 100:0, 1.18% in 90:10, 1.50% in 80:20, 1.79% in 70:30, 2.15% in 60:40 and
2.71% in 50:50 maize-soybean. This same variation has been previously observed in past research work (Ijarotimi and
Famurewa, (2006).
Meanwhile the carbohydrate content of the 100:0, 90:10, 80:20, 70:30, 60:40 and 50:50 maize-soybean are 55.01, 52.26,
50.86, 48.87, 47.92 and 46.51% respectively. This is showing a decreasing trend in the gruel sample as proportion of
soybean flour increases. The present result is lower than those (64.73 - 73.86%) by previous works consistent with previous
works (Lasekan et al., 2004; Samuel et al., 2006; Okoye and Mazi, 2011).
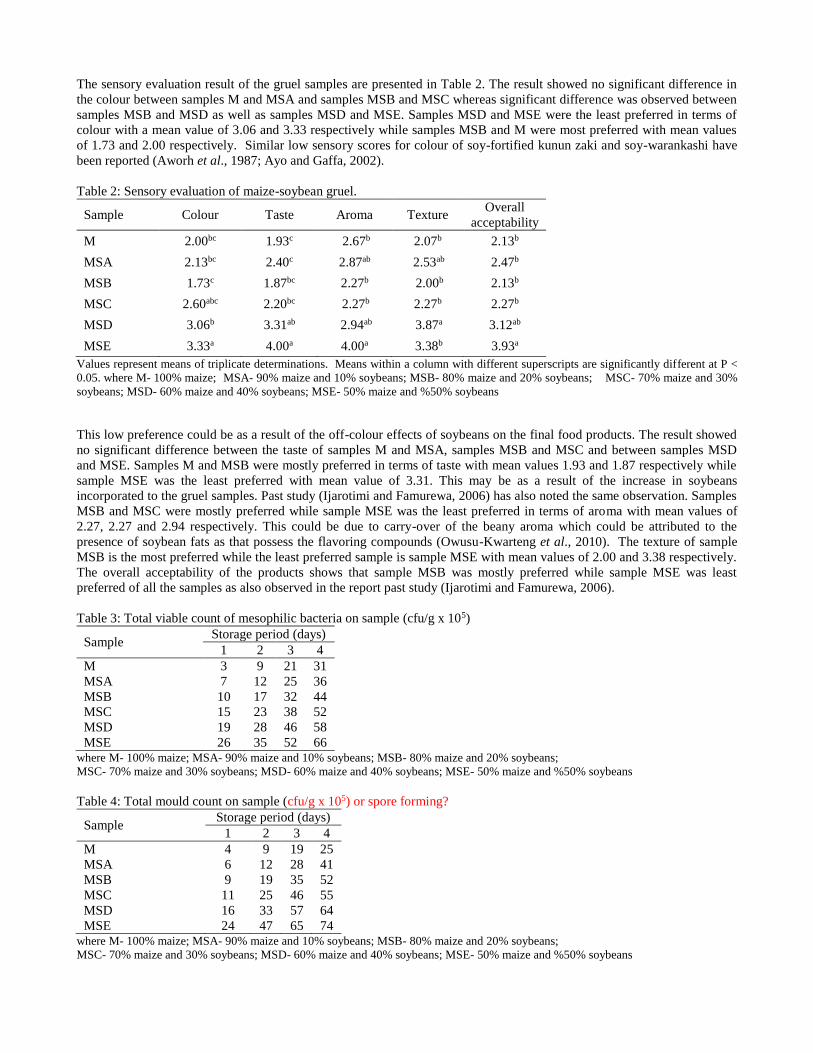
The sensory evaluation result of the gruel samples are presented in Table 2. The result showed no significant difference in
the colour between samples M and MSA and samples MSB and MSC whereas significant difference was observed between
samples MSB and MSD as well as samples MSD and MSE. Samples MSD and MSE were the least preferred in terms of
colour with a mean value of 3.06 and 3.33 respectively while samples MSB and M were most preferred with mean values
of 1.73 and 2.00 respectively. Similar low sensory scores for colour of soy-fortified kunun zaki and soy-warankashi have
been reported (Aworh et al., 1987; Ayo and Gaffa, 2002).
Table 2: Sensory evaluation of maize-soybean gruel.
Sample Colour Taste Aroma Texture Overall
acceptability
M 2.00bc 1.93c 2.67b 2.07b 2.13b
MSA 2.13bc 2.40c 2.87ab 2.53ab 2.47b
MSB 1.73c 1.87bc 2.27b 2.00b 2.13b
MSC 2.60abc 2.20bc 2.27b 2.27b 2.27b
MSD 3.06b 3.31ab 2.94ab 3.87a 3.12ab
MSE 3.33a 4.00a 4.00a 3.38b 3.93a
Values represent means of triplicate determinations. Means within a column with different superscripts are significantly different at P <
0.05. where M- 100% maize; MSA- 90% maize and 10% soybeans; MSB- 80% maize and 20% soybeans; MSC- 70% maize and 30%
soybeans; MSD- 60% maize and 40% soybeans; MSE- 50% maize and %50% soybeans
This low preference could be as a result of the off-colour effects of soybeans on the final food products. The result showed
no significant difference between the taste of samples M and MSA, samples MSB and MSC and between samples MSD
and MSE. Samples M and MSB were mostly preferred in terms of taste with mean values 1.93 and 1.87 respectively while
sample MSE was the least preferred with mean value of 3.31. This may be as a result of the increase in soybeans
incorporated to the gruel samples. Past study (Ijarotimi and Famurewa, 2006) has also noted the same observation. Samples
MSB and MSC were mostly preferred while sample MSE was the least preferred in terms of aroma with mean values of
2.27, 2.27 and 2.94 respectively. This could be due to carry-over of the beany aroma which could be attributed to the
presence of soybean fats as that possess the flavoring compounds (Owusu-Kwarteng et al., 2010). The texture of sample
MSB is the most preferred while the least preferred sample is sample MSE with mean values of 2.00 and 3.38 respectively.
The overall acceptability of the products shows that sample MSB was mostly preferred while sample MSE was least
preferred of all the samples as also observed in the report past study (Ijarotimi and Famurewa, 2006).
Table 3: Total viable count of mesophilic bacteria on sample (cfu/g x 105)
Sample Storage period (days)
1 2 3 4
M 3 9 21 31
MSA 7 12 25 36
MSB 10 17 32 44
MSC 15 23 38 52
MSD 19 28 46 58
MSE 26 35 52 66 where M- 100% maize; MSA- 90% maize and 10% soybeans; MSB- 80% maize and 20% soybeans;
MSC- 70% maize and 30% soybeans; MSD- 60% maize and 40% soybeans; MSE- 50% maize and %50% soybeans
Table 4: Total mould count on sample (cfu/g x 105) or spore forming?
Sample Storage period (days)
1 2 3 4
M 4 9 19 25
MSA 6 12 28 41
MSB 9 19 35 52
MSC 11 25 46 55
MSD 16 33 57 64
MSE 24 47 65 74 where M- 100% maize; MSA- 90% maize and 10% soybeans; MSB- 80% maize and 20% soybeans;
MSC- 70% maize and 30% soybeans; MSD- 60% maize and 40% soybeans; MSE- 50% maize and %50% soybeans

Tables 3 and 4 shows the total viable counts of mesophilic bacteria and mould counts for the samples during storage at
room temperature. There was increase in the number of microorganisms as the storage days increased. Increase in growth
rate of these microorganisms may be attributed to nutrient availability for the microorganisms, which are enormous in the
gruel samples due to its composition. For instance soybean has been as a rich medium containing proteins, vitamins and
importantly fermentable sugars such as sucrose and the oligosaccharides raffinose and stachytose that could aid microbial
growth (Adesokan et al., 2011).
CONCLUSION
Consumption of maize-soy gruel should be encouraged as it is of good nutritional value and a complete meal. The sample
with 80% maize and 20%soybeans was the most preferred according to the sensory evaluation (final consumer perception),
therefore, maize-soy gruels of acceptable quality may be prepared with up to 20% soybean paste
REFERENCES
Abdulrahaman A.A and Kolawole O.M. (2006). Traditional preparations and uses of maize in Nigeria. Ethnobotanical
leaflets 10: 219-227
Adelakun O.E, Duodu K.G., Buys, .E and Olanipekun B.F. (2013). Potential use of soybean flour (Glycine max) in food
fortification In Soybean - Bio-Active Compounds, Prof. Hany El-Shemy (Ed.), ISBN: 978-953-51-0977-8, InTech,
DOI: 10.5772/52599. Available from: http://www.intechopen.com/books/soybean-bio-active-compounds/potential-
use-of-soybean-flour-glycine-max-in-food-fortification
Adesokan I.A, Fawole A.O, Ekanola Y.A, Odejayi D.O and Olanipekun O.K, (2011). Nutritional and sensory properties of
soybean fortified composite ogi- a Nigerian fermented cereal gruel. African Journal of Microbiology Research
5(20): 3144-3149
Adeyemi I.A. and Soluade E.O. (1993). Development and quality evaluation of pawpaw-‘ogi’. Plants Foods for Human
Nutrition 44 (3): 213-220
Aminigo, E.R. and Akingbala, J.O. (2004). Nutritive composition of ‘ogi’ fortified with okra seed meal. Journal of Applied
Sciences and Environmental Management 8 (2): 23-28
Association of Official Analytical Chemists (AOAC, 2000). Official Methods of Analysis (17th Edition). Washington D.C.
Aworh O.C, Adedeji B.A and Nwanekezi E.C. (1987). Effect of partial substitution of cow’s milk with soybean on yield
and quality attributes of West African soft cheese. International Journal of Food Science and Technology 22: 135-
138
Ayo J.A. and Gaffa T. (2002). Effect of undefatted soybean flour on the protein content and sensory quality of ‘kunun –
zaki’. Nigerian Food Journal 20: 7- 9
Balogun M.A, Karim O.R, Kolawole, F.L and Solarin, A.O. (2012). Quality attributes of tapioca meal fortified with
defatted soy flour. Agroresearch 12 (1): 61-67
Barnett, J.A, Payne, R.W and Yarrow, D. (2000). Yeasts: characteristics and identification. 3rd edition. Cambridge
University press.
Belewu M.A.(2001). Nutritional and rheological evaluation of West African soft cheese made from plant coagulant
(Calotropis procera) during storage. Journal of Food Technology 6: 93-95
Fasasi, O, Adeyemi, I.A. and Fagbenro, O. A. (2006). Physicochemical properties of maize-tilapia flour blends. Journal of
Food Technology 3 (3): 342-345
IITA (2001). International Institute of Tropical Agriculture, Ibadan, Oyo State. Annual Report on Maize Production
Ijarotimi O.S. and Famurewa J.A.V. (2006) Assessment of chemical compositions of soybean supplemented weaning foods
and nutritional knowledge of nursingmothers on their utilizations. Pakistan Journal of Nutrition 5 (3): 218-223
Karim, O. R., Balogun, M. A., Oyeyinka, S. A. and Abolade, R. M. (2015). Comparative analysis of the physicochemical
and accceptability of enriched gari (fermented cassava product). Carpathian Journal of Food Science and
Technology 7 (2): 98-108
Lasekan O.O., Babajide J.M. and Adebayo O.J. (2004). Effect of soy on the physico-chemical properties of pupuru flour.
Nigerian Food Journal 22: 87-96
Nwosu O. I.C, Nnam N. N. and Maduforo A. N (2014). Development and nutritional evaluation of infant complementary
food from maize (Zea mays), soyabean (Glycine max) and Moringa oleifera leaves. International Journal of
Nutrition and Food Sciences 3(4): 290-299
Obatolu V.A, Augustine O. and Iken, J.E. (2007). Improvement of home-made maize tortilla with soyabean. International
Journal of Food Science and Technology 42: 420-426
Odunfa, S. A. and Oyewole, O. B. (1998). African fermented foods In Microbiology of fermented foods. Woods, B. J.B.
(ed) Blackie Academic and Professional, London, UK pp 713-746
Ogunlakin G. O, Olanipekun, B. F, Okpor, J. M and Ajayeoba, T. A (2015). Effect of soybeans treatment on some quality
parameters of soy-gari. Donnish Journal of Food Science and Technology 1(1): 001-005
Okoye, J.I. and Mazi, E.A. (2011). A development and quality evaluation of soy-fortified custard. Journal of Environment,
Science and Technology 1: 99-104.
Omemu A.M (2011). Fermentation dynamics during the production of ogi, a Nigerian fermented cereal porridge. Report
and Opinion, 2011; 3(4-10) http:/www.sciencepub.net/report
Osundahunsi, O.F and Aworh, A.C (2003). A preliminary study on the use of temperature- based formula. Plant Foods for
Human Nutrition 57 (3-4):365-376
Otunola, E. T., Sunny-Roberts, E.O. and Solademi, A.O (2007). Influence of the addition of okra seed flour on the
properties of ‘ogi’, a Nigerian fermented maize food. A Paper from the Conference on International Agricultural
Research for Development at the University of Kassel-Witzenhausen and University of Gottingen
Owusu-Kwarteng, J., Akabanda, F and Glover, R. L. K. (2010). Effect of soybean fortification on fermentation
characteristics and consumer acceptability of Hausa koko, a Ghanaian fermented porridge. .Journal of Applied
Biosciences 28: 1712 – 1717
Ribbotta P.D, Armuphi S.A, Leon A.E and Aron M.C. (2005). Effect of soybeans addition on the rheological properties and
bread making quality of flours. Journal of Science Food and Agriculture. 85: 1889-1896
Samuel F.O, Ayoola E.O, and Ayinla F.O. (2006). Chemical analysis and consumer acceptability of tapioca fortified with
soybeans. International Journal of Food and Agricultural Resources 3 (1): 1-5.

Marketing Perspective of Smoked Catfish by Consumers in South-West Nigeria
Adeola, A.A.1*; Ayegbokiki, A.O.2; Akerele, D.3; Adeniyi, B.T.4 and Bamidele, N.A.4
1Food and Nutrition Research Programme, Institute of Food Security, Environmental Resources and Agricultural Research,
Federal University of Agriculture, Abeokuta, Nigeria 2Food Security and Socio-Economic Research Programme, Institute of Food Security, Environmental Resources and
Agricultural Research, Federal University of Agriculture, Abeokuta, Nigeria 3Department of Agricultural Economics and Farm Management, Federal University of Agriculture, Abeokuta, Nigeria 4Fishery Research Programme, Institute of Food Security, Environmental Resources and Agricultural Research, Federal
University of Agriculture, Abeokuta, Nigeria.
*Corresponding author: [email protected]
ABSTRACT
Catfish consumption is increasingly becoming popular among Nigerians. With the rate of growth in population, demand is
likely to be on the increase in the future. This paper determined the marketing perspective of smoked catfish (Clarias
gariepinus) by consumers in South West Nigeria. A Multistage sampling procedure was used for data collection. Three
States in South West were randomly selected for the study. A total of 300 respondents were sampled. Descriptive statistics
and Tobit model were the statistical tools used for the analysis. The result revealed that there was a high level of smoked
catfish acceptance (92.6%) and consumption (88.3%) in the study area. Considering the factors that actually influenced the
quantity of smoked catfish consumed, the result showed that consumers’ income (0.0018671) and household size
(0.2691329) had positive and statistically significant influence (at 5%, respectively) on the quantity of smoked catfish
consumed. There was a negative relationship between higher educational level and fish consumption (-0.3855556), which
was significant at 10%. Since household size, level of income and male headed household (0.5373099), which was
significant at 1%, all influenced consumption of smoked catfish, it is therefore expected that smoked catfish will be a
lucrative business in south west Nigeria..
Keywords: catfish; consumers; consumption; marketing; perception; quality
INTRODUCTION
Fish is an essential source of food and relatively cheap source of animal protein to many people across developing nations,
especially Nigeria. People in some communities in various regions and states in Nigeria derived their livelihood from
fishing and related activities as a result of their closeness to oceans and seas. Fish is an important part of the diets of people
in these regions. It has been reported that fish consumption accounts for about 35% of animal protein consumption in
Nigeria and this could mean that fish farming is a vibrant and dynamic commercial sector in Nigeria, ripe with investment
and employment opportunities (USAID, 2014).
Data shows that Nigeria produced about 968,283 metric tons of fish in 2012 (Shehu, 2014). Despite this high level of fish
production in Nigeria, the demand for fish is still higher than what the supply in the market could meet up with. According
to USAID (2014), consumer demand in Nigeria was reported to be 2.66 million metric tons which was met only in part by
imports of about 740,000 metric tons that same year. Fish ranked second to wheat in the total food imported into Nigeria
between years 2006-2010 with an average annual value of N113.63 billion (Vaughan et al., 2014). This shows how
thousands of the Nigerian populace derive their livelihood directly from activities related to fish procurement, distribution
or consumption.
Furthermore, the average fish consumption in Nigeria is placed at 9.8 kg/caput (USAID, 2010); this is still far from meeting
the World Health Organisation (WHO) recommendation of 15 kg/caput fish consumption. With the rate of population
growth in Nigeria, demand is likely to be on the increase for the consumption of fish in the future. The reasons for
particular food choices are complex and diverse and food consumption, like any other complex human behaviour, is
influenced by many interrelating factors. According to Furst et al. (1996) and Olsen (2001) such factors include food
quality aspects (such as flavour, texture, odour) and characteristics of the individual (such as personality, preferences,
attitudes, perceptions, knowledge). Consumers’ preferences and interests are always of the foremost importance to
aquaculturists, leading to an improvement of aquacultural techniques and producing food, which is considered by the

consumer as attractive and acceptable. In this view, the fish consumer constitutes a major link between the supply and
demand. The knowledge of consumers’ preferences might increasingly contribute in the improvement of the terms of
production, fish distribution and the quality of their processed products (Garnier et al., 2003).
Different types of fish are consumed in Nigeria, among which include: Senegal jack (Caranx senegalllus), Marine catfish
(Arius mercatoris), Alexandria’s pompano (Alectis alexandrines), Mud catfish (Clarias gariepinus), Bonga fish
(Ethmalosa fimbriata) and Baraccudas (Sphyraena afria). Mud cat fish consumption is increasingly becoming popular
among Nigerians. It can be consumed in different ways. Due to its perishability, many preservative methods are employed
to extend its shelf life in Nigeria. Such methods include freezing, drying, smoking, etc. However, smoking is the most
common and practicable method of preservation (Eyo, 1992). This is due to the fact that it is affordable and improves the
organoleptic properties of the final product. Smoking is practised by rural and urban dwellers. In preserving fish by
smoking, water activity is lowered to the point where the activity of spoilage microorganisms is inhibited (Okonta et al.,
2005; Akinola, 2006).
Processors of smoked fish adopt different handling methods which have effect on the quality of the final product.
According to Eyabi-Eyabi (2000) and Omojowo et al (2008) salting, addition of vinegar as well as the type of wood used
for the smoking fire have significant contribution to the quality of smoked fish. Other methods that may contribute to the
quality of smoked fish include method of harvesting and killing the fish, duration of holding the fish before smoking, type
of oven. It is therefore important to obtain information on consumers’ perspective of fish quality as this would assist
processors to meet their demand.
In view of the above, this paper therefore seeks to answer the following questions:
i. What are the socio-economic characteristics of smoked catfish consumers?
ii. What is the level of smoked catfish consumption among the respondents?
iii. What is the perception of people towards smoked catfish?
iv. What are the criteria considered before buying smoked catfish?
v. What are the factors that determine the consumption of smoked cat fish?
The broad objective of the study is to determine marketing perspective of smoked catfish (Clarias gariepinus) by
consumers in south west Nigeria. Specifically, the study sought to:
i. determine the socio-economic characteristics of smoked catfish consumers;
ii. determine the consumption pattern of catfish among the respondents;
iii. determine the perception of people about smoked catfish;
iv. examine the criteria being considered by the respondents before purchasing smoked catfish; and
v. determine the factors that contribute to consumption of smoked cat fish..
METHODOLOGY
Study Area The study was conducted in South West Nigeria, made up of six states, namely: Ekiti, Lagos, Ogun, Ondo, Osun and Oyo
states. The region has a land mass of 76,852 square kilometers and a population of about 27.7 million (Nigeria Bureau of
Statistics, 2010). The south-west region is dominated majorly by Yoruba tribe.
The weather conditions vary between the two distinct seasons in Nigeria; the rainy season (which usually starts in March
and ends around November) and the dry season (usually between November-February). During the dry season, the region
experiences harmattan which is associated with dust, cold, dry winds from the northern deserts. Male and female, both old
and young are involved in fishing activities in the region. Although, women are more involved in processing and marketing
of the product; while men are into the production and harvesting of fish. Traditionally, men paddle canoe (mostly in the
coastline) to harvest fish. Lately, production of cat fish through culture system is becoming popular in the region.
Sampling procedures Multistage sampling procedure was used for data collection. Three (3) South West states, namely: Ogun, Ondo and Osun
were selected using random sampling method for the study. Then, there was purposive selection among communities where
catfish was regularly smoked and marketed in order to get adequate respondents. A total of 100 respondents were randomly
sampled across the selected communities in each of the state. 300 questionnaires were administered in all the three states,
out of which 19 questionnaires were found not useful for analysis due to missing data. The questionnaire was partitioned
into three basic sections: socio-economic characteristics; their smoked catfish consumption pattern as well as the factors
considered in purchasing the product.
Analytical technique

Descriptive statistics was employed to measure the socio-economic characteristics, consumption and perception of smoked
catfish by the respondents, while Tobit model was used to determine the factors that contributed to smoked catfish
consumption by the respondents. Some of the variables such as sex (male = 1, female = 0), age, marital status, secondary
occupation, consumption, etc. were coded as dummy variables (1, and 0 if otherwise). The respondents whose smoked
catfish consumption is insignificant, that is, those that consumed smoked catfish once-in-a-blue-moon were censored to 0.
Shazam statistical package, version 9, was used to run the data to generate results.
Tobit model is specified as:
Yi* = Xiβ + ei
where; ei = N (0, ϭ2).
Y* = latent variable that is observed for values greater than 0 and censored otherwise.
The observed Y is defined by the following measurement equation:
Yi ={█(y* if &y* >0
@0 if &y* ≤0)┤
Yi= Yi*
Traditionally, if we parameterize μ as Xiβ, this will give us the likelihood function for the Tobit model as:
L = ∏_i^n▒ 1/σ ϕ ((yi-Xiβ)¦σ) di 1- 𝝓 (Xiβ¦σ) 1 - di
where;
Yi = observable choice or outcome
Xi = independent variable (X1, X2... Xn)
Β = coefficient of independent variables
d = dummy indicator variable that equals 1 if y > 0
𝝈 = variance of the of estimate
Φ= standard normal probability distribution function
RESULT AND DISCUSSION
Socio-economic characteristics of the respondents Table 1 below shows the socio-economic information of the respondents. Majority of the respondents (35.2 %) belonged to
the age range of 26-35 years, followed by the people in the age range of 36-45 years (24.6 %) while those who were less
than 18 years were in the minority. This age distribution reflects that a good percentage of the sampled population are
smoked catfish consumers and this could contribute significantly to improving health status among the larger percentage of
working group in the society. The result also shows that 54.8 % of the respondents were male while about 45 % were
female. This could mean that a good percentage of household heads are more interested in consuming smoked catfish and
this could positively influence the entire family members into consuming smoked catfish. Parents, especially the household
heads, are more influential in modifying the diet of children in the family and thus, this may have influence in encouraging
the children in the family to consume smoked catfish (Jennifer et al., 2007; EUFIC, 2016)
The marital status distribution of the respondents’ shows that majority (62.6 %) of the respondents were married; about 35
% were single while 2.2 % were either divorced or widowed. About 53.4 % of the respondents had household size range of
4-6; with 34.2% and 12.5% possessing 1-3 and above 6 household sizes, respectively. It could therefore be deduced that
smoked catfish is more popular among the married people and who could possibly have an average household size of 4-6 in
the study area.
Considering the educational background of the respondents, majority of them (69.4 %) had tertiary education; 14.2 % had
secondary education and 4.6% of the respondents had no formal education. The educational background might be an
indication that the people of south-western Nigeria are well educated. This view is also supported by Huang (1994) and
Madu (2013) as Leonard Madu concluded that the people of the south west Nigeria are very significant in Nigeria’s
business and commerce, politics and also predominate the media and legal professions in Nigeria.
More than 74 % of the respondents were Christians, about 22 % practised Islam while 3.2 % practise other forms of
religions. This may indicate that consumption of smoked fish is most rampant among Christians than other religions. It may
also mean that food taboo has the most impact among traditional worshippers.
The socio-economic distribution of the respondents further shows that about 43 % of them were public/civil servants; about
22 % were either traders/artisans or render some other form of services in business world while about 35 % were students.
This distribution could be an indication that all classes of the society are interested in the consumption of smoked catfish in
the southwest region of Nigeria.

Table 1: Socio-economic characteristics of the respondents.
Socio-Economic
Characteristics Frequency Percentage
Age distribution
<18 2 0.7
18-25 60 21.4
26-35 99 35.2
36-45 69 24.6
46-55 36 12.8
56-65 15 5.3
Total 281 100
Sex distribution
Male 154 54.8
Female 127 45.2
Total 281 100
Marital status distribution
Single 99 35.2
Married 176 62.6
Divorced 3 1.1
Widowed 3 1.1
Total 281 100
Household size distribution
01-Mar 96 34.2
04-Jun 150 53.4
Above 6 35 12.4
Total 281 100
Education background distribution
No formal education 13 4.6
Primary education 20 7.1
Secondary education 40 14.2
Tertiary education 195 69.4
Adult education 13 4.7
Total 281 100
Religion distribution
Christianity 209 74.4
Islam 63 22.4
Traditional 5 1.8
Others 4 1.4
Total 281 100
Primary occupation distribution
Public/Civil servants 121 43.1
Trading/Business/ Artisan 62 22.1
Students and others 98 34.8
Total 281 100
Income distribution(N)
<10,000 39 13.9
10,000-30,000 75 26.7
30,001-60,000 72 25.6
60,001-90,000 33 11.7
90,001-120,000 27 9.6
120,001-150,000 8 2.8
150,001-180,000 17 6
180,001-250,000 8 2.8
>250,000 2 0.7
Total 281 100

Table 2: Consumption/perception of catfish by respondents.
Consumption/Perception Frequency Percentage
Consumed smoked catfish
Yes 248 88.3
No 33 11.7
Total 281 100
Preferred form of consumption
Boiled 62 22.1
Pepper soup 102 36.3
Smoked 91 32.4
Fried 21 7.5
Indifferent 5 1.8
Total 281 100
Acceptability by household
Yes 260 92.6
No 21 7.5
Total 281 100
Present smoked catfish as gift
Yes 211 75.1
No 70 24.9
Total 281 100
Attraction to smoked catfish
Sweet aroma 80 28.5
Rich source of nutrient 59 21
More delicious 81 28.8
Storage quality 39 13.9
Indifferent 22 7.8
Total 281 100
Smoked catfish is more
Nutritious
Strongly agreed 90 32
Agreed 70 24.9
Strongly disagree 25 8.9
Disagreed 47 16.7
I do not know 49 17.4
Total 281 100
Preferred processing method
Oven drying 102 36.3
Smoking Kiln 109 38.8
Charcoal pot 38 13.5
Sun Drying 26 9.3
Indifferent 6 2.1
Total 281 100
Average quantity purchased in a
month (kg)
<1 98 34.9
01-Mar 108 38.4
04-Jun 36 12.8
07-Oct 12 4.3
>10 12 4.3
Never purchased 15 5.3
Total 281 100
The income distribution of the respondents shows that about 14 % of the respondents earned less than N10,000:00k per
month. Majority of the respondents (about 53 %) earned between N10,000.00k and N60,000.00k, while very few (8.8 %)
earned between N150,001.00k and N250,000.00k. It was observed that income did not vary evenly along with educational
background of respondents.

Respondents’ perception and consumption of smoked catfish Table 2 below shows the respondents’ perception and consumption of smoked catfish in the study area. About 88.3 % of
the respondents consumed smoked catfish in the study area while 12% did not. Thus, there was a high level of smoked
catfish acceptance and consumption in the study area. The mode of consumption differed as most of the respondents who
consumed catfish (36.3 %) preferred it in pepper soup form while 32.4 % of the respondents preferred to consume it in the
smoked form while 1.8 % of the respondents were indifferent. Majority of the respondents (92.6 %) revealed that smoked
catfish was acceptable to the members of their household. Smoked catfish consumers constitute an important link between
supply and demand. The knowledge of the consumer preferences might therefore play important role in the production and
distribution of smoked catfish.
About 75 % of the respondents accepted they had either purchased or could purchase smoked catfish as a gift to either
friends or families. This again indicates a good acceptability of smoked catfish in the south west Nigeria. Major factors that
attracted consumers to purchasing smoked catfish were found to be the ‘sweet aroma that exudes from smoked catfish’(28.5
%), ‘rich source of nutrient’(21 %), ‘good delicious taste that comes with smoked fish’ (28.8 %) and ‘better storage quality’
(13.9 %) . Only 7.8 % of the respondents were indifferent to the attractive factors associated with smoked catfish.
When considering the perception of the nutritional value of the smoked fish, a good number (32 %) of the respondents
‘Strongly agreed’ while some (24.9 %) others ‘Only agreed’ that smoked catfish is better in nutritional quality than the
fresh catfish. This high level of knowledge could be associated with the educational status of the respondents in the study
area. The result further showed that about 25.6 % of the respondents ‘totally disagreed’ that smoked catfish was of better
nutritional quality than fresh catfish while a few others (17.4 %) of the respondents did not actually know any information
about the nutritional quality of smoked catfish.
Table 2 further shows that 38.8 % of the respondents preferred smoking kiln as a means of processing catfish while about
36 % actually liked it oven dried, and only 2.1 % were indifferent about how catfish was being processed. Those indifferent
only desired to eat smoked catfish. An average of 1-3 kg and 4-6 kg of smoked catfish were purchased and consumed
monthly by most of the respondents who represented 38.4 % and 12.8 %, respectively. This shows an indication that
smoked catfish will be a huge success if it can be taken as a business as there is potential good market for the product.
About 35 % of the respondents consumed less than 1 kg per month while only few respondents (5.3 %) had never
purchased smoked catfish as some claimed that they do not like how it tasted. A similar research carried out in the United
States indicated that 13 % of the survey respondents decreased their consumption of sea foods during the previous two
years, because of the change in lifestyle and taste (Wessells et al., 1996). Also, in a research conducted by Kreider et al.
(1993) in Delaware-US, taste was the most frequent reason given by respondents (42.3 %) who did not consume fish and
sea foods. Thus, 5.3 % of the respondents who did not consume smoked catfish would not have any major impact on the
marketability of the product in the study area like it would have caused if the percentage was as high as the similar study in
Delaware, US.
Criteria being considered by the respondents before purchasing smoked The extent to which certain attributes of catfish influenced respondents’ decision to purchase is shown in Table 3.
Attributes such as aroma (56.2 %), skin condition (59.4 %), level of dryness (84.7 %), and packaging (51.2 %) were
desirable factors that most respondents considered during purchase of smoked catfish. Hence, it is advisable that the
potential producers and/or marketers of smoked catfish take cognizance of these factors in order to obtain high acceptability
of their products by the consumers. On the other hand, majority of the respondents were not really interested in considering
factors such as skin colour of the smoked fish (55.6 %), body rigidity (61.2 %), body consistency of the smoked fish (63 %)
and the fish belly puffiness (74.7 %). Also, majority of the consumers were neither interested in the source of the smoked
catfish nor cared about the National Foods Drugs Administration and Control (NAFDAC) registration number before they
placed their order of smoked fish. Again, all these can be considered a great advantage for any potential investor in smoked
catfish as they have less to worry about to attain consumers’ satisfaction.
Factors influencing the quantity of smoked catfish consumed by the respondents Considering the factors that actually influenced the quantity of smoked catfish consumed by the respondents per month, the
results in Table 4 shows that consumers’ income (0.0018671) and household size (0.2691329) had positive and statistically
significant influence (at 5%, respectively) on the quantity of smoked catfish consumed, suggesting that improved income
and increases in household size could substantially raise consumption of smoked catfish in south-west Nigeria. This study
is in line with Amao and Ayantoye (2014); Mafimisebi (2012); Musaba and Namukwambi (2011); Amao et al (2006) and
Delgado et al. (2003) who found positive influence of increase in household size and income on fish consumption in their
respective studies as well as Dalhatu and Ala (2010) who established positive relationship between household fish

consumption and household size. Ali-ud-din Khan and Ahmad (2014) in their study on income and consumption generally
concluded that the level of income and household size both had positive influence on level of consumption and this study is
in concordance with that. The findings of this study contradicts Cengiz Sayin et al. (2010) who established
negative/insignificant relationship between income and household size on the level of fish consumption. Table 4 further
shows that there was a negative relationship between higher educational level and fish consumption (-0.3855556), which
contradicts Ali-ud-din Khan and Ahmad (2014) findings that increase in level of education had a positive influence on
consumption. This suggests that higher formal educational attainment may induce negative incentive towards smoked
catfish consumption in southwest Nigeria. This finding is contrary to our expectation; this is because appreciation of the
nutritive values of foods has been shown to be positively related with higher educational attainment.
Table 3: Attributes of smoked catfish affecting purchase
Attributes Frequency Percentage
Aroma
Yes 158 56.2
No 123 43.8
Total 281 100
Skin condition
Yes 167 59.4
No 114 40.6
Total 281 100
Level of dryness
Yes 238 84.7
No 43 15.3
Total 281 100
Packaging
Yes 144 51.2
No 137 48.8
Total 281 100
Skin colour
Yes 125 44.5
No 156 55.6
Total 281 100
Body rigidity
Yes 109 38.8
No 172 61.2
Total 281 100
Body consistency
Yes 104 37
No 177 63
Total 281 100
Belly puffiness
Yes 71 25.3
No 210 74.7
Total 281 100
Source of catfish
Yes 109 38.8
No 172 61.3
Total 281 100
NAFDAC
registration number
Yes 41 14.7
No 240 85.4
Total 281 100
Source: Field Survey, 2014

Table 4: Tobit regression on factors influencing the quantity of smoked catfish consumed by the respondents per month
Variable Coefficient
Robust
Std.
Error
T-Ratio P>|t| [95% Conf. Interval]
Household size 0.2691329 0.11959 2.25** 0.025 0.0336738; 0.504592
Income (N) 0.0018671 0.00094 1.99** 0.048 0.0000167; 0.0037174
Secondary Education dummy -0.2316601 0.28301 -0.82 0.414 -0.7888785; 0.3255583
Tertiary Education dummy -0.3855556 0.23125 -1.67* 0.097 -0.8408659; 0.0697548
Age range 31 to 45 -0.2828767 0.20062 -1.41 0.16 -0.6778657; 0.1121123
Age ≥45 0.0274807 0.26539 0.1 0.918 -0.4950361; 0.5499976
Sex (Male) dummy 0.5373099 0.15264 3.52*** 0.001 0.2367742; 0.8378456
Marital status (single) dummy 0.2486610 0.19600 1.27 0.206 -0.1372448; 0.6345667
Religion 0.0418194 0.17145 0.24 0.807 -0.2957432; 0.379382
Occupation (civil servant) dummy 0.1442914 0.17674 0.82 0.415 -0.2036912; 0.4922739
Ogun state (dummy) -0.3123081 0.25835 -1.21 0.228 -0.8209718; 0.1963555
Osun state (dummy) -0.2562524 0.26782 -0.96 0.34 -0.7835576; 0.2710529
Ondo state (dummy) -0.0299263 0.27835 -0.11 0.914 -0.5779726; 0.5181201
Constant 1.106266 0.41003 2.7 0.007 0.2989603; 1.913571
Sigma 1.213596 0.06722 1.081248; 1.345943
Source: Computed from Field survey, 2014
Note: *** = Significant at 1%, ** = Significant at 5% and * = Significant at 10%
The position of this paper is not to marginalize or downplay the significant role of education in improving food (fish)
consumption. It might be thinkable that with higher level of education beyond the secondary school, nutritional knowledge
may drive food (animal protein) consumption away towards consumption of other types of fish or animal protein sources.
Some of the studies that have found positive relationship between level of education and fish consumption include Dalhatu
and Ala (2010) and Amao et al. (2006) and those that have established insignificant/negative relationship include
Gebrezgabher et al. (2015) and Mafimisebi (2012), among others. None of the coefficients of state-level dummies is
statistically significant; suggesting that the qualitative (spatial) differences in the consumers place of residence is unlikely
to substantially influence consumption of smoked catfish among the consumers. The study also revealed that the gender
(male) specificity of the consumer would have little influence on smoked catfish consumption.
CONCLUSION
It could be drawn from this study that smoked catfish is highly popular among the people of south-west Nigeria as good
percentage of respondents preferred smoked catfish to any other form of processing due to its high nutritive value. The
level of dryness of the smoked catfish and the packaging strategies of the smoked catfish by the farmers/marketers also
played significant roles in the sales of smoked catfish in the study areas. The significance of packaging is in consonance
with Adebo and Toluwase (2014) which recommended that there is need for research focus on packaging of smoked catfish
for value addition in order to improve the marketability of the product. Since household size, level of income and male
headed household all influenced the consumption of smoked catfish, it is therefore expected that smoked catfish will be a
lucrative business in the south-western Nigeria. It is necessary to encourage those in the business through micro-credit
scheme to improve on packaging technology which could enhance the marketability of the product and relevant law
enforcement agents should ensure strict Good Manufacturing Practice among smoked catfish processors since majority of
consumers never care about the endorsement of the product by government agency such as NAFDAC before consumption.
REFERENCES
Adebo G. M. and Toluwase, S. O. W. (2014). Comparative Analysis of Fresh and Smoked Catfish Marketing in Ekiti and
Ondo States of Nigeria. Journal of Biology, Agriculture and Healthcare, Vol.4 (19). Page no?
Akinola, O. A., Akinyemi, A. O. and Bolaji, B. O. (2006). Evaluation of traditional and solar drying systems towards
enhancing fish storage and preservation in Nigeria. (Abeokuta Local Government as a case study). J. Fish. Int., 2
(1), 99 – 103.
Ali-ud-din Khan, M. and Ahmad, I. (2014). An Emperical Study into the Relation of Income and Consumption Using
Cross-Sectional Data, ASEE 2014 Zone I Conference, April 3-5, University of Bridgeport, Bridgpeort, CT, USA.
Amao. J.O and Ayantoye K. 2014. Consumer Preference and Consumption Pattern for selected forms of Fish in Oyo State,
Nigeria. International Journal of Science, Environment and Technology, 3 (3), 841 – 860
Amao, J. O, Oluwatayo, I. B and Osuntope F. K. 2006. Journal of Human Ecology, 19(1), 25-30.
Cengiz Sayin; Yilmaz Emre; M. Nisa Mencet; Suleyman Karaman and Yavuz Tascioglu (2010). Analysis of Factors
Affecting Fish Purchasing Decisions of the Household: Antalya District Case, Journal of Animal and Veterinary
Advance, 9(12) 1689-1695.
Dalhatu, M and Ala, A.L. (2010). Analysis of Fish Demand in Sokoto Metropolis, Sokoto, Nigeria, Nigerian Journal of
Basic and Applied Science, 18(2): 154-159
Delgado, C.L.; Wada N.; Rosegrant, M.W.; Meijer S. and Ahmed M. (2003). Fish to 2020: Supply and Demand in
Changing Global Markets. International Food Policy Research Institute, World Fish Center, Wellington, New
Zealand, pp: 29-44.
Eyabi-Eyabi, G. D. (2000). Brining, smoking and packaging of fish quality. Und. Ed. Pub. Cameroun Acad. Sci. Ref.
CAS/00/23.
Eyo A. A. (1992). Traditional and improved fish preservation and processing techniques. Paper presented at the 17th
NIFER National Workshop on fish processing, storage, marketing and Utilization, 4th - 8th May, 15 pp.
EUFIC, European Food Information Council (2016). Parental influence on children’s food preferences and energy intake.
Available at: http://www.eufic.org/article/en/artid/Parental-influence-children-food-preferences-and-energy-intake/.
Accessed on 4th March, 2016.
Furst, T., Connors, M., Bisogni, C.A., Sobal, J. and Falk, W., (1996). Food Choice: a conceptual model of the process.
Appetite, 26: 247-266.
Garnier, J.P., Klont, R., Plastow, G. (2003). The Potential Impact of Current Animal Research on the Meat Industry Land
Consumer Attitudes Towards Meat. Meat Science, 63: 79-88.
Gebrezgabher, S.A., Amewu, S. and Amoah, P. (2015). Consumer preference and willingness to pay for fish farmed in
treated wastewater in Ghana, Selected Paper prepared for presentation at the 2015 AAEA & WAEA Joint Annual
Meeting, San Francisco, California, 26-28 July.
Huang, F. (1994). The Yoruba and Other Major Nigerian Ethnic Groups. African Postcolonial Literature in English in the
Postcolonial Web, available at http://www.postcolonialweb.org/nigeria/yorubaFH.html, accessed on 11th Aug.,
2015.
Kreider, C.R., Gempesaw, C.M., Bacon, J.R., Toensmeyer, U.C. and Groff, A.J. (1993). An Analysis of Consumer
Perceptions of Fresh Fish and Seafood in the Delmarva Region. Journal of Food Distribution Research, 4: 37-48.
Jennifer S. S., Jennifer O. F., and Leann L. B. (2007). Parental Influence on Eating Behavior Conception to Adolescence, J.
Law Med Ethics 35(1): 22–34.
Madu, L. (2013). Who are the Yoruba People of Nigeria? Available at: http://chatafrik.com/articles/nigerian-affairs/who-
are-the-yoruba peoplenigeria, Accessed on 11th August, 2015
Mafimisebi, T. 2012. Comparative Analysis of Fresh and Dried Fish Consumption in Rural and Urban Households in Ondo
State, Nigeria, IIFET 2012 Tanzania Proceedings. Available
at:https://ir.library.oregonstate.edu/xmlui/bitstream/handle/1957/35117/Mafimisebi.pdf?sequence=4 Accessed on
26th January, 2016
Musaba, E. C. and Namukwambi, M. (2011). Socio-economic determinants of consumer fish purchase in Windhoek,
Namibia. African Journal of Agricultural Research, 6(6):1483-1488
Nigeria Bureau of Statistics, (2010). Annual Abstract of Statistics, Federal Republic of Nigeria publisher?
Okonta, A. A. and Ekelemu, J. K. (2005). A preliminary study of micro-organisms associated with fish spoilage in Asaba,
Southern Nigeria. Proceedings of the 20th Annual Conference of the Fisheries Society of Nigeria (FISON), Port
Harcourt, Nigeria. pp557 – 560.
Olsen, S.O. (2001). Consumer involvement in seafood as family meals in Norway: an application of the expectancy-value
approach. Appetite, 36: 173-186.
Omojowo, F. S., Omojasola, P. F. and Ihuahi, J. A. (2008). Microbial quality of Citric Aid as preservative in smoked
catfish (Clarias gariepinus). Bio. and Env. Sci. J. 5 (3), 130 – 134.
Shehu, A. (2014). Fisheries and Aquaculture: Options and pathway to providing more fish in Nigeria. The Nations online
publication of February 14, 2014. Accessed at www.thenationonlineng.net/fisheries-and-aquaculture-options-and-
pathway-to-providing-more-fish-in-nigeria/ on 25th May, 2015
USAID, (2010). Best Management Practices for Fish Farming Package of Practices (POP) for Fish Farming USAID
Markets Programme – Nigeria. Available at:
http://www.nigeriamarkets.org/files/Aquaculture%20POP%20final%202010.pdf.
USAID, (2014). Markets, increasing competitiveness and food security in Nigeria. Available at:
http://www.nigeriamarkets.org/index.php?option=com_content&view=article&id=123&Itemid=67
Vaughan, I.O; Afolami, C.A; Oyekale, T.O and Ayegbokiki, A.O. 2014. An Analysis of Nigeria Food Imports and Bills,
International Journal of Economics, Commerce and Management, United Kingdom 2(9).
Wessells, C.R., Kline, J. and Anderson, J.G. (1996). Seafood Safety Perceptions and their Effects on Anticipated
Consumption under Varying Information Treatments. Agricultural and Resource Economics Review, 25: 12–21.
Effects of Agricultural Sector Reforms on the Performance of some Quoted Agric-Based
Companies on Nigerian Stock Exchange
Ayegbokiki, A.O.1*; Arigbede, H.O.2; Okuneye, P.A.3; Ayinde, I.A.3 and Adeoye, S.O.3
1Institute of Food Security, Environmental Resources and Agricultural Research (IFSERAR), Federal University of
Agriculture, Abeokuta, Nigeria 2Department of Agricultural Economics, University of Ibadan, Ibadan, Nigeria 3Department of Agricultural Economics and Farm Management, Federal University of Agriculture, Abeokuta, Nigeria
*Corresponding author: [email protected]
ABSTRACT
The study was focused on the effects of Agricultural sector reforms on the performance of some quoted Agric-based
companies on the Nigerian Stock Exchange (1993-2007). The variables of the study were measured and analyzed
statistically using financial ratios such as Return on Equity (ROE), Average Price/Stock Price per Share, Earnings Yield,
Dividend Yield, Price-Earnings Ratio, etc. These helped to ascertain the financial conditions of the firms and regression
analysis was used to capture the performance of the Agric-based companies with regards to the reforms in the Agricultural
Sector in Nigeria. Cobb-Douglas explicit functional model was selected as the lead equation based on econometric,
economics and statistical criteria. The results showed the significance of price earnings ratio, net assets per share,
dividend yields as well as the dummy variables for Okomu Oil Palm Plc and the results further reflected that the reforms
during the periods under review has significantly stimulated the market and operational performance of Okomu Oil Palm
Plc and Nestle Nigeria Plc. Based on some indicators; it was shown that these companies has made considerable progress
over time.
Keywords: Agric-Based; Nigerian government; Policy; Reform; Stock exchange
INTRODUCTION
Olomola (2007) opined that the neglect of the Agricultural sector upon the advent of oil has confirmed to take its toll on the
Nigerian economy. Government’s low budget provision at every fiscal year has made it more worrisome. Hence,
Agriculture which used to be the mainstay of the Nigerian Economy has been relegated to the backstage. Agriculture is
Nigeria’s second-largest source of national wealth, after oil. Despite the dominant role of the petroleum sector as the major
foreign exchange earner, agriculture remains the mainstay of the economy. In addition to contributing the largest share of
Gross Domestic Product (GDP), it is the largest non-oil export sector earner, the largest employer of labour, and a key
contributor to wealth creation and poverty alleviation, as a large percentage of the population derives its income from
agriculture and related activities. Agricultural sector, one of the sources of economic growth, is looked unto to pave the way
for economic development since it has the potentials of generating employment opportunities, alleviating food insecurity,
encouraging agro-industrialization and improving entrepreneurship through capacity building. The realization of this fact
led Nigerian government to embark on several agricultural development programmes, many of which, unfortunately, failed
(Manyong et al, 2005 and Ogungbile, 2008).
However, over the years, the rate of growth in agricultural production has stagnated, and failed to keep pace with the needs
of a rapid growing population, resulting in a progressive rise in import bills for food and industrial raw materials. The
potentials of the agri-business sector as a major employer of the growing labour force and earner of foreign exchange have
also been undermined.
Given the dominant role of agriculture in the economy, prospects for food security, supply of industrial raw materials and
overall economic growth are critically dependent on what happens in this sector. Jacques (2004) quoted the Greek
philosopher - Xenophon who said: “Agriculture is the mother of all arts. When it is well conducted all other arts prosper.
When it is neglected, all other arts decline. “Also, quoting Jawaharlal Nehru-India’s first post-colonial Prime Minister who
remarked as follows: “Everything else can wait but not agriculture.”
The role of agricultural sector contributing to economic development depends not only in creating a conducive financial
environment for the farming community alone but also an attempt must be extended to develop conditions that will enhance
the growth of the Agro-industrial sector as well as food and beverages sector which takes on the excess that is not
immediately consumed. The growth of these depends to a large extent on access to finance which can be derived from a
variety of sources, especially, from the equity share sold on the Stock Exchange (Yazdani, 2008).
The role of the Nigerian government in agriculture is predicted on the prevailing socio-economic conditions of the Nigerian
Society, particularly at independence. The conditions generally made state intervention inevitable. For instance, agriculture
provided nearly two-thirds of government’s revenue and foreign exchange earnings in the 1960s (Haggblade, 2005). Also,
about 70 percent of the population lived on agriculture for household income and employment. However, the agricultural
sector was characterized by little growth of output per capita, low productivity, pervasive illiteracy, static and poorly
developed institutions, restrictive markets and unprogressive policy stance or policy inconsistency. The government was
unable to ignore these challenges and saw agriculture as the fulcrum ground which the entire national socio-economic
development should revolve. Consequently, agriculture was perceived as having a significant role to play in the
development process and government intervention was seen as desirable (Haggblade, 2005).
Bello (2007) examined the agricultural sector and its constraints, actions taken to address these constraints, key policy
thrusts and directions, strategies adopted to implement the policy actions; ongoing programmes, successes recorded so far,
observed gaps in strategy and programmes, and the prospects for the future and the way forward. It must be noted that
current achievements recorded in the agricultural sector must be assessed from the perspective of regaining lost ground,
especially when viewed from the role agriculture played in the Nigerian society economy in the 1960s to late 1970s. This
perhaps underscored the need to go beyond sustaining current achievements to breaking new grounds and positioning
agriculture as the mainstay of the Nigerian economy through gainful employment, agro-industrial development and growth,
raw material production for industry, enhanced foreign exchange earnings, food security and poverty reduction (Akande
and Olomola, 2007).
The ongoing effort of the federal government to reposition Nigeria among respected and economically stable nations is
challenging. The Obasanjo Administration did therefore, undertake very wide and penetrating reforms in the Nigerian
economy such as the National Economic Empowerment and Development Strategy (NEEDS), the liberalization of the
economy in order to reduce the opportunities of rent-taking officials, fiscal discipline, free market and privatization among
others over the period of his two-term tenure from 1999-2007 (John, 2011 and Augustine, 2007). These reforms were
inevitable if the economy was to achieve the desired level of growth and if poverty is to be reduced to its barest minimum
by reducing unemployment rate and avoiding the vulnerability to fluctuations in oil prices and thereby improve the average
income per capita of the citizens.
Reforms in the Agricultural Sector
Agriculture has not been spared the strokes of the now pervasive reforms process. Right from the onset of the civilian
dispensation, it was considered an advantageous policy to fuse agriculture and rural development into a single government
ministry. In 2001, the National policy and strategy for Integrated Rural Development was launched and adopted as a
replacement for that enacted as far back as 1989. The key leaning of the new policy were said to be, among others:
the creation of a conducive macro-economic environment to stimulate greater private sector investment in agriculture; the
rationalization of the roles of the different tiers of government; reorganization of the industrial framework for government
interventions in the sector; actualizing and implementing integrated rural development; increased budgeting allocation to
enhance production and productivity; increasing fiscal incentives to agriculture and reviewing trade regulations; promoting
increased use of machinery and input through favourable tariff policy.
For most sub-Sahara African countries including Nigeria, agricultural development is considered to hold the key to
economic development. In view of this, development Economists insist that, if there is to be a structural transformation in
output and labour force in the long-run, there must first be in the short-run some successful policies of agricultural
development to facilitate this transformation (Ayodele, 2000).
According to Essien (2005), most countries of the world have undertaken one form of economic reform or another at a time
in their history. The goals of these reforms may differ from country to country: nevertheless, they are all closely aligned
towards putting their economies on a path of sustainable growth and development. Consolidating on the policies made to
reform agriculture in Nigeria, the National Economic Empowerment and Development Strategy (NEEDS) sets the
following targets to restore agriculture to its former status as a leading sector in the economy.
a. Achieve minimum annual growth rate of 6 percent in agriculture
b. Raise agricultural exports to $3billion in 2007.
c. Drastically reduce food imports from 14.5% of total imports to 5% by 2007
d. Protect all prime agricultural lands for continued agricultural Production
e. Develop and implement a scheme of land preparation services to increase cultivable arable land by 10% a year and
forest private sector participation through incentive schemes.

The Nigerian Stock Exchange is the major stock exchange of Nigeria. It is headquartered in Lagos and was established on
September 15, 1960 and then known as Lagos Stock Exchange (LSE) In December 1977, it came to be called “The
Nigerian Stock Exchange and it currently consists of nine trading floors located at Lagos, Kaduna, Kano, Onitsha, Ibadan,
Yola, Abuja, Port Harcourt and Benin-city. As of March 9, 2007, it has 283 listed companies with a total market
capitalization of N15 trillion ($125billion). All listings are included in the only index, the NSE All Share Index. The
Exchange has an Automated Trading System (ATS). Data on listed companies’ performance are published daily, weekly,
monthly, quarterly and annually.
Ambe (1998) wrote that the Nigerian capital market performs a lot of roles in the development of the economy. The roles
include providing:
a. opportunities for companies to borrow funds for investment purposes
b. an avenue for marketing of shares and other securities to the investing public in order to raise fresh funds for
expansion of operations of companies.
c. opportunities for governments to finance their projects, including infrastructure for socio-economic development.
d. needed SEED money for venture capital and encouraging good corporate governance by ensuring transparency,
good accounting and management practices.
Agro-Allied Sub-Sector
Stock Market Guide (2005) forecasted that the Agric-sector is promising in terms of prospects for rapid growth over the
few years. This is strongly indicated by the impressive annual growth of about 7.0 percent recorded in 2003-one of the
highest sectoral growth records obtained in the year. Improvement in capacity plus emerging opportunities for exports
should raise new hopes and expectations for investors. The low import content of agricultural output is expected to preserve
profit margin.
The operator has a firm control of their market in terms of customers, prices and margins. This put them in a position to
achieve some of the highest growth rates in sales and profit in the stock market. In 2003, listed agric. companies came
among the top equities that recorded the highest price appreciation. At the NSE, seven companies are quoted under the
Agricultural/Agro-allied sub-sector. However, only about two to three companies have been operating as a going concern;
Okomu Oil Palm Plc and Presco Plc., located in Benin City. The companies have continued to compete favourably even as
they design strategies to expand their share of the market.
( NSMA (2005) ) however, wrote that the two companies have constantly appreciated the contribution of their
shareholder’s towards their continued growth. For instance, Okomu Oil paid a dividend of 45k per 50k share in 2007; this
probably explained the rise in price of Okomu to N18.45 as at August 2004.
From a global perspective, the state of the capital market gives an idea of the state of health of the national economy. It also
measures the stability of the economy with regards to the extent to which economic activities can rely on it. -Essentially the
level of national economic development and the extent to which most economic activities can effectively rely on the safety
of the capital market are major indicators of a healthy balance between a sound financial system and macro-economic
stability.
Having briefly considered the reforms in the agricultural sector, it is therefore imperative to examine its effects on the
market and operational performance on agri-business in Nigeria. The agricultural sector, prior to the inception of the
Obasanjo Administration in 1999 was characterized by decaying infrastructure, poor research facilities, low yield of crops,
high post-harvest losses, poor institutional linkages and partnerships, inconsistent macro-economic policies, lack of
appropriate technology and modern inputs, weak extension services, ineffective control of pests and diseases and poor data
base or policy formulation. The reform measures to tackle these problems commenced with the updating of the existing
agricultural policy and approval of a new policy in 2001. What then are the effects of these reforms on the performance of
listed based companies on the NSE?
The dismal performance of Nigerian agriculture in the last two decades raises a number of critical questions in relation to
the perceived roles of agriculture in the process of economic development: First, to what extent has Nigerian agriculture
been able to perform its roles? Second, how have different policies failure had significant effects on the agricultural sector
and consequently on the growth of quoted agric-based companies on the NSE? Third, what implications do these have for
Nigeria’s agricultural, private and public sector development in the future? These and other pertinent issues are the focus of
this study.
The broad objective of this study is to critically examine the effects of Agricultural sector reforms on the performance of
some quoted Agric-based companies on the Nigerian Stock Exchange (1993-2007). Specifically, the study aims at
achieving the following objectives:
i. identify the different economic reforms in the Agricultural Sector in Nigeria from 1999-2007
ii. access the impacts and shared values of the companies under consideration on the Nigerian economy.
iii. evaluate the trend in some financial ratios of these companies.
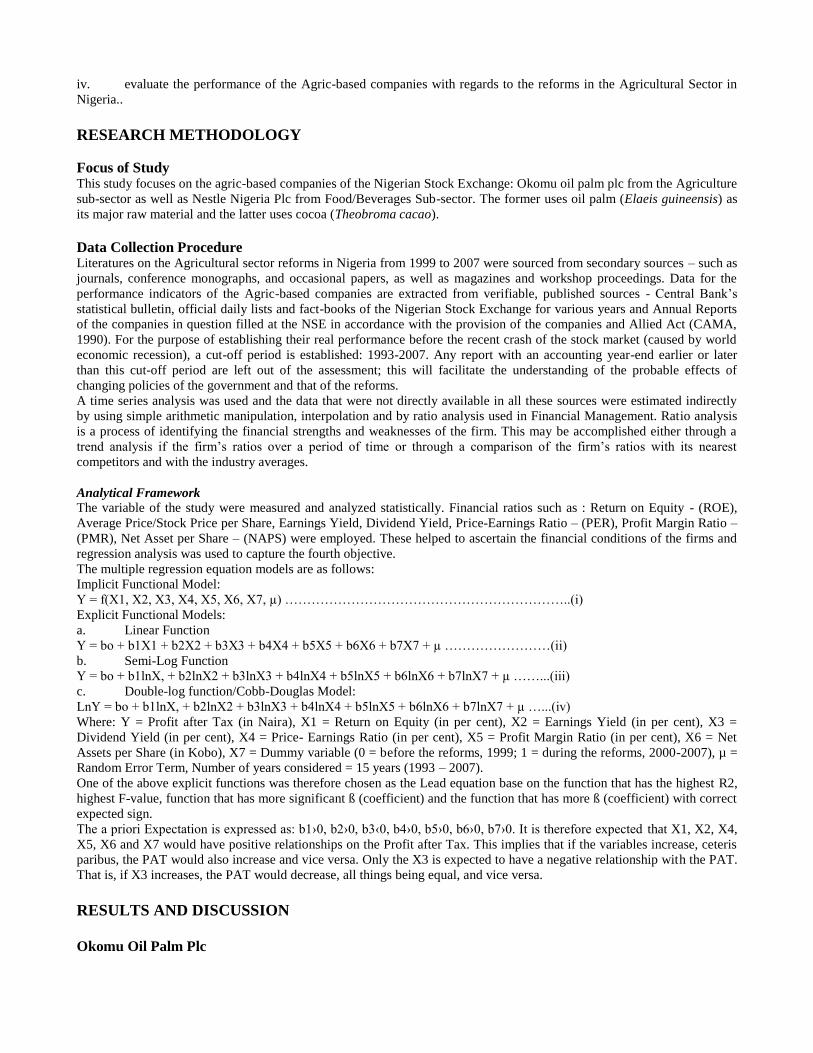
iv. evaluate the performance of the Agric-based companies with regards to the reforms in the Agricultural Sector in
Nigeria..
RESEARCH METHODOLOGY
Focus of Study This study focuses on the agric-based companies of the Nigerian Stock Exchange: Okomu oil palm plc from the Agriculture
sub-sector as well as Nestle Nigeria Plc from Food/Beverages Sub-sector. The former uses oil palm (Elaeis guineensis) as
its major raw material and the latter uses cocoa (Theobroma cacao).
Data Collection Procedure
Literatures on the Agricultural sector reforms in Nigeria from 1999 to 2007 were sourced from secondary sources – such as
journals, conference monographs, and occasional papers, as well as magazines and workshop proceedings. Data for the
performance indicators of the Agric-based companies are extracted from verifiable, published sources - Central Bank’s
statistical bulletin, official daily lists and fact-books of the Nigerian Stock Exchange for various years and Annual Reports
of the companies in question filled at the NSE in accordance with the provision of the companies and Allied Act (CAMA,
1990). For the purpose of establishing their real performance before the recent crash of the stock market (caused by world
economic recession), a cut-off period is established: 1993-2007. Any report with an accounting year-end earlier or later
than this cut-off period are left out of the assessment; this will facilitate the understanding of the probable effects of
changing policies of the government and that of the reforms.
A time series analysis was used and the data that were not directly available in all these sources were estimated indirectly
by using simple arithmetic manipulation, interpolation and by ratio analysis used in Financial Management. Ratio analysis
is a process of identifying the financial strengths and weaknesses of the firm. This may be accomplished either through a
trend analysis if the firm’s ratios over a period of time or through a comparison of the firm’s ratios with its nearest
competitors and with the industry averages.
Analytical Framework
The variable of the study were measured and analyzed statistically. Financial ratios such as : Return on Equity - (ROE),
Average Price/Stock Price per Share, Earnings Yield, Dividend Yield, Price-Earnings Ratio – (PER), Profit Margin Ratio –
(PMR), Net Asset per Share – (NAPS) were employed. These helped to ascertain the financial conditions of the firms and
regression analysis was used to capture the fourth objective.
The multiple regression equation models are as follows:
Implicit Functional Model:
Y = f(X1, X2, X3, X4, X5, X6, X7, µ) ………………………………………………………..(i)
Explicit Functional Models:
a. Linear Function
Y = bo + b1X1 + b2X2 + b3X3 + b4X4 + b5X5 + b6X6 + b7X7 + µ ……………………(ii)
b. Semi-Log Function
Y = bo + b1lnX, + b2lnX2 + b3lnX3 + b4lnX4 + b5lnX5 + b6lnX6 + b7lnX7 + µ ……...(iii)
c. Double-log function/Cobb-Douglas Model:
LnY = bo + b1lnX, + b2lnX2 + b3lnX3 + b4lnX4 + b5lnX5 + b6lnX6 + b7lnX7 + µ …...(iv)
Where: Y = Profit after Tax (in Naira), X1 = Return on Equity (in per cent), X2 = Earnings Yield (in per cent), X3 =
Dividend Yield (in per cent), X4 = Price- Earnings Ratio (in per cent), X5 = Profit Margin Ratio (in per cent), X6 = Net
Assets per Share (in Kobo), X7 = Dummy variable (0 = before the reforms, 1999; 1 = during the reforms, 2000-2007), µ =
Random Error Term, Number of years considered = 15 years (1993 – 2007).
One of the above explicit functions was therefore chosen as the Lead equation base on the function that has the highest R2,
highest F-value, function that has more significant ß (coefficient) and the function that has more ß (coefficient) with correct
expected sign.
The a priori Expectation is expressed as: b1›0, b2›0, b3‹0, b4›0, b5›0, b6›0, b7›0. It is therefore expected that X1, X2, X4,
X5, X6 and X7 would have positive relationships on the Profit after Tax. This implies that if the variables increase, ceteris
paribus, the PAT would also increase and vice versa. Only the X3 is expected to have a negative relationship with the PAT.
That is, if X3 increases, the PAT would decrease, all things being equal, and vice versa.
RESULTS AND DISCUSSION
Okomu Oil Palm Plc

The equation was significant at 1% and 5% levels. The coefficient of multiple determination (R2) of the lead equation was
0.91 which implies that 91% of the total variation in the PAT was explained by the modeled explanatory variables included
in the regression model while the remaining 9% was explained by the error term. Also, the F-value 58.603 is significant at
1% which showed that the model used was fit and appropriate for the data. The explicit form of the equation is as shown
below:
In Y = 14.196 + 0.126X1 – 0.007X2 – 1.178X3** – 1.670X4*–0.088X5 + 1.497X6* + 1.089X7*
(5.758) (0.509) (-0.263) (-2.548) (-2.591) (-0.227) (4.913) (4.435)
R2 = 90.8% Adj. R2 = 89.1% F – value = 58.603
The values in the parenthesis are standard T-values.
Out of the seven explanatory variables captured in the model, X4, X6 and X7 were significant at 1% while X3 was also
found to be significant at 5%. This implies that these four variables exerted significant effect on the profit after Tax.
Dividend Yield (X3) showed a negative relationship with the PAT, which is in conformity with the a priori expectation. It
connotes that for every 1% decrease in the DY, the PAT is decreased by 1.178%.
Price–Earnings Ratio (X4) showed a negative relationship with the PAT, which is not in conformity with the a priori
expectation. It indicates that for every 1% increase in PER, the PAT is decreased by 1.670%.
Net Asset per Share(X6) showed a positive relationship with the PAT, which is in conformity with the a priori expectation.
This also implies that for every 1% increase in NAPS, the PAT would increase by 1.497%.
Dummy variable (X7) showed a positive relationship with the PAT, which implies that Agricultural sector reforms between
2000 and 2007 with the value of 1, have significant effect at 0.007 (that is, 1%) on the PAT of Okomu Oil Palm Plc., used
as a proxy for the profitability and performance of the company.
Nestle Nig Plc The equation is significant at 1% and 10%. The coefficient of multiple determinations (R2) is 0.895 which implies that
89.5% of the total variation in the PAT was accounted for by the set of the explanatory variables captured in the model. It
could also be said that 10.5% of the total variation in the PAT was accounted for by other predictors not included in the
regression model. Also, the F-value is 181.982 and it is significant at 1%. Out of the seven predictors captured in this
study, X1, and X6 were found to be significant at 1%, while only X5 was significant at 10%. This implies that only three
variables were found significant to influence PAT. The explicit form of the equation Nestle Nig Plc is as shown below:
In Y =10.427 + 0.742X1* – 0.316X2 – 0.159X3 – 0.003X4 – 0.513X5*** + 1.071X6* + 0.099X7
(8.687) (5.395) (-0.931) (0.799) (-0.184) (1.654) (12.134) (-0.604)
R2 = 89.5% Adj. R2 = 88.9% F – value = 181.982
Return on Equity (X1) showed a positive relationship with the PAT, which is in conformity with a priori expectation. It
implies that for every 1% increase in ROE, the PAT would increase by 0.742%.
Profit Margin Ratio (X5) showed a negative relationship with PAT, which is not in conformity with the a priori
expectation. It implies that for every 1% increase in PMR, the PAT is decreased by 0.513%.
Net Asset per Share (X6) showed a positive relationship with the PAT, which is in conformity with the a priori expectation.
It implies that for every 1% increase in NAPS, the PAT would increase by 1.871%.
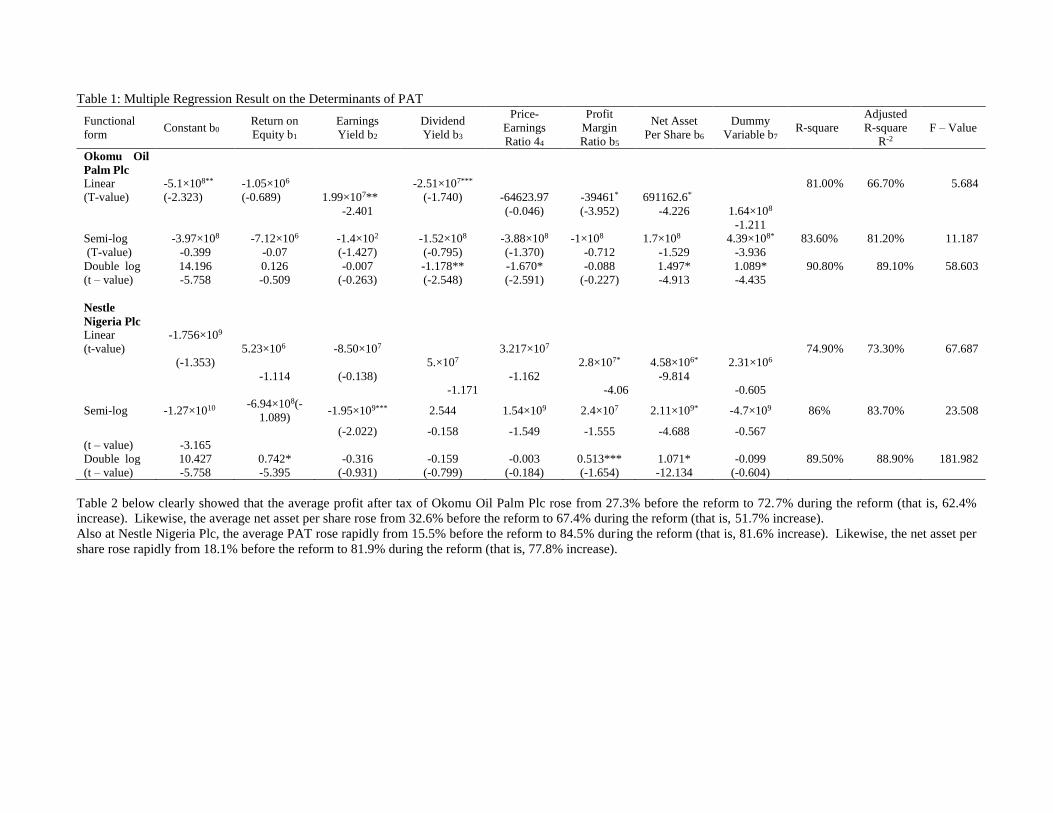
Table 1: Multiple Regression Result on the Determinants of PAT
Functional
form Constant b0
Return on
Equity b1
Earnings
Yield b2
Dividend
Yield b3
Price-
Earnings
Ratio 44
Profit
Margin
Ratio b5
Net Asset
Per Share b6
Dummy
Variable b7 R-square
Adjusted
R-square
R-2
F – Value
Okomu Oil
Palm Plc
Linear -5.1×10⁸** -1.05×10⁶
-2.51×10⁷***
81.00% 66.70% 5.684
(T-value) (-2.323) (-0.689) 1.99×10⁷** (-1.740) -64623.97 -39461* 691162.6*
-2.401 (-0.046) (-3.952) -4.226 1.64×10⁸
-1.211
Semi-log -3.97×10⁸ -7.12×10⁶ -1.4×10² -1.52×10⁸ -3.88×10⁸ -1×10⁸ 1.7×10⁸ 4.39×108* 83.60% 81.20% 11.187
(T-value) -0.399 -0.07 (-1.427) (-0.795) (-1.370) -0.712 -1.529 -3.936
Double log 14.196 0.126 -0.007 -1.178** -1.670* -0.088 1.497* 1.089* 90.80% 89.10% 58.603
(t – value) -5.758 -0.509 (-0.263) (-2.548) (-2.591) (-0.227) -4.913 -4.435
Nestle
Nigeria Plc
Linear -1.756×10⁹
(t-value)
5.23×10⁶ -8.50×10⁷
3.217×10⁷
74.90% 73.30% 67.687
(-1.353)
5.×107
2.8×107* 4.58×106* 2.31×106
-1.114 (-0.138)
-1.162
-9.814
-1.171 -4.06 -0.605
Semi-log -1.27×10¹⁰ -6.94×10⁸(-
1.089) -1.95×10⁹*** 2.544 1.54×10⁹ 2.4×10⁷ 2.11×10⁹* -4.7×10⁹ 86% 83.70% 23.508
(-2.022) -0.158 -1.549 -1.555 -4.688 -0.567
(t – value) -3.165
Double log 10.427 0.742* -0.316 -0.159 -0.003 0.513*** 1.071* -0.099 89.50% 88.90% 181.982
(t – value) -5.758 -5.395 (-0.931) (-0.799) (-0.184) (-1.654) -12.134 (-0.604)
Table 2 below clearly showed that the average profit after tax of Okomu Oil Palm Plc rose from 27.3% before the reform to 72.7% during the reform (that is, 62.4%
increase). Likewise, the average net asset per share rose from 32.6% before the reform to 67.4% during the reform (that is, 51.7% increase).
Also at Nestle Nigeria Plc, the average PAT rose rapidly from 15.5% before the reform to 84.5% during the reform (that is, 81.6% increase). Likewise, the net asset per
share rose rapidly from 18.1% before the reform to 81.9% during the reform (that is, 77.8% increase).

Table 2: Average PAT and Average NAPS of the Companies.
Companies
Average Profit After Tax
Average Net Asset Per Share
Before the Reform During the
Reform Before During
Okomu Oil
Palm Plc N134,433,341.4 N357,389,875
472.24 kobo 977.68 kobo
Nestle Nigeria
Plc N720, 928,000 N3,919,457,625 164.14 kobo 740.50 kobo
Values were calculated from interpolated data
CONCLUSION AND POLICY RECOMMENDATION
This study is motivated primarily by the need to enhance the performance of two named Agric-based companies on the
Nigerian Stock Exchange through the Agricultural sector reforms. In this regard, this exercise has demonstrated that there is
a positive relationship between the two. These reforms have been observed to be capable of stimulating the market and
operational performance of Okomu Oil Palm Plc and Nestle Nigeria Plc. Based on some financial indicators; it was shown
that these companies had made considerable progress over time, as their models were also significant at one per cent, each.
Although, the reform process appeared not to have much significant influence on Nestle Nigeria Plc as much as it does on
Okomu Oil Palm Plc. The positive effect of the reform on Nestle Nigeria Plc was only shown by its profit after tax on net
asset per share computed and the return on equity.
In absolute terms, the reforms in the Agricultural sector have had significant effects on the performance of the two quoted
Agric-based companies on the Nigeria Stock Exchange. The effects have been shown through the increasing trend in the
profit after tax of the companies as a true measure of their performance. Agricultural sector at large that has a growth rate of
2.8 per cent in the 1990s has now been growing at 7 per cent since 2003 (Soludo, 2006). The message is that the Nigeria
economy is changing its fundamental ways and the rest of the world is taking notice. From a perception of Nigeria as a
hopeless case for investment, the growing view now is that Nigeria is a preferred investment destination.
It is against this background that this question should be asked: will the Obasanjo-initiated reforms be sustained? The
answer to this question would determine the rate of investment in the Agricultural sector by Nigerians at home, in the
Diaspora and by Foreign Direct Investment (FDI); as agriculture, in the near future, holds the key to growth, employment
and poverty reduction. The outcomes of the reforms have been impressive. Evidently, the first thing to do is to keep doing
the right things we are doing now, continue with the reforms under the NEEDS framework. Build upon the current
momentum of reforms, sustain them and even take them to the next higher levels. In the next few years, the name of the
game will continue to be REFORMS, REFORMS!
Policy Recommendations The Federal Government should vigorously pursue the ongoing reform efforts in the Agricultural sector and ensure that
they are completed – and not abandoned – a task to which this government is fully committed; through appropriate funding
of the reform process. It is also important to make critical evaluation of the successes and failures as well as entrench
learning in the process while making necessary adjustments.
There is equally the need to formulate deliberate policies to make the Nigerian Stock Market more attractive to investors
through tax incentives, improved settlement procedure, and considerable reduction in transaction costs. The quoted
companies should be encouraged to raise funds for their firm’s expansion from the Nigerian Capital Market.
The Government should intensify growth in the Agricultural sector of the economy which will consequently strengthen
people’s confidence in the Stock Market investments.
A basic limitation of this study is the unavailability of some relevant data on performance indicators such as Market value
of share, number of ordinary share, number of deals recorded during the year etc. for the companies under considerations.
Also, the limitation of inability to map out, possibly on one-to-one basis, the relationship between economic reforms in the
Agricultural sector in Nigeria and Stock market indicator since most of these variables are inter-related. However, the
limitations had been attempted to be resolved by considering the average profit after tax and net asset per share before and
during the reform; 1993 – 1999 and 2000 – 2007 respectively.
REFERENCES
Akande, S. O and A. S. Olomola (2007). Consolidating and Sustaining the Gains of Reforms in Nigeria. Workshop
Proceedings, 43-57 pp. Nigeria Institute of Social Economic Research (NISER), Ibadan.
Ambe, J. (1998). An Analysis of the Performance of Selected Agricultural Sub-Sector in the Nigeria Stock Exchange.
(Unpublished B. Agric Thesis) Department of Agricultural Economics and Farm Management, University of
Agriculture, Abeokuta, Nigeria.
Augustine N. G. (2007). The Nigerian economy and current economic reforms. Is this a book? If yes please state the name
and publisher 323pp.
Ayodele, A. (2000). The State in the Nigerian Agricultural Development. NISER Review of Nigerian Development, 192-
213 pp. NISER, Ibadan.
Bello, D. (2007). Consolidating and Sustaining the Gains of Reforms in Nigeria. Workshop Proceedings, 43-57pp. NISER,
Ibadan.
Chukwuma, C. Soludo (2006). ‘‘Can Nigeria be the China of Africa?’’ Lecture Proceeding at the Founders’ Day,
University of Benin, Benin City, Nigeria. 17-33 pp.
Chukwuma, C. Soludo (2006). ‘‘Law, Institution and Nigeria’s Quest to join the First World Economy’’ Lecture
Proceeding at O. A. U. Ile-Ife, Nigeria. 4-15 pp.
Essien, A. E. (2005). Agricultural Sector under the National Economic Empowerment and Development Strategy
(NEEDS). Central Bank of Nigeria Statistical Bulletin, Vol.29. No. 4
Esosa, B. O. (2007). Capital Markets (African and Global). The Book house Company. 333-401pp.
Haggblade, S. (2005). From Roller Coaster to Rocket ships: the Role of Technology in African Agricultural Successes. The
African Food Crisis Lessons from the Asian Green Revolution.
Ikhide, S. I. (1997). ‘‘Financial Sector Reforms and Growth of Capital Market in Nigeria’’ Institute of Developing
Economies. V. R. F. Series, No. 291 February, Tokyo, Japan.
Jacques, D. (2007). Millennium Agricultural Revolution. Lecture Proceedings at the International Association of Research
Scholars and Fellows, IITA, Ibadan.
John, I. (2011). Obasanjo, Nigeria and the World. James Currey Publishers, Woodbridge, Suffolk, UK. 213Pp.
NEEDS (2004). National Economic Empwerment and Development Strategy. Published by the National Planning
Commission.
Nestle Nigeria Plc, Annual Reports (Various issues) The years should be indicated
Okomu Oil Palm Plc, Annual Reports (Various issues) The years should be indicated
Omole, D. A. 1999. Financial Deepening and Stock Market Development in Nigeria. NISER Monogragh Series No. 15.
NISER, Ibadan.
Pandey, I. M. (2005). Financial Management. Indian Institute of Management Ahmedabad. Pp 531-533.
Olawuyi, S. A and I. O. Famojuro (1998). Essential of Research Methodology. Published by Grapheal Printing and
Publishing Company.
The Stock Market Guide, (2008). Published by Datatrust Stock Trading Guide.Vol. 4 No.7.
The Nigerian Stock Market Annuals, NSMA.2005 & 2008 Edition
The Nigerian Stock Exchange, Annual report and Acounts (1993-2007). Published by the Authority of the Council of the
Exchange.
The Nigerian Stock Exchange, Daily Official List (January 1993 - December 2007). Published by the Authority of the
Council of the Exchange.
The Nigerian Stock Exchange, Factbooks (1993-2007). Published by the Authority of the Council of the Exchange.
Yazdani, S. (2008). Financial market development and Agricultural Economic Growth in Iran, American-Eurosian Journal
of Sustainable Agriculture, 2 (3), 338-343pp.

Haematological and Biochemical Parameters of Broiler Chicken Supplemented with Humic Acid
in the Drinking Water
Lala, A.O.1*; Okwelum, N.1; Irekhore, O.T.2; Ogunlade, B.A.3; Adigun, A.A.3; Elegbede, L.A.3 and
Oyedeji, M.M.3
1Institute of Food Security, Environmental Resources and Agriculture Research, Federal University of Agriculture,
Abeokuta Ogun State, Nigeria. 2Agricultural Media Resources and Extension Centre, Federal University of Agriculture, Abeokuta Ogun State, Nigeria. 3Department of Animal Nutrition, College of Animal Science and Livestock Production, Federal University of Agriculture,
Abeokuta Ogun State, Nigeria.
*Corresponding author: [email protected]
ABSTRACT
This study was conducted to evaluate the effects of supplementing humic acid in the drinking water on some haematological
and biochemical parameters of broiler chickens. One hundred and twenty (120), day-old Arbor Acre broiler chicks were
randomly divided into three treatments in a completely randomized design. Each treatment of forty birds was replicated 4
times with 10 chicks per replicate and the experiment lasted for 56 days. Treatment I served as the control without humic
acid in the drinking water while, treatment II was supplemented with 1 mL/L humic acid and treatment III was
supplemented with 2 mL/L of humic acid. Results obtained showed that supplementation with humic acids had no
significant effect (P > 0.05) on haematological indices of the broiler chickens. Significant (P<0.05) reduction in serum
level of uric acid was achieved as the level of supplementation of humic acid increased while, serum phosphorus and
calcium concentrations were significantly (P<0.05) increased with humic acid. Liver function enzymes were not
significantly (P>0.05) affected because the activity of serum alanine transaminase and aspartate transaminase were
similar among all treatments. The results indicated that humic acid supplementation had a beneficial effect on mineral
absorption and detoxification as revealed through uric acid concentration of broiler chickens.
Keywords: blood biochemistry; blood minerals; drinking water; haematology; humic acid
INTRODUCTION
Antibiotics had been used widely world-wide in poultry industry in order to prevent poultry disease and improve
production. However, with the unavoidable spread of bacterial resistance and cross resistance the use of antibiotics has been
considered hazardous (Andremont, 2000). Several additives have been tested as growth promoters to avoid the excessive
use of antibiotics or at least reduce or substitute their inclusion in feeds, while maintaining an efficient animal production to
obtain safe edible products (Islam et al., 2005; Gomez et al., 2012). Among these additives are humic substances which
have been tested in domestic animals in several studies around the world with promising results. The humic substances are
very common in nature as they originate from the decomposition of organic matter, and are normally present in the drinking
water and soil (Islam et al., 2005).
Humic acids are naturally occurring decomposed organic constituents of soil and lignite that are complex mixtures of
polyaromatic and heterocyclic chemicals with multiple carboxylic acid side chains (MacCarthy, 2001).
Farmers utilize humic substances to accelerate seed germination and improve rhizome growth. These materials stimulate
oxygen transport, accelerate respiration, and promote the efficient utilization of nutrients by the plant (Visser, 1987). These
observations have prompted scientists to assess the specific properties of humates and their possible benefits in the
improvement of health and wellbeing in animals (Wang et al., 2008). The use of humic acid to replace antibiotics in poultry
has gained widespread interest (Mutus et al., 2006). Beneficial effects of humic acid are described concerning stress
management (Enviromate, 2002) immune system (Hooge, 2004; Loddi et al., 2002), anti-inflammatory activity (Yang,
1996), antiviral properties (Huck et al., 1991). It has been observed that humic acid included in the feed and water of
poultry promote growth (Kocabagli et al., 2002; Mirnawati and Marlida, 2013). It has also been proposed that humic acid
plays an effective role on some blood parameters (Banaszkiewicz and Drobnik, 1994; Rath et al., 2006) and have been used
to minimize health problems and potential losses (Yoruk et al., 2004; Kucukersan et al., 2005; Trckova et al., 2006).
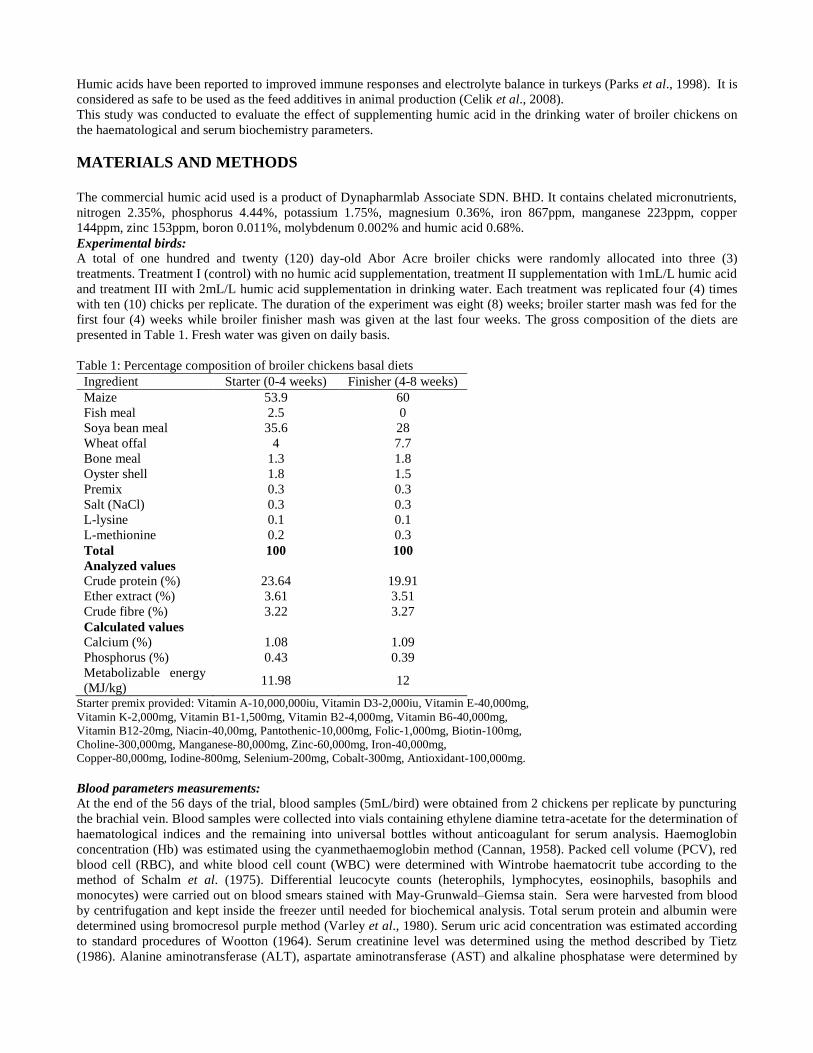
Humic acids have been reported to improved immune responses and electrolyte balance in turkeys (Parks et al., 1998). It is
considered as safe to be used as the feed additives in animal production (Celik et al., 2008).
This study was conducted to evaluate the effect of supplementing humic acid in the drinking water of broiler chickens on
the haematological and serum biochemistry parameters.
MATERIALS AND METHODS
The commercial humic acid used is a product of Dynapharmlab Associate SDN. BHD. It contains chelated micronutrients,
nitrogen 2.35%, phosphorus 4.44%, potassium 1.75%, magnesium 0.36%, iron 867ppm, manganese 223ppm, copper
144ppm, zinc 153ppm, boron 0.011%, molybdenum 0.002% and humic acid 0.68%.
Experimental birds: A total of one hundred and twenty (120) day-old Abor Acre broiler chicks were randomly allocated into three (3)
treatments. Treatment I (control) with no humic acid supplementation, treatment II supplementation with 1mL/L humic acid
and treatment III with 2mL/L humic acid supplementation in drinking water. Each treatment was replicated four (4) times
with ten (10) chicks per replicate. The duration of the experiment was eight (8) weeks; broiler starter mash was fed for the
first four (4) weeks while broiler finisher mash was given at the last four weeks. The gross composition of the diets are
presented in Table 1. Fresh water was given on daily basis.
Table 1: Percentage composition of broiler chickens basal diets
Ingredient Starter (0-4 weeks) Finisher (4-8 weeks)
Maize 53.9 60
Fish meal 2.5 0
Soya bean meal 35.6 28
Wheat offal 4 7.7
Bone meal 1.3 1.8
Oyster shell 1.8 1.5
Premix 0.3 0.3
Salt (NaCl) 0.3 0.3
L-lysine 0.1 0.1
L-methionine 0.2 0.3
Total 100 100
Analyzed values
Crude protein (%) 23.64 19.91
Ether extract (%) 3.61 3.51
Crude fibre (%) 3.22 3.27
Calculated values
Calcium (%) 1.08 1.09
Phosphorus (%) 0.43 0.39
Metabolizable energy
(MJ/kg) 11.98 12
Starter premix provided: Vitamin A-10,000,000iu, Vitamin D3-2,000iu, Vitamin E-40,000mg,
Vitamin K-2,000mg, Vitamin B1-1,500mg, Vitamin B2-4,000mg, Vitamin B6-40,000mg,
Vitamin B12-20mg, Niacin-40,00mg, Pantothenic-10,000mg, Folic-1,000mg, Biotin-100mg,
Choline-300,000mg, Manganese-80,000mg, Zinc-60,000mg, Iron-40,000mg,
Copper-80,000mg, Iodine-800mg, Selenium-200mg, Cobalt-300mg, Antioxidant-100,000mg.
Blood parameters measurements: At the end of the 56 days of the trial, blood samples (5mL/bird) were obtained from 2 chickens per replicate by puncturing
the brachial vein. Blood samples were collected into vials containing ethylene diamine tetra-acetate for the determination of
haematological indices and the remaining into universal bottles without anticoagulant for serum analysis. Haemoglobin
concentration (Hb) was estimated using the cyanmethaemoglobin method (Cannan, 1958). Packed cell volume (PCV), red
blood cell (RBC), and white blood cell count (WBC) were determined with Wintrobe haematocrit tube according to the
method of Schalm et al. (1975). Differential leucocyte counts (heterophils, lymphocytes, eosinophils, basophils and
monocytes) were carried out on blood smears stained with May-Grunwald–Giemsa stain. Sera were harvested from blood
by centrifugation and kept inside the freezer until needed for biochemical analysis. Total serum protein and albumin were
determined using bromocresol purple method (Varley et al., 1980). Serum uric acid concentration was estimated according
to standard procedures of Wootton (1964). Serum creatinine level was determined using the method described by Tietz
(1986). Alanine aminotransferase (ALT), aspartate aminotransferase (AST) and alkaline phosphatase were determined by
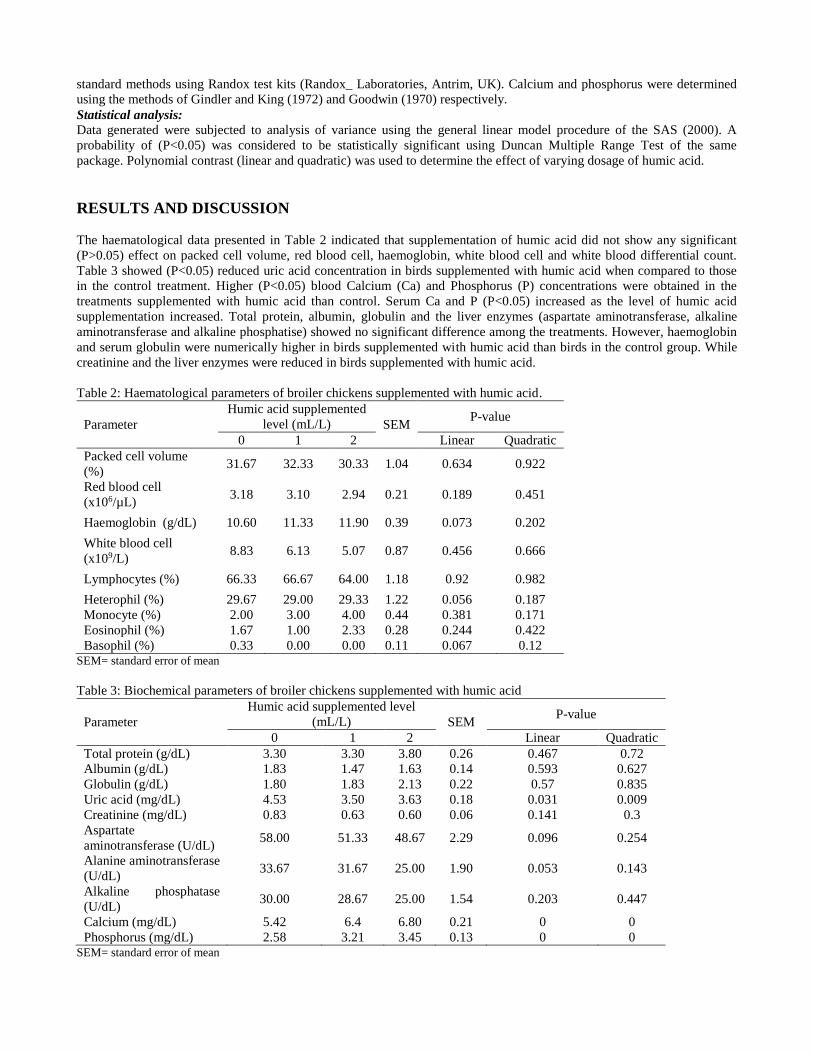
standard methods using Randox test kits (Randox_ Laboratories, Antrim, UK). Calcium and phosphorus were determined
using the methods of Gindler and King (1972) and Goodwin (1970) respectively.
Statistical analysis: Data generated were subjected to analysis of variance using the general linear model procedure of the SAS (2000). A
probability of (P<0.05) was considered to be statistically significant using Duncan Multiple Range Test of the same
package. Polynomial contrast (linear and quadratic) was used to determine the effect of varying dosage of humic acid.
RESULTS AND DISCUSSION
The haematological data presented in Table 2 indicated that supplementation of humic acid did not show any significant
(P>0.05) effect on packed cell volume, red blood cell, haemoglobin, white blood cell and white blood differential count.
Table 3 showed (P<0.05) reduced uric acid concentration in birds supplemented with humic acid when compared to those
in the control treatment. Higher (P<0.05) blood Calcium (Ca) and Phosphorus (P) concentrations were obtained in the
treatments supplemented with humic acid than control. Serum Ca and P (P<0.05) increased as the level of humic acid
supplementation increased. Total protein, albumin, globulin and the liver enzymes (aspartate aminotransferase, alkaline
aminotransferase and alkaline phosphatise) showed no significant difference among the treatments. However, haemoglobin
and serum globulin were numerically higher in birds supplemented with humic acid than birds in the control group. While
creatinine and the liver enzymes were reduced in birds supplemented with humic acid.
Table 2: Haematological parameters of broiler chickens supplemented with humic acid.
Parameter
Humic acid supplemented
level (mL/L) SEM P-value
0 1 2 Linear Quadratic
Packed cell volume
(%) 31.67 32.33 30.33 1.04 0.634 0.922
Red blood cell
(x106/µL) 3.18 3.10 2.94 0.21 0.189 0.451
Haemoglobin (g/dL) 10.60 11.33 11.90 0.39 0.073 0.202
White blood cell
(x109/L) 8.83 6.13 5.07 0.87 0.456 0.666
Lymphocytes (%) 66.33 66.67 64.00 1.18 0.92 0.982
Heterophil (%) 29.67 29.00 29.33 1.22 0.056 0.187
Monocyte (%) 2.00 3.00 4.00 0.44 0.381 0.171
Eosinophil (%) 1.67 1.00 2.33 0.28 0.244 0.422
Basophil (%) 0.33 0.00 0.00 0.11 0.067 0.12 SEM= standard error of mean
Table 3: Biochemical parameters of broiler chickens supplemented with humic acid
Parameter
Humic acid supplemented level
(mL/L) SEM P-value
0 1 2 Linear Quadratic
Total protein (g/dL) 3.30 3.30 3.80 0.26 0.467 0.72
Albumin (g/dL) 1.83 1.47 1.63 0.14 0.593 0.627
Globulin (g/dL) 1.80 1.83 2.13 0.22 0.57 0.835
Uric acid (mg/dL) 4.53 3.50 3.63 0.18 0.031 0.009
Creatinine (mg/dL) 0.83 0.63 0.60 0.06 0.141 0.3
Aspartate
aminotransferase (U/dL) 58.00 51.33 48.67 2.29 0.096 0.254
Alanine aminotransferase
(U/dL) 33.67 31.67 25.00 1.90 0.053 0.143
Alkaline phosphatase
(U/dL) 30.00 28.67 25.00 1.54 0.203 0.447
Calcium (mg/dL) 5.42 6.4 6.80 0.21 0 0
Phosphorus (mg/dL) 2.58 3.21 3.45 0.13 0 0 SEM= standard error of mean

Similar haematological values obtained from broiler chickens supplemented with humic acid with those in the control
group is indicative of tolerance of the humic acid used and the quantity supplemented in the drinking water to the chickens.
According to Rath et al. (2006) RBC, WBC and PCV values in broilers were not affected by humic acid supplementation.
Similarly, Cetin et al. (2006) reported that supplementation of humic acid to laying hens had no effects on WBC and PCV,
but affected, RBC and Hb. However, Banaszkiewicz and Drobnik (1994) reported that Hb, PCV and RBC were observed to
increase in rats treated with humic acid. The inconsistency of results obtained in the various studies might be attributed to
the composition and quantity of the humic acid used.
The increase of Ca and P levels in blood serum produced by humic acid may be attributed to the lowering of
gastrointestinal tract pH by using this acid, which increases the absorption of the minerals from the gut into the blood
stream. Improvement in the utilization of calcium and phosphorus by organic acids supplementation was revealed by
Boling et al. (2001). Also, Abdo and Zeinb (2004) observed an increase in blood calcium of broiler chicks fed on dietary
acidifier. Furthermore, (Kishi et al., 1999) reported that dietary acetic acid prevented osteoporosis, through the reduction in
bone turnover, as it enhanced intestinal Ca absorption by improving Ca solubility in ovariectomized rats.
After humate feeding, increased levels of some essential minerals (such as Ca, Al and Fe) in serum, liver and muscles were
recorded by Stepchenko et al. (1991). Whereas, Klocking (1994) reported a reduction in the serum concentrations of Ca and
P at 2.5 % level of humic acid, which may be due to its metal chelating effects caused by large number of carboxylic acid
side chains.
Reduced uric acid concentrations with humic acid could be as a result of better utilization of protein and amino acid
digestibility. As uric acid is the major end product of protein metabolism. The present results coincide with the findings of
Abdo and Zeinb (2004) who obtained lower uric acid in broiler chicks due to citric acid and acetic acid inclusion. Sturkie
(1986) also revealed that dietary addition of organic acid slightly reduced serum concentration of uric acid.
Supplementation of humic acid showed no deleterious effects on liver functions enzymes as the values were similar
(P>0.05) among the treatments. The result of aspartate aminotransferase, alanine aminotransferase and alkaline phosphatase
means that broiler chickens could tolerate the addition of up to 2 mL/L of the humic acid without any deleterious effects on
liver functions. Abdel-Azeem et al. (2000) showed that level of aspartate aminotransferase was reduced, although alanine
aminotransferase was not significantly affected when citric acid was supplemented in the diets of rabbits.
CONCLUSION
The result showed that broiler chickens could tolerate the addition of humic acids in the drinking water up to 2 mL/L
without any deleterious effect on the health status.
REFERENCES
Abdel - Azeem, F., El-Hommosany, Y.M. and Ali, G.M. (2000). Effect of citric acid in diets with different starch and fiber
levels on productive performance and some physiological traits of growing rabbits. Egypt Journal of Rabbit Science
10: 121-145.
Abdo, M. and Zeinb, A. (2004). Efficacy of acetic acid in improving the utilization of low protein-low energy broiler diets.
Egypt Poultry Science 24: 123-141.
Andremont, A. (2000). Consequences antibiotic therapy to the intestinal ecosystem. Annales Françaises d’Anes- thésie et
de Réanimation, 19: 395-402.
Banaszkiewick, W. and Drobnik, M. (1994). The influence of natural peat and isolated humic acid solution on certain
indices of metabolism and of acid-base equilibrium in experimental animals. Rocz Panstw Zakl Hig. 45: 353-60.
Boling, S.D., Frankenbach, J.L., Snow, C.M., Parsons, C.M. and Baker, D.H. (2001). The effect of citric acid on the
calcium and phosphorus requirements of chicks fed Corn -soybean meal diets. Poultry Science 80: 783-788.
Cannan, R.K. (1958). Book of Clinical Practical Chemistry, Vol I, fifth ed. Publisher and Distributors, New Delhi, India.
479–480pp.
Celik Kemal, Ahmet Uzatici and Adil Erdem Akin. (2008). Effects of dietary humic acid and Saccharomyces cerevisiae on
performance and biochemical parameters of broiler chickens. Asian Journal of Animal and Veterinary Advances 3
(5): 344-350
Cetin, M., Cetin, B. and Guclu, B.K. (2006). Effect of humate and organic acids supplementation to ration on some
haematological parameters in laying hens. Ankara Üniversity Veterinary Fak.Derg. 53: 165-168
Enviromate, T.M. (2002). Effects of humic acid on ani-mals and humans (literature review and current research). Effects of
humic acid. Environmate Inc., Forth Worth.
Gindler, E.M. and King, J. D. (1972). Rapid colorimetric determination of calcium in biological fluids with methyl thymol
blue. American Journal of Clinical Pathology 58: 376 – 382.

Gomez, S., Angeles, M. L., Mojica, M. C. and Jalukar, S. (2012). Combination of an enzymatically hydrolyzed yeast and
yeast culture with a direct-fed microbial in the feeds of broiler chickens. Asian Australian Journal of Animal
Science 25:665-673
Goodwin, J. E. (1970). Quantification of serum inorganic phosphorus, phosphates and urinary phosphate without
preliminary treatment. Clinical Chemistry 16: 776 – 780.
Hooge, D.M. (2004). Meta-analysis of broiler chicken pen trials evaluating dietary mannan oligosaccharide. International
Journal of Poultry Science. 3: 163-174.
Huck, T.A., Porter, N. and Bushell, M.E. (1991). Effect of humatees on microbial activity. Journal of General
Microbiology. 137: 2321-2329.
Islam, K.M., Schuhmacher, S.A. and Gropp, M.J. (2005). Humic acid substances in animal agriculture. Pakistan Journal of
Nutrition 4: 126–134.
Kishi, M., Fukaya, M., Tsukamoto, Y., Nagasawa, T., Kakehana, K. and Nishizawa, N. 1999. Enhancing effect of dietary
vinegar on the intestinal absorption of calcium in overiectomized rats. Bioscience Biotechnology Biochemistry 63:
905-910.
Klocking, R. (1994). Humic substances as potential therapeutics. In Humic Substances in Global Environment:
Implications for Human Health. T. Senesi and T. M. Miano, ed., Elsevier, Amsterdam, The Netherlands.
Kucukersan, S., Kucukersan, K., Colpan, I., Goncuoglu, E., Reisli, Z. and Yesilbag, D. (2005). The effects of humic acid on
egg production and egg traits of laying hen. Veterinary Medicine 50:406–410.
Loddi, M.M., Nakaghi, L.S.O., Edens, F., Tucci, F.M., Hannas, M.I., Moraes, V.M.B. and Ariki, J. (2002).
Mannoligosaccharide and organic acids on intestinal morphology integrity of broilers evaluated by scanning elec-
tron microscopy. Proceedings of the 11th European Poultry Science Conference, Bremen, 6-10 September 2002,
pp121.
MacCarthy P. (2001). The principles of humic substances. Soil Science 166:738–751.
Mirnawati, Y.R., Marlida, Y. (2013). Effects of humic acid addition via drinking water on the performance of broilers fed
diets containing fermented and non-fermented palm kernel cake. Archiva Zootech. 16: 41-53.
Mutus, R., Kocabagli, N., Alp, M., Acar, N., Eren, M. and Gezen, S.S. (2006). The effect of dietary probiotic
supplementation on tibial bone characteristics and strength in broilers. Poultry Science 85 (9): 1621-1625.
Parks C.W. (1998). The use of Menefee HumateTM in typical and low-crude protein diets for turkey toms and in the
bioremediation of petroleum-contaminated soil amended with poultry litter as a co-substrate and nutrient source.
Master’s Thesis. North Carolina State University, Raleigh, NC.
Rath, N.C., Huff, W.E. and Huff, G.R. (2006). Effect of humic acid on broiler chickens. Poultry Science, 85: 410- 414.
SAS, (2000). SAS Users Guide Version 9.1, rev. ed. SAS Inst. Inc., Cary, NC.
Schalm, O.W., Jain, N.C. and Qureshi, M.Q. (1975). Veterinary Hematology, third ed. Lea and Fibinger, Philadelphia.
Stepchenko, L.M., Zhorina, L.V. and Kravtsova, L.V. (1991). The effect of sodium humate on metabolism and resistance in
highly productive poultry (in Russain). Nauchnye Doklady Vysshei Shkoly. Biologicheskie Nauki, 10: 90–95.
Sturkie, P.D. (1986). “Avian Physiology”. 4th Edn. Springer-Verlag, Inc., New Work, NY
Tietz, N.W., (1986). Textbook of clinical chemistry. Philadelphia, WB Saunders Co.
Trckova, M., Matlova, L., Hudcova, H., Faldyna, M., Zraly, Z., Dvorska, L., Beran, V. and Pavlik, I. (2005). Peat as a feed
supplement for animals: A review. Veterinary Medicine 50:361– 377.
Varley, H. Gowelock, A. H. and Bells, M. (1980). Determination of serum urea using the acetyl monoxide method,
Practical biochemistry, 5th edn. William Heinemann Medical Books, London
Visser, S.A. (1987). Effect of humic substances on higher animals and man, the possible use of humic compounds in
medical treatments. International Humic Acid Society Meeting, Sevilla, Spain, pp 27.
Wang, Q., Chen, Y. J., Yoo, J. S., Kim, H. J., Cho, J. H. and Kim, I. H. (2008). Effects of supplemental humic substances
on growth performance, blood characteristics and meat quality in finishing pigs. Livestock Science 117:270-274.
Wootton, T. D. (1964). Micro analysis in Medical Biochemistry, 4th edn. Churchill, London, 409 pp.
Yang, H.L., Chiu, H.C. and Lu, F. 1996. Effects of humic acid on the viability and coagulant properties of human umbilical
vein endothelial cells. American Journal of Hematology. 51: 200-206.
Yoruk, M. A., Gul, M., Hayirli, A. and Macit, M. (2004). The effetcs of supplementation of humate and probiotic on egg
production and quality parameters during the late laying period in hens. Poultry Science 83:84-88.

Chemical and Sensory Qualities of Stored Gari Fortified with Soybean and Groundnut Flour
Ajani, A.O.1; Alade, O.A.1; Olagbaju, A.R.1; Fasoyiro, S.B.2; Arowora, K.A.3 and Oyelakin, M.O.1
1Nigerian Stored Products Research Institute, Onireke, Ibadan, Oyo State, Nigeria. 2Institute of Agricultural Research and Training, Moor Plantation, Ibadan, Oyo State,Nigeria. 3Department of Biochemistry, Federal University of Technology, Wukari, Taraba State,Nigeria.
*Corresponding author: [email protected]
ABSTRACT
Gari, a creamy white granular food product from cassava roots is a major staple consumed in both urban and rural areas
due to its convenience. Gari was fortified with soybeans or groundnut at 10%, 20% and 30% respectively to produce “soy-
gari” and groundnut-gari. The samples were analyzed at the initial stage of production and after eight months of storage.
The proximate composition showed that moisture content, protein, fat, ash, crude fibre and carbohydrate were in range of
7.97 – 8.93%, 1.17 – 1.57%, 1.33 – 1.47%, 1.67 – 1.73%, 1.67 – 1.63% and 86.20% - 84.83 respectively at the initial
production while results at eight months of storage ranged between 8.93 – 9.23%, 1.40 – 3.80%, 1.57– 3.73%, 1.20 –
2.50%, 2.80 – 1.90% and 79.50 – 84.10% respectively for soy-gari. Groundnut fortification increased the protein content
from 1.17% to a range of 1.77% - 4.47%, the fat increased from 1.33% to 1.37% - 4.17%; while the carbohydrate content
reduced from 86.20% to 84.33% - 78.45%. Sensory evaluation of flour and gari meal (Eba) was conducted. The result
showed that gari fortified with 30% soybeans and groundnut preferred most in term of appearance, aroma, texture and
mouth feel. The sensory evaluation for the soy and groundnut gari meal (Eba) showed that control samples were the most
acceptable followed by the 10% of each legume. However, the increase in protein and other essential nutrients indicate that
fortified gari have better nutritional qualities than control gari, therefore if globally accepted, it can prevent protein energy
malnutrition.
Keywords: fortification; groundnut-gari; sensory qualities; soy-gari; storage
INTRODUCTION
Cassava (Manihot esculenta crantz) is an important vegetable crop that is grown throughout the tropics and sub-tropics,
where it contributes a considerable proportion of the total caloric intake and ranks fourth after rice, wheat and corn on food
energy production basis as a source of complex carbohydrates (Beleia et al.,2006). Cassava occupies a prominent position
in foreign exchange earning following the Presidential Cassava Initiative of the federal government of Nigeria (FGN,
2006).
Gari (fried, fermented cassava flour) is the most popular cassava products consumed in West Africa and the most important
component in the diet of millions of Nigerians providing about 11.835 kJ/person/day (Osho, 2003). However, cassava and
its products are low in protein, deficient in essential amino acids and therefore have poor quantitative and qualitative
protein content (Obatolu and Osho, 1992). Due to high cost of animal protein and ignorance about the importance of protein
in diets, there is need to search for cheaper but good quality protein sources that are readily available for the fortification of
“gari” and as this will increase the amount of protein in the diet of the consuming population (Oluwamukomi, 2008).
Soybean is an excellent source of dietary protein for human food providing complete human requirement of almost all the
amino acids (Liu, 1997). It is also an excellent source of minerals and vitamins (Aworh et al., 1987; Igyor et al., 2006).
Recently, many functions of soybeans have been in the spotlight, for example, reducing the risk of heart disease, cancer and
so on (Messina et al., 1994). Soybean is the concentrated source of vegetable protein with about 40% protein and 20% oil.
Groundnut (Arachis hypogaea L.) is the 6th most important oil seed crop in the world. It contains 48-50% oil, 26-28%
protein and 11-27 % carbohydrate, minerals and vitamin (Mukhtar, 2009). Groundnut is grown on 26.4 million hectare
worldwide, with a total production of 37.1 million metric tons and an average productivity of 1.4 metric tons /ha.
Developing countries constitute 97% of the global area and 94% of the global production of this crop (FAO, 2011).
In tropical and sub-tropical areas of the world, feeding of the fast growing population has continued to pose a serious
problem. These areas are also characterized by a shortage of animal protein and incidences of protein energy malnutrition
are higher because they are rich in starchy tubers, such as yam, cocoyam and cassava (Hernandez et al., 1996). Hence,
continuous dependence on gari without fortification with protein-rich sources would result in protein deficiency. Soybean
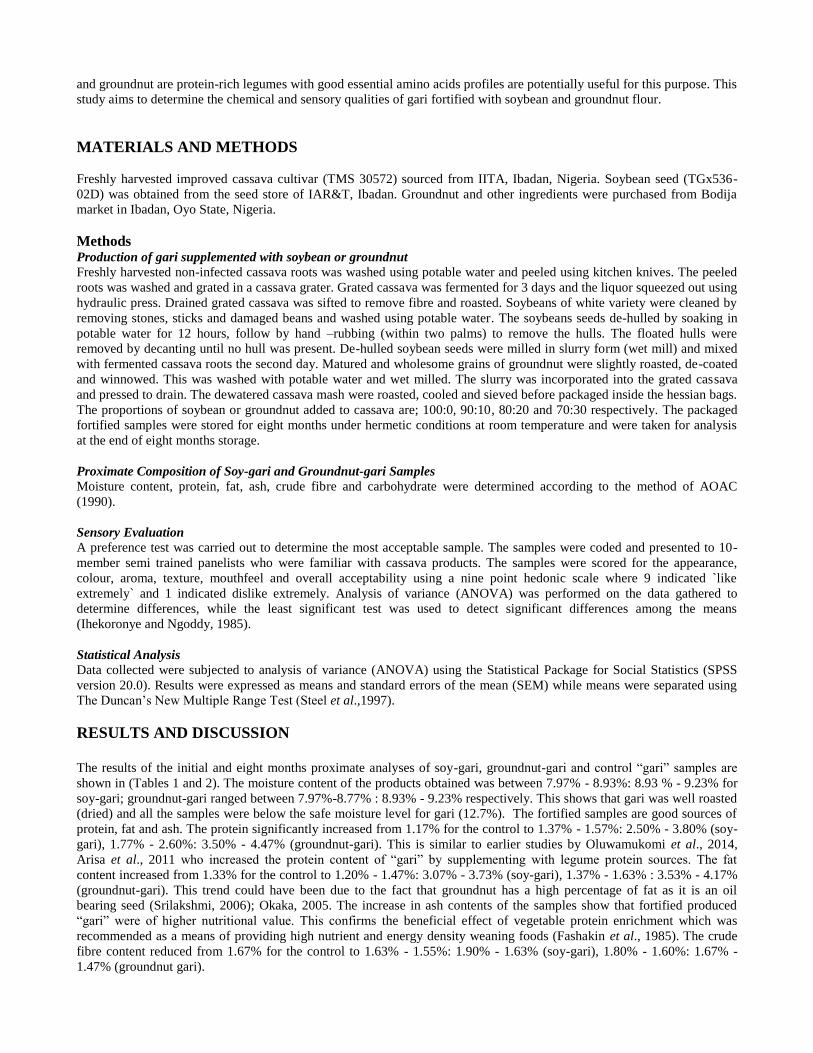
and groundnut are protein-rich legumes with good essential amino acids profiles are potentially useful for this purpose. This
study aims to determine the chemical and sensory qualities of gari fortified with soybean and groundnut flour.
MATERIALS AND METHODS
Freshly harvested improved cassava cultivar (TMS 30572) sourced from IITA, Ibadan, Nigeria. Soybean seed (TGx536-
02D) was obtained from the seed store of IAR&T, Ibadan. Groundnut and other ingredients were purchased from Bodija
market in Ibadan, Oyo State, Nigeria.
Methods Production of gari supplemented with soybean or groundnut
Freshly harvested non-infected cassava roots was washed using potable water and peeled using kitchen knives. The peeled
roots was washed and grated in a cassava grater. Grated cassava was fermented for 3 days and the liquor squeezed out using
hydraulic press. Drained grated cassava was sifted to remove fibre and roasted. Soybeans of white variety were cleaned by
removing stones, sticks and damaged beans and washed using potable water. The soybeans seeds de-hulled by soaking in
potable water for 12 hours, follow by hand –rubbing (within two palms) to remove the hulls. The floated hulls were
removed by decanting until no hull was present. De-hulled soybean seeds were milled in slurry form (wet mill) and mixed
with fermented cassava roots the second day. Matured and wholesome grains of groundnut were slightly roasted, de-coated
and winnowed. This was washed with potable water and wet milled. The slurry was incorporated into the grated cassava
and pressed to drain. The dewatered cassava mash were roasted, cooled and sieved before packaged inside the hessian bags.
The proportions of soybean or groundnut added to cassava are; 100:0, 90:10, 80:20 and 70:30 respectively. The packaged
fortified samples were stored for eight months under hermetic conditions at room temperature and were taken for analysis
at the end of eight months storage.
Proximate Composition of Soy-gari and Groundnut-gari Samples
Moisture content, protein, fat, ash, crude fibre and carbohydrate were determined according to the method of AOAC
(1990).
Sensory Evaluation
A preference test was carried out to determine the most acceptable sample. The samples were coded and presented to 10-
member semi trained panelists who were familiar with cassava products. The samples were scored for the appearance,
colour, aroma, texture, mouthfeel and overall acceptability using a nine point hedonic scale where 9 indicated `like
extremely` and 1 indicated dislike extremely. Analysis of variance (ANOVA) was performed on the data gathered to
determine differences, while the least significant test was used to detect significant differences among the means
(Ihekoronye and Ngoddy, 1985).
Statistical Analysis Data collected were subjected to analysis of variance (ANOVA) using the Statistical Package for Social Statistics (SPSS
version 20.0). Results were expressed as means and standard errors of the mean (SEM) while means were separated using
The Duncan’s New Multiple Range Test (Steel et al.,1997).
RESULTS AND DISCUSSION
The results of the initial and eight months proximate analyses of soy-gari, groundnut-gari and control “gari” samples are
shown in (Tables 1 and 2). The moisture content of the products obtained was between 7.97% - 8.93%: 8.93 % - 9.23% for
soy-gari; groundnut-gari ranged between 7.97%-8.77% : 8.93% - 9.23% respectively. This shows that gari was well roasted
(dried) and all the samples were below the safe moisture level for gari (12.7%). The fortified samples are good sources of
protein, fat and ash. The protein significantly increased from 1.17% for the control to 1.37% - 1.57%: 2.50% - 3.80% (soy-
gari), 1.77% - 2.60%: 3.50% - 4.47% (groundnut-gari). This is similar to earlier studies by Oluwamukomi et al., 2014,
Arisa et al., 2011 who increased the protein content of “gari” by supplementing with legume protein sources. The fat
content increased from 1.33% for the control to 1.20% - 1.47%: 3.07% - 3.73% (soy-gari), 1.37% - 1.63% : 3.53% - 4.17%
(groundnut-gari). This trend could have been due to the fact that groundnut has a high percentage of fat as it is an oil
bearing seed (Srilakshmi, 2006); Okaka, 2005. The increase in ash contents of the samples show that fortified produced
“gari” were of higher nutritional value. This confirms the beneficial effect of vegetable protein enrichment which was
recommended as a means of providing high nutrient and energy density weaning foods (Fashakin et al., 1985). The crude
fibre content reduced from 1.67% for the control to 1.63% - 1.55%: 1.90% - 1.63% (soy-gari), 1.80% - 1.60%: 1.67% -
1.47% (groundnut gari).
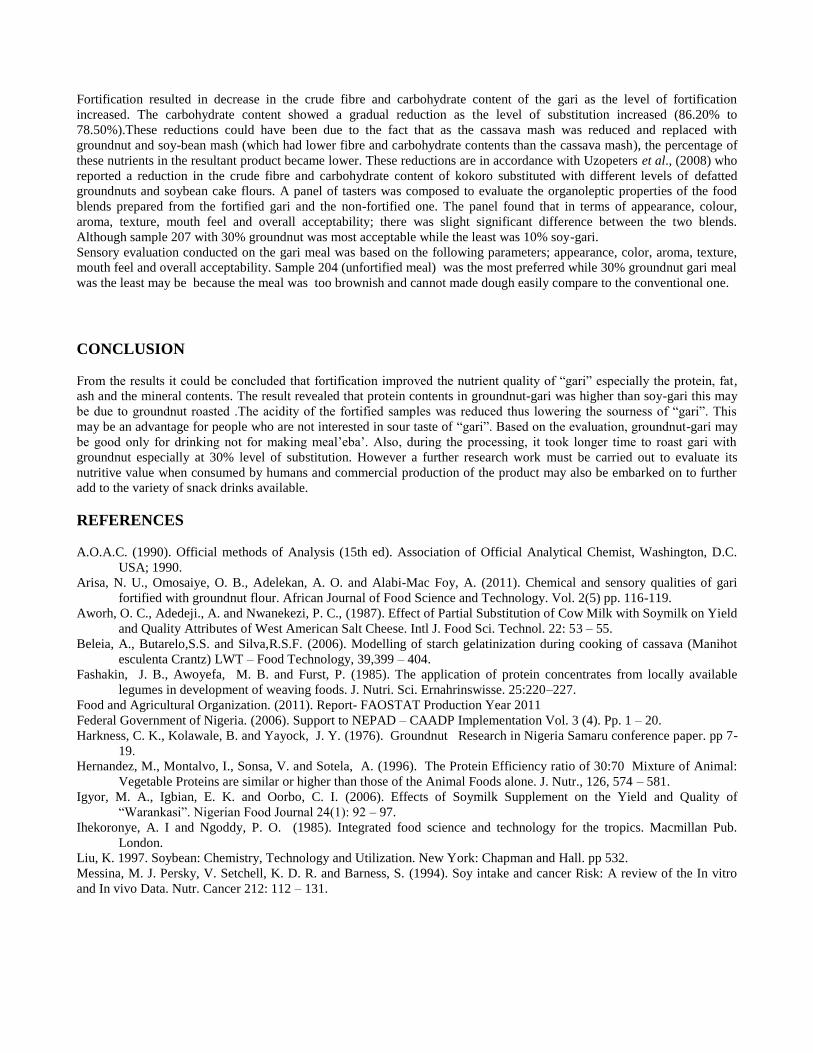
Fortification resulted in decrease in the crude fibre and carbohydrate content of the gari as the level of fortification
increased. The carbohydrate content showed a gradual reduction as the level of substitution increased (86.20% to
78.50%).These reductions could have been due to the fact that as the cassava mash was reduced and replaced with
groundnut and soy-bean mash (which had lower fibre and carbohydrate contents than the cassava mash), the percentage of
these nutrients in the resultant product became lower. These reductions are in accordance with Uzopeters et al., (2008) who
reported a reduction in the crude fibre and carbohydrate content of kokoro substituted with different levels of defatted
groundnuts and soybean cake flours. A panel of tasters was composed to evaluate the organoleptic properties of the food
blends prepared from the fortified gari and the non-fortified one. The panel found that in terms of appearance, colour,
aroma, texture, mouth feel and overall acceptability; there was slight significant difference between the two blends.
Although sample 207 with 30% groundnut was most acceptable while the least was 10% soy-gari.
Sensory evaluation conducted on the gari meal was based on the following parameters; appearance, color, aroma, texture,
mouth feel and overall acceptability. Sample 204 (unfortified meal) was the most preferred while 30% groundnut gari meal
was the least may be because the meal was too brownish and cannot made dough easily compare to the conventional one.
CONCLUSION
From the results it could be concluded that fortification improved the nutrient quality of “gari” especially the protein, fat,
ash and the mineral contents. The result revealed that protein contents in groundnut-gari was higher than soy-gari this may
be due to groundnut roasted .The acidity of the fortified samples was reduced thus lowering the sourness of “gari”. This
may be an advantage for people who are not interested in sour taste of “gari”. Based on the evaluation, groundnut-gari may
be good only for drinking not for making meal’eba’. Also, during the processing, it took longer time to roast gari with
groundnut especially at 30% level of substitution. However a further research work must be carried out to evaluate its
nutritive value when consumed by humans and commercial production of the product may also be embarked on to further
add to the variety of snack drinks available.
REFERENCES
A.O.A.C. (1990). Official methods of Analysis (15th ed). Association of Official Analytical Chemist, Washington, D.C.
USA; 1990.
Arisa, N. U., Omosaiye, O. B., Adelekan, A. O. and Alabi-Mac Foy, A. (2011). Chemical and sensory qualities of gari
fortified with groundnut flour. African Journal of Food Science and Technology. Vol. 2(5) pp. 116-119.
Aworh, O. C., Adedeji., A. and Nwanekezi, P. C., (1987). Effect of Partial Substitution of Cow Milk with Soymilk on Yield
and Quality Attributes of West American Salt Cheese. Intl J. Food Sci. Technol. 22: 53 – 55.
Beleia, A., Butarelo,S.S. and Silva,R.S.F. (2006). Modelling of starch gelatinization during cooking of cassava (Manihot
esculenta Crantz) LWT – Food Technology, 39,399 – 404.
Fashakin, J. B., Awoyefa, M. B. and Furst, P. (1985). The application of protein concentrates from locally available
legumes in development of weaving foods. J. Nutri. Sci. Ernahrinswisse. 25:220–227.
Food and Agricultural Organization. (2011). Report- FAOSTAT Production Year 2011
Federal Government of Nigeria. (2006). Support to NEPAD – CAADP Implementation Vol. 3 (4). Pp. 1 – 20.
Harkness, C. K., Kolawale, B. and Yayock, J. Y. (1976). Groundnut Research in Nigeria Samaru conference paper. pp 7-
19.
Hernandez, M., Montalvo, I., Sonsa, V. and Sotela, A. (1996). The Protein Efficiency ratio of 30:70 Mixture of Animal:
Vegetable Proteins are similar or higher than those of the Animal Foods alone. J. Nutr., 126, 574 – 581.
Igyor, M. A., Igbian, E. K. and Oorbo, C. I. (2006). Effects of Soymilk Supplement on the Yield and Quality of
“Warankasi”. Nigerian Food Journal 24(1): 92 – 97.
Ihekoronye, A. I and Ngoddy, P. O. (1985). Integrated food science and technology for the tropics. Macmillan Pub.
London.
Liu, K. 1997. Soybean: Chemistry, Technology and Utilization. New York: Chapman and Hall. pp 532.
Messina, M. J. Persky, V. Setchell, K. D. R. and Barness, S. (1994). Soy intake and cancer Risk: A review of the In vitro
and In vivo Data. Nutr. Cancer 212: 112 – 131.

Table 1: Initial Proximate Analysis (%) of Soy-gari and Groundnut-gari samples.
Compositions
(%)
Samples
201 202 203 204 205 206 207
Moisture 8.27±1.53d 8.28±0.12d 8.93±0.06a 7.97±0.06e 8.43 ±0.12cd 8.77±0.10bc 8.77±0.06ab
Crude Protein 1.37±0.12e 1.49±0.06de 1.57±0.15d 1.17±0.06f 1.77±0.06c 2.27±0.15b 2.60±0.10a
Crude fat 1.20±0.00d 1.35±0.10bc 1.47±0.06b 1.33±0.06c 1.37±0.06bc 1.40±0.10bc 1.63±0.06a
Ash 1.70±0.10a 1.73±0.06a 1.57±0.06bc 1.67±0.06ab 1.53±0.06c 1.63±0.06abc 1.63±0.06abc
Crude fibre 1.60±0.10b 1.55±0.06b 1.63±0.06b 1.67±0.12ab 1.60±2.72b 1.63±0.12b 1.80±0.00a
Carbohydrates 85.87±0.31ab 85.62±0.31abc 84.83±0.29cd 86.20±0.20a 85.33±0.12abc 85.10±1.15bcd 84.33±0.15d Mean values followed by different alphabet within a row are significantly different (p ≤ 0.05). where: 201 is 10% Soy-gari, 202 is 20%
Soy-gari,
203 is 30% Soy-gari, 204 is Control, 205 is 10% Groundnut-gari, 206 is 20% Groundnut –gari and 207 is 30% Groundnut – gari.
Table 2: Proximate Analysis (%) of Soy-gari and Groundnut gari at 8 Months of Storage.
Compositions
(%)
Samples
201 202 203 204 205 206 207
Moisture 9.07±0.06ab 9.23±0.15a 8.67±0.15d 8.93±0.06bc 8.73±0.15cd 8.83±0.06cd 9.23±0.15a
Crude Protein 2.50±0.10e 3.60±0.10d 3.80±0.10c 1.40±0.10f 3.50±0.10d 4.10±0.10b 4.47±0.15a
Crude fat 3.07±0.06c 3.57±0.15b 3.73±0.12b 1.57±0.15d 3.53±0.06b 3.97±0.12a 4.17±0.12a
Ash 2.33±0.06c 2.23±0.06c 2.50±0.10b 1.20±0.00d 2.27±0.15c 2.77±0.12a 2.53±0.06b
Crude fibre 1.73±0.06bc 1.90±0.10b 1.63±0.12cd 2.80±0.10a 1.67±0.15c 1.47±0.06d 1.60±0.10cd
Carbohydrates 81.10±0.30b 79.83±0.12d 79.50±0.26d 84.10±0.17a 80.23±0.15c 78.45±0.21e 78.60±0.17e Mean values followed by different alphabet within a row are significantly different (p ≤ 0.05). where: 201 is 10% Soy-gari, 202 is 20%
Soy-gari,
203 is 30% Soy-gari, 204 is Control, 205 is 10% Groundnut-gari, 206 is 20% Groundnut –gari and 207 is 30% Groundnut – gari.
Table 3: Sensory qualities of Soy-gari and Groundnut- gari
Parameters Samples
201 202 203 204 205 206 207
Appearance 2.14±1.61e 4.85±1.83cd 5.85±1.09bc 2.35±1.44e 4.42±1.65d 6.35±1.54b 8.92±0.26a
Colour 2.64±2.13de 5.28±1.85c 5.00±1.79c 2.07±1.14e 3.78±1.36d 6.57±1.39b 8.85±0.36a
Aroma 3.14±1.83cd 4.78±1.92b 4.57±2.06bc 2.35±1.27d 4.57±2.06bc 5.92±1.97b 8.35±1.86a
Texture 4.00±2.74cd 4.28±2.09cd 5.35±1.78bc 2.85±1.99d 4.71±1.85c 6.50±1.50ab 7.85±2.10a
Mouthfeel 3.42±2.37c 4.78±2.00bc 5.92±1.73b 3.64±2.59c 3.85±2.24c 6.21±1.05b 8.00±1.83a
Overall appearance 2.71±2.43d 4.78±1.84bc 5.85±1.61b 2.85±2.10d 3.92±1.77cd 6.14±1.95b 8.00±2.32a Mean values followed by different alphabet within a row are significantly different (p ≤ 0.05). where: 201 is 10% Soy-gari, 202 is 20%
Soy-gari,
203 is 30% Soy-gari, 204 is Control, 205 is 10% Groundnut-gari, 206 is 20% Groundnut –gari and 207 is 30% Groundnut – gari.
Table 4: Sensory Qualities of Soy and Groundnut Eba
Parameters Samples
201 202 203 204 205 206 207
Appearance 7.00c ± 1.76 5.36b ± 1.00 4.73b ± 1.79 8.09c ± 0.34 4.73b ± 1.68 3.09a ± 1.50 4.36ab ± 2.20
Colour 6.27c ± 2.28 5.82bc ± 1.35 4.91bc ± 1.66 8.27d ± 1.35 4.82bc ± 1.51 3.00a ± 1.47 4.27ab ± 1.95
Aroma 6.18bc ± 2.15 5.64ab ± 1.33 4.46ab ± 1.90 7.46c ± 1.92 5.73ab ± 1.97 4.27a ± 2.01 4.36a ± 1.80
Texture 5.91b ± 2.74 4.64ab ± 1.64 4.27ab ± 1.49 8.00c ± 0.77 4.27ab ± 1.85 4.09a ± 1.08 4.55ab ± 1.75
Mouthfeel 5.64b ± 2.33 4.55ab ± 1.75 3.82a ± 1.79 7.46c ± 1.21 4.27ab ±1.66 4.27ab ± 1.92 3.91ab ± 2.12
Overall appearance 6.55cd ± 2.23 5.18bc ± 1.63 4.27ab ± 1.92 7.91d ± 1.14 4.55ab ± 1.56 4.18ab ± 1.33 3.46a ± 1.13 Mean values followed by different alphabet within a row are significantly different (p ≤ 0.05). where: 201 is 10% Soy-gari, 202 is 20%
Soy-gari,
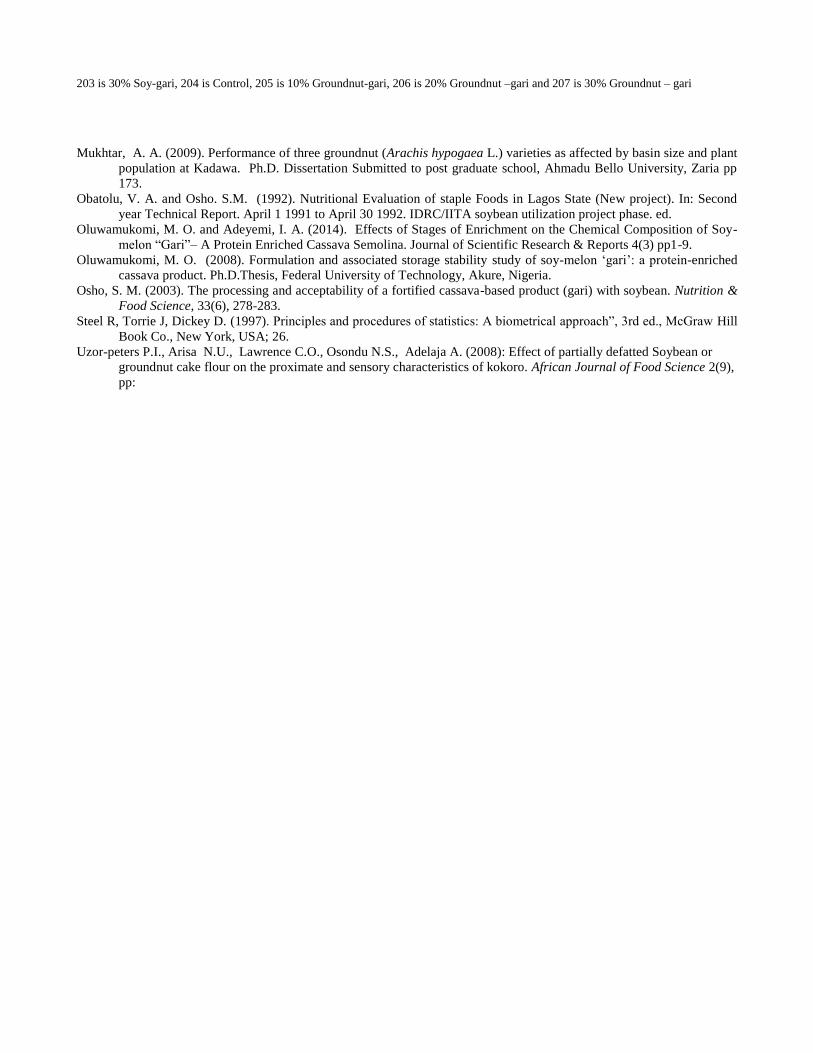
203 is 30% Soy-gari, 204 is Control, 205 is 10% Groundnut-gari, 206 is 20% Groundnut –gari and 207 is 30% Groundnut – gari
Mukhtar, A. A. (2009). Performance of three groundnut (Arachis hypogaea L.) varieties as affected by basin size and plant
population at Kadawa. Ph.D. Dissertation Submitted to post graduate school, Ahmadu Bello University, Zaria pp
173.
Obatolu, V. A. and Osho. S.M. (1992). Nutritional Evaluation of staple Foods in Lagos State (New project). In: Second
year Technical Report. April 1 1991 to April 30 1992. IDRC/IITA soybean utilization project phase. ed.
Oluwamukomi, M. O. and Adeyemi, I. A. (2014). Effects of Stages of Enrichment on the Chemical Composition of Soy-
melon “Gari”– A Protein Enriched Cassava Semolina. Journal of Scientific Research & Reports 4(3) pp1-9.
Oluwamukomi, M. O. (2008). Formulation and associated storage stability study of soy-melon ‘gari’: a protein-enriched
cassava product. Ph.D.Thesis, Federal University of Technology, Akure, Nigeria.
Osho, S. M. (2003). The processing and acceptability of a fortified cassava-based product (gari) with soybean. Nutrition &
Food Science, 33(6), 278-283.
Steel R, Torrie J, Dickey D. (1997). Principles and procedures of statistics: A biometrical approach”, 3rd ed., McGraw Hill
Book Co., New York, USA; 26.
Uzor-peters P.I., Arisa N.U., Lawrence C.O., Osondu N.S., Adelaja A. (2008): Effect of partially defatted Soybean or
groundnut cake flour on the proximate and sensory characteristics of kokoro. African Journal of Food Science 2(9),
pp:
Functional Properties of Composite Flour made from Wheat and Breadfruit
Ajani, A.O.1*; Fasoyiro, S.B.2; Arowora, K.A.3; Ajani, O.O.4; Popoola, C.A.5 and Zaka, K.O.1
1Nigerian Stored Products Research Institute, Onireke, Ibadan, Oyo State, Nigeria. 2Institute of Agricultural Research and Training, Moor Plantation, Ibadan, Oyo State, Nigeria. 3Department of Biochemistry, Federal University of Technology, Wukari, Taraba State, Nigeria. 4Department of Chemistry, Covenant University, Canaanland, Ota, Ogun State, Nigeria. 5Department of Food Science and Technology, Federal University of Technology, Wukari, Taraba State, Nigeria.
*Corresponding author: [email protected]
ABSTRACT
Breadfruit is one of the underutilized crops in Africa. It is a valuable food resource but the usage is limited due to poor
storage properties of the fresh fruit. Breadfruit was processed hygienically into dried chips using NSPRI multipurpose drier
powered by kerosene stove. The chips were milled into flour and mixed with wheat flour in the following ratio (wheat flour
: breadfruit flour; 100:0, 90:10, 80:20, 70:30, 60:40, 0:100) packed in 0.04mm thick gauge transparent polyethylene
nylon and evaluated for its functional properties. Water absorption capacity of the blend ranged from 161– 402 % while oil
absorption capacity ranged between 106 – 160 %. The loose bulk density, packed bulk density, emulsion capacity, emulsion
stability, foaming capacity, foaming stability and least gelation concentration of the breadfruit- wheat composite flour were
in the range of 0.38 – 0.47g/ml, 0.62 – 0.66g/ml, 14.2 – 18.8%, 6.6 – 11.9%, 7.5 – 11.3%, 3.7 – 7.0% and 16.7 -27.8%
respectively. The results from the flour blends showed that the flour may be useful for confectionery products, aerated foods
and high nutrient density weaning foods.
Keywords: breadfruit; confectionery products; functional properties; multipurpose dryer; storage
INTRODUCTION
Breadfruit (Artocarpus communis) is a tree and fruit native to Malaysia and countries of the South Pacific and the
Caribbean. Breadfruit has been an important staple crop and component of traditional agro-forestry systems in the Pacific
for more than 3,000 years. It is an important food in these areas (Taylor and Tuia, 2007). The tree has a great
productive ability with an average sized tree producing 400 to 600 fruits per year (Adepeju et al.,2011). It
produces fruit twice a year, from March to June and from July to September with some fruiting throughout the
year. Present level of breadfruit production in the South-Western Nigeria has been estimated to about 10million
tonnes dry weight per year with potentials for exceeding 100million tonnes every year (Adewusi et al., 1995; Ajayi,
1997).
Breadfruit is a versatile crop and the fruit can be cooked and eaten at all stages of maturity. It is an excellent dietary staple
and compares favorably with other starchy staple crops commonly eaten in the tropics, such as taro, plantain, cassava,
sweet potato and white rice. Breadfruits contain a sizeable quantity of carbohydrates with low levels of protein and fat and a
moderate glycemic index. These carbohydrates, utilized as simple sugars (such as fructose and glucose) by the body are
readily used to enhance the energy generation process in the body. Breadfruits contain essential vitamins and antioxidants,
such as xanthin, which work to protect the body from the debilitating attacks of bacterial and viral agents. 100 grams of
breadfruit contains an impressive inventory of vitamins which includes vitamin B1 (0.2 mg), vitamin B6 (0.1 mg), vitamin
C (29.1 mg), vitamin E (0.1 mg), niacin (0.9 mg) and chloine (9.81 mg).
It is a good source of dietary fiber, potassium, calcium, and magnesium with small amounts of thiamin, riboflavin, niacin
and iron. Some varieties contain small amounts of folic acid. Yellow-fleshed varieties can be a good source of provitamin A
carotenoids (NTBG, 2013). It is typically consumed when mature, but still firm and is a delicious substitute for any starchy
root crop, vegetable, pasta, potato or rice. Sliced breadfruit can be fried to make chips or French fries and pounding like
pounded yam (Morton, 1987). The breadfruit pulps are made into various dishes; it can be pounded, fried, boiled,
or mashed to make porridge; it can also be processed into flour and used in bread and biscuit making (Amusa et
al., 2002). Breadfruit is highly nutritious, cheap and readily available in overwhelming abundance during its
season, it has found limited applications in the food industries (Omobuwajo,2003). Although, a lot of work has been
done on breadfruit but the objective of this work is to assess the functional properties of composite flour from breadfruit
and wheat flour.
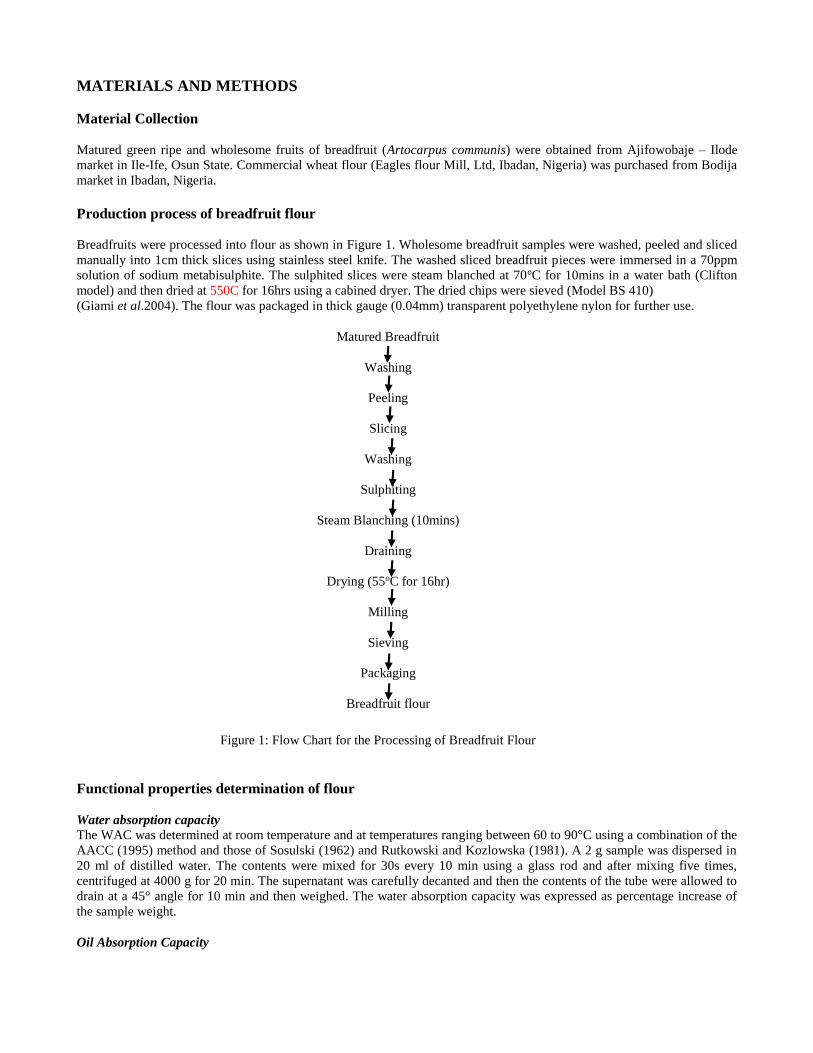
MATERIALS AND METHODS
Material Collection
Matured green ripe and wholesome fruits of breadfruit (Artocarpus communis) were obtained from Ajifowobaje – Ilode
market in Ile-Ife, Osun State. Commercial wheat flour (Eagles flour Mill, Ltd, Ibadan, Nigeria) was purchased from Bodija
market in Ibadan, Nigeria.
Production process of breadfruit flour
Breadfruits were processed into flour as shown in Figure 1. Wholesome breadfruit samples were washed, peeled and sliced
manually into 1cm thick slices using stainless steel knife. The washed sliced breadfruit pieces were immersed in a 70ppm
solution of sodium metabisulphite. The sulphited slices were steam blanched at 70oC for 10mins in a water bath (Clifton
model) and then dried at 550C for 16hrs using a cabined dryer. The dried chips were sieved (Model BS 410)
(Giami et al.2004). The flour was packaged in thick gauge (0.04mm) transparent polyethylene nylon for further use.
Figure 1: Flow Chart for the Processing of Breadfruit Flour
Functional properties determination of flour
Water absorption capacity
The WAC was determined at room temperature and at temperatures ranging between 60 to 90°C using a combination of the
AACC (1995) method and those of Sosulski (1962) and Rutkowski and Kozlowska (1981). A 2 g sample was dispersed in
20 ml of distilled water. The contents were mixed for 30s every 10 min using a glass rod and after mixing five times,
centrifuged at 4000 g for 20 min. The supernatant was carefully decanted and then the contents of the tube were allowed to
drain at a 45° angle for 10 min and then weighed. The water absorption capacity was expressed as percentage increase of
the sample weight.
Oil Absorption Capacity
Matured Breadfruit
Washing
Peeling
Slicing
Washing
Sulphiting
Steam Blanching (10mins)
Draining
Drying (55oC for 16hr)
Milling
Sieving
Packaging
Breadfruit flour
Oil absorption capacity of the flour samples was determined by the centrifugal method elicited by Beuchat (1977) with
slight modifications. One gram of sample was mixed with 10 ml of pure canola oil for 60 s, the mixture was allowed to
stand for 10 min at room temperature, centrifuged at 4000 g for 30 min and the oil that separated was carefully decanted
and the tubes were allowed to drain at a 45° angle for 10 min and then weighed. Oil absorption was expressed as percentage
increase of the sample weight.
Emulsion Capacity
This was determined using Beuchat (1977) method. 16g of the sample was suspended in 100ml of distilled water in a jar
and blended for 30 seconds using an osterizer blender. Peanut oil from a burette was added to the blending sample at a rate
of 0.5ml per second until the emulsion breakpoint was reached. Results were expressed as the percentage of oil emulsified
per gram of flour used.
Foaming capacity and stability
The procedure of Lawhom et al (1971) was used. Two grams of flour sample and 50ml distilled water were mixed in a
Braun blender at room temperature. The suspension was mixed and shaken for 5 minutes at 1600rpm. The content along
with the foam was poured into a 100ml graduated measuring cylinder. The total volume was recorded after 30seconds.
Then the content was allowed to stand at room temperature for 30 minutes and the volume of foam only was recorded.
Foaming Capacity (FC) = Vol. of foam AW – Vol. of foam BW X 100
Vol. of foam BW
Where:
AW = After Whipping
BW = Before Whipping
FS: The volume of foam only (Total volume – liquid volume) after the 30 min standing is taken as foam stability.
Gelation Capacity
The least gelation concentration was determined by a modification of the method of Coffman and Garcia (1977). The flour
dispersions of 2, 4, 6, 8, 10, 12, 14, 16, 18 and 20% (w/v) were prepared in 5ml distilled water in test tubes, which were
heated at 90oC for 1 hour in water bath (Gallenkamp). The heated dispersions were cooled rapidly under running tap water
and then at 4oC for 2 hours. The least gelation concentration was determined as that concentration when the sample from
the inverted tube did not slip or fall.
Bulk Density
The bulk density was determined according to the method described by Wang and Kinsella (1976). A 20g sample was put
into 50ml measuring cylinder. The cylinder was gently tapped on the bench top 10 times from a height of 5cm. The bulk
density was calculated as weight per unit volume of sample.
Calculation:
Bulk Density (g/ml or g/cm3) = Weight of sample
Volume of sample after tapping
RESULTS AND DISCUSSION
Data on selected functional properties of the composite flours are given in Table 1. Water absorption capacity ranged from
161 – 402%. High water absorption capacity may be attributed to the breakdown of starch during blanching and ease of
absorption of water by partly gelatinized starches (Ogbugu et al., 2005). At 100%, breadfruit flour had the highest water
absorption capacity (402%). This implied that blanching enhanced the water absorption capacity. Water absorption
characteristics represent the ability of a product to associate with water under conditions where water is limiting such as
dough and paste (Nwoji, 2004).
Table 1: Functional properties of wheat and breadfruit flour sample missed in different proportions
Properties Wheat and Breadfruit flour samples
A B C D E F
Water Absorption Capacity 161+1.0 202.5+1.5 253+1.0 247.5+1.5 367+2.0 402+1.0
Oil Absorption Capacity 106.5+1.5 109+1.0 118+1.0 113.5+0.5 128.5+1.0 160+2.0
Foaming Capacity 11.3+0.10 9.45+0.15 8.75+0.15 8.40+0.10 7.55+0.15 8.20+0.10
Foaming Solubility 7.0+0.1 6.2+0.1 5.2+0.1 4.5+0.1 4.0+0.1 3.7+0.1
Emulsion Capacity 14.24+0.02 17.93+0.01 14.41+0.03 10.05+0.03 18.86+0.02 14.70+0.04
Emulsion solubility 6.60+0.02 7.88+0.00 9.40+0.04 9.27+0.03 11.80+0.04 11.96+0.01
Least Gelation Capacity 27.84+0.00 25.49+0.00 22.56+0.00 19.34+0.00 17.66+0.00 16.74+0.00
Loosed Bulk Density (g/ml) 0.44+0.00 0.38+0.00 0.48+0.00 0.40+0.00 0.44+0.00 0.48+0.00
Packed Bulk Density (g/ml) 0.63+0.00 0.67+0.00 0.67+0.00 0.63+0.00 0.63+0.00 0.63+0.00
All the parameters are in percentages with the exception of both bulk densities. A=Wheat flour (100%), B=Wheat flour (90%) and
breadfruit flour (10%), C=Wheat flour (80%) and breadfruit flour (20%), D=Wheat flour (70%) and breadfruit flour (30%), E=Wheat
flour (60%) and breadfruit (40%) and F=Breadfruit (100%).
Oil absorption capacity increases with increase in level of substitution (106 – 160%).The oil absorption capacities of the
flour blends suggests that they may be useful in food preparation that involve mixing like bakery products where oil is an
important ingredient (Banigo and Mepba, 2005). The oil absorption capacities of the composite flours tended to increase
with increase in protein content since the protein in foods influences fat absorption.
Foam capacity ranged from 7.55-11.30%. The higher foaming capacity in the flour blends shows that breadfruit flour is a
good foaming agent and is useful in aerated foods. Also, the foam stability decreases with increase in level of substitution
(7.0 – 3.7%). It was noticed that as the level of substitution increases, the values for foam stability kept decreasing. Hence,
it is not a native proteins crops; it’s expected to have lower stability. At 100% wheat flour had the highest stability than
other flour blends. This suggests that wheat flour is more stable. Protein foams are important in many processes in the
beverage and food industries and this has stimulated interest in their formulation and stability. Foams are used to improve
texture, consistency and appearance of foods.
The least gelation concentration varies from 27.84% to 16.74%. That is, as the proportion of breadfruit flour in the mixture
increased, the least gelation concentration decreased in value. The variation in gelation of samples suggests that interactions
between such components may have significant role in functional properties. It was observed that 100% breadfruit flour had
the lowest least gelation concentration. Also, the values suggesting that the flour blends may not be a good binder in
breakfast foods (Osundahunsi, 2006).
Emulsion capacity ranged from 14.2 – 18.85%. This is suggesting that the flour blends may be a good emulsifying agent.
Increase in protein content with increase in substitution level aid in formulation and stabilization of emulsion (Abbey et. al.,
1998). Emulsion stability increased with increase in level of substitution. This ranged between 6.60 – 11.96%. At 100%,
breadfruit flour had the highest emulsion stability while 100% wheat flour had the lowest. The flour blends had stable
emulsions because the protein content of the blends was not denatured by heat.
For all the flour blends, it was observed that both the loose and packed bulk densities increased considerably with increase
in level of substitution. This is because the breadfruit flour is high in carbohydrate content. Loose and packed densities
ranged between 0.38 – 0.47g/ml and 0.62 – 0.66g/ml respectively. The relative high bulk density of the flour blends
indicates that packaging would be economical as observed by Osundahunsi and Aworh (2002). Breadfruit flour may be
more useful in preparing high nutrient density weaning foods.
CONCLUSION
Breadfruit has immense potential; not only does it provide food security but the fruit is nutritious and versatile. There is
need for commercial awareness, more support with production and processing techniques in order to put this time-honoured
staple crop back on the menu. Also, with the recent policy of 10% cassava flour supplement for wheat flour in Nigeria,
incorporating breadfruit flour into some of our products as a result of its functionality is therefore recommended.
REFERENCES
AACC .,(1995). Approved methods of AACC (9th ed., Vols. 1 and 2). St. Paul, MN: American Association of Cereal
Chemists.
Abbey, B.W. and Ibeh, S.O., (1988). Functional properties of raw and heat processed cowpea (Vigna unguiculata,walp)
flour. Journal Food Sci. 53(6):1775 – 1779.
Adewusi, S.R.A., Akpobome, J.U, and Osuntogun, B.A., (1995). Studies on carbohydrate content of breadfruit (Artocarpus
communis forst) from South-West Nigeria. Starch/Starke. 47: 287-294.
Adepeju, A. B., Gbadamosi, S. O., Adeniran, A. H and Omobuwajo, T. O., (2011). Functional and pasting characteristics of
breadfruit (Artocarpus altilis) flours. African Journal of Food Science 5(9), 529-535 .
Ajayi, O.P., 1997. Studies on some physic-chemical and enzymatic changes in breadfruit (Artocarpus altilis) during
storage. M. Sc Research Thesis. Food Technology Department, University of Ibadan.
Amusa, N.A., Kehinde, I.A. and Ashaye O.A., (2002). Biodeterioration of breadfruit (Artocarpus communis) in storage
and its effects on the nutrient composition. African. Journal of Biotechnology. 1(2): 419-424.
Banigo, E.B. and Mepba, H.D. 2005. Certain functional properties of wheat-breadfruit composite flours. In: Proced.29th
Annual Conference of Nigerian Institute of Food Science and Tech.(NIFST). pp 49b-49c.
Beuchat, L.R. (1977). Functional and electrophoretic characteristics of succinylated peanut flour protein. Journal of Agric.
Food Chemistry 25(2):258-261.
Coffman, C.W. and Garcia, V.V. (1977). Functional properties and amino acid content of a protein isolate from mung bean
flour. Journal of Food Tech.12:473-484.
Giami, S.Y., Amasisi,T. and Ekioyor,T. (2004). Comparison of bread making properties of composite flour from kernels of
roasted and boiled African breadfruit (Treculia Africana decne) seeds. Journal of Material Research.1 (1):16-25.
Lawhom, J.K. and Cater,C.M. 1971. Effect of processing methods and Ph precipitates on the yields and functional
properties of protein isolate from glandless cotton seeds. Journal of Food Science. 36:372-376.
Morton, J.F. and Miami, F.L 1987. Breadfruit: Artocarpus altilis. Fruits of warm climates. pp.50-58.
National Tropical Botanical Garden (NTBG). 2013. Breadfruit Institute: The miracle fruit.
http://www.fitnessrepublic.com/nutrition/fruits/breadfruit.html#ixzz2ONRcoMUY.
Nwoji, V.C. 2004. Effect of processing on the storage stability and functional properties of cowpea (Vigna unguculata)
flour in the production of cowpea bean (akara) and paste (moin-moin). In: Proced. 29th Annual Conference of
Nigeria Institute of Food Science and Tech. (NIFST). pp 199.
Ogbuju, N.J., Oti, E. and Etudaiye, E. 2005. Functional properties of flours produced from raw and cooked cocoyam and
sweet potato genotypes. 29th Annual conference, NIFST proceedings. pp 286.
Omobuwajo, T.O. 2003. Compositional characteristics and sensory quality of biscuit, prawn-crackers and fried chips
produced from breadfruit. Journal of Innovative Food Science and Emerging Technologies.4 (2): 219-225.
Osundahunsi, O.F. 2006. Functional properties of extruded soybean with plantain flour blends. Journal of food Agriculture
and Environment. 4(1):57 – 60.
Osundahunsi, O.F. and Aworh, O.C. 2002. A preliminary study on the use of Tempe-based formula as a weaning diet in
Nigeria. Plant Foods for Human Nutrition. 57: 365 – 376.
Rutkowski, A. and Kozlowska, H. 1981. Preparaty Zywnosciowe Bialka Roslinnego. (Food preparations from plant
proteins), Wydamnictwo Naukowo-Techniczne (WNT), Warszawa, Poland. pp. 318-334.
Sosulski, F.W., Humbert, E.S., Bui, K. and Jonnes, J.D. 1976. Functional properties of rapeseed flours, concentrates and
isolate. Journal of Food Science. 41:134-139.
Taylor, M. B. and Tuia, V.S. 2007. Breadfruit in the pacific region. Acta Horticulturae (ISHS) 757: 43-50.