
Comparison of Time-Domain OCT and Fundus Photographic Assessments of Retinal Thickening in Eyes with...
17
Comparison of Time-Domain OCT and Fundus Photographic Assessments of Retinal Thickening in Eyes with Diabetic Macular Edema Matthew D. Davis 1 , Susan B. Bressler 2 , Lloyd Paul Aiello 3 , Neil M. Bressler 2 , David J. Browning 4 , Christina J. Flaxel 5 , Donald S. Fong 6,7 , William J. Foster 8,9 , Adam R. Glassman 10 , Mary Elizabeth R. Hartnett 11 , Craig Kollman 10 , Helen K. Li 12 , Haijing Qin 10 , Ingrid U. Scott 13 , and the Diabetic Retinopathy Clinical Research Network Study Group 14 1 Department of Ophthalmology and Visual Sciences, University of Wisconsin, Madison, Wisconsin 2 Wilmer Eye Institute, Johns Hopkins University, Baltimore, Maryland 3 Beetham Eye Institute, Joslin Diabetes Center, Harvard Medical School, Boston, Massachusetts 4 Charlotte Eye, Ear, Nose and Throat Associates, Charlotte, North Carolina 5 Casey Eye Institute, Oregon Health and Science University, Portland, Oregon 6 Department of Ophthalmology, Kaiser Permanente Southern California, Baldwin Park, California 7 Department of Research and Evaluation, Kaiser Permanente Southern California, Pasadena, California 8 Department of Ophthalmology, Weill Cornell Medical College at The Methodist Hospital, Houston, Texas 9 Department of Physics, The University of Houston, Houston, Texas 10 Jaeb Center for Health Research, Tampa, Florida 11 Department of Ophthalmology, University of North Carolina School of Medicine, Chapel Hill, North Carolina 12 Department of Ophthalmology and Visual Sciences, University of Texas Medical Branch School of Medicine, Galveston, Texas 13 Department of Ophthalmology and Public Health Sciences, Penn State College of Medicine, Hershey, Pennsylvania. Abstract Purpose—To explore the correlation between optical coherence tomography (OCT) and stereoscopic fundus photographs (FP) for the assessment of retinal thickening (RT) in diabetic macular edema (DME) within a clinical trial. Methods—OCT, FP, and best corrected visual acuity (VA) measurements were obtained in both eyes of 263 participants in a trial comparing two photocoagulation techniques for DME. Correlation coefficients (r) were calculated comparing RT measured by OCT, RT estimated from FP, and VA. Principal variables were central subfield retinal thickness (CSRT) obtained from the OCT fast macular map and DME severity assessed by a reading center using a seven-step photographic scale combining the area of thickened retina within 1 disc diameter of the foveal center and thickening at the center. Results—Medians (quartiles) for retinal thickness within the center subfield by OCT at baseline increased from 236 (214, 264) μm in the lowest level of the photographic scale to 517 (455, 598) Corresponding author: Adam R. Glassman, c/o Jaeb Center for Health Research, 15310 Amberly Drive, Suite 350, Tampa, FL 33647; [email protected].. 14 The most recently published list of the Diabetic Retinopathy Clinical Research Network can be found in Arch Ophthalmol. 2007; 125 (4):469 − 480, with a current list available at www.drcr.net. Disclosure: M.D. Davis, Eli Lilly (F), Novartis (F); S.B. Bressler, Genentech (C, R), Pfizer (C, R), Oxigene (C, R), Notal Vision (C, R), AstraZeneca (C, R), Potentia (C, R); L.P. Aiello, Alcon (C, F, R) and Eli Lilly (C, R), OSI Pharmaceuticals (C, R); N.M. Bressler, Acucele (F), Bausch and Lomb (F), Carl Zeiss Meditech (F), Genentech (F), Notal Vision (F), Novartis (F), OSI (F), Othera (F), QLT (F), Regeneron (F), Targegen (F); D.J. Browning, None; C.J. Flaxel, Genentech (F, R), OSI Pharmaceuticals (C, R); D.S. Fong, None; W.J. Foster, None; A.R. Glassman, None; M.E.R. Hartnett, None; C. Kollman, None; H.K. Li, Eli Lilly (R); H. Qin, None; I.U. Scott, Genentech (C) NIH Public Access Author Manuscript Invest Ophthalmol Vis Sci. Author manuscript; available in PMC 2008 June 2. Published in final edited form as: Invest Ophthalmol Vis Sci. 2008 May ; 49(5): 1745–1752. NIH-PA Author Manuscript NIH-PA Author Manuscript NIH-PA Author Manuscript
-
Upload
independent -
Category
Documents
-
view
5 -
download
0
Transcript of Comparison of Time-Domain OCT and Fundus Photographic Assessments of Retinal Thickening in Eyes with...

Comparison of Time-Domain OCT and Fundus PhotographicAssessments of Retinal Thickening in Eyes with Diabetic MacularEdema
Matthew D. Davis1, Susan B. Bressler2, Lloyd Paul Aiello3, Neil M. Bressler2, David J.Browning4, Christina J. Flaxel5, Donald S. Fong6,7, William J. Foster8,9, Adam R.Glassman10, Mary Elizabeth R. Hartnett11, Craig Kollman10, Helen K. Li12, Haijing Qin10,Ingrid U. Scott13, and the Diabetic Retinopathy Clinical Research Network Study Group14
1Department of Ophthalmology and Visual Sciences, University of Wisconsin, Madison, Wisconsin 2WilmerEye Institute, Johns Hopkins University, Baltimore, Maryland 3Beetham Eye Institute, Joslin Diabetes Center,Harvard Medical School, Boston, Massachusetts 4Charlotte Eye, Ear, Nose and Throat Associates, Charlotte,North Carolina 5Casey Eye Institute, Oregon Health and Science University, Portland, Oregon 6Departmentof Ophthalmology, Kaiser Permanente Southern California, Baldwin Park, California 7Department ofResearch and Evaluation, Kaiser Permanente Southern California, Pasadena, California 8Department ofOphthalmology, Weill Cornell Medical College at The Methodist Hospital, Houston, Texas 9Department ofPhysics, The University of Houston, Houston, Texas 10Jaeb Center for Health Research, Tampa, Florida11Department of Ophthalmology, University of North Carolina School of Medicine, Chapel Hill, NorthCarolina 12Department of Ophthalmology and Visual Sciences, University of Texas Medical Branch Schoolof Medicine, Galveston, Texas 13Department of Ophthalmology and Public Health Sciences, Penn StateCollege of Medicine, Hershey, Pennsylvania.
AbstractPurpose—To explore the correlation between optical coherence tomography (OCT) andstereoscopic fundus photographs (FP) for the assessment of retinal thickening (RT) in diabeticmacular edema (DME) within a clinical trial.
Methods—OCT, FP, and best corrected visual acuity (VA) measurements were obtained in botheyes of 263 participants in a trial comparing two photocoagulation techniques for DME. Correlationcoefficients (r) were calculated comparing RT measured by OCT, RT estimated from FP, and VA.Principal variables were central subfield retinal thickness (CSRT) obtained from the OCT fastmacular map and DME severity assessed by a reading center using a seven-step photographic scalecombining the area of thickened retina within 1 disc diameter of the foveal center and thickening atthe center.
Results—Medians (quartiles) for retinal thickness within the center subfield by OCT at baselineincreased from 236 (214, 264) μm in the lowest level of the photographic scale to 517 (455, 598)
Corresponding author: Adam R. Glassman, c/o Jaeb Center for Health Research, 15310 Amberly Drive, Suite 350, Tampa, FL 33647;[email protected] most recently published list of the Diabetic Retinopathy Clinical Research Network can be found in Arch Ophthalmol. 2007; 125(4):469 − 480, with a current list available at www.drcr.net.Disclosure: M.D. Davis, Eli Lilly (F), Novartis (F); S.B. Bressler, Genentech (C, R), Pfizer (C, R), Oxigene (C, R), Notal Vision (C,R), AstraZeneca (C, R), Potentia (C, R); L.P. Aiello, Alcon (C, F, R) and Eli Lilly (C, R), OSI Pharmaceuticals (C, R); N.M. Bressler,Acucele (F), Bausch and Lomb (F), Carl Zeiss Meditech (F), Genentech (F), Notal Vision (F), Novartis (F), OSI (F), Othera (F), QLT(F), Regeneron (F), Targegen (F); D.J. Browning, None; C.J. Flaxel, Genentech (F, R), OSI Pharmaceuticals (C, R); D.S. Fong, None;W.J. Foster, None; A.R. Glassman, None; M.E.R. Hartnett, None; C. Kollman, None; H.K. Li, Eli Lilly (R); H. Qin, None; I.U.Scott, Genentech (C)
NIH Public AccessAuthor ManuscriptInvest Ophthalmol Vis Sci. Author manuscript; available in PMC 2008 June 2.
Published in final edited form as:Invest Ophthalmol Vis Sci. 2008 May ; 49(5): 1745–1752.
NIH
-PA Author Manuscript
NIH
-PA Author Manuscript
NIH
-PA Author Manuscript

μm in the highest level (r = 0.67). However, CSRT interquartile ranges were broad and overlappingbetween FP scale levels, and there were many outliers. Correlations between either modality and VAwere weaker (r = 0.57 for CSRT, and r = 0.47 for the FP scale). OCT appeared to be more reproducibleand more sensitive to change in RT between baseline and 1 year than was FP.
Conclusions—There was a moderate correlation between OCT and FP assessments of RT inpatients with DME and slightly less correlation of either measure with VA. OCT and FP providecomplementary information but neither is a reliable surrogate for VA.
The location and severity of retinal thickening and hard exudates (lipid deposits) are definingfeatures of diabetic macular edema (DME) and correlate with concurrent visual acuity (VA)and future VA loss.1–3 Clinically, these abnormalities have traditionally been assessed byophthalmoscopy and slit lamp biomicroscopy with contact or noncontact lenses. Stereoscopicfundus photographs (FP), can provide similar information and have been the standard methodfor documentation of diabetic retinopathy severity and DME in clinical trials.4
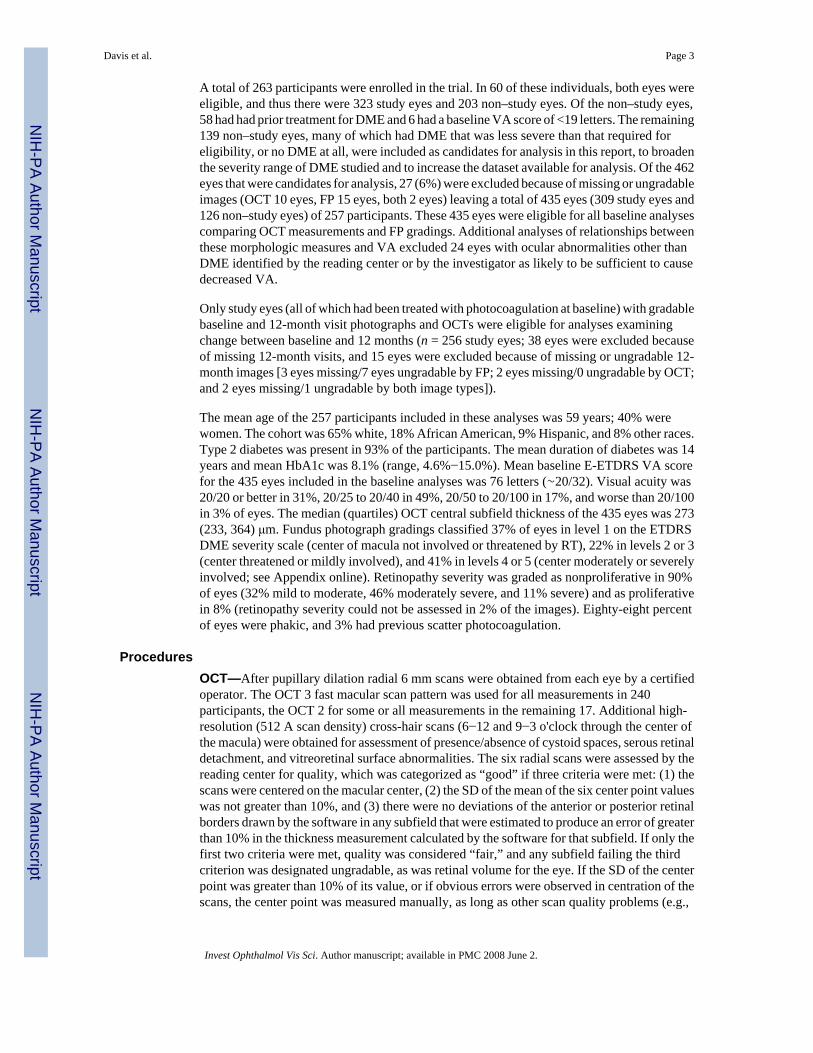
Optical coherence tomography (OCT) provides quantitative estimates of retinal thickness atmultiple points within the macular region, from which a retinal thickness map can beconstructed. The OCT instruments manufactured by Carl Zeiss Meditec (Dublin, CA), whichwere used in our trial, provide estimates of mean retinal thickness within each of ninesubdivisions of the macular area and display them on a grid similar to that used in photographicgrading (Fig. 1) except that the largest OCT grid (using 6-mm scans) is somewhat smaller thanthe photographic grid.4–6 Previous studies have found good agreement between clinicalexamination and OCT on the presence or absence of definite retinal thickening at or near thecenter of the macula (agreement 80%− 85%, κ = 0.60−0.70), but considerable disagreementin eyes with more subtle thickening.5,7,8 Strom et al.9 reported good agreement (89%, κ =0.69) on location of retinal thickening within the macular grid between FP and OCT in eyeswith mild DME that in most cases was located outside of the central subfield of the grid.9 Toour knowledge, no other studies have compared OCT and FP estimates of retinal thickeningin DME.
The extent of agreement between OCT and FP may be helpful in designing future clinicalstudies and for developing practice guidelines. We therefore assessed the correlation betweenretinal thickness measured by OCT and estimated from FP with a modification of the ETDRSDME scale (see Appendix online at http://www.iovs.org/cgi/content/full/49/5/1745/ DC1) ina randomized multicenter clinical trial comparing two photocoagulation strategies for DME.In addition, the correlation of these measures with VA was evaluated.
MethodsThe design, methods, and results of the trial have been published and are summarized brieflyherein.10 Best corrected electronic-ETDRS VA measurements, OCT, and FP were performedon both eyes at baseline and at follow-up visits scheduled 3.5, 8, and 12 months thereafter.Photocoagulation was performed at baseline and repeated during follow-up, according to studyguidelines if DME persisted or recurred. The trial adhered to the tenets of the Declaration ofHelsinki.
Participants were at least 18 years old and had type 1 or 2 diabetes mellitus. One or both eyesmet the following criteria to be a study eye in the trial: (1) best corrected VA score ≥19 letters(∼20/400 or better), (2) definite retinal thickening (RT) due to previously untreated DME (andnot primarily due to vitreoretinal interface abnormalities as determined by the investigator)within 500 μm of the macular center on clinical examination, and (3) mean OCT retinalthickness of ≥250 μm in the central subfield or ≥300 μm in at least one of the four innersubfields.
Davis et al. Page 2
Invest Ophthalmol Vis Sci. Author manuscript; available in PMC 2008 June 2.
NIH
-PA Author Manuscript
NIH
-PA Author Manuscript
NIH
-PA Author Manuscript
A total of 263 participants were enrolled in the trial. In 60 of these individuals, both eyes wereeligible, and thus there were 323 study eyes and 203 non–study eyes. Of the non–study eyes,58 had had prior treatment for DME and 6 had a baseline VA score of <19 letters. The remaining139 non–study eyes, many of which had DME that was less severe than that required foreligibility, or no DME at all, were included as candidates for analysis in this report, to broadenthe severity range of DME studied and to increase the dataset available for analysis. Of the 462eyes that were candidates for analysis, 27 (6%) were excluded because of missing or ungradableimages (OCT 10 eyes, FP 15 eyes, both 2 eyes) leaving a total of 435 eyes (309 study eyes and126 non–study eyes) of 257 participants. These 435 eyes were eligible for all baseline analysescomparing OCT measurements and FP gradings. Additional analyses of relationships betweenthese morphologic measures and VA excluded 24 eyes with ocular abnormalities other thanDME identified by the reading center or by the investigator as likely to be sufficient to causedecreased VA.
Only study eyes (all of which had been treated with photocoagulation at baseline) with gradablebaseline and 12-month visit photographs and OCTs were eligible for analyses examiningchange between baseline and 12 months (n = 256 study eyes; 38 eyes were excluded becauseof missing 12-month visits, and 15 eyes were excluded because of missing or ungradable 12-month images [3 eyes missing/7 eyes ungradable by FP; 2 eyes missing/0 ungradable by OCT;and 2 eyes missing/1 ungradable by both image types]).
The mean age of the 257 participants included in these analyses was 59 years; 40% werewomen. The cohort was 65% white, 18% African American, 9% Hispanic, and 8% other races.Type 2 diabetes was present in 93% of the participants. The mean duration of diabetes was 14years and mean HbA1c was 8.1% (range, 4.6%−15.0%). Mean baseline E-ETDRS VA scorefor the 435 eyes included in the baseline analyses was 76 letters (∼20/32). Visual acuity was20/20 or better in 31%, 20/25 to 20/40 in 49%, 20/50 to 20/100 in 17%, and worse than 20/100in 3% of eyes. The median (quartiles) OCT central subfield thickness of the 435 eyes was 273(233, 364) μm. Fundus photograph gradings classified 37% of eyes in level 1 on the ETDRSDME severity scale (center of macula not involved or threatened by RT), 22% in levels 2 or 3(center threatened or mildly involved), and 41% in levels 4 or 5 (center moderately or severelyinvolved; see Appendix online). Retinopathy severity was graded as nonproliferative in 90%of eyes (32% mild to moderate, 46% moderately severe, and 11% severe) and as proliferativein 8% (retinopathy severity could not be assessed in 2% of the images). Eighty-eight percentof eyes were phakic, and 3% had previous scatter photocoagulation.
ProceduresOCT—After pupillary dilation radial 6 mm scans were obtained from each eye by a certifiedoperator. The OCT 3 fast macular scan pattern was used for all measurements in 240participants, the OCT 2 for some or all measurements in the remaining 17. Additional high-resolution (512 A scan density) cross-hair scans (6−12 and 9−3 o'clock through the center ofthe macula) were obtained for assessment of presence/absence of cystoid spaces, serous retinaldetachment, and vitreoretinal surface abnormalities. The six radial scans were assessed by thereading center for quality, which was categorized as “good” if three criteria were met: (1) thescans were centered on the macular center, (2) the SD of the mean of the six center point valueswas not greater than 10%, and (3) there were no deviations of the anterior or posterior retinalborders drawn by the software in any subfield that were estimated to produce an error of greaterthan 10% in the thickness measurement calculated by the software for that subfield. If only thefirst two criteria were met, quality was considered “fair,” and any subfield failing the thirdcriterion was designated ungradable, as was retinal volume for the eye. If the SD of the centerpoint was greater than 10% of its value, or if obvious errors were observed in centration of thescans, the center point was measured manually, as long as other scan quality problems (e.g.,
Davis et al. Page 3
Invest Ophthalmol Vis Sci. Author manuscript; available in PMC 2008 June 2.
NIH
-PA Author Manuscript
NIH
-PA Author Manuscript
NIH
-PA Author Manuscript

poor signal strength) did not preclude this possibility, and the overall quality of the OCT wasconsidered “borderline.” The manually measured center point thickness was used to imputethe value for the central subfield using a regression equation, since the correlation of the twomeasures is 0.98.10,11 and only these two values were used in analysis. If a manualmeasurement of the center point was not possible, the OCT was considered ungradable forquantitative measures. Of the 435 eyes analyzed at baseline, OCT quality was good in 65%,fair in 20%, borderline in 15%, and ungradable in <1%. Scans of both eyes were gradedconcurrently by a single grader who was free to consult with a senior grader or reading-centerophthalmologist regarding difficult cases. Reproducibility of retinal thickness in the centralsubfield was analyzed in a previous DRCR.net report (different data set using the samemethods) in which the half widths of the 95% confidence intervals for absolute and relativechange between two measures were 38 μm and 11%, respectively.11
The standard output from the OCT radial line pattern provides retinal thickness (inclusive ofsubretinal fluid, when present) in micrometers at the center point, mean thickness in each ofthe nine subfields, and retinal volume within the grid as a whole. Additional measures used inthis report are mean measured retinal thickness in the inner zone (the average of the means ofthe central and four inner subfields, weighted by subfield area), maximum calculated retinalthickening in the inner zone (maximum thickening among the five subfields), and in the gridas a whole (maximum thickening among all nine subfields). Calculated retinal thickening wasdefined as measured retinal thickness minus normal thickness, using unpublished data providedby Carl Zeiss Meditec from a 2005 OCT 3 study of 260 eyes of nondiabetic individuals withnormal macula in which the following mean ± SD thicknesses were determined: centralsubfield, 202 ± 22 μm; inner superior, 269 ± 16 μm; inner nasal, 267 ± 17 μm; inner inferior,271 ± 16 μm; inner temporal, 267 ± 17 μm; outer superior, 232 ± 15 μm; outer nasal, 235 ± 23μm; outer inferior, 231 ± 15 μm; and outer temporal 237 ± 24 μm. We have emphasizedmaximum calculated retinal thickening in the inner zone and measured retinal thickness in thecentral subfield in this report, the former because it is most congruent with the eligibility criteriafor DME severity in the trial and corresponds most closely with the ETDRS DME severityscale, and the latter because it is commonly used clinically and was the principal OCT variableused in this trial.10
Fundus Photographs—ETDRS 7-standard-field FP were obtained using color film bycertified photographers and sent to the reading center for grading.4,12 Grading methods forDME were the same as those used in the ETDRS, except that areas of retinal thickening andhard exudates were estimated as continuous variables rather than on ordinal scales.13 FP andOCT were evaluated independently of each other and independently of visits preceding or afterthe visit being graded.
Creation of Photographic DME Severity Scale—In the ETDRS, poorer VA at baselineand poorer visual outcomes were associated with larger area of retinal thickening within 1 discdiameter of the center of the macula and with greater degree of thickening at the center assessedphotographically at study entry.3 ETDRS eyes were cross classified by the baseline values ofeach of these measures, and mean baseline VA was calculated for each cell (see Appendixonline). Cells with similar VA were combined using cluster analysis and clinical judgment toproduce a nine-level DME severity scale (Gangnon R, et al. IOVS 2005;46:ARVO E-Abstract3269). For use in this report, the scale was modified slightly. The scale and its modificationsand the reproducibility of the gradings are shown in the Appendix online (weighted κ for thescale was 0.58).
Davis et al. Page 4
Invest Ophthalmol Vis Sci. Author manuscript; available in PMC 2008 June 2.
NIH
-PA Author Manuscript
NIH
-PA Author Manuscript
NIH
-PA Author Manuscript
Statistical MethodsCorrelations were calculated in repeated measures models (to account for the correlationbetween eyes) based on the likelihood ratio as defined by Magee.14 Distributions of OCTmeasures and VA were slightly skewed; however, truncating outliers at ±3 SD from the meangave similar results (data not shown). The simple κ statistic was used to describe the associationbetween two dichotomous variables. Statistical analyses were performed with commercialsoftware (SAS software ver. 9.1; SAS, Cary, NC).
ResultCorrelations among OCT Measures at Baseline
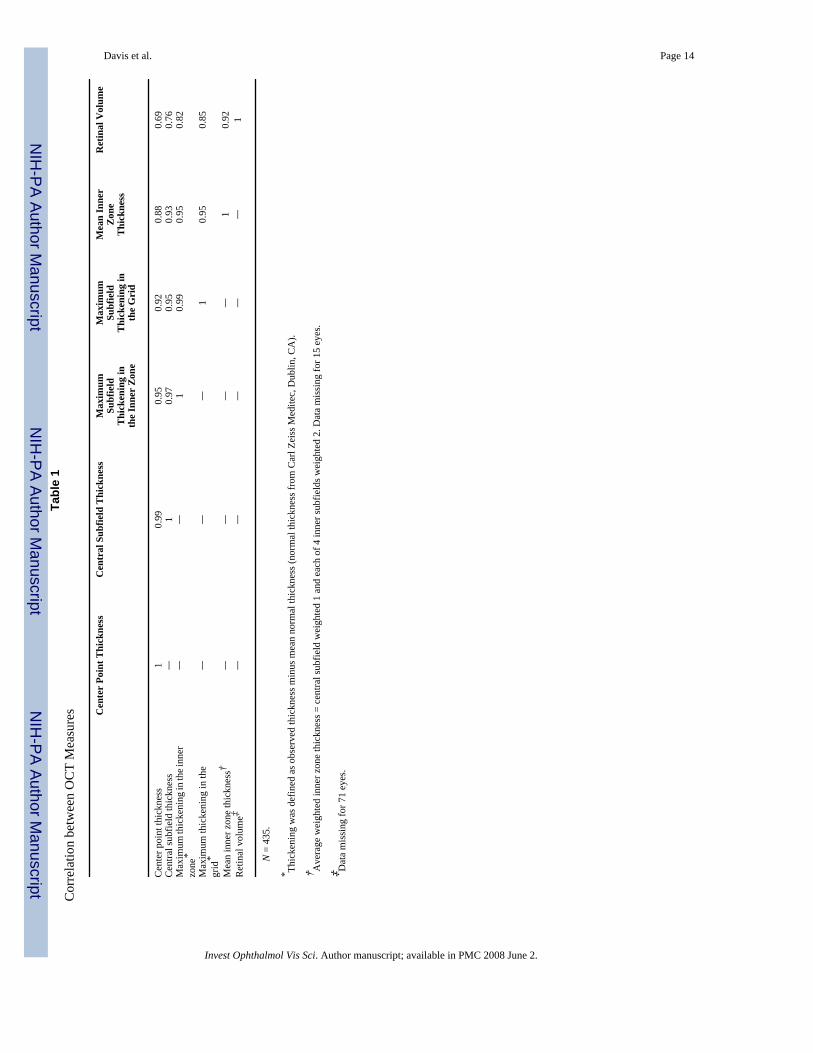
Table 1 presents correlations among several OCT measures. Thickness at the center point andmean thickness within the central subfield correlated highly (r = 0.99), reflecting the centrallocation of the center point within the relatively small area of the central subfield (<0.5 discarea) and the tendency for retinal thickening to have a broad, gently sloping configuration. Asexpected, correlations between the center point and surrounding areas of retina decreased asarea for comparison increased (r = 0.88 for mean inner zone thickness and r = 0.69 for retinalvolume). The central subfield thickness and maximum subfield thickening in the inner zone(r = 0.97) and in the grid (r = 0.95) correlated highly, in part because the central subfieldprovided the maximum value for the inner zone in 60% of eyes and for the grid in 50%.
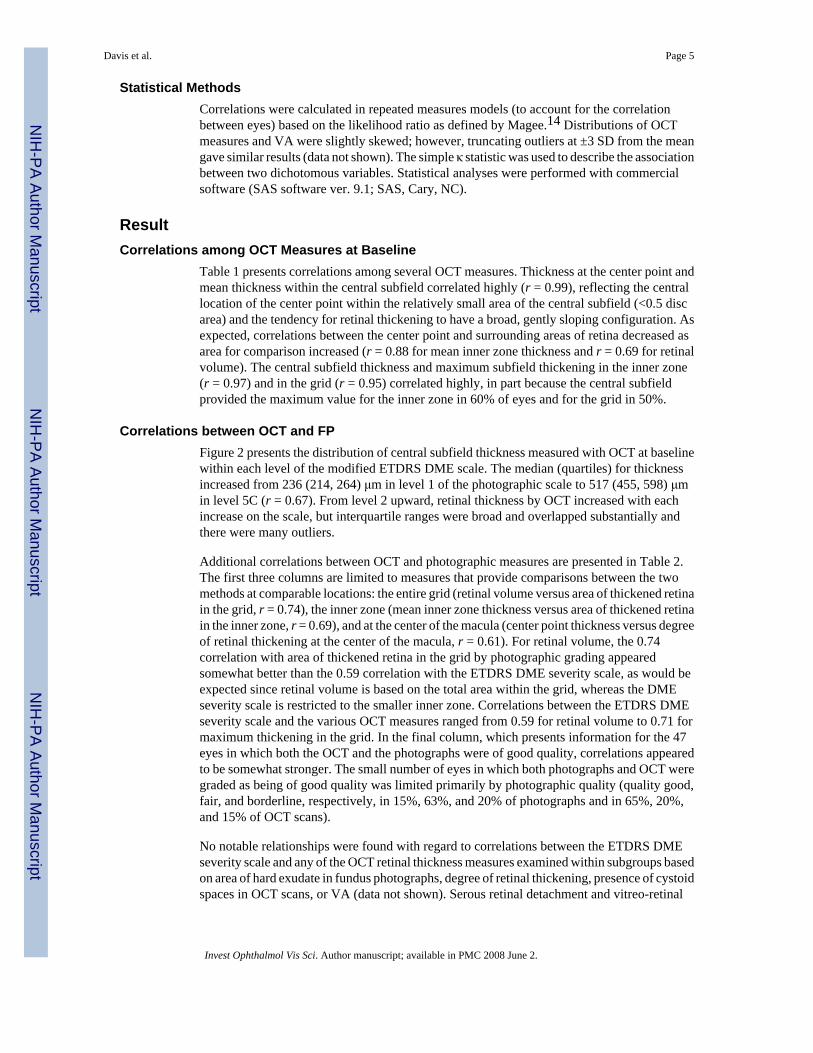
Correlations between OCT and FPFigure 2 presents the distribution of central subfield thickness measured with OCT at baselinewithin each level of the modified ETDRS DME scale. The median (quartiles) for thicknessincreased from 236 (214, 264) μm in level 1 of the photographic scale to 517 (455, 598) μmin level 5C (r = 0.67). From level 2 upward, retinal thickness by OCT increased with eachincrease on the scale, but interquartile ranges were broad and overlapped substantially andthere were many outliers.
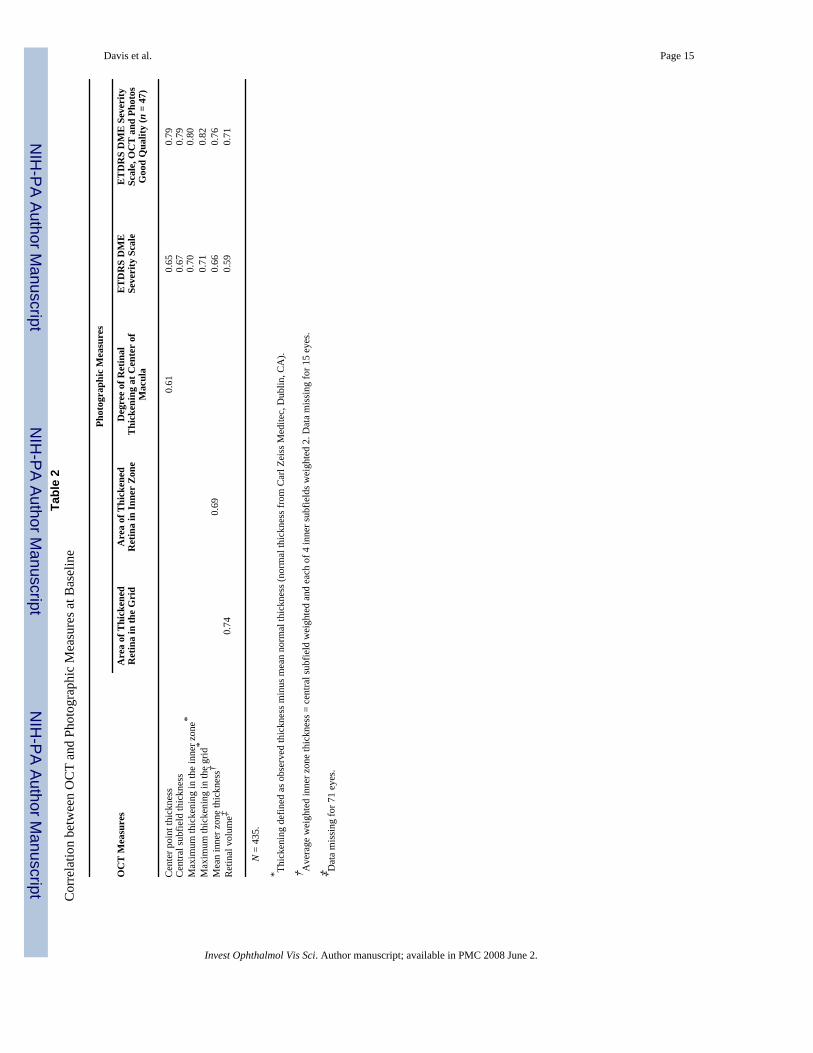
Additional correlations between OCT and photographic measures are presented in Table 2.The first three columns are limited to measures that provide comparisons between the twomethods at comparable locations: the entire grid (retinal volume versus area of thickened retinain the grid, r = 0.74), the inner zone (mean inner zone thickness versus area of thickened retinain the inner zone, r = 0.69), and at the center of the macula (center point thickness versus degreeof retinal thickening at the center of the macula, r = 0.61). For retinal volume, the 0.74correlation with area of thickened retina in the grid by photographic grading appearedsomewhat better than the 0.59 correlation with the ETDRS DME severity scale, as would beexpected since retinal volume is based on the total area within the grid, whereas the DMEseverity scale is restricted to the smaller inner zone. Correlations between the ETDRS DMEseverity scale and the various OCT measures ranged from 0.59 for retinal volume to 0.71 formaximum thickening in the grid. In the final column, which presents information for the 47eyes in which both the OCT and the photographs were of good quality, correlations appearedto be somewhat stronger. The small number of eyes in which both photographs and OCT weregraded as being of good quality was limited primarily by photographic quality (quality good,fair, and borderline, respectively, in 15%, 63%, and 20% of photographs and in 65%, 20%,and 15% of OCT scans).
No notable relationships were found with regard to correlations between the ETDRS DMEseverity scale and any of the OCT retinal thickness measures examined within subgroups basedon area of hard exudate in fundus photographs, degree of retinal thickening, presence of cystoidspaces in OCT scans, or VA (data not shown). Serous retinal detachment and vitreo-retinal
Davis et al. Page 5
Invest Ophthalmol Vis Sci. Author manuscript; available in PMC 2008 June 2.
NIH
-PA Author Manuscript
NIH
-PA Author Manuscript
NIH
-PA Author Manuscript
surface abnormalities were too infrequent for meaningful analyses (7% and 3% of eyes,respectively).
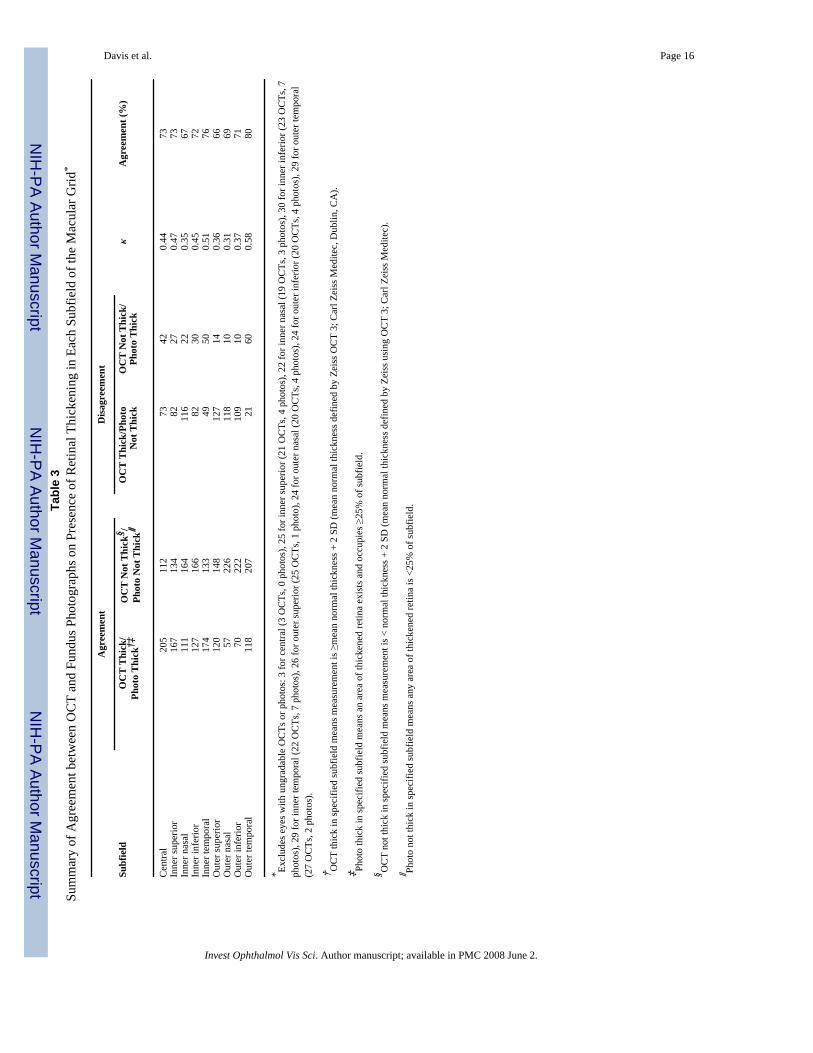
Detection of Retinal Thickening in Individual Subfields: OCT versus PhotographyAgreement on presence of retinal thickening within individual subfields of the grid betweenOCT and photography is shown in Table 3 (for OCT, retinal thickness ≥2 SD greater thannormal; for photographs ≥25% of the subfield thickened). With these definitions, the mostfrequently involved subfield was the central subfield (64% by OCT and 57% by photography;there was agreement in 73% of eyes, κ = 0.44). Involvement of the remaining subfields rangedfrom 34% to 61% by OCT and from 16% to 55% by photography; agreement ranged from 66%to 80% and κ = 0.31−0.58. Thickening was observed more often by OCT than by photographyin seven of the nine subfields. When the presence of retinal thickening detected by photographywas redefined as ≥5% of the subfield thickened, thickening was observed more often byphotography than by OCT in five of the nine subfields; however, the percent of agreement andκ values were similar to those in Table 3 (data not shown).
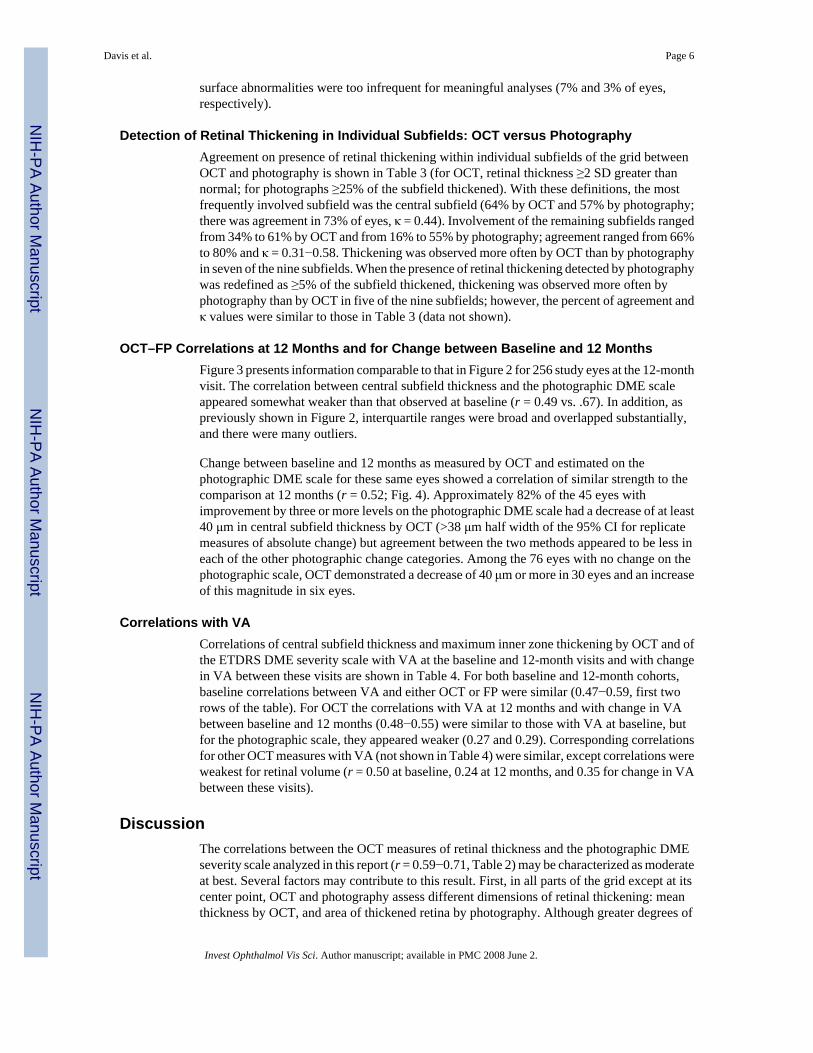
OCT–FP Correlations at 12 Months and for Change between Baseline and 12 MonthsFigure 3 presents information comparable to that in Figure 2 for 256 study eyes at the 12-monthvisit. The correlation between central subfield thickness and the photographic DME scaleappeared somewhat weaker than that observed at baseline (r = 0.49 vs. .67). In addition, aspreviously shown in Figure 2, interquartile ranges were broad and overlapped substantially,and there were many outliers.
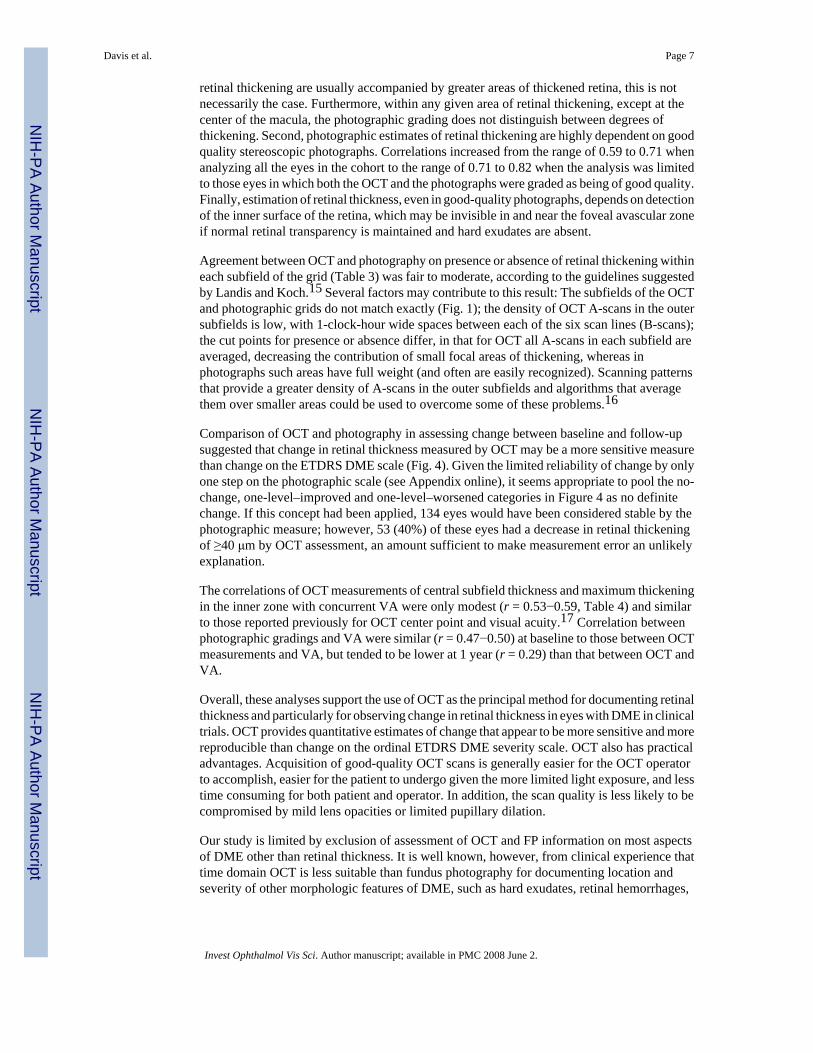
Change between baseline and 12 months as measured by OCT and estimated on thephotographic DME scale for these same eyes showed a correlation of similar strength to thecomparison at 12 months (r = 0.52; Fig. 4). Approximately 82% of the 45 eyes withimprovement by three or more levels on the photographic DME scale had a decrease of at least40 μm in central subfield thickness by OCT (>38 μm half width of the 95% CI for replicatemeasures of absolute change) but agreement between the two methods appeared to be less ineach of the other photographic change categories. Among the 76 eyes with no change on thephotographic scale, OCT demonstrated a decrease of 40 μm or more in 30 eyes and an increaseof this magnitude in six eyes.
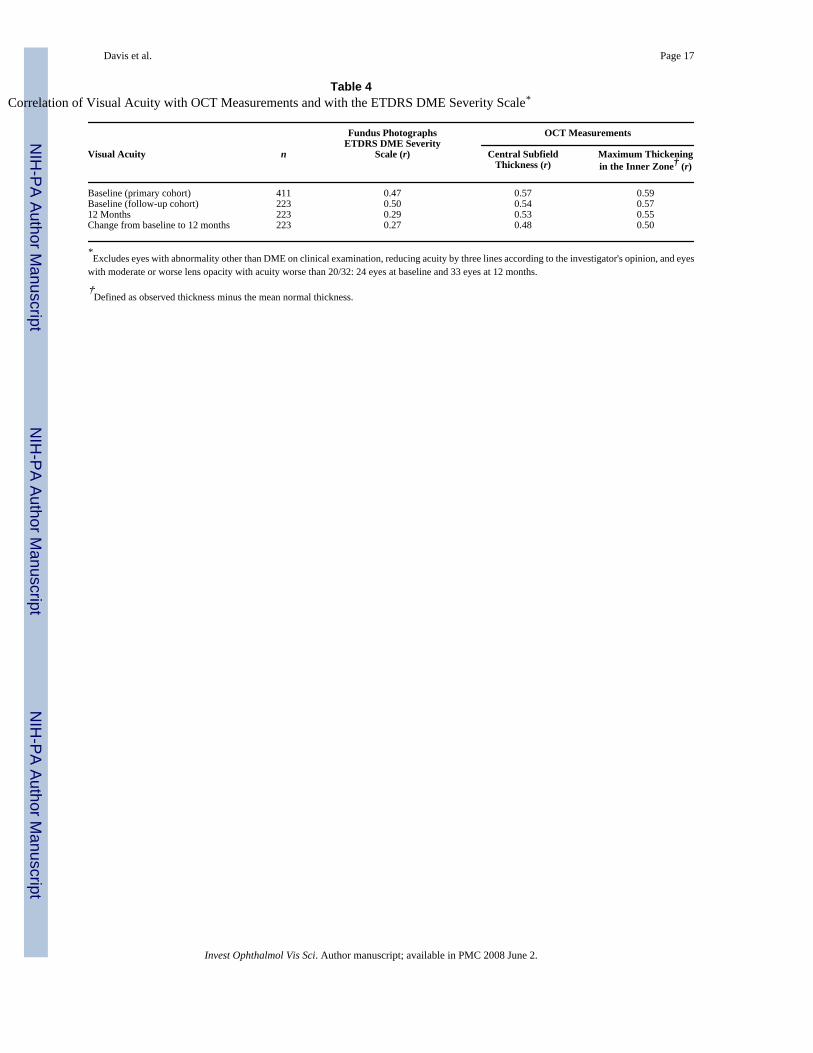
Correlations with VACorrelations of central subfield thickness and maximum inner zone thickening by OCT and ofthe ETDRS DME severity scale with VA at the baseline and 12-month visits and with changein VA between these visits are shown in Table 4. For both baseline and 12-month cohorts,baseline correlations between VA and either OCT or FP were similar (0.47−0.59, first tworows of the table). For OCT the correlations with VA at 12 months and with change in VAbetween baseline and 12 months (0.48−0.55) were similar to those with VA at baseline, butfor the photographic scale, they appeared weaker (0.27 and 0.29). Corresponding correlationsfor other OCT measures with VA (not shown in Table 4) were similar, except correlations wereweakest for retinal volume (r = 0.50 at baseline, 0.24 at 12 months, and 0.35 for change in VAbetween these visits).
DiscussionThe correlations between the OCT measures of retinal thickness and the photographic DMEseverity scale analyzed in this report (r = 0.59−0.71, Table 2) may be characterized as moderateat best. Several factors may contribute to this result. First, in all parts of the grid except at itscenter point, OCT and photography assess different dimensions of retinal thickening: meanthickness by OCT, and area of thickened retina by photography. Although greater degrees of
Davis et al. Page 6
Invest Ophthalmol Vis Sci. Author manuscript; available in PMC 2008 June 2.
NIH
-PA Author Manuscript
NIH
-PA Author Manuscript
NIH
-PA Author Manuscript
retinal thickening are usually accompanied by greater areas of thickened retina, this is notnecessarily the case. Furthermore, within any given area of retinal thickening, except at thecenter of the macula, the photographic grading does not distinguish between degrees ofthickening. Second, photographic estimates of retinal thickening are highly dependent on goodquality stereoscopic photographs. Correlations increased from the range of 0.59 to 0.71 whenanalyzing all the eyes in the cohort to the range of 0.71 to 0.82 when the analysis was limitedto those eyes in which both the OCT and the photographs were graded as being of good quality.Finally, estimation of retinal thickness, even in good-quality photographs, depends on detectionof the inner surface of the retina, which may be invisible in and near the foveal avascular zoneif normal retinal transparency is maintained and hard exudates are absent.
Agreement between OCT and photography on presence or absence of retinal thickening withineach subfield of the grid (Table 3) was fair to moderate, according to the guidelines suggestedby Landis and Koch.15 Several factors may contribute to this result: The subfields of the OCTand photographic grids do not match exactly (Fig. 1); the density of OCT A-scans in the outersubfields is low, with 1-clock-hour wide spaces between each of the six scan lines (B-scans);the cut points for presence or absence differ, in that for OCT all A-scans in each subfield areaveraged, decreasing the contribution of small focal areas of thickening, whereas inphotographs such areas have full weight (and often are easily recognized). Scanning patternsthat provide a greater density of A-scans in the outer subfields and algorithms that averagethem over smaller areas could be used to overcome some of these problems.16
Comparison of OCT and photography in assessing change between baseline and follow-upsuggested that change in retinal thickness measured by OCT may be a more sensitive measurethan change on the ETDRS DME scale (Fig. 4). Given the limited reliability of change by onlyone step on the photographic scale (see Appendix online), it seems appropriate to pool the no-change, one-level–improved and one-level–worsened categories in Figure 4 as no definitechange. If this concept had been applied, 134 eyes would have been considered stable by thephotographic measure; however, 53 (40%) of these eyes had a decrease in retinal thickeningof ≥40 μm by OCT assessment, an amount sufficient to make measurement error an unlikelyexplanation.
The correlations of OCT measurements of central subfield thickness and maximum thickeningin the inner zone with concurrent VA were only modest (r = 0.53−0.59, Table 4) and similarto those reported previously for OCT center point and visual acuity.17 Correlation betweenphotographic gradings and VA were similar (r = 0.47−0.50) at baseline to those between OCTmeasurements and VA, but tended to be lower at 1 year (r = 0.29) than that between OCT andVA.
Overall, these analyses support the use of OCT as the principal method for documenting retinalthickness and particularly for observing change in retinal thickness in eyes with DME in clinicaltrials. OCT provides quantitative estimates of change that appear to be more sensitive and morereproducible than change on the ordinal ETDRS DME severity scale. OCT also has practicaladvantages. Acquisition of good-quality OCT scans is generally easier for the OCT operatorto accomplish, easier for the patient to undergo given the more limited light exposure, and lesstime consuming for both patient and operator. In addition, the scan quality is less likely to becompromised by mild lens opacities or limited pupillary dilation.
Our study is limited by exclusion of assessment of OCT and FP information on most aspectsof DME other than retinal thickness. It is well known, however, from clinical experience thattime domain OCT is less suitable than fundus photography for documenting location andseverity of other morphologic features of DME, such as hard exudates, retinal hemorrhages,
Davis et al. Page 7
Invest Ophthalmol Vis Sci. Author manuscript; available in PMC 2008 June 2.
NIH
-PA Author Manuscript
NIH
-PA Author Manuscript
NIH
-PA Author Manuscript
microaneurysms, and vascular abnormalities. Furthermore, OCT cannot provide informationon overall retinopathy severity, for which FP remains the gold standard.
In summary, in our analyses there was a moderate correlation between OCT measurements ofretinal thickness and a DME severity scale based on gradings of retinal thickening instereoscopic fundus photographs and between these measures and VA. OCT provides a moresensitive and reproducible measure of retinal thickening but is less suitable for documentingother morphologic features of diabetic retinopathy and DME than is FP. However, changes inthese measures do not necessarily reflect changes in VA, particularly for a specific individual.The decision to use either, both, or neither of these modalities in a particular clinical researchstudy depends largely on the focus of the study and the primary study question.
Acknowledgements
Supported by a cooperative agreement from the National Eye Institute, Grants EY14231, EY14269, and EY14229.
References1. Early Treatment Diabetic Retinopathy Study research group. Photocoagulation for diabetic macular
edema. Early Treatment Diabetic Retinopathy Study report number 1. Arch Ophthalmol1985;103:1796–1806. [PubMed: 2866759]
2. Early Treatment Diabetic Retinopathy Study Research Group. Photocoagulation for diabetic macularedema: ETDRS report number 4. Int Ophthalmol Clin 1987;27:265–272. [PubMed: 3692708]
3. Early Treatment Diabetic Retinopathy Study Research Group. Focal photocoagulation treatment ofdiabetic macular edema: relationship of treatment effect to fluorescein angiographic and other retinalcharacteristics at baseline. ETDRS report no. 19. Arch Ophthalmol 1995;113:1144–1155. [PubMed:7661748]
4. Early Treatment Diabetic Retinopathy Study Research Group. Grading diabetic retinopathy fromstereoscopic color fundus photographs: an extension of the modified Airlie House classification.ETDRS report number 10. Ophthalmology 1991;98:786–806. [PubMed: 2062513]
5. Hee M, Puliafito C, Duker J, et al. Topography of diabetic macular edema with optical coherencetomography. Ophthalmology 1998;105:360–370. [PubMed: 9479300]
6. Massin P, Erginay A, Haouchine B, Mehidi AB, Paques M, Gaudric A. Retinal thickness in healthyand diabetic subjects measured using optical coherence tomography mapping software. Eur JOphthalmol 2002;12:102–108. [PubMed: 12022281]
7. Brown JC, Solomon SD, Bressler SB, Schachat AP, DiBernardo C, Bressler NM. Detection of DiabeticFoveal Edema: contact lens biomicroscopy compared with optical coherence tomography. ArchOphtholmol 2004;122:330–335.
8. Browning DJ, McOwen MD, Bowen RM, O'Marah TL. Comparison of the clinical diagnosis of diabeticmacular edema with diagnosis by optical coherence tomography. Am Acad Ophthalmol2004;111:712–715.
9. Strom C, Sander B, Larsen N, Larsen M, Lund-Andersen H. Diabetic macular edema assessed withoptical coherence tomography and stereo fundus photography. Invest Ophthalmol Vis Sci2002;43:241–245. [PubMed: 11773037]
10. Diabetic Retinopathy Clinical Research Network. Comparison of the modified early treatmentdiabetic retinopathy study and mild macular grid laser photocoagulation strategies for diabeticmacular edema. Arch Ophthalmol 2007;125:469–480. [PubMed: 17420366]
11. Diabetic Retinopathy Clinical Research Network. Reproducibility of macular thickness and volumeusing Zeiss optical coherence tomography in patients with diabetic macular edema. Ophthalmology2007;114:520–525. [PubMed: 17141315]
12. Early Treatment Diabetic Retinopathy Study Research Group. Fundus photographic risk factors forprogression of diabetic retinopathy. ETDRS report number 12. Ophthalmology 1991;98:823–833.[PubMed: 2062515]
Davis et al. Page 8
Invest Ophthalmol Vis Sci. Author manuscript; available in PMC 2008 June 2.
NIH
-PA Author Manuscript
NIH
-PA Author Manuscript
NIH
-PA Author Manuscript

13. Gardner TW, Sander B, Larson ML, et al. An extension of the early treatment diabetic retinopathystudy (EDTRS) system for grading of diabetic macular edema in the astemizole retinopathy trial.Curr Eye Res 2006;31:535–547. [PubMed: 16769613]
14. Magee L. R2 measures based on Wald and likelihood ratio joint significance tests. Am Stat1990;44:250–253.
15. Lanids JR, Koch GG. The measurement of observer agreement for categorical data. Biometrics1977;33(1):159–174. [PubMed: 843571]
16. Sadda SR, Tan O, Walsh AC, Schuman JS, Varma R, Huang D. Automated detection of clinicallysignificant macular edema by grid scanning optical coherence tomography. Ophthalmology2006;113:1187–1196. [PubMed: 16647123]
17. Diabetic Retinopathy Clinical Research Network. Relationship between optical coherencetomography-measured central retinal thickness and visual acuity in diabetic macular edema.Ophthalmology 2007;114:525–536. [PubMed: 17123615]
Davis et al. Page 9
Invest Ophthalmol Vis Sci. Author manuscript; available in PMC 2008 June 2.
NIH
-PA Author Manuscript
NIH
-PA Author Manuscript
NIH
-PA Author Manuscript
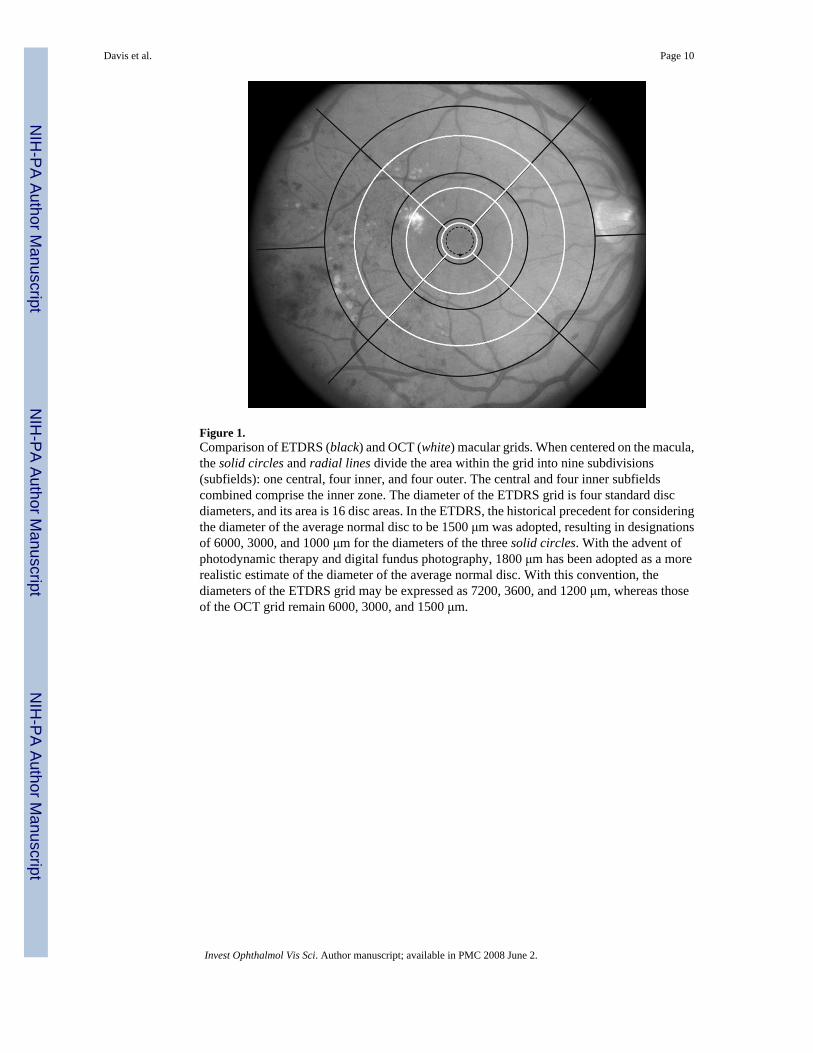
Figure 1.Comparison of ETDRS (black) and OCT (white) macular grids. When centered on the macula,the solid circles and radial lines divide the area within the grid into nine subdivisions(subfields): one central, four inner, and four outer. The central and four inner subfieldscombined comprise the inner zone. The diameter of the ETDRS grid is four standard discdiameters, and its area is 16 disc areas. In the ETDRS, the historical precedent for consideringthe diameter of the average normal disc to be 1500 μm was adopted, resulting in designationsof 6000, 3000, and 1000 μm for the diameters of the three solid circles. With the advent ofphotodynamic therapy and digital fundus photography, 1800 μm has been adopted as a morerealistic estimate of the diameter of the average normal disc. With this convention, thediameters of the ETDRS grid may be expressed as 7200, 3600, and 1200 μm, whereas thoseof the OCT grid remain 6000, 3000, and 1500 μm.
Davis et al. Page 10
Invest Ophthalmol Vis Sci. Author manuscript; available in PMC 2008 June 2.
NIH
-PA Author Manuscript
NIH
-PA Author Manuscript
NIH
-PA Author Manuscript

Figure 2.Distribution of retinal thickness in the central subfield by ETDRS DME severity level atbaseline. The boxes indicate 25th to 75th percentiles and the whiskers the 10th and 90thpercentiles. Solid line: median; dashed line: mean.
Davis et al. Page 11
Invest Ophthalmol Vis Sci. Author manuscript; available in PMC 2008 June 2.
NIH
-PA Author Manuscript
NIH
-PA Author Manuscript
NIH
-PA Author Manuscript
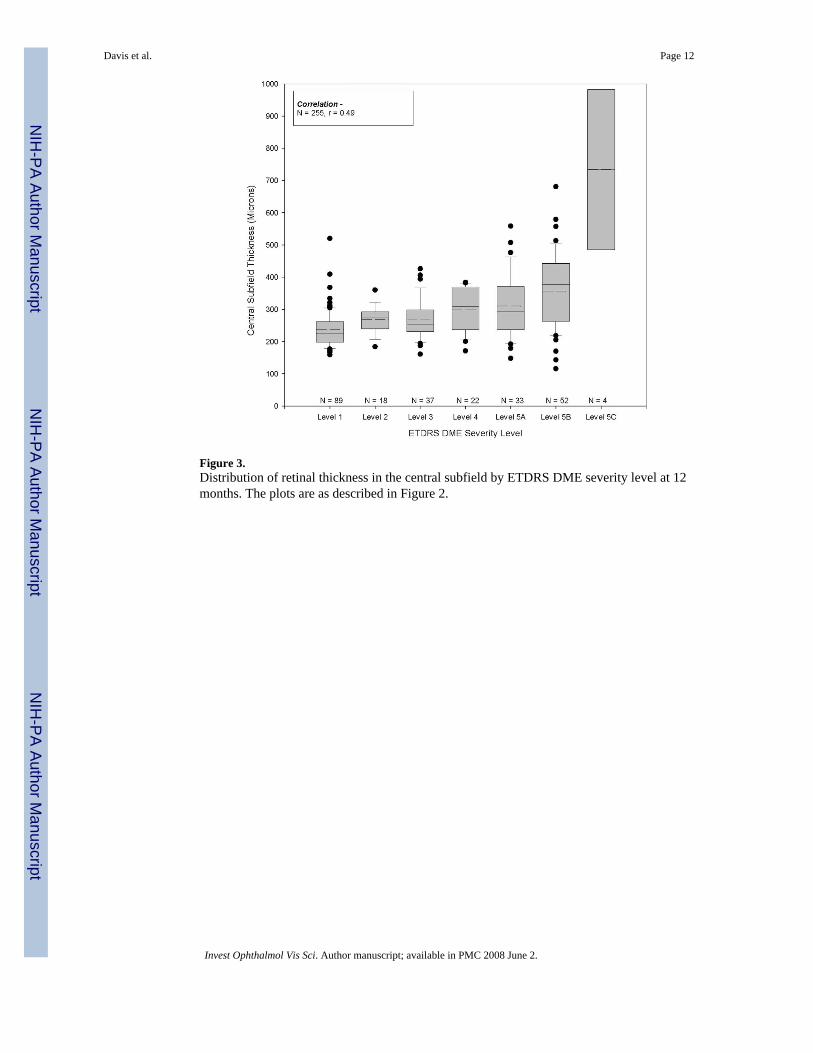
Figure 3.Distribution of retinal thickness in the central subfield by ETDRS DME severity level at 12months. The plots are as described in Figure 2.
Davis et al. Page 12
Invest Ophthalmol Vis Sci. Author manuscript; available in PMC 2008 June 2.
NIH
-PA Author Manuscript
NIH
-PA Author Manuscript
NIH
-PA Author Manuscript

Figure 4.Distribution of baseline to 12-month change in retinal thickness in the central subfield bychange in ETDRS DME severity level. Negative change in OCT values indicates decrease inthickening.
Davis et al. Page 13
Invest Ophthalmol Vis Sci. Author manuscript; available in PMC 2008 June 2.
NIH
-PA Author Manuscript
NIH
-PA Author Manuscript
NIH
-PA Author Manuscript
NIH
-PA Author Manuscript
NIH
-PA Author Manuscript
NIH
-PA Author Manuscript
Davis et al. Page 14Ta
ble
1C
orre
latio
n be
twee
n O
CT
Mea
sure
s Cen
ter
Poin
t Thi
ckne
ssC
entr
al S
ubfie
ld T
hick
ness
Max
imum
Subf
ield
Thi
cken
ing
inth
e In
ner
Zon
e
Max
imum
Subf
ield
Thi
cken
ing
inth
e G
rid
Mea
n In
ner
Zon
eT
hick
ness
Ret
inal
Vol
ume
Cen
ter p
oint
thic
knes
s1
0.99
0.95
0.92
0.88
0.69
Cen
tral s
ubfie
ld th
ickn
ess
—1
0.97
0.95
0.93
0.76
Max
imum
thic
keni
ng in
the i
nner
zone
*—
—1
0.99
0.95
0.82
Max
imum
thic
keni
ng in
the
grid
*—
——
10.
950.
85
Mea
n in
ner z
one
thic
knes
s†—
——
—1
0.92
Ret
inal
vol
ume‡
——
——
—1
N =
435
.
* Thic
keni
ng w
as d
efin
ed a
s obs
erve
d th
ickn
ess m
inus
mea
n no
rmal
thic
knes
s (no
rmal
thic
knes
s fro
m C
arl Z
eiss
Med
itec,
Dub
lin, C
A).
† Ave
rage
wei
ghte
d in
ner z
one
thic
knes
s = c
entra
l sub
field
wei
ghte
d 1
and
each
of 4
inne
r sub
field
s wei
ghte
d 2.
Dat
a m
issi
ng fo
r 15
eyes
.
‡ Dat
a m
issi
ng fo
r 71
eyes
.
Invest Ophthalmol Vis Sci. Author manuscript; available in PMC 2008 June 2.
NIH
-PA Author Manuscript
NIH
-PA Author Manuscript
NIH
-PA Author Manuscript
Davis et al. Page 15Ta
ble
2C
orre
latio
n be
twee
n O
CT
and
Phot
ogra
phic
Mea
sure
s at B
asel
ine
Phot
ogra
phic
Mea
sure
s
OC
T M
easu
res
Are
a of
Thi
cken
edR
etin
a in
the
Gri
dA
rea
of T
hick
ened
Ret
ina
in In
ner
Zon
eD
egre
e of
Ret
inal
Thi
cken
ing
at C
ente
r of
Mac
ula
ET
DR
S D
ME
Seve
rity
Sca
leE
TD
RS
DM
E S
ever
itySc
ale,
OC
T a
nd P
hoto
sG
ood
Qua
lity
(n =
47)
Cen
ter p
oint
thic
knes
s0.
610.
650.
79C
entra
l sub
field
thic
knes
s0.
670.
79M
axim
um th
icke
ning
in th
e in
ner z
one*
0.70
0.80
Max
imum
thic
keni
ng in
the
grid
*0.
710.
82M
ean
inne
r zon
e th
ickn
ess†
0.69
0.66
0.76
Ret
inal
vol
ume‡
0.74
0.59
0.71
N =
435
.
* Thic
keni
ng d
efin
ed a
s obs
erve
d th
ickn
ess m
inus
mea
n no
rmal
thic
knes
s (no
rmal
thic
knes
s fro
m C
arl Z
eiss
Med
itec,
Dub
lin, C
A).
† Ave
rage
wei
ghte
d in
ner z
one
thic
knes
s = c
entra
l sub
field
wei
ghte
d an
d ea
ch o
f 4 in
ner s
ubfie
lds w
eigh
ted
2. D
ata
mis
sing
for 1
5 ey
es.
‡ Dat
a m
issi
ng fo
r 71
eyes
.
Invest Ophthalmol Vis Sci. Author manuscript; available in PMC 2008 June 2.
NIH
-PA Author Manuscript
NIH
-PA Author Manuscript
NIH
-PA Author Manuscript
Davis et al. Page 16Ta
ble
3Su
mm
ary
of A
gree
men
t bet
wee
n O
CT
and
Fund
us P
hoto
grap
hs o
n Pr
esen
ce o
f Ret
inal
Thi
cken
ing
in E
ach
Subf
ield
of t
he M
acul
ar G
rid*
Agr
eem
ent
Dis
agre
emen
t
Subf
ield
OC
T T
hick
/Ph
oto
Thi
ck†‡
OC
T N
ot T
hick
§ /Ph
oto
Not
Thi
ck∥
OC
T T
hick
/Pho
toN
ot T
hick
OC
T N
ot T
hick
/Ph
oto
Thi
ckκ
Agr
eem
ent (
%)
Cen
tral
205
112
7342
0.44
73In
ner s
uper
ior
167
134
8227
0.47
73In
ner n
asal
111
164
116
220.
3567
Inne
r inf
erio
r12
716
682
300.
4572
Inne
r tem
pora
l17
413
349
500.
5176
Out
er su
perio
r12
014
812
714
0.36
66O
uter
nas
al57
226
118
100.
3169
Out
er in
ferio
r70
222
109
100.
3771
Out
er te
mpo
ral
118
207
2160
0.58
80
* Excl
udes
eye
s with
ung
rada
ble
OC
Ts o
r pho
tos:
3 fo
r cen
tral (
3 O
CTs
, 0 p
hoto
s), 2
5 fo
r inn
er su
perio
r (21
OC
Ts, 4
pho
tos)
, 22
for i
nner
nas
al (1
9 O
CTs
, 3 p
hoto
s), 3
0 fo
r inn
er in
ferio
r (23
OC
Ts, 7
phot
os),
29 fo
r inn
er te
mpo
ral (
22 O
CTs
, 7 p
hoto
s), 2
6 fo
r out
er su
perio
r (25
OC
Ts, 1
pho
to),
24 fo
r out
er n
asal
(20
OC
Ts, 4
pho
tos)
, 24
for o
uter
infe
rior (
20 O
CTs
, 4 p
hoto
s), 2
9 fo
r out
er te
mpo
ral
(27
OC
Ts, 2
pho
tos)
.
† OC
T th
ick
in sp
ecifi
ed su
bfie
ld m
eans
mea
sure
men
t is ≥
mea
n no
rmal
thic
knes
s + 2
SD
(mea
n no
rmal
thic
knes
s def
ined
by
Zeis
s OC
T 3;
Car
l Zei
ss M
edite
c, D
ublin
, CA
).
‡ Phot
o th
ick
in sp
ecifi
ed su
bfie
ld m
eans
an
area
of t
hick
ened
retin
a ex
ists
and
occ
upie
s ≥25
% o
f sub
field
.
§ OC
T no
t thi
ck in
spec
ified
subf
ield
mea
ns m
easu
rem
ent i
s < n
orm
al th
ickn
ess +
2 S
D (m
ean
norm
al th
ickn
ess d
efin
ed b
y Ze
iss u
sing
OC
T 3;
Car
l Zei
ss M
edite
c).
∥ Phot
o no
t thi
ck in
spec
ified
subf
ield
mea
ns a
ny a
rea
of th
icke
ned
retin
a is
<25
% o
f sub
field
.
Invest Ophthalmol Vis Sci. Author manuscript; available in PMC 2008 June 2.
NIH
-PA Author Manuscript
NIH
-PA Author Manuscript
NIH
-PA Author Manuscript
Davis et al. Page 17
Table 4Correlation of Visual Acuity with OCT Measurements and with the ETDRS DME Severity Scale*
Fundus PhotographsETDRS DME Severity
Scale (r)
OCT Measurements
Visual Acuity n Central SubfieldThickness (r)
Maximum Thickeningin the Inner Zone† (r)
Baseline (primary cohort) 411 0.47 0.57 0.59Baseline (follow-up cohort) 223 0.50 0.54 0.5712 Months 223 0.29 0.53 0.55Change from baseline to 12 months 223 0.27 0.48 0.50
*Excludes eyes with abnormality other than DME on clinical examination, reducing acuity by three lines according to the investigator's opinion, and eyes
with moderate or worse lens opacity with acuity worse than 20/32: 24 eyes at baseline and 33 eyes at 12 months.
†Defined as observed thickness minus the mean normal thickness.
Invest Ophthalmol Vis Sci. Author manuscript; available in PMC 2008 June 2.