Retinopathy Online Challenge: Automatic Detection of Microaneurysms in Digital Color Fundus...
11
IEEE TRANSACTIONS ON MEDICAL IMAGING, VOL. 29, NO. 1, JANUARY 2010 185 Retinopathy Online Challenge: Automatic Detection of Microaneurysms in Digital Color Fundus Photographs Meindert Niemeijer*, Bram van Ginneken, Member, IEEE, Michael J. Cree, Senior Member, IEEE, Atsushi Mizutani, Gwénolé Quellec, Clara I. Sánchez, Member, IEEE, Bob Zhang, Roberto Hornero, Member, IEEE, Mathieu Lamard, Chisako Muramatsu, Xiangqian Wu, Guy Cazuguel, Member, IEEE, Jane You, Agustín Mayo, Qin Li, Yuji Hatanaka, Béatrice Cochener, Christian Roux, Senior Member, IEEE, Fakhri Karray, María García, Student Member, IEEE, Hiroshi Fujita, Member, IEEE, and Michael D. Abràmoff, Member, IEEE Abstract—The detection of microaneurysms in digital color fundus photographs is a critical first step in automated screening for diabetic retinopathy (DR), a common complication of diabetes. To accomplish this detection numerous methods have been pub- lished in the past but none of these was compared with each other on the same data. In this work we present the results of the first international microaneurysm detection competition, organized in Manuscript received August 04, 2009; revised September 29, 2009; accepted September 30, 2009. First published October 09, 2009; current version pub- lished January 04, 2010. This work was supported in part by the National Eye Institute (R01 EY017066), in part by the Netherlands Organization for Scien- tific Research (NWO), and in part by Research to Prevent Blindness. Asterisk indicates corresponding author. *M. Niemeijer was with the Department of Electrical and Computer Engi- neering and the Department of Ophthalmology and Visual Sciences, University of Iowa, Iowa City, IA 52242 USA. He is now with the Image Sciences Institute, Utrecht, 3584 CX Utrecht, Netherlands. (e-mail: [email protected]). B. van Ginneken is with the Image Sciences Institute, 3584 CX Utrecht, The Netherlands. H. Fujita, C. Muramatsu, and A. Mizutani are with the Department of Intel- ligent Image Information, Graduate School of Medicine, Gifu University, Gifu 501-1193, Japan. Y. Hatanaka is with the Department of Electronic Systems Engineering, the University of Shiga Prefecture, Hikone 522-8533 , Japan. M. García and R. Hornero are with the Biomedical Engineering Group (GIB), University of Valladolid, 47002 Valladolid, Spain. C. Sánchez was with the Biomedical Engineering Group (GIB), University of Valladolid, 47002 Valladolid, Spain. She is now with the Image Sciences Institute, 3584 CX Utrecht, The Netherlands. A. Mayo is with the Department of Statistics and Operative Investigation, University of Valladolid, 47002 Valladolid, Spain. G. Quellec was with the Institut Telecom, 83818 Brest, France and with In- serm U650, 29609 Brest, France. He is now with the Department of Ophthal- mology and Visual Sciences and the Department of Biomedical Engineering, University of Iowa, Iowa City, IA 52242 USA. G. Cazuguel and Christian Roux are with Institut Telecom, 83818 Brest, France, and with Inserm U650, 29609 Brest, France. M. Lamard and B. Cochener are with the University of Bretagne Occidentale, 29238 Brest, France, and with Inserm, U650, 29609 Brest, France. M. Cree is with the Department of Engineering, University of Waikato, Hamilton 3240, New Zealand. B. Zhang and F.Karray are with the Department of Electrical and Computer Engineering, University of Waterloo, Waterloo, N2L 3G1 ON Canada. X. Wu is with the School of Computer Science and Technology, Harbin In- stitute of Technology, Harbin 150001, China. J. You and Q. Li are with the Department of Computing, Hong Kong Poly- technic University, Hong Kong. M. Abràmoff is with the University of Iowa Hospitals and Clinics, Depart- ment of Ophthalmology and Visual Sciences, Iowa City, IA 52242 USA and the University of Iowa, Department of Electrical and Computer Engineering, Iowa City, IA 52242 USA. Digital Object Identifier 10.1109/TMI.2009.2033909 the context of the Retinopathy Online Challenge (ROC), a multi- year online competition for various aspects of DR detection. For this competition, we compare the results of five different methods, produced by five different teams of researchers on the same set of data. The evaluation was performed in a uniform manner using an algorithm presented in this work. The set of data used for the competition consisted of 50 training images with available refer- ence standard and 50 test images where the reference standard was witheld by the organizers (M. Niemeijer, B. van Ginneken, and M. D. Abràmoff). The results obtained on the test data was submitted through a website after which standardized evaluation software was used to determine the performance of each of the methods. A human expert detected microaneurysms in the test set to allow comparison with the performance of the automatic methods. The overall results show that microaneurysm detection is a challenging task for both the automatic methods as well as the human expert. There is room for improvement as the best performing system does not reach the performance of the human expert. The data associated with the ROC microaneurysm detec- tion competition will remain publicly available and the website will continue accepting submissions. Index Terms—Computer aided detection, computer aided diagnosis, diabetic retinopathy, fundus photographs, retina, Retinopathy Online Challenge (ROC) competition. I. INTRODUCTION D IABETIC RETINOPATHY (DR) is a frequent microvas- cular complication of diabetes and the most common cause of blindness and vision loss in the working population of the western world [1]. It has been shown that early detection of DR helps prevent blindness and visual loss [2]. Most screening programs use nonmydriatic digital color fundus cameras to ac- quire color photographs of the back of the eye, the retina. These photographs are then examined for the presence of lesions indicative of DR (including microaneurysms, hemorrhages, exudates and cottonwool spots). Development of systems to automate DR screening have re- ceived a lot of attention from the research community. Recently two large studies of automated screening systems have appeared in the literature [3], [4]. These systems are designed to perform triage in an automated fashion. The software stores those exams that, after analysis, appear to have no visible signs of the pres- ence of diabetic retinopathy at some level of severity. The other exams, that possibly contain diabetic retinopathy related lesions 0278-0062/$26.00 © 2010 IEEE
-
Upload
independent -
Category
Documents
-
view
1 -
download
0
Transcript of Retinopathy Online Challenge: Automatic Detection of Microaneurysms in Digital Color Fundus...

IEEE TRANSACTIONS ON MEDICAL IMAGING, VOL. 29, NO. 1, JANUARY 2010 185
Retinopathy Online Challenge: AutomaticDetection of Microaneurysms in Digital
Color Fundus PhotographsMeindert Niemeijer*, Bram van Ginneken, Member, IEEE, Michael J. Cree, Senior Member, IEEE,
Atsushi Mizutani, Gwénolé Quellec, Clara I. Sánchez, Member, IEEE, Bob Zhang,Roberto Hornero, Member, IEEE, Mathieu Lamard, Chisako Muramatsu, Xiangqian Wu,
Guy Cazuguel, Member, IEEE, Jane You, Agustín Mayo, Qin Li, Yuji Hatanaka, Béatrice Cochener,Christian Roux, Senior Member, IEEE, Fakhri Karray, María García, Student Member, IEEE,
Hiroshi Fujita, Member, IEEE, and Michael D. Abràmoff, Member, IEEE
Abstract—The detection of microaneurysms in digital colorfundus photographs is a critical first step in automated screeningfor diabetic retinopathy (DR), a common complication of diabetes.To accomplish this detection numerous methods have been pub-lished in the past but none of these was compared with each otheron the same data. In this work we present the results of the firstinternational microaneurysm detection competition, organized in
Manuscript received August 04, 2009; revised September 29, 2009; acceptedSeptember 30, 2009. First published October 09, 2009; current version pub-lished January 04, 2010. This work was supported in part by the National EyeInstitute (R01 EY017066), in part by the Netherlands Organization for Scien-tific Research (NWO), and in part by Research to Prevent Blindness. Asteriskindicates corresponding author.
*M. Niemeijer was with the Department of Electrical and Computer Engi-neering and the Department of Ophthalmology and Visual Sciences, Universityof Iowa, Iowa City, IA 52242 USA. He is now with the Image Sciences Institute,Utrecht, 3584 CX Utrecht, Netherlands. (e-mail: [email protected]).
B. van Ginneken is with the Image Sciences Institute, 3584 CX Utrecht, TheNetherlands.
H. Fujita, C. Muramatsu, and A. Mizutani are with the Department of Intel-ligent Image Information, Graduate School of Medicine, Gifu University, Gifu501-1193, Japan.
Y. Hatanaka is with the Department of Electronic Systems Engineering, theUniversity of Shiga Prefecture, Hikone 522-8533 , Japan.
M. García and R. Hornero are with the Biomedical Engineering Group (GIB),University of Valladolid, 47002 Valladolid, Spain.
C. Sánchez was with the Biomedical Engineering Group (GIB), Universityof Valladolid, 47002 Valladolid, Spain. She is now with the Image SciencesInstitute, 3584 CX Utrecht, The Netherlands.
A. Mayo is with the Department of Statistics and Operative Investigation,University of Valladolid, 47002 Valladolid, Spain.
G. Quellec was with the Institut Telecom, 83818 Brest, France and with In-serm U650, 29609 Brest, France. He is now with the Department of Ophthal-mology and Visual Sciences and the Department of Biomedical Engineering,University of Iowa, Iowa City, IA 52242 USA.
G. Cazuguel and Christian Roux are with Institut Telecom, 83818 Brest,France, and with Inserm U650, 29609 Brest, France.
M. Lamard and B. Cochener are with the University of Bretagne Occidentale,29238 Brest, France, and with Inserm, U650, 29609 Brest, France.
M. Cree is with the Department of Engineering, University of Waikato,Hamilton 3240, New Zealand.
B. Zhang and F.Karray are with the Department of Electrical and ComputerEngineering, University of Waterloo, Waterloo, N2L 3G1 ON Canada.
X. Wu is with the School of Computer Science and Technology, Harbin In-stitute of Technology, Harbin 150001, China.
J. You and Q. Li are with the Department of Computing, Hong Kong Poly-technic University, Hong Kong.
M. Abràmoff is with the University of Iowa Hospitals and Clinics, Depart-ment of Ophthalmology and Visual Sciences, Iowa City, IA 52242 USA and theUniversity of Iowa, Department of Electrical and Computer Engineering, IowaCity, IA 52242 USA.
Digital Object Identifier 10.1109/TMI.2009.2033909
the context of the Retinopathy Online Challenge (ROC), a multi-year online competition for various aspects of DR detection. Forthis competition, we compare the results of five different methods,produced by five different teams of researchers on the same set ofdata. The evaluation was performed in a uniform manner usingan algorithm presented in this work. The set of data used for thecompetition consisted of 50 training images with available refer-ence standard and 50 test images where the reference standardwas witheld by the organizers (M. Niemeijer, B. van Ginneken,and M. D. Abràmoff). The results obtained on the test data wassubmitted through a website after which standardized evaluationsoftware was used to determine the performance of each of themethods. A human expert detected microaneurysms in the testset to allow comparison with the performance of the automaticmethods. The overall results show that microaneurysm detectionis a challenging task for both the automatic methods as well asthe human expert. There is room for improvement as the bestperforming system does not reach the performance of the humanexpert. The data associated with the ROC microaneurysm detec-tion competition will remain publicly available and the websitewill continue accepting submissions.
Index Terms—Computer aided detection, computer aideddiagnosis, diabetic retinopathy, fundus photographs, retina,Retinopathy Online Challenge (ROC) competition.
I. INTRODUCTION
D IABETIC RETINOPATHY (DR) is a frequent microvas-cular complication of diabetes and the most common
cause of blindness and vision loss in the working population ofthe western world [1]. It has been shown that early detection ofDR helps prevent blindness and visual loss [2]. Most screeningprograms use nonmydriatic digital color fundus cameras to ac-quire color photographs of the back of the eye, the retina. Thesephotographs are then examined for the presence of lesionsindicative of DR (including microaneurysms, hemorrhages,exudates and cottonwool spots).
Development of systems to automate DR screening have re-ceived a lot of attention from the research community. Recentlytwo large studies of automated screening systems have appearedin the literature [3], [4]. These systems are designed to performtriage in an automated fashion. The software stores those examsthat, after analysis, appear to have no visible signs of the pres-ence of diabetic retinopathy at some level of severity. The otherexams, that possibly contain diabetic retinopathy related lesions
0278-0062/$26.00 © 2010 IEEE
186 IEEE TRANSACTIONS ON MEDICAL IMAGING, VOL. 29, NO. 1, JANUARY 2010
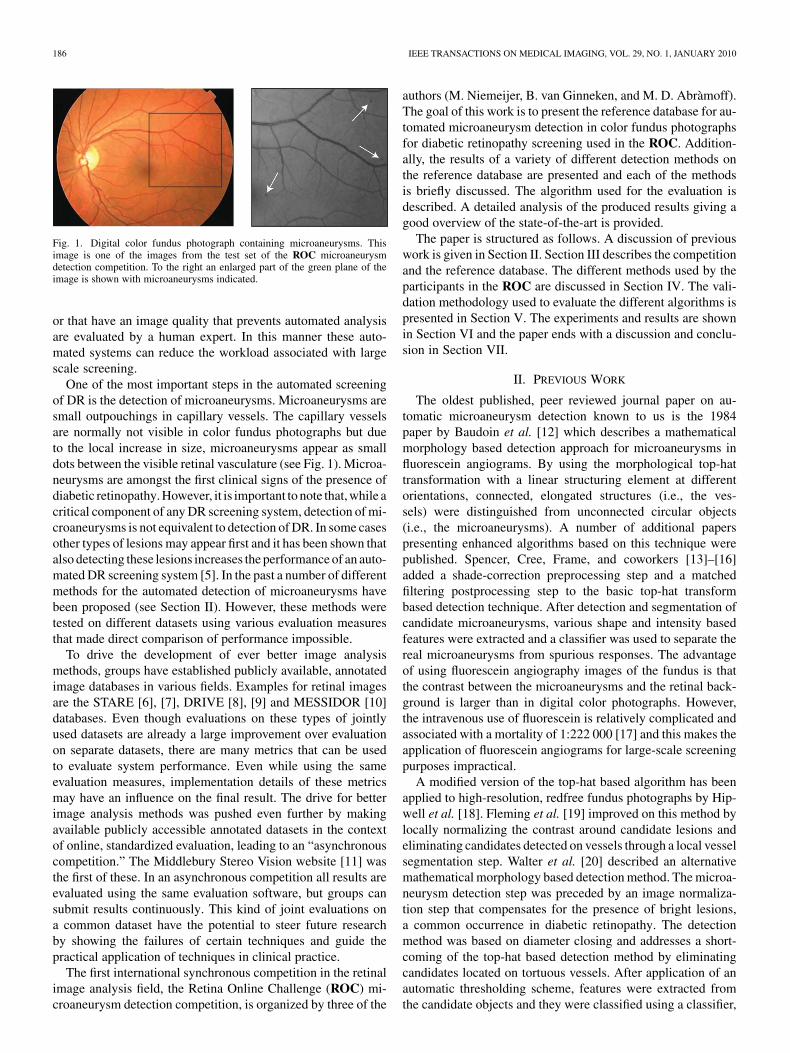
Fig. 1. Digital color fundus photograph containing microaneurysms. Thisimage is one of the images from the test set of the ROC microaneurysmdetection competition. To the right an enlarged part of the green plane of theimage is shown with microaneurysms indicated.
or that have an image quality that prevents automated analysisare evaluated by a human expert. In this manner these auto-mated systems can reduce the workload associated with largescale screening.
One of the most important steps in the automated screeningof DR is the detection of microaneurysms. Microaneurysms aresmall outpouchings in capillary vessels. The capillary vesselsare normally not visible in color fundus photographs but dueto the local increase in size, microaneurysms appear as smalldots between the visible retinal vasculature (see Fig. 1). Microa-neurysms are amongst the first clinical signs of the presence ofdiabetic retinopathy. However, it is important to note that, while acritical component of any DR screening system, detection of mi-croaneurysms is not equivalent to detection of DR. In some casesother types of lesions may appear first and it has been shown thatalso detecting these lesions increases the performance of an auto-mated DR screening system [5]. In the past a number of differentmethods for the automated detection of microaneurysms havebeen proposed (see Section II). However, these methods weretested on different datasets using various evaluation measuresthat made direct comparison of performance impossible.
To drive the development of ever better image analysismethods, groups have established publicly available, annotatedimage databases in various fields. Examples for retinal imagesare the STARE [6], [7], DRIVE [8], [9] and MESSIDOR [10]databases. Even though evaluations on these types of jointlyused datasets are already a large improvement over evaluationon separate datasets, there are many metrics that can be usedto evaluate system performance. Even while using the sameevaluation measures, implementation details of these metricsmay have an influence on the final result. The drive for betterimage analysis methods was pushed even further by makingavailable publicly accessible annotated datasets in the contextof online, standardized evaluation, leading to an “asynchronouscompetition.” The Middlebury Stereo Vision website [11] wasthe first of these. In an asynchronous competition all results areevaluated using the same evaluation software, but groups cansubmit results continuously. This kind of joint evaluations ona common dataset have the potential to steer future researchby showing the failures of certain techniques and guide thepractical application of techniques in clinical practice.
The first international synchronous competition in the retinalimage analysis field, the Retina Online Challenge (ROC) mi-croaneurysm detection competition, is organized by three of the
authors (M. Niemeijer, B. van Ginneken, and M. D. Abràmoff).The goal of this work is to present the reference database for au-tomated microaneurysm detection in color fundus photographsfor diabetic retinopathy screening used in the ROC. Addition-ally, the results of a variety of different detection methods onthe reference database are presented and each of the methodsis briefly discussed. The algorithm used for the evaluation isdescribed. A detailed analysis of the produced results giving agood overview of the state-of-the-art is provided.
The paper is structured as follows. A discussion of previouswork is given in Section II. Section III describes the competitionand the reference database. The different methods used by theparticipants in the ROC are discussed in Section IV. The vali-dation methodology used to evaluate the different algorithms ispresented in Section V. The experiments and results are shownin Section VI and the paper ends with a discussion and conclu-sion in Section VII.
II. PREVIOUS WORK
The oldest published, peer reviewed journal paper on au-tomatic microaneurysm detection known to us is the 1984paper by Baudoin et al. [12] which describes a mathematicalmorphology based detection approach for microaneurysms influorescein angiograms. By using the morphological top-hattransformation with a linear structuring element at differentorientations, connected, elongated structures (i.e., the ves-sels) were distinguished from unconnected circular objects(i.e., the microaneurysms). A number of additional paperspresenting enhanced algorithms based on this technique werepublished. Spencer, Cree, Frame, and coworkers [13]–[16]added a shade-correction preprocessing step and a matchedfiltering postprocessing step to the basic top-hat transformbased detection technique. After detection and segmentation ofcandidate microaneurysms, various shape and intensity basedfeatures were extracted and a classifier was used to separate thereal microaneurysms from spurious responses. The advantageof using fluorescein angiography images of the fundus is thatthe contrast between the microaneurysms and the retinal back-ground is larger than in digital color photographs. However,the intravenous use of fluorescein is relatively complicated andassociated with a mortality of 1:222 000 [17] and this makes theapplication of fluorescein angiograms for large-scale screeningpurposes impractical.
A modified version of the top-hat based algorithm has beenapplied to high-resolution, redfree fundus photographs by Hip-well et al. [18]. Fleming et al. [19] improved on this method bylocally normalizing the contrast around candidate lesions andeliminating candidates detected on vessels through a local vesselsegmentation step. Walter et al. [20] described an alternativemathematical morphology based detection method. The microa-neurysm detection step was preceded by an image normaliza-tion step that compensates for the presence of bright lesions,a common occurrence in diabetic retinopathy. The detectionmethod was based on diameter closing and addresses a short-coming of the top-hat based detection method by eliminatingcandidates located on tortuous vessels. After application of anautomatic thresholding scheme, features were extracted fromthe candidate objects and they were classified using a classifier,

NIEMEIJER et al.: RETINOPATHY ONLINE CHALLENGE: AUTOMATIC DETECTION OF MICROANEURYSMS 187
TABLE IDIFFERENT TYPES OF IMAGES IN THE ROC DATASET
that was first trained with example candidates from a trainingset.
Niemeijer et al. [21] presented a hybrid scheme that usedboth the top-hat based method as well as a supervised pixelclassification based method to detect the microaneurysm can-didates in color fundus photographs. The pixel classificationmethod was trained using example pixels from both the vascula-ture and “red lesions” (i.e., microaneurysms and hemorrhages).After training, the detector would detect all retinal vessel andred lesion pixels in an image. After eliminating all connected,elongated structures the remaining objects were considered can-didate microaneurysms. This method allowed for the detectionof larger “red lesions” (i.e., hemorrhages) in addition to themicroaneurysms using the same system. A large set of addi-tional features, including color, was added to those described in[15], [16]. A classifier, trained with example candidates from atraining set, distinguished between real and spurious candidatelesions.
A number of other approaches, not based on mathematicalmorphology, for the detection of red lesions in color fundus pho-tographs have also been described. Sinthanayothin et al. [22]applied a recursive region growing procedure that segmentedboth the vessels and red lesions in a fundus image. To detect thevessels and vessel segments in this result a neural network wasused. Any remaining objects after removal of the detected vas-culature were identified as microaneurysms. In a recent work,Quellec et al. [23] described a supervised microaneurysm detec-tion method based on template matching in wavelet-subbands.In the training phase the optimal adapted wavelet transform fordetecting microaneurysms was found using the lifting schemeframework. Template matching in the wavelet domain was usedto detect likely locations of microaneurysms. By applying athreshold on the matching result the microaneurysms are found.
None of the above methods was compared on the samedataset. The most common way of reporting algorithm per-formance was free-response receiver operating characteristic(FROC) analysis [24] on a per lesion basis [14], [15], [18]–[21].In FROC analysis the sensitivity of the system is plotted againstthe average number of false positive detections per image.Additionally, a number of papers reported the result of anreceiver operating characteristic (ROC) analysis [25] on a perimage basis [18], [19], [21]. In ROC analysis, the true positiverate is plotted against the false positive rate.
III. RETINAL ONLINE CHALLENGE: MICROANEURYSM
DETECTION
We established the Retinal Online Challenge (ROC). Thegoal of ROC is to organize several competitions, focussed onvarious important challenges in automated detection of retinaldisease. The first competition was focused on microaneurysm
detection because microaneurysm detection is a critical chal-lenge for automated diabetic retinopathy screening. This firstROC was structured as follows: the ROC was announced inFebruary 2008 and the image data was made available onlineat the same time. The training data included a multireader ref-erence standard and was meant for training and preliminarytesting of the participant’s methods. Of the test data only theimages were made available; the reference standard was keptprivate. The main reason for structuring the competition like thisis to prevent the use of the reference standard of the test set inthe training process and to keep the evaluation fair.
A. Reference Image Database
A set of 100 digital color fundus photographs was selectedby the first author (M. Niemeijer) from a large dataset (150 000images) as acquired in a diabetic retinopathy screening program[26]. The inclusion criteria were that the screening programophthalmologists had marked the image as containing microa-neurysms and had not marked it as ungradable. Since multiplescreening sites, with different camera types, are involved in thescreening program, the images in the ROC set are relatively het-erogeneous. Three different types of images with different res-olutions are present in the dataset (type I to III, see Table I). Theimages were captured using either a Topcon NW 100, a TopconNW 200, or a Canon CR5-45NM and this resulted in two differ-ently shaped FOVs. An example of all types of images is shownin Fig. 2. All images were in JPEG format and compression wasset in the camera. The substantial black background around theFOV present in the original type II and III images was cut offusing software that can perform certain image processing oper-ations on JPEG images without recompressing them. This com-plete set was randomly split into a training and a test set eachcontaining 50 images.
B. Reference Standard
Four retinal experts, all from the Department of Ophthal-mology at the University of Iowa, were asked to annotate all mi-croaneurysms and all irrelevant lesions in all 100 images in thetest and training set. The class of irrelevant lesions was specifi-cally added to address the problem that there may be objects inthe image that are not microaneurysms but that may be picked upas such by an automated program. As these objects are similarin appearance to microaneurysms these detections are not realfalse positives (examples of these types of objects include hem-orrhages and pigment spots). Irrelevant objects are not includedin the reference standard and detections on these objects in thetest set were not counted as a false positive. The TruthseekerJprogram (available on the ROC website) for online annotation
1http://roc.healthcare.uiowa.edu

188 IEEE TRANSACTIONS ON MEDICAL IMAGING, VOL. 29, NO. 1, JANUARY 2010
Fig. 2. Representative example images of the three types of images (see Table I) present in the training and test set of the ROC microaneurysm detection compe-tition. (a) Type I. (b) Type II. (c) Type III. Note that the images (b) and (c) shown here were preprocessed by removing a large part of the black image backgroundaround the FOV. All images have been scaled to equal height for display.
Fig. 3. Examples of the different categories of microaneurysms as indicated by the expert. Both images in a column are in the same category. (a) Subtle. (b)Regular. (c) Obvious. (d) Close to the vasculature.
was used to indicate the center location of the microaneurysm orirrelevant lesion in each image. The annotations were exportedas a file in XML format that contained the center locations forall microaneurysms and irrelevant lesions in each image in theset.
1) Training Set: For the training set, a logical OR wasused to combine the lesion locations annotated by the fourexperts—thus ensuring that the reference dataset was highlysensitive to lesions, as it required only one retinal expert todetect a lesion for it to be marked as a “microaneurysm.”
2) Test Set: To compare with a human observer, the way inwhich the reference standard for the test set was determined waschanged from the way this was done for the training set. One ofthe four retinal experts was randomly selected and his annota-tions were not used in determining the reference standard forthe test set. This expert’s performance is shown in the results asthe human expert. The annotations of the remaining three retinalexperts were combined into the final reference standard. All le-sions for which at least two experts assigned the label “microa-
neurysm” were assigned this label in the final reference stan-dard for the test set. All other lesions marked by only one ex-pert were assigned the label “irrelevant.” In total 1614 objectswere marked in the test set, of which 343 objects were assignedthe label “microaneurysm.” In the final set there were 10 imagesthat did not contain any microaneurysms; they did contain “ir-relevant” lesions.
3) Subdivision Into Lesion Categories: Microaneurysms areheterogeneous in their appearance (local contrast and color)and their location with respect to the normal anatomy on theretina. These factors can influence the ability of automateddetection systems to find them. We have asked an expert toassign each reference-standard identified microaneurysm in thetest set to one of three classes (i.e., subtle, regular, obvious)based on their local contrast and/or visibility in the image[see Fig. 3(a)–(c)]. Also, we asked the expert to indicate foreach lesion whether it was located “close” to the vasculature.“Close” was defined as less than or equal to the diameter ofthe lesion away from the vessel [Fig. 3(d)]. Many of the tested

NIEMEIJER et al.: RETINOPATHY ONLINE CHALLENGE: AUTOMATIC DETECTION OF MICROANEURYSMS 189
methods (see Section IV) rely on a vessel segmentation stepto eliminate false positive lesion detections on the vasculature.From the literature [21] we know this may lead to difficultiesin the detection of lesions located close to the vasculature. Ofthe 343 objects labeled as “microaneurysm” in the referencestandard 92 were labeled “subtle,” 192 were labeled “regular,”59 were labeled “obvious” and 37 of the 343 objects were closeto the vasculature.
IV. METHODS
The ROC dataset was downloaded by 26 groups and of these,6 groups sent in their results in time to be included in this work.Though the organizers (M. Niemeijer, B. van Ginneken, and M.D. Abràmoff) have also published an algorithm for “red lesion”detection [21], because of their obvious conflict of interest theydid not participate in this comparison. One group decided theydid not want their results to appear in this paper after they wereannounced. Below are short descriptions of each of the 5 re-maining methods. For each of the methods references to moredetailed information regarding the methods and techniques usedhave been provided.
A. Method 1: Valladolid [27]
In this method candidate detection is performed on the greenplane of the color image. The image is first resized so that thefield of view has a certain width and the image is normalizedby subtracting an estimate of the image background. The esti-mate is determined by median filtering the image using a largekernel. On the normalized image intensities, the candidate de-tection step is performed using an unsupervised mixture modelbased clustering method. The authors assume all pixels in theimage are part of one of three classes: class 1 (background ele-ments), class 2 (foreground elements, such as vessels, optic diskand lesions), and class 3 (outliers). A three class Gaussian mix-ture model is fit to the image intensities and a group of microa-neurysm candidates are segmented by thresholding the fittedmodel. Vessel segmentation is performed to remove those de-tected candidates that lie on the vasculature. Using logistic re-gression, a likelihood for each of the remaining microaneurysmcandidates is generated based on their color, shape and texturecharacteristics. The training data provided by the ROC was usedto train the system.
B. Method 2: Waikato [28]
The Waikato Microaneurysm Detector was designed to beuseful in an eye screening context; thus the reliable detectionand localisation of microaneurysms in a retinal image is not theprimary aim. This function is only useful in that it provides amechanism to detect diabetic retinopathy on the basis of pres-ence of microaneurysms. The algorithm used is a variant of themicroaneurysm detection algorithm developed by Spencer etal. [14] and extended/used by Cree et al. [15] for the detectionof microaneurysms in fluorescein angiographic images. For theWaikato Microaneurysm Detector the algorithm has been modi-fied to work on full-color retinal images. The green plane of theretinal images is used to find all candidate objects. After nor-malization by subtracting a median filtered version of the image,
noise is removed by median filtering using a small kernel. TheWaikato Microaneurysm Detector performs a top-hat transformby morphological reconstruction [29] using an elongated struc-turing element at different orientations which detects the vascu-lature. After removal of the vasculature and a microaneurysmmatched filtering step the candidate positions are found usingthresholding. Each of the candidates is segmented using regiongrowing. A number of features based on the color, intensity andshape of the candidates are extracted [30]. A Bayesian classifieris used to assign a likelihood to each of the found candidate ob-jects that it is a true microaneurysm. The ROC training data wasnot used, instead the system was trained using an independentset of images.
C. Method 3: Latim [23]
This method assumes that microaneurysms at a particularscale can be modeled with 2-D, rotation-symmetric generalizedGaussian functions. It then uses template matching in thewavelet domain to find the microaneurysm candidates. Thewavelet decomposition of an image produces several subim-ages of coefficients (called subbands), each of them containinginformation at a specific scale/frequency and along a specificdirection. These subbands contain either more or less relevantinformation to describe microaneurysms. By ignoring high-and low-frequency subbands, noise and slow image variationsare removed from the analysis. To perform template matchingin the wavelet domain the wavelet transform of the Gaussianmicroaneurysm model at several different standard deviationsis used. The wavelet transform of the model is restricted ina window which is moved across the image. The coefficientsof the wavelet transform of the model are compared to thecoefficients of the wavelet transform of the image. Locationsin the image where the difference is below a certain thresholdare designated as microaneurysm locations. The parameters ofthe matched model determine the size of the detected microa-neurysm. Each detected location is assigned a likelihood basedon the local difference in wavelet coefficients. In addition tothe method as described in [23] a vessel segmentation stepbased on wavelet analysis of the image was added to eliminatecandidates on the vasculature specifically for the data used inthe ROC. The training data provided by the ROC was used totrain the system.
D. Method 4: Ok Medical [31]
To detect the microaneurysm candidates this method usesa multiscale Bayesian correlation filtering [32] approach. Inthis approach responses from a Gaussian filterbank are used toconstruct probabilistic models of an object and its surroundings.By matching the filterbank outputs in a new image with theconstructed (trained) models a correlation measure is obtained.When the responses of the correlation filtering are larger thana certain threshold, the detected locations are regarded ascandidate microaneurysm locations. An adaptive thresholdingscheme is applied to segment the vasculature and all candidateson the vasculature are removed. The candidate microaneurysmsare segmented using region growing and a large set of featuresbased on shape, grayscale/color pixel intensity, responses of

190 IEEE TRANSACTIONS ON MEDICAL IMAGING, VOL. 29, NO. 1, JANUARY 2010
Gaussian filter-banks and correlation coefficient values asdescribed in [21] are extracted from each candidate. The min-imum and maximum values of each feature for all true lesionsare placed in a discrimination table. This is used to remove anycandidates whose features are below the minimum or greaterthan the maximum defined in the discrimination table. Theremaining candidates after this stage are classified as true redlesions. To do a soft classification the maximum filter responsefor that particular lesion is used. The training data provided bythe ROC was used to train the system.
E. Method 5: Fujita Lab [33]
The algorithm starts by preprocessing the image. To reducedifferences in intensity and contrast between the images, bright-ness correction, gamma correction, and contrast enhancement[34] are applied. Further processing is performed exclusivelyon the green-plane of the color image. Images smaller than thelargest size image in the ROC dataset are resized using bicubicscaling. Initial microaneurysm detection is performed using amodified double ring filter. The original double ring filter [35]was designed to detect areas in the image in which the averagepixel value is lower than the average pixel value in the area sur-rounding it. Instead, the modified filter detects areas where theaverage pixel value in the surrounding area is lower by a certainfraction of the number of pixels under the filter in order to reducefalse positive detections on small capillaries. After the microa-neurysm detection step many false positive candidates on thevasculature remain. To remove these the vasculature is detectedusing an original double ring filter with different parameter set-tings. All candidates determined to lie on the vasculature areremoved. A region growing procedure is used to segment thedetected microaneurysm candidates. A set of 12 features is ex-tracted from each of the segmented candidate objects; these in-clude shape, intensity, color and contrast features. An artificialneural network was trained to distinguish the true lesions fromthe spurious detections. The training data provided by the ROCwas used to train the system.
V. VALIDATION
Each of the methods produced an XML file with the finaldetection results. The format of the XML file was defined bythe ROC organizers. For each of the findings in the completeset of findings three parameters were stored; its location, thelikelihood that the detected object was a microaneurysm aswell as the index of the image where was detected with
where is the complete test set and .For each finding in a match was made with the referencestandard to determine the algorithm performance. The referencestandard consisted of individual findings collected in a set(either irrelevant or true lesion findings, see Section III-B). Eachof the individual findings has three parameters; a location, aradius and the index of the image where it is located . Theradius is meant to reflect the approximate scale of the object asindicated by the experts that made the reference standard. Tomatch the algorithm results to the reference standard Algorithm1 was used.
Algorithm 1 ROC evaluation algorithm
Input: and .
Output: a paired set of sensitivities and false positiverates.
Select all unique values of and store them in set . Sortset in ascending order.
for to do
Select all findings in for which , whereis the -th element of , and store them in set .
for to do
Determine the reference standard finding atdistance , closest to in the same image.
if then
if true finding then
remove from .
end if
else
end if
end for
Calculate and outputwhere is the set of true microaneurysms in thereference standard.
Calculate and output .
Restore to include all original reference standardfindings.
end for
The output of the ROC evaluation algorithm is then used togenerate an FROC curve [24] that plots the sensitivity againstthe average number of false positive detection per image.To facilitate comparison between the different methods theFROC curve is summarized in a single number. This numberis based on the achieved sensitivity at a set of particular falsepositive per image rates. We have selected the following points:
, and 8. To obtain the final score thesensitivities at these specific points are averaged.
VI. EXPERIMENTS AND RESULTS
All the results received from the participants were analyzedusing the validation algorithm as outlined in Section V. This al-gorithm produced a set of FROC curves for each of the differentmethods. The different curves represent the performance of thealgorithm for various groups of microaneurysms (i.e., all, subtle,regular, obvious, and close to the vasculature). Fig. 4 shows the
NIEMEIJER et al.: RETINOPATHY ONLINE CHALLENGE: AUTOMATIC DETECTION OF MICROANEURYSMS 191
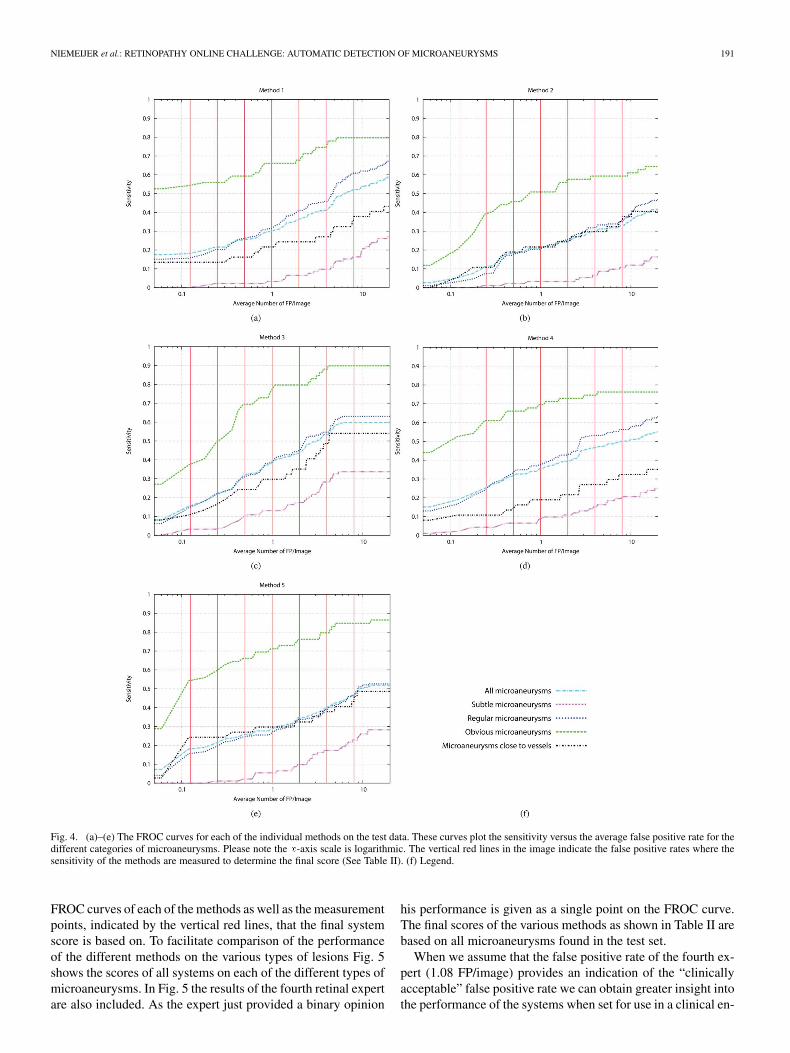
Fig. 4. (a)–(e) The FROC curves for each of the individual methods on the test data. These curves plot the sensitivity versus the average false positive rate for thedifferent categories of microaneurysms. Please note the �-axis scale is logarithmic. The vertical red lines in the image indicate the false positive rates where thesensitivity of the methods are measured to determine the final score (See Table II). (f) Legend.
FROC curves of each of the methods as well as the measurementpoints, indicated by the vertical red lines, that the final systemscore is based on. To facilitate comparison of the performanceof the different methods on the various types of lesions Fig. 5shows the scores of all systems on each of the different types ofmicroaneurysms. In Fig. 5 the results of the fourth retinal expertare also included. As the expert just provided a binary opinion
his performance is given as a single point on the FROC curve.The final scores of the various methods as shown in Table II arebased on all microaneurysms found in the test set.
When we assume that the false positive rate of the fourth ex-pert (1.08 FP/image) provides an indication of the “clinicallyacceptable” false positive rate we can obtain greater insight intothe performance of the systems when set for use in a clinical en-

192 IEEE TRANSACTIONS ON MEDICAL IMAGING, VOL. 29, NO. 1, JANUARY 2010
Fig. 5. (a)–(e) The FROC curves for each of the individual categories of microaneurysms. These curves plot the sensitivity versus the average false positive ratefor the different methods. Please note the �-axis scale is logarithmic. (f) Legend.
vironment. Table III shows the sensitivities of the systems at thisfalse positive rate for all different categories of microaneurysms,it also includes the rank of each method for each category.
VII. DISCUSSION AND CONCLUSION
A new publicly available database for microaneurysm detec-tion in digital retinal color photographs has been presented aswell as the results of five different microaneurysm detection
methods on this database. The competition website where thedatabase is available for download will remain open for newsubmissions and the goal of the ROC microaneurysm detectioncompetition image database is to be a reference database for fu-ture work on automatic microaneurysm detection.
When examining Fig. 4 two different performance behav-iors for the five methods can be distinguished; Method 1 and4 seem to have substantial performance differences between the

NIEMEIJER et al.: RETINOPATHY ONLINE CHALLENGE: AUTOMATIC DETECTION OF MICROANEURYSMS 193
TABLE IISENSITIVITIES OF THE DIFFERENT METHODS AT THE VARIOUS MEASUREMENT POINTS.
ALL MICROANEURYSMS FROM THE TEST SET ARE INCLUDED
TABLE IIISENSITIVITIES OF THE DIFFERENT METHODS AT THE AVERAGE FALSE POSITIVE
RATE OF THE HUMAN EXPERT (1.08 FP/IMAGE) FOR THE VARIOUS CATEGORIES
OF MICROANEURYSMS. THE RANKING OF THE METHODS FOR A PARTICULAR
CATEGORY IS GIVEN BETWEEN BRACKETS BEHIND THE SENSITIVITIES
different categories of microaneurysms while Method 2, 3, and5 have similar performance for “All,” “Regular” and “Close tovessels” microaneurysms with a large difference only betweenthe “Subtle” and “Obvious” categories. Both Method 1 and 4have a substantially lower performance on the microaneurysmsthat are close to vessels. The fact that a lesion is close to a vesselis independent from whether that lesion is in one of the other cat-egories (i.e., subtle, regular or obvious). Therefore, if a methodhas no trouble detecting lesions close to the vasculature, onewould expect a very similar performance to the complete setof microaneurysms. This is the case for Methods 2, 5, and to alesser extent 3, as shown in Fig. 4(b), (e), and (c), respectively.In case of Methods 1 and 3 this is most likely due to an overseg-mentation of the vasculature leading to the removal of microa-neurysms close to the vasculature.
From Fig. 5 the results of the various methods show that onlyfor the microaneurysms marked “subtle” and “obvious” doesthe best performing computer method approach the human ex-pert. For every other category of microaneurysms as well as forall microaneurysms the human expert is well ahead of the com-puter methods. This shows there is still room for improvementin the automatic system performance. The performance of thehuman observer also indicates the difficulty of the task. For thelesions labeled as “subtle” the observer achieved less than 0.20sensitivity. This also may indicate that this particular expert mayhave been less sensitive than some of the other experts involvedin making the reference standard. This is also indicated by thenumber of false positive detections the expert generated whichwas also small.
The method with the highest final score, Method 3, out-performs the other methods in all categories especially whenlooking at the area under the FROC curve between 0 and 8FP per image. For the “regular” and “overall” sets of microa-neurysms the difference is limited but this particular methoddoes a good job detecting “subtle” microaneurysms as well asthose close to the vasculature. When examining the results ata “clinically acceptable” false positive rate (see Table III) the
ranking of the different methods for all microaneurysms is ex-actly the same as the one given by the final score. For the othercategories of microaneurysms Method 3 is also ranked numberone although it is a shared first place for those microaneurysmsthat are close to the vasculature.
We received feedback from several of the participants thatthe data used for the ROC was “difficult” due to the presence ofnoise, compression artifacts and the general image quality. Theimages were selected randomly out of a vast dataset of imagesof patients with diabetes, and we have not specifically selectedthese images (see Section III-A): this is the quality of datatypical in the screening project that provided the images used inthis study. The images have not been recompressed or alteredexcept in the way described in Section III-A after receptionfrom the screening sites. Another issue that made analysismore difficult was the fact that the data was heterogeneouswith different resolutions and cameras being used. The datawas also acquired without dilation of the pupil which alsoleads to greater variations in image quality, but is again aconsequence of the real world type of data as collected in thescreening program. It is important to point out that the resultsobtained by the different methods on the ROC data are likelynot indicative of the performance the method may achieve ondifferent, more homogeneous data (e.g., from a single camerausing the same resolution).
Although the final goal of these algorithms is early detec-tion of DR, this competition was only about detecting a spe-cific subset of all lesions that can occur in DR, namely microa-neurysms. Detecting microaneurysms is only a single, thoughessential, step in early detection of DR. DR detection systemsare evaluated on the overall presence of DR in the patient, notthe number of microaneurysms in a single image. Dependingon the level of DR that an automated system is required to de-tect (for example “referrable retinopathy,” or “more than min-imal retinopathy” [4]), researchers have used different thresh-olds on the number of microaneurysms in an image. Systemswith differing performance on microaneurysm detection mayhave better (or worse) performance on DR detection.
We have conducted an additional experiment to examine thecapability of the various systems to detect images containingsigns of DR by assuming the presence of DR is indicatedsolely by the presence of microaneurysms. In our experimentthe maximum likelihood lesion in the image (that is not irrele-vant) indicates likelihood of the whole image to contain signsof DR. Since the testing set contained just 10 images with onlyirrelevant objects (i.e., without microaneurysms) this experi-ment is biased, additionally the use of the maximum rule forlesion likelihood combination is likely not optimal. However,
194 IEEE TRANSACTIONS ON MEDICAL IMAGING, VOL. 29, NO. 1, JANUARY 2010
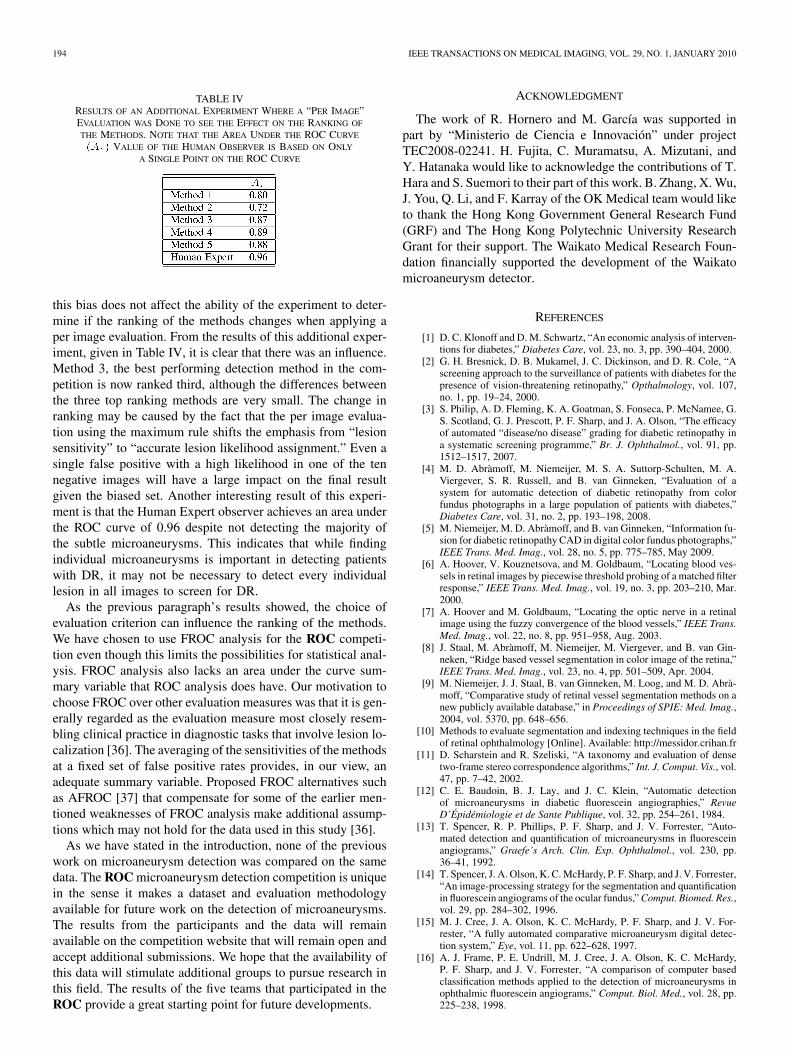
TABLE IVRESULTS OF AN ADDITIONAL EXPERIMENT WHERE A “PER IMAGE”EVALUATION WAS DONE TO SEE THE EFFECT ON THE RANKING OF
THE METHODS. NOTE THAT THE AREA UNDER THE ROC CURVE
�� � VALUE OF THE HUMAN OBSERVER IS BASED ON ONLY
A SINGLE POINT ON THE ROC CURVE
this bias does not affect the ability of the experiment to deter-mine if the ranking of the methods changes when applying aper image evaluation. From the results of this additional exper-iment, given in Table IV, it is clear that there was an influence.Method 3, the best performing detection method in the com-petition is now ranked third, although the differences betweenthe three top ranking methods are very small. The change inranking may be caused by the fact that the per image evalua-tion using the maximum rule shifts the emphasis from “lesionsensitivity” to “accurate lesion likelihood assignment.” Even asingle false positive with a high likelihood in one of the tennegative images will have a large impact on the final resultgiven the biased set. Another interesting result of this experi-ment is that the Human Expert observer achieves an area underthe ROC curve of 0.96 despite not detecting the majority ofthe subtle microaneurysms. This indicates that while findingindividual microaneurysms is important in detecting patientswith DR, it may not be necessary to detect every individuallesion in all images to screen for DR.
As the previous paragraph’s results showed, the choice ofevaluation criterion can influence the ranking of the methods.We have chosen to use FROC analysis for the ROC competi-tion even though this limits the possibilities for statistical anal-ysis. FROC analysis also lacks an area under the curve sum-mary variable that ROC analysis does have. Our motivation tochoose FROC over other evaluation measures was that it is gen-erally regarded as the evaluation measure most closely resem-bling clinical practice in diagnostic tasks that involve lesion lo-calization [36]. The averaging of the sensitivities of the methodsat a fixed set of false positive rates provides, in our view, anadequate summary variable. Proposed FROC alternatives suchas AFROC [37] that compensate for some of the earlier men-tioned weaknesses of FROC analysis make additional assump-tions which may not hold for the data used in this study [36].
As we have stated in the introduction, none of the previouswork on microaneurysm detection was compared on the samedata. The ROC microaneurysm detection competition is uniquein the sense it makes a dataset and evaluation methodologyavailable for future work on the detection of microaneurysms.The results from the participants and the data will remainavailable on the competition website that will remain open andaccept additional submissions. We hope that the availability ofthis data will stimulate additional groups to pursue research inthis field. The results of the five teams that participated in theROC provide a great starting point for future developments.
ACKNOWLEDGMENT
The work of R. Hornero and M. García was supported inpart by “Ministerio de Ciencia e Innovación” under projectTEC2008-02241. H. Fujita, C. Muramatsu, A. Mizutani, andY. Hatanaka would like to acknowledge the contributions of T.Hara and S. Suemori to their part of this work. B. Zhang, X. Wu,J. You, Q. Li, and F. Karray of the OK Medical team would liketo thank the Hong Kong Government General Research Fund(GRF) and The Hong Kong Polytechnic University ResearchGrant for their support. The Waikato Medical Research Foun-dation financially supported the development of the Waikatomicroaneurysm detector.
REFERENCES
[1] D. C. Klonoff and D. M. Schwartz, “An economic analysis of interven-tions for diabetes,” Diabetes Care, vol. 23, no. 3, pp. 390–404, 2000.
[2] G. H. Bresnick, D. B. Mukamel, J. C. Dickinson, and D. R. Cole, “Ascreening approach to the surveillance of patients with diabetes for thepresence of vision-threatening retinopathy,” Opthalmology, vol. 107,no. 1, pp. 19–24, 2000.
[3] S. Philip, A. D. Fleming, K. A. Goatman, S. Fonseca, P. McNamee, G.S. Scotland, G. J. Prescott, P. F. Sharp, and J. A. Olson, “The efficacyof automated “disease/no disease” grading for diabetic retinopathy ina systematic screening programme,” Br. J. Ophthalmol., vol. 91, pp.1512–1517, 2007.
[4] M. D. Abràmoff, M. Niemeijer, M. S. A. Suttorp-Schulten, M. A.Viergever, S. R. Russell, and B. van Ginneken, “Evaluation of asystem for automatic detection of diabetic retinopathy from colorfundus photographs in a large population of patients with diabetes,”Diabetes Care, vol. 31, no. 2, pp. 193–198, 2008.
[5] M. Niemeijer, M. D. Abràmoff, and B. van Ginneken, “Information fu-sion for diabetic retinopathy CAD in digital color fundus photographs,”IEEE Trans. Med. Imag., vol. 28, no. 5, pp. 775–785, May 2009.
[6] A. Hoover, V. Kouznetsova, and M. Goldbaum, “Locating blood ves-sels in retinal images by piecewise threshold probing of a matched filterresponse,” IEEE Trans. Med. Imag., vol. 19, no. 3, pp. 203–210, Mar.2000.
[7] A. Hoover and M. Goldbaum, “Locating the optic nerve in a retinalimage using the fuzzy convergence of the blood vessels,” IEEE Trans.Med. Imag., vol. 22, no. 8, pp. 951–958, Aug. 2003.
[8] J. Staal, M. Abràmoff, M. Niemeijer, M. Viergever, and B. van Gin-neken, “Ridge based vessel segmentation in color image of the retina,”IEEE Trans. Med. Imag., vol. 23, no. 4, pp. 501–509, Apr. 2004.
[9] M. Niemeijer, J. J. Staal, B. van Ginneken, M. Loog, and M. D. Abrà-moff, “Comparative study of retinal vessel segmentation methods on anew publicly available database,” in Proceedings of SPIE: Med. Imag.,2004, vol. 5370, pp. 648–656.
[10] Methods to evaluate segmentation and indexing techniques in the fieldof retinal ophthalmology [Online]. Available: http://messidor.crihan.fr
[11] D. Scharstein and R. Szeliski, “A taxonomy and evaluation of densetwo-frame stereo correspondence algorithms,” Int. J. Comput. Vis., vol.47, pp. 7–42, 2002.
[12] C. E. Baudoin, B. J. Lay, and J. C. Klein, “Automatic detectionof microaneurysms in diabetic fluorescein angiographies,” RevueD’Épidémiologie et de Sante Publique, vol. 32, pp. 254–261, 1984.
[13] T. Spencer, R. P. Phillips, P. F. Sharp, and J. V. Forrester, “Auto-mated detection and quantification of microaneurysms in fluoresceinangiograms,” Graefe’s Arch. Clin. Exp. Ophthalmol., vol. 230, pp.36–41, 1992.
[14] T. Spencer, J. A. Olson, K. C. McHardy, P. F. Sharp, and J. V. Forrester,“An image-processing strategy for the segmentation and quantificationin fluorescein angiograms of the ocular fundus,” Comput. Biomed. Res.,vol. 29, pp. 284–302, 1996.
[15] M. J. Cree, J. A. Olson, K. C. McHardy, P. F. Sharp, and J. V. For-rester, “A fully automated comparative microaneurysm digital detec-tion system,” Eye, vol. 11, pp. 622–628, 1997.
[16] A. J. Frame, P. E. Undrill, M. J. Cree, J. A. Olson, K. C. McHardy,P. F. Sharp, and J. V. Forrester, “A comparison of computer basedclassification methods applied to the detection of microaneurysms inophthalmic fluorescein angiograms,” Comput. Biol. Med., vol. 28, pp.225–238, 1998.

NIEMEIJER et al.: RETINOPATHY ONLINE CHALLENGE: AUTOMATIC DETECTION OF MICROANEURYSMS 195
[17] L. Yannuzzi, K. Rohrer, and L. Tindel, “Fluorescein angiography com-plication survey,” Ophthalmology, vol. 93, pp. 611–617, 1986.
[18] J. H. Hipwell, F. Strachant, J. A. Olson, K. C. McHardy, P. F. Sharp,and J. V. Forrester, “Automated detection of microaneurysms in digitalred-free photographs: A diabetic retinopathy screening tool,” DiabeticMed., vol. 17, pp. 588–594, 2000.
[19] A. D. Fleming, S. Philip, K. A. Goatman, J. A. Olson, and P. F. Sharp,“Automated microaneurysm detection using local contrast normaliza-tion and local vessel detection,” IEEE Trans. Med. Imag., vol. 25, no.9, pp. 1223–1232, Sep. 2006.
[20] T. Walter, P. Massin, A. Erginay, R. Ordonez, C. Jeulin, and J.-C.Klein, “Automatic detection of microaneurysms in color fundus im-ages,” Med. Image Anal., vol. 11, no. 6, pp. 555–566, 2007.
[21] M. Niemeijer, B. van Ginneken, J. Staal, M. S. A. Suttorp-Schulten,and M. D. Abràmoff, “Automatic detection of red lesions in digitalcolor fundus photographs,” IEEE Trans. Med. Imag., vol. 24, no. 5, pp.584–592, May 2005.
[22] C. Sinthanayothin, J. F. Boyce, T. H. Williamson, H. L. Cook, E.Mensah, S. Lal, and D. Usher, “Automated detection of diabeticretinopathy on digital fundus images,” Diabetic Med., vol. 19, pp.105–112, 2002.
[23] G. Quellec, M. Lamard, P. M. Josselin, G. Cazuguel, B. Cochener,and C. Roux, “Optimal wavelet transform for the detection of microa-neurysms in retina photographs,” IEEE Trans. Med. Imag., vol. 27, no.9, pp. 1230–1241, Sep. 2008.
[24] P. Bunch, J. Hamilton, G. Sanderson, and A. Simmons, “A freeresponse approach to the measurement and characterization of radio-graphic-observer performance,” J. Appl. Photogr. Eng0, vol. 4, pp.166–172, 1978.
[25] C. E. Metz, “ROC methodology in radiologic imaging,” InvestigativeRadiology, vol. 21, no. 9, pp. 720–733, 1986.
[26] M. D. Abràmoff and M. S. A. Suttorp-Schulten, “Web-based screeningfor diabetic retinopathy in a primary care population: The EyeCheckproject,” Telemedicine e-Health, vol. 11, no. 6, pp. 668–674, 2005.
[27] C. I. Sánchez, R. Hornero, A. Mayo, and M. García, “Mixture model-based clustering and logistic regression for automatic detection of mi-croaneurysms in retinal images,” in SPIE Medical Imaging 2009: Com-puter-Aided Diagnosis, N. Karssemeijer and M. L. Giger, Eds., 2009,vol. 7260, p. 72601M.
[28] M. J. Cree, The Waikato Microaneurysm Detector Univ. Waikato,Tech. Rep., 2008 [Online]. Available: http://roc.healthcare.uiowa.edu/results/documentation/waikato.pdf
[29] L. Vincent, “Morphological grayscale reconstruction in image analysis:Applications and efficient algorithms,” IEEE Trans. Image Process.,vol. 2, no. 2, pp. 176–201, Apr. 1993.
[30] M. J. Cree, E. Gamble, and D. Cornforth, “Colour normalisation roreduce inter-patient and intra-patient variablility in microaneurysm de-tection in colour retinal images,” in Proc. WDIC2005 ARPS WorkshopDigital Imag. Comput., 2005, pp. 163–168.
[31] B. Zhang, X. Wu, J. You, Q. Li, and F. Karray, “Hierarchical detectionof red lesions in retinal images by multiscale correlation filtering,” inSPIE Medical Imaging 2009: Computer-Aided Diagnosis, N. Karsse-meijer and M. L. Giger, Eds., 2009, vol. 7260, p. 72601L.
[32] S. B. Isard, J. Sullivan, A. Blake, M. Isard, and J. Maccormick,“Bayesian object localisation in images,” Int. J. Comput. Vis., vol. 44,no. 2, pp. 111–135, 2001.
[33] A. Mizutani, C. Muramatsu, Y. Hatanaka, S. Suemori, T. Hara, and H.Fujita, “Automated microaneurysm detection method based on doublering filter in retinal fundus images,” in SPIE Medical Imaging 2009:Computer-Aided Diagnosis, N. Karssemeijer and M. L. Giger, Eds.,2009, vol. 7260, no. 1, p. 72601N.
[34] Y. Hatanaka, T. Nakagawa, Y. Hayashi, M. Kakogawa, A. Sawada,K. Kawase, T. Hara, and H. Fujita, “Improvement of automatichemor-rhage detection methods using brightness correction on fundusimages,” in SPIE Medical Imaging 2008: Computer-Aided Diagnosis,M. L. Giger and N. Karssemeijer, Eds., 2008, vol. 6915, p. 69153E.
[35] Y. Hatanaka, T. Nakagawa, Y. Hayashi, A. Aoyama, X. Zhou, T. Hara,H. Fujita, Y. Mizukusa, A. Fujita, and M. Kakogawa, “Automated de-tection algorithm for arteriolar narrowing on fundus image,” in Proc.2005 IEEE Eng. Med. Biol. 27th Annu. Conf., 2005, pp. 286–289.
[36] P. M. DeLuca, Jr., A. Wambersie, and G. F. Whitmore, J. ICRU, vol.8, no. 1, pp. 31–35, 2008.
[37] D. P. Chakraborty and L. H. Winter, “Free-response methodology: Al-ternate analysis and a new observer-performance experiment.,” Radi-ology, vol. 174, no. 3, pp. 873–881, 1990.