Comparison of Statistical Methods for Identification of Streptococcus thermophilus, Enterococcus...
12
10.1128/AEM.67.5.2156-2166.2001. 2001, 67(5):2156. DOI: Appl. Environ. Microbiol. Salvatore Coppola and Eugenio Parente Giancarlo Moschetti, Giuseppe Blaiotta, Francesco Villani, Amplified Polymorphic DNA Patterns from Randomly Enterococcus faecium and Enterococcus faecalis, thermophilus, Streptococcus Identification of Comparison of Statistical Methods for http://aem.asm.org/content/67/5/2156 Updated information and services can be found at: These include: REFERENCES http://aem.asm.org/content/67/5/2156#ref-list-1 at: This article cites 28 articles, 11 of which can be accessed free CONTENT ALERTS more» articles cite this article), Receive: RSS Feeds, eTOCs, free email alerts (when new http://journals.asm.org/site/misc/reprints.xhtml Information about commercial reprint orders: http://journals.asm.org/site/subscriptions/ To subscribe to to another ASM Journal go to: on September 6, 2014 by guest http://aem.asm.org/ Downloaded from on September 6, 2014 by guest http://aem.asm.org/ Downloaded from
-
Upload
independent -
Category
Documents
-
view
0 -
download
0
Transcript of Comparison of Statistical Methods for Identification of Streptococcus thermophilus, Enterococcus...

10.1128/AEM.67.5.2156-2166.2001.
2001, 67(5):2156. DOI:Appl. Environ. Microbiol. Salvatore Coppola and Eugenio ParenteGiancarlo Moschetti, Giuseppe Blaiotta, Francesco Villani, Amplified Polymorphic DNA Patterns
from RandomlyEnterococcus faecium and Enterococcus faecalis, thermophilus,
StreptococcusIdentification ofComparison of Statistical Methods for
http://aem.asm.org/content/67/5/2156Updated information and services can be found at:
These include:
REFERENCEShttp://aem.asm.org/content/67/5/2156#ref-list-1at:
This article cites 28 articles, 11 of which can be accessed free
CONTENT ALERTS more»articles cite this article),
Receive: RSS Feeds, eTOCs, free email alerts (when new
http://journals.asm.org/site/misc/reprints.xhtmlInformation about commercial reprint orders: http://journals.asm.org/site/subscriptions/To subscribe to to another ASM Journal go to:
on Septem
ber 6, 2014 by guesthttp://aem
.asm.org/
Dow
nloaded from
on Septem
ber 6, 2014 by guesthttp://aem
.asm.org/
Dow
nloaded from
APPLIED AND ENVIRONMENTAL MICROBIOLOGY,0099-2240/01/$04.0010 DOI: 10.1128/AEM.67.5.2156–2166.2001
May 2001, p. 2156–2166 Vol. 67, No. 5
Copyright © 2001, American Society for Microbiology. All Rights Reserved.
Comparison of Statistical Methods for Identification of Streptococcusthermophilus, Enterococcus faecalis, and Enterococcus faecium
from Randomly Amplified Polymorphic DNA PatternsGIANCARLO MOSCHETTI,1 GIUSEPPE BLAIOTTA,1 FRANCESCO VILLANI,1
SALVATORE COPPOLA,1 AND EUGENIO PARENTE2*
Dipartimento di Scienza degli Alimenti, Universita degli Studi di Napoli “Federico II,” 80055 Portici,1
and Dipartimento di Biologia, Difesa, e Biotecnologie Agro-Forestali, Universita degliStudi della Basilicata, 85100 Potenza,2 Italy
Received 29 September 2000/Accepted 18 February 2001
Thermophilic streptococci play an important role in the manufacture of many European cheeses, and a rapidand reliable method for their identification is needed. Randomly amplified polymorphic DNA (RAPD) PCR(RAPD-PCR) with two different primers coupled to hierarchical cluster analysis has proven to be a powerfultool for the classification and typing of Streptococcus thermophilus, Enterococcus faecium, and Enterococcus fae-calis (G. Moschetti, G. Blaiotta, M. Aponte, P. Catzeddu, F. Villani, P. Deiana, and S. Coppola, J. Appl. Micro-biol. 85:25–36, 1998). In order to develop a fast and inexpensive method for the identification of thermophilicstreptococci, RAPD-PCR patterns were generated with a single primer (XD9), and the results were analyzedusing artificial neural networks (Multilayer Perceptron, Radial Basis Function network, and Bayesian net-work) and multivariate statistical techniques (cluster analysis, linear discriminant analysis, and classificationtrees). Cluster analysis allowed the identification of S. thermophilus but not of enterococci. A Bayesian networkproved to be more effective than a Multilayer Perceptron or a Radial Basis Function network for the identifi-cation of S. thermophilus, E. faecium, and E. faecalis using simplified RAPD-PCR patterns (obtained by sum-ming the bands in selected areas of the patterns). The Bayesian network also significantly outperformed twomultivariate statistical techniques (linear discriminant analysis and classification trees) and proved to be less sen-sitive to the size of the training set and more robust in the response to patterns belonging to unknown species.
A large variety of genotypic and phenotypic methods arecurrently used for the identification and classification of mi-croorganisms (32). Many of these techniques generate complexpatterns whose interpretation for classification and identifica-tion purposes requires multivariate statistical techniques. Ran-domly amplified polymorphic DNA (RAPD) PCR (RAPD-PCR) is one of the most popular genotypic typing techniques.It was developed to reveal intra- and interspecific differences inbacterial genomes (33, 35), and since it can be performed notonly on purified DNA (35) but also on untreated (19) or lysedcells without DNA extraction (23), it can replace time-consum-ing restriction endonuclease analysis in strain typing and DNA-DNA hybridization techniques for species identification. Infact, RAPD-PCR has been used for the classification of avariety of food-borne microorganisms, including Saccharomy-ces spp. (21), Bacillus spp. (30), Lactococcus spp. (31), Lacto-bacillus spp. (3, 7, 28), Penicillium spp. (8), and Streptococcusand Enterococcus spp. (23).
Statistical treatment of RAPD-PCR patterns usually in-volves calculation of a similarity matrix and use of hierarchicalcluster analysis for grouping of the patterns. Similarity can becalculated using the formula of Nei and Li (24) when only thepresence or the absence of bands is scored (21, 23), whilePearson’s product-moment correlation coefficient is used when
both the position and the intensity of bands are measured withimage analysis software (3, 28, 31). Although unknown isolatescan be assigned to a species on the basis of their similarity toidentified strains, this approach is still more adequate for clas-sification than for identification (as defined in reference 29). Infact, the observed intraspecific similarity levels may be as lowas 40%, the metric and ultrametric conditions for best perfor-mance of hierarchical cluster analysis (9) are not necessarilymet, the calculation of similarity or distance measures andclustering must be repeated for the classification of new iso-lates, and the fuzzy nature of RAPD-PCR patterns (with theoccurrence of major and minor bands) may complicate theanalysis. Once a database of identified patterns is available,discriminant analysis (20) or regression and classification trees(CT) (4) may be used to assign unknown patterns to estab-lished groups (species).
In linear discriminant analysis (LDA), the linear functions(canonical variables) of the variables that provide the bestdiscrimination of cases in two or more predefined groups areestimated, and cases are attributed to the group for which theclassification function provides the highest value or, equiva-lently, to the group whose centroid is nearest. Canonical scores,Mahalanobis distances, and posterior probabilities are alsocalculated. Violation of the statistical assumptions often has aminor effect (20), making LDA a popular technique. CT are anappealing alternative to LDA. The data set is divided into aseries of branches using the value of a splitting variable at thenodes chosen to minimize a loss function; this procedure ef-fectively results in a dichotomic key for the identification of
* Corresponding author. Mailing address: Dipartimento di Biologia,Difesa, e Biotecnologie Agro-Forestali, Universita degli Studi dellaBasilicata, Campus di Macchia Romana, 85100 Potenza, Italy. Phone:39–0971-205561. Fax: 39–0971-205561. E-mail: [email protected].
2156
on Septem
ber 6, 2014 by guesthttp://aem
.asm.org/
Dow
nloaded from

cases. However, the efficiencies of both of these techniquesmay be reduced by violation of the underlying statistical as-sumptions and by the inadequacy of the database used to buildthe models.
Artificial neural networks (ANNs) are a valuable alternativeto multivariate statistical methods for the analysis of datastructures which are complex, nonlinear, fuzzy, probabilistic,and inconsistent (15). ANNs simulate in software the behaviorand properties of biological neural networks, such as the hu-man brain. An ANN is made of simple processing units, calledneurons (Fig. 1). Artificial neurons are linked in a variety ofarchitectures to other neurons by means of connections calledsynapses, making up a network. Neurons in the input layerreceive stimuli from the “external” environment, while neu-rons in the hidden and output layers receive their inputs fromother neurons and produce outputs by using the weighted sumof inputs as an argument for an activation function. The syn-aptic weights are adjusted during a training process using alearning algorithm. Thus, ANNs learn to perform their task byexperience, and their knowledge is stored in the synaptic
weights. The learning process can be supervised (i.e., each setof input signals is paired with the desired response duringtraining) or unsupervised (i.e., no response is paired to theinput patterns and the network is allowed to create its ownrepresentation of the data). After training is completed, ANNscan be used repeatedly to solve a given identification, classifi-cation, or prediction problem. Important properties of prop-erly designed and trained ANNs are as follows (15): (i) theirability to generalize, i.e., to provide reasonable outputs toinputs not seen before; (ii) their ability to process nonlinearproblems, due to the presence of multiple layers of neuronsand/or to the use of nonlinear activation functions; and (iii)their fault tolerance, i.e., their ability to produce reasonableoutputs even if inputs are degraded (for example, because ofmissing or inconsistent data).
Several types of supervised ANNs have been used for iden-tification problems. The most popular model is the MultilayerPerceptron (MLP) trained by a backpropagation algorithm,but a Radial Basis Function network (RBF) or a Bayesiannetwork (BN), which differ in architecture and/or in the train-
FIG. 1. (A) Schematic representation of an artificial neuron. The neuron is a simple processing unit connected to other neurons by synapses.A synaptic weight (wi) is associated with each synapsis. An output y is produced by using the weighted sum (z 5 Sxiwi) of its inputs (xi; x0 is fixed,and the product x0w0 is known as bias) as an argument of the activation function f(z). Different types of activation functions (nonlinear sigmoidfunctions as the logistic and hyperbolic tangent, but also threshold or linear functions) can be used. (B) Architecture of the ANNs used in this study.All types of networks used as an input the number of bands in selected molecular weight (in kilobases) intervals of the RAPD-PCR patterns andhad three output nodes, one for each of the three species to be identified (EFM, E. faecium; EFS, E. faecalis; and ST, S. thermophilus). Both theMLP and the BN had a hidden layer with five nodes and used hyperbolic tangent activation functions, but they differed in the algorithm used toiteratively adjust the synaptic weights during supervised training (see the text for details). The hidden layer of the RBF was made up of 25 centers.For each of these, the Euclidean distance between an input pattern and the center was used as an argument of a nonlinear radial basis function,and the result was passed to the output nodes, which in turn had a linear activation function. The number and coordinates of the centers in theinput space and the synaptic weights of the output neurons were adjusted during supervised training.
VOL. 67, 2001 RAPD-PCR IDENTIFICATION OF THERMOPHILIC STREPTOCOCCI 2157
on Septem
ber 6, 2014 by guesthttp://aem
.asm.org/
Dow
nloaded from

ing algorithm (Fig. 1), can also be used (15, 34; networks arediscussed in Neural Connection 2.0 User’s Guide, SPSS Inc.,Chicago, Ill.). Requirements (metric or statistical) on the inputdata for ANNs are less stringent than those for correspondingstatistical methods (regression analysis, discriminant analysis,cluster analysis, and so forth); continuous, categorical, andsymbolic data can be easily analyzed with supervised and/orunsupervised networks, which often prove to be superior toand more robust than conventional statistical or modeling ap-proaches (15).
ANNs have been successfully exploited for the identificationof microorganisms at the genus, species, or strain level usingcomplex patterns, such as restriction patterns (5), whole-cellprotein analysis (12), signature lipid biomarkers (2), pyrolysis-mass spectrometry (10, 14), fatty acid composition (11, 12),flow cytometry data (34), and phenotypic characters (16), andfor the interpretation of patterns generated for the analysis ofmicrobial communities (25, 26). Although supervised ANNshave recently been applied to the separation of RegisteredDesignation of Origin fermented foods from different areasbased on metabolic profiles of lactic acid bacteria (18), to ourknowledge there is no report of the application of ANNs forthe identification of industrially important bacteria.
Streptococcus thermophilus and other thermophilic strepto-cocci, including Enterococcus faecalis and Enterococcus fae-cium, are among the dominant members of the microflora ofmany cheeses produced with the use of natural starter cultures(6, 13, 17, 22, 27). The identification of thermophilic strepto-cocci with phenotypic tests is often not conclusive, due to thefrequent occurrence of abnormal biochemical patterns instrains isolated from natural populations (23). Because of theindustrial importance of thermophilic streptococci and of thepotential public health significance of some enterococci (13),rapid and reliable techniques for the identification and typingof these species are needed. In a previous work (23), a poly-
phasic approach (32) was used for the classification of thermo-philic streptococci isolated from dairy sources; RAPD-PCRproved to be an effective tool for both identification and typingof S. thermophilus, E. faecalis, and E. faecium. However, twodifferent primers were needed, and the traditional approach tothe analysis of data (calculation of a similarity matrix andhierarchical cluster analysis) was cumbersome and time-con-suming. The objective of this work was therefore to compareANNs with multivariate statistical techniques (cluster analysis,LDA, and CT) in order to determine the best method for theidentification of S. thermophilus and some enterococci basedon RAPD-PCR patterns.
MATERIALS AND METHODS
Bacterial strains. A total of 138 strains of thermophilic streptococci fromseveral sources (Table 1) were identified at the species or genus level using phe-notypic and/or genotypic tests as S. thermophilus (79 strains), Streptococcus sali-varius (1 strain), Streptococcus spp. (9 strains), E. faecium (11 strains), E. faecalis(25 strains), Enterococcus durans (2 strains), Enterococcus gallinarum (2 strains),and Enterococcus spp. (9 strains).
RAPD-PCR assay. The RAPD-PCR conditions used with primer XD9(59GAAGTCGTCC) were described previously (23). Since the objective of thiswork was identification at the species level rather than strain typing, this primerwas selected because it resulted in reproducible (.95% similarity in replicateruns performed with the same strain) patterns with 5 to 14 bands (Fig. 2) and hada slightly lower discrimination index than primer XD8 (23). The sizes of all bandswere visually recorded by three trained operators.
Use of cluster analysis for the classification of RAPD-PCR patterns. Hierar-chical cluster analysis (unweighted pair group method with arithmetic means [UP-GMA]) was carried out on the matrix of similarity data obtained using theformula of Nei and Li (24):
Fxy 5 2nxy/(nx 1 ny)
where Fxy is the proportion of the reproducible bands common to the patternscompared, nxy is the number of bands shared by both strains, and nx 1 ny is thetotal number of reproducible bands in both strains.
Comparison of supervised ANNs for the identification of thermophilic strep-tococci. Three supervised ANNs (MLP, RBF, and BN) (Fig. 1) were initiallycompared for their ability to identify S. thermophilus, E. faecalis, and E. faecium
TABLE 1. List of microbial strains used in this study
Groupa Species Strain(s)b
a Streptococcus thermophilus CNRZ: 302; NCDO: 573T, 821, 822, 1968; CRAA: 45, 51, 207, 208, 221, 226, 229, 251, 256,263, 261, 267, 268, 284, 286, 288, 289, 292, 297, 299, 303, 305, 308, 315, 327, 333; DBPZ:S0205, S0403, S0405, S0502, S0505, S0605, S0804, S0902, S1004, S1203, S1304, S1404,S1503, S1601, S1703, S1804, S2103, SY; DISAABA: CF1, CF4, LC29, L1, LP25, LP30,LP45, LP75; IMAUN: 7C17, 8C6, 8C11, 9C4, 9C9, 9C9a, Y1C, Y5C, Y13C
Enterococcus faecalis ATCC: 19433T; DBPZ: EF1; DISAABA: LC1, LC5, LC12, LC18, LC24, LC28, LC30,LC31, LC36, LP16, LP21, LP26, LP36, LP51, LP77, LP79, LP81
Enterococcus faecium ATCC: 19434T; DISAABA: LC11, LC15, LC40, LP4, LP18a, LP42, LP68
b Streptococcus thermophilus DBPZ: S317, S901b; TH: 169T, 174T, 176T, 421T, 426T, 434T, 435T, 475T, 678T, 681TStreptococcus salivarius DSMZ: 20560T
Streptococcus spp.c CRAA: 59, 75, 232, 240, 243, 244, 248, 252, 253Enterococcus faecalis DBPZ: S211, S224, S228, S807a, S821b; TH: 536TEnterococcus faecium DBPZ: S309; TH: 538T, 649TEnterococcus durans TH: 481T, 640TEnterococcus gallinarum TH: 479T, 564TEnterococcus spp. DBPZ: S214, S222, S313, S314, S320, S818, S906c; TH: 512T, 514T
a a, strains used for building statistical models and ANNs; b, other strains.b Strain sources: ATCC, American Type Culture Collection, Manassas, Va.; CNRZ, Centre National de la Recherches Zootechniques, Jouy-en-Josas, France;
CRAA, Consorzio per la Ricerca Applicata in Agricoltura, Faculty of Agriculture, Portici, Italy; DBPZ, Dipartimento di Biologia, Difesa, e Biotecnologie Agro-Forestali, Potenza, Italy; DISAABA, Dipartimento di Scienze Ambientali Agrarie e Biotecnologie Alimentari, Sassary, Italy; DSMZ, Deutsche Sammlung vonMikroorganismen und Zelkulturen, Braunschweig, Germany; IMAUN, Istituto di Microbiologia Agraria, Universita degli Studi di Napoli “Federico II,” Portici, Italy;NCDO, National Collection of Dairy Organisms, now National Collection of Industrial and Marine Bacteria, Aberdeen, United Kingdom; TH, Veneto Agricoltura,Istituto per la Qualita e le Tecnologie Agroalimentari, Thiene, Italy.
c Streptococcus spp. were not identified to the species level, but their phenotypes and genotypes were clearly different from those of S. thermophilus or enterococci.
2158 MOSCHETTI ET AL. APPL. ENVIRON. MICROBIOL.
on Septem
ber 6, 2014 by guesthttp://aem
.asm.org/
Dow
nloaded from

on the basis of simplified RAPD-PCR patterns with seven groups of bands as aninput. In fact, to obtain a reasonable compromise between reduction of theamount of data for processing and preservation of information on strain diver-sity, the gel was subdivided into seven zones (.2.7, 2 to 2.7, 1.6 to 2, 1 to 1.6, 0.75to 1, 0.5 to 0.75, and ,0.5 kb) and bands in each zone were summed. Allnetworks had three output nodes, one for each species to be identified; a patternwas identified as belonging to the species whose node gave the lowest output.The MLP and the BN had similar architectures (seven input nodes, five hiddennodes, and three output nodes; the number of hidden nodes was set using theautomatic node generation facility provided by the software) but different train-ing strategies; a conjugate gradient algorithm was used to minimize the error sumof squares between training examples and network outputs for the MLP, whilethe algorithm used in BN minimized a cost function by using Bayesian statisticsand steepest descent (15; SPSS Neural Connection 2.0 User’s Guide). The RBFhad a completely different structure (Fig. 1); computations in the hidden layerwere performed by radial basis functions (thin-plate spline) which measured thedistance of the data from nodes (centers) in the data space, while neurons in theoutput layer had a linear activation function. The number of centers (25 centerswere used in the final configuration) and their positions were adjusted duringtraining, a process which was therefore equivalent to finding the multidimen-sional surface which provides the best fit for the training set.
Ninety-three strains whose identification was confirmed with both genotypicand phenotypic tests were used for training and testing of the networks (Table 1,group a). Since unequal numbers of patterns were available for the three species(67 S. thermophilus strains, with 53 different patterns; 19 E. faecalis strains, with11 patterns; and 8 E. faecium strains, with 8 different patterns), the patterns forenterococci were randomly duplicated until approximately equal numbers ofexamples were available for all species. Patterns were randomly assigned totraining (80% of the data, used by the supervised learning algorithms to obtainerror measures between network outputs and examples and to guide the adjust-ment of synaptic weights or center coordinates), validation (10%, used duringtraining to validate the results and avoid overtraining and loss of generalizationability), and test (10%, used to cross validate the performance of the networkafter training) sets. Because of the approach used for training, the BN does notneed a validation set, since overtraining is automatically prevented by its learningalgorithm (15; SPSS Neural Connection 2.0 User’s Guide). Assignment of cases
and training were repeated 15 times, and the percentage of correct identificationswas scored.
Comparison of BN, LDA, and CT for the identification of thermophilic strep-tococci. The same set of 93 RAPD-PCR patterns (188 patterns after randomduplication of E. faecium and E. faecalis patterns) was used to compare theabilities of the best ANN selected in the previous experiment (BN) and twomultivariate statistical techniques (LDA and CT; the phi coefficient was used asa loss function for CT) to identify S. thermophilus, E. faecalis, and E. faeciumfrom simplified (seven groups of bands; see above) RAPD-PCR patterns. Toevaluate the accuracies of the three methods and the effect of the size of thesample used for training the ANN or for building the statistical models, patternswere randomly assigned to two sets: a training set, which was used for buildingthe models, and a test set, which was used to evaluate model performance. Thesize of the training set was decreased from 90 to 40% of the data set, and the sizeof the test set was correspondingly increased from 10 to 60%. For each samplesize, random assignment of patterns and calculations were repeated five times,and the percentages of correct identifications for both training and test sets werescored.
To evaluate the robustness of the three techniques, two different approacheswere used: identification of unknown patterns (Table 1, group b, including strainsbelonging to species not used during the training stage) and evaluation of thecorrelation between the identification results for the same pattern read by dif-ferent operators. The whole set of RAPD-PCR patterns (groups a and b in Table1) read by a single operator was identified using the three techniques. In additionto species assignment, probabilities (for LDA) and network outputs (for BN)were also calculated. Moreover, identification results were estimated for eachpattern read by three different operators, and percentages of matching identifi-cations were calculated.
Software. ANNs were developed using Neural Connection 2.0 (SPSS). Statis-tical analysis and graphics were generated with Systat 7.0 for Windows (SPSS).
RESULTS
Use of RAPD-PCR with primer XD9 and cluster analysis forthe identification of thermophilic streptococci. RAPD-PCR
FIG. 2. Ethidium bromide-stained 1.5% (wt/vol) agarose gel displaying RAPD patterns of 32 strains of thermophilic streptococci obtained withprimer XD9 (59GAAGTCGTCC). Strain designations are shown above the lanes. Lane M, 1-kb DNA ladder (Gibco BRL) used as molecular sizemarker.
VOL. 67, 2001 RAPD-PCR IDENTIFICATION OF THERMOPHILIC STREPTOCOCCI 2159
on Septem
ber 6, 2014 by guesthttp://aem
.asm.org/
Dow
nloaded from

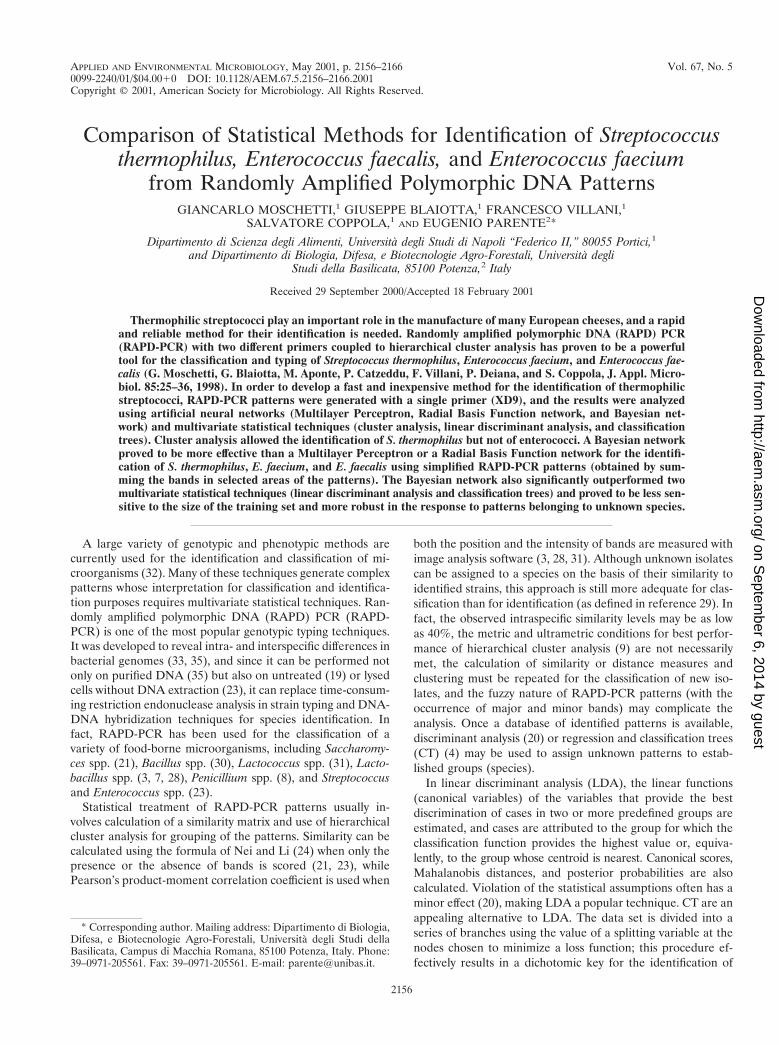
with a single primer (XD9), which yielded distinctive and re-producible patterns with 5 to 14 bands (Fig. 2), was coupledwith cluster analysis; the combination was evaluated as a tech-nique for the rapid identification of thermophilic streptococci.The abridged dendrogram showing the similarity relationshipsamong the RAPD-PCR patterns for the 138 strains listed inTable 1 is shown in Fig. 3. Five main clusters were found atthe 40% similarity level. Although almost all S. thermophilusstrains were found in cluster 3 (with the exception of strainsS317 and S901b, whose identity had be confirmed with pheno-typic tests only), all the other clusters contained more than onespecies. Therefore, the use of RAPD-PCR with primer XD9and cluster analysis would allow the identification of S. ther-mophilus but not that of E. faecalis or E. faecium.
Comparison of three supervised ANNs for the identificationof thermophilic streptococci from RAPD-PCR patterns. In or-der to develop a simple, rapid, and inexpensive procedure forthe identification of S. thermophilus, E. faecalis, and E. faeciumusing RAPD-PCR patterns obtained with primer XD9, threesupervised ANNs (MLP, RBF, and BN) (Fig. 1) were trainedto identify the three species using simplified RAPD-PCR pat-terns. The RAPD patterns obtained from 93 strains whoseidentification had been confirmed by both genotypic and phe-notypic tests were used (Table 1). After class equalization byrandom duplication of the patterns of the less-representedspecies (E. faecium and E. faecalis), the patterns were ran-domly assigned to training (80%), validation (10%), and test(10%) sets. The assignment and the training of the networkswere repeated 15 times, and ANN performance was evaluatedas the percentage of correct identifications for the test set(which had not been used for training). Although both theMLP and the RBF correctly identified 98 to 100% of thepatterns of the training set, their performance for the test setwas sometimes significantly worse: the MLP correctly identi-fied 84 to 100% of the patterns (median, 95%) of the test set,while the corresponding values for the RBF were 73 to 100%(median, 92%). In both cases, some S. thermophilus strainswere misidentified as E. faecium, while E. faecalis was alwaysidentified correctly. The BN always identified correctly all thepatterns in both the training and the test sets and was thereforechosen for further analysis.
Comparison of BN, LDA, and CT for the identification ofthermophilic streptococci. Two multivariate statistical tech-niques, LDA and CT, are valuable alternatives to cluster anal-ysis for the identification of strains. These techniques weretherefore compared to the BN for the identification of ther-mophilic streptococci using simplified RAPD-PCR patterns.
In order to compare the performances of the three methodsand to evaluate the effect of the size of the training set on thereliability of the results, 93 simplified RAPD-PCR patterns(strains listed in Table 1, group a) were used after randomduplication for class equalization as described above. The re-sulting patterns were randomly assigned to training and testsets (the validation set is not needed for the BN); the size ofthe training set was decreased from 90 to 40% of the wholedata set, while the size of the test set (used for cross validation)was increased accordingly. The assignment and the training ofthe network or the estimation of the statistical models wasrepeated five times for each training set size. The results, in
terms of percentages of correct identifications for the test set,are shown in Table 2.
The BN always identified correctly all the strains in thetraining set. Even when the size of the training set was reducedto 40% of the total (which resulted in the exclusion of manyunique patterns from the training set), the network identifiedcorrectly more than 96% of the strains in the test set, thusshowing excellent generalization. With ANNs, there is no di-rect way to estimate the relative effect of the input variables onthe output of the network. To identify the inputs which affectedthe identification results the most, the following procedure wasused. Eight E. faecium patterns, 10 E. faecalis patterns, and 20S. thermophilus patterns were selected, and the number ofbands in each band group of the pattern was systematicallyincreased or decreased by one or two (as long as this processdid not result in a negative number of bands); finally, theresulting patterns were used as a run set for the BN trainedwith the largest training set size. The effect of changing bandgroups on identification depended on the original pattern. ForS. thermophilus, changes in the number of bands at ,1.6 or.2.7 kb did not have any effect on identification, while changesin the number of bands between 1.6 and 2.7 kb resulted in adifferent identification. For E. faecium, increasing or decreas-ing by two the number of any group of bands always resulted ina change in identification. For E. faecalis, an increase in thenumber of bands at .2.7 and 2 to 2.7 kb resulted in a changein identification. Overall, changes in band groups between 0.75and 1.6 kb had the lowest impact on identification. Of the 553,180, and 211 artificial patterns generated for S. thermophilus,E. faecium, and E. faecalis, only 24 (4.3%), 23 (13%), and 15(7.1%) of the patterns, respectively, resulted in a change inidentification.
The performance of LDA was significantly affected by thenumber of examples used to build the model. There were.98% correct identifications for the training set, but with someexceptions, performance during cross validation for the test setwas lower and was as low as 84% correct identifications whensmaller training sets were used. With LDA, the relative impor-tance of input variables can be judged on the basis of the Fvalues for each variable. Band groups at .2.7, 1.6 to 2, and,0.5 kb consistently had the highest discriminant value inLDA for all training set sizes (with F values of 97.6, 93.4, and42.64, respectively), while bands between 0.5 and 1 kb had thelowest (F values of 7.6 and 3.4 for the two band groups in thisinterval). On the basis of the between-groups F matrix, dis-crimination of S. thermophilus from enterococci was relativelyclear-cut, while differentiation of E. faecalis from E. faeciumwas more difficult. This result was also evident from the ca-nonical score plot shown in Fig. 4. Discrimination betweenS. thermophilus and enterococci occurred along the first canon-ical factor, which explained 81.1% of the variance, while apartial overlap of the 95% confidence ellipses for the E. fae-calis and E. faecium groups occurred.
CT had the worst performance. A typical dichotomic keygenerated by the CT procedure is shown in Fig. 5. Althoughthe procedure allowed us to find a simple heuristic rule foridentification of the three species (choices were made on thebasis of the same variables as those identified as most signifi-cant in LDA and BN), the percentages of correct identifica-tions for the training set were usually ,95% and the size of the
2160 MOSCHETTI ET AL. APPL. ENVIRON. MICROBIOL.
on Septem
ber 6, 2014 by guesthttp://aem
.asm.org/
Dow
nloaded from
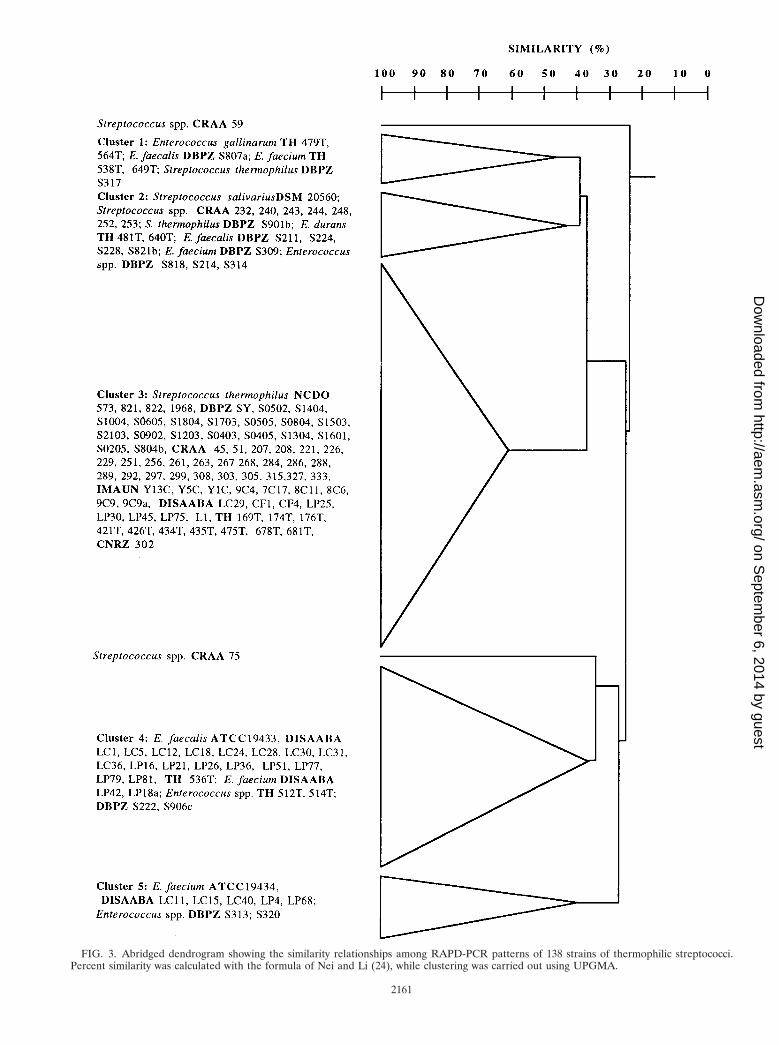
FIG. 3. Abridged dendrogram showing the similarity relationships among RAPD-PCR patterns of 138 strains of thermophilic streptococci.Percent similarity was calculated with the formula of Nei and Li (24), while clustering was carried out using UPGMA.
2161
on Septem
ber 6, 2014 by guesthttp://aem
.asm.org/
Dow
nloaded from

training set severely affected performance for the test set, withcorrect identifications as low as 88% in some cases. Moreover,with smaller training sets, the identification rule was highlydependent on the set used. While with most of the randomtrials the rule for identification was that shown in Fig. 5, in afew cases trees with a smaller number of branches (,1 band at1.6 to 2 kb and ,1 band at .2.7 kb), with many S. thermophilusstrains being classified as E. faecium, were generated.
The performance of the three methods was also tested withanother set of strains, which included species not used in train-ing the network and/or building the statistical models (Table 1,group b). In fact, a good identification technique should allownot only identification of the species used in the training andbuilding phase but also flagging of unknown species. Unfortu-nately, CT do not provide any measure of the reliability ofidentification and therefore systematically misidentified allStreptococcus spp. and Enterococcus spp. listed in Table 1,group b.
Both LDA and BN provide some measure of the reliabilityof identification. In addition to calculating canonical scoresand distances to group centroids, LDA generates posteriorprobabilities for identification. Table 3 shows a revised cross-tabulation matrix in which the ability of LDA to differentiateStreptococcus spp. and Enterococcus spp. from the three spe-cies used in building the classification function is taken intoaccount. A fourth category (“other species”) was created toinclude all strains identified by LDA as S. thermophilus, E. fae-cium, and E. faecalis with a posterior probability of ,0.80.With this criterion, the percentages of correct identificationsfor E. faecium, E. faecalis, S. thermophilus, and other specieswere, respectively, 64, 96, 91, and 26%. The last value reflectsthe misidentification of most Streptococcus and Enterococcusspp. Increasing or decreasing the posterior probability crite-rion resulted in even worse results. The poor ability of LDA todiscriminate Streptococcus and Enterococcus spp. is also evi-dent from the canonical score plot shown in Fig. 4, since theirpatterns often fell within the 95% bivariate confidence ellipsesfor the three species used to build the model (S. thermophilus,E. faecium, and E. faecalis).
ANNs do not generate true probabilities for identification;rather, each of the three output nodes (one for each species)generates a numerical output when the network is exposed toa pattern. The pattern is identified as belonging to the specieswhose node had the lowest output (winning node). In a typicalsituation for a clear-cut identification, the winning node has an
output close to 0, while the other two nodes have an outputclose to 1; this situation was in fact true for most of the strainsused for training the network. The network will still provide anoutput for patterns which are highly dissimilar from those usedduring training, either because they belong to a different spe-cies or because they are comparatively rare among one of thespecies used for training, but the result will be ambiguousvalues (far from 0 or 1) for two or more nodes.
To define a criterion for the definition of ambiguous iden-tifications, the following approach was used. First, to obtain arepresentation in two dimensions for the output of the BNwhich would be comparable to the canonical score plot ob-tained with LDA, a principal-component analysis was carriedout for the outputs of the three nodes. In the resulting scoreplot (Fig. 6), the patterns belonging to strains identified asE. faecium, E. faecalis, and S. thermophilus are more tightlyclustered than those in the canonical score plot generated withLDA (Fig. 4) and, as a consequence, the 95% bivariate ellipsesfor the three species are much smaller than with LDA. With asingle notable exception (S. salivarius DSM20560 was identi-fied as E. faecium), all Streptococcus strains fell outside theellipses. E. durans and E. gallinarum strains were clearly dif-ferentiated from E. faecium, E. faecalis, and S. thermophilusstrains by the BN; this finding was also obtained for most of theenterococci, for which a conclusive identification based on in-dependent testing (i.e., other than RAPD-PCR) was not avail-able. However, two E. faecium strains (538T and 649T), a fewS. thermophilus strains (CNRZ302, L1, S0605, and NCDO573),and one E. faecalis strain (536T), whose identification hadbeen confirmed by phenotypic and genotypic tests, were alsocomparatively far from the ellipses. When the outputs for
FIG. 4. Canonical score plot of simplified RAPD-PCR patternsobtained with primer XD9 for 138 strains of thermophilic streptococci.The canonical scores were calculated by discriminant analysis for theidentification of S. thermophilus (E), E. faecalis (‚), and E. faecium(M) using RAPD-PCR patterns for a set of 93 strains (Table 1, groupa). Other symbols: l, Streptococcus spp.; �, other enterococci. Opensymbols correspond to patterns used for building the model; closedsymbols correspond to patterns not used for building the model. The95% confidence ellipses for the patterns of each species used forbuilding the model are also shown.
TABLE 2. Performance of a supervised ANN (BN), LDA, and CTfor the identification of S. thermophilus, E. faecalis, and E. faeciumusing simplified RAPD-PCR patterns obtained with primer XD9
No. (%) of patternsin the training set:
Median (range) % correct identificationsobtained witha:
BN LDA CT
169 (90) 100 (100–100) 100 (100–100) 96 (94–100)158 (80) 100 (100–100) 100 (95–100) 97 (94–98)132 (70) 100 (100–100) 95 (94–100) 98 (95–98)113 (60) 100 (100–100) 96 (96–98) 96 (87–97)94 (50) 99 (97–100) 95 (94–99) 93 (88–98)75 (40) 97 (96–100) 91 (84–96) 96 (94–97)
a Values are for five replicate runs.
2162 MOSCHETTI ET AL. APPL. ENVIRON. MICROBIOL.
on Septem
ber 6, 2014 by guesthttp://aem
.asm.org/
Dow
nloaded from
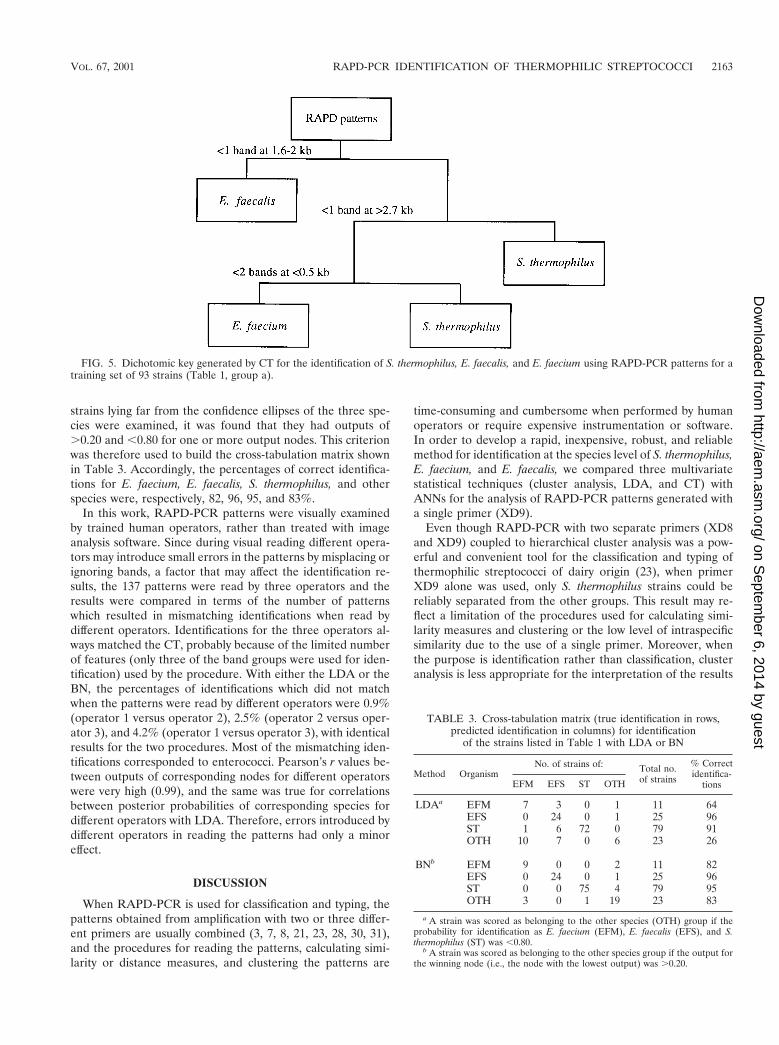
strains lying far from the confidence ellipses of the three spe-cies were examined, it was found that they had outputs of.0.20 and ,0.80 for one or more output nodes. This criterionwas therefore used to build the cross-tabulation matrix shownin Table 3. Accordingly, the percentages of correct identifica-tions for E. faecium, E. faecalis, S. thermophilus, and otherspecies were, respectively, 82, 96, 95, and 83%.
In this work, RAPD-PCR patterns were visually examinedby trained human operators, rather than treated with imageanalysis software. Since during visual reading different opera-tors may introduce small errors in the patterns by misplacing orignoring bands, a factor that may affect the identification re-sults, the 137 patterns were read by three operators and theresults were compared in terms of the number of patternswhich resulted in mismatching identifications when read bydifferent operators. Identifications for the three operators al-ways matched the CT, probably because of the limited numberof features (only three of the band groups were used for iden-tification) used by the procedure. With either the LDA or theBN, the percentages of identifications which did not matchwhen the patterns were read by different operators were 0.9%(operator 1 versus operator 2), 2.5% (operator 2 versus oper-ator 3), and 4.2% (operator 1 versus operator 3), with identicalresults for the two procedures. Most of the mismatching iden-tifications corresponded to enterococci. Pearson’s r values be-tween outputs of corresponding nodes for different operatorswere very high (0.99), and the same was true for correlationsbetween posterior probabilities of corresponding species fordifferent operators with LDA. Therefore, errors introduced bydifferent operators in reading the patterns had only a minoreffect.
DISCUSSION
When RAPD-PCR is used for classification and typing, thepatterns obtained from amplification with two or three differ-ent primers are usually combined (3, 7, 8, 21, 23, 28, 30, 31),and the procedures for reading the patterns, calculating simi-larity or distance measures, and clustering the patterns are
time-consuming and cumbersome when performed by humanoperators or require expensive instrumentation or software.In order to develop a rapid, inexpensive, robust, and reliablemethod for identification at the species level of S. thermophilus,E. faecium, and E. faecalis, we compared three multivariatestatistical techniques (cluster analysis, LDA, and CT) withANNs for the analysis of RAPD-PCR patterns generated witha single primer (XD9).
Even though RAPD-PCR with two separate primers (XD8and XD9) coupled to hierarchical cluster analysis was a pow-erful and convenient tool for the classification and typing ofthermophilic streptococci of dairy origin (23), when primerXD9 alone was used, only S. thermophilus strains could bereliably separated from the other groups. This result may re-flect a limitation of the procedures used for calculating simi-larity measures and clustering or the low level of intraspecificsimilarity due to the use of a single primer. Moreover, whenthe purpose is identification rather than classification, clusteranalysis is less appropriate for the interpretation of the results
FIG. 5. Dichotomic key generated by CT for the identification of S. thermophilus, E. faecalis, and E. faecium using RAPD-PCR patterns for atraining set of 93 strains (Table 1, group a).
TABLE 3. Cross-tabulation matrix (true identification in rows,predicted identification in columns) for identification
of the strains listed in Table 1 with LDA or BN
Method OrganismNo. of strains of: Total no.
of strains
% Correctidentifica-
tionsEFM EFS ST OTH
LDAa EFM 7 3 0 1 11 64EFS 0 24 0 1 25 96ST 1 6 72 0 79 91OTH 10 7 0 6 23 26
BNb EFM 9 0 0 2 11 82EFS 0 24 0 1 25 96ST 0 0 75 4 79 95OTH 3 0 1 19 23 83
a A strain was scored as belonging to the other species (OTH) group if theprobability for identification as E. faecium (EFM), E. faecalis (EFS), and S.thermophilus (ST) was ,0.80.
b A strain was scored as belonging to the other species group if the output forthe winning node (i.e., the node with the lowest output) was .0.20.
VOL. 67, 2001 RAPD-PCR IDENTIFICATION OF THERMOPHILIC STREPTOCOCCI 2163
on Septem
ber 6, 2014 by guesthttp://aem
.asm.org/
Dow
nloaded from

than other multivariate statistical techniques (such as LDAand CT) and supervised ANNs.
Three supervised ANNs (MLP, RBF, and BN) were com-pared for the identification of S. thermophilus, E. faecalis, andE. faecium using simplified RAPD-PCR patterns obtained bypooling the bands in selected molecular weight ranges. Thisprocedure significantly reduced the amount of input data, thusallowing the use of relatively small training sets, and had theadditional advantage of simplifying the process of reading theband patterns. The size and composition of the training set areboth very important for the performance of ANNs. The min-imum size and complexity of the training set (N) needed toachieve a predefined error level have a complex relationshipwith network architecture, but it has been suggested (15) thata training set size of at least W/e cases (where W is the numberof free parameters [weight and biases] of the network and e isthe fraction of classification error allowed for the test data)should be sufficient to obtain good generalization. Therefore,to achieve 95% correct identifications for the test set, the N/Wratio should be larger than 20. However, smaller training setscan still provide acceptable results in pattern classificationtasks (15). In fact, small training sets have been used withsuccess in the identification of microorganisms using complexinput patterns (2, 5, 10, 11, 12, 14). In a recent study (1), theissue of size and imbalance of training sets was addressed forthe identification of marine microalgae using flow cytometrydata and RBF. Even with very complex networks (7 inputnodes, 1 to 5 hidden nodes for each output node, and 20 to 60output layer nodes), relatively small training sets were suffi-cient to obtain comparatively high percentages of correct iden-tifications: 50 and 100 to 200 training examples per specieswere sufficient for networks trained to identify 20 and 40 to 60species (with an N/W ratio of between ,0.5 and 1.4, dependingon the number of hidden nodes), respectively. Imbalance in thetraining set (i.e., unequal numbers of training examples foreach species to be identified) severely affected the perfor-mance of networks trained to identify 40 to 60 species but hada much smaller effect on networks trained to identify 20 spe-cies. Adjusting the network outputs to account for differencesbetween proportions of taxa in training and test data setsimproved the results (1).
In this work, the N/W ratios were 1.9 for the MLP and theBN and 0.56 for the RBF. However, when only unique patternsare accounted for, N/W ratios of 0.9 for the MLP and the BNand 0.3 for the RBF are obtained. Even when approximatelyequal numbers of patterns for each species were used fortraining, the numbers of unique patterns for the species wereunbalanced, with more patterns available for S. thermophilusthan for E. faecium and E. faecalis. Over 15 replicate runs, theBN showed the best performance and the RBF showed theworst. This result may have been due to a number of factors,including performance of the training algorithm and inade-quacy of the training set. Both the MLP and the RBF had atendency to lose generalization ability because of overtraining,as shown by the better performance for the training set (98 to100% correct identifications) than for the validation and testsets (73 to 100% correct identifications). The RBF, which hadthe most unfavorable N/W ratio, may also have been moreaffected by unbalanced training set composition than the othernetworks. The ability of the BN to correctly identify all pat-
terns in the training and test sets was probably due to both afavorable N/W ratio and a training strategy better suited thanthe MLP convergence algorithm to prevent overtraining and tocope with unbalanced training sets and partially overlappingdecision boundaries (15). An additional advantage of the BN isthat there is no need for a validation set, thus making moredata available for training. Thus, this network was chosen forfurther study.
Since the size and composition of the sample used for build-ing the model (training set) may affect the performance of bothANNs and multivariate statistical techniques, the BN and twomultivariate statistical techniques (LDA and CT) were com-pared for their ability to identify S. thermophilus, E. faecalis,and E. faecium using training sets of decreasing sizes (from 90to 40% of the available patterns). The BN significantly outper-formed LDA and CT: the percentage of correct identificationswith the BN was always higher (usually 100%), and the resultswere less dependent on the size of the training set. Theseresults are not surprising, since the superiority of ANNs overconventional multivariate statistical techniques in classificationproblems is well known (15) and has already been proven forthe identification of a number of microorganisms at the speciesor strain level (2, 14, 34). However, it is remarkable how theBN showed excellent generalization even when very smalltraining sets were used (N/W ratio of ,1.4, with many uniquepatterns not being used for training). The robustness and faulttolerance of the BN were also proven by its better ability todiscriminate unknown species (i.e., species not included in thetraining set) compared to LDA and CT (even at the cost of aslight reduction in the percentages of correct identifications forthe species used to train the network) and by the relativeinsensitivity of the identification results to errors introduced byreading of the RAPD-PCR patterns by different operators and
FIG. 6. Score plot for the principal-component analysis carried outon the outputs of a BN trained to identify S. thermophilus (E), E.faecalis (‚), and E. faecium (M) using RAPD-PCR patterns for a setof 93 strains (Table 1, group a). The output for all 138 strains of Table1 is shown. Other symbols: l, Streptococcus spp.; �, other enterococci.Open symbols correspond to patterns used for building the model;closed symbols correspond to patterns not used for building the model.The 95% confidence ellipses for the patterns of each species used forbuilding the model are also shown.
2164 MOSCHETTI ET AL. APPL. ENVIRON. MICROBIOL.
on Septem
ber 6, 2014 by guesthttp://aem
.asm.org/
Dow
nloaded from

by artificial alteration of the number of bands for selectedpatterns.
The misidentification of some E. faecium and E. faecalis strainswith all techniques may have been caused by the unbalancedcomposition of the training set. However, S. thermophilus is by farthe species most frequently isolated in Italian cheeses producedwith thermophilic natural starter cultures, followed by E. faecalisand E. faecium, while other species (E. durans, E. gallinarum,Streptococcus uberis, and Streptococcus bovis) occur rarely (6, 13,17, 22, 27); therefore, the risk of incorrect identifications is rela-tively small in practice, even with a network trained to identifythree species only. A different training strategy, with the specificinclusion of a fourth class in the training set (unknown species, asproposed in reference 1, or random patterns, as proposed inreference 26), may have resulted in further improvements in theidentification ability of the networks. The use of a single primerand the massive simplification of the input (by grouping the bandsin seven groups in order to reduce the number of input featuresand to simplify the task of gel reading by human operators) mayhave contributed to reducing the discriminatory ability of RAPD-PCR. However, we believe that simplification of the patterns hadonly a minor effect on the classification abilities of LDA, CT, andBN. In fact, even when complete band patterns were used incluster analysis, they did not result in any improvement in classi-fication.
Even though the application of ANNs for the identification ofmicroorganisms using complex patterns (including electro-phoretic patterns [5, 12]) is not new, the approach used in thisstudy provides the basis for a fast and inexpensive method for theidentification of thermophilic streptococci which can easily beapplied to other microorganisms. RAPD-PCR patterns can beobtained in a matter of a few hours, starting directly from colonies(compared to a few days with pulsed-field gel electrophoresis orwhole-cell protein analysis); the procedure used for reading thepatterns (summing the bands in molecular weight groups) can beperformed rapidly even by untrained operators; the software usedfor building the neural networks is relatively inexpensive com-pared to the current packages for automatic acquisition and clas-sification of electrophoretic patterns; and the ANN, once trained,can be used repeatedly for the identification of new patterns andupgraded by introduction of new patterns for different species toexpand its identification capability. Finally, the identification pro-cedure is robust, and incorrect assignment of bands to groupsusually causes only minor changes.
ACKNOWLEDGMENTS
This work was funded by grants from MURST and ENEA, Rome,Italy.
We are grateful to Angiolella Lombardi for providing some of thestrains used in this study.
REFERENCES
1. Al-Haddad, L., C. W. Morris, and L. Boddy. 2000. Training radial basisfunction neural networks: effects of training set size and imbalanced trainingsets. J. Microbiol. Methods 43:33–44.
2. Almeida, J. S., A. Sonesson, D. B. Ringelberg, and D. C. White. 1995.Application of artificial neural networks to the detection of Mycobacteriumtuberculosis, its antibiotic resistance and prediction of pathogenicity amongstMycobacterium spp. based on signature lipid biomarkers. Bin. Comput. Mi-crobiol. 7:159–166.
3. Berthier, F., and S. D. Ehrlich. 1999. Genetic diversity of Lactobacillus sakeiand Lactobacillus curvatus and design of PCR primers for its detection usingrandomly amplified polymorphic DNA. Int. J. Syst. Bacteriol. 49:997–1007.
4. Breiman, L., J. H. Friedman, R. A. Olshen, and C. I. Stone. 1984. Classifi-cation and regression trees. Wadsworth, Belmont, Calif.
5. Carson, C. A., J. M. Keller, K. K. McAdoo, D. Wang, B. Higgins, C. W.Bailey, J. G. Thorne, B. J. Payne, M. Skala, and A. W. Hahn. 1995. Esche-richia coli O157:H7 restriction pattern recognition by artificial neural net-work. J. Clin. Microbiol. 33:2894–2898.
6. Coppola, S., E. Parente, S. Dumontet, and A. La Peccerella. 1988. Themicroflora of natural whey cultures utilized as starters in the manufacture ofmozzarella cheese from water-buffalo milk. Lait 68:295–310.
7. Du Plessis, E. M., and L. M. Dicks. 1995. Evaluation of random polymorphicDNA (RAPD)-PCR as a method to differentiate Lactobacillus acidophilus,Lactobacillus crispatus, Lactobacillus amylovorus, Lactobacillus gallinarum,Lactobacillus gasseri, and Lactobacillus johnsonii. Curr. Microbiol. 31:114–118.
8. Dupont, J., S. Magnin, A. Marti, and M. Brousse. 1999. Molecular tools foridentification of Penicillium starter cultures used in the food industry. Int. J.Food Microbiol. 49:109–118.
9. Everitt, B. 1974. Cluster analysis. Heinemann Educational Books, London,England.
10. Freeman, R., R. Goodacre, P. R. Magee, A. C. Ward, and N. F. Lightfoot.1994. Rapid identification of species within the Mycobacterium tuberculosiscomplex by artificial neural networks analysis of pyrolysis mass spectra.J. Med. Microbiol. 40:170–173.
11. Giacomini, M., C. Ruggiero, S. Bertone, and L. Calegari. 1997. Artificialneural network identification of heterotrophic marine bacteria based ontheir fatty-acid composition. IEEE Trans. Biomed. Eng. 44:1185–1191.
12. Giacomini, M., C. Ruggiero, L. Calegari, and S. Bertone. 2000. Artificialneural network based identification of environmental bacteria by gas-chro-matographic and electrophoretic data. J. Microbiol. Methods 43:45–54.
13. Giraffa, G., D. Carminati, and E. Neviani. 1997. Enterococci isolated fromdairy products: a review of risks and potential technological use. J. FoodProt. 60:732–738.
14. Goodacre, R., M. J. Neal, D. B. Kell, L. W. Greenham, W. C. Noble, and R. G.Harvey. 1994. Rapid identification using pyrolysis mass spectrometry andartificial neural networks of Propionibacterium acnes isolated from dogs.J. Appl. Bacteriol. 76:124–134.
15. Haykin, S. 1999. Neural networks. A comprehensive foundation. PrenticeHall International, London, United Kingdom.
16. Kennedy, M. J., and M. S. Thakur. 1993. The use of artificial neural net-works to aid microorganism identification: a case study of Haemophilusspecies identification. Antonie Leeuwenhoek 63:35–38.
17. Limsowtin, G. K. Y., I. B. Powell, and E. Parente. 1995. Types of starters, p.101–129. In T. M. Cogan and J.-P. Accolas (ed.), Dairy starter cultures.VCH, New York, N.Y.
18. Lopes, F. S. M., C. I. Pereira, F. M. S. Rodrigues, M. P. Martins, M. C.Mimoso, T. C. Barros, J. J. Figueiredo Marques, R. P. Tenreiro, J. S.Almeida, and M. T. Barreto Crespo. 1999. Registered designation of originareas of fermented food products defined by microbial phenotypes andartificial neural networks. Appl. Environ. Microbiol. 65:4484–4489.
19. Mazurier, S.-I., and K. Wernars. 1992. Typing of Listeria strains by randomamplified polymorphic DNA. Res. Microbiol. 143:499–505.
20. McLachlan, G. J. 1992. Discriminant analysis and statistical pattern recog-nition. John Wiley & Sons, Inc., New York, N.Y.
21. Molnar, O., R. Messner, H. Prillinger, U. Stahl, and E. Slavikova. 1995.Genotypic identification of Saccharomyces species using random amplifiedpolymorphic DNA analysis. Syst. Appl. Microbiol. 18:136–145.
22. Morea, M., F. Baruzzi, and P. S. Cocconcelli. 1999. Molecular and physio-logical characterization of the dominant bacterial populations in traditionalmozzarella cheese processing. J. Appl. Microbiol. 87:574–582.
23. Moschetti, G., G. Blaiotta, M. Aponte, P. Catzeddu, F. Villani, P. Deiana,and S. Coppola. 1998. Random amplified polymorphic DNA and amplifiedribosomal DNA spacer polymorphism: powerful methods to differentiateStreptococcus thermophilus strains. J. Appl. Microbiol. 85:25–36.
24. Nei, M., and W. Li. 1979. Mathematical model for studying genetic variationin terms of restriction endonucleases. Proc. Natl. Acad. Sci. USA 76:5269–5273.
25. Noble, P. A., K. D. Bidle, and M. Fletcher. 1997. Natural microbial commu-nity compositions compared by a back-propagation neural network and clus-ter analysis of 5S rRNA. Appl. Environ. Microbiol. 63:1762–1770.
26. Noble, P. A., J. S. Almeida, and C. R. Lovell. 2000. Application of neuralcomputing methods for interpreting phospholipid fatty acid profiles of nat-ural microbial communities. Appl. Environ. Microbiol. 66:694–699.
27. Parente, E., M. A. Rota, A. Ricciardi, and F. Clementi. 1997. Characteriza-tion of natural starter cultures used in the manufacture of pasta filata cheesein Basilicata (southern Italy). Int. Dairy J. 7:775–783.
28. Quiberoni, A., P. Taillez, P. Quenee, V. Suarez, and J. Reinheimer. 1998.Genetic (RAPD-PCR) and technological diversities among wild Lactobacil-lus helveticus strains. J. Appl. Microbiol. 85:591–596.
29. Staley, J. T., and N. R. Krieg. 1986. Classification of procaryotic organisms:an overview, p. 1–4. In N. R. Krieg and J. G. Holt (ed.), Bergey’s manual ofsystematic bacteriology, vol. 1. Williams & Wilkins, Baltimore, Md.
30. Stephan, R., H. Schraft, and F. Untermann. 1994. Characterization of Ba-
VOL. 67, 2001 RAPD-PCR IDENTIFICATION OF THERMOPHILIC STREPTOCOCCI 2165
on Septem
ber 6, 2014 by guesthttp://aem
.asm.org/
Dow
nloaded from
cillus licheniformis with the RAPD technique (randomly amplified polymor-phic DNA). Lett. Appl. Microbiol. 18:260–263.
31. Tailliez, P., J. Tremblay, S. D. Ehrlich, and A. Chopin. 1998. Moleculardiversity and relationship within Lactococcus lactis, as revealed by randomlyamplified polymorphic DNA (RAPD). Syst. Appl. Microbiol. 21:530–538.
32. Van damme, P., B. Pot, M. Gillis, P. De Vos, K. Kersters, and J. Swings.1996. Polyphasic taxonomy, a consensus approach to bacterial systematics.Microbiol. Rev. 60:407–438.
33. Welsh, J., and M. McClelland. 1990. Fingerprinting genomes using PCRwith arbitrary primers. Nucleic Acids Res. 18:7213–7218.
34. Wilkins, F. M., L. Boddy, C. W. Morris, and R. R. Jones. 1999. Identificationof phytoplankton from flow cytometry data by using radial basis functionneural networks. Appl. Environ. Microbiol. 65:4404–4410.
35. Williams, G., A. Kubelik, K. Livak, A. Rafalski, and S. Tingey. 1990. DNApolymorphisms amplified by arbitrary primers are useful as genetic markers.Nucleic Acids Res. 18:6531–6535.
2166 MOSCHETTI ET AL. APPL. ENVIRON. MICROBIOL.
on Septem
ber 6, 2014 by guesthttp://aem
.asm.org/
Dow
nloaded from