Structure of the double-stranded DNA-binding type IV secretion protein TraN from Enterococcus
15
electronic reprint Acta Crystallographica Section D Biological Crystallography ISSN 1399-0047 Structure of the double-stranded DNA-binding type IV secretion protein TraN from Enterococcus Nikolaus Goessweiner-Mohr, Markus Eder, Gerhard Hofer, Christian Fercher, Karsten Arends, Ruth Birner-Gruenberger, Elisabeth Grohmann and Walter Keller Acta Cryst. (2014). D70, 2376–2389 Copyright c International Union of Crystallography Author(s) of this paper may load this reprint on their own web site or institutional repository provided that this cover page is retained. Republication of this article or its storage in electronic databases other than as specified above is not permitted without prior permission in writing from the IUCr. For further information see http://journals.iucr.org/services/authorrights.html Acta Crystallographica Section D: Biological Crystallography welcomes the submission of papers covering any aspect of structural biology, with a particular emphasis on the struc- tures of biological macromolecules and the methods used to determine them. Reports on new protein structures are particularly encouraged, as are structure–function papers that could include crystallographic binding studies, or structural analysis of mutants or other modified forms of a known protein structure. The key criterion is that such papers should present new insights into biology, chemistry or structure. Papers on crystallo- graphic methods should be oriented towards biological crystallography, and may include new approaches to any aspect of structure determination or analysis. Papers on the crys- tallization of biological molecules will be accepted providing that these focus on new methods or other features that are of general importance or applicability. Crystallography Journals Online is available from journals.iucr.org Acta Cryst. (2014). D70, 2376–2389 G¨ ossweiner-Mohr et al. · TraN
-
Upload
beuth-hochsschule -
Category
Documents
-
view
0 -
download
0
Transcript of Structure of the double-stranded DNA-binding type IV secretion protein TraN from Enterococcus

electronic reprint
Acta Crystallographica Section D
BiologicalCrystallography
ISSN 1399-0047
Structure of the double-stranded DNA-binding type IVsecretion protein TraN from Enterococcus
Nikolaus Goessweiner-Mohr, Markus Eder, Gerhard Hofer, ChristianFercher, Karsten Arends, Ruth Birner-Gruenberger, Elisabeth Grohmannand Walter Keller
Acta Cryst. (2014). D70, 2376–2389
Copyright c© International Union of Crystallography
Author(s) of this paper may load this reprint on their own web site or institutional repository provided thatthis cover page is retained. Republication of this article or its storage in electronic databases other than asspecified above is not permitted without prior permission in writing from the IUCr.
For further information see http://journals.iucr.org/services/authorrights.html
Acta Crystallographica Section D: Biological Crystallography welcomes the submission ofpapers covering any aspect of structural biology, with a particular emphasis on the struc-tures of biological macromolecules and the methods used to determine them. Reportson new protein structures are particularly encouraged, as are structure–function papersthat could include crystallographic binding studies, or structural analysis of mutants orother modified forms of a known protein structure. The key criterion is that such papersshould present new insights into biology, chemistry or structure. Papers on crystallo-graphic methods should be oriented towards biological crystallography, and may includenew approaches to any aspect of structure determination or analysis. Papers on the crys-tallization of biological molecules will be accepted providing that these focus on newmethods or other features that are of general importance or applicability.
Crystallography Journals Online is available from journals.iucr.org
Acta Cryst. (2014). D70, 2376–2389 Gossweiner-Mohr et al. · TraN

research papers
2376 doi:10.1107/S1399004714014187 Acta Cryst. (2014). D70, 2376–2389
Acta Crystallographica Section D
BiologicalCrystallography
ISSN 1399-0047
Structure of the double-stranded DNA-binding typeIV secretion protein TraN from Enterococcus
Nikolaus Goessweiner-Mohr,a,b*
Markus Eder,a Gerhard Hofer,a
Christian Fercher,a Karsten
Arends,c Ruth Birner-
Gruenberger,d Elisabeth
Grohmanne* and Walter Kellera*
aInstitute of Molecular Biosciences, University of
Graz, Humboldtstrasse 50/III, 8010 Graz,
Austria, bInstitute of Molecular Biotechnology
(IMBA), Austrian Academy of Sciences,
Dr Bohr-Gasse 3, 1030 Vienna, Austria,cRobert Koch Institute Berlin, Nordufer 20,
13353 Berlin, Germany, dInstitute for Pathology
and Omics Center Graz, Medical University
Graz, Stiftingtalstrasse 24, 8010 Graz, Austria,
and eDivision of Infectious Diseases, University
Medical Center Freiburg, Hugstetter Strasse 55,
79106 Freiburg, Germany
Correspondence e-mail:
# 2014 International Union of Crystallography
Conjugative transfer through type IV secretion multiprotein
complexes is the most important means of spreading
antimicrobial resistance. Plasmid pIP501, frequently found in
clinical Enterococcus faecalis and Enterococcus faecium
isolates, is the first Gram-positive (G+) conjugative plasmid
for which self-transfer to Gram-negative (G�) bacteria has
been demonstrated. The pIP501-encoded type IV secretion
system (T4SS) protein TraN localizes to the cytoplasm and
shows specific DNA binding. The specific DNA-binding site
upstream of the pIP501 origin of transfer (oriT) was identified
by a novel footprinting technique based on exonuclease
digestion and sequencing, suggesting TraN to be an accessory
protein of the pIP501 relaxase TraA. The structure of TraN
was determined to 1.35 A resolution. It revealed an internal
dimer fold with antiparallel �-sheets in the centre and a helix–
turn–helix (HTH) motif at both ends. Surprisingly, structurally
related proteins (excisionases from T4SSs of G+ conjugative
transposons and transcriptional regulators of the MerR
family) resembling only one half of TraN were found. Thus,
TraN may be involved in the early steps of pIP501 transfer,
possibly triggering pIP501 TraA relaxase activity by recruiting
the relaxosome to the assembled mating pore.
Received 12 March 2014
Accepted 17 June 2014
PDB references: TraN, 4p0z;
4p0y; 4pm3
1. Introduction
As the major contributor to horizontal gene transfer, conju-
gative spread of plasmid-encoded antibiotic-resistance and
pathogenicity genes represents a serious threat to hospitalized
and immunosuppressed patients (Williams & Hergenrother,
2008). In the process of conjugation, DNA is transported from
a donor to a recipient cell, requiring direct contact between
the cells (Cascales & Christie, 2003; Alvarez-Martinez &
Christie, 2009). The transfer is mediated by a plasmid-
encoded, multi-protein complex that is large enough to span
the bacterial cell wall: the type IV secretion system (T4SS;
Llosa et al., 2002). T4SSs have been studied in detail in
bacteria of Gram-negative (G�) origin, such as Escherichia
coli and Agrobacterium tumefaciens (Llosa et al., 2009; de la
Cruz et al., 2010; Hayes et al., 2010; Rego et al., 2010; Smillie et
al., 2010; Wallden et al., 2010; Thanassi et al., 2012; Zechner et
al., 2012; Christie et al., 2014). For systems of Gram-positive
(G+) origin, most knowledge of the T4SSs was originally
based on their similarity to their G� counterparts (Grohmann
et al., 2003; Abajy et al., 2007), but recently significant progress
has been made towards their functional and structural char-
acterization. The findings of Chen et al. (2008) support a
model in which the putative coupling protein PcfC of the
Enterococcus faecalis sex pheromone plasmid pCF10 initiates
the conjugative transfer of the substrate through a pCF10-
encoded T4S channel. As with G� T4SSs, this mechanism is
NTP-dependent and requires the presence of the peptido-
electronic reprint

glycan hydrolase PrgK (Laverde Gomez et al., 2014). Only
recently has structural information on several G+ T4SS
proteins become available: a proposed scaffolding factor TcpC
from plasmid pCW3 (Porter et al., 2012), a VirD4-like ATPase
domain from Thermoanaerobacter pseudethanolicus (Wallden
et al., 2012), the C-terminal VirB8-like domain of the pIP501
T4S protein TraM (Goessweiner-Mohr, Grumet et al., 2013)
and the pIP501 T4S protein TraK, which exhibits a novel fold
(Goessweiner-Mohr et al., 2014). A broad overview of the
current G+ T4SS knowledge base is provided in a recent
review (Goessweiner-Mohr, Arends et al., 2013).
pIP501, a multiple antibiotic-resistance plasmid frequently
encountered in clinical E. faecalis and E. faecium isolates
(Rosvoll et al., 2010), is the conjugative plasmid with the
broadest host range in G+ bacteria (Kurenbach et al., 2003).
15 putative T4SS genes are organized in a single operon.
Significant sequence similarity to the T4SS from A. tume-
faciens has only been detected for three of these proteins.
TraE, an ATPase related to VirB4, interacts with itself as well
as with several other potential pIP501 T4SS proteins (Abajy
et al., 2007). This motor ATPase is most likely to drive the
conjugation process. The hexameric coupling protein TraJ
(E.-K. Celik, W. Keller & E. Grohmann, unpublished data),
related to VirD4, lacks the transmembrane region shown for
other coupling proteins (Gomis-Ruth et al., 2001; Atmakuri
et al., 2004). Coupling proteins connect the macromolecular
complex of single-stranded plasmid DNA and relaxosome-
associated proteins, which are transported to the recipient cell
with the T4SS secretory conduit (Gomis-Ruth et al., 2004).
Another pIP501 T4SS protein, TraI, might be responsible for
recruitment of the coupling protein TraJ to the cell membrane
(Alvarez-Martinez & Christie, 2009). To assemble the conju-
gative core complex in G+ bacteria, the thick peptidoglycan
layer needs to be opened locally. In the case of the pIP501
T4SS this role is performed by the muramidase TraG (Arends
et al., 2013), a protein related to VirB1. Recently, we published
the 2.5 A resolution structure of the C-terminal domain of
the pIP501 T4SS protein TraM, with similarity to VirB8-like
proteins (Goessweiner-Mohr, Grumet et al., 2013), as well as
the 3.0 A resolution structure of TraKpIP501 (Goessweiner-
Mohr et al., 2014). Despite these emerging structural data and
the above-described insight into some of the 15 potential T4SS
proteins, we still lack information on most of the individual
components.
Here, we present the biophysical and structural character-
ization of the T4SS protein TraN, a 17.6 kDa protein (formerly
ORF14; GenBank CAD44394.1) encoded by the conjugative
plasmid pIP501. The cytoplasmic protein binds to double-
stranded (ds) DNA. Using various oriTpIP501-flanking DNA
constructs, we were able to determine the preferred binding
site as a 34 bp sequence positioned upstream of oriTpIP501,
which suggests TraN to be an accessory or regulatory factor
within the pIP501 transfer system. We report the 1.35 A
resolution TraN structure, which has been solved by seleno-
methionine single-wavelength anomalous dispersion (SAD)
methods. TraN comprises an HTH fold with an internal dimer
composition. The TraN domains resemble the fold of
excisionases (Xis) from transposons of G+ origin and
bacteriophages as well as transcriptional regulators of the
MerR family. A search for structurally related proteins in
putative T4SSs from conjugative plasmids, transposons, ICEs
and genomic islands (GI) revealed only a few mobile genetic
elements which possess a TraN-like protein.
2. Materials and methods
Detailed information on the expression, purification and
crystallization of native TraN has been published in Goess-
weiner-Mohr et al. (2012).
The final coordinates and structure-factor amplitudes of the
TraN crystal structures have been deposited in the PDB as
entries 4p0z (crystal form I), 4p0y (crystal form II) and 4pm3
(crystal form III).
2.1. Expression of selenomethionine-labelled TraN
For the expression of selenomethionine-labelled TraN,
pQTEV-traN plasmid DNA was transformed into the
methionine-deficient E. coli strain B834 (DE3) (Novagen,
Merck, Darmstadt, Germany) using standard protocols. The
cells were resuspended in M9 minimal medium at an OD600
of �0.6, grown for 1 h at 37�C and induced with 1 mM IPTG.
25 mg selenomethionine was added and overexpression was
continued for 3 h. The cells were harvested and frozen at
�20�C. Selenomethionine-labelled TraN expression levels
were monitored by SDS–PAGE. Protein extraction was
performed as described in Goessweiner-Mohr et al. (2012).
2.2. Biophysical characterization of TraN
TraN was extracted and His-affinity purified in 50 mM Tris,
100 mM ammonium sulfate pH 7.45. TraN-containing His-
affinity fractions were pooled and concentrated via centrifu-
gation in Amicon tubes (Millipore Amicon, 3000 MWCO).
TraN was further purified by size-exclusion chromatography
with a Superdex 200 HR 10/30 column (GE Healthcare,
Chalfont St Giles, England). A gel-filtration standard (670,
158, 44, 17 and 1.35 kDa; Bio-Rad, Hercules, California, USA)
was used to calculate the molecular weight of TraN. TraN-
containing size-exclusion fractions with a maximal concen-
tration of 1.58 mg ml�1 were stored at �80 �C for subsequent
experiments.
Circular-dichroism (CD) measurements were performed
on a Jasco J715 spectropolarimeter (Jasco, Gross-Umstadt,
Germany) equipped with an external thermostat. Spectra
were measured from 260 to 190 nm in a 0.01 cm cuvette with a
protein concentration of 0.89 mg ml�1. Ten individual spectra
were accumulated and the standard deviation was calculated
from the repeated measurements. Temperature scans were
performed in a 0.02 cm temperature-controlled cuvette from
25 to 95�C using a step–scan procedure with a constant
wavelength of 208 nm. Spectra were recorded in triplicate
from 260 to 190 nm every 5�C. The temperature slope was
set to 1�C min�1. TraN was applied at a concentration of
0.42 mg ml�1. CD data were evaluated using the online service
DichroWeb (Whitmore & Wallace, 2008) and reference data
set No. 4.
research papers
Acta Cryst. (2014). D70, 2376–2389 Gossweiner-Mohr et al. � TraN 2377electronic reprint

For the DLS measurements, a size-exclusion fraction
containing 0.9 mg ml�1 TraN was measured in a 45 ml cuvette.
Ten measurements with constant baseline were merged and
the monodispersity was assessed.
For the SAXS measurements on the X33 beamline at
DESY, Hamburg, Germany, TraN was suspended in 100 mM
ammonium sulfate, 100 mM NaCl, 50 mM HEPES pH 7.0.
Size-exclusion purified protein was concentrated and TraN
was measured at three different concentrations: 3.18, 1.57 and
0.96 mg ml�1. PRIMUS (Konarev et al., 2003) was applied to
subtract the buffer from the protein data. The maximum
intensity (I0) and radius of gyration (Rg) were extracted from
the Guinier plot generated from the data at 1.57 mg ml�1. I0
was used to calculate the molecular weight of TraN in solution,
GNOME (Svergun, 1992) was used to generate the output file
for subsequent ab initio modelling with GASBOR (Svergun
et al., 2001), and CRYSOL (Svergun et al., 1995) was used to
generate a scattering curve from the X-ray-derived model.
The BUNCH software (Petoukhov & Svergun, 2005) was used
to fit the X-ray data to the SAXS scattering curve of TraN.
This was carried out by ab initio and rigid-body modelling of
the N-terminal His tag of the construct, which was present in
solution but was lost or not visible in the X-ray model.
2.3. Subcellular fractionation of E. faecalis JH2-2 (pIP501)and immunolocalization of TraN
Subcellular fractionation of E. faecalis JH2-2 (pIP501) was
performed according to Buttaro et al. (2000) with modifica-
tions. An exponentially growing culture (OD600 = 0.5) of
E. faecalis JH2-2 (pIP501) was chilled on ice, washed twice in
an equal volume of 50 mM potassium phosphate buffer pH 7.0
and resuspended [1:50(v:v)] in lysis buffer (50 mM KH2PO4/
K2HPO4 pH 7.0, 1 mM EDTA, 1 mM MgCl2, 100 mg ml�1
DNase, 100 mg ml�1 RNase). The cells were broken by
FastPrep-24 (MP Biomedicals, Illkirch, France) using lysing
matrix E (1.4 mm ceramic spheres, 0.1 mm silica spheres, 4 mm
glass beads; MP Biomedicals, Illkirch, France). Unlysed cells
were removed by low-speed centrifugation. The cell-wall
fraction was harvested by high-speed centrifugation at 17 000g
for 20 min at 4�C and the membrane fraction was obtained
by ultracentrifugation of the supernatant at 45 000 rev min�1
for 2 h at 4�C (OTD Combi ultracentrifuge, Thermo Fisher
Scientific GmbH, Dreieich, Germany). The remaining super-
natant contained the soluble proteins.
TraN was localized in the fractions (cell wall, membrane,
cytoplasm) by immunostaining with primary polyclonal
anti-TraN antibodies (BioGenes, Berlin, Germany) and a
secondary horseradish-peroxidase conjugated anti-rabbit IgG
antibody (Promega GmbH, Mannheim, Germany).
2.4. EMSA with unlabelled DNA fragments
Eight unlabelled DNA fragments of variable length were
tested (fragments A–H; Supplementary Fig. S31). Except for
fragments D and G, all fragments contained the pIP501 oriT
sequence and a sequence upstream and downstream of the
oriT. Fragments A–E mostly comprised an upstream oriT
sequence and fragments F–H a downstream oriT sequence.
3 ml of the respective fragments, corresponding to 1–2 pmol
dsDNA, were mixed with a 0/1/2.5/5/10/25/50/100-fold molar
excess of TraN protein, 3 ml glycerol, 1 mM EDTA, 15 mM
NaCl, 20 mM Tris–HCl pH 7.8, 20 mg BSA and H2O to a final
volume of 20 ml. The samples were incubated at room
temperature (RT) for 30 min. 1 ml DNA loading buffer
(R0611; ThermoFisher Scientific, Waltham, Massachusetts,
USA) was added and the samples were run on 1% agarose
gels at a constant voltage of 80 V for 35 min.
2.5. Exonuclease digestion and sequencing-basedfootprinting assay
10 ml of DNA fragments C and L (see Supplementary Fig
S3; up to 100 ng ml�1) were incubated with a tenfold molar
excess of TraN protein and without protein (negative control),
respectively. The 20 ml incubation mixture consisted of 15 mM
NaCl, 20 mM Tris–HCl pH 7.8, 20 mg BSA. The samples were
incubated at RT for 30 min. 1.1 ml H2O, 0.5 ml T7 exonuclease
(New England Biolabs, Frankfurt, Germany) and 2.4 ml 10�NEB4 buffer were added and the samples were mixed and
incubated at RT for 10, 15 or 20 min. 5 ml 20 mg ml�1 protei-
nase K (New England Biolabs, Frankfurt, Germany) was
added to stop the exonuclease reaction. The samples were
incubated at RT for 30 min, followed by purification of the
digested DNA fragments using the Wizard SV Gel and PCR
Clean-Up System (Promega GmbH, Mannheim, Germany).
The DNA was dissolved in distilled H2O and the respective
forward and reverse primers were added to allow Sanger
sequencing of both DNA strands. Samples were sent to either
the LGC Genomics GmbH (Berlin, Germany) or the Micro-
synth AG (Wolfurt-Bahnhof, Austria) sequencing services.
The respective chromatograms were analyzed for the presence
of a significant deterioration in the base-calling signal and the
corresponding position in the DNA sequence was identified
for all forward and reverse sequences. The sequences were
aligned and the matching (protected) area was identified as
the specific binding site of TraN.
2.6. Thermofluor assay
10 ml of TraN (0.85 mg ml�1) was mixed with random or
specific 34-mer dsDNA oligonucleotides in a 1:1 ratio, distilled
water was added to 20 ml, 5 ml of 50� SYPRO Orange (Sigma–
Aldrich, St Louis, Missouri, USA) was added and the solution
was incubated at RT for 10 min. In samples without oligo-
nucleotides, the DNA was substituted by an equal volume of
H2O. The melting curve was measured from 25 to 95�C in
increments of 0.1�C and with a 6 s incubation time at every
step. The mean and the standard deviation of the resulting
melting temperatures were individually calculated for all three
samples (TraN alone, TraN plus random 34-mer and TraN plus
34 bp binding site).
research papers
2378 Gossweiner-Mohr et al. � TraN Acta Cryst. (2014). D70, 2376–2389
1 Supporting information has been deposited in the IUCr electronic archive(Reference: CB5056).
electronic reprint

2.7. ITC experiments
ITC was performed on a MicroCal VP ITC System (GE
Healthcare, Uppsala, Sweden). The calorimeter was calibrated
according to the manufacturer’s instructions. DNA oligo-
nucleotides containing either the 34 bp binding site
(CGGAAATGTCAGGTTAAACATATTTACTTTTATA) or
the oriTpIP501 (nonspecific DNA; AGGGCGCACTTATAC-
GCAGTAACTTCGTTACTTC) sequence, as well as their
complementary strands, were ordered from Life Technologies.
The DNA was dissolved in TraN purification buffer to
minimize artifacts owing to minor differences in buffer
composition. Equal amounts of the complementary ssDNA
oligonucleotides were mixed and heated to 95�C to anneal the
two strands. The concentration was determined prior to the
measurements. The sample cell (1.421 ml) was loaded with 19–
26 mM protein. A typical titration experiment consisted of 25
injections of DNA solution (205–221 mM), 12 ml volume and
4 s duration with a 5 min interval between additions. The
titration was performed at constant temperature of 25�C. The
stirring rate was set to 270 rev min�1. For the competitive
titration, the protein was saturated with nonspecific DNA
(molar ratio of 1:1.2) and injected with specific DNA
accordingly. For the reverse titration, the sample cell was filled
with 12.9 mM specific binding-site DNA and the titration
consisted of 25 injections of protein with a concentration of
259 mM. TraN protein and DNA ligands were titrated against
buffer to measure nonspecific heat effects.
The raw data were integrated, corrected for nonspecific
heats, normalized for concentration and analyzed according
to a single-binding-site interaction model utilizing the Origin
v.7.0 scientific plotting software (supplied with the ITC
instrument). For the reverse titration with specific binding-site
DNA, a two-binding-site interaction model was used to fit the
data utilizing the results of the single titrations as starting
values for the fitting.
2.8. Mass spectrometry of TraN crystals
Several crystals of TraN were dissolved in 10 ml distilled
water and investigated by MALDI-TOF spectrometry (ultra-
fleXtreme, Bruker, Vienna, Austria).
2.9. Crystallization of selenomethionine-derivatized TraN
TraN crystallization and optimization have been described
in Goessweiner-Mohr et al. (2012). Since no significant
sequence similarity with available structures was found, we
generated a selenomethionine derivative of TraN. Optimized
conditions were used for the following setups with seleno-
methionine-containing TraN. A seeding stock was prepared
from TraN crystals and seeding-optimization plates were
produced with the microbatch method and Index condition 42
only. For some setups TEV-cleaved TraN was used. Plates had
a drop volume of 1 ml with a drop ratio of 50%(v/v) in the
nonseeding conditions and a drop ratio of 40%(v/v) protein,
40%(v/v) buffer and 20%(v/v) seeding stock in the seeding
conditions. Promising crystals were harvested from two
conditions: (i) 0.1 M bis-tris pH 5.5, 25%(w/v) PEG 3350,
no seeding, TEV-cleaved protein, stock concentration
0.54 mg ml�1 and (ii) 0.1 M bis-tris pH 5.5, 25%(w/v) PEG
3350, nondiluted seeding stock, protein stock concentration
1.52 mg ml�1.
2.10. Data collection, processing and refinement
Data collection was performed at 100 K on the synchrotron
beamline X06DA at SLS, Villigen, Switzerland. No cryo-
protectant was required. The selenomethionine-containing
crystals diffracted to a resolution of about 1.8 A on our home
source and to 1.35–1.5 A resolution at SLS. Several crystals
showed isotropic diffraction with clear spots and nontwinned
patterns. A fluorescence scan was performed to validate the
presence of selenomethionine within the crystals and to define
the optimal setup for anomalous data collection at the sele-
nium f 00 inflection, peak and high-end remote wavelengths
(0.9794, 0.9796 and 0.9714 A, respectively). A crystal-to-
detector distance of 120 mm, an oscillation range of 1.0� and
an exposure time of 1 s per image were chosen. Multi-
wavelength anomalous dispersion (MAD) data sets at the
mentioned wavelengths were collected for several crystals.
The crystals that were used for data processing and
refinement all belonged to space group P21, with unit-cell
parameters a = 33.15, b = 55.09, c = 35.52 A, � = 113.05� for
crystal form I, a = 33.10, b = 62.82, c = 55.87 A, � = 90.03� for
crystal form II and a = 32.88, b = 54.94, c = 57.71 A, � = 91.89�
for crystal form III, with one (form I) or two (forms II and III)
molecules per asymmetric unit. The Matthews coefficient
(Kantardjieff & Rupp, 2003) was calculated to be 2.04, 1.99
and 1.83 A3 Da�1 for crystal forms I, II and III, respectively,
and the solvent content was 39.9, 38.2 and 32.9%, respectively.
Details are presented in Table 2.
The first data set from crystal form I was used to solve the
preliminary structure of TraN at the synchrotron. The
resulting model was utilized in the data processing of further
data sets (data 1 from crystal form I, data 2 from crystal form
II and data 3 from crystal form III) using molecular replace-
ment. Data 3 represents the previously published data set for
the TraN protein (Goessweiner-Mohr et al., 2012). Although
not stated in Goessweiner-Mohr et al. (2012), the crystal was
soaked in K2PtBr4 solution for 1.5 h and the data set was
obtained at 1.0615 A, corresponding to the high-end remote
wavelength of the Pt LIII absorption edge. As the anomalous
signal was weak and the heavy-atom position could not be
unambiguously determined, at the time the data were treated
as a native data set. In the evaluation of the data the Pt and Br
atom positions of the heavy-atom compound were placed in
the residual electron density and were refined with a partial
occupancy of 0.5. The resulting structures were refined to final
R/Rfree values of 0.1685/0.2022 (data 1), 0.1833/0.2233 (data 2)
and 0.1693/0.2134 (data 3). In the models from data 1 and 2,
100% of the residues were found in the favoured Rama-
chandran areas. The final MolProbity scores were 1.30 (93rd
percentile), 1.65 (69th percentile) and 1.13 (99th percentile)
for data 1, 2 and 3, respectively.
The data sets were processed and scaled together using
XDS and XSCALE (Kabsch, 2010), iMosflm (Battye et al.,
research papers
Acta Cryst. (2014). D70, 2376–2389 Gossweiner-Mohr et al. � TraN 2379electronic reprint

2011) and SCALA (Evans, 2006). The programs SHELXC/D/
E (Sheldrick, 2010) were used to define the selenium heavy-
atom sites and to build an initial model (SHELXE chain-
tracing function). The resulting model was completed manu-
ally in Coot (Emsley et al., 2010) and refined with REFMAC5
(Murshudov et al., 2011). For further data sets, the refined
TraN SAD structure was the basis for molecular replacement
with MOLREP (Vagin & Teplyakov, 2010) to generate the
initial models. Data set 3 was also refined with phenix.refine
(Afonine et al., 2012) from the PHENIX software suite
(Adams et al., 2010). The refined X-ray models were validated
by MolProbity (Chen et al., 2010). Three-dimensional align-
ments of the TraN structure with structural homologues were
performed with DALI (Holm & Rosenstrom, 2010) and
MATRAS (Kawabata, 2003). Structural alignment of TraN
internal monomers was conducted with MASS (Dror et al.,
2003). PyMOL (Schrodinger) was used to prepare structural
representations and to calculate the r.m.s.d.s of TraN
monomer alignments. Structural and sequential similarities
between the two halves of TraN and structurally related
proteins were examined using the pairwise structural align-
ment feature of MATRAS and the SSM algorithm (Krissinel
& Henrick, 2004) included in Coot.
2.11. Sequencing-based comparison and characterization
HMMTOP (Tusnady & Simon, 2001), MemsatSVM
(Nugent & Jones, 2009) and Memsat3 (Jones et al., 1994) were
used to search for transmembrane motifs in the TraN sequence
and potential homologous proteins.
PSIpred (Jones, 1999) was used to predict the secondary-
structure content of TraN and of structurally related proteins,
but where known, the secondary structure was derived from
the crystal structure. The general features of the His-tagged
TraN construct were assessed with ProtParam (Gasteiger et
al., 2003).
3. Results
3.1. TraN localizes to the cytoplasm
To localize the TraN protein in vivo, an exponentially
growing culture of E. faecalis JH2-2 (pIP501) was fractionated
into cell-wall, membrane and cytoplasmic fractions as
described by Buttaro et al. (2000). TraN was exclusively found
in the cytoplasmic fraction (Fig. 1a). We exclude contamina-
tion of the cytoplasmic fraction with cell-envelope proteins
and vice versa as TraMpIP501, which is predicted by PSORTb to
localize to the cell envelope, was exclusively found in the cell-
envelope fractions (membrane and cell wall) but not in the
cytoplasm under the same conditions (Goessweiner-Mohr,
Grumet et al., 2013).
3.2. Biophysical characterization
The expression and purification of a His-tagged TraN
construct (17.6 kDa) have recently been reported (Goess-
weiner-Mohr et al., 2012). The protein eluted from the gel-
filtration column as a single peak (Supplementary Fig. S1a)
with an apparent molecular weight of 15.4 kDa, indicative of
a homogenous monomeric protein. Dynamic light-scattering
(DLS) measurements yielded a single peak with a calculated
polydispersity of 26.3% and a hydrodynamic radius (Rh) of
2.7 nm (Supplementary Fig. S1b).
SAXS measurements were performed to obtain further
information about the oligomeric state and shape of TraN in
solution. Data collection was performed on the X33 beamline
(DESY, Hamburg, Germany) for three different protein
concentrations. An I0 of 13.7 was calculated for the data at
medium concentration (1.57 mg ml�1), resulting in a mole-
cular weight of 14.1 kDa, which is in agreement with the
theoretical molecular weight of TraN (17.6 kDa). A radius of
gyration (Rg) of 2.28 nm was calculated from the Guinier plot
and a Dmax of 6 nm was determined from the p(r) function.
The TraN monomers in the crystal showed a maximal diameter
of only about 4.4 nm. An extended hydration shell may
explain the significantly larger particle depicted in the SAXS
measurements. On calculating ab initio models from the
scattering function we observed an elongated particle, which
may be owing to the flexible N-terminal end of the TraN
construct containing the unstructured His tag.
TraN is folded in solution and possesses a mixed �–�composition as shown by CD spectroscopy (Supplementary
Fig. S2a). The �-helical content exceeds that of �-sheets
research papers
2380 Gossweiner-Mohr et al. � TraN Acta Cryst. (2014). D70, 2376–2389
Figure 1TraN localization and MS analysis of TraN crystals. (a) TraN localizes tothe cytoplasm of pIP501-harbouring E. faecalis JH2-2 cells. TraN waslocalized in the cell fractions by Western blotting with anti-TraNantibodies. CW, cell wall; M, membrane; CP, cytoplasm. (b) MALDI-TOF analysis of TraN crystals.
electronic reprint

(Supplementary Fig. S2b). The large proportion of unordered
structure (27%) may result mainly from the N-terminal His
tag. Temperature scans revealed that TraN is a stable protein
with a melting temperature Tm of 55�C. Upon a thermal shift
to 95�C the protein unfolded completely, but it returned to its
original fold after cooling to RT (Supplementary Fig. S2c).
3.3. TraN binds to a sequence upstream of oriTpIP501
As TraN co-purified with DNA, we tested its ability to
interact with DNA molecules: the protein was incubated with
radiolabelled ssDNA and dsDNA oligonucleotides, respec-
tively, in electrophoretic mobility-shift assays (EMSA; data
not shown). The oligonucleotides had a length of 42 bases and
contained either the oriTpIP501 sequence (GenBank L39769.1,
bp 1259–1296) or a random sequence with no sequence simi-
larity to oriTpIP501. TraN showed only a weak shift for the
ssDNA oligonucleotides, whereas a significant shift was
observed for the dsDNA fragments. There was no difference
in the binding affinity between the random and the oriTpIP501-
containing oligonucleotide.
In order to check for a potential sequence-specific TraN
binding site on the pIP501 plasmid, we performed gel-shift
assays with dsDNA fragments containing the oriTpIP501
sequence as well as sequences upstream and downstream of
the oriTpIP501 region (Supplementary Fig. S3). All tested DNA
fragments were cooperatively shifted at higher TraN concen-
trations, thus confirming the nonspecific binding of our initial
EMSA experiments. A small but significant stepwise shift was
visible for fragments A and D using an equimolar
protein:DNA ratio. These two fragments both comprise a
common 149 bp sequence upstream of the oriT sequence
(Supplementary Fig. S3), which therefore has to contain a
preferred binding site. Fragments which did not comprise this
sequence (fragments B, G and H) did not exhibit a shift at
equimolar protein and DNA concentrations. Upon close
examination, fragments C, E and F also exhibited a defined,
albeit small, shift at equimolar TraN and DNA concentrations.
These three fragments contain the same 149 bp oriT upstream
sequence as fragments A and D but are significantly larger.
Thus, it appears that the smaller relative molecular mass
change through TraN binding results in a less pronounced shift
than for the smaller fragments A and D. From these experi-
ments we conclude that the 149 bp sequence of fragment D
contains a preferred high-affinity TraN binding site, as shown
in Supplementary Fig. S3.
3.4. Identification of the specific TraN binding site
We developed a new footprinting protocol based on 50-to-30
exonuclease digestion to identify the specific binding site of
TraN within the previously identified pIP501 sequence. The
new method was validated with three different DNA-binding
proteins: the bZIP protein GCN4 (PDB entry 2dgc; Keller et
al., 1995), the ribbon–helix–helix
protein ParD of the conjugative plasmid
RP4 (PDB entry 2an7; Oberer et al.,
2007) and the helix–turn–helix protein
ParR of the conjugative plasmid R1
(Breuner et al., 1996; Møller-Jensen et
al., 2007). In all three cases, the
published binding sites could be verified
by this novel method (N. Goessweiner-
Mohr & W. Keller, unpublished data
available on request).
In the case of TraN, the binding site
was determined as a 34 bp sequence
which is located 69 bp upstream of
oriTpIP501 (Fig. 2a; Supplementary Fig.
S4 shows an example of the
data obtained with the new method:
positions 1174–1207 on plasmid pIP501;
GenBank L39769.1). Notably, the TraN
binding site contains no direct or
inverted repeats but is heavily biased
towards A/T bases.
3.5. TraN DNA-binding mode andcharacterization
We investigated the thermal stability
of TraN in the presence and absence of
DNA using a Thermofluor-based assay.
As depicted in Fig. 2(b), the melting
temperature (Tm) of TraN alone
research papers
Acta Cryst. (2014). D70, 2376–2389 Gossweiner-Mohr et al. � TraN 2381
Figure 2The TraN specific binding site and its stabilizing effect on the protein. (a) Sequence of the 34 bpfragment identified as the specific binding site of TraN upstream of oriTpIP501. The position on thepIP501 plasmid sequence is indicated. (b) Thermofluor-based analysis of the TraN meltingtemperature without DNA (1), in the presence of a random 34-mer dsDNA oligonucleotide (2) andin the presence of the specific binding site (3). The standard deviation of each of the sets of 25individual measurements is displayed.
electronic reprint

amounted to 54.3 � 0.6�C; the binding of a nonspecific
(random) 34-mer dsDNA oligonucleotide raised the Tm to
65.2 � 0.6�C, whereas addition of DNA containing the specific
binding site increased the Tm to 70.4 � 0.2�C. The stabilizing
effect indicates an enhanced
binding affinity for the specific
binding site compared with the
random DNA.
To determine whether there
is a difference in the molar ratio
of the TraN–DNA interaction
between the random and the
specific oligonucleotides, as well
as to obtain information on the
respective binding constants and
�H values, we performed
isothermal titration calorimetry
(ITC) experiments with the
oligonucleotide containing the
binding site and the nonspecific
(random) oligonucleotides which
were used in the Thermofluor
experiments (Fig. 3 and Table 1).
In the titration setup with
nonspecific DNA two TraN
molecules bound to one dsDNA
fragment (in a 2:1 ratio), whereas
the stoichiometry for the specific
interaction was equimolar (1:1
ratio) as expected for the specific
binding site (Fig. 3b). We
observed a mixed pattern of
nonspecific and specific binding
in the first steps of the titration
with the fragment harbouring
the binding site. As these effects
could not be deconvoluted, we
performed a reverse titration in
which the DNA was in the
measuring cell and the concen-
trated protein was added. The
latter setup allowed a fit of a
two-binding-site interaction
model to the data. Owing to the
significantly stronger binding of
TraN to the specific binding site
(exothermic reaction; binding
constant of 107 M�1) compared
with the nonspecific reaction
(endothermic reaction; binding
constant of 105 M�2 and a 2:1
binding ratio), it seems that the
two sites are occupied consecu-
tively. The resulting binding
constants of the two calculated
sites correspond well to the
single titrations with specific and
nonspecific DNA, respectively. We conclude that the second
binding event of TraN to the specific DNA fragment is
equivalent to the interaction of TraN with a random DNA
sequence. To determine the difference in binding enthalpy
research papers
2382 Gossweiner-Mohr et al. � TraN Acta Cryst. (2014). D70, 2376–2389
Figure 3DNA-binding properties of TraN. Binding of TraN to a nonspecific 34-mer ds oligonucleotide (a) and thespecific 34-mer ds binding site DNA with DNA as injectant (b) and with protein as injectant (c) wereexamined via ITC. The higher affinity of TraN for its specific binding site was tested in a competitive bindingsetup (d) in which protein was pre-incubated with nonspecific DNA and the specific DNA was used as theinjectant.
electronic reprint

between the two modes of interaction, we performed a
competitive binding experiment. Again, the values corre-
sponded well to the results of the single titrations (Fig. 3d and
Table 1).
3.6. TraN crystallization and data collection
Crystals of TraN were obtained as described in Goess-
weiner-Mohr et al. (2012), leading to two different crystal
forms (using Index conditions 42 and 72).
The integrity of TraN in the crystals was examined by
matrix-assisted laser desorption/ionization time-of-flight
(MALDI-TOF) mass spectrometry (MS), which showed that
the protein in the crystals was significantly smaller than the
original His-tagged construct (17.6 kDa). Two peaks of equal
height with molecular masses of 14 222 and 14 478 Da,
respectively (Fig. 1b) were visible, implying two cleavage sites
with a distance of two amino acids. The His tag including the
TEV cleavage site and linker amount to a molecular weight of
research papers
Acta Cryst. (2014). D70, 2376–2389 Gossweiner-Mohr et al. � TraN 2383
Table 1ITC-derived binding properties of TraN to nonspecific and specific 34-mer ds oligonucleotides.
Reverse specific DNA Competitive binding
Nonspecific DNA Specific DNA Specific binding Nonspecific binding Nonspecific versus specific DNA
Molar ratio 0.512 � 0.115 1.03 � 0.005 1.08 � 0.004 1.01 � 0.055 0.797 � 0.004Binding constant† 1.04 � 105 � 3.02 � 104 7.23 � 106 � 7.72 � 105 3.38 � 107 � 3.31 � 106 1.36 � 105 � 2.46 � 104 1.45 � 107 � 1.77 � 106
�H (cal mol�1) 5380 � 1502 �10500 � 108 �12300 � 82 3811 � 262 �15100 � 109
† The unit of the binding constant is M�1 for 1:1 stoichiometry and M�2 for 1:2 stoichiometry.
Table 2Data-collection, phasing and refinement statistics.
Values in parentheses are for the highest resolution shell.
Crystal form I Crystal form II Crystal form III
Data 1 Data 2 Data 3
PDB code 4p0z 4p0y 4pm3Data collection
Beamline X06DA (PXIII), SLS X06DA (PXIII), SLS X06DA (PXIII), SLSSpace group P21 P21 P21
Detector MAR CCD MAR CCD MAR CCDUnit-cell parameters (A, �) a = 33.15, b = 55.09,
c = 35.52, � = 113.05a = 33.10, b = 62.82,
c = 55.87, � = 90.03a = 32.88, b = 54.94,
c = 57.71, � = 91.89Wavelength (A) 0.9794 0.9794 1.0615Resolution range (A) 28.57–1.325 (1.40–1.33) 22.78–1.35 (1.48–1.40) 28.97–1.80 (1.90–1.80)Rmeas (%) 9.9 (67.7) 9.1 (83.2) 14.1 (61.6)hI/�(I)i 5.1 (1.1) 14.3 (2.7) 8.8 (3.7)No. of molecules in asymmetric unit 1 2 2Matthews coefficient (A3 Da�1) 2.04 1.99 1.83Solvent content (%) 39.9 38.2 32.89Unique reflections 27168 (3914) 43358 (6179) 19191 (2804)Measured reflections 199889 (27845) 333921 (47047) 69059 (10004)Multiplicity 7.6 (7.1) 7.7 (7.6) 3.6 (3.6)Completeness (%) 99.3 (98.3) 96.4 (94.2) 100.0 (100.0)
RefinementResolution range (A) 32.68–1.35 21.35–1.40 28.97–1.80Unique reflections 25731 43358 19177R 0.1685 0.1833 0.1693Rfree 0.2022 0.2233 0.2134Rfree test-set size (%) 5 5 5No. of atoms
Protein 1014 1949 1886Water 215 231 234
B factors (A2)Protein 14.96 14.73 15.15Water 30.51 23.51 23.6Pt 22.22 [2 atoms]Br 43.72 [4 atoms]
Completeness (%) 99.4 96.1 99.95Average B factor (A2) 17.72 15.70 16.14R.m.s.d. from ideal values
Bond lengths (A) 0.025 0.024 0.007Bond angles (�) 2.481 2.701 0.962
Ramachandran outliers 0 0 0Ramachandran favoured (%) 98.33 99.12 99.10Rotamer outliers 0/110 8/212 2/204MolProbity score 0.96 [99rd percentile] 1.69 [65th percentile] 1.13 [99th percentile]
electronic reprint
3213 Da (ExPASy; Gasteiger et al., 2003), corresponding well
to the difference between the full-length protein and the two
species of TraN observed in the crystals. This indicates that the
N-terminal tag of TraN is cleaved by in situ proteolysis during
the crystallization process.
Details of the crystallization of selenomethionine-deriva-
tized TraN as well as data collection, processing and refine-
ment are described in x2.
3.7. The TraN crystal structure
Table 2 provides an overview of the data-collection, phasing
and refinement statistics of the three data sets. Three different
crystal forms with one (crystal form I) or two (crystal forms II
and III) molecules per asymmetric unit were found. The
N-terminal His tag and five residues at the C-terminal end
of TraN were not observed in the electron-density map. This
finding matches the loss of about 30 residues indicated by MS
analysis of TraN crystals. Supplementary Fig. S5 provides an
overview of the TraN construct as well as the predicted and
actual secondary-structure content of the protein. The final
coordinates and structure-factor amplitudes have been
deposited in the PDB as entries 4p0z (crystal form I), 4p0y
(crystal form II) and 4pm3 (crystal form III) .
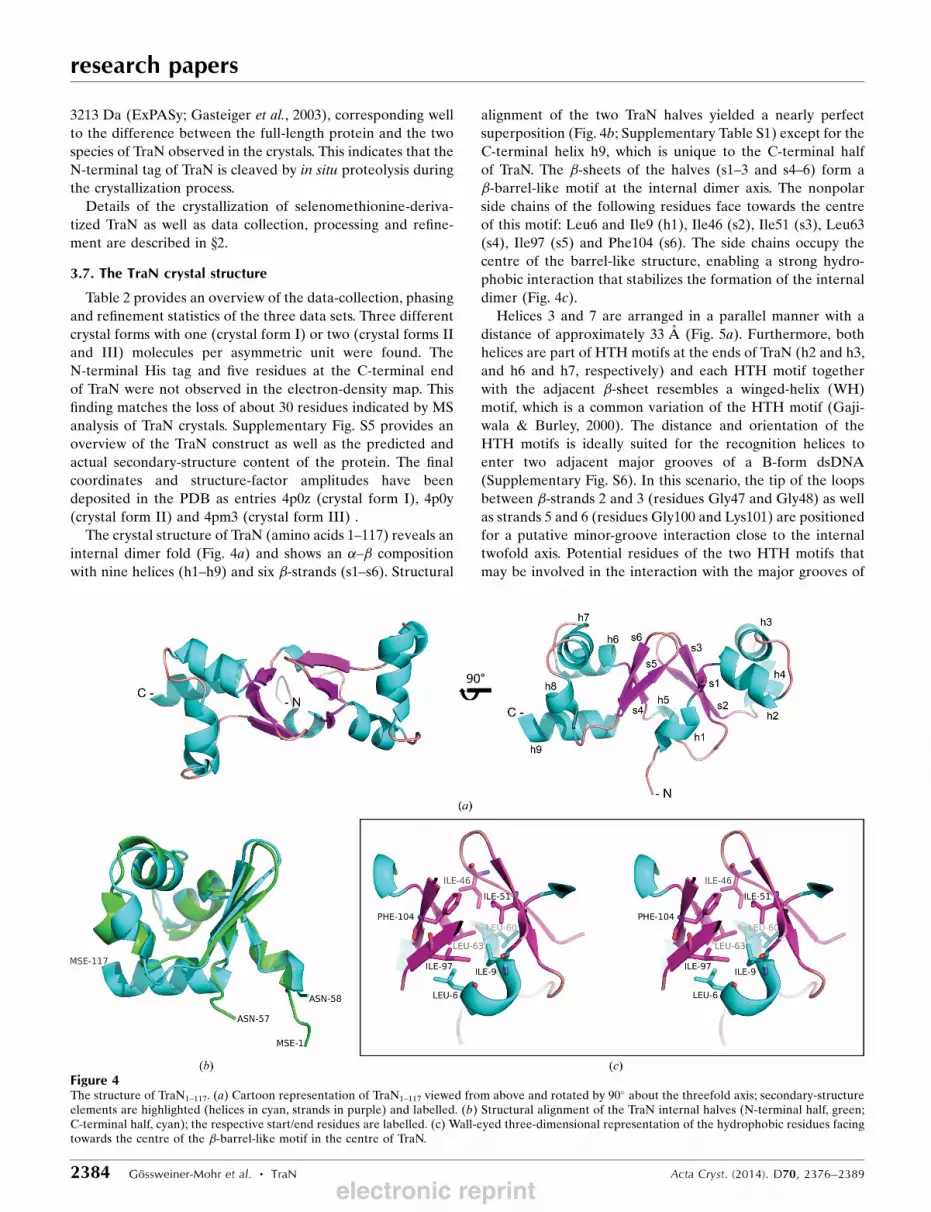
The crystal structure of TraN (amino acids 1–117) reveals an
internal dimer fold (Fig. 4a) and shows an �–� composition
with nine helices (h1–h9) and six �-strands (s1–s6). Structural
alignment of the two TraN halves yielded a nearly perfect
superposition (Fig. 4b; Supplementary Table S1) except for the
C-terminal helix h9, which is unique to the C-terminal half
of TraN. The �-sheets of the halves (s1–3 and s4–6) form a
�-barrel-like motif at the internal dimer axis. The nonpolar
side chains of the following residues face towards the centre
of this motif: Leu6 and Ile9 (h1), Ile46 (s2), Ile51 (s3), Leu63
(s4), Ile97 (s5) and Phe104 (s6). The side chains occupy the
centre of the barrel-like structure, enabling a strong hydro-
phobic interaction that stabilizes the formation of the internal
dimer (Fig. 4c).
Helices 3 and 7 are arranged in a parallel manner with a
distance of approximately 33 A (Fig. 5a). Furthermore, both
helices are part of HTH motifs at the ends of TraN (h2 and h3,
and h6 and h7, respectively) and each HTH motif together
with the adjacent �-sheet resembles a winged-helix (WH)
motif, which is a common variation of the HTH motif (Gaji-
wala & Burley, 2000). The distance and orientation of the
HTH motifs is ideally suited for the recognition helices to
enter two adjacent major grooves of a B-form dsDNA
(Supplementary Fig. S6). In this scenario, the tip of the loops
between �-strands 2 and 3 (residues Gly47 and Gly48) as well
as strands 5 and 6 (residues Gly100 and Lys101) are positioned
for a putative minor-groove interaction close to the internal
twofold axis. Potential residues of the two HTH motifs that
may be involved in the interaction with the major grooves of
research papers
2384 Gossweiner-Mohr et al. � TraN Acta Cryst. (2014). D70, 2376–2389
Figure 4The structure of TraN1–117. (a) Cartoon representation of TraN1–117 viewed from above and rotated by 90� about the threefold axis; secondary-structureelements are highlighted (helices in cyan, strands in purple) and labelled. (b) Structural alignment of the TraN internal halves (N-terminal half, green;C-terminal half, cyan); the respective start/end residues are labelled. (c) Wall-eyed three-dimensional representation of the hydrophobic residues facingtowards the centre of the �-barrel-like motif in the centre of TraN.
electronic reprint

DNA are Lys13, Asn22, Arg23, Asn24, Gln28, Arg31 and
Asn32 of the N-terminal half and Lys67, Asn76, Asp77, Glu78,
His82, Lys85 and Arg86 of the C-terminal half of TraN,
respectively (Fig. 5b). We aligned the two halves of TraN,
calculating the identity scores for the sequence and the
secondary-structure composition, and compared the binding
motifs. The sequence identity between the two halves is only
about 30%, but the secondary-structure similarity is greater
than 80% (Table S1). While the putative N-terminal binding
motif (boxed amino acids in Fig. 5c) is mostly comprised of
neutral or positively charged residues, the C-terminal motif
contains two negatively charged residues, and five of the nine
putative DNA-binding residues show non-conserved changes
(Fig. 5c). This asymmetry in DNA-binding motifs suggests that
different DNA half-sites should be recognized by the N- and
C-terminal domains of TraN, which is in good agreement with
the experimentally identified DNA-binding site of TraN, which
actually does not contain inverted repeats.
3.8. TraN shows structural similarity to excisionases and theMerR family of transcriptional regulators
In searches for structurally similar proteins we only found
hits that resemble one half of TraN. Consequently, we
continued the search with only the larger C-terminal half of
the protein. A closer examination of structural relatives (data
not shown) revealed a relation to the structures of an exci-
sionase from conjugative transposon Tn916 from E. faecalis
(PDB entry 1y6u; Abbani et al., 2005) and an excisionase
encoded by the Klebsiella pneumoniae genome (PDB entry
2kvv; Northeast Structural Genomics Consortium, unpub-
lished work). Furthermore, excisionases from several bacterio-
phages such as phage � (PDB entry 1rh6; Sam et al., 2004) and
phage HK022 (PDB entry 1pm6; Rogov et al., 2003) seem to
share this fold. Excisionases (or Xis proteins) are required for
the excision of bacteriophage DNA integrated in the genome
of a host bacterium (Landy, 1989). Upon induction of a
bacteriophage � lysogen, the excision of the phage genome is
performed via a site-specific recombination reaction (Sam et
al., 2002). The Xis protein thus functions as a DNA archi-
tectural factor (Vargas & Landy, 1991; Abbani et al., 2007),
which allows the integrase (Int) to switch to a second mode of
action, namely the excision of the integrated DNA. Like
bacteriophages, most of the time conjugative transposons are
integrated into the bacterial host genome. To enable propa-
gation, the integrated DNA is similarly excised from the host
genome (Sam et al., 2002).
The TraN fold also resembles that of the N-terminal domain
of transcriptional regulators (TR) of the MerR family, for
research papers
Acta Cryst. (2014). D70, 2376–2389 Gossweiner-Mohr et al. � TraN 2385
Figure 5Structural basis for DNA binding of TraN. (a) Cartoon representation of TraN with the distance between the two parallel helices indicated; the lengthwas measured in Coot. (b) Highlight of the TraN residues (yellow and labelled) putatively interacting with two succeeding major grooves of dsDNAviewed from above and rotated by 90� about the threefold axis. (c) Sequence and secondary-structure-based alignment of the two TraN internal halves[residues 1–57 (N-terminal half) and 58–117 (C-terminal half)]. Secondary-structure elements are highlighted (helices in cyan, �-strands in purple),identical amino acids are marked with a grey background and the putative DNA-binding residues are boxed and coloured according to their net charge.
electronic reprint

example a transcriptional activator from Bacillus thuringiensis
(PDB entry 3gpv; New York SGX Research Center for
Structural Genomics, unpublished work). Transcriptional
activators of the MerR family feature an N-terminal WH
DNA-binding region and recognize the specific DNA site as a
dimer where the recognition helices of the HTH motifs are
inserted into two adjacent major grooves. The dimerization
motif of MerR proteins is a coiled-coil arrangement between
the C-terminal parts of two MerR proteins (Supplementary
Fig. S6), which is completely different from the internal
dimer configuration of TraN, which is based on hydrophobic
interactions within a �-barrel-like motif in its centre. It is
interesting to note that the three-stranded �-sheet of this
motif corresponds to the ‘wing’ of the WH motif of MerR,
which in the protein–DNA complexes of MerR family
members is inserted into the minor grooves adjacent to the
major groove-embedded recognition helices (Newberry &
Brennan, 2004). In contrast to the MerR family proteins,
which feature a C-terminal effector-binding region (Brown et
al., 2003), neither TraN nor the TraN-like proteins of
related T4SSs (see below) contain such a C-terminal
extension.
Despite the low sequence identity of 8–13% between the
TraN C-terminal domain and the respective domains of the
compared proteins (Supplementary Table S1), the fold of all
aligned proteins is highly conserved (Fig. 6). A distinct feature
of the TraN fold is a short helix adjacent to the putative DNA-
recognition helix (h4 next to h3 in the N-terminal half and h8
next to h7 in the C-terminal half of TraN; Fig. 4a). This feature
is not observed in the excisionase proteins or in the MerR
family proteins (Fig. 6), suggesting that TraN-like proteins
form a unique subgroup of the WH proteins.
We performed an extended search for TraN-like proteins
(i.e. containing the internal dimer arrangement of the two
HTH domains) in a broad spectrum of conjugative plasmids,
transposons, ICEs and GIs from G� and G+ bacteria. All
TraN-like proteins found are of enterococcal origin (Supple-
mentary Fig. S7) and show a high sequence identity to TraN.
All other proteins identified (excisionases and proteins
belonging to the MerR family) contained only a single TraN-
like domain.
4. Discussion
The research field of conjugative DNA transport has attracted
increasing attention over the last decades. This is largely owing
to its enormous importance in human healthcare: conjugative
transfer greatly increases prokaryotic genome plasticity and
has been identified as a major vehicle for the spread of anti-
biotic resistance among pathogens and commensal bacteria
(Zechner et al., 2012).
The structural elucidation of the core complex of the
pKM101 T4SS from E. coli by electron microscopy and X-ray
crystallography was the most important recent contribution
to the understanding of the assembly and core-complex
architecture of the G� conjugation apparatus (Chandran
et al., 2009; Fronzes et al., 2009; Rivera-Calzada et al., 2013).
Unfortunately, less progress has been achieved for the corre-
research papers
2386 Gossweiner-Mohr et al. � TraN Acta Cryst. (2014). D70, 2376–2389
Figure 6Structural comparison of TraN with itself and with related proteins. Cartoon representation of the TraN C-terminal and N-terminal halves, Xis fromTn916 from E. faecalis (PDB entry 1y6u), an excisionase from K. pneumoniae (PDB entry 2kvv), Xis from bacteriophage � (1rh6), Xis frombacteriophage HK022 (PDB entry 1pm6) and a transcriptional regulator (TR) of the MerR family from B. thuringiensis (PDB entry 3gpv); secondary-structure elements are highlighted (helices in cyan, �-sheets in magenta).
electronic reprint

sponding systems of G+ origin, in spite of the occurrence of
major multi-resistant human pathogens such as enterococci,
streptococci or staphylococci in this group of bacteria (Burns,
2003). Only very recently has structural information become
available for G+ T4SSs: the structure of the VirB8-like
transfer protein TcpC from C. perfringens plasmid pCW3
(Porter et al., 2012) was reported in early 2012, followed by the
structure of VirB4 from T. pseudethanolicus (Wallden et al.,
2012), the structure of the VirB8-like protein TraM from
E. faecalis conjugative plasmid pIP501 (Goessweiner-Mohr,
Grumet et al., 2013) and, most recently, the 3.0 A resolution
structure of the TraKpIP501 extracellular domain (Goess-
weiner-Mohr et al., 2014).
In this study, structural and biophysical approaches were
used to characterize TraN, a putative T4SS protein from the
E. faecalis conjugative model plasmid pIP501. It is the third
structure to be reported of a component of the pIP501 T4SS.
TraN localizes to the cytoplasm and was found to bind
preferentially to dsDNA, which points to a role in DNA
processing prior to the actual transport of the single-stranded
plasmid to the recipient cell. Based on the structural resem-
blance of TraN to the DNA-binding domains of prokaryotic
transcription regulators, we predicted that TraN would be a
specific DNA-binding protein and we were finally able to
identify a 34 bp sequence upstream of oriTpIP501 as the high-
affinity binding site. These findings suggest several possible
roles for TraN in the pIP501 transfer process.
Firstly, TraN may act as an accessory protein for the pIP501-
encoded relaxase TraA. The role of accessory proteins is well
understood in G� T4S: detailed overviews of the conjugative
DNA metabolism in G� bacteria have been published by de la
Cruz et al. (2010) as well as by Zechner et al. (2012). In the case
of IncF plasmids, TraY is responsible for the bending of DNA
(Luo et al., 1994) and the subsequent relaxase binding and
nicking in preparation for conjugative DNA transfer (Inamoto
et al., 1994; Howard, 1995; Karl et al., 2001). A second protein,
TraM, binds the DNA as a tetramer at preferred sites close to
the oriT (Verdino et al., 1999; Wong et al., 2011). It was shown
to promote relaxosome formation and to stimulate the nic-
cleavage and oriT DNA-unwinding reactions of TraI (Rago-
nese et al., 2007; Sut et al., 2009). Moreover, it was found to
promote interactions between the coupling protein TraD and
the relaxosome (Beranek et al., 2004; Lu et al., 2008).
Our data suggest a functional role for TraNpIP501 similar
to that of the IncF auxiliary proteins TraM and TraY. This
hypothesis is based on the preferred binding of TraN upstream
of the pIP501 oriT DNA sequence, which implies an invol-
vement in the activity of the relaxase TraA at the nic site. The
two-domain HTH-like fold of the TraN crystal structure
suggests a DNA-binding mode in which two adjacent major
grooves of DNA are occupied, possibly including the bending
or local unwinding of the plasmid DNA which are supposedly
necessary for relaxase activity in vivo (Zechner et al., 2012).
Furthermore, TraN could be involved in connecting the
relaxosome complex to proteins of the pIP501 secretion
machinery. TraN has been reported to interact with the
ATPase TraE, the muramidase TraG, the membrane-associated
protein TraH and the polytopic protein TraL, as shown by
yeast two-hybrid and pull-down assays (Abajy et al., 2007) as
well as with the coupling protein TraJ (Goessweiner-Mohr et
al., unpublished work). The latter resembles the interaction of
the IncF auxiliary protein TraM with the respective coupling
protein TraD (Beranek et al., 2004; Lu et al., 2008). However,
we could not prove an interaction between TraN and the
relaxase TraA using a yeast two-hybrid system (Abajy et al.,
2007).
Secondly, and surprisingly, TraN shows structural simila-
rities to excisionases from bacteriophages and from the
conjugative transposon Tn916. Via the bending of DNA and
interaction with the integrase, the excisionase is responsible
for a switch in the mode of operation of the integrase which
leads to the excision of the mobile genetic element (Calı et al.,
2004; Singh et al., 2014). A similar function for TraN is un-
likely, since (i) pIP501 is not integrated in the chromosome
and (ii) the excisionases only resemble the fold of one TraN
domain. The proposed binding for a single TraN domain
involves the interaction of the HTH motif with the major
groove as well as of the loop between the two �-strands with
the minor groove. Although this mode of binding is very
similar to the observed mode of interaction of excisionases
with their target sequence (Sam et al., 2002), the symmetric
arrangement of the two HTH domains of TraN demands a
distinctly different mode of DNA interaction.
Nevertheless, TraN could have an excisionase-like function
by carrying out a role in altering the DNA architecture and
stimulating relaxase activity. It could be proposed that TraN
causes changes in the DNA structure at the oriT site on an
already assembled TraA–DNA complex to stimulate cleavage
of the nic site, similar to the mode of function of excisionases
(Ramsay et al., 2006). This model is distinct from that for other
relaxase accessory proteins described above, but is supported
by our previous and current work and by the genetic organi-
zation of the traA–traO operon. The following model could be
suggested. (i) Transcription of the tra operon initiates from the
promoter upstream of traA and TraA immediately binds the
oriT and represses further expression of the operon (Kuren-
bach et al., 2006), but is not able to immediately catalyze
nicking of the oriT. (ii) Since TraN is encoded by the second-
last gene in the operon (orf14), nearly all putative mating pore
proteins are translated before TraN. (iii) TraN is finally
expressed, binds and bends the DNA upstream of the TraA–
DNA complex and thereby stimulates nicking and subsequent
transfer of the pIP501 plasmid.
A third possible function of TraN concerns its structural
relation to transcriptional regulators of the MerR family.
This class of transcriptional regulators have been reported to
be involved in numerous metal-dependent stress-response
mechanisms (Hobman, 2007; Kidd et al., 2011; McEwan et al.,
2011; Liao & Sauer, 2012). Moreover, MerR-like regulators
have also been reported to be involved in bacterial virulence
(Stroeher et al., 2007). Similar to the excisionases, MerR-like
proteins only resemble the fold of a single TraN domain, but
their mode of binding to DNA involves the formation of a
homodimer (PDB entry 3gpv) which binds to two adjacent
research papers
Acta Cryst. (2014). D70, 2376–2389 Gossweiner-Mohr et al. � TraN 2387electronic reprint

major grooves of dsDNA, as proposed for TraN. Expression of
the pIP501 transfer genes is already under auto-regulation by
TraA relaxase (Kurenbach et al., 2006), thus TraN might fulfil
a different role in the control of pIP501 plasmid transfer.
We suggest that TraN may work as a transfer regulator by
preventing the pIP501 plasmid DNA from being nicked by the
relaxase without the establishment of cell-to-cell contact and
formation of the conjugative core complex. Interestingly, TraN
has been shown to interact with several key components of
the pIP501 T4SS, despite being localized in the cytoplasm.
Through these interactions, for example with the ATPase
TraE, the muramidase TraG and the coupling protein TraJ,
TraN could be prompted to release the plasmid DNA and
would subsequently allow the relaxase to nick the plasmid
DNA at the oriT site. The proposed mechanism would ensure
that the relaxase-dependent processing of the conjugative
plasmid is only started once the transfer apparatus has been
assembled. A major question remains concerning the late
expression of the TraN protein as the second-last gene in the
polycistronic mRNA of the transfer region. This raises the
question whether TraN is indeed capable of playing the
proposed crucial regulatory role in the early steps of the
transfer process.
TraN-like proteins are rarely found among T4SSs. In fact,
only five other proteins with an equivalent internal dimer fold
have been identified to date, all of which are of enterococcal
origin (Supplementary Fig. S7). These findings imply that the
corresponding conjugative systems might all have developed
from an ancestral G+ T4SS and that the separation into
distinct conjugative plasmids and ICEs has happened rela-
tively recently. An explanation for the rare presence of TraN-
like proteins in T4SSs could be the host range of the respective
T4SSs. pIP501 has the broadest host range of known G+
T4SSs and has been even shown to stably replicate in bacteria
of G� origin (Kurenbach et al., 2003). Consequently, TraN-
like proteins might play an important role in the adaptation of
their respective T4SSs to new hosts. This adaptation probably
involves the regulation or the adjustment of the specific
processing of the conjugative plasmid DNA.
The structure of TraN and the elucidation of its DNA-
binding properties are milestones in the growing under-
standing of G+ T4S. Nevertheless, further efforts are needed
to decipher the specific function of TraN-like proteins.
5. Related literature
The following reference is cited in the Supporting Information
for this article: van Dijk & Bonvin (2009).
This work was supported by the Austrian Science Fund
(FWF) projects P19794 and F4604. Staff support during data
collection at the SLS synchrotron X06DA beamline and the
DESY X33 SAXS beamline is gratefully acknowledged. EG
was supported by the European Union Sixth Framework
Program ‘Approaches to Control Multi-resistant Enterococci
ACE’ (LSHE-CT-2007-037410).
References
Abajy, M. Y., Kopec, J., Schiwon, K., Burzynski, M., Doring, M.,Bohn, C. & Grohmann, E. (2007). J. Bacteriol. 189, 2487–2496.
Abbani, M., Iwahara, M. & Clubb, R. T. (2005). J. Mol. Biol. 347,11–25.
Abbani, M. A., Papagiannis, C. V., Sam, M. D., Cascio, D., Johnson,R. C. & Clubb, R. T. (2007). Proc. Natl Acad. Sci. USA, 104, 2109–2114.
Adams, P. D. et al. (2010). Acta Cryst. D66, 213–221.Afonine, P. V., Grosse-Kunstleve, R. W., Echols, N., Headd, J. J.,
Moriarty, N. W., Mustyakimov, M., Terwilliger, T. C., Urzhumtsev,A., Zwart, P. H. & Adams, P. D. (2012). Acta Cryst. D68, 352–367.
Alvarez-Martinez, C. E. & Christie, P. J. (2009). Microbiol. Mol. Biol.Rev. 73, 775–808.
Arends, K., Celik, E. K., Probst, I., Goessweiner-Mohr, N., Fercher,C., Grumet, L., Soellue, C., Abajy, M. Y., Sakinc, T., Broszat, M.,Schiwon, K., Koraimann, G., Keller, W. & Grohmann, E. (2013). J.Bacteriol. 195, 4436–4444.
Atmakuri, K., Cascales, E. & Christie, P. J. (2004). Mol. Microbiol. 54,1199–1211.
Battye, T. G. G., Kontogiannis, L., Johnson, O., Powell, H. R. & Leslie,A. G. W. (2011). Acta Cryst. D67, 271–281.
Beranek, A., Zettl, M., Lorenzoni, K., Schauer, A., Manhart, M. &Koraimann, G. (2004). J. Bacteriol. 186, 6999–7006.
Breuner, A., Jensen, R. B., Dam, M., Pedersen, S. & Gerdes, K.(1996). Mol. Microbiol. 20, 581–592.
Brown, N. L., Stoyanov, J. V., Kidd, S. P. & Hobman, J. L. (2003).FEMS Microbiol. Rev. 27, 145–163.
Burns, D. L. (2003). Curr. Opin. Microbiol. 6, 29–34.Buttaro, B. A., Antiporta, M. H. & Dunny, G. M. (2000). J. Bacteriol.182, 4926–4933.
Calı, S., Spoldi, E., Piazzolla, D., Dodd, I. B., Forti, F., Deho, G. &Ghisotti, D. (2004). Virology, 322, 82–92.
Cascales, E. & Christie, P. J. (2003). Nature Rev. Microbiol. 1, 137–149.Chandran, V., Fronzes, R., Duquerroy, S., Cronin, N., Navaza, J. &
Waksman, G. (2009). Nature (London), 462, 1011–1015.Chen, V. B., Arendall, W. B., Headd, J. J., Keedy, D. A., Immormino,
R. M., Kapral, G. J., Murray, L. W., Richardson, J. S. & Richardson,D. C. (2010). Acta Cryst. D66, 12–21.
Chen, Y., Zhang, X., Manias, D., Yeo, H.-J., Dunny, G. M. & Christie,P. J. (2008). J. Bacteriol. 190, 3632–3645.
Christie, P. J., Whitaker, N. & Gonzalez-Rivera, C. (2014). Biochim.Biophys. Acta, 1843, 1578–1591.
Cruz, F. de la, Frost, L. S., Meyer, R. J. & Zechner, E. L. (2010). FEMSMicrobiol. Rev. 34, 18–40.
Dijk, M. van & Bonvin, A. M. J. J. (2009). Nucleic Acids Res. 37,W235–W239.
Dror, O., Benyamini, H., Nussinov, R. & Wolfson, H. (2003).Bioinformatics, 19, i95–104.
Emsley, P., Lohkamp, B., Scott, W. G. & Cowtan, K. (2010). ActaCryst. D66, 486–501.
Evans, P. (2006). Acta Cryst. D62, 72–82.Fronzes, R., Schafer, E., Wang, L., Saibil, H. R., Orlova, E. V. &
Waksman, G. (2009). Science, 323, 266–268.Gajiwala, K. S. & Burley, S. K. (2000). Curr. Opin. Struct. Biol. 10,
110–116.Gasteiger, E., Gattiker, A., Hoogland, C., Ivanyi, I., Appel, R. D. &
Bairoch, A. (2003). Nucleic Acids Res. 31, 3784–3788.Goessweiner-Mohr, N., Arends, K., Keller, W. & Grohmann, E.
(2013). Plasmid, 70, 289–302.Goessweiner-Mohr, N., Fercher, C., Abajy, M. Y., Grohmann, E. &
Keller, W. (2012). Acta Cryst. F68, 1402–1405.Goessweiner-Mohr, N., Fercher, C., Arends, K., Birner-Gruenberger,
R., Laverde-Gomez, D., Huebner, J., Grohmann, E. & Keller, W.(2014). Acta Cryst. D70, 1124–1135.
Goessweiner-Mohr, N., Grumet, L., Arends, K., Pavkov-Keller, T.,Gruber, C. C., Gruber, K., Birner-Gruenberger, R., Kropec-
research papers
2388 Gossweiner-Mohr et al. � TraN Acta Cryst. (2014). D70, 2376–2389
electronic reprint

Huebner, A., Huebner, J., Grohmann, E. & Keller, W. (2013). J.Biol. Chem. 288, 2018–2028.
Gomis-Ruth, F. X., Moncalıan, G., de la Cruz, F. & Coll, M. (2001). J.Biol. Chem. 277, 7556–7566.
Gomis-Ruth, F. X., Sola, M., de la Cruz, F. & Coll, M. (2004). Curr.Pharm. Des. 10, 1551–1565.
Grohmann, E., Muth, G. & Espinosa, M. (2003). Microbiol. Mol. Biol.Rev. 67, 277–301.
Hayes, C. S., Aoki, S. K. & Low, D. A. (2010). Annu. Rev. Genet. 44,71–90.
Hobman, J. L. (2007). Mol. Microbiol. 63, 1275–1278.Holm, L. & Rosenstrom, P. (2010). Nucleic Acids Res. 38, W545–
W549.Howard, M. T. (1995). J. Biol. Chem. 270, 28374–28380.Inamoto, S., Fukuda, H., Abo, T. & Ohtsubo, E. (1994). J. Biochem.116, 838–844.
Jones, D. T. (1999). J. Mol. Biol. 292, 195–202.Jones, D. T., Taylor, W. R. & Thornton, J. M. (1994). Biochemistry, 33,
3038–3049.Kabsch, W. (2010). Acta Cryst. D66, 125–132.Kantardjieff, K. A. & Rupp, B. (2003). Protein Sci. 12, 1865–1871.Karl, W., Bamberger, M. & Zechner, E. L. (2001). J. Bacteriol. 183,
909–914.Kawabata, T. (2003). Nucleic Acids Res. 31, 3367–3369.Keller, W., Konig, P. & Richmond, T. J. (1995). J. Mol. Biol. 254,
657–667.Kidd, S. P., Djoko, K. Y., Ng, J., Argente, M. P., Jennings, M. P. &
McEwan, A. G. (2011). Metallomics, 3, 1009–1018.Konarev, P. V., Volkov, V. V., Sokolova, A. V., Koch, M. H. J. &
Svergun, D. I. (2003). J. Appl. Cryst. 36, 1277–1282.Krissinel, E. & Henrick, K. (2004). Acta Cryst. D60, 2256–2268.Kurenbach, B., Bohn, C., Prabhu, J., Abudukerim, M., Szewzyk, U. &
Grohmann, E. (2003). Plasmid, 50, 86–93.Kurenbach, B., Kopec, J., Magdefrau, M., Andreas, K., Keller, W.,
Bohn, C., Abajy, M. Y. & Grohmann, E. (2006). Microbiology, 152,637–645.
Landy, A. (1989). Annu. Rev. Biochem. 58, 913–949.Laverde Gomez, J. A., Bhatty, M. & Christie, P. J. (2014). J. Bacteriol.196, 527–539.
Liao, J. & Sauer, K. (2012). J. Bacteriol. 194, 4823–4836.Llosa, M., Gomis-Ruth, F. X., Coll, M. & de la Cruz, F. (2002). Mol.
Microbiol. 45, 1–8.Llosa, M., Roy, C. & Dehio, C. (2009). Mol. Microbiol. 73, 141–151.Lu, J., Wong, J. J. W., Edwards, R. A., Manchak, J., Frost, L. S. &
Glover, J. N. M. (2008). Mol. Microbiol. 70, 89–99.Luo, Y., Gao, Q. & Deonier, R. C. (1994). Mol. Microbiol. 11,
459–469.McEwan, A. G., Djoko, K. Y., Chen, N. H., Counago, R. L., Kidd, S. P.,
Potter, A. J. & Jennings, M. P. (2011). Adv. Microb. Physiol. 58,1–22.
Moitoso de Vargas, L. & Landy, A. (1991). Proc. Natl Acad. Sci. USA,88, 588–592.
Møller-Jensen, J., Ringgaard, S., Mercogliano, C. P., Gerdes, K. &Lowe, J. (2007). EMBO J. 26, 4413–4422.
Murshudov, G. N., Skubak, P., Lebedev, A. A., Pannu, N. S., Steiner,R. A., Nicholls, R. A., Winn, M. D., Long, F. & Vagin, A. A. (2011).Acta Cryst. D67, 355–367.
Newberry, K. J. & Brennan, R. G. (2004). J. Biol. Chem. 279, 20356–20362.
Nugent, T. & Jones, D. T. (2009). BMC Bioinformatics, 10, 159.Oberer, M., Zangger, K., Gruber, K. & Keller, W. (2007). Protein Sci.16, 1676–1688.
Petoukhov, M. V. & Svergun, D. I. (2005). Biophys. J. 89, 1237–1250.Porter, C. J., Bantwal, R., Bannam, T. L., Rosado, C. J., Pearce, M. C.,
Adams, V., Lyras, D., Whisstock, J. C. & Rood, J. I. (2012). Mol.Microbiol. 83, 275–288.
Ragonese, H., Haisch, D., Villareal, E., Choi, J. H. & Matson, S. W.(2007). Mol. Microbiol. 63, 1173–1184.
Ramsay, J. P., Sullivan, J. T., Stuart, G. S., Lamont, I. L. & Ronson,C. W. (2006). Mol. Microbiol. 62, 723–734.
Rego, A. T., Chandran, V. & Waksman, G. (2010). Biochem. J. 425,475–488.
Rivera-Calzada, A., Fronzes, R., Savva, C. G., Chandran, V., Lian, P.W., Laeremans, T., Pardon, E., Steyaert, J., Remaut, H., Waksman,G. & Orlova, E. V. (2013). EMBO J. 32, 1195–1204.
Rogov, V. V., Lucke, C., Muresanu, L., Wienk, H., Kleinhaus, I.,Werner, K., Lohr, F., Pristovsek, P. & Ruterjans, H. (2003). Eur. J.Biochem. 270, 4846–4858.
Rosvoll, T. C., Pedersen, T., Sletvold, H., Johnsen, P. J., Sollid, J. E.,Simonsen, G. S., Jensen, L. B., Nielsen, K. M. & Sundsfjord, A.(2010). FEMS Immunol. Med. Microbiol. 58, 254–268.
Sam, M. D., Cascio, D., Johnson, R. C. & Clubb, R. T. (2004). J. Mol.Biol. 338, 229–240.
Sam, M. D., Papagiannis, C. V., Connolly, K. M., Corselli, L., Iwahara,J., Lee, J., Phillips, M., Wojciak, J. M., Johnson, R. C. & Clubb, R. T.(2002). J. Mol. Biol. 324, 791–805.
Sheldrick, G. M. (2010). Acta Cryst. D66, 479–485.Singh, S., Plaks, J. G., Homa, N. J., Amrich, C. G., Heroux, A., Hatfull,
G. F. & VanDemark, A. P. (2014). J. Mol. Biol. 426, 412–422.Smillie, C., Garcillan-Barcia, M. P., Francia, M. V., Rocha, E. P. C. &
de la Cruz, F. (2010). Microbiol. Mol. Biol. Rev. 74, 434–452.Stroeher, U. H., Kidd, S. P., Stafford, S. L., Jennings, M. P., Paton, J. C.
& McEwan, A. G. (2007). J. Infect. Dis. 196, 1820–1826.Sut, M. V., Mihajlovic, S., Lang, S., Gruber, C. J. & Zechner, E. L.
(2009). J. Bacteriol. 191, 6888–6899.Svergun, D. I. (1992). J. Appl. Cryst. 25, 495–503.Svergun, D., Barberato, C. & Koch, M. H. J. (1995). J. Appl. Cryst. 28,
768–773.Svergun, D. I., Petoukhov, M. V. & Koch, M. H. J. (2001). Biophys. J.80, 2946–2953.
Thanassi, D. G., Bliska, J. B. & Christie, P. J. (2012). FEMS Microbiol.Rev. 36, 1046–1082.
Tusnady, G. E. & Simon, I. (2001). Bioinformatics, 17, 849–850.Vagin, A. & Teplyakov, A. (2010). Acta Cryst. D66, 22–25.Verdino, P., Keller, W., Strohmaier, H., Bischof, K., Lindner, H. &
Koraimann, G. (1999). J. Biol. Chem. 274, 37421–37428.Wallden, K., Rivera-Calzada, A. & Waksman, G. (2010). Cell.
Microbiol. 12, 1203–1212.Wallden, K., Williams, R., Yan, J., Lian, P. W., Wang, L., Thalassinos,
K., Orlova, E. V. & Waksman, G. (2012). Proc. Natl Acad. Sci. USA,109, 11348–11353.
Whitmore, L. & Wallace, B. A. (2008). Biopolymers, 89, 392–400.Williams, J. J. & Hergenrother, P. J. (2008). Curr. Opin. Chem. Biol.12, 389–399.
Wong, J. J. W., Lu, J., Edwards, R. A., Frost, L. S. & Glover, J. N. M.(2011). Nucleic Acids Res. 39, 6775–6788.
Zechner, E. L., Lang, S. & Schildbach, J. F. (2012). Philos. Trans. R.Soc. Lond. B Biol. Sci. 367, 1073–1087.
research papers
Acta Cryst. (2014). D70, 2376–2389 Gossweiner-Mohr et al. � TraN 2389electronic reprint