Thao Tran 16891 W1 WA7 BIOL3311 F.2012
43
1 Analyzing the Genetics of a Mutant gene abrupt in Drosophila Melanogaster through Classical Crosses, PCR, and BLAST Analysis Thao Tran College of Natural Sciences and Mathematics Department of Biology and Biochemistry University of Houston Semester Project Manuscript BIOL 3311 Fall 2012 Date Submitted: 12/10/2012 Lab TA Instructor: Deepika Kumar Lab Section: 16891/ Wednesday 1 Drawer Group Number: 30 Unknown Mutant Code: 333 Group members: Scott Moncrieff, Amsale Derese, Lorraine Velasquez, Linh Nguyen
-
Upload
independent -
Category
Documents
-
view
1 -
download
0
Transcript of Thao Tran 16891 W1 WA7 BIOL3311 F.2012

1
Analyzing the Genetics of a Mutant gene abrupt in Drosophila
Melanogaster through Classical Crosses, PCR, and BLAST
Analysis
Thao Tran
College of Natural Sciences and MathematicsDepartment of Biology and Biochemistry
University of Houston
Semester Project ManuscriptBIOL 3311 Fall 2012
Date Submitted: 12/10/2012
Lab TA Instructor: Deepika Kumar
Lab Section: 16891/ Wednesday 1
Drawer Group Number: 30
Unknown Mutant Code: 333
Group members:Scott Moncrieff, Amsale Derese, Lorraine Velasquez, Linh
Nguyen
2
ABSTRACT
Expression of the gene, ab, is an important key factor for
developmental processes in Drosophila melanogaster. Muscle
attachment, sensory organ development, synaptic target
recognition, and transcriptional processes are some features
involved with the protein Abrupt. D. melanogaster flies with
the mutant phenotype exhibited a disrupted connection or
loss of the L5 wing vein. We observed the mutant phenotype
and attempted to map the gene relative to marker genes. The
chromosomal and allelic inheritance from the parents to
progeny are described by using known marker genes for two
discriminant genetic cross that were set at two distinct
temperatures. It is determined that the ab gene is inherited
recessively from parent to F1 progeny. This recessive
3
pattern is visible because of the marker phenotypes used.
The effect of the temperature in expression is determined to
have a moderate effect. Mutant male progeny in the second
discriminant cross did not have markers on the second
chromosome. It is concluded that the gene is on chromosome
2. PCR and BLAST analysis of ab in D. melanogaster verified the
identification of the unknown gene in a DNA sequence.
Protein BLAST highlighted the highly conserved domain, BTB,
of D. melanogaster in Homo sapiens. When we understand the
chromosomal inheritance and molecular genetics of the ab
gene, we could grasp some of the mechanisms and interactions
the gene had on the biological processes of development.
(Abstract=228)
INTRODUCTION
Drosophila melanogaster is the model organism for genetic
research and other fields because of the valuable
information it has to offer in many fields. Specific
4
physical and biological features that allow it to be
manipulated genetically are: small size, short life cycle,
high proliferation, and small genome. Genetic,
embryological, and biochemical methods are skillfully done
because of the capability to apply these techniques to
Drosophila. Continuous usage of embryological and genetic
methods in Drosophila leads towards an increased knowledge of
the many functions and development of the nervous system
(Rubin, 1988). Further questions can be researched and
answered through analyzing some of the significant roles
Drosophila melanogaster has in these studies.
With a similar human genome, Drosophila has signaling
pathways that are able to be analyzed in relation to human
cancer studies (Tickoo and Russell, 2002). Because of these
signaling pathways, the roles of targeted molecules can be
observed and analyzed for important physiological effects
which could lead to a new drug discovery. In neurological
studies, Drosophila’s single copy gene labels it a model
organism because one Drosophila gene corresponds to various

5
human genes; simplified gene interaction in the model aids
in understanding particular functions of the more complex
human nervous system. The genes of Drosophila correlate to
some more physiological effects in humans therefore the
organism continues to aid in our understanding of metabolic
and endocrine disorders (Tickoo and Russell, 2002).
Vein pattern formation systems help us understand more about
developmental genetics as well as cell signaling pathways.
Understanding how cells differentiate from each other in a
spatial formation has been hypothesized in various past
studies. Long cell signaling and short cell signaling can
lead to the tissue-level effects seen and lead to
understanding of organ patterning. Studying wing vein
arrangement can lead to more clear understanding of these
various patterns with molecular context. Many wing vein
mutations have been described advantageous because of the
ability to dissect a wing vein and easily induce and
quantify minor changes in vein expression (Thompson, 1980).
6
MATERIALS AND METHODS
Classical Crosses
In a clear polystyrene vial, cultured flies from Bloomington
Stock Center at Indiana University are maintained with
distilled water mixed in cornmeal-based formula of 4-24 blue
dye food for careful observations. In order to anesthetize
the flies, CO2 is delivered through the flow gun and
FlowBuddyTM pad. Under the pad, a stereomicroscope of 8-50X
magnification, swan neck lamp, and an artist brush are used
to inspect the phenotypes of the mutant flies in comparison
with wild-type flies. In the first genetic cross, 5 female
mutant virgins and 3 males with marker genes Curly/Plum;
Diachete/Stubble were placed in 2 vials at a temperature of 25
degrees Celsius and another vial at 19 degrees Celsius. When
dark brown pupas appeared, parents were separated and placed
in a fresh new vial. The F1 progeny’s phenotypes were scored
in comparison to a wild-type fly. Diachete marker flies had
the alulae missing and halters pointing down, Stubble had

7
shorter scutellar bristles, Curly had wings curled upwards,
and Plum had a lighter brown eye color. The mutant
phenotypes were searched for in the flies along with the
marker phenotypes. In the second genetic cross, 5 female
mutant virgins and 3 F1 Plum/Stubble males were crossed in 2
cross vials at 25 degrees Celsius. The progeny were scored
according to 4 phenotypic classes: mutant only, mutant and
Stubble, Plum only, and Plum and Stubble together. In
statistical analysis of the results, a null and alternative
hypothesis was proposed. Expected number or progeny were
calculated according to each specific discriminant or
mapping cross. The chi-square number was calculated through
the chi-square formula and compared to the chi- square
critical value.
PCR and Agarose Gel Electrophoresis
In using polymerase chain reaction to amplify DNA, DNA
template, buffer, potassium chloride, primers, dNTPs, Taq
DNA polymerase, and magnesium chloride were added in our
8
standard PCR product. A temperature cycle consisted of
denaturing the DNA at 94 degrees Celsius, annealing, at 45-
48 degrees, and elongation at 64 degrees Celsius. Using 1.5
gm/100 ml agarose gel and an electric field with a cathode
and anode, a purified and unpurified PCR product was loaded
on to an agarose gel by careful placement of micropipette
into a loading buffer above the gel well. Other gel lanes
consisted of positive control, negative control, and a base
pair ladder.
BLAST Analysis
DNA sequence amplified by primers and protein amino acid
sequence were analyzed. Forward and primers used were
agccacaaaagaaggagcaa and gctgttctccaaagcctgtc, respectively.
Searches were performed using BLAST and pBLAST. The forward
primers were BLASTed first to find the raw DNA sequence,
then the complement of the reverse primer were used to find
the area in between primers where the DNA sequence was
amplified. The highest scoring value was analyzed to match
our query search to the Drosophila genome. A GBrowse was
9
observed to find specific details of exons, introns, and
regulatory regions in the gene. The transcripts were also
analyzed below the gene for any significance information. In
the protein BLAST, Flybase was used to find the amino acid
sequence of the Abrupt protein. A protein BLAST was done
against the Homo sapiens database. The initial search matched
conserved domains that were found located in the proteins of
Homo sapiens. Lastly, a low E value in addition with high
matching score values was used for a protein that that was
closely matched to Drosophila melanogaster.
RESULTS
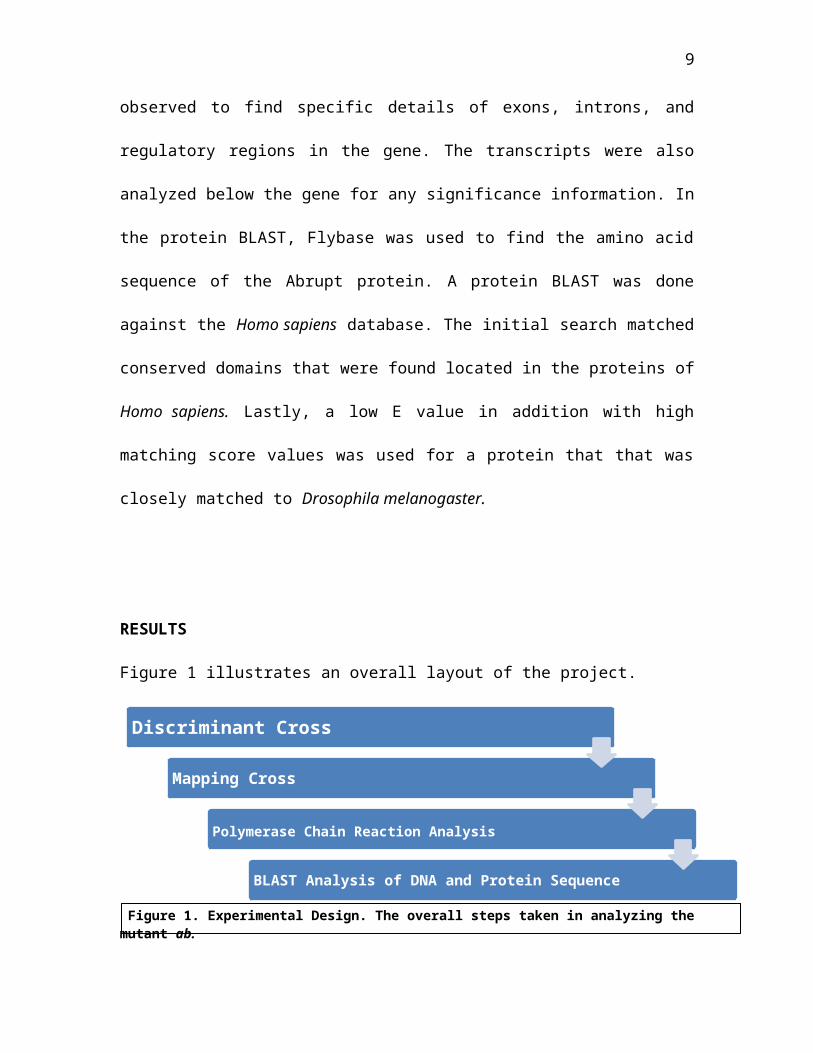
Figure 1 illustrates an overall layout of the project.
Figure 1. Experimental Design. The overall steps taken in analyzing themutant ab.
Discriminant Cross
Mapping Cross
Polymerase Chain Reaction Analysis
BLAST Analysis of DNA and Protein Sequence
10
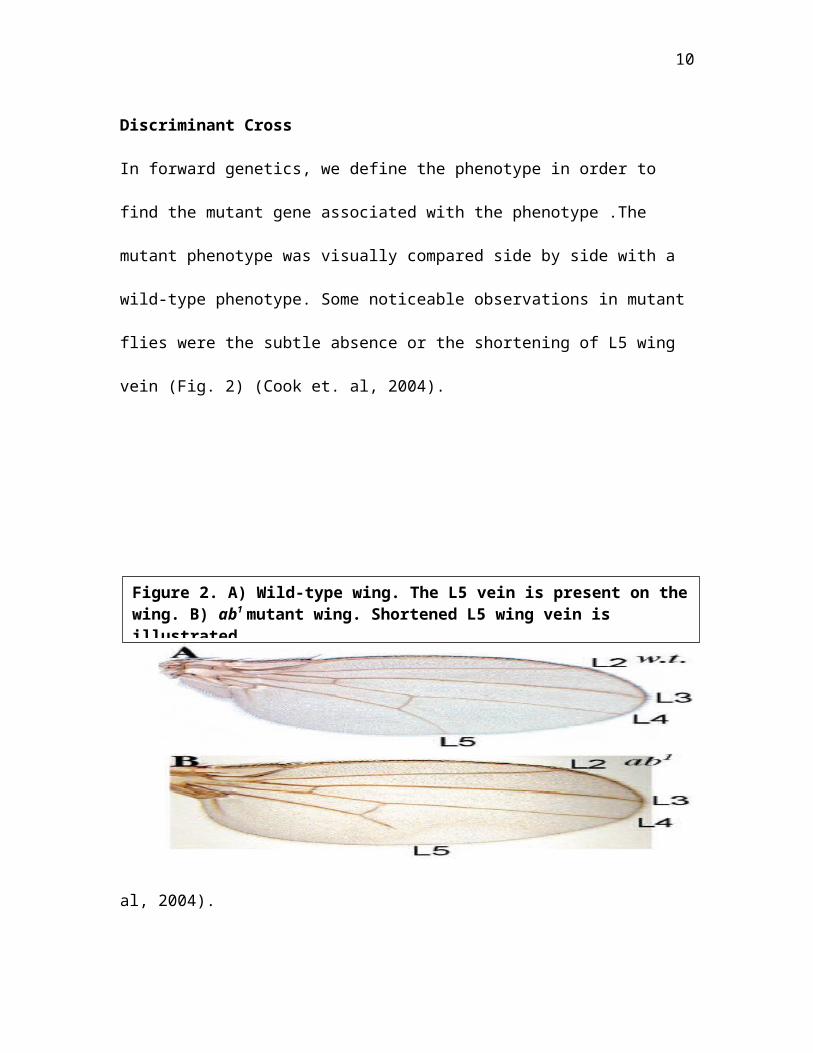
Discriminant Cross
In forward genetics, we define the phenotype in order to
find the mutant gene associated with the phenotype .The
mutant phenotype was visually compared side by side with a
wild-type phenotype. Some noticeable observations in mutant
flies were the subtle absence or the shortening of L5 wing
vein (Fig. 2) (Cook et. al, 2004).
al, 2004).
Figure 2. A) Wild-type wing. The L5 vein is present on thewing. B) ab1 mutant wing. Shortened L5 wing vein is illustrated.

11
To test the expressivity of the mutant phenotype under the
influence of different temperature, we observed two vials of
wild-type and mutant flies each under 25/26 or 19/20 degrees
Celsius. After dark brown pupa was seen and parents were
subculture, at two different temperatures, we closely
examined phenotypes of wild-type to wild-type, mutant to
mutant, and wild-type to mutant. For wild-type to wild-type,
no distinctive changes in phenotype occurred at a lower
temperature, but development of pupa was slower. For mutant
to mutant, the vein lining were thinner under a lower
temperature compared to a 25 degrees temperature (Jang et.
al, 2009). For a wild-type to mutant, the expression of the
vein mutation changed significantly for mutant compared to
wild-type.
In order to determine the mode of chromosomal inheritance
and the chromosomal location of the mutant gene, we
performed two classical genetic crosses that are named
discriminant cross 1 and 2, respectively. Virgin female
12
mutant were collected to mate with males that had marker
genes of Curly, Plum, Diachete, and Stubble. Progeny flies were
scored in males and females, and the progeny number of each
phenotypic category was quantified in table 1. In the
chromosomal drawings of figure 3, the 4 phenotypic classes
in females and males are Curly; Diachete, Curly; Stubble, Plum; Diachete,
Plum; Stubble.
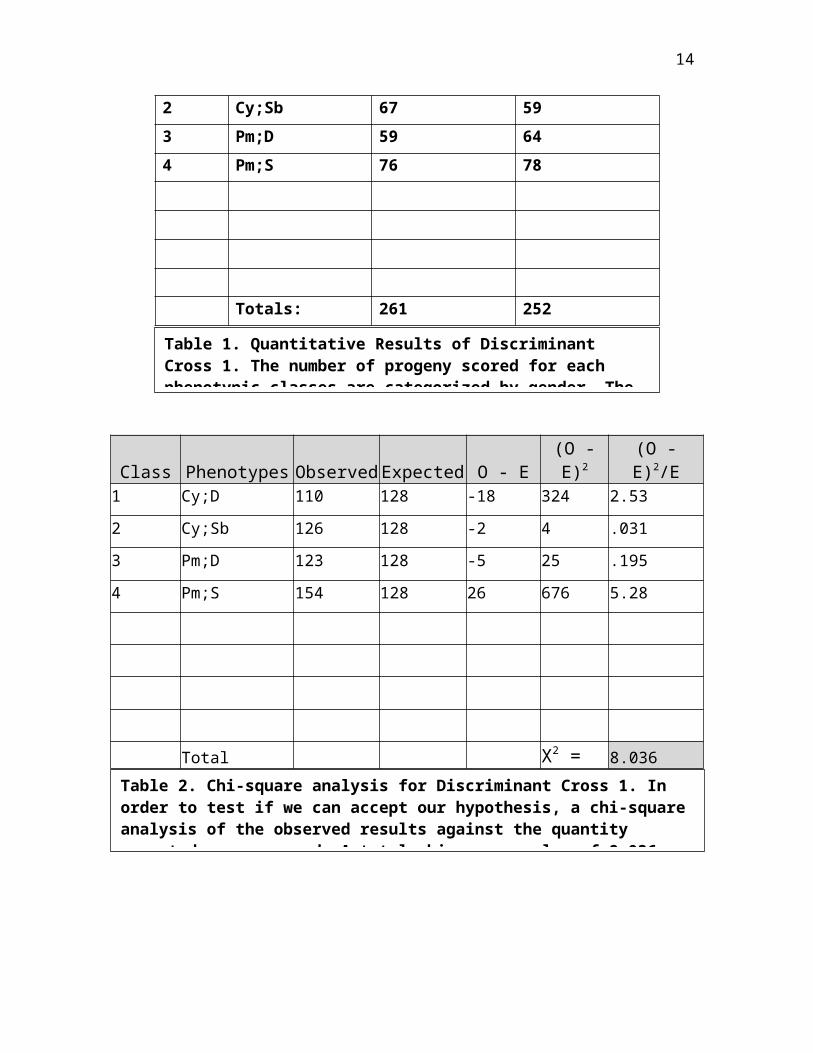
There were a total of 515 progeny collected for discriminant
cross 1 at two temperatures of 25/16 and 19/20 degrees
Celsius. About 100 of the progeny showed the marker
phenotypes of Curly; Diachete, Curly; Stubble, Plum; Diachete, Plum; Stubble.
None of the progeny exhibited mutant phenotypes with the
exception of two cases. We did a chi-square analysis of the
observed results against the expected number for a recessive
mutation. In table 2, the expected result was used to
compare a significant difference in the observed data
through the chi-square analysis. The results show a chi-
square of 8.03 greater than the critical of 7.82.

13
Class Phenotypes Females Males1 Cy;D 59 51
Figure 3. Possible chromosomal outcomes. un represents theunknown mutant gene assuming that it is recessive and on chromosome 2. The marker genes are Curly, Diachete, Stubble, Plum. The four phenotypic classes will appear in the
14
2 Cy;Sb 67 593 Pm;D 59 644 Pm;S 76 78
Totals: 261 252
Class Phenotypes ObservedExpected O - E(O -E)2
(O -E)2/E
1 Cy;D 110 128 -18 324 2.53
2 Cy;Sb 126 128 -2 4 .0313 Pm;D 123 128 -5 25 .195
4 Pm;S 154 128 26 676 5.28
Total X2 = 8.036
Table 1. Quantitative Results of Discriminant Cross 1. The number of progeny scored for each phenotypic classes are categorized by gender. The
Table 2. Chi-square analysis for Discriminant Cross 1. In order to test if we can accept our hypothesis, a chi-squareanalysis of the observed results against the quantity expected was measured. A total chi-square value of 8.036

15
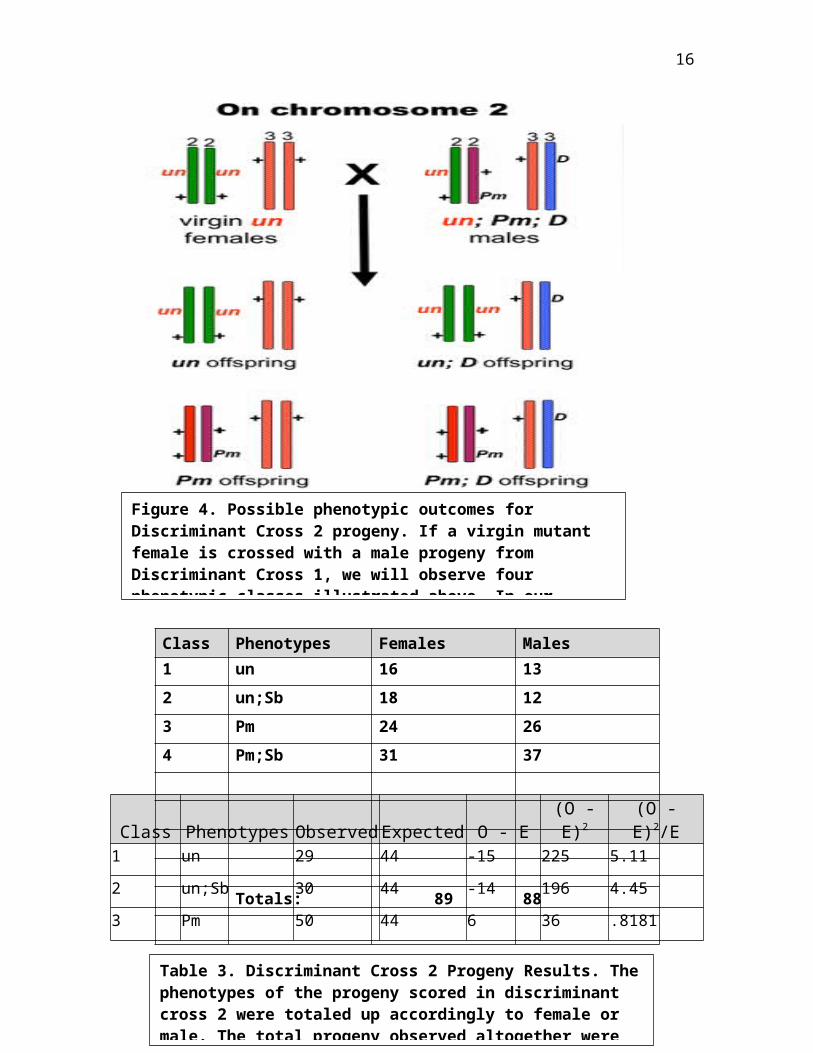
In discriminant cross 2, we performed a cross with virgin
mutant female and F1 male progeny with the phenotypic class
of Pm;Sb. In figure 4, the chromosomal drawing allows us to
predict the outcomes of 4 phenotypic classes when a virgin
mutant female and F1 male progeny are cross. The 4
phenotypic classes observed in the chromosomal drawings are
when the mutant gene is on chromosome 2. From the
chromosomal drawings with minor changes (Pm;Sb was used
instead of Pm;D), the four phenotypic classes are un, un;Sb,
Pm, Pm;Sb. In table 1, the phenotypic classes observed in the
progeny are mutant females and males in a 1:1 ratio. In DC2,
there was 225 progeny scored. Out of 225 progeny, a total of
68 progeny had Plum;Stubble, 30 had unknown;Stubble, 50 had Plum,
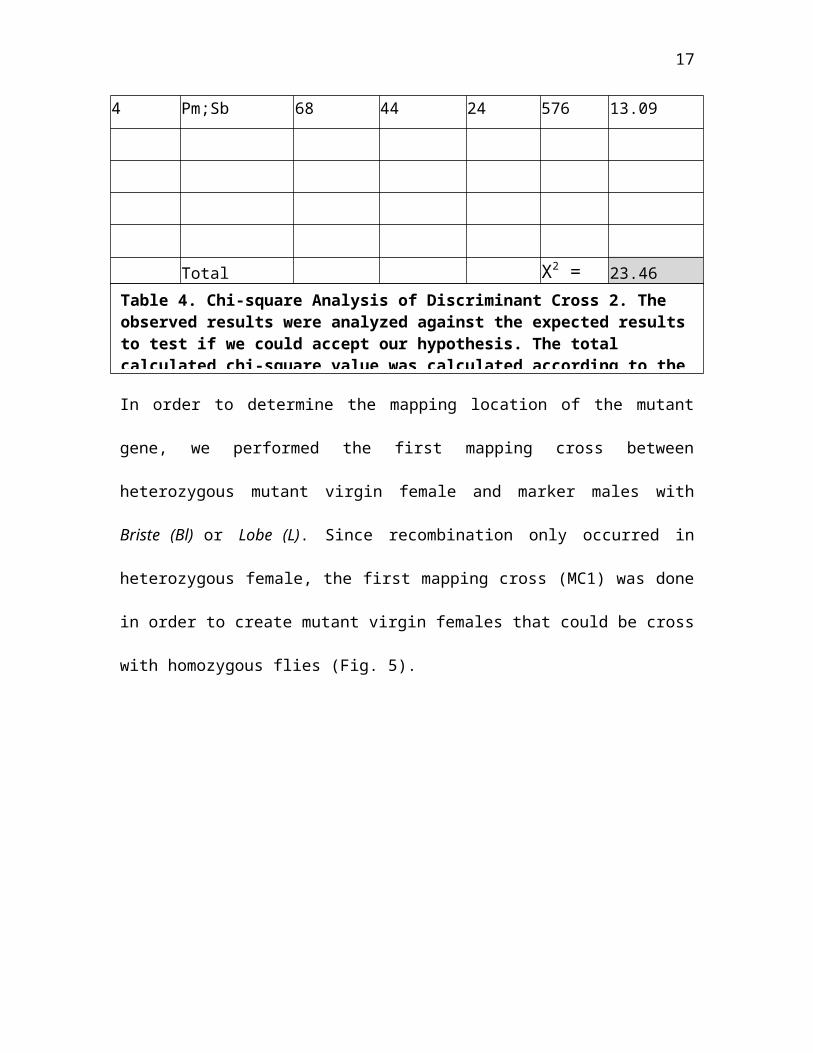
and 29 had unknown. In table 4, chi-square analysis was
completed to test for a significant difference in observed
and expected. The calculated chi-square is 23.46. There were
three exceptional cases when 1 progeny of Plum with unknown,
19 Stubble progeny, and 28 wild-type progeny.
16
Class Phenotypes ObservedExpected O - E(O -E)2
(O -E)2/E
1 un 29 44 -15 225 5.11
2 un;Sb 30 44 -14 196 4.453 Pm 50 44 6 36 .8181
Figure 4. Possible phenotypic outcomes for Discriminant Cross 2 progeny. If a virgin mutant female is crossed with a male progeny from Discriminant Cross 1, we will observe four phenotypic classes illustrated above. In our
Table 3. Discriminant Cross 2 Progeny Results. Thephenotypes of the progeny scored in discriminant cross 2 were totaled up accordingly to female or male. The total progeny observed altogether were
Class Phenotypes Females Males1 un 16 132 un;Sb 18 123 Pm 24 264 Pm;Sb 31 37
Totals: 89 88
17
4 Pm;Sb 68 44 24 576 13.09
Total X2 = 23.46
Mapping Cross
In order to determine the mapping location of the mutant
gene, we performed the first mapping cross between
heterozygous mutant virgin female and marker males with
Briste (Bl) or Lobe (L). Since recombination only occurred in
heterozygous female, the first mapping cross (MC1) was done
in order to create mutant virgin females that could be cross
with homozygous flies (Fig. 5).
Table 4. Chi-square Analysis of Discriminant Cross 2. The observed results were analyzed against the expected resultsto test if we could accept our hypothesis. The total calculated chi-square value was calculated according to the
18
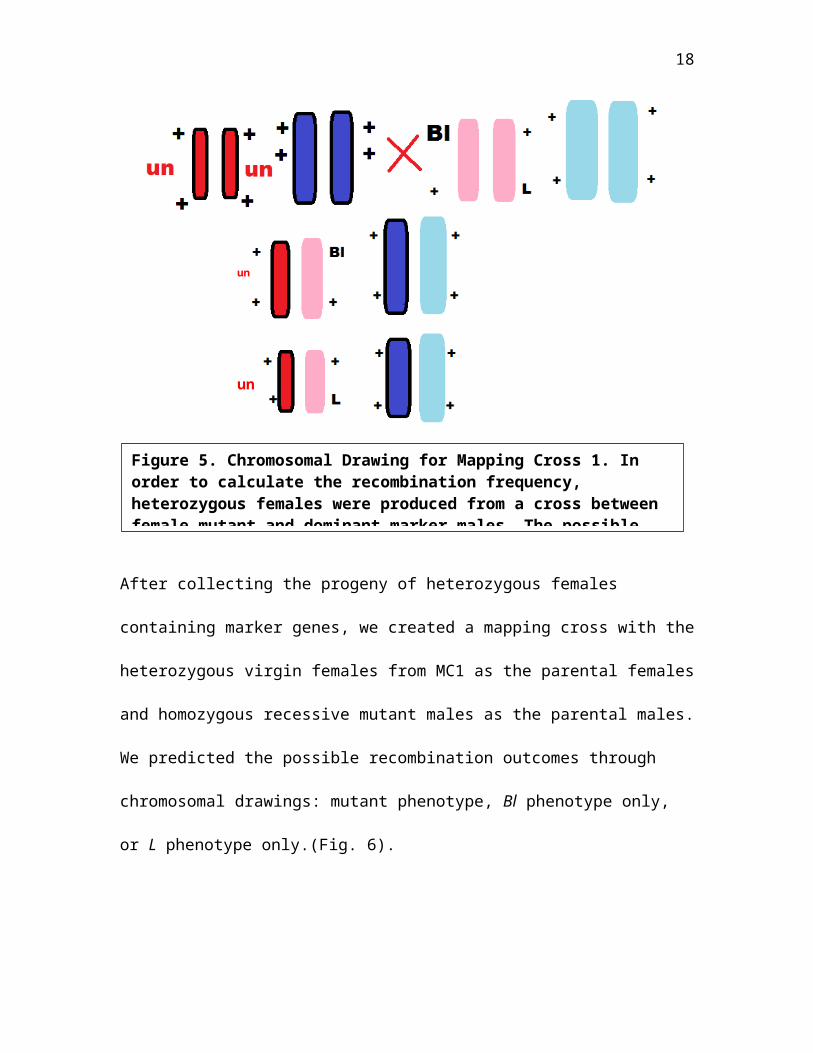
After collecting the progeny of heterozygous females
containing marker genes, we created a mapping cross with the
heterozygous virgin females from MC1 as the parental females
and homozygous recessive mutant males as the parental males.
We predicted the possible recombination outcomes through
chromosomal drawings: mutant phenotype, Bl phenotype only,
or L phenotype only.(Fig. 6).
un
un
Figure 5. Chromosomal Drawing for Mapping Cross 1. In order to calculate the recombination frequency, heterozygous females were produced from a cross between female mutant and dominant marker males. The possible

19
In the laboratory, we observed 858 wild-type phenotypes out
of a total of 1418 progeny eclosed from mapping cross 2. The
second largest phenotypic class observed in the progeny was
Bl and L together; the total amounts observed were 231
Figure 6. Chromosomal Drawing for Mapping Cross 2. A)The possible phenotypic classes are shown when crossing the heterozygous females (MC1) with the recessive mutant males. A Bl heterozygous female and an recessive mutant male produces a progeny that could exhibit mutant phenotypes or Bl/L phenotype. B) Single recombinants phenotypes are shown on the far left and right. Double
A
B
20
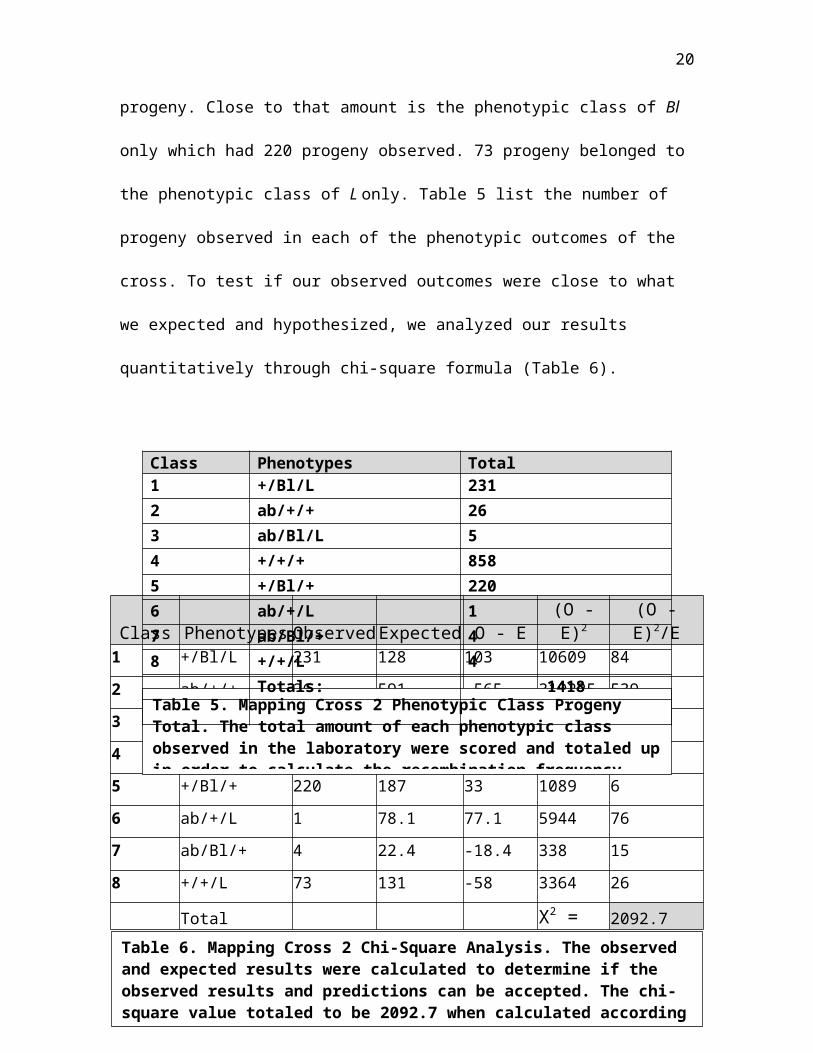
progeny. Close to that amount is the phenotypic class of Bl
only which had 220 progeny observed. 73 progeny belonged to
the phenotypic class of L only. Table 5 list the number of
progeny observed in each of the phenotypic outcomes of the
cross. To test if our observed outcomes were close to what
we expected and hypothesized, we analyzed our results
quantitatively through chi-square formula (Table 6).
Class Phenotypes ObservedExpected O - E(O -E)2
(O -E)2/E
1 +/Bl/L 231 128 103 10609 84
2 ab/+/+ 26 591 -565 319225 5393 ab/Bl/L 5 17.8 -12.8 163.84 9
4 +/+/+ 858 264 594 352836 13375 +/Bl/+ 220 187 33 1089 6
6 ab/+/L 1 78.1 77.1 5944 767 ab/Bl/+ 4 22.4 -18.4 338 15
8 +/+/L 73 131 -58 3364 26
Total X2 = 2092.7
Table 5. Mapping Cross 2 Phenotypic Class Progeny Total. The total amount of each phenotypic class observed in the laboratory were scored and totaled upin order to calculate the recombination frequency.
Table 6. Mapping Cross 2 Chi-Square Analysis. The observed and expected results were calculated to determine if the observed results and predictions can be accepted. The chi-square value totaled to be 2092.7 when calculated according
Class Phenotypes Total1 +/Bl/L 2312 ab/+/+ 263 ab/Bl/L 54 +/+/+ 8585 +/Bl/+ 2206 ab/+/L 17 ab/Bl/+ 48 +/+/L 4
Totals: 1418
21
In a computer simulation of the proposed mapping cross two,
2420 progeny were produced with the amount of phenotypic
class shown in Table 7. Seven phenotypic classes were
produced in the progeny from the cross. Recombination
frequency was calculated using the simulated data, and
calculations are shown in table 8. Parental recombinants
show the phenotypic class ab/+/+ and +/Bl/L. Single
recombinants show the phenotypic class +/Bl/+ , +/+/+,
ab/Bl/L, ab/Bl/+. Lastly, the double recombinants show the
phenotypic class ab/+/L and no double recombinants of the
phenotypic class +/+/L were produced. Bl and L are
approximately 13.9 map units apart, Bl and ab are
approximately 9.7 map units apart, L and ab are
approximately 23.5 map units apart (Table 8).

22
Class Bl and L Bl and ab L and ab1 - -
-2 - -
-3 208 - 2084 128 - 1285 - 128
1286 - 106
1067 1 1
-8 0 0
-Total 337 238
570% RF 13.9
9.7 23.5
Class Phenotypes ObservedExpected O - E(O -E)2
(O -E)2/E
Table 7. Computer Simulation of Mapping Cross 2. Seven phenotypic classes were produced from the cross. A total of 2420 progeny were produced
Table 8. Recombinants of 3 Genes. Recombination frequencieswere calculated by summing up the total recombinants of twogenes and dividing by the total progeny and multiplying by 100. 1% recombination frequency equals to 1 map unit. Therefore, the recombination frequency above represents the
Class Phenotypes Total1 +/Bl/L 9252 ab/+/+ 9243 +/Bl/+ 2084 +/+/+ 1285 ab/Bl/L 1286 ab/Bl/+ 1067 ab/+/L 18 +/+/L 0
Totals: 2420

23
1 +/Bl/L 925 926 -1 1 0
2 ab/+/+ 924 926 -2 4 03 ab/Bl/L 128 133 -5 25 .18
4 +/+/+ 128 133 -5 25 .185 +/Bl/+ 208 284 -76 5776 20
6 ab/+/L 1 0 -1 2 07 ab/Bl/+ 106 133 -27 3249 24
8 +/+/L 0 0 0 0 0
Total X2 = 44.36
Polymerase Chain Reaction Analysis
In previous molecular studies of the ab gene, Hu and
colleagues applied inverse PCR in order to isolate the ab
transcription unit that is about 5.1 kb. (Hu et. al, 1995).
Before manipulation of DNA can be done, an estimation of DNA
amount is confirmed for further analysis. After the
extraction of genomic DNA and purification of the amplified
PCR product, we quantified the DNA sample using agarose gel
Table 9. Chi-square analysis of the simulation mapping cross. The observed data was calculated against the expecteddata to determine if the hypothesis should be accepted. A total chi-square value of 209.01 was calculated according to
24
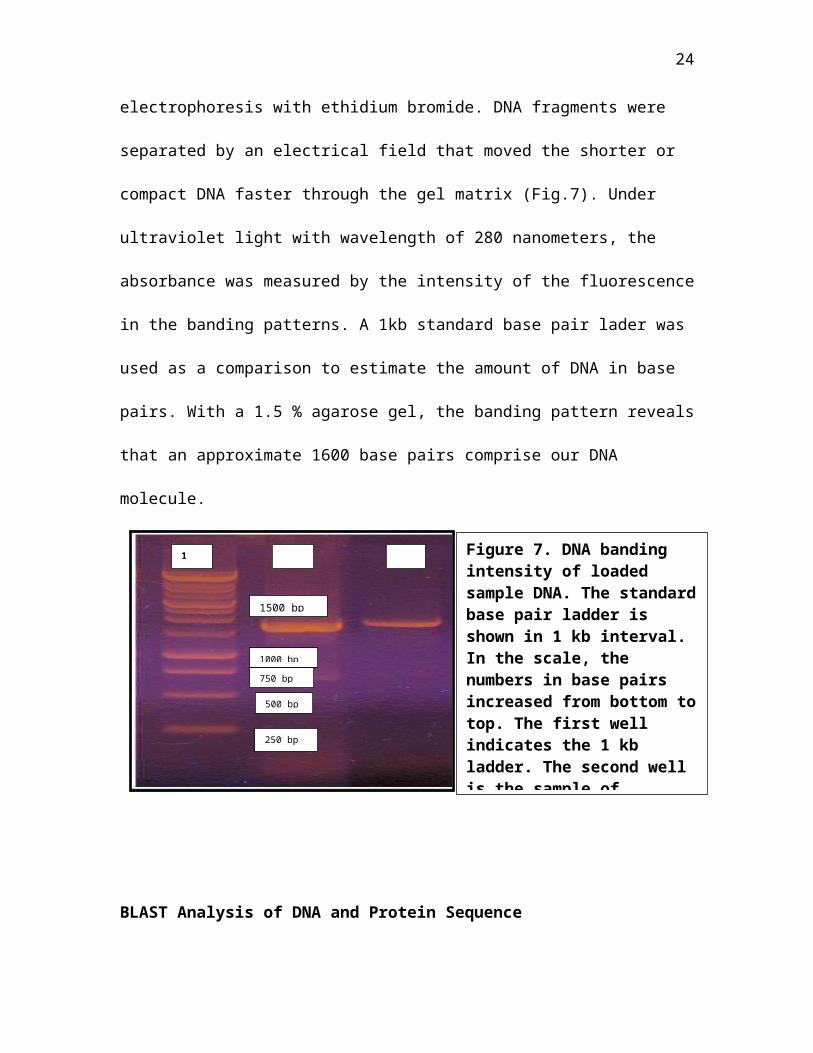
electrophoresis with ethidium bromide. DNA fragments were
separated by an electrical field that moved the shorter or
compact DNA faster through the gel matrix (Fig.7). Under
ultraviolet light with wavelength of 280 nanometers, the
absorbance was measured by the intensity of the fluorescence
in the banding patterns. A 1kb standard base pair lader was
used as a comparison to estimate the amount of DNA in base
pairs. With a 1.5 % agarose gel, the banding pattern reveals
that an approximate 1600 base pairs comprise our DNA
molecule.
BLAST Analysis of DNA and Protein Sequence
1 kb
Figure 7. DNA banding intensity of loaded sample DNA. The standardbase pair ladder is shown in 1 kb interval. In the scale, the numbers in base pairs increased from bottom totop. The first well indicates the 1 kb ladder. The second well is the sample of
250 bp
500 bp
750 bp
1000 bp
1500 bp

25
In analyzing the DNA sequence, we used the Basic Local
Alignment Search Tool, and BLASTed the forward primer
sequence against the genomic Drosophila Melanogaster sequence in
order to obtain a raw DNA sequence. After we BLASTed with
the bases between the forward and reverse primer sequences
(including primer sequence), we obtain a sequence match
score of 1511.05 bits and found that the sequence is on the
plus strand of DNA. The allele identified to be associated
with our mutant gene is ab and it is confirmed by the high
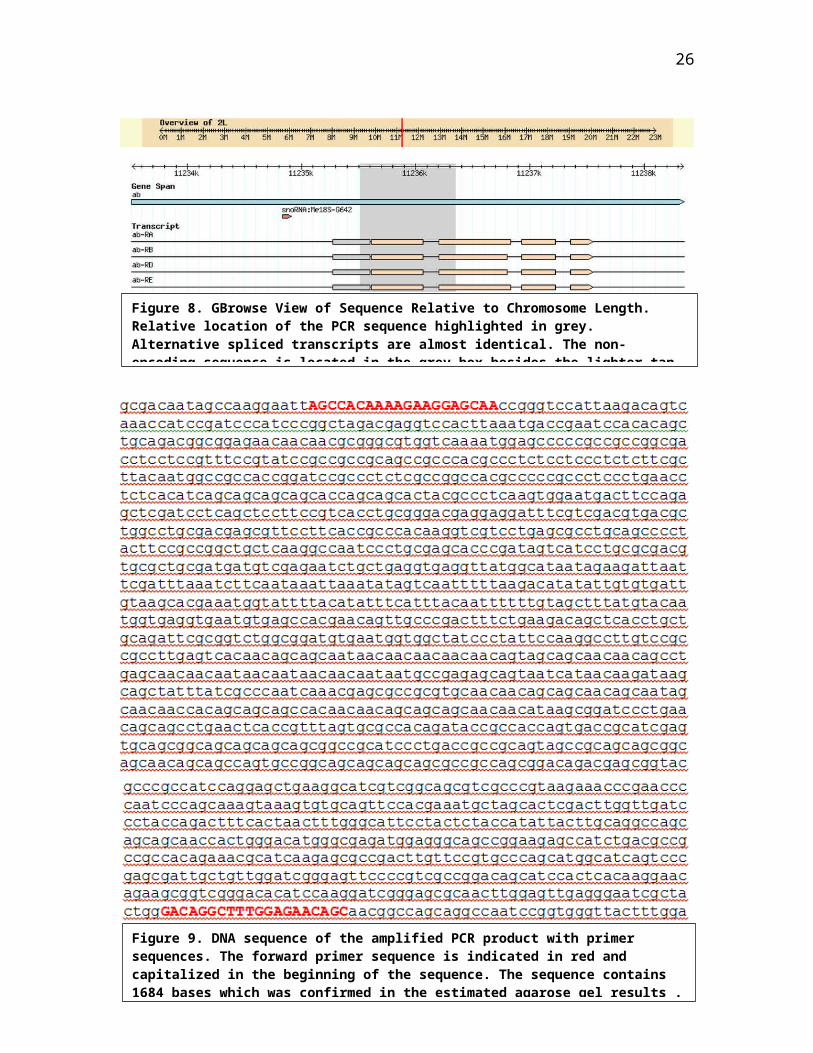
matching score for our sequence. Indicated by the red line,
our sequence is located relatively around 11M to 12 M on the
second chromosome (Fig.8 ). The ab gene has four
transcripts: ab-RA, ab-RB, ab-RD, and ab-RE. We confirmed
with previous studies that abrupt has identical
alternatively spliced transcripts with non-encoding exons
(Grieder et al, 2006). The non-encoding exons are indicated
in a grey box beside the coding sequence in tan color. The
amount of bases for our PCR product sequence was obtained by
word count, and the results was 1684 bases which is in the
range of our agarose gel results (Fig.9 ).
26
Figure 8. GBrowse View of Sequence Relative to Chromosome Length. Relative location of the PCR sequence highlighted in grey. Alternative spliced transcripts are almost identical. The non-encoding sequence is located in the grey box besides the lighter tan
Figure 9. DNA sequence of the amplified PCR product with primer sequences. The forward primer sequence is indicated in red and capitalized in the beginning of the sequence. The sequence contains 1684 bases which was confirmed in the estimated agarose gel results .
27
Previous studies categorized the Ab protein as part of a
family of BTB-ZF (broad-complex, tramtrack and bric-à-brac -
zinc finger). The BTB domain is a highly conserved 115 amino
acid region in combination with the ZF that are DNA-binding
domains acting as transcription factors. (Hu et. al, 1995).
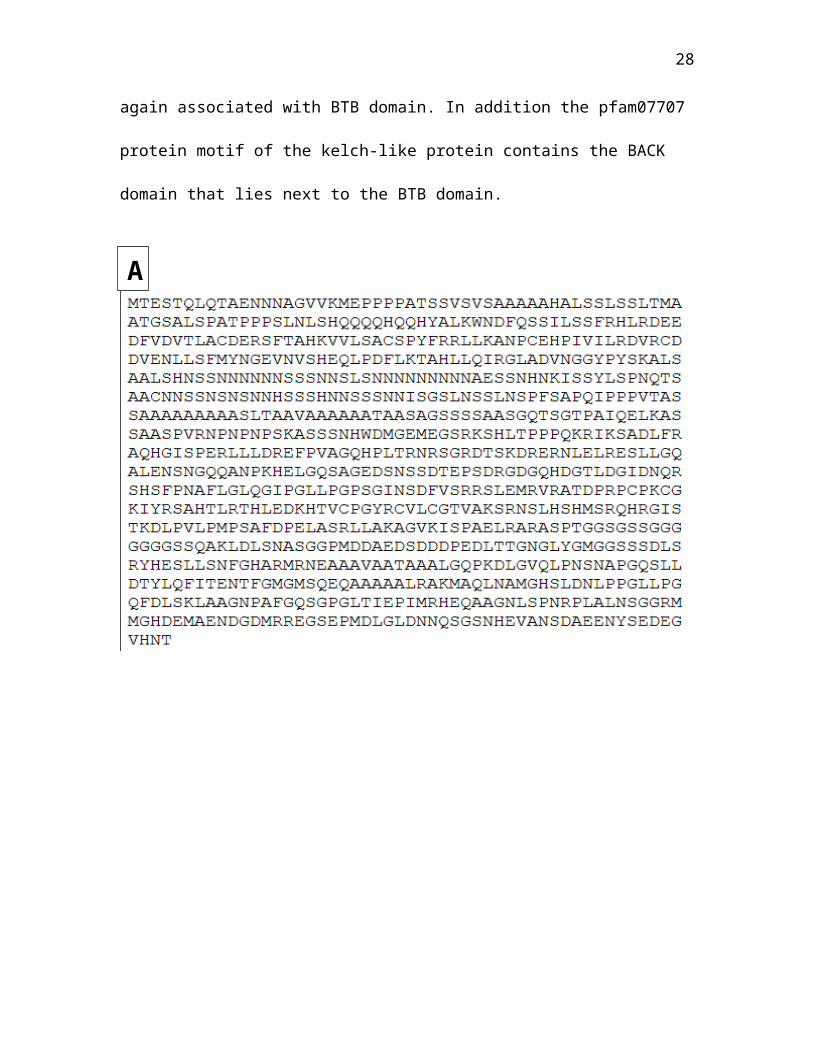
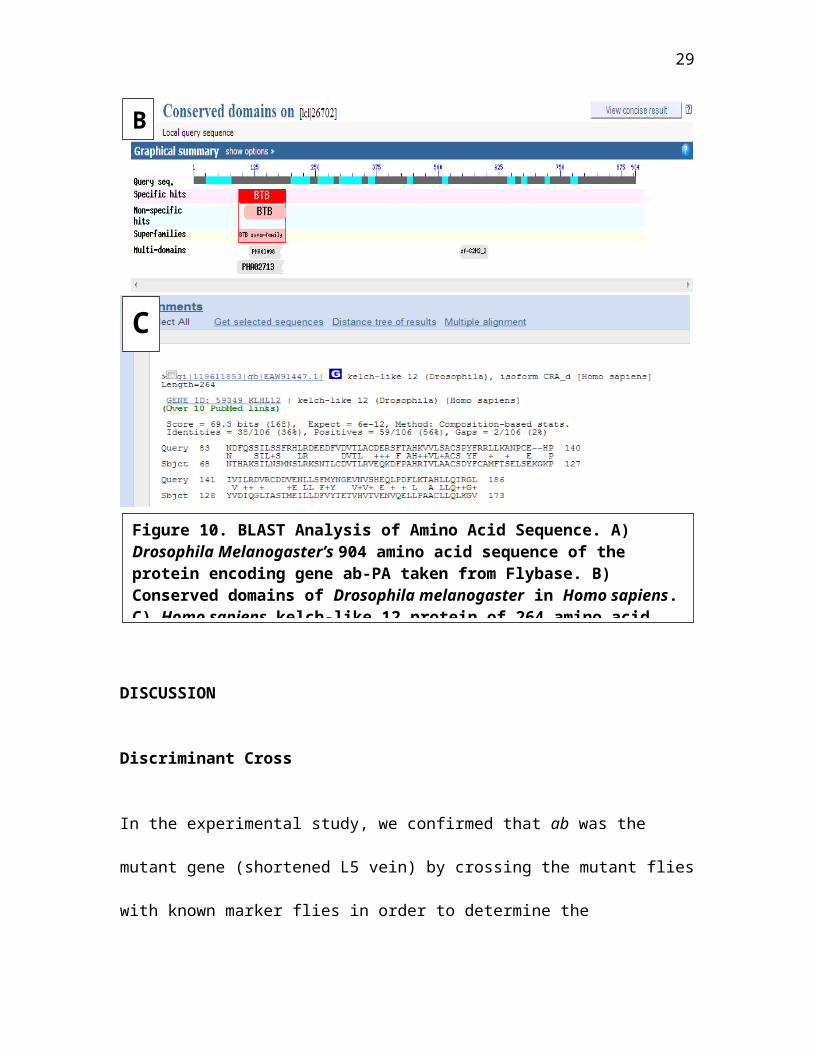
When we protein BLASTed the 904 amino acid sequence, ab-PA,
against Homo sapiens, the BTB/ POZ was the specific conserved
domain listed (Fig. 10). In the superfamily domain is the
protein motif cl02518 with the domain BTB/ POZ domain. The
non-specific domain hit was the smart00225 protein motif
with the POZ (pox virus and zinc finger) domain. Three
multi-domains that are conserved were matched: PHA03098
(provisional domain), C2H2 type zinc-finger domain (pfam
12756), and PHAO02713 (provisional domain). In Homo sapiens,
a 264 amino acid protein aligned with that of Drosophila
Melanogaster at a high scoring match of 69.3 bits. The kelch-
like 12 protein contains the pfam00651 protein motif that is
28
again associated with BTB domain. In addition the pfam07707
protein motif of the kelch-like protein contains the BACK
domain that lies next to the BTB domain.
A
29
DISCUSSION
Discriminant Cross
In the experimental study, we confirmed that ab was the
mutant gene (shortened L5 vein) by crossing the mutant flies
with known marker flies in order to determine the
Figure 10. BLAST Analysis of Amino Acid Sequence. A) Drosophila Melanogaster’s 904 amino acid sequence of the protein encoding gene ab-PA taken from Flybase. B) Conserved domains of Drosophila melanogaster in Homo sapiens.C) Homo sapiens kelch-like 12 protein of 264 amino acid
B
C
30
chromosomal inheritance and location relative to the marker
genes. In our first discriminant cross, the two of the
phenotypic classes, Pm;Sb and Cy;D, observed were slightly
higher and varied compared to the other phenotypes. These
quantity lead to a higher chi-square value (8.03) that is
greater than the chi-square critical value (7.82). Variation
could lead to the genetic competence of one phenotypic class
over another which lead to higher distribution of a certain
phenotype. Despite the variation, our mutation did not
significantly appear in any of the phenotypic classes. The
information obtained from physical observations revealed
that our mutant gene was inherited as a recessive allele. In
other studies, muscle defects phenotypes were observed in
order to determine levels of expressivity in the ab allele.
The ab recessive viable mutation was combined with other
allele to observe the phenotypes effects of the mutant (Hu
et. al, 1995).
Despite the observed quantity of phenotypic classes
differing from the expected amount, the phenotypic class
31
data lead us to infer that the ab mutant gene is on
chromosome 2. The abrupt mutant gene was not physically
combined with any of the phenotypes of the chromosome 2
markers. Chromosomal drawings show the possible phenotypic
outcomes that result if the gene was on chromosome 2. The
observations matched with the predicted phenotypic classes.
In an experiment with P-element insertions, the P element in
line B2149 shown to be inserted upstream of abrupt which is
mapped genetically on chromosome 2 (Grieder et. al, 2006).
Through polytene chromosome in situ hybridization, insertion
elements were mapped to chromosome 2 interval (Hu et. al,
1995). The classical genetic approach does not take into
account the various loci and pleiotropic alleles that alter
the phenotypic expression of veins. Possible changes would
be to study genes specific in being involved in a
development directed to the final pattern.
With the temperature variable, phenotypes were only recorded
visually. In another study testing the effects of
temperature on vein expression, quantification of vein
32
intervals were done to test certain interruptions in
specific parts of a vein. The study took into account
gender, genotype, and temperature effects and interactions
on vein intervals, and the results quantify the vein pattern
changes that occurred (Carlson, 1970). Our study lacked the
ability to have done so.
Mapping Cross
Mapping cross depended on the recombination of heterozygous
female and chromosomal linkage. So, if heterozygous female
were not properly obtained, recombination was unlikely to
have occurred. A majority of our observations had wild-type
phenotypes. We suspected that that the marker genes of Bl
and L were not a balanced stock that needed to be maintained
as a heterozygous stock. Plus, a previous study show how
vein mutant could exhibit vein pattern compensation due to
tissue-level mechanisms that can respond to developmental
process that code for particular cell products (Thompson,
1980). Although the laboratory data was insufficient to
33
produce any mapping data, we obtained computer simulation
data that was able to sufficiently provide where the mutant
allele was relative to the marker genes. Two single
recombinants differ from the expected value leading to a
relatively high chi-square value. Despite the chi-square
value, both of the marker genes reveal the relative map
units of the marker genes to the mutant genes. In computer
simulation, various factors can affect the values of the
data produced. Usually, multiple mapping crosses are done to
produce values confirmable with statistical data. The
mapping location of the mutant gene ab was determined by
recombination frequency and is located closer to the marker
gene Bl by 9.7 map units. To further confirm our results, a
search on Flybase verifies that the mapping location of ab
is at 2-44.
Mapping a gene to a human autosome was a significant
contribution done by Donahue et. al who described the results
of mapping a blood group gene to chromosome 1. In his
results, he described the marker chromosome region. Physical
34
changes in chromosome structure combined with a pedigree
analysis can be used to map specific gene to a chromosome
(Donahue et. al, 1968).
Genetic mapping of sex-linked chromosome involves many other
effective factors including non-recombinant sex chromosomes,
sex ratio in D. melanogaster, or segregation issues at a
locus. After applying sex-linked markers, applying the
genetic linkage map will differ from autosomal mapping.
Records of sex will be recorded in addition to the linkage
groups derived from marker segregation in females or males
(Smerikov et. al, 2003).
PCR estimates DNA length range
Observation data from the agarose gel electrophoresis of our
amplified PCR product suggest that our ab mutant gene had a
1600 range of base pairs. The levels of band intensity were
thicker due to fluorescence absorbance of the ultraviolet
wavelength. The estimation of the DNA quantity was seen
35
after the electrical current was applied which allowed the
attraction of DNA towards the positive anode current. The
ability of the gene to move towards the positive current was
significantly slower because of the DNA length.
BLAST Analysis
In further analyzing the mutant DNA sequence, a BLAST
analysis of our sequence reveals a region of our gene that
contains coding and non-coding sequences. The four
transcripts below the gene are alternative splicing
transcripts, and the transcriptional region codes for the
protein Ab (Hu et. al, 1995). Limitations to this analysis
are found in studies where activation and repression of vein
genes affect the level of expressivity (Jang et. al, 2009).
ab gene is able to down regulate other genes, but regulatory
region of the DNA analysis is not observed in the results.
In our protein BLAST analysis of the amino acid sequence, we
found the conserved region that Ab encodes for is the
36
transcription factor BTB/POZ domain that is expressed during
embryogenesis (Li et. al, 2004). There are certain cases
where Drosophila melanogaster do not have the homologs for
certain Homo sapiens proteins. As our results show, there
is a possibility that varieties of protein domains have
different extensions along a protein and occupy different
areas of a protein.
The ab-PA consisting of 904 amino acids belong to a family
of BTB domain that has been defined as the evolutionary
conserved domain in Drosophila melanogaster. The role involved
in developmental regulation provides a comparable analysis
of the protein product towards Homo sapiens. BTB domain plays
important roles in transcriptional regulation with the zinc-
finger motif. In addition, the protein-protein interaction
has been associated with the BTB family other proteins
(Zolman et. al, 1994).
37
The BTB domain is located near the N-terminus of the zinc
finger and in kelch protein family. In kelch-like 12 (D.
melanogaster), isoform CRA_d (Homo sapiens), the kelch-like
protein were found to be autoantigens. These autoantigens
were applied efficiently as serological markers for clinical
diagnosis of Sjogren’s syndrome (Uchida et. al, 2005). In
other studies comparing the kelch-like protein of D.
melanogaster with Homo sapiens the formation of how the protein
is structured allows for further comparative analysis. The
D. melanogaster’s kelch-like protein forms a ring-like canal
during oocyte development. The ring-like structure was
observed in mammalian cells suggesting the importance of the
kelch homologue in interactions with localization of other
proteins (Mai et. al, 2004).
Mutation at the Molecular Level
In studies where genetic screens were done to determine the
molecular functions of vein genes, two factors that were
significant in representing the vein function is signaling
molecules and transcription factors. Many other
38
developmental processes are factors that can affect vein
formation (Molnar et. al, 2006).
The ab transcript encodes for the Ab protein that has been
shown to act as a DNA binding transcriptional regulatory
protein. Combination of ab gene and transcription factors
plays a role in the mutation seen at the phenotypic level;
transcription factor can send or respond to local signals
resulting in organization of a wing vein in a specific
location. In other molecular analysis where the mutant gene
was experimented for specific deficiency, primers that
failed to amplify a certain portion of the DNA reveals that
there is a deletion of a portion of bases in the DNA. The
deletion removed coding sequences and the starting site for
transcription which lead to a null function (Hu. et, al,
1995).
Other applications and similar genes in other organisms
Mammalian neuronal cells stem cells differentiate into
different types of neurons during the course of development.
In D. melanogaster, the transcription factor Ab is targeted by
39
microRNA to regulate the timing of neuronal development in
flies (Kucherenko et. al, 2012). The information suggests
the role of microRNA in contributing to developmental
signaling and learning impairment.
The gene ortholog of a non-Drosophila organism is AGAP008032
of the common malaria mosquito, Anopheles gambiae. The gene has
only one transcript with the location on the forward strand.
The gene belongs to the novel protein coding category, and
one of the domain of the protein is zinc-finger C2H2-like
similar to that of the Drosophila. The protein sequence has
been found to have regions of low complexity in the
different residual types present (Wooton et. Al, 1993).
In conclusion, we determine the mapping of the recessive
allele and the possible mutations in the 1600 base pair DNA
sequence that is associated with the genetic transmission of
a shortened or absence of the L5 wing vein. Usage of BLAST
reveals the highly evolutionary conserved domain BTB and the
importance of the domain in transcription regulation when it
is involved in DNA-binding or protein-protein interactions.

40
What is unclear is the when abrupt first appear in the
evolutionary origin between invertebrates and vertebrates.
Since there are similarities between the human genome and
Drosophila genome, we want to isolate the important genetic
forms and variations that arise in studying developmental
roles. Simple molecular analysis and classical genetic cross
does not tell us further about any further interactions that
can create subtle vein effects and affect other biological
processes with other genes.
REFERENCES
Benjumea, , and Bellido. "Genetic analysis of the wing vein
pattern of Drosophila." Developmental Biology . (1990): n.
page. Print.
Carlson, , , .et al " Genetics of an L2 Vein Mutant in
Drosophila Melanogaster.” The Ohio Journal of Science (1970): n.
page. Print.
41
Cook, , , et al. “brinker and optomotor-blind act coordinately to initiate
development of the L5 wing vein primordium in
Drosophila.”131.Development (2004): 2119-2124. Print.
Donahue, , , et al. “probable assignment of the duffy blood
group locus to chromosome 1 in man”. 61. Genetics.(1968):
n. page. Print.
Grieder, , , et al. “Misexpression Screen in Drosophila
melanogaster Aiming to Reveal Novel Factors Involved in
Formation of Body Parts.” 175. Genetics (2007): n. page.
Print.
Hu, , , et al. “Drosophila abrupt gene encodes a BTB-zinc
finger regulatory protein that controls the specificity
of neuromuscular connections.” 9. Genes and Development.
(1995): 2936-2948. Print.
Jang, , , et al. “Border-cell migration requires integration
of spatial and temporal signals by the BTB protein
Abrupt.” 131. Nature. (2009): 2119-2124. Print.

42
Kucherenko, , , et al. “Steroid-induced microRNA let-7 acts
as a spatio-temporal code for neuronal cell fate in the
developing Drosophila brain.” EMBO. (2012): n. page.
Print.
Li, , , et al. “BTB/POZ-Zinc Finger Protein Abrupt
Suppresses Dendritic Branching in a Neuronal Subtype-
Specific and Dosage-Dependent Manner.” 23.EMBO .
(2004): 823-834. Print.
Mai, , , et al. “hDKIR, a human homologue of the Drosophila
kelch protein, involved in a ring-like structure.” 300.
Exp. Cell. Res. (2004): n. page. Print.
Molnar, , , et al. “Gain-of-Function Screen Identifying
Genes Required for Vein Formation in the Drosophila
melanogaster Wing”. 174.Genetics (2006): n. page. Print.
Rubin, Gerald. “Drosophila melanogaster as an Experimental
Organism.” 240. Science (1988): 1453-1459. Print.
Smerikov, , , et al. “Genetic mapping of sex-linked markers
in Salix viminalis L.” 91. (2003): n. page. Print.

43
Thompson, , , et al. “Pattern Compensation in Drosophila
Wing Vein Development.” Heredity (1980): n. page. Print.
Tickoo, Sanjay, and Steven Russell. . “Drosophila
melanogaster as a model system for drug discovery and
pathway screening. 2. Current Opinion in Pharmacology (2002):
555-560. Print.
Uchida, , , et al. “Identification of specific autoantigens
in Sjögren's syndrome by SEREX.”. 116. Immunology.
(2006): n. page. Print.
Wooton, , , et al. “Statistics of local complexity in amino
acid sequences and sequence databases .” 17. Computers
and Chemistry. (1993): n. page. Print.
Zolman, , , et al. “BTB domain, found primarily in zinc
finger proteins, defines an evolutionarily conserved
family that includes several developmentally regulated
genes in Drosophila.” 91. Developmental Biology. (1994): n.
page. Print.


![W1 152> P1615=1 X28Y Z[ \28626 A 9]](https://static.fdokumen.com/doc/165x107/633679db29fb49e5aa0b3873/w1-152-p16151-x28y-z-28626-a-9.jpg)