Impact of AgroChemical Use on Productivity and Health in Vietnam by Nguyen Huu Dung, Tran Chi Thien,...
69
Research Reports Impact of Agro-Chemical Use on Productivity and Health in Vietnam by Nguyen Huu Dung, Tran Chi Thien, Nguyen Van Hong, Nguyen Thi Loc, Dang Van Minh, Trinh Dinh Thau, Huynh Thi Le Nguyen, Nguyen Tan Phong, And Thai Thanh Son 1.0 EXECUTIVE SUMMARY 1.1 Background and Objectives Agro-chemicals play an important role in intensive agriculture. They offer the most attractive low cost method of increasing output per hectare of land and give the farmer a high economic return for his labor and investment. The potential for agrochemical application is considerably increased in developing countries where its advantages seem to have not been fully exploited. Vietnam, like any developing economy, promotes the use of agrochemicals. In recent years, the use of agrochemicals increased considerably. For example, the quantity of agrochemicals used in agriculture increased three times in 1994 as compared to the late 1980s (Ministry of Agriculture and Rural Development). Among these agrochemicals, the inorganic fertilizers were popularly used and reached the level of three (3) million tons/year where two million tons are imported. Among the chemical fertilizers, nitrogen was introduced into Vietnam earlier than phosphorous and potassium because of its yield effect. Modern varieties are nitrogen responsive. The government has also promoted use of nitrogen by price incentives (Part 2). Due to this, there is a belief that farmers over-use nitrogen. Many farmers tend to use urea heavily; knowledge about the importance of potassium and phosphorus may not be enough. At present, extension workers and scientists advise farmers to be aware of balanced fertilizer application. The use of too much urea that lead to unbalanced fertilizer use, is in the long-run not sustainable; too much nitrogen also enhances plant growth that makes it attractive to some insect pests. Thus, this could be a source of increased pesticide use. Indeed, it was observed that the use of pesticides has increased considerably in recent years, largely due to production incentives given by the government. Currently, Vietnam has used 200 different insecticides, 83 fungicides, 52 herbicides, organophosphates, carbamates, and pyrethroids (Ministry of Agriculture and Rural Development, 1995). Though being restricted in use, organophosphates which are in the WHO hazardous categories I and II, are applied by a larger number of farmers. All farmers used pesticides of all kinds to control pests. About 36% of restricted pesticides have been used in Tien Giang province, which increased the farmers health risk from exposure (Dung, 1994). In addition, with greater market liberalization there is higher tendency to use cheaper, more hazardous pesticides. There is less conformity to guidelines issued by the Department of Plant Protection. In 1993-1994, there are about 600 cases of pesticide poisoning allegedly due to eating contaminated vegetables. This study aims to investigate the extent of imbalance in the use of inorganic fertilizers in Vietnam. Due to lack of basic information, the analysis only infers on the relationship between the use of inorganic fertilizers with increased pest occurrences, and hence increased pesticide use. Health effects of pesticide use on the producers and consumers are also investigated. This 5/15/03 12:39 PM Impact of Agro-Chemical Use on Productivity and Health in Vietnam Page 1 of 69 http://203.116.43.77/publications/research1/ACF122.html
-
Upload
independent -
Category
Documents
-
view
1 -
download
0
Transcript of Impact of AgroChemical Use on Productivity and Health in Vietnam by Nguyen Huu Dung, Tran Chi Thien,...

Research Reports
Impact of Agro-Chemical Use on Productivity and Health in Vietnamby Nguyen Huu Dung, Tran Chi Thien, Nguyen Van Hong, Nguyen Thi Loc, Dang Van Minh, Trinh Dinh Thau, Huynh Thi Le Nguyen, Nguyen Tan Phong, And Thai Thanh Son
1.0 EXECUTIVE SUMMARY
1.1 Background and Objectives
Agro-chemicals play an important role in intensive agriculture. They offer the most attractive low cost method of increasing output per hectare of land and give the farmer a high economic return for his labor and investment. The potential for agrochemical application is considerably increased in developing countries where its advantages seem to have not been fully exploited. Vietnam, like any developing economy, promotes the use of agrochemicals.
In recent years, the use of agrochemicals increased considerably. For example, the quantity of agrochemicals used in agriculture increased three times in 1994 as compared to the late 1980s (Ministry of Agriculture and Rural Development). Among these agrochemicals, the inorganic fertilizers were popularly used and reached the level of three (3) million tons/yearwhere two million tons are imported. Among the chemical fertilizers, nitrogen was introduced into Vietnam earlier than phosphorous and potassium because of its yield effect. Modern varieties are nitrogen responsive. The government has also promoted use of nitrogen by price incentives (Part 2). Due to this, there is a belief that farmers over-use nitrogen.
Many farmers tend to use urea heavily; knowledge about the importance of potassium and phosphorus may not be enough. At present, extension workers and scientists advise farmers to be aware of balanced fertilizer application.
The use of too much urea that lead to unbalanced fertilizer use, is in the long-run not sustainable; too much nitrogen also enhances plant growth that makes it attractive to some insect pests. Thus, this could be a source of increased pesticide use.
Indeed, it was observed that the use of pesticides has increased considerably in recent years, largely due to production incentives given by the government. Currently, Vietnam has used 200 different insecticides, 83 fungicides, 52 herbicides, organophosphates, carbamates, and pyrethroids (Ministry of Agriculture and Rural Development, 1995). Though being restricted in use, organophosphates which are in the WHO hazardous categories I and II, are applied by a larger number of farmers. All farmers used pesticides of all kinds to control pests. About 36% of restricted pesticides have been used in Tien Giang province, which increased the farmers health risk from exposure (Dung, 1994). In addition, with greater market liberalization there is higher tendency to use cheaper, more hazardous pesticides. There is less conformity to guidelines issued by the Department of Plant Protection. In 1993-1994, there are about 600 cases of pesticide poisoning allegedly due to eating contaminated vegetables.
This study aims to investigate the extent of imbalance in the use of inorganic fertilizers in Vietnam. Due to lack of basic information, the analysis only infers on the relationship between the use of inorganic fertilizers with increased pest occurrences, and hence increased pesticide use. Health effects of pesticide use on the producers and consumers are also investigated. This
5/15/03 12:39 PMImpact of Agro-Chemical Use on Productivity and Health in Vietnam
Page 1 of 69http://203.116.43.77/publications/research1/ACF122.html

is done to illustrate the consequences of current government policies on use of pesticides.
Studying and valuing the effect of current levels of agrochemical use on productivity and health will be an important input in formulating policy decisions to promote sustainable agriculture, and better quality of life in rural Vietnam.
This report is divided into seven parts. The second and third parts discuss the agrochemical use in Vietnam at the macro level and field levels, respectively. The fourth part details the methodology used in the study; parts 5, 6 and 7 present the results of the case studies done among rice farmers in Red River Delta in North Vietnam, vegetable farmers and consumers in Ho Chi Minh (HCM) city and rice farmers in the Mekong Delta in South Vietnam.
Fertilizer manufacturing is a low - and long - return industry. Government subsidies and support for investments in these projects could be in the form of tax exemptions, guarantees for borrowed funds or low royalties on raw materials. The data on nutrient needs of Vietnam farmers will be important so that these instruments will be more targeted.
1.2 Study Hypotheses
The case studies presented set out to answer the following hypotheses:
1. Rice and vegetables farmers in Vietnam overuse nitrogen which leads to use of wrong fertilizer mix;2. The high amount of nitrogen causes high population of brown plant hopper and other pests, in rice and vegetables;3. High pesticide use leads to frequent exposure by producers, thus, posing health risks;4. High pesticide residues in vegetables also put consumers at risks.
1.3 Study Methodology
In order to address the above hypotheses, both secondary and primary data were used. The project duration covers one year and so long-term experimental trials were not possible. The second hypothesis then was investigated through evidences from literature reviews (Part 3).
The primary data were collected to shed light on the other three hypotheses. A total of 86 rice farmers in North Vietnam; 94 rice farmers in Mekong Delta and 60 vegetable farmers in HCM City were interviewed during November to December 1996. Farm and household level data were collected. Data on willingness to pay to avoid being sick due to insecticide were also collected among North Vietnam and HCM City farmers. Rice production data pertain to two cropping seasons in 1996-97. Vegetable production data consisted of cabbage and tomato produced in 1996. The vegetable consumer survey was done in December, 1996. Sixty (60) vegetable consumers were interviewed to determine their perceptions and attitudes towards safe vegetables sold in Vietnam. Willingness to pay (WTP) for safe vegetables were also elicited; however the demand function estimation did not yield significant results due to lack of price variation in vegetables sold in HCM market.
An econometric production function estimation was done to determine the yield effects of the current mix of fertilizers used by rice and vegetables farmers (Part 4). First-order conditions for profit maximization was assumed to generate the optimal fertilizer mix. If the coefficient from the regression equation was not significant, the recommended rates from extension servicewere instead used to come up with balanced fertilizer mix. Private cost of overuse of nitrogen was also calculated; environmental cost could be inferred from the analysis. Descriptive statistics described the levels of WTP to avoid being ill by rice farmers in the North; and vegetable farmers and consumers in HCM City.
Table 1.1 Extent of over-use/under-use of fertilizers (in kg/ha) in Vietnam
Fertilizer /Location/Crop Optimal amount Farmers’ practice Overuse(+)/Underuse (-)
Red River Delta (rice)
Spring season
N
100
66
20
122
62
29
22
-4
9
5/15/03 12:39 PMImpact of Agro-Chemical Use on Productivity and Health in Vietnam
Page 2 of 69http://203.116.43.77/publications/research1/ACF122.html

P O2 5
K O2
Autumn season
N
P O2 5
K O 2
91
54
16
96
44
25
5
-10
9
Ho Chi Minh City (vege)
NCabbage
P O2 5
K O2
Tomato N
P O2 5
K O2
210*
280
210
250*
300
410
210
100
90
250
80
40
-
-80
-120
-
-220
-370
Mekong Delta (rice)
Spring-Autumn
N
P O2 5
K O2
86
113
18*
113
57
13
27
-56
-5
* Recommended rates
1.4 Summary of Results
1.4.1 Balanced fertilization issue
The micro level analysis showed that Vietnamese farmers are in general, overusing nitrogen and under-using potassium and phosphorous (Table 1.1). This unbalanced use of fertilizer mix has led to non-optimal yields and profits. The analysis shows that farmers can benefit in terms of higher yields and profits if they follow the optimal mix (Table 1.2). The estimates can be subjected to sensitivity analysis to determine the input/output price ratios that could influence farmers’ decision to use the optimal amount. Pricing, however, is only one strategy to influence level and mix of fertilizer use.
Table 1.2 Comparison of yields (in kg/ha) and profits (in 1000 VND/ha) between optimal mix and farmers’ practice
Location/Crop Yield Profit
Optimal Farmers’ Difference Optimal Farmers’ Difference
5/15/03 12:39 PMImpact of Agro-Chemical Use on Productivity and Health in Vietnam
Page 3 of 69http://203.116.43.77/publications/research1/ACF122.html

mix practice mix practice
Red River Delta (rice)
Spring
Autumn
5813
4241
5750
4020
63
221
4293
4276
3878
3794
415
482
Ho Chi Minh City
(vegetables)
Cabbage
Tomato
4202
3937
3900
3460
302
477
68
2632
-74
2310
142
322
Mekong Delta (rice)
Spring-Autumn
6465 6336 129 123 79 44
Note: US$ = 11,600 VNDVegetable data are in 1000 m2
As observed, especially in Red River Delta, farmers do not produce for maximum profits, but for maximum yields. Thus, the insignificant differences between farmers’ practice and the recommended rates (Part 5). In this situation, one will not just depend on pricing strategies to influence farmers’ behavior. Farmers need to understand that balanced fertilization in the long-run will be more advantageous in terms of sustainability of yields; and minimum negative impact to the agro-ecosystem. However, in areas where farmers are more integrated in the market, prices of these inputs could include a premium due to environmental costs.
Especially among the market-oriented vegetable farmers and Mekong Delta rice farmers, where there is certainly overuse of N and under-use of P and K, higher N and output prices could lead to more optimal use (Parts 6 and 7). Caution, however, must be taken in interpretation of some estimates. For instance, the optimal amount of phosphorous is much higher than recommended rates. As common in recall studies, measurement errors could create econometric problems. Ideally, a panel data analysis would give more robust estimation of production coefficients, especially if the temporal farmer decisions affect the yield variation.
The role of animal manure is highlighted in the Red River Delta farmers and vegetable farmers. In the North, animal manure is a significant input, and minimizes potassium use. In vegetable farmers, there is an overuse. The commercial farmers in Mekong Delta do not use animal manure at all.
1.4.2 Insecticide use
Insecticide use in Red River Delta did not give significant coefficients for the spring season; this coefficient was significant in the autumn. Since the data on pest infestation levels are not available, one could not really determine the productivity of insecticides. However, it was observed that in the spring, many farmers sprayed insecticides periodically even if there was no pest infestation, thus, an overuse of these chemicals. In the autumn season, farmers feel that the weather is not conducive tohigh pest population so they do not spray too much. Decision parameters on the use of pesticides, in general are not very well defined for all farmers in the study areas.
This is more evident among vegetable farmers who spray insecticides very frequently. The more urgent information that vegetable farmers need to know is the strict compliance to the pre-harvest intervals in using pesticides. Current practice is for farmers to spray as close to one day before harvest to sell good-looking vegetables. This practice, however, poses health risks to consumers especially for those who consume raw vegetables.
1.4.3 Externalities due to agrochemical use
5/15/03 12:39 PMImpact of Agro-Chemical Use on Productivity and Health in Vietnam
Page 4 of 69http://203.116.43.77/publications/research1/ACF122.html

Fertilizers
Overuse of Nitrogen could lead to more pest incidence. Secondary data indicated that an increase in brown plant-hopper and other insects pest population in rice as well as diseases especially in vegetables could be triggered by nitrogen overuse. On the other hand, under-use of phosphorous and potassium could deplete the natural nutrient contents of the soils that could lead to degraded soils. Use of animal manure is actually found to be a good complement to inorganic fertilizers.
Insecticides
Health risks are evident among farmers due to insecticide exposure. In the Red River Delta, farmers are willing to pay a positive amount to avoid being ill. This WTP was on the average about 250,000 VND.
Vegetable consumers are also willing to pay a premium for safe produce (Table 1.3). Among organic market consumers the consumer surplus that was estimated for safe vegetable is 2,200 VND/kg of cabbage and 4,500 VND/kg for tomatoes. This was calculated as the difference between their maximum WTP and the actual price paid for safe vegetables.
Table 1.3 Willingness to pay for safe vegetables, Ho Chi Minh City, 1996. (In VND/kg)
WTP price Actual price Consumer surplus
Ordinary market
Organic market
Ordinary market*
Organic market**
Ordinary market
Organic market
Tomato 4,724 12,000 2,538 9,800 2,182 2,200
Cabbage 8,440 21,800 5,012 17,300 3,428 4,500
* Actual price of the vegetables in the ordinary market** Actual price of safe vegetables in the organic market
For ordinary market, consumers are willing to pay about 2,000 VND more for a kilo of safe cabbage, and 3,000 VND more for a kilo of safe tomatoes. The study however, pointed out that there is difficulty in identifying the safe vegetables from the high pesticide residue vegetables.
1.5 Recommendations
1.5.1 Towards a balanced fertilizer use
Farmers should be aware of the importance of balanced fertilization. Information campaign is helpful. The village leaders should periodically update the soil analysis in their areas, and advise farmers on the mix of inorganic fertilizers as a complement to the soil nutrients and the seed variety they use. The use of animal manure should also be encouraged.
Though price incentives are important only to market oriented farmers, the prices should include a premium that should possibly indicate environmental costs incurred due to improper use. Urea plants have been producing sufficient amounts of nitrogen; but incentives to increase supply of phosphorous and potassium should be in place. This could be in terms of tax breaks for investors willing to supply these nutrients.
1.5.2 Minimizing pesticide externalities
Vietnamese farmers, like others in the developing world need to understand the what’s, why’s and how’s of pest management. Currently, there is no definite decision rules that farmers follow to use pesticides. Knowledge of the ecological make-up of the fields is important for farmers to maximize benefits from an insecticide spray. Price is only one factor in maximizing profits, the pest density is another factor. Hence, farmers training along these; as well as on proper and judicious use of pesticides will
5/15/03 12:39 PMImpact of Agro-Chemical Use on Productivity and Health in Vietnam
Page 5 of 69http://203.116.43.77/publications/research1/ACF122.html

have positive impact on production and health.
1.5.3 The realities of consumer health risks
Pesticides that create high residues in vegetables, thus causing consumer health problems need to be strictly regulated. The Plant Protection Department at HCM City monitors pesticide residues in vegetables. The results of these should be used for regulatory purposes, including restricting sale and use of persistent compounds. Educating vegetable farmers about IntegratedNutrient Management (INM) and Integrated Pest Management (IPM) will translate to safer vegetable produce. This is because high nitrate and high pesticide use contribute to high chemical residues in vegetables.
1.5.4 Further research
Research institutions should be pro-active in issues of IPM and INM. Long-term research should be done to create data bases for the fertilizer-pest-pesticide interaction. Basic research on nutrient management and on cropping patterns and their impact on soil nutrient content should also be on a long-run basis. All these information could be inputted into a policy research that will serve as basis to initiate policy reforms.
2.0 AGROCHEMICAL USE IN VIETNAM
2.1 National Trends
2.1.1 Fertilizer use
Plant nutrient supply through chemical fertilizers is a common and conventional practice. The world use of chemical fertilizers reached 122 million tons in 1979-1980. This number increased to 143.5 million tons during 1989-1990; and reached to 137.5 million tons in 1990-1991 (Table 2.1). According to some estimates, the world fertilizer use is expected to grow from 1990-1991 to 1996-1997 at about 0.9% per year in which a rate of 1% is for nitrogen, 0.7% for phosphate, and 0.8% for potash.
Table 2.1 Trends of total fertilizers (N + P O + K O) use in major regions (million tons)2 5 2
Region 1979-1980 1989-1990 1990-1991
World 122 143 137.52
Asia 28 53 56.403
India 5 11 12.561
Europe 32 31 26.078
All developing countries 34 63 65.048
All developed country 78 81 72.472
Source: FAO, 1992. Integrated Plant Nutrition System, 1993.
The trend of fertiliser use in developing countries, being different from the world trend and the trend in developed countries, showed an increase of 4.5% in total fertiliser use. The developed countries recorded a reduction of 10.8% in total consumption.
5/15/03 12:39 PMImpact of Agro-Chemical Use on Productivity and Health in Vietnam
Page 6 of 69http://203.116.43.77/publications/research1/ACF122.html

Fertilizer use in Vietnam increased from about 172,000 tons per year (in nutrient terms) in 1980-1981 to 428,000 tons per year in 1984-1986 to about 500,000 tons per year in 1989-1990. However, average fertilizer consumption per ha is not high by East-Asian standards and by the extent of irrigation in the country (Table 2.2).
Table 2.2 Fertilizer Use and Associated Indicators, 1987-1989
Indonesia Cambodia Thailand VN Malaysia
AVR paddy yields (ton/ha) 3.1 3.2 3.7 2.7 4.0
% rice area under irrigation 25.0 60.0 73.0 45.0 55.0
AVR fertilizer use
(kg nutrient/ cultivated ha)
39.0 75.0 151.0 63.0 113.0
AVR size of farm (ha) 3.8 0.6 3.5 2.8 1.1
Source: Various World Bank Reports and Country Statistical Reports.
The National Institute for Agricultural Planning and Projections (NIAPP) survey in 1989-1990, showed that, even though fertilizer levels used in the farmers were on average below those of other Asian countries, there is excess use of nitrogen beyond what was considered the economic optimum. Under utilization of phosphorous (P O ) was particularly evident for
virtually all provinces of both the Northern and Southern Central Coastal zones and Hanoi province. In the Mekong Delta, fertilizer use was at the optimum level except possibly for slight overuse of nitrogen (N) in the wet season. Thus, even from an economic optimum standpoint, opportunities exist to reduce some fertilizer application rates (i.e. especially for nitrogenous fertilizer). In fact, the quantity of nitrogen fertilizer used in Vietnam in 1992 increased by around five times as compared to the 1971 level. The quantity of phosphorous and potash fertilizers did not change much over the same period. Total quantity of NPK (accounted by N, P O and K O) used in the whole country in 1993 increased 3.3 times compared to 1981 level. The
amount of NPK used per hectare in 1993 increased 3.5 times compared to 1981 (Ministry of Agriculture and Rural Development).
2 5
2 5 2
2.1.2 Fertilizer market
"It blows hot. It blows cold. It blows hot again!" This is the characteristic of the fertilizer market in Vietnam. The fertilizer market is unpredictable, as it is the market of the world trade. As much as 90% of urea used are imported.
In 1995, the country imported 1.8 million tons of its total consumption of 1.9 million tons. Between 1990 and 1995, the prices shot up four times and fell three times. Government’s interventions at that time to solve the problem were to allocate quotas on a quarterly basis instead of yearly to be more responsive to changes in the international market. The Government also tried to loosen import restriction to curb the monopoly, which had been concentrated in some state-owned fertilizer companies.
In 1991, Agricultural Material Corporation (Vigegam) - a major unit in charge of importing fertilisers - received only 100,000 tons of Urea following an agreement between Vietnam and the Former Soviet Union. This amount represents 10% of import quantity of the previous annual plan. In 1992-1993, there were up to 100 stations importing fertilisers. In 1994, the State decided to reduce the number of fertiliser import stations to only nine and Vigegam was appointed by the Government to import 70% of fertilizers’ total import demand. However, the company’s organization displayed some weaknesses; as a result of which, plan was not well implemented. In 1995, the stations importing fertilisers increased to 28, of which Vigegam was entrusted to import 60% of the total import. This share corresponds to 780,000 tons. Although the requested level was reduced, Vigegam could only import 400,000 tons of fertilizers.
In 1996, 40% of total amount of fertilizers imported was given to Vigegam. The weaknesses and difficulties still existed in this company, contributing to the weak situation of fertilizer market in Vietnam.
5/15/03 12:39 PMImpact of Agro-Chemical Use on Productivity and Health in Vietnam
Page 7 of 69http://203.116.43.77/publications/research1/ACF122.html

The relationship between the prices of fertilisers and prices of rice has remarkably changed since 1989. The farm gate rice price per kg and the fertiliser price per kg have been reduced significantly at the same period (Table 2.3). The price of fertiliser has gone down more quickly than that of rice.
Table 2.3 Relationship between fertilizers (Urea) and Rice Prices, 1989-1995
Relative farmgate prices* (VND/kg, 1989 prices)
Year Fertilizer (1) Rice (2) Ratio (3) = (1) : (2)
1989 1604 459 3.49
1990 1339 507 2.64
1991 771 429 1.80
1992 581 341 1.70
1993 518 196 1.75
1994 412 276 1.49
1995 510 294 1.73
Source: IFPRI Survey in Vietnam, 1995-1996; basic data from General Statistics Office (Government of Vietnam), Food and AgricultureOrganization (FAO) and World Bank. Note: Deflated by GDP price index.
2.1.3 Fertilizer production in Vietnam
According to the Plan of Economic Development of Vietnam, the output of agricultural products will reach 30 million tons by the year 2000 and more than 40 million tons by the year 2010. In this regard, fertilisers will play a very important role in achieving such high outputs. In its aim to achieve this target, Vietnam fertiliser Sector finalised its strategy to meet fertilizer demand by the year 2000. By the year 2010, 2.6 million tons of urea and 3.0 million tons of phosphate fertilisers will be needed.
Vietnam’s capacity to produce phosphate and general NPK has improved. Domestic production met 50% of the demand between 1990 and 1992 and increased to 75% between 1994 and 1995. In 1996, it rose further by five percent. Two joint venture plants have been set up to produce NPK, with a total capacity of 540,000 ton per year. The first is a USD35 million joint venture between the Japanese firm - Nissho Iwai and Central Glass and Southern Fertiliser Company of the Vietnam Chemical Corporation. Vietnam’s input is 30% and the Japanese firm is 70%. The plant, in Dong Nai province, is expected to produce 240,000 tonnes of NPK a year. The second was set up by Vietnam Agricultural Material Corporation, Agricultural Material Company of Baria - Vungtau Province and Itachu of Japan and Taiwan Fertiliser. This USD36 million investment will build a general NPK plant in Baria-Vungtau with an initial capacity of 300,000 tonnes per year. Both joint ventures are expected to be in operation by 1998.
Another project underway is a USD403 million electric power-urea project in Baria-Vungtau, which will produce urea from natural gas. Outside investors include BHP, Agrium, and BSP/Stain. The project, which is being prepared for submission to the government, will provide 800,000 tons per year - about 30 to 40% of local demand. In addition, VINACHEM will raise overseas funds for a 330,000-ton per year DAP plant at Deep Water Port of Ca Lan in Quang Ninh Province. Tomen of Japan has pledged to finance this USD215 million project. It is believed that by the year 2000, Vietnam will be able to meet the domestic demand by producing 1,700,000 tons phosphate and 1,200,000 tons urea.
Despite this optimism, investors are still worried about whether they can gain profit from such a low and long return industry. Therefore, support from the Government to the investment projects in this industry is considered. These could be in forms of
5/15/03 12:39 PMImpact of Agro-Chemical Use on Productivity and Health in Vietnam
Page 8 of 69http://203.116.43.77/publications/research1/ACF122.html
tax exemptions, guarantees for borrowed funds or low royalties on materials used to produce fertiliser, such as appeite,pyrites, serpentine, coal and gas. This study will attempt to determine the nutrient needs of Vietnam agriculture, so that these instruments will be more targeted.
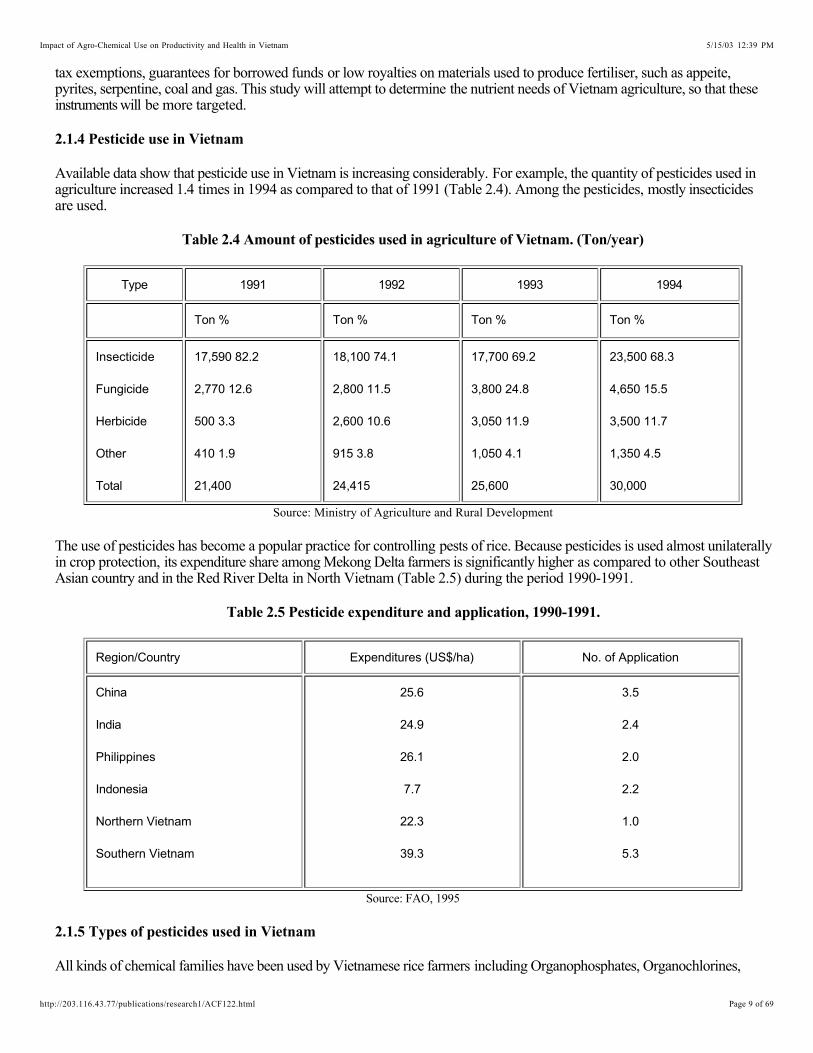
2.1.4 Pesticide use in Vietnam
Available data show that pesticide use in Vietnam is increasing considerably. For example, the quantity of pesticides used in agriculture increased 1.4 times in 1994 as compared to that of 1991 (Table 2.4). Among the pesticides, mostly insecticides are used.
Table 2.4 Amount of pesticides used in agriculture of Vietnam. (Ton/year)
Type 1991 1992 1993 1994
Ton % Ton % Ton % Ton %
Insecticide
Fungicide
Herbicide
Other
Total
17,590 82.2
2,770 12.6
500 3.3
410 1.9
21,400
18,100 74.1
2,800 11.5
2,600 10.6
915 3.8
24,415
17,700 69.2
3,800 24.8
3,050 11.9
1,050 4.1
25,600
23,500 68.3
4,650 15.5
3,500 11.7
1,350 4.5
30,000
Source: Ministry of Agriculture and Rural Development
The use of pesticides has become a popular practice for controlling pests of rice. Because pesticides is used almost unilaterally in crop protection, its expenditure share among Mekong Delta farmers is significantly higher as compared to other Southeast Asian country and in the Red River Delta in North Vietnam (Table 2.5) during the period 1990-1991.
Table 2.5 Pesticide expenditure and application, 1990-1991.
Region/Country Expenditures (US$/ha) No. of Application
China
India
Philippines
Indonesia
Northern Vietnam
Southern Vietnam
25.6
24.9
26.1
7.7
22.3
39.3
3.5
2.4
2.0
2.2
1.0
5.3
Source: FAO, 1995
2.1.5 Types of pesticides used in Vietnam
All kinds of chemical families have been used by Vietnamese rice farmers including Organophosphates, Organochlorines,
5/15/03 12:39 PMImpact of Agro-Chemical Use on Productivity and Health in Vietnam
Page 9 of 69http://203.116.43.77/publications/research1/ACF122.html

Pyrethroids and Carbamates. Many of these are considered extremely and moderately hazardous pesticides according to WHO classification. Available data show that about 23% of all insecticides used in Vietnam are of the Category IA which is considered extremely hazardous (Plant Protection Department, 1993).
2.1.6 Practices by rice farmers
Farmers are perceived to improperly use hazardous pesticides, with mixtures of chemicals, being the favourite form of application. About 65% of farmers read instruction in labels, but only 39% of those understood and followed instruction. Besides, more than 60% of farmers do not use protective clothing when applying pesticides (Trinh, 1994). Thus, the more frequent the application, the higher is the exposure. Therefore, the probability of poisoning through inhalation of chemical and other ways are certainly high. In addition, since there are no danger signs posted in the newly sprayed fields, neighbours as well as children in or near these fields may also be exposed to pesticides.
Due to misuse and unsafe handling of hazardous pesticides, poisoning symptoms were observed among rice growing farmers in the Mekong Delta. In one study, approximately 60% of farmers surveyed claimed sickness (headache, dizziness, vomiting, allergies) due to pesticide use. The number of actual poisoning cases is higher since most farmers do not go to the hospital.Also, local health officials do not always correctly diagnose pesticide poisoning symptoms.
2.2 Agrochemical Policy in Vietnam
Agricultural productivity and health consequences of agrochemical use could be attributed to a large extent to the policy context that governs such use. As in other countries, the general policies relevant to agrochemical use are in terms of trade, price, regulatory, and investments in training programs.
We have summarized in Table 2.6 the current policy instruments that influence agrochemical use in Vietnam.
2.2.1 Fertilizer Policy
Before 1991, fertilizers were imported by state units. About 800,000 to 1 million tons of urea were imported in a contract in Vietnam and Soviet Union. The Agricultural Material Corporation was assigned to transact business of about 40% to 60% of fertilizer importation; while the rest was done by the private sector. Sales tax was also imposed in the domestic sales of fertilizers. However, there are no regulatory policies that governs fertilizer use.
On the other hand, agricultural extension officers teach farmers on the use of agrochemical, both pesticides and fertilizers.
2.2.2 Pesticide Policy
In terms of trade, there was no tax on imports until May 1998. There also was no subsidies to importing pesticide companies. However, in May 1998, a tax was imposed on the importation of the kinds of pesticides (Table 2.6).
Pesticide pricing is competitive. The individual importing companies estimate the market demand and set the prices that are competitive with others in the business. It was however observed that pesticide prices at farm gate are approximately higher than the CIF prices by 10% to 15%. The market share from state pesticide companies is estimated to be about 50%; that of foreign companies is 15%. The remainder is controlled by private traders.
Regulatory policies ensure that the inherently toxic pesticides are to be used properly. In Vietnam, the Plant Protection Department under the Ministry of Agriculture and Rural Development regulates the use of pesticides. Among the important decrees enacted towards a safe environment in the midst of chemical era is the decree on plant protection and quarantine that was promulgated by the National Assembly in 1993.
Among the provisions of this decree which are in line with plant protection chemicals are:
0. biorational products and integrated part management are encouraged by government;1. a list of permitted, restricted and banned pesticides should be known - banned pesticides should be strictly out of the
market;
5/15/03 12:39 PMImpact of Agro-Chemical Use on Productivity and Health in Vietnam
Page 10 of 69http://203.116.43.77/publications/research1/ACF122.html

The test to strict adherence of this promulgation is in the extent of the externalities on health and the environment from the use of these chemicals in agricultural production.
2. organizations/individuals have to secure license to transact business on pesticides;3. product stewardship should be observed, pesticide residues in food should be below international standards;4. pesticide must be registered before making them available to the public.
To minimize these externalities, the government sponsored a national program on Integrated Pest Management (IPM). Externally funded at the moment, this program focuses on the rice crop alone. The program teaches farmers on the integrated tactics of controlling pest, with chemical pesticides as the strategy of last resort.
Table 2.6. Policy instruments governing agrochemical use in Vietnam, 1997-1998
Policy Fertilizers Pesticides
1. Trade There is quota for importation of fertilizers, Vietnam Fertilizer Development Plan liberalizes trade, but defined targets for supply of urea and phosphates.
No tax on raw material imports until May 1998. No subsidies to importing pesticide companies. In May 1998, tax rates are: insecticide 1-3%; herbicide 3%; rodenticide1%; and fungicide 0%. No quota restrictions.
2. Price Sales tax Sales tax, no price control, competitive pricing
3. Regulatory None Plant Protection Department of the Ministry of Agriculture and Rural Development regulates the use of pesticides.
4. Investment in Training Programs
Agricultural extension offices teach farmers on the use of agrochemicals (pesticides and fertilizers).
There is a national IPM program, but limited to rice and with external funding.
3.0 CONSEQUENCES OF AGROCHEMICAL USE ON AGRICULTURAL PRODUCTIVITY,ENVIRONMENT, AND HEALTH: REVIEW OF EVIDENCE
3.1 Evidence from Field Level Studies in Rice
3.1.1 Fertilizer productivity in rice ecosystem
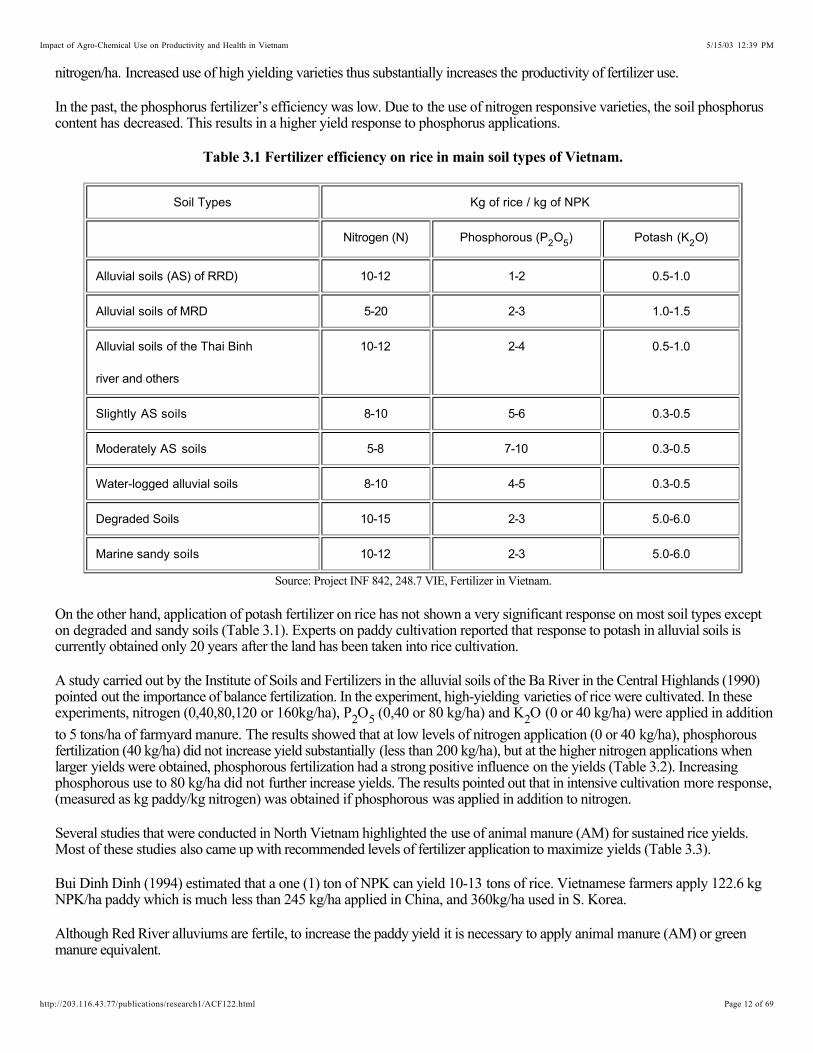
Available data show that most alluvial soils in Vietnam do need substantial nitrogen, and relatively less phosphorus and potassium (Table 3.1).
Some soils do not need high amounts of inorganic fertilizers. The alluvial soil in Cuu Long Delta has high nutrient. However, the farmers used 120-130 kg nitrogen/ha and in some places, the farmers used more than 200-kg nitrogen/ha. The experiments of Thai (1994) showed that 100-kg nitrogen/ha on Cuu Long Delta alluvial soil gave a yield of 7 tons/ha in spring seasons. The efficacy of phosphorus in this soil was very low and it was not necessary to use potash fertilizer for this soil.
Aside from soil, the effectiveness of fertilizer application on crop yield is dependent on other factors such as rice variety, time, and method of application. On high yielding varieties (HYV) such as IR 8, yield responses to fertilizers have been 20 to 25 kg grain/kg nitrogen, producing 2-4 tons of grain/ha with 100 to 120 kg nitrogen/ha. On local varieties such as Chiem Tep and Saiduong 314, yield responses were only 8 to 15 kg grain/kg nitrogen, producing 0.5 - 1.5 tons of grain/ha with 60-90 kg
5/15/03 12:39 PMImpact of Agro-Chemical Use on Productivity and Health in Vietnam
Page 11 of 69http://203.116.43.77/publications/research1/ACF122.html
nitrogen/ha. Increased use of high yielding varieties thus substantially increases the productivity of fertilizer use.
In the past, the phosphorus fertilizer’s efficiency was low. Due to the use of nitrogen responsive varieties, the soil phosphorus content has decreased. This results in a higher yield response to phosphorus applications.
Table 3.1 Fertilizer efficiency on rice in main soil types of Vietnam.
Soil Types Kg of rice / kg of NPK
Nitrogen (N) Phosphorous (P O )2 5 Potash (K O)2
Alluvial soils (AS) of RRD) 10-12 1-2 0.5-1.0
Alluvial soils of MRD 5-20 2-3 1.0-1.5
Alluvial soils of the Thai Binh
river and others
10-12 2-4 0.5-1.0
Slightly AS soils 8-10 5-6 0.3-0.5
Moderately AS soils 5-8 7-10 0.3-0.5
Water-logged alluvial soils 8-10 4-5 0.3-0.5
Degraded Soils 10-15 2-3 5.0-6.0
Marine sandy soils 10-12 2-3 5.0-6.0
Source: Project INF 842, 248.7 VIE, Fertilizer in Vietnam.
On the other hand, application of potash fertilizer on rice has not shown a very significant response on most soil types except on degraded and sandy soils (Table 3.1). Experts on paddy cultivation reported that response to potash in alluvial soils is currently obtained only 20 years after the land has been taken into rice cultivation.
A study carried out by the Institute of Soils and Fertilizers in the alluvial soils of the Ba River in the Central Highlands (1990) pointed out the importance of balance fertilization. In the experiment, high-yielding varieties of rice were cultivated. In these experiments, nitrogen (0,40,80,120 or 160kg/ha), P O (0,40 or 80 kg/ha) and K O (0 or 40 kg/ha) were applied in addition
to 5 tons/ha of farmyard manure. The results showed that at low levels of nitrogen application (0 or 40 kg/ha), phosphorous fertilization (40 kg/ha) did not increase yield substantially (less than 200 kg/ha), but at the higher nitrogen applications when larger yields were obtained, phosphorous fertilization had a strong positive influence on the yields (Table 3.2). Increasing phosphorous use to 80 kg/ha did not further increase yields. The results pointed out that in intensive cultivation more response, (measured as kg paddy/kg nitrogen) was obtained if phosphorous was applied in addition to nitrogen.
2 5 2
Several studies that were conducted in North Vietnam highlighted the use of animal manure (AM) for sustained rice yields. Most of these studies also came up with recommended levels of fertilizer application to maximize yields (Table 3.3).
Bui Dinh Dinh (1994) estimated that a one (1) ton of NPK can yield 10-13 tons of rice. Vietnamese farmers apply 122.6 kg NPK/ha paddy which is much less than 245 kg/ha applied in China, and 360kg/ha used in S. Korea.
Although Red River alluviums are fertile, to increase the paddy yield it is necessary to apply animal manure (AM) or green manure equivalent.
5/15/03 12:39 PMImpact of Agro-Chemical Use on Productivity and Health in Vietnam
Page 12 of 69http://203.116.43.77/publications/research1/ACF122.html

On the joint-effect of potassium and animal manure on paddy yield, Van Bo, et al. (1995) found that with animal manure, potassium effect reduces because AM contains a lot of potassium. Hence, paddy yields are higher if AM is applied with NPK but that higher amounts of K does not translate to higher rice yields. These data tell us that fertilizer mix should be balanced for maximum effect on yield.
Table 3.2 Response of IR-64A rice variety to nitrogen and phosphorus fertilization on the Ba River alluvial soils (Winter 1989, Spring 1990).
Application rates N-P-K
kg / ha
Rice Yield Response
(T/ha) to nitrogen
(Kg paddy/kg N)
to phosphorus
(Kg paddy/kg P)
A B A B A B
0-0-20
40-0-20
80-0-20
120-0-20
160-0-20
0-0-20
40-40-20
80-40-20
120-40-20
160-40-20
2.56
3.70
4.50
4.93
4.76
2.62
3.72
5.56
6.00
6.20
2.20
2.90
3.80
4.00
4.10
2.30
3.00
4.00
4.50
4.70
-
20.7
20.4
17.5
12.6
-
20.0
30.9
25.0
20.4
-
17.5
19.7
14.7
11.7
-
18.7
21.1
18.2
15.1
-
-
-
-
1.50
0.50
26.00
27.00
36.00
-
-
-
-
2.50
2.50
5.00
12.50
15.00
Source: Project INF 842, 248.7 VIE, Fertilizer in VietnamNotes: N denoted for nitrogen;
P denoted for phosphorus;A - winter 1991;B - spring 1990
Results of Nguyen Nhu Ha’s survey of 210 households in 3 provinces in the Red River Delta in 1992 and 1993 showed a high rice yield of around 10 tons/ha/year. The amounts of chemical fertilizers applied are: 104.2 - 130.9 kg N/13 - 64.6 kg P O /0 0-25.7 kg K O, for the spring season, and 77.3 - 114.49 kg N/13 - 60.4 kg P O /0 - 23.8 kg K O, for the
autumn season. Animal manure was applied at 6.5 - 6.8 tons/ha for spring and 4.4 - 6.8 tons/ha for autumn.2 5 2 2 5 2
Table 3.3 Fertilizer recommendations from several studies, North Vietnam.
Source Recommended amount (kg/ha)
5/15/03 12:39 PMImpact of Agro-Chemical Use on Productivity and Health in Vietnam
Page 13 of 69http://203.116.43.77/publications/research1/ACF122.html

N P K
1. For yield maximization
Tran Khai & Nguyen Tu Siem (1994)
Bui Dinh Dinh: (1994)
- Spring
- Autumn
Tran Thuc Son & Dang Van Hien (1995)
Nguyen Van Bo
2. For profit maximization
Tran Thuc Son & Dang Van Hien (1995)
100-120
120
90
160
120
120
30-70
60
40
90
90
60
50-80
30
30
60
60*
30
* with 10 tons A.M.
3.1.2 Previous studies on economics of fertilizers
While the previous section looked at technical recommendations, the question to be asked is whether the level of fertilizer use is economically rationale. Except for one study by Son and Hien (1995), there was no previous study to prove this hence; the current case studies could serve as benchmark information. However, studies in other area are reviewed for illustrationespecially in terms of methodology.
Akimi Fujimoto in 1987 conducted a study for three villages in Thailand (i.e. Phatthalung, Suphan Buri, and Chiang Mai) using the Cobb-Douglas production function. The dependent variable was total production of paddy rice (in kilograms) while the independent variables are total rice land area (in rai), total labor input (in man-hours regardless of age and sex of the workers), total expenditure on fertilizer (in baht) and a dummy variable for tenure.
The results of estimation presented in Table 3.4 show that the model is best fit for Phatthalung, where more than 91% of the yield variation can be explained by the four independent variables, followed by 86% in Suphan Buri and 47% in Chiang Mai. Dr. Ahmad Saeed Khan and Asghar Ali - used the quadratic and Cobb-Douglas to model production in the irrigated areas of the Punjab. The quadratic equation was right because of non-conformity and inconsistency of results with economic theory.
Table 3.4 Production function estimates in Phatthalung, Suphan Buri, and Chiang Mai, 1984/85 rainy season.
Phatthalung Suphan Buri Chiang Mai
Constant
Land, b1
Labour, b2
Fertilizer, b3
5.843
0.831***
(13.072)
-0.026
(-0.422)
0.115***
5.662
0.925***
(15.818)
0.090*
(1.720)
0.036
6.479
0.762***
(8.241)
0.022
(0.280)
0.034
5/15/03 12:39 PMImpact of Agro-Chemical Use on Productivity and Health in Vietnam
Page 14 of 69http://203.116.43.77/publications/research1/ACF122.html

Tenurial Status,
B4
Sum of Coefficients
R2
DW ratio
N
(2.571)
-0.040
(-0.831)
0.946
0.915
1.832
97
(1.096)
-0.083*
(-1.771)
0.932
0.859
2.111
152
(1.180)
0.062*
(1.439)
0.825
0.468
2.303
129
Note: ***significance at the one percent level; **significance at the five percent level;* significance at one percent level; Figures in parentheses are the t-value.
The Cobb-Douglas function had three variables, N, P, K, and a dummy variable as time shiftor for the seven-year data. Results of their sensitivity analysis are shown in Table3.5. The findings show that prices of paddy drives the increase in use of both nitrogen and phosphorous given constant prices.
Son and Hien (1995) both estimated the N, P, and K rates for yield maximization and for profit maximization (Table 3.3), where they found out that the economic optimum rates are lower than the yield maximum rates.
Table 3.5 Balanced fertilizer optimal doses of nitrogen and phosphorus at their prevailing prices fixed at Rs. 1.30 and Rs. 0.90 per nutrient pound respectively for the Punjab (Potash fixed at 40 pounds).
Prices of paddy per maund Nitrogen Phosphorus Potash
25
35
45
55
65
75
55.41
81.14
107.90
135.47
163.73
192.58
35.84
52.48
69.79
87.62
105.90
124.55
40
40
40
40
40
40
Source: Kham and Ali, no date
3.1.3 Relationship between nitrogen and pest population: theory and evidence
The word "pest" is used to represent weed, plant diseases, and insects detrimental to crops. Pest damages crops, resulting to major yield losses as evidenced by: a) weed competes with crop plants for sunlight, water and nutrients; b) insects and their larvae feed on crop plants and act as disease carriers; c) fungi, bacteria and viruses invade and damage the plants; and d) rodents and insects feed on produce, and fungi poison them or make them otherwise unsuitable as food.
Nitrogen helps to increase early growth rate and canopy closing creating a competitive advantage over some weeds to the crop. It also furthers the growth of tall-growing weeds. The elimination of straw and stubble burning has also increased weed problems. To control or to kill the weeds, herbicides and/or traditional mechanical methods like harrowing and ploughing that
5/15/03 12:39 PMImpact of Agro-Chemical Use on Productivity and Health in Vietnam
Page 15 of 69http://203.116.43.77/publications/research1/ACF122.html

disrupt and bury the weeds are used. So, in brief, high nitrogen will result to high growth of weeds; and additional use of herbicide.
Apart from weeds, crop diseases are also a serious problem that should be given attention. It is obvious that nitrogen favors the growth of the crops, helping the crops to get the lush. However, this can create some inverse effects to the crops, for it favors the growth and reproduction of parasites. Lush growth can lead to an early closing of the crop canopy, making for humid conditions within the crop, that benefit the fungi. Through the acidifying action of fertilization as well as the high ratio of ammonium to nitrate in the soil, attacks of some root diseases are enhanced while others are impaired.
These negative effects damage the crop, resulting to yield losses. Therefore, crop protection, for this fungicides use is imperative. High nitrogen results to widespread plant diseases, needing additional use of fungicides.
The lack of nutrients also results in unbalanced supply of nutrients than can distort plant development and predispose plants to diseases. Properly timed and balanced fertilization is a supporting measure in crop protection. In short, there are many factors that affect pest population and the supply of nitrogen is one of the factors involved.
However, it is a fact in many developing countries that farmers prefer to use nitrogen fertilizers as compared to phosphorous and potassium. This may lead to the wrong mix of NPK ratio that can cause the increase in the pest population resulting to more use of pesticides.
Of the various evidences gathered, the study of the Plant Protection Institute in 1977-1978 showed that the use of high amount of nitrogen caused high population of brown plant-hopper in the two study sites: Long Binh and Long An (Table 3.6).
Table 3.6 Impacts of nitrogen application to brown plant hopper population. Institute of Plant Protection, Summer-Autumn 1997-1978).
Location Nitrogen quantity (kg/ha) Number of brown planthopper / hill
PI Heading Milk Ripening
Long Dinh (*) 90N
120N
12.7
22.2
12.2
32.0
63.0
74.2
36.2
46.7
Long An (**) 40N
80N
120N
49.5
45.6
48.9
76.8
164.5
425.7
612.5
708.7
961.6
-
-
-
*Mean of 3 replications, variety IR 2153-V m , direct seeding at Jun-01-77.2
**Mean of 4 replications, variety 73-2. Source: Institute of Plant Protection, 1978.
The study of Can Tho University and Institute of Agricultural Sciences of South Vietnam in Mekong Delta also showed that nitrogen fertilizer affected the severity of leaf yellowing disease (LYD) in Cai Lay and Vung Liem in 1992 and 1993. An increase in nitrogen application in 1992 from 100 to 140 kg nitrogen/ha led to an increase in the severity of the disease (Table3.7). Although leaf nitrogen concentration increased with higher nitrogen rates, leaf nitrogen content remained well below the critical value of 2.5%. Supplementation with 100 kg P O /ha and 200 kg K O did not show any effect on the disease.2 5 2
3.1.4 Environmental issues relating to fertilizer use
Environmental issues relating to farming and farming practices have come to the fore in recent years and some of the
5/15/03 12:39 PMImpact of Agro-Chemical Use on Productivity and Health in Vietnam
Page 16 of 69http://203.116.43.77/publications/research1/ACF122.html

controversies concern fertilizer use. It is a misconception that the more fertilizer is applied, the more profit can be made. At all times one should aim for the optimum balance between applied nutrients and those removed from the harvest. This thing will help us to prevent leaching of excessive nutrients to the environment. Apart from that, time of year when fertilizers are applied should also be a concern because it has an influence on leaching.
The environmental effects due to fertilizer use can be listed as follows:
0. Nitrogen (N) and Phosphorus (P): Nitrogen and Phosphorus in liquid effluents can contribute to eutrophication in water with a risk of oxygen depletion.
1. Ammonia (NH ): Ammonia gas can cause haze and contribute to the acidification of soils.32. Nitrogen oxides (NO ): Nitrogen oxides can contribute to regional acid precipitation and locally reduced air quality.x3. Sulphur dioxide (SO ): Sulphur dioxide reacts with other gases and contributes to haze formation and also to regional
acid precipitation.2
4. Dust: Dust can be a local nuisance and contribute to visible haze.5. Fluoride (F): In high concentrations, Fluoride is dangerous to plants and animals.
Table 3.7 Effect of fertilizers on grain yield and severity of leaf-yellowing disease, Mekong Delta, 1992.
Site and treatment
(kg NPK/ha)
Grain yield
(t/ha)
Disease index
(%)
Upper leaf N at flowering (%)
Cai Lay
100-46-0
140-46-0
100-146-0
100-46-200
100-146-200
104-146-200
Vung Liem
100-46-0
140-46-0
100-146-0
100-46-200
100-146-200
104-146-200
5.8a
5.7a
6.0a
5.8a
6.0a
5.9a
5.0c
5.2bc
5.2bc
5.4ab
5.5ab
5.7a
55.7c
66.0a
54.8c
56.9c
58.2bc
63.7ab
0.27c
3.45b
0.44c
0.84c
1.15c
7.66a
1.348b
1.764a
1.377b
1.415b
1.403b
1.740a
1.42b
1.439a
1.141b
1.181b
1.114b
1.374a
Note: Within a column, means followed by the same letter do not differ significantly by Duncan’s multiple. Source: Can Tho University and Institute of Agricultural Sciences of South Vietnam in Mekong Delta, 1992.
Although these effects are not perceptible to the eye, they can accumulate through time and will lead to a serious degradation of the soil and the environment in general. Tai Lake area in China is a typical example. Until now, the area serves is a rice
5/15/03 12:39 PMImpact of Agro-Chemical Use on Productivity and Health in Vietnam
Page 17 of 69http://203.116.43.77/publications/research1/ACF122.html

basket of China, but with the present rate of destruction of the biology system, the area will be degraded within 50 years (Source: Environmental Review, 1997).
In developed countries, the levels of fertilizer application are based on regular soil analyses in order to prevent the high content of fertilizers in soil and the negative effects to environment. This is not done in developing countries like Vietnam.
3.1.5 Effects of nitrogen on human health
With the trend of intensive farming to get the high yield for crop, more and more nitrogen fertilizer is used in the world without paying attention to their effects.
In 1990, 94.5 kg NPK was used for one cultivated ha on the average in the world. The intensification in agriculture has made the nitrate level in soil increase. In 1956, the world nitrogen fertilizer production was only 3.5 million tons (in nutrient term) but in 1975 this increased to 40 million tons and it is expected to increase to 200 million tons by the year 2000.
When there is surplus nitrogen in the soil, this will be converted to ammonia or nitrate through biochemical processes. In other words, the nitrate content will increase in soil and water resulting to pollution. Nitrate then will be absorbed in the vegetables and cereals leading to excess over the standard nitrate content in food. The standard nitrate in food and drinking water for adult is 300 mg/day and for children is 30 mg/day.
In developed countries, cultivated areas were seriously polluted due to farming intensification. Holland is a typical example. Vegetable of this country, especially in winter, can contain 4,000mg nitrate/kg. It was calculated that each person here put into his/her stomach 1,100mg nitrate through food and 100 mg nitrate through drinks per day, 4-time exceeding the standard level. This is more serious with children (Environment Weekly, No. 10/96).
High content of nitrate in drinking water also leads to the nitrate disintegration to nitrite (NO2) and the creation of nitroamin in digestive system can cause suffocation, anemia and cancer.
In Vietnam, the use of nitrogen fertilizer has increased remarkably due to the intensification of agriculture. However, up till now, there has been no official research on the effects of overuse of nitrogen fertilizer to environment and farmers’ health. Standards as well as detection of nitrate content in soil, food, water, especially drinking water are still very limited.
3.1.6 Effect of pesticides on rice productivity and farmer’s health.
In the Southeast Asian setting impact, of pesticides in the rice ecosystem has been widely studied. Most of studies were by The International Rice Research Institute (IRRI).
Rice yield increases resulting from insecticide applications reported in the literature are highly variable. Early experiments at IRRI showed that insecticide -protected plots yielded almost twice as much as unprotected plots. However, Litsinger (1987) and Waibel (1986) observed no significant yield differences between the insecticide treated and untreated plots, in more than half of their study cases. A 1989 survey of 50 rice entomologists from 11 countries estimated average yield losses due to insect pests at 18.5%. However, Herdt et al. (1984) concluded that rice yield in farmers’ field could be raised by an additional 0.5 to 1 ton per hectare with prophylactic insecticide applications. Nevertheless, Herdt et al. (1984) also concluded that the expected returns to rice production are lower for farmer applying insecticides on a prophylactic basis rather than not applying insecticides at all.
Rola and Pingali (1992) by comparing the returns to prophylactic control, economic threshold level, farmer’s practice and natural control found natural control to be the economically dominant pest management strategy in normal times. The dominance of natural control becomes even greater when the health cost of exposure to insecticides are explicitly accounted for (Rola and Pingali 1993). The positive production benefit of applying insecticides are overwhelmed by the increased health costs. The value of crop loss to pests is invariably lower than the cost of pesticide - related illness (Rola and Pingali 1993) and the associated loss in farmer productivity (Antle and Pingali 1995).
From the survey of literature of 70,000 records, a total of 856 papers on pest outbreaks were reported in Asia between 1967 and 1993. However, only 106 of them reported any yield loss. (P.L. Pingali, et al. 1995). Pingali, et al. (1995) also showed
5/15/03 12:39 PMImpact of Agro-Chemical Use on Productivity and Health in Vietnam
Page 18 of 69http://203.116.43.77/publications/research1/ACF122.html

that insecticides had a significant positive effect on the mean and significant negative effect on the variance of the yield distribution using Philippines data.
Rice farmers are poisoned from pesticide use in two ways: 1) their exposure to pesticides; and 2) their getting food from paddy ecosystem. Farmers and agricultural workers face chronic health effect due to prolonged exposure to pesticides. Eye, dermal, pulmonary, neurologic and kidney problems were found to be significantly associated with long-term pesticide exposure (Pingali et. al. 1995). It was likewise found that health effects in areas of intensive pesticide use are more serious than in areas with less intensive pesticide use. On the other hand, Warburton et. al. (1995) reported that 31% and 63%, respectively of Laguna and Nueva Ecija farmers in the Philippines get food other than rice from the paddy ecosystem. All of these things such as vegetables, root crops, frogs, fish are potentially contaminated by high intensity of pesticide use.
3.2 Agrochemicals in Vegetable Production in Vietnam
3.2.1 Fertilizer and vegetable production
Organic Fertilizer
Organic fertilizers are popularly used in commercial vegetable production in Vietnam. But most vegetable producers in Ho Chi Minh City do not have experience in making compost from animal manure and fresh garbage. Thus, they usually apply fresh garbage directly to the crops. Vegetable producers in Hoc Mon district use fresh urban garbage (raw rubbish fertilizer) in the amount of 35-50 tons/ha for cabbage. In contrast, Cu Chi district is relatively far from the center, thus farmers do not use fresh urban cabbage.
For animal manure, farmers at both sites usually apply dry cattle dung for vegetables with the average amount of 30-35 tons/ha (Table 3.8).
Table 3.8 Average amount of fertilizers applied for cabbage and tomato
Kind of Fertilizers Cabbage Tomato
Hoc Mon Cu Chi Hoc Mon
Fresh urban garbage (T/ha)
Animal manure (T/ha)
Oil cake (kg/ha)
Urea(kg/ha)Superphosphate (kg/ha)
Clorua Potassium (kg/ha)
50
30
400
350
200
200
0
35
600
200
200
180
35
35
800
200
100
150
Source: Plant protection Department (IAS).
Nitrogen Fertilizer
Table 3.9 summarizes the recommendations of fertilizer rates for cabbage and tomatoes from several sources. Many nitrogen experiments for cabbage in University of Agriculture and Forestry (UAF) in HCM City revealed that suitable amounts of nitrogen varies from 15-18 KgN/1000m . This is confirmed by Thi (1996) in Red river delta (Northern Vietnam) wherecabbage grown in Winter-spring early season should be applied 15-18 kgN/1000m , whereas cabbage planted early need
2
2
5/15/03 12:39 PMImpact of Agro-Chemical Use on Productivity and Health in Vietnam
Page 19 of 69http://203.116.43.77/publications/research1/ACF122.html

only 12-15 kgN/1000m .2
UAF researchers reported that applying amount of 15 kgN/1000m in cabbage production in Hoc Mon district gave the highest yield and economic efficiency. On the other hand, Quyen et al. (1995) recommended that the most suitable amount of nitrogen for cabbages and tomatoes are 13.8 and 7.5 kgN/1000m , respectively.
2
2
Agricultural Extension Service (AES) of HCM City made a recommendation of 17.4 kgN/1000m for tomatoes growing in Winter-spring season, while Thang and My (1996) suggested that the suitable amount of nitrogen for tomato growing in Northern Vietnam is about 7.8 kgN/1000m .
2
2
Phosphorous fertilizer
In Red River delta in Northern Vietnam, Thi (1996) suggested that the most suitable amount of phosphorous for cabbage is 9kg P O /1000m . In most studies conducted by the Vegetable Department of Institute of Agricultural Science of South
Vietnam (IAS), phosphorous of 6-kg P O /1000m is used as a standard for cabbage. Quyen et al. (1995) recommended the
amounts of phosphorous for cabbage and tomato growing in Ho Chi Minh City to be 6 and 8 kg P O /1000m , respectively.
2 52
2 52
2 52
Amount of phosphorous recommended by Agricultural Extension Service (AES) of Ho Chi Minh city is about 14.5-kg P O /
1000m for tomato planting in Winter-spring; while Thang and My (1996) suggested that 10-14.5kg P O /1000m
phosphorous for tomato production in Northern Vietnam is most suitable.
2 52
2 52
Potassium fertilizer
In Northern Vietnam, Thi (1996) suggested a potassium amount of 12-kg K O/1000m for cabbage growing in Winter-
spring season; while Vegetable Department (IAS) used 9 kg K O/1000m as a standard for many studies on cabbage varietal
experiments around urban district of Ho Chi Minh City. Quyen et al. (1995) suggested that suitable amounts of potassium for cabbage and tomato are 7.5 and 12.5 kg K O/1000m , respectively.
22
22
22
In Northern Vietnam, Thang and My recommended a rate of 10-kg K O/1000m for tomato. Agricultural Extension Service
of Ho Chi Minh city also suggested potassium amount of 10-kg K O/1000m for tomato production in Winter-spring.2
2
22
Table 3.9 Recommended rate of fertilizers for cabbage and tomato
Kind of fertilizer Recommended rate of fertilizer (kg/1000 m )2
Cabbage Tomato
N 8. (Quyen et. al., 1995)
15 (Kiet and Quyen, 1995)
15 - 18 (Thi, 1996)
15 - 18 (U.A.F., unpublished)*
8. (Quyen et. al., 1995)9. (Thang and My, 1996)
17.4 (A.E.C., 1996)***
P O2 5 8 (Quyen et. al., 1995) 6 (Quyen et. al., 1995)
5/15/03 12:39 PMImpact of Agro-Chemical Use on Productivity and Health in Vietnam
Page 20 of 69http://203.116.43.77/publications/research1/ACF122.html

6 (Kiet and Quyen, 1995)
9 (Thi, 1996)
10 (Thang and My, 1996)
14.5 (A.E.C., 1996)
K O2 5. (Quyen et al., 1995)
9 (Kiet and Quyen, 1995)
12 (Thi, 1996)
5. (Quyen et. al., 1995)
10 (Thang and My, 1996)
10 (A.E.C., 1996)
*U.A.F. = University of Agricultural and Forestry, Ho Chi Minh City, Vietnam.**A.E.C. = Agricultural Extension Center for Ho Chi Minh City.
3.2.2 Pesticide use in vegetable production
Although there are about 200 kinds of insecticides available in Vietnam, vegetable farmers only use some familiar ones.
A survey in the vegetable zone of Ho Chi Minh City revealed that farmers use about 16 kinds of insecticides (Hung, 1993). The most widely used insecticides are Cidi M50ND, Monitor 70SC, Sherpa 25EC, and Sumicidin. Farmers still use insecticides for vegetables that are banned by Ministry of Agriculture and Rural Development. These include Methyl parathion, Monitor, Azodrin, Furadan, Decis.
Most farmers do not have good knowledge in recognizing pests causing damage on their crops. This leads them to use pesticides improperly. Most of farmers mix 2-5 kinds of pesticides together. Farmers also use very high dosage of pesticides and spray too many times throughout the season. A survey of IPM program shows that the majority of cabbage producers apply pesticides 20-30 times for a cabbage crop. Some use pesticides more than 30 times (Table 3.10)
Table 3.10 Number of pesticide applications and percent of households used for a cabbage crop.
Number of
sprays/season
Tan Xuan Xuan T. Ba Diem Vinh Loc Average
< 20
20 - 30
> 30
10
65
25
9.5
85.7
4.8
0
80
20
50
50
0
17.4
70.2
12.4
Source: Hung et al., 1993
Most of farmers do not follow the advice of extension workers in pesticide application. In turn, their practices may harm their health as well as those of the consumers. They usually do not respect the recommended pre-harvest interval. In Hoc Mon district 78.2% of households harvested cabbage and 59% picked tomatoes just 1-36 days after spraying pesticide. Sometimes, farmers spray pesticides in the afternoon, and harvest products the following morning. Their products could be contaminated with chemical poisons, which could affect vegetable consumers’ health.
In contrast, the situation of pesticide application in Cu Chi district appears to be relatively better. Perhaps, they learn a lot from IPM trials conducted in the region. But some farmers in Ap Dinh, Cu Chi state that the time of harvesting usually depends greatly on vegetable dealers and the demand of the market. That is why, in some cases, products are harvested right after pesticide application to meet market demand. Some vegetable dealers also force farmers to spray Azodrin 3-4 days before harvesting to make products look good, smooth and juicy. This insecticide is extremely toxic and banned for use on
5/15/03 12:39 PMImpact of Agro-Chemical Use on Productivity and Health in Vietnam
Page 21 of 69http://203.116.43.77/publications/research1/ACF122.html

vegetables. Similarly, most farmers in Red River Delta (Northern Vietnam) apply pesticides for all kinds of vegetable 3 days before harvesting (Thi, 1996).
Table 3.11 Residue levels of methamidophos and monocrotophos on selected crops, Ho Chi Minh City, Vietnam. (mm/kg)
Crop samples Mehtamidophos Monocrotophos
Residue on
Samples
MRL of FAO Residue on
samples
MRL of FAO
Tomato
Tomato
Chinese Cabbage
Celery
String bean
Haricot
Cabbage
Leafy onion
1.71
1.24
1.21
4.73
6.27
4.45
24.78
106.38
2
2
1
1
1-2
1-2
1
1-2
0
2.35
0
0
0
0
33.8
0
1
0.2
Source: South Vietnam Agrochemical Quarantine Center.
Because of the very intensive pesticide use in the vegetable production, and the ignorance of the significance of pre-limit methods, report of South Vietnam Agrochemical Quarantine Center showed that residue on vegetable products taken in Ho Chi Minh is higher than Maximum Residue Limits set by the FAO-WHO (Table 3.11). These are residues of methamidophos and monocrotophos which are classified as extremely toxic (Category 1) by the WHO hazard classification. These high residues pose health risks more so to Vietnamese who consume a lot of raw vegetables. Thus, it is imperative to recommendpolicies that will promote safe vegetable consumption in Vietnam.
4.0 CASE STUDY METHODOLOGY
4.1 Production Function Approach
Production function analysis is useful for deriving measurements of relations between input use and yields at the farm level. It also enables analysis of the impact of different technologies through measurement of shifts in production functions and changes in factor intensities. It is based on the assumptions that (Kalizrajan, 1990):
1. The farmers are observed in a range of circumstances at one time, with different sizes of operational holdings and level of input applications;
2. Farmers are price takers in both product and factor markets and factor prices are fixed competitively;3. All farmers maximize profit based on anticipated output; and4. Within the study area, all farmers have access to the same information on the technology.
5/15/03 12:39 PMImpact of Agro-Chemical Use on Productivity and Health in Vietnam
Page 22 of 69http://203.116.43.77/publications/research1/ACF122.html

The general functional relationship is expressed as:
We compute for the marginal physical product (MPP) of the factor i, and equate this to the ratio of the input and output prices. So, for nitrogen, we have:
Y = f (X, Z) (1)
where:
Y - yield of the crop per unit of areaX - vector of variable inputsZ - vector of fixed inputs
4.2 Estimation Procedure
Numerous alternative mathematical forms can be used to estimate a production function. Some of the functions that are specified in the empirical agricultural production literature are the Cobb-Douglas, the transcendental functions and the quadratic functions. The Cobb-Douglas form is popular for the following reasons: 1) It is a simple model, and 2) Its unitary elasticity of substitution usually fits a cross-section data very well. Both Cobb-Douglas and translog functions were fitted to the data generated in the case studies. However, the Cobb-Douglas production function was used to estimate physical productivity relationships in rice and vegetables studies.
4.2.1 Empirical model
The following Cobb-Douglas function in a log - linear form is defined:
LNYIELD = Ln o + 1IPM + 2EDUDUM + 3SCLASSDU + 4AREADU + 1LNEXP +2LNN + 3LN P O + 4LN K O + 5LNGAI + 6LNTODAY
α α α α α β ββ 2 5 β 2 β β (2)
where:
Y = yield (ton/ha)N = amount of nitrogen (kg/ha)P O = Phosphorous (kg/ha)
K O = Potassium (kg/ha)
GAI = total dose of pesticidesTODAY = total mandaysIPM: Integrated Management Program (Dummy variable); 1 for IPM-trained farmers, and 0 otherwiseEXP = Experience of the farmersSCLASSDU = Soil class (Dummy variable); 0 if soil type is the first grade (Highest quality); 1 for other soil types (Grade 2,3,4,5)EDUDUM = mean education of adult family members (Dummy variable); 0 if farmer's educational level lower than sixth grade, and 1 otherwiseAREADU = Area of land owned by the farmers; 0 if area less than 8000 squared meter, and 1 otherwise
2 5
2
4.2.2 Estimating the optimal amount of fertilizers and the cost of wrong mix of fertilizers
To determine the optimal amount of fertilizers used in Paddy/Vegetable Production to maximize profits:
dLnY/dLnN = MPPn = Pn/Py (3)
5/15/03 12:39 PMImpact of Agro-Chemical Use on Productivity and Health in Vietnam
Page 23 of 69http://203.116.43.77/publications/research1/ACF122.html

We could transform equation 3, by satisfying the following equation:
We do this exercise with the other elements, P and K and animal manure. We are then able to generate four equations with four unknowns, and from these, we could compute for the optimal amounts of the N, P, K and animal manure that will maximize profits, given input and output prices.
Loss of Farmer Income per hectare due to wrong mix of fertilizers: (per ha)
Caveats:
where
MPPn is equal to the Marginal Physical Product of Nitrogen,Pn = the price of nitrogenPy = the price of the output
MPPn x Py = Pn (4)
where
MPPn x Py = Marginal Value ProductPn = Marginal Factor cost
The optimal mix formula of fertilizers - xN / yP / zK / + AM is established based on the combination of the optimal amount of N/optimal amount of P / optimal amount of K / optimal amount of animal manure.
Comparing the yield of optimal mix formula of fertilizers (Y1) with the yield of the wrong mix of fertilizers (Y2) obtaining the loss to production due to wrong mix ( Y): Y = Y1 - Y2∆ ∆
I = (Y1 - Y2)·Py Py is the price of output.∆ where
(Note: to obtain the value of Y1 and Y2 based on the survey data, we do the following: Substitute optimal amounts of N,P, and K, and animal manure in (1), holding other factors constant, and then we compute for Y1. The Y2 is derived using the actual data of farmers.
One also can calculate the cost/saving of farmers due to Wrong Mix of NPK:
C = (TC1 - TC2) TC2 = cost of wrong mix fertilizers + cost of these fertilizers' application:
∆where
F2 . Pf + Lf2 . P1TC1 = cost of optimal mix of fertilizers + cost of these fertilizers' application:
F = N (or P / K / AM), Pf = price of fertilizers, Lf = labor to apply FP1 = Price of labor.
Σ Σ
F2 . Pf + Lf2 . P1Σ Σ
Total Loss (cost) / saving per ha of farmers due to wrong mix of F: 1 + C ∆ ∆
We note that the optimum mix is dependent on the price ratios of the inputs and output. In instances where potassium is not available in the area, then we would not have any estimate of the price of this input. Also, if some farmers do not buy animal
5/15/03 12:39 PMImpact of Agro-Chemical Use on Productivity and Health in Vietnam
Page 24 of 69http://203.116.43.77/publications/research1/ACF122.html

Results of this function using data from Mekong Delta are reported in Dung (1997).
manure, then we can not compute for the optimal manure amount. There are local recommendations on the optimal mix and amounts by the extension office as seen in the previous discussions. These recommendations could be substituted in the production function to get the yield effects, holding the other variables constant. These yield effects represent the level of yields with current farmer management and using the recommended NPK. One could thus compute for the saving from the use of the optimal mix using this information.
4.2.3 Relationship between the wrong mix of fertilizers and pest population, and levels of pesticide use.
To determine the effect of nitrogen levels on the pest population, one needs to define a biological model of the dose-response function. We assume that both nitrogen and pest control variables affect pest populations. In turn, pest and natural enemy populations affect yields. Thus a two-equation model would be of the form:
Pest population = f (Nitrogen, Pesticides) (5)Yield = f (pest population, natural enemy population) (6)
The coefficients of the dose response function can be taken from data derived from experiments and brown plant hopper population (Table 3.6). The short duration of this study did not allow for biological studies, and for further estimation of dose response function.
4.2.4 Cost of over-using pesticides as a result of high nitrogen use.
Cost of pesticide over-use can be computed by comparing the cost of farmer practice with the cost of control of low pest population levels, i.e. CP = ( Qe . Pp + Lp . P1) - (Cost of control of low pest levels)Σ
CP = cost of overusing pesticides,Qe = amount of pesticides overused,Pp = price of pesticides,Lp = labor use for pesticide application (mandays),P1 = price of labor for pesticide application (D/manday),
where
4.2.5 Health cost function of farmers
The approach used in valuing health damage on farmers is a health cost function which is a log-linear regression model defined as follows:
Ln HC = f (LAGE, HEALTH, ACMOK, DRINK, LTODOSE, LINDOSE, LHEDOSE, NACATE12, NACATE34)
: Ln HC = Log of health cost (cost of treatment + opportunity cost of farmers' time required to recuperate + the value of avoiding illness).LAGE = log of farmers' ageHEALTH = farmers' weight by heightACSMOK = dummy for smoking (0 for non-smoker, 1 for smoker)DRINK = dummy for drinking alcohol (0 for non-drinker, 1 for drinker)LTODOSE = LOG of total dosage of all pesticide used (kg a.i./ha)LINDOSE = log of insecticide dosage used (Kg. a.i. /ha)NACATE12 = log of number of application in categories 1&2NACATE34 = log of number of application in categories 3&4
where
4.3 Valuing Health Damages of Vegetable Consumers
5/15/03 12:39 PMImpact of Agro-Chemical Use on Productivity and Health in Vietnam
Page 25 of 69http://203.116.43.77/publications/research1/ACF122.html

The approach used in valuing consumers’ health damages is the Contingent Valuation Method. We generated Willingness to Pay (WTP) for safe vegetables to measure the consumers' value of health impacts of inorganically grown vegetables. We could validate these WTP values with actual prices that are found in the market for safe vegetables.
The data obtained from the CV formal survey include:
1. sample mean of the amount of WTP bid for safe vegetable products.2. respondents’ value of clean vegetable products.3. social-economic standing (such as educational attainment, income, age,4. gender, profession, frequency of eating vegetable, etc.).
5.0 AGRO-CHEMICALS IN RICE IN THE RED RIVER DELTA
5.1 Overview of the Study Site
5.1.1 The Red River Delta
Red River Delta is the second largest rice growing region in the country after Mekong River Delta. The total rice cultivated area of Red River Delta is 626,100 hectares accounting for 13.1% total rice area in the country. Red River Delta has alluvial soils generated from two important rivers namely, The Red River and Thai Binh river.
Farmers in this area engage in rice production, which is the main livelihood of the populace. It has the highest population density. In some parts, this density is more than 1000 per km . Average population growth rate is 2.2 percent annually. Farmers are also better-off in this area than in other rural regions in Northern Vietnam in terms of income, education, health care facilities and infrastructure.
2
In terms of agriculture, Red River Delta has a good soil fertility and irrigation system. Nearly 100% of cultivated rice land areas has access to irrigation system. Farmers practice two to three annual crops per year of which 2 rice crops is common. Lowland rice spring season is from Feb. to June, Summer-Autumn rice season is from July to October. In some areas, the third crop season starts from end of October to January with maize, sweet potato or vegetables as the popular crops grown.
Most rice varieties used are improved and high yielding varieties i.e., IR36, CR203, VN10, and others. Some improved varieties have very high resistance to insects and diseases. Because of high population pressure and lack of agricultural land, farmers have used high doses of agrochemicals such as fertilizers and pesticides for intensive rice agriculture.
It is reported that farmers in the area applied 100 kg to 160 kg of nitrogen per hectare of rice produced (Source: Son and Hien, 1995). The rice yield of from 4 to 5 ton per hectare is common. The survey in Ha Tay province showed that on alluvial soil, the high yield was obtained with an application of 150-160 kg N, in combination with 16 ton of farmyard manure, 90 kg phosphorus, and 60 kg of potassium per hectare. The pesticide use varies widely and depends on the level of pest incidence.
5.1.2 District study site
1. Description of the study site
Two districts belonging to two different provinces were selected for the study. The first is My Van district of Hai Hung province. It is about 50km east of Hanoi. The other is Duy Tien district of Ha Nam province that is located in Southern Red River Delta and about 60km from Ha Noi. Both study areas are rice growing.
But cultivated land area per capita is very low. It is 560 and 658 m per capita in My Van and Duy Tien district, respectively (Table 5.1).
2
5/15/03 12:39 PMImpact of Agro-Chemical Use on Productivity and Health in Vietnam
Page 26 of 69http://203.116.43.77/publications/research1/ACF122.html

Table 5.1 Description of the district study site
District
Item Unit My Van Duy Tien
1. Land area
- Total natural land of which: Lowland rice
Perennial crop land
Water surface area
Ha
Ha
Ha
Ha
21,203
13,862
137
Not available
12,772
7,838.6
300.4
783.0
2. Population
Number households
Person
Household
250,084
61,956
123,638
31,016
3. Cultivated land area per ita m2 560 658
Farmers in sample survey sites have high education status (Table 5.2). Fifty to 65.9% of them finished secondary school while 19.5 to 38.6% are of high school level.
Table 5.2 Education level of sample household heads (%) n = 87
Education level Duy Tien My Van
1 - Elementary School
2 - Secondary School
3 - High School
4 - Other
Number of household survey
14.6
65.9
19.5
-
43
9.1
50.0
38.6
2.3
44
2. Current cropping system
The common cropping systems in these rice areas are as follows: Spring rice - Autumn Rice; and Spring rice-Autumn rice-Winter crop (sweet potato / corn / potato / vegetable).
3. Fertilizer application recommended by district extension department.
Commonly, the district Extension Department advises farmers to use fertilizers based on season and rice variety. In spring season, they advise farmers to apply 100 - 120 kg nitrogen, 80-100 kg phosphorous, and 40 - 50 kg potassium, for improved varieties, and 40 kg potassium per ha for non-improved varieties. In autumn season, recommended amount of fertilizers applied is slightly lower than that of spring season. Compost and animal manure are applied in the amount of 6-10
5/15/03 12:39 PMImpact of Agro-Chemical Use on Productivity and Health in Vietnam
Page 27 of 69http://203.116.43.77/publications/research1/ACF122.html

ton/ha in each crop season.
4. Rice varieties used in the study site
It appears that most farmers in Red River Delta used improved rice variety. These varieties are from Vietnamese Agricultural Research Institute, China, and the International Research Institute (IRRI). There are many varieties that were introduced at the same time. However, it is difficult for farmers to select pest resistant varieties. Farmers usually have a combination of several varieties planted in their plots. The rice varieties used in the study site are: CR203, VN10, C70-71, 1561, CN2 (sources from IRRI and V.N. Research Institutes), Ai32, Q5, TAPGIAO1, KHE UU25 (Hybrid rice varieties from China).
5.2 Analyzing the Effects of Agro-chemicals on Rice Yield
5.2.1 Descriptive statistics
Table 5.3 Current use of fertilizers and pesticides by farmers in two districts, (per hectare) 1996
Inputs and rice yield Unit Spring season Autumn season
Nitrogen
Phosphorus
Potassium
Animal manure
Pesticides
Of which: - Insecticides
- Fungicides
Rice yield
kg.
kg.
kg.
ton
gram a.i.
gram a.i.
gram a.i.
kg.
121.9
61.68
29.11
6.871
1972.6
1463
509.6
5755.0
95.99
44.7
24.66
3.8
857.5
622.1
235.4
4020
Farmers used high quantity of nitrogen; 121.9 kg in Spring season, 95.99 kg in Autumn season (Table 5.3) phosphorus and potassium are applied at low levels. They applied much higher amounts of chemicals in the spring season compared to Autumn season.
Table 5.4 shows that the larger the farm size the lower the agro-chemical investment. As a result, this gives lower paddy yield. The reason could be that the smaller parcels are usually located nearer the village, so farmers tend to cultivate the area intensively.
Table 5.4 Farm size and Agrochemical Input Use, 1996.
Spring season (n=86)
Farms (m )2 N (kg) P (kg) K AM (ton)
Fung
(g.a.l.)
Insecti
(g.a.i)
Man
day
Yield
(kg)
5/15/03 12:39 PMImpact of Agro-Chemical Use on Productivity and Health in Vietnam
Page 28 of 69http://203.116.43.77/publications/research1/ACF122.html

336-720
720-1080
>1080
126.5
119.4
118.0
67.2
57.5
58.5
33.5
26.3
25.8
7.5
6.2
6.8
558.8
449.2
448.3
1628.8
1411.0
1248.0
204.8
169.6
183.1
6019
5587
5552
Autumn season (n=87)
Farms (m )2 N (kg) P (kg) K AM (ton)
Fung
(g.a.l.)
Insecti
(g.a.i)
Man
day
Yield
(kg)
336-720
720-1080
>1080
101.9
97.2
84.6
48.6
44.6
38.3
29.0
25.1
17.3
4.5
3.7
3.1
256.4
249.1
177.9
688.9
608.8
548.1
164.6
165.6
145.6
4164
3989
3851
For the two crop seasons, household heads who have higher education levels tend to use more fertilizers, pesticides and labor input (Table 5.5). Therefore, their rice yields are higher in comparison with those of farmer with lower education. Perhaps, they understand more clearly the need of intensive investment. Or, they might have better economic condition that allows them to invest more.
Table 5.5 Farmer education and agrochemicals use
Spring season (n=86)
Education No. of
HH
N
(kg)
P
(kg)
K
(kg)
AM
(ton)
FUNG
(g.a.i)
INSECTI
(g.a.i)
Yield
(kg/ha)
MAN
DAY
< 7
> 7
36
50
114.1
127.5
56.5
65.4
23.8
32.9
6.18
6.45
452.4
550.1
1277.2
1597.5
5567.3
5933.0
186.7
187.0
Autumn season (n=87)
Education N
(kg)
P
(kg)
K
(kg)
AM
(ton)
FUNG
(g.a.i)
INSECTI
(g.a.i)
Yield
(kg/ha)
MAN
DAY
< 7
> 7
83.30
105.8
39.7
48.3
19.2
29.0
3.36
4.23
202.5
260.8
561.6
671.3
152.6
167.0
3863.7
4140.6
5/15/03 12:39 PMImpact of Agro-Chemical Use on Productivity and Health in Vietnam
Page 29 of 69http://203.116.43.77/publications/research1/ACF122.html

Table 5.6 and 5.7 show that higher yield parcels in both two seasons had higher investment in agrochemicals. This was found to be true in N, P and K.
Table 5.6 Yield and agrochemical use
Spring season
YIELD
(Kg/ha)
No. of
HH
N
(kg)
P
(kg)
K
(kg)
AM
(ton)
FUNG
(g.a.i.)
INSECTI
(g.a.i)
MAN
DAY
4139-5695
5694-5913
5913-7392
33
28
25
103.8
113.7
153.9
43.25
65.76
82.90
15.30
34.07
44.15
4.61
7.01
8.50
329.5
524.2
748.6
963.2
1492.3
2121.3
174.1
231.0
192.1
Autumn season
YIELD
(Kg/ha)
No. of
HH
N
(kg)
P
(kg)
K
(kg)
AM
(ton)
FUNG
(g.a.i.)
INSECTI
(g.a.i)
MAN
DAY
2770-4000
4000-4400
>4400
30
37
20
60.61
99.91
141.8
26.38
48.19
65.14
3.52
29.7
47.0
1.83
4.50
5.66
100.01
270.30
373.50
331.70
72. 803
1358.90
123.8
169.3
199.9
Table 5.7 Nitrogen use and rice yield
Spring season
Nitrogen
(Kg)
No. of
HH
P
(kg)
K
(kg)
AM
(ton)
FUNG
(g.a.i).
INSECTI
(g.a.i).
Yield
(kg/ha)
75.8 - 105
105 - 139
139 - 172
27
34
25
47.1
59.3
80.6
18.7
27.3
42.6
4.83
6.59
9.40
369.7
459.8
728.5
1081.6
1325.9
2062.9
5137.8
5618.1
6607.2
Autumn season
5/15/03 12:39 PMImpact of Agro-Chemical Use on Productivity and Health in Vietnam
Page 30 of 69http://203.116.43.77/publications/research1/ACF122.html

Nitrogen
(Kg)
No. of
HH
P
(kg)
K
(kg)
AM
(ton)
FUNG
(g.a.i).
INSECTI
(g.a.i).
Yield
(kg/ha)
20 - 79
80 -120
> 120
27
33
27
26.28
45.70
60.81
5.15
25.3
42.7
1.78
4.23
5.41
111.12
239.18
350.70
393.48
615.37
854.32
3474.0
4055.9
4504.2
Thus, survey results also indicate that farmers rely so much on the agrochemicals. A 30% increase in price will not affect their current levels of use. However, compared to P and K use, nitrogen use will be reduced according to 17% of farmers. (Table 5.8)
Table 5.8 Frequency counts of household responses to a 30% price increase agro-chemicals (% of household).
The same less than More than
N
P
K
PESTICIDE
82.0
90.7
87.2
95.0
17.0
8.1
6.98
5.0
1.0
1.2
2.33
0.0
Farmers mentioned that their important source of information for agricultural technologies are the radio, television, and newspapers. The role of extension workers contributed only 27.91 to 32.56%. About 50% of farmers relied on their production experience (Table 5.9).
Table 5.9 Farmer sources of technical information (% of farmers receiving information from specific sources)
Sources Fertilizer use Pesticide use Seed Variety use
Radio
Television
Newspapers
Extension
Cooperative
Other farmers
Seller
Experiences
48.84
27.91
23.26
27.91
20.93
8.14
1.16
50.0
43.0
17.44
12.79
32.56
22.1
5.81
1.17
29.1
27.91
10.47
8.14
25.58
23.16
12.79
2.33
41.86
5/15/03 12:39 PMImpact of Agro-Chemical Use on Productivity and Health in Vietnam
Page 31 of 69http://203.116.43.77/publications/research1/ACF122.html

Separate regression equations are estimated for the two different crop seasons: Spring and Autumn. In the former, it was warm, highly humid with moderate sunlight - a good condition for pests, fungi and weeds to develop. In the latter, it is very hot with much heavy rain. These different weather conditions lead to different effects of the agrochemicals and other inputs on the rice yield. The above results of the regressions indicate that N, P, K, AM, FUNG and INSECTI are dominant explanatory variables of rice yield in both crop seasons.
Others 15.11 27.91 6.98
5.3 Estimating Agrochemical Effects on Rice Yield
Cobb-Douglas production function was estimated with the following variables:
Dependent variable:
Rice yield (per hectare (kg/ha) of cultivated area in each crop season for the largest parcel of each household.
Dedu is a dummy variable (Dedu = 0 if schooling years < 7; = 1 if schooling years > or 7)D Soil is all types, a dummy variableDsoil = 0 if soil class = 1 or 2DSoil = 1 if soil class = 3 or 4N is amount of Nitrogen applied in each crop season in kg/ha.P is amount Phosphorus applied in each crop season in kg/ha.K is amount of Potassium applied in each crop season in kg/haAM is amount of standard animal manure applied in each crop season in tons/ha where a 1 to AM mixture is composed of
Fung is fungicides used per hectare in each crop season in gr. A.I.Insecti is insecticides used per hectare in each crop season in gr. A.I.Manday is the amount of labor input per crop per season, in manday/ha
Independent variables:
= 1 ton of standard pig waste composted.= 2 tons of cow and buffalo waste composted.= 1/3 tons of chicken or human waste composted.
Labor input (MANDAY) is also important but more clearly in the Autumn crop. This is needed to take out the flood water from the farms during the early stage of the rice crop growth. Soil type does not affect the rice yield so much, as soil fertility in farms in the Red River Delta are not much different. Education also does not affect the rice yield because farmers in the region have been cultivating rice for a long time, and hence, are very experienced, and often exchange this learning to others. The education level is almost uniform across the respondents; this absence of variation cannot capture the education effect on yield.
To estimate the economic efficiency of each agrochemical and AM as well, the first order condition for profit maximization was solved.
The regression coefficient can be written as:
x =Σ ε y
--- x
δ
δ
Xi---Y
MPP = Y
--- X
δ
δ= xε
Y---Xi
5/15/03 12:39 PMImpact of Agro-Chemical Use on Productivity and Health in Vietnam
Page 32 of 69http://203.116.43.77/publications/research1/ACF122.html
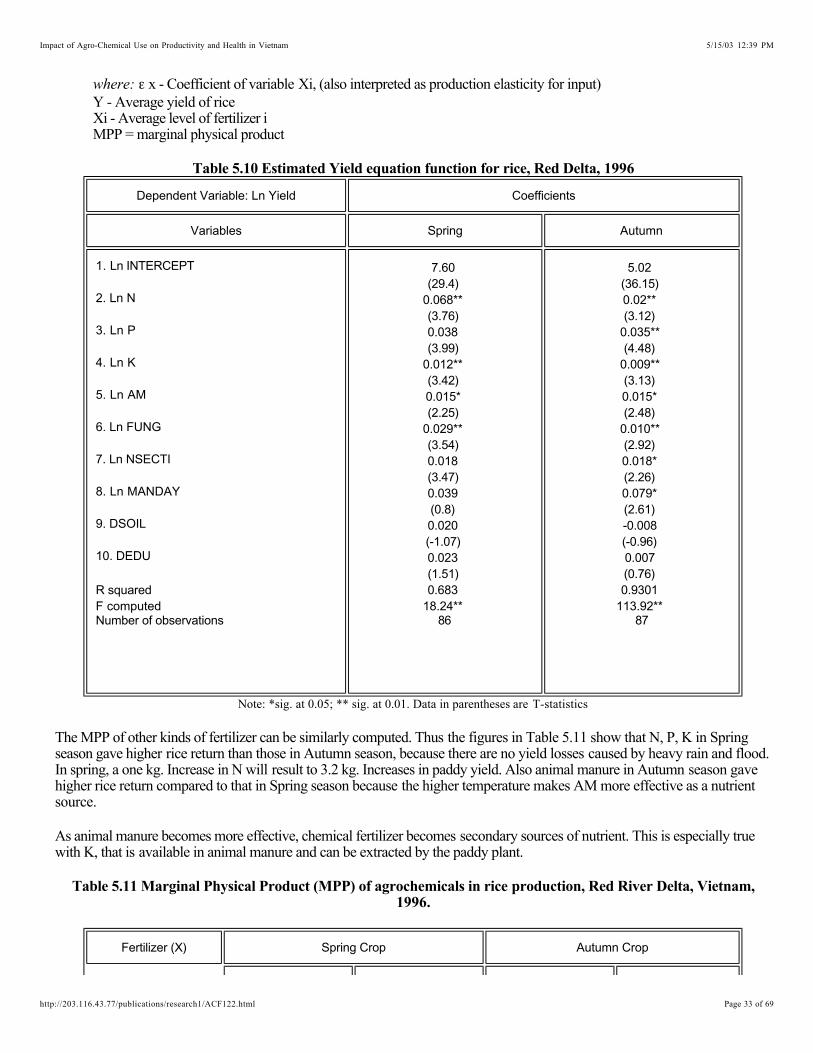
x - Coefficient of variable Xi, (also interpreted as production elasticity for input)Y - Average yield of riceXi - Average level of fertilizer iMPP = marginal physical product
where: ε
Table 5.10 Estimated Yield equation function for rice, Red Delta, 1996
Dependent Variable: Ln Yield Coefficients
Variables Spring Autumn
1. Ln INTERCEPT
2. Ln N
3. Ln P
4. Ln K
5. Ln AM
6. Ln FUNG
7. Ln NSECTI
8. Ln MANDAY
9. DSOIL
10. DEDU
R squaredF computedNumber of observations
7.60(29.4)
0.068**(3.76)0.038(3.99)
0.012**(3.42)0.015*(2.25)
0.029**(3.54)0.018(3.47)0.039(0.8)0.020(-1.07)0.023(1.51)0.683
18.24**86
5.02(36.15)0.02**(3.12)
0.035**(4.48)
0.009**(3.13)0.015*(2.48)
0.010**(2.92)0.018*(2.26)0.079*(2.61)-0.008(-0.96)0.007(0.76)0.9301
113.92**87
Note: *sig. at 0.05; ** sig. at 0.01. Data in parentheses are T-statistics
The MPP of other kinds of fertilizer can be similarly computed. Thus the figures in Table 5.11 show that N, P, K in Spring season gave higher rice return than those in Autumn season, because there are no yield losses caused by heavy rain and flood. In spring, a one kg. Increase in N will result to 3.2 kg. Increases in paddy yield. Also animal manure in Autumn season gave higher rice return compared to that in Spring season because the higher temperature makes AM more effective as a nutrient source.
As animal manure becomes more effective, chemical fertilizer becomes secondary sources of nutrient. This is especially true with K, that is available in animal manure and can be extracted by the paddy plant.
Table 5.11 Marginal Physical Product (MPP) of agrochemicals in rice production, Red River Delta, Vietnam, 1996.
Fertilizer (X) Spring Crop Autumn Crop
5/15/03 12:39 PMImpact of Agro-Chemical Use on Productivity and Health in Vietnam
Page 33 of 69http://203.116.43.77/publications/research1/ACF122.html

The optimal levels of agrochemical application depend on the yield, price of rice and the unit price of the chemical as well as the coefficient x. In its turn, x depends on its application level.
Similarly, we can derive for optimal levels of FUNG, INSECTI for the Spring season and that of each agrochemical for the Autumn season. The output and input prices are found in Table5.12. Comparing those with the actual levels, one can determine that agrochemical is overused although these absolute values may not be statistically significant from zero.
X MPPx X MPPx
N
P
K
AM
121.90
61.68
29.11
6.87
3.2
3.58
2.3
12.5
95.99
44.57
24.66
3.85
2.6
3.2
1.5
15.5
5.4 Estimating the economically optimal level of agrochemical application and the overuse levels.
In practice, farmers, in the area only would want to maximize yields and not profits. In other words, they do not know how much agrochemicals they need to maximize their profit. The basic idea of determining these economically optimal levels of agrochemical application is to estimate the amount at the profit - maximizing point.
To do so, we use the formula derived from the first order conditions,
Xi* = ( xi. Py.Y)/Pxi:ε
where
Xi* = optimal level of the input Xix = coefficient of the variable Xi
Py = Unit Price of RiceY = Average yield of ricePxi = Unit price of the input Xi
ε
ε ε
For example: for Spring season:
a. N* = 0.068213 x 1800 (VD/kg rice) x 5755 Kg rice/7012 (VND/kg.N) = 100.8 Kgb. P* = 0.038321 x 1800 (VND/Kg) x 5755Kg rice/6000 (VND/kgP O ) = 66.16Kg2 5c. K* = 0.011727 x 1800(VND/kg) x 5755Kg rice/6000(VND/kg K O) = 20.25 kg2
Table in 5.13 indicates that farmers in Red River Delta overuse agro-chemicals in rice production, with exception of phosphorus. In Spring season, farmers used more fertilizers and pesticides than in Autumn season. However, we need to test whether the difference in the optimal levels and the current practice are statistically significant.
Table 5.12 Current price of input and output
Price Unit Spring Season Autumn
Paddy
N
VND/kg.
VND/kg.
1800
7012
2200
6000
5/15/03 12:39 PMImpact of Agro-Chemical Use on Productivity and Health in Vietnam
Page 34 of 69http://203.116.43.77/publications/research1/ACF122.html

P
K
Insecticide
Fungicide
AM
Wage rate
VND/kg.
VND/kg.
VND/gram a.i.
VND/gram a.i.
VND/Ton
VND/manday
6000
6000
140
800
200000
10000
5800
5400
125
620
200000
10000
Table 5.13 Determining overuse of agrochemicals in rice in the Red River Delta, 1996.
Chemicals Spring season Autumn season
Optimal Actual overuse Optimal Actual overuse
Nitrogen (kg)
Phosphorus (kg)
Potassium (kg)
Fungicides (g.a.i)
Insecticides (g.a.i)
100.8
66.2
20.2
378
1376
121.9
61.68
29.11
509.6
1463
+12.13
-4.48
+8.86
+131.6
+87
91.0
54.4
15.6
148.0
1285.7
95.99
44.57
24.66
235.4
622.1
+4.99
-9.83
+9.06
+87.4
-663.6
In autumn season, nitrogen, potassium and fungicides were found to be overused while phosphorus and insecticides were underused. Caution must be taken in interpreting insecticide use. In this analysis we assumed that pest incidence is the same in both seasons. In reality this might not be the case.
In Spring, many farmers sprayed pesticides periodically even if there was no pest infestation. In North Vietnam, a limited training on Integrated Pest Management (IPM) was done. In Autumn season, farmers were not worried too much about the pest incidence. Thus, the estimate obtained in the insecticide may not be a normal figure. Productivity of insecticides could only be observed if there is pest infestation. Hence, the figure in Table 5.13 should be taken with caution, i.e., the optimal level of insecticide use should also be a function of pest levels.
5.4.1 Estimating the cost of agrochemical overuse
Cost of chemical overuse is equivalent to 193 kg of paddy in the spring season and 60 kg of paddy in the autumn season (Table 5.14). This was computed based on the method outlined in Chapter 4.
Table 5.14 Cost of agrochemical overuse (CAO)
Chemical Unit Spring Autumn
Overuse CAO (VND) Overuse CAO (VND)
N Kg 12.13 148,164 4.99 29,940
5/15/03 12:39 PMImpact of Agro-Chemical Use on Productivity and Health in Vietnam
Page 35 of 69http://203.116.43.77/publications/research1/ACF122.html
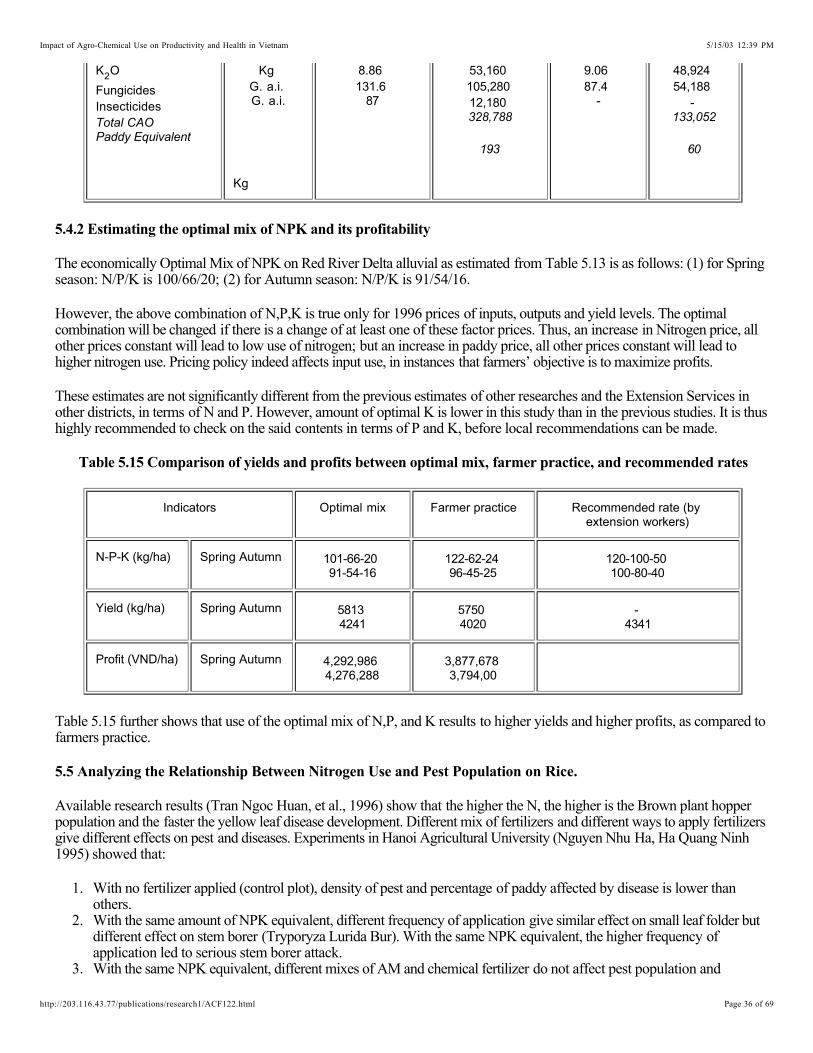
K O2
FungicidesInsecticidesTotal CAOPaddy Equivalent
KgG. a.i.G. a.i.
Kg
8.86131.6
87
53,160105,28012,180328,788
193
9.0687.4
-
48,92454,188
-133,052
60
5.4.2 Estimating the optimal mix of NPK and its profitability
The economically Optimal Mix of NPK on Red River Delta alluvial as estimated from Table 5.13 is as follows: (1) for Spring season: N/P/K is 100/66/20; (2) for Autumn season: N/P/K is 91/54/16.
However, the above combination of N,P,K is true only for 1996 prices of inputs, outputs and yield levels. The optimal combination will be changed if there is a change of at least one of these factor prices. Thus, an increase in Nitrogen price, all other prices constant will lead to low use of nitrogen; but an increase in paddy price, all other prices constant will lead tohigher nitrogen use. Pricing policy indeed affects input use, in instances that farmers’ objective is to maximize profits.
These estimates are not significantly different from the previous estimates of other researches and the Extension Services in other districts, in terms of N and P. However, amount of optimal K is lower in this study than in the previous studies. It is thus highly recommended to check on the said contents in terms of P and K, before local recommendations can be made.
Table 5.15 Comparison of yields and profits between optimal mix, farmer practice, and recommended rates
Indicators Optimal mix Farmer practice Recommended rate (by extension workers)
N-P-K (kg/ha) Spring Autumn 101-66-2091-54-16
122-62-2496-45-25
120-100-50100-80-40
Yield (kg/ha) Spring Autumn 58134241
57504020
-4341
Profit (VND/ha) Spring Autumn 4,292,9864,276,288
3,877,6783,794,00
Table 5.15 further shows that use of the optimal mix of N,P, and K results to higher yields and higher profits, as compared to farmers practice.
5.5 Analyzing the Relationship Between Nitrogen Use and Pest Population on Rice.
Available research results (Tran Ngoc Huan, et al., 1996) show that the higher the N, the higher is the Brown plant hopper population and the faster the yellow leaf disease development. Different mix of fertilizers and different ways to apply fertilizers give different effects on pest and diseases. Experiments in Hanoi Agricultural University (Nguyen Nhu Ha, Ha Quang Ninh 1995) showed that:
1. With no fertilizer applied (control plot), density of pest and percentage of paddy affected by disease is lower than others.
2. With the same amount of NPK equivalent, different frequency of application give similar effect on small leaf folder but different effect on stem borer (Tryporyza Lurida Bur). With the same NPK equivalent, the higher frequency of application led to serious stem borer attack.
3. With the same NPK equivalent, different mixes of AM and chemical fertilizer do not affect pest population and
5/15/03 12:39 PMImpact of Agro-Chemical Use on Productivity and Health in Vietnam
Page 36 of 69http://203.116.43.77/publications/research1/ACF122.html

The other research by Plant Protection Institute showed that the high nitrogen amount caused high population of brown plant hopper in Lonh Binh and Long An province. When nitrogen increased from 90 N to 120 N per ha, the number of brown plant hopper increased from 12.2 /hill to 32.2/hill heading stage of rice.
diseases, but has an effect on paddy yield, i.e., yield reduces with lower chemical fertilizer/AM rate.4. If nitrogen and potassium are applied before transplanting time, it makes paddy grow stronger and faster, and hence,
can be more resistant to pests and diseases.5. Summer - Autumn cropping without potassium application leads to more pests and diseases, hence, less yield.
Although recommended for further research, available evidence supports the hypothesis that overuse of nitrogen will lead to more pest outbreaks and hence, more pesticide use. The optimal amount of Nitrogen used in rice will lead to lower costs, in terms of private outlay and lower social costs, in terms of savings in health-related expenses.
5.6 Analyzing Impacts of Pesticide Use on Rice Farmers’ Health
The frequent exposure to pesticides led to health impairment as shown by previous studies. In this case study, empirical estimation of economic variables is done to assess damage of pesticide exposure on farmers’ health.
5.6.1 Descriptive analysis
1. Characteristics of farmer respondents (n=87)
There are 56% and 61% farmers smoking, and 60% and 59% farmers who drink alcohol in Duy Tien and My Van, respectively. Most smokers and drinkers are men who are heads of households.
Table 5.16 Physical characteristics of rice farmer respondents, RR Delta survey, 1996
Farmers’ characteristics Nam ha Hai Hung
Weight (kg) 52 50
Height (cm) 164 162
Married (%) 93 87
Age (in years) 45 43
Table 5.17 Incidence of smoking and drinking (in percentage of farmers surveyed), Red River Delta, 1996 (n=87)
Farmers’ habit Duy Tien My Van
Smoking 56 61
Drinking 60 59
2. Descriptive statistics of pesticides impact on farmers’ health.
The average distance from farmers’ house to the field is 0.65 km and 0.7 km in Duy Tien and My Van, respectively. However, 85 to 90% of farmers recognized pesticide odor during crop season from 2-3 days of each spraying period. They can not remember how many times they can smell pesticides because there are too many people spraying pesticides in the fields at different times.
5/15/03 12:39 PMImpact of Agro-Chemical Use on Productivity and Health in Vietnam
Page 37 of 69http://203.116.43.77/publications/research1/ACF122.html

All farmers are aware that pesticides affect humans after long term exposure to chemicals. The figures in Table 5.18 show that farmers in Red River Delta used pesticides for a long time. Most of them used pesticides from 5 to 15 years. About 93% of farmers in My Van and 65% of farmers in Duy Tien said that pesticides have significant effect on farmers’ health (Table 5.19).
Table 5.18 Number of years farmers sprayed pesticides (in percent of responses) n=87, Red River Delta, 1996
Year Duy Tien My Van
<5 32 10
5-10 38 38
11-15 15 36
16-20 10 14
>20 5 2
Table 5.19 Farmer perception on the effects of long time application of pesticides, Red River Delta, 1996. (% total of farmers spraying, n=87)
Farmers’ perception Duy Tien My Van
- no effect 0 0
- Very little effect 10 0
- Little effect 25 7
- Much effect 55 36
- Very much effect 10 38
- Extreme effect 0 19
It appears that most of the farmers reported an increase in the amount and frequency of application of pesticides (Table 5.20). Forty percent of farmers said that frequency of application increased considerably from first usage to current usage.
Table 5.20 Perception of farmers regarding changes in the amount and frequency of pesticides applied from the time of first use to the present, Red River Delta, 1996 (% of farmers, n=87)
Perception Amount Frequency of application
Decreased 17 20
No different 3 5
5/15/03 12:39 PMImpact of Agro-Chemical Use on Productivity and Health in Vietnam
Page 38 of 69http://203.116.43.77/publications/research1/ACF122.html

Increased a little 38 35
Increased a lot 42 40
Most farmers also reported to have experienced acute illnesses due to pesticide exposure. Most said that they experience headaches (Table 5.21). Farmers are willing to pay a positive amount to avoid being ill (Table 5.23). They also reported that they have to take days off when stricken with illness (Table 5.22). With respect to chronic effects, studies elsewhere show that an increase in the number in doses would result in higher health costs for rice farmers (Rola and Pingali, 1993).
Table 5.21 Symptoms experienced by farmers after applying pesticide (% of farmers surveyed, n=87), Red River Delta, 1996
Symptom Duy Tien My Van
1. Eye irritation 30 6
2. Headache 78 77
3. Dizziness 38 38
4. Vomitting 10 2
5. Diarrhea 13 0
6. Shortness breath 10 17
7. Heart trouble 13 4
8. Skin irritation 68 60
9. Other 40 30
Note: Multiple answers
Table 5.22 Farmers’ activities when stricken ill due to acute pesticides exposure (n=87), Red River Delta, 1996
Duy Tien My Van
Take day off 51 53
Stay in bed 45 53
Go to clinics 8 0
Go to hospital 5 2
Table 5.23 Willingness to pay to avoid being ill (%), n=87, Red River Delta farmers, 1996
Vietnam Dong (VND) Duy Tien My Van
5/15/03 12:39 PMImpact of Agro-Chemical Use on Productivity and Health in Vietnam
Page 39 of 69http://203.116.43.77/publications/research1/ACF122.html

<100.00 31 17
100.00-200.00 32 44
200.00-300.00 30 19
300.00-400.00 5 4
>400.00 2 16
Note: 1 US$ = 11600 VND
The recognition by farmers of the negative impact of pesticide use should have some implications for policy. Currently, Vietnam does not have a strong pesticide regulatory policy. Most of efficiency gains in the use of pesticides is via farmer education on the proper pesticide handling, and also the appropriate equipment. There is no policy to educate the farmers along other pest management strategies. Although Vietnam has been aggressive with the training of farmers on Integrated Pest Management (IPM), most of these were conducted in the South Vietnam, where the intensive rice cultivation is prevalent. However, as North Vietnam becomes more and more commercialized, farmers tend to use more agrochemicals. Thus, it is also relevant for these training to be done in the North.
6.0 AGRO-CHEMICALS IN VEGETABLES: A CASE STUDY IN HO CHI MINH CITY
6.1 Description of the Study Site
Ho Chi Minh City (HCM) has a population of 4.5 million with a total area of 209,031 hectares. Total area for vegetables is about 11,000 hectares (Table 6.1). Almost all kinds of tropical vegetable are grown in Ho Chi Minh City. The local farmers have valuable experience and long tradition in growing vegetables. Most agricultural areas in Ho Chi Minh City are planted to paddy rice during the rainy season with vegetables being grown during the dry season. There are some areas devoted to vegetables for the whole year; one of these is the Cu Chi district.
Table 6.1 Effective area of vegetables in the Ho Chi Minh City. (ha) (Bureau of Agriculture and Rural Development, HCMC, 1993)
District Whole year Winter-spring
(Nov - Feb)
Summer-Autumn
(Mar - Jun)
Autumn-Winter
(Jul - Oct)
Cu Chi*
Hoc Mon*
Thu Duc
Binh Chanh
Nha Be
Go Vap
Tan Binh
2411
3446
486
2853
5
1636
271
980
1761
164
1477
-
820
119
737
837
162
390
-
521
103
699
844
160
986
5
295
49
5/15/03 12:39 PMImpact of Agro-Chemical Use on Productivity and Health in Vietnam
Page 40 of 69http://203.116.43.77/publications/research1/ACF122.html

Binh thanh
Quan 8
9
216
5
69
2
81
2
66
Total 11,334 5,395 2,833 3,016
*Sites of current study
Location of study site
This study was done in two vegetable growing districts of Hoc Mon and Cu Chi in HCMC. It is bounded to the North by Binh Duong, to the West by Tay Ninh, to the South by Long An provinces. The study site has a good road system to connect to the other urban districts of Ho Chi Minh City.
Table 6.2 Vegetable growing season in Hoc Mon district and percent of households planting vegetables
Planting Season Cabbage Cauliflower Eggplant Cucumber Tomato
Jan. - Mar.
Apr. - Jun.
Jul. - Sept.
Oct. - Dec.
57.3
1.1
3.3
37.3
18.5
0.0
4.5
77.0
0.0
0.0
23.4
76.6
54.1
7.8
0.0
38.1
47.1
2.3
0.0
50.6
(Source: Hoc Mon People's Committee 1996).
Agricultural land
Average land area for growing vegetable per household is relatively small (Table 6.3). The majority of vegetables are produced in a land area of 0.3 - 0.6 ha; very few farmers have land area greater than 0.6 ha. About 28.6% of farmers have land area less than 0.3 ha.
Table 6.3 Average land area for growing vegetable per hh (Hung et al., 1993)
Land area Percentage of household (%)
< 0.03 ha
0.30 - 0.60
0.61 - 1.0
> 1 ha
28.6
58.6
11.4
1.4
Hoc Mon district has a total area of about 15,552 ha. In 1993, vegetable production accounted for 3,500 ha, but this area expanded to 4,112.9 ha in 1995. Vegetable growing areas are scattered on 16 communes, however, they are mainly concentrated in Xuan Thoi Thuong (690 ha), Tan Xuan (647.8 ha), Tan Thoi Hiep (637.2 ha), Tan Thoi Nhi (485 ha), Xuan Thoi Son (374 ha). As an agricultural district, Cu Chi has a total agricultural land of 25,664 hectare of which annual crop land occupies 23,918 ha and perennial crop land 1,746 ha.
5/15/03 12:39 PMImpact of Agro-Chemical Use on Productivity and Health in Vietnam
Page 41 of 69http://203.116.43.77/publications/research1/ACF122.html

Along with the development of Ho Chi Minh City, the vegetable growing areas in Cu Chi district increased gradually in recent years. Vegetable growing area ranks third after rice and peanut.
Weather condition
The climate in the study site is monsoon type with two distinct seasons. The rainy season is from May to November, and the rest of the time is dry season.
Mean annual temperature is 27ºC with a range of 16ºC between the highest (38ºC) and lowest month temperatures (22ºC). Mean annual rainfall is 1,800-2,000mm with 130 rainy days. Mean annual humidity is 83%, in which the lowest humidity is in February (75%).
Water sources
At the study site, there are 5 layers of groundwater that could be used for vegetable production in the dry season. Other sources of water for vegetable production include "Eastern canal", which gets water from Dau Tieng reservoir and many branches of the Saigon River.
The site has an elevation of 3.5 - 5 meters above mean sea level. The soil type at both current study site is sandy loam in grey degraded soil with light texture.
In general, the soil is acidic and this acidity increases with the depth of soil profile. Carbon content is medium and decreases rapidly at deeper layers. The soil has relatively low nitrogen content. Similarly, phosphorous and potassium contents are also very low.
Although, grey degraded soil is considered of poor quality, the study site has many great potentials such as relatively even and flat terrain, suitability for many kinds of vegetables, and abundant source of groundwater.
6.2 Demographic Characteristics
The survey was conducted during the dry season of 1996 (November- December). Sixty households of the two districts of Hoc Mon and Cu Chi were interviewed, in which 59 questionnaires have reliable data.
Most of the respondents in the site were males, only three females are decision-makers in vegetable production (Tables 6.4). Females are usually responsible for crop care such as handweeding and harvesting. Males are responsible for applying fertilizers and pesticides; and watering.
Education level of most respondents is relatively low (grade 1-9). Many of the farmers are unaware of the composition of fertilizers and their knowledge in insects and pesticide use is limited. Most of the families had 3-5 members above 13 years old. Their total gross income varies from 10-50 million VND. Only 15 household borrowed money from the AgriculturalDevelopment banks for vegetable production and animal husbandry.
Sources of information
In general, extension network in the study area is very weak. Furthermore, the skill and knowledge of extension workers are still very basic.
Most of the vegetable producers learned how to apply fertilizer, pesticide and select vegetable varieties from their co-farmers. About 15% of tomato growers seek advise from extension workers for new varieties (Table 6.5).
Only 5% of farmers read booklets and magazines to learn procedures and techniques for applying fertilizers and pesticides efficiently. About 10% of vegetable growers listen to radio programs to know more about fertilizers and pesticides.
Table 6.4 Demographic characteristics of the respondents, 1996, Hocmon & Cuchi.
5/15/03 12:39 PMImpact of Agro-Chemical Use on Productivity and Health in Vietnam
Page 42 of 69http://203.116.43.77/publications/research1/ACF122.html

Characteristic Respondents
Sex Female
Male
3 (5.1%)
56 (94.9%)
Age < 40
40 - 49
50 - 59
= and > 60
13 (22.0%)
23 (39.0%)
17 (29.8%)
6 (10.2%)
Education Level 1 (grade 3 5)
Level 2 (grade 6 - 9)
Level 3 (grade 3 10)
25 (42.4%)
31 (52.5%)
3 ( 5.1%)
Family size
(of members
older than 13 years)
2 persons
3 persons
4 persons
5 persons
6 persons
7 persons
4 (6.8%)
15 (25.4%)
14 (23.7%)
13 (22.0%)
7 (11.9%)
6 (10.2%)
Gross income
(million VND)
< 10
10 - 19
20 - 29
30 - 39
40 - 49
= and > 50
3 (5.1%)
15 (25.4%)
19 (32.2%)
9 (15.3%)
9 (15.3%)
4 (6.7%)
Credit
(million VND)
0
0.1 - 2
44 (74.6%)
6 (10.2%)
5/15/03 12:39 PMImpact of Agro-Chemical Use on Productivity and Health in Vietnam
Page 43 of 69http://203.116.43.77/publications/research1/ACF122.html
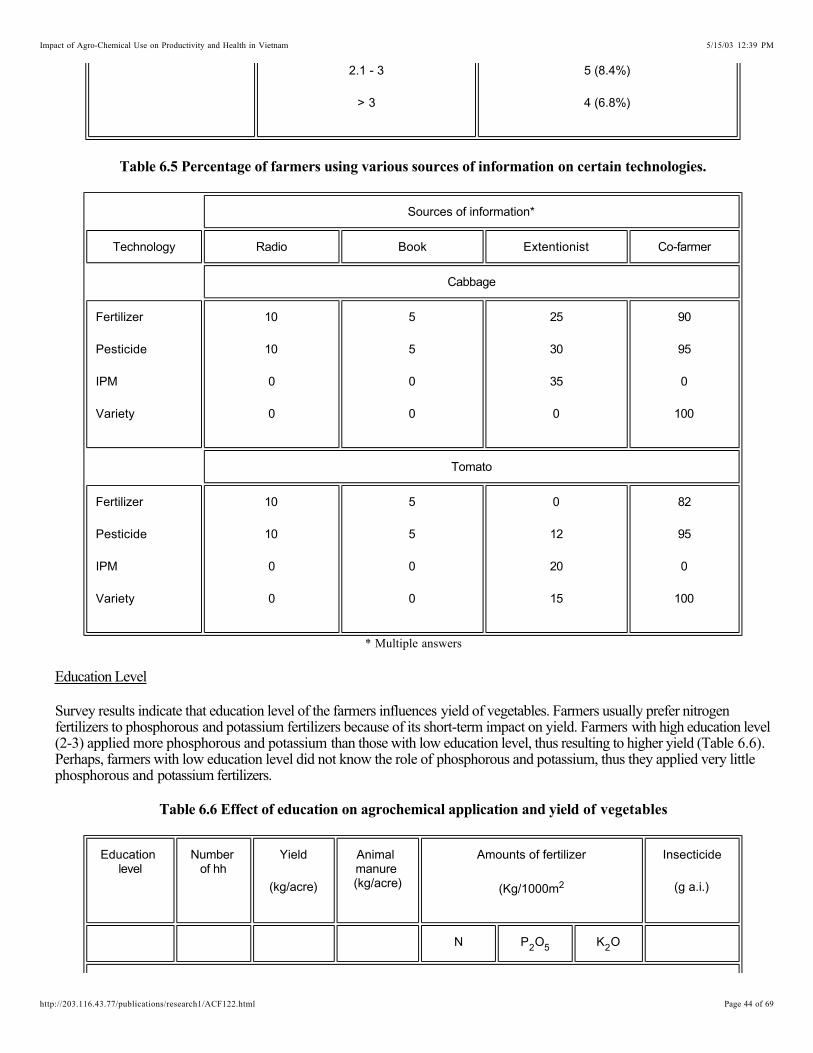
2.1 - 3
> 3
5 (8.4%)
4 (6.8%)
Table 6.5 Percentage of farmers using various sources of information on certain technologies.
Sources of information*
Technology Radio Book Extentionist Co-farmer
Cabbage
Fertilizer
Pesticide
IPM
Variety
10
10
0
0
5
5
0
0
25
30
35
0
90
95
0
100
Tomato
Fertilizer
Pesticide
IPM
Variety
10
10
0
0
5
5
0
0
0
12
20
15
82
95
0
100
* Multiple answers
Education Level
Survey results indicate that education level of the farmers influences yield of vegetables. Farmers usually prefer nitrogen fertilizers to phosphorous and potassium fertilizers because of its short-term impact on yield. Farmers with high education level (2-3) applied more phosphorous and potassium than those with low education level, thus resulting to higher yield (Table 6.6). Perhaps, farmers with low education level did not know the role of phosphorous and potassium, thus they applied very little phosphorous and potassium fertilizers.
Table 6.6 Effect of education on agrochemical application and yield of vegetables
Education level
Number of hh
Yield
(kg/acre)
Animal manure (kg/acre)
Amounts of fertilizer
(Kg/1000m2
Insecticide
(g a.i.)
N P O2 5 K O2
5/15/03 12:39 PMImpact of Agro-Chemical Use on Productivity and Health in Vietnam
Page 44 of 69http://203.116.43.77/publications/research1/ACF122.html

Cabbage
1
2
3
21
35
3
3540
4071
4433
2808
3277
3300
19.1
21.9
25.3
6.0
11.6
14.5
1.8
12.7
11.2
1890
1231
1355
Tomato
1
2
3
25
31
3
2950
3731
5066
2699
3698
3600
24.7
26.0
25.4
5.7
10.0
12.1
1.8
5.8
11.1
1035
907
675
In recent years, the habit of using fresh urban garbage as fertilizer was gradually reduced in the site. Most of the fresh urban garbage are now buried or brought to factories to produce some kinds organic fertilizers. The use of animal manure in rotation crops show favorable effect on both vegetable, and rice crops by enhancing soil fertility and reducing source of diseases from fresh urban garbage.
In general, vegetable producers applied more animal manure and nitrogen fertilizers for tomatoes than for cabbage; whereas cabbages received larger amounts of phosphorous and potassium than tomatoes. This is, perhaps in line with some reports that high nitrogen application on cabbage may lead to high incidence of stem borer.
Farm size
Vegetable farmers with farm size larger that 3,000m had a tendency to use less fertilizer, especially potassium (Table 6.7). This was found to result to lower yields. However, pesticides are applied to control pests.
2
Table 6.7 Effect of Farm Size on agrochemical application and yield of vegetables
Farm Size Number of hh
Yield
(kg/arcre)
Animal manure (kg/
acre)
Amounts of fertilizer
(Kg/1000m2
Insecticide
(g a.i.)
N P O2 5 K O2
Cabbage
<= 1000 28 3,873 3,436 21.2 9.8 10.0 1,212
= 1000 -3000
22 4,050 2,825 21.8 11.0 9.7 1,662
>3000 9 3,616 2,800 19.1 6.7 2.5 1,813
Tomato
5/15/03 12:39 PMImpact of Agro-Chemical Use on Productivity and Health in Vietnam
Page 45 of 69http://203.116.43.77/publications/research1/ACF122.html

3 1000 23 3,713 3,195 26.9 9.3 4.8 913
1000-3000 26 3,340 3,223 26.2 7.8 3.7 954
>3000 10 3,235 3,420 20.3 6.6 4.5 1,034
Total Income
Vegetable producers with total gross income less than 20 million VND apply higher potassium fertilizer for cabbage. This could increase resistance of cabbage to insects and diseases. It was observed that they use lesser pesticides (Table 6.8).
Table 6.8 Effect of total income of farmers and agrochemical application and yield of vegetables
Gross Income
million VND)
Number of hh Yield
(kg/arcre)
Amounts of fertilizer
(Kg/1000m2
Insecticide
(g a.i.)
N P O2 5 K O2
Cabbage
< 20
20 - 40
> 40
16
29
14
4,047
4,074
4,019
22.3
19.5
21.1
9.8
8.0
6.4
9.6
7.2
4.3
1,007
1,409
1,441
Tomato
< 20
20 - 40
> 40
18
28
13
3,588
3,433
3,433
25.4
27.4
23.5
8.5
10.0
10.4
2.3
2.4
2.9
961
940
933
6.3 Results of the Regression analysis
Multiple regression analysis show that educational level of the farmers have significant effect on yield of cabbage but not on tomato yield (Table 6.9). Perhaps, farmers at the site have long tradition in growing tomato; and more experience in tomato production. Cabbage was first planted 15 years ago. Cabbage is very susceptible to insects, especially Diamond back moth. Farmers with high education level may be able to understand and control this insect better than those with low education.
The estimated equation also indicates that improved tomato varieties gave higher yields than local ones. In contrast, KK-cross is the only cabbage variety, suitable for tropical condition, and is grown at the two districts.
The site dummy coefficient showed that there was no difference in vegetable yields between the two districts. The coefficient of animal manure in vegetables is also not statistically significant. Perhaps most of the farmers use high amount of animal manure thus contributing very little to the yield of vegetables.
5/15/03 12:39 PMImpact of Agro-Chemical Use on Productivity and Health in Vietnam
Page 46 of 69http://203.116.43.77/publications/research1/ACF122.html

According to many documents, recommended rates of nitrogen application for cabbage and tomatoes is about 150 kg N/ha or 15 kg/1000m . The survey data showed that farmers on the average, applied amounts of nitrogen fertilizer higher than recommended rate (Table 6.6). Thus, nitrogen did not have significant influence in vegetable yields, and had negative effect on marginal productivity.
2
Similarly, most of the farmers used very high dosage of pesticide and sprayed too many times during the vegetables production season. This could be an overuse and thus did not give significant effect on the yield of vegetables.
Both phosphorous and potassium use had positive effect on the yield of both cabbage and tomato. This indicated that the higher amounts of phosphorous and potassium applied, the more vegetable yield the farmers could get. Potassium fertilizer contributed more than phosphorous in terms of marginal productivity.
The number of mandays contributed by family members during the vegetable production significantly influenced yield of cabbage and tomatoes. However, hired labor did not affect the yield of vegetables.
6.4 Estimating for Optimum Amount of N, P, K in Vegetables
With the use of first order condition for profit maximization, results indicate that nitrogen application at the study site is an overuse. Optimal levels for phosphorous and potassium can be computed as follows:
a) Optimal amount of phosphorous and potassium in cabbage production
P* = 6111 VND/kg0.0441 x 3900 kg x 1000 VND/kg = 28.1
K* = 4000 VND/kg0.0224 x 3900 kg x 1000 VND/kg = 21.8
b) Optimal amount of phosphorous and potassium in tomato production
P* = 6111 VND/kg0.0297 x 3468 kg x 1800 VND/kg = 30.3
K* = 4000 VND/kg0.0266 x 3468 kg x 1800 VND/kg = 41.5
Table 6.9 Estimated yield function for cabbage and tomatoes, Hoc Mon & Cu Chi districts Ho Chi Minh City, 1996. (Dependent variable is in yield per hectare). (n=59)
Variable Cabbage Tomato
Constant 7.0566
(0.2972)
6.4316
(0.5415)*
EDU (education) 0.0339
(0.0167)**
0.0310
(0.0283)NS
Variety 0.2202
5/15/03 12:39 PMImpact of Agro-Chemical Use on Productivity and Health in Vietnam
Page 47 of 69http://203.116.43.77/publications/research1/ACF122.html

(0.0431)*
SIT (site) 0.0024
(0.0131)NS
0.0417
(0.0329NS
FS (farmize) 0.0106
(0.0119)NS
0.0531
(0.0306)***
Ln AM (animal manure) -0.0031
(0.0034)NS
0.0176
(0.0348)NS
Ln N (nitrogen) - 0.0266
(0.0446)NS
- 0.0412
(0.0352)NS
Ln P (phosphorous) 0.0441
(0.0227)***
0.0297
(0.0127)**
Ln K (potassium) 0.0224
(0.0070)*
0.0266
(0.0097)
Ln lns )insecticide 0.0127
(0.0106)NS
0.0079
(0.0224)NS
Ln Flab (family labor) 0.2398
(0.0774)*
0.3502
(0.1039)*
Ln Hlab (hired labor) 0.0411
(0.0376)NS
- 0.0095
(0.0754)NS
R2 0.8313 0.8966
Figures in parenthesis are standard error values.NS = not significant.
* = significant at 1% level** = significant at 5% level
5/15/03 12:39 PMImpact of Agro-Chemical Use on Productivity and Health in Vietnam
Page 48 of 69http://203.116.43.77/publications/research1/ACF122.html

*** = significant at 10% level
Nitrogen fertilizers do not affect the crop yield and have negative sign. It is then assumed that the recommended rate is the optimal rate of N. Thus, the optimal mix formula of fertilizers for cabbage and tomato productions are as follows:
Optimal mix formula of N, P, K ratio for cabbage is 21/28/21Optimal mix formula of N, P, K ratio for tomato is 25/30/41
Table 6.10 Amount of fertilizers applied in cabbage and tomato production
Kind of Amount of fertilizer (kg/1000m )2
Vegetable N P2 O 5 K O2
Cabbage
Tomato
FP
21
25.4
RR
15
11
O*
-
-
FP
9.7
8.3
RR
8
10
O*
28
30
FP
8.7
4.4
RR
12
9
O*
21
41
FP: (Farmers' practice) Based on result of the surveyO*: (Optimum rate) Based on computation from recommendation in HCMC.
RR: Recommended Rates
In this optimal mix formula, computed amount of phosphorous and potassium fertilizers are relatively high compared to recommended rate. This is, perhaps, due to very low nutrition content of the soil. Another reason is that farmers at the study site apply very little amount of phosphorous and potassium fertilizers for many years, causing P O and K O deficiency.2 5 2
6.5 Estimating the Cost of Overuse of Fertilizer
The survey data indicated that farmers applied amount of nitrogen fertilizer higher than the recommended rate, whereas, amount of phosphorous and potassium fertilizers applied are lower than recommended rate. Based on the yield function, optimal mix of fertilizers (N, P, K) gave the highest yield, followed by recommended rate for both cabbage and tomato. Farmers' practice had the lowest yields for cabbage and tomato.
Optimal mix of fertilizer gave higher profit than recommended rate in case of cabbage. In contrast, equivalent profit was received between the two levels of fertilizers in case of tomato. Farmers' practice gave the lowest profit for both cabbage and tomato. At the time of survey, the farmgate prices of cabbage and tomato were 1,000 and 1,800 VND/kg, respectively. With this price, growing tomato had higher profit than cabbage.
Table 6.11 Yield and profit for optimal mix, farmers' practice and recommended levels of N, P, K on cabbage and tomato production.
Crop Optimal mix Farmers' practice Recommended rate
N - P - K
(kg/1000m2
Cabbage
Tomato
21 - 28 - 21
25 - 30 - 41
21 - 9.8 - 87
25 - 8.3 - 4.4
15 - 8 - 12
11 - 10 - 9
Yield Cabbage 4202 3900 3960
5/15/03 12:39 PMImpact of Agro-Chemical Use on Productivity and Health in Vietnam
Page 49 of 69http://203.116.43.77/publications/research1/ACF122.html

(kg/1000m2
Gross profit
(VND/1000m2
Tomato
Cabbage
Tomato
3937
1,036,617
3,621,773
3460
893,642
3,300,583
3645
989,819
3,683,965
Net profit (*)
VND/1000m2
Cabbage
Tomato
68,611
2,631,773
-74,357
2,310,583
21,819
2,693,965
(*) Minus opportunity cost of family labor
6.6 Nitrogen Application, Pest Population and Pesticides Use on Vegetables.
Because of its perceived positive yield effects, farmers at the study site were found to apply very high amount of nitrogen compared to recommended rate. Aside from increased yields nitrogen application also induces susceptibility of plants to insects and diseases. This is borne by several experiments conducted by University of Agriculture and Forestry of Ho Chi Minh City. Data showed that pest incidence increased proportionally to the amount of nitrogen applied (Table 6.12).
Table 6.12 Effect of nitrogen application on pest incidences and crop yields of cabbage.
Experiment Nitrogen application (kg N/ha)
60 N 80N 100 N 120 N 140 N 160 N 180 N
Yield
Pest (%)
38.52
3.12
45.08
3.12
47.68
3.18
50.40
3.85
52.60
5.38
54.48
7.32
51.92
8.80
Yield
Pest (%)
35.8
2.8
38.9
2.8
41.2
3.9
46.9
5.5
48.2
6.1
48.2
6.1
48.5
6.1
Yield
Pest (%)
40.7
15.9
41.5
16.3
43.5
17.3
48.1
17.3
50.0
20.8
50.9
22.2
49.9
21.5
(Source: Vegetable Department, U.A.F.)
The wrong mix of fertilizers leads to nutrient imbalance in plants, resulting to low resistance of plants and high pest population. At the study site, farmers with low education levels applied high nitrogen but low phosphorous and potassium, and apply high amounts of pesticides.
In order to reduce amounts of pesticide use in vegetable growing areas at Ho Chi Minh City, farmers need to be guided to apply fertilizers correctly. Some pricing policy could be done in order to affect farmers’ use of these nutrients. With a balanced use of fertilizers, vegetables would grow to be healthy and highly resistant to insects and diseases. Furthermore, an Integrated Pest Management (IPM) program for vegetables should be implemented soon to help farmers learn to use pesticides judiciously.
6.7 Impact of Pesticide Use on Health of Vegetable Producers
5/15/03 12:39 PMImpact of Agro-Chemical Use on Productivity and Health in Vietnam
Page 50 of 69http://203.116.43.77/publications/research1/ACF122.html

6.7.1 Characteristics of vegetable producers
The pesticide users in vegetable growing areas of Ho Chi Minh City are relatively older, with an average age of 48 years old. They have grown vegetables for more than 18 years. Their average height and weight are 162 cm and 51.6 kg respectively (Table 6.13).
Table 6.13 Vegetable producers' socio-economic characteristics
Characteristics Quantity
Year of age (year)
Year of vegetable farming (year)
Height (cm)
Weight (kg)
48.4
18.7
162.0
51.6
Smoking farmers (%)
Age of started smoking (year)
Cigarette/day (time)
50
16.6
20.5
Alcohol-drinking farmers (%)
Age of started drinking (year)
Alcohol drinking/week (time)
Amount of alcohol/time (ml)
39.3
23.5
3.93
209
Fifty percent of them are cigarette smokers. They started smoking at about 16.5 years old. Now, they consume, about 20 cigarettes everyday. About forty percent of farmers like to drink alcohol if they have a chance. The others state that they only drink very little amount of alcohol in parties. The farmers who like to drink alcohol, started drinking at about 23 years old. Now they drink alcohol almost 4 days per week with average amount of 2000ml.
6.7.2 Wearing protective clothing while spraying pesticides
Like other third world countries, most vegetable producers in Ho Chi Minh City do not wear protective clothing during pesticide application. Twenty one percent of farmers wear long shirt and pants to protect themselves from pesticides. Some said that covering nose and mouth is not comfortable; and is inconvenient while working. Another 10% of farmers only wear masks to cover nose and mouth but did not wear any other protective clothing.
Table 6.14 Percent of farmers wearing protective clothing during pesticide use
Wearing protective clothing Percent of farmers (%)
Long shirts and pants 21.4
5/15/03 12:39 PMImpact of Agro-Chemical Use on Productivity and Health in Vietnam
Page 51 of 69http://203.116.43.77/publications/research1/ACF122.html

Cover nose and mouth
No protective clothing
10.7
67.9
6.7.3 Impact on farmers’ health of handling pesticides
Most farmers spray insecticides periodically even if they do not find any insect symptoms. They are afraid that their crops would be sold at low price because of insect symptoms; especially Diamond back moth (DBM) on cabbages. This risk awareness results to a majority of vegetable producers spraying insecticides 13-16 time during one vegetable season. During the seedbed preparation, insecticides are usually applied 2-3 times. At vegetative development stage, farmers spray insecticides every 4-5 days. At flowering stage of tomato or establishing economic organ of cabbage, farmers applyinsecticide every 2-3 days.
Some farmers divide their plot of vegetable into three parts. Everyday, they apply insecticides for one part. The aim of this method is to maintain odor of insecticides on the one plot so insects would not be attracted to the whole farm area. Some farmers also use "false spraying" method. They apply "false spraying" everyday at low dosage of pesticide to create odor of insecticides. By doing this, insects would be kept at bay. They apply "true spraying" every 4-5 days by mixing at least 2-3 kinds of insecticides at very high dosages.
As a result, the percent of farmers getting ill is proportional to higher frequency of pesticide applications. Survey data indicate that there are about 28.6% of producers who get ill, while those who spray pesticides from 13-16 times have higher incidence of getting ill. (Table 6.15). Those applying more than 16 times did not report having been ill. This could be because they have used pesticides recently.
Table 6.15 Effect of frequent pesticide applications on vegetable producers' health
Number of pesticide application
Number of HHs applied Percent of farmer getting ill Total percent of farmers getting ill
< 10
11 - 12
13 -14
15 - 16
> 16
0 (0%)
8 (13.%)
25 (42.4%)
20 (33.9%)
3 (5.1%)
0 (0%)
25% (2/8)
32% (8/25)
30% (6/20)
0% (0/3)
0% (0/59)
3.4% (2/59)
13.5% (8/59)
10.1% (6/59)
0% (0/59)
Data showed that percent of farmers getting ill increased proportionally to the number of years of pesticide use (Table 6.16). Hence farmers who been exposed to pesticides for less than 10 years did not report incidence of illness. At the study site, the most popular symptoms of pesticide poisoning reported by producers are dizziness, fatigue and shortness of breath. Othersymptoms of poisoning are vomiting, skin irritation, headache and belly-ache (Table 6.17).
Table 6.16 Effect of number of years using pesticides on the health of farmers
Number of years using pesticide
Number of HHs applied Percent of farmers getting ill Total percent of farmers getting ill
< 10 2 0% (0/2) 0% (0/59)
5/15/03 12:39 PMImpact of Agro-Chemical Use on Productivity and Health in Vietnam
Page 52 of 69http://203.116.43.77/publications/research1/ACF122.html

10 - 14
15 - 19
20 - 24
9
25
23
22.2% (2/9)
32.0% (8/25)
43.5% (10/23)
3.4% (2/59)
13.6% (8/59)
16.9% (10/59)
59 33.9% (20/59)
Table 6.17 The popular symptoms of pesticide poisoning among farmers in Hoc Mon and Cu Chi, HCMC, 1996
Symptoms of pesticide poisoning Percent of farmers affected
Dizzy
Vomit
Fatigue
Shortness of breath
Skin irritation
Headache
Belly-ache
6.8% (4/59)
3.4% (2/59)
6.8% (4/59)
6.8% (4/59)
3.4% (2/59)
3.4% (2/59)
3.4% (2/59)
6.8 Demand for Safe Vegetable in Ho Chi Minh City.
6.8.1 Descriptive statistics of variables under study
A survey was conducted in December 1996 at two ordinary and organic markets in Ho Chi Minh city (HMC) to determine the demand for safe vegetables. The survey results are discussed in this section.
Thirty consumers were interviewed in the ordinary market and 30 in organic market. However, of the 30 consumers in organic markets, only 20 consumers bought vegetables, the other 10 consumers did not buy vegetable in organic markets. Thus, the 10 could be considered consumers of ordinary markets.
Table 6.18 Demographic characteristics of vegetable consumers
Ordinary market (n=40) Organic market (n=20)
Occupation Public Servant
Urban Laborer
Student
Housewife
19
6
2
9
8
0
2
6
5/15/03 12:39 PMImpact of Agro-Chemical Use on Productivity and Health in Vietnam
Page 53 of 69http://203.116.43.77/publications/research1/ACF122.html

Professional 4 4
Education Primary school
High school
University
6
18
16
0
6
14
Income < 500.000 VND
500,000-1 Million
> 1 Million VND
8
19
13
2
3
15
Age < 30 years
30 - 40
> 40
4
14
22
2
10
8
Sex Male
Female
2
38
1
19
In general, the majority of consumers who bought safe vegetables in organic markets, have high education and income levels. Most of them are female and belong to the age range of from 30-40 years (Table 6.18). The majority of consumers like to eat cabbage once a day, 2 days a week; whereas they eat tomato twice a day, 3 days a week (Table 6.19). Some consumersstate that eating tomatoes is good for the health but eating cabbage could cause goiter.
Table 6.19 Frequency of eating cabbage and tomato by consumers (per week)
Frequency of Respondents
Eating Cabbage (n=60) Tomato (n=60)
4
3
2
1
0 (0%)
10 (16.7%)
33 (55.0%)
17 (28.3%)
15 (25%)
29 (48.3%)
15 (25.0%)
1 (1.7%)
4
3
0 (0%)
0 (0%)
0 (0%)
0 (0%)
5/15/03 12:39 PMImpact of Agro-Chemical Use on Productivity and Health in Vietnam
Page 54 of 69http://203.116.43.77/publications/research1/ACF122.html

2
1
11 (18.3%)
49 (81.7%)
35 (58.3%)
25 (41.7%)
Table 6.20 Quality of vegetable consumers pay most attention
Respondents
Cabbage (n=60) Tomato (n=60)
Price
Size
Freshness
Quality
Pesticide residues
21 (35%)
3 (5%)
6 (10%)
18 (30%)
12 (20%)
21 (35.0%)
9 (15.0%)
15 (25.0%)
8 (13.3%)
7 (11.7%)
Most consumers pay particular attention to the price of vegetables, and then on quality or pest symptoms (i.e. worm in the products) and freshness (Table 6.20). Some consumers state that pesticide residue is a very important attribute in vegetables. However, it is very difficult to determine whether vegetables have high pesticide residues or not. Some consumers like tochoose vegetables with pest symptoms because they perceive that pesticide residues are less in the vegetables.
Most consumers believe that eating vegetable with high residues of pesticide would cause stomach ailments. Some state that patients would have diarrhea and vomiting (Table 6.21). The majority of consumers know that farmers apply too much pesticides on cabbages, but most of them think less pesticides are applied in tomato (Table 6.22). In general, this perception is relatively correct because cabbage always have heavy attacks by insects compared to tomato. Our survey data also support this claim.
Table 6.21 Consumers' knowledge of poisoning symptoms.
Poisoning Respondents
Symptom Cabbage (n=60) Tomato (n=60)
Vomiting
Diarrhea
Stomach
8 (13.3%)
19 (31.7%)
60 (100%)
8 (13.3%)
19 (31.7%)
60 (100%)
Table 6.22 Consumers' knowledge of high levels of pesticides applied on vegetables.
Respondents
Cabbage (n=60) Tomato (n=60)
Yes 36 (60%) 11 (18.3%)
5/15/03 12:39 PMImpact of Agro-Chemical Use on Productivity and Health in Vietnam
Page 55 of 69http://203.116.43.77/publications/research1/ACF122.html

No 24 (40%) 49 (81.7%)
6.8.2 Estimating the demand for safe vegetable
In general, vegetable demand is price inelastic (Table 6.23 and 6.24). This indicates that even the price of vegetables decreases people would not increase their demand by buying much more vegetables. On the other hand, a reduction in price of safe vegetables could imply more consumers buying these vegetables rather than the ones from the ordinary market.
Maximum willingness to pay for safe vegetables are higher than actual price by about 63 - 82% in ordinary markets and 22 - 26% in organic markets.
The difference between the WTP for safe vegetables and the actual prices is positive; this implies that consumers are willing to invest a positive amount to avoid being ill from pesticide contaminated products.
Regression analyses were also done to estimate demand for vegetables, but because of too few samples and lack of variation in prices, the estimates were found to be not significant. To pursue this further, a seasonal variation, and with more samples of respondents would be needed.
Table 6.23 The actual prices and amounts of products consumers buy in ordinary and organic markets, HCMC, 1996.
Vegetable Average amount/visit
Range of actual price (VND/kg) Average actual
price (VND/kg)
Cabbage
Tomato
0.8 kg
0.8 kg
Ordinary market (n=40)
1,800 - 3,500
4,000 - 7,000
2,538
5,012
Cabbage
Tomato
0.86 kg
0.85 kg
Organic market (n=10)
9,000 - 10000
15000 - 20000
9,800
17,300
Table 6.24 The WTP prices and amounts of safe vegetables consumers are willing to buy in ordinary and organic markets, HCMC, 1996.
Vegetable Average amount/visit
Range of WTP price (VND/kg) Average WTP
price (VND/kg)
Cabbage 0.64 kg Ordinary market (n=30) 4,724
5/15/03 12:39 PMImpact of Agro-Chemical Use on Productivity and Health in Vietnam
Page 56 of 69http://203.116.43.77/publications/research1/ACF122.html

Tomato 0.60 kg 3,000 - 6,000
6,000 - 12,000
8,440
Cabbage
Tomato
0.58 kg
0.56 kg
Organic market (n=10)
11,000 - 13,000
19000 - 24,000
12,000
21,800
6.9 Conclusions
Nitrogen fertilizers have perceptible effects on the growth and development of vegetables. Thus, vegetable producers in HCMC overuse nitrogen for their crops; whereas they under-use potassium and phosphorous. This nutrient imbalance may bring about high incidence of insects and diseases for vegetable production.
Farmers have very little knowledge of insects, diseases and pesticides. Without reliable information on what pest can be controlled by which formulations, farmers mix several insecticides together and spray every 3 - 4 days to prevent vegetables from insects damage. This increases production cost, hazard to human health and the quality of the environment.
Many insecticides banned for use in vegetable production are still utilized widely because farmers could buy these insecticides easily. Vegetable producers prefer these insecticides because they are not only cheaper but also have wider toxicity.
The price of "safe vegetable" is still too high for the majority of people. Besides, no body can assure the quality of "safe vegetable" sold in supermarket. However, ailments due to pesticide residues are observed by one sample respondent.
7.0 AGROCHEMICAL USE IN RICE IN THE MEKONG RIVER DELTA
7.1 Scope of the Study
This case study focused on the estimation of optimal use of fertilizers and the cost of fertilizer overuse (if any); the relationship is also discussed using data of Winter-Spring paddy season of 1996-1997. The study respondents were from the Mekong Delta of Vietnam.
The field survey was conducted in three districts of three provinces in the Mekong Delta (MD): Tien giang (Cailay district), Longan (Tantru district) and Cantho (Thotnot) districts. MD produces more than 50% of the paddy output of the whole country. The three locations are chosen because they have different levels of intensity of rice cultivation and pesticideapplication. Intensive cultivation is represented by Cailay district. High pesticide application is represented by Thotnot district while Tantru district represents the low pesticide application location.
7.2 Data Collection
7.2.1 Sampling method
Multi-stage sampling was used to select the study respondents. In the first stage the determinants used to select the provinces were yield, cultivated area, the linkage to central markets and others like the number of crops, rice-production method, and practice of IPM. In the second stage, in each province, subdistricts which best represent the province was chosen. In the third stage, thirty farmers from three villages of each subdistrict were selected randomly to be interviewed.
5/15/03 12:39 PMImpact of Agro-Chemical Use on Productivity and Health in Vietnam
Page 57 of 69http://203.116.43.77/publications/research1/ACF122.html

The survey which lasted for about two months was conducted by researchers from Mekong Delta Rice Research Institute, and co-researchers, staff members of EEU (Department of Economics, NUH), with the co-operation of AgriculturalDepartments, Plant Protection Departments of subdistricts, People Committee of Communes and others.
7.2.2 Information collected
The data collected through the questionnaire consisted of the following data: sex, age, experience, education, farm size, household members, trend of fertilizer use, pesticide use, and willingness to pay to avoid being ill from pesticide use. Production data at the household level consisted of area cultivated, rice varieties, yield, input utilization (labor, fertilizer,pesticides, other expenses). Input prices and output prices were also collected. The data were processed by different econometric software: SX for summary statistical description, LIMDEP for linear multiple regression with and without constraints.
7.3 Description of the Study Site
7.3.1 General information on the Mekong Delta of Vietnam
The Mekong Delta of Vietnam links Vietnam to other Southeast Asian countries. It is also the country's biggest food area, providing more than half of the total food output, 50% of fishery and 60% of fruit of the country.
Due to the influence of seasonal winds, the climate of this Delta consists of two distinct seasons: wet season from May to November with west-south seasonal wind and dry season from December to April with east-north seasonal wind. The weather in this Delta is warm every month during the year. The average temperature is about 27°C; the highest temperature does not exceed 30°C and the lowest temperature is not lower that 25°C.
The total area of the Mekong Delta of Vietnam is about 39,574,500 ha, accounting for 12% of the country's total area, 3-times larger than of the Red River Delta. The Mekong Delta accounts for 37% of the country's total cultivated area. The arable land per household is also quite high compared with the Red River Delta and the whole country (Table 7.1).
The Mekong river, with a length of 4,200 km provides water source of 4.66 billion m3 per year is the tenth largest river in the world. Mekong river flows into South-Vietnam through two main ways Tien and Hau rivers - with total length of 1,708 km and 137 big irrigation ditches and canals with total length of 2,780 km. It receives an amount of 90 billion m3 of rain water of which 90% are in rainy season. Unfortunately, rainy months and high water flow of Mekong river occur at the same time, and vice versa. This leads to a serious situation in this delta: a flood season and a draught season at the same time.
Table 7.1 Arable land per household and per capita (m )2
Regions Land per household Land per capita
Whole country
Red River Delta
Mekong Delta
Long An
Dong Thap
An Giang
Tien Giang
Kien Giang
4984
2281
10149
9958
11345
10227
5995
14963
1034
556
1917
1968
2099
1859
1205
2693
5/15/03 12:39 PMImpact of Agro-Chemical Use on Productivity and Health in Vietnam
Page 58 of 69http://203.116.43.77/publications/research1/ACF122.html

Can Tho
Ben Tre
Vinh Long
Tra Vinh
Soc Trang
Minh Hai
9545
5312
7263
9026
14737
15423
1733
1094
1415
1784
2704
2659
Source: General Survey of Rural and Agriculture, Statistic Published House, Hanoi, 1995, Vol. 1 p. 406 & 430.
The Mekong Delta is considered as the country's rice basket. The gross output of paddy in the Mekong Delta increased quite quickly since 1985 (Table 7.2).
Table 7.2 Mekong Delta Rice output from 1985 to 1995.
1985 1986 1987 1988 1989 1990 1991 1992 1993 1994 1995
6859.5 7084 6447 7604 8883 9480 10351 10948 110668 12121 12832
Source: Statistical Data of Agriculture, Forestry and Fishery, 1985-1995, Statistical Publishing House, Hanoi, 1996
Information released from the 1995 Statistical Year Book indicated that the population of the Mekong Delta of Vietnam reached 15.9 million people with the average density of 403 persons/km , being nearly double compared with the whole country. The population density of Mekong Delta is the second highest after the River Delta.
2
In the whole area of the Mekong Delta of Vietnam, 8% of residents are Chinese, Khome and Cham people, living in different provinces, mainly in An Giang, Minh Hai, Tai, Tra Vinh, Klen Giang, Soc Trang. Growth rate of population in The Mekong Delta is about 2.1%/year.
With this population growth rate, population will reach 17.9 million persons, by the year 2000, and 23.7 million persons by the year 2015. With current land per capita of 0.16 ha/person which is near to the limit of land area, there will not be enough land to provide for the increasing population.
The labor force in the area is quite abundant, but are mostly unskilled, consisting largely of mainly concentrates agricultural workers. A research on 16 communes of 16 districts of 6 provinces in The Mekong Delta Vietnam carried out by the Science and Social Institute in 1991 showed the serious imbalance between cultivation and breeding, planting paddy and other crops,agricultural sector and other sectors (Table 7.3). Paddy cultivation accounted for 73% of total labor time.
Table 7.3 Occupational Groupings in The Mekong Delta of Vietnam, 1991
Career types Shares (%)
Paddy Cultivation
Breeding
Minor Handicraft Industry
Gardening
72.8 %
0.1 %
0.4 %
2.3 %
5/15/03 12:39 PMImpact of Agro-Chemical Use on Productivity and Health in Vietnam
Page 59 of 69http://203.116.43.77/publications/research1/ACF122.html

Work for hire
Fishery rearing
Services
Others
0.8 %
3.0 %
3.6 %
17.0 %
Source: Survey on 2,378 persons above 15 years of age implemented by the Science and Social Institute, 1991. The Mekong Delta of Vietnam - Study and Development, Social Science Publisher, Ha Noi, 1995.
The Population in the Mekong Delta of Vietnam has low education. The number of persons in high education group consisting of high school, college, university and other university and after university graduates is just equal to 1/3 of the country's level (Table 7.4). Moreover, due to high cost of education, more and more people do not attend school, or go to school later in their lives.
Table 7.4 Education Level of residents from 10 years of age
Education Level Mekong Delta of Vietnam Country
Secondary and under
High School
College, University and above
81.0 %
2.7 %
0.5 %
76.6 %
6.6 %
1.5 %
Source: General Survey on Population
These days, The Mekong Delta of Vietnam is facing problems with environmental pollution. The use of agro-chemicals to increase the yields of crops, can also result to damages to fishery, human health due exposure, soil and water pollution as well as poisonous residues in agricultural products.
7.3.2 General socio-economic conditions of the study areas
The study site covered three villages from a subdistrict or provinces of the Mekong Delta, namely Long An, Can Tho, and Tien Giang. With the information from a total of 94 households, this section describes the paddy production environment, social-economic conditions and the fertilizer use trend in the Mekong Delta.
Demographic characteristics of Sample Farmers
There is no significant difference between the provinces or the regions in terms of characteristics. Most farmers stay in their places of birth. This is reflected by the years of residence of 38.9 years for the region (Table 7.5).
Table 7.5 Socio-economic characteristics of sample farmers
Characteristics Tien Giang Can Tho Long An Region
Years of residence
Years of rice farming
Age of respondents
41.90
22.50
44.2
37.6
22.89
43.56
37.20
41.41
42.89
38.90
26.51
43.64
5/15/03 12:39 PMImpact of Agro-Chemical Use on Productivity and Health in Vietnam
Page 60 of 69http://203.116.43.77/publications/research1/ACF122.html

Household size (persons)
of which: female
Household labor (persons)
of which: female
IPM-trained farmers (%)
Farmsize (m )2
Average Education Level
Yield (kg/ha)
5.23
2.76
2.76
1.50
43.33
4,625
8.53
7,160
6.86
3.26
3.77
1.72
37.78
11,780
5.69
6,444
5.26
2.84
2.73
1.60
68.42
8,921
9.74
4,692
6.02
3.02
3.25
1.63
45.74
8,926
7.42
Source: Sample Survey (1997)
Number of persons living in each household is quite high with an average of 6.02 of which the household labour takes more than half (3.25 persons/ household).
1. Education
Education is considered a factor that may influence efficiency or productivity. Usually, any job seems to be done better by highly educated person than low educated ones. In paddy production, experience, not education is the main and necessary factor for the farmers to get high yields.
2. Experience
Agricultural production is traditionally handed down through generation. Most household members begin to get acquainted with farming from early age. It is mainly for this reason, that the years of rice farming or experience is very high, at 23.21 years.
Table 7.6 Relationship between farmers' experience and agro-chemical use and yield in Tien Giang, Can Tho, and Long An
Experience N P O2 5 K O2 pesticide yield
Less than 24-year experience (n = ) 118.2 61.19 13.45 1.384 6.282
More than 24-year experience (n = ) 101.4 48.47 14.48 1.182 6.246
Overall (n = ) 112.1 56.59 13.79 1.310 6.269
Source: Sample survey (1997)
The above table shows that the farmers with high experience had a tendency the use lower rates of agro-chemicals, while maintaining their yield at the same levels compared with other farmers using more agro-chemicals (Table 7.6).
Other characteristics
1. Soil types
There are many types of soils in The Mekong Delta of Vietnam: grade 1,2,3,4 and 5, which are classified in terms of quality
5/15/03 12:39 PMImpact of Agro-Chemical Use on Productivity and Health in Vietnam
Page 61 of 69http://203.116.43.77/publications/research1/ACF122.html

by the Government. However, soil class 2, 3, 4 and 5 seem to be the same in quality according to soil class. Hence, one can divide class into two groups - class 1 and others.
In the three provinces, soil class 1 (high quality) takes quite a large ratio, accounting for 54.26%. It is obvious that high quality soils give higher yield than low quality soils, at the same inputs, or even lower inputs. This is shown in Table 7.7.
Table 7.7 Relationship between soil class and agro-chemical use and yield in Tien Giang, Can Tho, and Long An.
N P O2 5 K O2 PESTICIDE YIELD
Soil class 1
Soil class 2, 3, 4
Overall
109.1
115.7
112.6
41.77
69.88
56.88
13.00
14.68
13.90
990.5
1,402
1,302
6.419
6.265
6.336
Source: Sample survey (1997)
2. IPM training
The proportion of farmers in the sample who took part in IPM training is 45.7%. IPM practice leads to the remarkable reduction in pesticide use and minimize environmental pollution and pesticide residues in food. It also helps farmers to apply fertilizers appropriately and at the right time.
In some cases, IPM practice may lead to the fall in yield due to low use, even non-use of pesticide. However, evidence shows that IPM practice has brought a profit of VND994,330 per ha to Dong Nai farmers compared with non-IPM practice.(Science, Technology and Environment News Week, Spring Issue, 1997).
In this survey, the application of IPM has led reduction of pesticide use 1,104 compared with 1,465 (Table 7.8).
Table 7.8 Relationship between IPM and agro-chemical use and yield in Tien Giang, Can Tho, and Long An
N P O2 5 K O2 PESTICIDE YIELD
Non-IPM practice
IPM practice
Overall
112.5
112.7
112.6
54.93
59.24
56.88
12.93
15.08
13.09
1,465
1,104
1,302
6.505
6.131
6.336
7.4 Fertilizer Use in the Mekong Delta of Vietnam
According to the farmers' opinion, the use of fertilizers has increased remarkably (Table 7.9). In the past, there was only one crop in a year and the farmers did not pay much attention about the fertilizer application because every year, the alluvium raised the level of the rice farm with full nutrients. It is different now. The fact that farmers increase the number of crop to 2, even 3 crops per year affected soil quality. The natural soil nutrients are much more reduced. To maintain or increase the productivity, a large amount of chemical fertilizer has to be applied.
Table 7.9 Farmers' perception on the trend of chemical fertilizer application since early use
5/15/03 12:39 PMImpact of Agro-Chemical Use on Productivity and Health in Vietnam
Page 62 of 69http://203.116.43.77/publications/research1/ACF122.html
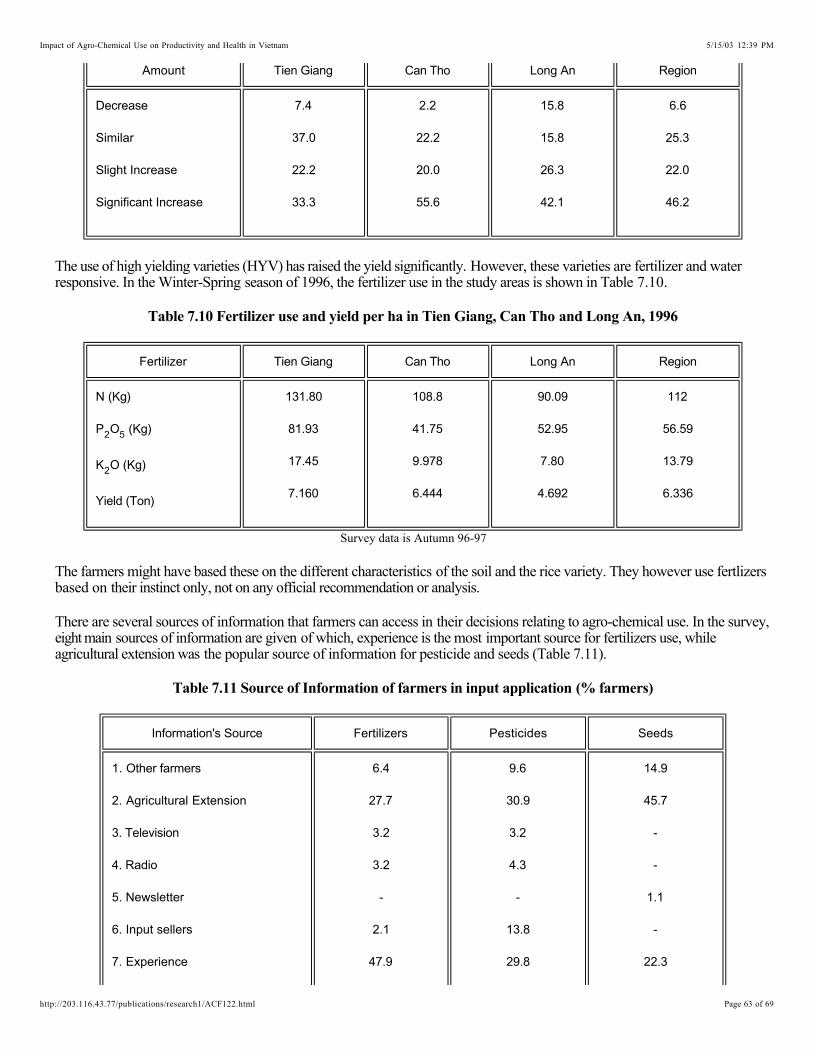
Amount Tien Giang Can Tho Long An Region
Decrease
Similar
Slight Increase
Significant Increase
7.4
37.0
22.2
33.3
2.2
22.2
20.0
55.6
15.8
15.8
26.3
42.1
6.6
25.3
22.0
46.2
The use of high yielding varieties (HYV) has raised the yield significantly. However, these varieties are fertilizer and water responsive. In the Winter-Spring season of 1996, the fertilizer use in the study areas is shown in Table 7.10.
Table 7.10 Fertilizer use and yield per ha in Tien Giang, Can Tho and Long An, 1996
Fertilizer Tien Giang Can Tho Long An Region
N (Kg)
P O (Kg)2 5
K O (Kg)2
Yield (Ton)
131.80
81.93
17.45
7.160
108.8
41.75
9.978
6.444
90.09
52.95
7.80
4.692
112
56.59
13.79
6.336
Survey data is Autumn 96-97
The farmers might have based these on the different characteristics of the soil and the rice variety. They however use fertlizers based on their instinct only, not on any official recommendation or analysis.
There are several sources of information that farmers can access in their decisions relating to agro-chemical use. In the survey, eight main sources of information are given of which, experience is the most important source for fertilizers use, while agricultural extension was the popular source of information for pesticide and seeds (Table 7.11).
Table 7.11 Source of Information of farmers in input application (% farmers)
Information's Source Fertilizers Pesticides Seeds
1. Other farmers
2. Agricultural Extension
3. Television
4. Radio
5. Newsletter
6. Input sellers
7. Experience
6.4
27.7
3.2
3.2
-
2.1
47.9
9.6
30.9
3.2
4.3
-
13.8
29.8
14.9
45.7
-
-
1.1
-
22.3
5/15/03 12:39 PMImpact of Agro-Chemical Use on Productivity and Health in Vietnam
Page 63 of 69http://203.116.43.77/publications/research1/ACF122.html

8. Other sources 9.6 8.5 16.0
7.5 Results of Regression Analysis
The Cobb-Douglas production function is estimated for 94 farmers applying agro-chemicals. The results are presented in Table 7.12. Long-an respondents’ data are for summer-autumn, while the other two are for winter-spring.
Table 7.12 Multiple Regression Analysis for Yield Function for the Mekong Delta
Variables Coefficients Standard Errors
ConstantIPM (1 with IPM training, and 0 otherwise)EDUDUM (Education)(0 if education is primary school and under, 1 if education is above primary school)SEASON ((0 for Summer-Autumn season, 1 for Winter-Spring season)SCLASSDUM (Soil Class)(0 for soil type no.1, and 1 for soil type no. 2,3,4,5)AREADU (area)(0 if area is equal or smaller than 8000m , and 1 if area is larger than 8000m )
2
2
LNEXP (Experience)LNN (Nitrogen)LNP O (Phosphorous)2 5
LNK O (Potassium)2
LNGAI (Pesticides)LNTODAY (Total labor in days)R-SquaredF-Value (df)
1.20 *-0.03NS-0.04NS
0.38*
-0.034NS
-0.01NS
0.02NS0.06***0.06**
-0.01NS-0.01***-0.02NS
0.6815.7
0.240.0230.03
0.04
0.03
0.03
0.0120.030.020.010.010.03
Note: NS: Not significant;: Significant at 1% level;
** : Significant at 5% level;*** : Significant at 10% Level
With the positive sign, the variable (LNEXP) reflects a positive, but weak relationship to yield. The most important variables in this regression analysis are agro-chemical use variables - LNN (Nitrogen), LNP O (Phosphorous),
LNK O (Potash), and LNGAI (Pesticide). Co-efficient of LNN and LNP O have positive signs. LNK O and LNGAI,
coefficient show negative signs. Potash coefficient is not significantly different from zero. The pesticide variable is an aggregate of all pesticides used, and is not ideal measure to explain yields. Different kinds of pesticides have different impacts on yield. The non-significance of labor could be due to data measurement problems.
"Experience"
2 5
2 2 5 2
Of all the variables, SEASON is one which has the strongest effect on yield with the coefficient of 0.3798 and significant level at 1%. Average yield in the winter-spring is 6,000kg, while that in the summer autumn is 4,698kg.
7.6 Estimating the Optimal Use of N, P, K
The optimal levels of agro-chemical use can be determined by the following formula: Xi* = ( xi. Py.Y)/Pxiε
5/15/03 12:39 PMImpact of Agro-Chemical Use on Productivity and Health in Vietnam
Page 64 of 69http://203.116.43.77/publications/research1/ACF122.html

Table 7.13 Fertilizer optimal levels in comparison with that of the North
Fertilizers Economical Optimal Level
Red River Delta* Mekong Delta** Sample Survey (Actual)
1. Nitrogen (N)
2. Phosphorous (P)
3. Potash (K)
100
60
20
99.65
62.96
20.86
86
113
18***
Source: * = Report on impact of agro-chemicals on productivity and health: The case of rice production in Red River Delta, Tran Thi Chien and et al., Environment Economics Research Workshop, Aug. 26-29, 1997. EFPSEA & EEU.
** = Computed from survey for 180 samples in 4 main provinces of The Mekong Delta of Vietnam in Winter-Spring Season 1997, Thai ThanhSon, M.A. Thesis, Vietnam-Netherlands Project.
*** = The optimal amount of K O based on the recommended level from previous studies.2
With the unit price of kg paddy of 1,300, average yield of 6,336kg/ha in the three provinces and of 6,731 kg/ha in Cantho and Tiem Giang, the coefficients of variables, and unit price of kg fertilizers and pesticide, the optimal use and P can be calculated as follows:
N* = ( 0.0613 x 6336 x 1300 )/5869 = 86 KgP* = ( 0.0641 x 6336 x 1300 )/4659 = 113 Kg
7.7 Estimates of the Cost of Overuse/under-use of Fertilizers in the Region
Table 7.14 Overuse/under-use of Fertilizers in the Region
Fertilizers Optimal amount Farmers' Practice Overuse/Under-use
1. N
2. P O2 5
3. K O2
86
113
18*
113
57
13
27
-56
-5
Note: * The optimal amount of K O is based on the recommended level from previous studies.2
The estimation for the overuse/under-use of fertilizers from the sample showed that Nitrogen is overused in the region by about 27 kg per ha (Table7.14). The other fertilizers. Phosphorous and Potash is underused by 56 and 5 kg per ha, respectively.
The overuse and under-use of fertilizers, apart from the non-economic effects, have led to a cost of VND 43,390 per ha to the farmers in the Mekong Delta of Vietnam. Although this amount is not so big and impressive that the farmers have to be worried about, this will be quite big for the whole region. For the 3,190,000 ha of paddy cultivated area in the Mekong Delta, the total cost will reach to the number of VND141 billions for one crop (Table 7.15).
Table 7.15 The Cost of overuse and under-use of fertilizers in the region, rice season 1996-97 (in VND)
Yield from Yield from Add. yield Benefit from Cost of Cost of Benefit Final
5/15/03 12:39 PMImpact of Agro-Chemical Use on Productivity and Health in Vietnam
Page 65 of 69http://203.116.43.77/publications/research1/ACF122.html

Optimal
Use (kg)
Practical
use (kg)
from optimal
use (kg)
Additional
yield
optimal use practical
use
from the
optimal use
profit of optimal
use
6,465 6,336 129 167,700 1,085.201 961,891 123,310 44,390
Source: Computed from the survey data (1997)Note:
* Yield from optimal use is calculated by replacing optimal uses of N, P, K into the equation when keeping other variables constant.* Benefit from additional yield = Additional yield from optimal use (54kg) x Price of kg paddy VND1,300).
* Cost of optimal use = cost of optimal uses of nitrogen + of phosphorous + of potash.* Cost of practical use = cost of practical uses of nitrogen + of phosphorous + of potash.
= mean of fertilizer cost.* Benefit from optimal use = Cost of practical use - Cost of practical use.
* Final profit of optimal use = Benefit from additional yield + Benefit from optimal use.
LITERATURE CITED
Antle, J. M. and P. L. Pingali. 1995. 'Pesticides Productivity and Farmers Health: A Philippine Case Study.’ In Pingali and Roger (Eds.). Impact of Pesticides on Farmer Health and the Rice Environment, IRRI. Kluwer Academic Publishers.
Dinh, D. B. 1995. Nutrient Elements Constraining Crop Yield and Strategy for Nutrient Management in Order to Develop a Sustainable Agriculture.
Dung, N. H. (1994). 'Profitability and Rice Response of Rice Production System in the Mekong Delta', Chaingmai University, Thailand.
Msc. Thesis.
FAO (1993). FAO, Rome, Italy.Industry Fertilizer Working Group,
FAO (1994). FAO, Rome, Italy.The State of Food and Agriculture,
Fujimoto, A. and Matshuda (1989). World Planning.Thai Rice Farming in Transition.
Ha, N. N. 1995. Some Ideas from Fertilizer Use Situation in Highly Intensive Rice Cultivation Regions.
Ha, N. N. and H. Q. Hung. 1995. Plant Protection Study on Effects of Fertilization Regime for Short term Intensive Rrice on Pests and Diseases of Summer-Autumn Season on Red Rice Alluvial.
Hans, P. B. et al. (1991). World Bank, Washington, D.C.Technology Change and Commercialization in Agriculture.
Herdt, R. W., C. Castillo and S. Jayasuriya. 1984. ‘The Economics of Insect Control in the Philippines’. In IRRI, Judicious and Efficient Use of Insecticides.
Hoc Mon People’s Committe. 1996. Outline on Research and Development of "Clean Vegetable Production in Ho Chi Minh City from 1996-2000.
Huan, T. N. et al. 1996. Agricultural Publishing House, Hanoi, Vietnam.
Effect of Nitrogen and Transplanting Density on Yield and Disease and Pest Population.
5/15/03 12:39 PMImpact of Agro-Chemical Use on Productivity and Health in Vietnam
Page 66 of 69http://203.116.43.77/publications/research1/ACF122.html

Hung, N., L. P. Quy, C. H. Huynh, and N. V. Minh. 1993. Survey on Vegetable Production in Ho Chi Minh city and Diamond back moth Damage on Cabbage. Paper presented in the annual scientific conference at Institute of AgriculturalScience of South Vietnam (IAS).
Khai, T. and N. T. Siem. 1994. The Characteristics of Vietnam Soils in Relation with Fertilizer.
Khan, A. S. and A. Ali. 'Production Function Analysis of Nitrogenous and Phosphatic Fertilizers in Rice Production in the Irrigated Areas of the Funjab'. , Punjab, Pakistan.Research paper
Kalizrajan, K. 1990. Rice Production: An Econometric Analysis. IBH Publishing, New Delhi
Litsinger, J. A. 1990. ‘Integrated Pest Management in Rice: Impact of Pesticide ’. Workshop on Environmental and Health Impacts of Pesticide Use in Culture, IRRI, Los Baños, Laguna, Philippines.
Litsinger, J. A. 1987. ‘Integrated Part Management Assessment in Farm Communities’. Paper presented at the Workshop on IPM and INM on Rice. 28-29. IRRI.
Ministry of Agriculture and Rural Development. 1995. 'Procedure on Survey of Pest Infestation on Crop' Hanoi, Vietnam
Ministry of Agriculture and Food Industries (1994). Ministry of Agriculture and Food Industries.
Strategies On Agriculture For The Future.
Pingali, P. L. et al. IRRI 1995. We can live without pesticides for tropical rice?
Quyen, M. V., L. T. V. Nhi, N. Q. Vinh, N. T. Hoa, N. T. Kiet, and V. V. Binh. 1995. Handbook for Growing Vegetable. Agriculture Publishing, Ho Chi Minh city.
Rola, A.C. 1994. Impact of Pesticides on Farmer Health: Review of Evidence from the Philippines. Journal of Crop Science, UPLB.
Rola, A.C. and P. L. Pingali. 1992. ‘Choice of Crop Protection Technologies Under Risk: An expected utility maximization framework’. The Philippine Journal of Crop Science 17(1).
Rola, A.C. and P. L. Pingali. 1993. Pesticides, Farmers’ Health and Rice Productivity: An Economic Assessment, WRI, Washington D. C. and IRRI, College, Laguna
Rola, A. C. and P. L. Pingali. 1992. Choice of Crop Protection Technologies Under Pests. Phil. Journal of Crop Science
Son, T. T. and D. V. Hien. 1995. Determination of Appropriate Fertilizer Amount Applied to Rice to Obtain High Yield and Economic Efficiency.
Thang, N. V., and B. T. My. 1996. Technique for Growing Tomato, Potato, Onion and Garlic. Agriculture Publishing, Hanoi.
Thi, T. K. 1996. Technique for Growing Clean Vegetable. Agriculture Publishing, Hanoi.
Van Bo, N. 1995. Efficiency of Potassium in Relation with Balanced Fertilization in Order to Increase Yield and Quality of Agricultural Products in Vietnam.
Van Bo, N. et al. 1995. Efficient Mechanism of Potassium Applied to Paddy.
Van Bo, N. and B. B. Dinh. 1995. Some Results on Study of Fertilizer Application for Hybrid Variety in Vietnam.
Vietnam New, Volume VII, Number 2088, June 2, 1997
5/15/03 12:39 PMImpact of Agro-Chemical Use on Productivity and Health in Vietnam
Page 67 of 69http://203.116.43.77/publications/research1/ACF122.html

Vietnam New, Volume VII, Number 2092, June 6, 1997
Vietnam New, Volume VII, Number 2093, June 7, 1997
Vietnam New, Volume VII, Number 2124, June 8, 1997
Vietnam New, Volume VII, Number 2125, June 9, 1997
Waibel, H. 1996. ‘The Economics of Integrated Pest Control in Irrigated Rice: A Case Study from the Philippines’. Crop Protection Monographs. Berlin: Springer-Verla.
Warburton H., F.G. Palis and P. L. Pingali. 1995. ‘Farmer Perceptions, Knowledge and Pesticide Use Practices’ In P. L. Pingali and P. A. Roger, (Eds.). Impact of Pesticides on Farmer Health and the Rice Environment, IRRI. Kluwer Academic Publishers.
Warburton, H., F.G. Palis and P.L Pingali. 1995. Farmer Perceptions, Knowledge and Pesticide Use Practice. IRRI.
World Bank (1990). Agricultural Marketing: The World Bank's experience (74-85).
Washington D. C.
World Bank (1994). 'Environment Impact Assessment', World Bank.
Vietnam-North Binh Chanh Irrigation Rehabilitation Project - Report EOO76.
World Bank. (1977). . World Bank, USA.
Commodity Markets and the Developing Countries - A World Bank Quarterly
ABOUT THE AUTHORS
Name Professional Major Position Institution & Address
Nguyen Huu Dung Agricultural Development (MSc)Certificate on Environmental Economics (EEPSEA)Ph.D. course of Goteborg University, Sweden
Lecturer and Researcher
Economic University HCM City01 Bis Hoang Dieu St., Phunhuan Dist., Ho Chi Minh CityTel: 84-8 844 8222Fax: 84-8 845 3897
Tran Chi Thien Agricultural Statistics (BSc)Economic (MSc)Certificate on Environmental Economics (EEPSEA)
Lecturer Bac Thai University of Agriculture and ForestryThai Nguyen CityTel: 84-2 885 5564Fax: 84-2 885 2921
Nguyen Van Hong Agriculture (BSc)Agronomist (MSc)Certificate on Environmental Economics (EEPSEA)
Researcher Institute of Agricultural Scienceof South Vietnam121 Nguyen Binh, Khiem St., HCM CityTel: 84-8 829 1746
5/15/03 12:39 PMImpact of Agro-Chemical Use on Productivity and Health in Vietnam
Page 68 of 69http://203.116.43.77/publications/research1/ACF122.html

Nguyen Thi Loc Agriculture (BSc)Entomology (MSc)Entomology - Bio-control of Plant DiseasesCertificate on Environmental Economics (EEPSEA)
Head of Ecology and Bio-control
Department
Cuu Long Delta Rice Research InstituteOmon, Can Tho VietnamTel: 84-7 186 1256Fax: 84-7 186 1457E-mail: Loc@ clrri.ac.vn
Trinh Dinh Thau Animal and Veterinary Sciences (BSc)Rural Development and Management (MSc)Certificate on Environmental Economics (EEPSEA)
Lecturer Hanoi Agricultural UniversityGia lam, Hanoi, VietnamTel: 84-4 827 690684-4 827 6653Fax: 84-4 827 6554
Dang Van Minh Agronomist (BSc)Diploma in Plant Protection Rural Development (MSc)Certificate on Environmental Economics (EEPSEA)
Lecturer Bac Thai University of Agriculture and ForestryThai Nguyen CityTel: 84-2 885 5564Fax: 84-2 885 2921
Huynh Thi Le Nguyen Agronomist (BSc)Certificate on Environmental Economics (EEPSEA)
Researcher Faculty of AgronomyUniversity of Agriculture and ForestryHo Chi Minh CityTel: 84-8 896 6780
Nguyen Tan Phong Agronomist (BSc)Certificate on Environmental Economics (EEPSEA)
Researcher Department of Science, Technology and Environment Long An, VietnamTel: 84-7 282 6249Fax: 84-7 282 2093
Thai Thanh Son Graduate student Economic University Ho Chi Minh City01 Bis Hoang Dieu St., Phunhuan Dist., HCM CityTel: 84-8 844 8222Fax: 84-8 845 3897
Copyright 1997 © International Development Research Centre, Ottawa, Canada | 17 July [email protected]
5/15/03 12:39 PMImpact of Agro-Chemical Use on Productivity and Health in Vietnam
Page 69 of 69http://203.116.43.77/publications/research1/ACF122.html